nsw coal mining benchmarking study: international …...nsw coal mining benchmarking study:...
TRANSCRIPT
NSW Coal Mining
Benchmarking Study:
International Best Practice
Measures to Prevent and/or
Minimise Emissions of
Particulate Matter from Coal
Mining
Prepared for
Office of Environment and
Heritage KE1006953
June 2011
Final
Prepared by
Katestone Environmental Pty Ltd ABN 92 097 270 276
Terrace 5, 249 Coronation Drive
PO Box 2217
Milton, Queensland, Australia 4064
www.katestone.com.au
Ph +61 7 3369 3699
Fax +61 7 3369 1966

Document Quality Details
Job Number: KE1006953
Title: NSW Coal Mining Benchmarking Study: International Best Practice Measures to Prevent and/or Minimise Emissions of Particulate Matter from Coal Mining
Client: OEH
Document reference: KE1006953_NSW Coal Mining Benchmarking Study_Volume I.doc
Prepared by: Sarah-Jane Donnelly, Andrew Balch, Andrew Wiebe, Natalie Shaw, Simon Welchman, Alex Schloss, Ella Castillo, Kim Henville, Andrew Vernon, John Planner
Reviewed by: Simon Welchman, Christine Killip, Andrew Balch
Revision Date Approved Signature
Rev 1.3 22/6/2011 Simon Welchman
Disclaimer This document is intended only for its named addressee and may not be relied upon by any other person. Katestone Environmental Pty Ltd disclaims any and all liability for damages of whatsoever nature to any other party and accepts no responsibility for any damages of whatsoever nature, however caused arising from misapplication or misinterpretation by third parties of the contents of this document. This document has been prepared with all due care and attention by professional scientists and engineers according to accepted practices and techniques. This document is issued in confidence and is relevant only to the issues pertinent to the subject matter contained herein. Katestone Environmental accepts no responsibility for any misuse or application of the material set out in this document for any purpose other than the purpose for which it is provided. Where site inspections, testing or fieldwork have taken place, the report is based on the information made available by the client, their employees, agents or nominees during the visit, visual observations and any subsequent discussions with regulatory authorities. The validity and comprehensiveness of supplied information has not been independently verified except where expressly stated and, for the purposes of this report, it is assumed that the information provided to Katestone Environmental Pty. Ltd. is both complete and accurate. Copyright This document, electronic files or software are the copyright property of Katestone Environmental Pty. Ltd. and the information contained therein is solely for the use of the authorised recipient and may not be used, copied or reproduced in whole or part for any purpose without the prior written authority of Katestone Environmental Pty. Ltd. Katestone Environmental Pty. Ltd. makes no representation, undertakes no duty and accepts no responsibility to any third party who may use or rely upon this document, electronic files or software or the information contained therein.
Copyright Katestone Environmental Pty. Ltd.

Katestone Environmental Pty Ltd KE1006953 OEH
June 2011
Acknowledgements Katestone Environmental acknowledges the following persons and organisations for their assistance in the preparation of this study:
Office of Environment and Heritage for providing the Coal Mines Emission Database and for constructive comments and suggestions following review of milestone reports and the draft versions of this report.
John Planner of Introspec Consulting for his ongoing support, advice and involvement in the completion of the study.
Richard Hoskings, Managing Director, The Minserve Group Pty Ltd for his time and advice.
Brian Mahony for his advice and assistance.
The following coal mining companies that completed internet surveys:
Airly Coal Pty Limited Cumnock No. 1 Colliery Pty Limited
Resource Pacific Pty Ltd
Anglo Coal (Dartbrook Management) Pty Ltd
Donaldson Coal Pty Ltd Rix's Creek Pty Limited
Anglo Coal Drayton Mine Duralie Coal Pty Ltd Springvale Coal
Ashton Coal Operations Pty Limited
Endeavour Coal Tahmor Coal Pty Ltd
Austar Coal Mine Pty Limited Endeavour Coal Pty Limited The Bloomfield Group
BHP Billiton Gujarat Nre Minerals Limited The Wallerawang Collieries Limited
BHP Billiton Illawarra Coal Hunter Enviro-Mining (Operations) Pty Limited
Thiess Pty Ltd
Bulga Coal Management Pty Limited
Ivanhoe Coal Pty Limited Ulan Coal Mines Ltd
Centennial Angus Place Lakecoal Pty Ltd United Collieries Pty Ltd
Centennial Coal Moolarben Coal Operations Pty Ltd
Wambo Coal Pty Limited
Centennial Myuna Pty Ltd Muswellbrook Coal Company Limited
Warkworth Mining Ltd
Centennial Newstan Pty Limited Newcastle Coal Company Pty Ltd
West Wallsend - Oceanic coal
Clarence Colliery Pty Ltd Oceanic Coal Australia Pty Limited
Xstrata Coal
Coal & Allied Operations Pty Ltd
Peabody Energy Australia Xstrata Mangoola Pty Limited
Coalpac Pty Limited Ravensworth Operations Pty Limited
Xstrata Mt Owen Pty Limited

Katestone Environmental Pty Ltd KE1006953 OEH
June 2011
The following coal mining companies that provided access and the time of their personnel to escort the study team around their mines:
Muswellbrook Coal Company Ltd
Warkworth Mining Limited Glendell Coal Mine - XStrata Mt Owen Pty Limited
Hunter Valley Operations – Coal & Allied Operations Pty Ltd
Bulga Coal Management Pty Limited
Mount Arthur North Coal Mine – Hunter Valley Energy Coal Pty Ltd
Liddell Coal Operations Pty Ltd Ravensworth Operations Pty Limited
Wambo Coal Pty Limited
Bengalla Mining Company Pty Limited
Cumnock No. 1 Colliery Pty Limited
XStrata Mt Owen Pty Limited
Donaldson Coal Pty Ltd
The following companies and persons that provided information about their company‟s products that was used in the study:
o Letiscia Xavier, Vital Chemical Pty Ltd o Paul Heinburger, RST – Dust Earth and Water Solutions o David Bennie, DuPont Australia Limited o Matt Wood, Hastings Deering (Australia) Ltd

Katestone Environmental Pty Ltd KE1006953 OEH
June 2011
Page i
Contents
Executive Summary ...................................................................................................................... 1
1. Introduction ....................................................................................................................... 9
1.1 Study background ................................................................................................ 9
1.2 Study aims and objectives ................................................................................ 10
1.3 Study methodology and document outline .................................................. 11
2. Amenity Impacts and Health Effects of Particulate Matter ..................................... 13
2.1 Definitions of particulate matter ...................................................................... 13
2.2 Amenity impacts of particulate matter........................................................... 14
2.3 Health effects of particulate matter ................................................................ 15
3. Overview of Coal Mining Process and Techniques ................................................... 17
3.1 Underground mining .......................................................................................... 18
3.2 Open-cut mining ................................................................................................ 20
3.2.1 Land preparation ................................................................................... 20 3.2.2 Blasting ..................................................................................................... 21 3.2.3 Overburden removal ............................................................................. 21 3.2.4 Coal recovery ......................................................................................... 23 3.2.5 Coal processing and transport off-site ................................................ 23 3.2.6 Mined land rehabilitation ...................................................................... 24
3.3 Highwall mining ................................................................................................... 24
4. Air Quality Impacts in Mining Areas ............................................................................. 26
4.1 Ambient concentrations of PM10 in the Hunter Valley .................................. 26
4.2 Air quality complaints in the GMR .................................................................... 35
4.3 Environment Protection Licence conditions and non-compliance ............ 41
4.4 Camberwell Cumulative Impact Review ....................................................... 43
4.4.1 Cumulative Impacts of Particulate Matter – Environ ........................ 43 4.4.2 Lead in Drinking Water Report – Centre for Mined
Land Rehabilitation ................................................................................ 46
4.5 Upper Hunter Air Quality Monitoring Network ................................................ 47
5. Identifying Major Coal Producers ................................................................................. 48
5.1 Coal production by country ............................................................................. 48
5.2 Coal production by regional groupings.......................................................... 50
5.3 Coal production by national economic groupings ...................................... 52
5.4 Coal production in the United States .............................................................. 53
6. Coal Production in Australia ......................................................................................... 55
6.1 Coal production by state .................................................................................. 55
6.2 Coal production in NSW and GMR .................................................................. 57
6.3 Coal production by mining method in NSW and GMR ................................ 59
6.4 Coal mines in the GMR ...................................................................................... 60
6.5 Historical trends and future projections in NSW coal production ................ 63
7. Emissions Inventory Data for NSW Coal Mines ............................................................ 66

Katestone Environmental Pty Ltd KE1006953 OEH
June 2011
Page ii
7.1 National Pollutant Inventory ............................................................................. 66
7.2 Air Emissions Inventory for the GMR 2003 ........................................................ 68
7.3 Coal Mining Air Emissions Inventory for the GMR 2008 .................................. 75
7.3.1 Coal Mines Emission Database............................................................. 75 7.3.2 Coal mines included in the Coal Mines Emission
Database ................................................................................................. 77 7.3.3 Ranking of coal mining activities ......................................................... 83 7.3.4 Ranking of coal mine premises ............................................................ 87 7.3.5 Ranking of coalfields .............................................................................. 93
8. Legislative Frameworks for Coal Mining ...................................................................... 95
8.1 Selection criteria for literature review .............................................................. 95
8.2 Definitions of best practice ............................................................................... 98
8.3 Air quality management, regulation and administration of coal mining 100
8.3.1 Australia ................................................................................................. 101 8.3.2 New South Wales .................................................................................. 101 8.3.3 Queensland ........................................................................................... 101 8.3.4 Victoria ................................................................................................... 102 8.3.5 United States ......................................................................................... 103 8.3.6 Canada ................................................................................................. 105 8.3.7 European Union .................................................................................... 106 8.3.8 Germany ................................................................................................ 107 8.3.9 New Zealand ......................................................................................... 108
8.4 Approvals process for coal mining ................................................................ 108
8.4.1 New South Wales .................................................................................. 109 8.4.2 Queensland ........................................................................................... 114 8.4.3 United States ......................................................................................... 115 8.4.4 Germany ................................................................................................ 120
8.5 Air quality impact assessment for coal mining ............................................. 121
8.5.1 New South Wales .................................................................................. 121 8.5.2 Victoria ................................................................................................... 124 8.5.3 United States ......................................................................................... 126
8.6 Licensing of coal mines ................................................................................... 129
8.6.1 New South Wales .................................................................................. 129 8.6.2 Queensland ........................................................................................... 132 8.6.3 United States ......................................................................................... 133 8.6.4 New Zealand ......................................................................................... 134
8.7 Emission limits and ambient air quality standards ........................................ 136
8.7.1 United States ......................................................................................... 136 8.7.2 Canada ................................................................................................. 139 8.7.3 Germany ................................................................................................ 141 8.7.4 South Africa ........................................................................................... 141 8.7.5 Ambient air quality standards for particulate
matter ..................................................................................................... 142
9. International Techniques for Controlling Particulate Matter Emissions from Coal
Mining ............................................................................................................................. 151

Katestone Environmental Pty Ltd KE1006953 OEH
June 2011
Page iii
9.1 Introduction ....................................................................................................... 151
9.2 Haul roads .......................................................................................................... 154
9.2.1 Overview ................................................................................................ 154 9.2.2 Design ..................................................................................................... 158 9.2.3 Maintenance and management ...................................................... 159 9.2.4 Surface improvements ......................................................................... 159 9.2.5 Surface treatments ............................................................................... 160
9.2.5.1 Watering ................................................................................. 160
9.2.5.2 Chemical suppressants ......................................................... 161
9.2.6 Summary ................................................................................................ 164
9.3 Wind erosion ...................................................................................................... 166
9.3.1 Overview ................................................................................................ 166 9.3.2 Exposed areas and overburden emplacements ............................ 170 9.3.3 Coal stockpiles ...................................................................................... 172
9.4 Bulldozing ........................................................................................................... 175
9.5 Blasting and drilling........................................................................................... 178
9.5.1 Overview ................................................................................................ 178 9.5.2 Blasting ................................................................................................... 180 9.5.3 Drilling ..................................................................................................... 181
9.6 Draglines ............................................................................................................ 182
9.7 Loading and dumping overburden ............................................................... 184
9.8 Loading and dumping ROM coal .................................................................. 187
9.9 Conveyors and transfers .................................................................................. 190
9.10 Stacking and reclaiming product coal ......................................................... 191
9.11 Train and truck load out and transportation ................................................ 192
10. NSW Techniques for Controlling Particulate Matter Emissions from Coal Mining 195
10.1 Methodology .................................................................................................... 195
10.1.1 Coal Mines Emission Database........................................................... 195 10.1.2 Internet survey: July-August 2010 ....................................................... 196 10.1.3 Internet survey: February – March 2011............................................. 196 10.1.4 Coal mine site visits ............................................................................... 196 10.1.5 Review of AEMR, EMS, EMP and EPL documents ............................. 197
10.2 Results of internet survey .................................................................................. 198
10.3 Particulate matter emission control metric ................................................... 199
10.4 Identification of existing management practices ....................................... 201
10.4.1 Haul roads .............................................................................................. 201 10.4.2 Wind erosion .......................................................................................... 205 10.4.3 Bulldozing ............................................................................................... 212 10.4.4 Blasting and drilling............................................................................... 213 10.4.5 Draglines ................................................................................................ 218 10.4.6 Loading and dumping overburden ................................................... 219 10.4.7 Loading and dumping ROM coal ...................................................... 222 10.4.8 Conveyors and transfers ...................................................................... 227 10.4.9 Stacking and reclaiming product coal ............................................. 229
10.5 Summary of particulate matter emission control metrics ........................... 232
11. Air Quality Management Tools ................................................................................... 234

Katestone Environmental Pty Ltd KE1006953 OEH
June 2011
Page iv
11.1 Identify environmental criteria ........................................................................ 234
11.2 Mission statement ............................................................................................. 234
11.3 Develop particulate matter management strategy ................................... 235
11.3.1 Set objectives and targets .................................................................. 235 11.3.2 Particulate matter risk assessment ..................................................... 235 11.3.3 Particulate matter suppression improvement plan ......................... 235
11.4 Monitoring requirements ................................................................................. 235
11.5 Responsibilities ................................................................................................... 235
11.6 Communication strategies .............................................................................. 236
11.7 System and performance review ................................................................... 236
11.8 Proactive and reactive components of a management plan ................. 236
11.9 Current practices in the GMR ......................................................................... 237
12. Estimated Costs of Controlling Particulate Matter Emissions from NSW Coal
Mines ............................................................................................................................. 241
12.1 Overview ............................................................................................................ 241
12.2 Limitations .......................................................................................................... 242
12.3 Input data and assumptions ........................................................................... 242
12.3.1 Watering ................................................................................................ 242 12.3.2 Chemical suppressant ......................................................................... 243 12.3.3 Rehabilitation ........................................................................................ 243 12.3.4 Hydraulic mulch seeding ..................................................................... 244 12.3.5 Enclosures and windbreaks ................................................................. 244 12.3.6 Conveyors .............................................................................................. 244 12.3.7 Haul trucks and equipment ................................................................ 245 12.3.8 Fabric filters – ROM hopper and drilling ............................................ 246
12.4 Application of best practice controls by source or activity ....................... 246
12.4.1 Haul roads .............................................................................................. 246 12.4.2 Wind erosion .......................................................................................... 248
12.4.2.1 Overburden emplacements .............................................. 248
12.4.2.2 Coal stockpiles ..................................................................... 249
12.4.2.3 Exposed areas ...................................................................... 250
12.4.3 Bulldozers ............................................................................................... 251 12.4.4 Trucks dumping coal to the ROM hopper ........................................ 253 12.4.5 Graders .................................................................................................. 254 12.4.6 Drilling ..................................................................................................... 255 12.4.7 No cost emission reductions................................................................ 256 12.4.8 Emission reductions not assessed ....................................................... 257 12.4.9 Summary by source or activity ........................................................... 258
12.5 Aggregated costs by activity and premises for the GMR .......................... 259
12.6 Summary of cost effectiveness analysis ........................................................ 265
13. Conclusions and Recommendations ........................................................................ 268
14. References .................................................................................................................... 276
Appendix A - OEH Tender Document
Appendix B - OEH Section 191 Notice to GMR Coal Mines
Appendix C - OEH Letter to GMR Coal Mines

Katestone Environmental Pty Ltd KE1006953 OEH
June 2011
Page v
Appendix D - Katestone Environmental Letters and Survey to GMR Coal Mines
Appendix E - Summary of Katestone Environmental Survey to GMR Coal Mines
Katestone Environmental Pty Ltd KE1006953 OEH
June 2011
Page vi
Tables
Table 1 Atmospheric lifetime and potential travel distance for particles of various
size categories ....................................................................................................... 14
Table 2 Summary of 24-hour and annual average concentrations of PM10 at
Muswellbrook ......................................................................................................... 29
Table 3 Summary of 24-hour and annual average concentrations of PM10 at
Singleton ................................................................................................................. 31
Table 4 Number of complaints received by OEH's Environment Line in relation to
air quality issues associated with coal mines in the GMR, by OEH Region
from 2007 to 2009 .................................................................................................. 35
Table 5 Number of complaints received by OEH's Environment Line in relation to
air quality issues associated with coal mines in the GMR, by suburb or
town from 2007 to 2009 ........................................................................................ 35
Table 6 Reason for complaints received by OEH’s Environment Line in relation to
air quality issues associated with coal mines in the GMR from 2007 to
2009 ......................................................................................................................... 37
Table 7 GMR coal mine Environment Protection Licence conditions relating to air
quality, excluding monitoring conditions ........................................................... 41
Table 8 Non-compliances with Environment Protection Licence conditions as
recorded in the public register for coal mining activities from 2000 to
2009 ......................................................................................................................... 42
Table 9 World coal production by country for 2009 ....................................................... 48
Table 10 World coal production by regional groupings for 2009 ................................... 50
Table 11 World coal production by national economic groupings for 2009 ................ 52
Table 12 United States coal production by state for 2008 .............................................. 53
Table 13 United States coal production by coal producing region for 2008 ............... 54
Table 14 Australian production of black and brown coal by state for 2007-08 ........... 55
Table 15 Coal production in NSW for 2006-07 and 2007-08 ............................................ 59
Table 16 Coal production in NSW by mining method for 2007-08 ................................. 59
Table 17 GMR coal mines in the Hunter Coalfield for 2007-2008 .................................... 61
Table 18 GMR coal mines in the Newcastle Coalfield for 2007-2008 ............................ 61
Table 19 GMR coal mines in the Southern Coalfield for 2007-2008 ................................ 62
Table 20 GMR coal mines in the Western Coalfield for 2007-2008 ................................. 62
Table 21 Coal mine development projects in the Hunter Coalfield .............................. 64
Table 22 Coal mine development projects in the Newcastle Coalfield ....................... 64
Table 23 Coal mine development projects in the Southern Coalfield .......................... 64
Table 24 Coal mine development projects in the Western Coalfield ........................... 65
Katestone Environmental Pty Ltd KE1006953 OEH
June 2011
Page vii
Table 25 Anthropogenic emissions of particulate matter <10.0 µm in the GMR from
NPI 2008-09 ............................................................................................................. 67
Table 26 Ten largest anthropogenic sources of particulate matter <10 µm in the
GMR ......................................................................................................................... 70
Table 27 Ten largest anthropogenic sources of particulate matter <2.5 µm in the
GMR ......................................................................................................................... 72
Table 28 Information included in the Coal Mines Emission Database ........................... 75
Table 29 Common sources of particulate matter from coal mining ............................. 77
Table 30 Coal mines included in the Coal Mines Emission Database ........................... 77
Table 31 Ranking of coal mining activities based on total emissions of TSP, PM10
and PM2.5 ................................................................................................................ 83
Table 32 Proportion of total TSP emissions produced by various coal mining
activities based on data from GMR coal mines ............................................... 84
Table 33 Proportion of total PM10 emissions produced by various coal mining
activities based on data from GMR coal mines ............................................... 85
Table 34 Proportion of total PM2.5 emissions produced by various coal mining
activities based on data from GMR coal mines ............................................... 86
Table 35 Ranking of coal mines based on total particle emissions................................ 87
Table 36 Ranking of coal mines based on TSP emissions with proportion and
cumulative proportion of total coal mining emissions ..................................... 89
Table 37 Ranking of coal mines based on PM10 emissions with proportion and
cumulative proportion of total coal mining emissions ..................................... 90
Table 38 Ranking of coal mines based on PM2.5 emissions with proportion and
cumulative proportion of total coal mining emissions ..................................... 92
Table 39 TSP, PM10 and PM2.5 emission rates by coalfield ................................................ 93
Table 40 Selection matrix for the review of legislative frameworks in air quality
management for coal mining countries and regions ...................................... 96
Table 41 Long term impact assessment criteria for particulate matter used in
Department of Planning Project Approvals .................................................... 111
Table 42 Short term impact assessment criteria for particulate matter used in
Department of Planning Project Approvals .................................................... 111
Table 43 Long term impact assessment criteria for deposited dust used in
Department of Planning Project Approvals .................................................... 112
Table 44 Long term land acquisition criteria for particulate matter used in
Department of Planning Project Approvals .................................................... 112
Table 45 Short term land acquisition criteria for particulate matter used in
Department of Planning Project Approvals .................................................... 112
Table 46 Long term land acquisition criteria for deposited dust used in
Department of Planning Project Approvals .................................................... 112
Table 47 Assessment criteria relevant to coal mining in NSW ....................................... 131
Katestone Environmental Pty Ltd KE1006953 OEH
June 2011
Page viii
Table 48 Ambient air quality sampling and analysis methods relevant to coal
mining in NSW ...................................................................................................... 132
Table 49 Summary of the New Zealand permit system ................................................. 135
Table 50 Summary of 40 CFR Part 60 Subpart Y – Standards of Performance for
Coal Preparation and Processing Plants .......................................................... 137
Table 51 Summary of 40 CFR Part 60 Subpart Y Section 60.255 – Dust emissions
management plans for open storage stockpiles including loading,
unloading and conveying at Coal Preparation and Processing Plants ...... 137
Table 52 Summary of air quality standards and objectives for 24-hour average
total suspended particulates ............................................................................. 144
Table 53 Summary of air quality standards and objectives for annual average
total suspended particulates ............................................................................. 145
Table 54 Summary of air quality standards and objectives for 24-hour average
PM10 ....................................................................................................................... 146
Table 55 Summary of air quality standards and objectives for annual average
PM10 ....................................................................................................................... 147
Table 56 Summary of air quality standards and objectives for 1-hour average PM2.5147
Table 57 Summary of air quality standards and objectives for 24-hour average
PM2.5 ....................................................................................................................... 148
Table 58 Summary of air quality standards and objectives for 3-year average PM2.5148
Table 59 Summary of air quality standards and objectives for annual average
PM2.5 ....................................................................................................................... 149
Table 60 Summary of air quality standards and objectives for deposited dust ......... 150
Table 61 NPI and AP-42 TSP and PM10 emission factor equations for haul roads ....... 154
Table 62 NPI and AP-42 TSP and PM10 emission factor equations for graders ............ 154
Table 63 Emission factor equation variables for haul roads showing NPI default
values and range and geometric means of AP-42 variables ....................... 155
Table 64 Emission factor equation variable for graders showing NPI default value
and range and geometric mean of AP-42 variable ...................................... 155
Table 65 A summary of usability issues for each suppressant class .............................. 163
Table 66 Best practice control measures to reduce particulate matter emissions
from haul roads .................................................................................................... 165
Table 67 Contribution of various wind erosion sources to GMR emissions of TSP,
PM10 and PM2.5 ..................................................................................................... 166
Table 68 NPI and AP-42 TSP and PM10 emission factor equations for wind erosion of
exposed areas including overburden stockpiles ............................................ 166
Table 69 NPI and AP-42 TSP and PM10 emission factor equations for wind erosion of
active coal stockpiles ......................................................................................... 167
Table 70 Threshold friction velocity for various materials ............................................... 169
Table 71 Best practice control measures to reduce particulate matter emissions
from exposed areas and overburden emplacements .................................. 172
Katestone Environmental Pty Ltd KE1006953 OEH
June 2011
Page ix
Table 72 Best practice control measures to reduce particulate matter emissions
from coal stockpiles ............................................................................................ 174
Table 73 NPI and AP-42 TSP and PM10 emission factor equations for bulldozing coal175
Table 74 NPI and AP-42 TSP and PM10 emission factor equations for bulldozing
overburden........................................................................................................... 175
Table 75 NPI and AP-42 emission factors for bulldozing on coal and overburden
using NPI defaults and AP-42 geometric means of silt and moisture
content variables ................................................................................................ 176
Table 76 Best practice control measures to reduce particulate matter emissions
from bulldozers ..................................................................................................... 178
Table 77 Contribution of blasting and drilling to GMR emissions of TSP, PM10 and
PM2.5 ....................................................................................................................... 178
Table 78 NPI and AP-42 TSP and PM10 emission estimation equations for blasting .... 178
Table 79 Range and geometric means of variables for the NPI and AP-42 emission
estimation equations for blasting ...................................................................... 180
Table 80 NPI and AP-42 TSP and PM10 emission estimation equations for drilling
overburden........................................................................................................... 180
Table 81 Best practice control measures to reduce particulate matter emissions
from blasting ........................................................................................................ 181
Table 82 Best practice control measures to reduce particulate matter emissions
from drilling ........................................................................................................... 182
Table 83 NPI and AP-42 TSP and PM10 emission estimation equations for draglines .. 182
Table 84 NPI defaults and range and geometric means of variables for AP-42
emission estimation equations for draglines .................................................... 183
Table 85 Best practice control measures to reduce particulate matter emissions
from draglines ...................................................................................................... 184
Table 86 Contribution of trucks and loaders dumping overburden to GMR
emissions of TSP, PM10 and PM2.5 ........................................................................ 184
Table 87 NPI and AP-42 TSP and PM10 emission estimation equations for dumping
overburden from trucks ...................................................................................... 185
Table 88 NPI and AP-42 TSP and PM10 emission estimation equations for dumping
overburden by front end loader, excavator or shovel .................................. 185
Table 89 NPI defaults and range and geometric means of variables for AP-42
emission estimation equations for dumping overburden .............................. 185
Table 90 Best practice control measures to reduce particulate matter emissions
from loading and dumping overburden ......................................................... 187
Table 91 Contribution of trucks and loaders dumping coal to GMR emissions of
TSP, PM10 and PM2.5 .............................................................................................. 187
Table 92 NPI and AP-42 TSP and PM10 emission estimation equations for dumping
coal from trucks ................................................................................................... 188
Table 93 NPI and AP-42 TSP and PM10 emission estimation equations for dumping
coal from excavators.......................................................................................... 188

Katestone Environmental Pty Ltd KE1006953 OEH
June 2011
Page x
Table 94 Comparison of NPI and AP-42 emission factors for truck and shovel
dumping coal ...................................................................................................... 188
Table 95 Best practice control measures to reduce particulate matter emissions
from loading and dumping ROM coal ............................................................ 190
Table 96 Best practice control measures to reduce particulate matter emissions
from conveyors and transfers ............................................................................ 191
Table 97 Best practice control measures to reduce particulate matter emissions
from stacking and reclaiming product coal ................................................... 192
Table 98 NPI and AP-42 TSP and PM10 emission estimation equations for loading
trains and trucks with coal ................................................................................. 192
Table 99 Example calculation of the particulate matter emission control metric for
three mines each with three emission sources................................................ 201
Table 100 Management of particulate matter from haul roads in the GMR -
underground mines ............................................................................................. 202
Table 101 Management of particulate matter from haul roads in the GMR - open-
cut mines and combined open-cut and underground mines ..................... 203
Table 102 Current control factor for haul roads in the Coal Mines Emission
Database for GMR coal mines and particulate matter emission control
metrics ................................................................................................................... 204
Table 103 Management of particulate matter from wind erosion in the GMR -
underground mines ............................................................................................. 206
Table 104 Management of particulate matter from wind erosion in the GMR -
open-cut mines and combined open-cut and underground mines .......... 207
Table 105 Management of particulate matter using rehabilitation in the GMR -
underground mines ............................................................................................. 209
Table 106 Management of particulate matter using rehabilitation in the GMR -
open-cut mines and combined open-cut and underground mines .......... 210
Table 107 Current control factor for wind erosion of exposed areas, coal stockpiles
and overburden in the Coal Mines Emission Database for GMR coal
mines and particulate matter emission control metrics ................................ 211
Table 108 Combined particulate matter emission control metric for GMR wind
erosion sources .................................................................................................... 212
Table 109 Current control factor for bulldozing coal and overburden in the Coal
Mines Emission Database for GMR coal mines and particulate matter
emission control metrics ..................................................................................... 212
Table 110 Management of particulate matter from blasting in the GMR - open-cut
mines and combined open-cut and underground mines ............................ 214
Table 111 Management of particulate matter from drilling in the GMR - open-cut
mines and combined open-cut and underground mines ............................ 215
Table 112 Current control factor for blasting and drilling in the Coal Mines Emission
Database for GMR coal mines and particulate matter emission control
metrics ................................................................................................................... 216
Table 113 Management of particulate matter from draglines in the GMR .................. 219
Katestone Environmental Pty Ltd KE1006953 OEH
June 2011
Page xi
Table 114 Management of particulate matter from loading and dumping
overburden in the GMR - open-cut mines and combined open-cut and
underground mines ............................................................................................. 220
Table 115 Current control factor for loading and dumping overburden in the Coal
Mines Emission Database for GMR coal mines and particulate matter
emission control metrics ..................................................................................... 221
Table 116 Management of particulate matter from ROM pad in the GMR - open-
cut mines and combined open-cut and underground mines ..................... 223
Table 117 Current control factor for loading coal in the Coal Mines Emission
Database for GMR coal mines and particulate matter emission control
metrics ................................................................................................................... 224
Table 118 Current control factor for dumping coal in the Coal Mines Emission
Database for GMR coal mines and particulate matter emission control
metrics ................................................................................................................... 226
Table 119 Combined particulate matter emission control metrics for GMR coal
dumping sources ................................................................................................. 227
Table 120 Management of particulate matter from conveyors and transfers in the
GMR - underground mines ................................................................................. 228
Table 121 Management of particulate matter from conveyors and transfers in the
GMR - open-cut mines and combined open-cut and underground mines229
Table 122 Management of particulate matter from materials handling in the GMR -
underground mines ............................................................................................. 230
Table 123 Management of particulate matter from materials handling in the GMR -
open-cut mines and combined open-cut and underground mines .......... 231
Table 124 Combined particulate matter emission control metrics by coalfield and
GMR ....................................................................................................................... 233
Table 125 Air quality monitoring considerations ............................................................... 237
Table 126 Air quality management tools in the GMR - underground mines ................ 239
Table 127 Air quality management tools in the GMR - open-cut mines and
combined open-cut and underground mines ............................................... 240
Table 128 Estimated purchase and operating costs of haul trucks and equipment .. 246
Table 129 Control measures for mines with overburden emplacement emissions ...... 248
Table 130 Control measures for mines with coal stockpile emissions ............................ 249
Table 131 Control measures for mines with exposed area emissions ............................ 250
Table 132 Control measures for mines with emissions from trucks dumping coal to
the ROM hopper .................................................................................................. 253
Table 133 Control measures for mines with grader emissions ......................................... 254
Table 134 Control measures for mines with drilling emissions .......................................... 255
Table 135 No cost emission reductions, reduction in emissions to implement best
practice control measures ................................................................................. 257
Katestone Environmental Pty Ltd KE1006953 OEH
June 2011
Page xii
Table 136 Cumulative cost and reduction by the implementation of best practice
control measures ................................................................................................. 258
Table 137 Current emissions of PM10 by coal mining activity in the GMR and
estimated emissions after the implementation of best practice control
measures and the estimated cost of implementing best practice ............. 260
Table 138 Current emissions of PM10 by coal mine in the GMR and estimated
emissions after the implementation of best practice control measures
and the estimated cost of implementing best practice ............................... 262
Table 139 Summary of cost effectiveness analysis for GMR coal mines ....................... 266
Table 140 Summary of emission reduction measures for other activities ...................... 267

Katestone Environmental Pty Ltd KE1006953 OEH
June 2011
Page xiii
Figures
Figure 1 Sizes of particulate matter smaller than PM2.5 and PM10 relative to the
average width of a human hair .......................................................................... 14
Figure 2 Open-cut and underground coal mining and washing flowchart ................ 17
Figure 3 Underground mining using the bord (or room) and pillar mining
technique ............................................................................................................... 19
Figure 4 Underground mining using the longwall technique ......................................... 19
Figure 5 Open-cut coal mining process ............................................................................ 20
Figure 6 Large excavator loading haul truck ................................................................... 22
Figure 7 Hydraulic shovel loading haul truck ................................................................... 22
Figure 8 Dragline ................................................................................................................... 23
Figure 9 Highwall mining using an auger miner ............................................................... 25
Figure 10 Locations of ambient air quality monitoring stations from OEH
Compendium of Upper Hunter Ambient Air Quality Monitoring Data .......... 28
Figure 11 Box and whisker plot of 24-hour average concentrations of PM10
recorded at Muswellbrook from 2005-2009, Site 1 Muswellbrook Coal
Company ............................................................................................................... 33
Figure 12 Box and whisker plot of 24-hour average concentrations of PM10
recorded at Muswellbrook from 2005-2009, Site 2 Muswellbrook Coal
Company ............................................................................................................... 33
Figure 13 Box and whisker plot of 24-hour average concentrations of PM10
recorded at Muswellbrook from 2005-2009, Site 3 Muswellbrook Coal
Company ............................................................................................................... 34
Figure 14 Box and whisker plot of 24-hour average concentrations of PM10
recorded at Singleton from 2007-2009, Maison Dieu Coal & Allied
Industries Ltd ........................................................................................................... 34
Figure 15 Complaints about dust in the Newcastle and Hunter Coalfields by suburb
and relative coal mining emission rates of PM10, 2007-2009 ........................... 38
Figure 16 Complaints about dust in the Southern Coalfield by suburb and relative
coal mining emission rates of PM10, 2007-2009 .................................................. 39
Figure 17 Complaints about dust in the Western Coalfield by suburb and relative
coal mining emission rates of PM10, 2007-2009 .................................................. 40
Figure 18 World coal production for 2009 showing contributions from individual
countries ................................................................................................................. 49
Figure 19 World coal production from 1981 to 2009 showing contributions from
individual countries ............................................................................................... 50
Figure 20 World coal production for 2009 showing contributions of regional
groupings ................................................................................................................ 51
Figure 21 World coal production from 1981 to 2009 showing contributions of
regional groupings ................................................................................................ 51

Katestone Environmental Pty Ltd KE1006953 OEH
June 2011
Page xiv
Figure 22 World coal production from 1981 to 2009 showing contributions of
national economic groupings ............................................................................. 52
Figure 23 United States coal production by state for 2008 .............................................. 53
Figure 24 Total Australian coal production by state from 1960-61 to 2007-08 ............... 56
Figure 25 Total Australian black coal production by state from 1960-61 to 2007-08 .... 56
Figure 26 NSW coalfields ....................................................................................................... 58
Figure 27 Coal production in the GMR by mining method for 2007-08 .......................... 60
Figure 28 NSW black coal production, historical production from 1960-61 to 2007-
08 and future production from 2008-09 to 2029-30 .......................................... 63
Figure 29 Anthropogenic emissions of particulate matter <10.0 µm in the GMR from
NPI 2008-09 ............................................................................................................. 67
Figure 30 GMR, Sydney, Newcastle and Wollongong Regions ....................................... 69
Figure 31 Ten largest anthropogenic sources of particulate matter < 10 µm in the
GMR ......................................................................................................................... 74
Figure 32 Ten largest anthropogenic sources of particulate matter < 2.5 µm in the
GMR ......................................................................................................................... 74
Figure 33 Schematic representation of the Coal Mines Emission Database ................. 76
Figure 34 Location of coal mines in the Hunter Coalfield ................................................ 79
Figure 35 Location of coal mines in the Newcastle Coalfield ......................................... 80
Figure 36 Location of coal mines in the Southern Coalfield ............................................ 81
Figure 37 Location of coal mines in the Western Coalfield .............................................. 82
Figure 38 Proportion of total TSP emissions produced by various coal mining
activities based on data from GMR coal mines ............................................... 85
Figure 39 Proportion of total PM10 emissions produced by various coal mining
activities based on data from GMR coal mines ............................................... 86
Figure 40 Proportion of total PM2.5 emissions produced by various coal mining
activities based on data from GMR coal mines ............................................... 87
Figure 41 TSP emission rate by coalfield .............................................................................. 93
Figure 42 PM10 emission rate by coalfield ........................................................................... 94
Figure 43 PM2.5 emission rate by coalfield ........................................................................... 94
Figure 44 The National Environmental Policy Act process .............................................. 117
Figure 45 NPI and AP-42 PM10 emission factors for haul roads and sensitivity to
average vehicle mass, surface silt and moisture contents ........................... 156
Figure 46 NPI and AP-42 PM10 emission factors for graders and sensitivity to
average vehicle speed ...................................................................................... 157
Figure 47 NPI default emission factor and AP-42 emission factor equation for PM10
from wind erosion of active coal stockpiles showing sensitivity to wind
speed .................................................................................................................... 168

Katestone Environmental Pty Ltd KE1006953 OEH
June 2011
Page xv
Figure 48 NPI emission factor equation for PM10 from wind erosion of active coal
stockpiles and NPI default emission factor ...................................................... 168
Figure 49 NPI and AP-42 emission factor equations for PM10 from bulldozers
operating on coal (C) and overburden (OB) showing sensitivity to
moisture content (M) and silt content .............................................................. 177
Figure 50 NPI and AP-42 PM10 emission factors for blasting and sensitivity to area
blasted, moisture content and depth of blast ................................................ 179
Figure 51 NPI and AP-42 PM10 emission factors for draglines and sensitivity to drop
height and moisture content ............................................................................. 183
Figure 52 NPI and AP-42 PM10 emission factors for dumping overburden and
sensitivity to moisture content and average wind speed ............................. 186
Figure 53 NPI and AP-42 PM10 emission factors for dumping coal and sensitivity to
moisture content ................................................................................................. 189
Figure 54 Photograph of a train loading facility .............................................................. 193
Figure 55 Survey response: type of coal produced ........................................................ 198
Figure 56 Survey response: type of coal produced ........................................................ 199
Figure 57 Stockpile sprays .................................................................................................... 208
Figure 58 ROM hopper with enclosure .............................................................................. 224
Figure 59 Reduction in emissions and associated costs (per tonne) to implement
control options on haul roads ............................................................................ 247
Figure 60 Reduction in emissions and associated costs (per tonne) to implement
control options on overburden emplacements ............................................. 249
Figure 61 Reduction in emissions and associated costs (per tonne) to implement
control options on coal stockpiles .................................................................... 250
Figure 62 Reduction in emissions and associated costs (per tonne) to implement
control options on exposed areas .................................................................... 251
Figure 63 Reduction in emissions and associated costs (per tonne) to implement
watering on bulldozing coal .............................................................................. 252
Figure 64 Reduction in emissions and associated costs (per tonne) to implement
watering on bulldozing overburden ................................................................. 253
Figure 65 Reduction in emissions and associated costs (per tonne) to implement
control options on trucks dumping coal at the ROM hopper ...................... 254
Figure 66 Reduction in emissions and associated costs (per tonne) to implement
control options on grading ................................................................................ 255
Figure 67 Reduction in emissions and associated costs (per tonne) to implement
control options on drilling ................................................................................... 256
Figure 68 No cost emission reductions, reduction in emissions to implement best
practice control measures ................................................................................. 257
Figure 69 Reduction in PM10 emissions and associated costs (per tonne) to
implement control options by mine activity .................................................... 261

Katestone Environmental Pty Ltd KE1006953 OEH
June 2011
Page xvi
Figure 70 Reduction in PM10 emissions and associated costs (per tonne) to
implement best practice control measures by coal mine ............................ 264

Katestone Environmental Pty Ltd KE1006953 OEH
June 2011
Page 1
Executive Summary There is growing community concern regarding both the health and amenity impacts associated with particle emissions from coal mining in NSW. Katestone Environmental was commissioned by OEH to conduct a review of coal mining activities in the Greater Metropolitan Region of NSW (GMR) to:
Identify the major sources of particles from coal mines (i.e. TSP, PM10 and PM2.5) and rank them in descending order of significance for offsite impacts.
Identify current operational practices and emission controls for minimising particle emissions from coal mining. Visit a representative sample of operational open-cut coal mines in the Hunter Valley to assist in identifying current operational practices and emission controls.
Research and identify international best practice to prevent and/or minimise particle emissions from all activities associated with coal mining including land rehabilitation.
Evaluate the practicality of implementing best practice at coal mines in the GMR. The objectives of the study were to:
Review international best practice measures to prevent and/or minimise particle emissions from all activities associated with NSW coal mines, including land rehabilitation.
Compare international best practice measures to prevent and/or minimise particle emissions with those currently used at NSW coal mines.
Make recommendations regarding the adoption of international best practice measures that could be practicably implemented in NSW at existing and proposed coal mines.
Estimate the likely reduction in particle emissions associated with adopting each international best practice measure at NSW coal mines.
Estimate the costs associated with adopting each international best practice measure at NSW coal mines.
The conclusions and recommendations of the review of coal mining activities in the Greater Metropolitan Region of NSW (GMR) are summarised below. The analysis of coal mining in the GMR indicates that:
There are about 57 open-cut and underground coal mines in the GMR that produce more than 92% of total NSW production of coal. More than half of the mines are located in the Hunter Coalfield between Singleton and Muswellbrook and in the Newcastle Coalfield where the majority of NSW coal production occurs. Coal is also mined west of Sydney in the Western Coalfield in the regions surrounding the towns of Lithgow, Kandos, Rylstone, Mudgee and Ulan. There are a number of mines in the Southern Coalfield in the region surrounding Wollongong, reaching Appin to the north of Wollongong, Tahmoor to the northwest and Berrima to the west.
The existing issues associated with particulate matter emissions from coal mining are illustrated by the following:
Ambient monitoring data collected at Muswellbrook, Singleton and Camberwell indicate that concentrations of particulate matter exceed the Ambient Air Quality NEPM standard for 24-hour average PM10 of 50 µg/m³ on a number of occasions per year.
331 complaints were received by OEH between 2007 and 2009 about air quality issues associated with coal mining. Approximately, 86% of complainants cited dust as a reason for the complaint. Sixty percent of the complaints came from residents in
Katestone Environmental Pty Ltd KE1006953 OEH
June 2011
Page 2
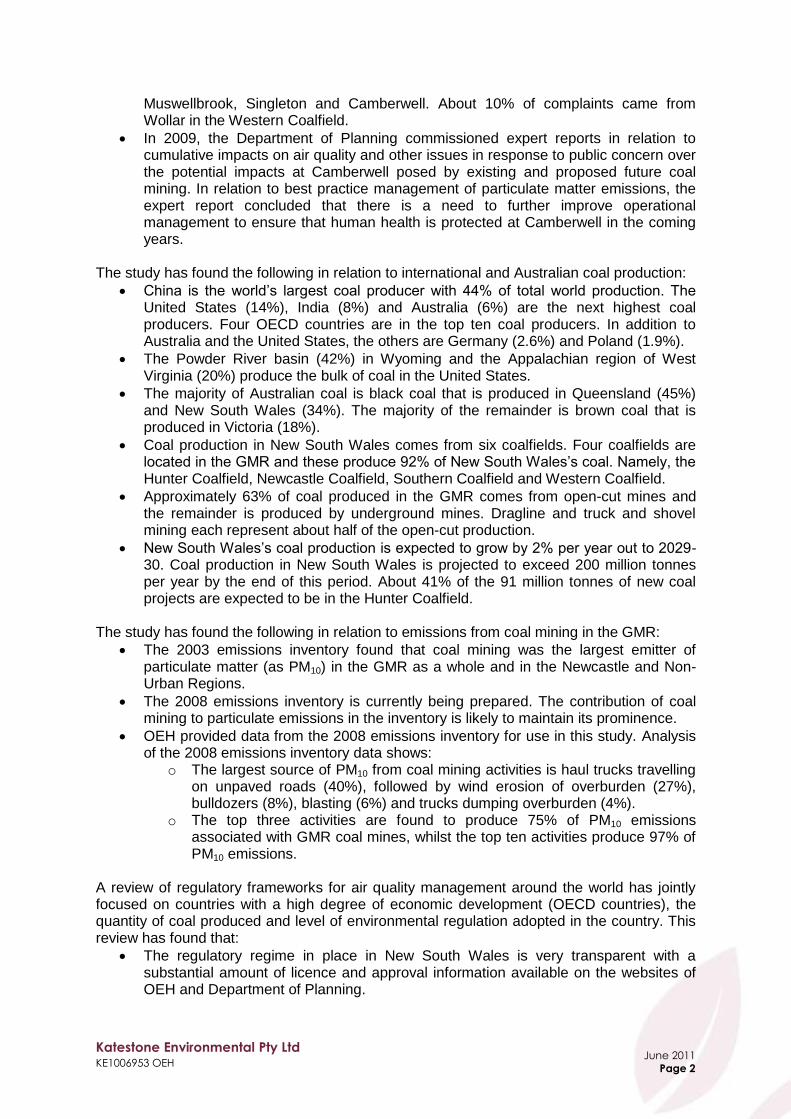
Muswellbrook, Singleton and Camberwell. About 10% of complaints came from Wollar in the Western Coalfield.
In 2009, the Department of Planning commissioned expert reports in relation to cumulative impacts on air quality and other issues in response to public concern over the potential impacts at Camberwell posed by existing and proposed future coal mining. In relation to best practice management of particulate matter emissions, the expert report concluded that there is a need to further improve operational management to ensure that human health is protected at Camberwell in the coming years.
The study has found the following in relation to international and Australian coal production:
China is the world‟s largest coal producer with 44% of total world production. The United States (14%), India (8%) and Australia (6%) are the next highest coal producers. Four OECD countries are in the top ten coal producers. In addition to Australia and the United States, the others are Germany (2.6%) and Poland (1.9%).
The Powder River basin (42%) in Wyoming and the Appalachian region of West Virginia (20%) produce the bulk of coal in the United States.
The majority of Australian coal is black coal that is produced in Queensland (45%) and New South Wales (34%). The majority of the remainder is brown coal that is produced in Victoria (18%).
Coal production in New South Wales comes from six coalfields. Four coalfields are located in the GMR and these produce 92% of New South Wales‟s coal. Namely, the Hunter Coalfield, Newcastle Coalfield, Southern Coalfield and Western Coalfield.
Approximately 63% of coal produced in the GMR comes from open-cut mines and the remainder is produced by underground mines. Dragline and truck and shovel mining each represent about half of the open-cut production.
New South Wales‟s coal production is expected to grow by 2% per year out to 2029-30. Coal production in New South Wales is projected to exceed 200 million tonnes per year by the end of this period. About 41% of the 91 million tonnes of new coal projects are expected to be in the Hunter Coalfield.
The study has found the following in relation to emissions from coal mining in the GMR:
The 2003 emissions inventory found that coal mining was the largest emitter of particulate matter (as PM10) in the GMR as a whole and in the Newcastle and Non-Urban Regions.
The 2008 emissions inventory is currently being prepared. The contribution of coal mining to particulate emissions in the inventory is likely to maintain its prominence.
OEH provided data from the 2008 emissions inventory for use in this study. Analysis of the 2008 emissions inventory data shows:
o The largest source of PM10 from coal mining activities is haul trucks travelling on unpaved roads (40%), followed by wind erosion of overburden (27%), bulldozers (8%), blasting (6%) and trucks dumping overburden (4%).
o The top three activities are found to produce 75% of PM10 emissions associated with GMR coal mines, whilst the top ten activities produce 97% of PM10 emissions.
A review of regulatory frameworks for air quality management around the world has jointly focused on countries with a high degree of economic development (OECD countries), the quantity of coal produced and level of environmental regulation adopted in the country. This review has found that:
The regulatory regime in place in New South Wales is very transparent with a substantial amount of licence and approval information available on the websites of OEH and Department of Planning.

Katestone Environmental Pty Ltd KE1006953 OEH
June 2011
Page 3
Best practice is not strictly defined in the New South Wales legislation, but a form of best practice is implicit in Section 128 of the Protection of the Environment Operations Act 1997 (POEO Act) that requires “...the occupier of a premises to carry on any activity, or operate any plant, in or on the premises by such practicable means as may be necessary to prevent or minimise air pollution.” As distinct from other aspects of New South Wales legislation (e.g. the Protection of the Environment Operations (Clean Air Regulation) 2002 (CAR) in relation to point source emissions), there is no legislation or guideline that might provide the regulator, community or coal mine with a detailed and practical interpretation of what Section 128 might mean for coal mining.
In the United States and Canada, the legislation and project approvals provide specific and detailed expectations about controlling emissions of particulate matter from coal mining.
The NSW approach is deliberately less prescriptive to allow the licensee to determine the optimal approach to achieving the ongoing minimisation. The less prescriptive approach means that conditions of development approval do not specifically state the commitments made during the Environmental Assessment, but include a statement that the project shall be carried out “generally in accordance with the Environmental Assessment.” Additionally, the assumptions made in the Environmental Assessment can be optimistic with regard to a mine‟s ability to achieve an appropriate level of minimisation or lack specificity as to how the minimisation will be achieved in practice.
No impact assessment criterion has been specified by OEH for 24-hour average TSP. The Canadian province of Alberta provides a 24-hour average TSP criterion of 100 µg/m³, which is the most stringent criterion of all jurisdictions considered in the review.
The annual average TSP impact assessment criterion adopted by OEH is less stringent than the strictest limits adopted by other jurisdictions considered in the review. The Canadian provinces of Alberta, British Columbia and Ontario and the Government of Canada provide an annual average TSP criterion of 60 µg/m³, which is the most stringent criterion of all jurisdictions considered in the review.
The 24-hour average PM10 impact assessment criterion adopted by OEH is consistent with the strictest limits adopted by other jurisdictions considered in the review.
The annual average PM10 impact assessment criterion adopted by OEH is less stringent than the strictest limits adopted by other jurisdictions considered in the review. The World Health Organisation, California and Scotland provide annual average PM10 criteria that are equal to or less than 20 µg/m³, which are the most stringent criteria of all jurisdictions considered in the review.
No impact assessment criteria have been specified by OEH for PM2.5. Annual average and 24-hour average criteria have been specified by most jurisdictions considered in the review. The stated position of OEH is that there is currently an Ambient Air Quality NEPM process considering developing a standard for PM2.5 in Australia and OEH is awaiting the outcome of this process prior to setting impact assessment criteria for PM2.5.
The impact assessment criteria for deposited dust adopted by OEH are consistent with the strictest limits adopted by other jurisdictions considered in the review.
The differences between OEH‟s impact assessment criteria and the Department of Planning‟s land acquisition criteria, leaves a gap that is filled by the land acquisition process. The land acquisition process requires a person to be affected and for that affected party to make representations to the mine in order to trigger action.
Emissions of particulate matter from coal mining are not captured under New South Wales Load Based Licensing scheme. In the United States coal mines that exceed a
Katestone Environmental Pty Ltd KE1006953 OEH
June 2011
Page 4
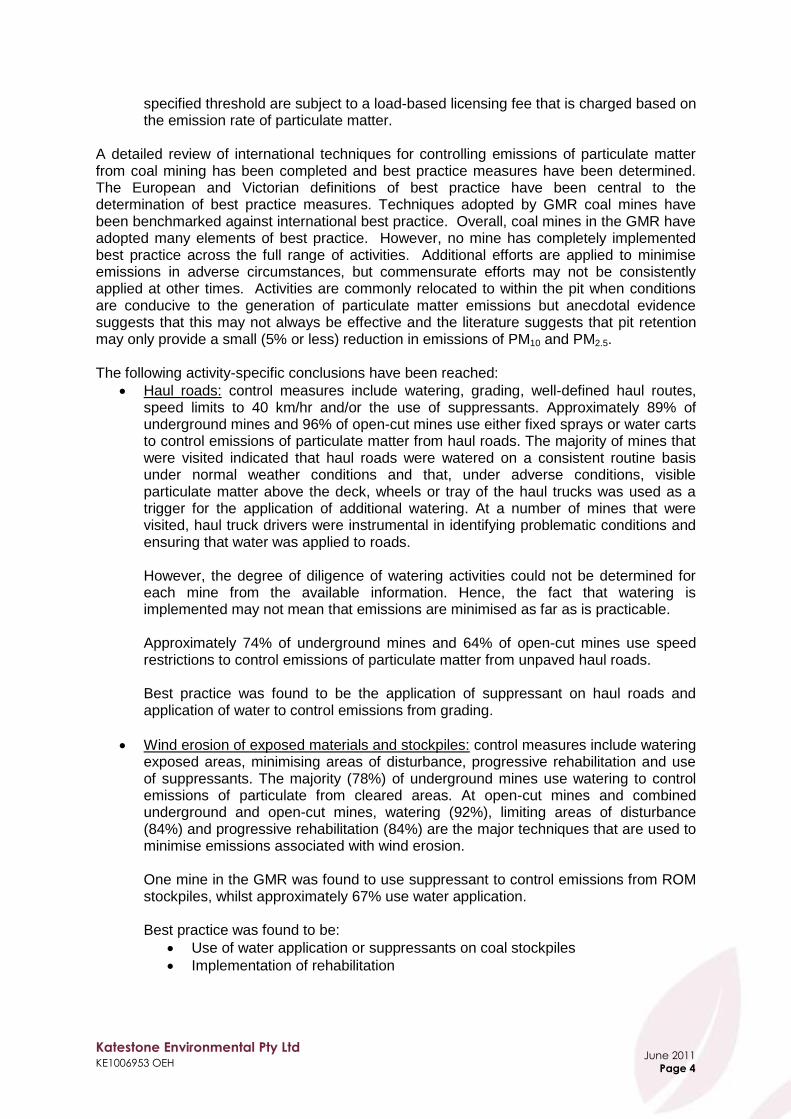
specified threshold are subject to a load-based licensing fee that is charged based on the emission rate of particulate matter.
A detailed review of international techniques for controlling emissions of particulate matter from coal mining has been completed and best practice measures have been determined. The European and Victorian definitions of best practice have been central to the determination of best practice measures. Techniques adopted by GMR coal mines have been benchmarked against international best practice. Overall, coal mines in the GMR have adopted many elements of best practice. However, no mine has completely implemented best practice across the full range of activities. Additional efforts are applied to minimise emissions in adverse circumstances, but commensurate efforts may not be consistently applied at other times. Activities are commonly relocated to within the pit when conditions are conducive to the generation of particulate matter emissions but anecdotal evidence suggests that this may not always be effective and the literature suggests that pit retention may only provide a small (5% or less) reduction in emissions of PM10 and PM2.5. The following activity-specific conclusions have been reached:
Haul roads: control measures include watering, grading, well-defined haul routes, speed limits to 40 km/hr and/or the use of suppressants. Approximately 89% of underground mines and 96% of open-cut mines use either fixed sprays or water carts to control emissions of particulate matter from haul roads. The majority of mines that were visited indicated that haul roads were watered on a consistent routine basis under normal weather conditions and that, under adverse conditions, visible particulate matter above the deck, wheels or tray of the haul trucks was used as a trigger for the application of additional watering. At a number of mines that were visited, haul truck drivers were instrumental in identifying problematic conditions and ensuring that water was applied to roads. However, the degree of diligence of watering activities could not be determined for each mine from the available information. Hence, the fact that watering is implemented may not mean that emissions are minimised as far as is practicable.
Approximately 74% of underground mines and 64% of open-cut mines use speed restrictions to control emissions of particulate matter from unpaved haul roads. Best practice was found to be the application of suppressant on haul roads and application of water to control emissions from grading.
Wind erosion of exposed materials and stockpiles: control measures include watering exposed areas, minimising areas of disturbance, progressive rehabilitation and use of suppressants. The majority (78%) of underground mines use watering to control emissions of particulate from cleared areas. At open-cut mines and combined underground and open-cut mines, watering (92%), limiting areas of disturbance (84%) and progressive rehabilitation (84%) are the major techniques that are used to minimise emissions associated with wind erosion. One mine in the GMR was found to use suppressant to control emissions from ROM stockpiles, whilst approximately 67% use water application. Best practice was found to be:
Use of water application or suppressants on coal stockpiles
Implementation of rehabilitation

Katestone Environmental Pty Ltd KE1006953 OEH
June 2011
Page 5
Bulldozing: best practice control measures include minimising the travel speed and distance travelled by bulldozers and the application of water to keep travel routes moist.
Blasting: best practice control measures include delaying shot to avoid unfavourable weather conditions and minimising the area blasted. Most mines (91%) restrict blasting to times of favourable weather conditions.
Drilling: best practice control measures include air extraction to a bag filter. No mines were found to use this practice. Approximately 58% of mines control emissions using water sprays, which are less effective than the use of fabric filtration, but still have a good level of effectiveness. Approximately, 62% use curtains to limit emissions.
Draglines: there are seven open-cut mines that utilise draglines. Best practice control measures for draglines is minimising the drop height of materials to 5 metres and the suspension of operations in adverse conditions. Three GMR coal mines reported that drop heights were minimised to between 6 and 12 metres. Six metres has been taken to be equivalent to best practice.
Loading and dumping overburden: current practices adopted to control emissions from loading and dumping overburden were found to be water application, minimisation of drop heights and suspension or modification of activities during adverse weather conditions. Best practice control measures were identified as minimising drop heights and or the application of water.
Loading and dumping ROM coal: best practice control measures for minimising emissions from the ROM hopper is enclosure with air extraction to a fabric filter or other control device. No mines in the GMR adopt this approach. Three mines (13%) were found to utilise enclosure on three sides and water sprays. Most (83%) mines use water sprays activated by the movement of the truck.
Monitoring, proactive and reactive management: Of the open-cut mines, 84% monitor meteorological conditions and 48% monitor using a TEOM or other continuous particulate monitoring technique. Forty eight percent modify or cease activities on dry or windy days based on consideration of monitoring data. At least three mines have continuous particulate matter monitoring data available in the control room with alarms to alert operators when trigger levels are being exceeded. A number of mines use a forecasting system and inversion tower data to predict the potential for strong inversions for scheduling blasts to avoid noise impacts. Three mines were identified that adopt similar proactive approaches for management of particulate matter emissions.
A particulate matter emission control metric has been developed to quantify the progress towards achieving best practice in GMR mines, which shows that:
The Hunter and Newcastle coalfields have a similar level of particulate matter emissions control as an aggregate of all sources of emissions. Particulate matter emission control metrics of 63.2 and 67.0 out of 100 were estimated for these coalfields, respectively. The metrics indicate a moderate level of progress towards achieving best practice.
Whilst lower combined metrics are evident in the Southern (46.5 out of 100) and Western (51.4 out of 100) coalfields, the relatively low contribution of these coalfields to the overall emissions into the GMR airshed mean that the combined GMR metric (62.8) is marginally lower than the Hunter and Newcastle coalfield metrics.

Katestone Environmental Pty Ltd KE1006953 OEH
June 2011
Page 6
A cost benefit analysis has been conducted to estimate the cost to implement best practice control measures in GMR mines and the reduction in emissions of particulate matter that would be achieved by its implementation. The conclusions of this cost benefit analysis are as follows:
Overall costs and benefits: o Significant reductions in emissions of particulate matter could be achieved
through the application of best practice control measures that are both technically and economically feasible.
o The cost of implementing best practice particulate emission controls in GMR coal mines was estimated to be $164M per year.
o The application of best practice particulate emission controls was estimated to produce a 49% reduction in overall emissions of PM10.
o This reduction relies heavily on achieving a substantial increase in the area of land rehabilitated per year and the application of suppressant to haul roads.
o Costs and benefits of the application of best practice control measures to different mine activities are based on generalised assumptions about mine activities, costs and effectiveness of those control measures. The actual cost and effectiveness will be dependent on site specific factors that need to be evaluated on a case-by-case basis.
Haul roads: o The greatest reduction in emissions would be achieved by the application of
suppressants to haul roads, which will reduce the current emissions by 21%. The cost for this is $59M per year.
o A similar reduction in emissions could be achieved by the conversion of 50% of the haul roads to conveyors, which is estimated to cost $24M per year, and would reduce current emissions by 20%.
o The most cost-effective control measure would be the replacement of the current fleet with larger-capacity vehicles, which is shown not to incur any additional costs, but instead produces a significant cost saving due to the reduction in the number of vehicles required to be purchased, as well as reduced operating costs. The use of larger haul trucks is estimated to reduce costs by $105M per year across GMR mines and to reduce overall emissions by 10%.
Overburden emplacements: o Rehabilitation of 80% of the overburden emplacements will reduce the current
emissions by 20% and is estimated to cost $20M per year. o Rehabilitation is a more cost-effective approach in minimising emissions than
watering.
Coal stockpiles: o The greatest reduction in emissions from coal stockpiles was achieved by the
application of suppressants, which is expected to reduce the current emissions by 2.0% at an ongoing cost of $33M per year.
o A more cost effective approach would be the application of Level 2 watering, estimated to reduce current emissions by 1.0% and is estimated to cost $8M per year
Exposed areas: o Full rehabilitation of other exposed areas is estimated to reduce current
emissions by almost 3%, and is estimated to reduce the costs of current control measures (namely watering) by approximately $4M.
o Full or partial rehabilitation of the exposed areas is shown to reduce the

Katestone Environmental Pty Ltd KE1006953 OEH
June 2011
Page 7
ongoing operational costs and the current emissions.
Bulldozing: o Watering while bulldozing coal will reduce the current emissions by almost
2.0% of the current emissions and is estimated to cost over $53M per year. o Watering while bulldozing overburden will reduce the current emissions by
less than 2% of the current emissions and is estimated to cost over $156M per year.
Trucks dumping coal to the ROM hopper: o Enclosing the ROM hopper and the use of fabric filters is shown to reduce
current PM10 emissions by less than 1% at a cost of $2M per year.
Graders: o The application of level 2 watering to grading activities is estimated to reduce
emissions by less than 1% at an estimated cost of $38M per year.
Drilling: o The use of fabric filters on drill rigs is estimated to reduce emissions by less
than 1.0% at a cost of $150,000 per year. o The cost of using the enclosure is significantly lower, estimated to cost
$24,000 per year, and estimated to reduce emissions by less than 1.0%. Based on the findings and conclusions of this study, the following steps may be considered to reduce emissions of particulate matter from coal mining activities.
Provide a definition of best management practices (BMP) in the CAR that would be applied in instances where there is no standard of concentration defined under Section 128 of the POEO Act.
Include opacity as an indicator of fugitive emissions of particulate matter and specify a limit for opacity with reference to limits defined in other jurisdictions. In the United States coal mining activities are required to minimise emissions to be less than a 20% opacity level. Such an approach could provide for a greater degree of management and control of emissions from haul roads and other emission sources, but would require training of mine and regulatory personnel to implement and enforce. Open-path opacity monitoring equipment could provide a technological solution to this.
Consideration should be given to the development of a handbook, guideline or regulation that defines BMP for the control of particulate matter emissions from coal mining activities. The handbook could be initially developed from the findings of this study, but would be a dynamic document that is updated regularly based on experience, future innovation, community and stakeholder input. The document could:
o Define appropriate emissions estimation techniques o Be referenced in conditions of approval and EPL conditions o Used as a tool for auditing o Used as a tool for developing management programs o Used as a resource for impact assessment studies o Define acceptable control factors for the development of emissions
inventories required under the legislation. Alternative control factors or control measures that deviate from best practice could be acceptable based on review and approval using a process similar to the Chief Scientist process that is used to approve alternative sampling methods under the CAR.
Katestone Environmental Pty Ltd KE1006953 OEH
June 2011
Page 8
Incorporate coal mining into the load-based-licensing scheme. This could be used to drive the take up of more effective emission controls, but would require the development of the handbook described above. This may also motivate the development of more robust techniques for the quantification of particulate matter emissions from coal mining.
Undertake a review of the currency, adequacy and effectiveness of existing TSP, PM10 and dust deposition criteria in avoiding adverse impacts on human health and amenity. Consider within this review whether PM2.5 criteria should be adopted. Revise the Approved Methods for the Modelling and Assessment of Air Pollutants in NSW accordingly.
Develop a regional dispersion model for the Hunter Coalfield to assist the planning and development. The model would need to incorporate:
o Existing activities and use mine plans to project future emissions. This may require ongoing provision of mine plans to an administrative body for incorporation into the model
o Historical ambient air quality monitoring data o Historical surface meteorological measurements incorporated into a 3-
dimensional meteorological model o Approved mining activities
The model could be used to:
o Provide an agreed and approved framework for the planning and approval of new coal mines or extension of existing mines
o Forecast air quality to provide information and alerts to mine managers and to community about air quality.
Require new coal mine developments (at EA stage) and existing coal mines to conduct site specific BMP determinations to identify the most technically and economically feasible options to reduce emissions. For new developments, the BMP determination should be transparently linked to the air quality impact assessment and detailed in the air quality management plan (AQMP), which should also accompany the EA. For existing premises, the BMP determination could be required through a pollution reduction program (PRP) and the outcomes implemented through EPL conditions.

Katestone Environmental Pty Ltd KE1006953 OEH
June 2011
Page 9
1. Introduction
1.1 Study background
The NSW Office of Environment and Heritage (OEH) has commenced an environmental review that aims to benchmark the performance of the NSW coal mining industry against international best practice measures to prevent and/or minimise particle emissions. There is growing community concern regarding both the health and amenity impacts associated with particle emissions from coal mining in the Greater Metropolitan Region (GMR) of NSW. Many recent scientific studies have confirmed that exposure to particles are associated with health risks. Katestone Environmental was commissioned by OEH to conduct a review of coal mining activities in the GMR to:
Identify the major sources of particles from coal mines (i.e. TSP, PM10 and PM2.5) and rank them in descending order of significance for offsite impacts.
Identify current operational practices and emission controls for minimising particle emissions from coal mining. Visit a representative sample of operational open-cut coal mines in the Hunter Valley to assist in identifying current operational practices and emission controls.
Research and identify international best practice to prevent and/or minimise particle emissions from all activities associated with coal mining including land rehabilitation.
Evaluate the practicality of implementing best practice at coal mines in the GMR. The GMR measures 210 km (east-west) by 273 km (north-south) and includes the greater Sydney, Newcastle and Wollongong regions. The GMR covers a total area of 57,330 square kilometres. Approximately, 76% of the population of NSW resides within the GMR1. There are about 57 open-cut and underground coal mines in the GMR that are responsible for more than 92% of total NSW production of coal. More than half of the mines are located in the Hunter Coalfield between Singleton and Muswellbrook and in the Newcastle Coalfield and these produce the majority of NSW coal. Coal is also mined west of Sydney in the Western Coalfield in the regions surrounding the towns of Lithgow, Kandos, Rylstone, Mudgee and Ulan. There are a number of mines in the Southern Coalfield in the region surrounding Wollongong, reaching Appin to the north of Wollongong, Tahmoor to the northwest and Berrima to the west. The air emissions inventory for the GMR1 shows that the coal mining industry is the largest industrial emitter of:
TSP in the GMR, emitting 88,606,091 kg of TSP per year, or 45.5% of anthropogenic emissions.
PM10 in the GMR, emitting 32,109,349 kg of PM10 per year, or 42.7% of anthropogenic emissions.
PM2.5 in the GMR, emitting 6,887,798 kg of PM2.5 per year, or 22.6% of anthropogenic emissions.

Katestone Environmental Pty Ltd KE1006953 OEH
June 2011
Page 10
Particulate matter is the major air pollutant that is emitted from coal mining and processing activities. The majority of particulate matter emitted from coal mining consists of large particles generated from activities such as mechanical disturbance of rock and soil materials by bulldozing, blasting and trucks travelling on dirt roads. Particulate matter is also generated from wind erosion of stockpiles and bare ground. The majority of particulate matter generated by open-cut mining activities is derived from the dirt, rock and soil. The Coal Mines Emission Database (CMED) that was analysed for this study (Section 7.3) indicates that approximately 11% of particulate matter emitted from GMR mines is from coal handling and storage. Particulate matter has the potential to cause nuisance impacts in surrounding communities due to soiling of surfaces such as clothes and buildings. Particulate matter in elevated concentrations also has the potential to cause adverse health effects. In sensitive individuals, or when high levels of fine particles are present, particulate matter may contribute to increased rates of respiratory illnesses and other symptoms. In NSW, the most challenging region for management of particulate matter emissions from coal mining is in the Hunter Coalfield. The Hunter Coalfield produces almost 60% and 65% of all coal produced in NSW and GMR, respectively. It is from this region that OEH receives the most complaints about particulate matter from coal mining and significant expansion in coal mining is expected over the medium term. Growth in coal production is expected in all NSW coalfields over the medium term and, with current emission controls, this could lead to higher ambient concentrations of particulate matter in populated areas such as Muswellbrook and Singleton and also in smaller towns such as Camberwell in the Hunter and Wollar in the Western Coalfields.
1.2 Study aims and objectives
This study has been prepared to address the aims and objectives specified in the Tender Document issued by OEH (Appendix A). OEH contracted Katestone Environmental to complete the review with the following broad objectives:
Establish existing practices for minimising particle emissions from NSW coal mines and benchmark them against international best practice.
Estimate the likely reduction in particle emissions and costs associated with adopting those international best practice measures.
The objectives of the study were to:
Review international best practice measures to prevent and/or minimise particle emissions from all activities associated with NSW coal mines, including land rehabilitation.
Compare international best practice measures to prevent and/or minimise particle emissions with those currently used at NSW coal mines.
Make recommendations regarding the adoption of international best practice measures that could be practicably implemented in NSW at existing and proposed coal mines.
Estimate the likely reduction in particle emissions associated with adopting each international best practice measure at NSW coal mines.
Estimate the costs associated with adopting each international best practice measure at NSW coal mines.

Katestone Environmental Pty Ltd KE1006953 OEH
June 2011
Page 11
1.3 Study methodology and document outline
The key elements of the study and structure of the report are as follows:
Amenity Impacts and Health Effects of Particulate Matter: Definitions of particulate matter and a discussion of the potential for particulate matter to affect human health, amenity and the environment (Section 2).
Overview of Coal Mining Process and Techniques: An overview of the coal mining process that introduces coal mining techniques, terminology and methods and describes coal mining processes that produce emissions of particulate matter (Section 3).
Air Quality Impacts in Mining Areas: Various measures are considered such as complaints, ambient particulate measurements and non-compliance with environment protection licence conditions to provide a picture of the current issues associated with coal mining. The Camberwell Cumulative Impacts Review was also considered in this section to provide insight into the issues that exist in some mining communities and the sense that work needs to be done in various areas to improve the planning, assessment and regulation of coal mining activities to ensure that there is an ongoing minimisation of potential impacts (Section 4).
Identifying Major Coal Producers: A review of World coal production by country, region and economic groupings was conducted to focus the international literature review on countries and regions that are most likely to have invested heavily in research and development of controls and regulatory regimes for management of particulate matter from coal mining (Section 5).
Coal Production in Australia: A review of coal production in Australia was conducted to provide the local context and to identify the key coalfields in NSW. The method of coal mining was considered to determine whether this may have an important bearing on the potential for impact in different regions. Future trends in coal production are also considered, because in general terms increasing production whilst adopting the current approaches to particulate control will lead to increased emissions and potential impacts (Section 6).
Emissions Inventory Data for NSW Coal Mines: Coal mining emissions in the GMR were quantified by OEH in the 2003 calendar year air emissions inventory. This data has been summarised to show the relative contribution of coal mining to particulate matter emissions in the GMR as a whole and to the Sydney, Newcastle, Wollongong and Non-Urban Regions within the GMR (Section 7).
Coal Mining Air Emissions Inventory for the GMR 2008: OEH is currently preparing an emissions inventory for the 2008 calendar year. Coal mining data from this inventory was provided to Katestone Environmental for the benchmarking study. This information has been used to determine the relative contributions of specific aspects of the coal mining process to an individual mine‟s emissions and to overall emissions into the GMR airshed. Individual sources of particulate matter from coal mining activities have been ranked. This data has been used to focus the best practice literature review and review of current practices adopted by the coal mining industry in the GMR (Section 7.3).
Legislative Frameworks for Coal Mining: The regulatory frameworks for the management of particulate matter emissions from coal mining in major coal
Katestone Environmental Pty Ltd KE1006953 OEH
June 2011
Page 12
producing countries have been researched and compared against current practice in NSW. Countries that are members of the Organisation for Economic Cooperation and Development (OECD) were the focus of this research, but consideration was also given to the frameworks adopted in non-member countries that are major coal producers. The concept of best practice is considered and the procedures used to plan, develop and regulate coal mining activities are discussed (Section 8).
International Techniques for Controlling Particulate Matter Emissions from Coal Mining: International techniques for controlling particulate emissions from coal mining have been researched and best practice measures have been identified (Section 9).
NSW Techniques for Controlling Particulate Matter Emissions from Coal Mining: Current techniques for controlling particulate matter emissions from coal mines in the GMR have been researched (Section 10) by considering:
o Documents published by the coal mines such as: Annual Environment Management Reports (AEMR), Environmental Management Plans (EMP) and Environmental Management Systems (EMS).
o Conditions of Approval and Environment Protection Licences (EPL). o Information sourced during site visits to thirteen mines in the Hunter and
Newcastle coalfields. o An internet survey of GMR mines conducted in July-August 2010 and a
follow-up survey conducted in February-March 2011.
Air Quality Management Tools: The air quality management tools that are used to control emissions of particulate matter from coal mines and current practices adopted by coal mines in the GMR are detailed (Section 11). An Air Quality Management Plan (AQMP) is an essential part of controlling emissions of particulate matter. Measures to minimise the potential impact of fugitive particulate matter emissions must recognise all potential sources and have strategies in place to mitigate any unnecessary emissions and adverse impacts that the proposed activities may have on the health and amenity of the surrounding community. An AQMP should have both proactive and reactive components.
Estimated Costs of Controlling Particulate Matter Emissions from NSW Coal Mines: A cost benefit analysis has been conducted to determine the cost of using best practice particulate emissions controls at GMR mines. The benefits, in terms of the reduction in emissions of particulate matter, have been determined along with the cost per tonne of particulate matter avoided (Section 12).
Conclusions and Recommendations: Conclusions of the study and potential improvements to the management of particulate matter emissions from coal mines in the GMR are also presented (Section 13).
Katestone Environmental Pty Ltd KE1006953 OEH
June 2011
Page 13
2. Amenity Impacts and Health Effects of Particulate Matter
This section provides definitions of particulate matter including the key metrics (TSP, PM10 and PM2.5) that are used throughout the document. A discussion of the potential for particulate matter to affect human health, amenity and the environment is also provided.
2.1 Definitions of particulate matter
Particulate matter is a term used to define solid or liquid particles that may be suspended in the atmosphere. Particulate matter is a generic term that is commonly used interchangeably with other terms such as smoke, soot, haze and dust. The potential affect of particulate matter on the environment, human health and amenity depends on the size of the particles, the concentration of particulate matter in the atmosphere and rate of deposition. Concentration is the mass of particulate matter that is suspended per unit volume of air. Suspended particulate matter in ambient air is usually measured in micrograms per cubic metre (µg/m³). Deposition is the mass of particulate matter that settles per unit surface area. Deposited particulate matter is usually measured in grams per square metre (g/m2). Particulate matter with an aerodynamic diameter greater than 10 micrometres (µm) tend to be associated with amenity impacts, while particulate matter less than 10 µm are associated with health impacts. For this reason, particulate matter is sub-divided into a number of metrics based on particle size. These metrics are total suspended particulates (TSP), PM10, PM2.5 and dust deposition rate:
TSP refers to the total of all particles suspended in the air. When TSP is measured using a high volume air sampler, the maximum particle size has been found to be approximately 30 µm2. TSP was first used as a human health metric, but research has found a poor correlation between the concentration of TSP and health effects. TSP is now used as a metric of the potential for particulate matter to affect amenity.
PM10 is a subset of TSP2 and refers to particles suspended in the air with an aerodynamic diameter less than 10 µm.
Coarse particulate matter2 is a subset of TSP and PM10 and refers to particles suspended in the air with an aerodynamic diameter between 2.5 and 10 µm.
PM2.5 is a subset of TSP and PM10 and refers to particles suspended in the air with an aerodynamic diameter less than 2.5 µm. PM2.5 is also called fine particulate matter2.
Dust deposition rate is the mass of particulate matter that collects on an area over a one month period. Dust deposition rate is used as a metric of the potential for particulate matter to affect amenity.
The atmospheric lifetimes of particles depends on the size of the particle with coarse particulate matter tending to deposit quickly and in relatively close proximity to its point of emissions, whilst fine particulate matter may remain suspended in the atmosphere for many days and travel many hundreds of kilometres. The atmospheric lifetimes of particles and potential travel distances based on the particle size are summarised in Table 13.

Katestone Environmental Pty Ltd KE1006953 OEH
June 2011
Page 14
Table 1 Atmospheric lifetime and potential travel distance for particles of various
size categories
Particle size
Description Atmospheric
lifetime Travel distance
TSP Total of all particles suspended in the atmosphere
Minutes to hours
Typically deposits within the proximate area downwind of the point of emissions
PM10 A subset of TSP, including all particles smaller than 10 µm in diameter.
Days Up to 100 kilometres or more
PM2.5 A subset of the PM10 and TSP categories, including all particles smaller than 2.5 µm in diameter.
Days to weeks Hundreds to thousands of kilometres
Figure 14 shows the sizes of particulate matter as PM2.5 and PM10 relative to the average width of a human hair, which is 70 µm.
Figure 1 Sizes of particulate matter smaller than PM2.5 and PM10 relative to the
average width of a human hair
2.2 Amenity impacts of particulate matter
Amenity impacts can occur when levels of particulate matter become elevated5. The following impacts on amenity are commonly noted:
Short-term reduction in visibility. For example, at a local scale particulate matter may pass across a road and temporarily affect a driver‟s ability to see oncoming traffic. At a regional scale, a visible plume of particulate matter may adversely affect the aesthetics of the environment such as scenic views.
Katestone Environmental Pty Ltd KE1006953 OEH
June 2011
Page 15
Build up of particulate matter on surfaces within homes resulting in the occupant needing to clean more frequently.
Soiling of washing.
Build up of particulate matter on the roofs of houses and, during rainfall, the flushing of the particulate matter into rainwater tanks potentially affecting quality of drinking water or tank capacity.
2.3 Health effects of particulate matter
The human body's respiratory system has a number of defence mechanisms to protect against the harmful effects of particulate matter5. Coarse particulate matter may be trapped in the mucus on the walls of the airways and can be removed by cilia, small hair-like structures that line the surface of the airways. The particulate matter is expelled from the body by coughing or is swallowed. There is a demonstrated statistical association between health effects and the concentration of fine particulate matter. Recent studies Ono6, Cowherd and Donaldson7 and USEPA8 indicate that in susceptible sub-populations, fine particulate matter from combustion related sources are markedly more detrimental to health than coarse particulate fractions (PM10-2.5). There is data associating PM10 from a combustion origin with health effects but this fraction also contains PM2.5
9 and, hence, the specific cause cannot be delineated. Exposure to particulate matter can cause a variety of health effects5. For example, numerous studies link levels of fine particulate matter to increased hospital admissions and emergency room visits and even to death from heart or lung diseases. Both long (over years) and short term (hours or days) particle exposure have been linked to health problems. There is clearly a fundamental distinction between particulate matter originating from the combustion of fuel and secondary chemical reactions, and mechanically generated crustal particulate matter. Where the former is generated for example by motor vehicles, power stations, and industrial activities and consists predominantly of fine particulate matter (PM2.5). While the latter, originates from construction, mining, earth works, unpaved roads, agricultural activities and erosion and consists predominantly of coarse particulate matter (PM10). Ono6, Cowherd and Donaldson7 and USEPA8 noted there are clear distinctions between:
The character of the ambient mix of particles generally found in urban areas as compared to that found in rural areas.
The nature of the evidence concerning health effects associated with thoracic coarse particles generally found in urban versus rural areas.
Further, the mix of particles typically found in areas with combustion sources such as industrial sites and urban areas contain a number of contaminants that are not commonly present, or not present to the same degree, in the mix of natural crustal particles. Particles of crustal origin, which are predominately in the coarse fraction, appear to be relatively non-toxic under most circumstances, compared to combustion-related particles. NSW Health5 considers that the following people may be more susceptible to the health effects of fine and coarse particles:
Infants, children and adolescents.
The elderly.
People with respiratory conditions such as asthma, bronchitis and emphysema.

Katestone Environmental Pty Ltd KE1006953 OEH
June 2011
Page 16
People with heart disease.
People with diabetes. If health effects arise from exposure to particulate matter, the symptoms are likely to be5:
Coughing.
Wheezing or worsening of asthma.
Increased need for medications (e.g. puffers, antibiotics).
Increased breathlessness.
Sneezing and sore eyes. NSW Health reports5 that recent research suggests that heart problems, such as angina and heart attacks may also be associated with coarse particle pollution. Particulate matter is the major air pollutant that is emitted from coal mining and processing activities. The majority of particulate matter emitted from coal mining consists of large particles generated from activities such as mechanical disturbance of rock and soil materials by bulldozing, blasting and vehicles on dirt roads. Particulate matter is also generated from wind erosion of stockpiles and bare ground. Section 8.7 presents a comparison of ambient air quality standards for particulate matter including total suspended particulate (TSP), PM10, PM2.5 and deposited dust that are promulgated in various national and state/provincial jurisdictions in Table 52 to Table 60.
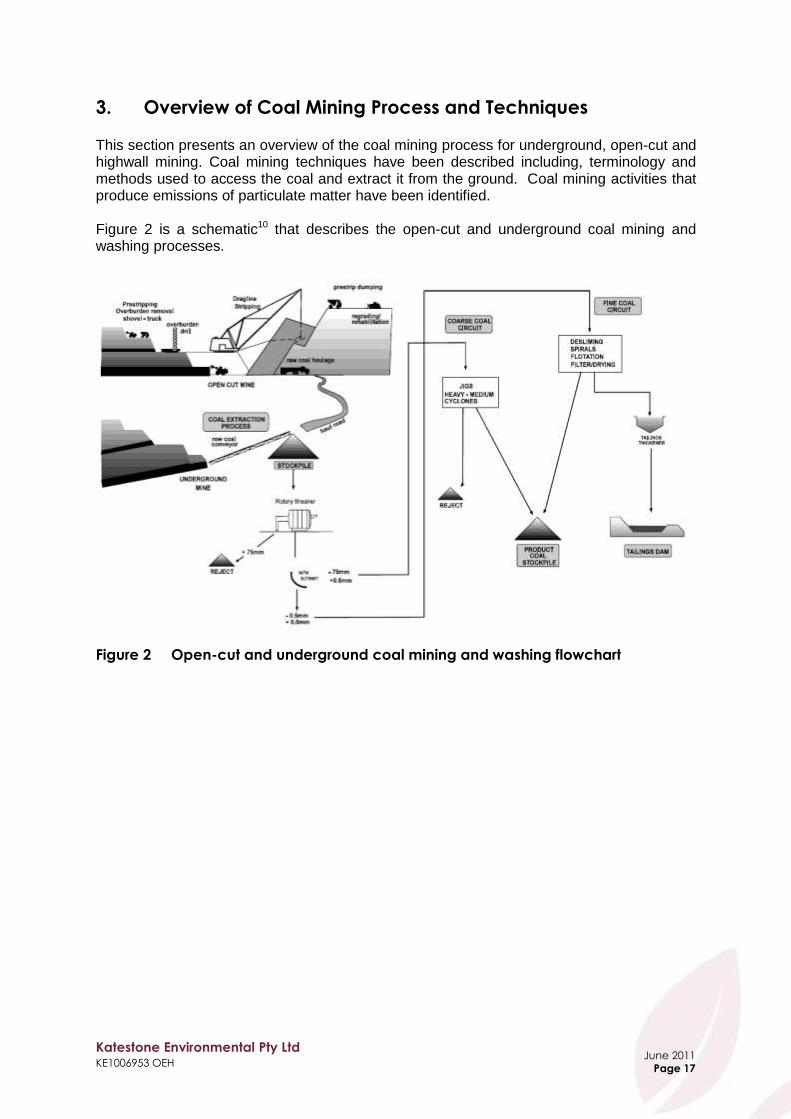
Katestone Environmental Pty Ltd KE1006953 OEH
June 2011
Page 17
3. Overview of Coal Mining Process and Techniques
This section presents an overview of the coal mining process for underground, open-cut and highwall mining. Coal mining techniques have been described including, terminology and methods used to access the coal and extract it from the ground. Coal mining activities that produce emissions of particulate matter have been identified. Figure 2 is a schematic10 that describes the open-cut and underground coal mining and washing processes.
Figure 2 Open-cut and underground coal mining and washing flowchart
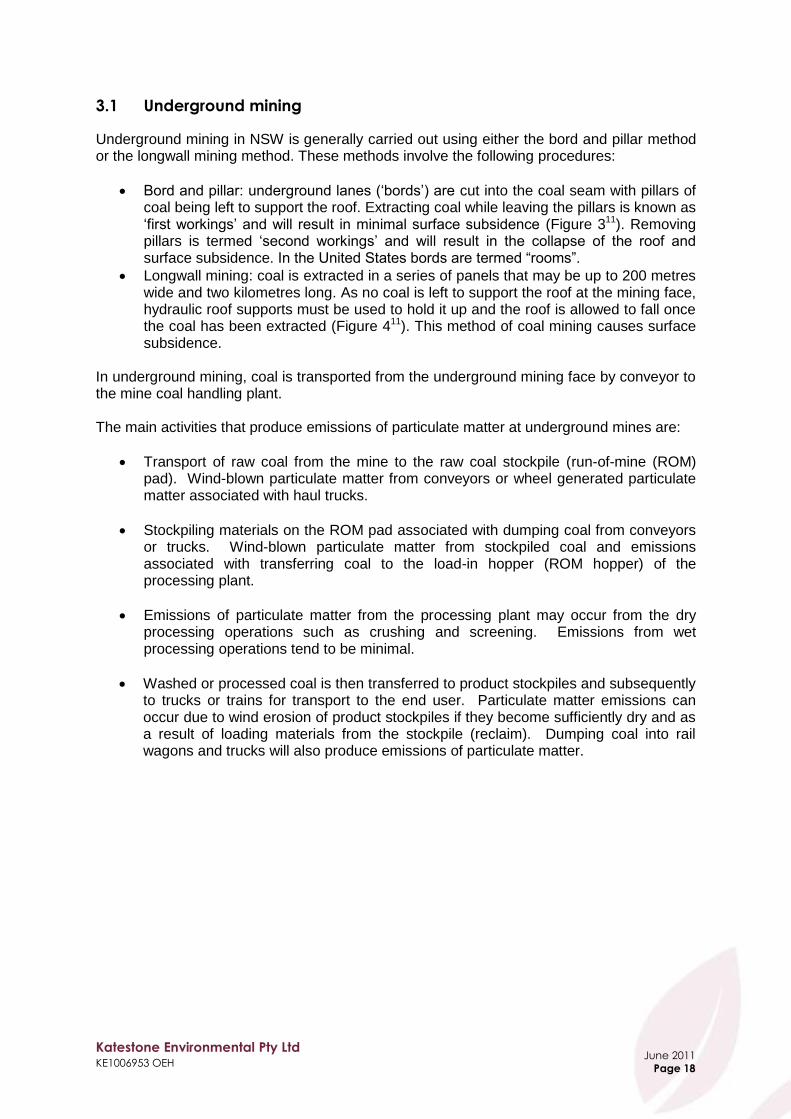
Katestone Environmental Pty Ltd KE1006953 OEH
June 2011
Page 18
3.1 Underground mining
Underground mining in NSW is generally carried out using either the bord and pillar method or the longwall mining method. These methods involve the following procedures:
Bord and pillar: underground lanes („bords‟) are cut into the coal seam with pillars of coal being left to support the roof. Extracting coal while leaving the pillars is known as „first workings‟ and will result in minimal surface subsidence (Figure 311). Removing pillars is termed „second workings‟ and will result in the collapse of the roof and surface subsidence. In the United States bords are termed “rooms”.
Longwall mining: coal is extracted in a series of panels that may be up to 200 metres wide and two kilometres long. As no coal is left to support the roof at the mining face, hydraulic roof supports must be used to hold it up and the roof is allowed to fall once the coal has been extracted (Figure 411). This method of coal mining causes surface subsidence.
In underground mining, coal is transported from the underground mining face by conveyor to the mine coal handling plant. The main activities that produce emissions of particulate matter at underground mines are:
Transport of raw coal from the mine to the raw coal stockpile (run-of-mine (ROM) pad). Wind-blown particulate matter from conveyors or wheel generated particulate matter associated with haul trucks.
Stockpiling materials on the ROM pad associated with dumping coal from conveyors or trucks. Wind-blown particulate matter from stockpiled coal and emissions associated with transferring coal to the load-in hopper (ROM hopper) of the processing plant.
Emissions of particulate matter from the processing plant may occur from the dry processing operations such as crushing and screening. Emissions from wet processing operations tend to be minimal.
Washed or processed coal is then transferred to product stockpiles and subsequently to trucks or trains for transport to the end user. Particulate matter emissions can occur due to wind erosion of product stockpiles if they become sufficiently dry and as a result of loading materials from the stockpile (reclaim). Dumping coal into rail wagons and trucks will also produce emissions of particulate matter.

Katestone Environmental Pty Ltd KE1006953 OEH
June 2011
Page 19
Figure 3 Underground mining using the bord (or room) and pillar mining technique
Figure 4 Underground mining using the longwall technique
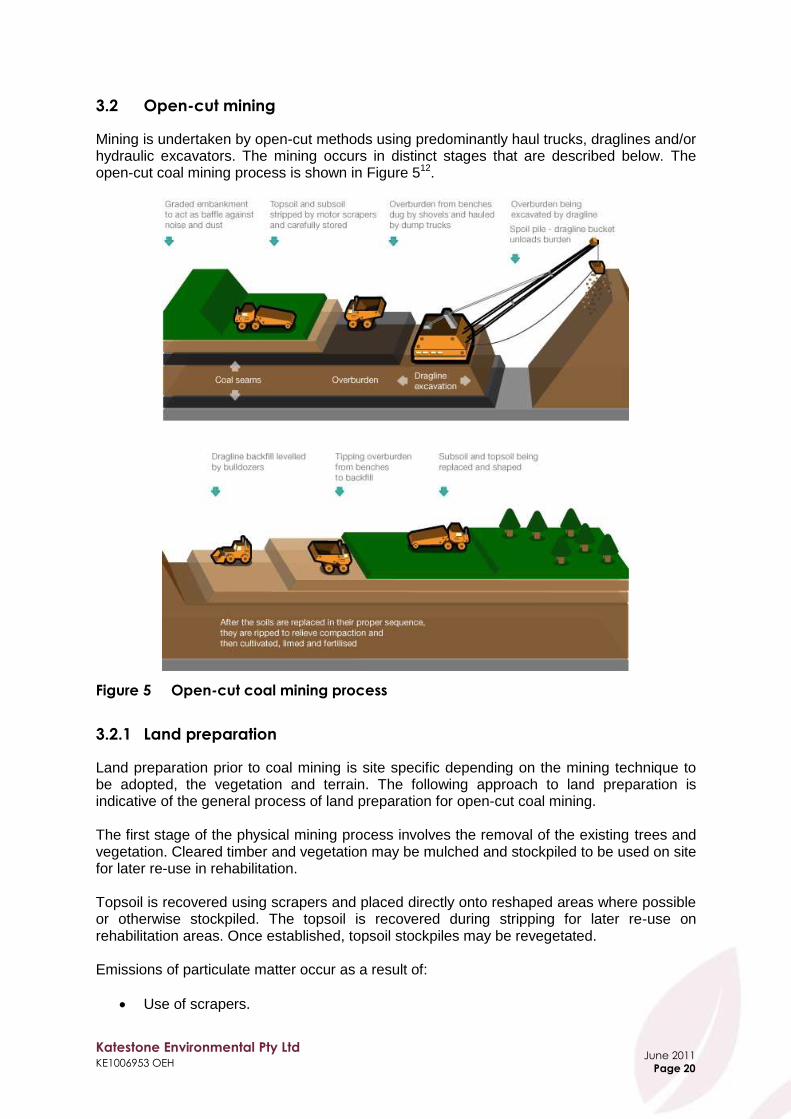
Katestone Environmental Pty Ltd KE1006953 OEH
June 2011
Page 20
3.2 Open-cut mining
Mining is undertaken by open-cut methods using predominantly haul trucks, draglines and/or hydraulic excavators. The mining occurs in distinct stages that are described below. The open-cut coal mining process is shown in Figure 512.
Figure 5 Open-cut coal mining process
3.2.1 Land preparation
Land preparation prior to coal mining is site specific depending on the mining technique to be adopted, the vegetation and terrain. The following approach to land preparation is indicative of the general process of land preparation for open-cut coal mining. The first stage of the physical mining process involves the removal of the existing trees and vegetation. Cleared timber and vegetation may be mulched and stockpiled to be used on site for later re-use in rehabilitation. Topsoil is recovered using scrapers and placed directly onto reshaped areas where possible or otherwise stockpiled. The topsoil is recovered during stripping for later re-use on rehabilitation areas. Once established, topsoil stockpiles may be revegetated. Emissions of particulate matter occur as a result of:
Use of scrapers.
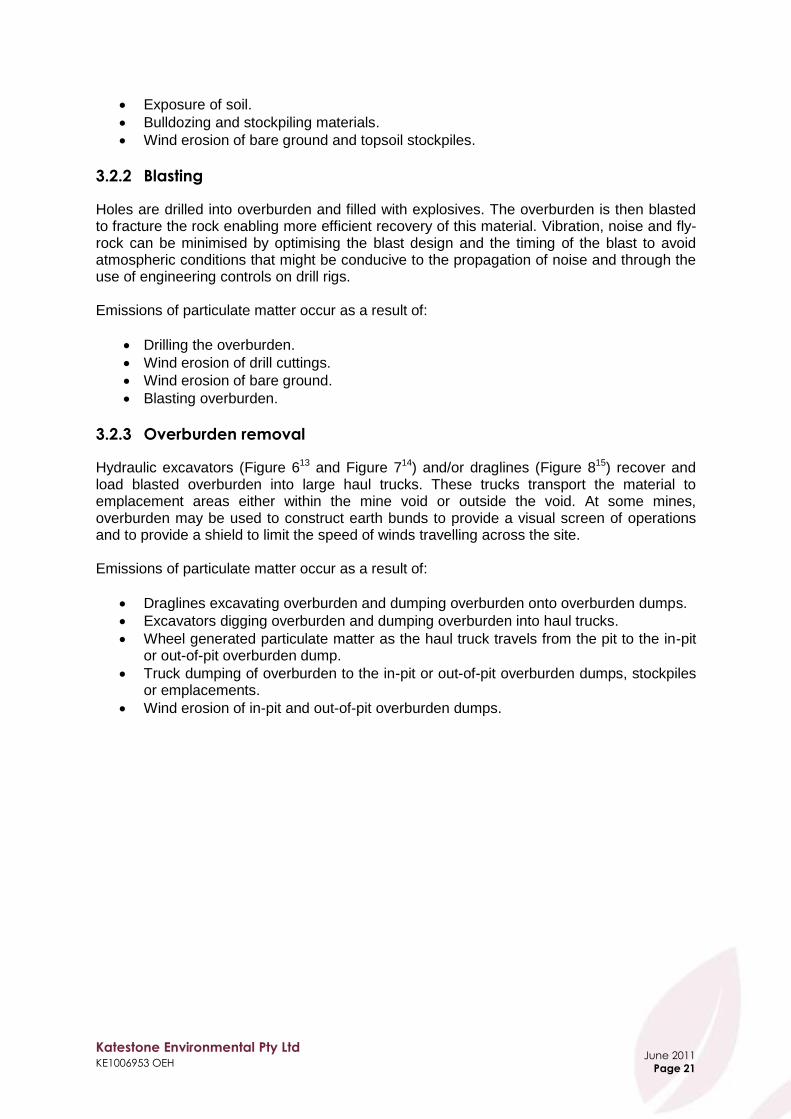
Katestone Environmental Pty Ltd KE1006953 OEH
June 2011
Page 21
Exposure of soil.
Bulldozing and stockpiling materials.
Wind erosion of bare ground and topsoil stockpiles.
3.2.2 Blasting
Holes are drilled into overburden and filled with explosives. The overburden is then blasted to fracture the rock enabling more efficient recovery of this material. Vibration, noise and fly-rock can be minimised by optimising the blast design and the timing of the blast to avoid atmospheric conditions that might be conducive to the propagation of noise and through the use of engineering controls on drill rigs. Emissions of particulate matter occur as a result of:
Drilling the overburden.
Wind erosion of drill cuttings.
Wind erosion of bare ground.
Blasting overburden.
3.2.3 Overburden removal
Hydraulic excavators (Figure 613 and Figure 714) and/or draglines (Figure 815) recover and load blasted overburden into large haul trucks. These trucks transport the material to emplacement areas either within the mine void or outside the void. At some mines, overburden may be used to construct earth bunds to provide a visual screen of operations and to provide a shield to limit the speed of winds travelling across the site. Emissions of particulate matter occur as a result of:
Draglines excavating overburden and dumping overburden onto overburden dumps.
Excavators digging overburden and dumping overburden into haul trucks.
Wheel generated particulate matter as the haul truck travels from the pit to the in-pit or out-of-pit overburden dump.
Truck dumping of overburden to the in-pit or out-of-pit overburden dumps, stockpiles or emplacements.
Wind erosion of in-pit and out-of-pit overburden dumps.

Katestone Environmental Pty Ltd KE1006953 OEH
June 2011
Page 22
Figure 6 Large excavator loading haul truck
Figure 7 Hydraulic shovel loading haul truck

Katestone Environmental Pty Ltd KE1006953 OEH
June 2011
Page 23
Figure 8 Dragline
3.2.4 Coal recovery
After removing the overburden, coal seams are mined using hydraulic excavators and loaders with the assistance of dozers. Haul trucks then transport the coal to the processing plant. Emissions of particulate matter occur as a result of:
Excavators digging coal and dumping coal into haul trucks.
Wheel generated particulate matter as the haul truck travels from the pit to the processing plant.
Truck dumping coal onto the raw coal pad (ROM pad).
Bulldozers forming the coal into a stockpile.
Truck or loader dumping coal into the raw coal hopper (ROM hopper).
Wind erosion of ROM stockpile.
3.2.5 Coal processing and transport off-site
After crushing to size and processing (washing) to remove impurities, coal is stockpiled prior to removal from site. Coal is then either loaded onto rail wagons or road trucks for transport to the port for export or to the end user.

Katestone Environmental Pty Ltd KE1006953 OEH
June 2011
Page 24
Emissions of particulate matter occur as a result of:
Coal crushing and screening.
Transferring coal from the processing plant to the product stockyard by conveyor.
Stockpiling product coal using fixed or variable height stackers.
Wind erosion of product stockpile.
Unloading coal from the product stockpile (reclaiming).
Transferring coal from the reclaimer to the truck or rail loading facility.
Dumping coal into rail wagons or trucks.
Transfer and disposal of coal rejects.
3.2.6 Mined land rehabilitation
As overburden emplacement areas reach final design elevations, dozers are used to shape the land to be consistent with the surrounding environment. These reshaped areas are then re-topsoiled, ripped and sown with a mix of pasture grasses and native trees. Emissions of particulate matter occur as a result of:
Earthworks associated with reshaping the land by bulldozer.
Spreading topsoil.
Wind erosion of bare ground prior to the establishment of vegetation.
3.3 Highwall mining
Highwall mining is conducted using remote controlled mining machines that are driven into a coal seam to extract the coal. Highwall mining can be used to access coal left behind from previous mining operations or where difficult geological conditions restrict the use of other mining methods. In highwall mining, coal is extracted from the base of a cliff (a highwall) using horizontal drilling to create holes in the coal seam. Pillars are left between areas of coal extraction to support the roof from collapsing. Highwall mining is a relatively new mining method that was introduced to Australia in the 1990s16. There are two main types of highwall mining: continuous highwall mining and auger mining (Figure 9). The potential for emissions of particulate matter from highwall mining will depend on the circumstances where highwall mining is used. However, in general, highwall mining would have equivalent emission sources to an underground mine, but with the addition of emissions associated with the creation of the highwall and wind erosion of exposed areas of overburden.
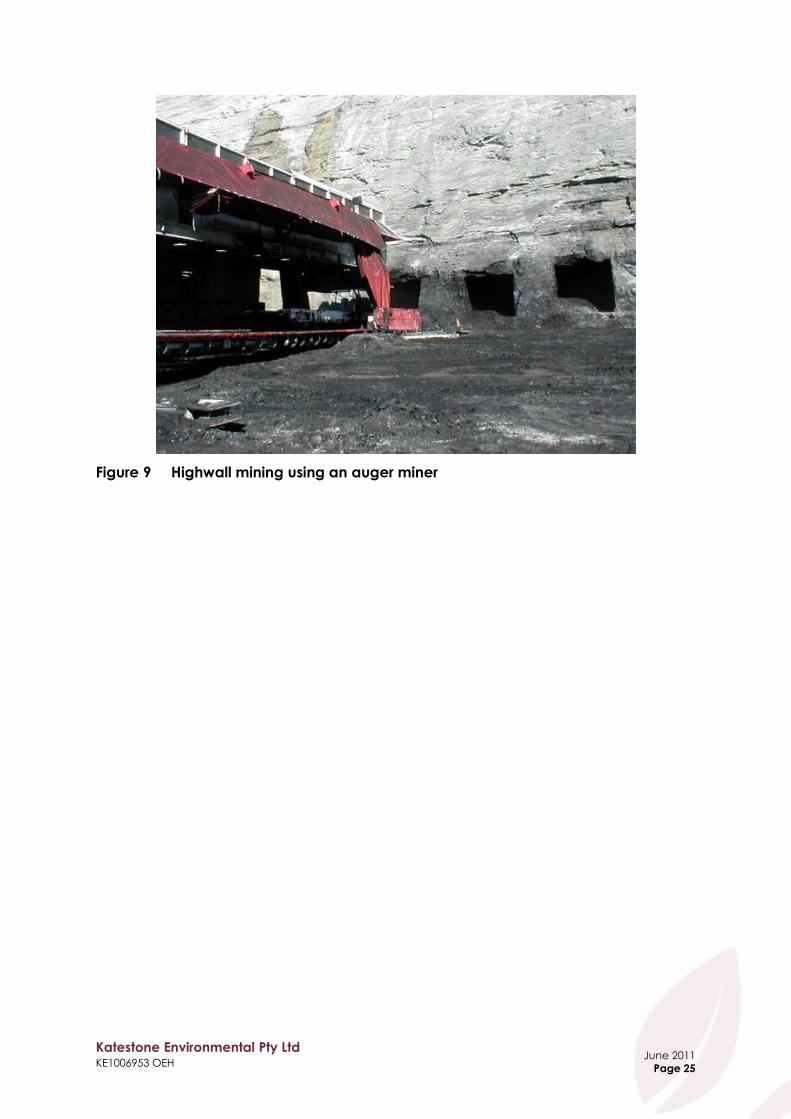
Katestone Environmental Pty Ltd KE1006953 OEH
June 2011
Page 25
Figure 9 Highwall mining using an auger miner

Katestone Environmental Pty Ltd KE1006953 OEH
June 2011
Page 26
4. Air Quality Impacts in Mining Areas
In this section, various measures are considered such as complaints, ambient particulate measurements and non-compliance with environment protection licence conditions to provide a picture of the current issues associated with coal mining in the GMR. The Camberwell Cumulative Impacts Review was also considered in this section to provide insight into the issues that exist in some mining communities and the sense that work needs to be done in various areas to improve the planning, assessment and regulation of coal mining activities to ensure that there is an ongoing minimisation of potential impacts.
4.1 Ambient concentrations of PM10 in the Hunter Valley
In the Hunter Valley area, ambient monitoring of PM10 is conducted across a network of 60 sites. There are 45 high volume air samplers (HVAS) and 25 continuous monitors (Tapered Element Oscillating Microbalances or TEOMs). Sampling of PM10 is conducted once every six days, daily and/or hourly depending on the method used. Monitoring at these sites is conducted as a condition of development approval to indicate levels that occur close to the mines and residences. In 2010, OEH prepared a document titled Compendium of Upper Hunter Ambient Air Quality Monitoring Data. The compendium included the monitoring data collected by coal mining companies in the Hunter Valley17. The compendium presents ambient monitoring data for PM10 using the National Environment Protection (Ambient Air Quality) Measure18 (Ambient Air Quality NEPM) standards. Ambient data for PM2.5 sourced from the Australian Nuclear Science and Technology Organisation monitoring site at Muswellbrook is also presented, using the Ambient Air Quality NEPM advisory reporting standards for PM2.5 as a benchmark19. The data that formed the basis of OEH‟s review has been considered in the following section. The monitoring data collected within close proximity to the towns of Singleton and Muswellbrook has been considered specifically. Tables are provided below that summarise the maximum and 95th percentile, 24-hour average and annual average ground-level concentrations of PM10. Also included in the tables is the number of days when the 24-hour average concentration of PM10 has exceeded the Ambient Air Quality NEPM standard of 50 µg/m³. Years that have more than 5 days with 24-hour average concentrations above 50 µg/m³ have been shaded red. The data shows:
In 2009 the maximum 24-hour average concentrations recorded are significantly higher than for other years. This is partly, though not entirely due to dust storm events that occurred on the 23 and 26 September 200920.
The annual average concentrations of PM10 at Muswellbrook are typically between 20 and 25 µg/m3 (HVAS data) and 15 to 20 µg/m³ (TEOM data).
The annual average concentrations of PM10 at Singleton are typically between 15 and 30 µg/m3 (HVAS data). The low data capture rate at some sites makes it difficult to calculate an accurate annual average concentration.
The 24-hour average, 95th percentile PM10 concentrations at Muswellbrook are typically between 25 and 40 µg/m3 (TEOM data), except for 2009 when levels reach above 50 µg/m3.

Katestone Environmental Pty Ltd KE1006953 OEH
June 2011
Page 27
The maximum 24-hour average PM10 concentrations at Muswellbrook have ranged between 40 and 120 µg/m3, excluding data from 2009.
At all monitoring stations at Muswellbrook for the year 2009, the 24-hour average concentrations of PM10 have exceeded 50 µg/m3 on more than 5 days per year, ranging between 6 to 30 days. Excluding the days related to the dust storm event, the number of days that exceedances occurred during 2009 are generally greater than for other years. For 2005 to 2008, the number of days exceeding 50 µg/m3 is lower than 5.
The 24-hour average, 95th percentile PM10 concentrations at Singleton are typically between 37 and 48 µg/m3 (TEOM data) in years where the data recovery is greater than 80%.
The maximum 24-hour average PM10 concentrations at Singleton have ranged between 40 and 100 µg/m3.
At Singleton, the number of days per year that the 24-hour average concentration of 50 µg/m3 is exceeded has increased since 2005, ranging from 0 to 12 days.
Box and whisker plots of the 24-hour average concentrations of PM10 measured at the four TEOM sites at Muswellbrook and Singleton are presented in Figure 11, Figure 12, Figure 13 and Figure 14. Measurements during the dust storm event in 2009 have been removed from these data. Figure 1 shows the locations of ambient monitoring stations included in OEH‟s compendium.

Katestone Environmental Pty Ltd KE1006953 OEH
June 2011
Page 28
Figure 10 Locations of ambient air quality monitoring stations from OEH Compendium of Upper Hunter Ambient Air Quality
Monitoring Data

Katestone Environmental Pty Ltd KE1006953 OEH
June 2011
Page 29
Table 2 Summary of 24-hour and annual average concentrations of PM10 at Muswellbrook
Site name/location Organisation Method1 Duration Year
Data capture
(%)
Maximum 24-hour
(µg/m3)
95th
Percentile, 24-hour (µg/m
3)2
Annual average (µg/m
3)
4Number of
days >50 µg/m³
Site 2 Racecourse Rd
Bengalla Mining Company
AM-18 HVAS
one in six day
03/01/2005 to
26/12/2009
2005 100 53.3 - 23.3 1
2006 100 44.8 - 23.7 0
2007 100 78.1 - 26.5 6
2008 90 83.6 - 24.8 2
20093 99 123.0 - 31.5 9
Site 4 St James School
Bengalla Mining Company
AM-18 HVAS
one in six day
03/01/2005 to
26/12/2009
2005 100 52.2 - 20.2 1
2006 100 41.8 - 22.3 0
2007 100 55.0 - 23.3 3
2008 90 62.4 - 21.9 1
20093 99 125.0 - 30.5 6
Site 31 Sheppard Avenue
Hunter Valley Energy Coal Pty
Ltd
AM-18 HVAS
one in six day
03/01/2005 to
26/12/2009
2005 100 47.4 - 21.8 0
2006 100 95.7 - 27.9 7
2007 99 97.2 - 27.8 6
2008 100 78.9 - 21.0 2
20093 99 192.0 - 29.8 7
Site 31 Sheppard Avenue
Hunter Valley Energy Coal Pty
Ltd
AM-22 TEOM daily
1/01/2009 to 31/12/2009
20093 97 2090.7 59.3 32.4 30
Site 32 South Muswellbrook
Hunter Valley Energy Coal Pty
Ltd
AM-18 HVAS
one in six day
03/01/2005 to
26/12/2009
2005 99 60.9 - 22.4 3
2006 100 66.2 - 22.3 1
2007 99 64.6 - 23.1 1
2008 100 84.3 - 20.7 1
20093 95 71.0 - 27.9 8
Site 32 South Muswellbrook
Hunter Valley Energy Coal Pty
Ltd
AM-22 TEOM daily
1/01/2009 to 31/12/2009
20093 94 1959.8 55.1 31.0 21

Katestone Environmental Pty Ltd KE1006953 OEH
June 2011
Page 30
Site name/location Organisation Method1 Duration Year
Data capture
(%)
Maximum 24-hour
(µg/m3)
95th
Percentile, 24-hour (µg/m
3)2
Annual average (µg/m
3)
4Number of
days >50 µg/m³
Site 34 Yammanie
Hunter Valley Energy Coal Pty
Ltd
AM-22 TEOM daily
1/01/2009 to 31/12/2009
20093 100 1924.0 53.9 30.8 21
Site 44 Site 1 - MCC
Muswellbrook Coal Company
Ltd
AM-22 TEOM daily
08/03/2005 to
31/12/2009
2005 80 45.5 26.1 13.4 0
2006 96 56.2 30.9 17.3 2
2007 98 84.7 35.8 17.2 7
2008 94 120.5 29.3 14.6 2
20093 95 1960.0 46.1 25.2 15
Site 45 Site 2 - MCC
Muswellbrook Coal Company
Ltd
AM-22 TEOM daily
08/03/2005 to
31/12/2009
2005 80 46.2 30.4 16.3 0
2006 90 71.6 40.2 21.0 5
2007 97 73.8 43.5 20.5 14
2008 90 66.2 28.4 15.6 2
20093 92 1994.0 47.2 29.2 16
Site 46 Site 3 - MCC
Muswellbrook Coal Company
Ltd
AM-22 TEOM daily
08/03/2005 to
31/12/2009
2005 80 44.2 28.5 15.9 0
2006 95 75.6 37.8 19.8 4
2007 94 56.2 39.1 18.1 4
2008 91 124.7 33.7 15.7 3
20093 89 1942.0 60.1 31.8 29
Note: 1 Monitoring methods are defined in the Approved Methods for Sampling
21. AM-18 is the Australian Standard for monitoring PM10 with a HVAS. AM-22 is the Australian
Standard for monitoring PM10 with a TEOM. 2
24-hour, 95th
percentile concentrations were calculated for TEOM data only due to insufficient data for HVAS. 3 Results include measurements recorded during dust storm events that occurred on 23 September and 26 September 2009.
4 Since HVAS monitoring for PM10 is conducted on one day in six, the actual number of exceedances of the PM10 criterion is likely to be higher than reported. The
proportion of exceedances is likely to be correct. So the number of exceedances can be inferred from HVAS results assuming the monitor were operated continuously. For example, one exceedance measured over a full year of one day in six monitoring would correspond to exceedances on 1.6% of days or six days per year. Hence one or more HVAS exceedances indicate the likelihood that there would be more than five exceedances of the PM10 criterion in a year.

Katestone Environmental Pty Ltd KE1006953 OEH
June 2011
Page 31
Table 3 Summary of 24-hour and annual average concentrations of PM10 at Singleton
Site name/location Organisation Method1 Duration Year
Data capture
(%)
Maximum 24-hour
(µg/m3)
95th
Percentile, 24-hour (µg/m
3)2
Annual average (µg/m
3)
4Number of
days >50 µg/m³
Site 9 HV1 - Bridgman
Road
Camberwell Coal Pty Ltd
AM-18 HVAS
one in six day
25/08/2005 to
26/12/2009
2005 36 49.0 - 22.9 0
2006 99 57.0 - 17.4 1
2007 100 72.0 - 19.9 4
2008 100 66.0 - 20.6 3
20093 99 60.0 - 21.7 4
Site 16 Long Point PM10
Coal & Allied Industries Ltd (Hunter Valley
Operations)
AM-18 HVAS
one in six day
29/06/2009 to
26/12/2009 2009
3 53 54.7 - 21.9 1
Site 17 Maison Dieu PM10
Coal & Allied Industries Ltd (Hunter Valley
Operations)
AM-18 HVAS
one in six day
NO DATA - - - - - -
Site 17 Maison Dieu PM10
Coal & Allied Industries Ltd (Hunter Valley
Operations)
AM-22 TEOM daily
16/10/2007 to
31/12/2009
2007 21 64.5 50.7 20.7 4
2008 96 78.0 37.3 18.2 8
20093 87 149.0 47.7 21 12
Site 54 Mines Rescue
Rix's Creek Pty Limited
AM-18 HVAS
one in six day
03/01/2005 to
26/12/2009
2005 99 42.0 - 10.5 0
2006 99 48.0 - 19.7 0
2007 94 58.0 - 15.4 1
2008 75 87.0 - 38 12
20093 39 81.0 - 27.1 3

Katestone Environmental Pty Ltd KE1006953 OEH
June 2011
Page 32
Site name/location Organisation Method1 Duration Year
Data capture
(%)
Maximum 24-hour
(µg/m3)
95th
Percentile, 24-hour (µg/m
3)2
Annual average (µg/m
3)
4Number of
days >50 µg/m³
Site 55 Retreat
Rix's Creek Pty Limited
AM-18 HVAS
one in six day
03/01/2005 to
26/12/2009
2005 97 83.0 - 25.3 7
2006 99 57.0 - 23.9 6
2007 97 89.0 - 26.1 7
2008 90 71.0 - 29.8 9
20093 76 69.0 - 25.7 4
Site 56 Rix's Creek
Rix's Creek Pty Limited
AM-18 HVAS
one in six day
03/01/2005 to
26/12/2009
2005 92 73.0 - 21.3 2
2006 85 58.0 - 22.4 4
2007 90 94.0 - 28.5 5
2008 93 94.0 - 28.5 8
20093 46 108.0 - 20.5 3
Note: 1 Monitoring methods are defined in the Approved Methods for Sampling
21. AM-18 is the Australian Standard for monitoring PM10 with a HVAS. AM-22 is the Australian
Standard for monitoring PM10 with a TEOM. 2 24-hour, 95
th percentile concentrations were calculated for TEOM data only due to insufficient data for HVAS.
3 Results include measurements recorded during dust storm events that occurred on 23 September and 26 September 2009.
4 Since HVAS monitoring for PM10 is conducted on one day in six, the actual number of exceedances of the PM10 criterion is likely to be higher than reported. The
proportion of exceedances is likely to be correct. So the number of exceedances can be inferred from HVAS results assuming the monitor were operated continuously. For example, one exceedance measured over a full year of one day in six monitoring would correspond to exceedances on 1.6% of days or six days per year. Hence one or more HVAS exceedances indicate the likelihood that there would be more than five exceedances of the PM10 criterion in a year.

Katestone Environmental Pty Ltd KE1006953 OEH
Jun e 2011
Page 33
Figure 11 Box and whisker plot of 24-hour average concentrations of PM10 recorded
at Muswellbrook from 2005-2009, Site 1 Muswellbrook Coal Company
Figure 12 Box and whisker plot of 24-hour average concentrations of PM10 recorded
at Muswellbrook from 2005-2009, Site 2 Muswellbrook Coal Company

Katestone Environmental Pty Ltd KE1006953 OEH
Jun e 2011
Page 34
Figure 13 Box and whisker plot of 24-hour average concentrations of PM10 recorded
at Muswellbrook from 2005-2009, Site 3 Muswellbrook Coal Company
Figure 14 Box and whisker plot of 24-hour average concentrations of PM10 recorded
at Singleton from 2007-2009, Maison Dieu Coal & Allied Industries Ltd

Katestone Environmental Pty Ltd KE1006953 OEH
Jun e 2011
Page 35
4.2 Air quality complaints in the GMR
OEH operates the Environment Line so that pollution incidents may be reported. The following information is recorded with each incident:
Caller name.
Suburb and Council area.
Date and location of the incident.
Description of the incident. Complaints about air quality issues associated with coal mining activities which are recorded by OEH‟s Environment Line were provided by OEH for the purpose of this study. The data was provided for each of OEH‟s Operations Regions where coal mining activities occur for the years 2007, 2008 and 2009. The complaints are summarised in Table 4. The validity of these complaints was not assessed. The total number of complaints is relatively steady from year to year ranging from 103 in 2007 to 120 in 2008. The majority of complaints (81-84 per year) came from OEH‟s North East Region that incorporates the Newcastle Coalfield and the Hunter Coalfield. The Metropolitan Region covers the Southern Coalfield and received the least number of complaints (6-11 per year). The Central West Region includes the Western Coalfield and received between 12 and 30 complaints per year.
Table 4 Number of complaints received by OEH's Environment Line in relation to
air quality issues associated with coal mines in the GMR, by OEH Region
from 2007 to 2009
OEH Region Number of complaints pertaining to air quality
2007 2008 2009 Total
North East 83 84 81 248
Metropolitan 8 6 11 25
Central West 12 30 16 58
Total 103 120 108 331
Table 5 shows the number of complaints by suburb or town as a total for the three years from 2007 to 2009. The greatest number of complaints (81 or 24.5%) was received from people living in Muswellbrook. A further 62 complaints were received from Camberwell and 54 from Singleton. The top three are all in the Hunter Coalfield and represent 60% of all complaints. A total of 11 (or 10%) of complaints were received from Wollar, east of the Wilpinjong and Ulan coal mines.
Table 5 Number of complaints received by OEH's Environment Line in relation to
air quality issues associated with coal mines in the GMR, by suburb or
town from 2007 to 2009
Suburb OEH Region Total complaints Proportion (%) Cumulative Proportion (%)
Muswellbrook North East 81 24.5 24.5
Camberwell North East 62 18.7 43.2
Singleton North East 54 16.3 59.5
Wollar Central West 33 10.0 69.5
Ravensworth North East 11 3.3 72.8
Mount Thorley North East 9 2.7 75.5
Russell Vale Metropolitan 7 2.1 77.6

Katestone Environmental Pty Ltd KE1006953 OEH
Jun e 2011
Page 36
Suburb OEH Region Total complaints Proportion (%) Cumulative Proportion (%)
Helensburgh Metropolitan 6 1.8 79.5
Jerrys Plains North East 6 1.8 81.3
Cullen Bullen Central West 5 1.5 82.8
Blackmans Flat Central West 4 1.2 84.0
Capertee Central West 4 1.2 85.2
Port Kembla Metropolitan 4 1.2 86.4
Charbon Central West 3 0.9 87.3
Fassifern North East 3 0.9 88.2
Warkworth North East 3 0.9 89.1
Broke North East 2 0.6 89.7
Dapto West Metropolitan 2 0.6 90.3
Lithgow Central West 2 0.6 90.9
Mudgee Central West 2 0.6 91.5
Stroud North East 2 0.6 92.1
Teralba North East 2 0.6 92.7
Wilpinjong Central West 2 0.6 93.4
Wybong North East 2 0.6 94.0
Bellambi Metropolitan 1 0.3 94.3
Boolaroo North East 1 0.3 94.6
Bulga North East 1 0.3 94.9
Cessnock North East 1 0.3 95.2
Clandulla Central West 1 0.3 95.5
Corrimal Metropolitan 1 0.3 95.8
Lidsdale Central West 1 0.3 96.1
Mount Vincent North East 1 0.3 96.4
Rix‟s Creek North East 1 0.3 96.7
Rothbury North North East 1 0.3 97.0
Rutherford North East 1 0.3 97.3
Singleton Heights North East 1 0.3 97.6
Stroud Road North East 1 0.3 97.9
Tahmoor Metropolitan 1 0.3 98.2
Thirroul Metropolitan 1 0.3 98.5
Toukley North East 1 0.3 98.8
Ulan Central West 1 0.3 99.1
Wards River North East 1 0.3 99.4
Wongawilli Metropolitan 1 0.3 99.7
Yallah Metropolitan 1 0.3 100.0
Grand Total 331 100.0
The reason for complaints is summarised in Table 6. Note that the proportions in Table 6 do not add to 100% because complainants commonly cite multiple reasons for the complaint. For example, the complainant may have identified dust or fume associated with blasting. Dust (85.8%) is the predominant reason cited for complaints. Approximately 17% of complainants identified blasting in the complaint. A further 16% of complainants mentioned that strong wind conditions were a factor in causing the incident.
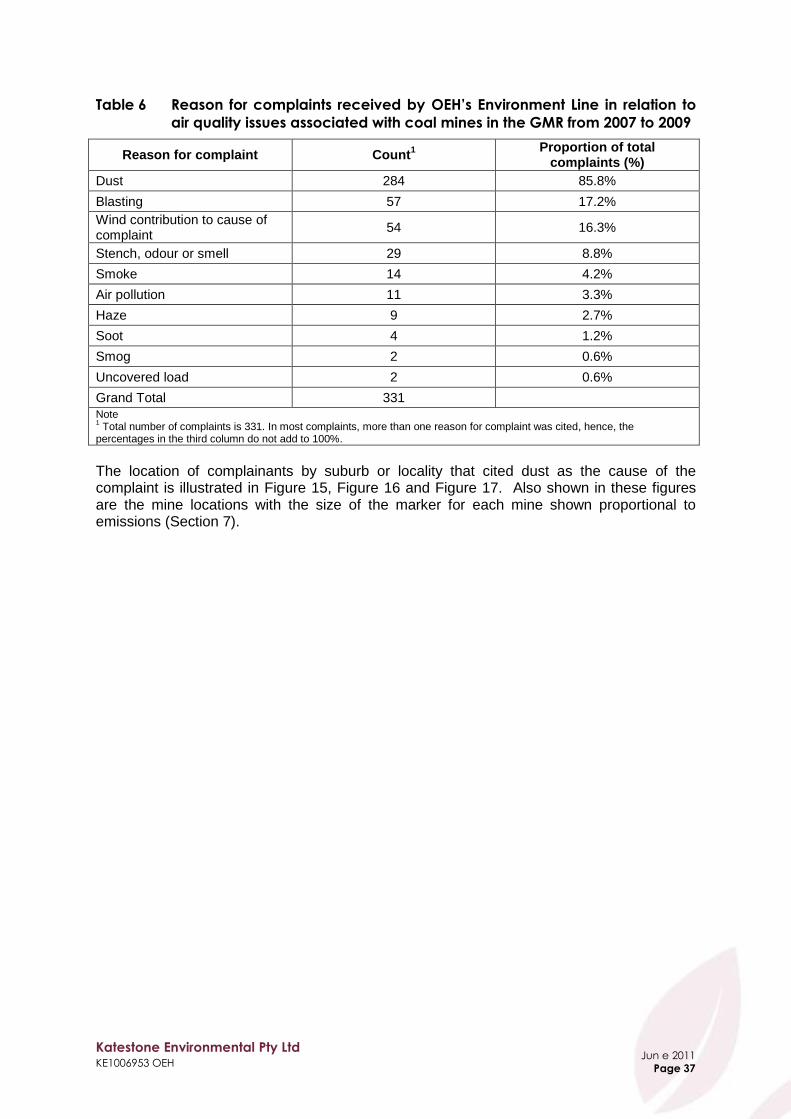
Katestone Environmental Pty Ltd KE1006953 OEH
Jun e 2011
Page 37
Table 6 Reason for complaints received by OEH’s Environment Line in relation to
air quality issues associated with coal mines in the GMR from 2007 to 2009
Reason for complaint Count1
Proportion of total complaints (%)
Dust 284 85.8%
Blasting 57 17.2%
Wind contribution to cause of complaint
54 16.3%
Stench, odour or smell 29 8.8%
Smoke 14 4.2%
Air pollution 11 3.3%
Haze 9 2.7%
Soot 4 1.2%
Smog 2 0.6%
Uncovered load 2 0.6%
Grand Total 331
Note 1 Total number of complaints is 331. In most complaints, more than one reason for complaint was cited, hence, the
percentages in the third column do not add to 100%.
The location of complainants by suburb or locality that cited dust as the cause of the complaint is illustrated in Figure 15, Figure 16 and Figure 17. Also shown in these figures are the mine locations with the size of the marker for each mine shown proportional to emissions (Section 7).

Katestone Environmental Pty Ltd KE1006953 OEH
Jun e 2011
Page 38
Figure 15 Complaints about dust in the Newcastle and Hunter Coalfields by suburb
and relative coal mining emission rates of PM10, 2007-2009

Katestone Environmental Pty Ltd KE1006953 OEH
Jun e 2011
Page 39
Figure 16 Complaints about dust in the Southern Coalfield by suburb and relative
coal mining emission rates of PM10, 2007-2009

Katestone Environmental Pty Ltd KE1006953 OEH
Jun e 2011
Page 40
Figure 17 Complaints about dust in the Western Coalfield by suburb and relative
coal mining emission rates of PM10, 2007-2009
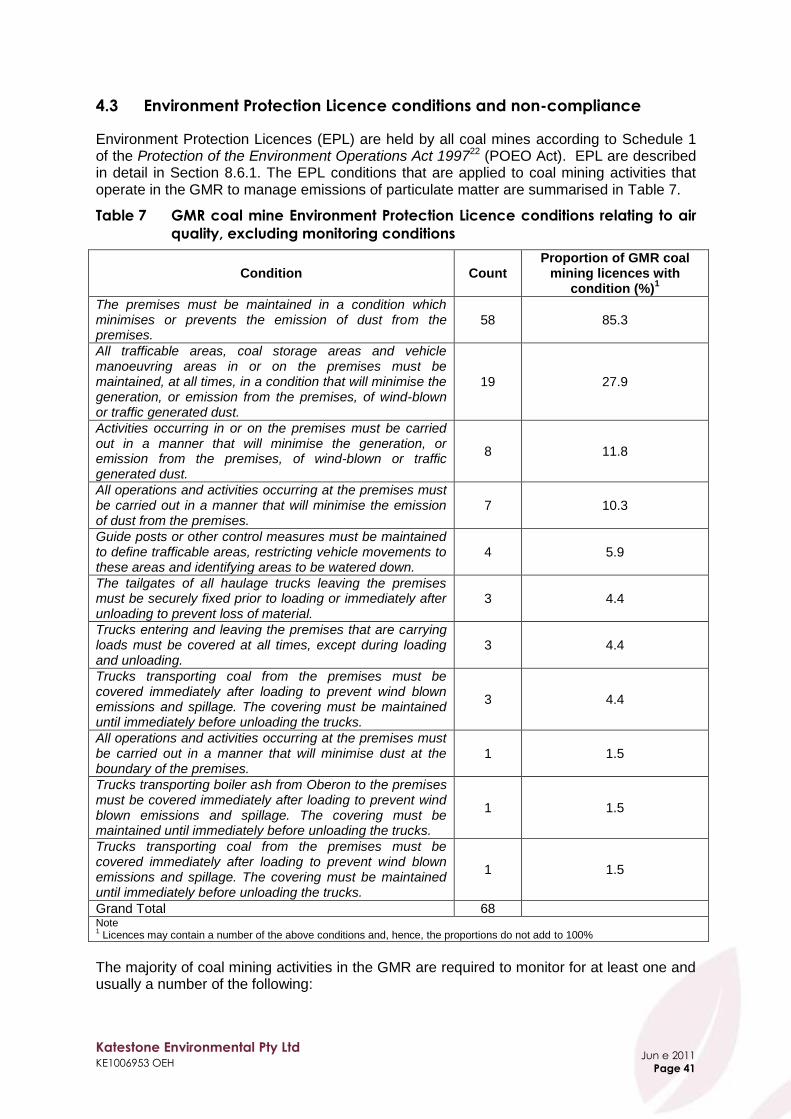
Katestone Environmental Pty Ltd KE1006953 OEH
Jun e 2011
Page 41
4.3 Environment Protection Licence conditions and non-compliance
Environment Protection Licences (EPL) are held by all coal mines according to Schedule 1 of the Protection of the Environment Operations Act 199722 (POEO Act). EPL are described in detail in Section 8.6.1. The EPL conditions that are applied to coal mining activities that operate in the GMR to manage emissions of particulate matter are summarised in Table 7.
Table 7 GMR coal mine Environment Protection Licence conditions relating to air
quality, excluding monitoring conditions
Condition Count Proportion of GMR coal
mining licences with condition (%)
1
The premises must be maintained in a condition which minimises or prevents the emission of dust from the premises.
58 85.3
All trafficable areas, coal storage areas and vehicle manoeuvring areas in or on the premises must be maintained, at all times, in a condition that will minimise the generation, or emission from the premises, of wind-blown or traffic generated dust.
19 27.9
Activities occurring in or on the premises must be carried out in a manner that will minimise the generation, or emission from the premises, of wind-blown or traffic generated dust.
8 11.8
All operations and activities occurring at the premises must be carried out in a manner that will minimise the emission of dust from the premises.
7 10.3
Guide posts or other control measures must be maintained to define trafficable areas, restricting vehicle movements to these areas and identifying areas to be watered down.
4 5.9
The tailgates of all haulage trucks leaving the premises must be securely fixed prior to loading or immediately after unloading to prevent loss of material.
3 4.4
Trucks entering and leaving the premises that are carrying loads must be covered at all times, except during loading and unloading.
3 4.4
Trucks transporting coal from the premises must be covered immediately after loading to prevent wind blown emissions and spillage. The covering must be maintained until immediately before unloading the trucks.
3 4.4
All operations and activities occurring at the premises must be carried out in a manner that will minimise dust at the boundary of the premises.
1 1.5
Trucks transporting boiler ash from Oberon to the premises must be covered immediately after loading to prevent wind blown emissions and spillage. The covering must be maintained until immediately before unloading the trucks.
1 1.5
Trucks transporting coal from the premises must be covered immediately after loading to prevent wind blown emissions and spillage. The covering must be maintained until immediately before unloading the trucks.
1 1.5
Grand Total 68 Note 1 Licences may contain a number of the above conditions and, hence, the proportions do not add to 100%
The majority of coal mining activities in the GMR are required to monitor for at least one and usually a number of the following:
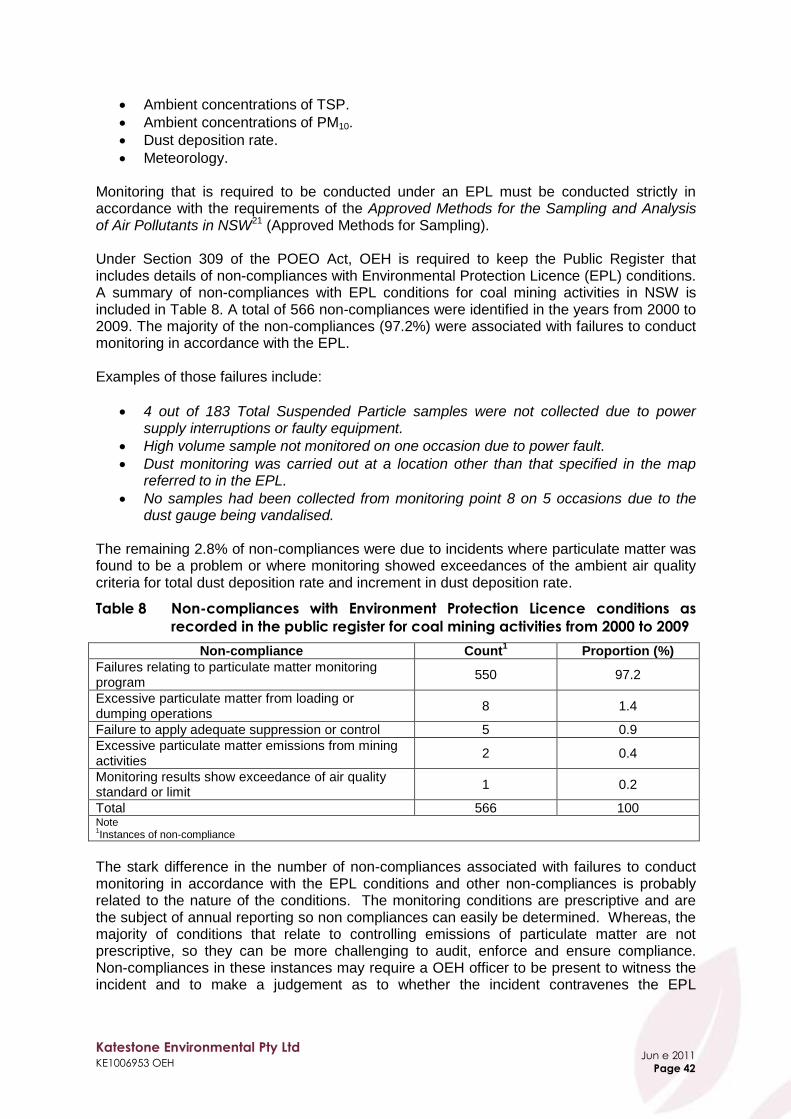
Katestone Environmental Pty Ltd KE1006953 OEH
Jun e 2011
Page 42
Ambient concentrations of TSP.
Ambient concentrations of PM10.
Dust deposition rate.
Meteorology. Monitoring that is required to be conducted under an EPL must be conducted strictly in accordance with the requirements of the Approved Methods for the Sampling and Analysis of Air Pollutants in NSW21 (Approved Methods for Sampling). Under Section 309 of the POEO Act, OEH is required to keep the Public Register that includes details of non-compliances with Environmental Protection Licence (EPL) conditions. A summary of non-compliances with EPL conditions for coal mining activities in NSW is included in Table 8. A total of 566 non-compliances were identified in the years from 2000 to 2009. The majority of the non-compliances (97.2%) were associated with failures to conduct monitoring in accordance with the EPL. Examples of those failures include:
4 out of 183 Total Suspended Particle samples were not collected due to power supply interruptions or faulty equipment.
High volume sample not monitored on one occasion due to power fault.
Dust monitoring was carried out at a location other than that specified in the map referred to in the EPL.
No samples had been collected from monitoring point 8 on 5 occasions due to the dust gauge being vandalised.
The remaining 2.8% of non-compliances were due to incidents where particulate matter was found to be a problem or where monitoring showed exceedances of the ambient air quality criteria for total dust deposition rate and increment in dust deposition rate.
Table 8 Non-compliances with Environment Protection Licence conditions as
recorded in the public register for coal mining activities from 2000 to 2009
Non-compliance Count1 Proportion (%)
Failures relating to particulate matter monitoring program
550 97.2
Excessive particulate matter from loading or dumping operations
8 1.4
Failure to apply adequate suppression or control 5 0.9
Excessive particulate matter emissions from mining activities
2 0.4
Monitoring results show exceedance of air quality standard or limit
1 0.2
Total 566 100 Note 1Instances of non-compliance
The stark difference in the number of non-compliances associated with failures to conduct monitoring in accordance with the EPL conditions and other non-compliances is probably related to the nature of the conditions. The monitoring conditions are prescriptive and are the subject of annual reporting so non compliances can easily be determined. Whereas, the majority of conditions that relate to controlling emissions of particulate matter are not prescriptive, so they can be more challenging to audit, enforce and ensure compliance. Non-compliances in these instances may require a OEH officer to be present to witness the incident and to make a judgement as to whether the incident contravenes the EPL

Katestone Environmental Pty Ltd KE1006953 OEH
Jun e 2011
Page 43
conditions. Alternatively, a OEH officer could request an incident report and determine an appropriate course of action.
4.4 Camberwell Cumulative Impact Review
On 13 July 2010, the Department of Planning released the final Camberwell Cumulative Impacts Review consisting of:
Expert reports on air quality (particulate matter) (Environ 200923), noise (Wilkinson Murray 200924) and potential contamination of drinking water with lead (Centre for Mined Land Rehabilitation 200925).
An additional expert report on air quality requested from several mining companies seeking to expand their operations in the vicinity of Camberwell (PAE Holmes 201026).
A Department of Planning overview and response to the reports27. The studies were commissioned in early 2009 in response to public concern over the impact of the existing mining operations on Camberwell and the potential impacts from proposed expansions. In response to the studies, the NSW Government will implement the following initiatives27:
Employ two Department of Planning compliance officers, who will be based full-time in the Upper Hunter to monitor mines‟ compliance with conditions of consent.
Targeting Camberwell as a site for the establishment of an air monitoring station as part of the 14 stations proposed for the Upper Hunter Air Quality Monitoring Network. This will allow residents to access real time data on air quality in the region.
Requiring mines around Camberwell to employ best practice dust and noise control measures, expanding real-time monitoring and limiting mine operating practices to reduce emissions.
Ensuring residents are fully informed of potential health impacts of mining operations.
4.4.1 Cumulative Impacts of Particulate Matter – Environ
The expert report on the cumulative levels of particulate matter23 found the following in relation to existing air quality within Camberwell Village based on 2007-08 monitoring at residential sites:
Elevated peak daily PM10 concentrations, in excess of health-based ambient air quality limits occur within Camberwell Village. Maximum daily average PM10 concentrations sufficiently protective. Average annual PM10 concentrations are in the range of 18 μg/m³ to 26 μg/m³ (31% to 87% of the air quality criterion of 30 μg/m³).
The highest PM10 concentrations and greatest frequency of days on which concentrations are > 50 μg/m³ occurs within Camberwell Village West, with lower levels and exceedance frequencies at residences situated south of the New England highway.

Katestone Environmental Pty Ltd KE1006953 OEH
Jun e 2011
Page 44
Despite the lower PM10 concentrations measured to the south of the New England highway, PM10 concentrations measured across the greater Camberwell area are generally of a similar magnitude.
Concentrations of fine particulates in the less than 2.5 micron diameter size fraction (PM2.5) have been measured to exceed National Environment Protection Measure (NEPM) advisory goals. It is conjectured that such exceedances may be primarily due to combustion sources, notably bushfire events.
Based on an analysis of emissions inventory information and ambient air quality data it is concluded that suspended TSP and PM10 concentrations within Camberwell Village are routinely dominated by local coal mining emissions. Bushfires and dust storms are recognised as being significant but episodic (infrequent) contributors to peak fine particulate concentrations. The contribution of other sources, including local and remote combustion sources, are anticipated to be a more substantial contributor to fine and ultrafine particulate concentrations.
Elevated ambient PM10 concentrations frequently occur during periods of significant wind variations during which time pollutant recirculation and accumulation is likely to be occurring.
Distinguishing the contribution of individual mines to air pollutant episodes (in cases where no significant mine environmental incident was logged) is not possible even with detailed analysis of coincident air quality and meteorological data from several stations.
Diurnal trends in PM10 concentrations within Camberwell Village are a function of temporal trends in emissions and the prevailing meteorology. The distinct increase in PM10 concentrations in the Camberwell area at 7 am is noted to coincide with the initiation of Ashton Coal Operation Ltd (ACOL)‟s open cut mining operations, and occurs ahead of the onset of the higher daytime winds. Daytime wind and mining emissions, including emissions from ACOL and other nearby mines which operate continuously (and potentially increase the intensity of their activities during the daytime), are anticipated to be responsible for the elevated day-time PM10 concentrations.
No significant inter-annual trends in PM10 concentrations were observed based on the available data. This observation is however subject to uncertainty due to the unavailability of a long-term PM10 monitoring data set comprising continuous measurements at a single location.
The highest PM10 concentrations and greatest number of peak 24-hour PM10 concentrations occur during the September to November period (peaking in October). This period is characterised by more variable wind (prevalence of both west to northwest and southeast to south-southeast flow components) and is likely to be associated with greater air pollutant recirculation and accumulation potentials. Bushfire incidence data could not be obtained to assess the contributions of such natural events to PM10 concentrations at this time of year.
Annual dust deposition rates within Camberwell Village were generally found to be within the DECCW criterion of 4 g/m²/month given for cumulative dust deposition. Although this criterion was exceeded within Camberwell Village west during 2007, dust deposition rates during 2008 were below this limit. Notwithstanding these data,
Katestone Environmental Pty Ltd KE1006953 OEH
Jun e 2011
Page 45
soiling of surfaces and dust build up in gutters was evident during the visual inspection of premises within Camberwell Village.
Given the controlling influence of local coal mining emissions on suspended particulate concentrations, changes in mining activities were taken to be indicative of potential changes in future air quality within Camberwell. Particulate emissions are anticipated to be of a similar magnitude to those currently experienced until at least 2015 (with emissions being higher than 2009 emissions during certain coming years). Additionally, there is a scheduled progression of mining towards Camberwell Village over the next five years. It is therefore anticipated that without additional dust management measures, PM10 concentrations within Camberwell are likely to increase in the next five years.
The Environ report adopted the European Best Available Technique (BAT) definition of Best Practice, namely, a level of performance towards the upper range of what is economically and technically achievable within an industry sector and considers local factors. Best practice does not necessarily represent “the very best” or “world‟s best practice”. The following conclusions were reached in relation to best practice measures to control particulate matter emissions:
There are many activities identified by surrounding mining operations that may be considered to be best practice dust controls, however not all practices are consistent across facilities.
While best practice techniques are identified, findings within Section 3 indicate that there is need for further improvement in operational dust management to ensure that human health is protected at Camberwell within coming years.
Best practice should incorporate the most appropriate techniques at a facility level. Techniques may be rationalised and cost-optimised through site-specific investigations, with source prioritisation based on the contribution of sources to suspended fine particulate concentrations at nearby receptors.
Key areas where dust management may be augmented, in line with best practice, include investigation into the selective use of chemical dust suppressants, the optimisation of reactive monitoring techniques, and the use of predictive forecasting to inform dust management.
For dust management to be effective in practice, it requires to be institutionalised, with dust management responsibilities being set for all levels of personnel, incorporating dust management within Standard Operating Procedures, and routine inspection, corrective action, audit and review to ensure a process of continual improvement.
Effective management of cumulative air quality impacts within Camberwell Village will require a coordinated approach, with the cooperation of all surrounding mining operations, at all levels.
The Environ report also reached conclusions about the following elements of Airshed Management:
Katestone Environmental Pty Ltd KE1006953 OEH
Jun e 2011
Page 46
Ambient Air Quality Criteria: one set of criteria must be specified for assessing the status of ambient air quality within Camberwell Village. These criteria should be used to assess cumulative air pollutant concentrations, whether measured or predicted, and be referenced by all government agencies.
Responsibility for Managing Air Quality within Criteria: Integrated air quality monitoring and management with active participation by regulatory authorities should be implemented with the effectiveness of such coordinated management gauged based on compliance with air quality criteria.
Air Quality Monitoring: consolidation (and rationalisation) of the current air quality monitoring sites within Camberwell Village and the surrounds, as part of a coordinated management approach.
Area-wide Emissions Inventory and Air Dispersion Modelling: development of a validated emissions and dispersion model for scenario modelling and evaluation of new projects.
Optimisation of Abatement.
Cumulative Assessments for Proposed Developments.
Integrated Consultative Committee for the Camberwell area, comprising representation of all adjacent mines in addition to regulatory authorities and residents, should be considered.
Regular compliance assessments should be undertaken to ensure that local mining operations consistently comply with all requirements. Such assessments should be undertaken by independent parties with expertise in air quality mitigation and should evaluate not only the existence of measures and systems but their effectiveness at maintaining air quality within agreed levels.
4.4.2 Lead in Drinking Water Report – Centre for Mined Land Rehabilitation
To determine the potential contribution from mining, the Centre for Mined Land Rehabilitation (CMLR) study25 analysed lead levels in:
Domestic rainwater tanks in Camberwell and on the outskirts of Muswellbrook.
Soils in these residential areas.
House dust samples from Camberwell.
TSP samples from Ashton and Integra HVAS.
Mined overburden, coal and topsoil at the three mines in the vicinity of Camberwell.
The study also included background samples taken from Branxton for comparison, which is some distance from mining activities.
The study found that:
Lead in all samples of tank water was below the health-based lead levels contained in the Australian Drinking Water Guidelines.
There was no transfer of lead from historical sludge, which is present in the base of some tanks.

Katestone Environmental Pty Ltd KE1006953 OEH
Jun e 2011
Page 47
The risk assessment indicated that there was no significant difference between tank water from houses close to coal mining operations and background water samples, including Newcastle town water.
The analysis of atmospheric particulates concluded that there was no significant transfer of lead from mine overburden material. Mine overburden contained lead at levels below the relevant NEPM soil criteria.
Samples of house dust from floor wipes, window sill and trough wipes at Camberwell and surrounding areas showed that lead levels were not significant in any house, with respect to human health risk, apart from two window tracks. The study indicated that there was no association with lead in window tracks and an external dust source and recommended routine window trough cleaning to minimise dust build up.
The study concluded that there was no demonstrated health risk from lead impacts from the coal mining operations studied. Lead levels within rainwater tanks, soils, house dust and atmospheric particulates were all below relevant criteria. The study concluded that it was unnecessary to proceed with further risk assessment.
4.5 Upper Hunter Air Quality Monitoring Network
The NSW Government has begun work to establish an ambient-air monitoring network in strategic locations around Upper Hunter mining areas and populated centres, including Muswellbrook and Singleton. The Upper Hunter Air Quality Monitoring Network28 (the Network) will continuously measure dust particulates in the air at up to 14 sites throughout the region. Air quality data from the Network will be accessible around the clock via an online website. Data collected by the Network may be used to identify the causes of changes in air quality and to help identify the major sources of the monitored pollutants. In addition, regional air-quality data from the Network will be compared with relevant national air-quality goals. Each station will use TEOM monitors to measure PM10. Three of the TEOM monitors will monitor PM2.5. Each station will also record wind direction and wind speed to provide an indication of the movement of dust throughout the Upper Hunter Region.

Katestone Environmental Pty Ltd KE1006953 OEH
Jun e 2011
Page 48
5. Identifying Major Coal Producers
This section provides a review of World coal production by country, region and economic groupings to focus the international literature review on countries and regions that are most likely to have invested heavily in research and development of controls and regulatory regimes for management of particulate matter from coal mining. Key coal mining countries have been identified and their status as OECD or emerging market economies has been documented. In some countries state or provincial governments take an important role in regulating coal mining activities. Hence, some attention is also given to coal production by state or province.
5.1 Coal production by country
The 2010 BP Statistical Review of World Energy29 reported that world coal production was more than 6.9 billion tonnes in 2009. Coal production occurs in many countries using a variety of surface and underground mining techniques. Open-cut mining accounts for around 80% of production in Australia, while in the USA about 67% of production comes from open-cut mining30. Table 9 and Figure 18 show the world‟s coal production by coal producing country29. The top ten countries produce almost 90% of the world‟s coal. China is the highest coal producer with 44% of total world production in 2009. The United States is the second largest coal producer contributing 14% whilst India and Australia contribute 8% and 6%, respectively. Germany and Poland are the eighth and ninth highest world producers. Of the top ten coal producing countries, four are members of the Organisation for Economic Co-operation and Development (OECD), namely, the United States, Australia, Germany and Poland. Figure 19 shows world coal production since 198129. The figure shows that China has been the world‟s largest coal producing country since 1985 when it overtook the United States.
Table 9 World coal production by country for 2009
Country Member of OECD and year joined
2009 Coal Production
(million tonnes per year)
Proportion of total (%)
Cumulative Proportion of
total (%)
China -- 3,050.0 44.0% 44.0%
US Member since 1961 973.2 14.0% 58.0%
India Non-member 557.6 8.0% 66.0%
Australia Member since 1971 409.2 5.9% 71.9%
Russian Federation Non-member 298.1 4.3% 76.2%
Indonesia Non-member 252.5 3.6% 79.8%
South Africa Non-member 250.0 3.6% 83.4%
Germany Member since 1961 183.7 2.6% 86.1%
Poland Member since 1996 135.1 1.9% 88.0%
Kazakhstan Non-member 101.5 1.5% 89.5%
Turkey Member since 1961 84.3 1.2% 90.7%
Ukraine Non-member 73.7 1.1% 91.8%
Colombia Non-member 72.1 1.0% 92.8%
Other Europe & Eurasia N/A 65.4 0.9% 93.8%
Canada Member since 1961 62.9 0.9% 94.7%
Greece Member since 1961 62.7 0.9% 95.6%
Other Asia Pacific N/A 57.8 0.8% 96.4%
Czech Republic Member since 1995 53.3 0.8% 97.2%
Vietnam Non-member 45.0 0.6% 97.8%
Romania Non-member 30.6 0.4% 98.3%
Bulgaria Non-member 26.9 0.4% 98.7%

Katestone Environmental Pty Ltd KE1006953 OEH
Jun e 2011
Page 49
Country Member of OECD and year joined
2009 Coal Production
(million tonnes per year)
Proportion of total (%)
Cumulative Proportion of
total (%)
Thailand Non-member 18.8 0.3% 98.9%
United Kingdom Member since 1961 17.9 0.3% 99.2%
Mexico Member since 1994 11.1 0.2% 99.3%
Spain Member since 1961 10.2 0.1% 99.5%
Hungary Member since 1996 9.0 0.1% 99.6%
Brazil Non-member 5.1 0.07% 99.69%
Venezuela Non-member 5.0 0.07% 99.77%
New Zealand Member since 1973 4.6 0.07% 99.83%
Pakistan Non-member 3.5 0.05% 99.88%
South Korea Member since 1996 2.5 0.04% 99.92%
Other Africa Non-member 1.8 0.03% 99.94%
Zimbabwe Non-member 1.7 0.02% 99.97%
Japan Member since 1964 1.3 0.02% 99.99%
Other S. & Cent. America N/A 0.7 0.01% 100.0%
France Member since 1961 0.2 0.00% 100.0%
Grand Total 6,940 100 100
Figure 18 World coal production for 2009 showing contributions from individual
countries
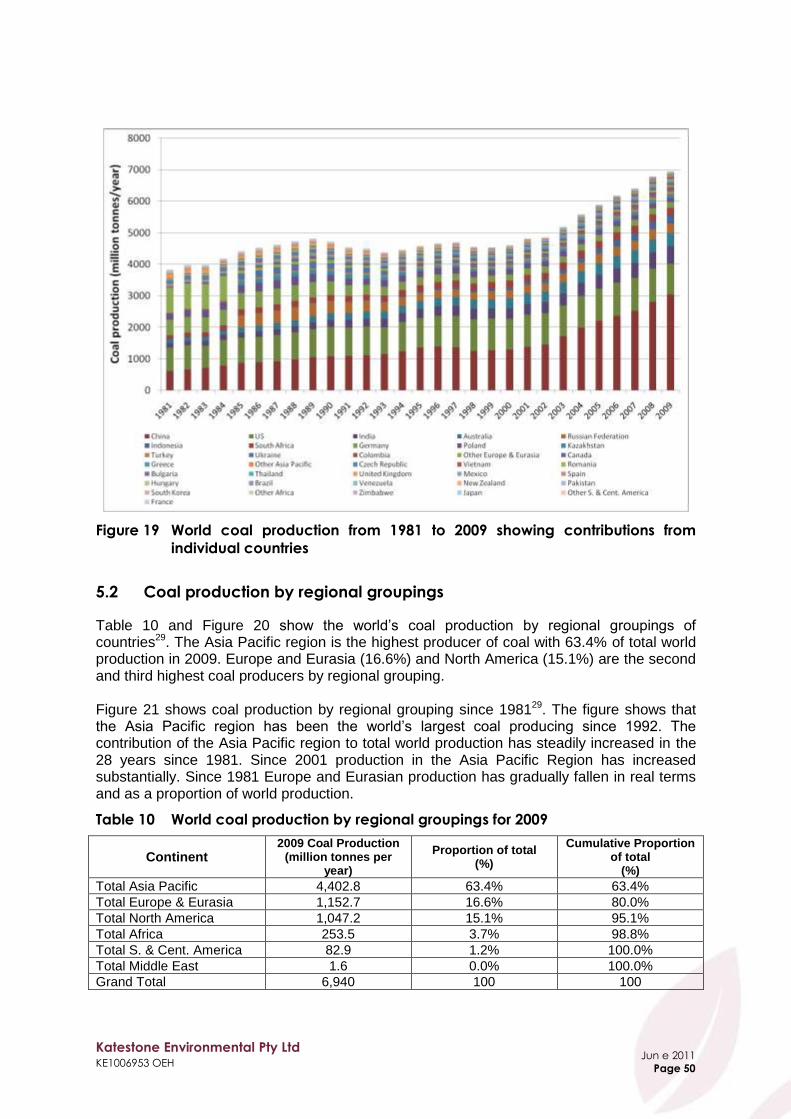
Katestone Environmental Pty Ltd KE1006953 OEH
Jun e 2011
Page 50
Figure 19 World coal production from 1981 to 2009 showing contributions from
individual countries
5.2 Coal production by regional groupings
Table 10 and Figure 20 show the world‟s coal production by regional groupings of countries29. The Asia Pacific region is the highest producer of coal with 63.4% of total world production in 2009. Europe and Eurasia (16.6%) and North America (15.1%) are the second and third highest coal producers by regional grouping. Figure 21 shows coal production by regional grouping since 198129. The figure shows that the Asia Pacific region has been the world‟s largest coal producing since 1992. The contribution of the Asia Pacific region to total world production has steadily increased in the 28 years since 1981. Since 2001 production in the Asia Pacific Region has increased substantially. Since 1981 Europe and Eurasian production has gradually fallen in real terms and as a proportion of world production.
Table 10 World coal production by regional groupings for 2009
Continent 2009 Coal Production
(million tonnes per year)
Proportion of total (%)
Cumulative Proportion of total
(%)
Total Asia Pacific 4,402.8 63.4% 63.4%
Total Europe & Eurasia 1,152.7 16.6% 80.0%
Total North America 1,047.2 15.1% 95.1%
Total Africa 253.5 3.7% 98.8%
Total S. & Cent. America 82.9 1.2% 100.0%
Total Middle East 1.6 0.0% 100.0%
Grand Total 6,940 100 100

Katestone Environmental Pty Ltd KE1006953 OEH
Jun e 2011
Page 51
Figure 20 World coal production for 2009 showing contributions of regional
groupings
Figure 21 World coal production from 1981 to 2009 showing contributions of regional
groupings

Katestone Environmental Pty Ltd KE1006953 OEH
Jun e 2011
Page 52
5.3 Coal production by national economic groupings
Table 11 show the world‟s coal production by national economic grouping29. Emerging Market Economies (EME) are countries, such as China, undergoing rapid growth and industrialisation. The group Other EMEs includes China and is therefore the highest coal producer with 64% of total world production in 2009. The OECD group is the second largest coal producer contributing 29.2% whilst the Former Soviet Union countries produce 6.9% of world production. Total coal produced by the combined European Union is almost 8% of world production. Figure 22 shows world coal production since 1981 by national economic grouping29. The figure shows that the Other EMEs grouping emerged as the highest coal producer in 1995.
Table 11 World coal production by national economic groupings for 2009
National grouping 2009 Coal Production
(million tonnes per year) Proportion of total
2
(%)
Other EMEs1 4436.7 63.9%
OECD 2026.6 29.2%
European Union 536.83 7.7%
2
Former Soviet Union 477.2 6.9%
Note 1 EME, emerging market economies
2,3 European Union coal producing countries are also counted in the OECD grouping
Figure 22 World coal production from 1981 to 2009 showing contributions of national
economic groupings

Katestone Environmental Pty Ltd KE1006953 OEH
Jun e 2011
Page 53
5.4 Coal production in the United States
The U.S. Energy Information Administration provides an annual report on coal production across all states and regions in the United States. A summary of coal production by state and region in 2008 (the latest year of available data) is provided by the US Energy Information Administration and is reproduced in Table 12, Table 13 and Figure 2331. The data indicates that the Powder River Basin region in Wyoming is the largest producer of coal in the United States, producing more than double the quantity of coal of the second highest producer, West Virginia in the Appalachian region.
Table 12 United States coal production by state for 2008
State Rank
2008 Proportion
(%)
Cumulative Proportion
(%) Number of
mines Production
(Mt)
Wyoming 1 20 424 40.0 40.0
West Virginia 2 301 143 13.5 53.4
Kentucky 3 469 109 10.3 63.7
Pennsylvania 4 266 59 5.6 69.3
Montana 5 6 41 3.9 73.1
All other states 6-25 373 285 26.9 100
Grand Total 1,435 1,062 100 100
Figure 23 United States coal production by state for 2008

Katestone Environmental Pty Ltd KE1006953 OEH
Jun e 2011
Page 54
Table 13 United States coal production by coal producing region for 2008
Coal producing region Rank 2008
Proportion (%)
Cumulative Proportion
(%) Number of
mines Production
(Mt)
Western Region – Powder River Basin
1 17 450 42.4 42.4
Appalachian Region – Central
2 841 212 20.0 62.4
Interior Region 3 99 133 12.5 74.9
Appalachian Region - Northern
4 378 123 11.6 86.5
Illinois Basin Region 5 72 90 8.5 94.9
Other 28 54 5.1 100.00

Katestone Environmental Pty Ltd KE1006953 OEH
Jun e 2011
Page 55
6. Coal Production in Australia
This section includes a review of coal production in Australia to provide the local context and identify the key coalfields in NSW. The method of coal mining was considered to determine whether this may have an important bearing on the potential for impact in different regions. Future trends in coal production are also considered, because in general terms increasing production whilst adopting the current approaches to particulate control will lead to increased emissions and potential impacts.
6.1 Coal production by state
Coal is Australia‟s largest energy resource and Australia has substantial reserves of both black and brown coal, including high quality thermal and metallurgical coal. New South Wales and Queensland have Australia‟s largest black coal resources with the Sydney basin and Bowen basin containing most of the recoverable black coal, respectively32. Total Australian production of black and brown coal in 2007-08 is shown in Table 1433. Total Australian production of coal from 1960-61 to 2007-08 is shown in Figure 2433. Victorian production of brown coal was 18% of the national total in 2007-08, whilst NSW and Queensland production of black coal was 34% and 45%, respectively.
Table 14 Australian production of black and brown coal by state for 2007-08
State
Coal production 2007-08 (Mt)
Proportion of total coal production
(%)
Cumulative proportion of total coal production
(%) Black Brown
Queensland 180.9 - 45.3 45.3
NSW 135.0 - 33.8 79.1
Victoria - 72.4 18.1 97.2
Western Australia 6.4 - 1.6 98.8
South Australia 3.8 - 1.0 99.8
Northern Territory 0.6 - 0.2 100
Total brown - 72.4 18.1
Total black 327.6 - 81.9
Total 399.1 100
During 2007-08, Australia produced about 327 million tonnes (Mt) of black coal. Approximately 41.3% or 135 Mt of this came from the coalfields of NSW and 55.4% or 181 Mt came from Queensland. The remainder (3.3% or 11 Mt is produced in Western Australia, South Australia and Tasmania). Figure 25 shows total annual Australian production of black coal and production for each state in the period from 1960-61 to 2007-08. From the mid-80s to the late 90s, black coal production in NSW and Queensland were almost equal. From the late 90s to present, black coal production in Queensland has exceeded that of NSW by 32% on average.

Katestone Environmental Pty Ltd KE1006953 OEH
Jun e 2011
Page 56
Figure 24 Total Australian coal production by state from 1960-61 to 2007-08
Figure 25 Total Australian black coal production by state from 1960-61 to 2007-08

Katestone Environmental Pty Ltd KE1006953 OEH
Jun e 2011
Page 57
6.2 Coal production in NSW and GMR
Production of black coal in NSW comes from six coalfields, namely: Hunter, Newcastle, Gloucester, Southern and Western in the Sydney Basin and the Gunnedah Coalfield in the Gunnedah Basin. The locations of coalfields are shown in Figure 2634. The Hunter, Newcastle and Southern Coalfields are located within the GMR. The majority of the coal mines in the Western Coalfield are also located within the GMR with the exception of the Ulan Mine. The Hunter Coalfield is the largest coal-producing region in NSW and is located around Singleton and Muswellbrook. The Hunter Coalfield produces thermal coal for the NSW electricity market and for export. The coal seams in the Hunter are mostly shallow, allowing for a relatively low cost of production. The Newcastle Coalfield is located around Newcastle, extending about 70 km southwest toward Sydney and 50 km in a north-westerly direction towards Singleton, incorporating Cessnock, Maitland and Wyong. The Newcastle Coalfield produces soft coking coals and thermal coals. The Southern Coalfield is located northwest, west and southwest of Wollongong reaching Appin to the north, Tahmoor to the northwest and Berrima to the west. The Southern Coalfield is the only source of hard coking coal in NSW. Approximately 50% of the output is used in the domestic steel industry and the remainder is exported as coking and thermal coal. The Western Coalfield extends from Lithgow to Rylstone and on to Ulan in the northwest.

Katestone Environmental Pty Ltd KE1006953 OEH
Jun e 2011
Page 58
Figure 26 NSW coalfields

Katestone Environmental Pty Ltd KE1006953 OEH
Jun e 2011
Page 59
Table 15 shows coal production by coalfield as reported by the Department of Primary Industries35. In 2007-08 approximately 92% of coal production came from coal mines operating in the GMR.
Table 15 Coal production in NSW for 2006-07 and 2007-08
Coalfield
Coal production (Mt)
Proportion 2007-08
(%)
Cumulative proportion 2007-08
(%) 2006-07 2007-08
Hunter 81.2 80.4 59.5 59.5
Western 19.1 22.2 16.4 75.9
Newcastle 14.9 16.1 11.9 87.8
Southern 10.6 10.4 7.7 95.5
Gunnedah 3.5 4.0 3.0 98.6
Gloucester 2.0 1.9 1.4 100
Total NSW 131.3 135.2
Total GMR 120.6 124.0
GMR as proportion of NSW (%) 92 92
6.3 Coal production by mining method in NSW and GMR
Approximately 63% of coal produced in the GMR comes from open-cut mining and the remainder is produced by underground mining. Open-cut mining is conducted by dragline or truck and shovel, accounting for approximately 32% and 30% of total GMR production, respectively. Underground coal mining is conducted using the longwall and bord and pillar techniques. Longwall mining accounts for a further 32% of GMR production whilst the remaining 5% is produced using the bord and pillar technique. All mining in the Southern Coalfield is conducted using underground mining techniques, whereas a mix of methods is used throughout the other GMR coalfields. Table 16 summarises coal production in NSW and the GMR by coalfield and mining method35. The relative proportions of GMR coal production that occur by each mining method are summarised in Figure 2735.
Table 16 Coal production in NSW by mining method for 2007-08
Coalfield
Coal (Mt)
Open-cut Underground
Dragline Truck and
shovel Longwall
Bord and Pillar
Hunter 39.4 28.5 12.5 0
Western 2.0 7.6 10.7 2.0
Newcastle 0 2.7 9.7 3.7
Southern 0 0 9.6 0.8
Gunnedah 0 4.0 0 0
Gloucester 0 1.9 0 0
Total NSW 41.4 44.8 42.5 6.5
Total GMR 39.4 36.9 39.2 6.5
Proportion of GMR production by method (%)
32.3 30.3 32.1 5.3

Katestone Environmental Pty Ltd KE1006953 OEH
Jun e 2011
Page 60
Figure 27 Coal production in the GMR by mining method for 2007-08
6.4 Coal mines in the GMR
Table 17 lists operating coal mines in the Hunter Coalfield and GMR. There are seven dragline operations in the Hunter Coalfield that account for about 49% of coal production in this coalfield. Truck and shovel (35.5%) and underground longwall mining (15.5%) make up the remaining production in the Hunter Coalfield.

Katestone Environmental Pty Ltd KE1006953 OEH
Jun e 2011
Page 61
Table 17 GMR coal mines in the Hunter Coalfield for 2007-2008
Coal operation Coal
produced (Mt)
EPL Suburb Mine Type Method
Ashton Coal Mine 2.96 11879 Camberwell OC/UG Truck & Shovel/Longwall
Bengalla Mine 5.35 6538 Muswellbrook OC Dragline
Camberwell Coal Mine (Integra Open-Cut)
2.26 3390 Singleton OC Truck & Shovel
Cumnock No. 1 Colliery 0.87 37 Ravensworth OC Truck & Shovel
Drayton Coal Mine 4.61 398 Muswellbrook OC Dragline
Glendell Mine 1.81 12840 Ravensworth OC Truck & Shovel
Glennies Creek Colliery (Integra Underground)
1.57 7622 Singleton UG Longwall
Hunter Valley Operations 10.6 640 Singleton OC Dragline
Liddell Coal Operations 2.95 2094 Ravensworth OC Truck & Shovel
Mount Arthur North Coal Mine 11.75 11457 Muswellbrook OC Truck & Shovel
Mt Owen Coal Mine/ Ravensworth East Mine
5.25 4460/ 10860
Ravensworth OC Truck & Shovel
Muswellbrook Colliery Holding 1.23 656 Muswellbrook OC Truck & Shovel
Ravensworth Underground Mine 0.69 10337 Singleton UG Longwall
Ravensworth/Narama Mine 4.15 2652 Ravensworth OC Dragline
Rix's Creek Colliery 1.3 3391 Singleton OC Dragline
Saxonvale Colliery Holding 9.48 563 Singleton OC/UG Dragline/Longwall
United Colliery 2.62 3141 Warkworth UG Longwall
Wambo Coal Pty Ltd 3.9 529 Warkworth OC/UG Truck & Shovel/Longwall
Warkworth Coal Mine/ Mount Thorley Operations
8.89 1376, 1976
Mount Thorley OC/CHPP Dragline
Grand Total 82.24
Note 1 Started production in June 2008 not counted in percentages shown above
Mine type: open-cut (OC), underground (UG), combined open-cut and underground (OC/UG), processing plant (CHPP)
Table 18 lists operating coal mines in the Newcastle Coalfield and GMR. About 83% of production is by underground longwall (60%) and bord and pillar (23%) techniques. There are four open-cut truck and shovel operations that account for the remaining 17% of production in the Newcastle Coalfield.
Table 18 GMR coal mines in the Newcastle Coalfield for 2007-2008
Coal operation Coal
produced (Mt)
EPL Suburb Mine Type Method
Abel Underground Mine 0.081 12856 Black Hill UG Bord & Pillar
Austar Coal Mine 1.24 416 Pelton UG Longwall
Awaba Colliery 0.75 443 Awaba UG Bord & Pillar
Bloomfield Colliery 0.46 396 Ashtonfield OC Truck & Shovel
Chain Valley Colliery 0.63 1770 Chain Valley
Bay UG Bord & Pillar
Donaldson Coal Pty Ltd 1.45 11080 Maitland OC Truck & Shovel
Mandalong Mine and Cooranbong Colliery
4.77 365 Dora Creek UG Longwall
Mannering Colliery 0.83 191 Wyee UG Bord & Pillar
Myuna Colliery 1.17 366 Wangi Wangi UG Bord & Pillar
Newstan Colliery 2.05 395 Fassifern UG Longwall
Oceanic Coal Australia Limited (West Wallsend Colliery)
1.63 1360 Killingworth UG Longwall
Tasman Coal Mine 0.33 12483 Seahampton UG Bord & Pillar
Westside Mine 0.81 4033 Killingworth OC Truck & Shovel
Grand Total 16.2
Note 1 Coal production for 2008-09 period not included in percentages shown above.
Mine type: open-cut (OC), underground (UG)
Table 19 lists operating coal mines in the Southern Coalfield and GMR. All production is by underground longwall (92.1%) and bord and pillar (7.9%) techniques.

Katestone Environmental Pty Ltd KE1006953 OEH
Jun e 2011
Page 62
Table 19 GMR coal mines in the Southern Coalfield for 2007-2008
Coal operation Coal
produced (Mt)
EPL Suburb Mine Type Method
Appin Colliery 1.6 758 Appin UG Longwall
Berrima Colliery 0.23 608 Medway UG Bord & Pillar
Dendrobium Mine 2.53 3241 Mount Kembla UG Longwall
Metropolitan Colliery 1.22 767 Helensburgh UG Longwall
Nre No 1 Colliery 0.55 12040 Russell Vale UG Bord & Pillar
Nre Wongawilli Colliery 0.04 1087 Wongawilli UG Bord & Pillar
Tahmoor Colliery 1.38 1389 Tahmoor UG Longwall
Westcliff and Northcliff Collieries
2.88 2504 Appin UG Longwall
Grand Total 10.43
Note: Mine type: open-cut (OC), underground (UG)
Table 20 lists operating coal mines in the Western Coalfield and GMR. About 55% of production is by underground longwall (43.8%) and bord and pillar (11.6%) techniques. There are four open-cut truck and shovel operations that account for the remaining 44.5% of production in the Western Coalfield.
Table 20 GMR coal mines in the Western Coalfield for 2007-2008
Coal operation Coal
produced (Mt)
EPL Suburb Mine Type Method
Angus Place Colliery 3.21 467 Lidsdale UG Longwall
Baal Bone Colliery 1.49 765 Lithgow UG Longwall
Charbon Coal Pty Ltd 0.94 528 Charbon UG Bord & Pillar
Clarence Colliery 1.49
726 Newnes Junction UG Bord & Pillar
Cullen Valley Mine 0.34 10341 Cullen Bullen OC Truck & Shovel
Pine Dale Mine 0.24 4911 Lidsdale OC Truck & Shovel
Springvale Colliery 2.8 3607 Lidsdale UG Longwall
The Invincible Colliery 0.42 1095 Cullen Bullen OC Truck & Shovel
Wilpinjong Coal Pty Ltd 5.86 12425 Wollar OC Truck & Shovel
Grand Total 16.79
Note: Mine type: open-cut (OC), underground (UG)
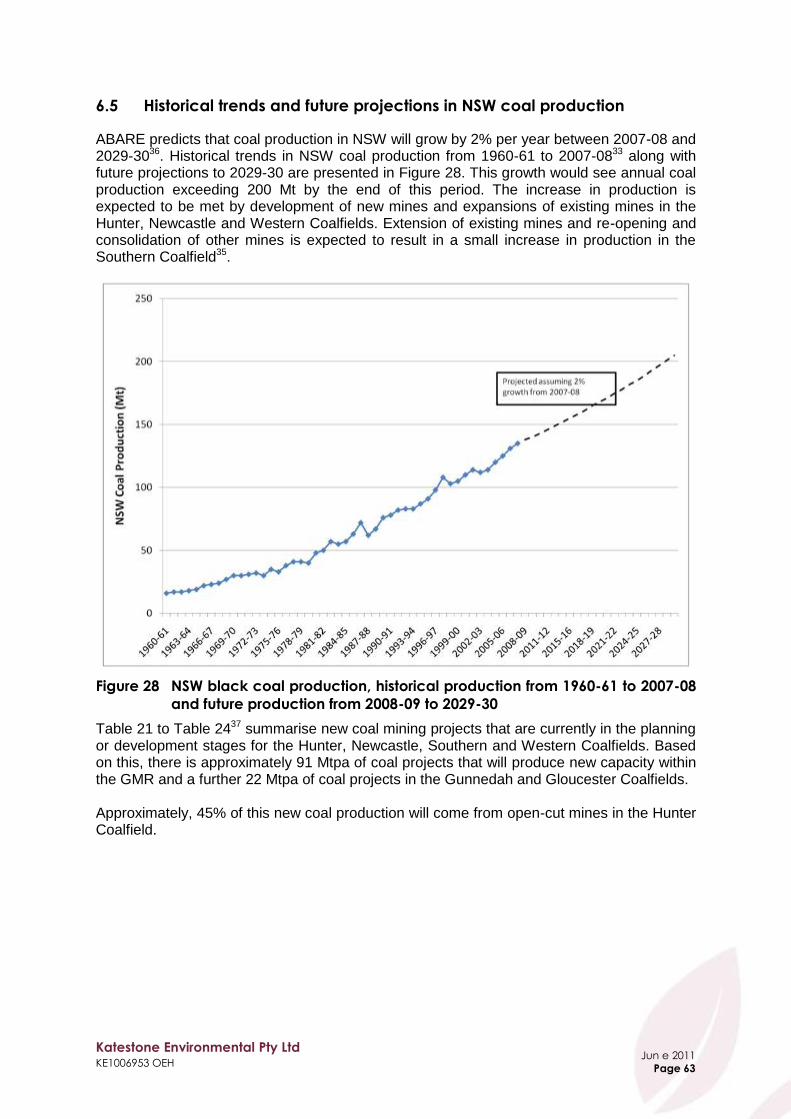
Katestone Environmental Pty Ltd KE1006953 OEH
Jun e 2011
Page 63
6.5 Historical trends and future projections in NSW coal production
ABARE predicts that coal production in NSW will grow by 2% per year between 2007-08 and 2029-3036. Historical trends in NSW coal production from 1960-61 to 2007-0833 along with future projections to 2029-30 are presented in Figure 28. This growth would see annual coal production exceeding 200 Mt by the end of this period. The increase in production is expected to be met by development of new mines and expansions of existing mines in the Hunter, Newcastle and Western Coalfields. Extension of existing mines and re-opening and consolidation of other mines is expected to result in a small increase in production in the Southern Coalfield35.
Figure 28 NSW black coal production, historical production from 1960-61 to 2007-08
and future production from 2008-09 to 2029-30
Table 21 to Table 2437 summarise new coal mining projects that are currently in the planning or development stages for the Hunter, Newcastle, Southern and Western Coalfields. Based on this, there is approximately 91 Mtpa of coal projects that will produce new capacity within the GMR and a further 22 Mtpa of coal projects in the Gunnedah and Gloucester Coalfields. Approximately, 45% of this new coal production will come from open-cut mines in the Hunter Coalfield.

Katestone Environmental Pty Ltd KE1006953 OEH
Jun e 2011
Page 64
Table 21 Coal mine development projects in the Hunter Coalfield
Project Status Mine type Expected Startup
New Annual Production Capacity
Blakefield South New project, under
construction UG 2010 nil (replacement for Beltana)
Mangoola (Anvil Hill opencut) New project, under
construction OC 2012 9 Mt thermal
Mount Arthur opencut (MAC20) Expansion, under construction OC 2011 3.5 Mt thermal
Bickham opencut1 – north of
Scone New project, EIS under way
1 OC 2011 2 Mt thermal
Drayton mine extension Expansion, feasibility study
under way OC na 2.5 Mt thermal
Hunter Valley Operations Expansion
Expansion, govt approval received
OC 2011 3.6 Mt ROM semi-soft
coking and thermal
Mount Arthur North underground New project, govt approval
received UG LW 2011 8 Mt thermal (ROM)
Mount Pleasant Project New project, feasibility study
completed, on hold OC 2013 10.5 Mt thermal
Ravensworth North Expansion, feasibility study
under way OC 2013 9.9 Mt
Saddler's Creek underground and opencut
New project, feasibility study under way
UG/OC na 2 Mt thermal, 2 Mt coking
South East opencut Expansion, feasibility study
under way OC na 2.4 Mt thermal
Warkworth extension Expansion, feasibility study
under way OC na
nil (continuation of mining operations)
Total new capacity 53.4 Mt
Note 1 On 14 May 2010 Premier Kristina Keneally and Minister for Planning Tony Kelly announced the Bickham Coal Project will not
proceed. In addition, the NSW Government announced amendments to the Mining State Environmental Planning Policy to prohibit open-cut mining on the Bickham site permanently.
Table 22 Coal mine development projects in the Newcastle Coalfield
Project Status Mine type Expected Startup
New Annual Production Capacity
Austar underground (Stage 3) Expansion, govt approval
received UG LW 2012-13 3.6 Mt ROM hard coking
Wallarah underground longwall New project, EIS completed UG 2013 5 Mt thermal
Total new capacity 8.6 Mt
Table 23 Coal mine development projects in the Southern Coalfield
Project Status Mine type Expected Startup
New Annual Production Capacity
Metropolitan longwall Expansion, committed UG LW na 1 Mt
NRE No. 1 Colliery Expansion, feasibility study
under way UG na 2 Mt
NRE No. 1 Colliery (preliminary works project)
Expansion, awaiting govt approval
UG na nil (mine upgrade)
Wongawilli Colliery Expansion, feasibility study
under way UG na
nil (continuation of mining operations)
Total new capacity 3 Mt
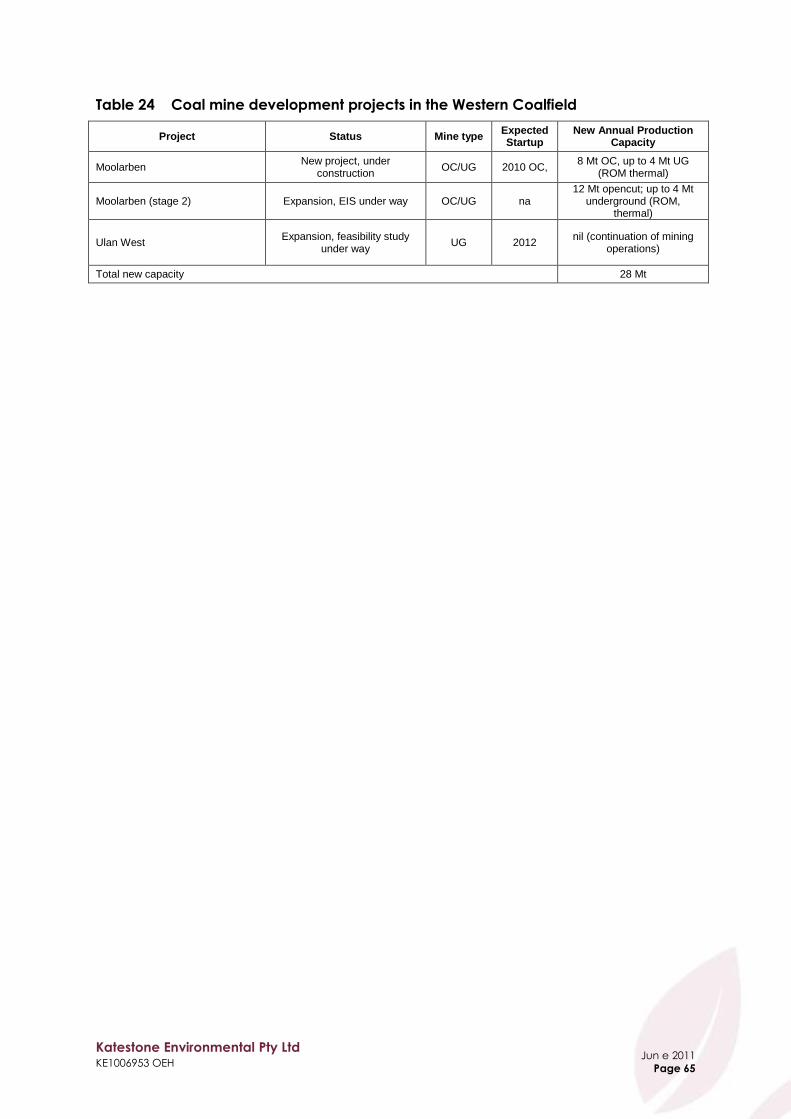
Katestone Environmental Pty Ltd KE1006953 OEH
Jun e 2011
Page 65
Table 24 Coal mine development projects in the Western Coalfield
Project Status Mine type Expected Startup
New Annual Production Capacity
Moolarben New project, under
construction OC/UG 2010 OC,
8 Mt OC, up to 4 Mt UG (ROM thermal)
Moolarben (stage 2) Expansion, EIS under way OC/UG na 12 Mt opencut; up to 4 Mt
underground (ROM, thermal)
Ulan West Expansion, feasibility study
under way UG 2012
nil (continuation of mining operations)
Total new capacity 28 Mt

Katestone Environmental Pty Ltd KE1006953 OEH
Jun e 2011
Page 66
7. Emissions Inventory Data for NSW Coal Mines
This section uses inventory data from various sources to quantify coal mining emissions in the GMR. The inventory data has been derived using the same techniques that are used in dispersion modelling studies to assess new mining projects and data provided by NSW coal mines. A key assumption in using the inventory data in this context is that the potential for impact is proportional to the rate of emission. This is a reasonable assumption that is consistent with the scientific literature. This data has been summarised to show the relative contribution of coal mining to total particulate matter emissions in the GMR as a whole and to the Sydney, Newcastle, Wollongong and Non-Urban Regions within the GMR.
OEH is currently preparing an emissions inventory for the 2008 calendar year. Coal mining data from this inventory was provided to Katestone Environmental for the benchmarking study. This information has been used to determine the relative contributions of specific aspects of the coal mining process to an individual mine‟s emissions and to overall emissions into the GMR airshed. Individual sources of particulate matter from coal mining activities have been ranked. This data has been used to focus the best practice literature review and review of current practices adopted by the coal mining industry in the GMR.
7.1 National Pollutant Inventory
The National Pollutant Inventory (NPI)38 has been developed to track emissions to air and water from activities occurring across Australia. The inventory is publicly available on the NPI website. Australian industries that exceed various thresholds are required under legislation in each state or territory to monitor, measure and report their emissions and transfers. The desired environmental outcomes of the NPI program are to:
Maintain and improve air and water quality;
Minimise environmental impacts associated with hazardous waste; and
Improve the sustainable use of resources. The NPI contains data on 93 substances that have been identified as important due to their possible effect on human health and the environment. The NPI provides emission rates that are aggregated by premises and reported on an annual basis. The NPI has six threshold categories with each of the 93 NPI substances listed in one or more of these categories. If a facility exceeds a threshold during a reporting year for a substance on the reporting list, all the emissions of that substance from the facility must be reported to the NPI. In addition, transfers of the substance (if Category 1, 1b or 3) to a mandatory reporting transfer destination must be reported. The six threshold categories are:
Category 1: based on substance usage – use greater than 10 tonnes per year
Category 1a: based on substance usage – use greater than 25 tonnes per year of total volatile organic compounds
Category 1b: based on substance usage – use greater than 5 kg per year of mercury
Category 2a: based on fuel combusted – burn more than 400 tonnes of fuel or waste per year or burn more than 1 tonne of fuel per hour
Category 2b: based on fuel combusted – burn more than 2,000 tonnes of fuel or waste per year or consume more than 60,000 megawatt hours of electricity per year or having maximum potential power consumption of 20 megawatts other than for lighting or motive purposes per year

Katestone Environmental Pty Ltd KE1006953 OEH
Jun e 2011
Page 67
Category 3: based on substance usage, including transfers Disaggregated emissions information is required for this study to characterise emissions from individual activities at all coal mines in the GMR. Hence, the NPI data is not sufficient for the purpose of this study. A summary of emissions of PM10 in the GMR by industry grouping from the NPI database39 for the 2008-09 reporting year is shown in Table 25 and Figure 29.
Table 25 Anthropogenic emissions of particulate matter <10.0 µm in the GMR from
NPI 2008-09
Source PM10
(tonnes) Proportion (%)
Cumulative proportion
(%)
Coal Mining [060] 53,190.03 82.18 82.18
Electricity Generation [261] 6,498.44 10.04 92.22
Basic Ferrous Metal Manufacturing [211] 983.65 1.52 93.74
Cement, Lime, Plaster and Concrete Product Manufacturing [203]
749.94 1.16 94.90
Ceramic Product Manufacturing [202] 716.90 1.11 96.01
Construction Material Mining [091] 509.65 0.79 96.79
Petroleum and Coal Product Manufacturing [170] 422.19 0.65 97.45
Basic Non-Ferrous Metal Manufacturing [213] 297.21 0.46 97.90
Glass and Glass Product Manufacturing [201] 273.41 0.42 98.33
Water Transport Support Services [521] 201.09 0.31 98.64
Other 881.63 1.36 100
Total 64,724.15 100.00
Figure 29 Anthropogenic emissions of particulate matter <10.0 µm in the GMR from
NPI 2008-09

Katestone Environmental Pty Ltd KE1006953 OEH
Jun e 2011
Page 68
7.2 Air Emissions Inventory for the GMR 2003
OEH completed a three year air emissions inventory project in 20071. The base year of the inventory represents activities that took place during the 2003 calendar year. Emission projections are also provided in yearly increments up to the 2031 calendar year. OEH maintains the GMR air emissions inventory to ensure that policy development and state targets for air quality are based on the most credible and up to date evidence. The GMR measures 210 km (east-west) by 273 km (north-south) and includes the greater Sydney, Newcastle and Wollongong Regions. The GMR covers a total area of 57,330 km2. Approximately, 76% of the population of NSW resides within the GMR. Figure 30 shows the GMR and the Sydney, Newcastle and Wollongong Regions. The area within the GMR but outside of the Sydney, Newcastle and Wollongong Regions is known as the Non-Urban Region. The air emissions inventory includes emissions from biogenic (i.e. natural) and anthropogenic (i.e. human derived) sources. The anthropogenic source groups included in the air emissions inventory are as follows:
Commercial businesses (i.e. non-EPA-licensed)
Domestic-commercial activities
Industrial premises (i.e. EPA-licensed)
Off-road mobile (i.e. non-registered off-road vehicles and equipment)
On-road mobile (i.e. registered on-road vehicles). The pollutants inventoried include criteria pollutants specified in the Ambient Air Quality NEPM18, air toxics associated with the NPI38 and the National Environment Protection (Air Toxics) Measure40 (Air Toxics NEPM) and any other pollutants associated with state specific programs, including:
Load Based Licensing (Protection of the Environment Operations (General) Regulation 1998)41
Protection of the Environment Operations (Clean Air) Regulation 200242. The top ten largest anthropogenic (or man-made) sources of PM10 in the GMR, Sydney, Newcastle, Wollongong and Non-Urban Regions are shown in Table 2643. This data is summarised for the GMR in Figure 31. The top ten largest anthropogenic sources of PM2.5 in the GMR, Sydney, Newcastle, Wollongong and Non-Urban Regions are shown in Table 27. This data is summarised for the GMR in Figure 32.

Katestone Environmental Pty Ltd KE1006953 OEH
Jun e 2011
Page 69
Figure 30 GMR, Sydney, Newcastle and Wollongong Regions

Katestone Environmental Pty Ltd KE1006953 OEH
Jun e 2011
Page 70
Table 26 Ten largest anthropogenic sources of particulate matter <10 µm in the
GMR
Source Group Source Type
Particulate Matter < 10 µm
Annual Emissions
(tonnes/year)
Proportion of Annual
Anthropogenic Emissions (%)
Cumulative (%)
GMR
Industrial Coal mining 25,256 33.6 33.6
Off-Road Mobile Industrial Off-Road Vehicles and Equipment
12,584 16.8 50.4
Domestic-Commercial Solid Fuel Combustion 6,172 8.22 58.6
Industrial Generation of electrical power from coal
4,816 6.41 65.0
Industrial Other land-based extraction 3,472 4.62 69.6
Industrial Crushing, grinding or separating works
2,513 3.34 73.0
Commercial Poultry Farming (Meat) 1,841 2.45 75.4
Industrial Hard-rock gravel quarrying 1,687 2.25 77.7
Industrial Primary iron and steel production
1,620 2.16 79.8
Commercial Gravel and Sand Quarrying 1,252 1.67 81.5
All Other 13,915 18.5 100.0
Sydney
Domestic-Commercial Solid Fuel Combustion 4,642 21.8 21.8
Off-Road Mobile Industrial Off-Road Vehicles and Equipment
2,794 13.1 34.9
Industrial Crushing, grinding or separating works
2,051 9.63 44.5
Industrial Other land-based extraction 1,768 8.30 52.8
On-Road Mobile Exhaust Emissions Passenger Cars Petrol
867 4.07 56.9
On-Road Mobile Exhaust Emissions Light Duty - Diesel
866 4.06 61.0
Industrial Ceramics production (excluding glass)
841 3.95 64.9
Commercial Poultry Farming (Meat) 831 3.90 68.8
On-Road Mobile Exhaust Emissions Heavy Duty Commercial - Diesel
702 3.29 72.1
Commercial Gravel and Sand Quarrying 560 2.63 74.7
All Other 5,383 25.3 100.0
Newcastle
Industrial Coal mining 494 16.8 16.8
Domestic-Commercial Solid Fuel Combustion 393 13.3 30.1
Off-Road Mobile Industrial Off-Road Vehicles and Equipment
302 10.2 40.3
Industrial Production of ammonium nitrate
210 7.1 47.5
Industrial Hard-rock gravel quarrying 158 5.4 52.8
Industrial Primary aluminium production
153 5.2 58.0
Industrial Bitumen pre-mix or hotmix production
129 4.4 62.4
Industrial Crushing, grinding or separating works
93 3.2 65.6
Off-Road Mobile Commercial Ships 83 2.8 68.4
Commercial Gravel and Sand Quarrying 81 2.7 71.1
All Other 851 28.9 100.0
Wollongong
Industrial Primary Iron and steel production
1,618 53.3 53.3
Off-Road Mobile Industrial off-road Vehicles and Equipment
453 14.9 68.3

Katestone Environmental Pty Ltd KE1006953 OEH
Jun e 2011
Page 71
Source Group Source Type
Particulate Matter < 10 µm
Annual Emissions
(tonnes/year)
Proportion of Annual
Anthropogenic Emissions (%)
Cumulative (%)
Domestic-Commercial Solid Fuel Combustion 256 8.4 76.7
Industrial Coal loading 180 5.9 82.6
Industrial Coal mining 65 2.2 84.8
Industrial Coal washery reject or slag landfilling
57 1.9 86.7
Industrial Inert waste landfilling 45 1.5 88.1
On-Road Mobile Exhaust Emissions Heavy Duty Commercial - Diesel
42 1.4 89.5
On-Road Mobile Exhaust Emissions Light Duty - Diesel
38 1.2 90.7
On-Road Mobile Exhaust Emissions Passenger Cars Petrol
34 1.1 91.9
All Other 246 8.1 100.0
Non-Urban
Industrial Coal mining 24,587 51.4 51.4
Off-Road Mobile Industrial off-road Vehicles and Equipment
9,036 18.9 70.3
Industrial Generation of electrical power from coal
4,816 10.1 80.3
Industrial Other land-based extraction 1,639 3.4 83.8
Industrial Hard-rock gravel quarrying 1,404 2.9 86.7
Commercial Poultry Farming (Meat) 953 2.0 88.7
Domestic-Commercial Solid Fuel Combustion 881 1.8 90.5
Commercial Gravel and Sand Quarrying 578 1.2 91.7
Off-Road Mobile Commercial Off-Road Vehicles and Equipment
572 1.2 92.9
Industrial Solid waste landfilling 392 0.8 93.8
All Other 2,984 6.2 100.0

Katestone Environmental Pty Ltd KE1006953 OEH
Jun e 2011
Page 72
Table 27 Ten largest anthropogenic sources of particulate matter <2.5 µm in the
GMR
Source Group Source Type
Particulate Matter < 2.5 µm
Annual Emissions
(tonnes/year)
Proportion of Annual
Anthropogenic Emissions (%)
Cumulative
GMR
Domestic-Commercial Solid Fuel Combustion 5,986 19.6 19.6
Off-Road Mobile Industrial Off-Road Vehicles and Equipment
5,191 17.0 36.6
Industrial Coal mining 4,154 13.6 50.3
Industrial Generation of electrical power from coal
1,708 5.6 55.9
Industrial Primary iron and steel production
1,444 4.7 60.6
On-Road Mobile Exhaust Emissions Light Duty - Diesel
1,073 3.5 64.1
On-Road Mobile Exhaust Emissions Heavy Duty Commercial - Diesel
1,002 3.3 67.4
On-Road Mobile Exhaust Emissions Passenger Cars Petrol
972 3.2 70.6
Industrial Crushing, grinding or separating works
918 3.0 73.6
Industrial Other land-based extraction 799 2.6 76.2
All Other 7,253 23.8 100
Sydney
Domestic-Commercial Solid Fuel Combustion 4,503 34.3 34.3
Off-Road Mobile Industrial Off-Road Vehicles and Equipment
1,152 8.8 43.1
On-Road Mobile Exhaust Emissions Light Duty - Diesel
840 6.4 49.5
Industrial Crushing, grinding or separating works
807 6.2 55.6
On-Road Mobile Exhaust Emissions Passenger Cars Petrol
797 6.1 61.7
On-Road Mobile Exhaust Emissions Heavy Duty Commercial - Diesel
681 5.2 66.9
Industrial Ceramics production (excluding glass)
606 4.6 71.5
Industrial Other land-based extraction 418 3.2 74.7
Commercial Poultry Farming (Meat) 237 1.8 76.5
Industrial Petroleum refining 237 1.8 78.3
All Other 2,848 21.7 100
Newcastle
Domestic-Commercial Solid Fuel Combustion 381 22.6 22.6
Industrial Production of ammonium nitrate
207 12.3 34.8
Off-Road Mobile Industrial Off-Road Vehicles and Equipment
125 7.4 42.2
Industrial Bitumen pre-mix or hotmix production
114 6.8 49.0
Industrial Primary aluminium production
111 6.6 55.6
Off-Road Mobile Commercial Ships 80 4.7 60.3
Industrial Production of phosphate fertilizer
78 4.6 64.9
Industrial Coal mining 71 4.2 69.1
On-Road Mobile Exhaust Emissions Light Duty - Diesel
60 3.6 72.6
On-Road Mobile Exhaust Emissions Heavy Duty Commercial - Diesel
52 3.1 75.7
All Other 409 24.3 100

Katestone Environmental Pty Ltd KE1006953 OEH
Jun e 2011
Page 73
Source Group Source Type
Particulate Matter < 2.5 µm
Annual Emissions
(tonnes/year)
Proportion of Annual
Anthropogenic Emissions (%)
Cumulative
Wollongong
Industrial Primary iron and steel production
1,442 65.8 65.8
Domestic-Commercial Solid Fuel Combustion 248 11.3 77.1
Off-Road Mobile Industrial Off-Road Vehicles and Equipment
187 8.5 85.6
On-Road Mobile Exhaust Emissions Heavy Duty Commercial - Diesel
40 1.9 87.5
On-Road Mobile Exhaust Emissions Light Duty - Diesel
36 1.7 89.1
Industrial Coke production 33 1.5 90.6
On-Road Mobile Exhaust Emissions Passenger Cars - Petrol
32 1.4 92.1
Industrial Coal loading 19 0.9 93.0
Off-Road Mobile Commercial Ships 14 0.7 93.6
Industrial Coal mining 14 0.6 94.2
All Other 126 5.8 100.0
Non-Urban
Industrial Coal mining 4,056 30.1 30.1
Off-Road Mobile Industrial Off-Road Vehicles and Equipment
3,727 27.6 57.7
Industrial Generation of electrical power from coal
1,708 12.7 70.3
Domestic-Commercial Solid Fuel Combustion 855 6.3 76.7
Industrial Other land-based extraction 368 2.7 79.4
Industrial Hard-rock gravel quarrying 360 2.7 82.1
Commercial Poultry Farming (Meat) 272 2.0 84.1
Off-Road Mobile Commercial Off-Road Vehicles and Equipment
261 1.9 86.0
On-Road Mobile Exhaust Emissions Heavy Duty Commercial - Diesel
228 1.7 87.7
Industrial Primary aluminium production
202 1.5 89.2
All Other 1,456 10.8 100.0
The 2003 air emissions inventory includes wheel generated and exhaust emissions from coal mining vehicles and equipment in the Industrial Off-Road Vehicles and Equipment source type category. With the exception of wheel generated and exhaust emissions, the 2003 inventory shows that the coal mining industry is the:
Largest industrial emitter of PM10 in the NSW GMR, emitting 25,256 tonnes of PM10 per year, or 33.6% of anthropogenic emissions
Largest industrial emitter of PM10 in the Newcastle and Non-Urban Regions, emitting 494 tonnes and 24,587 tonnes of PM10 per year, respectively
Third largest emitter of PM2.5 in the GMR, emitting 4,154 tonnes of PM2.5 per year, or 13.6% of anthropogenic emissions
Largest industrial emitter of PM2.5 in the Non-Urban Region, emitting 4,056 tonnes per year, or 30.1% of anthropogenic emissions

Katestone Environmental Pty Ltd KE1006953 OEH
Jun e 2011
Page 74
Figure 31 Ten largest anthropogenic sources of particulate matter < 10 µm in the
GMR
Figure 32 Ten largest anthropogenic sources of particulate matter < 2.5 µm in the
GMR

Katestone Environmental Pty Ltd KE1006953 OEH
Jun e 2011
Page 75
7.3 Coal Mining Air Emissions Inventory for the GMR 2008
7.3.1 Coal Mines Emission Database
In September 2009, OEH wrote to all EPA licensees including all coal mines in the GMR and requested information by Notice under Section 191 of the POEO Act (Appendix B). OEH‟s approach to updating the inventory aims to minimise duplication with the NPI by utilising the disaggregated data that is prepared by reporting premises. In September 2009, OEH wrote to all EPA licensees including all coal mines in the GMR and requested information by Notice under Section 191 of the POEO Act. The Notice required licensees to complete a questionnaire that included the provision of the following information:
Details of the operation
Operating schedule
Major materials and products
Air emissions sources
Fuel combustion
Fugitive emissions from valves seals
On-site vehicles
Materials handling
Stockpiles and exposed areas
NPI emissions of particulate matter
Process flow diagram OEH provided Katestone Environmental with a database of disaggregated particulate matter emissions for coal mining activities in the GMR. The Coal Mines Emission Database (CMED) is a subset of the information collected for the GMR air emissions inventory. The CMED is in MS Access 2003 format and includes coal mines in the GMR. Table 28 presents a summary of the information provided in the CMED, including the index for each table, which serves as a linking point to other tables within the database, and standardises data within the database. Figure 33 shows a schematic representation of the tables in the CMED and the relationships between fields and tables.
Table 28 Information included in the Coal Mines Emission Database
Table Index Information
tblFacility_Coal_Mine Facility_ID Mines location, Licence no. Other miscellaneous information
tblEET EET_ID EET Description (using a standard description) Algorithm used in estimating emissions
tblSource_Coal_Mine Source_ID
Linked to tblEET and details activities that is relevant only to particular mines. This table also provides flexibility in calculating emissions from mine where the calculation factor values (mine data) could vary within the mine
tbl_Substance Substance_ID Substance name
tblSource_Substance_Output
No unique index, links on indices for the previous two tables
Control factor applied Source output
tblSources_EET_Calc_Inputs
EET_Calc_Factor_ID EET_Calc_Factor_TypeID
Description of variables used in simple calculation (where Emissions = A * E * C).
tlkpEET_Config_CalcFactorType
CalcFactorType_ID Description of variables used in complex calculations
tlkpUnit Unit_ID Units used in the previous two tables

Katestone Environmental Pty Ltd KE1006953 OEH
Jun e 2011
Page 76
The output amounts for TSP, PM10, and PM2.5 stored in the table „tblSource_Substance_Output‟ were re-checked against the calculated output amounts using the calculation factors provided and the equations used. In addition to this, the spreadsheet used to calculate vehicle data for the mines was also provided by OEH.
Figure 33 Schematic representation of the Coal Mines Emission Database
Common sources of particulate matter from coal mining identified in the CMED are listed in Table 29. These activities emit varying levels of TSP, PM10 and PM2.5. The majority of these emissions occur as a result of work done on coal and/or overburden. Particulates are also emitted at coal mines by combustion activities including internal combustion engines (usually diesel), boilers and flares. Emissions from these sources are also included in the inventory and are relevant here, although their relative contribution to emissions is quite small.

Katestone Environmental Pty Ltd KE1006953 OEH
Jun e 2011
Page 77
Table 29 Common sources of particulate matter from coal mining
Activity Material
Coal Overburden
Blasting
Bulldozers
Crushing -
Dragline
Drilling -
Front-end loaders
Graders -
Material transfer and conveying
Scrapers -
Screening
Stacking and reclaiming from stockpiles -
Train loading -
Truck loading and unloading
Wheel-generated particulate matter -
Wind erosion of stockpiles and exposed areas
7.3.2 Coal mines included in the Coal Mines Emission Database
The coal mines for which detailed activity data were available are listed in Table 30. The locations of these coal mines are shown in Figure 34 for the Hunter Coalfield, Figure 35 for the Newcastle Coalfield, Figure 36 for the Southern Coalfield and Figure 37 for the Western Coalfield. The facilities include underground coal mines, open-cut coal mines, coal preparation plants, coal handling facilities and several sites where coal mines are either under construction or have ceased operations.
Table 30 Coal mines included in the Coal Mines Emission Database
Coal operation EPL Suburb Operations type
Abel Underground Mine 12856 Black Hill Underground mine
Angus Place Colliery 467 Lidsdale Underground mine
Appin Colliery 758 Appin Coal handling facility
Ashton Coal Mine 11879 Camberwell
Combined underground and open-cut mining
Austar Coal Mine 416 Pelton Underground mine
Awaba Colliery 443 Awaba Underground mine
Baal Bone Colliery 765 Lithgow Underground mine
Bayswater Colliery 113 Muswellbrook Open-cut mine
Bengalla Mine 6538 Muswellbrook Open-cut mine
Berrima Colliery 608 Medway Underground mine
Bloomfield Colliery 396 Ashtonfield Open-cut mine
Camberwell Coal Mine 3390 Singleton Open-cut mine
Chain Valley Colliery 1770 Chain Valley Bay Underground mine
Charbon Coal Pty Ltd 528 Charbon Underground mine
Clarence Colliery 726 Newnes Junction Underground mine
Cullen Valley Mine 10341 Cullen Bullen Open-cut mine
Cumnock No. 1 Colliery 37 Ravensworth Open-cut mine
Dendrobium Mine 3241 Mount Kembla Underground mine
Donaldson Coal Pty Ltd 11080 Maitland Open-cut mine
Drayton Coal Mine 398 Muswellbrook Open-cut mine
Glendell Mine 12840 Ravensworth Open-cut mine
Glennies Creek Colliery 7622 Singleton Underground mine
Hunter Valley Operations 640 Singleton Open-cut mine
Ivanhoe No.2 Colliery 631 Portland
Site under care and maintenance contract
Liddell Coal Operations 2094 Ravensworth Open-cut mine
Macquarie Coal Preparation Plant 1360 Teralba Coal handling facility
Mandalong Mine and Cooranbong Colliery 365 Dora Creek Underground mine
Mannering Colliery 191 Wyee Underground mine
Metropolitan Colliery 767 Helensburgh Underground mine

Katestone Environmental Pty Ltd KE1006953 OEH
Jun e 2011
Page 78
Coal operation EPL Suburb Operations type
Mount Arthur Coal 11457 Mount Thorley Coal handling facility
Mount Thorley Operations 1976 Muswellbrook Open-cut mine
Mt Owen Coal Mine 4460 Ravensworth Open-cut mine
Muswellbrook Colliery Holding 656 Muswellbrook Open-cut mine
Myuna Colliery 366 Wangi Wangi Underground mine
Newstan Colliery 395 Fassifern Underground mine
Nre No 1 Colliery 12040 Russell Vale Underground mine
Nre Wongawilli Colliery 1087 Wongawilli Underground mine
Pine Dale Mine 4911 Lidsdale Open-cut mine
Ravensworth East Mine 10860 Ravensworth Open-cut mine
Ravensworth Underground Mine 10337 Singleton Underground mine
Ravensworth/Narama Mine 2652 Ravensworth Open-cut mine
Richmond Main East 13027 Cessnock Rehabilitated site
Rix's Creek Colliery 3391 Singleton Open-cut mine
Saxonvale Colliery Holding 563 Singleton
Combined underground and open-cut mining
Springvale Colliery 3607 Lidsdale Underground mine
Tahmoor Colliery 1389 Tahmoor Underground mine
Tasman Coal Mine 12483 Seahampton Underground mine
The Invincible Colliery 1095 Cullen Bullen Open-cut mine
United Colliery 3141 Warkworth Underground mine
Wambo Coal Pty Ltd 529 Warkworth
Combined underground and open-cut mining
Warkworth Coal Mine 1376 Mount Thorley Open-cut mine
West Wallsend Colliery 1360 Killingworth Underground mine
Westcliff and Northcliff Collieries 2504 Appin Underground mine
Westside Mine 4033 Killingworth Open-cut mine
Wilpinjong Coal Pty Ltd 12425 Wollar Open-cut mine
Xstrata Mangoola (Anvil Hill Mine) 12894 Wybong Mine under construction
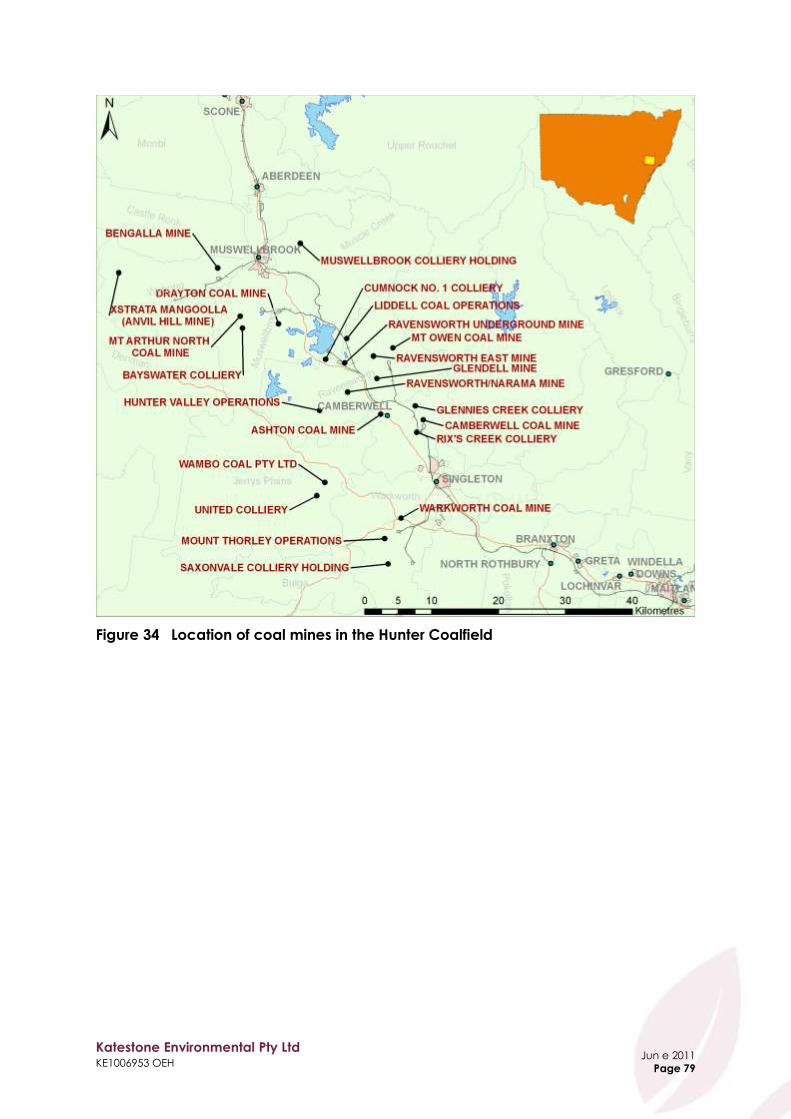
Katestone Environmental Pty Ltd KE1006953 OEH
Jun e 2011
Page 79
Figure 34 Location of coal mines in the Hunter Coalfield

Katestone Environmental Pty Ltd KE1006953 OEH
Jun e 2011
Page 80
Figure 35 Location of coal mines in the Newcastle Coalfield

Katestone Environmental Pty Ltd KE1006953 OEH
Jun e 2011
Page 81
Figure 36 Location of coal mines in the Southern Coalfield
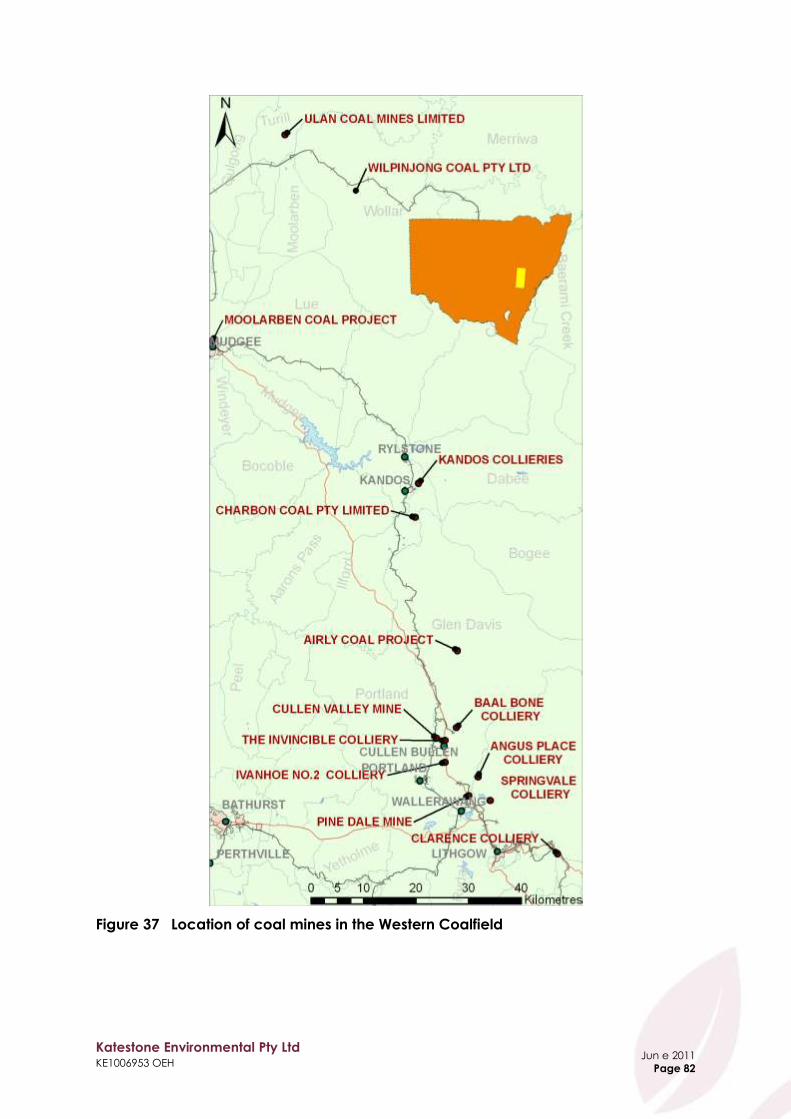
Katestone Environmental Pty Ltd KE1006953 OEH
Jun e 2011
Page 82
Figure 37 Location of coal mines in the Western Coalfield
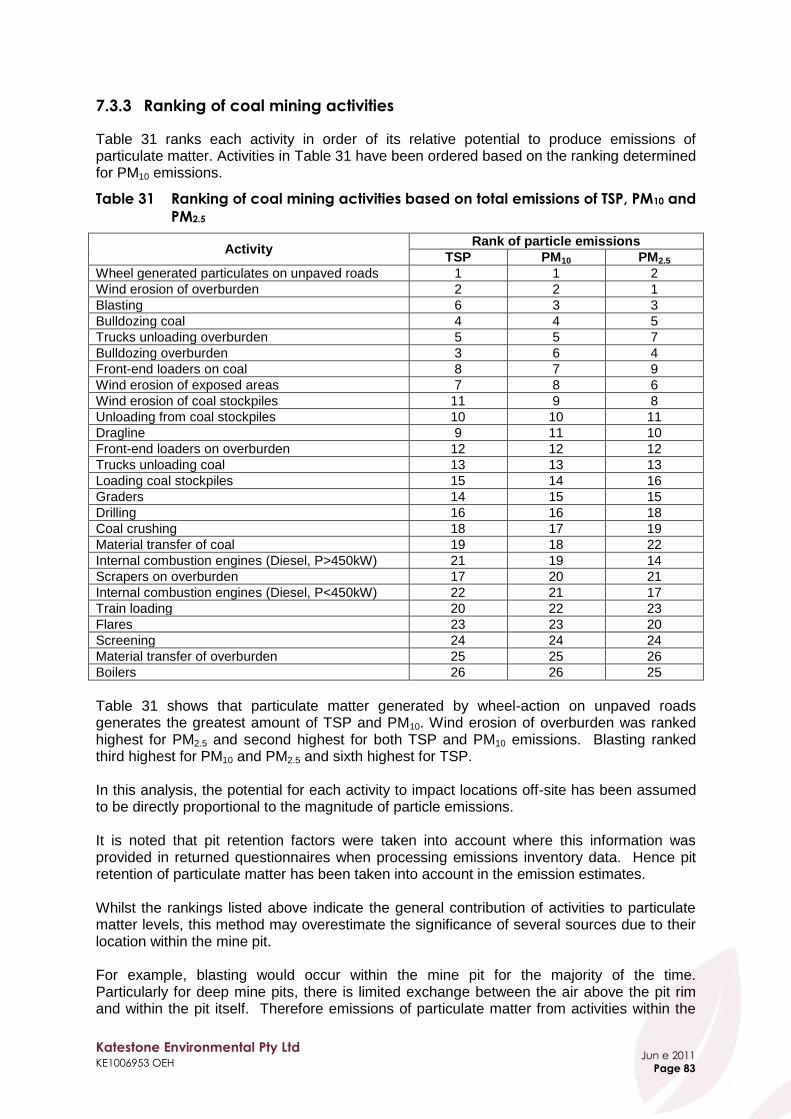
Katestone Environmental Pty Ltd KE1006953 OEH
Jun e 2011
Page 83
7.3.3 Ranking of coal mining activities
Table 31 ranks each activity in order of its relative potential to produce emissions of particulate matter. Activities in Table 31 have been ordered based on the ranking determined for PM10 emissions.
Table 31 Ranking of coal mining activities based on total emissions of TSP, PM10 and
PM2.5
Activity Rank of particle emissions
TSP PM10 PM2.5
Wheel generated particulates on unpaved roads 1 1 2
Wind erosion of overburden 2 2 1
Blasting 6 3 3
Bulldozing coal 4 4 5
Trucks unloading overburden 5 5 7
Bulldozing overburden 3 6 4
Front-end loaders on coal 8 7 9
Wind erosion of exposed areas 7 8 6
Wind erosion of coal stockpiles 11 9 8
Unloading from coal stockpiles 10 10 11
Dragline 9 11 10
Front-end loaders on overburden 12 12 12
Trucks unloading coal 13 13 13
Loading coal stockpiles 15 14 16
Graders 14 15 15
Drilling 16 16 18
Coal crushing 18 17 19
Material transfer of coal 19 18 22
Internal combustion engines (Diesel, P>450kW) 21 19 14
Scrapers on overburden 17 20 21
Internal combustion engines (Diesel, P<450kW) 22 21 17
Train loading 20 22 23
Flares 23 23 20
Screening 24 24 24
Material transfer of overburden 25 25 26
Boilers 26 26 25
Table 31 shows that particulate matter generated by wheel-action on unpaved roads generates the greatest amount of TSP and PM10. Wind erosion of overburden was ranked highest for PM2.5 and second highest for both TSP and PM10 emissions. Blasting ranked third highest for PM10 and PM2.5 and sixth highest for TSP. In this analysis, the potential for each activity to impact locations off-site has been assumed to be directly proportional to the magnitude of particle emissions. It is noted that pit retention factors were taken into account where this information was provided in returned questionnaires when processing emissions inventory data. Hence pit retention of particulate matter has been taken into account in the emission estimates. Whilst the rankings listed above indicate the general contribution of activities to particulate matter levels, this method may overestimate the significance of several sources due to their location within the mine pit. For example, blasting would occur within the mine pit for the majority of the time. Particularly for deep mine pits, there is limited exchange between the air above the pit rim and within the pit itself. Therefore emissions of particulate matter from activities within the

Katestone Environmental Pty Ltd KE1006953 OEH
Jun e 2011
Page 84
pit would be retained inside it. This pit retention may decrease TSP emissions by a factor of 50% and PM10 and PM2.5 emissions by 5%10. On the other hand, anecdotal evidence from mines in the GMR suggests that pit retention may not be as effective for long deep open-cut mines when the wind runs parallel with the length of the open-cut. Enhanced particulate matter emissions can occur in this circumstance offsetting the benefit of pit retention. Further research is required to verify or dispel this phenomenon. Table 32 and Figure 38 show the proportion of total TSP emissions that are produced by various activities conducted at GMR coal mines. Table 32 suggests that the top three activities produce 80% of the TSP emissions associated with GMR coal mines, whilst the top ten activities produce 97% of TSP emissions.
Table 32 Proportion of total TSP emissions produced by various coal mining
activities based on data from GMR coal mines
Source type Rank TSP Emissions (tonnes/year)
Proportion (%)
Cumulative Proportion (%)
Wheel generated dust 1 81,643 52.4 52.4
Wind Erosion (overburden) 2 28,907 18.6 70.9
Bulldozers 3 14,156 9.1 80.0
Trucks (dumping overburden) 4 6,295 4.0 84.1
Blasting 5 5,508 3.5 87.6
Exposed area (wind erosion) 6 3,732 2.4 90.0
Loaders (coal) 7 3,384 2.2 92.2
Dragline (Other) 8 2,956 1.9 94.1
Unloading from stockpiles (coal) 9 2,520 1.6 95.7
Wind Erosion (coal) 10 2,453 1.6 97.3
Loaders (overburden) 11 1,237 0.8 98.0
Trucks (dumping coal) 12 1,108 0.7 98.8
Graders 13 690 0.4 99.2
Loading stockpiles (coal) 14 576 0.4 99.6
Drilling 15 301 0.2 99.8
Other 363 0.2 100.0
Grand total 155,830 100
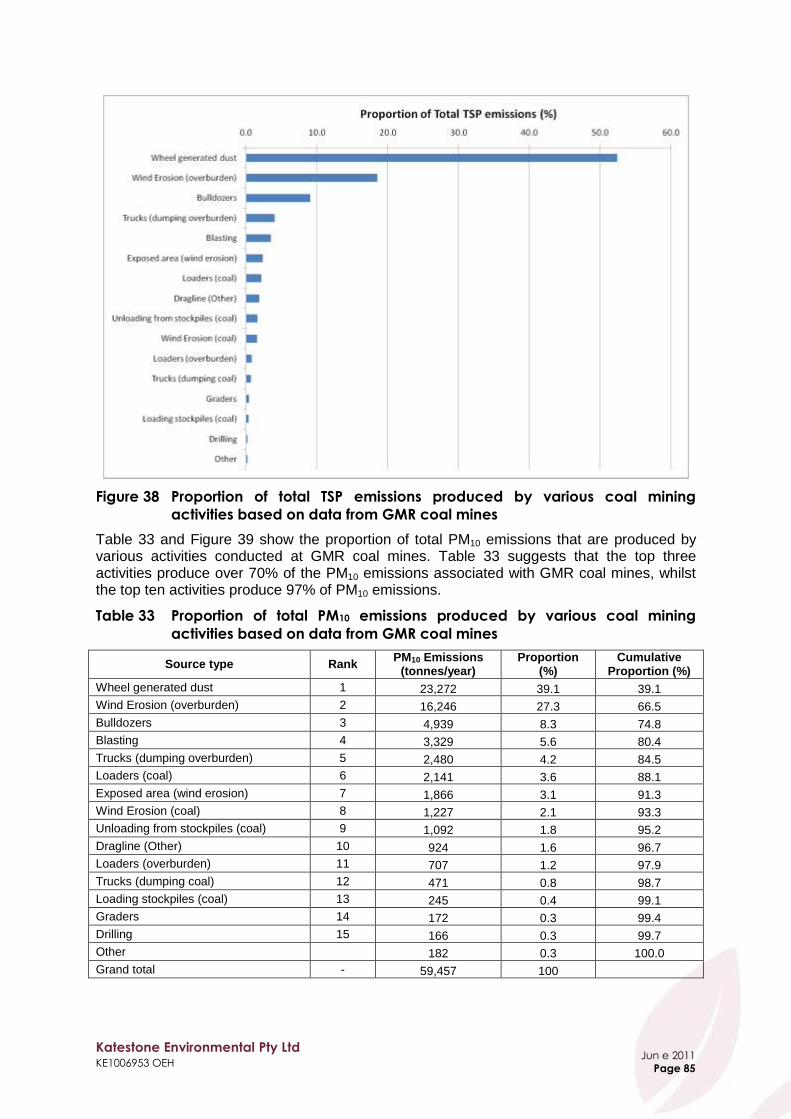
Katestone Environmental Pty Ltd KE1006953 OEH
Jun e 2011
Page 85
Figure 38 Proportion of total TSP emissions produced by various coal mining
activities based on data from GMR coal mines
Table 33 and Figure 39 show the proportion of total PM10 emissions that are produced by various activities conducted at GMR coal mines. Table 33 suggests that the top three activities produce over 70% of the PM10 emissions associated with GMR coal mines, whilst the top ten activities produce 97% of PM10 emissions.
Table 33 Proportion of total PM10 emissions produced by various coal mining
activities based on data from GMR coal mines
Source type Rank PM10 Emissions
(tonnes/year) Proportion
(%) Cumulative
Proportion (%)
Wheel generated dust 1 23,272 39.1 39.1
Wind Erosion (overburden) 2 16,246 27.3 66.5
Bulldozers 3 4,939 8.3 74.8
Blasting 4 3,329 5.6 80.4
Trucks (dumping overburden) 5 2,480 4.2 84.5
Loaders (coal) 6 2,141 3.6 88.1
Exposed area (wind erosion) 7 1,866 3.1 91.3
Wind Erosion (coal) 8 1,227 2.1 93.3
Unloading from stockpiles (coal) 9 1,092 1.8 95.2
Dragline (Other) 10 924 1.6 96.7
Loaders (overburden) 11 707 1.2 97.9
Trucks (dumping coal) 12 471 0.8 98.7
Loading stockpiles (coal) 13 245 0.4 99.1
Graders 14 172 0.3 99.4
Drilling 15 166 0.3 99.7
Other 182 0.3 100.0
Grand total - 59,457 100

Katestone Environmental Pty Ltd KE1006953 OEH
Jun e 2011
Page 86
Figure 39 Proportion of total PM10 emissions produced by various coal mining
activities based on data from GMR coal mines
Table 34 and Figure 40 show the proportion of total PM2.5 emissions that are produced by various activities conducted at GMR coal mines. Table 34 suggests that the top three activities produce 75% of the PM2.5 emissions associated with GMR coal mines, whilst the top ten activities produce 97% of PM2.5 emissions.
Table 34 Proportion of total PM2.5 emissions produced by various coal mining
activities based on data from GMR coal mines
Source type Rank PM2.5 Emissions
(tonnes/year) Proportion
(%) Cumulative
Proportion (%)
Wind Erosion (overburden) 1 3,272 31.8 31.8
Wheel generated dust 2 2,327 22.6 54.4
Blasting 3 2,121 20.6 75.1
Bulldozers 4 887 8.6 83.7
Exposed area (wind erosion) 5 373 3.6 87.3
Trucks (dumping overburden) 6 324 3.1 90.5
Wind Erosion (coal) 7 247 2.4 92.9
Loaders (coal) 8 209 2.0 94.9
Dragline (Other) 9 138 1.3 96.2
Unloading from stockpiles (coal) 10 118 1.1 97.4
Loaders (overburden) 11 70 0.7 98.1
Trucks (dumping coal) 12 53 0.5 98.6
Internal Combustion Engine (Diesel, P>450kW)
13 34 0.3 98.9
Graders 14 32 0.3 99.2
Loading stockpiles (coal) 15 27 0.3 99.5
Other 55 0.5 100.0
Grand total 10,286 100
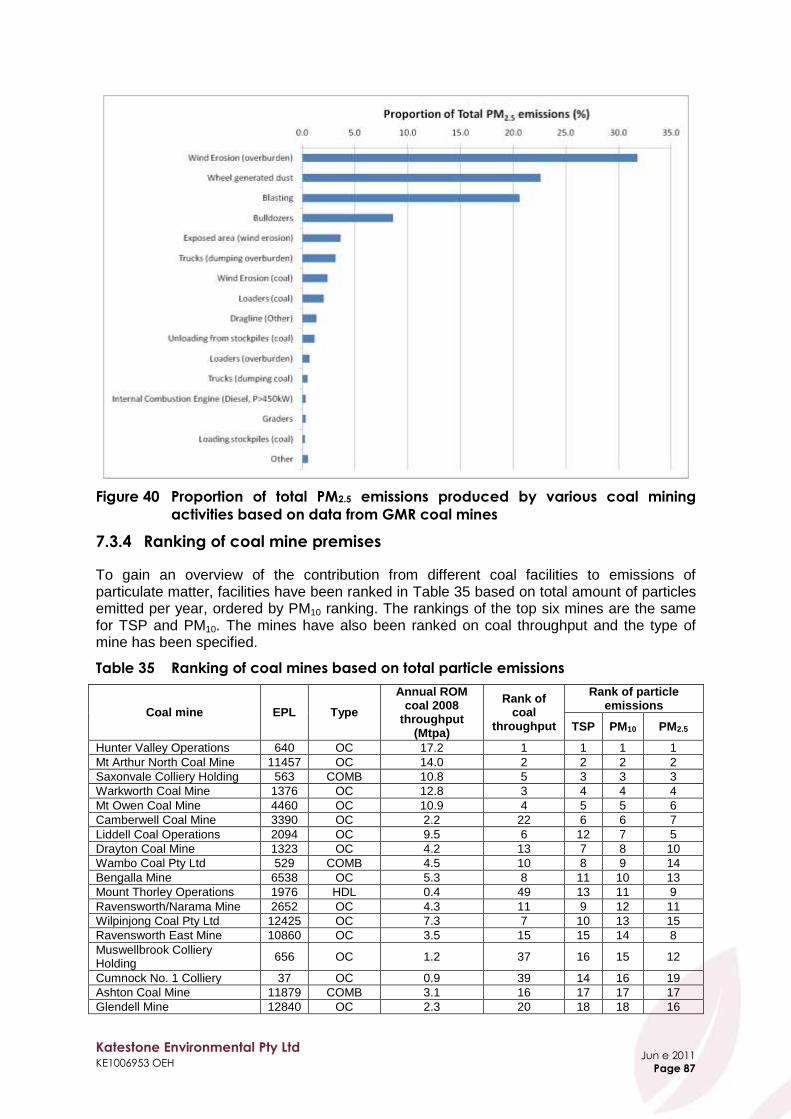
Katestone Environmental Pty Ltd KE1006953 OEH
Jun e 2011
Page 87
Figure 40 Proportion of total PM2.5 emissions produced by various coal mining
activities based on data from GMR coal mines
7.3.4 Ranking of coal mine premises
To gain an overview of the contribution from different coal facilities to emissions of particulate matter, facilities have been ranked in Table 35 based on total amount of particles emitted per year, ordered by PM10 ranking. The rankings of the top six mines are the same for TSP and PM10. The mines have also been ranked on coal throughput and the type of mine has been specified.
Table 35 Ranking of coal mines based on total particle emissions
Coal mine EPL Type
Annual ROM coal 2008
throughput (Mtpa)
Rank of coal
throughput
Rank of particle emissions
TSP PM10 PM2.5
Hunter Valley Operations 640 OC 17.2 1 1 1 1
Mt Arthur North Coal Mine 11457 OC 14.0 2 2 2 2
Saxonvale Colliery Holding 563 COMB 10.8 5 3 3 3
Warkworth Coal Mine 1376 OC 12.8 3 4 4 4
Mt Owen Coal Mine 4460 OC 10.9 4 5 5 6
Camberwell Coal Mine 3390 OC 2.2 22 6 6 7
Liddell Coal Operations 2094 OC 9.5 6 12 7 5
Drayton Coal Mine 1323 OC 4.2 13 7 8 10
Wambo Coal Pty Ltd 529 COMB 4.5 10 8 9 14
Bengalla Mine 6538 OC 5.3 8 11 10 13
Mount Thorley Operations 1976 HDL 0.4 49 13 11 9
Ravensworth/Narama Mine 2652 OC 4.3 11 9 12 11
Wilpinjong Coal Pty Ltd 12425 OC 7.3 7 10 13 15
Ravensworth East Mine 10860 OC 3.5 15 15 14 8
Muswellbrook Colliery Holding
656 OC 1.2 37 16 15 12
Cumnock No. 1 Colliery 37 OC 0.9 39 14 16 19
Ashton Coal Mine 11879 COMB 3.1 16 17 17 17
Glendell Mine 12840 OC 2.3 20 18 18 16
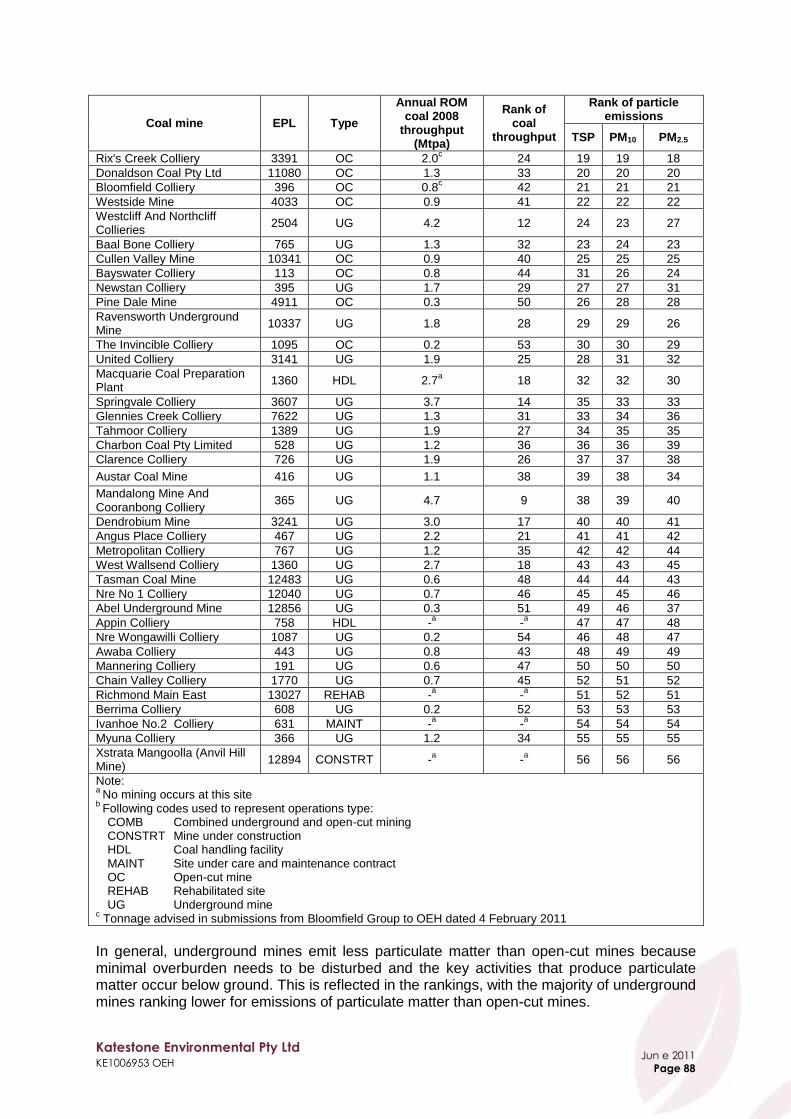
Katestone Environmental Pty Ltd KE1006953 OEH
Jun e 2011
Page 88
Coal mine EPL Type
Annual ROM coal 2008
throughput (Mtpa)
Rank of coal
throughput
Rank of particle emissions
TSP PM10 PM2.5
Rix's Creek Colliery 3391 OC 2.0c 24 19 19 18
Donaldson Coal Pty Ltd 11080 OC 1.3 33 20 20 20
Bloomfield Colliery 396 OC 0.8c 42 21 21 21
Westside Mine 4033 OC 0.9 41 22 22 22
Westcliff And Northcliff Collieries
2504 UG 4.2 12 24 23 27
Baal Bone Colliery 765 UG 1.3 32 23 24 23
Cullen Valley Mine 10341 OC 0.9 40 25 25 25
Bayswater Colliery 113 OC 0.8 44 31 26 24
Newstan Colliery 395 UG 1.7 29 27 27 31
Pine Dale Mine 4911 OC 0.3 50 26 28 28
Ravensworth Underground Mine
10337 UG 1.8 28 29 29 26
The Invincible Colliery 1095 OC 0.2 53 30 30 29
United Colliery 3141 UG 1.9 25 28 31 32
Macquarie Coal Preparation Plant
1360 HDL 2.7a 18 32 32 30
Springvale Colliery 3607 UG 3.7 14 35 33 33
Glennies Creek Colliery 7622 UG 1.3 31 33 34 36
Tahmoor Colliery 1389 UG 1.9 27 34 35 35
Charbon Coal Pty Limited 528 UG 1.2 36 36 36 39
Clarence Colliery 726 UG 1.9 26 37 37 38
Austar Coal Mine 416 UG 1.1 38 39 38 34
Mandalong Mine And Cooranbong Colliery
365 UG 4.7 9 38 39 40
Dendrobium Mine 3241 UG 3.0 17 40 40 41
Angus Place Colliery 467 UG 2.2 21 41 41 42
Metropolitan Colliery 767 UG 1.2 35 42 42 44
West Wallsend Colliery 1360 UG 2.7 18 43 43 45
Tasman Coal Mine 12483 UG 0.6 48 44 44 43
Nre No 1 Colliery 12040 UG 0.7 46 45 45 46
Abel Underground Mine 12856 UG 0.3 51 49 46 37
Appin Colliery 758 HDL -a -
a 47 47 48
Nre Wongawilli Colliery 1087 UG 0.2 54 46 48 47
Awaba Colliery 443 UG 0.8 43 48 49 49
Mannering Colliery 191 UG 0.6 47 50 50 50
Chain Valley Colliery 1770 UG 0.7 45 52 51 52
Richmond Main East 13027 REHAB -a -
a 51 52 51
Berrima Colliery 608 UG 0.2 52 53 53 53
Ivanhoe No.2 Colliery 631 MAINT -a -
a 54 54 54
Myuna Colliery 366 UG 1.2 34 55 55 55
Xstrata Mangoolla (Anvil Hill Mine)
12894 CONSTRT -a -
a 56 56 56
Note: a
No mining occurs at this site b
Following codes used to represent operations type: COMB Combined underground and open-cut mining CONSTRT Mine under construction HDL Coal handling facility MAINT Site under care and maintenance contract OC Open-cut mine REHAB Rehabilitated site UG Underground mine
c Tonnage advised in submissions from Bloomfield Group to OEH dated 4 February 2011
In general, underground mines emit less particulate matter than open-cut mines because minimal overburden needs to be disturbed and the key activities that produce particulate matter occur below ground. This is reflected in the rankings, with the majority of underground mines ranking lower for emissions of particulate matter than open-cut mines.
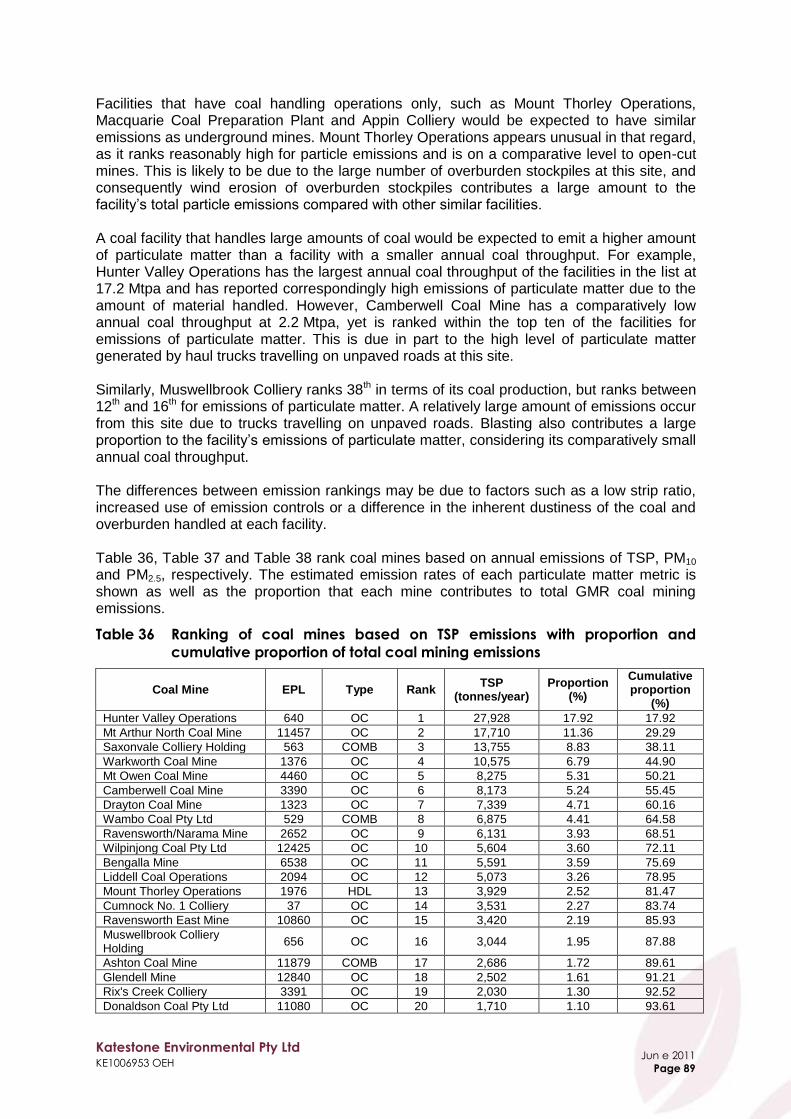
Katestone Environmental Pty Ltd KE1006953 OEH
Jun e 2011
Page 89
Facilities that have coal handling operations only, such as Mount Thorley Operations, Macquarie Coal Preparation Plant and Appin Colliery would be expected to have similar emissions as underground mines. Mount Thorley Operations appears unusual in that regard, as it ranks reasonably high for particle emissions and is on a comparative level to open-cut mines. This is likely to be due to the large number of overburden stockpiles at this site, and consequently wind erosion of overburden stockpiles contributes a large amount to the facility‟s total particle emissions compared with other similar facilities. A coal facility that handles large amounts of coal would be expected to emit a higher amount of particulate matter than a facility with a smaller annual coal throughput. For example, Hunter Valley Operations has the largest annual coal throughput of the facilities in the list at 17.2 Mtpa and has reported correspondingly high emissions of particulate matter due to the amount of material handled. However, Camberwell Coal Mine has a comparatively low annual coal throughput at 2.2 Mtpa, yet is ranked within the top ten of the facilities for emissions of particulate matter. This is due in part to the high level of particulate matter generated by haul trucks travelling on unpaved roads at this site. Similarly, Muswellbrook Colliery ranks 38th in terms of its coal production, but ranks between 12th and 16th for emissions of particulate matter. A relatively large amount of emissions occur from this site due to trucks travelling on unpaved roads. Blasting also contributes a large proportion to the facility‟s emissions of particulate matter, considering its comparatively small annual coal throughput. The differences between emission rankings may be due to factors such as a low strip ratio, increased use of emission controls or a difference in the inherent dustiness of the coal and overburden handled at each facility. Table 36, Table 37 and Table 38 rank coal mines based on annual emissions of TSP, PM10 and PM2.5, respectively. The estimated emission rates of each particulate matter metric is shown as well as the proportion that each mine contributes to total GMR coal mining emissions.
Table 36 Ranking of coal mines based on TSP emissions with proportion and
cumulative proportion of total coal mining emissions
Coal Mine EPL Type Rank TSP
(tonnes/year) Proportion
(%)
Cumulative proportion
(%)
Hunter Valley Operations 640 OC 1 27,928 17.92 17.92
Mt Arthur North Coal Mine 11457 OC 2 17,710 11.36 29.29
Saxonvale Colliery Holding 563 COMB 3 13,755 8.83 38.11
Warkworth Coal Mine 1376 OC 4 10,575 6.79 44.90
Mt Owen Coal Mine 4460 OC 5 8,275 5.31 50.21
Camberwell Coal Mine 3390 OC 6 8,173 5.24 55.45
Drayton Coal Mine 1323 OC 7 7,339 4.71 60.16
Wambo Coal Pty Ltd 529 COMB 8 6,875 4.41 64.58
Ravensworth/Narama Mine 2652 OC 9 6,131 3.93 68.51
Wilpinjong Coal Pty Ltd 12425 OC 10 5,604 3.60 72.11
Bengalla Mine 6538 OC 11 5,591 3.59 75.69
Liddell Coal Operations 2094 OC 12 5,073 3.26 78.95
Mount Thorley Operations 1976 HDL 13 3,929 2.52 81.47
Cumnock No. 1 Colliery 37 OC 14 3,531 2.27 83.74
Ravensworth East Mine 10860 OC 15 3,420 2.19 85.93
Muswellbrook Colliery Holding
656 OC 16 3,044 1.95 87.88
Ashton Coal Mine 11879 COMB 17 2,686 1.72 89.61
Glendell Mine 12840 OC 18 2,502 1.61 91.21
Rix's Creek Colliery 3391 OC 19 2,030 1.30 92.52
Donaldson Coal Pty Ltd 11080 OC 20 1,710 1.10 93.61

Katestone Environmental Pty Ltd KE1006953 OEH
Jun e 2011
Page 90
Coal Mine EPL Type Rank TSP
(tonnes/year) Proportion
(%)
Cumulative proportion
(%)
Bloomfield Colliery 396 OC 21 1,156 0.74 94.36
Westside Mine 4033 OC 22 1,057 0.68 95.03
Baal Bone Colliery 765 UG 23 706 0.45 95.49
Westcliff And Northcliff Collieries
2504 UG 24 687 0.44 95.93
Cullen Valley Mine 10341 OC 25 681 0.44 96.36
Pine Dale Mine 4911 OC 26 655 0.42 96.79
Newstan Colliery 395 UG 27 589 0.38 97.16
United Colliery 3141 UG 28 465 0.30 97.46
Ravensworth Underground Mine
10337 UG 29 438 0.28 97.74
The Invincible Colliery 1095 OC 30 421 0.27 98.01
Bayswater Colliery 113 OC 31 334 0.21 98.23
Macquarie Coal Preparation Plant
1360 HDL 32 320 0.21 98.43
Glennies Creek Colliery 7622 UG 33 297 0.19 98.62
Tahmoor Colliery 1389 UG 34 293 0.19 98.81
Springvale Colliery 3607 UG 35 262 0.17 98.98
Charbon Coal Pty Limited 528 UG 36 246 0.16 99.14
Clarence Colliery 726 UG 37 222 0.14 99.28
Mandalong Mine And Cooranbong Colliery
365 UG 38 186 0.12 99.40
Austar Coal Mine 416 UG 39 168 0.11 99.51
Dendrobium Mine 3241 UG 40 135 0.09 99.59
Angus Place Colliery 467 UG 41 120 0.08 99.67
Metropolitan Colliery 767 UG 42 90 0.06 99.73
West Wallsend Colliery 1360 UG 43 66 0.04 99.77
Tasman Coal Mine 12483 UG 44 64 0.04 99.81
Nre No 1 Colliery 12040 UG 45 56 0.04 99.85
Nre Wongawilli Colliery 1087 UG 46 47 0.03 99.88
Appin Colliery 758 HDL 47 45 0.03 99.91
Awaba Colliery 443 UG 48 36 0.02 99.93
Abel Underground Mine 12856 UG 49 32 0.02 99.95
Mannering Colliery 191 UG 50 23 0.01 99.96
Richmond Main East 13027 REHAB 51 23 0.01 99.98
Chain Valley Colliery 1770 UG 52 18 0.01 99.99
Berrima Colliery 608 UG 53 9 0.01 100
Ivanhoe No.2 Colliery 631 MAINT 54 2 0 100
Myuna Colliery 366 UG 55 2 0 100
Xstrata Mangoolla (Anvil Hill Mine)
12894 CONSTRT 56 1 0 100
Grand total 155,830 100.0
Table 37 Ranking of coal mines based on PM10 emissions with proportion and
cumulative proportion of total coal mining emissions
Coal Mine EPL Type Rank PM10
(tonnes/year) Proportion
(%)
Cumulative proportion
(%)
Hunter Valley Operations 640 OC 1 11,633 19.56 19.56
Mt Arthur North Coal Mine 11457 OC 2 7,524 12.65 32.22
Saxonvale Colliery Holding 563 COMB 3 4,653 7.83 40.04
Warkworth Coal Mine 1376 OC 4 3,494 5.88 45.92
Mt Owen Coal Mine 4460 OC 5 2,859 4.81 50.73
Camberwell Coal Mine 3390 OC 6 2,727 4.59 55.31
Liddell Coal Operations 2094 OC 7 2,660 4.47 59.79
Drayton Coal Mine 1323 OC 8 2,497 4.20 63.99
Wambo Coal Pty Ltd 529 COMB 9 2,166 3.64 67.63
Bengalla Mine 6538 OC 10 2,098 3.53 71.16
Mount Thorley Operations 1976 HDL 11 1,958 3.29 74.45
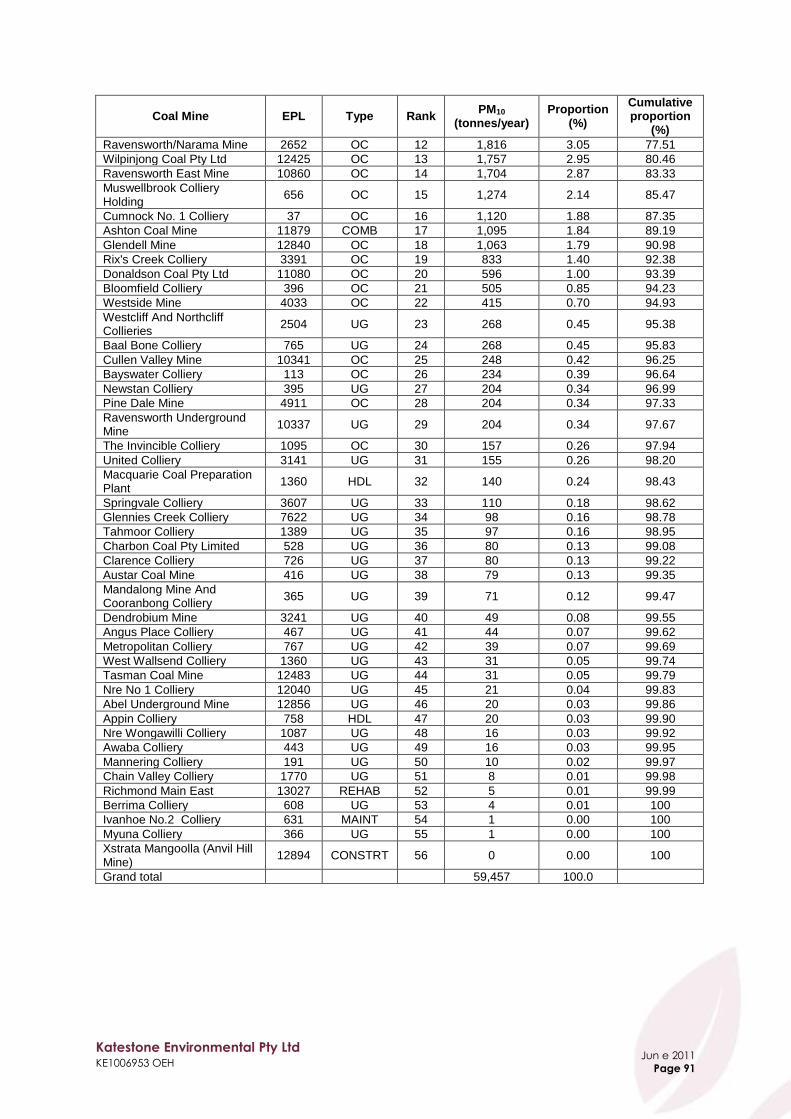
Katestone Environmental Pty Ltd KE1006953 OEH
Jun e 2011
Page 91
Coal Mine EPL Type Rank PM10
(tonnes/year) Proportion
(%)
Cumulative proportion
(%)
Ravensworth/Narama Mine 2652 OC 12 1,816 3.05 77.51
Wilpinjong Coal Pty Ltd 12425 OC 13 1,757 2.95 80.46
Ravensworth East Mine 10860 OC 14 1,704 2.87 83.33
Muswellbrook Colliery Holding
656 OC 15 1,274 2.14 85.47
Cumnock No. 1 Colliery 37 OC 16 1,120 1.88 87.35
Ashton Coal Mine 11879 COMB 17 1,095 1.84 89.19
Glendell Mine 12840 OC 18 1,063 1.79 90.98
Rix's Creek Colliery 3391 OC 19 833 1.40 92.38
Donaldson Coal Pty Ltd 11080 OC 20 596 1.00 93.39
Bloomfield Colliery 396 OC 21 505 0.85 94.23
Westside Mine 4033 OC 22 415 0.70 94.93
Westcliff And Northcliff Collieries
2504 UG 23 268 0.45 95.38
Baal Bone Colliery 765 UG 24 268 0.45 95.83
Cullen Valley Mine 10341 OC 25 248 0.42 96.25
Bayswater Colliery 113 OC 26 234 0.39 96.64
Newstan Colliery 395 UG 27 204 0.34 96.99
Pine Dale Mine 4911 OC 28 204 0.34 97.33
Ravensworth Underground Mine
10337 UG 29 204 0.34 97.67
The Invincible Colliery 1095 OC 30 157 0.26 97.94
United Colliery 3141 UG 31 155 0.26 98.20
Macquarie Coal Preparation Plant
1360 HDL 32 140 0.24 98.43
Springvale Colliery 3607 UG 33 110 0.18 98.62
Glennies Creek Colliery 7622 UG 34 98 0.16 98.78
Tahmoor Colliery 1389 UG 35 97 0.16 98.95
Charbon Coal Pty Limited 528 UG 36 80 0.13 99.08
Clarence Colliery 726 UG 37 80 0.13 99.22
Austar Coal Mine 416 UG 38 79 0.13 99.35
Mandalong Mine And Cooranbong Colliery
365 UG 39 71 0.12 99.47
Dendrobium Mine 3241 UG 40 49 0.08 99.55
Angus Place Colliery 467 UG 41 44 0.07 99.62
Metropolitan Colliery 767 UG 42 39 0.07 99.69
West Wallsend Colliery 1360 UG 43 31 0.05 99.74
Tasman Coal Mine 12483 UG 44 31 0.05 99.79
Nre No 1 Colliery 12040 UG 45 21 0.04 99.83
Abel Underground Mine 12856 UG 46 20 0.03 99.86
Appin Colliery 758 HDL 47 20 0.03 99.90
Nre Wongawilli Colliery 1087 UG 48 16 0.03 99.92
Awaba Colliery 443 UG 49 16 0.03 99.95
Mannering Colliery 191 UG 50 10 0.02 99.97
Chain Valley Colliery 1770 UG 51 8 0.01 99.98
Richmond Main East 13027 REHAB 52 5 0.01 99.99
Berrima Colliery 608 UG 53 4 0.01 100
Ivanhoe No.2 Colliery 631 MAINT 54 1 0.00 100
Myuna Colliery 366 UG 55 1 0.00 100
Xstrata Mangoolla (Anvil Hill Mine)
12894 CONSTRT 56 0 0.00 100
Grand total
59,457 100.0

Katestone Environmental Pty Ltd KE1006953 OEH
Jun e 2011
Page 92
Table 38 Ranking of coal mines based on PM2.5 emissions with proportion and
cumulative proportion of total coal mining emissions
Coal Mine EPL Type Rank PM2.5
(tonnes/year) Proportion
(%)
Cumulative proportion
(%)
Hunter Valley Operations 640 OC 1 2,322 22.58 22.58
Mt Arthur North Coal Mine 11457 OC 2 1,089 10.59 33.16
Saxonvale Colliery Holding 563 COMB 3 720 7.00 40.17
Warkworth Coal Mine 1376 OC 4 507 4.93 45.09
Liddell Coal Operations 2094 OC 5 492 4.78 49.88
Mt Owen Coal Mine 4460 OC 6 470 4.57 54.45
Camberwell Coal Mine 3390 OC 7 447 4.35 58.79
Ravensworth East Mine 10860 OC 8 418 4.06 62.86
Mount Thorley Operations 1976 HDL 9 385 3.74 66.60
Drayton Coal Mine 1323 OC 10 356 3.46 70.06
Ravensworth/Narama Mine 2652 OC 11 348 3.38 73.45
Muswellbrook Colliery Holding
656 OC 12 333 3.24 76.68
Bengalla Mine 6538 OC 13 333 3.24 79.92
Wambo Coal Pty Ltd 529 COMB 14 298 2.90 82.82
Wilpinjong Coal Pty Ltd 12425 OC 15 278 2.70 85.52
Glendell Mine 12840 OC 16 270 2.63 88.15
Ashton Coal Mine 11879 COMB 17 206 2.00 90.15
Rix's Creek Colliery 3391 OC 18 150 1.46 91.61
Cumnock No. 1 Colliery 37 OC 19 141 1.37 92.98
Donaldson Coal Pty Ltd 11080 OC 20 99 0.96 93.94
Bloomfield Colliery 396 OC 21 93 0.90 94.85
Westside Mine 4033 OC 22 81 0.79 95.63
Baal Bone Colliery 765 UG 23 43 0.42 96.05
Bayswater Colliery 113 OC 24 42 0.41 96.46
Cullen Valley Mine 10341 OC 25 40 0.39 96.85
Ravensworth Underground Mine
10337 UG 26 38 0.37 97.22
Westcliff And Northcliff Collieries
2504 UG 27 37 0.36 97.58
Pine Dale Mine 4911 OC 28 28 0.27 97.85
The Invincible Colliery 1095 OC 29 24 0.23 98.08
Macquarie Coal Preparation Plant
1360 HDL 30 23 0.22 98.31
Newstan Colliery 395 UG 31 23 0.22 98.53
United Colliery 3141 UG 32 19 0.18 98.72
Springvale Colliery 3607 UG 33 15 0.15 98.86
Austar Coal Mine 416 UG 34 15 0.15 99.01
Tahmoor Colliery 1389 UG 35 12 0.12 99.12
Glennies Creek Colliery 7622 UG 36 11 0.11 99.23
Abel Underground Mine 12856 UG 37 11 0.11 99.34
Clarence Colliery 726 UG 38 10 0.10 99.44
Charbon Coal Pty Limited 528 UG 39 10 0.10 99.53
Mandalong Mine And Cooranbong Colliery
365 UG 40 9 0.09 99.62
Dendrobium Mine 3241 UG 41 7 0.07 99.69
Angus Place Colliery 467 UG 42 6 0.06 99.75
Tasman Coal Mine 12483 UG 43 5 0.05 99.80
Metropolitan Colliery 767 UG 44 4 0.04 99.83
West Wallsend Colliery 1360 UG 45 3 0.03 99.86
Nre No 1 Colliery 12040 UG 46 3 0.03 99.89
Nre Wongawilli Colliery 1087 UG 47 3 0.03 99.92
Appin Colliery 758 HDL 48 2 0.02 99.94
Awaba Colliery 443 UG 49 2 0.02 99.96
Mannering Colliery 191 UG 50 1 0.01 99.97
Richmond Main East 13027 REHAB 51 1 0.01 99.98
Chain Valley Colliery 1770 UG 52 1 0.01 99.99
Berrima Colliery 608 UG 53 1 0.01 100

Katestone Environmental Pty Ltd KE1006953 OEH
Jun e 2011
Page 93
Coal Mine EPL Type Rank PM2.5
(tonnes/year) Proportion
(%)
Cumulative proportion
(%)
Ivanhoe No.2 Colliery 631 MAINT 54 0 0.00 100
Myuna Colliery 366 UG 55 0 0.00 100
Xstrata Mangoolla (Anvil Hill Mine)
12894 CONSTRT 56 0 0.00 100
Grand total
10,286 100.0
7.3.5 Ranking of coalfields
Emission rates of TSP, PM10 and PM2.5 by coalfield are shown in Table 39 and Figure 41 to Figure 43. Table 39 shows that the Hunter Coalfield produces 90% of TSP, 91% of PM10 and 92% of PM2.5 associated with GMR coal mines.
Table 39 TSP, PM10 and PM2.5 emission rates by coalfield
Coalfield
TSP PM10 PM2.5
Emission rate (tonnes/year)
Proportion of total
(%)
Emission rate (tonnes/year)
Proportion of total (%)
Emission rate (tonnes/year)
Proportion of total
(%)
Hunter 140,422 90.1 54,004 90.8 9,418 91.6
Western 8,919 5.7 2,948 5.0 455 4.4
Newcastle 5,128 3.3 1,992 3.3 345 3.4
Southern 1,361 0.9 514 0.9 68 0.7
Total GMR 155,830 100.0 59,457 100.0 10,286 100.0
Gloucester 2,512 829 115
Figure 41 TSP emission rate by coalfield

Katestone Environmental Pty Ltd KE1006953 OEH
Jun e 2011
Page 94
Figure 42 PM10 emission rate by coalfield
Figure 43 PM2.5 emission rate by coalfield

Katestone Environmental Pty Ltd KE1006953 OEH
Jun e 2011
Page 95
8. Legislative Frameworks for Coal Mining
This section summarises the results of research into the regulatory frameworks for the management of particulate matter emissions from coal mining in major coal producing countries and a comparison against current practice in NSW. Countries that are members of the Organisation for Economic Co-operation and Development (OECD) were the focus of this research, but consideration was also given to the frameworks adopted in non-member countries that are major coal producers. The concept of best practice is considered and the procedures used to plan, develop and regulate coal mining activities are discussed.
8.1 Selection criteria for literature review
The review of legislative frameworks for the management of air quality in coal mining regions was undertaken using a number of selection criteria. The NSW legislative framework was compared to other Australian states in addition to international jurisdictions by considering the:
Level of economic development in the country including membership of the Organisation for Economic Co-operation and Development (OECD)
Quantity of coal produced by the country or region and rank in world coal production
Approaches taken in different geographical regions of the world
Level of environmental management and regulation in the country or region including extent of legislative framework
Historical development of environmental management and regulation in the country or region
Availability and transparency of legislative framework documentation (rated primarily on accessibility of information provided on government websites)
The criteria have been developed into a selection matrix as presented in Table 40.

Katestone Environmental Pty Ltd KE1006953 OEH
June 2011
Page 96
Table 40 Selection matrix for the review of legislative frameworks in air quality management for coal mining countries and regions
Region Country or region Coal production
2009 [MTPA] (rank)
OECD member
Extent of environmental framework
Accessibility to legislation Included in review
process
Asia China 3050.0 (1) No Moderate to high Inconsistent due to language
barrier Yes
North America
United States
973.2 (2) Yes Very high
Federal and State Very good
Federal and State
Yes
Wyoming/ Powder River Basin
Yes
West Virginia/ Appalachia
Yes
Arizona/ Western region Yes
Asia India 557.6 (3) No Not determined Not determined No
Oceania
Australia
409.2 (4) Yes High
Federal and State Good
Federal and State
Yes
Queensland Yes
Victoria Yes
Europe Russia 298.1 (5) No Moderate Inconsistent due to language
barrier No
Asia Indonesia 252.5 (6) No Moderate Poor to moderate No
Africa South Africa 250.0 (7) No Moderate to high Good Yes
Europe Germany 183.7 (8) Yes High Good Yes
Europe Poland 135.1 (9) Yes Not determined Not determined No
Europe Kazakhstan 101.5 (10) No Not determined Not determined No
Europe Turkey 84.3 (11) Yes Not determined Not determined No
Europe Ukraine 73.7 (12) No Not determined Not determined No
South America
Columbia 72.1 (13) No Not determined Not determined No
North America
Canada
62.9 (14) Yes High
Federal and Provincial/Territorial
Good Federal and
Provincial/Territorial
Yes
Ontario Yes
Quebec Yes
British Columbia Yes
Alberta Yes
Europe Greece 62.7 (15) Yes Not determined Not determined No
Europe Czech Republic 53.3 (16) Yes Not determined Not determined No
Asia Vietnam 45.0 (17) No Not determined Not determined No
Europe United Kingdom 17.9 (21) Yes Not determined Not determined Yes
Europe Spain 10.2 (23) Yes Not determined Not determined No
South America
Brazil 5.1 (25) No Not determined Not determined No
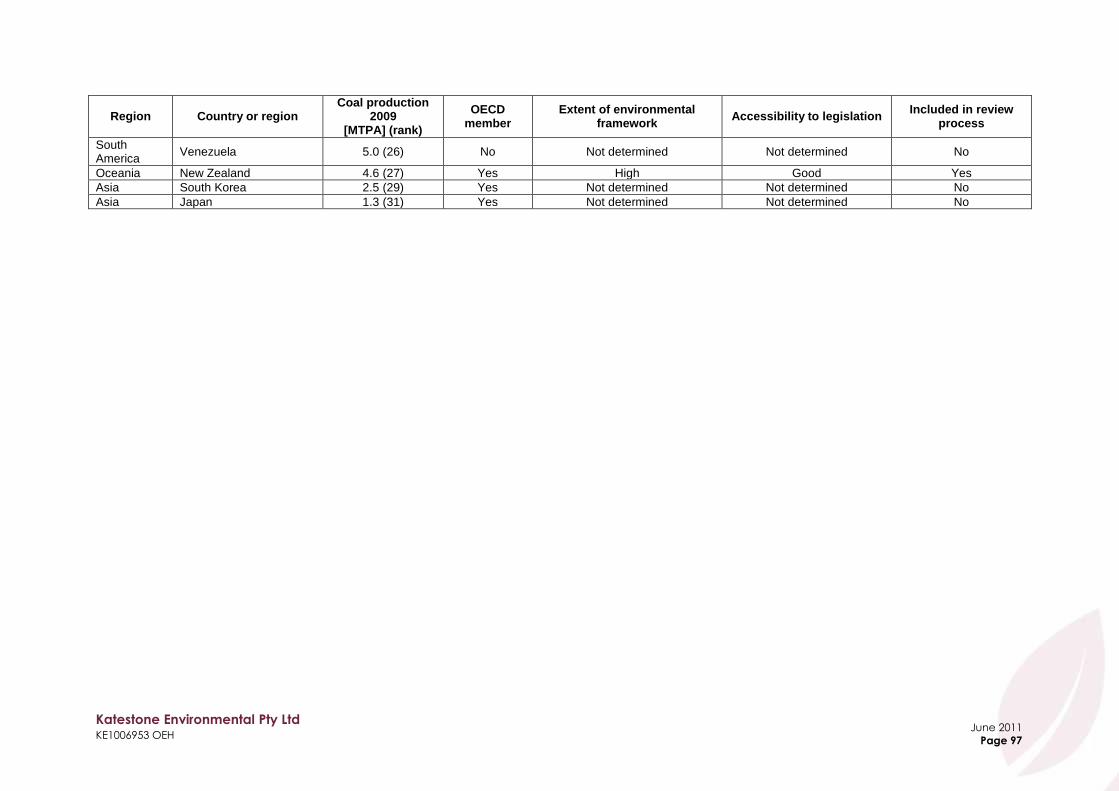
Katestone Environmental Pty Ltd KE1006953 OEH
June 2011
Page 97
Region Country or region Coal production
2009 [MTPA] (rank)
OECD member
Extent of environmental framework
Accessibility to legislation Included in review
process
South America
Venezuela 5.0 (26) No Not determined Not determined No
Oceania New Zealand 4.6 (27) Yes High Good Yes
Asia South Korea 2.5 (29) Yes Not determined Not determined No
Asia Japan 1.3 (31) Yes Not determined Not determined No

Katestone Environmental Pty Ltd KE1006953 OEH
June 2011
Page 98
8.2 Definitions of best practice
The concept of best practice attempts to incorporate various technical, logistical, economic, environmental and managerial considerations of the methods of production into a balanced and optimal outcome for all stakeholders. The degree of emphasis placed on each of these elements, depends on the risk posed by an activity or pollutant. The emission of highly toxic air pollutants that bio-accumulate and/or are carcinogenic (such as dioxins and furans) are commonly required to be minimised to the maximum extent achievable with a strong emphasis on avoidance, technology, diligent management and environmental considerations, but to a lesser extent on economic considerations. For air pollutants that are considered to have a lower risk and reversible effects, there may be greater acceptance of some minor degradation of air quality provided that an ongoing minimisation is achieved and operation occurs within the environmental legislation. In the NSW air quality regulatory framework, concepts of best practice are used, but the term “best practice” does not explicitly appear in the legislation. For pollutants such as particulate matter with no safe level of exposure, best practice is the guiding principle in meeting an objective of the Protection of the Environment Operations Act 1997 (POEO Act)22, which is to reduce the risks to human health by reducing emissions to harmless levels (Chapter 1, Section 3). Best practice is also the guiding principle in meeting the general air pollution provisions of the POEO Act. Sections 124 to 126 of the POEO Act require that air pollution related activities be conducted in a proper and efficient manner, while section 128 requires that all necessary practicable means are used to prevent or minimise air pollution. Section 128 of the POEO Act makes it an offence to emit air pollutants from a point that exceeds a limit prescribed in a regulation defined under the POEO Act. One air quality regulation exists under the act, the Protection of the Environment Operations (Clean Air) Regulation 200244 (Clean Air Regulation). While the Clean Air Regulation prescribes a minimum level of performance, it can be made tighter through Environment Protection Licence (EPL) conditions. The Clean Air Regulation is an example of the application of best practice, because it applies a minimum standard of performance that has been developed for the NSW context with reference to international regulation and literature, is updated periodically and is applied regardless of the local circumstances that might otherwise permit a lower level of emission control (e.g. remoteness from sensitive land-use). Compliance with the Clean Air Regulation is sufficient in the majority of circumstances to ensure that there is a low risk of impact on air quality and that air quality standards are met by a reasonable margin. Tighter limits than the regulation are usually only required where there is a regional cumulative air quality problem such as photochemical smog or particle pollution. For sources of air pollutants not covered by a regulation, Section 128 of the POEO Act also states:
“...the occupier of any premises must carry on any activity, or operate any plant, in or on the premises by such practicable means as may be necessary to prevent or minimise air pollution.”
This section may also be considered to require best practice that is equivalent to that applied to point sources in NSW through the Clean Air Regulation. Most EPL conditions for coal mines restate this requirement (Section 4).

Katestone Environmental Pty Ltd KE1006953 OEH
June 2011
Page 99
The concept of minimising emissions to the maximum extent achievable is referred to in the Approved Methods for the Modelling and Assessment of Air Pollutants in NSW45 (Approved Methods for Modelling), in reference to toxic air pollutants, which states:
“Principal toxic air pollutants must be minimised to the maximum extent achievable through the application of best-practice process design and/or emission controls. Decisions with respect to achievability will have regard to technical, logistical and financial considerations. Technical and logistical considerations include a wide range of issues that will influence the feasibility of an option: for example, whether a particular technology is compatible with an enterprise's production processes. Financial considerations relate to the financial viability, of an option. It is not expected that reductions in emissions should be pursued 'at any cost'. Nor does it mean that the preferred option will always be the lowest cost option. However it is important that the preferred option is cost-effective. The costs need to be affordable in the context of the relevant industry sector within which the enterprise operates. This will need to be considered on a case-by-case basis through discussions with the EPA”
No guidelines exist in NSW that might allow Section 128 of the POEO Act to be interpreted consistently across coal mining activities. Conditions of approval for coal mining activities that are issued by the Department of Planning do not require mining operations to demonstrate the implementation of best practice controls. Rather, the standard conditions in relation to air quality require that the activity does not cause additional exceedances of air quality standards. Although, in relation to blasting activities most new approvals contain the following condition (emphasis added):
9. During mining operations on site, the Proponent shall implement best blasting practice to: (a) protect the safety of people, property, public infrastructure, and
livestock; and (b) minimise the dust and fume emissions from blasting at the project, to
the satisfaction of the Director-General. In Victoria, the State Environment Protection Policy (Air Quality Management) (SEPP(AQM))46 provides a framework for the management of emissions from industry to the air environment while ensuring that air quality objectives are met. The SEPP(AQM) introduces the concept of best practice and Maximum Extent Achievable (MEA) for the mining industry through the Protocol for Environmental Management - Mining and Extractive Industries (PEM)47. The PEM defines best practice as:
“the best combination of eco-efficient techniques, methods, processes or technology used in an industry sector or activity that demonstrably minimises the environmental impact of a generator of emissions in that industry sector or activity”
MEA is defined in the SEPP(AQM)46 as:
“a degree of reduction in the emission of wastes from a particular source that uses the most effective, practicable means to minimise the risk to human health from those emissions and is at least equivalent to or greater than that which can be achieved through application of best practice”
The European Parliament, according to Directive 2008/1/EC48, has adopted the concept of best available techniques (BAT) in the Integrated Pollution Prevention and Control BAT Reference Documents49. The documents provide a guideline for the control and management of emissions from a range of industrial activities. Relevant to this study is

Katestone Environmental Pty Ltd KE1006953 OEH
June 2011
Page 100
Management of Tailings and Waste-Rock in Mining Activities49 (referred to as the Tailings BREF). A definition of best available techniques is provided in Article 2 of the Directive48, and states:
"best available techniques" means the most effective and advanced stage in the development of activities and their methods of operation which indicate the practical suitability of particular techniques for providing in principle the basis for emission limit values designed to prevent and, where that is not practicable, generally to reduce emissions and the impact on the environment as a whole:
(a) "techniques" shall include both the technology used and the way in which
the installation is designed, built, maintained, operated and decommissioned
(b) "available techniques" means those developed on a scale which allows
implementation in the relevant industrial sector, under economically and technically viable conditions, taking into consideration the costs and advantages, whether or not the techniques are used or produced inside the Member State in question, as long as they are reasonably accessible to the operator
(c) "best" means most effective in achieving a high general level of protection
of the environment as a whole The concept of best available control technology (BACT) is incorporated into the United States federal regulatory framework and promulgated in the Clean Air Act 199050 under the regulation: 40 CFR Part 60 Standards of Performance for New Stationary Sources51. In accordance with the Act, the United States Environmental Protection Agency (US EPA) determines the emission limit, and appropriate air pollution control technology to achieve that limit, on a case by case basis. The BACT is selected based on factors such as energy consumption, source emissions, air quality impact and economic costs of implementation and operation. The BACT standard is significantly more stringent than the Reasonably Available Control Technology (RACT) standard but less stringent than the Lowest Achievable Emission Rate (LAER) standard. The LAER standard is applied to the assessment of new sources planned for development in non-attainment areas to determine whether they are acceptable under State Implementation Plan (SIP) guidelines.
8.3 Air quality management, regulation and administration of coal mining
Government administration of coal mining operations varies across the major coal producing countries. Mining legislation is promulgated and administered at either federal or state/provincial government levels, or a combination of both, while in some jurisdictions local government in mining areas have developed their own legislation and management framework. Legislation that regulates mining activities may also be promulgated by different government departments that administer mining, natural resource management, the environment, industrial relations and public health and safety. These departments may be at the federal or state government levels and result in apparent legislative overlap.

Katestone Environmental Pty Ltd KE1006953 OEH
June 2011
Page 101
8.3.1 Australia
In Australia, air quality management is administered at the federal and state/provincial government levels. In Australia, the National Environment Protection Council (NEPC) has set air quality standards for six criteria pollutants including particulate matter, promulgated under the National Environment (Ambient Air Quality) Measure (Ambient Air Quality NEPM)18. The state environmental regulatory bodies are responsible for setting ambient air quality objectives and assessment criteria to manage air quality issues associated with emissions from industry and other major sources.
8.3.2 New South Wales
In NSW, environmental protection from the effects of coal mining is primarily administered under the Protection of the Environment (Operations) Act 199722 (POEO Act). The POEO Act provides a framework for the:
Development of Protection of the Environment Policies
Licensing by OEH of activities that are defined under Schedule 1 of the POEO Act
Development of regulations and guidelines that promulgate impact assessment criteria and emission standards for industry
Definition of offences and penalties in relation to air pollution under Sections 124-129
Provision of a mechanism for public participation in the environmental assessment of activities that may be licensed by OEH, in conjunction with the Environmental Planning and Assessment Act 197952 (EP&A Act)
Air quality assessment criteria are promulgated by OEH in the Approved Methods for Modelling45, which lists the statutory methods and air quality criteria that are to be used to model and assess emissions and impacts of air pollutants from stationary sources in New South Wales. The Approved Methods for Modelling provide air quality assessment criteria for TSP, PM10 and dust deposition rates.
8.3.3 Queensland
Queensland‟s primary legislation for environmental regulation is the Environmental Protection Act 199453 (Qld EP Act). The object of the Qld EP Act is to protect Queensland‟s environment while allowing for development that improves the total quality of life both now and in the future, in a way that maintains the ecological processes on which life depends. In particular, the Qld EP Act:
Gives the Environment Minister the power to create Environmental Protection Policies such as the Environment Protection (Air) Policy 200854(Air EPP)
Defines the framework for licensing Environmentally Relevant Activities (ERA). ERAs are defined in Schedule 1 of the Environmental Protection Regulation 199855
Defines environmental harm, the offences of causing environmental harm and penalties
In conjunction with the Sustainable Planning Act 200956, defines the framework for the approval of new ERAs
Defines best practice environmental management
Defines the general environmental duty The Air EPP specifies air quality indicators and objectives for the air environment of Queensland. In addition to reporting in accordance with the requirements of the Ambient Air

Katestone Environmental Pty Ltd KE1006953 OEH
June 2011
Page 102
Quality NEPM18, the Queensland Government has adopted the Ambient Air Quality NEPM standards for the six criteria air pollutants (including PM10) and the advisory reporting standards for PM2.5 as objectives in the Air EPP.
8.3.4 Victoria
The administrative and legislative framework governing mining and extractive industries in Victoria differs from that in NSW and Queensland, with the Earth Resources Regulation Branch of the Department of Primary Industries responsible for environmental regulation under the Extractive Industries Development Act 199547, Mineral Resources Development Act 199057 and the Environment Effects Act 197858. Appropriate authorisation from the Department of Primary Industries is required in the form of a licence, work authority or work plan approval, before the following are conducted:
Mineral exploration Mining Extractive Industry
Work Plans submitted as part of the approval process for exploration and mining tenements must address environmental issues including particulate matter and air quality. Other activities associated with coal mining are regulated under the Environment Protection Act 197059 (Vic EP Act) and using licences that are issued by the Environment Protection Authority (EPA). The Vic EP Act gives the Governor in Council, on the recommendation of the EPA, the power to issue State Environment Protection Policies. The SEPP(AQM)46 establishes a framework for:
Defining the principles, approaches and measures for managing air quality at local, regional and State levels
Managing emissions
Defines three classes of air quality indicators o Class 1 indicators: common or widely distributed air pollutants which are
established as environmental indicators in the State environment protection policy (Ambient Air Quality) and may threaten the beneficial uses of both local and regional air environments
o Class 2 indicators: hazardous substances that may threaten the beneficial uses of the air environment by virtue of their toxicity, bio-accumulation or odorous characteristics
o Class 3 indicators: extremely hazardous substances that are carcinogenic, mutagenic, teratogenic, highly toxic or highly persistent, and which may threaten the beneficial uses of the air environment
o Unclassified indicators are indicators of local amenity and aesthetic enjoyment and include odour and total suspended particulates. Mining activities may affect one or more indicators in each class and may also affect amenity
Developing a program for action to protect the air environment of Victoria and achieve the regional air quality objectives contained in the SEPP(AQM)
Addressing global environmental issues Government agencies are required to apply the policy when making decisions, formulating strategies and implementing programs. The SEPP(AQM) defines the responsibilities of all Victorians, and seeks environmental improvement through regulatory measures, economic incentives and co-operative arrangements. The SEPP(AQM) requires that best practice

Katestone Environmental Pty Ltd KE1006953 OEH
June 2011
Page 103
management and controls are implemented in all circumstances. Where Class 3 indicators are likely to be emitted, emissions must be controlled to the maximum extent achievable. The SEPP(AQM) states that the Authority will employ statutory and non-statutory instruments and measures to implement the SEPP(AQM). This includes protocols for environmental management. The Protocol for Environmental Management: Mining and Extractive Industries47 (PEM) is an incorporated document of the SEPP(AQM). The PEM supports the interpretation of the SEPP(AQM) and sets out the statutory requirements for the management of emissions from mining and extractive industries. All mining and extractive industries are required to comply with the SEPP(AQM). Proposals requiring an Environment Effects Statement or an EPA Works Approval and Licence are required to make an assessment in accordance with the PEM. The Department of Primary Industries may specifically request an assessment in accordance with the PEM. The PEM specifies the requirements for conducting an air quality study to assess the potential impacts of mining and extractive industries, including:
Assessment criteria
Level of assessment – depending on the scale or size of the operation and the location of the site
Monitoring requirements for impact assessment
Modelling methodology
8.3.5 United States
In contrast to the combination of both federal and state government frameworks used in Australia, the United States has a more top down approach to environmental and industrial legislation and administration. Industrial and environmental regulation is incorporated into United States Code of Federal Regulation that is administered by Congress. The state governments are then mandated to enact and administer the federal code. Coal mining is administered by the Office of Surface Mining Reclamation and Enforcement (OSM) within the federal government Department of the Interior. OSM‟s role is to enforce mining laws, „balance the need to protect the environment from the adverse effects of surface coal mining with the Nation's need for coal as an essential energy source‟ and ensure that „coal mining operations are conducted in an environmentally responsible manner and that the land is adequately reclaimed during and following the mining process‟. These objectives are administered by OSM under the Surface Mining Control and Reclamation Act 197760 (SMCRA). OSM developed a nationwide program incorporating state governments and Indian Tribes to achieve its goals of assuring the protection of citizens and the environment from the adverse effects of coal mining and to restore the land to beneficial use when the mining operations ceased. OSM and its partners are also responsible for reclaiming and restoring lands and water degraded by mining operations prior to 1977. The primary responsibility for regulating surface coal mining activities now resides with the state jurisdiction within which the coal mining activity is taking place. OSM now performs an oversight role. In conjunction with the SMCRA, the affects of coal mining on the air environment are administered by the US EPA under the Clean Air Act 199050 (CAA). The CAA framework provides regulation for the following governance pursuant to the coal mining industry:
Title I - Air Pollution Prevention and Control o Part A –

Katestone Environmental Pty Ltd KE1006953 OEH
June 2011
Page 104
National Ambient Air Quality Standards Standards of Performance for New Stationary Sources Air quality control regions State implementation plans for national primary and secondary
ambient air quality standards Federal enforcement Non-compliance penalty Emission factors
o Part C Prevention of Significant Deterioration of Air Quality (Subpart 1 Clean
Air, Subpart 2 Visibility Protection) o Part D
Plan Requirements for Nonattainment Areas
Title II - Emission Standards for Moving Sources o Part A
Motor Vehicle Emission and Fuel Standards
Title V - Permits The CAA requires the US EPA to set the National Ambient Air Quality Standards (NAAQS)61, referred to as 40 CFR Part 50, for pollutants considered harmful to public health and the environment, that is, the criteria pollutants including PM10 and PM2.5. The states are then obliged to set air quality standards for regional air quality management and application in the development approval process at a level equivalent to, or more stringent, than the NAAQS. In accordance with the CAA, the EPA is required to classify regions across the United States under the Prevention of Significant Deterioration (PSD) regulations into areas that have or have not attained the NAAQS for all pollutants. Areas that do not meet the air quality standards for one of the NAAQS criteria pollutants may be designated as non-attainment, with an area that fails to meet the NAAQS required to produce a State Implementation Plan (SIP). The SIP is an enforceable plan developed and administered at the state and local government level that details how the area will attain compliance with the NAAQS according to the CAA (Maricopa County, 2010)62. The CAA also provides for Standards of Performance for New Stationary Sources63 regulations including the Standards of Performance for Coal Preparation Plants promulgated under 40 CFR Part 60 Subpart Y51. The regulations ensure that BACT standards are implemented into the design, construction and operation of the facility or source being developed. The standards of performance comprise emission limits and the measurement and monitoring requirements to assess compliance. The standards of performance are then included in the permit for the source in accordance with the requirements of the CAA. The two primary coal producing states in the United States are Wyoming (Powder River Basin) and West Virginia (Appalachia Region). In Wyoming, the Wyoming Department of Environmental Quality (WDEQ) promulgated the Wyoming Air Quality Standards and Regulations64 (WAQS&R) that provide the legislative framework for regulating air quality management issues such as those associated with the coal mining industry. In West Virginia, coal mining and the related air quality affects are administered by the Department of Environmental Protection (WVDEP), Division of Mining and Reclamation under the West Virginia Coal Surface Reclamation Mining Rule65 (38 CSR 2) and the Division of Air Quality under the West Virginia Air Pollution Control Act66. In general, the Wyoming and West Virginia legislature have adopted the requirements of the federal CAA. The WDEQ and WVDEP manage the attainment of air quality standards and SIPs in the coal mining regions and the approval and permitting of coal mines and emission sources.

Katestone Environmental Pty Ltd KE1006953 OEH
June 2011
Page 105
8.3.6 Canada
In Canada, mining is administered at both the federal and provincial/territorial government level. The federal government has the authority over uranium mining, mining activities in two of the three territories and offshore, mining of federal lands, and fiscal responsibilities to stimulate investment, encourage production and enhance competitiveness and trade. Some of the federal responsibilities related to fisheries, protected areas and the environment also apply to mining projects. The provincial governments are responsible for managing resources, making land-use decisions, issuing licences and permits, conducting monitoring of activities, collecting mining royalties and provincial taxes and health and safety (United Nations, 2010)67. At the federal government level, no single mining law exists, with federal legislation of mining pursuant to the Canadian Environmental Protection Act 199968 (CEPA), Canadian Environmental Assessment Act69 (CEAA), Fisheries Act70, Navigable Waters Act71 and Migratory Birds Act72. Federal regulations relevant to the management of environmental effects associated with mining are largely focussed on mine effluent and its impacts on natural waterways and aquatic ecosystems, i.e. fisheries. Health and safety of mining industry workers is regulated under the Canadian Labour Code Part II73, including the duties of employers, employees and the establishment of the Coal Mining Safety Commission. The CEPA is the primary element of the legislative framework for protecting the Canadian environment and human health and allows the federal government to regulate and control substances through national quality objectives, guidelines and/or standards. In regard to mining developments, proposed projects are carefully assessed in accordance with the framework promulgated in the CEAA to ensure compliance with environmental and human health standards before permit approval is granted. The Canadian federal government sets “...the National Ambient Air Quality Objectives on the basis of recommendations from the Federal-Provincial Working Group on Air Quality Objectives and Guidelines consisting of representatives from both Canadian health and environment departments. Objectives may be promulgated by Environment Canada and/or Health Canada under the CEPA, Part 1, Section 8, and adopted by provincial and territorial jurisdictions for enforcement as standards” (CNAAQO, 199968). The CEPA provides objectives for the protection of three levels of environmental values which encompass the environment and human health. The three levels of objectives are referred to as: Desirable, Acceptable and Tolerable. The CEPA includes Desirable, Acceptable and Tolerable objectives for TSP, while a single Reference Level is set for PM2.5. Canadian provincial and territorial governments are responsible for many aspects of air pollution control and regulation. However, air quality management regulation is integrated under the CEPA. In Ontario, coal mining activities are administered by the Mines and Minerals Division of the Ministry of Northern Development, Mines and Forestry, in accordance with various provincial laws including the Mining Act 199074. Environmental protection regulation and the Ambient Air Quality Criteria75 in the province have been developed by the Ontario Ministry of Environment (MOE) in accordance with the Ontario Environmental Protection Act 199076. Regulations and assessments made in accordance with the Environmental Protection Act are administered by the MOE. In Quebec, legislation providing for ambient air standards is administered by the Ministère du Développment durable, de l‟Environnement et des Parcs and promulgated under the Environmental Quality Act77 (EQA). The Ministry has also promulgated general emission standards for particulate matter under the EQA. These emission standards for particulate

Katestone Environmental Pty Ltd KE1006953 OEH
June 2011
Page 106
matter are relevant to industrial development but not specifically designed for the coal mining industry. In British Columbia, coal mining and its related environment effects are administered by the Ministry of Energy, Mines and Petroleum Resources and the Ministry of Environment under provincial legislation including the Mines Act (including Health, Safety & Reclamation Code & Mineral Exploration Code)78, Environmental Assessment Act79, Environment and Land Use Act80, Environment Management Act81and Health Act82. In Alberta, coal mining activities are administered by the Ministry of Energy under the Mines and Minerals Act 200083 (MMA) and the Mines and Minerals Administration Regulation84. Administration of portions of the MMA is shared with the Sustainable Resource Development Department85. Environmental legislation relevant to the mining industry includes Environmental Protection and Enhancement Act86, Environmental Assessment (Mandatory and Exempted Activities) Regulation87 and Environmental Assessment Regulation87.
8.3.7 European Union
In Europe, the characteristics of air pollution dispersion and the spatial distribution of the countries and their populations result in the sharing of air quality impacts between neighbours. Consequently, the European Commission has worked to unify the ambient air quality standards and objectives of its member states. The Parliament of the European Union (EU), under Directive 96/62/EC 199688, outlined a framework for the assessment and management of ambient air quality throughout the member states. The Directive describes the following: Articles -
1. Objectives 2. Definitions 3. Implementation and responsibilities 4. Setting of limit values and alert thresholds for ambient air 5. Preliminary assessment of ambient air quality 6. Assessment of ambient air quality 7. Improvement of ambient air quality 8. Measures applicable in zones where levels are higher than the limit value 9. Requirements in zones where the levels are lower than the limit value 10. Measures applicable in the event of the alert thresholds being exceeded
Annex
1. List of atmospheric pollutants to be taken into consideration in the assessment and management of ambient air quality
2. Factors to be taken into consideration when setting limit values and alert thresholds 3. Guidelines for selecting air pollutants for consideration 4. Information to be included in the local, regional or national programmes for the
improvement in the ambient air quality In 2008, a new Directive 2008/50/EC89 on ambient air quality and cleaner air for Europe was promulgated. Directive 2008/50/EC includes the following key elements:
The merging of most of the existing legislation into a single directive (except for the fourth daughter directive) with no change to existing air quality objectives.
New air quality objectives for PM2.5 (fine particles) including the limit value and exposure related objectives – exposure concentration obligation and exposure reduction target.
The possibility to discount natural sources of pollution when assessing compliance against limit values.
Katestone Environmental Pty Ltd KE1006953 OEH
June 2011
Page 107
The possibility for time extensions of three years (PM10) for complying with limit values, based on conditions and the assessment by the European Commission.
The EU Member States were given two years to transpose the new Directive into national legislation, with the existing legislation in force in the interim period. Some provisions of the new Directive such as PM2.5 monitoring requirements were to be implemented sooner. Other legislation relevant to particulate matter:
1. Council Directive 96/62/EC88 on ambient air quality assessment and management is commonly referred to as the Air Quality Framework Directive. It describes the basic principles as to how air quality should be assessed and managed in the Member States. It lists the pollutants for which air quality standards and objectives will be developed and specified in legislation.
2. Council Directive 1999/30/EC88 relating to limit values for particulate matter in ambient air. The directive is the so-called "First Daughter Directive". The directive describes the numerical limits and thresholds required to assess and manage air quality impacts for particulate matter. It addresses both PM10 and PM2.5 but only establishes monitoring requirements for fine particles.
3. Council Decision 97/101/EC88 establishing a reciprocal exchange of information (EoI) and data from networks and individual stations measuring ambient air pollution within the Member States. This "EoI Decision" describes the procedures for the dissemination of air quality monitoring information by the Member States to the Commission and to the public.
4. Commission Decision 2004/461/EC90 laying down a questionnaire for annual reporting on ambient air quality assessment under Council Directives 96/62/EC and 1999/30/EC and under Directives 2000/69/EC88 and 2002/3/EC88 of the European Parliament and of the Council. This decision specifies the format and content of Member States' Annual Report on ambient air quality in their territories.
8.3.8 Germany
In Germany, the federal government has developed a comprehensive legislative framework in the area of mining law, „implementing integrated risk prevention through an inter-media approach with strict requirements on concessions, health and safety, environment and other issues as well as differentiated mechanisms for compliance and monitoring‟. Mining legislation comprises a series of laws and ordinances, providing for a uniform law supervised by one single administration. This legislation includes Federal Mining Act 198091 (FMA), Federal General Mining Ordinance 199592, Health and Safety Mining Ordinance 199192 and Ordinance on the Environmental Impact Assessment of Mining Projects 199093. The German system has also been strengthened during the past thirty years through the transfer of new European legislation on concessions, environment and health and safety in the extractive industries into the German legislation. These include the transposition of the European Union‟s Environmental Impact Assessment Directive 85/337/EEC94 and Mining Waste Directive 2006/21/EC95 for the mining sector within the procedures of mining law, rather than in general environmental law through an amendment of the FMA and an additional ordinance92. The monitoring of compliance with the provisions of mining law is administered by the mining authority. The authority can order the implementation of the measures required to comply with mining laws and ordinances and for the mitigation of associated risks.

Katestone Environmental Pty Ltd KE1006953 OEH
June 2011
Page 108
The framework for ambient air quality assessment and management is promulgated under the Federal Immission Control Act (Technical Instructions on Air Quality Control) 199096 (TA Luft). Ambient air quality standards are promulgated for PM10 concentrations and dust deposition.
8.3.9 New Zealand
In New Zealand, the allocation of rights to prospect, explore or mine minerals or coal that is owned by the Crown is administered by Crown Minerals, a Department of the Ministry of Economic Development97, under the Crown Minerals Act 199198. Crown Minerals issue permits to proponents seeking to prospect, explore or mine minerals or coal. Environmental issues relating to mining are administered under the Resource Management Act 199199, with local government authorities managing resource consents required under the Act. This process is separate from obtaining a permit for mineral rights under the Crown Minerals Act. The purpose of the Resource Management Act is to promote sustainable management of natural and physical resources, including use and development. Notwithstanding the issuance of a permit under the Crown Minerals Act or consent under the Resource Management Act, neither provides the right of access to the land in which the exploitable resource is situated. Land access is determined by direct negotiation with the land owner. Prior to commencing ay work on the ground, an applicant must ascertain and obtain what is required in terms of:
A minerals permit from Crown Minerals under the Crown Minerals Act
An access arrangement from the land owner and occupier
Resource Consent(s) from either the District Council or the Regional Council under the Resource Management Act 1991
The Crown Minerals Act requires the Minister of Energy to prepare minerals programs that outline the policies and regulations for the allocation of permits and collection of Crown royalties. The Crown Minerals (Minerals and Coal) Regulations 2007100 set out the requirements and procedures for explorers and miners to:
apply for a permit under the Crown Minerals Act 1991
make permit change applications
make royalty returns and payments
report to the Crown on prospecting and exploration
lodge cores and samples with the Crown The Crown Minerals (Minerals fees) Regulations 2006101 outline fees payable for the matters specified under the Crown Minerals Act for minerals and coal.
8.4 Approvals process for coal mining
The approvals process for major industrial projects such as the development of coal mining operations is broadly similar across the economically developed world. Most jurisdictions have promulgated legislation for the planning and development of major projects, with regulation in place to outline the administrative requirements for project approval and provide guidance through the process of environmental impact assessment. The administration of coal mine planning, development and assessment legislation is carried out at the federal and/or state government level, by government departments responsible for the environment or mining and resource development and in accordance with environmental and/or mining

Katestone Environmental Pty Ltd KE1006953 OEH
June 2011
Page 109
laws. Notwithstanding this, the legislative framework for coal mine development approval is broadly similar and comprises:
Provision of an exploration licence
Declaration of discovery of a new resource, application for development and initial project design
Terms of reference for the assessment of environmental impacts, provided by the regulator
Assessment of potential environmental impacts associated with the development including preparation of an environmental impact statement in consultation with stakeholders
Review of the environmental impact statement by the administrative bodies responsible for the relevant laws pursuant to coal mining in the jurisdiction and other stakeholders such as the public
Response by the proponent to issues raised during the review process
Provision of unconditional or conditional planning consent by the regulator
Provision for the negotiation of conditions before licensing
Compliance with the conditions of consent
Project approval or refusal
Application for a licence to carry out the project in accordance with the conditions of approval
Provision of a licence to carry out the mining activity in accordance with the conditions of approval and relevant environmental protection and mining regulations
Project commencement
8.4.1 New South Wales
In NSW, the Department of Planning administers the Environmental Planning and Assessment Act 197952 (EP&A Act). Applications for the development of new coal mining activities are assessed under Part 3A of the EP&A Act52. Part 3A relates to the designation and assessment of developments that are designated as Major Projects. The Major Project designation triggers the need to prepare an Environmental Assessment (EA) for approval by the Minister for Planning. At any stage of the process the Minister for Planning may request the Planning Assessment Commission (PAC) to review or advise on any aspect of a major project or a concept plan. The approvals process consists of the following major steps:
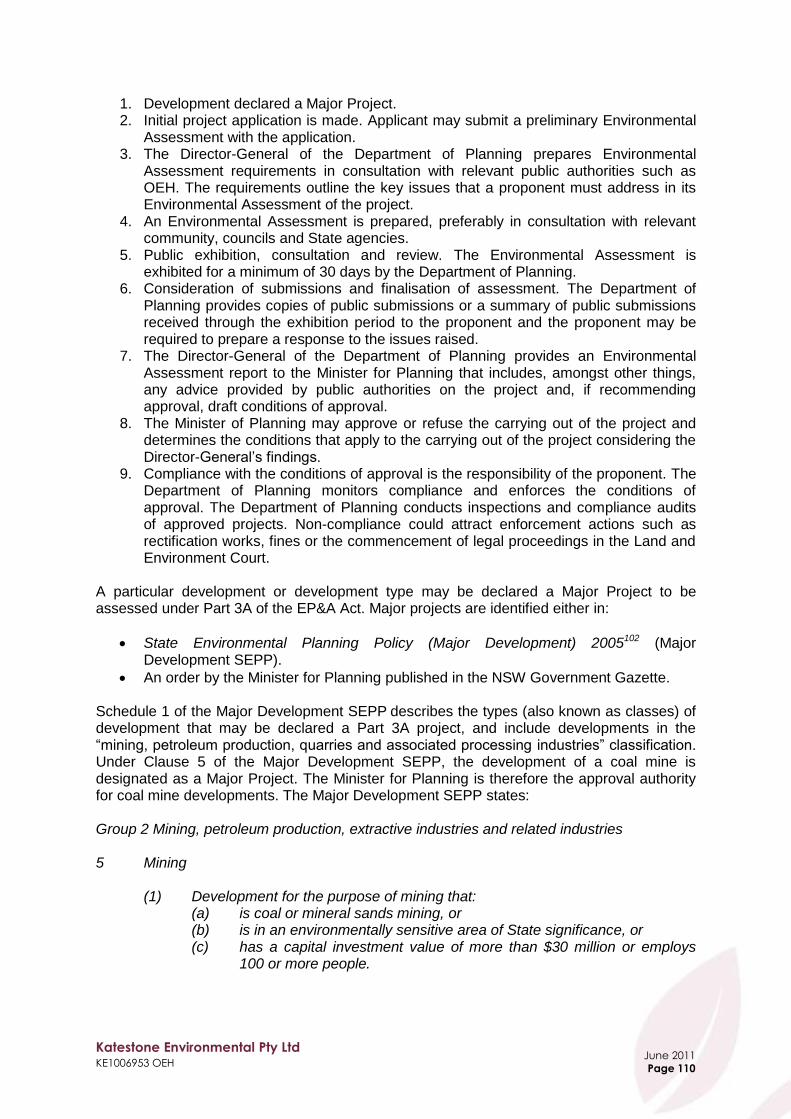
Katestone Environmental Pty Ltd KE1006953 OEH
June 2011
Page 110
1. Development declared a Major Project. 2. Initial project application is made. Applicant may submit a preliminary Environmental
Assessment with the application. 3. The Director-General of the Department of Planning prepares Environmental
Assessment requirements in consultation with relevant public authorities such as OEH. The requirements outline the key issues that a proponent must address in its Environmental Assessment of the project.
4. An Environmental Assessment is prepared, preferably in consultation with relevant community, councils and State agencies.
5. Public exhibition, consultation and review. The Environmental Assessment is exhibited for a minimum of 30 days by the Department of Planning.
6. Consideration of submissions and finalisation of assessment. The Department of Planning provides copies of public submissions or a summary of public submissions received through the exhibition period to the proponent and the proponent may be required to prepare a response to the issues raised.
7. The Director-General of the Department of Planning provides an Environmental Assessment report to the Minister for Planning that includes, amongst other things, any advice provided by public authorities on the project and, if recommending approval, draft conditions of approval.
8. The Minister of Planning may approve or refuse the carrying out of the project and determines the conditions that apply to the carrying out of the project considering the Director-General‟s findings.
9. Compliance with the conditions of approval is the responsibility of the proponent. The Department of Planning monitors compliance and enforces the conditions of approval. The Department of Planning conducts inspections and compliance audits of approved projects. Non-compliance could attract enforcement actions such as rectification works, fines or the commencement of legal proceedings in the Land and Environment Court.
A particular development or development type may be declared a Major Project to be assessed under Part 3A of the EP&A Act. Major projects are identified either in:
State Environmental Planning Policy (Major Development) 2005102 (Major Development SEPP).
An order by the Minister for Planning published in the NSW Government Gazette. Schedule 1 of the Major Development SEPP describes the types (also known as classes) of development that may be declared a Part 3A project, and include developments in the “mining, petroleum production, quarries and associated processing industries” classification. Under Clause 5 of the Major Development SEPP, the development of a coal mine is designated as a Major Project. The Minister for Planning is therefore the approval authority for coal mine developments. The Major Development SEPP states: Group 2 Mining, petroleum production, extractive industries and related industries 5 Mining
(1) Development for the purpose of mining that: (a) is coal or mineral sands mining, or (b) is in an environmentally sensitive area of State significance, or (c) has a capital investment value of more than $30 million or employs
100 or more people.

Katestone Environmental Pty Ltd KE1006953 OEH
June 2011
Page 111
(2) Extracting a bulk sample as part of resource appraisal or a trial mine comprising the extraction of more than 20,000 tonnes of coal or of any mineral ore.
(3) Development for the purpose of mining related works (including primary processing plants or facilities for storage, loading or transporting any mineral, ore or waste material) that: (a) is ancillary to or an extension of another Part 3A project, or (b) has a capital investment value of more than $30 million or employs
100 or more people. Development consent conditions that are applied to mining activities by the Department of Planning to control the emission of particulate matter are summarised below. There are two Schedules of conditions:
Administrative Conditions
Specific Environmental Conditions Administrative conditions include:
On approval such as: (a) Timeframe of operation; (b) Total tonnage of coal extracted; and (c) Seam base, below which coal cannot be extracted.
Requirement to prepare and implement monitoring programs, management plans and an Environmental Management Strategy as approved in accordance with the conditions of this approval.
Requirement that plant and equipment used on site are: (a) Maintained in a proper and efficient condition; and (b) Operated in a proper and efficient manner.
Specific Environmental Conditions that have relevance to the control and management of particulate matter from mining activities include:
Impact Assessment Criteria as shown in Table 41, Table 42 and Table 43. Except for the air quality-affected land referred to in the development consent, the Proponent shall ensure that dust generated by the projects does not cause additional exceedances of the impact assessment criteria at any residence on privately-owned land or on more than 25 percent of any privately-owned land. For example the approval for the Wilpinjong Coal Project103.
Table 41 Long term impact assessment criteria for particulate matter used in
Department of Planning Project Approvals
Pollutant Averaging period Criterion
Total suspended particulate matter (TSP) Annual 90 µg/m³
Particulate matter < 10 µm (PM10) Annual 30 µg/m³
Table 42 Short term impact assessment criteria for particulate matter used in
Department of Planning Project Approvals
Pollutant Averaging period Criterion
Particulate matter < 10 µm (PM10) 24 hour 50 µg/m³

Katestone Environmental Pty Ltd KE1006953 OEH
June 2011
Page 112
Table 43 Long term impact assessment criteria for deposited dust used in
Department of Planning Project Approvals
Pollutant Averaging
period Maximum increase in deposited dust level
Maximum total deposited dust level
Deposited dust Annual 2 g/m²/month 4 g/m²/month
Land Acquisition Criteria as shown in Table 44, Table 45 and Table 46. If the particulate emissions that are generated by the project exceed the land acquisition criteria at any privately-owned land, the Proponent shall, upon receiving a written request for acquisition from the landowner, acquire the land in accordance with additional procedures for air quality and noise management that may be detailed in a schedule of the project approval. For example the approval for the Wilpinjong Coal Project.
Table 44 Long term land acquisition criteria for particulate matter used in
Department of Planning Project Approvals
Pollutant Averaging period Criterion
Total suspended particulate matter (TSP) Annual 90 µg/m³
Particulate matter < 10 µm (PM10) Annual 30 µg/m³
Table 45 Short term land acquisition criteria for particulate matter used in
Department of Planning Project Approvals
Pollutant Averaging
period Criterion Percentile
1 Basis
Particulate matter < 10 µm (PM10) 24-hour 150 µg/m³ 992 Total
3
Particulate matter < 10 µm (PM10) 24-hour 50 µg/m³ 98.6 Increment4
Note 1 Based on the number of block 24-hour averages in an annual period.
2 Excludes extraordinary events such as bushfires, prescribed burning, dust storms, sea fog, fire incidents, illegal activities or
any other activity agreed by the Director-General in consultation with OEH 3 Background PM10 concentrations due to all other sources plus the incremental increase in PM10 concentrations due to the mine
alone. 4 Incremental increase in PM10 concentration due to the mine alone.
Table 46 Long term land acquisition criteria for deposited dust used in Department
of Planning Project Approvals
Pollutant Averaging
period Maximum increase in deposited dust level
Maximum total deposited dust level
Deposited dust Annual 2 g/m²/month 4 g/m²/month
Additional air quality impact mitigation measures may be required to be implemented for landowners listed in the Approval. Upon receiving a written request, the Proponent must implement feasible and reasonable air quality mitigation measures such as: air conditioning and first flush drinking water collection systems.
Operating conditions: (a) Visible levels of particulate matter assessed regularly and used as a trigger to
relocate, modify or stop mining activities to minimise air quality impacts on privately owned land.
(b) Real-time monitoring assessed regularly and used as a trigger to relocate, modify or stop mining activities to ensure compliance with the impact assessment criteria.
(c) Take all practicable measures to minimise off-site odour and fume emissions generated by spontaneous combustion or blasting activities.

Katestone Environmental Pty Ltd KE1006953 OEH
June 2011
Page 113
Monitoring conditions that require the preparation and implementation of an Air Quality Monitoring Program that includes high volume air samplers, real-time monitoring of particulate matter and meteorological monitoring.
The approvals include Additional Procedures for Air Quality and Noise Management that includes the following:
A requirement to notify each landowner that is listed in the approval for Acquisition Upon Request within 1 month of approval that they have the right to require the Proponent to acquire their land at any stage of the project.
A requirement to notify the Department of Planning and affected landowners and tenants if monitoring shows exceedance of the impact assessment criteria specified in the approval, if exceedance was not predicted in the EA. A requirement that the Proponent provide quarterly monitoring results to the relevant parties until the results show that the project complies with the impact assessment criteria. The Proponent is also required to send landowners and tenants a copy of the NSW Health fact sheet “Mine Dust and You”5.
If a landowner considers that the project is exceeding the impact assessment criteria and this was not identified in the Environmental Assessment, the landowner may make a request in writing to the Department of Planning for an independent review to be conducted. Based on the results of this independent review, the Department of Planning may:
Conclude that the impact assessment criteria are not being exceeded and the independent review may be discontinued.
Require all feasible and reasonable mitigation measures to be implemented by the Proponent.
Secure a written agreement with the landowner. Require the Proponent to acquire all or part of the landowner‟s land. In the case where a number of mines contribute to exceedances of the impact
assessment criteria, then the Proponent and the other contributing mines will acquire the land on an equitable basis.
The approval contains conditions relating to Environmental Management, Monitoring, Auditing and Reporting that includes:
A requirement to prepare an Environmental Management Strategy that includes: o Keeping the community and relevant agencies informed o Managing complaints o Dispute resolution o Responding to non-compliances o Managing cumulative impacts o Monitoring o Integrating incident and reporting processes into a single system o Role, responsibility and accountability of personnel
Expectations with respect to reporting incidents
A requirement to submit an Annual Environmental Management Report annually to the Department of Planning, the Community Consultative Committee and relevant agencies. That, amongst other things:
o Identifies standards and performance measures o Describes work carried out in the last 12 months o Describes work to be carried out over the next 12 months o Summarises complaints and monitoring results o Identifies and discusses exceedances of approval and licence conditions o Describes actions being taken to ensure compliance

Katestone Environmental Pty Ltd KE1006953 OEH
June 2011
Page 114
A requirement to commission an Independent Environmental Audit of the project every 3 years to assess the environmental performance of the project and whether the project is complying with the relevant requirements in the approval and relevant mining lease and licence requirements
A requirement to operate a Community Consultative Committee
To provide copies of the following documents to relevant agencies, the Community Consultative Committee and to make the documents available on the company‟s website:
o Any strategy, plan or program required under the approval o Any audits required under the approval o The Annual Environmental Management Report (AEMR) o Monitoring results required under the approval
8.4.2 Queensland
In Queensland, environmental impact assessment may be conducted under the:
Sustainable Planning Act 200956 (SPA) Environmental Protection Act 199453 (Qld EP Act) State Development and Public Works Organisation Act 1971104 (SDPWOA)
These legislative frameworks provide for the assessment and approval of a variety of development projects, including:
Under SPA - routine building or land use change requests and major infrastructure proposals such as power stations, community infrastructure and major transport infrastructure.
Under Qld EP Act - mining, petroleum and gas activities, with an environmental impact assessment either undertaken voluntarily by the project proponent or at the request of the Queensland Minister responsible for Environment based on environmental impact assessment trigger criteria. These projects are exempt from SPA as outlined in the Mineral Resources Act 1989105 and the Petroleum and Gas Act 2004106.
Under SDPWOA - a small number of projects that may be considered significant by the Queensland Government and will require an environmental impact statement (EIS) to be prepared under the SDPWOA. These projects are generally highly important or complex projects, which require centralised government coordination of environmental assessment by the Coordinator-General.
Under the Qld EP Act terms of reference are developed that provide the minimum expectations for the scope of the EIS. DERM has published generic terms of reference that are used as the basis to develop the terms of reference. Key elements of the generic terms of reference are107:
Preparation of a description of environmental values (existing air quality, meteorology, sensitive land-uses)
Quantify potential impacts and mitigation measures The draft terms of reference are made available for a minimum period of 30 business days so that stakeholders and any member of the public can review the document and comment on what values, impacts and commitments should be considered in the EIS.

Katestone Environmental Pty Ltd KE1006953 OEH
June 2011
Page 115
When the proponent has produced the EIS, it is made available for a minimum period of 30 business days for stakeholders and the public to review the document, and to submit comments on the quality of the proponent‟s assessment and commitments. The key elements of the process under SDPWOA are as follows:
Initial advice statement – process for declaration of a significant project
Significant project declaration
Referral to Commonwealth Government (for determination if a 'controlled action' is required)
Preparation of terms of reference (public comment is provided at this stage)
Preparation of an environmental impact statement (EIS)
Review and assessment of EIS (public comment is provided at this stage)
Preparation of a supplementary EIS report (if required)
Preparation of the Coordinator-General‟s EIS evaluation report The air quality impact assessment process is guided by the terms of reference. The objectives that are specified in the Air EPP are used to determine whether potential impacts are acceptable or whether more effective controls are required to ameliorate potential impacts. Detailed technical elements of the air quality impact assessment process, such as acceptable dispersion models and characterisation of existing air quality and meteorology are not codified in Queensland. Notwithstanding the above, in the Gladstone airshed on the Central Coast of Queensland, the Queensland Government has adopted a more detailed approach to airshed planning and management. In December 1993 approximately 6,800 hectares of land at Aldoga, northwest of Gladstone, was declared a state development area. The declaration followed an extensive review of land in the Gladstone region suitable for future large-scale industrial development. In 2001, the Queensland Government commissioned the development of a modelling tool to assist air quality management and planning in the Gladstone State Development Area (GSDA). The Gladstone Airshed Modelling System (GAMS) utilises the TAPM and Calpuff dispersion models and provides a framework to allow new industrial sources to be assessed for regional air quality impacts using a consistent methodology. GAMS comprises a three-dimensional meteorological field for the region being assessed and a database of existing emissions and source characteristics for sources and air pollutants of interest. The performance of the meteorological and dispersion modelling of existing sources has been evaluated against monitoring information. New proposals can be readily incorporated into GAMS, which can be run simply and efficiently to provide an indication of the Gladstone airshed‟s capacity for development. The Queensland Government, through the Department of Infrastructure and Planning maintains the modelling system with regular updates of the models and emissions inventory.
8.4.3 United States
In the United States, every agency in the executive branch of the federal government has a responsibility to implement the National Environmental Policy Act 1969108 (NEPA). The NEPA was the first major environmental law promulgated in the United States, it established national environmental policies and is the primary legislation that requires federal agencies to undertake assessments of the environmental effects of proposed actions prior to making decisions. The NEPA was promulgated as it was recognised that the actions of the federal

Katestone Environmental Pty Ltd KE1006953 OEH
June 2011
Page 116
government could cause significant environmental effects. The Council on Environmental Quality states:
“The range of actions that cause significant environmental effects is broad and includes issuing regulations, providing permits for private actions, funding private actions, making federal land management decisions, constructing publicly-owned facilities, and many other types of actions”
The NEPA provides a process for agencies to assess the environmental and related social and economic effects of their proposed actions. The process also applies to a Federal agency‟s:
“decisions for actions, including financing, assisting, conducting, or approving projects or programs; agency rules, regulations, plans, policies, or procedures; and legislative proposals”
The primary responsibility for administering NEPA policies is vested in the Council on Environmental Quality108 (CEQ), established by Congress within NEPA. The CEQ is positioned in the Executive Office of the President and has many responsibilities, including “the responsibility to ensure that Federal agencies meet their obligations under the Act. CEQ oversees implementation of NEPA, principally through issuing and interpreting NEPA regulations that implement the procedural requirements of NEPA. CEQ also reviews and approves Federal agency NEPA procedures, approves alternative arrangements for compliance with NEPA in the case of emergencies, and helps to resolve disputes between Federal agencies and with other governmental entities and members of the public”108. “The CEQ regulations set forth minimum requirements for agencies” and also call for “agencies to create their own implementing procedures that supplement the minimum requirements based on each agency‟s specific mandates, obligations, and missions. These agency-specific NEPA procedures account for the slight differences in agencies‟ NEPA processes”108. The NEPA provides the framework for companies applying for a permit issued by a federal agency. When a coal mining company applies for a permit to develop a resource the agency that is being asked to issue the permit must evaluate the environmental effects of the permit decision under the NEPA. A primary objective of the NEPA process is to provide information on the consequences of an agency approving an action, to allow decision-makers to make informed decisions. The NEPA analyses should also consider how NEPA policy will be incorporated into the decision to the extent consistent with other considerations of national policy. The lead agency responsible for managing the NEPA process will depend on the proposed action. Large, complex projects such as coal mines may involve federal agencies as well as state, local and Tribal agencies that may take a joint leadership role in the process and share responsibilities for the management of the NEPA process, including public involvement and the preparation of documents. Cooperating agencies provide special expertise in their area with respect to the evaluation of the environmental impact of a proposed action or a reasonable alternative. Once the lead agency has developed a proposed action or received a proposal from a developer, consideration of the proposal determines one of three possible courses of assessment the agency will pursue:
1. Categorical Exclusion (CE) 2. Environmental Assessment (EA) 3. Environmental Impact Statement (EIS)

Katestone Environmental Pty Ltd KE1006953 OEH
June 2011
Page 117
The NEPA process is outlined in the flow diagram presented in Figure 44109.
Figure 44 The National Environmental Policy Act process

Katestone Environmental Pty Ltd KE1006953 OEH
June 2011
Page 118
The Council on Environmental Quality describes the three courses of action as follows109: Categorical Exclusion A Categorical Exclusion (CE) is a category of actions that the agency has determined does not individually or cumulatively have a significant effect on the quality of the human environment. Agencies develop a list of CEs specific to their operations when they develop or revise their NEPA implementing procedures in accordance with CEQ‟s NEPA regulations. A CE is based on an agency‟s experience with a particular kind of action and its environmental effects. The agency may have studied the action in previous EAs, found no significant impact on the environment based on the analyses, and validated the lack of significant impacts after the implementation. If this is the type of action that will be repeated over time, the agency may decide to amend their implementing regulations to include the action as a CE. In these cases, the draft agency procedures are published in the Federal Register, and a public comment period is required. Participation in these comment periods is an important way to be involved in the development of a particular CE. If a proposed action is included in the description provided for a listed CE established by the agency, the agency must check to make sure that no extraordinary circumstances exist that may cause the proposed action to have a significant effect in a particular situation. If there are no extraordinary circumstances indicating that the effects of the action may be significant, then the agency can proceed with the action. If the proposed action is not included in the description provided in the CE established by the agency, or there are extraordinary circumstances, the agency must prepare an EA or an EIS, or develop a new proposal that may qualify for application of a CE. When the agency does not know or is uncertain whether significant impacts are expected, the agency should prepare an EA to determine if there are significant environmental effects. Environmental Assessment The purpose of an Environmental Assessment (EA) is to determine the significance of the environmental effects and to look at alternative means to achieve the agency‟s objectives. The EA is intended to be a concise document that:
1. Briefly provides sufficient evidence and analysis for determining whether to prepare an EIS
2. Aids an agency‟s compliance with NEPA when no environmental impact statement is necessary
3. Facilitates preparation of an Environmental Impact Statement when one is necessary (CEQ NEPA Regulations, 40 C.F.R. § 1508.9)
An EA should include brief discussions of:
the need for the proposal
alternative courses of action for any proposal which involves unresolved conflicts concerning alternative uses of available resources
the environmental impacts of the proposed action and alternatives
a listing of agencies and persons consulted (CEQ NEPA Regulations, 40 C.F.R. § 1508.9(b)
Because the EA serves to evaluate the significance of a proposal for agency actions, it should focus on the context and intensity of effects that may “significantly” affect the quality of the human environment. Often the EA will identify ways in which the agency can revise the action to minimize environmental effects. When preparing an EA, the agency has discretion as to the level of public involvement. The CEQ regulations state that the agency shall involve environmental agencies, applicants, and the public, to the extent practicable, in preparing EAs. Sometimes agencies will choose to mirror the scoping and public comment

Katestone Environmental Pty Ltd KE1006953 OEH
June 2011
Page 119
periods that are found in the EIS process. Some agencies keep a notification list of parties interested in a particular kind of action or in all agency actions. Other agencies simply prepare the EA and not all agencies systematically provide information about individual EAs. The EA process concludes with either a Finding of No Significant Impact (FONSI) or a determination to proceed to preparation of an EIS. A FONSI is a document that presents the reasons why the agency has concluded that there are no significant environmental impacts projected to occur upon implementation of the action. The EA is either summarized in the FONSI or attached to it. In two circumstances, the CEQ regulations require agencies to make the proposed FONSI available for public review for 30 days. Those situations are:
if the type of proposed action hasn‟t been done before by the particular agency, or
if the action is something that typically would require an EIS under the agency NEPA procedures
If this is the case, the FONSI is usually published in the Federal Register, and the notice of availability of the FONSI will include information on how and where to provide comments. If the requirement for a 30 day review is not triggered the FONSI often will not be published in the Federal Register. It may be posted on the agency‟s website, published in local newspapers or made available in some other manner. Environmental Impact Statements A Federal agency must prepare an Environmental Impact Statement (EIS) if it is proposing a major federal action significantly affecting the quality of the human environment. The EIS process begins with publication of a Notice of Intent (NOI), stating the agency‟s intent to prepare an EIS for a particular proposal. The NOI is published in the Federal Register, and provides some basic information on the proposed action in preparation for the scoping process. The NOI provides a brief description of the proposed action and possible alternatives. It also describes the agency‟s proposed scoping process, including any meetings and how the public can get involved. The NOI will also contain an agency point of contact who can answer questions about the proposed action and the NEPA process. The scoping process is the best time to identify issues, determine points of contact, establish project schedules, and provide recommendations to the agency. The overall goal is to define the scope of issues to be addressed in depth in the analyses that will be included in the EIS. Specifically, the scoping process will:
Identify people or organizations who are interested in the proposed action
Identify the significant issues to be analyzed in the EIS
Identify and eliminate from detailed review those issues that will not be significant or those that have been adequately covered in prior environmental review
Determine the roles and responsibilities of lead and cooperating agencies
Identify any related EAs or EISs
Identify gaps in data and informational needs
Set time limits for the process and page limits for the EIS
Identify other environmental review and consultation requirements so they can be integrated with the EIS
Indicate the relationship between the development of the environmental analysis and the agency‟s tentative decision-making schedule
Federal agencies might require the proponent to pay for the preparation of analyses, but the agency remains responsible for the scope and accuracy of the analysis. An important requirement of the EA and EIS process is the investigation of alternative methods and

Katestone Environmental Pty Ltd KE1006953 OEH
June 2011
Page 120
proposals for carrying out the action, in addition to the costs and benefits of not carrying out the action and the NEPA applies when an agency has discretion to choose among one or more alternative means of accomplishing a particular goal. However, the NEPA “does not require the decision-maker to select the environmentally preferable alternative or prohibit adverse environmental effects”, as decision-makers must consider multiple issues and policy considerations such as social, economic, technical or national security interests109. The US EPA‟s Office of Federal Activities reviews EISs and some EAs issued by federal agencies and provides comments to the public by publishing summaries in the Federal Register. The US EPA‟s reviews are intended to assist federal agencies to improve their NEPA analyses and decisions.
8.4.4 Germany
In Germany, mining legislation includes various regulations and mechanisms for project development and the approvals process including compliance with, and monitoring of, health, safety and environmental performance standards. Mining activities are subject to a two-step authorisation procedure:
1. The granting of an exploration or exploitation license that confers the exclusive right to explore for or exploit the mineral resources specified in the license
2. The approval of an operations plan for mining operations ranging from the beginning of exploration to the reclamation of land surfaces used by mining. There are four kinds of operations plan including the:
o skeleton operations plan o main operations plan o special operations plan o mine closure operations plan
The provision of an exploration or exploitation license is subject to a development approvals and consultation process with the various authorities safeguarding public interests. Consultation with local government planning authorities and other groups is carried out if the mining operations plan conflicts with various interests across jurisdictions. For major mining activities, where open-cut surface mining exceeds an area of twenty five hectares, the skeleton operations plan is subject to an environmental impact assessment with the consultation of the broad public. The Federal Mining Act (1980)91 and the Ordinance on the Environmental Impact Assessment for Mining Projects (1990)93 integrate the environmental impact assessment into the skeleton operations plan procedure with specific provisions taking into account the dynamic character of mining activities. In order to guarantee the participation of the public and all stakeholders, the approval of a skeleton operations plan with an environmental impact assessment by the mining authority is subject to a formal plan approval procedure according to the German Administrative Procedure Act110. This procedure includes the processing of all necessary permits and accommodates the examination and consultation of all issues by all administrations and stakeholders.

Katestone Environmental Pty Ltd KE1006953 OEH
June 2011
Page 121
8.5 Air quality impact assessment for coal mining
8.5.1 New South Wales
In NSW, air quality impact assessments of coal mining activities are carried out in accordance with the Approved Methods for Modelling45, which lists the statutory methods for modelling and assessing emissions of air pollutants from stationary sources. The Approved Methods for Modelling is subordinate legislation promulgated under Part 4 of the Clean Air Regulation. The Approved Methods for Modelling covers the following aspects of air quality impact assessment that are specific to coal mines:
preparation of emissions inventory data
preparation of meteorological data
methods for accounting for background concentrations and dealing with elevated background concentrations
dispersion modelling methodology
interpretation of dispersion modelling results
impact assessment criteria for particulates (TSP), PM10 and deposited dust The Approved Methods for Modelling specifies two levels of impact assessment:
Level 1 – screening-level dispersion modelling technique using worst-case input data
Level 2 – refined dispersion modelling technique using site-specific input data The impact assessment levels are designed so that the impact estimates from the second level should be more accurate than the first. This means that, for a given facility, the result of a Level 1 impact assessment would be more conservative and less specific than the result of a Level 2 assessment. It is not intended that an assessment should routinely progress through the two levels. If air quality impact is considered to be a significant issue, there is no impediment to immediately conducting a Level 2 assessment. Equally, if a Level 1 assessment conclusively demonstrates that adverse impacts will not occur, there is no need to progress to Level 2. The Approved Methods for Modelling specifies five main stages in an air quality impact assessment:
1. Input data collection 2. Dispersion modelling 3. Processing dispersion model output data 4. Interpretation of dispersion modelling results 5. Preparation of an impact assessment report
Emissions information for coal mines is typically estimated using emission factors published in the National Pollutant Inventory handbooks38 or US EPA‟s Clearinghouse for Inventories & Emissions Factors (AP-42)111 and coal mine production and extraction rates. An emission inventory is then developed for all sources with consideration of the individual source‟s physical characteristics. The meteorological data used in the dispersion modelling is one factor that determines the level of assessment.

Katestone Environmental Pty Ltd KE1006953 OEH
June 2011
Page 122
Level 1 impact assessments are conducted using „synthetic‟ worst-case meteorological data
Level 2 impact assessments are conducted using at least one year of site-specific meteorological data. The meteorological data must be 90% complete in order to be acceptable for use in Level 2 impact assessments (i.e. for one year, there can be no more than 876 hours of data missing). If site-specific meteorological data are not available for a Level 2 impact assessment, at least one year of site-representative meteorological data must be used. The site representative data should be:
o preferably collected at a meteorological monitoring station. Where measured data is unavailable or of insufficient quality for dispersion modelling purposes, a meteorological data file may be generated using a prognostic meteorological model such as TAPM
o correlated against a longer-duration site-representative meteorological database of at least five years (preferably five consecutive years) to be deemed acceptable. It must be clearly established that the data adequately describes the expected meteorological patterns at the site under investigation (e.g. wind speed, wind direction, ambient temperature, atmospheric stability class, inversion conditions and katabatic drift)
Dispersion modelling is then used to predict ground-level concentrations of particulate matter for assessment against the impact assessment criteria, specified in the Approved Methods for Modelling. An air quality impact assessment report must clearly document the methodology and result of the assessment. The minimum requirements regarding the information contained within an impact assessment report are specified below. Site plan
Layout of the site clearly showing all unit operations
All emission sources clearly identified
Plant boundary
Sensitive receptors (e.g. nearest residences)
Topography Description of the activities carried out on the site
A process flow diagram clearly showing all unit operations carried out on the premises
A detailed discussion of all unit operations carried out on the site, including all possible operational variability
A detailed list of all process inputs and outputs
Plans, process flow diagrams and descriptions that clearly identify and explain all pollution control equipment and techniques for all processes on the premises
A description of all aspects of the air emission control system, with particular regard to any fugitive emission capture systems (e.g. hooding, ducting), treatment systems (e.g. scrubbers, bag filters) and discharge systems (e.g. stacks)
The operational parameters of all emission sources, including all operational variability, i.e. location, release type (stack, volume or area) and release parameters (e.g. stack height, stack diameter, exhaust velocity, temperature, emission concentration and rate)
Emissions inventory
A detailed discussion of the methodology used to calculate the expected pollutant emission rates for each source

Katestone Environmental Pty Ltd KE1006953 OEH
June 2011
Page 123
All supporting reports of source emission tests. All analytical reports must contain all the information specified in Section 4 of DEC (2005)
Methodologies used to sample and analyse for each of the pollutants considered
Detailed calculations of pollutant emission rates for each source
Tables showing all release parameters of stack and fugitive sources (e.g. temperature, exit velocity, stack dimensions, and emission concentrations and rates), and all pollutant emission concentrations with a comparison of the emission concentrations against the relevant requirements of the Regulation
Meteorological data Level 1 meteorological data
A description of the techniques used to prepare the meteorological data in a format for use in the dispersion modelling
The meteorological data used in the dispersion modelling supplied in a Microsoft Windows-compatible format
Level 2 meteorological data
A detailed discussion of the prevailing dispersion meteorology at the proposed site. The report should typically include wind rose diagrams; an analysis of wind speed, wind direction, stability class, ambient temperature and mixing height; and joint frequency distributions of wind speed and wind direction as a function of stability class
Demonstration that the site-representative data adequately describes the expected meteorological patterns at the site under investigation (e.g. wind speed, wind direction, ambient temperature, atmospheric stability class, inversion conditions and katabatic drift)
A description of the techniques used to prepare the meteorological data into a format for use in the dispersion modelling
A quality assurance and quality control analysis of the meteorological data used in the dispersion modelling. Provide and discuss any relevant results of this analysis
The meteorological data used in the dispersion modelling supplied in a Microsoft Windows-compatible format
Background air quality data
Methods used to sample and analyse for each of the pollutants considered
A detailed discussion of the methodology used to calculate the background concentrations for each pollutant
Tables summarising the ambient monitoring data Dispersion modelling
A detailed discussion and justification of all parameters used in the dispersion modeling and the manner in which topography, building wake effects and other site-specific peculiarities that may affect plume dispersion have been treated
A detailed discussion of the methodology used to account for any atmospheric pollutant formation and chemistry
A detailed discussion of air quality impacts for all relevant pollutants, based on predicted ground-level concentrations at the plant boundary and beyond, and at all sensitive receptors
Ground-level concentrations, hazard index and risk isopleths (contours) and tables summarising the predicted concentrations of all relevant pollutants at sensitive receptors
All input, output and meteorological files used in the dispersion modelling supplied in a Microsoft Windows-compatible format

Katestone Environmental Pty Ltd KE1006953 OEH
June 2011
Page 124
8.5.2 Victoria
In Victoria, air quality management of coal mining operations must be carried out in accordance with the requirements of the SEPP (AQM)46. The level of impact assessment required is dependent on:
The scale or size of the operation
The location of the site Emissions of Class 1 and 2 indicators must be controlled by the application of best practice, while Class 3 environmental indicators must be controlled to the Maximum Extent Achievable (MEA)46. The PEM47 states: In some situations extensive monitoring and modelling data may be required to assess the level of impact that emissions from the operations on site may have on the beneficial uses of the air environment defined in the policy. A level 1 assessment is required when developments are located close to residential areas or urban areas and have the potential to give rise to significant offsite impacts. These assessments are the most rigorous and require the most extensive modelling and monitoring data. A level 2 assessment is required when the proposed development is in a rural location with residences in close proximity or where a small operation is located in an urban area. A level 3 assessment is required when the development is in a rural location with no residences nearby. A level 3 assessment is the least onerous due to a lower potential risk arising from emissions from the proposed operations compared to operations requiring a level 1 or level 2 assessment. A level 3 assessment may be required when the development is small, in a location remote from residences, or where it is considered that the off-site impacts would be small compared to sites requiring level 1 or level 2 assessments. For mines and quarries with less than 50,000 tonnes/yr extraction, no modelling assessment of air quality is required but emissions on site must be controlled by the application of best practice site management. For all proposals requiring an air quality assessment the following indicators must be assessed:
PM10
PM2.5
Respirable crystalline silica (defined as the PM2.5 fraction) Depending on the location of the mining or extractive operations other substances may also require assessment, including:
arsenic
heavy metals (e.g., antimony, lead etc)
hydrogen cyanide and CN
polycyclic aromatic hydrocarbons [PAHs] (as benzo-a-pyrene [BaP])
naturally occurring asbestos
radionuclides

Katestone Environmental Pty Ltd KE1006953 OEH
June 2011
Page 125
The MEA strategies are more stringent than best practice and consider site-specific emission control rather than industry wide technologies and procedures. The PEM also states:
Best practice and MEA go beyond consideration of technological control and include application of the wastes hierarchy with avoidance being the primary aim.
The identification of indicators that may be present at individual sites needs to be undertaken in the early stages of planning and prior to the air quality assessment being commenced to ensure that the appropriate indicators are included in the assessment. Advice from EPA should be obtained at this early stage. Schedule A of the SEPP (AQM) should be consulted to identify potential substances that may require assessment. If an assessment is not to be undertaken for key indicators, such as respirable crystalline silica, then supporting evidence needs to be provided to show why an assessment is not required. Identification of all indicators of concern and assessment of these indicators must be conducted. In doing this assessment all sources need to be considered including emissions from haul roads, crushers, generators, processing operations (including leaching), mining operations and any other plant operations on the site. The type of rock and soil also needs to be considered. For Level 1 and 2 assessments mobile sources (such as trucks and graders) also need to be included. For large area-based sources of emissions such as mines and quarries the majority of emissions from the site arise from many ground level sources such as disturbance of soil due to earth moving equipment and vehicle emissions. It is appropriate that the criteria used to assess the potential impacts from these operations are directly related to the protection of the health of the surrounding population and sensitive land uses.
The impacts of a new proposal are estimated using an approved dispersion model and the impacts are assessed against the design impact assessment criteria, in accordance with the SEPP (AQM). The existing air quality in the vicinity of the proposal is also considered in the cumulative impact assessment. The PEM states:
It is important that emissions from industries, including mining and extractives, do not contribute to a deterioration of air quality in urban centres and regional towns and townships. Although the assessment criteria have been established for mining and extractive industries there may be some situations where the assessment criteria cannot be met at the nearest sensitive location to the operation, no additional management practices can be practically applied and the predicted impact from the proposed expansion or operation extends into urban areas or townships. These situations are likely to be rare. In these situations assessment of the predicted emissions on existing air quality within the urban area or township may be required. Advice should be sought from EPA on the need for such an assessment. If required, the assessment should be undertaken at locations where the general population of the town is likely to be exposed (e.g., town centre) rather than the nearest residence. Background (existing air quality) data must be included in the modelling.
An analysis of existing air quality levels is an important part of the impact assessment and approvals process. The data requirements are47:

Katestone Environmental Pty Ltd KE1006953 OEH
June 2011
Page 126
Level 1: Real time continuous 24-hour PM10 and PM2.5 data for a 12-month period, analysis of crystalline silica (PM2.5 fraction) and heavy metal content (PM10) (where applicable)
Level 2: Continuous representative 24-hour PM10 and PM2.5 data for a 12-month period, representative analysis of crystalline silica (PM2.5 fraction) and heavy metal content of PM10
Level 3: no monitoring data is required prior to the assessment Meteorological information suitable for application in dispersion modelling should also be collected at the site during the same period as the ambient air quality observations are recorded. Data requirements are47:
Level 1 assessments data from the area where the operation is proposed needs to be collected. This must be done prior to the air quality assessment commencing. In some circumstances data may be available from EPA.
Level 2 assessments data collected by EPA that is considered representative of the location where the mining or extractives operation is proposed can be used. In some circumstances representative data may not be available and some monitoring may be required.
Data for locations in Melbourne, Geelong and the Latrobe Valley can be obtained from EPA. Availability of appropriate data for other regional centres should be confirmed with EPA. If appropriate data is not available in these locations or for other areas where Level 1 or Level 2 operations are planned and appropriate data is not available, twelve months of data needs to be collected or developed (e.g., through modelling with approval from EPA) by the proponent prior to the assessment being undertaken. Use of alternative background data may be used if agreed by EPA.
Dispersion modelling is to be used to provide broad guidance as to the potential environmental impacts associated with the proposal, as the predicted outcomes are highly dependent on emission rate estimation, meteorological data and background levels. These parameters are all highly variable with a high degree of uncertainty with regard to mining applications. Modelling results should be presented using contour plots illustrating the predicted ground-level concentrations in the area surrounding the proposal, time series analysis of predicted impacts at the most affected sensitive receptors and a general discussion on the analysis of the modelling results including the degree of uncertainty in the results47.
8.5.3 United States
In the United States, a Draft EIS is first prepared for public comment. On completion, the “EPA publishes a Notice of Availability in the Federal Register informing the public that the draft is available for comment. The EPA notices are also available at www.epa.gov/compliance/nepa/eisdata.html. Based on the communication plan established by the agency, websites, local papers, or other means of public notice may also be used. The comment period is at least 45 days long, although it may be longer based on requirements spelled out in the agency specific NEPA procedures or at the agency‟s discretion. During this time, the agency may conduct public meetings or hearings as a way to solicit comments. The agency will also request comments from other Federal, State, Tribal, and local agencies that may have jurisdiction or interest in the matter.” A key aspect of the Draft EIS is the provision of a statement of “Purpose and Need”, to describe the objectives and goals of the proposed action. The statement explains to the stakeholders why an agency action is necessary, and serves as the basis for identifying the reasonable alternatives that meet the purpose and need 109.

Katestone Environmental Pty Ltd KE1006953 OEH
June 2011
Page 127
The identification and evaluation of alternative ways of meeting the purpose and need of the proposed action is the heart of the NEPA analysis. The lead agency or agencies must objectively evaluate all reasonable alternatives and briefly discuss the reasons for having eliminated any alternatives. Reasonable alternatives are those that substantially meet the agency‟s purpose and need. If the agency is considering an application for a permit or other federal approval, the agency must still consider all reasonable alternatives. Reasonable alternatives include those that are practical or feasible from the technical and economic standpoint and using common sense, rather than simply desirable from the standpoint of the applicant. Agencies are obliged to evaluate all reasonable alternatives in enough detail so that a reader can compare and contrast the environmental effects of the various alternatives.109 Agencies must always describe and analyse a “no action alternative”. The “no action” alternative is what would happen if the agency did not act upon the proposal for agency action. If an agency has a preferred alternative when it publishes a draft EIS, the draft must identify which alternative the agency prefers. All agencies must identify a preferred alternative in the final EIS, unless another law prohibits it from doing so.109 The agency must analyse the full range of direct, indirect, and cumulative effects of the preferred alternative and of the reasonable alternatives identified in the draft EIS. They include ecological, aesthetic, historic, cultural, economic, social, or health impacts, whether adverse or beneficial. The draft EIS will contain a description of the environment that would be affected by the various alternatives.109 In the Final EIS, the agency will provide further explanation of its findings or conduct further analyses to address the comments provided by stakeholders on the Draft EIS. Investigation of new alternatives to the proposed action may also be required. On completion, the EPA will publish the document and publish a Notice of Availability in the Federal Register. The consultation period is a minimum of thirty days before the agency can make a decision on their proposed action, unless the agency couples the thirty days with a formal internal appeals process.109 The final step for agencies in the EIS process is the Record of Decision (ROD) document. This document states that the decision has:
Identified the alternatives considered in the EIS including the environmentally preferred alternative
Discussed mitigation plans including any enforcement and monitoring commitments
Included in the ROD document are all of the agency‟s considerations including the:
National policy contemplated in its decision on whether or not to approve and action, and if so, how to proceed
Practical means adopted to avoid or minimize environmental harm, and if not, why not
The ROD is a publicly available document and is sometimes published in the Federal Register or on the agency‟s website. There is also occasion when the federal agency is required to prepare a supplement to an existing EIS. Substantial changes made to any proposed action after the publication of the Draft or Final EIS that are relevant to environmental concerns or are likely to alter the impacts assessed in the initial document will require the preparation of a Supplemental EIS.
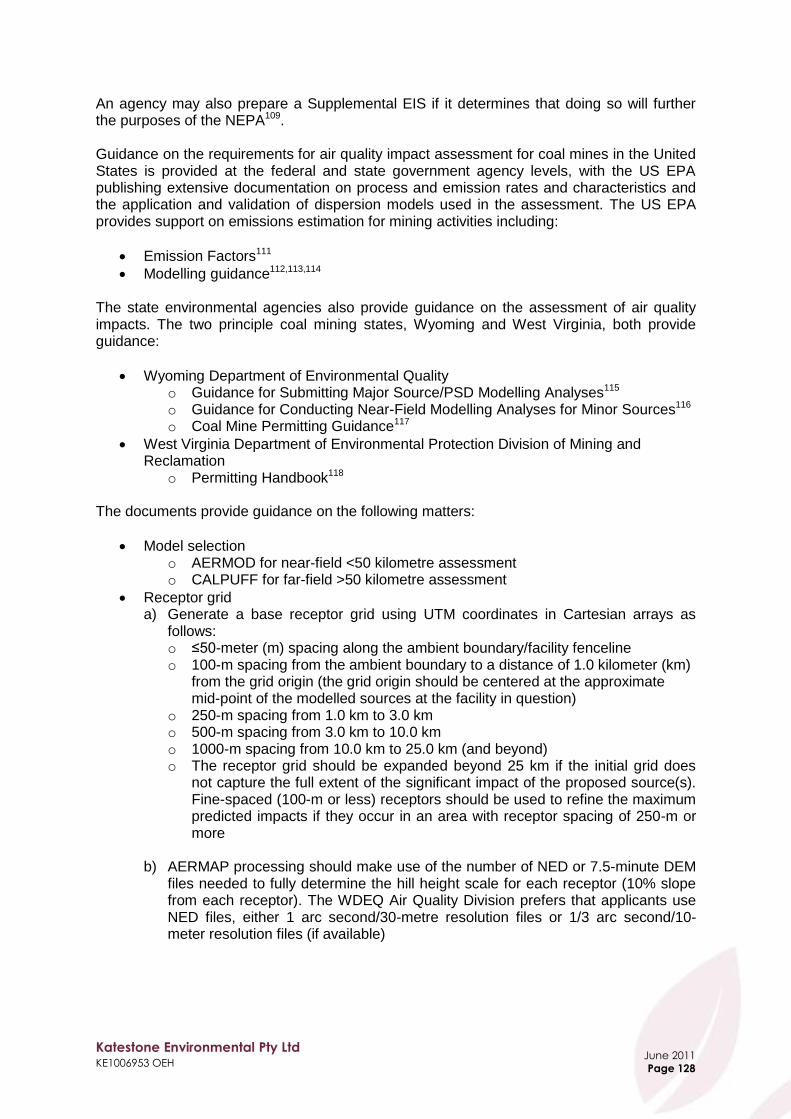
Katestone Environmental Pty Ltd KE1006953 OEH
June 2011
Page 128
An agency may also prepare a Supplemental EIS if it determines that doing so will further the purposes of the NEPA109. Guidance on the requirements for air quality impact assessment for coal mines in the United States is provided at the federal and state government agency levels, with the US EPA publishing extensive documentation on process and emission rates and characteristics and the application and validation of dispersion models used in the assessment. The US EPA provides support on emissions estimation for mining activities including:
Emission Factors111
Modelling guidance112,113,114 The state environmental agencies also provide guidance on the assessment of air quality impacts. The two principle coal mining states, Wyoming and West Virginia, both provide guidance:
Wyoming Department of Environmental Quality o Guidance for Submitting Major Source/PSD Modelling Analyses115 o Guidance for Conducting Near-Field Modelling Analyses for Minor Sources116 o Coal Mine Permitting Guidance117
West Virginia Department of Environmental Protection Division of Mining and Reclamation
o Permitting Handbook118 The documents provide guidance on the following matters:
Model selection o AERMOD for near-field <50 kilometre assessment o CALPUFF for far-field >50 kilometre assessment
Receptor grid a) Generate a base receptor grid using UTM coordinates in Cartesian arrays as
follows: o ≤50-meter (m) spacing along the ambient boundary/facility fenceline o 100-m spacing from the ambient boundary to a distance of 1.0 kilometer (km)
from the grid origin (the grid origin should be centered at the approximate mid-point of the modelled sources at the facility in question)
o 250-m spacing from 1.0 km to 3.0 km o 500-m spacing from 3.0 km to 10.0 km o 1000-m spacing from 10.0 km to 25.0 km (and beyond) o The receptor grid should be expanded beyond 25 km if the initial grid does
not capture the full extent of the significant impact of the proposed source(s). Fine-spaced (100-m or less) receptors should be used to refine the maximum predicted impacts if they occur in an area with receptor spacing of 250-m or more
b) AERMAP processing should make use of the number of NED or 7.5-minute DEM
files needed to fully determine the hill height scale for each receptor (10% slope from each receptor). The WDEQ Air Quality Division prefers that applicants use NED files, either 1 arc second/30-metre resolution files or 1/3 arc second/10-meter resolution files (if available)

Katestone Environmental Pty Ltd KE1006953 OEH
June 2011
Page 129
Meteorological data o Applicants should use the most recent five-year period of meteorological data
that are representative of the project area. At least one year of on-site meteorological data may be used to fulfil this requirement. Document and submit Quality Assurance (QA) procedures that were followed in preparing any meteorological data
o The WDEQ Air Quality Division has developed AERMET-derived meteorological data for several locations in Wyoming
Modelling approach
Emission inventories
Application of BACT
Assessment of PM10 background
Equipment and process area description
Land use and the effect of mine operations on the land including soil: o The application must include a discussion of the land status for the current year
and for the years modelled. In the discussion, include a table that summarizes disturbed acreage as follows: o Topsoil stripping (include areas stripped for sediment control and diversions) o Topsoil piles - assume piles from previous year and current year as disturbed o Reclaimed areas - assume previous and current year reclamation as
disturbed acreage o Overburden stockpile areas o Mine facility areas (excluding buildings and treated areas) o All roads in the mine permit area o Active coal pit areas
o Maps are to be submitted that delineate the various disturbance areas and the size of the areas should be noted on the maps
8.6 Licensing of coal mines
8.6.1 New South Wales
Environmental Protection Licences (EPL) permit the holder of the licence to undertake an activity that is included in Schedule 1 of the Protection of the Environment (Operations) Act 199722 (POEO Act). Licences specify the intensity of the activity that can be undertaken and the conditions that must be met whilst the activity is undertaken with respect to regulating the activity‟s environmental impact. Section 309 of the POEO Act requires OEH to keep the Public Register. Section 308 of the POEO Act defines that the following are to be included in the public register:
Environment Protection Licences
Applications for new licences and to transfer or vary existing licences
Environment protection and noise control notices
Convictions in prosecutions under the POEO Act
The results of civil proceedings
Licence review information. Submissions regarding licence review can be made at any time
Exemptions from the provisions of the POEO Act or regulations
Approvals granted under clause 9 of the POEO (Control of Burning) Regulation
Approvals granted under clause 7A of the POEO (Clean Air) Regulation

Katestone Environmental Pty Ltd KE1006953 OEH
June 2011
Page 130
Coal mining premises that undertake an activity listed in Schedule 1 of the POEO Act, and conduct this activity above the identified thresholds, must hold an environment protection licence. In Schedule 1, a coal mine is defined as: 28 Mining for coal
(1) This clause applies to mining for coal, meaning the mining, processing or handling of coal (including tailings and chitter) at underground mines or open cut mines.
(2) The activity to which this clause applies is declared to be a scheduled activity if: (a) it has a capacity to produce more than 500 tonnes of coal per day, or (b) it has disturbed, is disturbing or will disturb a total surface area of
more than 4 hectares of land by:
(i) clearing or excavating, or (ii) constructing dams, ponds, drains, roads, railways or
conveyors, or (iii) storing or depositing overburden or coal (including tailings and
chitter). All activities holding an EPL must:
Keep a record of pollution complaints
Prepare an Annual Return that includes: (a) a Statement of Compliance (b) a Monitoring and Complaints Summary
Report incidents causing or threatening material harm as soon as practicable after the person becomes aware of the incident in accordance with the requirements of Part 5.7 of the POEO Act
In the event that adverse impacts occur or are suspected to have occurred, OEH can issue one of the following notices under Chapter 4 of the POEO Act to deal with the impacts:
Clean-up notice
Compliance cost notice
Prevention notice
Prohibition notice Under Section 175 of the POEO Act, a requirement to conduct an environmental audit can be imposed on a licensee. 175 Circumstances in which mandatory environmental audit can be imposed Conditions requiring the undertaking of a mandatory environmental audit may only be imposed if the appropriate regulatory authority reasonably suspects:
(a) that the holder of the licence has on one or more occasions contravened this Act, the regulations or the conditions of the licence, and
(b) that the contravention or contraventions have caused, are causing or are likely to cause, harm to the environment.

Katestone Environmental Pty Ltd KE1006953 OEH
June 2011
Page 131
Whilst OEH may include monitoring requirements on EPL, OEH doesn‟t include ambient air quality standards. However, assessment criteria are used for reporting and as a trigger for further investigation of elevated particulate matter levels as follows:
Monitoring results are compared against the criteria.
Any exceedances of the criteria at sensitive receptors are identified.
The cause of any exceedances are investigated and reported.
Actions are identified and implemented to ensure that impacts will be minimised in the future.
To determine whether particulate matter emissions from a facility may be the cause of a complaint, an air quality assessment study is required to be undertaken in accordance with the Approved Methods for Modelling. The Approved Methods for Modelling lists the statutory methods and air quality criteria that are to be used to model and assess emissions and impacts of air pollutants from stationary sources in New South Wales. The assessment criteria summarised in Table 47 are relevant to the assessment of coal mines.
Table 47 Assessment criteria relevant to coal mining in NSW
Pollutant Criteria Units Averaging period
Particulates as TSP 90 µg/m³ Annual
Dust deposition rate 2 increment
4 total g/m
2/month Annual
Particulates as PM10 50 30
µg/m³ µg/m³
24-hour Annual
Sampling and analysis of air pollutants that are required to be conducted under the POEO Act must be conducted in accordance with the Approved Methods for Sampling21. Table 48 summarises sampling methods that are relevant to the measurement of particulate matter from mining activities. A number of methods have been superseded and the Approved Methods for Sampling should be updated to reflect this.

Katestone Environmental Pty Ltd KE1006953 OEH
June 2011
Page 132
Table 48 Ambient air quality sampling and analysis methods relevant to coal
mining in NSW
Method no. Parameter measured Method
AM-1 Guide for the siting of sampling units AS 2922–19871
AM-2 Guide for measurement of horizontal wind for air quality applications
AS 2923–1987
AM-3 Preparation of reference test atmospheres AS 3580.2.1–1990
2 or
AS 3580.2.2–19903 as
appropriate
AM-4 Meteorological monitoring guidance for regulatory modelling applications
USEPA (2000) EPA 454/R-99-005
AM-15 Particulate matter – TSP – high volume sampler method
AS 2724.3-19844
AM-17 Particulate matter – impinged matter – directional dust gauge method
AS 2724.5-1987
AM-18 Particulate matter – PM10 – high volume sampler with size-selective inlet
AS 3580.9.6-19905
AM-19 Particulates – deposited matter – gravimetric method AS 3580.10.1-19916
AM-22 Particulate matter – PM10 – TEOM AS 3580.9.8-20017
Note: 1 Superseded by 3580.1.1:2007
2 Standard withdrawn
3 Superseded by AS 3580.2.2:2009
4 Superseded by AS 3580.9.3:2003
5 Superseded by AS 3580.9.6:2003
6 Superseded by AS 3580.10.1:2003
7 Superseded by AS 3580.9.8-2008
The load-based licensing (LBL) scheme119 sets limits on the pollutant loads emitted by licensed activities by linking licence fees to pollutant emissions. The LBL scheme also provides the infrastructure for emissions trading schemes. These enable emissions to be controlled from groups of licensees as well as from individual premises by allowing licensees to buy and sell credits for reducing emissions. Coal mining activities are not subject to the requirements of load-based licensing in NSW.
8.6.2 Queensland
In Queensland, typical conditions contained in Development Approvals and Environmental Authorities issued include:
Dust Nuisance. The release of dust and/or particulate matter resulting from the ERA must not cause an environmental nuisance at any nuisance sensitive or commercial place. Dust and particulate matter resulting from the ERA must not cause the following levels to be exceeded when measured at any nuisance sensitive place
(a) dust deposition of 120 milligrams per square metre per day, when monitored in accordance with Australian Standard AS 3580.10.1 of 2003 (or more recent editions); or
(b) a concentration of particulate matter with an aerodynamic diameter of less
than 10 micrometre (µm) (PM10) suspended in the atmosphere of 150 micrograms per cubic metre over a 24 hour averaging time, at a nuisance sensitive or commercial place downwind of the site, when monitored in accordance with Australian Standard AS 3580.9.6 of 2003 (or more recent

Katestone Environmental Pty Ltd KE1006953 OEH
June 2011
Page 133
editions) „Ambient Air – Particulate matter – Determination of suspended particulate PM10 high-volume sampler with size-selective inlet – Gravimetric method‟; or
Any alternative method of monitoring PM10 which may be permitted by the „Air
Quality Sampling Manual‟ as published from time to time by the administering authority.
8.6.3 United States
In the United States, the Clean Air Act 199050 provides for a national operating permitting system for major sources of air pollution known as 40 CFR Part 70 – State Operating Permit Programs120. Under this section of the Act, known as Title V, state and local air pollution control agencies issue permits that contain all of the requirements that are needed for a source to maintain compliance with state and federal air pollution control regulations. Permits are issued for a fixed term of five years in the case of affected sources, and for a term not to exceed five years in the case of all other sources. Title V permits are directly enforceable by the authority issuing the permit and the Environmental Protection Agency. In addition to this, permits are also subject to the citizen suit provisions of the Act. The Title V permit should be regarded as a living document that reflects the changing conditions at a facility. The issuance of the permit as part of a facility‟s development approval process does not end the relevance of a broader „purposes‟ discussion for that facility. Permit content requirements are outlined in 40 CFR Section 70.6120 of the United States Federal Register. In 2004, the Clean Air Act Advisory Committee established a Task Force on the Title V Implementation Experience to report on stakeholder experience with the implementation of the Title V operating permit program. The Task Force agreed that the primary purposes of the permitting program include, but are not limited to, the following:
Consolidation of all Clean Air Act requirements into one document
Enhancement of public participation in decisions about applicability of the requirements to major facilities
Provision of the opportunity to judicially challenge these decisions
Enhancement of the ability to enforce Clean Air Act requirements through, among other things,
o compliance certifications o providing certainty to permitted facilities regarding which regulatory
obligations apply The Task Force observed that, whether intentional or not, the implementation of the Title V program appears to have, or may be credited with:
Providing the impetus to resolve longstanding issues of interpreting Federal or SIP standards, sometime through revision of the standard itself
Providing the incentive to resolve longstanding compliance problems at facilities applying for a permit so that compliance can be certified and a schedule of compliance avoided
Raising the statutory profile of compliance through certifications
Forcing the resolution of issues that otherwise may have persisted in a state of stalemate (or perhaps acknowledged ignorance by all sides)
Providing an opportunity for the people living near a facility to find out more about it, even if they otherwise agree with the permitting
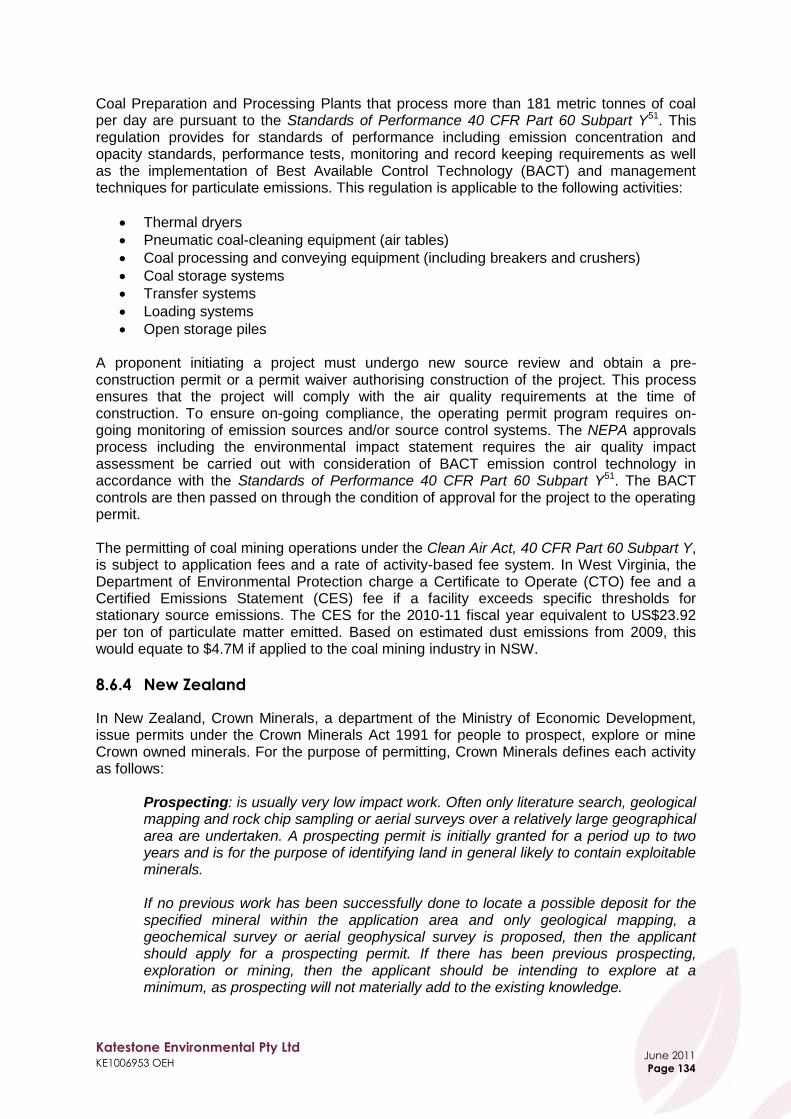
Katestone Environmental Pty Ltd KE1006953 OEH
June 2011
Page 134
Coal Preparation and Processing Plants that process more than 181 metric tonnes of coal per day are pursuant to the Standards of Performance 40 CFR Part 60 Subpart Y51. This regulation provides for standards of performance including emission concentration and opacity standards, performance tests, monitoring and record keeping requirements as well as the implementation of Best Available Control Technology (BACT) and management techniques for particulate emissions. This regulation is applicable to the following activities:
Thermal dryers
Pneumatic coal-cleaning equipment (air tables)
Coal processing and conveying equipment (including breakers and crushers)
Coal storage systems
Transfer systems
Loading systems
Open storage piles A proponent initiating a project must undergo new source review and obtain a pre-construction permit or a permit waiver authorising construction of the project. This process ensures that the project will comply with the air quality requirements at the time of construction. To ensure on-going compliance, the operating permit program requires on-going monitoring of emission sources and/or source control systems. The NEPA approvals process including the environmental impact statement requires the air quality impact assessment be carried out with consideration of BACT emission control technology in accordance with the Standards of Performance 40 CFR Part 60 Subpart Y51. The BACT controls are then passed on through the condition of approval for the project to the operating permit. The permitting of coal mining operations under the Clean Air Act, 40 CFR Part 60 Subpart Y, is subject to application fees and a rate of activity-based fee system. In West Virginia, the Department of Environmental Protection charge a Certificate to Operate (CTO) fee and a Certified Emissions Statement (CES) fee if a facility exceeds specific thresholds for stationary source emissions. The CES for the 2010-11 fiscal year equivalent to US$23.92 per ton of particulate matter emitted. Based on estimated dust emissions from 2009, this would equate to $4.7M if applied to the coal mining industry in NSW.
8.6.4 New Zealand
In New Zealand, Crown Minerals, a department of the Ministry of Economic Development, issue permits under the Crown Minerals Act 1991 for people to prospect, explore or mine Crown owned minerals. For the purpose of permitting, Crown Minerals defines each activity as follows:
Prospecting: is usually very low impact work. Often only literature search, geological mapping and rock chip sampling or aerial surveys over a relatively large geographical area are undertaken. A prospecting permit is initially granted for a period up to two years and is for the purpose of identifying land in general likely to contain exploitable minerals. If no previous work has been successfully done to locate a possible deposit for the specified mineral within the application area and only geological mapping, a geochemical survey or aerial geophysical survey is proposed, then the applicant should apply for a prospecting permit. If there has been previous prospecting, exploration or mining, then the applicant should be intending to explore at a minimum, as prospecting will not materially add to the existing knowledge.
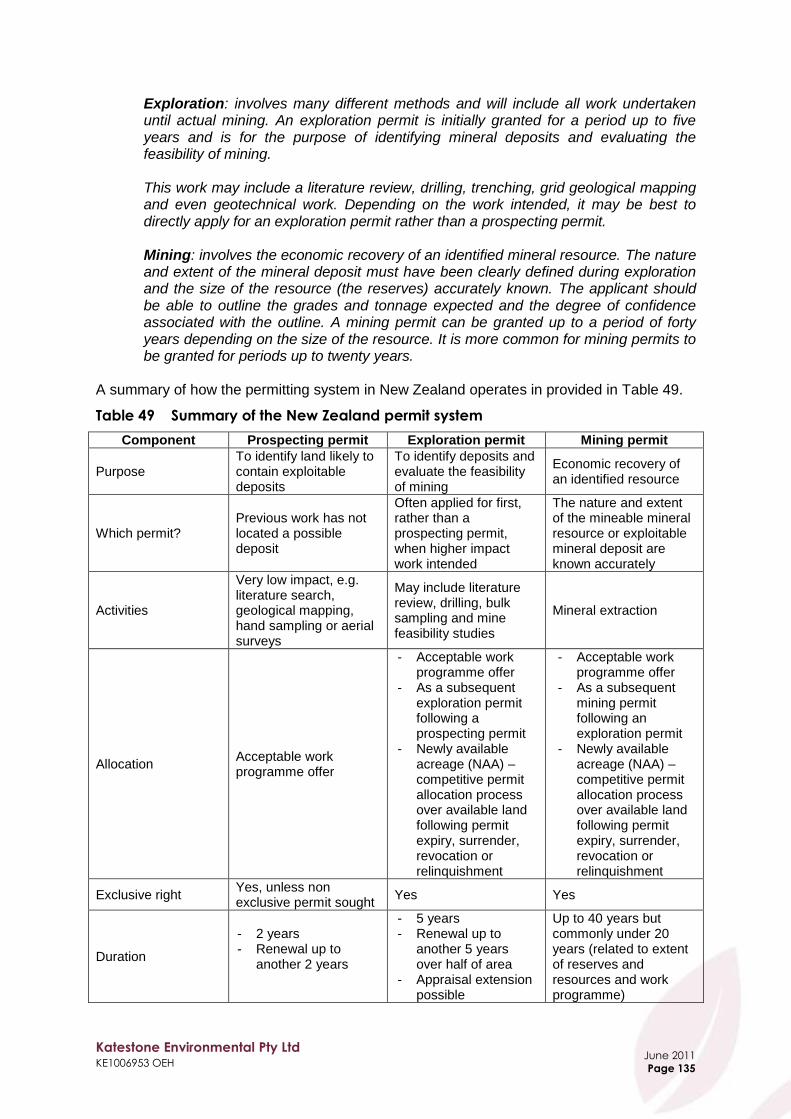
Katestone Environmental Pty Ltd KE1006953 OEH
June 2011
Page 135
Exploration: involves many different methods and will include all work undertaken until actual mining. An exploration permit is initially granted for a period up to five years and is for the purpose of identifying mineral deposits and evaluating the feasibility of mining. This work may include a literature review, drilling, trenching, grid geological mapping and even geotechnical work. Depending on the work intended, it may be best to directly apply for an exploration permit rather than a prospecting permit. Mining: involves the economic recovery of an identified mineral resource. The nature and extent of the mineral deposit must have been clearly defined during exploration and the size of the resource (the reserves) accurately known. The applicant should be able to outline the grades and tonnage expected and the degree of confidence associated with the outline. A mining permit can be granted up to a period of forty years depending on the size of the resource. It is more common for mining permits to be granted for periods up to twenty years.
A summary of how the permitting system in New Zealand operates in provided in Table 49.
Table 49 Summary of the New Zealand permit system
Component Prospecting permit Exploration permit Mining permit
Purpose To identify land likely to contain exploitable deposits
To identify deposits and evaluate the feasibility of mining
Economic recovery of an identified resource
Which permit? Previous work has not located a possible deposit
Often applied for first, rather than a prospecting permit, when higher impact work intended
The nature and extent of the mineable mineral resource or exploitable mineral deposit are known accurately
Activities
Very low impact, e.g. literature search, geological mapping, hand sampling or aerial surveys
May include literature review, drilling, bulk sampling and mine feasibility studies
Mineral extraction
Allocation Acceptable work programme offer
- Acceptable work programme offer
- As a subsequent exploration permit following a prospecting permit
- Newly available acreage (NAA) – competitive permit allocation process over available land following permit expiry, surrender, revocation or relinquishment
- Acceptable work programme offer
- As a subsequent mining permit following an exploration permit
- Newly available acreage (NAA) – competitive permit allocation process over available land following permit expiry, surrender, revocation or relinquishment
Exclusive right Yes, unless non exclusive permit sought
Yes Yes
Duration
- 2 years - Renewal up to
another 2 years
- 5 years - Renewal up to
another 5 years over half of area
- Appraisal extension possible
Up to 40 years but commonly under 20 years (related to extent of reserves and resources and work programme)
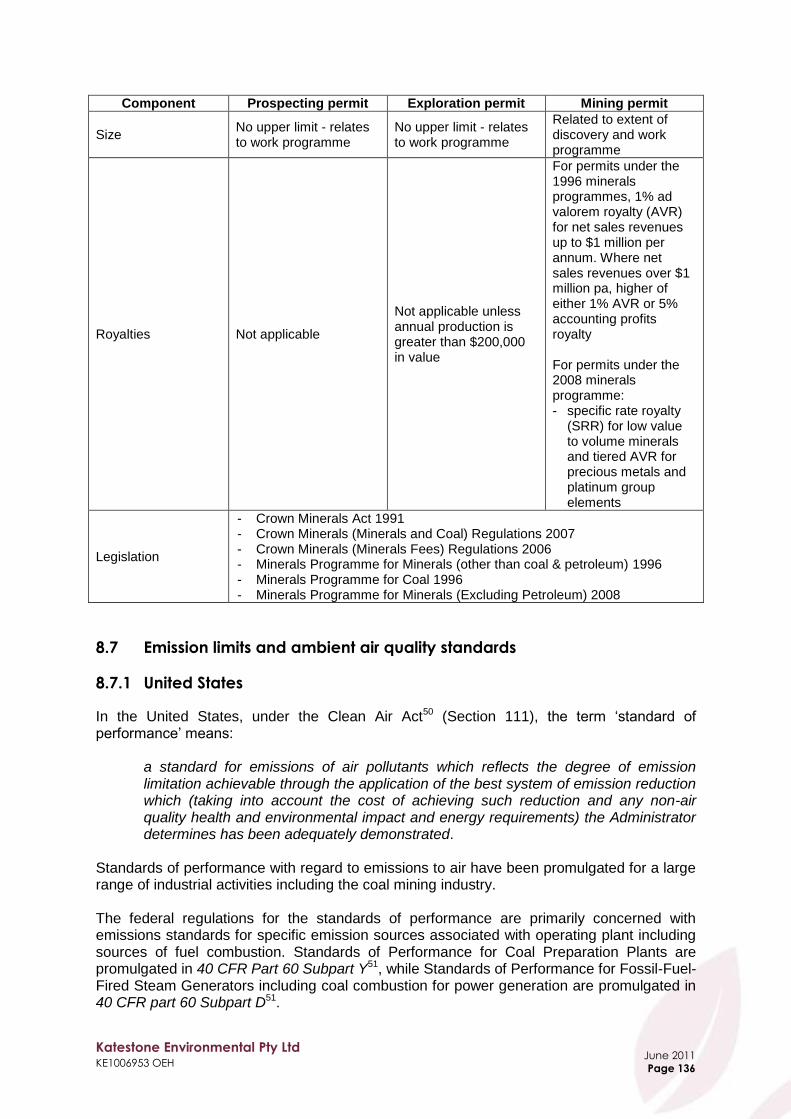
Katestone Environmental Pty Ltd KE1006953 OEH
June 2011
Page 136
Component Prospecting permit Exploration permit Mining permit
Size No upper limit - relates to work programme
No upper limit - relates to work programme
Related to extent of discovery and work programme
Royalties Not applicable
Not applicable unless annual production is greater than $200,000 in value
For permits under the 1996 minerals programmes, 1% ad valorem royalty (AVR) for net sales revenues up to $1 million per annum. Where net sales revenues over $1 million pa, higher of either 1% AVR or 5% accounting profits royalty For permits under the 2008 minerals programme: - specific rate royalty
(SRR) for low value to volume minerals and tiered AVR for precious metals and platinum group elements
Legislation
- Crown Minerals Act 1991 - Crown Minerals (Minerals and Coal) Regulations 2007 - Crown Minerals (Minerals Fees) Regulations 2006 - Minerals Programme for Minerals (other than coal & petroleum) 1996 - Minerals Programme for Coal 1996 - Minerals Programme for Minerals (Excluding Petroleum) 2008
8.7 Emission limits and ambient air quality standards
8.7.1 United States
In the United States, under the Clean Air Act50 (Section 111), the term „standard of performance‟ means:
a standard for emissions of air pollutants which reflects the degree of emission limitation achievable through the application of the best system of emission reduction which (taking into account the cost of achieving such reduction and any non-air quality health and environmental impact and energy requirements) the Administrator determines has been adequately demonstrated.
Standards of performance with regard to emissions to air have been promulgated for a large range of industrial activities including the coal mining industry. The federal regulations for the standards of performance are primarily concerned with emissions standards for specific emission sources associated with operating plant including sources of fuel combustion. Standards of Performance for Coal Preparation Plants are promulgated in 40 CFR Part 60 Subpart Y51, while Standards of Performance for Fossil-Fuel-Fired Steam Generators including coal combustion for power generation are promulgated in 40 CFR part 60 Subpart D51.

Katestone Environmental Pty Ltd KE1006953 OEH
June 2011
Page 137
The standards of emissions for Coal Preparation and Processing Plants that process more than 181 metric tonnes of coal per day are summarised in Table 50.
Table 50 Summary of 40 CFR Part 60 Subpart Y – Standards of Performance for Coal
Preparation and Processing Plants
Emission source Equipment construction, reconstruction or
modification date
Emission standard
Mass of particulate
matter (g/dscm)
Visibility (% opacity)
Thermal dryers
Constructed, reconstructed or modified on and before 28/04/2008
0.070 20
Constructed or reconstructed after 28/04/2008 0.023 10
Modified after 28/04/2008 0.070 20
Pneumatic coal cleaning equipment
Constructed, reconstructed or modified on and before 28/04/2008
0.040 10
Constructed, reconstructed or modified after 28/04/2008
0.023 5
Coal processing and conveying equipment, coal storage, transfer and loading systems
Constructed, reconstructed or modified on and before 28/04/2008
N/A 20
Constructed, reconstructed or modified after 28/04/2008
0.023 10
Open storage stockpile including loading, unloading and conveying
The owner or operator of an open storage pile, which includes the equipment used in the loading, unloading, and conveying operations of the affected facility, constructed, reconstructed, or modified after May 27, 2009, must prepare and operate in accordance with a submitted fugitive coal dust emissions control plan
N/A (see Table 51)
An outline of the requirements for dust emissions management plans for open storage stockpiles including loading, unloading and conveying systems at Coal Preparation and Processing Plants is presented in Table 51.
Table 51 Summary of 40 CFR Part 60 Subpart Y Section 60.255 – Dust emissions
management plans for open storage stockpiles including loading,
unloading and conveying at Coal Preparation and Processing Plants
Section Fugitive coal dust emissions control plan
(c) Applicable to activities constructed, reconstructed or modified after 27/05/2009 must prepare and operate in accordance with a submitted fugitive coal dust emissions control plan that is appropriate for the site conditions as specified in paragraphs (c)(1) through (6) of this section
(c) (1) The fugitive coal dust emissions control plan must identify and describe the control measures the owner or operator will use to minimize fugitive coal dust emissions from each open storage pile.
(c) (2)
One or more of the following control measures are to be used to minimize to the greatest extent practicable fugitive coal dust:
Locating the source inside a partial enclosure
Installing and operating a water spray or fogging system
Applying appropriate chemical dust suppression agents on the source (when the provisions of paragraph (c)(6) of this section are met)
Use of a wind barrier, compaction, or use of a vegetative cover The owner or operator must select, for inclusion in the fugitive coal dust emissions control plan, the control measure or measures listed in this paragraph that are most appropriate for site conditions. The plan must also explain how the measure or measures selected are applicable and appropriate for site conditions. In addition, the plan must be revised as needed to reflect any changing conditions at the source.
(c) (3)
Petition to the Administrator can be made to approve, for inclusion in the plan, alternative control
measures other than those specified in paragraph (c)(2) of this section as specified in paragraphs
(c)(3)(i) through (iv) of this section. However,
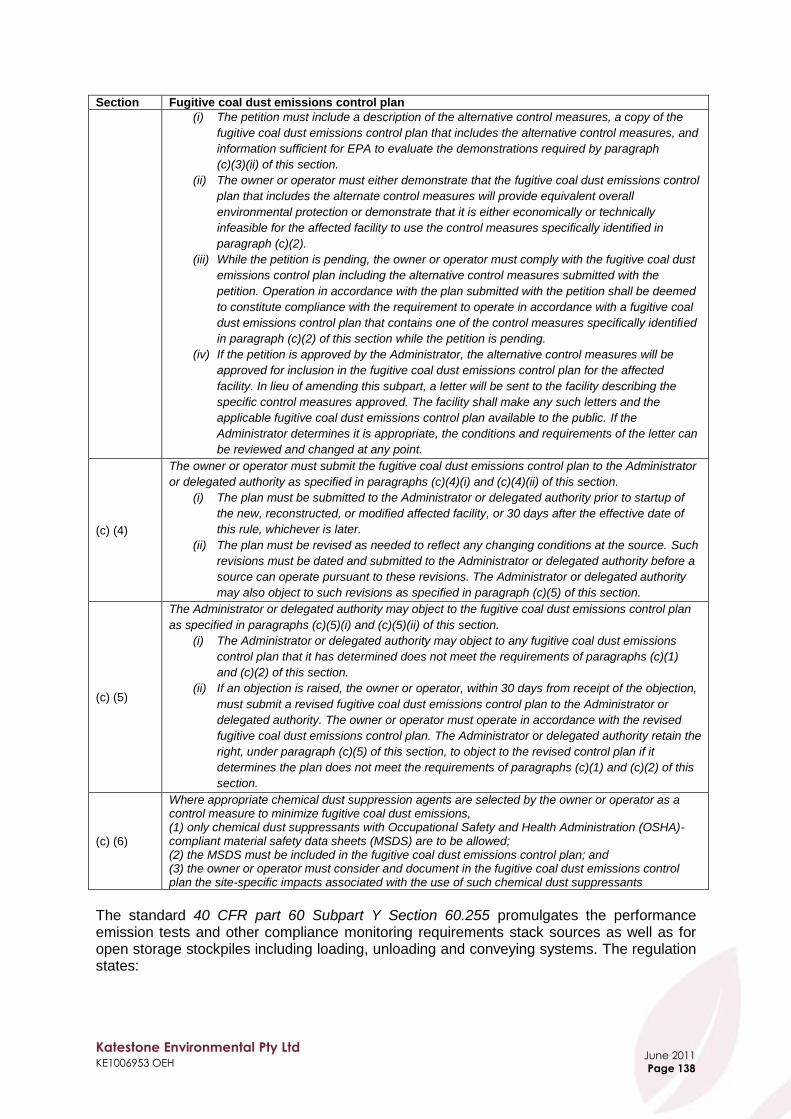
Katestone Environmental Pty Ltd KE1006953 OEH
June 2011
Page 138
Section Fugitive coal dust emissions control plan
(i) The petition must include a description of the alternative control measures, a copy of the
fugitive coal dust emissions control plan that includes the alternative control measures, and
information sufficient for EPA to evaluate the demonstrations required by paragraph
(c)(3)(ii) of this section.
(ii) The owner or operator must either demonstrate that the fugitive coal dust emissions control
plan that includes the alternate control measures will provide equivalent overall
environmental protection or demonstrate that it is either economically or technically
infeasible for the affected facility to use the control measures specifically identified in
paragraph (c)(2).
(iii) While the petition is pending, the owner or operator must comply with the fugitive coal dust
emissions control plan including the alternative control measures submitted with the
petition. Operation in accordance with the plan submitted with the petition shall be deemed
to constitute compliance with the requirement to operate in accordance with a fugitive coal
dust emissions control plan that contains one of the control measures specifically identified
in paragraph (c)(2) of this section while the petition is pending.
(iv) If the petition is approved by the Administrator, the alternative control measures will be
approved for inclusion in the fugitive coal dust emissions control plan for the affected
facility. In lieu of amending this subpart, a letter will be sent to the facility describing the
specific control measures approved. The facility shall make any such letters and the
applicable fugitive coal dust emissions control plan available to the public. If the
Administrator determines it is appropriate, the conditions and requirements of the letter can
be reviewed and changed at any point.
(c) (4)
The owner or operator must submit the fugitive coal dust emissions control plan to the Administrator
or delegated authority as specified in paragraphs (c)(4)(i) and (c)(4)(ii) of this section.
(i) The plan must be submitted to the Administrator or delegated authority prior to startup of
the new, reconstructed, or modified affected facility, or 30 days after the effective date of
this rule, whichever is later.
(ii) The plan must be revised as needed to reflect any changing conditions at the source. Such
revisions must be dated and submitted to the Administrator or delegated authority before a
source can operate pursuant to these revisions. The Administrator or delegated authority
may also object to such revisions as specified in paragraph (c)(5) of this section.
(c) (5)
The Administrator or delegated authority may object to the fugitive coal dust emissions control plan
as specified in paragraphs (c)(5)(i) and (c)(5)(ii) of this section.
(i) The Administrator or delegated authority may object to any fugitive coal dust emissions
control plan that it has determined does not meet the requirements of paragraphs (c)(1)
and (c)(2) of this section.
(ii) If an objection is raised, the owner or operator, within 30 days from receipt of the objection,
must submit a revised fugitive coal dust emissions control plan to the Administrator or
delegated authority. The owner or operator must operate in accordance with the revised
fugitive coal dust emissions control plan. The Administrator or delegated authority retain the
right, under paragraph (c)(5) of this section, to object to the revised control plan if it
determines the plan does not meet the requirements of paragraphs (c)(1) and (c)(2) of this
section.
(c) (6)
Where appropriate chemical dust suppression agents are selected by the owner or operator as a control measure to minimize fugitive coal dust emissions, (1) only chemical dust suppressants with Occupational Safety and Health Administration (OSHA)-compliant material safety data sheets (MSDS) are to be allowed; (2) the MSDS must be included in the fugitive coal dust emissions control plan; and (3) the owner or operator must consider and document in the fugitive coal dust emissions control plan the site-specific impacts associated with the use of such chemical dust suppressants
The standard 40 CFR part 60 Subpart Y Section 60.255 promulgates the performance emission tests and other compliance monitoring requirements stack sources as well as for open storage stockpiles including loading, unloading and conveying systems. The regulation states:

Katestone Environmental Pty Ltd KE1006953 OEH
June 2011
Page 139
a) An owner or operator of each affected facility that commenced construction, reconstruction, or modification on or before April 28, 2008, must conduct all performance tests required by Section 60.8 to demonstrate compliance with the applicable emission standards using the methods identified in Section 60.257
b) An owner or operator of each affected facility that commenced construction, reconstruction, or modification after April 28, 2008, must conduct performance tests according to the requirements of Section 60.8 and the methods identified in Section 60.257 to demonstrate compliance with the applicable emissions standards in this subpart as specified in paragraphs (b)(1) and (2) of Section 60.255
8.7.2 Canada
In Canada, the Quebec Ministère du Dévelopment durable, de l‟Environnement et des Parcs has promulgated general emission standards for particulate matter under the Environmental Quality Act121. These standards do not refer directly to particulate emissions associated with general mining or coal mining activities however, they are relevant in terms of environmental impact assessment for developments. Section 24 states:
Except for the special cases provided for in Divisions IX to XV, XVII to XXII, XXIV, XXVI to XXVIII and in section 25, no one may emit particulate matters into the atmosphere in excess of the hourly quantities allowed respectively for existing and new stationary sources in Schedules A and B.
It should noted, that the Divisions of the Act referred to as exceptions to the emissions standards promulgated under Section 24 are pursuant to the following industrial activities, and do not include the coal mining industry:
Division IX – Use of Fossil Fuels Division X – Metal Purification Plant Division XI – Aluminium Smelters Division XII – Cement Plants Division XIII – Coke Manufacturing Plants Division XIV – Wood Burning Division XV – Refractory Powder Production Plants Division XVII – Steel and Cast Iron Foundries Division XVIII – Charcoal Kilns Division XIX – Incinerators Division XX – Asbestos Industry Division XXI – Secondary Lead Smelters Division XXII – Oil Refineries and Petrochemical Plants Division XXIV – Treatment of Metallic Surfaces Division XXVI – Iron Ore Pelletising Plant Division XXVII – Ferroalloy Plants Division XXVIII – Primary Non-Ferrous Metal Smelters

Katestone Environmental Pty Ltd KE1006953 OEH
June 2011
Page 140
Schedules A and B provide for variable emission rate standards for particulate matter based on the scale of operations. For Schedule A, emissions standards are calculated using the following equations:
Interpolation of the data in Schedule A, for process weight rates under 25 tonnes per hour, shall be accomplished by use of the equation:
Interpolation and extrapolation of the data in Schedule A, for process weight rates equal to or in excess of 25 tonnes per hour, shall be accomplished by use of the equation:
Where: E is the emission standard in kg/hour P is the process weight in tonnes/hour For Schedule B, emissions standards are calculated using the following equations:
Interpolation of the data in Schedule B, for process weight rates under 25 tonnes per hour, shall be accomplished by use of the equation:
Interpolation and extrapolation of the data in Schedule A, for process weight rates equal to or in excess of 25 tonnes per hour, shall be accomplished by use of the equation:
Where: E is the emission standard in kg/hour p is the process weight in tonnes/hour Section 25 - Concentration of the standards state:
„No mill, distillery, brewery, powder milk plant, fertilizer mixing plant, concrete plant, vitreous enamel, earthenware, and ceramic products plant, polyvinyl chloride production or processing plant or wood processing plant must emit particulate matter into the atmosphere with a concentration higher than 50 milligrams per cubic metre, under standard conditions. This standard applies also to emissions coming from any transfer of bulk material except wood, any storage in confined environment, any digging other than the sinking of a supply water well, any welding operation metal works in indoor sandblasting and to any process for the preparation, concentration, agglomeration or drying of ore or ore concentrate, as well as to the related handling operations done in a plant for the preparation, concentration, agglomeration or drying of metallic ores, except for the process of aluminium hydrate calcining‟.

Katestone Environmental Pty Ltd KE1006953 OEH
June 2011
Page 141
Fugitive emission standards are also promulgated under the Environmental Quality Act, Regulation respecting the quality of the atmosphere in Division VII, Fugitive Emissions Sections 17 – 23. Section 17 of the regulation pertains to dust emissions non-specific to the mining industry and is associated with:
„any person who wrecks, builds, repairs or maintains a building or a thoroughfare‟ and states that that person must:
„spread water or another dust control product to prevent the raising of dust in all cases where the carrying out of such activity brings about the emission of dust‟
Notwithstanding this, Section 19 of the regulation, titled Transfer and Fee Fall, is relevant to the mining industry, and states:
In the case where the transfer or free fall of materials of any kind including aggregates, mine rejects ore, ore concentrate or pellets, brings about the emission of dust which can be seen in the atmosphere more than two metres away from the emission source, the person responsible for that source of atmospheric contamination must take the necessary measures so that:
a) the stationary transfer point is included in an enclosed space equipped with ducts which draw dust to a dust collector so that the emissions of particulate matters into the atmosphere are in compliance with the concentration standard established in section 25; or
b) the free fall height of these materials does not exceed two metres.
8.7.3 Germany
In Germany, standards of emissions for coal mining activities are not specifically addressed in TA Luft96. Notwithstanding this, the regulation provides a general description of emission management and reduction strategies for emissions associated with transporting, loading and unloading, storing and working with solid substances. No emission concentration standards have been promulgated.
8.7.4 South Africa
In South Africa, the Department of Environmental Affairs and Tourism has promulgated an extensive list of air emission standards for industry under the National Environment Management: Air Quality Act in Government Gazette No. 33064 on 31 March 2010122. However, emission standards for the bulk handling and storage of minerals and ore, promulgated under Category 5: Mineral Processing, Storage and Handling – Subcategory 5.1: Storage and handling of ore and coal do not apply to mine sites and works as defined under the Mine Health and Safety Act 1996123.

Katestone Environmental Pty Ltd KE1006953 OEH
June 2011
Page 142
8.7.5 Ambient air quality standards for particulate matter
A comparison of ambient air quality standards for particulate matter including total suspended particulate (TSP), PM10, PM2.5 and deposited dust that are promulgated in various national and state/provincial jurisdictions are presented in Table 52 to Table 60. The list of jurisdictions reviewed includes OECD (Organisation for Economic Co-operation and Development) countries and other major coal producing nations and regions. The World Health Organisation (WHO) publishes air quality guidelines124 from time to time. These guidelines are intended to support actions which are aimed at achieving air quality levels that protect public health in different contexts. In relation to the setting of air quality standards the WHO states:
Air quality standards are an important instrument of risk management and environmental policy, and should be set by each country to protect the health of its citizens. The standards set in each country will vary according to specific approaches to balancing risks to health, technological feasibility, economic considerations and other political and social factors. This variability will depend on the country‟s level of development, capability in air quality management and other factors. The guidelines recommended by WHO acknowledge this heterogeneity and recognize in particular that, in formulating policy targets, governments should consider their own local circumstances carefully before using the guidelines directly as legal standards.
A detailed description of the derivation of the WHO air quality guidelines is contained in the reference cited above. The numerical value of the WHO air quality guidelines for PM10 are based on studies of the health effects associated with PM2.5 exposures in cities located in developed and undeveloped countries throughout the world. A PM2.5:PM10 ratio of 0.5 is used to derive the numerical guideline value for PM10 from the PM2.5 guideline. The following comments are relevant in relation to these tables:
No impact assessment criterion has been specified by OEH for 24-hour average TSP. The Canadian province of Alberta provides a 24-hour average TSP criterion of 100 µg/m³, which is the most stringent criterion of all jurisdictions considered in the review.
The annual average TSP impact assessment criterion adopted by OEH is less stringent than the strictest limits adopted by other jurisdictions considered in the review. The Canadian provinces of Alberta, British Columbia and Ontario and the Government of Canada provide an annual average TSP criterion of 60 µg/m³, which is the most stringent criterion of all jurisdictions considered in the review.
The 24-hour average PM10 impact assessment criterion adopted by OEH is consistent with the strictest limits adopted by other jurisdictions considered in the review.
In New Zealand the ambient air quality standard for PM10 is based on a risk-based approach and is equivalent to the standards set in Australia, the United Kingdom and California. The standard allows for five exceedances of the 24-hour average concentration threshold of 50 µg/m3, with a maximum threshold not to be exceeded of 120 µg/m3. Where the standard is not met, regional councils must make that non-compliance public. In air sheds where the standard is not achieved, regional councils can only grant resource consents if they are confident that the net result of all activities in their air shed results in an improvement in air quality. The New Zealand standard is currently under review.
The annual average PM10 impact assessment criterion adopted by OEH is less stringent than the strictest limits adopted by other jurisdictions considered in the

Katestone Environmental Pty Ltd KE1006953 OEH
June 2011
Page 143
review. The World Health Organisation, California and Scotland provide annual average PM10 criteria that are equal to or less than 20 µg/m³, which are the most stringent criteria of all jurisdictions considered in the review.
No impact assessment criteria have been specified in NSW for PM2.5. Annual average and 24-hour average criteria have been specified by most jurisdictions considered in the review.
The impact assessment criteria for deposited dust adopted in NSW are consistent with the strictest limits adopted by other jurisdictions considered in the review.

Katestone Environmental Pty Ltd KE1006953 OEH
June 2011
Page 144
Table 52 Summary of air quality standards and objectives for 24-hour average total suspended particulates
Jurisdiction Standard/ objective (µg/m
3)
Number of allowable
exceedances Comment
Canada (national)
120 0 Acceptable limit. Based on Canadian National Ambient Air Quality Objectives, converted from ppmv to µg/m³ at 0°C and 1 atmosphere
400 0 Tolerable limit. Based on Canadian National Ambient Air Quality Objectives, converted from ppmv to µg/m³ at 0°C and 1 atmosphere
Ontario, Canada 120 0 Based on Ontario‟s Ambient Air Quality Criteria, converted from ppmv to µg/m³ at 10°C and 1 atmosphere
Quebec, Canada 150 0 The TSP values for Quebec are referred to as „Suspended Particulates‟.
British Columbia, Canada
150 0 Level A
200 0 Level B
260 0 Level C
Alberta, Canada 100 0 Based on pulmonary effects.
China (national)
120 0 Grade I Standard I
300 0 Grade II Standard II
500 0 Grade III Standard III

Katestone Environmental Pty Ltd KE1006953 OEH
June 2011
Page 145
Table 53 Summary of air quality standards and objectives for annual average total suspended particulates
Jurisdiction Standard/ objective
(µg/m3)
Comment
New South Wales, Australia 90 None
Queensland, Australia 90 None
Canada (national)
60 Desirable limit. Based on Canadian National Ambient Air Quality Objectives, converted from ppmv to µg/m³ at 0°C and 1 atmosphere
70 Tolerable limit. Based on Canadian National Ambient Air Quality Objectives, converted from ppmv to µg/m³ at 0°C and 1 atmosphere
Ontario, Canada 60 Based on Ontario‟s Ambient Air Quality Criteria, converted from ppmv to µg/m³ at 10°C and 1 atmosphere
Quebec, Canada 70 Annual geometric average. The TSP values for Quebec are referred to as „Suspended Particulates‟.
British Columbia, Canada
60 Level A
70 Level B
75 Level C
Alberta, Canada 60 Geometric mean.
China
80 Grade I Standard I
200 Grade II Standard II
300 Grade III Standard III

Katestone Environmental Pty Ltd KE1006953 OEH
June 2011
Page 146
Table 54 Summary of air quality standards and objectives for 24-hour average PM10
Jurisdiction
Standard/ objective
(µg/m3)
Number of allowable
exceedances Comment
World Health Organisation 50 3 None
Ambient Air Quality NEPM, Australia
50 5 Applicable in towns with a population greater than 25,000
New South Wales, Australia 50 0 None
Queensland, Australia 50 5 None
Victoria, Australia 60 0 None
New Zealand 50 5
1 None
1201 0 None
United States (national) 150 See comment Not to be exceeded more than once per year on average over 3 years
Wyoming, United States 150 1 None
West Virginia, United States 150 1 None
California, United States 50 0 None
European Union 50 35 Legal nature: Limit value enters into force 1/01/2005
United Kingdom (national) 50 35 To be achieved by 31/12/2004 and maintained thereafter
Scotland, UK 50 7 To be achieved by 31/12/2010 and maintained thereafter. Indicative 2010 objectives for PM10 (from the 2000 Strategy and 2003 Addendum) have been replaced by an exposure reduction approach for PM2.5 (except in Scotland)
Germany 50 35 Immission value of PM10 in order to ensure the protection on human health
Ontario, Canada 50 0 Based on Ontario‟s Ambient Air Quality Criteria, converted from ppmv to µg/m³ at 10°C and 1 atmosphere
British Columbia, Canada 50 0 Level B
South Africa 120 4 Compliance date: 24/12/2009 to 31/12/2014
75 4 Compliance date: From 1/01/2015
China
50 0 Grade I Standard I
150 0 Grade II Standard II
250 0 Grade III Standard III Note 1In response to submissions, the Ministry for the Environment plans to amend the standards to PM10. Regional councils will be required to decide whether to monitor for PM10, to publicly report any
exceedances, and to use the standard as the basis for regional air shed planning. Regional councils will be required to comply with a 'proxy air plan' of no more than 1 exceedance of 50 ug/m3 by
2013. Councils can choose to implement an air quality plan that is stricter than the proxy air plan. The proposed upper limit of 120 ug/m3 will be removed, and the number of allowable exceedances
will be reduced from 5 to 1. No resource consent application will be granted where that consent is the primary source of exceedances. In a polluted airshed, an application may be granted if it will not adversely affect air quality improvement as accounted for in the regional air quality plan.

Katestone Environmental Pty Ltd KE1006953 OEH
June 2011
Page 147
Table 55 Summary of air quality standards and objectives for annual average PM10
Jurisdiction Standard/ objective
(µg/m3)
Comment
World Health Organisation 20 None
New South Wales, Australia 30 None
Wyoming, United States 50 None
California, United States 20 Annual arithmetic mean
European Union 40 Legal nature: Limit value enters into force 1/01/2005
United Kingdom (national) 40 To be achieved by 31/12/2004 and maintained thereafter
Scotland, UK 18 To be achieved by 31/12/2010 and maintained thereafter. Indicative 2010 objectives for PM10 (from the 2000 Strategy and 2003 Addendum) have been replaced by an exposure reduction approach for PM2.5 (except in Scotland)
Germany 40 Immission value of PM10 in order to ensure the protection on human health
South Africa 50 Compliance date: 24/12/2009 to 31/12/2014
40 Compliance date: From 1/01/2015
Table 56 Summary of air quality standards and objectives for 1-hour average PM2.5
Jurisdiction
Standard/ objective
(µg/m3)
Number of allowable
exceedances Comment
Alberta, Canada 80 0 Derived from Canada wide objective

Katestone Environmental Pty Ltd KE1006953 OEH
June 2011
Page 148
Table 57 Summary of air quality standards and objectives for 24-hour average PM2.5
Jurisdiction
Standard/ objective
(µg/m3)
Number of allowable
exceedances Comment
World Health Organisation 25 3 None
Ambient Air Quality NEPM, Australia
25 0 Goal is to gather sufficient data nationally to facilitate a review of the Advisory Reporting Standards as part of the review of this measure scheduled to commence in 2005.
Queensland, Australia 25 0 None
Victoria, Australia 36 0 None
3 0 Respirable crystalline silica as PM2.5
United States (national) 35 See comment To attain this standard, the 3-year average of the 98th percentile of 24-hour concentrations at each population-oriented monitor within an area must not exceed 35 µg/m
3
Wyoming, United States 65 See comment The 98.0
th percentile or 7
th highest 24-hour average concentration is assessed. The standard is
currently under review since the amendment of the NAAQS of PM2.5 to 35 µg/m3.
West Virginia, United States 35 See comment The 98.0th
percentile or 7th highest 24-hour average concentration is assessed
California, United States 35 See comment
There is no separate 24-hour average PM2.5 standard in California; however, the USEPA standard of 35 µg/m
3 applies. To attain this standard, the 3-year average of the 98th percentile
of 24-hour concentrations at each population-oriented monitor within an area must not exceed 35 µg/m
3.
Canada (national) 30 0 Based on Canadian National Ambient Air Quality Objectives, converted from ppmv to µg/m³ at 0°C and 1 atmosphere
Ontario, Canada 30 See comment Based on Ontario‟s Ambient Air Quality Criteria, converted from ppmv to µg/m³ at 10°C and 1 atmosphere. 98th Percentile averaged over 3 consecutive years.
Quebec, Canada 30 0 None
British Columbia, Canada 25 0 Based on annual 98th percentile value
Alberta, Canada 30 0 Based on Canada wide objective
Table 58 Summary of air quality standards and objectives for 3-year average PM2.5
Jurisdiction Standard/ objective
(µg/m3)
Comment
European Union
20 Exposure concentration obligation. Legally binding in 2015 (years 2013, 2014, 2015)
18 Exposure reduction target. Reduction to be attained in 2020, determined on the basis of the value of exposure indicator in 2010
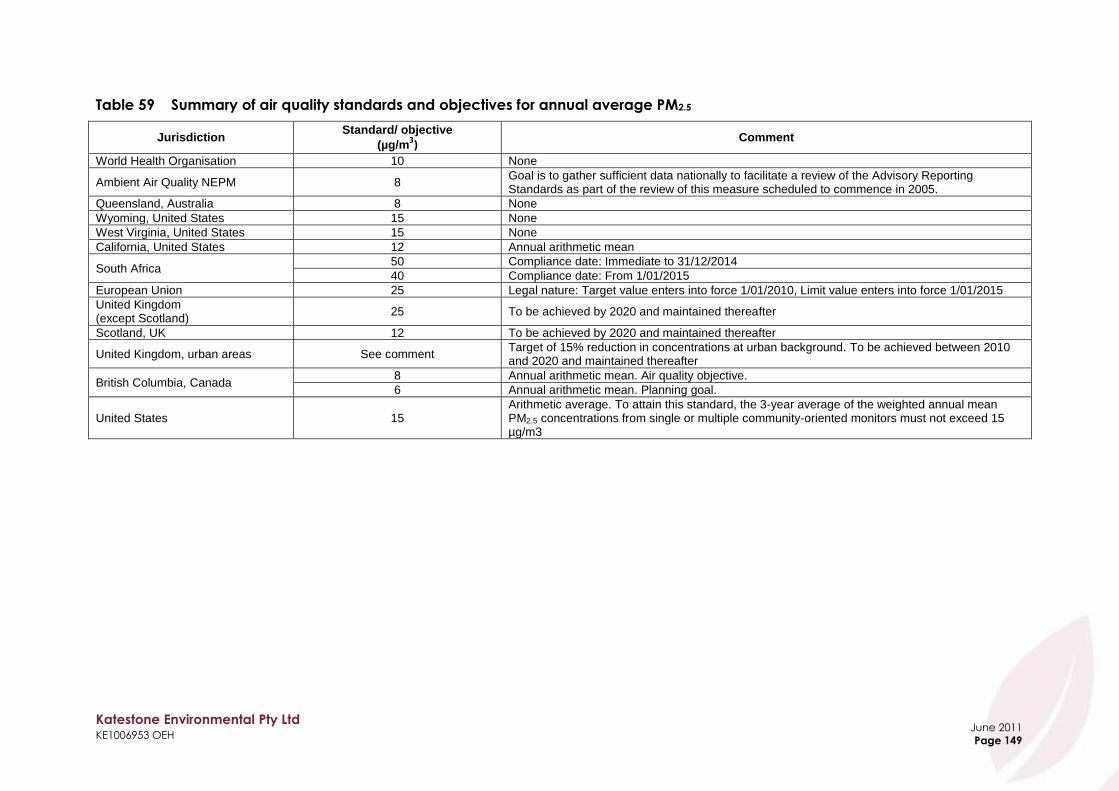
Katestone Environmental Pty Ltd KE1006953 OEH
June 2011
Page 149
Table 59 Summary of air quality standards and objectives for annual average PM2.5
Jurisdiction Standard/ objective
(µg/m3)
Comment
World Health Organisation 10 None
Ambient Air Quality NEPM 8 Goal is to gather sufficient data nationally to facilitate a review of the Advisory Reporting Standards as part of the review of this measure scheduled to commence in 2005.
Queensland, Australia 8 None
Wyoming, United States 15 None
West Virginia, United States 15 None
California, United States 12 Annual arithmetic mean
South Africa 50 Compliance date: Immediate to 31/12/2014
40 Compliance date: From 1/01/2015
European Union 25 Legal nature: Target value enters into force 1/01/2010, Limit value enters into force 1/01/2015
United Kingdom (except Scotland)
25 To be achieved by 2020 and maintained thereafter
Scotland, UK 12 To be achieved by 2020 and maintained thereafter
United Kingdom, urban areas See comment Target of 15% reduction in concentrations at urban background. To be achieved between 2010 and 2020 and maintained thereafter
British Columbia, Canada 8 Annual arithmetic mean. Air quality objective.
6 Annual arithmetic mean. Planning goal.
United States 15 Arithmetic average. To attain this standard, the 3-year average of the weighted annual mean PM2.5 concentrations from single or multiple community-oriented monitors must not exceed 15 µg/m3
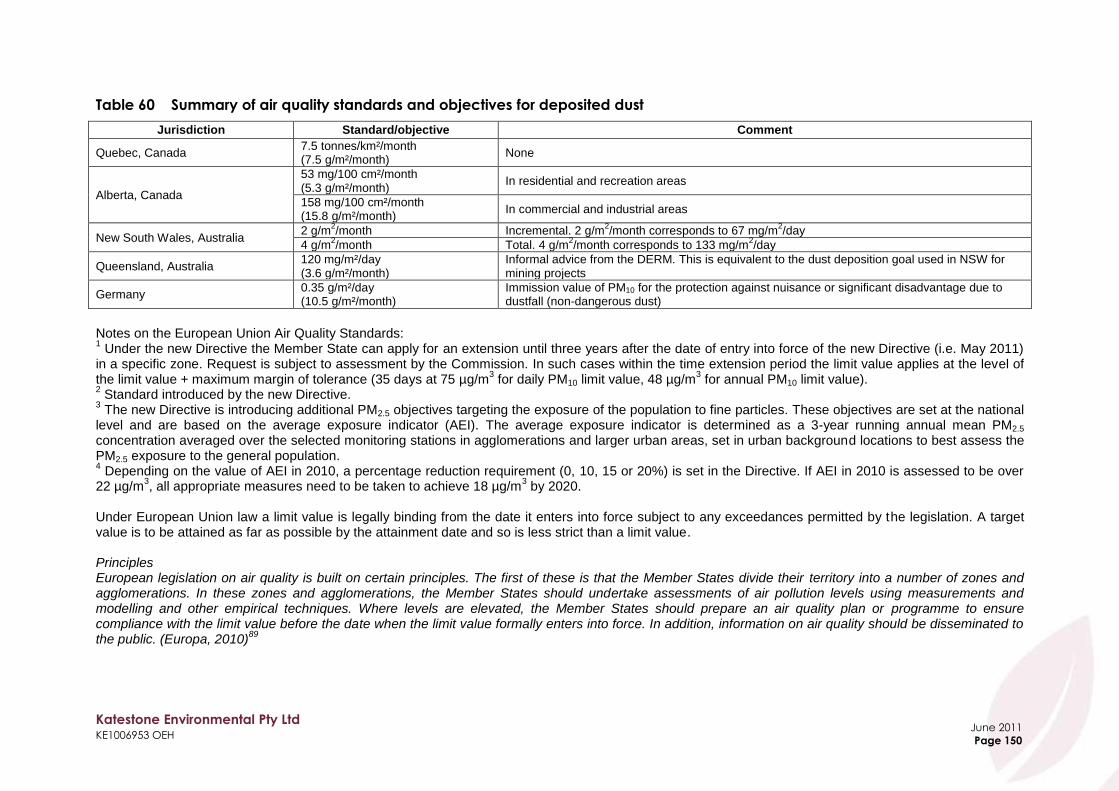
Katestone Environmental Pty Ltd KE1006953 OEH
June 2011
Page 150
Table 60 Summary of air quality standards and objectives for deposited dust
Jurisdiction Standard/objective Comment
Quebec, Canada 7.5 tonnes/km²/month (7.5 g/m²/month)
None
Alberta, Canada
53 mg/100 cm²/month (5.3 g/m²/month)
In residential and recreation areas
158 mg/100 cm²/month (15.8 g/m²/month)
In commercial and industrial areas
New South Wales, Australia 2 g/m
2/month Incremental. 2 g/m
2/month corresponds to 67 mg/m
2/day
4 g/m2/month Total. 4 g/m
2/month corresponds to 133 mg/m
2/day
Queensland, Australia 120 mg/m²/day (3.6 g/m²/month)
Informal advice from the DERM. This is equivalent to the dust deposition goal used in NSW for mining projects
Germany 0.35 g/m²/day (10.5 g/m²/month)
Immission value of PM10 for the protection against nuisance or significant disadvantage due to dustfall (non-dangerous dust)
Notes on the European Union Air Quality Standards: 1 Under the new Directive the Member State can apply for an extension until three years after the date of entry into force of the new Directive (i.e. May 2011)
in a specific zone. Request is subject to assessment by the Commission. In such cases within the time extension period the limit value applies at the level of the limit value + maximum margin of tolerance (35 days at 75 µg/m
3 for daily PM10 limit value, 48 µg/m
3 for annual PM10 limit value).
2 Standard introduced by the new Directive.
3 The new Directive is introducing additional PM2.5 objectives targeting the exposure of the population to fine particles. These objectives are set at the national
level and are based on the average exposure indicator (AEI). The average exposure indicator is determined as a 3-year running annual mean PM2.5 concentration averaged over the selected monitoring stations in agglomerations and larger urban areas, set in urban background locations to best assess the PM2.5 exposure to the general population. 4 Depending on the value of AEI in 2010, a percentage reduction requirement (0, 10, 15 or 20%) is set in the Directive. If AEI in 2010 is assessed to be over
22 µg/m3, all appropriate measures need to be taken to achieve 18 µg/m
3 by 2020.
Under European Union law a limit value is legally binding from the date it enters into force subject to any exceedances permitted by the legislation. A target value is to be attained as far as possible by the attainment date and so is less strict than a limit value. Principles European legislation on air quality is built on certain principles. The first of these is that the Member States divide their territory into a number of zones and agglomerations. In these zones and agglomerations, the Member States should undertake assessments of air pollution levels using measurements and modelling and other empirical techniques. Where levels are elevated, the Member States should prepare an air quality plan or programme to ensure compliance with the limit value before the date when the limit value formally enters into force. In addition, information on air quality should be disseminated to the public. (Europa, 2010)
89

Katestone Environmental Pty Ltd KE1006953 OEH
June 2011
Page 151
9. International Techniques for Controlling Particulate Matter
Emissions from Coal Mining
This section summarises the results of research into international techniques for controlling particulate emissions from coal mining. Best practice measures have been identified and the reduction in emissions that is achievable through the application of best practice has been quantified where possible.
9.1 Introduction
The literature review aimed to provide a comprehensive statement of techniques used internationally for the management of particulate matter emissions from coal mining activities. The review has focused on literature from a range of sources including:
Government departments/agencies (e.g. legislation, guidelines, handbooks, research)
Journal papers and articles
Information published by coal mining companies The review has focused on literature published in major coal producing countries that are likely to have spent significant resources on development of measures to minimise emissions from coal mining activities. Key countries include:
Australia
United States
Canada
Germany
United Kingdom Information has also been drawn from:
South Africa
India
China
Russia
European Union Best practice has been determined considering the EU48 and EPA Victoria46 definitions of best practice, namely:
“the best combination of eco-efficient techniques, methods, processes or technology used in an industry sector or activity that demonstrably minimises the environmental impact of a generator of emissions in that industry sector or activity” "best available techniques" means the most effective and advanced stage in the development of activities and their methods of operation which indicate the practical suitability of particular techniques for providing in principle the basis for emission limit values designed to prevent and, where that is not practicable, generally to reduce emissions and the impact on the environment as a whole:

Katestone Environmental Pty Ltd KE1006953 OEH
June 2011
Page 152
(a) "techniques" shall include both the technology used and the way in which the installation is designed, built, maintained, operated and decommissioned
(b) "available techniques" means those developed on a scale which allows implementation in the relevant industrial sector, under economically and technically viable conditions, taking into consideration the costs and advantages, whether or not the techniques are used or produced inside the Member State in question, as long as they are reasonably accessible to the operator
(c) "best" means most effective in achieving a high general level of protection of the environment as a whole
The focus of the literature review has been to identify techniques that are used in the coal mining industry that have been demonstrated to achieve a reduction in emissions of particulate matter. The starting point of this literature review is the estimation and prioritisation of emission sources. Quantification of emissions of particulate matter from coal mining activities has been conducted, as detailed in Section 7, using emission factors from the NPI Emission Estimation Technique (EET) Manual for Mining10 and US Environmental Protection Agency‟s (US EPA) AP-42 emission factors125. The NPI emission factors were based on US Environmental Protection Agency AP-42 emission factors that were in print at the time that the NPI EET Manual for Mining was produced and, to a lesser extent, factors developed jointly by the State Pollution Control Commission (SPCC) and the NSW Coal Association in the 1980s126. The following general equation is used to calculate the emission rate of an air pollutant using emission factors.
Where:
E is the emission rate in units of mass per unit time. EFi,j is the uncontrolled emission factor for source i and pollutant j in units of mass per unit activity rate. A is the activity rate. CFi,j,k is the control factor achieved for source i and pollutant j by applying control k, as a percent.
The terms control factor and control efficiency are used interchangeably in the NPI EET Manual for Mining. However, in other jurisdictions such as in Michigan in the United States, the control efficiency and control factor are defined as the complement of each other. That is CE = (1-CF/100).

Katestone Environmental Pty Ltd KE1006953 OEH
June 2011
Page 153
For consistency with the NPI, the control factor is calculated as follows:
Where:
CFi,j,k is the control factor achieved for source i and pollutant j by applying control k, as a percent. Ei,j is the uncontrolled emission rate for source i and pollutant j. Ei,j,k is the controlled emission rate achieved for source i and pollutant j by applying control k.
As defined above, the control factor is equivalent to the term Overall Emission Reduction Efficiency (ER) that is used by the US EPA127. The general form of the emission equation that is used by the US EPA to estimate emissions is as follows:
Where:
E is the emission rate EF is the uncontrolled emission factor A is the activity rate ER is the overall emission reduction efficiency, as a percent
Whilst the quantification and prioritisation of emissions has been based on the best Australian information there are some potential issues with the NPI EET Manual for Mining, including:
Some of the emission factors in the NPI derive from older editions of AP-42 that have been subsequently withdrawn.
The NPI does not provide information on the valid range of the variables (such as moisture and silt content) used in the equations, although defaults are provided. The AP-42 emission factors125 include a valid range of values for the variables based on the test work that produced the emission factors and the geometric mean of the variables.
There is no supporting information or guidance for the correct use of the control factors.
The following sections include a comparison of the emission factors from the NPI EET Manual for Mining with the emission factors published in AP-42. Recommendations from the comparison to improve emission estimation using emission factors are as follows:
Greater reliance should be placed on the current version of AP-42 emission factors in impact assessment and in future development of emissions inventories.
Testing should be conducted at NSW coal mines using techniques that are equivalent to those used to develop the AP-42 emission factors to evaluate the suitability of the AP-42 emission factors for conditions in NSW. Relevant findings and guidance on the local application of the AP-42 emission factors could be incorporated into a guidance document for estimating emissions from mining activities.

Katestone Environmental Pty Ltd KE1006953 OEH
June 2011
Page 154
Where the AP-42 emission factors are reproduced in guidance documents, valid ranges of variables and geometric means that can be used with the AP-42 emission factors should also be reproduced with the emission factors.
Default emission factors should be avoided. The onus to demonstrate the validity of data should remain with the coal mine. Air quality impact assessments that have been reviewed within this study were found to rarely rely upon local measurements of variables such as surface silt and moisture contents. Such data should be routinely collected and used in emission estimation.
9.2 Haul roads
9.2.1 Overview
Of all sources of particulate matter from coal mining activities in the GMR, wheel generated emissions, which is mainly generated by trucks travelling on unsealed haul roads, has been ranked number 1 in terms of emissions of TSP and PM10 and number 2 in terms of emissions of PM2.5. Haul roads have been estimated to contribute 52.4% of TSP, 39.1% of PM10 and 22.6% of PM2.5 emissions from coal mines in the GMR. Grading of haul roads has been ranked number 13 in terms of emissions of TSP and number 14 in terms of emissions of PM10 and PM2.5. Grading has been estimated to contribute 0.4% of TSP and 0.3% of PM10 and PM2.5 emissions from coal mines in the GMR. The review of international literature relating to the control of particulate matter emissions from wheel action on haul roads identified that an extensive amount of research has been conducted into this issue. The NPI emission estimation equations for unpaved haul roads and graders10 are reproduced in Table 61 and Table 62. Table 63 and Table 64 show the NPI default emission factor equation variables and range and geometric mean of variables from the AP-42 for haul roads and graders.
Table 61 NPI and AP-42 TSP and PM10 emission factor equations for haul roads
Species NPI10
AP-42128
TSP
PM10
Notes Where: EFTSP is the TSP size specific emission factor (kg/km) EFPM10 is the PM10 size specific emission factor (kg/km) s is the surface material silt content (%) W is the mean vehicle weight in tonnes M is the surface material moisture content (%)
Where: EFTSP is the TSP size specific emission factor (kg/km) EFPM10 is the PM10 size specific emission factor (kg/km) s is the surface material silt content (%) W is the mean vehicle weight in tonnes 0.4536 is the unit conversion factor kg/lb 1.6093 is the unit conversion factor km/mile 1.1023 is the unit conversion factor tonne/ton
Table 62 NPI and AP-42 TSP and PM10 emission factor equations for graders
Species NPI10
AP-42125
TSP PM10 Notes Where:
EFTSP is the TSP size specific emission factor (kg/km) EFPM10 is the PM10 size specific emission factor (kg/km) S is the mean vehicle speed in km/hr
Where: EFTSP is the TSP size specific emission factor (kg/km) EFPM10 is the PM10 size specific emission factor (kg/km) S is the mean vehicle speed in km/hr

Katestone Environmental Pty Ltd KE1006953 OEH
June 2011
Page 155
Table 63 Emission factor equation variables for haul roads showing NPI default
values and range and geometric means of AP-42 variables
Parameter NPI Defaults10 AP-42125
Range Geometric mean
Surface material silt content (%) 10 1.2-19.2 4.3
Mean vehicle weight (tonnes) 48 20.9-260 110
Surface material moisture content (%) 2 0.3-20.1 2.4
Table 64 Emission factor equation variable for graders showing NPI default value
and range and geometric mean of AP-42 variable
Parameter NPI Defaults10 AP-42125
Range Geometric mean
Vehicle speed (km/hr) - 8.0-19.0 11.4
Figure 45 is a plot showing the sensitivity of the NPI emission estimation equation for PM10 to average vehicle weight, surface silt and moisture contents. Also plotted is the AP-42 emission estimation equation. The solid lines in the plot represent the results of the NPI emission estimation equation for the range of silt and moisture contents specified in AP-42, with the dotted lines representing the results of the AP-42 emission estimation equation. The red solid and dotted lines represent the results of the NPI and AP-42 emission estimation equations respectively, for the default conditions defined in the NPI EET Manual for Mining. The NPI emission estimation equation for unpaved roads is similar to the current AP-42 equation with the exceptions that AP-42 does not include the moisture term and there are differences in the values of the exponents. In effect, the AP-42 emission estimation equation is set at a neutral moisture level of 0.2% relative to the NPI emission estimation equation. The plot shows that the NPI emission estimation equation produces a higher upper bound set of results when the lower bound moisture content and upper bound surface silt contents are used. The upper bound set of results for the NPI emission estimation equation is between 2.1 and 2.3 times higher than the upper bound result using the AP-42 emission estimation equation. The lower bound results for the AP-42 estimation equation are more than two times higher than the lower bound results for the NPI emission estimation equation. The NPI default moisture level of 2% provides a 50% reduction in particulate matter emissions compared with the AP-42 default moisture level of 0.2%. The differences are due to:
The effect of moisture in the NPI emission estimation equation, which causes the NPI emission factor to be higher than the AP-42 emission factor by 1.76 times for a low moisture content and lower than the AP-42 emission factor by a factor of 0.29 for high moisture contents.
The k factors (after correcting for the difference in units (lb/mile vs kg/km)), which causes the NPI emission factor to be higher than the AP-42 emission factor by 1.73 times.
Differences in the exponents in the emission estimation equations and the apparent failure of the NPI emission estimation equation to correct from imperial short tons to metric tonnes. Combined these result in the NPI emission estimation equation being lower than the AP-42 emission estimation equation by a factor of 0.77.
Based on the information presented in Figure 45, the NPI emission estimation equations for the default surface silt and moisture contents appear to be low by a factor of 0.66 to 0.71 depending on the vehicle weight.
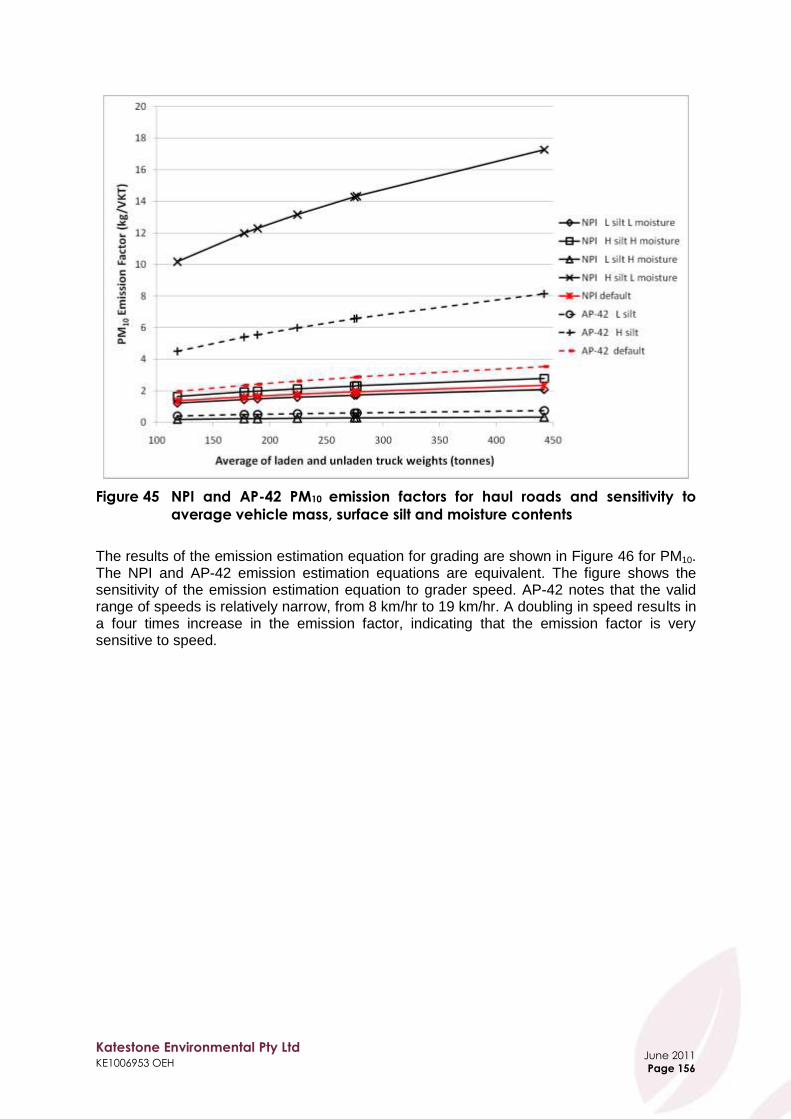
Katestone Environmental Pty Ltd KE1006953 OEH
June 2011
Page 156
Figure 45 NPI and AP-42 PM10 emission factors for haul roads and sensitivity to
average vehicle mass, surface silt and moisture contents
The results of the emission estimation equation for grading are shown in Figure 46 for PM10. The NPI and AP-42 emission estimation equations are equivalent. The figure shows the sensitivity of the emission estimation equation to grader speed. AP-42 notes that the valid range of speeds is relatively narrow, from 8 km/hr to 19 km/hr. A doubling in speed results in a four times increase in the emission factor, indicating that the emission factor is very sensitive to speed.
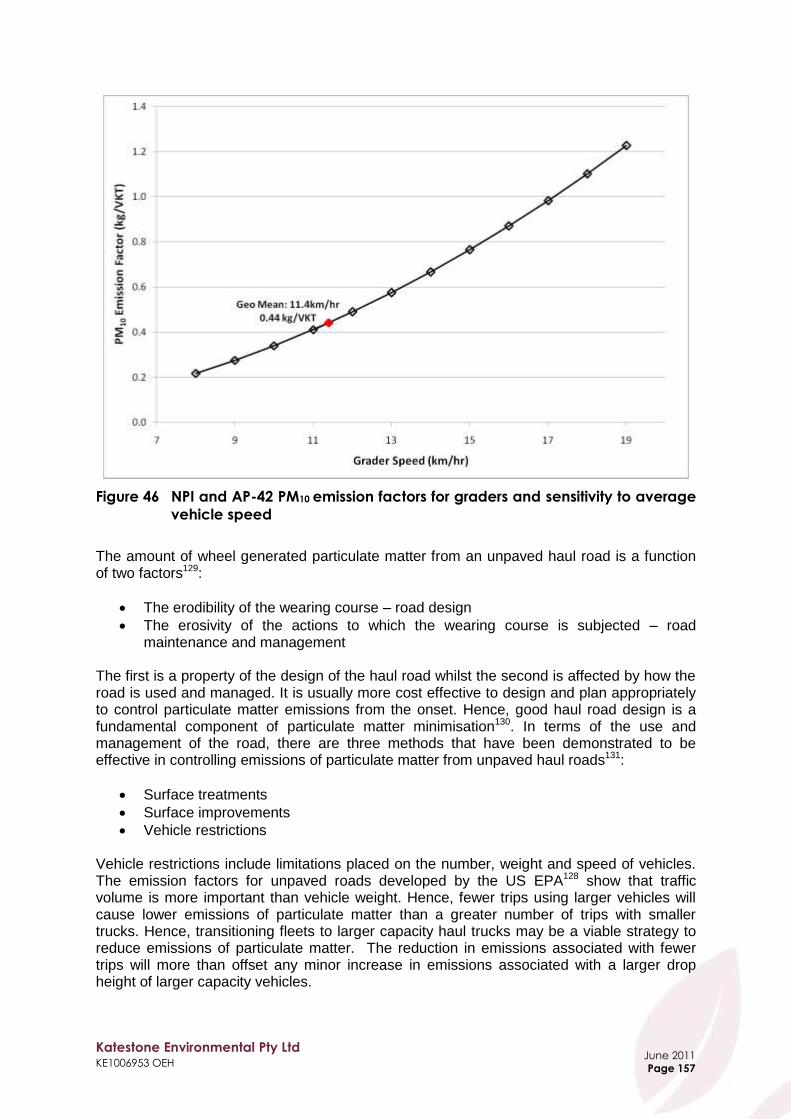
Katestone Environmental Pty Ltd KE1006953 OEH
June 2011
Page 157
Figure 46 NPI and AP-42 PM10 emission factors for graders and sensitivity to average
vehicle speed
The amount of wheel generated particulate matter from an unpaved haul road is a function of two factors129:
The erodibility of the wearing course – road design
The erosivity of the actions to which the wearing course is subjected – road maintenance and management
The first is a property of the design of the haul road whilst the second is affected by how the road is used and managed. It is usually more cost effective to design and plan appropriately to control particulate matter emissions from the onset. Hence, good haul road design is a fundamental component of particulate matter minimisation130. In terms of the use and management of the road, there are three methods that have been demonstrated to be effective in controlling emissions of particulate matter from unpaved haul roads131:
Surface treatments
Surface improvements
Vehicle restrictions Vehicle restrictions include limitations placed on the number, weight and speed of vehicles. The emission factors for unpaved roads developed by the US EPA128 show that traffic volume is more important than vehicle weight. Hence, fewer trips using larger vehicles will cause lower emissions of particulate matter than a greater number of trips with smaller trucks. Hence, transitioning fleets to larger capacity haul trucks may be a viable strategy to reduce emissions of particulate matter. The reduction in emissions associated with fewer trips will more than offset any minor increase in emissions associated with a larger drop height of larger capacity vehicles.
Katestone Environmental Pty Ltd KE1006953 OEH
June 2011
Page 158
Surface improvements include using materials with a lower silt content to construct haul roads. Typically haul road construction material is sourced onsite, if this material has poor bonding properties or a high proportion of fine material (e.g. silt) the dustiness of the haul road may increase along with the costs of maintaining the road surface. Increasing the amount of large aggregates in the construction material by adding gravel or slag can reduce the dustiness of haul roads and reduce maintenance costs as the road is less susceptible to deterioration. Surface treatments or suppressants by their nature will require reapplication. However, improving the wearing course will increase the longevity of the surface treatment resulting in the need for fewer applications132.
9.2.2 Design
The design of a haul road needs to consider a number of elements and one of these is the minimisation of particulate matter emissions. The design factors that are relevant to the minimisation of these emissions are:
Design of haul road cross section o The preparation of a suitable road sub-base. Thompson & Visser137 recommend
a California Bearing Ratio (CBR) of over 80% for the wearing course material to minimise rutting, sinking and overall deterioration of the road. The California Bearing Ratio (CBR) is a test undertaken to compare the bearing capacity of a given soil as a percentage of the bearing capacity of well-graded crushed stone (a high quality crushed stone should have a CBR of 100%).
o The placement of materials within the cross section of the haul roads so the stiffest material is placed as close to the upper surface as possible133.
o The amount of compaction of material within the cross sectional design.
Road construction materials
o The composition of the material used for the haul road has a significant impact on the tendency for emissions of particulate matter to occur134. Thompson & Visser137 document an approach to the selection of appropriate wearing course materials and recommend some material selection guidelines. The surface material selected for haul road construction is most frequently gravel or crushed stone. This is mainly due to cost effectiveness of the material and availability137. However, the actual cost effectiveness of this material may be poor over the longer term if a large amount of maintenance is required137.
o The type of aggregate used dictates the most suitable approaches to control particulate matter emissions135. For example, for gravel road surfaces with minimal fines, chemical suppressants cannot compact the surface or form a new surface and therefore do not provide a substantial additional benefit from watering alone.
o The durability of the material used for the road surface is critical. As part of the
compilation of the Guidelines for Mine Haul Road Design in Canada, Tannant & Regensburg133 surveyed mines in Canada. It was found that 91% of mines reported haul road deterioration was caused by watering, rain and run off. The deterioration of a haul road may lead to increased nuisance issues. However, a
Katestone Environmental Pty Ltd KE1006953 OEH
June 2011
Page 159
well-designed haul road will resist deterioration and will enable management and maintenance actions to be implemented more readily, improving energy efficiency, driver comfort and emissions of particulate matter as a consequence.
Road surface o Particulate matter emissions are proportional to the silt content of the material
used for the road (i.e. lower silt content will result in a lower emission rate of particulate matter).
o The silt content of the road surface will determine how successful suppressants may be. For example at silt contents greater than 20-25% suppressants are unlikely to be effective135.
Haulage road planning and alignment o Particulate matter emissions are proportional to VKT (i.e. lower VKT will result in
a lower emission rate of particulate matter). o The amount of traffic and speed of vehicles on unpaved haul roads has been
shown to be an effective mitigation technique136. o Haul roads that are redundant should be shut down and revegetated as soon as
practical. o Conveyors can be used in place of haul roads, particularly on high traffic routes
that are relatively static during the mine life. A well planned and designed haul road will allow for easier management and maintenance, increased productivity (becoming more cost effective) and minimise emissions of particulate matter.
9.2.3 Maintenance and management
The objective of road maintenance is to restore the road to (or as near to as possible) the original design, whilst management of the road is aimed at effectively controlling particulate matter through a range of surface improvement and treatments. Thomson & Visser137 introduce the concept of structured management maintenance systems (MMS) for mine haul roads. The ideal maintenance strategy for mine haul roads minimises total road user costs as the mine must operate and maintain the haul route137. The term user cost encompasses road maintenance costs and vehicle operating costs137. The maintenance program selected should aim to optimise both of these costs. The issue of inadequate maintenance has been observed to be a problem in Indian mines, where for example, sprinkler systems were shown to be installed but not working properly138. An audit and compliance regime is important to ensure that available infrastructure is maintained to ensure that emissions of particulate matter are minimised in practice.
9.2.4 Surface improvements
The obvious improvement in this area is the paving of a previously unpaved area131. This would provide the most effective control method for the emissions of particulate matter129. However, this solution has a high financial cost and therefore may not be suitable for many coal mining activities due to their size and nature. A paved haul road would still require ongoing maintenance and would need to be swept regularly to remove surface silt.
Katestone Environmental Pty Ltd KE1006953 OEH
June 2011
Page 160
An alternative to paving is the addition of lower silting materials to the surface of a haul road131. Lower silting materials include gravel, aggregate and the resurfacing of haul roads as part of haul road maintenance. The use of fly ash may be appropriate in coal mines that are located within close proximity to a power station. Fly ash can be used as an economical cementing agent to improve the construction material properties133. The exact effectiveness of using this product is determined by the proportion of calcium oxide in the fly ash. If there is a high percentage of calcium oxide then the product will be self cementing133. The use of this product has been done on a trial basis at a mine in Canada133. The gradation of materials can be used to restore the surface layer of the haul road by removing ruts, potholes and smoothing the surface layer.
9.2.5 Surface treatments
The choice of treatment (water or suppressants) will be dependent on a number of factors such as cost, road surface type and availability.
9.2.5.1 Watering
Watering of haul roads is a standard practice in the majority of coal producing countries as it is an effective method to control emissions of particulate matter. However, where water supply is limited or costly, watering may not be an adequate or desirable solution. In addition, watering of roads can result in a slippery surface and in some cases the addition of water can lead to the production of increased fine particles139. The loss of fine particulates from the surface through run off and wind erosion can cause an increase in surface roughness and lead to the formation of potholes and a destruction of the haul road surface139. Water carts are the most common technique used for the application of water to haul roads. New water truck technology includes the following:
Water sprayed as a function of ground speed versus motor speed for reduced water wastage
Finer mists from spray bars
Closer proximity of spray heads to the ground surface
Adding surfactants to improve water performance
GPS tracking of spray areas139 Watering can be applied using a variety of methods and is not limited to a traditional water cart. The type of spraying system technology selected depends on the source of particulate matter emissions and local conditions. There is a range of different spray types and nozzles utilised to optimise the beneficial effects of watering140. An ultrasonic dry fogging system can apply watering using a compression system, with a water droplet size of 0.3-0.5 mm. For each volume unit the number of droplets will increase as droplet size decreases. The smaller the droplet size the larger surface area affinity for particles increases. This system can thereby agglomerate and suppress emissions of particulate matter at the source141. The NPI handbook provides two control factors for watering based on the water application rate:
Level 1 watering (2 litres/m²/hr): 50%
Level 2 watering (>2 litres/m²/hr): 75%
Katestone Environmental Pty Ltd KE1006953 OEH
June 2011
Page 161
9.2.5.2 Chemical suppressants
Chemical suppressants can either compact the surface or form a new surface. The type of suppressant will depend on the road material that needs to be controlled and the rate and characteristics of the traffic135. It is important to prepare the road surface in a suitable manner to enhance the effectiveness of the specific suppressant method142. For example, some suppressants require a dry surface for application, whilst others require a surface that is not compacted. The control efficiencies of suppressants depend on:
Dilution rate of the mixture
Application rate
Time between applications
Size, speed and volume of traffic
Meteorological conditions
Characteristics of the road The ARRB Group (formerly the Australian Road Research Board) undertook a literature review of over 110 reports documenting suppressants129. The aim of the report was to document the effectiveness of a range of suppressants using the results from 30 of these reports in conjunction with survey answers from Local Authorities in Australia. This document may be used as a reference guide to the range of suppressants available as it contains supplier data and economic analyses. The report included two figures in the form of flow charts that show decision makers how to select an appropriate control method and how to select a suitable chemical suppressant. Suppliers of suppressants to the Australian market have supplied information about the benefits of their products for controlling emissions from haul roads. Dust deposition observations were conducted on a typical open cut coal mine site to determine the effectiveness of chemical suppressants on coal mine haul roads. Under identical operational conditions, dust deposition was 37% less following application of the suppressant compared with the application of water (L. Xavier, Vital Chemical Pty Ltd, 25 June 2010, pers. comm.). Operating costs were also compared for water application and suppressant solution application by Vital Chemical. It was noted that lower water tanker operational hours were required for suppressant solution application than were required for application of water only. The lower operational costs balanced the cost of suppressant chemical, resulting in reduced haul road emissions with a very small increase in overall operational cost (L. Xavier, Vital Chemical Pty Ltd, 25 June 2010, pers. comm.).
An Australian study by RST – Dust Earth and Water Solutions (P. Heinburger, RST – Dust Earth and Water Solutions, pers. comm. 5 July 2010) of typical haul road management operations concluded that use of suppressant solution achieved the following compared with use of water only:
Reduction in water applied per square metre: 57%
Time between watering: 166.7% However, variable operating conditions at open cut mine sites may warrant different strategies. The most cost effective management strategy may require a mix of suppressant application combined with water application. Water application may be used following previous application of suppressant solution to reactivate the previously applied suppressant
Katestone Environmental Pty Ltd KE1006953 OEH
June 2011
Page 162
chemical. A typical application rate for both options is likely to be one litre per square metre for each pass of haul road surface. The proportion of suppressant chemical in water varies with product supplier recommendations, but a typical solution could comprise 5% chemical. Cost of suppressant has been quoted as $0.14 per square metre for an average program. Frequency of application also varies with different products and is dependent on traffic frequency. Application has been quoted as low as fortnightly for the first two months and then monthly for the next four to six months (L. Xavier, Vital Chemical Pty Ltd, 25 June 2010, pers. comm.). The US Department of Agriculture has published a document titled Dust Palliative and Selection Application Guide143. The document contains details of the attributes, application rates and origin of a range of suppressants. It is important to acknowledge that cost effectiveness is an important issue, but also the availability of materials with which to derive a chemical suppressant is particularly critical. This document also has a flow chart detailing the decision making process for selecting a cost effective suppressant. The following categories of suppressants are identified in the literature134:
Hygroscopic salts
Lignosulphonates
Petroleum (or sulphonated petroleum) resins
Tar- and bitumen-emulsion products
Polymer emulsions Table 65 shows a summary of the above chemical suppressants by climate, wearing course and traffic limitations, as taken from Thompson & Visser134. Thompson & Visser134 found that for spray-on techniques the control efficiencies observed were in the 40 to 60% range and decrease rapidly over time whereas for the mix-in techniques this range was higher at 60 to 70% for the first 7 weeks. The highest control efficiency measured was 92% for tar/bitumen emulsion products, immediately following application. The work of Thompson & Visser134 highlights that suppressants are not the only solution to manage particulate matter emissions if the course wearing material is the cause of particulate matter emissions.

Katestone Environmental Pty Ltd KE1006953 OEH
June 2011
Page 163
Table 65 A summary of usability issues for each suppressant class
Hygroscopic salts Lignosulphonates Petroleum-and-tar
bitumen based products
Others (sulponated petroleum, Ionic products,
polymers and enzymes)
Climatic limitations
Salts lose effectiveness in continual dry periods with low relative humidity. Selection dependant on relative humidity and potential to water road surface.
Retains effectiveness during long dry periods with low humidity.
Generally effective, regardless of climate but will pothole (small diameter) in wet weather where fines content of wearing course is high.
Generally effective, regardless of climate.
Wearing course material limitations
Recommended for use with moderate surface fines (max 10-20%<0.075 mm). Not suitable for low fines materials or high shrinkage product/PI
1 low
CBR2 or slippery materials.
Recommended for use where high (<30%< 0.075 mm) fines exist in a dense graded travel with no loose material.
Performs best with low fines content (<10%<0.075 mm). Use low viscosity products on dense fine grained material, more viscous products on looser, open-textured material.
PI range 8-35 Fines limit 15-55% <0.075 mm. Minimum density ratio 98%. Performance may be dependent on clay mineralogy (enzymes).
Treatment maintenance and self-repair capability
Reblade under moist conditions. CaCl2 is more amenable to spray-on application. Low shrinkage product materials may shear and corrugate with high speed trucks. Shear can self-repair.
Best applied as an initial mix-in and quality of construction important. Low shrinkage product materials may shear and corrugate with high speed trucks. Tendency to shear or form „biscuit‟ layer in dry weather – not self- repairing.
Requires sound base and attention to compaction moisture content. Slow speed, tight radius turning will cause shearing – not self-repairing, but amenable to spot repairs.
Mix-in application-sensitive to construction quality. Difficult to maintain – rework. Generally no problem once cured.
Tendency to leach out or accumulate
Leaches down or out of pavement. Repeated applications accumulate.
Leaches in rain if not sufficiently cured. Gradually oxidize and leach out. Repeated applications accumulate.
Does not leach Repeated applications accumulate.
Efficiency depends on the cation exchange capacity of the host material. Repeated applications accumulate.
Comments A high fines content may become slippery when wet. Corrosion problems may result.
Generally ineffective if wearing course contains little fine material or there is excessive loose gravel on the road.
Long lasting – more effective in dry climates. May cause layering after several spray-on re-treatments especially where fines content is >15%.
Generally ineffective if material is low in fines content or where loose gravel exists on surface. Curing period required.
Notes 1 Plasticity index
2 California bearing ratio (%)
Katestone Environmental Pty Ltd KE1006953 OEH
June 2011
Page 164
9.2.6 Summary
Wheel generated particulate matter associated with trucks travelling on unpaved haul roads is a major source of particulate matter emissions and so haul roads require a significant amount of attention in their design, maintenance and management to minimise emissions. Best practice haul road design should include:
Minimisation of the distance travelled by taking the most direct route to the destination
Road safety (minimise steepness of ramps to less than 8%, eliminate sweeping intersections and avoid potential for equipment interactions)
Optimise surface drainage, particularly at intersections
Optimise base materials to reduce silt content and increase the retention of larger aggregates, particularly at intersections
Restrict vehicle speeds on all roads to 40 km/hr or less
Use larger trucks to minimise number of trips Best practice haul road maintenance should include:
Scheduled grading and gravelling of heavy traffic areas such as intersections
Watering, application of chemical suppressants or paving of light traffic areas, such as the CHPP, underground mine portals and workshop and administrative areas
Regular resurfacing of high traffic areas such as intersections to reduce silt build up
Regular maintenance of drainage design features at intersections (cross fall or camber)
Best practice haul road management should include:
Diligent monitoring and application of controls as surface dries out to avoid excessive emissions. Real-time triggers should be used to identify problem areas for targeted application of controls.
Regular watering of haul roads and at the direction of haul truck operators or the Open Cut Examiner (OCE)
Do not allow haul roads to become saturated as this will increase emissions once it dries out
Regular grading and maintenance of intersections Table 66 summarises the control measures used for haul roads. Alternatives to hauling using trucks on unpaved roads should also be considered. The use of conveyors to replace haul routes is one such approach. With respect to grading emissions, there is very little information available in the literature that would provide a basis to define best practice. However, the NPI handbook for mining10 recommends a control factor of 50% for scrapers working on topsoil where the soil is naturally or artificially moist. A similar reduction would be expected to be achieved for graders. The emission factors for graders suggest that a 75% reduction could be achieved by reducing the speed of the grader from 16 km/hr to 8 km/hr.
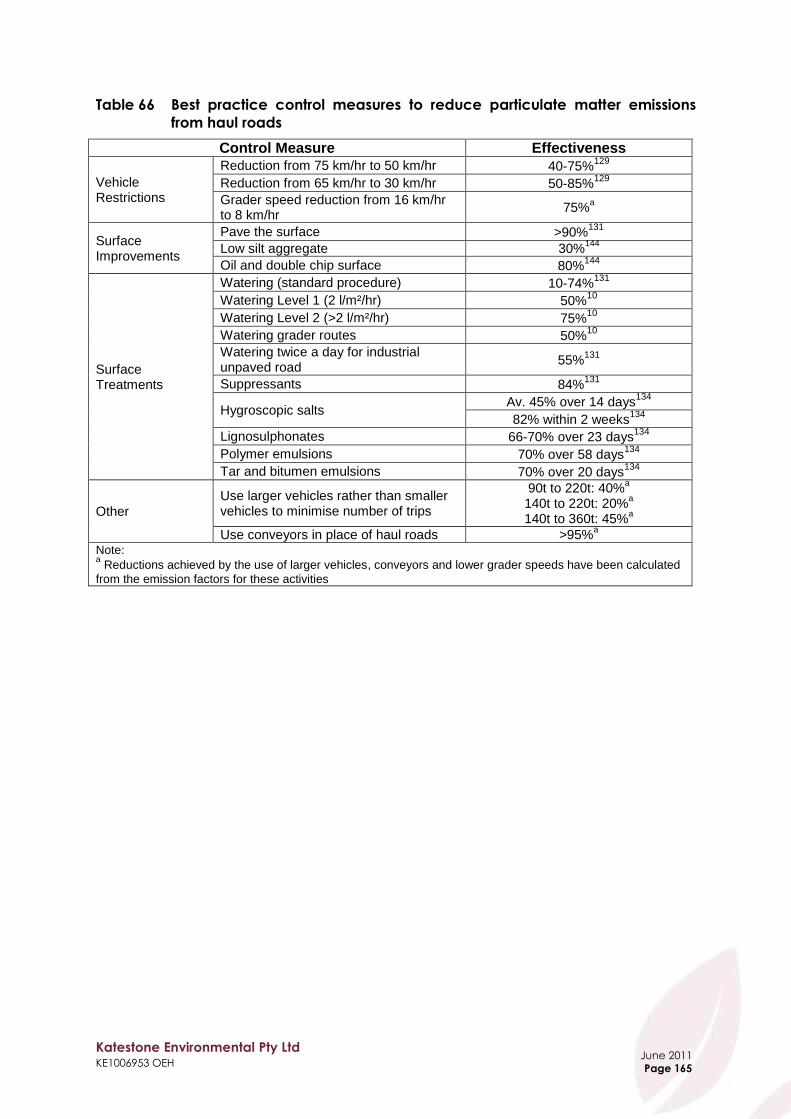
Katestone Environmental Pty Ltd KE1006953 OEH
June 2011
Page 165
Table 66 Best practice control measures to reduce particulate matter emissions
from haul roads
Control Measure Effectiveness
Vehicle Restrictions
Reduction from 75 km/hr to 50 km/hr 40-75%129
Reduction from 65 km/hr to 30 km/hr 50-85%129
Grader speed reduction from 16 km/hr to 8 km/hr
75%a
Surface Improvements
Pave the surface >90%131
Low silt aggregate 30%144
Oil and double chip surface 80%144
Surface Treatments
Watering (standard procedure) 10-74%131
Watering Level 1 (2 l/m²/hr) 50%10
Watering Level 2 (>2 l/m²/hr) 75%10
Watering grader routes 50%10
Watering twice a day for industrial unpaved road
55%131
Suppressants 84%131
Hygroscopic salts Av. 45% over 14 days
134
82% within 2 weeks134
Lignosulphonates 66-70% over 23 days134
Polymer emulsions 70% over 58 days134
Tar and bitumen emulsions 70% over 20 days134
Other
Use larger vehicles rather than smaller vehicles to minimise number of trips
90t to 220t: 40%a
140t to 220t: 20%a
140t to 360t: 45%a
Use conveyors in place of haul roads >95%a
Note: a Reductions achieved by the use of larger vehicles, conveyors and lower grader speeds have been calculated
from the emission factors for these activities
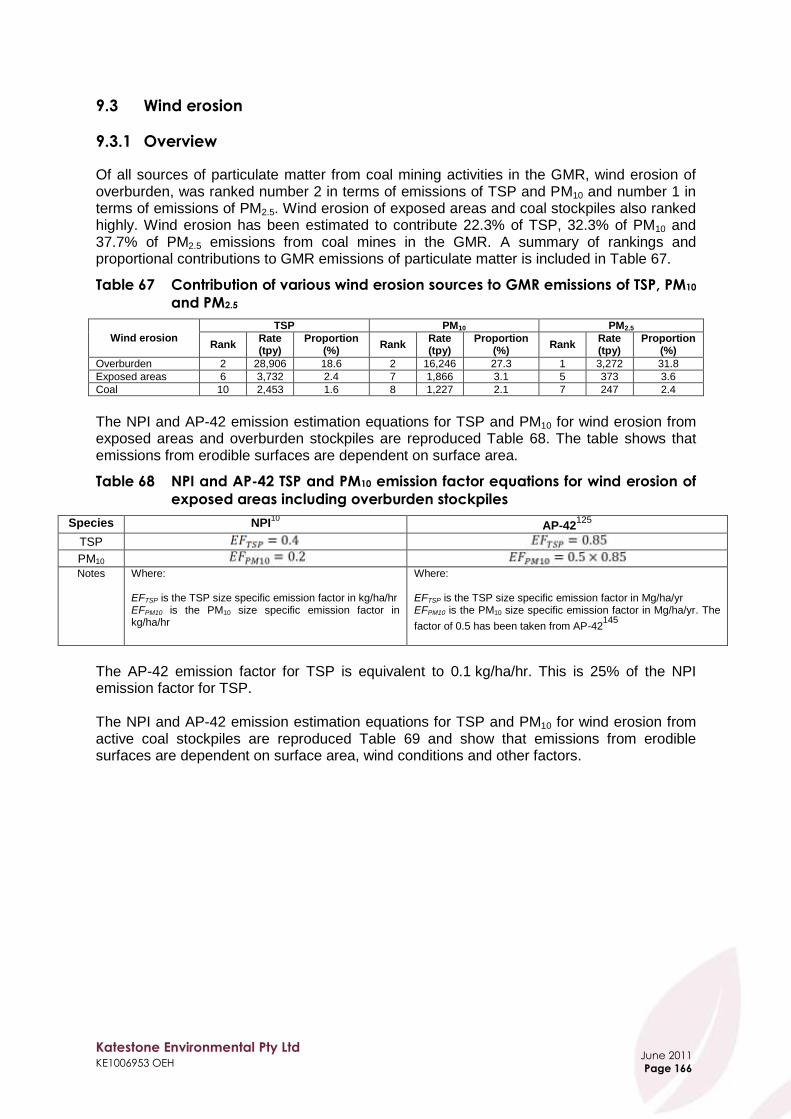
Katestone Environmental Pty Ltd KE1006953 OEH
June 2011
Page 166
9.3 Wind erosion
9.3.1 Overview
Of all sources of particulate matter from coal mining activities in the GMR, wind erosion of overburden, was ranked number 2 in terms of emissions of TSP and PM10 and number 1 in terms of emissions of PM2.5. Wind erosion of exposed areas and coal stockpiles also ranked highly. Wind erosion has been estimated to contribute 22.3% of TSP, 32.3% of PM10 and 37.7% of PM2.5 emissions from coal mines in the GMR. A summary of rankings and proportional contributions to GMR emissions of particulate matter is included in Table 67.
Table 67 Contribution of various wind erosion sources to GMR emissions of TSP, PM10
and PM2.5
Wind erosion TSP PM10 PM2.5
Rank Rate (tpy)
Proportion (%)
Rank Rate (tpy)
Proportion (%)
Rank Rate (tpy)
Proportion (%)
Overburden 2 28,906 18.6 2 16,246 27.3 1 3,272 31.8
Exposed areas 6 3,732 2.4 7 1,866 3.1 5 373 3.6
Coal 10 2,453 1.6 8 1,227 2.1 7 247 2.4
The NPI and AP-42 emission estimation equations for TSP and PM10 for wind erosion from exposed areas and overburden stockpiles are reproduced Table 68. The table shows that emissions from erodible surfaces are dependent on surface area.
Table 68 NPI and AP-42 TSP and PM10 emission factor equations for wind erosion of
exposed areas including overburden stockpiles
Species NPI10
AP-42125
TSP PM10 Notes Where:
EFTSP is the TSP size specific emission factor in kg/ha/hr EFPM10 is the PM10 size specific emission factor in kg/ha/hr
Where: EFTSP is the TSP size specific emission factor in Mg/ha/yr EFPM10 is the PM10 size specific emission factor in Mg/ha/yr. The
factor of 0.5 has been taken from AP-42145
The AP-42 emission factor for TSP is equivalent to 0.1 kg/ha/hr. This is 25% of the NPI emission factor for TSP. The NPI and AP-42 emission estimation equations for TSP and PM10 for wind erosion from active coal stockpiles are reproduced Table 69 and show that emissions from erodible surfaces are dependent on surface area, wind conditions and other factors.
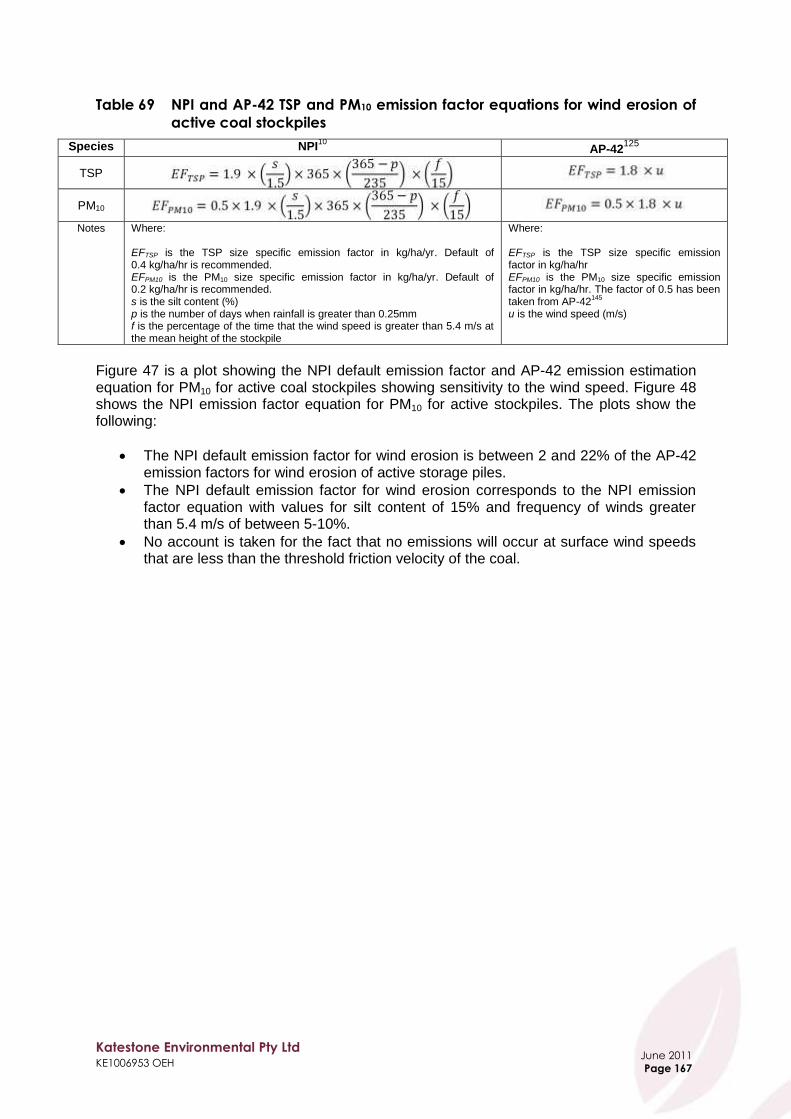
Katestone Environmental Pty Ltd KE1006953 OEH
June 2011
Page 167
Table 69 NPI and AP-42 TSP and PM10 emission factor equations for wind erosion of
active coal stockpiles
Species NPI10
AP-42125
TSP
PM10
Notes Where: EFTSP is the TSP size specific emission factor in kg/ha/yr. Default of 0.4 kg/ha/hr is recommended. EFPM10 is the PM10 size specific emission factor in kg/ha/yr. Default of 0.2 kg/ha/hr is recommended. s is the silt content (%) p is the number of days when rainfall is greater than 0.25mm f is the percentage of the time that the wind speed is greater than 5.4 m/s at the mean height of the stockpile
Where: EFTSP is the TSP size specific emission factor in kg/ha/hr EFPM10 is the PM10 size specific emission factor in kg/ha/hr. The factor of 0.5 has been taken from AP-42
145
u is the wind speed (m/s)
Figure 47 is a plot showing the NPI default emission factor and AP-42 emission estimation equation for PM10 for active coal stockpiles showing sensitivity to the wind speed. Figure 48 shows the NPI emission factor equation for PM10 for active stockpiles. The plots show the following:
The NPI default emission factor for wind erosion is between 2 and 22% of the AP-42 emission factors for wind erosion of active storage piles.
The NPI default emission factor for wind erosion corresponds to the NPI emission factor equation with values for silt content of 15% and frequency of winds greater than 5.4 m/s of between 5-10%.
No account is taken for the fact that no emissions will occur at surface wind speeds that are less than the threshold friction velocity of the coal.

Katestone Environmental Pty Ltd KE1006953 OEH
June 2011
Page 168
Figure 47 NPI default emission factor and AP-42 emission factor equation for PM10
from wind erosion of active coal stockpiles showing sensitivity to wind
speed
Figure 48 NPI emission factor equation for PM10 from wind erosion of active coal
stockpiles and NPI default emission factor
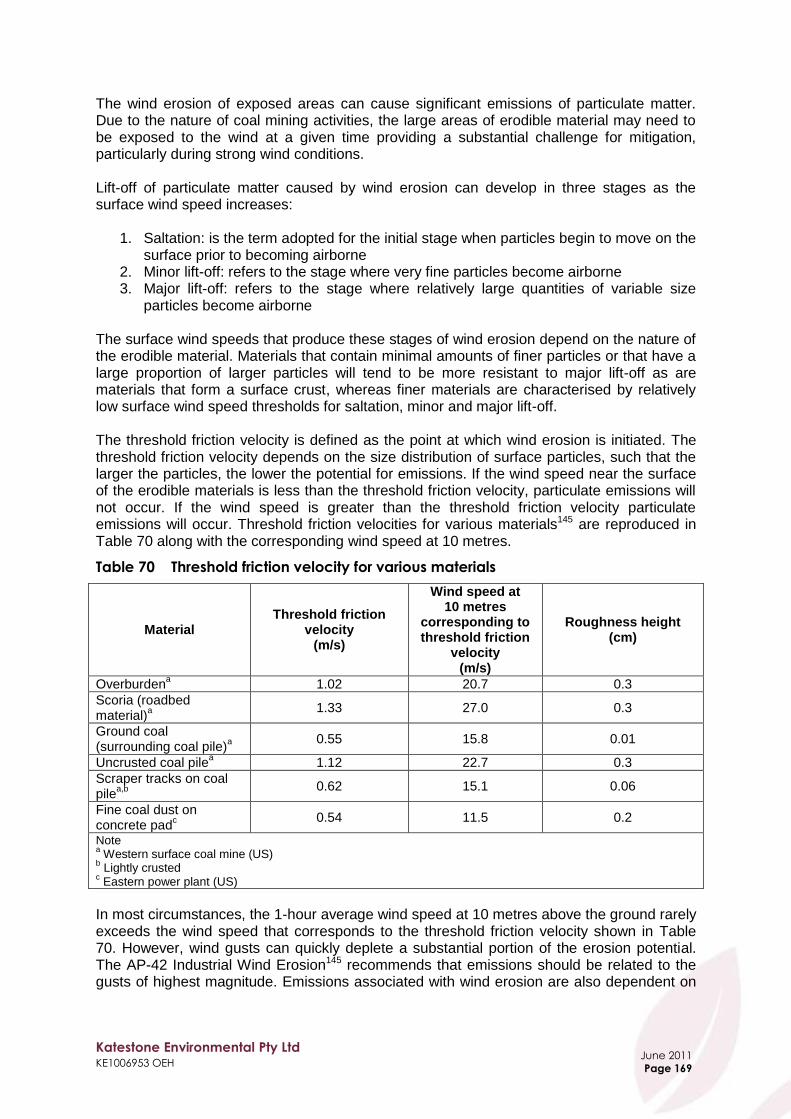
Katestone Environmental Pty Ltd KE1006953 OEH
June 2011
Page 169
The wind erosion of exposed areas can cause significant emissions of particulate matter. Due to the nature of coal mining activities, the large areas of erodible material may need to be exposed to the wind at a given time providing a substantial challenge for mitigation, particularly during strong wind conditions. Lift-off of particulate matter caused by wind erosion can develop in three stages as the surface wind speed increases:
1. Saltation: is the term adopted for the initial stage when particles begin to move on the surface prior to becoming airborne
2. Minor lift-off: refers to the stage where very fine particles become airborne 3. Major lift-off: refers to the stage where relatively large quantities of variable size
particles become airborne The surface wind speeds that produce these stages of wind erosion depend on the nature of the erodible material. Materials that contain minimal amounts of finer particles or that have a large proportion of larger particles will tend to be more resistant to major lift-off as are materials that form a surface crust, whereas finer materials are characterised by relatively low surface wind speed thresholds for saltation, minor and major lift-off. The threshold friction velocity is defined as the point at which wind erosion is initiated. The threshold friction velocity depends on the size distribution of surface particles, such that the larger the particles, the lower the potential for emissions. If the wind speed near the surface of the erodible materials is less than the threshold friction velocity, particulate emissions will not occur. If the wind speed is greater than the threshold friction velocity particulate emissions will occur. Threshold friction velocities for various materials145 are reproduced in Table 70 along with the corresponding wind speed at 10 metres.
Table 70 Threshold friction velocity for various materials
Material Threshold friction
velocity (m/s)
Wind speed at 10 metres
corresponding to threshold friction
velocity (m/s)
Roughness height (cm)
Overburdena 1.02 20.7 0.3
Scoria (roadbed material)
a
1.33 27.0 0.3
Ground coal (surrounding coal pile)
a
0.55 15.8 0.01
Uncrusted coal pilea 1.12 22.7 0.3
Scraper tracks on coal pile
a,b
0.62 15.1 0.06
Fine coal dust on concrete pad
c
0.54 11.5 0.2
Note a Western surface coal mine (US)
b Lightly crusted
c Eastern power plant (US)
In most circumstances, the 1-hour average wind speed at 10 metres above the ground rarely exceeds the wind speed that corresponds to the threshold friction velocity shown in Table 70. However, wind gusts can quickly deplete a substantial portion of the erosion potential. The AP-42 Industrial Wind Erosion145 recommends that emissions should be related to the gusts of highest magnitude. Emissions associated with wind erosion are also dependent on
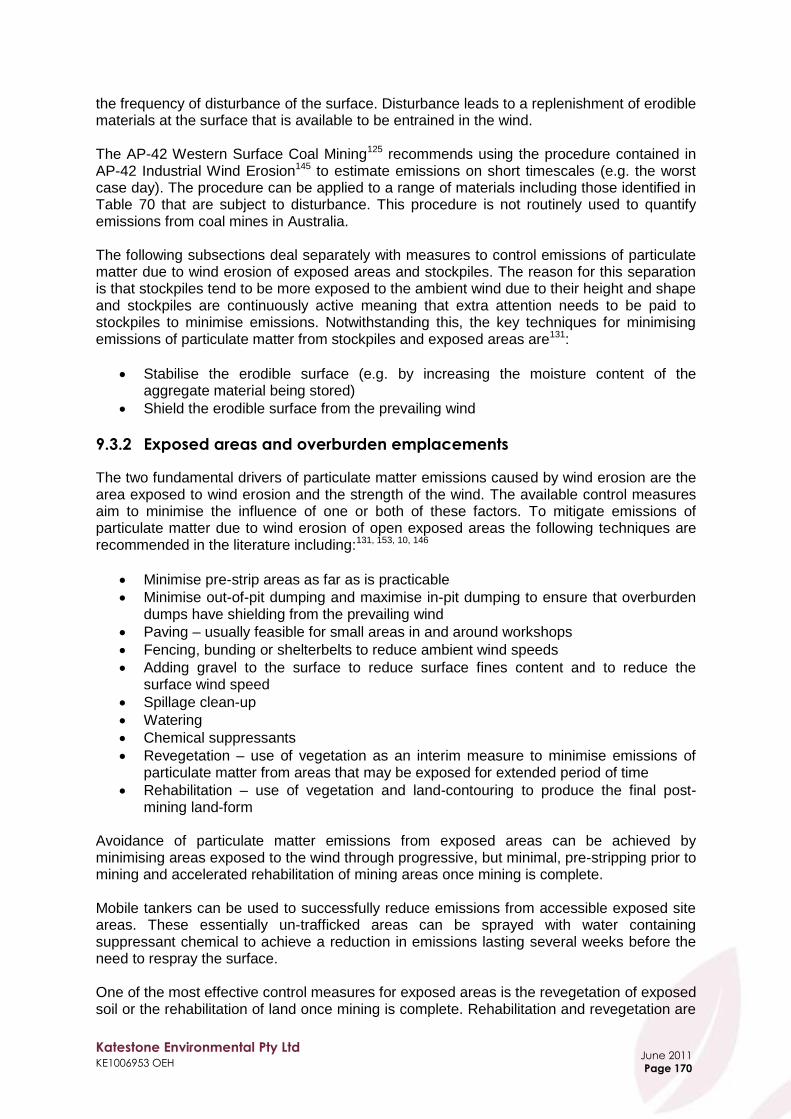
Katestone Environmental Pty Ltd KE1006953 OEH
June 2011
Page 170
the frequency of disturbance of the surface. Disturbance leads to a replenishment of erodible materials at the surface that is available to be entrained in the wind. The AP-42 Western Surface Coal Mining125 recommends using the procedure contained in AP-42 Industrial Wind Erosion145 to estimate emissions on short timescales (e.g. the worst case day). The procedure can be applied to a range of materials including those identified in Table 70 that are subject to disturbance. This procedure is not routinely used to quantify emissions from coal mines in Australia. The following subsections deal separately with measures to control emissions of particulate matter due to wind erosion of exposed areas and stockpiles. The reason for this separation is that stockpiles tend to be more exposed to the ambient wind due to their height and shape and stockpiles are continuously active meaning that extra attention needs to be paid to stockpiles to minimise emissions. Notwithstanding this, the key techniques for minimising emissions of particulate matter from stockpiles and exposed areas are131:
Stabilise the erodible surface (e.g. by increasing the moisture content of the aggregate material being stored)
Shield the erodible surface from the prevailing wind
9.3.2 Exposed areas and overburden emplacements
The two fundamental drivers of particulate matter emissions caused by wind erosion are the area exposed to wind erosion and the strength of the wind. The available control measures aim to minimise the influence of one or both of these factors. To mitigate emissions of particulate matter due to wind erosion of open exposed areas the following techniques are recommended in the literature including:131, 153, 10, 146
Minimise pre-strip areas as far as is practicable
Minimise out-of-pit dumping and maximise in-pit dumping to ensure that overburden dumps have shielding from the prevailing wind
Paving – usually feasible for small areas in and around workshops
Fencing, bunding or shelterbelts to reduce ambient wind speeds
Adding gravel to the surface to reduce surface fines content and to reduce the surface wind speed
Spillage clean-up
Watering
Chemical suppressants
Revegetation – use of vegetation as an interim measure to minimise emissions of particulate matter from areas that may be exposed for extended period of time
Rehabilitation – use of vegetation and land-contouring to produce the final post-mining land-form
Avoidance of particulate matter emissions from exposed areas can be achieved by minimising areas exposed to the wind through progressive, but minimal, pre-stripping prior to mining and accelerated rehabilitation of mining areas once mining is complete. Mobile tankers can be used to successfully reduce emissions from accessible exposed site areas. These essentially un-trafficked areas can be sprayed with water containing suppressant chemical to achieve a reduction in emissions lasting several weeks before the need to respray the surface. One of the most effective control measures for exposed areas is the revegetation of exposed soil or the rehabilitation of land once mining is complete. Rehabilitation and revegetation are
Katestone Environmental Pty Ltd KE1006953 OEH
June 2011
Page 171
widely used in Australia and internationally with varying degrees of success to control emissions of particulate matter from exposed areas and to return mined areas to a suitable landscape with minimal erosion potential147. Rehabilitation is achieved by firstly surface contouring the mined landform and secondly by restoring the vegetation147. By revegetating areas of land progressively as the mine develops the act of reclamation can be gradual and reduce emissions of particulate matter at the same time. Reclamation is required in the USA under the Surface Mine Control and Reclamation Act of 1977148 and since this time the practice has evolved rapidly and is very successful in managing fugitive emissions of particulate matter from wind erosion. Due to the long term operational aspects of open cut coal mining, there can be an extended period before overburden emplacements can be the subject of final site rehabilitation. It is therefore appropriate to consider the use of interim vegetation of overburden emplacements. Hydraulic mulch seeding is a broad-scale planting process that utilises a slurry of seed and mulch to commence revegetation. It is a technique that has been used successfully to quickly establish vegetative cover at mine sites. Similarly, aerial seeding can be used to establish vegetative cover over broad and otherwise inaccessible areas at mine sites. Aerial seeding trials have been timed to take place before forecast rain periods. The method has been demonstrated to be cost effective in New South Wales with the cost of aerial services to conduct the seeding about one third of the cost of the seed and fertiliser. The development of a green belt area using trees or shrubbery as a natural barrier to emissions of particulate matter137 and winds have been used in some countries. A shelter-belt attenuation model has been developed to allow for the performance of such a measure to be optimised137. Maiti and Banerjee141 reported that the use of plants in the Jharia Coalfields in Eastern India can be effective, acting as filter to emissions of particulate matter.
Table 71 summarises the control measures used for exposed areas and overburden emplacements.
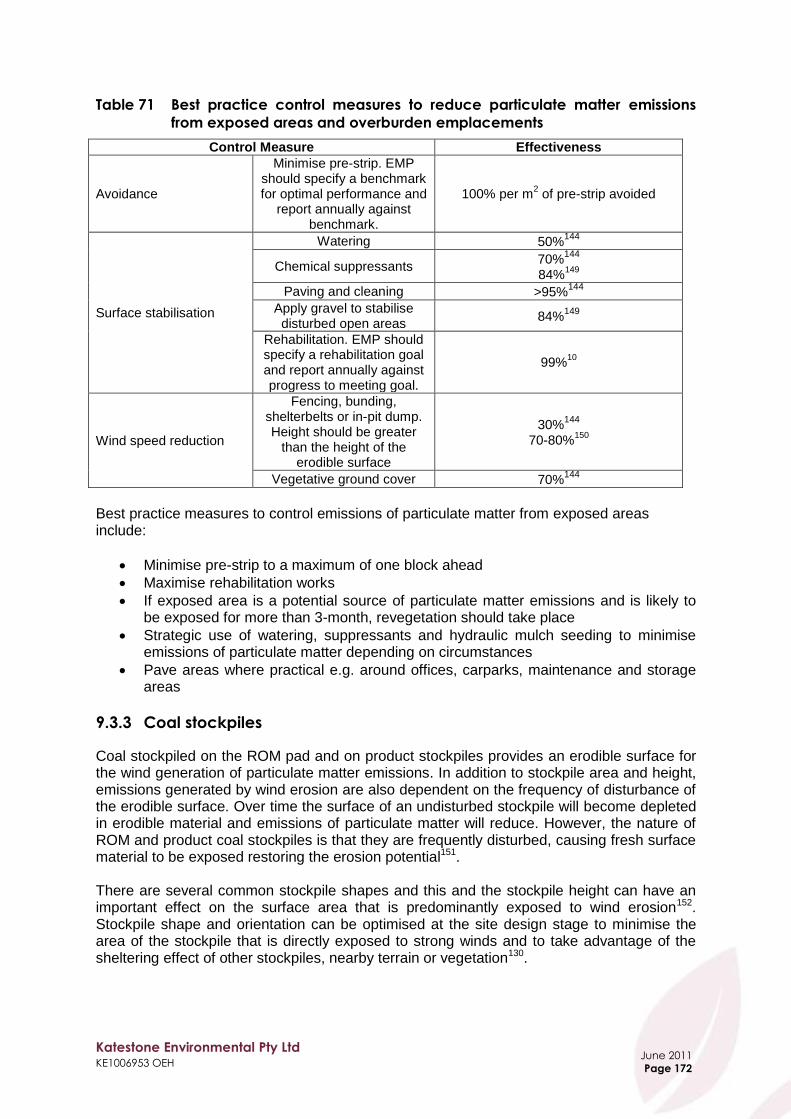
Katestone Environmental Pty Ltd KE1006953 OEH
June 2011
Page 172
Table 71 Best practice control measures to reduce particulate matter emissions
from exposed areas and overburden emplacements
Control Measure Effectiveness
Avoidance
Minimise pre-strip. EMP should specify a benchmark for optimal performance and
report annually against benchmark.
100% per m2 of pre-strip avoided
Surface stabilisation
Watering 50%144
Chemical suppressants 70%
144
84%149
Paving and cleaning >95%144
Apply gravel to stabilise disturbed open areas
84%149
Rehabilitation. EMP should specify a rehabilitation goal and report annually against progress to meeting goal.
99%10
Wind speed reduction
Fencing, bunding, shelterbelts or in-pit dump. Height should be greater
than the height of the erodible surface
30%144
70-80%
150
Vegetative ground cover 70%144
Best practice measures to control emissions of particulate matter from exposed areas include:
Minimise pre-strip to a maximum of one block ahead
Maximise rehabilitation works
If exposed area is a potential source of particulate matter emissions and is likely to be exposed for more than 3-month, revegetation should take place
Strategic use of watering, suppressants and hydraulic mulch seeding to minimise emissions of particulate matter depending on circumstances
Pave areas where practical e.g. around offices, carparks, maintenance and storage areas
9.3.3 Coal stockpiles
Coal stockpiled on the ROM pad and on product stockpiles provides an erodible surface for the wind generation of particulate matter emissions. In addition to stockpile area and height, emissions generated by wind erosion are also dependent on the frequency of disturbance of the erodible surface. Over time the surface of an undisturbed stockpile will become depleted in erodible material and emissions of particulate matter will reduce. However, the nature of ROM and product coal stockpiles is that they are frequently disturbed, causing fresh surface material to be exposed restoring the erosion potential151. There are several common stockpile shapes and this and the stockpile height can have an important effect on the surface area that is predominantly exposed to wind erosion152. Stockpile shape and orientation can be optimised at the site design stage to minimise the area of the stockpile that is directly exposed to strong winds and to take advantage of the sheltering effect of other stockpiles, nearby terrain or vegetation130.

Katestone Environmental Pty Ltd KE1006953 OEH
June 2011
Page 173
For existing stockpiles, the control measures identified in the literature to minimise stockpile emissions include:131,153,146,10,130,154
Fencing, bunding or shelterbelts to reduce ambient wind speeds
Watering to minimise lift-off with automatic control through continuous cycling and increased application based on meteorological conditions
Chemical suppressants to bind loose fine surface material in response to adverse weather conditions
Minimise residence time of coal in stockpiles
Spillage clean-up
Surface covering
Bypassing stockpiles to load directly into ROM bin or onto train Structures can be used to reduce emissions of particulate matter, such as earth walls (berms) or fences130. Berms can act as a wind break by preventing the erosive and drying effects of the wind130. Berms can also reduce the amount of water and use of suppressants making it a cost effective option in many cases130. Billman and Arya155 found that a 50% porous windbreak of equal height to the pile height and equal length to the pile length at the base, located one pile height from the base of both piles was found to be quite effective in reducing wind speeds over much of the pile. Zimmer156 conducted field studies of the effectiveness of wind screens and determined that the most effective screens for reducing the wind speed had the following dimensions relative to the height of the stockpile:
Height: 1.25 times the height of the stockpile
Width: 1.5 times the height of the stockpile
Distance upwind: 2.0 times the height of the stockpile Chemical suppressants can be applied to coal stockpiles to reduce the effects of wind erosion by binding the surface into a crust. Spraying of suppressants onto stockpiles is normally carried out by truck to target application to problem areas. There are number of local and international companies that sell suppressants into the Australian market. Shielding, wind fences, chemical additive controls or intensively monitored water spray systems can reduce emissions of particulate matter. Bohn144 report a control efficiency of up to 30% for vegetative wind breaks. Carnes157 report values of up to 80% for wind screens or fences. Stunder158 concluded from wind tunnel studies that efficiencies of 15-60% could be expected, depending on stockpile shape, windbreak porosity, length and height. A 50% porosity windbreak located three stockpile heights upstream was considered optimal. Windbreaks downwind do not provide any reduction in particulate matter transport, although trees downwind may help to knock out particulate matter. Faveri159 in similar studies confirmed wind speed reductions as the key advantage of windbreaks and showed that chemical additives used in combination with windbreaks of optimal size could achieve efficiencies of 85% for up to 10 days for moderate to high wind speeds. The applicability of these laboratory-measured efficiencies to a coal surface kept moist is unknown as the moisture will increase threshold velocities and reduce emission rates without windbreaks. Stockpile profile management should be further investigated. A pointed apex or conical form will tend to accelerate wind flow near regions of high curvature and generate vortices in strong winds which will result in increased emissions of particulate matter. A smooth whaleback profile is preferable. Orienting stockpiles so that the smallest cross-sectional area is exposed to the high frequency of strong winds will minimise surface drying and wind

Katestone Environmental Pty Ltd KE1006953 OEH
June 2011
Page 174
erosion. Martin and Drehmel160 report a control efficiency of up to 60% for pile shaping and orientation. Wind speed increases with height from ground, so imposing limits on stockpile height will reduce the velocity of wind over the surface and hence the entrainment of particulate matter. Bohn144 reports a control efficiency of up to 30% by reduction of pile height. For storage pile wind erosion, the estimated control efficiency for water sprays is reported at 50%163 to 80%144. Modern automated sprays may be capable of better performance than this. Chemical wetting agents are reported to provide a control efficiency of 80-99%161, 85%162 and 90%163. A surface crusting agent is reported to provide a control efficiency of 95%164 to approximately 99%144. Table 72 summarises the control measures used for coal stockpiles.
Table 72 Best practice control measures to reduce particulate matter emissions
from coal stockpiles
Control Measure Effectiveness
Avoidance Bypassing stockpiles 100% reduction in wind erosion for coal
bypassing stockpiles
Surface stabilisation
Water spray 50%163
Chemical wetting agents
80-99%165
85%162
90%163
Surface crusting agent 95%
164
Carry over wetting from load in 80%164
Enclosure
Silo with bag house 100%
144
95-99%163
99%
166
Cover storage pile with a tarp during high winds
99%a
Wind speed reduction
Vegetative wind breaks 30%144
Reduced pile height 30%144
Wind screens/wind fences >80%
157
75-80%150
Pile shaping/orientation <60%160
Erect 3-sided enclosure around storage piles
75%167
Note a Estimated based on the effectiveness of chemical surface treatments
Best practice measures to control emissions of particulate matter from coal stockpiles include:
Shaping and orientation to minimise emissions of particulate matter
Stockpile watering on continuous cycle with modification of cycle depending on prevailing weather conditions to allow greater or lesser watering intensity
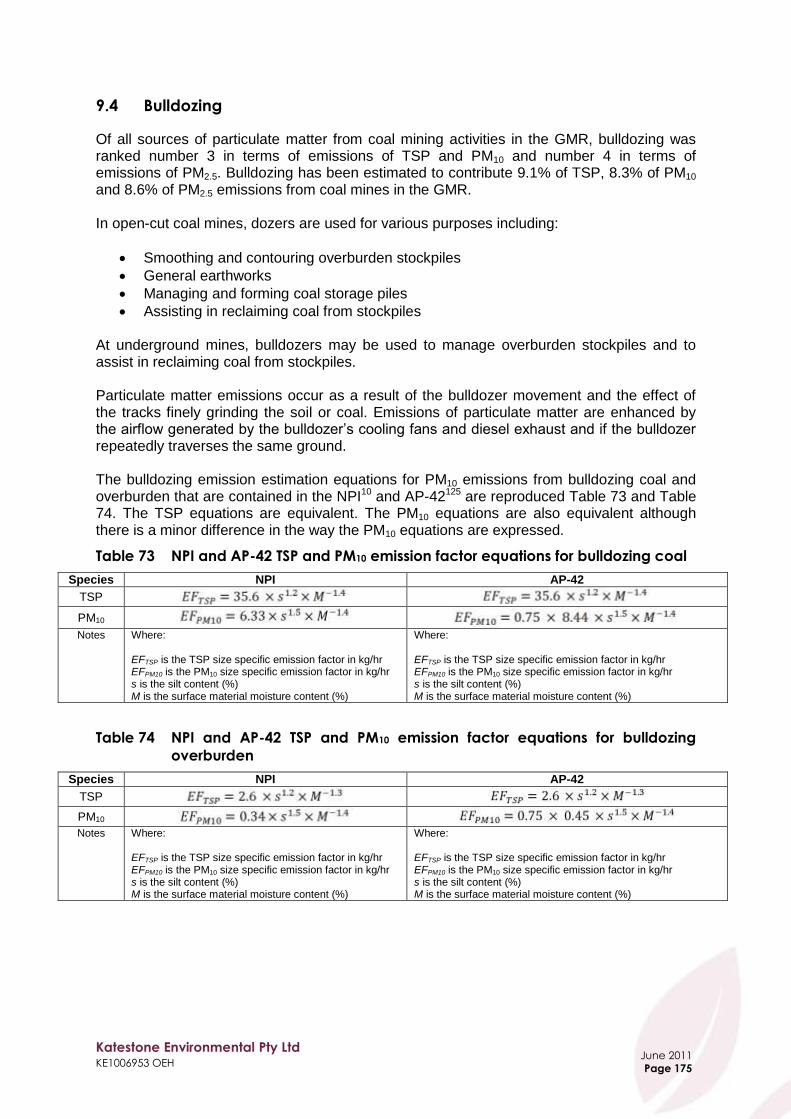
Katestone Environmental Pty Ltd KE1006953 OEH
June 2011
Page 175
9.4 Bulldozing
Of all sources of particulate matter from coal mining activities in the GMR, bulldozing was ranked number 3 in terms of emissions of TSP and PM10 and number 4 in terms of emissions of PM2.5. Bulldozing has been estimated to contribute 9.1% of TSP, 8.3% of PM10 and 8.6% of PM2.5 emissions from coal mines in the GMR. In open-cut coal mines, dozers are used for various purposes including:
Smoothing and contouring overburden stockpiles
General earthworks
Managing and forming coal storage piles
Assisting in reclaiming coal from stockpiles At underground mines, bulldozers may be used to manage overburden stockpiles and to assist in reclaiming coal from stockpiles. Particulate matter emissions occur as a result of the bulldozer movement and the effect of the tracks finely grinding the soil or coal. Emissions of particulate matter are enhanced by the airflow generated by the bulldozer‟s cooling fans and diesel exhaust and if the bulldozer repeatedly traverses the same ground. The bulldozing emission estimation equations for PM10 emissions from bulldozing coal and overburden that are contained in the NPI10 and AP-42125 are reproduced Table 73 and Table 74. The TSP equations are equivalent. The PM10 equations are also equivalent although there is a minor difference in the way the PM10 equations are expressed.
Table 73 NPI and AP-42 TSP and PM10 emission factor equations for bulldozing coal
Species NPI AP-42
TSP
PM10 Notes Where:
EFTSP is the TSP size specific emission factor in kg/hr EFPM10 is the PM10 size specific emission factor in kg/hr s is the silt content (%) M is the surface material moisture content (%)
Where: EFTSP is the TSP size specific emission factor in kg/hr EFPM10 is the PM10 size specific emission factor in kg/hr s is the silt content (%) M is the surface material moisture content (%)
Table 74 NPI and AP-42 TSP and PM10 emission factor equations for bulldozing
overburden
Species NPI AP-42
TSP PM10 Notes Where:
EFTSP is the TSP size specific emission factor in kg/hr EFPM10 is the PM10 size specific emission factor in kg/hr s is the silt content (%) M is the surface material moisture content (%)
Where: EFTSP is the TSP size specific emission factor in kg/hr EFPM10 is the PM10 size specific emission factor in kg/hr s is the silt content (%) M is the surface material moisture content (%)
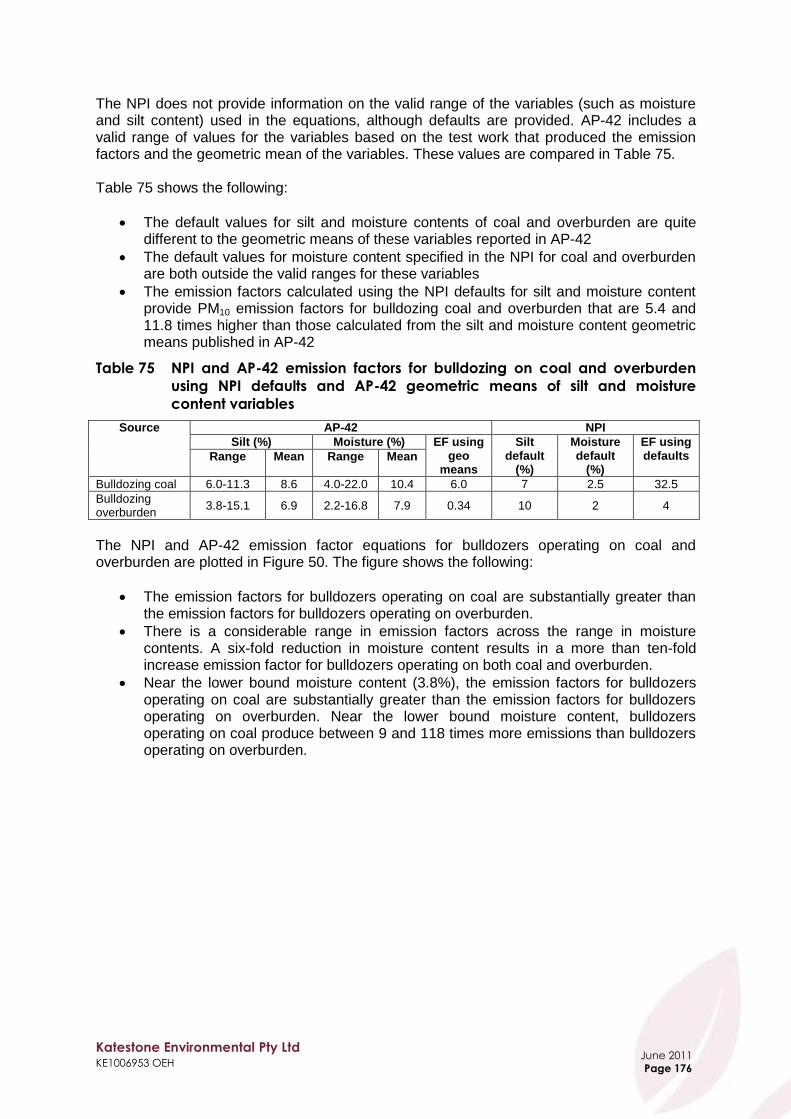
Katestone Environmental Pty Ltd KE1006953 OEH
June 2011
Page 176
The NPI does not provide information on the valid range of the variables (such as moisture and silt content) used in the equations, although defaults are provided. AP-42 includes a valid range of values for the variables based on the test work that produced the emission factors and the geometric mean of the variables. These values are compared in Table 75. Table 75 shows the following:
The default values for silt and moisture contents of coal and overburden are quite different to the geometric means of these variables reported in AP-42
The default values for moisture content specified in the NPI for coal and overburden are both outside the valid ranges for these variables
The emission factors calculated using the NPI defaults for silt and moisture content provide PM10 emission factors for bulldozing coal and overburden that are 5.4 and 11.8 times higher than those calculated from the silt and moisture content geometric means published in AP-42
Table 75 NPI and AP-42 emission factors for bulldozing on coal and overburden
using NPI defaults and AP-42 geometric means of silt and moisture
content variables
Source AP-42 NPI
Silt (%) Moisture (%) EF using geo
means
Silt default
(%)
Moisture default
(%)
EF using defaults Range Mean Range Mean
Bulldozing coal 6.0-11.3 8.6 4.0-22.0 10.4 6.0 7 2.5 32.5
Bulldozing overburden
3.8-15.1 6.9 2.2-16.8 7.9 0.34 10 2 4
The NPI and AP-42 emission factor equations for bulldozers operating on coal and overburden are plotted in Figure 50. The figure shows the following:
The emission factors for bulldozers operating on coal are substantially greater than the emission factors for bulldozers operating on overburden.
There is a considerable range in emission factors across the range in moisture contents. A six-fold reduction in moisture content results in a more than ten-fold increase emission factor for bulldozers operating on both coal and overburden.
Near the lower bound moisture content (3.8%), the emission factors for bulldozers operating on coal are substantially greater than the emission factors for bulldozers operating on overburden. Near the lower bound moisture content, bulldozers operating on coal produce between 9 and 118 times more emissions than bulldozers operating on overburden.

Katestone Environmental Pty Ltd KE1006953 OEH
June 2011
Page 177
Figure 49 NPI and AP-42 emission factor equations for PM10 from bulldozers
operating on coal (C) and overburden (OB) showing sensitivity to moisture
content (M) and silt content
There is very little information in the literature on minimising emissions of particulate matter from bulldozers. The NPI states that there are no controls to reduce emissions from bulldozers working on coal or other materials. The NPI provides a 50% control factor for scrapers operating on topsoil when the soil is naturally or artificially moist and it is likely that a similar effect would be achieved for bulldozers if the working areas could be kept moist. A detailed evaluation of options to control emissions of particulate matter from bulldozers was conducted by Connell Hatch for the RG Tanna Coal Terminal153. Options considered in this study included:
Minimising travel speed and travel distance
Stabilising bulldozer travel routes and use of water or suppressants on travel routes
Manage coal moisture to ensure coal is sufficiently moist when working
Modify design of the bulldozer to minimise emissions There is no information available that would allow the benefit of minimised travel speed of bulldozers to be determined. The emission rate of particulate matter due to bulldozing is directly related to the number of hours of operation. Hence, a reduction in the number of hours of operation would result in a proportional reduction in emissions. However, whilst bulldozer use may be optimised to minimise emissions, substantial reduction in emissions would not be practical without a redesign of the mining operation to substantially eliminate the need for bulldozing. This was considered to be impractical and, hence, the effectiveness of this measure has not been quantified. With respect to the bulldozers at RG Tanna Coal Terminal, Connell Hatch found that the bulldozer manufacturer had not considered particulate matter emissions induced by the
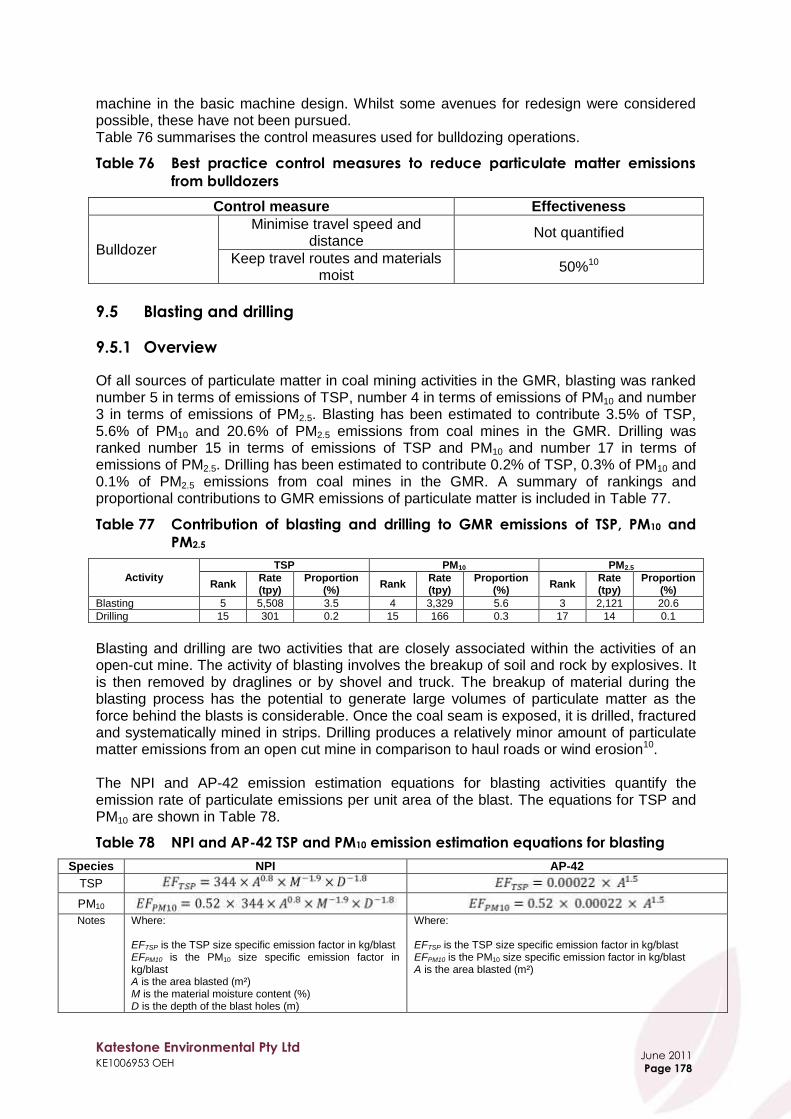
Katestone Environmental Pty Ltd KE1006953 OEH
June 2011
Page 178
machine in the basic machine design. Whilst some avenues for redesign were considered possible, these have not been pursued. Table 76 summarises the control measures used for bulldozing operations.
Table 76 Best practice control measures to reduce particulate matter emissions
from bulldozers
Control measure Effectiveness
Bulldozer
Minimise travel speed and distance
Not quantified
Keep travel routes and materials moist
50%10
9.5 Blasting and drilling
9.5.1 Overview
Of all sources of particulate matter in coal mining activities in the GMR, blasting was ranked number 5 in terms of emissions of TSP, number 4 in terms of emissions of PM10 and number 3 in terms of emissions of PM2.5. Blasting has been estimated to contribute 3.5% of TSP, 5.6% of PM10 and 20.6% of PM2.5 emissions from coal mines in the GMR. Drilling was ranked number 15 in terms of emissions of TSP and PM10 and number 17 in terms of emissions of PM2.5. Drilling has been estimated to contribute 0.2% of TSP, 0.3% of PM10 and 0.1% of PM2.5 emissions from coal mines in the GMR. A summary of rankings and proportional contributions to GMR emissions of particulate matter is included in Table 77.
Table 77 Contribution of blasting and drilling to GMR emissions of TSP, PM10 and
PM2.5
Activity TSP PM10 PM2.5
Rank Rate (tpy)
Proportion (%)
Rank Rate (tpy)
Proportion (%)
Rank Rate (tpy)
Proportion (%)
Blasting 5 5,508 3.5 4 3,329 5.6 3 2,121 20.6
Drilling 15 301 0.2 15 166 0.3 17 14 0.1
Blasting and drilling are two activities that are closely associated within the activities of an open-cut mine. The activity of blasting involves the breakup of soil and rock by explosives. It is then removed by draglines or by shovel and truck. The breakup of material during the blasting process has the potential to generate large volumes of particulate matter as the force behind the blasts is considerable. Once the coal seam is exposed, it is drilled, fractured and systematically mined in strips. Drilling produces a relatively minor amount of particulate matter emissions from an open cut mine in comparison to haul roads or wind erosion10. The NPI and AP-42 emission estimation equations for blasting activities quantify the emission rate of particulate emissions per unit area of the blast. The equations for TSP and PM10 are shown in Table 78.
Table 78 NPI and AP-42 TSP and PM10 emission estimation equations for blasting
Species NPI AP-42
TSP PM10 Notes Where:
EFTSP is the TSP size specific emission factor in kg/blast EFPM10 is the PM10 size specific emission factor in kg/blast A is the area blasted (m²) M is the material moisture content (%) D is the depth of the blast holes (m)
Where: EFTSP is the TSP size specific emission factor in kg/blast EFPM10 is the PM10 size specific emission factor in kg/blast A is the area blasted (m²)

Katestone Environmental Pty Ltd KE1006953 OEH
June 2011
Page 179
The NPI emission estimation equation is from the fourth edition of AP-42 and is no longer supported by the US Environmental Protection Agency168. Figure 50 is a plot of the emission factors for PM10 for blasting showing the sensitivity to blast area for AP-42 and NPI emission factors and to moisture and blast depth for the NPI emission factors. The NPI provides no guidance on the ranges of validity of the variables and does not provide default values for the variables. The low, high and mid-range values shown in Figure 50 are based on the ranges and geometric means of moisture content and blasting depth contained in the fourth edition of AP-42. The ranges and geometric means of these variables are also shown in Table 79.
Figure 50 NPI and AP-42 PM10 emission factors for blasting and sensitivity to area
blasted, moisture content and depth of blast
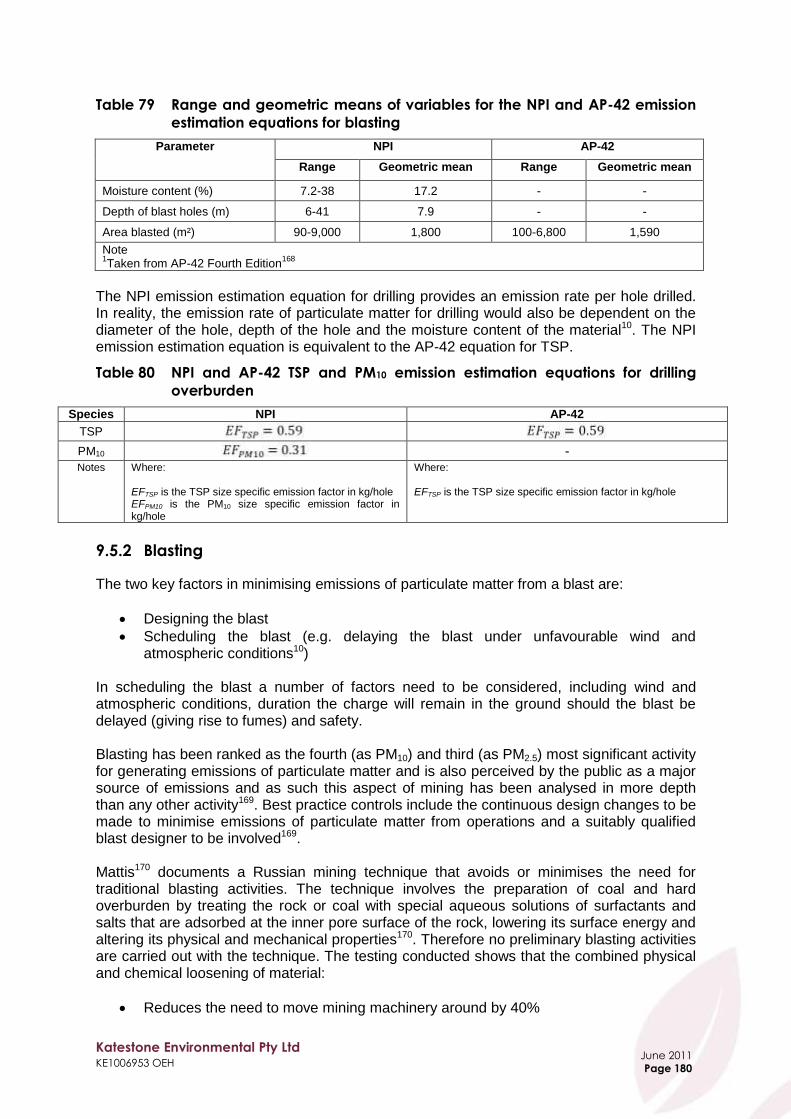
Katestone Environmental Pty Ltd KE1006953 OEH
June 2011
Page 180
Table 79 Range and geometric means of variables for the NPI and AP-42 emission
estimation equations for blasting
Parameter NPI AP-42
Range Geometric mean Range Geometric mean
Moisture content (%) 7.2-38 17.2 - -
Depth of blast holes (m) 6-41 7.9 - -
Area blasted (m²) 90-9,000 1,800 100-6,800 1,590
Note 1Taken from AP-42 Fourth Edition
168
The NPI emission estimation equation for drilling provides an emission rate per hole drilled. In reality, the emission rate of particulate matter for drilling would also be dependent on the diameter of the hole, depth of the hole and the moisture content of the material10. The NPI emission estimation equation is equivalent to the AP-42 equation for TSP.
Table 80 NPI and AP-42 TSP and PM10 emission estimation equations for drilling
overburden
Species NPI AP-42
TSP PM10 - Notes Where:
EFTSP is the TSP size specific emission factor in kg/hole EFPM10 is the PM10 size specific emission factor in kg/hole
Where: EFTSP is the TSP size specific emission factor in kg/hole
9.5.2 Blasting
The two key factors in minimising emissions of particulate matter from a blast are:
Designing the blast
Scheduling the blast (e.g. delaying the blast under unfavourable wind and atmospheric conditions10)
In scheduling the blast a number of factors need to be considered, including wind and atmospheric conditions, duration the charge will remain in the ground should the blast be delayed (giving rise to fumes) and safety. Blasting has been ranked as the fourth (as PM10) and third (as PM2.5) most significant activity for generating emissions of particulate matter and is also perceived by the public as a major source of emissions and as such this aspect of mining has been analysed in more depth than any other activity169. Best practice controls include the continuous design changes to be made to minimise emissions of particulate matter from operations and a suitably qualified blast designer to be involved169. Mattis170 documents a Russian mining technique that avoids or minimises the need for traditional blasting activities. The technique involves the preparation of coal and hard overburden by treating the rock or coal with special aqueous solutions of surfactants and salts that are adsorbed at the inner pore surface of the rock, lowering its surface energy and altering its physical and mechanical properties170. Therefore no preliminary blasting activities are carried out with the technique. The testing conducted shows that the combined physical and chemical loosening of material:
Reduces the need to move mining machinery around by 40%
Katestone Environmental Pty Ltd KE1006953 OEH
June 2011
Page 181
Increases excavator productivity by up to 30%
Reduces the energy intensity of extraction by 20-35%
Reduces the abrasiveness of the rock and coal by 30-40%
Using a combination of the new method and blasting to prepare hard rock for extraction reduces explosives consumption by 25-30% and cuts the amount of drilling required by up to 25%171. Table 81 summarises the control measures used for blasting.
Table 81 Best practice control measures to reduce particulate matter emissions
from blasting
Control Measure Effectiveness
Blasting
Design: Delay shot to avoid unfavourable weather conditions
Not quantified
Design: Minimise area blasted Not quantified
9.5.3 Drilling
Emissions of particulate matter from drilling can be controlled using wet and dry methods and these include:
Wet suppression o Watering
Dry collection o Fabric filters o Cyclones
The use of watering when drilling can be an effective control measure and efficiencies are dependent on the flow of watering and have been shown to range between 3.1% and 96.3%142. The watering system can be mounted onto the drill and is operated by the drill operator. The system is dependent on the moisture content of the material that is to be drilled. A dry collection system is simply a system to collect particulate matter in an enclosure around where the drilling is taking place142. Fabric filters can reduce emissions of particulate matter by 99%154. Reed172 documented a new approach to control emissions of particulate matter at the collector dump point for blast hole drills. The control was developed primarily to address occupational exposure for operators of this equipment; however, it is also effective in reducing total fugitive emissions of particulate matter. Reed172 reports that creating a particulate matter collector shroud is a simple, yet very effective measure in reducing respirable particulate matter. The shroud is easy to fit and replace and is inexpensive requiring almost no maintenance172. The observed reduction in respirable particulate matter varied between 63% and 88%172. The reduction rates vary according to the meteorological conditions, particularly wind speed and direction172. The small drills used in surface mining typically use a dry collection system called a Cyclone in Australia and Rotoclone in the US173. A cyclone works by forcing the air to move rapidly in a curved trajectory and during this movement the denser particulates are separated from the air stream, drop out and are collected174. Although this collection system collects the majority of particulate matter (in mass terms) there is a significant amount of fine particulate matter that is not collected in this system173. Buonicore & Davis175 reported efficiencies of PM10 capture of 80-90%. The US Bureau of Mines173 documented an improved system for the Rotoclone in which water is injected in very small amounts to the Rotoclone exhaust to

Katestone Environmental Pty Ltd KE1006953 OEH
June 2011
Page 182
reduce the emissions of particulate matter from this activity. Principally this system was developed to remove fine particulate matter and the system proved very efficient. Monitoring was undertaken 10 feet downwind of the Rotoclone and the discharged showed a 90% reduction in total particulate matter emissions and a 92% reduction of respirable particulate matter emissions and the eradication of all visible emissions of particulate matter173. Table 82 summarises the control measures used for drilling.
Table 82 Best practice control measures to reduce particulate matter emissions
from drilling
Control Measure Effectiveness
Dry collection Fabric filter
Cyclone 99
154
80-90175
Wet Water injection 3 – 96142
, 7010
9.6 Draglines
Of all sources of particulate matter from coal mining activities in the GMR, draglines have been ranked number 8 in terms of emissions of TSP, number 10 in terms of emissions of PM10 and number 9 in terms of emissions of PM2.5. Draglines have been estimated to contribute 1.9% of TSP, 1.5% of PM10 and 1.3% of PM2.5 emissions from coal mines in the GMR. Draglines are frequently used in the removal of blasted overburden from surface pit mining. The dragline consists of a large bucket which is controlled by a dragline operator using a pulley system of ropes. The bucket is lowered and dragged across the surface of the overburden to be excavated. The bucket is then swung to the in-pit dumping area where the overburden is dumped from the bucket. During this activity, there are three actions where emissions of particulate matter may arise:
Pick up of the overburden material
Loss of material from the bucket during the swing
During the drop of the overburden material
The amount of particulate matter generated from these activities is dependent on local conditions such as, weather (wind speed, rainfall), drop height and moisture content of the material being excavated. The NPI emission estimation equations for draglines are equivalent to AP-42 emission estimation equations125.
Table 83 NPI and AP-42 TSP and PM10 emission estimation equations for draglines
Species NPI10
AP-42125
TSP PM10 Notes Where:
EFTSP is the TSP size specific emission factor in kg/bcm EFPM10 is the PM10 size specific emission factor in kg/bcm d is the drop distance (m) M is the material moisture content (%)
Where: EFTSP is the TSP size specific emission factor in kg/m³ EFPM10 is the PM10 size specific emission factor in kg/ m³ d is the drop distance (m) M is the material moisture content (%)

Katestone Environmental Pty Ltd KE1006953 OEH
June 2011
Page 183
Figure 51 is a plot of the emission factors for PM10 for draglines showing the sensitivity to drop height and to moisture content for the NPI emission factors. The NPI suggests a drop height of 12 metres and moisture contents of 1% or 2% are reasonable for the Hunter Valley. The low, high and mid-range values shown in Figure 51 are based on the ranges and geometric means of moisture content and blasting depth contained in AP-42 (Table 84).
Table 84 NPI defaults and range and geometric means of variables for AP-42
emission estimation equations for draglines
Parameter NPI defaults10
AP-42125
Range Geometric mean
Moisture content (%) 1-2 0.2-16.3 3.2
Drop height (m) 12 1.5-30 8.6
Reducing the drop height from 30 metres to less than 5 metres will reduce total PM10 emissions by 72%. Increasing the moisture content of the material from 2% to 16.3% would reduce the PM10 emission rate by 53%.
Figure 51 NPI and AP-42 PM10 emission factors for draglines and sensitivity to drop
height and moisture content
BHP Billiton Mitsubishi Alliance (BMA) has developed a particulate matter suppression system that has been reported to be effective in reducing particulate matter emissions and has improved dragline productivity176. The particulate matter suppression system consists of a high water capacity, full circle irrigation spray176. There is a limitation to the amount of controls that can be placed on draglines due to the nature of the activity. Best practice techniques for the control of particulate matter emissions from draglines are:

Katestone Environmental Pty Ltd KE1006953 OEH
June 2011
Page 184
Minimise drop height
Modify operations during adverse atmospheric and meteorological conditions
Water sprays
Eliminate side casting Table 85 summarises the control measures used for dragline operations.
Table 85 Best practice control measures to reduce particulate matter emissions
from draglines
Control measure Effectiveness
Dragline
Minimise drop height Reduce from 30 m to 5 m: 70%a
Minimise drop height Reduce from 10 m to 5 m: 40%a
Modify activities in windy conditions
Unquantified
Water application 50%a
Minimise side casting Unquantified Note aReduction due to reduced drop height and water have been inferred from the dragline emission estimation
equation
9.7 Loading and dumping overburden
Of all sources of particulate matter in coal mining activities in the GMR, trucks dumping overburden was ranked number 4 in terms of emissions of TSP, number 5 in terms of emissions of PM10 and number 6 in terms of emissions of PM2.5. Trucks dumping overburden has been estimated to contribute 4.1% of PM10 emissions from coal mines in the GMR. Loaders dumping overburden ranked number 11 in terms of emissions of TSP, PM10 and PM2.5. Loaders dumping overburden has been estimated to contribute 1.2% of PM10 emissions from coal mines in the GMR. A summary of rankings and proportional contributions to GMR emissions of particulate matter is included in Table 86.
Table 86 Contribution of trucks and loaders dumping overburden to GMR emissions
of TSP, PM10 and PM2.5
Activity
TSP PM10 PM2.5
Rank Rate (tpy)
Proportion (%)
Rank Rate (tpy)
Proportion (%)
Rank Rate (tpy)
Proportion (%)
Trucks (dumping overburden)
4 6,295 4.0 5 2,480 4.2 6 324 3.1
Loaders (overburden)
11 1,237 0.8 11 707 1.2 11 70 0.7
At truck and shovel mines, excavators or power shovels are used to excavate blasted overburden in the pit. The overburden is dumped into large haul trucks and transported to the waste emplacement and dumped or is dumped back into the pit. To control emissions from trucks dumping the West Virginia Department of Environmental Protection recommends that where truck dumps have a drop height greater than 6 metres, a stacking tube or full enclosure of the dump should be used. The effect of this recommendation is to minimise the drop height of materials. Other documents146 suggest that the application of water can achieve a reduction in particulate emissions from truck dumping. The sensitivity of dragline emissions to drop height shows that increasing drop height would increase emissions significantly. It would be reasonable therefore, to conclude that minimising the drop height from excavator to truck and truck to ground would also be an effective mitigation measure.
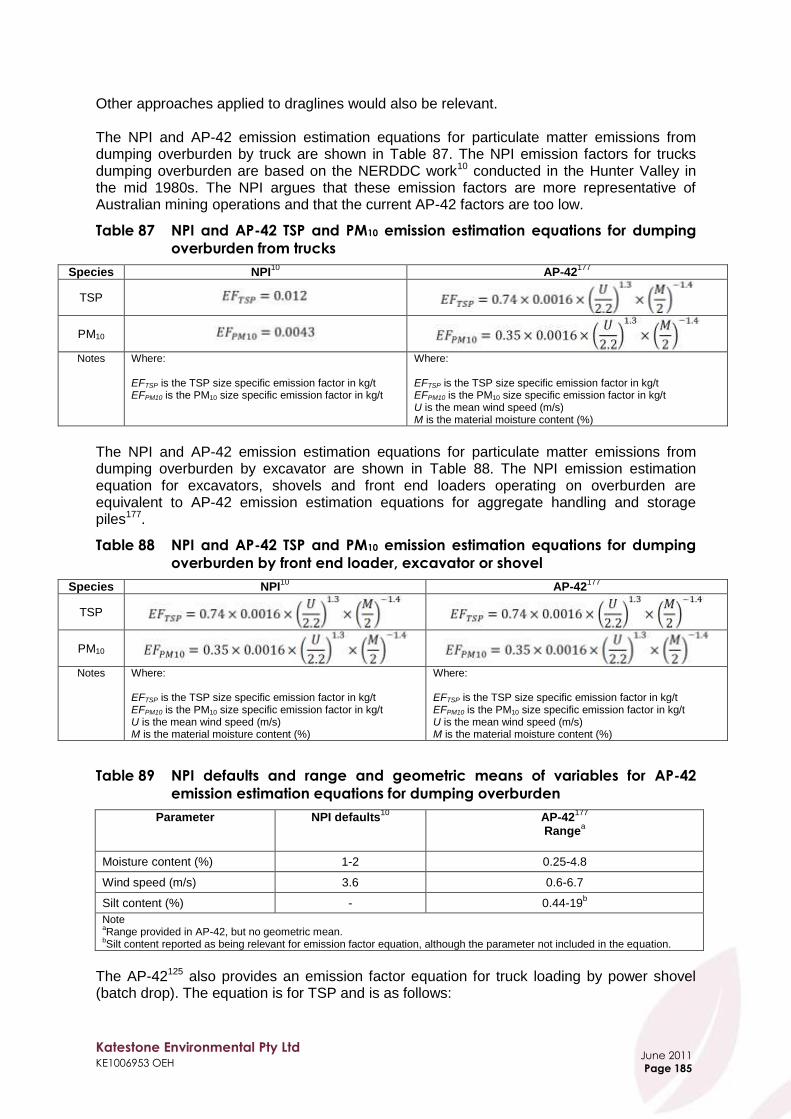
Katestone Environmental Pty Ltd KE1006953 OEH
June 2011
Page 185
Other approaches applied to draglines would also be relevant. The NPI and AP-42 emission estimation equations for particulate matter emissions from dumping overburden by truck are shown in Table 87. The NPI emission factors for trucks dumping overburden are based on the NERDDC work10 conducted in the Hunter Valley in the mid 1980s. The NPI argues that these emission factors are more representative of Australian mining operations and that the current AP-42 factors are too low.
Table 87 NPI and AP-42 TSP and PM10 emission estimation equations for dumping
overburden from trucks
Species NPI10
AP-42177
TSP
PM10
Notes Where: EFTSP is the TSP size specific emission factor in kg/t EFPM10 is the PM10 size specific emission factor in kg/t
Where: EFTSP is the TSP size specific emission factor in kg/t EFPM10 is the PM10 size specific emission factor in kg/t U is the mean wind speed (m/s) M is the material moisture content (%)
The NPI and AP-42 emission estimation equations for particulate matter emissions from dumping overburden by excavator are shown in Table 88. The NPI emission estimation equation for excavators, shovels and front end loaders operating on overburden are equivalent to AP-42 emission estimation equations for aggregate handling and storage piles177.
Table 88 NPI and AP-42 TSP and PM10 emission estimation equations for dumping
overburden by front end loader, excavator or shovel
Species NPI10
AP-42177
TSP
PM10
Notes Where: EFTSP is the TSP size specific emission factor in kg/t EFPM10 is the PM10 size specific emission factor in kg/t U is the mean wind speed (m/s) M is the material moisture content (%)
Where: EFTSP is the TSP size specific emission factor in kg/t EFPM10 is the PM10 size specific emission factor in kg/t U is the mean wind speed (m/s) M is the material moisture content (%)
Table 89 NPI defaults and range and geometric means of variables for AP-42
emission estimation equations for dumping overburden
Parameter NPI defaults10
AP-42177
Range
a
Moisture content (%) 1-2 0.25-4.8
Wind speed (m/s) 3.6 0.6-6.7
Silt content (%) - 0.44-19b
Note aRange provided in AP-42, but no geometric mean.
bSilt content reported as being relevant for emission factor equation, although the parameter not included in the equation.
The AP-42125 also provides an emission factor equation for truck loading by power shovel (batch drop). The equation is for TSP and is as follows:

Katestone Environmental Pty Ltd KE1006953 OEH
June 2011
Page 186
Where: EFTSP is the TSP size specific emission factor in kg/Mg Figure 52 is a plot of the emission factors for PM10 for trucks and shovels dumping overburden showing the sensitivity to moisture content and average wind speed. The figure shows that the NPI emission factor for truck dumping and the AP-42 emission factor for truck loading by power shovel (batch drop) are at the upper bound of the other AP-42 emission factors. The ranges of average wind speed and moisture content are consistent with the AP-42 data.
Figure 52 NPI and AP-42 PM10 emission factors for dumping overburden and
sensitivity to moisture content and average wind speed
Reducing the drop height from 3 metres to less than 1.5 metres will reduce total PM10 emissions by 30%. Increasing the moisture content of the material from 1% to 2% would reduce the PM10 emission rate by 38%. Best practice measures for minimising emissions from material dumping include:
Use of water sprays or water carts with boom spray
Cease or modify activities on dry windy days
Minimise dump height Table 90 summarises the control measures used for loading and dumping overburden.

Katestone Environmental Pty Ltd KE1006953 OEH
June 2011
Page 187
Table 90 Best practice control measures to reduce particulate matter emissions
from loading and dumping overburden
Control measure Effectiveness
Excavator Minimise drop height Reduce from 3 m to 1.5 m: 30%a
Truck dumping
Minimise drop height Reduce from 3 m to 1.5 m: 30%a
Water application 50%10
Modify activities in windy conditions Unquantified Note a Reductions due to reduced drop heights have been inferred from the emission estimation equation for dropping
material from a dragline and rounded down to the nearest 10%.
9.8 Loading and dumping ROM coal
Of all sources of particulate matter from coal mining activities in the GMR, loaders dumping coal was ranked number 7 in terms of emissions of TSP, number 6 in terms of emissions of PM10 and number 8 in terms of emissions of PM2.5. Loaders dumping coal contribute 2.1% of total coal mining emissions of PM10 in the GMR. Trucks dumping coal ranked number 12 in terms of emissions of TSP, PM10 and PM2.5. Trucks dumping coal contribute 0.7% to total coal mining emissions of PM10 in the GMR. A summary of rankings and proportional contributions to GMR emissions of particulate matter is included in Table 91.
Table 91 Contribution of trucks and loaders dumping coal to GMR emissions of TSP,
PM10 and PM2.5
Activity TSP PM10 PM2.5
Rank Rate (tpy)
Proportion (%)
Rank Rate (tpy)
Proportion (%)
Rank Rate (tpy)
Proportion (%)
Loaders (coal) 7 3,384 2.2 6 2,141 3.6 8 209 2.0
Trucks (dumping coal)
12 1,108 0.7 12 471 0.8 12 53 0.5
Emissions of particulate matter on the ROM pad are caused by dumping of coal on the pad, forming the coal into stockpiles and load-out of coal to the ROM bin. Emissions of particulate matter will also occur as a result of wind erosion of stockpiled coal on the ROM pad. Bulldozing coal is dealt with in Section 9.4 and wind erosion of stockpiled coal is dealt with in Section 9.3.3. The ROM pad is used to store coal as required prior to load-out into the coal processing plant. Coal may bypass the ROM stockpiles resulting in a reduction in emissions of particulate matter associated with dumping of coal and stockpile formation. Loading coal into the ROM bin or truck produces particulate matter as a result of the turbulence induced by dumping coal, which may be enhanced in a cross-wind. Enclosure and application of water is the principal control measure used to control emissions of particulate matter from ROM bins10. Water may also be applied at the ROM pad to minimise dumping emissions. The NPI and AP-42 emission estimation equations for particulate matter for trucks dumping coal are shown in Table 92.

Katestone Environmental Pty Ltd KE1006953 OEH
June 2011
Page 188
Table 92 NPI and AP-42 TSP and PM10 emission estimation equations for dumping
coal from trucks
Species NPI10
AP-42125
TSP PM10 Notes Where:
EFTSP is the TSP size specific emission factor in kg/t EFPM10 is the PM10 size specific emission factor in kg/t
Where: EFTSP is the TSP size specific emission factor in kg/t EFPM10 is the PM10 size specific emission factor in kg/t M is the material moisture content (%)
The NPI and AP-42 emission estimation equations for particulate matter from excavators dumping coal are shown in Table 93.
Table 93 NPI and AP-42 TSP and PM10 emission estimation equations for dumping
coal from excavators
Species NPI10
AP-42125
TSP
PM10 Notes Where:
EFTSP is the TSP size specific emission factor in kg/t EFPM10 is the PM10 size specific emission factor in kg/t M is the material moisture content (%)
Where: EFTSP is the TSP size specific emission factor in kg/t EFPM10 is the PM10 size specific emission factor in kg/t M is the material moisture content (%)
The NPI emission factors for trucks dumping coal are based on the NERDDC work10 conducted in the Hunter Valley in the mid 1980s. The NPI argues that these emission factors are more representative of Australian mining operations and that the current AP-42 factors are too low. The NPI emission estimation equation for excavators, shovels and front end loaders operating on coal are equivalent to the AP-42 emission estimation equation for PM10 emissions from truck loading of coal125. However, the AP-42 emission estimation equation for TSP is different to the NPI emission estimation equation for excavators, shovels and front end loaders. Table 94 is a comparison of NPI and AP-42 emission factors for TSP and PM10 for trucks and shovels dumping coal. The default NPI emission factor for trucks dumping coal is about 81% of the AP-42 factor calculated using the geometric mean of the moisture content. The default factor for PM10 emissions from dumping coal using a shovel, loader or excavator is 2.7 times higher than the AP-42 factor calculated using the geometric mean of the moisture content.
Table 94 Comparison of NPI and AP-42 emission factors for truck and shovel
dumping coal
Activity
AP-42 Moisture data (%)
AP-42 using Geo mean for moisture
(kg/t)
NPI default (kg/t)
Range Geo
mean TSP PM10 TSP PM10
Truck dumping coal 6.6-38 17.8 0.019 0.0052 0.010 0.0042
Shovel, loader or excavator working on coal
6.6-38 17.8 0.019 0.0052 0.029 0.014
Figure 53 shows the sensitivity of the NPI and AP-42 emission estimation equations to moisture content of the coal. The default NPI emission factors for truck dumping coal and shovel, loader or excavator working on coal are also shown in the figure. Increasing the moisture content from the lower end of the range to the geometric mean will reduce emissions of PM10 by 59%.

Katestone Environmental Pty Ltd KE1006953 OEH
June 2011
Page 189
Figure 53 NPI and AP-42 PM10 emission factors for dumping coal and sensitivity to
moisture content
Operational management and control of mining that ensures that coal bypasses the ROM pad will minimise potential emissions from stockpiled coal and multiple handling activities. There are no controls identified in the literature for reducing emissions from trucks dumping coal onto the ROM pad. Whereas particulate emissions from coal dumped into the ROM hopper can be effectively controlled. Table 95 summarises the control measures used for the loading and dumping ROM coal.
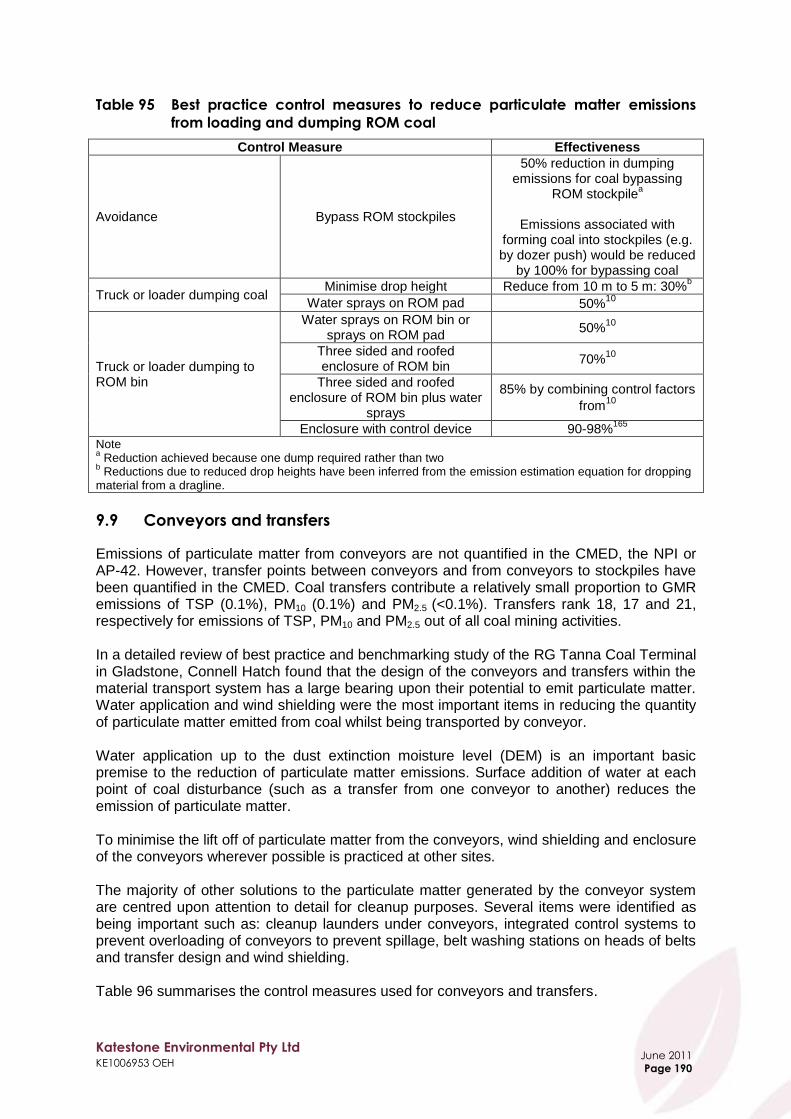
Katestone Environmental Pty Ltd KE1006953 OEH
June 2011
Page 190
Table 95 Best practice control measures to reduce particulate matter emissions
from loading and dumping ROM coal
Control Measure Effectiveness
Avoidance Bypass ROM stockpiles
50% reduction in dumping emissions for coal bypassing
ROM stockpilea
Emissions associated with
forming coal into stockpiles (e.g. by dozer push) would be reduced
by 100% for bypassing coal
Truck or loader dumping coal Minimise drop height Reduce from 10 m to 5 m: 30%
b
Water sprays on ROM pad 50%10
Truck or loader dumping to ROM bin
Water sprays on ROM bin or sprays on ROM pad
50%10
Three sided and roofed enclosure of ROM bin
70%10
Three sided and roofed enclosure of ROM bin plus water
sprays
85% by combining control factors
from10
Enclosure with control device 90-98%165
Note a Reduction achieved because one dump required rather than two
b Reductions due to reduced drop heights have been inferred from the emission estimation equation for dropping
material from a dragline.
9.9 Conveyors and transfers
Emissions of particulate matter from conveyors are not quantified in the CMED, the NPI or AP-42. However, transfer points between conveyors and from conveyors to stockpiles have been quantified in the CMED. Coal transfers contribute a relatively small proportion to GMR emissions of TSP (0.1%), PM10 (0.1%) and PM2.5
(<0.1%). Transfers rank 18, 17 and 21, respectively for emissions of TSP, PM10 and PM2.5 out of all coal mining activities. In a detailed review of best practice and benchmarking study of the RG Tanna Coal Terminal in Gladstone, Connell Hatch found that the design of the conveyors and transfers within the material transport system has a large bearing upon their potential to emit particulate matter. Water application and wind shielding were the most important items in reducing the quantity of particulate matter emitted from coal whilst being transported by conveyor. Water application up to the dust extinction moisture level (DEM) is an important basic premise to the reduction of particulate matter emissions. Surface addition of water at each point of coal disturbance (such as a transfer from one conveyor to another) reduces the emission of particulate matter. To minimise the lift off of particulate matter from the conveyors, wind shielding and enclosure of the conveyors wherever possible is practiced at other sites. The majority of other solutions to the particulate matter generated by the conveyor system are centred upon attention to detail for cleanup purposes. Several items were identified as being important such as: cleanup launders under conveyors, integrated control systems to prevent overloading of conveyors to prevent spillage, belt washing stations on heads of belts and transfer design and wind shielding. Table 96 summarises the control measures used for conveyors and transfers.

Katestone Environmental Pty Ltd KE1006953 OEH
June 2011
Page 191
Table 96 Best practice control measures to reduce particulate matter emissions
from conveyors and transfers
Control Measure Effectiveness
Conveyors
Application of water at transfers 50%10
Wind shielding – roof or side wall 40%10
Wind shielding – roof and side wall
70%10
Belt cleaning and spillage minimisation
Not quantified
Transfers Enclosure 70%10
9.10 Stacking and reclaiming product coal
Stacking and reclaiming product coal is not explicitly characterised in the CMED. Since product coal is in most circumstances, relatively wet during handling, emissions of particulate matter would be relatively small and would be a subset of coal dumping, bulldozing and transfers identified above. Stacking coal on product stockpiles can produce emissions of particulate matter due to the turbulence induced by dropping coal from height particularly in circumstances where coal is dry and/or where coal has a high dustiness potential. Emissions of particulate matter are enhanced when there is a significant cross-wind present. Where coal is being stacked after washing, emissions of particulate matter are low so additional control is generally unnecessary. The following measures are applied to minimise emissions of particulate matter from stacking:
Bypass coal stockpile
Variable height luffing stacker to allow drop height to be minimised and stacking to occur without dozer push
Use of chutes or wind shields to shroud falling coal from static trippers
Water application – boom tip sprays Reclaiming coal on product stockpiles can produce emissions of particulate matter where substantial additional handling by loader or bulldozer are required to reclaim coal or where coal remains in stockpile for a period sufficient to allow substantial coal drainage and drying. Where coal is being reclaimed after washing, emissions of particulate matter may be low and additional amelioration may be unnecessary. The following measures are applied to minimise emissions of particulate matter from reclaiming:
Use of bucket-wheel, portal or bridge reclaimer
Water application – boom tip sprays
Reclaim tunnel with minimal mechanical disturbance
Minimise residence time in stockpiles
Coal moisture management Table 97 summarises the control measures used for stacking and reclaiming coal.

Katestone Environmental Pty Ltd KE1006953 OEH
June 2011
Page 192
Table 97 Best practice control measures to reduce particulate matter emissions
from stacking and reclaiming product coal
Control Measure Effectiveness
Avoidance Bypass coal stockpiles 100% reduction in stacking
emissions for coal bypassing stacker
Loading coal stockpiles
Variable height stack 25%10
Boom tip water sprays 50%10
Telescopic chute with water sprays 75%10
Unloading coal stockpiles Bucket-wheel, portal or bridge
reclaimer with water application 50%
10
9.11 Train and truck load out and transportation
Of all sources of particulate matter in coal mining activities in the GMR, loading of trains with coal was ranked number 19 in terms of emissions of TSP, number 20 in terms of emissions of PM10 and number 22 in terms of emissions of PM2.5. Loading trains with coal contributes less than 0.1% to overall coal mining emissions of TSP, PM10 and PM2.5 in the GMR. The NPI and AP-42 emission estimation equations for particulate matter from loading trains are shown in Table 98.
Table 98 NPI and AP-42 TSP and PM10 emission estimation equations for loading
trains and trucks with coal
Species NPI10
AP-42125
TSP
PM10 - Notes Where:
EFTSP is the TSP size specific emission factor in kg/t EFPM10 is the PM10 size specific emission factor in kg/t
Where: EFTSP is the TSP size specific emission factor in kg/t
The NPI emission factor is between the lower and upper bounds of the AP-42 emission factors for TSP. Particulate matter occurs whilst coal is loaded into trains and trucks as a result of the air turbulence induced by dropping the coal from a height. Cross flow of wind can exacerbate emission of particulate matter. Spilled coal can also be a cause of particulate matter emissions due to wind erosion. Emissions of particulate matter from train and truck load out facilities are low compared with other activities at mines as the majority of coal is relatively wet from washing and the activity is usually carried out within an enclosure. Best practice measures to control emissions of particulate matter from truck and train loader are the use of volumetric loading from an overhead silo or bin with a telescopic chute with the entire activity enclosed within a building. Clam-shell or front-end loaders should be avoided where possible due to the potential for spillage during loading operations. Spilled coal can be a source of particulate matter emissions particularly as the coal dries and where it is deposited on tracks and trafficked areas can be pulverised to produce a very fine and easily eroded particulate matter.

Katestone Environmental Pty Ltd KE1006953 OEH
June 2011
Page 193
Figure 54178 shows a fully automated train loading facility with enclosure of the loading point.
Figure 54 Photograph of a train loading facility
The off-site transportation of the coal via rail can give rise to localised impacts on levels of particulate matter. Queensland Rail has undertaken an extensive study into fugitive emissions of particulate matter from coal trains. Emissions of particulate matter are mainly caused by wheel action on the rails, wagon-induced turbulence acting on dust-supporting ground surfaces and windblown particulate matter from loads. Sources of particulate matter emissions from trains are:
The coal surface of loaded wagons
Leakage of coal from doors of loaded wagons
Wind erosion of spilled coal in the corridor
Leakage of residual coal from doors of unloaded wagons Best practice measures to control emissions of particulate matter from rail corridors include179:
Use of profilers to manage overloading or underloading of wagons
Maintain a consistent profile. (Loading via front-end loaders and clam shells produces uneven loads that are susceptible to spillage and reduce the effectiveness of suppressants.)
Maintaining the 100 mm freeboard around the edge of the wagon
Application of a suppressant to the surface of the coal profile
Removing parasitic coal from the surface of the wagons before leaving the mine site
Covering load (e.g. tarpaulins or lid)
Wagon wheel wash There are a number of suppressants available, however the effectiveness of each to minimise lift-off depends on the properties of the coal and the individual suppressant179.

Katestone Environmental Pty Ltd KE1006953 OEH
June 2011
Page 194
Best practice measures to control emissions of particulate matter from trucks include:
Limit load size to ensure coal is not above the level of the sidewalls
Maintain a consistent profile
Use bedliners to minimise seepage and spillage from bottom dumping trucks
Covering load with a tarpaulin
Utilise a truck wheel wash ensuring that truck is clean and free of loose material

Katestone Environmental Pty Ltd KE1006953 OEH
June 2011
Page 195
10. NSW Techniques for Controlling Particulate Matter Emissions
from Coal Mining
In this section, current techniques for controlling particulate matter emissions from coal mines in the GMR have been researched by considering:
The Coal Mines Emission Database (CMED) developed by OEH from its industrial survey conducted in 2009.
An internet survey of GMR mines in July – August 2010. Non-responders were re-surveyed in February – March 2011.
Information sourced during site visits to thirteen mines in the Hunter and Newcastle coalfields.
Documents published by the coal mines such as: Annual Environment Management Reports (AEMR), Environmental Management Plans (EMP) and Environmental Management Systems (EMS).
Conditions of Approval and Environment Protection Licences (EPL). A metric has been developed to rank, in relative terms, the progress towards best practice that has been achieved at GMR coal mines. The metric has been solely based on data provided by EPA licensees in response to the OEH industrial survey conducted in 2009 and contained within CMED. The metric, hereafter, is referred to as the particulate matter emission control metric.
10.1 Methodology
The existing practices adopted to manage particulate matter emissions from coal mining activities in the GMR have been identified through the following work:
A review of data contained in OEH‟s CMED.
Internet surveys.
Site visit to thirteen coal mines in the Hunter Valley and Newcastle Coalfields.
Review of NPI data for 2008-09 reporting year.
Review of Annual Environmental Management Reports (AEMR), Environmental Management Systems (EMS), Environmental Management Plans (EMP) and Environment Protection Licences (EPL).
This information has been consolidated into the following sections. Letters were sent to 69 licensees in the GMR requesting that they participate in this study and requesting disaggregated NPI data and other documents. A copy of the OEH letter that was sent to each mine is included at Appendix C.
10.1.1 Coal Mines Emission Database
In September 2009, OEH wrote to all EPA licensees including all coal mines in the GMR and requested information by Notice under Section 191 of the POEO Act (Appendix B). The Notice required licensees to complete a questionnaire that included the provision of the following information:
Details of the operation
Operating schedule
Major materials and products

Katestone Environmental Pty Ltd KE1006953 OEH
June 2011
Page 196
Air emissions sources
Fuel combustion
Fugitive emissions from valves seals
On-site vehicles
Materials handling
Stockpiles and exposed areas
NPI emissions of particulate matter
Process flow diagram OEH provided Katestone Environmental with a database of disaggregated particulate matter emissions for coal mining activities in the GMR. The Coal Mines Emission Database (CMED) is a subset of the information collected for the GMR air emissions inventory.
10.1.2 Internet survey: July-August 2010
On 8 July 2010, sixty nine letters were sent out to coal mines in the GMR. Twenty six complete responses to the survey were received. The survey consisted of thirty questions covering the following:
• Coal produced • Type of coal mining activity • For open-cut mines:
o Mining method for coal and overburden extraction o Management of particulate matter emissions from draglines, blasting and
exposed materials • For all activities:
o Coal and overburden transport methods o Management of particulate matter emissions from unloading trucks, haul
roads and conveyors o Management of particulate matter emissions from ROM and product
stockpiles o Management of particulate matter emissions from CHPP, dry processing of
coal, wind erosion, tailings dams and truck and train loading A copy of the Katestone Environmental letter and internet survey is included as Appendix D.
10.1.3 Internet survey: February – March 2011
The final draft report of this benchmarking study was published on the OEH website (http://www.environment.nsw.gov.au/air/coalminingNSW.htm) on 23 December 2010 and comments were requested by 7 February 2011. A number of mines that did not participate in the survey conducted in July and August 2010, requested that they be given the opportunity to complete the survey. On 22 February 2011, the survey was reissued to those mining companies that had not completed the survey. An additional 33 responses were received. A copy of the Katestone Environmental letter and internet survey is included as Appendix D.
10.1.4 Coal mine site visits
The following criteria were used to identify the subset of mines to be initially considered for the site visits:
Katestone Environmental Pty Ltd KE1006953 OEH
June 2011
Page 197
Open-cut (or combination of open-cut and underground) to provide the broadest range of issues
Located in the Hunter Valley to provide for most efficient timing of visits
Relative proximity to sensitive land-use
Population density and evidence of complaints
Use of dragline and truck and shovel Of these mines, the top fifteen mines with respect to production rate and PM10 emission rate were identified. Additionally, the relative PM10 emission rate was calculated (i.e. the emission rate of PM10 per tonne of coal produced) and used to identify mines with low and high relative PM10 emission rates. Preliminary information from the review of current NSW management practices identified a number of mines of particular interest. Relative proximity of mines to residential areas was also considered. Using the nominated criteria, nineteen mines were identified and as a result of personnel availability during the two weeks of visits, arrangements were able to be made with 13 of those mines for inspections. The following sites were visited during the study:
• Hunter Valley Operations • Mt Arthur North Coal Mine • Saxonvale Colliery Holding • Warkworth Coal Mine/Mount Thorley Operations • Mt Owen Coal Mine • Wambo Coal Pty Ltd • Liddell Coal Operations • Bengalla Mine • Ravensworth/Narama Mine • Muswellbrook Colliery Holding • Cumnock No. 1 Colliery • Glendell Mine • Donaldson Coal Pty Ltd
The objectives of the visits were as follows:
Observe and document air quality management and mitigation measures implemented at each site
Focus of observations was on major sources of particulate matter:
Unpaved roads and haul trucks
Wind erosion of overburden and exposed areas
Blasting
ROM pad
Dragline and overburden handling
Develop an understanding, through discussion with relevant site personnel, the effectiveness of particulate matter mitigation strategies and the site constraints to reducing emissions
10.1.5 Review of AEMR, EMS, EMP and EPL documents
Relevant documents were obtained for each facility as a result of the written request for information and from the websites of some facilities. EPLs for all activities were obtained from OEH‟s website. All relevant documents have been reviewed and details of management practices and monitoring data have been compiled. Forty eight AEMRs have

Katestone Environmental Pty Ltd KE1006953 OEH
June 2011
Page 198
been obtained and details of particulate matter management activities have been included in this study. In some cases, where AEMR were not available, EMP or EMS have been used. Minimal information was available for five mines. This information has been summarised in the following sections.
10.2 Results of internet survey
Responses representing fifty nine facilities were received during the two survey periods. The results of the surveys are summarised in the following sections. Survey respondents represented 93% of coal production in the GMR and 91% of estimated PM10 emissions using the CMED. The data from the surveys has been used to supplement the information obtained about GMR mines and this information is presented in the following sections. Responses to each survey question are summarised at Appendix E. Of the fifty nine respondents, 41% represent underground mining activities and 41% open-cut mining activities (Figure 55). Fifteen percent of respondents conduct no mining, but represent either processing plants or former mines under rehabilitation or care and maintenance.
Figure 55 Survey response: type of coal produced
Of the mines that responded to the survey, the majority (59%) produce thermal coal of either low or high ash content (Figure 56). High ash thermal coal has ash content from 15-30% whilst low ash thermal coal has ash content that is less than 15%180. Twenty six percent produce coking coal. The other category includes mines producing soft coking coals and mines that produce multiple products for export and local markets.

Katestone Environmental Pty Ltd KE1006953 OEH
June 2011
Page 199
Figure 56 Survey response: type of coal produced
10.3 Particulate matter emission control metric
A particulate matter emission control metric was developed to quantify the progress of mines towards achieving best practice in control of emissions of particulate matter. The metric has been solely based on data provided by EPA licensees in response to the OEH industrial survey conducted in 2009 and contained within CMED. For an individual source of particulate matter emissions the source metric is calculated as follows:
Where: Mi is the metric for source i CFi is the current control factor for source i CFi-B is the best practice control factor for source i The combined metric for a mine is the sum of metrics calculated for each individual source weighted by the contribution of that uncontrolled source to the mine‟s total uncontrolled emission rate. For a mine with best practice the score would be 100. To achieve a high score, a mine must score close to 100 for the emission sources that represent the majority of emissions.

Katestone Environmental Pty Ltd KE1006953 OEH
June 2011
Page 200
For a mine the combined metric is calculated as an uncontrolled emission weighted sum of the individual source metrics as follows:
Where: Mm is the metric for mine m. Ei,m is the uncontrolled source emission rate for source i at mine m. Em is the total uncontrolled emission rate of all sources at mine m:
CFi,m is the current control factor for source i at mine m CFi-B is the best practice control factor for source i For the GMR, a combined metric representing the progress towards achieving best practice across all mines was calculated from the metric for each individual mine as follows:
Where: MGMR is the metric for the entire GMR. Mm is the metric for mine m. Em is the total emission rate of all sources at mine m EGMR is the sum of the uncontrolled emissions from all mines in the GMR i.e.
An example of this calculation is shown in Table 99. In the example, Mine C is achieving best practice for emission source 1., but is below best practice for sources 2 and 3. The metric for Mine A is 55, for Mine B is 62 and for Mine C is 74, indicating that Mine C is providing the best level of emission control for particulate emissions. Emission source 1 is controlled to the greatest degree of all the sources with a combined source metric of 85. Emission source 2 is controlled to the lowest extent. The metric for all three mines combined is 67.
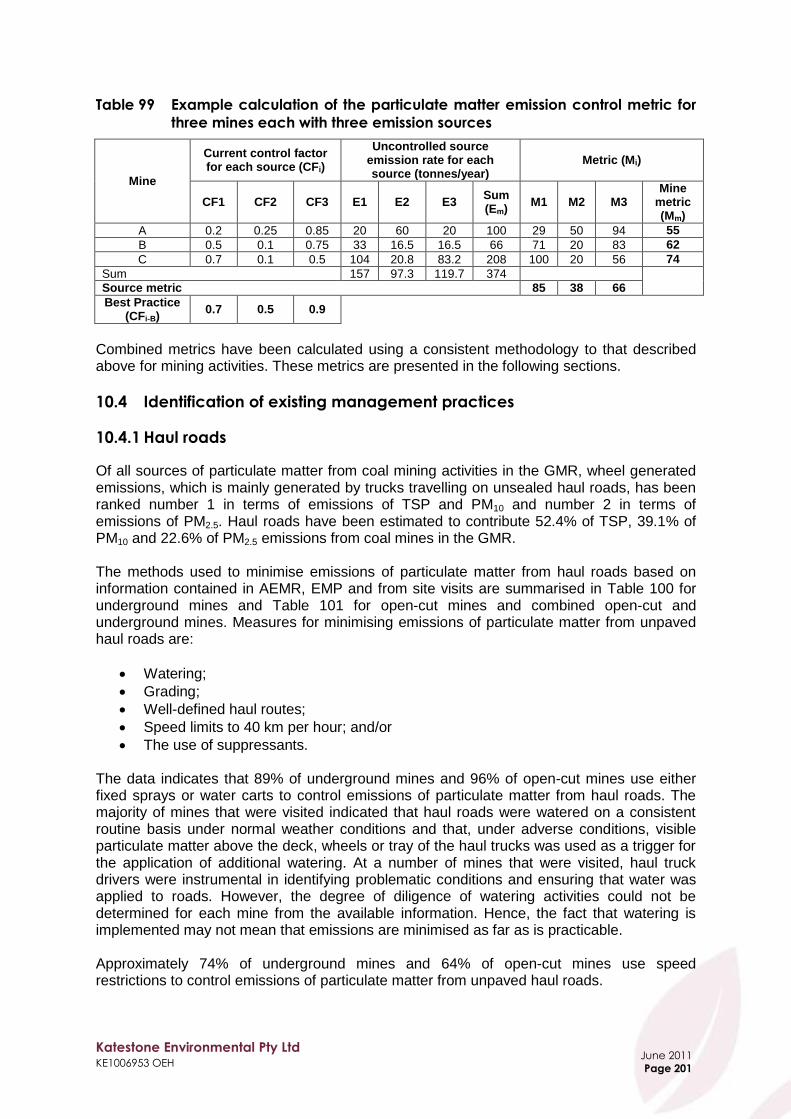
Katestone Environmental Pty Ltd KE1006953 OEH
June 2011
Page 201
Table 99 Example calculation of the particulate matter emission control metric for
three mines each with three emission sources
Mine
Current control factor for each source (CFi)
Uncontrolled source emission rate for each source (tonnes/year)
Metric (Mi)
CF1 CF2 CF3 E1 E2 E3 Sum (Em)
M1 M2 M3 Mine
metric (Mm)
A 0.2 0.25 0.85 20 60 20 100 29 50 94 55
B 0.5 0.1 0.75 33 16.5 16.5 66 71 20 83 62
C 0.7 0.1 0.5 104 20.8 83.2 208 100 20 56 74
Sum 157 97.3 119.7 374
Source metric 85 38 66
Best Practice (CFi-B)
0.7 0.5 0.9
Combined metrics have been calculated using a consistent methodology to that described above for mining activities. These metrics are presented in the following sections.
10.4 Identification of existing management practices
10.4.1 Haul roads
Of all sources of particulate matter from coal mining activities in the GMR, wheel generated emissions, which is mainly generated by trucks travelling on unsealed haul roads, has been ranked number 1 in terms of emissions of TSP and PM10 and number 2 in terms of emissions of PM2.5. Haul roads have been estimated to contribute 52.4% of TSP, 39.1% of PM10 and 22.6% of PM2.5 emissions from coal mines in the GMR. The methods used to minimise emissions of particulate matter from haul roads based on information contained in AEMR, EMP and from site visits are summarised in Table 100 for underground mines and Table 101 for open-cut mines and combined open-cut and underground mines. Measures for minimising emissions of particulate matter from unpaved haul roads are:
Watering;
Grading;
Well-defined haul routes;
Speed limits to 40 km per hour; and/or
The use of suppressants. The data indicates that 89% of underground mines and 96% of open-cut mines use either fixed sprays or water carts to control emissions of particulate matter from haul roads. The majority of mines that were visited indicated that haul roads were watered on a consistent routine basis under normal weather conditions and that, under adverse conditions, visible particulate matter above the deck, wheels or tray of the haul trucks was used as a trigger for the application of additional watering. At a number of mines that were visited, haul truck drivers were instrumental in identifying problematic conditions and ensuring that water was applied to roads. However, the degree of diligence of watering activities could not be determined for each mine from the available information. Hence, the fact that watering is implemented may not mean that emissions are minimised as far as is practicable. Approximately 74% of underground mines and 64% of open-cut mines use speed restrictions to control emissions of particulate matter from unpaved haul roads.
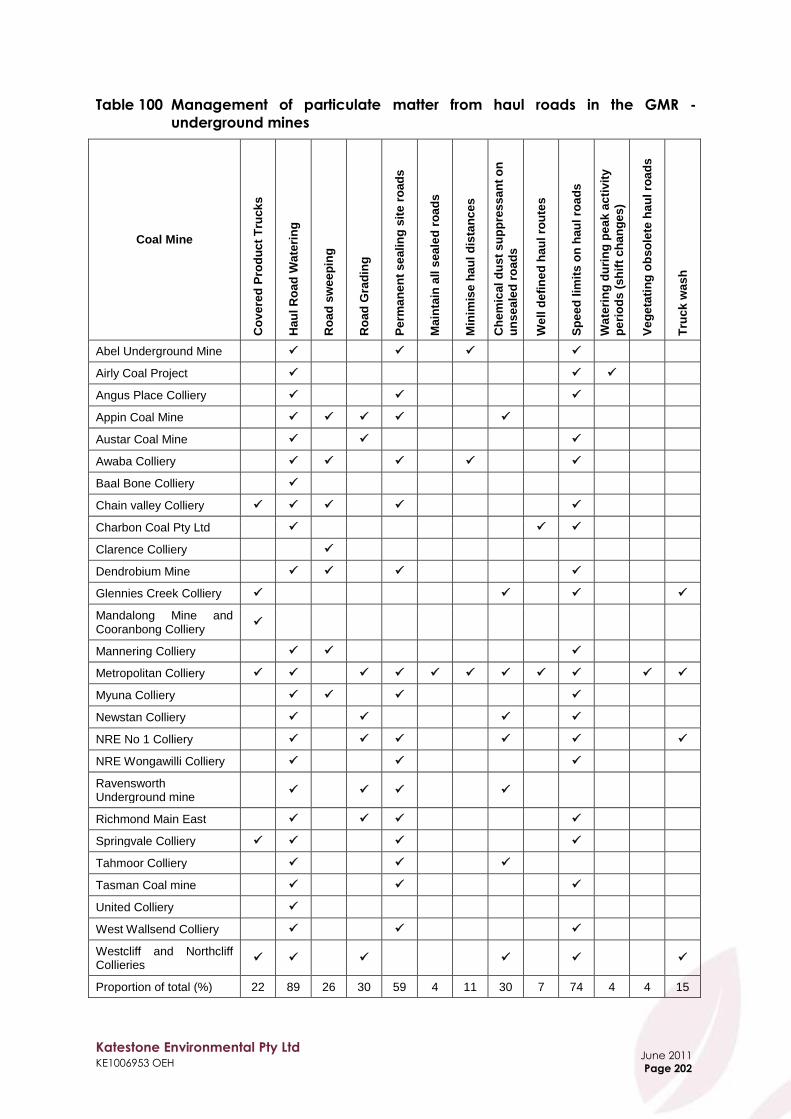
Katestone Environmental Pty Ltd KE1006953 OEH
June 2011
Page 202
Table 100 Management of particulate matter from haul roads in the GMR -
underground mines
Coal Mine
Co
ve
red
Pro
du
ct
Tru
ck
s
Ha
ul
Ro
ad
Wa
teri
ng
Ro
ad
sw
ee
pin
g
Ro
ad
Gra
din
g
Pe
rma
ne
nt
se
ali
ng
sit
e r
oad
s
Ma
inta
in a
ll s
ea
led
ro
ad
s
Min
imis
e h
au
l d
ista
nc
es
Ch
em
ical
du
st
su
pp
res
sa
nt
on
un
se
ale
d r
oa
ds
We
ll d
efi
ne
d h
au
l ro
ute
s
Sp
ee
d l
imit
s o
n h
au
l ro
ad
s
Wa
teri
ng
du
rin
g p
ea
k a
cti
vit
y
pe
rio
ds
(s
hif
t ch
an
ge
s)
Ve
ge
tati
ng
ob
so
lete
ha
ul
roa
ds
Tru
ck
wa
sh
Abel Underground Mine
Airly Coal Project
Angus Place Colliery
Appin Coal Mine
Austar Coal Mine
Awaba Colliery
Baal Bone Colliery
Chain valley Colliery
Charbon Coal Pty Ltd
Clarence Colliery
Dendrobium Mine
Glennies Creek Colliery
Mandalong Mine and Cooranbong Colliery
Mannering Colliery
Metropolitan Colliery
Myuna Colliery
Newstan Colliery
NRE No 1 Colliery
NRE Wongawilli Colliery
Ravensworth Underground mine
Richmond Main East
Springvale Colliery
Tahmoor Colliery
Tasman Coal mine
United Colliery
West Wallsend Colliery
Westcliff and Northcliff Collieries
Proportion of total (%) 22 89 26 30 59 4 11 30 7 74 4 4 15

Katestone Environmental Pty Ltd KE1006953 OEH
June 2011
Page 203
Table 101 Management of particulate matter from haul roads in the GMR - open-cut
mines and combined open-cut and underground mines
Coal Mine
Co
ve
red
Pro
du
ct
Tru
ck
s
Ha
ul
Ro
ad
Wa
teri
ng
Ro
ad
sw
ee
pin
g
Ro
ad
Gra
din
g
Pe
rma
ne
nt
se
ali
ng
sit
e r
oad
s
Du
st
Sh
ak
er
Gri
da
Ma
inta
in a
ll s
ea
led
ro
ad
s
Min
imis
e h
au
l d
ista
nc
es
Ch
em
ical
du
st
su
pp
res
sa
nt
on
un
se
ale
d r
oa
ds
We
ll d
efi
ne
d h
au
l ro
ute
s
Sp
ee
d l
imit
s o
n h
au
l ro
ad
s
Wa
teri
ng
du
rin
g p
ea
k a
cti
vit
y
pe
rio
ds
(s
hif
t ch
an
ge
s)
Ve
ge
tati
ng
ob
so
lete
ha
ul
roa
ds
Fe
we
r la
rge
r tr
uck
s
Ashton Coal Mine
Bengalla
Bloomfield Colliery
Camberwell (Integra Coal Open-cut)
Cullen Valley Mine
Cumnock No.1 Colliery
Donaldson Coal Mine
Drayton Coal Mine
Glendell Mine, Mt Owen Mine, Ravensworth East
Hunter Valley Operations
Ivanhoe No.2 Colliery
Liddell Coal Operations
Mangoola (Anvil Hill) (UNDER CONSTRUCTION)
Moolarben Coal Mine
Mount Arthur Coal Mine
Mount Thorley Warkworth Operations
Muswellbrook Colliery Holding
Pine Dale Mine
Ravensworth Narama
Rix's Creek Colliery Holding
Saxonvale Colliery Holding
The Invincible Mine
Wambo Coal NA
Westside Mine
Wilpinjong Coal Pty Ltd NA
Proportion of total (%) 10 96 4 52 28 4 8 28 12 40 64 16 24 4
Note a Dust shaker grid or rumble strips are used to remove loose material from a vehicle by vibration as the vehicle
travels across the grid or strip.
The individual source metrics for haul roads, which are presented in Table 102 assume best practice control factors of 84% (i.e. the use of suppressant) and 50% (i.e. soil is naturally or
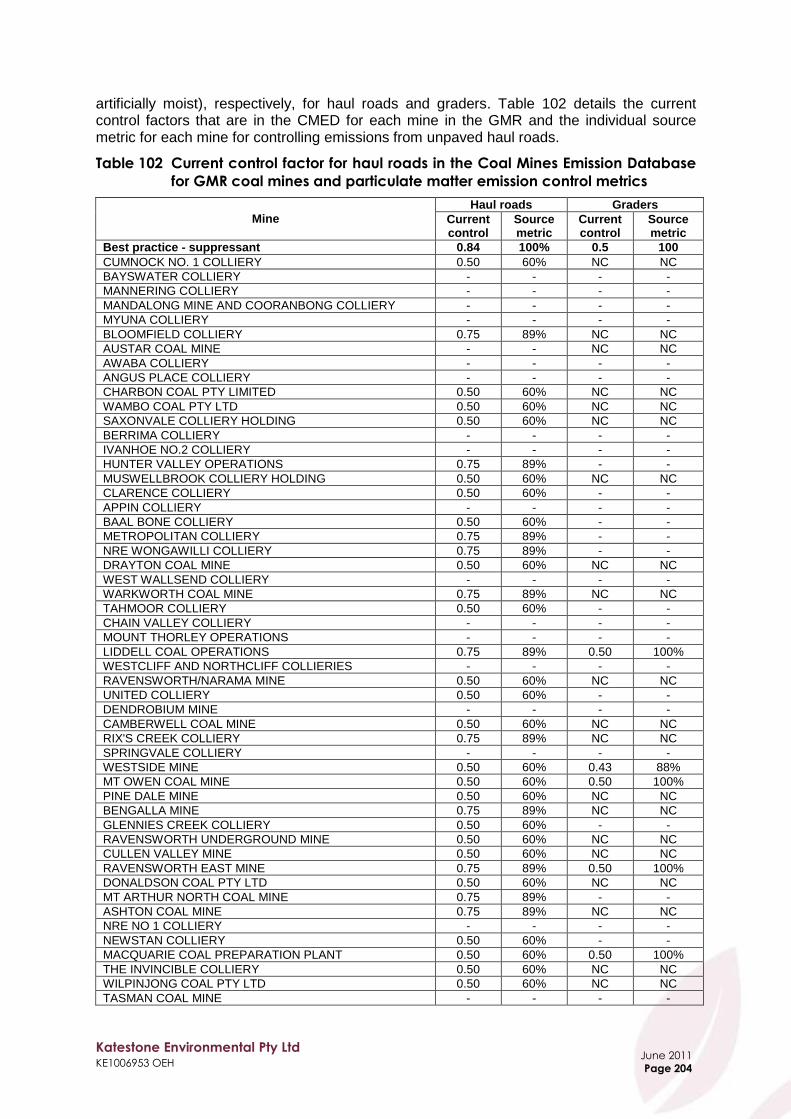
Katestone Environmental Pty Ltd KE1006953 OEH
June 2011
Page 204
artificially moist), respectively, for haul roads and graders. Table 102 details the current control factors that are in the CMED for each mine in the GMR and the individual source metric for each mine for controlling emissions from unpaved haul roads.
Table 102 Current control factor for haul roads in the Coal Mines Emission Database
for GMR coal mines and particulate matter emission control metrics
Mine
Haul roads Graders
Current control
Source metric
Current control
Source metric
Best practice - suppressant 0.84 100% 0.5 100
CUMNOCK NO. 1 COLLIERY 0.50 60% NC NC
BAYSWATER COLLIERY - - - -
MANNERING COLLIERY - - - -
MANDALONG MINE AND COORANBONG COLLIERY - - - -
MYUNA COLLIERY - - - -
BLOOMFIELD COLLIERY 0.75 89% NC NC
AUSTAR COAL MINE - - NC NC
AWABA COLLIERY - - - -
ANGUS PLACE COLLIERY - - - -
CHARBON COAL PTY LIMITED 0.50 60% NC NC
WAMBO COAL PTY LTD 0.50 60% NC NC
SAXONVALE COLLIERY HOLDING 0.50 60% NC NC
BERRIMA COLLIERY - - - -
IVANHOE NO.2 COLLIERY - - - -
HUNTER VALLEY OPERATIONS 0.75 89% - -
MUSWELLBROOK COLLIERY HOLDING 0.50 60% NC NC
CLARENCE COLLIERY 0.50 60% - -
APPIN COLLIERY - - - -
BAAL BONE COLLIERY 0.50 60% - -
METROPOLITAN COLLIERY 0.75 89% - -
NRE WONGAWILLI COLLIERY 0.75 89% - -
DRAYTON COAL MINE 0.50 60% NC NC
WEST WALLSEND COLLIERY - - - -
WARKWORTH COAL MINE 0.75 89% NC NC
TAHMOOR COLLIERY 0.50 60% - -
CHAIN VALLEY COLLIERY - - - -
MOUNT THORLEY OPERATIONS - - - -
LIDDELL COAL OPERATIONS 0.75 89% 0.50 100%
WESTCLIFF AND NORTHCLIFF COLLIERIES - - - -
RAVENSWORTH/NARAMA MINE 0.50 60% NC NC
UNITED COLLIERY 0.50 60% - -
DENDROBIUM MINE - - - -
CAMBERWELL COAL MINE 0.50 60% NC NC
RIX'S CREEK COLLIERY 0.75 89% NC NC
SPRINGVALE COLLIERY - - - -
WESTSIDE MINE 0.50 60% 0.43 88%
MT OWEN COAL MINE 0.50 60% 0.50 100%
PINE DALE MINE 0.50 60% NC NC
BENGALLA MINE 0.75 89% NC NC
GLENNIES CREEK COLLIERY 0.50 60% - -
RAVENSWORTH UNDERGROUND MINE 0.50 60% NC NC
CULLEN VALLEY MINE 0.50 60% NC NC
RAVENSWORTH EAST MINE 0.75 89% 0.50 100%
DONALDSON COAL PTY LTD 0.50 60% NC NC
MT ARTHUR NORTH COAL MINE 0.75 89% - -
ASHTON COAL MINE 0.75 89% NC NC
NRE NO 1 COLLIERY - - - -
NEWSTAN COLLIERY 0.50 60% - -
MACQUARIE COAL PREPARATION PLANT 0.50 60% 0.50 100%
THE INVINCIBLE COLLIERY 0.50 60% NC NC
WILPINJONG COAL PTY LTD 0.50 60% NC NC
TASMAN COAL MINE - - - -
Katestone Environmental Pty Ltd KE1006953 OEH
June 2011
Page 205
Mine
Haul roads Graders
Current control
Source metric
Current control
Source metric
GLENDELL MINE 0.75 89% NC NC
ABEL UNDERGROUND MINE - - - -
XSTRATA MANGOOLLA (ANVIL HILL MINE) - - - -
RICHMOND MAIN EAST - - - -
Note NC means no controls “–” means no emissions from this source
The combined particulate matter emission control metric for wheel generated emissions from haul roads at coal mines in the GMR is 77.9 out of 100. This indicates that most of the mines that have a significant contribution to particulate matter emissions from haul roads have stated that they are applying Level 2 watering. The combined particulate matter emission control metric for graders at coal mines in the GMR is 31.1 out of 100.
10.4.2 Wind erosion
Of all sources of particulate matter from coal mining activities in the GMR, wind erosion of overburden, was ranked number 2 in terms of emissions of TSP and PM10 and number 1 in terms of emissions of PM2.5. Wind erosion of exposed areas and coal stockpiles also ranked highly. Wind erosion has been estimated to contribute 22.5% of TSP, 32.5% of PM10 and 37.8% of PM2.5 emissions from coal mines in the GMR. The methods used to minimise emissions of particulate matter associated with wind erosion of cleared areas and overburden and coal stockpiles are summarised in Table 103 for underground mines and Table 104 for open-cut mines and combined open-cut and underground mines. Current measures for minimising emissions of particulate matter from wind erosion are:
Watering exposed areas
Topsoil stripping when moisture is elevated but not sodden
Minimising the area of disturbance
Progressive rehabilitation
Suppressant on stockpiles and exposed areas
Long term stockpiles revegetated
Stockpile moisture content measured and controlled
Wind barriers The data indicates that the majority (78%) of underground mines use watering to control emissions of particulate from cleared areas. At open-cut mines and combined underground and open-cut mines, watering (92%) and limiting areas of disturbance (84%) are the major techniques that are used to minimise emissions associated with wind erosion. Sixty five percent of mines use water applied by fixed sprays (Figure 57181) or by water cart to manage particulate matter emissions generated by wind erosion. One mine was identified as using suppressants to manage emissions from ROM stockpiles.
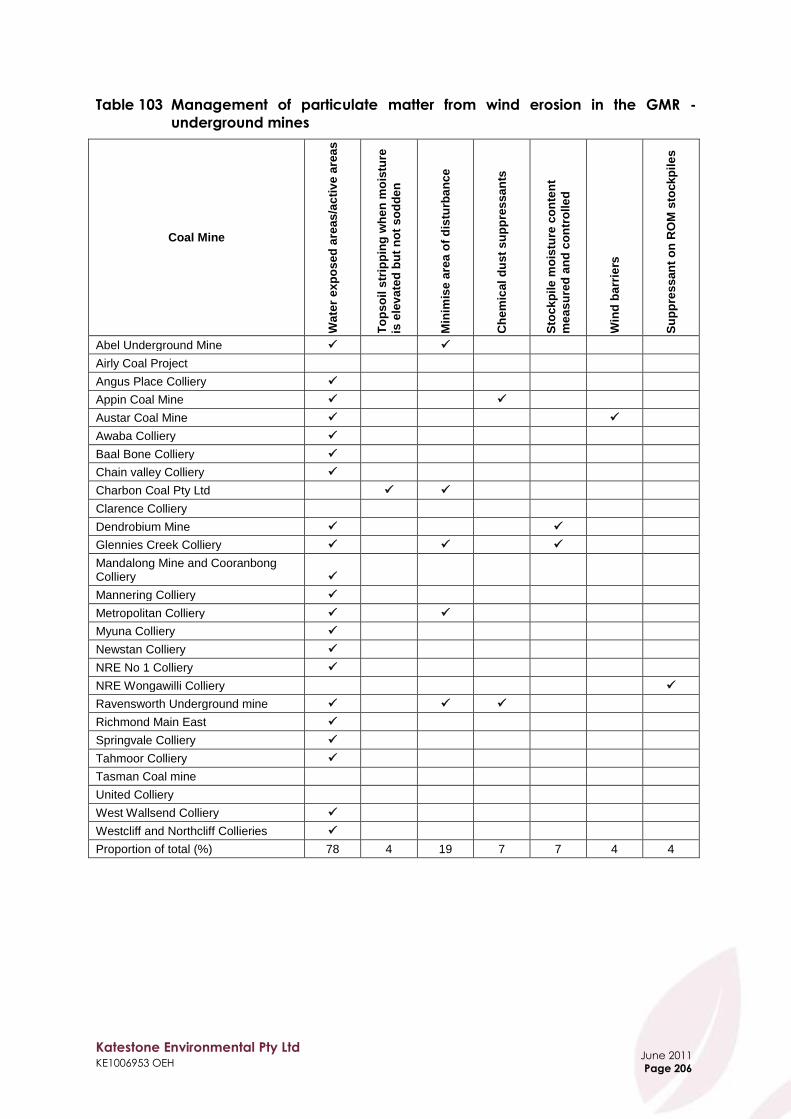
Katestone Environmental Pty Ltd KE1006953 OEH
June 2011
Page 206
Table 103 Management of particulate matter from wind erosion in the GMR -
underground mines
Coal Mine
Wa
ter
exp
os
ed
are
as
/ac
tiv
e a
rea
s
To
ps
oil s
trip
pin
g w
he
n m
ois
ture
is e
lev
ate
d b
ut
no
t s
od
de
n
Min
imis
e a
rea
of
dis
turb
an
ce
Ch
em
ical
du
st
su
pp
res
sa
nts
Sto
ck
pile
mo
istu
re c
on
ten
t
me
as
ure
d a
nd
co
ntr
olle
d
Win
d b
arr
iers
Su
pp
res
san
t o
n R
OM
sto
ckp
ile
s
Abel Underground Mine
Airly Coal Project
Angus Place Colliery
Appin Coal Mine
Austar Coal Mine
Awaba Colliery
Baal Bone Colliery
Chain valley Colliery
Charbon Coal Pty Ltd
Clarence Colliery
Dendrobium Mine
Glennies Creek Colliery
Mandalong Mine and Cooranbong Colliery
Mannering Colliery
Metropolitan Colliery
Myuna Colliery
Newstan Colliery
NRE No 1 Colliery
NRE Wongawilli Colliery
Ravensworth Underground mine
Richmond Main East
Springvale Colliery
Tahmoor Colliery
Tasman Coal mine
United Colliery
West Wallsend Colliery
Westcliff and Northcliff Collieries
Proportion of total (%) 78 4 19 7 7 4 4
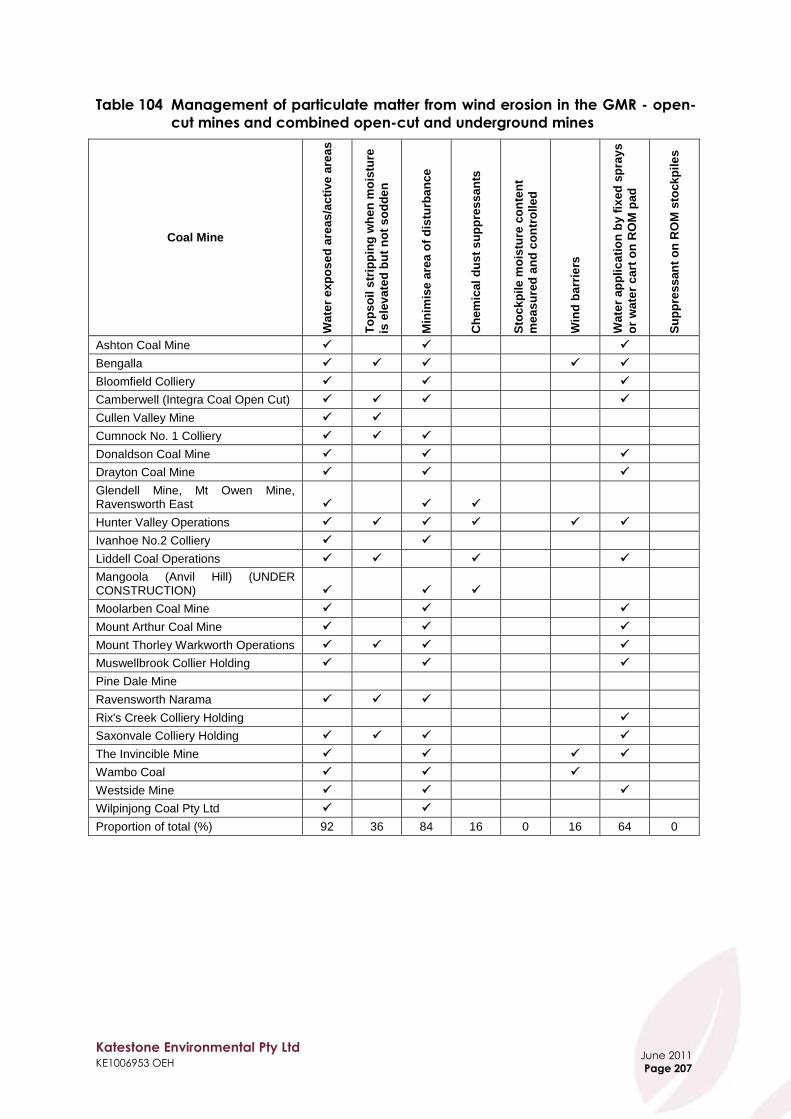
Katestone Environmental Pty Ltd KE1006953 OEH
June 2011
Page 207
Table 104 Management of particulate matter from wind erosion in the GMR - open-
cut mines and combined open-cut and underground mines
Coal Mine
Wa
ter
exp
os
ed
are
as
/ac
tiv
e a
rea
s
To
ps
oil s
trip
pin
g w
he
n m
ois
ture
is e
lev
ate
d b
ut
no
t s
od
de
n
Min
imis
e a
rea
of
dis
turb
an
ce
Ch
em
ical
du
st
su
pp
res
sa
nts
Sto
ck
pile
mo
istu
re c
on
ten
t
me
as
ure
d a
nd
co
ntr
olle
d
Win
d b
arr
iers
Wa
ter
ap
pli
ca
tio
n b
y f
ixed
sp
ray
s
or
wa
ter
ca
rt o
n R
OM
pa
d
Su
pp
res
san
t o
n R
OM
sto
ckp
ile
s
Ashton Coal Mine
Bengalla
Bloomfield Colliery
Camberwell (Integra Coal Open Cut)
Cullen Valley Mine
Cumnock No. 1 Colliery
Donaldson Coal Mine
Drayton Coal Mine
Glendell Mine, Mt Owen Mine, Ravensworth East
Hunter Valley Operations
Ivanhoe No.2 Colliery
Liddell Coal Operations
Mangoola (Anvil Hill) (UNDER CONSTRUCTION)
Moolarben Coal Mine
Mount Arthur Coal Mine
Mount Thorley Warkworth Operations
Muswellbrook Collier Holding
Pine Dale Mine
Ravensworth Narama
Rix's Creek Colliery Holding
Saxonvale Colliery Holding
The Invincible Mine
Wambo Coal
Westside Mine
Wilpinjong Coal Pty Ltd
Proportion of total (%) 92 36 84 16 0 16 64 0

Katestone Environmental Pty Ltd KE1006953 OEH
June 2011
Page 208
Figure 57 Stockpile sprays
Progressive rehabilitation was found to be a best practice measure for minimising emissions of particulate matter associated with wind erosion. Table 105 and Table 106 provide information on aspects of rehabilitation noted in the available information. The development of site and industry wide benchmarks and key performance indicators and the annual reporting against the key performance indicators would bolster the use of rehabilitation as a best practice measure to control particulate emissions. It was noted in the review of mine information that some mines already use the extent of rehabilitation achieved in a year as a key performance indicator. Use of hydraulic mulch and aerial seeding has been found to be effective in establishing a vegetative cover in a relatively short period of time (six weeks) under favourable weather conditions. Hydraulic mulch also provides an immediate sealing of the surface material that will minimise the emissions of particulate matter until the vegetative cover takes hold. The study found information to suggest that one of the underground mines and six open-cut mines have used hydraulic mulch. Other mines indicated an interest in using hydraulic mulch in the future. Discussions with site personnel suggest that at least five mines have successfully used aerial seeding to assist in rehabilitation.

Katestone Environmental Pty Ltd KE1006953 OEH
June 2011
Page 209
Table 105 Management of particulate matter using rehabilitation in the GMR -
underground mines
Coal Mine
Pro
gre
ss
ive
re
ha
bil
ita
tio
n
Se
ed
ing
to
ps
oil
Us
e o
f am
eli
ora
nts
to
im
pro
ve
so
il
Hy
dra
uli
c m
ulc
h s
eed
ing
Us
e o
f O
rga
nic
Gro
wth
Me
diu
m
(OG
M)
Re
ha
bil
ita
tio
n S
tra
teg
y
Abel Underground Mine
Airly Coal Project
Angus Place Colliery
Appin Coal Mine
Austar Coal Mine
Awaba Colliery
Baal Bone Colliery
Chain valley Colliery
Charbon Coal Pty Ltd
Clarence Colliery
Dendrobium Mine
Glennies Creek Colliery
Mandalong Mine and Cooranbong Colliery
Mannering Colliery
Metropolitan Colliery
Myuna Colliery
Newstan Colliery
NRE No 1 Colliery
NRE Wongawilli Colliery
Ravensworth Underground mine
Richmond Main East
Springvale Colliery
Tahmoor Colliery
Tasman Coal mine
United Colliery
West Wallsend Colliery
Westcliff and Northcliff Collieries
Proportion of total (%) 19 4 0 4 0 7

Katestone Environmental Pty Ltd KE1006953 OEH
June 2011
Page 210
Table 106 Management of particulate matter using rehabilitation in the GMR - open-
cut mines and combined open-cut and underground mines
Coal Mine
Pro
gre
ss
ive
re
ha
bil
ita
tio
n
Se
ed
ing
to
ps
oil
Us
e o
f am
eli
ora
nts
to
im
pro
ve
so
il
Hy
dra
uli
c m
ulc
h s
eed
ing
Us
e o
f O
rga
nic
Gro
wth
Me
diu
m
(OG
M)
Re
ha
bil
ita
tio
n S
tra
teg
y
Ashton Coal Mine
Bengalla
Bloomfield Colliery
Camberwell (Integra Coal Open Cut)
Cullen Valley Mine
Cumnock No1 Colliery
Donaldson Coal Mine
Drayton Coal Mine
Glendell Mine, Mt Owen Mine, Ravensworth East
Hunter Valley Operations
Ivanhoe No.2 Colliery
Liddell Coal Operations
Mangoola (Anvil Hill) (UNDER CONSTRUCTION)
Moolarben Coal Mine
Mount Arthur Coal Mine
Mount Thorley Warkworth Operations
Muswellbrook Colliery Holding
Pine Dale Mine
Ravensworth Narama
Rix's Creek Colliery Holding
Saxonvale Colliery Holding
The Invincible Mine
Wambo Coal
Westside Mine
Wilpinjong Coal Pty Ltd
Proportion of total (%) 84 48 36 24 16 24
The individual source metrics for coal stockpiles, overburden stockpiles and other exposed areas, which are presented in Table 107 assume best practice control factors of 75% (i.e. wind screens, wind fences or erect three-sided enclosure around storage piles), 80% (i.e. fencing, bunding, shelterbelts or in-pit dump) and 99% (i.e. rehabilitation or revegetation), respectively. Table 107 details the current control factors that are in the CMED for each mine in the GMR and the individual source metric for each mine for controlling emissions from exposed areas, overburden and coal stockpiles.

Katestone Environmental Pty Ltd KE1006953 OEH
June 2011
Page 211
Table 107 Current control factor for wind erosion of exposed areas, coal stockpiles
and overburden in the Coal Mines Emission Database for GMR coal mines
and particulate matter emission control metrics
Mine
Exposed areas Coal stockpiles Overburden
Current control
Source metric
Current control
Source metric
Current control
Source metric
Best practice - various 0.99 100 0.75 100 0.8 100
CUMNOCK NO. 1 COLLIERY - - 0.50 67% 0.02 2%
BAYSWATER COLLIERY - - 0.50 67% 0.23 23%
MANNERING COLLIERY - - NC NC - -
MANDALONG MINE AND COORANBONG COLLIERY
- - NC NC - -
MYUNA COLLIERY - - 0.95 100% - -
BLOOMFIELD COLLIERY - - 0.50 67% 0.80 100%
AUSTAR COAL MINE - - 0.50 67% 0.50 91%
AWABA COLLIERY - - NC NC - -
ANGUS PLACE COLLIERY - - NC NC - -
CHARBON COAL PTY LIMITED NC NC 0.50 67% - -
WAMBO COAL PTY LTD 0.90 91% 0.50 67% - -
SAXONVALE COLLIERY HOLDING - - 0.50 67% NC NC
BERRIMA COLLIERY - - 0.50 67% - -
IVANHOE NO.2 COLLIERY - - - - NC NC
HUNTER VALLEY OPERATIONS - - 0.00 0% NC NC
MUSWELLBROOK COLLIERY HOLDING - - NC NC 0.39 70%
CLARENCE COLLIERY NC NC 0.50 67% - -
APPIN COLLIERY - - 0.50 67% - -
BAAL BONE COLLIERY 0.50 51% NC NC 0.50 91%
METROPOLITAN COLLIERY - - 0.50 67% - -
NRE WONGAWILLI COLLIERY - - 0.50 67% - -
DRAYTON COAL MINE - - 0.50 67% 0.80 100%
WEST WALLSEND COLLIERY - - 0.50 67% - -
WARKWORTH COAL MINE - - 0.50 67% 0.99 100%
TAHMOOR COLLIERY - - 0.41 55% 0.50 91%
CHAIN VALLEY COLLIERY - - 0.50 67% - -
MOUNT THORLEY OPERATIONS NC NC 0.50 67% NC NC
LIDDELL COAL OPERATIONS - - 0.28 37% NC NC
WESTCLIFF AND NORTHCLIFF COLLIERIES
- - 0.50 67% - -
RAVENSWORTH/NARAMA MINE - - NC NC 0.46 100%
UNITED COLLIERY - - 0.50 67% - -
DENDROBIUM MINE - - 0.50 67% - -
CAMBERWELL COAL MINE 0.40 61% 0.59 78% 0.99 100%
RIX'S CREEK COLLIERY - - 0.50 67% 0.80 100%
SPRINGVALE COLLIERY - - 0.50 67% NC NC
WESTSIDE MINE - - NC NC NC NC
MT OWEN COAL MINE - - NC NC NC NC
PINE DALE MINE - - 0.50 67% - -
BENGALLA MINE 0.50 51% 0.50 67% - -
GLENNIES CREEK COLLIERY 0.99 71% 0.50 67% - -
RAVENSWORTH UNDERGROUND MINE - - NC NC 0.75 100%
CULLEN VALLEY MINE - - 0.50 67% 0.07 12%
RAVENSWORTH EAST MINE - - NC NC 0.50 91%
DONALDSON COAL PTY LTD 0.60 74% 0.25 33% - -
MT ARTHUR NORTH COAL MINE - - 0.50 67% 0.24 24%
ASHTON COAL MINE NC NC 0.50 67% 0.99 100%
NRE NO 1 COLLIERY - - 0.50 67% - -
NEWSTAN COLLIERY - - 0.50 67% - -
MACQUARIE COAL PREPARATION PLANT
- - 0.50 67% - -
THE INVINCIBLE COLLIERY - - 0.50 67% 0.07 12%
WILPINJONG COAL PTY LTD - - 0.27 36% 0.99 100%
TASMAN COAL MINE NC NC 0.50 67% - -

Katestone Environmental Pty Ltd KE1006953 OEH
June 2011
Page 212
Mine Exposed areas Coal stockpiles Overburden
GLENDELL MINE - - - - 0.50 91%
ABEL UNDERGROUND MINE NC NC 0.50 67% - -
XSTRATA MANGOOLLA (ANVIL HILL MINE)
- - - - 0.50 91%
RICHMOND MAIN EAST - - - - 0.50 91%
Note NC means no controls “ – “ means no emissions from this source
Table 108 shows the combined particulate matter emission control metrics for wind erosion sources at coal mines in the GMR. The table shows that a moderate level of control is applied to wind erosion sources.
Table 108 Combined particulate matter emission control metric for GMR wind
erosion sources
Wind erosion source Combined metric for GMR mines
Exposed areas 63
Coal stockpiles 51
Overburden 54
10.4.3 Bulldozing
Of all sources of particulate matter from coal mining activities in the GMR, bulldozing was ranked number 3 in terms of emissions of TSP and PM10 and number 4 in terms of emissions of PM2.5. Bulldozing has been estimated to contribute 9.1% of TSP, 8.3% of PM10 and 8.6% of PM2.5 emissions from coal mines in the GMR. The review of current practices identified no specific measures are implemented to control emissions of particulate matter associated with bulldozing at coal mines in the GMR. The individual source metrics for bulldozing coal and overburden, which are presented in Table 109, assume a best practice control factor of 50% (i.e. use of water to keep travel routes and materials moist). Table 109 details the current control factors that are shown in the CMED for each mine in the GMR and the individual source metric for each mine for controlling emissions from bulldozers.
Table 109 Current control factor for bulldozing coal and overburden in the Coal
Mines Emission Database for GMR coal mines and particulate matter
emission control metrics
Mine
Bulldozing coal Bulldozing overburden
Current control
Source metric
Current control
Source metric
Best practice 0.5 100 0.5 100
CUMNOCK NO. 1 COLLIERY NC NC NC NC
BAYSWATER COLLIERY NC NC NC NC
MANNERING COLLIERY - - - -
MANDALONG MINE AND COORANBONG COLLIERY NC NC - -
MYUNA COLLIERY - - - -
BLOOMFIELD COLLIERY NC NC NC NC
AUSTAR COAL MINE NC NC - -
AWABA COLLIERY - - - -
ANGUS PLACE COLLIERY NC NC - -
CHARBON COAL PTY LIMITED NC NC NC NC
WAMBO COAL PTY LTD NC NC NC NC
SAXONVALE COLLIERY HOLDING NC NC NC NC
BERRIMA COLLIERY - - - -

Katestone Environmental Pty Ltd KE1006953 OEH
June 2011
Page 213
Mine Bulldozing coal Bulldozing overburden
IVANHOE NO.2 COLLIERY - - - -
HUNTER VALLEY OPERATIONS NC NC NC NC
MUSWELLBROOK COLLIERY HOLDING NC NC NC NC
CLARENCE COLLIERY NC NC - -
APPIN COLLIERY - - - -
BAAL BONE COLLIERY NC NC - -
METROPOLITAN COLLIERY - - - -
NRE WONGAWILLI COLLIERY NC NC - -
DRAYTON COAL MINE NC NC NC NC
WEST WALLSEND COLLIERY - - - -
WARKWORTH COAL MINE NC NC NC NC
TAHMOOR COLLIERY NC NC - -
CHAIN VALLEY COLLIERY - - - -
MOUNT THORLEY OPERATIONS - - - -
LIDDELL COAL OPERATIONS NC NC NC NC
WESTCLIFF AND NORTHCLIFF COLLIERIES NC NC - -
RAVENSWORTH/NARAMA MINE NC NC NC NC
UNITED COLLIERY NC NC - -
DENDROBIUM MINE NC NC - -
CAMBERWELL COAL MINE NC NC NC NC
RIX'S CREEK COLLIERY NC NC NC NC
SPRINGVALE COLLIERY NC NC NC NC
WESTSIDE MINE NC NC NC NC
MT OWEN COAL MINE NC NC NC NC
PINE DALE MINE NC NC NC NC
BENGALLA MINE NC NC - -
GLENNIES CREEK COLLIERY NC NC - -
RAVENSWORTH UNDERGROUND MINE - - - -
CULLEN VALLEY MINE NC NC NC NC
RAVENSWORTH EAST MINE NC NC NC NC
DONALDSON COAL PTY LTD NC NC NC NC
MT ARTHUR NORTH COAL MINE NC NC NC NC
ASHTON COAL MINE NC NC NC NC
NRE NO 1 COLLIERY NC NC - -
NEWSTAN COLLIERY NC NC - -
MACQUARIE COAL PREPARATION PLANT NC NC - -
THE INVINCIBLE COLLIERY NC NC NC NC
WILPINJONG COAL PTY LTD NC NC NC NC
TASMAN COAL MINE - - - -
GLENDELL MINE NC NC NC NC
ABEL UNDERGROUND MINE - - - -
XSTRATA MANGOOLLA (ANVIL HILL MINE) - - - -
RICHMOND MAIN EAST - - NC NC
Note NC means no controls “ – “ means no emissions from this source
Table 109 shows that the metric representing the current level of control of particulate matter emissions from bulldozing is 0 out of 100.
10.4.4 Blasting and drilling
Of all sources of particulate matter in coal mining activities in the GMR, blasting was ranked number 5 in terms of emissions of TSP, number 4 in terms of emissions of PM10 and number 3 in terms of emissions of PM2.5. Blasting has been estimated to contribute 3.5% of TSP, 5.6% of PM10 and 20.6% of PM2.5 emissions from coal mines in the GMR. Drilling was ranked number 15 in terms of emissions of TSP and PM10 and number 17 in terms of emissions of PM2.5. Drilling has been estimated to contribute 0.2% of TSP, 0.3% of PM10 and 0.1% of PM2.5 emissions from coal mines in the GMR.
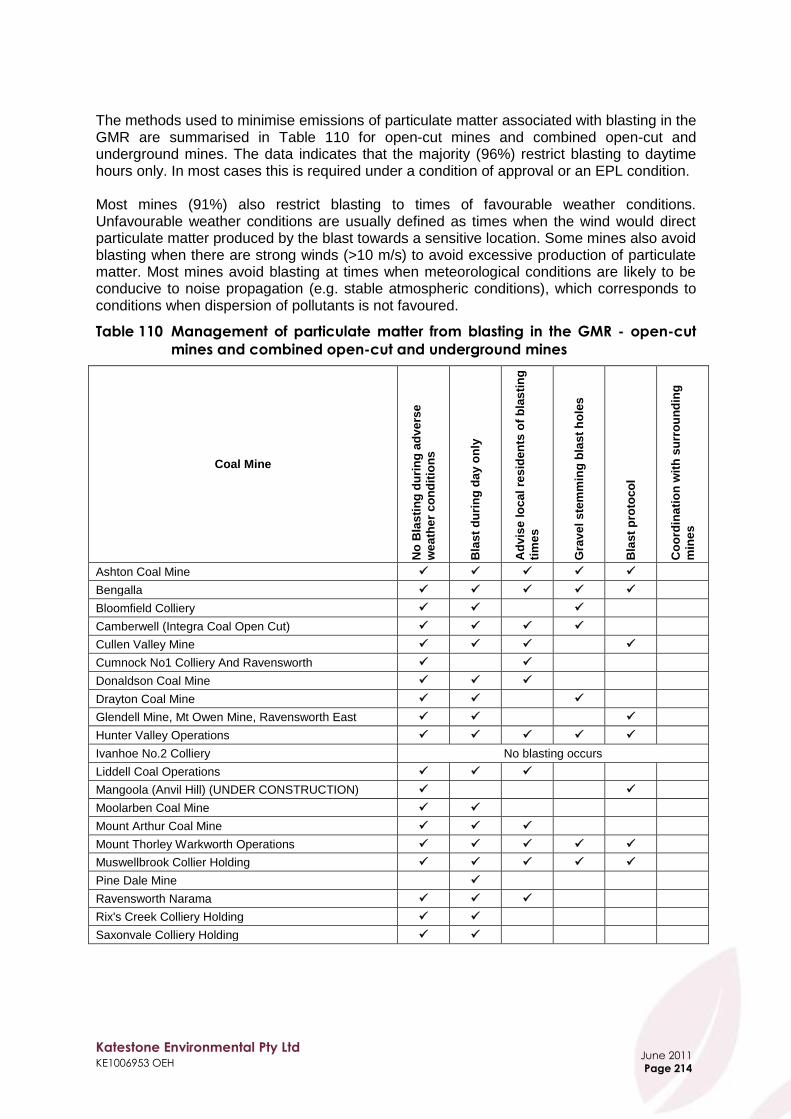
Katestone Environmental Pty Ltd KE1006953 OEH
June 2011
Page 214
The methods used to minimise emissions of particulate matter associated with blasting in the GMR are summarised in Table 110 for open-cut mines and combined open-cut and underground mines. The data indicates that the majority (96%) restrict blasting to daytime hours only. In most cases this is required under a condition of approval or an EPL condition. Most mines (91%) also restrict blasting to times of favourable weather conditions. Unfavourable weather conditions are usually defined as times when the wind would direct particulate matter produced by the blast towards a sensitive location. Some mines also avoid blasting when there are strong winds (>10 m/s) to avoid excessive production of particulate matter. Most mines avoid blasting at times when meteorological conditions are likely to be conducive to noise propagation (e.g. stable atmospheric conditions), which corresponds to conditions when dispersion of pollutants is not favoured.
Table 110 Management of particulate matter from blasting in the GMR - open-cut
mines and combined open-cut and underground mines
Coal Mine
No
Bla
sti
ng
du
rin
g a
dv
ers
e
we
ath
er
co
nd
itio
ns
Bla
st
du
rin
g d
ay o
nly
Ad
vis
e lo
ca
l re
sid
en
ts o
f b
las
tin
g
tim
es
Gra
ve
l s
tem
min
g b
las
t h
ole
s
Bla
st
pro
toco
l
Co
ord
ina
tio
n w
ith
su
rro
un
din
g
min
es
Ashton Coal Mine
Bengalla
Bloomfield Colliery
Camberwell (Integra Coal Open Cut)
Cullen Valley Mine
Cumnock No1 Colliery And Ravensworth
Donaldson Coal Mine
Drayton Coal Mine
Glendell Mine, Mt Owen Mine, Ravensworth East
Hunter Valley Operations
Ivanhoe No.2 Colliery No blasting occurs
Liddell Coal Operations
Mangoola (Anvil Hill) (UNDER CONSTRUCTION)
Moolarben Coal Mine
Mount Arthur Coal Mine
Mount Thorley Warkworth Operations
Muswellbrook Collier Holding
Pine Dale Mine
Ravensworth Narama
Rix's Creek Colliery Holding
Saxonvale Colliery Holding

Katestone Environmental Pty Ltd KE1006953 OEH
June 2011
Page 215
Coal Mine
No
Bla
sti
ng
du
rin
g a
dv
ers
e
we
ath
er
co
nd
itio
ns
Bla
st
du
rin
g d
ay o
nly
Ad
vis
e lo
ca
l re
sid
en
ts o
f b
las
tin
g
tim
es
Gra
ve
l s
tem
min
g b
las
t h
ole
s
Bla
st
pro
toco
l
Co
ord
ina
tio
n w
ith
su
rro
un
din
g
min
es
The Invincible Mine
Wambo Coal
Westside Mine
Wilpinjong Coal Pty Ltd
Proportion of total (%) 91 96 57 43 35 4
The methods used to minimise emissions of particulate matter from drilling in the GMR are summarised in Table 111 for open-cut mines and combined open-cut and underground mines. The data indicates that 58% control emissions using water sprays and 63% have curtains. A total of 75% use either dust curtains or water sprays to manage emissions of particulate matter. Notwithstanding this, visible emissions of particulate matter from drilling equipment were noted at a number of the mines visited during this study. This indicated that emissions may not always be well-controlled despite the availability of effective mitigation techniques.
Table 111 Management of particulate matter from drilling in the GMR - open-cut
mines and combined open-cut and underground mines
Coal Mine
Dri
ll r
igs
hav
e d
us
t c
urt
ain
s
Wa
ter
sp
ray
s o
n t
he
dri
ll
Fa
bri
c f
ilte
rs o
n t
he
dri
ll
No
dri
llin
g in
ad
ve
rse
wea
the
r
Dri
ll a
rea
mo
iste
ne
d
Ashton Coal Mine
Bengalla
Bloomfield Colliery
Camberwell (Integra Coal Open Cut)
Cullen Valley Mine
Cumnock No1 Colliery
Donaldson Coal Mine
Drayton Coal Mine
Glendell Mine, Mt Owen Mine, Ravensworth East
Hunter Valley Operations
Liddell Coal Operations
Mangoola (Anvil Hill) (UNDER CONSTRUCTION)

Katestone Environmental Pty Ltd KE1006953 OEH
June 2011
Page 216
Coal Mine
Dri
ll r
igs
hav
e d
us
t c
urt
ain
s
Wa
ter
sp
ray
s o
n t
he
dri
ll
Fa
bri
c f
ilte
rs o
n t
he
dri
ll
No
dri
llin
g in
ad
ve
rse
wea
the
r
Dri
ll a
rea
mo
iste
ne
d
Moolarben Coal Mine
Mount Arthur Coal Mine
Mount Thorley Warkworth Operations
Muswellbrook Collier Holding
Pine Dale Mine
Ravensworth Narama
Rix's Creek Colliery Holding
Saxonvale Colliery Holding
The Invincible Mine
Wambo Coal
Westside Mine
Wilpinjong Coal Pty Ltd
Proportion of total (%) 63 58 4 17 21
The individual source metrics for blasting and drilling, which are presented in Table 112, assume a best practice control factor of 99% (i.e. enclosure with fabric filter). The use of blast design and timing was assumed to be best practice for blasting, but the reduction in emissions associated with this approach to management could not be quantified. Table 112 details the current control factors that are in the CMED for each mine in the GMR and the individual source metric for each mine for controlling emissions from blasting and drilling.
Table 112 Current control factor for blasting and drilling in the Coal Mines Emission
Database for GMR coal mines and particulate matter emission control
metrics
Mine
Blasting Drilling
Current control
Source metric
Current control
Source metric
Best practice NQ 100 0.99 100
CUMNOCK NO. 1 COLLIERY NC NC NC NC
BAYSWATER COLLIERY - - - -
MANNERING COLLIERY - - - -
MANDALONG MINE AND COORANBONG COLLIERY - - - -
MYUNA COLLIERY - - - -
BLOOMFIELD COLLIERY NC NC NC NC
AUSTAR COAL MINE - - - -
AWABA COLLIERY - - - -
ANGUS PLACE COLLIERY - - - -
CHARBON COAL PTY LIMITED - - - -
WAMBO COAL PTY LTD NC NC 0.70 70%
SAXONVALE COLLIERY HOLDING NC NC NC NC
BERRIMA COLLIERY - - - -
IVANHOE NO.2 COLLIERY - - - -
HUNTER VALLEY OPERATIONS NC NC NC NC
MUSWELLBROOK COLLIERY HOLDING NC NC 0.70 70%

Katestone Environmental Pty Ltd KE1006953 OEH
June 2011
Page 217
Mine
Blasting Drilling
Current control
Source metric
Current control
Source metric
CLARENCE COLLIERY - - - -
APPIN COLLIERY - - - -
BAAL BONE COLLIERY - - - -
METROPOLITAN COLLIERY - - - -
NRE WONGAWILLI COLLIERY - - - -
DRAYTON COAL MINE NC NC NC NC
WEST WALLSEND COLLIERY - - - -
WARKWORTH COAL MINE NC NC NC NC
TAHMOOR COLLIERY - - - -
CHAIN VALLEY COLLIERY - - - -
MOUNT THORLEY OPERATIONS - - - -
LIDDELL COAL OPERATIONS NC NC NC NC
WESTCLIFF AND NORTHCLIFF COLLIERIES - - - -
RAVENSWORTH/NARAMA MINE NC NC NC NC
UNITED COLLIERY - - - -
DENDROBIUM MINE - - - -
CAMBERWELL COAL MINE NC NC 0.75 75%
RIX'S CREEK COLLIERY NC NC NC NC
SPRINGVALE COLLIERY - - - -
WESTSIDE MINE NC NC NC NC
MT OWEN COAL MINE NC NC 0.70 70%
PINE DALE MINE NC NC 0.70 70%
BENGALLA MINE NC NC NC NC
GLENNIES CREEK COLLIERY - - - -
RAVENSWORTH UNDERGROUND MINE - - - -
CULLEN VALLEY MINE NC NC NC NC
RAVENSWORTH EAST MINE NC NC 0.70 70%
DONALDSON COAL PTY LTD NC NC 0.85 85%
MT ARTHUR NORTH COAL MINE - - - -
ASHTON COAL MINE NC NC 0.70 70%
NRE NO 1 COLLIERY - - - -
NEWSTAN COLLIERY - - - -
MACQUARIE COAL PREPARATION PLANT - - - -
THE INVINCIBLE COLLIERY NC NC NC NC
WILPINJONG COAL PTY LTD NC NC NC NC
TASMAN COAL MINE - - - -
GLENDELL MINE NC NC NC NC
ABEL UNDERGROUND MINE - - - -
XSTRATA MANGOOLLA (ANVIL HILL MINE) - - - -
RICHMOND MAIN EAST - - - -
Note NQ means best practice emission control factor not quantified NC means no controls “ – “ means no emissions from this source
No best practice control factor could be quantified for blasting and no control factor is specified in the CMED for mines that conduct blasting. However, Table 110 shows that elements of best practice have been adopted at many mines and so this has been recognised in the calculation of the metric for blasting. The combined particulate matter emission control metric for blasting at coal mines in the GMR cannot be estimated. The combined particulate matter emission control metric for drilling at coal mines in the GMR has been estimated to be 70.7 out of 100.

Katestone Environmental Pty Ltd KE1006953 OEH
June 2011
Page 218
10.4.5 Draglines
Of all sources of particulate matter from coal mining activities in the GMR, draglines have been ranked number 8 in terms of emissions of TSP, number 10 in terms of emissions of PM10 and number 9 in terms of emissions of PM2.5. Draglines have been estimated to contribute 1.9% of TSP, 1.6% of PM10 and 1.3% of PM2.5 emissions from coal mines in the GMR. There are seven open-cut coal mines in the GMR that use draglines, these are all located in the Hunter Coalfield, namely:
Bengalla Mine
Drayton Coal Mine
Hunter Valley Operations
Ravensworth/Narama Mine
Rix's Creek Colliery
Saxonvale Colliery Holding
Warkworth Coal Mine The methods used to minimise emissions of particulate matter from these draglines based on information contained in AEMR, EMP and from site visits are summarised in Table 113. Best practice for controlling particulate matter from draglines is the minimisation of drop height, careful placement of overburden on overburden piles and the suspension of operations when weather conditions are causing excessive visible emissions. The available data suggests that at least six of the seven mines (86%) minimise drop heights and suspend operations if weather conditions result in excessive particulate matter emissions. The information contained in the CMED for a subset of these mines indicates that the drop heights are minimised to between 6 and 12 metres. Six metres has been taken to be equivalent to best practice. Observations from the site visits and discussions with mine personnel suggest that whilst the majority of coal mines actively work towards the minimisation of particulate matter from draglines through the use of good operating practices, such as minimising drop heights and careful placement of materials, emissions are still dependent on the skills of the operator. Most mines also indicated that the minimisation of particulate matter emissions was included in training of dragline operators and in standard operating procedures indicating that training and awareness may not be the entire solution to managing emissions.

Katestone Environmental Pty Ltd KE1006953 OEH
June 2011
Page 219
Table 113 Management of particulate matter from draglines in the GMR
Coal Mine Minimise drop
height
Place material on overburden piles in
a manner that minimises emissions
Suspend operations if weather conditions
cause excessive visible emissions
Bengalla
Drayton Coal Mine
Hunter Valley Operations
Ravensworth/Narama Mine
Rix‟s Creek Colliery
Mount Thorley Warkworth Operations
Saxonvale Colliery Holding
Proportion of total (%) 86 14 86
In addition to training, any performance indicators that are used to manage production should take account of the need for minimisation of emissions from dragline operations. Given the earlier comments about the potential for a wind tunnel to form in the open-cut mining void, coal mines should not be overly reliant on pit ventilation to minimise emissions. Furthermore, pit retention of particulate matter is only estimated to reduce uncontrolled emissions of PM10 by 5%. This control efficiency would be expected to be even less for smaller particles such as PM2.5. The individual source metrics for draglines assume a best practice control factor of 57% (i.e. minimise drop height). The combined particulate matter emission control metric for draglines at coal mines in the GMR has been estimated to be 93.4 out of 100.
10.4.6 Loading and dumping overburden
Of all sources of particulate matter from coal mining activities in the GMR, trucks dumping overburden was ranked number 4 in terms of emissions of TSP, number 5 in terms of emissions of PM10 and number 6 in terms of emissions of PM2.5. Trucks dumping overburden has been estimated to contribute 4.2% of PM10 emissions from coal mines in the GMR. Loaders dumping overburden ranked number 11 in terms of emissions of TSP, PM10 and PM2.5. Loaders dumping overburden has been estimated to contribute 1.2% of PM10 emissions from coal mines in the GMR. The following practices are currently adopted:
Water application by fixed sprays or water cart
The minimisation of drop heights
Suspension or modification of high risk activities under adverse weather conditions The measures adopted at GMR mines are shown in Table 114 for open-cut mines and combined underground and open-cut mines. At least 92% of open-cut mines were found to utilise water application by fixed sprays or water cart. Fifty six percent of open-cut mines were found to suspend or modify high risk activities under adverse weather conditions. During the site visits, it was evident that some mines dump material into the pit over the highwall. Such practices were stated to be suspended during adverse weather conditions. However, given the potential for dropping materials from a height to cause elevated emissions, this practice should be eliminated.

Katestone Environmental Pty Ltd KE1006953 OEH
June 2011
Page 220
Table 114 Management of particulate matter from loading and dumping
overburden in the GMR - open-cut mines and combined open-cut and
underground mines
Coal Mine
Wa
ter
sp
ray
s o
r b
oo
m s
pra
y o
n
wa
ter
ca
rt
Au
tom
ati
c w
ate
r s
pra
ys
Min
imis
e d
rop
he
igh
t
Su
sp
en
sio
n o
r m
od
ific
ati
on
of
op
era
tio
ns
du
rin
g a
dve
rse
we
ath
er
No
du
mp
ing
on
hig
h
em
pla
ce
men
ts i
n s
tro
ng
win
ds
Ashton Coal Mine
Bengalla
Bloomfield Colliery
Camberwell (Integra Coal Open Cut)
Cullen Valley Mine
Cumnock No1 Colliery
Donaldson Coal Mine
Drayton Coal Mine
Glendell Mine, Mt Owen Mine, Ravensworth East
Hunter Valley Operations
Ivanhoe No.2 Colliery
Liddell Coal Operations
Mangoola (Anvil Hill) (UNDER CONSTRUCTION)
Moolarben Coal Mine
Mount Arthur Coal Mine
Mount Thorley Warkworth Operations
Muswellbrook Colliery Holding
Pine Dale Mine
Ravensworth Narama
Rix's Creek Colliery Holding
Saxonvale Colliery Holding
The Invincible Mine
Wambo Coal
Westside Mine
Wilpinjong Coal Pty Ltd
Proportion of total (%) 92 32 36 56 12
The individual source metrics for loading and dumping overburden, which are presented in Table 115, assume a best practice control factor of 50% (i.e. water application). The modification of activities in windy conditions was also assumed to be best practice for loading and dumping overburden, but the reduction in emissions associated with this approach to management could not be quantified. Table 115 details the current control factors that are in the CMED for each mine in the GMR and the individual source metric for each mine for controlling emissions from loading and dumping overburden.
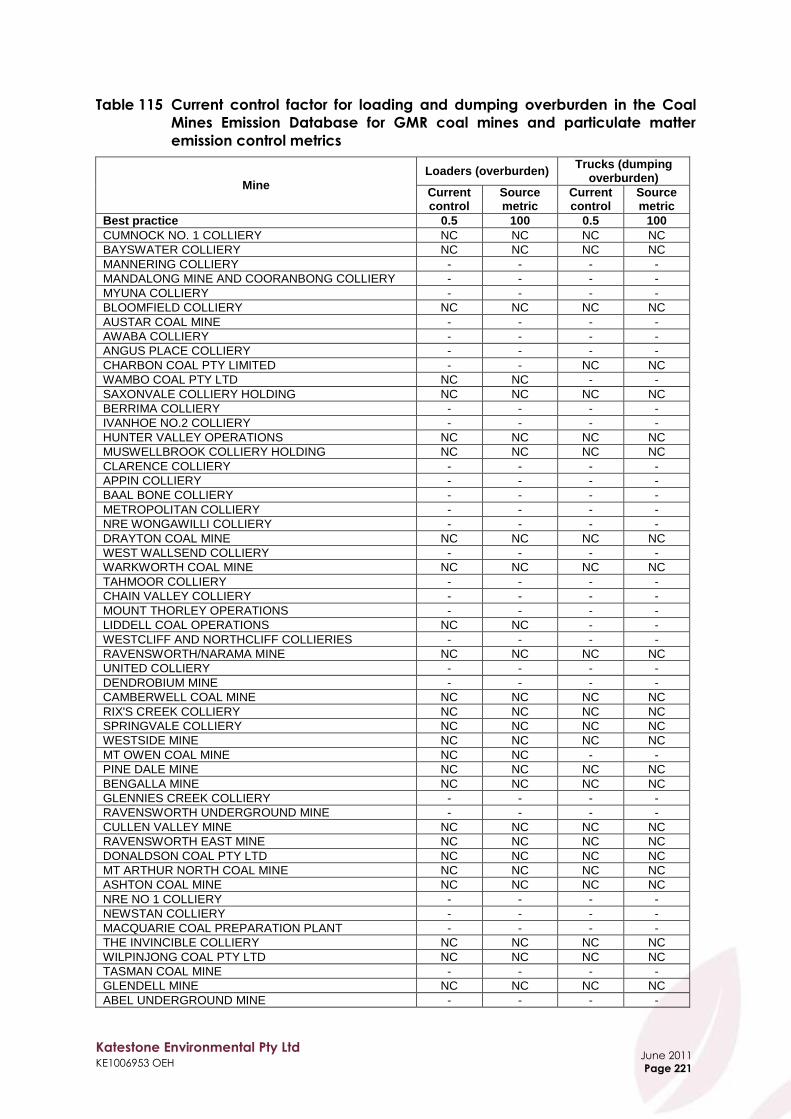
Katestone Environmental Pty Ltd KE1006953 OEH
June 2011
Page 221
Table 115 Current control factor for loading and dumping overburden in the Coal
Mines Emission Database for GMR coal mines and particulate matter
emission control metrics
Mine
Loaders (overburden) Trucks (dumping
overburden)
Current control
Source metric
Current control
Source metric
Best practice 0.5 100 0.5 100
CUMNOCK NO. 1 COLLIERY NC NC NC NC
BAYSWATER COLLIERY NC NC NC NC
MANNERING COLLIERY - - - -
MANDALONG MINE AND COORANBONG COLLIERY - - - -
MYUNA COLLIERY - - - -
BLOOMFIELD COLLIERY NC NC NC NC
AUSTAR COAL MINE - - - -
AWABA COLLIERY - - - -
ANGUS PLACE COLLIERY - - - -
CHARBON COAL PTY LIMITED - - NC NC
WAMBO COAL PTY LTD NC NC - -
SAXONVALE COLLIERY HOLDING NC NC NC NC
BERRIMA COLLIERY - - - -
IVANHOE NO.2 COLLIERY - - - -
HUNTER VALLEY OPERATIONS NC NC NC NC
MUSWELLBROOK COLLIERY HOLDING NC NC NC NC
CLARENCE COLLIERY - - - -
APPIN COLLIERY - - - -
BAAL BONE COLLIERY - - - -
METROPOLITAN COLLIERY - - - -
NRE WONGAWILLI COLLIERY - - - -
DRAYTON COAL MINE NC NC NC NC
WEST WALLSEND COLLIERY - - - -
WARKWORTH COAL MINE NC NC NC NC
TAHMOOR COLLIERY - - - -
CHAIN VALLEY COLLIERY - - - -
MOUNT THORLEY OPERATIONS - - - -
LIDDELL COAL OPERATIONS NC NC - -
WESTCLIFF AND NORTHCLIFF COLLIERIES - - - -
RAVENSWORTH/NARAMA MINE NC NC NC NC
UNITED COLLIERY - - - -
DENDROBIUM MINE - - - -
CAMBERWELL COAL MINE NC NC NC NC
RIX'S CREEK COLLIERY NC NC NC NC
SPRINGVALE COLLIERY NC NC NC NC
WESTSIDE MINE NC NC NC NC
MT OWEN COAL MINE NC NC - -
PINE DALE MINE NC NC NC NC
BENGALLA MINE NC NC NC NC
GLENNIES CREEK COLLIERY - - - -
RAVENSWORTH UNDERGROUND MINE - - - -
CULLEN VALLEY MINE NC NC NC NC
RAVENSWORTH EAST MINE NC NC NC NC
DONALDSON COAL PTY LTD NC NC NC NC
MT ARTHUR NORTH COAL MINE NC NC NC NC
ASHTON COAL MINE NC NC NC NC
NRE NO 1 COLLIERY - - - -
NEWSTAN COLLIERY - - - -
MACQUARIE COAL PREPARATION PLANT - - - -
THE INVINCIBLE COLLIERY NC NC NC NC
WILPINJONG COAL PTY LTD NC NC NC NC
TASMAN COAL MINE - - - -
GLENDELL MINE NC NC NC NC
ABEL UNDERGROUND MINE - - - -

Katestone Environmental Pty Ltd KE1006953 OEH
June 2011
Page 222
Mine
Loaders (overburden) Trucks (dumping
overburden)
Current control
Source metric
Current control
Source metric
XSTRATA MANGOOLLA (ANVIL HILL MINE) NC NC - -
RICHMOND MAIN EAST NC NC - -
Note NQ means best practice emission control factor not quantified NC means no controls “ – “ means no emissions from this source
The combined particulate matter emission control metric for dumping overburden from loader or truck at coal mines in the GMR has been estimated to be 0 out of 100. This outcome is inconsistent with the outcomes of the review of AEMR, EMS, EMP and EPL shown in Table 114 that indicated a moderate level of controls on overburden dumping.
10.4.7 Loading and dumping ROM coal
Of all sources of particulate matter from coal mining activities in the GMR, loaders dumping coal was ranked number 7 in terms of emissions of TSP, number 6 in terms of emissions of PM10 and number 8 in terms of emissions of PM2.5. Loaders dumping coal contribute 3.6% of total coal mining emissions of PM10 in the GMR. Trucks dumping coal ranked number 12 in terms of emissions of TSP, PM10 and PM2.5. Trucks dumping coal contribute 0.8% to total coal mining emissions of PM10 in the GMR. The key sources of particulate matter at the ROM pad are trucks and loaders dumping into the ROM hopper and onto the ROM pad. Current practice for the management of particulate matter emissions from the ROM pad are the combined use of water sprays and enclosure of the ROM hopper. Such an enclosure ensures that the water sprays remain effective with moderate to strong winds. Most of the mines that were visited during this study aimed to minimise the amount of material that was stockpiled on the ROM pad, with coal being dumped directly into the ROM bin whenever possible. The ROM pad was used primarily when there was a break-down in the processing plant or when the coal coming from the pit was out-of-specification with the requirements of the processing plant. The practice of dumping directly into the ROM hopper avoids particulate emissions associated with double handling of coal and reduces the potential that the coal will dry-out on the pad and be subject to wind erosion. The measures adopted at GMR mines are shown in Table 116 for open-cut mines and combined underground and open-cut mines. Three mines (13%) were found that utilise both elements of best practice to minimise emissions associated with loading coal to the ROM hoppers (Figure 58182). Most ROM hoppers (83%) use water sprays activated by the movement of the truck into the dumping area to minimise particulate emissions as the coal falls into the hopper. Sixty seven percent of mines use water applied by fixed sprays or by water cart to manage particulate matter emissions generated by coal dumping.

Katestone Environmental Pty Ltd KE1006953 OEH
June 2011
Page 223
Table 116 Management of particulate matter from ROM pad in the GMR - open-cut
mines and combined open-cut and underground mines
Coal Mine
Au
tom
ati
c w
ate
r s
pra
ys
wh
ils
t
du
mp
ing
in
to R
OM
ho
pp
er
RO
M h
op
pe
r en
clo
su
re o
f th
ree
sid
es
an
d a
ro
of
Wa
ter
ap
pli
ca
tio
n b
y f
ixed
sp
ray
s
or
wa
ter
ca
rt o
n R
OM
pa
d
En
clo
su
re w
ith
fa
bri
c f
ilte
r
Ashton Coal Mine
Bengalla
Bloomfield Colliery
Camberwell (Integra Coal Open Cut)
Cullen Valley Mine
Cumnock No1 Colliery
Donaldson Coal Mine
Drayton Coal Mine
Glendell Mine, Mt Owen Mine, Ravensworth East
Hunter Valley Operations
Liddell Coal Operations
Mangoola (Anvil Hill) (UNDER CONSTRUCTION)
Moolarben Coal Mine
Mount Arthur Coal Mine
Mount Thorley Warkworth Operations
Muswellbrook Colliery Holding
Pine Dale Mine
Ravensworth Narama
Rix's Creek Colliery Holding
Saxonvale Colliery Holding
The Invincible Mine
Wambo Coal
Westside Mine
Wilpinjong Coal Pty Ltd
Proportion of total (%) 83 13 67 0
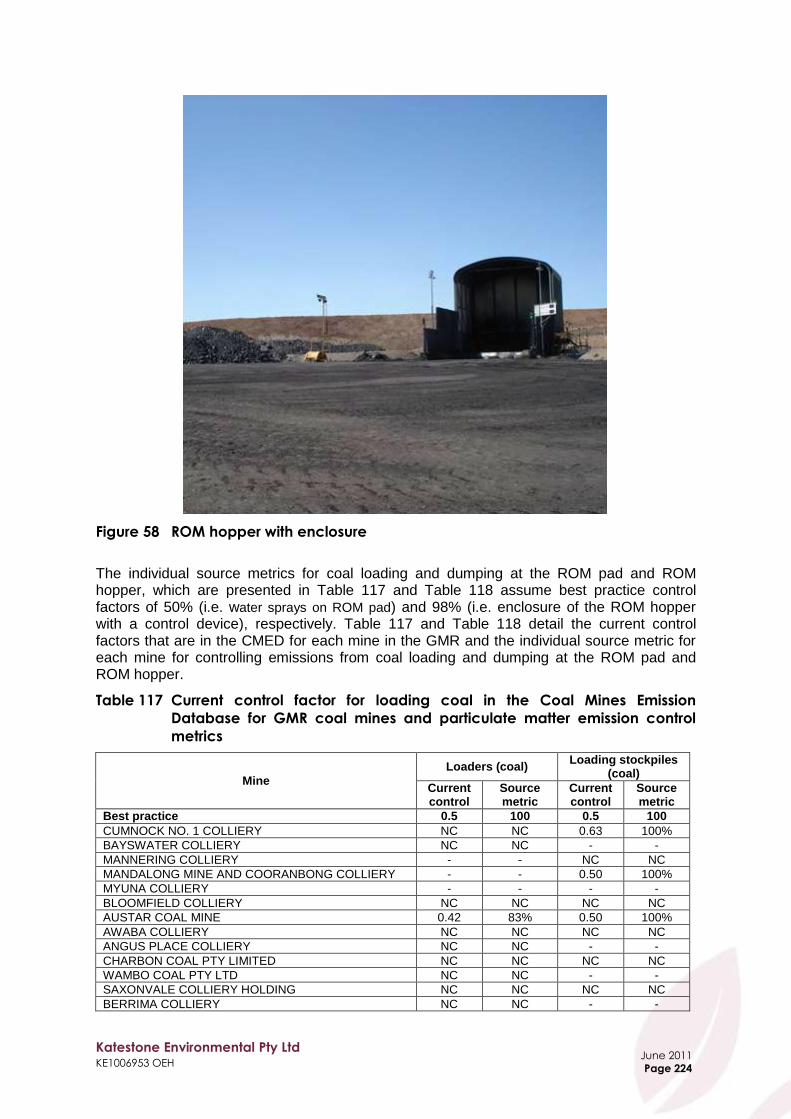
Katestone Environmental Pty Ltd KE1006953 OEH
June 2011
Page 224
Figure 58 ROM hopper with enclosure
The individual source metrics for coal loading and dumping at the ROM pad and ROM hopper, which are presented in Table 117 and Table 118 assume best practice control factors of 50% (i.e. water sprays on ROM pad) and 98% (i.e. enclosure of the ROM hopper with a control device), respectively. Table 117 and Table 118 detail the current control factors that are in the CMED for each mine in the GMR and the individual source metric for each mine for controlling emissions from coal loading and dumping at the ROM pad and ROM hopper.
Table 117 Current control factor for loading coal in the Coal Mines Emission
Database for GMR coal mines and particulate matter emission control
metrics
Mine
Loaders (coal) Loading stockpiles
(coal)
Current control
Source metric
Current control
Source metric
Best practice 0.5 100 0.5 100
CUMNOCK NO. 1 COLLIERY NC NC 0.63 100%
BAYSWATER COLLIERY NC NC - -
MANNERING COLLIERY - - NC NC
MANDALONG MINE AND COORANBONG COLLIERY - - 0.50 100%
MYUNA COLLIERY - - - -
BLOOMFIELD COLLIERY NC NC NC NC
AUSTAR COAL MINE 0.42 83% 0.50 100%
AWABA COLLIERY NC NC NC NC
ANGUS PLACE COLLIERY NC NC - -
CHARBON COAL PTY LIMITED NC NC NC NC
WAMBO COAL PTY LTD NC NC - -
SAXONVALE COLLIERY HOLDING NC NC NC NC
BERRIMA COLLIERY NC NC - -

Katestone Environmental Pty Ltd KE1006953 OEH
June 2011
Page 225
Mine
Loaders (coal) Loading stockpiles
(coal)
Current control
Source metric
Current control
Source metric
IVANHOE NO.2 COLLIERY - - - -
HUNTER VALLEY OPERATIONS 0.12 24% NC NC
MUSWELLBROOK COLLIERY HOLDING NC NC NC NC
CLARENCE COLLIERY - - 0.50 100%
APPIN COLLIERY - - - -
BAAL BONE COLLIERY NC NC 0.50 100%
METROPOLITAN COLLIERY NC NC NC NC
NRE WONGAWILLI COLLIERY NC NC NC NC
DRAYTON COAL MINE NC NC NC NC
WEST WALLSEND COLLIERY NC NC NC NC
WARKWORTH COAL MINE 0.11 22% 0.50 100%
TAHMOOR COLLIERY 0.09 17% - -
CHAIN VALLEY COLLIERY NC NC NC NC
MOUNT THORLEY OPERATIONS 0.26 52% NC NC
LIDDELL COAL OPERATIONS NC NC - -
WESTCLIFF AND NORTHCLIFF COLLIERIES NC NC 0.50 100%
RAVENSWORTH/NARAMA MINE NC NC - -
UNITED COLLIERY 0.50 100% 0.25 50%
DENDROBIUM MINE - - 0.50 100%
CAMBERWELL COAL MINE NC NC 0.70 100%
RIX'S CREEK COLLIERY NC NC NC NC
SPRINGVALE COLLIERY - - NC NC
WESTSIDE MINE NC NC - -
MT OWEN COAL MINE NC NC NC NC
PINE DALE MINE 0.17 33% - -
BENGALLA MINE NC NC NC NC
GLENNIES CREEK COLLIERY NC NC 0.50 100%
RAVENSWORTH UNDERGROUND MINE - - 0.70 100%
CULLEN VALLEY MINE NC NC NC NC
RAVENSWORTH EAST MINE NC NC NC NC
DONALDSON COAL PTY LTD NC NC - -
MT ARTHUR NORTH COAL MINE NC NC - -
ASHTON COAL MINE 0.25 50% 0.50 100%
NRE NO 1 COLLIERY NC NC 0.50 100%
NEWSTAN COLLIERY NC NC NC NC
MACQUARIE COAL PREPARATION PLANT 0.70 100% 0.36 72%
THE INVINCIBLE COLLIERY NC NC NC NC
WILPINJONG COAL PTY LTD NC NC NC NC
TASMAN COAL MINE NC NC NC NC
GLENDELL MINE NC NC - -
ABEL UNDERGROUND MINE NC NC NC NC
XSTRATA MANGOOLLA (ANVIL HILL MINE) - - - -
RICHMOND MAIN EAST - - - -
Note NQ means best practice emission control factor not quantified NC means no controls “ – “ means no emissions from this source

Katestone Environmental Pty Ltd KE1006953 OEH
June 2011
Page 226
Table 118 Current control factor for dumping coal in the Coal Mines Emission
Database for GMR coal mines and particulate matter emission control
metrics
Mine
Trucks (dumping coal)
Dumping coal into ROM hopper
Current control
Source metric
Current control
Source metric
Best practice 0.5 100 0.98 100
CUMNOCK NO. 1 COLLIERY - - 0.70 71%
BAYSWATER COLLIERY - - 0.50 51%
MANNERING COLLIERY - - - -
MANDALONG MINE AND COORANBONG COLLIERY - - - -
MYUNA COLLIERY - - - -
BLOOMFIELD COLLIERY - - NC NC
AUSTAR COAL MINE NC NC - -
AWABA COLLIERY - - - -
ANGUS PLACE COLLIERY - - - -
CHARBON COAL PTY LIMITED - - NC NC
WAMBO COAL PTY LTD - - - -
SAXONVALE COLLIERY HOLDING - - NC NC
BERRIMA COLLIERY - - NC NC
IVANHOE NO.2 COLLIERY - - - -
HUNTER VALLEY OPERATIONS - - NC NC
MUSWELLBROOK COLLIERY HOLDING NC NC 0.50 51%
CLARENCE COLLIERY - - - -
APPIN COLLIERY - - 0.70 71%
BAAL BONE COLLIERY NC NC - -
METROPOLITAN COLLIERY - - - -
NRE WONGAWILLI COLLIERY - - - -
DRAYTON COAL MINE NC NC NC NC
WEST WALLSEND COLLIERY - - - -
WARKWORTH COAL MINE - - NC NC
TAHMOOR COLLIERY - - NC NC
CHAIN VALLEY COLLIERY - - - -
MOUNT THORLEY OPERATIONS - - - -
LIDDELL COAL OPERATIONS - - 0.50 32%
WESTCLIFF AND NORTHCLIFF COLLIERIES - - 0.60 60%
RAVENSWORTH/NARAMA MINE - - 0.57 58%
UNITED COLLIERY - - 0.70 60%
DENDROBIUM MINE - - - -
CAMBERWELL COAL MINE NC NC 0.50 51%
RIX'S CREEK COLLIERY - - NC NC
SPRINGVALE COLLIERY - - NC NC
WESTSIDE MINE - - - -
MT OWEN COAL MINE - - NC NC
PINE DALE MINE - - NC NC
BENGALLA MINE - - NC NC
GLENNIES CREEK COLLIERY - - NC NC
RAVENSWORTH UNDERGROUND MINE - - - -
CULLEN VALLEY MINE - - NC NC
RAVENSWORTH EAST MINE - - NC NC
DONALDSON COAL PTY LTD - - - -
MT ARTHUR NORTH COAL MINE - - 0.50 51%
ASHTON COAL MINE NC NC 0.50 51%
NRE NO 1 COLLIERY - - - -
NEWSTAN COLLIERY - - NC NC
MACQUARIE COAL PREPARATION PLANT - - 0.70 71%
THE INVINCIBLE COLLIERY - - NC NC
WILPINJONG COAL PTY LTD NC NC NC NC
TASMAN COAL MINE - - - -
GLENDELL MINE - - - -
ABEL UNDERGROUND MINE - - - -

Katestone Environmental Pty Ltd KE1006953 OEH
June 2011
Page 227
Mine
Trucks (dumping coal)
Dumping coal into ROM hopper
Current control
Source metric
Current control
Source metric
XSTRATA MANGOOLLA (ANVIL HILL MINE) - - - -
RICHMOND MAIN EAST - - - -
Note NQ means best practice emission control factor not quantified NC means no controls “ – “ means no emissions from this source
Table 119 shows the combined particulate matter emission control metrics for coal dumping sources at the ROM pad for coal mines in the GMR. The table shows that a low level of control is applied to coal dumping sources. This outcome is inconsistent with the outcomes of the review of AEMR, EMS, EMP and EPL shown in Table 116, which indicated a moderate level of control on ROM hoppers.
Table 119 Combined particulate matter emission control metrics for GMR coal
dumping sources
Wind erosion source Combined metric for GMR mines
Loaders (coal) 14.9
Loading stockpiles (coal) 27.1
Trucks (dumping coal) 0.0
Dumping coal into ROM hopper 24.2
10.4.8 Conveyors and transfers
Emissions of particulate matter from conveyors are not quantified in the CMED and emission factors are not available in the NPI handbook or AP-42. However, transfer points between conveyors and from conveyors to stockpiles have been quantified in the CMED. Coal transfers contribute a relatively small amount to GMR emissions of TSP (0.1%), PM10 (0.1%) and PM2.5 (<0.1%). At GMR mines, conveyors are generally used to transport coal from the ROM hopper to the processing plant and from the processing plant to the product stockpiles. Some mines utilise common processing plants and so, conveyor lengths can be extensive with many transfer points. Best practice measures for minimising emissions of particulate matter from conveyors and transfers are:
The use of wind shielding on conveyor sides;
Water sprays at conveyor transfers;
Enclosure of transfer points; and
Soft-loading chutes.
The measures adopted at GMR mines are shown in Table 120 for underground mines and Table 121 for open-cut mines and combined underground and open-cut mines. Three open-cut mines (12%) were found that utilise all of these measures. No underground mines were found that utilise all of the measures. A third of underground and 40% of open-cut mines were found to utilise four of the five elements. Seventy eight percent of underground mines and 68% of open-cut mines were found to use one aspect of best practice.

Katestone Environmental Pty Ltd KE1006953 OEH
June 2011
Page 228
Table 120 Management of particulate matter from conveyors and transfers in the
GMR - underground mines
Coal Mine
Co
nv
ey
or
win
d s
hie
ldin
g -
ro
of
Co
nv
ey
or
win
d s
hie
ldin
g -
on
e o
r
two
sid
es
Wa
ter
sp
ray
s a
t tr
an
sfe
rs
En
clo
sed
tra
ns
fers
So
ft-l
oa
din
g c
hu
tes
Abel Underground Mine
Airly Coal Project
Angus Place Colliery
Appin Coal Mine
Austar Coal Mine
Awaba Colliery
Baal Bone Colliery
Chain valley Colliery
Charbon Coal Pty Ltd
Clarence Colliery
Dendrobium Mine
Glennies Creek Colliery
Mandalong Mine and Cooranbong Colliery
Mannering Colliery
Metropolitan Colliery
Myuna Colliery
Newstan Colliery
NRE No 1 Colliery
NRE Wongawilli Colliery
Ravensworth Underground mine
Richmond Main East
Springvale Colliery
Tahmoor Colliery
Tasman Coal mine
United Colliery
West Wallsend Colliery
Westcliff and Northcliff Collieries
Proportion of total (%) 70 48 59 52 7

Katestone Environmental Pty Ltd KE1006953 OEH
June 2011
Page 229
Table 121 Management of particulate matter from conveyors and transfers in the
GMR - open-cut mines and combined open-cut and underground mines
Coal Mine
Co
nv
ey
or
win
d s
hie
ldin
g -
ro
of
Co
nv
ey
or
win
d s
hie
ldin
g -
on
e o
r
two
sid
es
Wa
ters
pra
ys
at
tra
ns
fers
En
clo
sed
tra
ns
fers
So
ft-l
oa
din
g c
hu
tes
Ashton Coal Mine
Bengalla
Bloomfield Colliery
Camberwell (Integra Coal Open Cut)
Cullen Valley Mine
Cumnock No1 Colliery
Donaldson Coal Mine
Drayton Coal Mine
Glendell Mine, Mt Owen Mine, Ravensworth East
Hunter Valley Operations
Ivanhoe No.2 Colliery
Liddell Coal Operations
Mangoola (Anvil Hill) (UNDER CONSTRUCTION)
Moolarben Coal Mine
Mount Arthur Coal Mine
Mount Thorley Warkworth Operations
Muswellbrook Colliery Holding
Pine Dale Mine
Ravensworth Narama
Rix's Creek Colliery Holding
Saxonvale Colliery Holding
The Invincible Mine
Wambo Coal
Westside Mine
Wilpinjong Coal Pty Ltd
Proportion of total (%) 44 40 64 48 12
Since these emission sources are not explicitly represented in the database and are not a substantial source of emissions, metrics have not been presented.
10.4.9 Stacking and reclaiming product coal
Stacking and reclaiming product coal is not explicitly characterised in the CMED. Since product coal is in most circumstances, relatively wet during handling, emissions of particulate matter would be relatively small and would be a subset of the coal dumping, bulldozing and transfers identified above. Current practices have been identified to be:
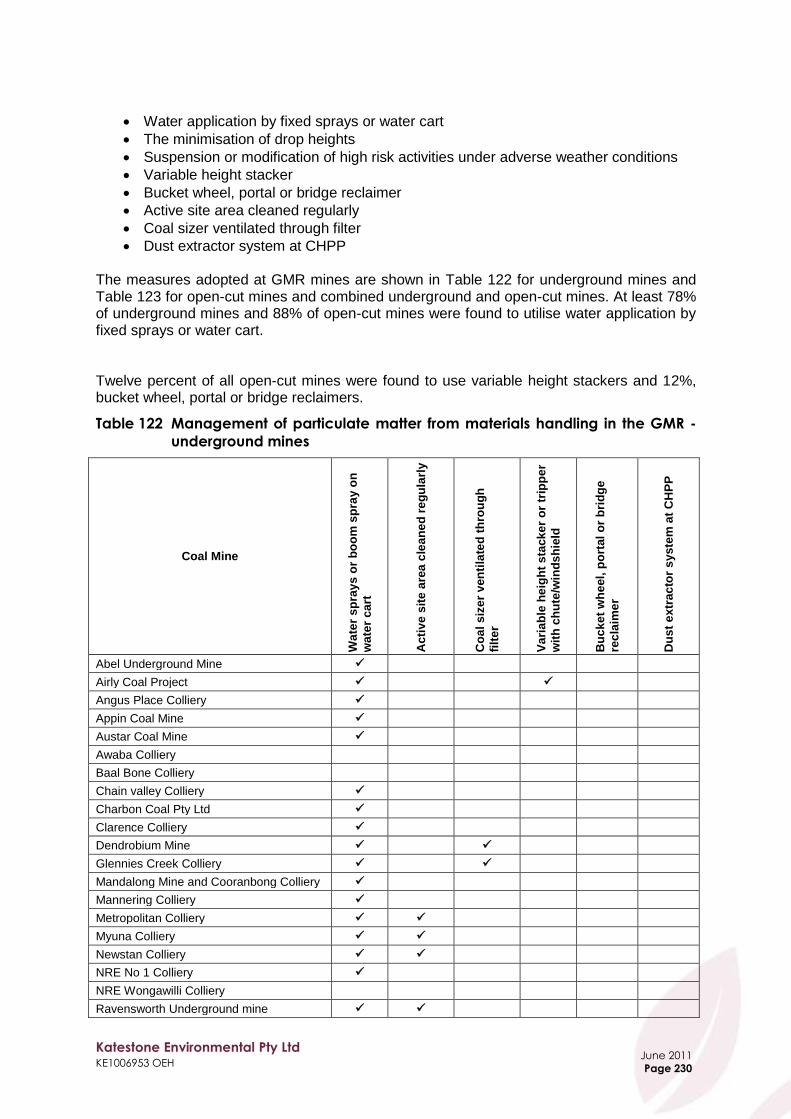
Katestone Environmental Pty Ltd KE1006953 OEH
June 2011
Page 230
Water application by fixed sprays or water cart
The minimisation of drop heights
Suspension or modification of high risk activities under adverse weather conditions
Variable height stacker
Bucket wheel, portal or bridge reclaimer
Active site area cleaned regularly
Coal sizer ventilated through filter
Dust extractor system at CHPP The measures adopted at GMR mines are shown in Table 122 for underground mines and Table 123 for open-cut mines and combined underground and open-cut mines. At least 78% of underground mines and 88% of open-cut mines were found to utilise water application by fixed sprays or water cart. Twelve percent of all open-cut mines were found to use variable height stackers and 12%, bucket wheel, portal or bridge reclaimers.
Table 122 Management of particulate matter from materials handling in the GMR -
underground mines
Coal Mine
Wa
ter
sp
ray
s o
r b
oo
m s
pra
y o
n
wa
ter
ca
rt
Acti
ve
sit
e a
rea
cle
an
ed
re
gu
larl
y
Co
al
siz
er
ven
tila
ted
th
rou
gh
filt
er
Va
ria
ble
he
igh
t s
tack
er
or
trip
pe
r
wit
h c
hu
te/w
ind
sh
ield
Bu
ck
et
wh
eel,
po
rtal
or
bri
dg
e
rec
laim
er
Du
st
ex
trac
tor
sy
ste
m a
t C
HP
P
Abel Underground Mine
Airly Coal Project
Angus Place Colliery
Appin Coal Mine
Austar Coal Mine
Awaba Colliery
Baal Bone Colliery
Chain valley Colliery
Charbon Coal Pty Ltd
Clarence Colliery
Dendrobium Mine
Glennies Creek Colliery
Mandalong Mine and Cooranbong Colliery
Mannering Colliery
Metropolitan Colliery
Myuna Colliery
Newstan Colliery
NRE No 1 Colliery
NRE Wongawilli Colliery
Ravensworth Underground mine

Katestone Environmental Pty Ltd KE1006953 OEH
June 2011
Page 231
Coal Mine
Wa
ter
sp
ray
s o
r b
oo
m s
pra
y o
n
wa
ter
ca
rt
Ac
tiv
e s
ite
are
a c
lea
ne
d r
eg
ula
rly
Co
al
siz
er
ven
tila
ted
th
rou
gh
filt
er
Va
ria
ble
he
igh
t s
tack
er
or
trip
pe
r
wit
h c
hu
te/w
ind
sh
ield
Bu
ck
et
wh
eel,
po
rtal
or
bri
dg
e
rec
laim
er
Du
st
ex
tra
cto
r s
yste
m a
t C
HP
P
Richmond Main East
Springvale Colliery
Tahmoor Colliery
Tasman Coal mine
United Colliery
West Wallsend Colliery
Westcliff and Northcliff Collieries
Proportion of total (%) 78 19 7 7 4 4
Table 123 Management of particulate matter from materials handling in the GMR -
open-cut mines and combined open-cut and underground mines
Coal Mine
Wa
ter
sp
ray
s o
r b
oo
m s
pra
y o
n
wa
ter
ca
rt
Acti
ve
sit
e a
rea
cle
an
ed
re
gu
larl
y
Co
al
siz
er
ven
tila
ted
th
rou
gh
filt
er
Va
ria
ble
he
igh
t s
tack
er
or
trip
pe
r
wit
h c
hu
te/w
ind
sh
ield
Bu
ck
et
wh
eel,
po
rtal
or
bri
dg
e
rec
laim
er
Du
st
ex
trac
tor
sy
ste
m a
t C
HP
P
Ashton Coal Mine
Bengalla
Bloomfield Colliery
Camberwell (Integra Coal Open Cut)
Cullen Valley Mine
Cumnock No1 Colliery
Donaldson Coal Mine
Drayton Coal Mine
Glendell Mine, Mt Owen Mine, Ravensworth East
Hunter Valley Operations
Ivanhoe No.2 Colliery
Liddell Coal Operations
Mangoola (Anvil Hill) (UNDER CONSTRUCTION)
Moolarben Coal Mine
Mount Arthur Coal Mine

Katestone Environmental Pty Ltd KE1006953 OEH
June 2011
Page 232
Coal Mine
Wa
ter
sp
ray
s o
r b
oo
m s
pra
y o
n
wa
ter
ca
rt
Ac
tiv
e s
ite
are
a c
lea
ne
d r
eg
ula
rly
Co
al
siz
er
ven
tila
ted
th
rou
gh
filt
er
Va
ria
ble
he
igh
t s
tack
er
or
trip
pe
r
wit
h c
hu
te/w
ind
sh
ield
Bu
ck
et
wh
eel,
po
rtal
or
bri
dg
e
rec
laim
er
Du
st
ex
tra
cto
r s
yste
m a
t C
HP
P
Mount Thorley Warkworth Operations
Muswellbrook Colliery Holding
Pine Dale Mine
Ravensworth Narama
Rix's Creek Colliery Holding
Saxonvale Colliery Holding
The Invincible Mine
Wambo Coal
Westside Mine
Wilpinjong Coal Pty Ltd
Proportion of total (%) 88 8 4 12 12 0
Since these emission sources are not explicitly represented in the database and are not a substantial source of emissions, metrics have not been presented.
10.5 Summary of particulate matter emission control metrics
Particulate matter emission control metrics have been calculated from the Coal Mines Emission Database (CMED) for all sources of particulate matter at GMR coal mines. The metrics have been expressed as a combined metric for each coalfield and for the GMR as a whole in Table 124. Note that the combined metrics for each coalfield are the sum of the metrics for each emission source within each coalfield weighted by the relative contribution of each source to the total uncontrolled emissions within each coalfield. Similarly, the combined metric for the GMR is sum of the metrics for each emission source within the GMR weighted by the relative contribution of each source to the total uncontrolled GMR emissions. Hence, the combined GMR metric is not a simple average of the combined metrics for each of the coalfields. The metrics show that the Hunter and Newcastle coalfields have a similar level of particulate matter emissions control as an aggregate of all sources of emissions. A moderate level of progress towards best practice has been achieved. Whilst lower combined metrics are evident in the Southern and Western coalfields, the relatively low contribution of these coalfields to the overall emissions into the GMR airshed mean that the combined GMR metric is marginally lower than the Hunter and Newcastle coalfield metrics.

Katestone Environmental Pty Ltd KE1006953 OEH
June 2011
Page 233
Table 124 Combined particulate matter emission control metrics by coalfield and
GMR
Coal field
Combined particulate matter emission control metric (/100)
Range Weighted sum
HUNTER 0.0-93.7 63.2
NEWCASTLE 0.0-92.2 67.0
SOUTHERN 0.0-87.8 46.5
WESTERN 0.0-66.3 51.4
GMR Total 0.0-93.7 62.8

Katestone Environmental Pty Ltd KE1006953 OEH
June 2011
Page 234
11. Air Quality Management Tools
This section provides details of air quality management tools that are used to control emissions of particulate matter from coal mines. The current practices adopted by coal mines in the GMR are detailed. An Air Quality Management Plan (AQMP) is an essential part of controlling emissions of particulate matter. Measures to minimise the potential impact of fugitive particulate matter emissions must recognise all potential sources and have strategies in place to mitigate any unnecessary emissions and adverse impacts that the proposed activities may have on the health and amenity of the surrounding community. An AQMP should have both proactive and reactive components. An AQMP for a coal mine should contain as a minimum the following elements:
Environmental Criteria
Mission statement
Particulate matter management strategy consisting of: o Objectives and targets o Particulate matter risk assessment o Particulate matter suppression improvement plan
Monitoring requirements including assignment of responsibility
Communication strategy
System and performance review for continuous improvement
11.1 Identify environmental criteria
Identify environmental criteria that can be used to measure the extent of impacts from emissions of particulate matter. The environmental criteria should note the:
Particle size
Averaging time
Concentration
Frequency of allowable exceedances
Environmental criteria for an AQMP may not directly correlate to regulatory criteria. For example, the premises may operate several air quality monitors that measure and report ambient levels of particulate matter at 10 minute time intervals. It may be useful for the AQMP to identify alarm levels based on short term time intervals in order to effectively manage air quality impacts. Therefore, environmental criteria would need to be developed that are not necessarily consistent with regulatory criteria but improve the mine‟s ability for achieving them.
11.2 Mission statement
Provide a mission statement for the operation of the premises. The mission statement for a particulate matter management plan for a coal mine should encompass the need for continuous improvement in terms of reducing fugitive particulate matter generated by activities at the coal mine and outline why continuous improvement is important for the organisation.

Katestone Environmental Pty Ltd KE1006953 OEH
June 2011
Page 235
11.3 Develop particulate matter management strategy
11.3.1 Set objectives and targets
Within the Particulate Matter Management Strategy, the operator should set objectives and targets to meet over the reporting period taking into consideration the following aspects:
environmental risks identified in the particulate matter risk register
legal non-compliance issues
audit findings and corrective actions
stakeholder complaints and views
technological options
financial, operational and business requirements
11.3.2 Particulate matter risk assessment
The particulate matter risk assessment should:
identify all potential particulate matter emission sources
magnitude of emission source and range of potential emission significance
potential impact area under the range of meteorological conditions likely at the site
probability of occurrence
consequence of occurrence
existing controls of each source, including physical controls, behavioural controls and procedural controls
11.3.3 Particulate matter suppression improvement plan
The particulate matter suppression improvement plan should outline actions to meet endorsed objectives and targets and address high risk areas identified in the particulate matter risk register.
11.4 Monitoring requirements
The broad aim of the monitoring programme is to provide a quantitative measurement of how the operator is performing against the Objectives and Targets set out in the Particulate Matter Management Plan. Secondary aims of the monitoring network are to:
Determine long-term trends in ambient particulate matter levels.
Determine TSP, PM10 and PM2.5 concentrations at representative locations surrounding the facility.
Provide scientific data for the community. It is important to note that monitoring requirements for informing an AQMP do not necessarily have to align with regulatory monitoring requirements. For example, light scattering techniques that are correlated to particulate matter levels could be used to inform the Particulate Matter Management Plan (e.g. opacity meters used to measure haul road particulate matter to inform road watering, surface treatment response etc.).
11.5 Responsibilities
The Particulate Matter Management Plan should outline all responsibilities in regards to particulate matter management for all employees (including contractors) of the operator.

Katestone Environmental Pty Ltd KE1006953 OEH
June 2011
Page 236
11.6 Communication strategies
Both internal (e.g. training and induction, exceedance reporting, incidence reporting) and external (e.g. annual reporting, exceedance analysis, complaint analysis, internet reporting for community) communication strategies in relation to particulate matter management are to be outlined in the Particulate Matter Management Plan.
11.7 System and performance review
A review of the Air Quality Management Plan should be conducted on an annual basis as a minimum. The review should take into account the following:
Suitability of the mission statement
The extent to which objectives and targets have been met
Air quality concerns or complaints from external stakeholders
General particulate matter performance based on monitoring results
Periodic environmental audit findings
Periodic reviews of particulate matter control trials and investigations
Changing circumstances such as urban encroachment, changing location and orientation of mining operations, developments in legal and other requirements
Annual external review of particulate matter management practices and particulate matter monitoring results
The results of the review are to feed back into the Air Quality Management Plan with the objective to drive continuous improvement in performance.
11.8 Proactive and reactive components of a management plan
Proactive components of a management plan could include:
Training, tool-box talks, implementation of particulate matter minimisation into standard operating procedure
Local activity-based observations of particulate matter (or opacity) and feedback to mine management
Continuous real time monitoring of meteorological conditions that feed into operational planning
Continuous real time monitoring of particulate matter concentrations at sensitive receptors that feed into operational planning
Use of a forecasting system to assist in anticipating adverse meteorological conditions that may give rise to emissions of particulate matter and implementation of operational changes and improved mitigation to avoid adverse impacts. e.g. plan activities that include land clearing, blasting etc.
Adaptive management strategies such as reduction in extraction rates of operations when meteorological monitoring suggests adverse wind conditions or monitoring of particulate matter at sensitive receptors indicates levels are near to exceeding air quality criteria
Scheduling of activities based on the outcomes of the real time monitoring, forecasting and adaptive management strategies

Katestone Environmental Pty Ltd KE1006953 OEH
June 2011
Page 237
Reactive components of a management plan could include:
Implementation of additional mitigation measures when wind conditions become adverse, such as ceasing operations, reducing activity rates or covering equipment, application of suppressants
Trigger points for management decisions based on measurements of wind conditions and/or monitoring of particulate matter at sensitive receptors when levels are near exceeding air quality criteria
The objective of any monitoring undertaken must be clear in order to design a monitoring program that is effective and useful. Table 125 outlines considerations for monitoring conducted under an AQMP.
Table 125 Air quality monitoring considerations
Consideration Baseline monitoring Compliance monitoring
Real time management
Purpose To gather site-specific information on existing
air quality
To determine compliance against a set air quality criteria
To provide early indication of impacts. Data needs to
feed into management plan for the mine. i.e. affects
where and how activities are occurring
Monitoring requirements
Minimum 1 year As required by licence or approval conditions
Short-term (10-minute)
Location At a residence At a residence At boundary of mine and/or
at a residence
Method Monitor to be sited and operated in accordance
with standards
Monitor to be sited and operated in accordance
with standards
Not critical to be sited and operated in accordance with
standards
Comments
Need to confirm specific monitoring requirements (i.e. monitoring interval require and pollutants)
Need to confirm specific monitoring requirements (i.e. monitoring interval
require and pollutants)
Weather station (measuring wind speed and wind
direction as a minimum) will need to be co-located with
pollution monitor
11.9 Current practices in the GMR
Proactive and reactive management tools were found to be best practice for reducing emissions of particulate matter from open-cut coal mines. Such tools could also be applied to surface activities of underground mines. However, the nature of the surface facilities of an underground mine being compact and hence more easily managed than that of an open-cut mine, mean that proactive and reactive strategies are less critical for underground mines. Best practice for underground mines consists of meteorological monitoring and monitoring ambient concentrations of particulate matter. A summary of information collected relating to air quality management tools used at underground and open-cut mines in the GMR is presented in Table 126 and Table 127, respectively. Considering the underground mines, 41% monitor meteorological conditions and 33% monitor concentrations of particulates using high volume air samplers. At least 78% of underground mines measure the potential nuisance impact of particulate matter emissions using dust deposition gauges.

Katestone Environmental Pty Ltd KE1006953 OEH
June 2011
Page 238
Of the open-cut mines, 84% monitor meteorological conditions and 48% monitor using a TEOM or other continuous particulate monitoring technique. Forty eight percent modify or cease activities on dry or windy days based on consideration of monitoring data. At least three mines have continuous particulate matter monitoring data available in the control room with alarms to alert operators when trigger levels are being exceeded. A number of mines use a forecasting system and inversion tower data to predict the potential for strong inversions for scheduling blasts to avoid noise impacts. Three mines were identified that adopt similar proactive approaches for management of particulate matter emissions.
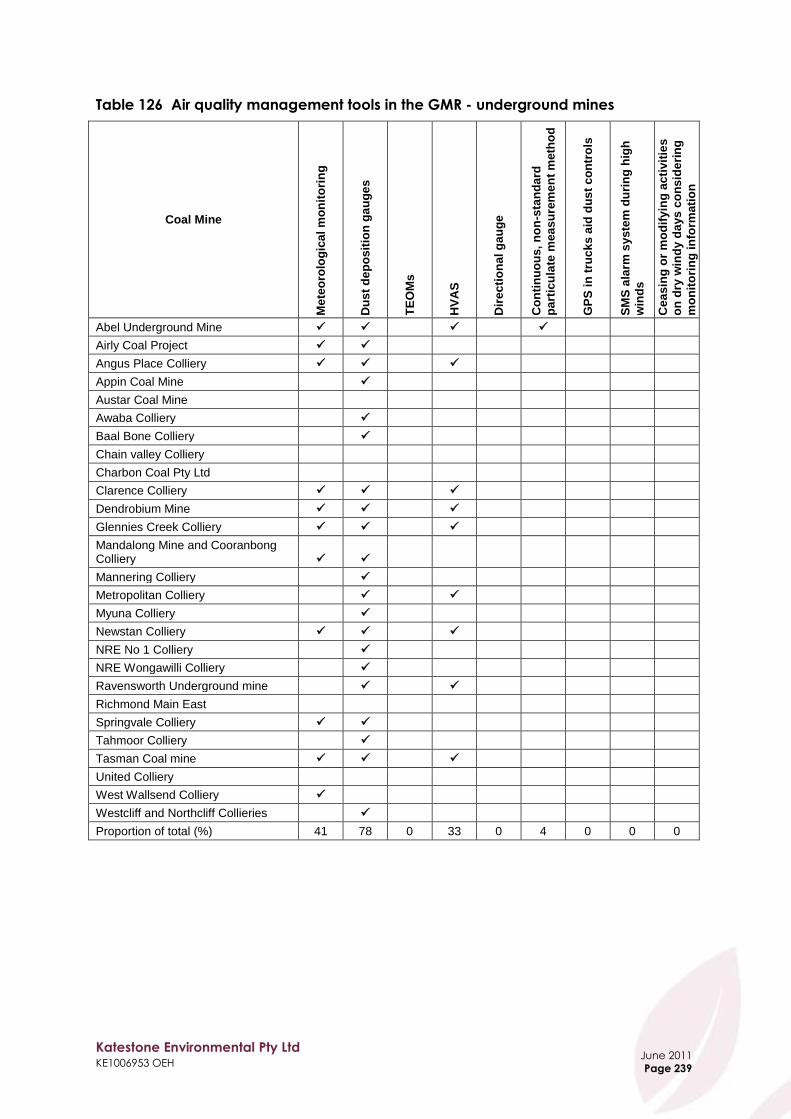
Katestone Environmental Pty Ltd KE1006953 OEH
June 2011
Page 239
Table 126 Air quality management tools in the GMR - underground mines
Coal Mine
Me
teo
rolo
gic
al
mo
nit
ori
ng
Du
st
de
po
sit
ion
ga
ug
es
TE
OM
s
HV
AS
Dir
ec
tio
na
l g
au
ge
Co
nti
nu
ou
s,
no
n-s
tan
da
rd
pa
rtic
ula
te m
ea
su
rem
en
t m
eth
od
GP
S i
n t
ruc
ks
aid
du
st
co
ntr
ols
SM
S a
larm
sy
ste
m d
uri
ng
hig
h
win
ds
Ce
as
ing
or
mo
dif
yin
g a
cti
vit
ies
on
dry
win
dy d
ays
co
ns
ide
rin
g
mo
nit
ori
ng
in
form
ati
on
Abel Underground Mine
Airly Coal Project
Angus Place Colliery
Appin Coal Mine
Austar Coal Mine
Awaba Colliery
Baal Bone Colliery
Chain valley Colliery
Charbon Coal Pty Ltd
Clarence Colliery
Dendrobium Mine
Glennies Creek Colliery
Mandalong Mine and Cooranbong Colliery
Mannering Colliery
Metropolitan Colliery
Myuna Colliery
Newstan Colliery
NRE No 1 Colliery
NRE Wongawilli Colliery
Ravensworth Underground mine
Richmond Main East
Springvale Colliery
Tahmoor Colliery
Tasman Coal mine
United Colliery
West Wallsend Colliery
Westcliff and Northcliff Collieries
Proportion of total (%) 41 78 0 33 0 4 0 0 0

Katestone Environmental Pty Ltd KE1006953 OEH
June 2011
Page 240
Table 127 Air quality management tools in the GMR - open-cut mines and
combined open-cut and underground mines
Coal Mine
Me
teo
rolo
gic
al
mo
nit
ori
ng
Du
st
de
po
sit
ion
ga
ug
es
TE
OM
s
HV
AS
Dir
ec
tio
na
l g
au
ge
Co
nti
nu
ou
s,
no
n-s
tan
da
rd
pa
rtic
ula
te m
ea
su
rem
en
t m
eth
od
GP
S i
n t
ruc
ks
aid
du
st
co
ntr
ols
SM
S a
larm
sy
ste
m d
uri
ng
hig
h
win
ds
Ce
as
ing
or
mo
dif
yin
g a
cti
vit
ies
on
dry
win
dy d
ays
co
ns
ide
rin
g
mo
nit
ori
ng
in
form
ati
on
Ashton Coal Mine
Bengalla
Bloomfield Colliery
Camberwell (Integra Coal Open Cut)
Cullen Valley Mine
Cumnock No1 Colliery
Donaldson Coal Mine
Drayton Coal Mine
Glendell Mine, Mt Owen Mine, Ravensworth East
Hunter Valley Operations
Ivanhoe No.2 Colliery
Liddell Coal Operations
Mangoola (Anvil Hill) (UNDER CONSTRUCTION)
Moolarben Coal Mine
Mount Arthur Coal Mine
Mount Thorley Warkworth Operations
Muswellbrook Colliery Holding
Pine Dale Mine
Ravensworth Narama
Rix's Creek Colliery Holding
Saxonvale Colliery Holding
The Invincible Mine
Wambo Coal
Westside Mine
Wilpinjong Coal Pty Ltd
Proportion of total (%) 84 88 40 80 16 12 4 16 48

Katestone Environmental Pty Ltd KE1006953 OEH
June 2011
Page 241
12. Estimated Costs of Controlling Particulate Matter Emissions
from NSW Coal Mines
12.1 Overview
The costs associated with a range of best practice measures to control emissions of particulate matter have been estimated for a number of activities and emission sources, both individually by activity and in aggregate for the GMR. Information on the effectiveness of existing controls on emissions of particulate matter from GMR coal mines has been taken from the Coal Mines Emission Database (CMED). The cost of best practice measures that is detailed in the following sections has been combined with the uncontrolled emissions data from the CMED and the benefits detailed in Section 9 to quantify the total cost and benefits of implementing best practice emission controls at GMR coal mines. Costs and benefits of implementing best practice measures have been estimated for the following activities and emission sources that represent the majority of emissions from coal mines into the GMR airshed:
Unpaved haul roads
Wind erosion from overburden, coal stockpiles and other exposed areas
Trucks and loaders dumping coal to the ROM hopper
Trucks dumping coal to the ROM pad
Drilling
Graders
Draglines
Trucks and loaders dumping overburden
Bulldozers working on coal and overburden In the following analysis, the estimated cost of any major capital purchases that are associated with each best practice control measure have been annualised over a 10 year period. The cost and effectiveness of each of the best practice control measures was determined assuming that the best practice control measure replaces the current control measure. In a small number of cases, the current control measure for a particular activity at a particular mine that is recorded in the Coal Mines Emission Database was greater than the control measure that was determined to be best practice. In these cases the current control measure was assumed to remain in place and no additional cost was determined. Where possible and relevant, the cost of existing equipment was accounted for in the estimation of the cost of the best practice control measures. Additional costs relevant to the best practice control measures take into account the operating costs of the current control and assume that these will no longer be an ongoing cost. In Section 10.3, the particulate matter emission control metric was defined to measure the progress towards implementation of best practice control measures at mines in the GMR. The particulate matter emission control metric has been presented in the following sections to provide in indication of the existing level of controls of particulate emissions. Where relevant, costs were estimated based on the assumptions discussed in Section 12.3. The costs of the best practice control measures are compared with the costs of the existing control measures and the incremental costs to upgrade to best practice control measures are also presented.

Katestone Environmental Pty Ltd KE1006953 OEH
June 2011
Page 242
12.2 Limitations
In reading the information contained in the following sections, the following limitations in the study should be noted:
Particulate matter emission rates and the effectiveness of existing control measures and best practice control measures have been based on the information developed in this project and the information contained in the CMED. Where data were missing, an average value based on all current information was used.
Cost and benefits of the application of best practice control measures to the different mine activities are based on generalised assumptions about mine activities, costs and effectiveness of those control measures. The actual costs and effectiveness will be dependent on a number of site specific variables that need to be evaluated on a case by case basis.
The cost of each best practice control measure has been evaluated separately and independently of current control measures and other possible best practice control measures to provide an upper bound estimate of costs. In most circumstances, the effectiveness of a combination of control measures will be equal to or more effective than the effectiveness of individual control measures operating in isolation.
12.3 Input data and assumptions
12.3.1 Watering
Watering is one of the most common and effective ways of reducing particulate matter emissions from a number of coal mining activities. Diligent application of water has been identified as a best practice measure for many activities that emit particulate matter. Emissions of particulate matter have been demonstrated to be reduced by between 50% and 75%10 depending on the application and the rate of water use. The cost and potential reduction in particulate matter emissions using watering as a control measure on a number of mine activities has been estimated. Throughout this study, Level 1 watering represents the application of 2 litres of water per square metre per hour (2 L/m²/hour) and Level 2 watering is the application of >2 L/m²/hour. The cost of water has been estimated to be $1.70 per kL183. It is worth noting that most of the coal mines in the Hunter Valley that were visited during this study had excess water available through pre-drainage of old mine workings, the collection of stormwater in mine voids and wastewater from coal processing. Hence, applying the above cost for water is conservative and will overestimate the cost of this control measure. The costs associated with increasing the amount of water were quantified by taking into account additional resources required to achieve the watering level and operating costs. These include additional volume of water and truck operating costs (including fuel consumption and wages), which are assumed to be directly proportional to the amount of additional watering required (i.e. per square metre). Mines with Level 1 watering were assumed to increase watering to Level 2 watering, simply by doubling the watering rate. For haul roads and graders, the amount of water required for each mine is based on the vehicle kilometers travelled (VKT) by each water truck on unpaved roads and a typical haul road width of 30 metres. Diesel costs are based on the diesel consumption rates contained in the CMED and a cost of $1.17 per litre184. Wages for the additional labour required to make the additional number of trips are based on the total operating hours for each truck, using a standard of $50 per hour, inclusive of all service-related benefits such as

Katestone Environmental Pty Ltd KE1006953 OEH
June 2011
Page 243
allowances, superannuation expenses, and other miscellaneous benefits (Richard Hoskings, Managing Director, The Minserve Group Pty Ltd, pers. comm.). Where required, the costs of buying, maintaining and operating additional trucks were also included. Additional trucks were used where the demand on the current fleet could not be doubled, such as where the existing water truck is operating more than 12 hours per day. Doubling this would mean that the water truck would need to operate for more than 24 hours per day. The implementation of watering to reduce emissions due to wind erosion is dependent on the surface area, frequency, and the operational costs. On days when the rainfall exceeds 0.25 mm, watering is not applied. While watering is a relatively inexpensive and accessible form of emissions control, the benefits are short-term and water needs to be applied consistently and regularly.
12.3.2 Chemical suppressant
Chemical suppressants can provide a longer term and more durable reduction in emissions of particulate matter. Suppressants can be in the form of wetting agents, binding/agglomerating agents or crusting agents. Wetting agents are surfactant formulations that are soluble in water. Wetting agents reduce the surface tension of water, thus improving its ability to wet and agglomerate fine particles. Binding or agglomerating agents, on the other hand, provide a longer-term or residual control than water as these absorb and maintain surface moisture to keep the erodible material wet. These are also used when using water-based technologies are impractical. Chemical suppressants can also be in the form of crusting agents, which are essentially binding agents used for long-term surface stabilisation. Viscosity modifiers may be added to affect the rate and degree of liquid penetration into the bulk solid surface. While the cost of chemicals varies, a standard cost of $0.14 per square metre (L. Xavier, Vital Chemical Pty Ltd, 25 June 2010, pers. comm.) is used in this study. Mine water trucks are assumed to apply suppressant every two weeks (L. Xavier, Vital Chemical Pty Ltd, 25 June 2010, pers. comm.) travelling at a speed of 5 km/hr (conservatively estimated from CMED). Since the application of water serves to reactivate the suppressants, the cost of periodic watering is also included in the cost estimation for this control method.
12.3.3 Rehabilitation
Rehabilitation is one of the most common and effective control measures for reducing emissions of particulate matter from exposed areas prone to wind erosion. It is usually conducted by a rehabilitation expert and involves reshaping the land using small bulldozers and other equipment to spread stockpiled topsoil and reseed it. While effective, rehabilitation is not always a practical solution. For example, rehabilitation is not applied to mine areas where activities are still expected to take place. In addition to this, the effects of rehabilitation are not immediate and continuously progress from seeding to full development over the area to be vegetated. Depending on the type of plants, this process could take up to a few years. The reduction in the emission rate of particulate matter was assumed to be constant. The maximum reduction in particulate matter emissions (i.e. 99%10) is assumed from the time the area is rehabilitated with an estimated cost of $10,000 per hectare185.
Katestone Environmental Pty Ltd KE1006953 OEH
June 2011
Page 244
12.3.4 Hydraulic mulch seeding
Hydraulic mulch seeding, also known as hydro-seeding, hydro-mulch or spray-on grass, is another form of rehabilitation. The process allows the spreading of seed, mulch and fertiliser in one application. Hydraulic mulch seeding can use almost any seed including native species, trees and shrubs. A range of ingredients in various combinations, including wood fibre, hemp, paper pulp, sugar cane mulch and other natural and artificial fibres can be used as mulch. All the materials are mixed in tanks onsite and sprayed as slurry over areas to be re-vegetated directly from the truck (up to 30 metres) or through hoses (over 100 metres).
The estimated cost of applying hydraulic mulch seeding as an alternative means of rehabilitation is about three times greater than conventional seeding ($30,000 per hectare) (Amy Harburg, Bengalla Mine, 30 July 2010 pers. comm.). The expected benefit in reduction of particulate matter emissions due to wind erosion is 99%10, the same as for conventional rehabilitation. However, hydraulic mulch seeding provides a more flexible control measure than rehabilitation. The benefit of hydraulic mulch seeding is immediate, as the binder cures within a few hours and sets to form a stable, porous matrix, protecting the surface from erosion until vegetation is established. Applying the mulch in water helps it conform to irregularities in the ground, providing close soil contact and erosion protection.
12.3.5 Enclosures and windbreaks
Enclosures and windbreaks around areas where activities produce a large volume of particulate matter can control emissions by 70%150. Windbreaks slow the speed of the wind as it passes over the erodible surface. The best windbreaks produce a zone behind the windbreak that reduces the incident wind to a quarter of its speed. For a 15 metre high windbreak this zone will extend about 70 metres downwind. From 70 metres to 150 metres the wind speed will increase up to about half that of the incident wind. The windbreak loses its effectiveness beyond about 150 metres. Natural windbreaks, such as trees and shrubs which are planted to provide shelter from the wind, are used to prevent wind erosion and also provide improved amenity. However, these do not provide the immediate impact and flexibility that man-made windbreaks can provide. To estimate costs, the related capital expenditure and ongoing maintenance for a non-metallic screening material was approximated based on the size of the area to be enclosed. All areas were assumed to be square for the purpose of determining the size of the windbreak. The cost per lineal metre was based on the costs estimated by Connell Hatch for the RG Tanna Coal Terminal153, with an estimated cost of $10M for a 4 km long enclosure and an ongoing annual operating cost of 7% of the capital cost. The estimated cost of this enclosure is based on a shade-cloth type of material. To estimate the cost of a metal fabricated enclosure for the ROM hopper, the cost per lineal metre was multiplied by five153.
12.3.6 Conveyors
Trucks travelling on unpaved roads carrying coal and overburden are the major source of particulate matter emissions at coal mines. The cost associated with using an alternative transport method has been estimated and the potential reduction in particulate matter emissions has been quantified. Conveyors have significantly lower emission rates of particulate matter than haul trucks travelling on unpaved roads. However, conveyors are semi-permanent or permanent fixtures

Katestone Environmental Pty Ltd KE1006953 OEH
June 2011
Page 245
that are not as easy to move as haul roads with the progression of the pit. Conveyors also require a higher initial capital outlay than do haul trucks. To provide a case study of the use of conveyors, half of the haul road from the pit to the ROM pad or overburden dump was assumed to be converted to conveyors. The length of the haul road has been calculated from the information contained in the CMED, including the haul truck capacity, VKT of each haul truck, and the mass of ROM coal and overburden transported. The number of trips per day for each haul truck is based on the apportionment of the annual load transported (ROM and overburden) and the capacity. The cost of a conveyor is estimated at $4,000 per metre (pers. comm. Richard Hoskings, Managing Director, The Minserve Group Pty Ltd). Emissions of particulate matter were assumed to be reduced by 95% (see Section 9.2) when transporting ROM coal by conveyor. Emissions from transporting overburden and ROM coal by haul trucks on the remaining length of the haul road were added to this.
12.3.7 Haul trucks and equipment
Particulate matter emissions are proportional to the vehicle kilometres travelled (VKT) by haul trucks (i.e. lower VKT will result in a lower emission rate of particulate matter). Using larger capacity haul trucks can reduce the number of trips required to transport the same amount of material. Therefore, overall emissions can be reduced by replacing smaller capacity trucks with larger ones. Data on the current fleet of haul trucks for each mine are contained in the CMED. In this scenario, trucks with less than 90 tonne capacity are replaced with the CAT 777, with a capacity of 90 tonnes and an estimated cost of $2M (Matt Wood, Hastings Deering (Australia) Ltd, 25 August 2010, pers. comm.). Trucks with capacities from 90 tonnes to 190 tonnes are replaced with the LIEBHERR T282, which has the largest capacity in the current vehicle inventory and an estimated cost of $5M. Trucks that have capacities greater than 190 tonnes are assumed to remain the same. The reduced number of haul trucks required to transport the same amount of material is calculated as a direct proportion of the replacement truck‟s and the original truck‟s capacities. The hours of operation of each truck in the fleet were assumed to remain the same. The estimated costs associated with using larger capacity haul trucks is assumed to be the difference between the total purchase price of the new fleet compared to the existing fleet. Truck costs are detailed in Table 128. Table 128 also shows the annual operating costs of trucks used in this assessment. Prices for Caterpillar equipment are based on data supplied by Hastings Deering (Australia) Ltd (Matt Wood, Hastings Deering (Australia) Ltd, 25 August 2010 and 20 September 2010 pers. comm.). Data for trucks by other manufacturers are interpolated from known truck costs (Table 128) and assumed to be proportional to the engine size.

Katestone Environmental Pty Ltd KE1006953 OEH
June 2011
Page 246
Table 128 Estimated purchase and operating costs of haul trucks and equipment
Truck Purchase Cost Annual Operating Cost
CAT 769a $1,706,204 $18,636
CAT 773a $1,200,000 $18,910
CAT 777b $1,924,789 $20,632
CAT 789b $3,218,382 $41,226
EUCLID R100 $1,200,000 $18,910
FORD LN9000 $1,706,204 $18,636
KOMATSU HD 785-3 $1,200,000 $18,910
VOLVO F724 $1,706,204 $18,636
Unidentified Water Truck $1,849,875 $23,663
Note: a Price estimated based on similarity in engine size to the Euclid water truck with a known price of
$1,200,000 b Purchase and Operational Cost provided by Hastings Deering
Wheel-generated emissions of particulate matter not attributed to haul trucks are relatively small and were assumed to remain the same.
12.3.8 Fabric filters – ROM hopper and drilling
Fabric filters can reduce the emission rate of particulate matter by 99%154. The source of emissions needs to be effectively enclosed so that particulate matter can be entrained in a stream of air and passed through the fabric filter. Bags have been assumed to be cleaned using mechanical shakers. Costs for the use of fabric filters to reduce emissions of particulate matter from drilling and dumping into the ROM hoppers have been estimated using the information contained in AirControlNet186. The highest value in the range of US$303 (1998 dollar value) per tonne reduction of PM10 emissions has been used. The net present value to 2010 was calculated assuming an inflation rate of 4% amortised quarterly.
12.4 Application of best practice controls by source or activity
12.4.1 Haul roads
While not all mines included in the assessment emit substantial amounts of particulate matter from haul trucks travelling on unpaved roads, for 36 mines this is the most significant source of TSP (53%) and PM10 (39%) emissions and the second largest source of emissions of PM2.5 (23%). All mines in the GMR implement watering controls using water trucks. Twenty-four mines employ Level 1 watering (2 L/m²/hour) and, hence, achieve a 50% control of emissions. The remaining twelve mines use Level 2 watering (greater than 2 L/m²/hour) and achieve 75% control of emissions. Emissions due to vehicles travelling on unpaved roads can be minimised by implementing watering controls, applying suppressant, alternative transport methods (such as conveyors) or by reducing the number of trips required to transport material through the use of larger trucks. The costs associated with each of these control measures have been estimated and are represented in Figure 59, where current emissions are the sum of the grey area (emission reduction for the subject activity), red area (emission remaining for the subject activity) and dark blue area (emission from activities other than the subject activity). The cost per tonne of particulate matter reduced is shown at the top of each stacked column.

Katestone Environmental Pty Ltd KE1006953 OEH
June 2011
Page 247
Figure 59 shows that the particulate matter generated by haul trucks travelling on unpaved roads is almost equivalent to the emissions from all other activities at GMR coal mines. Hence, a significant reduction in wheel-generated particulate matter will also significantly reduce aggregate GMR coal mine emissions. Figure 59 also shows that the greatest reduction in emissions would be achieved by the application of suppressants in conjunction with level 2 watering. A slightly smaller reduction would be achieved by the conversion of half of the haul roads to conveyors at less than half the cost. The most cost-effective control measure would be the replacement of the current fleet with larger-capacity vehicles, which is shown not to incur any additional costs, but instead produces a significant cost saving due to the reduction in the number of vehicles required to be purchased, as well as reduced operating costs. Total emission reduction for this control measure is comparable to implementing Level 2 Watering, but less than employing alternative methods of transportation.
Figure 59 Reduction in emissions and associated costs (per tonne) to implement
control options on haul roads

Katestone Environmental Pty Ltd KE1006953 OEH
June 2011
Page 248
12.4.2 Wind erosion
Exposed areas are prone to wind erosion. The CMED categorises these areas as overburden dumps, coal stockpiles or other exposed areas.
12.4.2.1 Overburden emplacements
Within the GMR, wind erosion of overburden dumps is a significant source of particulate matter emissions from coal mines. There are 30 mines that have wind erosion emissions, contributing 27% to the total GMR emissions of PM10. The number of mines implementing control measures is presented in Table 129. Mines implementing more than one control are counted separately in the table. There are 7 mines where the CMED records no control measures, while 23 mines in the GMR are recorded as implementing at least one or a combination of control measures.
Table 129 Control measures for mines with overburden emplacement emissions
Control Measure Reduction (%) Number of mines
Full Rehabilitation 99 11
Partial rehabilitation varies 7
Enclosure 70 1
Level 2 Watering 75 2
Level 1 Watering
50 11
No Control 0 7
Emissions of particulate matter associated with wind erosion of overburden dumps can be reduced by rehabilitation, watering or by enclosing the exposed areas. The methodology used to estimate the costs and the reduction in emissions for the implementation of Level 1 and Level 2 watering are discussed in detail in Section 12.3.1. Estimation of the costs and emissions for rehabilitation and enclosures are discussed in Sections 12.3.3 and 12.3.5, respectively. The results of these assessments are presented in Figure 60, where current emissions are the sum of the grey area (emission reduction for the subject activity), red area (emission remaining for the subject activity) and dark blue area (emission from activities other than the subject activity). Rehabilitation of 80% of the exposed areas show the highest level of reduction, with a cost per tonne reduction in the lower range of the costs of all the control measures considered.

Katestone Environmental Pty Ltd KE1006953 OEH
June 2011
Page 249
Figure 60 Reduction in emissions and associated costs (per tonne) to implement
control options on overburden emplacements
12.4.2.2 Coal stockpiles
Wind erosion of coal stockpiles contributes approximately 2% of emissions to the aggregate GMR coal mine emissions of PM10. Table 130 presents the current control measures implemented by the mines to mitigate emissions associated with wind erosion of coal stockpiles. There are 52 mines in the CMED that emit PM10 from coal stockpiles, with most of the mines implementing some form of emissions control to reduce the emissions, the most common of which is Level 1 watering, which is implemented by 38 mines.
Table 130 Control measures for mines with coal stockpile emissions
Control Measure Reduction (%) Number of mines
Suppressant 95 1
Enclosure 70 2
Level 1 Watering 50 38
Unidentified Control (25% Reduction)
25 2
No Control 0 11
Costs and associated reductions in emissions were estimated for the application of suppressants, Level 1 and Level 2 watering, and the construction of an enclosure. The methodology used to estimate the costs and emissions are discussed in more detail in Section 12.2. The results are presented in Figure 61, showing that the application of chemical suppressants significantly reduces the emissions at a cost of approximately $29,000 per tonne of PM10. Current emissions are the sum of the grey area (emission reduction for the subject activity), red area (emission remaining for the subject activity) and dark blue area (emission from activities other than the subject activity).

Katestone Environmental Pty Ltd KE1006953 OEH
June 2011
Page 250
Figure 61 Reduction in emissions and associated costs (per tonne) to implement
control options on coal stockpiles
12.4.2.3 Exposed areas
Twelve mines in the GMR have reported emissions associated with wind erosion from exposed areas. Wind erosion of these areas is a function of the size of the exposed area, silt content, number of rainfall days and frequency of wind speeds greater than 5.4 m/s. Table 131 presents the control measures implemented by the mines to mitigate emissions from wind erosion of exposed areas.
Table 131 Control measures for mines with exposed area emissions
Control Measure Reduction (%) Number of mines
Partial Rehabilitation Varies 3
Enclosure 70 2
Level 1 Watering
50 2
No Control 0 6
The methodology used to estimate the costs and emissions are discussed in Section 12.2. The results are shown in Figure 62, showing an estimated saving of $2,000 by the implementation of full rehabilitation in place of current control measures, namely watering. Current emissions are the sum of the grey area (emission reduction for the subject activity), red area (emission remaining for the subject activity) and dark blue area (emission from activities other than the subject activity).
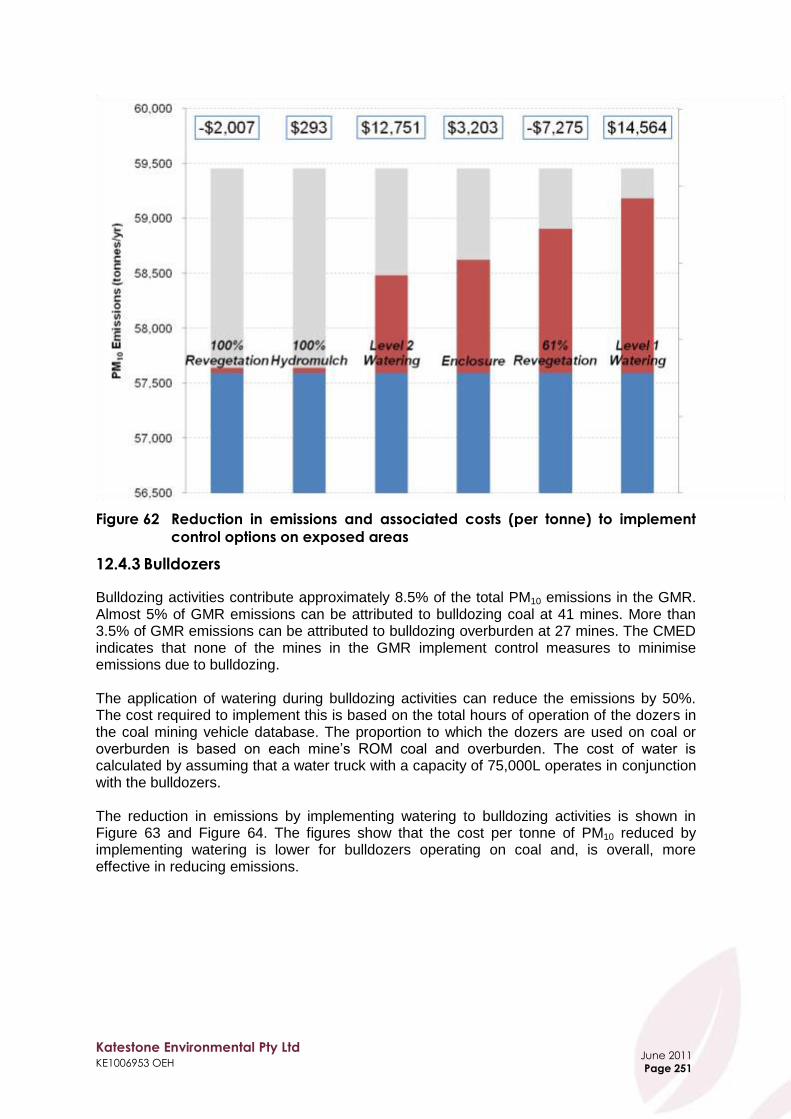
Katestone Environmental Pty Ltd KE1006953 OEH
June 2011
Page 251
Figure 62 Reduction in emissions and associated costs (per tonne) to implement
control options on exposed areas
12.4.3 Bulldozers
Bulldozing activities contribute approximately 8.5% of the total PM10 emissions in the GMR. Almost 5% of GMR emissions can be attributed to bulldozing coal at 41 mines. More than 3.5% of GMR emissions can be attributed to bulldozing overburden at 27 mines. The CMED indicates that none of the mines in the GMR implement control measures to minimise emissions due to bulldozing. The application of watering during bulldozing activities can reduce the emissions by 50%. The cost required to implement this is based on the total hours of operation of the dozers in the coal mining vehicle database. The proportion to which the dozers are used on coal or overburden is based on each mine‟s ROM coal and overburden. The cost of water is calculated by assuming that a water truck with a capacity of 75,000L operates in conjunction with the bulldozers. The reduction in emissions by implementing watering to bulldozing activities is shown in Figure 63 and Figure 64. The figures show that the cost per tonne of PM10 reduced by implementing watering is lower for bulldozers operating on coal and, is overall, more effective in reducing emissions.

Katestone Environmental Pty Ltd KE1006953 OEH
June 2011
Page 252
Figure 63 Reduction in emissions and associated costs (per tonne) to implement
watering on bulldozing coal

Katestone Environmental Pty Ltd KE1006953 OEH
June 2011
Page 253
Figure 64 Reduction in emissions and associated costs (per tonne) to implement
watering on bulldozing overburden
12.4.4 Trucks dumping coal to the ROM hopper
Trucks dumping coal to the ROM hopper contribute less than 1% to the total emissions of PM10 from coal mines in the GMR. The number of mines implementing control measures is shown in Table 132, with most of the mines not implementing any form of control measure to minimise emissions. The costs and reductions in emissions achieved by the use of enclosure and fabric filters, water sprays and enclosure, and water sprays alone were estimated.
Table 132 Control measures for mines with emissions from trucks dumping coal to
the ROM hopper
Control Measure Reduction (%) Number of mines
Unidentified Control (75% reduction) 75 1
Water Sprays + Enclosure 70 6
Water Sprays 50 6
No Control 0 20
The ROM hopper is assumed to be a 9m x 3m area, and the enclosure required is estimated to be double this size. Structural costs for the enclosure and water sprays take into account the existing structures. Water sprays were estimated to cost $200,000, and the enclosures are estimated based on the discussion in Section 12.3.5. The water sprays are assumed to be activated for 2 minutes while the trucks are dumping the coal at a rate of 2 L/m2/hr for each dump. The total number of trips is based on data provided in the CMED.
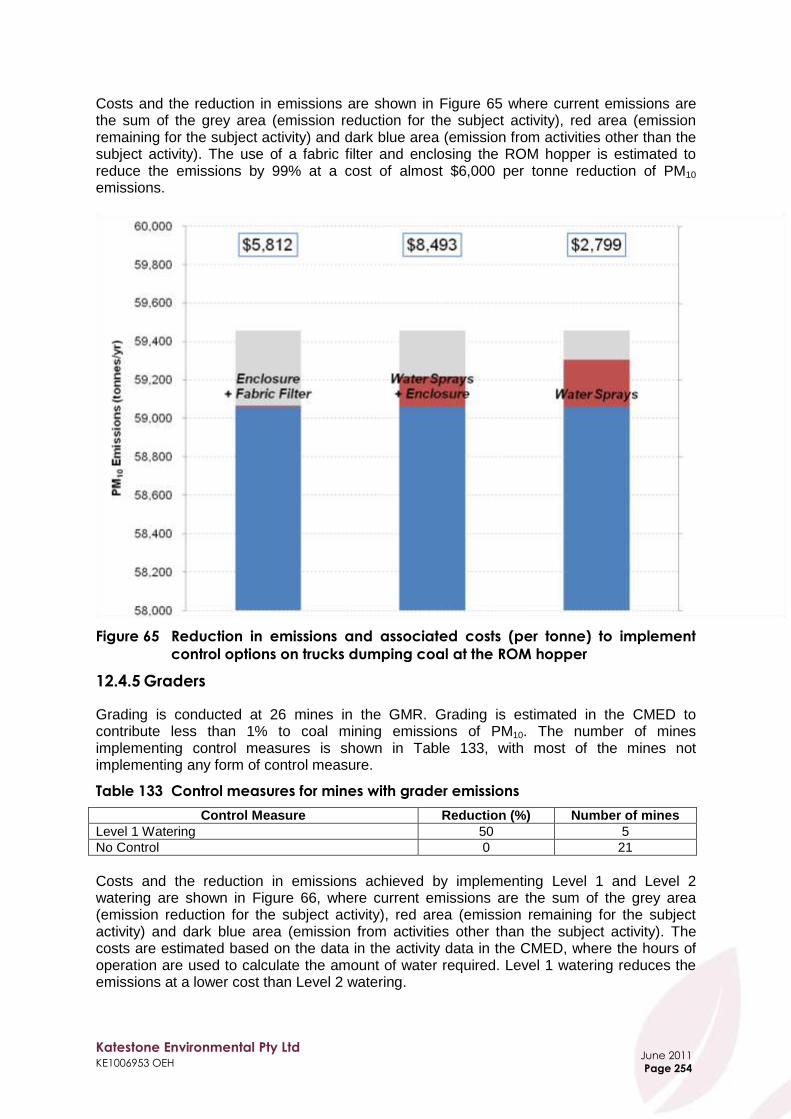
Katestone Environmental Pty Ltd KE1006953 OEH
June 2011
Page 254
Costs and the reduction in emissions are shown in Figure 65 where current emissions are the sum of the grey area (emission reduction for the subject activity), red area (emission remaining for the subject activity) and dark blue area (emission from activities other than the subject activity). The use of a fabric filter and enclosing the ROM hopper is estimated to reduce the emissions by 99% at a cost of almost $6,000 per tonne reduction of PM10 emissions.
Figure 65 Reduction in emissions and associated costs (per tonne) to implement
control options on trucks dumping coal at the ROM hopper
12.4.5 Graders
Grading is conducted at 26 mines in the GMR. Grading is estimated in the CMED to contribute less than 1% to coal mining emissions of PM10. The number of mines implementing control measures is shown in Table 133, with most of the mines not implementing any form of control measure.
Table 133 Control measures for mines with grader emissions
Control Measure Reduction (%) Number of mines
Level 1 Watering 50 5
No Control 0 21
Costs and the reduction in emissions achieved by implementing Level 1 and Level 2 watering are shown in Figure 66, where current emissions are the sum of the grey area (emission reduction for the subject activity), red area (emission remaining for the subject activity) and dark blue area (emission from activities other than the subject activity). The costs are estimated based on the data in the activity data in the CMED, where the hours of operation are used to calculate the amount of water required. Level 1 watering reduces the emissions at a lower cost than Level 2 watering.
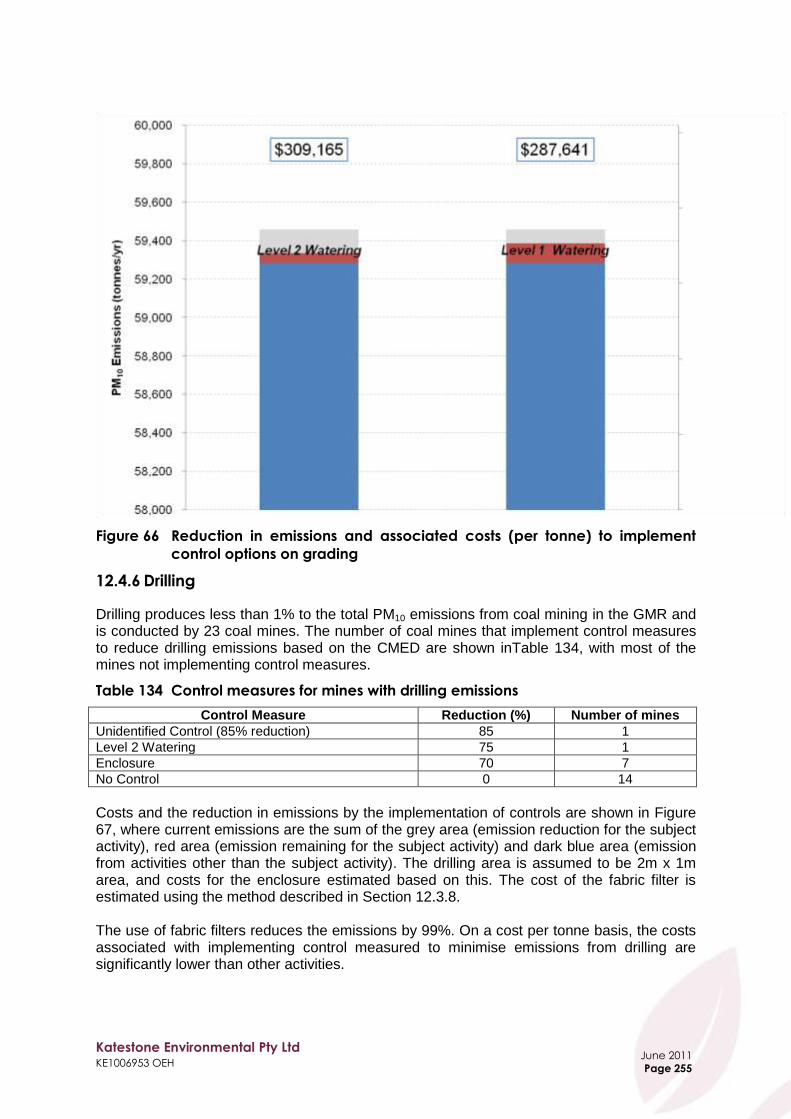
Katestone Environmental Pty Ltd KE1006953 OEH
June 2011
Page 255
Figure 66 Reduction in emissions and associated costs (per tonne) to implement
control options on grading
12.4.6 Drilling
Drilling produces less than 1% to the total PM10 emissions from coal mining in the GMR and is conducted by 23 coal mines. The number of coal mines that implement control measures to reduce drilling emissions based on the CMED are shown inTable 134, with most of the mines not implementing control measures.
Table 134 Control measures for mines with drilling emissions
Control Measure Reduction (%) Number of mines
Unidentified Control (85% reduction) 85 1
Level 2 Watering 75 1
Enclosure
70 7
No Control 0 14
Costs and the reduction in emissions by the implementation of controls are shown in Figure 67, where current emissions are the sum of the grey area (emission reduction for the subject activity), red area (emission remaining for the subject activity) and dark blue area (emission from activities other than the subject activity). The drilling area is assumed to be 2m x 1m area, and costs for the enclosure estimated based on this. The cost of the fabric filter is estimated using the method described in Section 12.3.8. The use of fabric filters reduces the emissions by 99%. On a cost per tonne basis, the costs associated with implementing control measured to minimise emissions from drilling are significantly lower than other activities.
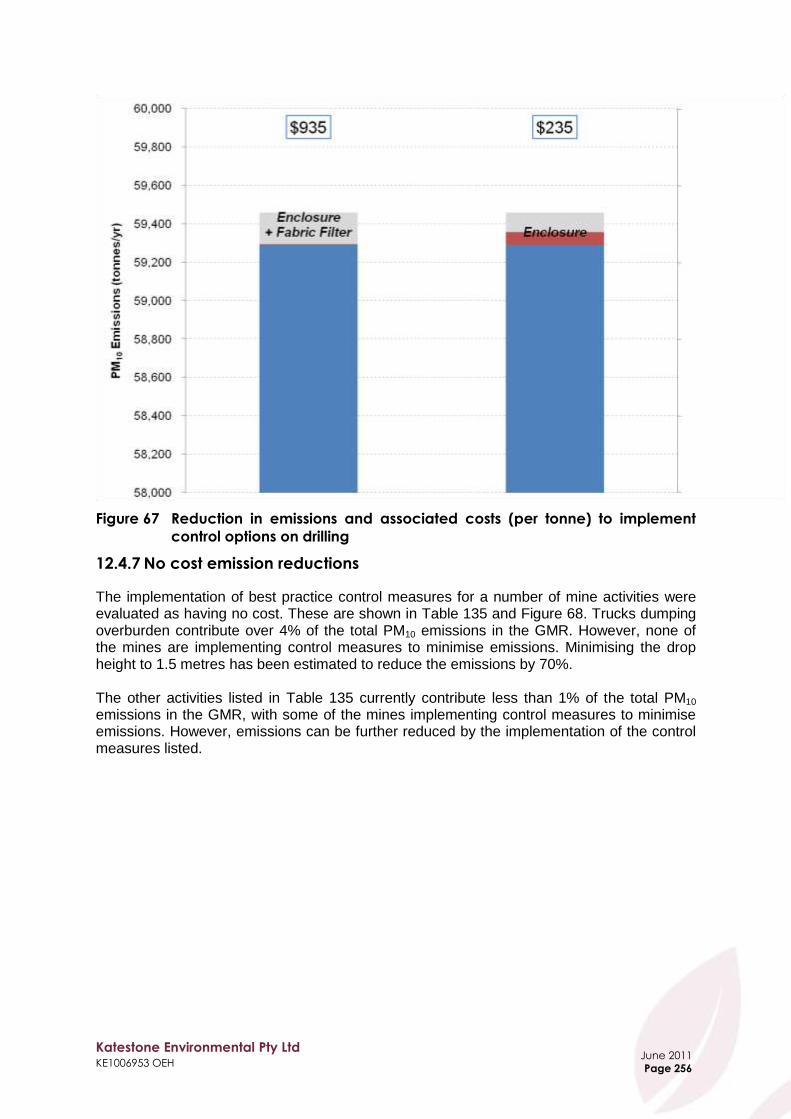
Katestone Environmental Pty Ltd KE1006953 OEH
June 2011
Page 256
Figure 67 Reduction in emissions and associated costs (per tonne) to implement
control options on drilling
12.4.7 No cost emission reductions
The implementation of best practice control measures for a number of mine activities were evaluated as having no cost. These are shown in Table 135 and Figure 68. Trucks dumping overburden contribute over 4% of the total PM10 emissions in the GMR. However, none of the mines are implementing control measures to minimise emissions. Minimising the drop height to 1.5 metres has been estimated to reduce the emissions by 70%. The other activities listed in Table 135 currently contribute less than 1% of the total PM10 emissions in the GMR, with some of the mines implementing control measures to minimise emissions. However, emissions can be further reduced by the implementation of the control measures listed.

Katestone Environmental Pty Ltd KE1006953 OEH
June 2011
Page 257
Table 135 No cost emission reductions, reduction in emissions to implement best
practice control measures
Activity Best Practice
Control Option Source Metric
Current Emissions
(tonnes/year)
Reduced Emissions
(tonnes/year)
Trucks (dumping overburden) Minimise drop height 0% 2,512 776
Loaders (coal) Watering 15% 2,198 1,008
Unloading from stockpiles (coal) Watering 39% 1,092 407
Dragline (Other) Minimise drop height 93% 924 74
Loading stockpiles (coal) Watering 27% 245 102
Material transfer (coal) Enclosure 70% 37 15
Loading trains (coal) Level 2 Watering 29% 15 10
Figure 68 No cost emission reductions, reduction in emissions to implement best
practice control measures
12.4.8 Emission reductions not assessed
Mine activities where no control measures were evaluated are summarised below:
Blasting
Coal crushing (controlled wet suppression)
Internal Combustion Engine (Diesel, P>450kW)
Scrapers (overburden)
Internal Combustion Engine (Diesel, P<450kW)
Flares (natural gas, coal seam methane, landfill gas)
Screening
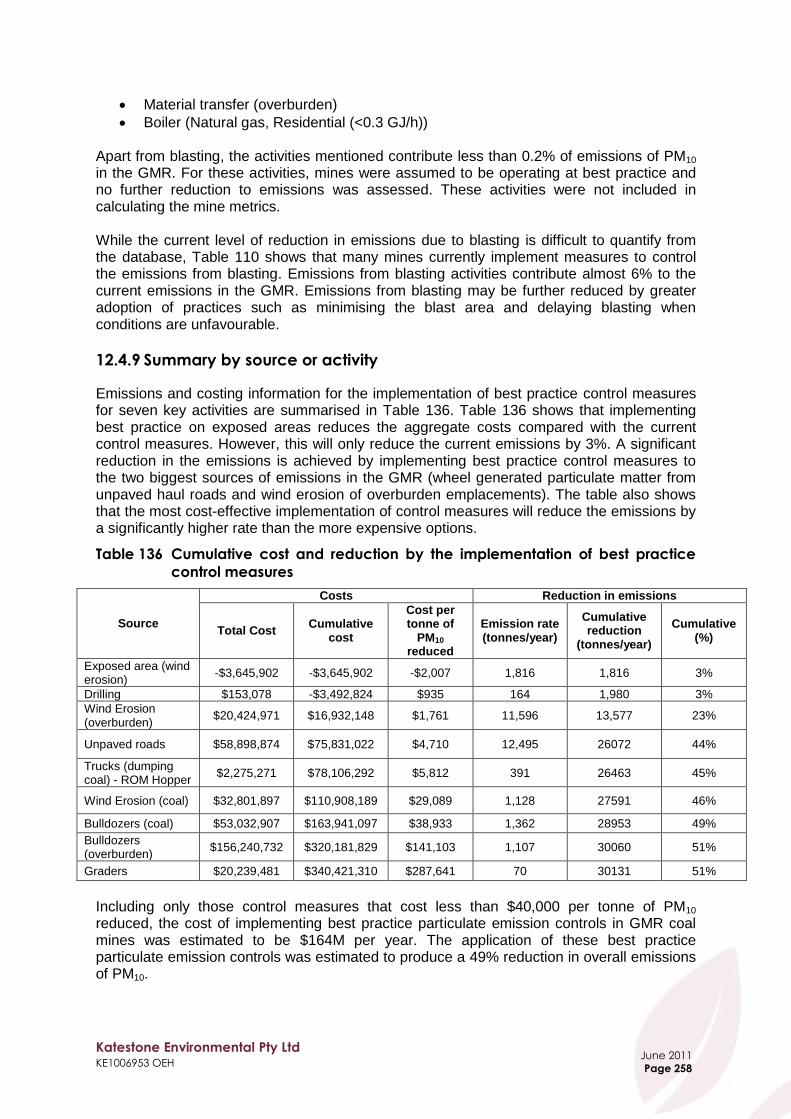
Katestone Environmental Pty Ltd KE1006953 OEH
June 2011
Page 258
Material transfer (overburden)
Boiler (Natural gas, Residential (<0.3 GJ/h)) Apart from blasting, the activities mentioned contribute less than 0.2% of emissions of PM10 in the GMR. For these activities, mines were assumed to be operating at best practice and no further reduction to emissions was assessed. These activities were not included in calculating the mine metrics. While the current level of reduction in emissions due to blasting is difficult to quantify from the database, Table 110 shows that many mines currently implement measures to control the emissions from blasting. Emissions from blasting activities contribute almost 6% to the current emissions in the GMR. Emissions from blasting may be further reduced by greater adoption of practices such as minimising the blast area and delaying blasting when conditions are unfavourable.
12.4.9 Summary by source or activity
Emissions and costing information for the implementation of best practice control measures for seven key activities are summarised in Table 136. Table 136 shows that implementing best practice on exposed areas reduces the aggregate costs compared with the current control measures. However, this will only reduce the current emissions by 3%. A significant reduction in the emissions is achieved by implementing best practice control measures to the two biggest sources of emissions in the GMR (wheel generated particulate matter from unpaved haul roads and wind erosion of overburden emplacements). The table also shows that the most cost-effective implementation of control measures will reduce the emissions by a significantly higher rate than the more expensive options.
Table 136 Cumulative cost and reduction by the implementation of best practice
control measures
Source
Costs Reduction in emissions
Total Cost Cumulative
cost
Cost per tonne of
PM10 reduced
Emission rate (tonnes/year)
Cumulative reduction
(tonnes/year)
Cumulative (%)
Exposed area (wind erosion)
-$3,645,902 -$3,645,902 -$2,007 1,816 1,816 3%
Drilling $153,078 -$3,492,824 $935 164 1,980 3%
Wind Erosion (overburden)
$20,424,971 $16,932,148 $1,761 11,596 13,577 23%
Unpaved roads $58,898,874 $75,831,022 $4,710 12,495 26072 44%
Trucks (dumping coal) - ROM Hopper
$2,275,271 $78,106,292 $5,812 391 26463 45%
Wind Erosion (coal) $32,801,897 $110,908,189 $29,089 1,128 27591 46%
Bulldozers (coal) $53,032,907 $163,941,097 $38,933 1,362 28953 49%
Bulldozers (overburden)
$156,240,732 $320,181,829 $141,103 1,107 30060 51%
Graders $20,239,481 $340,421,310 $287,641 70 30131 51%
Including only those control measures that cost less than $40,000 per tonne of PM10 reduced, the cost of implementing best practice particulate emission controls in GMR coal mines was estimated to be $164M per year. The application of these best practice particulate emission controls was estimated to produce a 49% reduction in overall emissions of PM10.

Katestone Environmental Pty Ltd KE1006953 OEH
June 2011
Page 259
12.5 Aggregated costs by activity and premises for the GMR
Table 137 shows the current emission rates of PM10 and particulate matter emission control metrics for various sources of particulate matter at GMR coal mines, as well as the resultant emissions and reduction in emissions of PM10 achieved by the implementation of best practice control measures. As shown in Table 137, a significant portion of the current emissions can be reduced by the implementation of chemical suppressants to haul roads and rehabilitation of 81% of overburden emplacements. This is also graphically represented in Figure 69, showing the relevant costs per tonne reduction of emissions for each activity where possible. Emissions and costs to implement best practice control measures for the individual mines are presented in Table 138 and Figure 70, showing the significant reduction in emissions can be achieved by the implementation of best practice control measures to significant sources of PM10 emissions in the GMR.
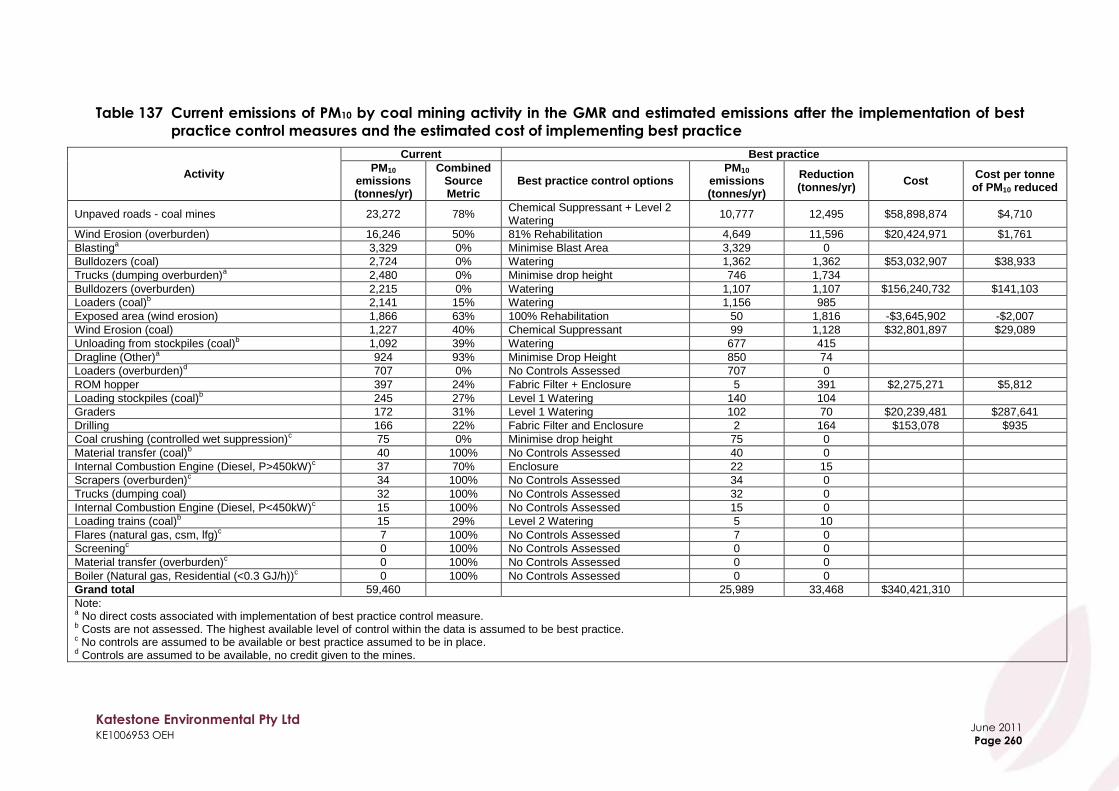
Katestone Environmental Pty Ltd KE1006953 OEH
June 2011
Page 260
Table 137 Current emissions of PM10 by coal mining activity in the GMR and estimated emissions after the implementation of best
practice control measures and the estimated cost of implementing best practice
Activity
Current Best practice
PM10 emissions (tonnes/yr)
Combined Source Metric
Best practice control options PM10
emissions (tonnes/yr)
Reduction (tonnes/yr)
Cost Cost per tonne
of PM10 reduced
Unpaved roads - coal mines 23,272 78% Chemical Suppressant + Level 2 Watering
10,777 12,495 $58,898,874 $4,710
Wind Erosion (overburden) 16,246 50% 81% Rehabilitation 4,649 11,596 $20,424,971 $1,761
Blastinga 3,329 0% Minimise Blast Area 3,329 0
Bulldozers (coal) 2,724 0% Watering 1,362 1,362 $53,032,907 $38,933
Trucks (dumping overburden)a 2,480 0% Minimise drop height 746 1,734
Bulldozers (overburden) 2,215 0% Watering 1,107 1,107 $156,240,732 $141,103
Loaders (coal)b 2,141 15% Watering 1,156 985
Exposed area (wind erosion) 1,866 63% 100% Rehabilitation 50 1,816 -$3,645,902 -$2,007
Wind Erosion (coal) 1,227 40% Chemical Suppressant 99 1,128 $32,801,897 $29,089
Unloading from stockpiles (coal)b 1,092 39% Watering 677 415
Dragline (Other)a 924 93% Minimise Drop Height 850 74
Loaders (overburden)d 707 0% No Controls Assessed 707 0
ROM hopper 397 24% Fabric Filter + Enclosure 5 391 $2,275,271 $5,812
Loading stockpiles (coal)b 245 27% Level 1 Watering 140 104
Graders 172 31% Level 1 Watering 102 70 $20,239,481 $287,641
Drilling 166 22% Fabric Filter and Enclosure 2 164 $153,078 $935
Coal crushing (controlled wet suppression)c 75 0% Minimise drop height 75 0
Material transfer (coal)b 40 100% No Controls Assessed 40 0
Internal Combustion Engine (Diesel, P>450kW)c 37 70% Enclosure 22 15
Scrapers (overburden)c 34 100% No Controls Assessed 34 0
Trucks (dumping coal) 32 100% No Controls Assessed 32 0
Internal Combustion Engine (Diesel, P<450kW)c 15 100% No Controls Assessed 15 0
Loading trains (coal)b 15 29% Level 2 Watering 5 10
Flares (natural gas, csm, lfg)c 7 100% No Controls Assessed 7 0
Screeningc 0 100% No Controls Assessed 0 0
Material transfer (overburden)c 0 100% No Controls Assessed 0 0
Boiler (Natural gas, Residential (<0.3 GJ/h))c 0 100% No Controls Assessed 0 0
Grand total 59,460 25,989 33,468 $340,421,310
Note: a No direct costs associated with implementation of best practice control measure. b Costs are not assessed. The highest available level of control within the data is assumed to be best practice. c No controls are assumed to be available or best practice assumed to be in place. d Controls are assumed to be available, no credit given to the mines.

Katestone Environmental Pty Ltd KE1006953 OEH
June 2011
Page 261
Figure 69 Reduction in PM10 emissions and associated costs (per tonne) to implement control options by mine activity

Katestone Environmental Pty Ltd KE1006953 OEH
June 2011
Page 262
Table 138 Current emissions of PM10 by coal mine in the GMR and estimated emissions after the implementation of best practice
control measures and the estimated cost of implementing best practice
Activity
Current Best Practice
PM10 emissions (tonnes/yr)
Source Metric
PM10 emissions (tonnes/yr)
Reduction (tonnes/yr)
Cost to implement
Cost per tonne of PM10 reduced
HUNTER VALLEY OPERATIONS 11,633 51% 4,564 7,069 $38,407,787 $5,433
MT ARTHUR NORTH COAL MINE 7,524 71% 3,373 4,151 $44,389,466 $10,693
SAXONVALE COLLIERY HOLDING 4,653 54% 2,096 2,557 $17,071,653 $6,676
WARKWORTH COAL MINE 3,494 94% 2,071 1,423 $21,831,420 $15,337
MT OWEN COAL MINE 2,859 51% 1,142 1,717 $12,641,210 $7,364
CAMBERWELL COAL MINE 2,727 49% 910 1,817 $21,616,534 $11,897
LIDDELL COAL OPERATIONS 2,660 53% 1,102 1,558 $4,814,914 $3,090
DRAYTON COAL MINE 2,497 67% 1,202 1,295 $27,629,709 $21,328
WAMBO COAL PTY LTD 2,166 67% 825 1,341 $12,647,437 $9,434
BENGALLA MINE 2,098 73% 942 1,156 $4,329,712 $3,747
MOUNT THORLEY OPERATIONS 1,958 3% 429 1,529 $1,936,992 $1,267
RAVENSWORTH/NARAMA MINE 1,816 58% 842 974 $6,643,232 $6,819
WILPINJONG COAL PTY LTD 1,757 58% 776 981 $23,018,174 $23,473
RAVENSWORTH EAST MINE 1,704 61% 906 798 $7,713,872 $9,668
MUSWELLBROOK COLLIERY HOLDING 1,274 50% 635 639 $9,669,461 $15,138
CUMNOCK NO. 1 COLLIERY 1,120 51% 384 736 $5,826,841 $7,914
ASHTON COAL MINE 1,095 65% 522 573 $8,982,718 $15,671
GLENDELL MINE 1,063 59% 568 495 $4,625,755 $9,338
RIX'S CREEK COLLIERY 833 94% 685 148 $5,331,295 $36,008
DONALDSON COAL PTY LTD 596 52% 196 400 $3,370,748 $8,434
BLOOMFIELD COLLIERY 505 92% 404 101 $4,405,657 $43,580
WESTSIDE MINE 415 33% 157 257 $2,918,797 $11,337
WESTCLIFF AND NORTHCLIFF COLLIERIES 268 49% 151 117 $3,903,177 $33,317
BAAL BONE COLLIERY 268 44% 58 210 $2,633,866 $12,520
CULLEN VALLEY MINE 248 39% 98 149 $3,788,083 $25,350
BAYSWATER COLLIERY 234 25% 70 164 $3,436,392 $21,007
NEWSTAN COLLIERY 204 38% 88 116 $2,101,702 $18,111
PINE DALE MINE 204 57% 83 120 $3,611,796 $30,009
RAVENSWORTH UNDERGROUND MINE 204 77% 88 115 $3,209,467 $27,859
THE INVINCIBLE COLLIERY 157 35% 58 99 $3,647,879 $36,690
UNITED COLLIERY 155 66% 82 73 $2,053,087 $28,130
MACQUARIE COAL PREPARATION PLANT 140 66% 41 98 $4,013,292 $40,780
SPRINGVALE COLLIERY 110 5% 42 68 $952,049 $13,971
GLENNIES CREEK COLLIERY 98 78% 37 61 $1,770,822 $29,266
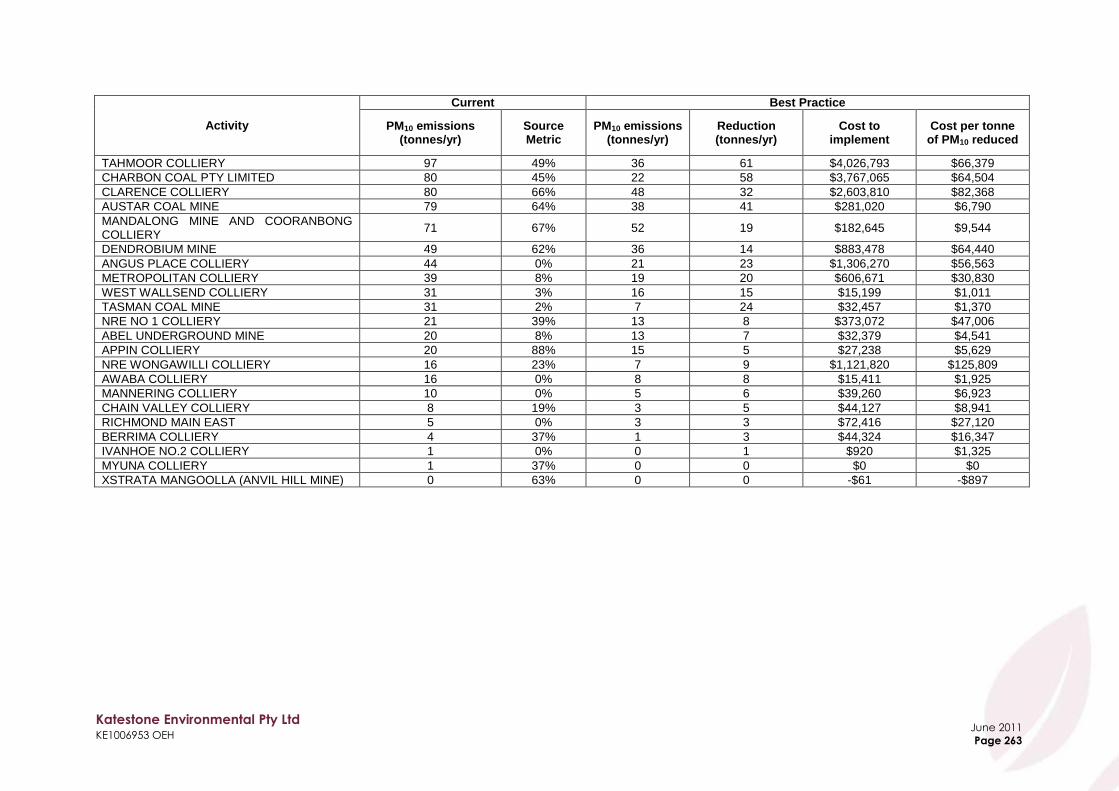
Katestone Environmental Pty Ltd KE1006953 OEH
June 2011
Page 263
Activity
Current Best Practice
PM10 emissions (tonnes/yr)
Source Metric
PM10 emissions (tonnes/yr)
Reduction (tonnes/yr)
Cost to implement
Cost per tonne of PM10 reduced
TAHMOOR COLLIERY 97 49% 36 61 $4,026,793 $66,379
CHARBON COAL PTY LIMITED 80 45% 22 58 $3,767,065 $64,504
CLARENCE COLLIERY 80 66% 48 32 $2,603,810 $82,368
AUSTAR COAL MINE 79 64% 38 41 $281,020 $6,790
MANDALONG MINE AND COORANBONG COLLIERY
71 67% 52 19 $182,645 $9,544
DENDROBIUM MINE 49 62% 36 14 $883,478 $64,440
ANGUS PLACE COLLIERY 44 0% 21 23 $1,306,270 $56,563
METROPOLITAN COLLIERY 39 8% 19 20 $606,671 $30,830
WEST WALLSEND COLLIERY 31 3% 16 15 $15,199 $1,011
TASMAN COAL MINE 31 2% 7 24 $32,457 $1,370
NRE NO 1 COLLIERY 21 39% 13 8 $373,072 $47,006
ABEL UNDERGROUND MINE 20 8% 13 7 $32,379 $4,541
APPIN COLLIERY 20 88% 15 5 $27,238 $5,629
NRE WONGAWILLI COLLIERY 16 23% 7 9 $1,121,820 $125,809
AWABA COLLIERY 16 0% 8 8 $15,411 $1,925
MANNERING COLLIERY 10 0% 5 6 $39,260 $6,923
CHAIN VALLEY COLLIERY 8 19% 3 5 $44,127 $8,941
RICHMOND MAIN EAST 5 0% 3 3 $72,416 $27,120
BERRIMA COLLIERY 4 37% 1 3 $44,324 $16,347
IVANHOE NO.2 COLLIERY 1 0% 0 1 $920 $1,325
MYUNA COLLIERY 1 37% 0 0 $0 $0
XSTRATA MANGOOLLA (ANVIL HILL MINE) 0 63% 0 0 -$61 -$897

Katestone Environmental Pty Ltd KE1006953 OEH
June 2011
Page 264
Figure 70 Reduction in PM10 emissions and associated costs (per tonne) to implement best practice control measures by coal
mine
Katestone Environmental Pty Ltd KE1006953 OEH
June 2011
Page 265
12.6 Summary of cost effectiveness analysis
Table 139 provides a summary of the costs and benefits of implementing best practice particulate control measures in GMR coal mines. The table shows that: Haul roads:
The greatest reduction in emissions would be achieved by the application of suppressants to haul roads, which will reduce the current emissions by 21%. The cost for this is $59M per year.
A similar reduction in emissions could be achieved by the conversion of 50% of the haul roads to conveyors, which is estimated to cost $24M per year, and would reduce current emissions by 20%.
The most cost-effective control measure would be the replacement of the current fleet with larger-capacity vehicles, which is shown not to incur any additional costs, but instead produces a significant cost saving due to the reduction in the number of vehicles required to be purchased, as well as reduced operating costs. The use of larger haul trucks is estimated to reduce costs by $105M per year across GMR mines and to reduce overall emissions by 10%.
Overburden emplacements:
Rehabilitation of 80% of the overburden emplacements will reduce the current emissions by 20% and is estimated to cost $20M per year.
Rehabilitation is a more cost-effective approach in minimising emissions than watering.
Coal stockpiles:
The greatest reduction in emissions from coal stockpiles was achieved by the application of suppressants, which is expected to reduce the current emissions by 2.0% at an ongoing cost of $33M per year.
A more cost effective approach would be the application of Level 2 watering, estimated to reduce current emissions by 1.0% and is estimated to cost $8M per year
Exposed areas:
Full rehabilitation of other exposed areas is estimated to reduce current emissions by almost 3%, and is estimated to reduce the costs of current control measures (namely watering) by approximately $4M.
Full or partial rehabilitation of the exposed areas is shown to reduce the ongoing operational costs and the current emissions.
Bulldozing:
Watering while bulldozing coal will reduce the current emissions by almost 2.0% of the current emissions and is estimated to cost over $53M per year.
Watering while bulldozing overburden will reduce the current emissions by less than 2% of the current emissions and is estimated to cost over $156M per year.
Trucks dumping coal to the ROM hopper:
Enclosing the ROM hopper and the use of fabric filters is shown to reduce current PM10 emissions by less than 1% at a cost of $2M per year.
Graders:
The application of level 2 watering to grading activities is estimated to reduce emissions by less than 1% at an estimated cost of $38M per year.

Katestone Environmental Pty Ltd KE1006953 OEH
June 2011
Page 266
Drilling:
The use of fabric filters on drill rigs is estimated to reduce emissions by less than 1% at an approximate cost of $150,000 per year.
The cost of using the enclosure is significantly lower, estimated to cost $24,000 per year, and estimated to reduce emissions by less than 1%.
Table 139 Summary of cost effectiveness analysis for GMR coal mines
Activity
Reduction in emissions of PM10
from entire inventory (%)
Total Cost per year
Cost per tonne of PM10 reduced
Wheel generated dust (unpaved roads - coal mines)
Level 2 Watering 11% $26,723,874 $4,145
Level 2 Watering + Dust Suppressant 21% $58,898,874 $4,710
Conversion of 50% of Haul Roads to Conveyor 20% $23,949,845 $1,992
Truck Replacement 10% -$105,111,320 -$17,240
Wind Erosion (overburden)
Level 2 Watering 18% $62,563,790 $5,827
Level 1 Watering 11% $26,051,699 $3,980
Enclosure 17% $18,684,716 $1,889
Rehab (56%) 12% $12,387,531 $1,682
Rehab (81%) 20% $20,424,971 $1,761
Coal Stockpiles
Suppressants 2% $32,801,897 $29,089
Level 2 Watering 1% $8,186,396 $11,190
Enclosure 1% $11,916,561 $18,839
Level 1 Watering 0% $1,997,168 $8,358
Exposed area (wind erosion)
100% Revegetation 3% -$3,645,902 -$2,007
100% Hydromulch 3% $533,082 $293
Level 2 Watering 2% $12,447,721 $12,751
Enclosure 1% $2,675,726 $3,203
61% Revegetation 1% -$4,025,355 -$7,275
Level 1 Watering 0% $3,952,865 $14,564
Bulldozing (coal)
Watering 2% $53,032,907 $38,933
Bulldozing (overburden)
Watering 2% $156,240,732 $141,103
Trucks dumping coal to ROM Hopper
Enclosure + Fabric Filter 1% $2,275,271 $5,812
Water Sprays + Enclosure 0% $2,045,032 $8,493
Water Sprays 0% $425,032 $2,799
Graders
Level 2 Watering 0% $37,530,061 $309,165
Level 1 Watering 0% $20,239,481 $287,641
Drilling
Enclosure + Fabric Filter 0% $153,078 $935
Water Sprays + Enclosure 0% $24,000 $235
Overall costs and benefits:
Significant reductions in emissions of particulate matter could be achieved through the application of best practice control measures that are both technically and economically feasible.
Including only those control measures that cost less than $40,000 per tonne of PM10 reduced, the cost of implementing best practice particulate emission controls in GMR coal mines was estimated to be $164M per year.
The application of these best practice particulate emission controls was estimated to produce a 49% reduction in overall emissions of PM10.
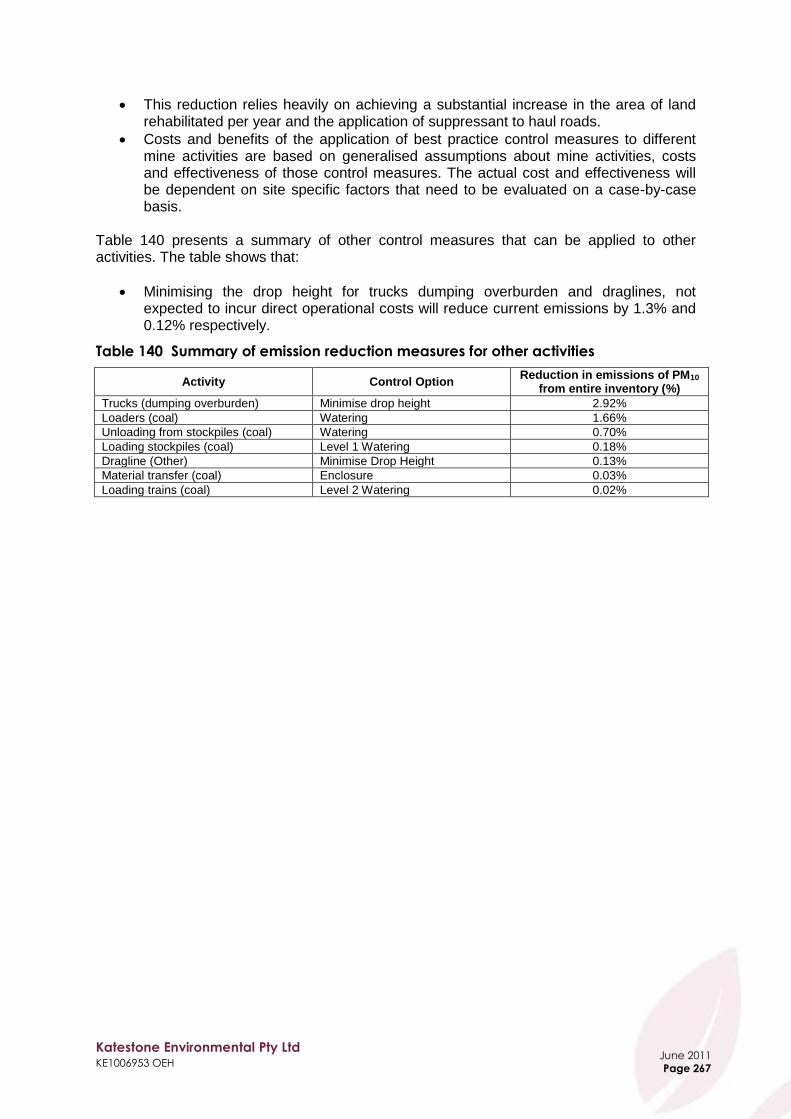
Katestone Environmental Pty Ltd KE1006953 OEH
June 2011
Page 267
This reduction relies heavily on achieving a substantial increase in the area of land rehabilitated per year and the application of suppressant to haul roads.
Costs and benefits of the application of best practice control measures to different mine activities are based on generalised assumptions about mine activities, costs and effectiveness of those control measures. The actual cost and effectiveness will be dependent on site specific factors that need to be evaluated on a case-by-case basis.
Table 140 presents a summary of other control measures that can be applied to other activities. The table shows that:
Minimising the drop height for trucks dumping overburden and draglines, not expected to incur direct operational costs will reduce current emissions by 1.3% and 0.12% respectively.
Table 140 Summary of emission reduction measures for other activities
Activity Control Option Reduction in emissions of PM10
from entire inventory (%)
Trucks (dumping overburden) Minimise drop height 2.92%
Loaders (coal) Watering 1.66%
Unloading from stockpiles (coal) Watering 0.70%
Loading stockpiles (coal) Level 1 Watering 0.18%
Dragline (Other) Minimise Drop Height 0.13%
Material transfer (coal) Enclosure 0.03%
Loading trains (coal) Level 2 Watering 0.02%
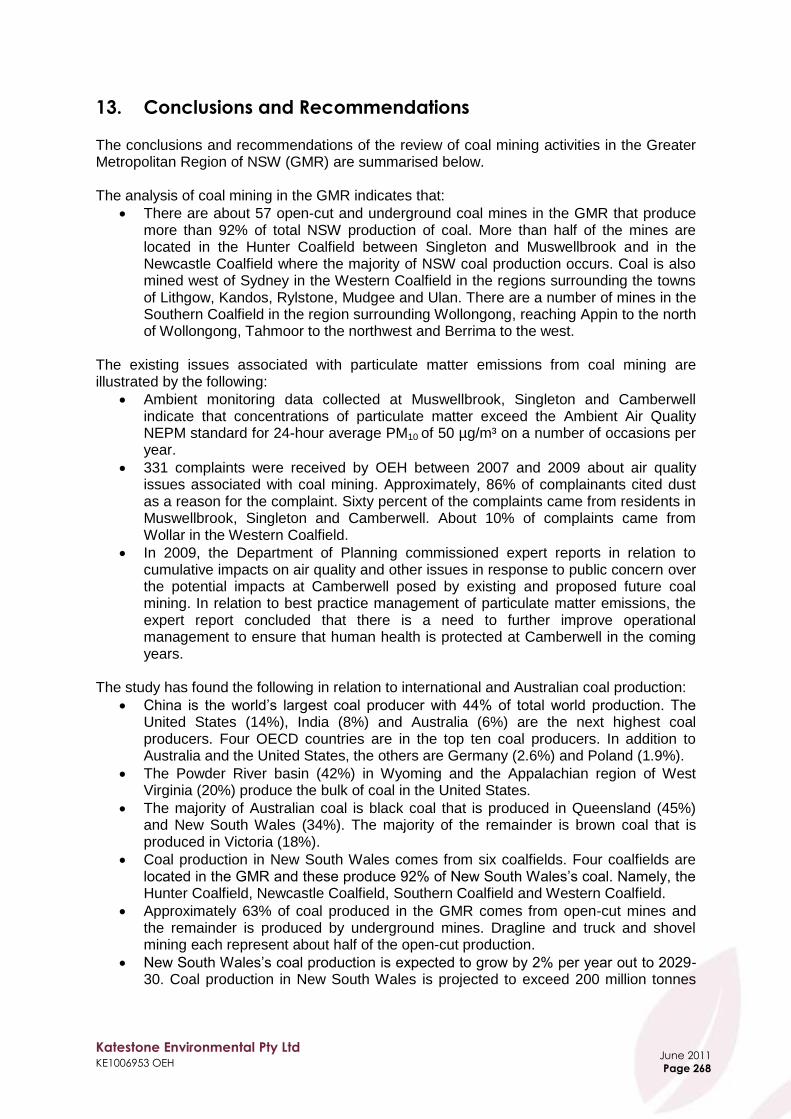
Katestone Environmental Pty Ltd KE1006953 OEH
June 2011
Page 268
13. Conclusions and Recommendations
The conclusions and recommendations of the review of coal mining activities in the Greater Metropolitan Region of NSW (GMR) are summarised below. The analysis of coal mining in the GMR indicates that:
There are about 57 open-cut and underground coal mines in the GMR that produce more than 92% of total NSW production of coal. More than half of the mines are located in the Hunter Coalfield between Singleton and Muswellbrook and in the Newcastle Coalfield where the majority of NSW coal production occurs. Coal is also mined west of Sydney in the Western Coalfield in the regions surrounding the towns of Lithgow, Kandos, Rylstone, Mudgee and Ulan. There are a number of mines in the Southern Coalfield in the region surrounding Wollongong, reaching Appin to the north of Wollongong, Tahmoor to the northwest and Berrima to the west.
The existing issues associated with particulate matter emissions from coal mining are illustrated by the following:
Ambient monitoring data collected at Muswellbrook, Singleton and Camberwell indicate that concentrations of particulate matter exceed the Ambient Air Quality NEPM standard for 24-hour average PM10 of 50 µg/m³ on a number of occasions per year.
331 complaints were received by OEH between 2007 and 2009 about air quality issues associated with coal mining. Approximately, 86% of complainants cited dust as a reason for the complaint. Sixty percent of the complaints came from residents in Muswellbrook, Singleton and Camberwell. About 10% of complaints came from Wollar in the Western Coalfield.
In 2009, the Department of Planning commissioned expert reports in relation to cumulative impacts on air quality and other issues in response to public concern over the potential impacts at Camberwell posed by existing and proposed future coal mining. In relation to best practice management of particulate matter emissions, the expert report concluded that there is a need to further improve operational management to ensure that human health is protected at Camberwell in the coming years.
The study has found the following in relation to international and Australian coal production:
China is the world‟s largest coal producer with 44% of total world production. The United States (14%), India (8%) and Australia (6%) are the next highest coal producers. Four OECD countries are in the top ten coal producers. In addition to Australia and the United States, the others are Germany (2.6%) and Poland (1.9%).
The Powder River basin (42%) in Wyoming and the Appalachian region of West Virginia (20%) produce the bulk of coal in the United States.
The majority of Australian coal is black coal that is produced in Queensland (45%) and New South Wales (34%). The majority of the remainder is brown coal that is produced in Victoria (18%).
Coal production in New South Wales comes from six coalfields. Four coalfields are located in the GMR and these produce 92% of New South Wales‟s coal. Namely, the Hunter Coalfield, Newcastle Coalfield, Southern Coalfield and Western Coalfield.
Approximately 63% of coal produced in the GMR comes from open-cut mines and the remainder is produced by underground mines. Dragline and truck and shovel mining each represent about half of the open-cut production.
New South Wales‟s coal production is expected to grow by 2% per year out to 2029-30. Coal production in New South Wales is projected to exceed 200 million tonnes

Katestone Environmental Pty Ltd KE1006953 OEH
June 2011
Page 269
per year by the end of this period. About 41% of the 91 million tonnes of new coal projects are expected to be in the Hunter Coalfield.
The study has found the following in relation to emissions from coal mining in the GMR:
The 2003 emissions inventory found that coal mining was the largest emitter of particulate matter (as PM10) in the GMR as a whole and in the Newcastle and Non-Urban Regions.
The 2008 emissions inventory is currently being prepared. The contribution of coal mining to particulate emissions in the inventory is likely to maintain its prominence.
OEH provided data from the 2008 emissions inventory for use in this study. Analysis of the 2008 emissions inventory data shows:
o The largest source of PM10 from coal mining activities is haul trucks travelling on unpaved roads (40%), followed by wind erosion of overburden (27%), bulldozers (8%), blasting (6%) and trucks dumping overburden (4%).
o The top three activities are found to produce 75% of PM10 emissions associated with GMR coal mines, whilst the top ten activities produce 97% of PM10 emissions.
A review of regulatory frameworks for air quality management around the world has jointly focused on countries with a high degree of economic development (OECD countries), the quantity of coal produced and level of environmental regulation adopted in the country. This review has found that:
The regulatory regime in place in New South Wales is very transparent with a substantial amount of licence and approval information available on the websites of OEH and Department of Planning.
Best practice is not strictly defined in the New South Wales legislation, but a form of best practice is implicit in Section 128 of the POEO Act that requires “...the occupier of a premises to carry on any activity, or operate any plant, in or on the premises by such practicable means as may be necessary to prevent or minimise air pollution.” As distinct from other aspects of New South Wales legislation (e.g. the Clean Air Regulation in relation to point source emissions), there is no legislation or guideline that might provide the regulator, community or coal mine with a detailed and practical interpretation of what Section 128 might mean for coal mining.
In the United States and Canada, the legislation and project approvals provide specific and detailed expectations about controlling emissions of particulate matter from coal mining.
The NSW approach is deliberately less prescriptive to allow the licensee to determine the optimal approach to achieving the ongoing minimisation. The less prescriptive approach means that conditions of development approval do not specifically state the commitments made during the Environmental Assessment, but include a statement that the project shall be carried out “generally in accordance with the Environmental Assessment.” Additionally, the assumptions made in the Environmental Assessment can be optimistic with regard to a mine‟s ability to achieve an appropriate level of minimisation or lack specificity as to how the minimisation will be achieved in practice.
No impact assessment criterion has been specified by OEH for 24-hour average TSP. The Canadian province of Alberta provides a 24-hour average TSP criterion of 100 µg/m³, which is the most stringent criterion of all jurisdictions considered in the review.
The annual average TSP impact assessment criterion adopted by OEH is less stringent than the strictest limits adopted by other jurisdictions considered in the review. The Canadian provinces of Alberta, British Columbia and Ontario and the Government of Canada provide an annual average TSP criterion of 60 µg/m³, which is the most stringent criterion of all jurisdictions considered in the review.

Katestone Environmental Pty Ltd KE1006953 OEH
June 2011
Page 270
The 24-hour average PM10 impact assessment criterion adopted by OEH is consistent with the strictest limits adopted by other jurisdictions considered in the review.
The annual average PM10 impact assessment criterion adopted by OEH is less stringent than the strictest limits adopted by other jurisdictions considered in the review. The World Health Organisation, California and Scotland provide annual average PM10 criteria that are equal to or less than 20 µg/m³, which are the most stringent criteria of all jurisdictions considered in the review.
No impact assessment criteria have been specified by OEH for PM2.5. Annual average and 24-hour average criteria have been specified by most jurisdictions considered in the review. The stated position of OEH is that there is currently an Ambient Air Quality NEPM process considering developing a standard for PM2.5 in Australia and OEH is awaiting the outcome of this process prior to setting impact assessment criteria for PM2.5.
The impact assessment criteria for deposited dust adopted by OEH are consistent with the strictest limits adopted by other jurisdictions considered in the review.
The differences between OEH‟s impact assessment criteria and the Department of Planning‟s land acquisition criteria, leaves a gap that is filled by the land acquisition process. The land acquisition process requires a person to be affected and for that affected party to make representations to the mine in order to trigger action.
Emissions of particulate matter from coal mining are not captured under New South Wales Load Based Licensing scheme. In the United States coal mines that exceed a specified threshold are subject to a load-based licensing fee that is charged based on the emission rate of particulate matter.
A detailed review of international techniques for controlling emissions of particulate matter from coal mining has been completed and best practice measures have been determined. The European and Victorian definitions of best practice have been central to the determination of best practice measures. Techniques adopted by GMR coal mines have been benchmarked against international best practice. Overall, coal mines in the GMR have adopted many elements of best practice. However, no mine has completely implemented best practice across the full range of activities. Additional efforts are applied to minimise emissions in adverse circumstances, but commensurate efforts may not be consistently applied at other times. Activities are commonly relocated to within the pit when conditions are conducive to the generation of particulate matter emissions but anecdotal evidence suggests that this may not always be effective and the literature suggests that pit retention may only provide a small (5% or less) reduction in emissions of PM10 and PM2.5. The following activity-specific conclusions have been reached:
Haul roads: control measures include watering, grading, well-defined haul routes, speed limits to 40 km/hr and/or the use of suppressants. Approximately 89% of underground mines and 96% of open-cut mines use either fixed sprays or water carts to control emissions of particulate matter from haul roads. The majority of mines that were visited indicated that haul roads were watered on a consistent routine basis under normal weather conditions and that, under adverse conditions, visible particulate matter above the deck, wheels or tray of the haul trucks was used as a trigger for the application of additional watering. At a number of mines that were visited, haul truck drivers were instrumental in identifying problematic conditions and ensuring that water was applied to roads. However, the degree of diligence of watering activities could not be determined for each mine from the available information. Hence, the fact that watering is implemented may not mean that emissions are minimised as far as is practicable.

Katestone Environmental Pty Ltd KE1006953 OEH
June 2011
Page 271
Approximately 74% of underground mines and 64% of open-cut mines use speed restrictions to control emissions of particulate matter from unpaved haul roads. Best practice was found to be the application of suppressant on haul roads and application of water to control emissions from grading.
Wind erosion of exposed materials and stockpiles: control measures include watering exposed areas, minimising areas of disturbance, progressive rehabilitation and use of suppressants. The majority (78%) of underground mines use watering to control emissions of particulate from cleared areas. At open-cut mines and combined underground and open-cut mines, watering (92%), limiting areas of disturbance (84%) and progressive rehabilitation (84%) are the major techniques that are used to minimise emissions associated with wind erosion. One mine in the GMR was found to use suppressant to control emissions from ROM stockpiles, whilst approximately 67% use water application. Best practice was found to be:
Use of water application or suppressants on coal stockpiles
Implementation of rehabilitation
Bulldozing: best practice control measures include minimising the travel speed and distance travelled by bulldozers and the application of water to keep travel routes moist.
Blasting: best practice control measures include delaying shot to avoid unfavourable weather conditions and minimising the area blasted. Most mines (91%) restrict blasting to times of favourable weather conditions.
Drilling: best practice control measures include air extraction to a bag filter. No mines were found to use this practice. Approximately 58% of mines control emissions using water sprays, which are less effective than the use of fabric filtration, but still have a good level of effectiveness. Approximately, 62% use curtains to limit emissions.
Draglines: there are seven open-cut mines that utilise draglines. Best practice control measures for draglines is minimising the drop height of materials to 5 metres and the suspension of operations in adverse conditions. Three GMR coal mines reported that drop heights were minimised to between 6 and 12 metres. Six metres is equivalent to best practice.
Loading and dumping overburden: current practices adopted to control emissions from loading and dumping overburden were found to be water application, minimisation of drop heights and suspension or modification of activities during adverse weather conditions. Best practice control measures were identified as minimising drop heights and or the application of water.
Loading and dumping ROM coal: best practice control measures for minimising emissions from the ROM hopper is enclosure with air extraction to a fabric filter or other control device. No mines in the GMR adopt this approach. Three mines (13%) were found to utilise enclosure on three sides and water sprays. Most (83%) mines use water sprays activated by the movement of the truck.
Monitoring, proactive and reactive management: Of the open-cut mines, 84% monitor meteorological conditions and 48% monitor using a TEOM or other continuous
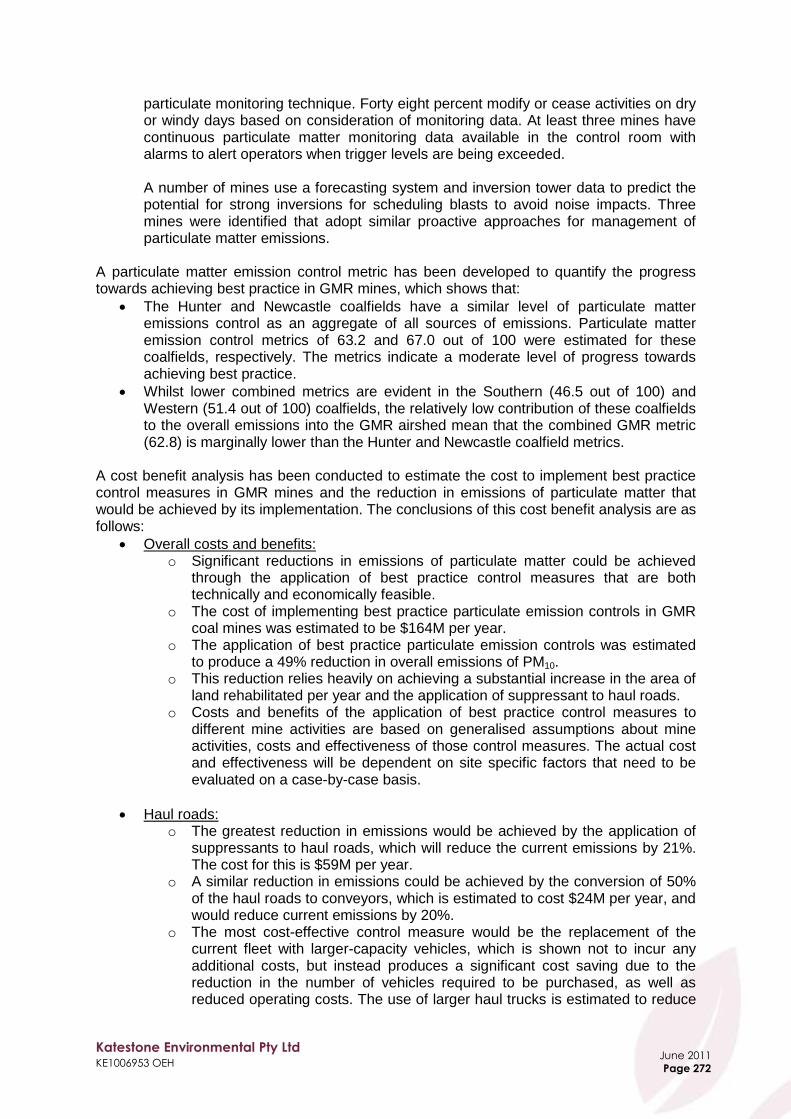
Katestone Environmental Pty Ltd KE1006953 OEH
June 2011
Page 272
particulate monitoring technique. Forty eight percent modify or cease activities on dry or windy days based on consideration of monitoring data. At least three mines have continuous particulate matter monitoring data available in the control room with alarms to alert operators when trigger levels are being exceeded. A number of mines use a forecasting system and inversion tower data to predict the potential for strong inversions for scheduling blasts to avoid noise impacts. Three mines were identified that adopt similar proactive approaches for management of particulate matter emissions.
A particulate matter emission control metric has been developed to quantify the progress towards achieving best practice in GMR mines, which shows that:
The Hunter and Newcastle coalfields have a similar level of particulate matter emissions control as an aggregate of all sources of emissions. Particulate matter emission control metrics of 63.2 and 67.0 out of 100 were estimated for these coalfields, respectively. The metrics indicate a moderate level of progress towards achieving best practice.
Whilst lower combined metrics are evident in the Southern (46.5 out of 100) and Western (51.4 out of 100) coalfields, the relatively low contribution of these coalfields to the overall emissions into the GMR airshed mean that the combined GMR metric (62.8) is marginally lower than the Hunter and Newcastle coalfield metrics.
A cost benefit analysis has been conducted to estimate the cost to implement best practice control measures in GMR mines and the reduction in emissions of particulate matter that would be achieved by its implementation. The conclusions of this cost benefit analysis are as follows:
Overall costs and benefits: o Significant reductions in emissions of particulate matter could be achieved
through the application of best practice control measures that are both technically and economically feasible.
o The cost of implementing best practice particulate emission controls in GMR coal mines was estimated to be $164M per year.
o The application of best practice particulate emission controls was estimated to produce a 49% reduction in overall emissions of PM10.
o This reduction relies heavily on achieving a substantial increase in the area of land rehabilitated per year and the application of suppressant to haul roads.
o Costs and benefits of the application of best practice control measures to different mine activities are based on generalised assumptions about mine activities, costs and effectiveness of those control measures. The actual cost and effectiveness will be dependent on site specific factors that need to be evaluated on a case-by-case basis.
Haul roads: o The greatest reduction in emissions would be achieved by the application of
suppressants to haul roads, which will reduce the current emissions by 21%. The cost for this is $59M per year.
o A similar reduction in emissions could be achieved by the conversion of 50% of the haul roads to conveyors, which is estimated to cost $24M per year, and would reduce current emissions by 20%.
o The most cost-effective control measure would be the replacement of the current fleet with larger-capacity vehicles, which is shown not to incur any additional costs, but instead produces a significant cost saving due to the reduction in the number of vehicles required to be purchased, as well as reduced operating costs. The use of larger haul trucks is estimated to reduce

Katestone Environmental Pty Ltd KE1006953 OEH
June 2011
Page 273
costs by $105M per year across GMR mines and to reduce overall emissions by 10%.
Overburden emplacements: o Rehabilitation of 80% of the overburden emplacements will reduce the current
emissions by 20% and is estimated to cost $20M per year. o Rehabilitation is a more cost-effective approach in minimising emissions than
watering.
Coal stockpiles: o The greatest reduction in emissions from coal stockpiles was achieved by the
application of suppressants, which is expected to reduce the current emissions by 2.0% at an ongoing cost of $33M per year.
o A more cost effective approach would be the application of Level 2 watering, estimated to reduce current emissions by 1.0% and is estimated to cost $8M per year
Exposed areas: o Full rehabilitation of other exposed areas is estimated to reduce current
emissions by almost 3%, and is estimated to reduce the costs of current control measures (namely watering) by approximately $4M.
o Full or partial rehabilitation of the exposed areas is shown to reduce the ongoing operational costs and the current emissions.
Bulldozing: o Watering while bulldozing coal will reduce the current emissions by almost
2.0% of the current emissions and is estimated to cost over $53M per year. o Watering while bulldozing overburden will reduce the current emissions by
less than 2% of the current emissions and is estimated to cost over $156M per year.
Trucks dumping coal to the ROM hopper: o Enclosing the ROM hopper and the use of fabric filters is shown to reduce
current PM10 emissions by less than 1% at a cost of $2M per year.
Graders: o The application of level 2 watering to grading activities is estimated to reduce
emissions by less than 1% at an estimated cost of $38M per year.
Drilling: o The use of fabric filters on drill rigs is estimated to reduce emissions by less
than 1.0% at a cost of $150,000 per year. o The cost of using the enclosure is significantly lower, estimated to cost
$24,000 per year, and estimated to reduce emissions by less than 1.0%.

Katestone Environmental Pty Ltd KE1006953 OEH
June 2011
Page 274
Based on the findings and conclusions of this study, the following steps may be considered to reduce emissions of particulate matter from coal mining activities.
Provide a definition of best management practices (BMP) in the Protection of the Environment Operations (Clean Air Regulation) 2002 (CAR) that would be applied in instances where there is no standard of concentration defined under Section 128 of the Protection of the Environment Operations Act 1997.
Include opacity as an indicator of fugitive emissions of particulate matter and specify a limit for opacity with reference to limits defined in other jurisdictions. In the United States coal mining activities are required to minimise emissions to be less than a 20% opacity level. Such an approach could provide for a greater degree of management and control of emissions from haul roads and other emission sources, but would require training of mine and regulatory personnel to implement and enforce. Open-path opacity monitoring equipment could provide a technological solution to this.
Consideration should be given to the development of a handbook, guideline or regulation that defines BMP for the control of particulate matter emissions from coal mining activities. The handbook could be initially developed from the findings of this study, but would be a dynamic document that is updated regularly based on experience, future innovation, community and stakeholder input. The document could:
o Define appropriate emissions estimation techniques o Be referenced in conditions of approval and EPL conditions o Used as a tool for auditing o Used as a tool for developing management programs o Used as a resource for impact assessment studies o Define acceptable control factors for the development of emissions
inventories required under the legislation. Alternative control factors or control measures that deviate from best practice could be acceptable based on review and approval using a process similar to the Chief Scientist process that is used to approve alternative sampling methods under the CAR.

Katestone Environmental Pty Ltd KE1006953 OEH
June 2011
Page 275
Incorporate coal mining into the load-based-licensing scheme. This could be used to drive the take up of more effective emission controls, but would require the development of the handbook described above. This may also motivate the development of more robust techniques for the quantification of particulate matter emissions from coal mining.
Undertake a review of the currency, adequacy and effectiveness of existing TSP, PM10 and dust deposition criteria in avoiding adverse impacts on human health and amenity. Consider within this review whether PM2.5 criteria should be adopted. Revise the Approved Methods for the Modelling and Assessment of Air Pollutants in NSW accordingly.
Develop a regional dispersion model for the Hunter Coalfield to assist the planning and development. The model would need to incorporate:
o Existing activities and use mine plans to project future emissions. This may require ongoing provision of mine plans to an administrative body for incorporation into the model
o Historical ambient air quality monitoring data o Historical surface meteorological measurements incorporated into a 3-
dimensional meteorological model o Approved mining activities
The model could be used to:
o Provide an agreed and approved framework for the planning and approval of new coal mines or extension of existing mines
o Forecast air quality to provide information and alerts to mine managers and to community about air quality.
Require new coal mine developments (at EA stage) and existing coal mines to conduct site specific BMP determinations to identify the most technically and economically feasible options to reduce emissions. For new developments, the BMP determination should be transparently linked to the air quality impact assessment and detailed in the air quality management plan (AQMP), which should also accompany the EA. For existing premises, the BMP determination could be required through a pollution reduction program (PRP) and the outcomes implemented through EPL conditions.
Katestone Environmental Pty Ltd KE1006953 OEH
June 2011
Page 276
14. References
1 Department of Environment and Climate Change NSW 2007, Air Emissions Inventory for the
Greater Metropolitan Region in NSW, viewed August 2010. <http://www.environment.nsw.gov.au/air/airinventory.htm> 2 US Environmental Protection Agency 2010, Basic Concepts in Environmental Sciences, Module 3:
Characteristics of Particles – Size Distribution, viewed 4 November 2010. <http://www.epa.gov/apti/bces/module3/distribu/distribu.htm> 3 US Environmental Protection Agency 1996, Review of the National Ambient Air Quality Standards
for Particulate Matter: Policy Assessment of Scientific and Technical Information, OAQPS Staff Paper, Office of Office of Air Quality Planning and Standards U.S. Environmental Protection Agency, EPA-452\R-96-013, July 1996, viewed 4 November 2010. <http://www.epa.gov/ttn/caaa/t1/reports/pmspcov.pdf> 4 Santa Barbara County Air Pollution Control District 2010, Air Pollution and Our Health, viewed
2 November 2010. < http://www.sbcapcd.org/sbc/pollut.htm> 5 New South Wales Health 2007, Mine Dust and You, Factsheet developed with the NSW Minerals
Council, viewed August 2010. <http://www.health.nsw.gov.au/factsheets/environmental/mine_dust.html>
6 Ono, D, 2005, Ambient PM2.5/PM10 ratios for Dust Events from the Keeler Dunes, Great Basin
UAPCD, Bishop, CA.
7 Cowherd, C, Donaldson, J, 2005, Analysis of the Fine Fraction of Particulate Matter in Fugitive Dust,
Final report prepared for the Western Governors‟ Association, Western Regional Air Partnership (WRAP), MRI Project No. 110397.
8 US Environmental Protection Agency (USEPA) 2006, Background Document for Revisions to Fine
Fraction Ratios Used for AP-42 Fugitive Dust Emission Factors, Midwest Research Institute, Western Governors‟ Association Western Regional Air Partnership (WRAP), 1515 Cleveland Place, Suite 200, Denver Colorado 80202. MRI Project No. 110397.
9 Drew, R 2009, Screening Health Risk Assessment of Predicted Dust Emissions from the Wandoan
Coal Mine, Toxicos document: TR020909-Rd1 4 September 2009.
10
Environment Australia 2001, Emission Estimation Technique Manual for Mining Version 2.3, Environment Australia, GPO Box 787, Canberra, ACT 2601, Australia. <http://www.npi.gov.au/publications/emission-estimation-technique/pubs/mining.pdf> 11
Heavy Equipment Machinery Information 2010, Underground Coal Mining in the Bituminous Coalfields, viewed 12 November 2010. <http://www.heavymachineryinfo.com/articles/364/1/Underground-Coal-Mining-in-the-Bituminous-Coalfields/Underground-Coal-Mining-in-the-Bituminous-Coalfields.html> 12
World Coal Association 2010, Coal Mining, viewed 20 August 2010. <http://www.worldcoal.org/media/jpg/585/074647section2_diagram.jpg> 13
Xstrata Coal Mt Owen Complex 2010, Mining & Infrastructure Mining Methods, viewed 12 November 2010. <http://www.mtowencomplex.com.au/img/mining_methods2.jpg>

Katestone Environmental Pty Ltd KE1006953 OEH
June 2011
Page 277
14
Mine Machine Training 2010, Hydraulic Shovel Operations Training for Coal Employment, viewed 12 November 2010. <http://www.minemachinetraining.com.au/hydraulic-shovel-training.html> 15
Bulga Coal 2010, Mining & Infrastructure Mining Methods & Equipment, viewed 12 November 2010. <http://www.bulgacoal.com.au/mining_methods.html> 16
NSW Minerals Council 2010, Mining in NSW Mining Methods, viewed 12 November 2010. <http://www.nswmin.com.au/Mining-in-NSW/About-the-Industry/How-we-mine/Mining-Methods/default.aspx> 17
Department of Environment Climate Change and Water 2010, Compendium of Upper Hunter Air Quality Monitoring Data, viewed 10 November 2010. <http://www.environment.nsw.gov.au/resources/air/UpperHunterAirQualityData.pdf> 18
National Environment Protection (Ambient Air Quality) Measure 1998 (Commonwealth of Australia). 19
Department of Environment Climate Change and Water 2010, Review of upper hunter air quality data, viewed 5 August 2010. < http://www.environment.nsw.gov.au/aqms/upperhunterreview.htm> 20
DustWatch 2010, DustWatch report for week ending 28 September 2009, viewed 12 November 2010. <http://www.environment.nsw.gov.au/resources/dustwatch/DWNL090928.pdf> 21
Department of Environment and Conservation 2007, Approved Methods for the Sampling and Analysis of Air Pollutants in NSW, Department of Environment and Conservation, Sydney, DEC 2007/1, ISBN 978 1 74122 373 6, January 2007, viewed 1 November 2010. <http://www.environment.nsw.gov.au/resources/air/07001amsaap.pdf> 22
Protection of the Environment Operations Act 1997 (New South Wales, Australia). 23
Environ Australia Pty Ltd., 2009, Independent Review of Cumulative Dust Impacts – Camberwell Village, prepared for Major Project Assessment – Industry and Mining NSW Department of Planning, viewed 2 September 2010. <http://www.planning.nsw.gov.au/LinkClick.aspx?fileticket=waS1Eif7MY8%3d&tabid=70&language=en-AU> 24
Wilkinson Murray 2009, Independent Review of Cumulative Noise Impacts – Camberwell Village, Report No. 09048, Version B, May 2010, prepared for Major Project Assessment – Industry and Mining NSW Department of Planning, viewed 2 September 2010. <http://www.planning.nsw.gov.au/LinkClick.aspx?fileticket=QHTJY4NwLlA%3d&tabid=70&language=en-AU> 25
Noller, B 2009, Community Lead Issues at Camberwell NSW, Report from Centre for Mined Land Rehabilitation, The University of Queensland to Ashton Coal Operations Pty. Ltd, viewed 2 September 2010. <http://www.planning.nsw.gov.au/LinkClick.aspx?fileticket=n4iJb9CtYbc%3d&tabid=70&language=en-AU>
26
PAE Holmes 2010, Final Report, Additional Cumulative Air Quality Assessment for Proposed Ashton Coal Operations Ltd, Integra Coal Operations Pty Ltd and Ravensworth Operations Pty Ltd, 1 July 2010, viewed 2 September 2010. <http://www.planning.nsw.gov.au/LinkClick.aspx?fileticket=nfYnftFXXKI%3d&tabid=70&language=en-AU>

Katestone Environmental Pty Ltd KE1006953 OEH
June 2011
Page 278
27
Department of Planning 2010, Camberwell Cumulative Impacts Review – Key Government Responses, July 2010, viewed 21 August 2010. <http://www.planning.nsw.gov.au/LinkClick.aspx?fileticket=kGN73fl6Cx8%3D&tabid=70&language=en-AU> 28
Department of Environment Climate Change and Water 2010, Upper Hunter air quality monitoring network, viewed 2 September 2010. <http://www.environment.nsw.gov.au/aqms/upperhunter.htm> 29
BP 2010, Statistical Review of World Energy, viewed 15 August 2010. <http://www.bp.com/productlanding.do?categoryId=6929&contentId=7044622> 30
World Coal Institute 2005, The Coal Resource – A comprehensive overview of coal, viewed 19 August 2010. <www.worldcoal.org/bin/pdf/original_pdf_file/coal_resource_overview_of_coal_report(03_06_ 2009).pdf> 31
US Energy Information Administration 2010, Annual Coal Report 2009, DOE/EIA-0584 (2009), viewed 28 August 2010. <http://www.eia.doe.gov/cneaf/coal/page/acr/acr_sum.html>
32
ABARE 2010, Australian Energy Resource Assessment, viewed August 2010. <http://www.abare.gov.au/publications_html/energy/energy_10/foreword.pdf>
33
ABARE 2010, Australian energy statistics, Australian Production of Primary Fuels – Physical Units, 1960-61 to 07-08, viewed August 2010. <http://www.abare.gov.au/publications_html/data/data/data.html>
34
New South Wales Department of Primary Industries 2009, Coal Industry Profile, viewed August 2010. <http://www.dpi.nsw.gov.au/minerals/resources/coal/nsw-coal-industry-profile> 35
Department of Primary Industries 2009, 2009 New South Wales Coal Industry Profile, NSW Department of Primary Industries, 2009. 36
ABARE 2010, Australian energy projections to 2029-30, ABARE research report 10.02, ABARE, March 2010, viewed 2 August 2010. <http://www.abare.gov.au/publications_html/energy/energy_10/energy_proj.pdf> 37
ABARE 2010, List of Minerals and Energy Projects, viewed August 2010. <http://www.abare.gov.au/publications_html/energy/energy_10/ME10_AprListing.xls> 38
Australian Government Department of Environment, Water, Heritage and Arts 2010, NPI National Pollution Inventory, Version 5.1, February 2010, viewed 29 August 2010. <http://www.npi.gov.au/publications/pubs/npiguide.pdf> 39
Australian Government Department of Sustainability, Environment, Water, Population and Communities 2010, National Pollutant Inventory, viewed 12 November 2010. <http://www.npi.gov.au/> 40
National Environment Protection (Air Toxics) Measure (Commonwealth of Australia) 41
Protection of the Environment Operations (General) Regulation 1998 (New South Wales, Australia) 42
Protection of the Environment Operations (Clean Air) Regulation 2002 (New South Wales, Australia)

Katestone Environmental Pty Ltd KE1006953 OEH
June 2011
Page 279
43
Department of Environment and Climate Change NSW 2007, Technical Report No. 1 Air Emissions Inventory for the Greater Metropolitan Region in New South Wales Criteria Pollutant Emissions for all Sectors: Results, viewed August 2010. <http://www.environment.nsw.gov.au/resources/air/tr1aei0712.pdf> 44
Protection of the Environment Operations (Clean Air) Regulation 2002 (New South Wales, Australia) 45
Department of Environment and Conservation 2005, Approved methods for the modelling and assessment of air pollutants in New South Wales, Department of Environment and Conservation, Sydney, DEC 2005/361, ISBN 1 74137 488 X, August 2005, viewed 5 November 2010. <http://www.environment.nsw.gov.au/resources/air/ammodelling05361.pdf> 46
Victorian Government, 2001, State Environment Protection Policy (Air Quality Management) Environment Protection Act 1970, Victoria Government Gazette, Special No. S 240 Friday 21 December 2001. Victorian Government Printer. 47
Victorian Government, Environmental Protection Agency, 2006, State Environment Protection Policy Mining and Extractive Industry, Consultation Document, EPA Victoria. 48
Directive 2008/1/EC of the European Parliament and of the Council, viewed 12 August 2010. <http://eur-lex.europa.eu/LexUriServ/LexUriServ.do?uri=OJ:L:2008:024:0008:0029:EN:PDF> 49
European Commission Directorate General JRC Joint Research Centre, 2004, Reference document of best available techniques for management of tailings and waste rock in mining activities, Reference Document on Best Available Techniques for Management of Tailings and Waste-rock in Mining Activities – 21.2 Mb accessed August 2010. <http://eippcb.jrc.es/pub/english.cgi/d1056340/25> 50
Clean Air Act 1990 (United States) 51
40 CFR Part 60, Standards of Performance for Coal Preparation and Processing Plants; Final Rule part of EPA Title 40, Protection of Environment, Chapter 1, Environmental Protection Agency, Sub Chapter C Air Programs Standards of Performance for new Stationary Sources (United States) <http://ecfr.gpoaccess.gov/cgi/t/text/text-idx?c=ecfr&tpl=/ecfrbrowse/Title40/40cfr60_main_02.tpl> 52
Environmental Planning and Assessment Act 1979 (New South Wales, Australia) 53
Environmental Protection Act 1994 (Queensland, Australia) 54
Environmental Protection (Air) Policy 2008 (Queensland, Australia) 55
Environmental Protection Regulation 1998 (Queensland, Australia) 56
Sustainable Planning Act 2009 (Queensland, Australia) 57
Mineral Resources (Sustainable Development) Act 1990 (Victoria, Australia) 58
Environmental Effects Act 1978 (Victoria, Australia) 59
Environment Protection Act 1970 (Victoria, Australia) 60
Public Law 95-97 Surface Mining Control and Reclamation Act 1977 (United States) accessed August 2010. <http://www.osmre.gov> 61
US Environmental Protection Agency 2010, National Ambient Air Quality Standards (NAAQS), Air and Radiation, viewed 10 August 2010. <http://www.epa.gov/air/criteria.html>

Katestone Environmental Pty Ltd KE1006953 OEH
June 2011
Page 280
62
Maricopa County Air Quality Department 2010, State Implementation Plan, viewed 10 August 2010. <http://www.maricopa.gov/aq/divisions/planning_analysis/state_implementation_plan.aspx>
63
EPA Title 40, Protection of Environment, Chapter 1, Environmental Protection Agency, Sub Chapter C Air Programs Standards of Performance for new Stationary Sources (United States) 64
Wyoming Department of Environmental Quality USA Air Quality Division Standards and Regulations, Chapter 6 Permitting Requirements. 65
West Virginia Coal Surface Reclamation Mining Rule 66
Air Pollution Control Act (West Virginia, United States) 67
United Nations, 2010, National Reports, Canada, Mining, viewed 10 August 2010. <http://www.un.org/esa/dsd/dsd_aofw_ni/ni_pdfs/NationalReports/canada/Mining.pdf> 68
Environmental Protection Act 1999 (Canada) 69
Canadian Environmental Assessment Act 1992 (Canada) 70
Fisheries Act 1985 (Canada) 71
Navigable Waters Protection Act 1985 (Canada) 72
Migratory Birds Convention Act 1994 (Canada) 73
Labour Code Part 11 1985 (Canada) 74
Mining Act 1990 (Ontario, Canada) 75
Ministry of the Environment Ontario 2010, Ontario‟s Ambient Air Quality Criteria, viewed 10 August 2010. <http://www.ene.gov.on.ca/publications/6570e-chem.pdf>
76
Environment Protection Act RSO 1990 (Ontario, Canada) 77
Quebec, Editeur Officiel du Qjebec (Ministère du Développment durable, de l‟Environnement et des Parcs, 2002, viewed 10 August 2010. <http://www.mddep.gouv.qc.ca/industriel/inter_en.htm> 78
Mines Act (including Health, Safety & Reclamation Code & Mineral Exploration Code, RSBC 1996, Chapter 293 (Victoria, British Columbia, Canada) 79
Environmental Assessment Act, SBC 2002, Chapter 43 (Victoria, British Columbia, Canada) 80
Environmental Land Use Act, RSBC 1996, Chapter 117 (Victoria, British Columbia, Canada) 81
Environmental Management Act 2004 (Victoria, British Columbia, Canada) 82
Health Act RSBC 1996 (Victoria, British Columbia, Canada) 83
Mines and Minerals Act O.C. 371/2008 (Alberta, Canada) 84
Mines and Minerals Administration Regulation, Alta, Reg 262.1997 (Canada) 85
Government of Alberta, Ministry of Energy 2010, Minerals Acts & Regulations, viewed 20 August 2010. <http://www.energy.gov.ab.ca/minerals/714.asp>

Katestone Environmental Pty Ltd KE1006953 OEH
June 2011
Page 281
86
Environmental Protection and Enhancement Act RSA 2000 c.E-12 (Alberta, Canada) 87
Environment Assessment (Mandatory and exempted activities) Regulation 111/1993 (Alberta, Canada). 88
Framework Directive 96/62/EC, 1-3 daughter Directives 1999/30/EC, 2000/69/EC, 2002/3/EC, and Decision on Exchange of Information 97/101/EC. 89
European Union, European Law, Directive Eur – Lex, Access to European Law Directive, 2008/50/EC Effective 11 June 2008. 90
EUR-Lex Access to European Law, 2004, Legislative Instrument Details: Questionnaire for Annual Reporting on Ambient Air Quality Assessment and Management (2004/461/EC). 91
Federal Mining Act 13.8 1980, 32004D0073 (Germany) 92
United Nations 2010, National Reports, Germany, Mining, viewed 27 August 2010. <http://www.un.org/esa/dsd/dsd_aofw_ni/ni_pdfs/NationalReports/germany/mining.pdf> 93
United Nations 1990, Ordinance on the Environmental Impact Assessment of Mining Projects of 1990.
94
European Commission Environment, 1985, Environmental Assessment, Council Directive of 27 June 1985 on the Assessment of the Effects of certain Public and Private Projects on the Environment, 85/337/EEC, Reference Official Journal No. L175 5/7/1985 P 0040 – 0048. 95
European Commission Environment, Community Legislation, Summary of EU Legislation of Mining Waste, Directive 2006/21/EC of the European Parliament and of the Council on the Management of Waste from the Extractive Industries. 96
Federal Immission Control Act (Technical Instructions on Air Quality Control) 1990 (Germany) <http://www.bmu.de/files/pdfs/allgemein/application/pdf/taluft_engl.pdf> 97
New Zealand Government, Ministry for Economic Development – Crown Minerals, accessed on 15 November 2010. <http://www.crownminerals.govt.nz> 98
Crown Minerals Act 1991 (New Zealand) 99
Resource Management Act 1991 (New Zealand) 100
Crown Minerals (Minerals and Coal) Regulations 2007 (New Zealand) 101
Crown Minerals (Minerals fees) Regulations 2006 (New Zealand) 102
State Environmental Planning Policy (Major Developments) 2005 (New South Wales, Australia) 103
Department of Planning 2006, Instrument of Consent for the Wilpinjong Coal Project, viewed 11 November 2010. <http://majorprojects.planning.nsw.gov.au/files/9315/05_0021_instrument_of_consent.pdf> 104
State Development and Public Works Organisation Act 1971 (Queensland, Australia) 105
Mineral Resources Act 1989 (Queensland, Australia) 106
Petroleum and Gas Act 2004 (Queensland, Australia)

Katestone Environmental Pty Ltd KE1006953 OEH
June 2011
Page 282
107
Department of Environment and Resource Management 2010, EIS processes, viewed 2 November 2010. <http://www.derm.qld.gov.au/environmental_management/impact_assessment/eis-processes/documents/generic-draft-tor.doc> 108
Region 9, National Environment Policy Act 1969 (United States) 109
Council on Environment Quality (CEQ), 2007, A Citizen‟s Guide to the NEPA, Having Your Voice Heard, viewed 1 September 2010. <http://ceq.hss.doe.gov/nepa/Citizens_Guide_Dec07.pdf> 110
Administrative Procedure Act 1949 (Germany). 111
US Environmental Protection Agency 2010, Technology Transfer Network, Clearinghouse for Inventories & Emissions Factors, viewed 20 August 2010. <http://www.epa.gov/ttn/chief/ap42/index.html> 112
40 CFR Part 51 - Revision to the Guideline on Air Quality Models: Adoption of a Preferred General Purpose (Flat and Complex Terrain) Dispersion Model (United States). 113
US Environmental Protection Agency 2010, Support Center for Regulatory Atmospheric Modeling, Permit Modeling Guidance, viewed 17 August 2010. <http://www.epa.gov/ttn/scram/guidance_permit.htm> 114
US Environmental Protection Agency 2010, Support Center for Regulatory Atmospheric Modeling, State Implementation Plan (SIP) Attainment Demonstration Guidance, viewed 17 August 2010. <http://www.epa.gov/ttn/scram/guidance_sip.htm> 115
Wyoming Department of Environmental Quality, WDEQ, 2010, Guidance for Submitting Major Source/PSD Modeling Analyses 116
Wyoming Department of Environmental Quality, WDEQ, 2010, Guidance for Conducting Near-Field Modelling Analyses for Minor Sources 117
Wyoming Department of Environmental Quality, WDEQ, 2006, Memorandum – PRB Coal Mine Permitting Guidance 118
West Virginia Department of Environmental Protection 2010, Permitting Handbook, viewed 20 August 2010. <http://www.dep.wv.gov/dmr/handbooks/Pages/page1.aspx> 119
Protection of the Environment Operations (General) Regulation 2009 (New South Wales, Australia), viewed 11 November 2010. <http://www.legislation.nsw.gov.au/scanview/inforce/s/1/?SRTITLE=%22Protection%20of%20the%20Environment%20Operations%20%28General%29%20Regulation%202009%22&nohits=y> 120
40 CFR Title 40 Protection of Environment, Part 70, 1992, State Operating Permit Programs (United States) 121
Environmental Quality Act (Quebec, Canada) <http://www2.publicationsduquebec.gouv.qc.ca/dynamicSearch/telecharge.php?type=2&file=/Q_2/Q2_A.html> 122
Air Quality Act 2004 (Republic of South Africa) 123
Mine Health and Safety Act 1996 (Republic of South Africa)
124
World Health Organisation (2006), Air quality guidelines. Global Update 2005. Particulate matter, ozone, nitrogen dioxide and sulfur dioxide, ISBN 92 890 2192 6, World Health Organisation 2006.

Katestone Environmental Pty Ltd KE1006953 OEH
June 2011
Page 283
<http://www.euro.who.int/__data/assets/pdf_file/0005/78638/E90038.pdf> 125
US Environmental Protection Agency 1998, AP 42, Fifth Edition, Volume I Chapter 11: Mineral Products Industry, 11.9 Western Surface Coal Mining, Technology Transfer Network, Clearinghouse for Inventories & Emission Factors, United States Environmental Protection Agency, Research Triangle Park, NC 27711, USA. <http://www.epa.gov/ttn/chief/ap42/ch11/final/c11s09.pdf > 126
NERDDC (1988), Air Pollution from Surface Coal Mining: Volume 2 Emission Factors and Model Refinement, National Energy Research and Demonstration Council, Project 921. 127
US Environmental Protection Agency 2010, Technology Transfer Network, Clearinghouse for Inventories & Emission Factors, viewed 10 August 2010. <http://www.epa.gov/ttn/chief/ap42/index.html> 128
US Environmental Protection Agency 2006, AP 42, Fifth Edition, Volume I Chapter 13: Miscellaneous Sources, 13.2.2 Unpaved Roads, Technology Transfer Network, Clearinghouse for Inventories & Emission Factors, United States Environmental Protection Agency, Research Triangle Park, NC 27711, USA. <http://www.epa.gov/ttn/chief/ap42/ch13/final/c13s0202.pdf> 129
Foley, G., Cropley S., Giummarra G., 1996, Road Dust Control Techniques - Evaluation of Chemical Dust Suppressants. Performance. Special Report 54 to ARRB Transport Research Limited, Australia. 130
IEA Coal Research, 1994, Control of Coal Dust in Transit and in Stockpiles. 131
Midwest Research Institute, 2006, Background document for revisions to fine fraction ratios used for AP-42 fugitive dust emission factors, MRI Project No. 110397, Western Governors‟ Association, Western Regional Air Partnership (WRAP). 132
State and Territorial Air Pollution Program Administrators (STAPPA) and Association of Local Air Pollution Control Officials (ALACO), 2006, Controlling Fine Particulate Matter under the Clean Air Act. A Menu of Options, Chapter 20 Fugitive Dust. USA. 133
Tannant, D.W., Regensburg, B., 2001, Guidelines for Mine Haul Road Design, Canada. 134
Thompson, R.J., Visser, A.T., 2007, Selection, Performance and Economic Evaluation of Dust Palliatives on Surface Mine Haul Roads, The Journal of The Southern African Institute of Mining and Metallurgy, Volume 107. 135
Organiscak, J.A., Page, S.J., Cecala, A.B., Kissell, F.N., Chapter 5. – Surface Mine Dust Control. Handbook for Dust Control in Mining. IC9465 Information Circular 2003. <www.cdc.gov/NIOSH/Mining/pubs/pdfs/2003-147.pdf> 136
US Environmental Protection Agency 1992, Fugitive Dust Background Document and Technical Information Document for Best Available Control Measures, Document EPA-450/2-92-004. 137
Thompson, R J, Visser, A T 2006, Selection and maintenance of mine haul road wearing course materials, Mining Technology Vol. 15 No. 4. 138
Chaulya, S K 2004, Assessment and Management of Air Quality for an Opencast Coal Mining Area, Journal of Environmental Management 70, 1-14. 139
Craig, A J, Director of Mining at Midwest Industrial Supply - comment in International Mining, 2010 Haul Roads and Tyres – Tread Carefully. 140
Spraying Systems Co. 2008, A Guide to Spray Technology for Dust Control.

Katestone Environmental Pty Ltd KE1006953 OEH
June 2011
Page 284
141
Ghose, M.K., and Majee, S.R., 2001, Air Pollution Caused by Opencast Mining and its Abatement Measures in India. Journal of Environmental Management, 63, 193-202. 142
Organiscak, J.A., Page, S.J., Cecala, A.B., Kissell., F.N., Chapter 5. – Surface Mine Dust Control. Handbook for Dust Control in Mining. IC9465 Information Circular 2003. <www.cdc.gov/NIOSH/Mining/pubs/pdfs/2003-147.pdf.> 143
US Department of Agriculture, Forest Service, Technology and Development Program. 1999, Dust Palliative Selection and Application Guide. 144
Bohn, R., Cuscinio, T., Cowherd, C., 1978, Fugitive Emissions from Integrated Iron and Steel Plants, Prepared by Midwest Research Institute for USEPA. EPA Report Mo. EPA-600/2-78-050, NTIS Report No. PB-281322. 145
US Environmental Protection Agency 2006, AP 42, Fifth Edition, Volume I Chapter 13: Miscellaneous Sources, 13.2.5 Industrial Wind Erosion, Technology Transfer Network, Clearinghouse for Inventories & Emission Factors, United States Environmental Protection Agency, Research Triangle Park, NC 27711, USA. <http://www.epa.gov/ttn/chief/ap42/ch13/final/c13s0205.pdf> 146
Australian Government Department of Resources, Energy and Tourism 2009, Leading Practice Sustainable Development Program for the Mining Industry, Airborne Contaminants, Noise and Vibration, October 2009. 147
Toy, T.J., 1979, Potential Evapotranspiration and Surface-mine Rehabilitation in the Powder River Basin, Wyoming and Montana. Journal of Range Management, Volume 32, No. 4, pp312-317. 148
Surface Mine Control and Reclamation Act of 1977 (United States) 149
CARB, 2002, Evaluation of Air Quality Performance Claims for Soils-Cement Dust Suppressant. 150
Park, C.W., Lee, S.J., 2002, Verification of the shelter effect of a windbreak on coal piles in the POSCO open storage yards at the Kwang-Yang works. Atmospheric Environment, Vol.36, 13, 2171-2185. 151
US Environmental Protection Agency 2006, AP 42, Fifth Edition, Volume I Chapter 13: Miscellaneous Sources, 13.2.5 Industrial Wind Erosion, Technology Transfer Network, Clearinghouse for Inventories & Emission Factors, United States Environmental Protection Agency, Research Triangle Park, NC 27711, USA. <http://www.epa.gov/ttn/chief/ap42/ch13/final/c13s0205.pdf> 152
IEA Coal Research, 1994, Control of Coal Dust in Transit and in Stockpiles. 153
Connell Hatch 2008, RG Tanna Dust Benchmarking Gladstone Port Coal Losses and Air Quality Study, Report to Central Queensland Ports Authority, Revision 4.1, 12 March 2008, viewed 29 August 2010. <http://www.cqpa.com.au/Pages/Publications/RGTCTBenchmarkingStudy/RGTCTBenchmarkingStudyFullReport2008.PDF> 154
NSW Minerals Council 2000, Technical Paper Particulate Matter and Mining Interim Report. 155
Billman, B.J., Arya, 1985, Windbreak effectiveness for storage-pile fugitive dust control, USEPA Report No. EPA/600/3 - 85/059. 156
US Environmental Protection Agency 1986, Field Evaluation of Windscreens as a Fugitive Dust Control Measure for Material Storage Piles, Document EPA/600/S7-86/027. 157
Carnes, D, Drehmel, D C 1981, The Control of Fugitive Emissions using Windscreens. Third Symposium on the Transfer and Utilization of Particulate Control Technology, Orlando, Florida.

Katestone Environmental Pty Ltd KE1006953 OEH
June 2011
Page 285
158
Stunder, B J B, Arya, S P S, 1988, „Windbreak effectiveness for storage pile fugitive dust control: a wind tunnel study‟, Journal Air Pollution Control Association, Volume 38, No. 2. 159
Faveri, D.M de., Converti, A., Vidili A., Campidonico A., Ferraiolo, G., 1990, Reduction of the environmental impact of coal storage piles: a wind tunnel study, Atmospheric Environment, 24A (11); 2787-2793. 160
Martin, D., Drehmel, D.C., 1981, The Influence of Aggregate Pile Shape and Orientation on Particulate Fugitive Emissions. Third Symposium on the Transfer and Utilization of Particulate Control Technology, Orlando, Florida. 161
Ohio EPA, 1980, Reasonably Available Control Measures for Fugitive Dust Sources, Office of Air Pollution Control, Division of Engineering, Columbus OH, 43216. NTIS Report No. PB82-103805. 162
Currier, E.L., Neal, B.D., 1979, Fugitive Emission from Coal-Fired Power Plants, 72nd
Annual Meeting of the Air Pollution Control Association, Cincinnati, OH. June 24-29, 1979. Paper 79-11.4.
163
Jutze, G.A., Zoller J.M., Janszen T.A., Amick R.S., Zimmer C.E., 1977, Technical Guidance for Control of Industrial Process Fugitive Particulate Emissions, prepared by PEDCo-Environmental, Inc. for USEPA. EPA Report No. EPA-450/3-77-010. 164
Davis, E.A., 1981, Fugitive dust emissions from the Proposed Vienna Unit No. 9. Prepared by the Johns Hopkins University Applied Physics Laboratory for the Maryland Power Plant Siting Program. NTIS Report No. PB81-190175. 165
Ohio EPA (1980), Reasonably Available Control Measures for Fugitive Dust Sources. Office of Air Pollution Control, Division of Engineering, Columbus OH, 43216. NTIS Report No. PB82-103805. 166
TRW (1982), BACT and Fugitive Emissions Evaluation of Kentucky Utilities – Hancock Station PSD Application, Prepared for US EPA Region IV. 167
Countess Environmental, 2006, WRAP Fugitive Dust Handbook, Western Governor‟s Association 168
US Environmental Protection Agency 1983, AP 42, Fourth Edition, Volume I Chapter 8: Mineral Products Industry, 8.24 Western Surface Coal Mining, Technology Transfer Network, Clearinghouse for Inventories & Emission Factors, United States Environmental Protection Agency, Research Triangle Park, NC 27711, USA. <http://www.epa.gov/ttn/chief/ap42/oldeditions/4th_edition/ap42_4thed_orig.pdf> 169
UK Coal 2007, Surface Mining Operations, viewed 20 August 2010. <http://www.ukcoal.com/surface-mining-ops> 170
Mattis, A.R., Cheskidov, V.I., Labutin, V.N., Zaitsez D., 2004, Blast Free Technology of Mineral Mining: State and Prospects, Source: Journal of Mining Science, Volume 40, Number 2, March 2004, pp. 173-181(9). 171
Mattis, A.R., Cheskidov, V.I., Labutin, V.N., Zaitsez D., 1995, Russian mining technique avoids blasting, Coal International 243(3) p,110. 172
Reed, W.R., Organiscak, J.A., Page, S.J., 2004, New Approach Controls Dust at the Collector Dump Point. <http://www.e-mj.com> 173
US Bureau of Mines, 1994, Improved Dust Control for Surface Coal Mine Drilled with Rotoclone Collectors. Technology News. Bureau of Mines, US Department of the Interior. 174
New South Wales Mineral Council, 2000, Particulate matter and mining, NSW Minerals Council Technical Paper.

Katestone Environmental Pty Ltd KE1006953 OEH
June 2011
Page 286
175
Buonicore, A J, Davis, W T (ed.) 1992, Air Pollution Engineering Manual, US Air and Water Management Association, Van Nostrand Reinhold Company, June 1992. 176
BHP Billiton Sustainability Report 2005, Managing dust suppression issues at our operations, accessed August 2010 <http://sustainability.bhpbilliton.com/2005/repository/environment/> 177
US Environmental Protection Agency 2006, AP 42, Fifth Edition, Volume I Chapter 13: Miscellaneous Sources, 13.2.4 Aggregate Handling and Storage Piles, Technology Transfer Network, Clearinghouse for Inventories & Emission Factors, United States Environmental Protection Agency, Research Triangle Park, NC 27711, USA. <http://www.epa.gov/ttn/chief/ap42/ch13/final/c13s0204.pdf> 178
Bengalla Coal Mine 2010, Processing, viewed 15 August 2010. <http://www.bengallamine.com/pages/map/index.html> 179
Connell Hatch, 2008, Environmental Evaluation Coal Dust Emissions Literature Review, Report to Queensland Rail.
180
Australian Standard 1993, Guide to the technical evaluation of higher rank coal deposits, AS2519-1993, Standards Australia, Homebush, NSW. 181
BHP Billiton 2010, Mt Arthur Coal Annual Environmental Management Report 2009, viewed 12 August 2010. <http://www.bhpbilliton.com/bbContentRepository/docs/2009MtArthurCoalEnvironmentManagementReportWeb.pdf> 182
Bengalla Mining Company Pty Limited 2010, Annual Environmental Management Report 2009, viewed 12 August 2010. <http://www.coalandallied.com.au/documents/2009_Bengalla_Annaul_Environmental_Managment_Report.pdf> 183
Hunter Water 2010, Water Charges, viewed 17 August 2010. <http://www.hunterwater.com.au/3217.aspx> 184
Australian Institute of Petroleum 2010, Pricing, viewed 17 August 2010, <http://www.aip.com.au/pricing/> 185
NSW Department of Industry & Investment 2010, Primary Industries, Minerals and Petroleum, Mining rehabilitation security, DPI schedule of rehabilitation costs, viewed 17 August 2010. <http://www.dpi.nsw.gov.au/__data/assets/pdf_file/0003/96114/DPI-Schedule-of-Rehabilitation-Costs.pdf>