nox formation in iron ore rotary kilns · the grate-kiln process, applied in the iron ore industry,...
TRANSCRIPT

THESIS FOR THE DEGREE OF DOCTOR OF PHILOSOPHY
NOx Formation in Iron Ore Rotary Kilns
Rikard Edland
Department of Space, Earth and Environment
CHALMERS UNIVERSITY OF TECHNOLOGY
Gothenburg, Sweden 2019
II
NOx Formation in Iron Ore Rotary Kilns
RIKARD EDLAND
ISBN 978-91-7905-139-6
© RIKARD EDLAND, 2019.
Doktorsavhandlingar vid Chalmers tekniska högskola
Ny serie nr 4606
ISSN 0346-718X
Department of Space, Earth and Environment
Chalmers University of Technology
SE-412 96 Gothenburg
Sweden
Telephone + 46 (0)31-772 1000
Printed by Chalmers Reproservice
Chalmers University of Technology
Gothenburg, Sweden 2019

III
NOx Formation in Iron Ore Rotary Kilns
RIKARD EDLAND
Division of Energy Technology
Department of Space, Earth and Environment
Chalmers University of Technology
ABSTRACT
Iron ore pellets are often produced using the so-called Grate-Kiln process, which is designed to
oxidize the magnetite (Fe3O4) to hematite (Fe2O3) and to sinter the pellets so they can be used
in steel manufacturing. The heat required for this process comes from the combustion of a
pulverized fuel in a rotary kiln, involving the formation of a jet flame. To oxidize the pellets,
large amounts of air are introduced into the kiln, and an air-to-fuel equivalence ratio of 4–6 is
obtained. Furthermore, the air is pre-heated to >1000°C. High temperatures and large amounts
of excess air are known to promote NOx formation and NOx emissions from iron ore processing
plants are in general high.
This thesis describes the NOx formation in the rotary kiln and identifies the governing
parameters, with the aim of reducing the emissions. The work involves experiments in a pilot-
scale kiln, as well as modeling work based on the same experiments. Data from a full-scale iron
ore pelletization plant are also provided.
From the experiments and the modeling work in this thesis, thermal NO is deemed to be of low
importance in iron ore rotary kilns when solid fuels are combusted. Instead, the conditions
during char combustion contribute significantly to the overall NOx formation. These results
explain why many of the primary measures used to date have failed to achieve reductions in
NOx emissions. Suggested additional primary measures include: raising the pyrolysis
temperature (e.g., through oxygen addition) to deplete the char of nitrogen; or switching to a
fuel with a lower nitrogen content (e.g., wood pellets). These are interesting alternatives for the
future, and the latter may be tested in the coming years.
Keywords: Nitrogen oxides, combustion chemistry, emissions control, rotary kiln, Grate-Kiln
process

IV

V
List of publications
The thesis is based on the following papers, which are referred to in the text according to their
Roman numerals:
Paper I. R. Edland, F. Normann, C. Fredriksson, K. Andersson, Implications of fuel
choice and burner settings for combustion efficiency and NOx formation in PF-
fired iron ore rotary kilns, Energy and Fuels, 2017, 31 (3), pp 3253–3261.
Paper II. R. Edland, F. Normann, K. Andersson, Modelling the contribution from volatile
and char bound nitrogen to NOx formation in iron ore rotary kilns, Energy and
Fuels, 2018, 32 (2), pp 2321-2331.
Paper III. R. Edland, F. Normann, T. Allgurén, C. Fredriksson, K. Andersson, Scaling of
Pulverized-Fuel Jet Flames That Apply Large Amounts of Excess Air—
Implications for NOx Formation, Energies, 2019, 12(40), Article number 2680
Paper IV. R. Edland, N. Smith, F. Normann, T. Allgurén, C. Fredriksson, T. Fletcher, K.
Andersson, Evaluation of NOx reduction measures for iron ore rotary kilns,
Submitted.
Paper V. R. Edland, T. Allgurén, F. Normann, A. Fry, E. Eddings, K. Andersson, The
relevance of homogeneous and heterogeneous reactions for NO formation in
three PF-flame types, Submitted.
Rikard Edland is the principal author of all five papers. Associate Professor Fredrik Normann
and Professor Klas Andersson contributed with discussions and editing for all the papers. Dr.
Christian Fredriksson organized the experimental campaign in Paper I and provided the
industrial perspective in Papers I–IV. Dr. Thomas Allgurén contributed with discussions and
editing of Papers III–V and performed the experiments presented in Paper V. Professor Tom
Fletcher conducted the flat-flame experiments described in Paper IV. Neil Smith contributed
with discussion and input to Paper IV. Professors Andrew Fry and Eric Eddings organized the
measurement campaign in Paper V.

VI
Additional work has been carried out during the period of the thesis work, as listed below. These
papers are not included in the thesis due to either overlap with the appended papers or their
being outside the scope of the current thesis.
a) R. Edland, F. Normann, C. Fredriksson, K. Andersson, Formation of nitrogen oxides
in rotary kiln burners: an assessment of pilot scale experiments using gaseous, liquid
and solid fuels, INFUB Conference 2015.
b) R. Edland, F. Normann, K. Andersson, Nitrogen chemistry in rotary kiln flames:
Impact of mixing rate and temperature at high air to fuel ratios, Nordic Flame Days
Conference 2016.
c) R. Edland, T. Allgurén, F. Normann, K. Andersson, The connection between NOx and
soot in oxygen-enriched propane flames, Clearwater Clean Energy Conference 2018.
d) R. Edland, T. Allgurén, F. Normann, K. Andersson, Formation of soot in oxygen-
enriched propane flames, Submitted for publication 2019.

VII
Acknowledgments
First of all, I want to express my gratitude to my supervisors professor Klas Andersson and
associate professor Fredrik Normann who made this thesis possible. Thank you for entrusting
me with this work, for sharing your expertise and for providing me with your valuable guidance.
LKAB and the Swedish Energy Agency are acknowledged for their financial support. A special
thanks to doctor Christian Fredriksson for productive discussions and a willingness to work
together and share data.
I’m very grateful for having Adrian Gunnarsson as a close colleague and now as a close friend.
Thank you for the many hours shared in the office and out in the field. A big thanks to Thomas
Allgurén for being one of the few people that I can discuss combustion chemistry and video
games with, and for acting as a mentor. I am also grateful to the rest of the Combustion and
Carbon Capture Technologies group (Dan, Max, Jakob, Rubén, Johanna) for entertaining
meetings and interesting discussions. I’m very happy that Angelica Gyllén has been my
officemate, thank you for all the interesting discussions we’ve had and for your moral support.
To the rest of Energy Technology: thank you for contributing to a stimulating and fun working
environment, and thanks to everyone who organizes board game nights, lunch-running and
other events. An extra appreciation goes to the A-team for all the work that you do behind the
scenes that enables us to work and have a good time.
Furthermore, thanks to all my friends outside of Energy Technology and Chalmers for making
my life so enjoyable, whether it is by playing sports, video games, music or just spending quality
time together. You’re too many to mention but know that you are loved and appreciated. My
family receives my deepest gratitude: my brother for being a great friend and someone that I’ve
looked up to my entire life; my father for always believing in me and my technical skills; and
to my mother for the unyielding support and love you always give me.
My final acknowledgement goes to my girlfriend Sofie. Thank you for being by my side and
for being the lovely person you are. You light up my life.
Rikard Edland
Gothenburg, Sweden
July 2019

VIII

IX
Table of contents
1 Introduction ........................................................................................................................ 1
1.1 Aim .............................................................................................................................. 1
1.2 Outline of the thesis ..................................................................................................... 2
2 Background ........................................................................................................................ 3
2.1 Atmospheric pollution ................................................................................................. 3
2.2 Iron ore industry .......................................................................................................... 5
3 Theory ................................................................................................................................ 7
3.1 NO formation ............................................................................................................... 7
3.2 Fuel-N evolution during solid fuel combustion ........................................................... 8
3.3 General NOx mitigation strategies ............................................................................. 14
3.4 Scaling ....................................................................................................................... 15
3.5 Units of emission measurements ............................................................................... 17
4 Previous work on NOx formation in rotary kilns ............................................................. 19
4.1 Cement industry ......................................................................................................... 19
4.2 Iron ore industry ........................................................................................................ 20
5 Experimental .................................................................................................................... 21
5.1 Combustion facilities ................................................................................................. 21
5.2 In-flame measurements .............................................................................................. 25
6 Modeling .......................................................................................................................... 31
6.1 Model description ...................................................................................................... 31
6.2 Modeling NO formation ............................................................................................ 34
7 Results and Discussion ..................................................................................................... 37
7.1 NO formation routes .................................................................................................. 37
7.2 The impact of fuel type on NOx emissions ................................................................ 38
7.3 The impact of burner settings on NOx emissions ...................................................... 40
7.4 NOx mitigation measures ........................................................................................... 41
7.5 Comparison to a conventional state-of-the-art flame ................................................ 44
8 Conclusion ........................................................................................................................ 47
9 Outlook ............................................................................................................................. 49
References ................................................................................................................................ 50

X

1
1 Introduction
Air pollution is a topic of major concern that receives considerable attention due to the negative
impacts that it has on humans and the environment. It is even a major part of the UN
sustainability Goal 7 – Affordable and Clean Energy. A solid body of literature [1-7] supports
the notion that exposure to air pollution is harmful to the cardiovascular, circulatory and
respiratory systems of humans, and thus shortens life expectancy. It is also well-known that
vegetation and wildlife suffer because of air pollution [8-10]. Today, the emission of pollutants
from conventional combustion processes, e.g., in the automotive industry and the heat and
power industry, is strictly regulated in many parts of the world. Emissions from industrial
processes that apply less-conventional combustion systems have received less attention and
now typically lie above e.g., conventional power plants that apply state-of-the-art technologies.
However, this situation is changing, and smaller industrial processes are starting to attract more
attention regarding their emissions.
The Grate-Kiln process, applied in the iron ore industry, is an example of an industrial process
that is attracting increased attention regarding emissions reductions. The Grate-Kiln process
applies combustion of a fuel together with large volumes of pre-heated (>1000°C) air in a rotary
kiln, so as to provide heat for the iron ore. These conditions promote the formation of high
levels of nitrogen oxide (NOx). The rotation of the kiln, the combustion conditions, and the
requirement for a high-quality product (iron ore pellets) make the implementation of many
conventional NOx mitigation techniques unfeasible. Therefore, it is important to understand and
describe accurately the mechanisms governing NOx formation, so as to identify and evaluate
the mitigation possibilities. This has taken on greater importance in recent times as demands
for CO2 level reductions and fuel flexibility have grown, and these drivers may give rise to
additional changes in the process. Furthermore, it is important to ensure that any measures
applied in pilot-scale are correctly scaled up to the commercial scale.
1.1 Aim
This work characterizes the formation of NOx in industrial jet flames, specifically in the Grate-
Kiln process, with the aim of supporting the development of suitable emission control. A
combination of experimental and modeling work is used to investigate the formation of NOx,
as well as to evaluate potential mitigation measures. The importance of scaling is also discussed,
as it is an important element in ensuring impact in the full-scale setup. Two key research areas
are identified:
A. Characterization of the NOx formation mechanism in jet flames applied to iron ore
rotary kilns.
B. Identification of measures for reducing NOx emissions in iron ore rotary kilns.

2
1.2 Outline of the thesis
This thesis consists of a summary and the five appended papers. Chapter 2 places the work in
context by presenting the trends in atmospheric pollution and describing the issues with respect
to NOx formation in the iron ore industry. Chapter 3 presents the theoretical framework of the
processes that govern NOx formation. Chapter 4 summarizes the previously conducted research
on NOx mitigation in rotary kilns. Chapters 5 and 6 describe the experimental and numerical
methods used. Chapter 7 describes the results and a discussion thereof. The thesis concludes
with a summary and some ideas for future work.
The papers upon which the thesis is built are described briefly below.
Paper I is an experimental investigation of the impacts of the fuel characteristics and
combustion parameters on NOx formation in rotary kilns. Four coals, as well as co-firing of coal
and biomass were tested in a pilot-scale kiln (580 kW), and several burner settings were
investigated.
Paper II assesses the importance of the NOx formation mechanisms in iron ore rotary kiln
flames using detailed reaction modeling, based on the results obtained in Paper I. A couple of
theoretical NOx mitigation measures are evaluated.
Paper III is an investigation of how the transition from pilot-scale to full-scale affects NOx
formation in iron ore rotary kilns. Emissions from a full-scale iron ore rotary kiln (40 MW) are
compared with those from a pilot-scale kiln (580 kW) for three coals and one heavy fuel oil,
and the mechanisms of NOx formation are discussed with the support from detailed reaction
modeling.
Paper IV evaluates NOx mitigation measures that have been tested over the years in both the
pilot-scale kiln and full-scale kiln owned by LKAB, in light of the more recent findings
presented in Paper III.
Paper V combines experimental and modeling work to evaluate NOx formation in two staged
1-MW flames and one unstaged 30-kW flame. The effect of flame type on NOx formation is
investigated, and the specific modeling approach that is best suited to each individual flame
type is explored.

3
2 Background
This section places the work of the thesis in context. A brief overview of atmospheric pollution
is presented, along with the trends in emissions since Year 1970. Atmospheric pollution is here
defined as contamination of the atmosphere and refers primarily to emissions that are directly
harmful to humans or the environment, although CO2 is also included. This is followed by a
brief description of the iron ore industry and the Grate-Kiln process.
2.1 Atmospheric pollution
Atmospheric pollution from anthropogenic activities is a worldwide concern. Occasionally,
nature produces what is considered a pollutant species of her own, e.g., through lightning or
volcanic eruptions. However, human industrial activities generate significantly more pollution
over time and tend to concentrate the pollution to areas where humans live [11]. Air pollution
from wood-burning fires was an issue already in ancient Rome, and fuel combustion related to
the manufacturing of lime, glass and brick resulted in significant pollution during the Middle
Ages [12]. The introduction of the steam engine in the 18th Century resulted in a surge of coal
combustion and, consequently, a substantial increase in production capacity and pollution.
While major advances have been made regarding the mitigation of pollution, industrialization
and the development of the internal combustion engine have led to a tremendous increase in
fuel combustion worldwide, which means that air pollution poses a major problem in many
parts of the world. The World Health Organization states that “Air pollution represents the
biggest environmental risk to health. In 2012, one out of every nine deaths was the result of air
pollution-related conditions” [2].
One of the more direct and well-known consequences of pollution is smog. The visible pollution
from combustion, consisting of numerous substances, was mostly referred to as ‘smoke’ until
the 20th Century. The term ‘smog’, a combination of the words ‘smoke’ and ‘fog’, was
introduced in 1905 in Great Britain. The ‘smoke’ part of the word referred to direct emissions
from the combustion of coal and raw materials, while the ‘fog’ part referred to meteorological
inversion, whereby the gases closest to the earth surface are trapped (which facilitates fog
formation). London was particularly plagued by smog, especially in December 1952 when the
‘Great Smog of London’ occurred, killing thousands of people, perhaps as many as 12,000 if
one counts the high mortality rate in the subsequent months [13]. This type of smog is
sometimes referred to as ‘London-type smog’ and is a direct consequence of the incomplete
combustion or usage of dirty fuels. Such emissions, i.e., emissions that are emitted directly from
the combustion process, are designated as ‘primary emissions’. Since the 1950s, London-type
smog has been reduced in most cities in the Western world, partly due to the achievement of
higher combustion efficiencies and the reduced use of coal for domestic heating, but also due
to industries designing taller smokestacks (i.e., emitting at higher altitude) [14]. Today, another
type of smog, ‘photochemical smog’, is commonly seen in many cities, with Los Angeles being
a prime example. Several of the constituents of photochemical smog are formed through
chemical reactions that occur between primary emissions and the atmosphere and that are
activated by sunlight (hence ‘photochemical’). Such pollution is often referred to as ‘secondary
emissions’, since the main pollutants are not formed during the combustion process itself. The
key ingredients of photochemical smog are nitrogen oxide, hydrocarbons, and sunlight, while
the most hazardous components of photochemical smog are ozone and particulate matter [15].
Another major air pollution problem is acid deposition, in the form of either acid rain (wet
deposition) or gas and particles (dry deposition). Oxides of sulfur (SOx) and oxides of nitrogen
(NOx) that are released into the atmosphere can form acidic compounds, which can be
transported thousands of kilometers before being deposited. The resulting acidification of soil
4
and waterways is harmful to the vegetation and aquatic wildlife, and has caused severe
environmental problems in many parts of the world [10]. Scandinavia and parts of Germany
were particularly affected by acid rain during the period 1955–1970, and even though acid rain
is not as problematic today (Year 2019), many lakes are still being treated with lime in order to
adjust the pH-value of the water so that it can sustain life [16, 17].
The global emissions of NOx, SOx, PM2.5 and CO2 in the period of 1970–2012 (2017 for CO2)
are presented in Figure 1, based on the information in the EDGAR database [18, 19]. The global
NOx emissions have increased steadily, although Europe and the US have managed to reduce
their emissions. Global SOx emissions decreased between 1980 and 2000, although since Year
2000 they have been rising again, mainly due to increased coal combustion in China and India,
as well as an increase in global shipping. For the global PM2.5 emissions, i.e., particulate matter
with a diameter of <2.5 µm, a similar trend has been observed. It should be mentioned that the
PM2.5 data are based on the usage of fossil fuels. If biofuels are included, the emissions become
significantly higher due to domestic heating in many regions, especially in India and the “Rest
of the world”. CO2 emissions, which are also based on the combustion of fossil fuels, have seen
the most dramatic increases over the selected time period. In general, there is a distinct
correlation between CO2 emissions and emissions of pollutants such as NOx, SOx and PM. The
main reason for the relatively larger increase in CO2 emissions is that the other pollutants can
currently be controlled through combustion modifications (so-called ‘primary measures’) or
flue-gas cleaning (‘secondary measures’), while the capture of CO2 is not yet implemented on
a significant scale.
As mentioned above, Europe and the US have managed to reduce their emissions of NOx, SOx
and PM2.5. However, many Western industries are struggling to comply with new and more
stringent regulations. The energy sector and the transport sector have received a lot of attention
as they are the largest emitters. This has resulted in the development of primary and secondary
measures suited to, for example, boilers and engines. However, other industrial processes have
received less attention but often have significantly higher emissions than conventional
combustion plants.
The iron ore industry is in need of mitigation technologies that are adapted to its processes,
especially with respect to the generation of NOx. For SOx and PM, secondary measures are the
go-to alternative: they are relatively straightforward to implement albeit costly. For NOx,
primary measures are always preferred due to the cost of secondary measures. This applies even
more to iron ore pelletization plants, since the large flow of flue gases and the dusty
environment make secondary measures for NOx difficult to operate. However, primary
measures that are tailored to these processes have not yet been developed, so NOx emissions
remain high. According to the Swedish Environmental Protection Agency (Naturvårdsverket),
the top two point-sources of NOx emissions in Sweden are iron ore pelletization plants (as of
Year 2018) [20]. It should also be mentioned that although there is currently a correlation
between CO2 emissions and other pollutants, it is not necessarily the case that the levels of NOx
will decrease if the CO2 levels are decreased. Alternatives to fossil fuels, e.g., biomass,
hydrogen, or high-temperature electrification using plasma torches, may still generate
significant amounts of pollutants (especially NOx).

5
Figure 1. Global emissions of NOx, SOx, PM2.5, and CO2 (from fossil use). Note that the y-axis for CO2 is in units
of Gt/year. Data are taken from the EDGAR database [18, 19]
2.2 Iron ore industry
The main consumer of iron ore is in primary steelmaking. Since the Year 1950, the annual steel
production level has risen from 189 tonnes/year to 1,808 tonnes/year (Year 2018), with 50% of
this increase occurring since Year 2000 [21]. Postindustrial countries show a tendency towards
saturation of the steel demand when the in-use stock of steel is around 13 tonnes/capita [22],
i.e., not much new steel has to be produced once this is achieved. Countries that are undergoing
industrialization initially have a lower in-use stock of steel (in Year 2005, China and India had
stocks of 2.2 and 0.4 tonnes/capita, respectively[23]). However, they are likely to eventually
increase their steel stocks to around 13 tonnes/capita, so a continued global demand for primary
steel is expected. Thus, the demand for iron ore will also remain high.
In the steelmaking industry, two forms of iron ore are used: sinter and pellets. Pellets are often
preferred in both the steelmaking process and during transport due to their characteristics (e.g.,
geometry and strength) [24]. For the production of iron ore pellets, there are two main
processes: the Straight-Grate process, and the Grate-Kiln process. The advantages and
disadvantages of each process are discussed in the work of Zhu et al [25], with references to
Mourão et al [26]. However, both processes emit large amounts of NOx. The Swedish iron ore
industry is dominated by the company Luossavaara-Kiirunavaara Aktiebolag (LKAB). The
amount of NOx from LKABs Grate-Kiln plants are in the range of 150–175 g/tonne pellets,
according to available literature from Year 2006 [27]. Straight-Grate plants produce slightly
higher levels of NOx. The emissions from the Swedish plants are, however, lower than those
from pelletization plants in many other regions [28], although still high if compared with, for

6
example, power generation on a g/MJfuel basis. This thesis focuses on the Grate-Kiln process,
which is described in the following section.
The Grate-Kiln process
A schematic of the Grate-Kiln process is shown in Figure 2. While different manufacturing
plants may have slightly different configurations, the overall layout is the same. The green
(unprocessed) pellets are fed onto the grate, where they are dried and preheated by the
recirculated hot air flows from the cooler. The grate is divided into zones that receive air from
a corresponding zone in the cooler. If the iron ore contains magnetite (Fe3O4) a significant
amount of heat is released by its oxidation to hematite (Fe2O3), which occurs in the later stages
of the grate (TPH and PH in Figure 2). By the time they reach the end of the grate, the pellets
are of sufficient strength to be introduced into the rotary kiln, where they are sintered. The kiln
is slightly tilted, so that the pellets gradually move forward under gravity. Owing to the rotation
of the kiln, the pellets are thoroughly mixed, so that a uniform final product is obtained. The
heat required for sintering is transferred to the pellets by a flame, usually involving the
combustion of coal, although oil and gas are also used. The hot sintered pellets then proceed to
the cooler where they are cooled by ambient air. The warm air that exits the cooler is used for
preheating the pellets on the grate and as combustion air in the kiln. The air used in the kiln
comes from the first part of the cooler (C1 in Figure 2) and may have a temperature of >1100°C
at the inlet, which is significantly higher than the preheating temperature range of 300°–400°C
that is typical for the combustion air in heat and power generation plants. Although most of the
oxidation of the pellets occurs on the grate, it is important to maintain high levels of oxygen in
the kiln, to ensure a high degree of oxidation and to prevent reduction back to magnetite. Thus,
a large volumetric flow of air from C1 is needed. Relating the air flow to the fuel flow, an air-
to-fuel equivalence ratio of 4–6 is obtained in the kiln, which is significantly higher than the
equivalence ratio (of approximately 1) seen in conventional solid fuel combustion.
Figure 2. Schematic of the Grate-Kiln process. The dotted lines indicate the gas flows through the process. C1–
C4: Cooling sections.

7
3 Theory
Combustion is a complex process that involves numerous chemical reactions. For simplicity,
the written formulas are often representative of the overall reactions and only include the initial
reactants and final products. An example of this is the complete oxidation of methane:
𝐶𝐻4 + 2𝑂2 → 𝐶𝑂2 + 2𝐻2𝑂 R 3-1
In reality, a myriad of intermediate reactions occurs, involving hundreds of intermediate species
(e.g., CH3, OH, HO2, CO). Some of these species are relatively stable (e.g., CO), while others
are unstable (e.g., OH) and react rapidly with other compounds. The unstable species are mainly
radicals, i.e., they have an unpaired valence electron. Radicals are crucial to understanding the
progress of combustion, and they also govern the formation of pollutants during combustion.
The main bulk of the fuel ends up as CO2 and H2O, regardless of how the combustion progresses
(as long as enough oxygen is available). In contrast, reactive nitrogen species will be converted
to NOx or N2 depending on the progress of the combustion process and the distribution of
radicals. The distribution of radicals reflects the reaction rates of the relevant reactions, which
in turn are dependent upon the rate constants and the availability of reactants. The rate constant
is most commonly described by the modified Arrhenius expression (although other expressions
exist for e.g. surface reactions):
𝑘 = 𝐴𝑇𝑛𝑒−
𝐸𝑎𝑅𝑇 Eq. 1
where k is the rate constant, A and n are constants that describe the pre-exponential factor, T is
the temperature, Ea is the activation energy, and R is the gas-law constant. For many reactions,
n is equal to zero. Mathematically, this expression gives that the rate constant (and thus the
reaction rate) increases exponentially with temperature, as long as the activation energy is above
zero and the temperature is less than the value of Ea/2R. A high activation energy equals low
rates at low temperatures.
3.1 NO formation
NOx is a term that groups nitric oxide (NO) and nitrogen dioxide (NO2), and sometimes nitrous
oxide (N2O). In this work, only NO and NO2 are included in NOx. NOx is dominated by NO at
the high temperatures of combustion processes. Therefore, research on NOx is concerned with
the formation and destruction of NO rather than of NO2. However, the emitted NO rapidly
converts to NO2 at lower temperatures. This chapter describes the chemistry of NO during
combustion and considers the influences of various combustion parameters. The focus here is
on solid fuel combustion, as solid fuels are the most commonly used in the Grate-Kiln process.
NO may be formed from either the nitrogen introduced with the air (N2) or the nitrogen
introduced with the fuel (fuel-N). When firing gaseous or liquid fuels, it may be assumed that
all or most of the generated NO originates from N2, due to the absence or low level of fuel-N.
In contrast, fuel-N is usually the main contributor to NO in solid fuel combustion [29]. Although
NO formation is complex and includes hundreds of intermediate reactions, it is – for pedagogic
purposes – common to split the process into three main mechanisms:
• Thermal NO formation – reaction between N2 and O2 to form NO
• Prompt NO formation – reaction between N2 and fuel radicals to form NO
• Fuel NO formation – oxidation of fuel-N to form NO
8
Thermal NO formation, as the name suggests, is dependent upon a high temperature, since the
N2 molecule contains a strong triple bond that requires large amounts of energy for breakage.
The mechanism underlying thermal NO formation was first proposed by Zeldovich (after whom
the mechanism is named) [30]. Originally, the Zeldovich mechanism involved the two reactions
R 3-2 and R 3-3, while a third reaction, R 3-4, was added later:
𝑁2 + 𝑂 ↔ 𝑁𝑂 + 𝑁 R 3-2
𝑁 + 𝑂2 ↔ 𝑁𝑂 + 𝑂 R 3-3
𝑁 + 𝑂𝐻 ↔ 𝑁𝑂 + 𝐻
R 3-4
Thermal NO formation is limited by the forward reaction of R 3-2, and once activated, it
promotes the other reactions by providing N-radicals. The activation energy of R 3-2 is
approximately 318 kJ/mol. Typically, the formation rate of thermal NO becomes significant,
relative to other NO reactions, at around 1800 K, although the concentrations of all the included
species are important for determining the eventual rate. The gas residence times at these high
temperatures are also important in terms of the total amount of NO produced by the thermal
mechanism.
Prompt NO formation converts N2 into NO through an initiating reaction between a CH-radical
and an N2 molecule, to form NCN. The number of relevant reactions for this far exceeds the
number of reactions involved in thermal NO formation, which means that prompt NO formation
is significantly more complex. While prompt NO formation is rapid (hence its name), it is only
active in the presence of short-lived hydrocarbon radicals. It can play an important role in
hydrocarbon flames, although it is expected to be negligible when fuel-bound nitrogen is
present [31]. As this thesis focuses on solid fuel combustion (with fuel-bound nitrogen), prompt
NO will not be explicitly discussed, although considered in the simulations.
Fuel-N conversion is discussed in detail in the next section. In brief, the fuel-bound nitrogen
ends up either as NO or N2, depending on the local conditions during the combustion process.
In particular, the air-to-fuel equivalence ratio, λ, is important for fuel-N conversion. While
considerable progress has been made in understanding fuel NO formation [32], it includes many
different processes and is, to say the least, challenging to describe. Empirical data are still
needed to describe the formation, especially regarding the interactions between the solid and
gaseous phases.
Although it is convenient to define NO formation in this manner, these are not mutually
exclusive mechanisms. An illustrative example is R 3-2, which ably describes thermal NO
production as long as there are no other sources of NO. However, when NO is already present
(from, for example, the oxidation of fuel-N) the equilibrium of this reaction is shifted to the
reactant side in line with Le Chatelier’s principle, thereby reversing the reaction. According to
the work of Pershing and Wendt [29], temperatures above 2000 K may be required for thermal
NO to contribute significantly in PF flames. Given these types of interactions, determining the
contribution of each NO mechanism to the total NO formation is not a trivial task.
3.2 Fuel-N evolution during solid fuel combustion
A solid fuel particle undergoes several processing steps during combustion. In a pulverized fuel
(PF) flame, the particle is heated through convection and radiation from the upstream flame as
well as the walls, and the water contained in the particle starts to evaporate. For small particles,
as in PF flames, this process occurs rapidly (in a couple of milliseconds). Once the drying is
completed, the particle temperature increases, the particle starts to decompose, and volatile
compounds within the particle escape from the solid fuel matrix. This process is called

9
‘devolatilization’ or ‘pyrolysis’, depending on whether oxygen is present or not. For bituminous
coal particles, significant pressure builds up inside the particle, which causes the particles to
swell or fracture. The products of devolatilization are volatiles and char. The volatiles, which
comprise light-weight gases (such as CO and CH4), and the tars (heavier hydrocarbons) react
with oxygen to form a small flame envelope around the remaining particle. The processes of
devolatilization and volatile combustion occur on a time-scale similar to that of the drying
process. The solid fraction of the particle that remains after devolatilization is the char, which
consists mainly of carbon and ash, although small amounts of other elements are also present.
When the combustion of volatiles is complete and the flame envelope has disappeared, oxygen
reaches the surface of the char and may diffuse into the pores. Heterogeneous reactions between
the solid and the gaseous oxygen occur, and the products consist mainly of CO and CO2. The
time-scale for char combustion is considerably longer than those of the previous processes, and
usually takes hundreds of milliseconds to reach completion. Other gases, such as H2O and CO2,
may also react with the solid char. In this case, gasification rather than combustion of the char
occurs.
The fuel-bound nitrogen is released either with the volatiles or with the char, and the degree of
conversion to NO or N2 will depend on the local conditions. The following sections cover the
partitioning of nitrogen between volatiles (vol-N) and char (char-N) and the formation of NO
from vol-N and char-N. Thereafter, the reduction of NO is discussed.
Nitrogen partitioning during pyrolysis
The partitioning of nitrogen during pyrolysis is important for NO formation, since the
combustion process and the possibility for NOx control differ substantially between volatile-
and char-bound nitrogen. Even though different conditions yield different volatile products,
there is consensus regarding the importance of the pyrolysis temperature in dictating the amount
of fuel-N that is retained in the char. Figure 3 presents the percentages of nitrogen that are lost
with the volatiles during pyrolysis, based on the studies of Zhang and Fletcher [33], Blair et al
[34], Pohl et al [35], Solomon and Colket [36], and Kambara et al [37]. Even though there is a
clear trend showing that more nitrogen leaves with the volatiles at higher pyrolysis
temperatures, there are considerable differences between the test series. Blair et al [34] have
also compared the release rate of nitrogen to the release rate of total mass (which also increases
with temperature) during pyrolysis, and have concluded that nitrogen release is more sensitive
than mass release to temperature.
As is evident from the variability of the data points in Figure 3, the fraction of nitrogen that
leaves as vol-N is not predictable when it is based solely on the pyrolysis temperature. Kambara
et al [37] have stated that it is impossible to predict the partitioning of volatile nitrogen based
on proximate and ultimate analyses, given their finding that two coals with the same levels of
nitrogen and volatile matter yielded two different fractions. However, several models have been
subsequently developed that show reasonable success in predicting the composition and yield
of volatiles based on the chemical structures of the coals. Three commonly used pyrolysis
models are: FG-DVC [38], FLASHCHAIN [39], and CPD [40].

10
Figure 3. Nitrogen loss as a function of pyrolysis temperature. The data are taken from the indicated publications
[33-37]. Trend lines are shown for each investigated coal.
Vol-N conversion
The nitrogen-containing volatiles (vol-N) evolve mainly as light-weight nitrogen species (HCN
or NH3), either directly from the coal matrix or indirectly from the tar formed during pyrolysis.
Thereafter, they react with radicals to form either NO or N2. The conversion of light-weight
nitrogen gas species to NO is largely dependent upon the availability of oxygen. The conversion
can vary from 0% to 100% depending on the local conditions [35, 41]. Thus, if left uncontrolled,
vol-N can be a significant contributor to the total NO formation. Given that local stoichiometry
has such a strong impact, it is beneficial to design burners and combustion equipment so as to
create oxygen-lean combustion zones, thereby reducing the net NO formation. Miller and
Bowman [42] have carried out a thorough assessment of the oxidation of light-weight nitrogen
species, and the major reaction pathways for HCN and NH3 have been confirmed: nitrogen
atoms in HCN or NH3 end up as N radicals, which then react either with OH to form NO or
with NO to form N2. In other words, when N radicals are formed, the reactions with NO and
with OH compete with each other to form either N2 or NO. The rate constants of these reactions
are usually of similar magnitude, and the yields of NO and N2 are, thus, a function of the ratio
of the OH concentrations to the NO concentration.
Several detailed reaction mechanisms have been proposed for the homogeneous interplay
between hydrocarbon combustion and NO formation. The best-known of these is the GRI-Mech
mechanism [43], which has been widely used and refined in more recent studies. Such detailed
mechanisms are capable of describing the premixed gas flame chemistry with high accuracy. A
common approach is to assume that all of the vol-N is released as HCN or NH3 and, thereafter,
converted to NO and N2, depending on the local gas-phase conditions.
Nitrogen-containing volatiles that are not directly released from the coal matrix or from the tar
will be incorporated into the soot that is formed. The reported values for the fractions of volatile
nitrogen components trapped in the soot are generally low, even though they may reach up to
30% [44-46]. The importance of soot-bound nitrogen is not well understood. Soot itself can
effectively reduce the levels of NO [47, 48], although incorporated soot-N means that there are
lower concentrations of light-weight nitrogen gas species that are susceptible to primary NOx
reduction measures.

11
Char-N conversion
Since it is possible to reduce the conversion of vol-N to NO using controlled mixing of the
oxygen and fuel, the oxidation of char-N has grown in importance relative to the formation of
NO as the development of low-NOx burners has evolved. Phong-Anant et al [49], using a drop
tube reactor at different temperatures and stoichiometric ratios, found that for fuel-lean PF
combustion conditions (λ = 1.25– 1.67, T = 1673–1773 K), vol-N contributed more to the total
NO formation than did char-N. In the case of fuel-rich combustion (λ < 1), the contribution of
char-N was in the range of 60%–90%. Although char-N conversion has been extensively
studied, the results are not as conclusive as for vol-N. One challenge is to differentiate between
intrinsic char-N conversion, i.e., the selectivity of char-N towards NO (prior to its reduction by
the char), and apparent char-N conversion, i.e., the net conversion after NO reduction by char.
As NO is usually measured when the combustion process is completed, data for apparent char-
N conversion are more common in the literature than data for intrinsic char-N conversion. Table
1 presents several char-N conversion values obtained under conditions relevant to flame
combustion. The values vary within the range of 10%–100%. Different ideas have been put
forward to explain this variability. Most of the experimental studies performed [50-54] have
noted an increase in char-N conversion with increasing level of stoichiometry, although the
magnitude of the observed increase varies between studies. Jensen et al [55] found that the
conversion of char-N to NO was close to 100% when very small samples of char (<1 mg, to
minimize the NO-char reduction) were combusted at 1323 K and 1423 K, whereas for
combustion at 1123 K the conversion of char-N to NO was 65%. The conversion decreased
rapidly when the sample size was increased. The availability of O2 did not affect the conversion
for small samples. These results imply that intrinsic char-N conversion is 100% for coal chars
at high temperatures, and that NO reduction by char is responsible for the lower values of char-
N conversion. A similar study has shown that the parent fuel also plays an important role, as
biomass chars showed lower char-N to NO conversion than coal chars [56]. In agreement with
Jensen et al [55], Molina and colleagues [53] found a decrease in char-N conversion when the
char sample size was increased (≈4.5–21.0 mg). Furthermore, they performed two types of
experiments that resulted in two significantly different levels of char-N conversion. In the first
(Type I) experiment, the char was first injected into a helium atmosphere and pyrolyzed (low
levels of NO and CO exited the char) for 60 s, and then an O2/He mixture was injected to initiate
combustion. In the second (Type II) experiment, the char was injected directly into a stream of
O2/He. The Type I experiment resulted in char-N conversion values in the range of 10%–15%,
while the corresponding values in the Type II experiment were in the range of 40%–55%. The
authors attributed this difference to a lower local stoichiometry in the Type I experiments
leading to an increase in a homogeneous reduction mechanism that involves HCN. Although
the importance of HCN for char-N conversion has not been established, modeling conducted
by some groups (see for example [57, 58]) have shown that assuming HCN to be the primary
product from char-N can provide good results. Another, perhaps more common, approach is to
use NO as the primary product obtained from char-N, with subsequent reduction by char.
Additional combustion issues are discussed by Shimizu et al [59], who have shown that the
conditions during char production affect the final conversion of char-N to NO. Spinti and
Perching [51] have taken this as an explanation for the differences observed in the literature.
Jensen et al [55] have shown that NO-char reduction occurs significantly faster directly after
pyrolysis than when the char has been prepared separately, as is the case in most NO-char
reduction studies.

12
Table 1. Experimental values for char-N conversion to NO relevant to pulverized coal combustion, as obtained
from the literature.
Reference Apparatus Set temperature [K] Char-N conversion (%)
Perching and Wendt [52] Combustor 10–15
Spinti and Perching [51] Combustor 40–60
Nelson et al [54] EFR 1473 35–80*
Song et al [50] EFR 1250–1750 20–35*
Molina et al [53] EFR 1698 10–55
Phong-Anant et al [49] EFR 1273–1873 30–50
Pohl et al [35] EFR 1500 10–20*
Wang et al [60] EFR 1273 10–45
Jensen et al [55] Fixed bed 1123–1423 10–100
* Only values of λ>1 are taken. Lower values were obtained when λ was <1.
EFR: Entrained Flow Reactor (includes drop tube reactors).
As char-N conversion is closely linked to char conversion, a brief overview of char combustion
is presented here. Char combustion can be divided into three zones based on which phenomena
limits progression. In Zone I, the char conversion rate is kinetically controlled and increases
rapidly with temperature. In Zone III, the conversion rate is controlled by the mass transport of
oxygen to the char, which is less dependent upon the temperature. Zone II represents conditions
in which both the kinetic and oxygen transport rates are important. High temperatures direct the
combustion towards Zone III, since the chemical reaction rates increase, making mass transport
the limiting factor. In contrast, the use of small particles directs the combustion towards Zone
I, as the specific diffusive mass flux to the particle is increased, thereby promoting more rapid
mass transport. High temperatures and small particles are present in pulverized coal
combustion, and these systems are generally well represented by the conditions characteristic
of Zone II [61]. Given the abovementioned factors, it is clear that it is complicated to describe
char oxidation over a wide range of temperatures and combustion conditions, especially with
respect to the partial pressure of oxygen. In general, neither global power-law kinetics nor semi-
global Langmuir-Hinshelwood kinetics describe with sufficient accuracy the temperature-
dependence. Instead, more complex models are required, some of which attempt to maintain
dependence on just temperature and concentrations [62], while others include dimensionless
numbers and specific coal parameters [63].
NO reduction
It is convenient to divide the NO reduction process during solid fuel combustion into reduction
by volatiles and reduction by char, as these reactions occur on different time-scales. NO
reduction by volatiles is important and is the main reason why air staging achieves significant
reductions in NO levels, i.e., by prolonging the time in which NO can interact with the radicals
formed by the volatile compounds. This mechanism is also used when fuel staging is applied,
i.e., when introducing a fuel (e.g., natural gas) downstream of the initial combustion zone. The
reduction of NO may occur through reactions with N-containing species (such as NHi) or N-
free species (such as CHi) [64]. In those combustion systems in which fuel staging is not
applied, NO reduction by volatiles only affects the NO that has been formed during the early
stage of combustion, while the NO formed subsequently is not affected.

13
In contrast, the reduction of NO by char affects a larger fraction of the formed NO, since the
char reactions occur on a longer time-scale. Many studies have been conducted on NO reduction
by char and carbonaceous materials, several of which have observed a decrease in the apparent
char-N-to-NO conversion as the background NO level is increased, i.e., the (NOout-NOin)/char-
N ratio decreases significantly as the initial NO concentration increases [51, 53, 57, 65]. Some
of these studies have even observed negative rates of apparent conversion of char-N, i.e., more
NO is reduced by the char than is formed by the char-N [51, 57]. This reduction appears to be
enhanced in the presence of CO [58]. Aarna and Suuberg [66] have reviewed the studies on
NO-char kinetics in the literature and averaged the rates; the resulting rate constant is shown in
Figure 4 along with selected constants. Most of the rates found in the literature are within one
order of magnitude of the Aarna and Suuberg rate. However, most of those studies have used
chars that have been prepared prior to the experiments. Jensen et al [55] have shown that the
rate of NO-char reduction decreases continuously in the time-span after pyrolysis, due to some
deactivation mechanism, and that the rate directly after pyrolysis is significantly higher than
that usually reported in studies in which the chars have been prepared separately. The rate
reported by Song [67] is included in Figure 4, as it was obtained from experiments performed
in the temperature range relevant to the conditions in a rotary kiln. The rate reported by Jensen
et al [55], which is shown for comparison, is also applied in the modeling of this thesis. While
it is significantly higher than the average rate provided by Aarna and Suuberg [66], it was
derived in one of the few studies in which the char was produced in situ with the NO-char
reactions proceeding directly afterwards. The rate described by Chan [68] was obtained at lower
reactor temperatures. Nonetheless, it is recommended by Visona and Stanmore [58] for
pulverized fuel combustion carried out at around 1750 K. Extrapolating this rate to higher
temperatures results in a rate that is similar to that reported by Jensen and co-workers. Finally,
it should be mentioned that Molina et al [57] increased by one order of magnitude the rate of
Aarna and Suuberg to achieve fitting to their experimental data. This further indicates that the
NO-char rate is higher than what is usually found in the literature, and that the rate reported by
Jensen et al [66] is a strong candidate for describing the NO-char reduction in a PF flame.
Figure 4. Arrhenius plot of the NO-char reaction. The reaction rates (in m3/kg/s) are derived from Song et al. [67]
and Aarna and Suuberg [66], assuming a char surface area of 150 m2/g. An area of 530 m2/g was used for the Chan
rate [68]. As the reaction rate derived by Aarna and Suuberg [66] is an average rate, it does not include any
symbols.

14
3.3 General NOx mitigation strategies
Air staging
The most commonly used measure to reduce NOx is to control the mixing of the air and the fuel
to create an oxygen-lean zone during vol-N conversion, thereby yielding a lower rate of NO
formation from volatile nitrogen. Mixtures that are overly oxygen-lean may, however, result in
flame extinction. Burners are typically built with two registers for air: primary and secondary.
The primary air may be premixed with the fuel or mixed rapidly. The secondary air is usually
added through an outer register and is most often swirled, creating a reverse aerodynamic flow
in the flame. Due to this reverse flow, hot (O2-lean) gases are recirculated to the early part of
the flame, which is beneficial for NO reduction. Swirling may also be applied to the primary
air. There tends to be an optimal NOx emission level with regard to swirling, as a low rate of
swirling will not result in a significant recirculation zone, while a too-high rate of swirling will
mix the air with the fuel too rapidly and NOx formation will increase. Staging air through burner
design is called ‘internal staging’. It is also possible to stage the air externally by adding enough
air through the burner to ignite the fuel, and adding the remainder at a later stage through
separate ports (often called ‘over fire air’, OFA) (e.g., along the wall), to ensure burnout. For
rotary kilns, OFA is not possible due to the rotation of the kiln.
Fuel staging
Introducing part of the total fuel input at a later stage in the combustor enables the formed NO
to be reduced by, for example, hydrocarbon radicals (CHi). The mechanism is called
‘reburning’, and it has proved to be an efficient way to reduce NOx. The reburn fuel is typically
natural gas, although solid fuels may also be used as long as they ignite readily and mix well.
The reburn zone is generally sub-stoichiometric and additional air has to be added after this
zone. Although fuel staging is generally performed externally, it is also possible to apply
internal fuel staging using burners with different fuel registers.
Other primary measures
The relationship between stoichiometry and NO formation is clear; a lower stoichiometry
(air/fuel) results in a lower level of NO formation, which means that decreasing the overall
excess of air an effective measure. Although it is always the local stoichiometry that determines
the level of fuel-N conversion, the global stoichiometry controls the ease with which local O2-
lean zones can be created. The stoichiometry in the early part of combustion can, as mentioned,
be controlled effectively through burner design, whereas the stoichiometry in the later stages is
less sensitive to such changes. However, decreasing the global stoichiometry lowers the O2
levels post-flame inherently.
Another possibility is to recirculate the O2-lean flue gases through the burner. This has three
potential benefits for NO reduction: the reduction in O2 concentration leads to decreased
oxidation of fuel-N, as well as a lower temperature (reducing the thermal-NO mechanism), and
the recirculation enables a reduction in the NO levels through reburning. Substantial reductions
in NO levels have been attained in oil- and gas-fired boilers owing to the decrease in thermal-
NO formation, while this strategy has proven to be less effective for solid fuels [69].

15
Fuel switch
Since fuel-N is a significant contributor to NO formation in PF flames, a simple measure that
is often used is to switch to a fuel that contains less nitrogen. Switching from a solid fuel to a
gaseous fuel tends to decrease significantly the NOx emissions. However, the linkage between
the fuel-N content in solid fuels and NO emissions is weak, as fuel-N conversion depends on
many other aspects. Thus, changing to a solid fuel with a lower nitrogen content does not
guarantee a lower level of NOx formation. The content of volatiles has, for example, been shown
to play a significant role. In unstaged flames, a higher volatile content leads to higher NO
emissions, whereas for staged flames the opposite trend is observed. The reason for this is that
a fuel that has a high content of volatiles is likely to release more volatile nitrogen, and if air
staging is achieved it will affect a larger fraction of the total fuel-bound nitrogen. Other fuel
properties, such as particle size and ash content, can also play important roles, so it is difficult
to predict the effect on NO of a fuel swap.
Another possibility is to co-combust the fuels. Apart from reducing the amount of incoming
fuel-N, the interaction between the two fuels has the potential to create NO reduction by
forming additional, local O2-deficient zones. In theory, a volatile fuel with low nitrogen content
could be manipulated so that a reducing zone is formed at an optimum location, thereby
reducing the fuel-N conversion from the other fuel [70]. Co-combustion also facilitates the
combustion of certain fuels that may be difficult to ignite. Using a small amount of gaseous fuel
can, for example, stabilize a solid fuel flame.
Secondary measures
If NOx emissions cannot be reduced effectively using primary measures, flue gas cleaning may
be necessary. This is performed by adding ammonia (NH3), which reacts with NO to form N2.
Urea [CO(NH2)2] is also used, since it decomposes to NH3 but is safer to handle. The reaction
between NO and NH3 is highly temperature-dependent, and it is most efficient at temperatures
in the range of 900°-1100°C. At higher temperatures, the oxidation of ammonia becomes more
prominent, which can result in increased NO emissions, while at lower temperatures, the
reaction may not proceed to completion and ammonia may be emitted (so-called ‘ammonia
slip’).
The reduction of NO by NH3 is possible at lower temperatures (200°-500°C) if a catalyst is
present. This is selective catalytic reduction (SCR), and it can provide significant NOx
reduction. The reduction without a catalyst is called selective non-catalytic reduction (SNCR)
and is less common in industrial systems.
3.4 Scaling
In raw material-producing industries, such as the iron and steel industry, having strong
production flows and high utilization rates is crucial to the business, such that any modifications
to the processes are carefully evaluated using a scaling procedure prior to full-scale
implementation. However, scaling is a difficult task as it influences almost all combustion
aspects. The International Flame Research Foundation (IFRF) states that “the scaling of
combustion systems with complete similarity is practically impossible” [71]. It is, therefore,
important to be aware of the effects that scaling can have on the combustion process.
The two most common ways of scaling PF combustion processes are constant velocity scaling
and constant residence time scaling. To understand these criteria, it is helpful to write the inlet
velocity (u0) as follows:

16
𝑢0 =
𝑉0𝐴=4𝑉0
𝐷02𝜋
=4𝑚0
𝜌0𝐷02𝜋
Eq. 2
where, typically, V0 and m0 are the volumetric and mass flow rates of combustion air through
the burner, A is the cross-section area of the burner, ρ0 is the density of the combustion air, and
D0 is the diameter of the burner throat. For rotary kiln systems, it is however not straight-
forward to define which air flows and diameter should be used for the calculations, as will be
shown in Chapter 5.1. If we want to relate the air mass flow to the fuel input, we can expand
m0 as:
𝑚0 = 𝑀𝑎𝑖𝑟𝜆𝑁0,𝑠𝑡𝑜𝑖𝑐ℎ𝑚𝑓𝑢𝑒𝑙 Eq. 3
where Mair is the molar mass of air, λ is the air-to-fuel equivalence ratio, N0,stoich is the
stoichiometric amount of air required to achieve complete combustion of the fuel (in
kmolair/kgfuel), and mfuel is the mass flow of fuel. If we also include that the fuel heat input (Q)
is equal to the mass flow of fuel (mfuel) times the heating value of the fuel (Hi), we obtain:
𝑢0 =4𝑀𝑎𝑖𝑟𝜆𝑁0,𝑠𝑡𝑜𝑖𝑐ℎ𝑄
𝐷02𝜌0𝜋𝐻𝑖
Eq. 4
When scaling a combustion process, usually only a few of these values change, and it is,
therefore, common to simplify the equation as:
𝑄 = 𝐾𝜌0𝑢0𝐷02 Eq. 5
where K represents the values that do not change during scaling. If constant velocity scaling is
applied, u0 is kept constant while Q and D0 are varied. If constant residence time scaling is
applied, the value of D0/u0 is kept constant. For constant velocity scaling, the relation between
D0 and Q becomes:
𝐷0 ∝ 𝑄0,5
and for constant residence time scaling:
𝐷0 ∝ 𝑄0,33
For example, if the fuel input is scaled by a factor of 64, the diameter of the down-scaled burner
should be scaled by a factor of 8 if constant velocity scaling is applied, and by a factor of 4 if
constant residence time scaling is applied.
According to Smart et al [72], both scaling criteria should maintain the factional degree of
mixing over the normalized axial length x/D0. This means that both scaling criteria should
achieve satisfactory outcomes if the combustion reactions are sufficiently rapid for the
combustion to be fully controlled by mixing. This could, in theory, be applicable to gaseous
fuels, since there is no inherent mass transfer resistance to limit the progress of combustion.
However, even for gaseous flames, scaling is difficult, as demonstrated in the Scaling 400
project conducted by the IFRF (see for example Hsieh et al [73] and Weber [74]). For liquid
and solid fuels, the two-phase interactions complicate the process even more. A 40-kW oxy-
coal burner was successfully scaled up to 80 kW by the application of a constant residence time-
scale, as described by Toporov [75]. However, echoing the IFRF statement, Toporov has
written that “direct scale-up of the burner described above to an industrial scale oxy-firing
burner in the range of several MWth, however, is not possible”.
The recent work by Weber and Mancini [76] provides RANS simulations of five flames in the
range of 0.176–50.0 MW, revealing how constant velocity scaling affects the flame
characteristics. In the low thermal input range, the particles penetrate deeper into the internal

17
recirculation zone (IRZ), which means that the devolatilization occurs in a fuel-rich
environment, while in the high thermal input range devolatilization occurs mainly in the air
stream. The authors mention that when scaled to even lower thermal inputs (40–80 kW), flame
blow-off occurred. Constant velocity scaling for PF-flames is, therefore, not guaranteed to be
successful. While constant residence time scaling is in theory a superior scaling method, it is
rarely applied in practice owing to problems related to the reduced velocity in small scale [71].
3.5 Units of emission measurements
Several units for quantifying NOx emissions are used depending on the application. A common
unit used in research is the volumetric gas fraction of NOx (in ppm), as it is the unit that is
employed by most measurement instruments. The volumetric gas fraction is equivalent to the
molar gas fraction and proportional to the partial pressure and concentration (mol/cm3). The
latter is, however, dependent upon system conditions such as pressure and temperature.
Neither of these units directly quantifies the amount of NOx formed in the process, as they both
depend on the flue gas flow and the values are decreased if the gas is diluted. A common
approach to account for dilution is to correct the NOx fraction to a certain base oxygen level.
This correction is performed according to:
𝑥𝑁𝑂𝑥,𝑐𝑜𝑟𝑟𝑒𝑐𝑡𝑒𝑑 = 𝑥𝑁𝑂𝑥 ∗𝑥𝑂2,𝑜𝑥 − 𝑥𝑂2,𝑏𝑎𝑠𝑒
𝑥𝑂2,𝑜𝑥 − 𝑥𝑂2 Eq. 6
where 𝑥𝑁𝑂𝑥,𝑐𝑜𝑟𝑟𝑒𝑐𝑡𝑒𝑑 is the corrected molar NOx fraction, 𝑥𝑁𝑂𝑥 is the measured molar NOx
fraction, 𝑥𝑂2 is the measured molar O2 fraction, 𝑥𝑂2,𝑜𝑥 is the oxygen molar fraction in the
oxidizer (≈0.21 for air), and 𝑥𝑂2,𝑏𝑎𝑠𝑒 is the base oxygen fraction to which the emission should
be corrected (0.06 for solid fuels within the EU).
It is also common to use the unit mgNO2/m3
n instead of the molar fraction. This unit is equivalent
to the molar fraction, and the conversion is obtained by applying the ideal gas law and assuming
that all the NO is converted to NO2. Correction to a base oxygen level might still be necessary,
and it is also performed using Eq. 6. It may also be of interest to look at the ratio of emitted
NOx to introduced fuel-N, since this relates to the performance of the combustion process with
regard to NOx emission. NOx emissions corrected to 6% O2 and the NOx to fuel-N ratio are used
mainly in Papers I and II.
Another common practice is to relate the emitted NOx to the energy input, i.e., mgNO2/MJ. An
advantage of using this unit system is that it relies on the actual amount of NOx in the flue gases.
It does, however, require accurate measurements of the flue gas flow and the fuel feed, which
are not always available. Attention must also be paid to the specific heating value (lower or
higher) on which the unit is based. This unit is used primarily in Papers III and IV.
For the Grate-Kiln process, use of the molar fraction or mgNO2/m3
n corrected to a certain oxygen
level should be avoided, as the product (the pellets) absorb a certain amount of oxygen, thereby
introducing an error when one attempts to correct the NOx measurement. Nonetheless, this
approach is used throughout this thesis as there were no pellets present in the pilot-scale kiln
experiments and to facilitate comparisons with other units and regulation limits. When
presenting NOx emissions from the full-scale plant as values corrected to an oxygen
concentration, the NOx emission is first calculated as mgNO2/MJfuel and then converted1 to ppm
and corrected to 6% O2.
1 See Appendix A for how this conversion is performed.

18
In Paper IV, the unit NOx/CO2 is applied because it is used in the reports that the paper reviews.
NOx/CO2 is an uncommon unit and not suitable for comparing NOx emissions from different
fuels. However, if the burnout is complete, it generates an easily-obtained normalized value
that gives a good indication of whether a primary measure manages to reduce NOx emissions
or not.
A unit that is commonly used in industrial production processes is NOx/unit of production. In
the Grate-Kiln process, this is expressed as gNO2/tonne pellets, and it may be advantageous
because it incorporates the production efficiency of the plant. It is, however, difficult to
compare NOx emissions across industries using this unit system.
Units that are corrected to a certain oxygen level or related to the energy input are often used in
legislation aimed at industrial applications. The review of Baukal and Eleazer [77] provides
more details on this. Finally, it should be noted that these units indicate the environmental
performances of individual plants, and that using them in designing legislation incentivizes the
use of BAT. The environmental impact on a regional or global level is, however, more sensitive
to the absolute amount of NOx emitted than to the concentrations in flue gases. For example,
for evaluating the degree of pollution, kgNO2/year is superior to mgNO2/m3
n. The Gothenburg
protocol and EC Directive 2016/2284/EU use units of ktonNO2/year.

19
4 Previous work on NOx formation in rotary kilns
Rotary kilns are efficient for high-temperature heat treatment of solid material. In addition to
iron ore manufacturing, typical applications include cement production, lime manufacturing,
lightweight aggregate manufacturing, reduction of oxide ore, and waste incineration [78]. As
the most common application of rotary kilns is cement production, research on combustion in
kilns has focused on that application. This section provides an overview of the previous findings
regarding NOx formation in cement and iron ore kilns. It should be noted that there are
significant differences in kiln design and usage between industries: sintering cement clinker
may require a bed temperature as high as 1540°C and the flue gas oxygen concentration is in
the range of 1%–4% [79, 80], whereas iron ore is sintered at around 1250°C and employs a
level of excess air that is equivalent to 15%–17% oxygen in the flue gases [81, 82].
4.1 Cement industry
The specific NOx emissions from cement kilns that fire solid fuels are in the range of 1300–
2500 g/tonne clinker, while for gaseous fuels the corresponding level can be three times as high
[83]. In China, 10% of the NOx emissions originate from the cement industry [84] (with
reference to [85]). The BAT document for cement production [86] states that as a yearly
average, the outlet NOx concentration from European cement kilns is about 380 ppm, with a
minimum of 70 ppm and a maximum of 990 ppm (all corrected to an oxygen level of 10%). In
many cement production plants, NOx reduction by primary measures is carried out either in the
kiln or in the calciner, which the flue gases enter after the kiln. Intensive efforts have been made
to reduce the levels of NOx in the calciner, and a NOx reduction of up to 60% has been achieved
through calciner modifications [26]. Among the various studies of NOx control in cement
manufacturing, there is a consensus that thermal NO formation dominates NO formation in the
rotary kiln. Strong evidence for this is the fact that flame cooling through the injection of water
is an efficient way to reduce NOx emissions [87].
Vaccaro [88] has reviewed NOx campaigns performed in industrial cement kilns, largely based
on the CEMFLAME project by the IFRF and a research program conducted by the European
Commission, both in the 1990s [89, 90]. The review concludes that significant NOx reductions
could be achieved through the use of low-NOx burners. In kiln systems, these burners have two
primary air inlets (one is swirling and one is axial) and one fuel inlet. The amount of primary
air used was considered to be especially important. The NOx emission levels could be reduced
by 45% (compared to a mono-channel burner) by reducing the amount of primary air while
maintaining stable operation. In a review performed by McQueen et al [83], decreasing the level
of primary air was shown to have the potential to reduce NOx levels by 30%. Other primary
measures were found to contribute NOx reductions in the range of 15%–30%, while the use of
SNCR and SCR could reduce NOx levels by 40%–70% and 70%–90%, respectively.
Both the European Union and the US Environmental Protection Agency have published
documents on NOx control in the cement industry that include several proposed measures [91,
92]. Reducing the amount of excess air (i.e., reducing the flue gas oxygen concentration from
2% to 1%) was shown to decrease the levels of NOx by 15%. An innovative strategy that has
been proposed for dealing with NOx is fuel staging by means of “mid-kiln firing”, which entails
the use of a fuel inlet through the wall half-way along the rotary kiln. This allows for slow-
burning fuels, such as whole tires, to be introduced once per rotation of the kiln. Since the
energy input of the kiln inlet can be reduced by this measure, the combustion is dispersed, and
the level of NOx is reduced by as much as 50%. The use of low-NOx burners does not always
yield reductions in NOx, although reductions of up to 35% have been reported.
20
4.2 Iron ore industry
The specific NOx emissions from iron ore kilns firing solid fuels are typically in the range of
150–400 g/tonne of pellets, and become about three-times higher when natural gas combustion
is applied [28]. The BAT document for iron and steel production [93] shows that the NOx
emissions for three pelletization plants are in the range of 36–138 ppm, although it is unclear if
these values are corrected to a specific oxygen concentration. If the oxygen concentration is
17%, which is a typical stack oxygen concentration in Grate-Kiln plants, the above ranges
becomes 99–380 ppm when corrected to an oxygen level of 10%, i.e., slightly lower than the
NOx emissions of cement plants. However, as stated in Chapter 3.5, correction to an oxygen
content is not the optimal method for measuring NOx emissions in iron ore induration plants.
Very little research has been performed on the emissions performances of iron ore rotary kilns,
and many aspects are assumed in the literature to be shared with cement rotary kilns. In iron
ore rotary kilns, firing with natural gas has been shown (as in cement kilns) to produce more
NOx than firing with solid fuels [28], which underlines the importance of thermal NO formation.
Similar to cement kilns, the high levels of NOx emissions produced during solid fuel
combustion are assumed to result from the dominance of thermal NO formation. As will be
discussed in Chapter 7, this thesis questions this assumption and suggests that fuel-N is the
dominant source of NOX emissions from the iron ore rotary kiln.
The modeling of a gas-fired rotary kiln for iron ore production performed by Davis [94]
revealed a minimum level of NO formation at a certain secondary air flow. A too-low level of
secondary air flow resulted in a high level of NO formation due to the long residence times and
high peak temperature (i.e., high thermal NO formation), while a high secondary air flow
resulted in high-level NO formation due to the increased O2 levels, although the temperatures
were reduced. Apart from this study and some general reports on emissions [28, 93, 95], not
much research has been done or is available on NOx in rotary kilns for iron ore production.
21
5 Experimental
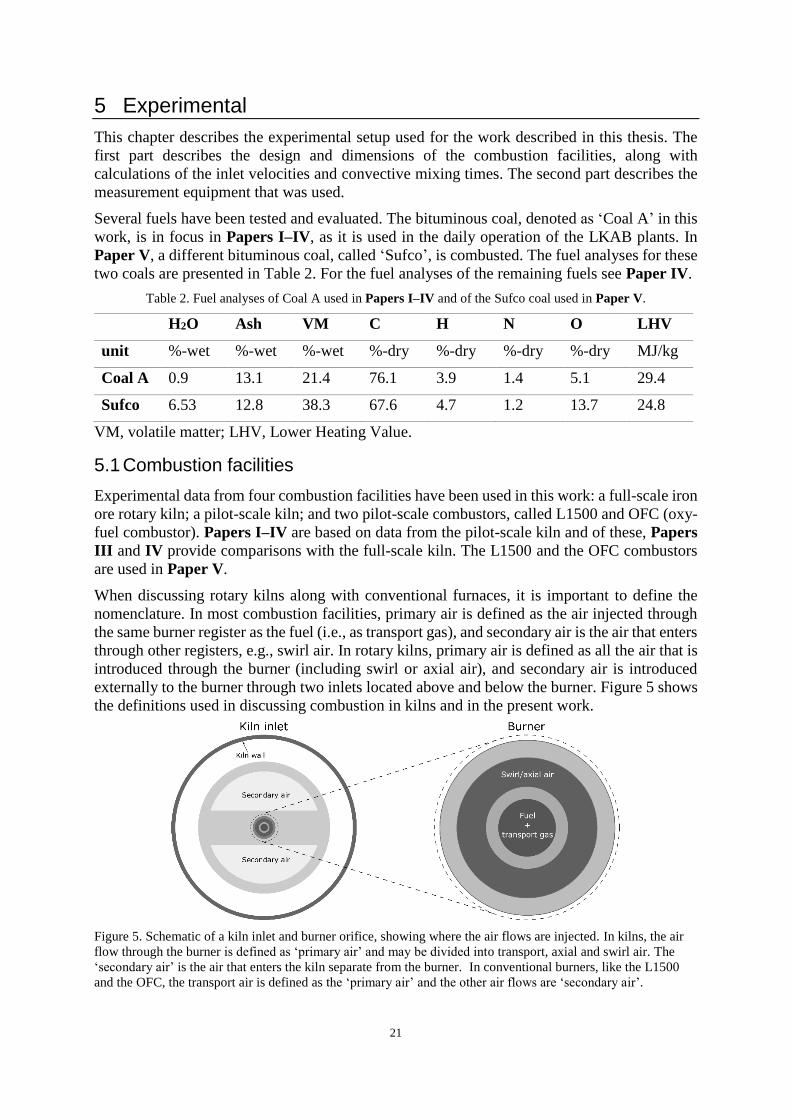
This chapter describes the experimental setup used for the work described in this thesis. The
first part describes the design and dimensions of the combustion facilities, along with
calculations of the inlet velocities and convective mixing times. The second part describes the
measurement equipment that was used.
Several fuels have been tested and evaluated. The bituminous coal, denoted as ‘Coal A’ in this
work, is in focus in Papers I–IV, as it is used in the daily operation of the LKAB plants. In
Paper V, a different bituminous coal, called ‘Sufco’, is combusted. The fuel analyses for these
two coals are presented in Table 2. For the fuel analyses of the remaining fuels see Paper IV.
Table 2. Fuel analyses of Coal A used in Papers I–IV and of the Sufco coal used in Paper V.
H2O Ash VM C H N O LHV
unit %-wet %-wet %-wet %-dry %-dry %-dry %-dry MJ/kg
Coal A 0.9 13.1 21.4 76.1 3.9 1.4 5.1 29.4
Sufco 6.53 12.8 38.3 67.6 4.7 1.2 13.7 24.8
VM, volatile matter; LHV, Lower Heating Value.
5.1 Combustion facilities
Experimental data from four combustion facilities have been used in this work: a full-scale iron
ore rotary kiln; a pilot-scale kiln; and two pilot-scale combustors, called L1500 and OFC (oxy-
fuel combustor). Papers I–IV are based on data from the pilot-scale kiln and of these, Papers
III and IV provide comparisons with the full-scale kiln. The L1500 and the OFC combustors
are used in Paper V.
When discussing rotary kilns along with conventional furnaces, it is important to define the
nomenclature. In most combustion facilities, primary air is defined as the air injected through
the same burner register as the fuel (i.e., as transport gas), and secondary air is the air that enters
through other registers, e.g., swirl air. In rotary kilns, primary air is defined as all the air that is
introduced through the burner (including swirl or axial air), and secondary air is introduced
externally to the burner through two inlets located above and below the burner. Figure 5 shows
the definitions used in discussing combustion in kilns and in the present work.
Figure 5. Schematic of a kiln inlet and burner orifice, showing where the air flows are injected. In kilns, the air
flow through the burner is defined as ‘primary air’ and may be divided into transport, axial and swirl air. The
‘secondary air’ is the air that enters the kiln separate from the burner. In conventional burners, like the L1500
and the OFC, the transport air is defined as the ‘primary air’ and the other air flows are ‘secondary air’.

22
The full-scale kiln
The full-scale reference kiln is used in the LKAB KK2 plant, located in Kiruna, Sweden. The
KK2 plant produces around 4 million tonnes of iron ore pellets annually and has been in
operation since 1981 [81]. The kiln is inclined at an angle of 4° so that the pellets gradually
move forward under force of gravity. The kiln is rotating at 1.4 rpm to ensure that the pellets
are thoroughly mixed. The iron ore pellets form a rolling bed at the bottom of the kiln, taking
up about 10% of the kiln volume. The fuel is usually a bituminous coal, and the fuel heat rate
is about 40 MW, depending on the pellet production rate. The secondary air is preheated to
>1000°C by the processed hot pellets in the cooler. No secondary measures for NOx reduction
are implemented at the plant.
Figure 6 shows a photograph of the burner in the full-scale kiln. The burner, which has a central
position within the kiln, consists of a central pipe through which the coal is fed along with
transport air. Two annular swirl registers surround the coal pipe. The diameter of the coal pipe
is 85 mm, and the outer diameters are 138 mm and 160 mm for the inner and outer swirl
registers, respectively. The outer swirl register is, however, not in use.
Figure 6. Photograph of the burner used in the LKAB KK2 plant. Solid fuel and transport air are injected through
the central pipe, and swirl air through the inner swirl register. The outer swirl register is not in use.
The pilot-scale kiln
The LKAB pilot-scale kiln is a downscaled version of the KK2 kiln and is used for fuel and
burner evaluations. Two versions of the pilot-scale kiln are evaluated in this work: The Year
2013 kiln, with a heat input of 400 kWfuel; and the Year 2015 kiln, with a heat input of 580
kWfuel. The following description is of the Year 2015 kiln since it has been used for most of the
experiments and modeling in this thesis (Papers I–IV). Only in Paper IV has the Year 2013
kiln been evaluated.
The Year 2015 kiln is scaled down using constant velocity scaling. The length of the kiln is 14
m, and the diameter is 650 mm for the first 4.4 m, after which the diameter expands to 800 mm.
Only the first 4.4 m section is considered to be the kiln. The reason for extending the furnace
to 14 m is mainly to be able to perform, for example, slagging measurements. The rotation of
the kiln is not included in the pilot-scale setup. The kiln is equipped with both horizontally and
vertically arranged access ports for in-flame measurements of temperature, concentrations,
radiation, and heat flux. The kiln also includes a cooling system at the bottom part of the kiln,
to simulate the heat sink of pellets.
Secondary air at a temperature of 1000°C–1100°C enters through two channels located above
and below the centrally positioned burner. The burner (Figure 7) has six registers: two for

23
primary air, and four for fuel. One primary air register is swirled (N4), while the other register
introduces air axially (N1). Different fuel registers may be used depending on which full-scale
plant is being simulated by the pilot-scale setup. In Paper I, the central fuel register (N6) was
the most frequently used, as the goal was usually to replicate the KK2 conditions. This register
had a diameter of 12.5 mm and register N5 had a diameter of 22.5 mm. The transport gas for
these registers was N2. The swirl register (N4) consisted of 24 small holes on a disc with an
outer diameter of 35 mm. Register N3 had an outer diameter of 58 mm and register N2 had an
outer dimeter of 73 mm. The axial register (N6) consisted of 36 small holes on a disc with an
outer diameter of 85 mm. When co-combusting coal and biomass, coal was fed through N3 and
biomass was fed through N2, to simulate the conditions of another LKAB plant located in
Svappavaara, Sweden.
Figure 7. Illustration of the frontal view of the pilot-scale kiln burner showing all six fuel and air registers.
The Oxy-Fuel Combustor
The oxy-fuel combustor (OFC) is a vertical, down-fired combustor, with an inner diameter of
0.61 m in the combustion zone, located at the University of Utah, Salt Lake City, UT, USA.
While the OFC is designed for inputs of up to 100 kW, in the experiments performed in Paper
V, it was fired at a fuel input of 30 kW. The outlet oxygen concentration was maintained at 3%-
dry.
A co-axial burner with central coal-feeding and an outer annulus for secondary air was used.
The coal pipe had a diameter of 12 mm, while the secondary air register had an inner diameter
of 27 mm and an outer diameter of 41 mm. A register designed for gas combustion was located
between the two registers but was not used in this work. This burner creates a jet flame (Type-
0).
Figure 8. Illustration of the burner orifice for the burner used in the oxy-fuel combustor. Only the central pipe
and the outer registers were in use for the work in Paper V.

24
The L1500 furnace
The L1500 is a horizontal furnace located at the University of Utah, Salt Lake City, UT, USA.
The combustor has a length of about 12 m and the square cross-section has a width of about 1
m. There are several measurement ports located along the length of the furnace.
Figure 9 presents the co-axial annular burner with an adjustable swirl setting, as used in Paper
V. Coal and primary air were fed through the central annulus, which had a diameter of 76 mm.
Three annular registers surrounded the central coal pipe, of which the innermost register was
designed for gas firing and was not in use. The outer two registers were used for secondary air
and had outer diameters of 154 mm and 203 mm. Two types of flames were produced in this
combustor: a swirled flame with a swirl angle of 75° (applied to both secondary air registers),
and a jet flame without any swirl. For both flames, the burner operated under sub-stoichiometric
conditions (λ = 0.8), and over-fire air (OFA) was injected at an axial distance of about 4 m to
complete burnout. The fuel input was 1 MW, and the outlet oxygen content was 3%-dry.
Figure 9. Illustration of the burner orifice of the burner used in the L1500 furnace in Paper V.
Comparison of combustion facilities
The test facilities used are summarized and compared in Table 3. It’s worth to mention that an
effort was made to scale the combustion process only between the full-scale kiln and the pilot-
scale kiln. To relate the facilities to each other, the u0 values are calculated using Eq. 4.
However, the definition of the diameter, D0 in Eq. 4, is difficult to establish for kilns, as a large
fraction of the air is introduced outside the burner. A considerable part, albeit not all, of this air
will be entrained into the flame and influence the velocities in the flame. The share and position
of the entrainment of secondary air into the flame are two important aspects. Thus, three u0
values are presented, based on the diameters of the central coal pipe, the burner throat (based
on register N4 for the pilot-scale kiln), and the entire furnace, respectively. The calculations
based on the furnace diameter are not of significant interest for the L1500 and the OFC, as these
are enclosed combustion chambers and do not include the secondary air flows like the kiln
systems. Therefore, these values are given in parentheses.
The pilot-scale kin, the full-scale kiln, and the OFC show high values for u0 when calculated
based on the coal pipe, which is expected for jet flames. The velocities in the full-scale kiln and
pilot-scale kiln are of similar magnitude, independent on which value of D0 that is used,
indicating that constant velocity scaling has been successfully applied. The convective mixing
time (D0/u0) is, however, significantly shorter in the pilot-scale than in the full-scale, indicating
that mixing occurs faster in the pilot-scale setup.

25
Table 3. Comparison of the characteristics of the combustion facilities used in this thesis. The values inside
parentheses for the L1500 and the OFC are calculated but not of special interest, since they have confined
combustion chambers.
Full-scale
kiln
Pilot-scale
kiln
OFC L1500
Qfuel [MW] 40 0.58 0.03 1
Lfurnace [m] 34 4.4 1.2 14
Dcoal pipe [m] 0.085 0.0125 0.012 0.076
Dburner [m] 0.14 0.03 0.041 0.2
Dfurnace [m] 5 0.65 0.61 1
λcoal pipe [-] 0.012 0.019* 0.32 0.24
λburner [-] 0.04 0.11 1.16 0.8
λfurnace [-] 4 4 1.16 1.16
u0 [m/s]
Coal pipe 24.0 25.5 24.1 14.9
Burner 27 26 11.6 6.8
Furnace 10.7 9.1 (0.03) (0.42)
D0/u0 [ms]
Coal pipe 3.5 0.49 0.5 5
Burner 5.3 1.15 5.5 29.5
Furnace 468 71 (18,040) (2,384)
* Assuming that air instead of N2 is used as the carrier gas.
The flat-flame burner
A flat-flame burner was used in Paper IV to estimate the level of nitrogen partitioning during
pyrolysis. A low rate of coal feeding (about 1 g/h) was used to ensure single-particle behavior.
A stream of N2 was used as the carrier gas and the particles were injected about 1 mm above
the FFB surface. The average temperature was 1392°C, and the average residence time was
1.33 × 10⁻² s, i.e., the particles were warmed rapidly with a heating rate of approximately 105
°C/s. The char samples were then collected and sent for analysis.
5.2 In-flame measurements
Characterization of a PF flame is challenging due to the high spatial and temporal gradients.
During in-flame measurements, data are collected at each measurement position for a certain
amount of time (several minutes), to derive a representative average. Several data-points are
required to map the flame spread. Furthermore, fluctuations in the fuel feed and difficulties
associated with attaining steady-state conditions, for example constant wall temperatures
(which may affect the flame), are issues that are commonly encountered in pilot-scale facilities
that are not run continuously.
Another challenge is to measure a property at a certain point while minimally disturbing the
flame. The most common forms of in-flame measurements are intrusive, i.e., a probe is inserted
at the desired location and measures a property, either directly or by extracting gas or particles
to be analyzed in an external instrument. These probes are cooled to withstand the high

26
temperatures of the flame. Both the cooling and the volume of the probe will, of course, affect
the flame temperature and flow field around the measurement position. The extent to which the
flame is affected is, however, difficult to establish. Ideally, one wants to perform measurements
that are non-intrusive, for example using new optical techniques. These techniques typically
involve transmitting a laser beam that interacts with the flame characteristic of interest and
measuring the resulting radiation with detectors. Although there are many advantages and
possibilities associated with such techniques, they require adequate optical access, and the laser
beam may affect the flame being characterized. The lasers themselves can also be large and
require several fine adjustments, and it may be inconvenient to move them to, for example,
another measurement port. Therefore, in terms of mobility and flexibility, intrusive
measurements are more convenient. Nevertheless, there are optical measurement techniques
that are portable and easy to use, e.g., infrared (IR) cameras.
Temperature measurements
Temperature measurements are typically performed with thermocouples, which produce a
temperature-dependent voltage from which the temperature can be derived. Figure 10 gives an
illustration of the thermocouple and probe used for in-flame measurements. To ensure that the
thermocouple is heated to the temperature of the flame, it needs to be shielded with a ceramic
shell, as the furnace wall temperatures are lower than the flame temperatures and would
otherwise exert a significant radiative cooling effect on the thermocouple. The shielding also
protects the thermocouple from physical damage by particles. Furthermore, the gas velocity
around the thermocouple should be around 200 m/s, to achieve sufficient convective heat
transfer. Increased gas velocity is achieved by applying suction around the thermocouple. A
drawback of the suction is that the volume of gas that is sucked out of the flame makes the
measurement less of a point measurement.
For the measurements performed in Papers I and V, a triple-shielded thermocouple of type B
(suitable for temperatures <1800°C) was mounted on a cooled probe with suction. The probe
was traversed across the flame. Approximately 4 minutes were required for the thermocouple
to stabilize at each measurement point. Figure 10 shows a schematic of the suction pyrometer,
as well as a photograph of the ceramic shield after an in-flame measurement.
Figure 10. Top panel: Schematic of the suction pyrometer. Courtesy of Adrian Gunnarsson [96]. Bottom panel:
Photograph of the protective ceramic around the thermocouple after measurement. As the gas inlet is on the other
side, it is not visible in this image. Hot coal particles adhere to the ceramic shield after the measurements.
Cooling water outletCooling water inlet
Flue gas outletThermocouple

27
Gas composition measurements
There are several ways to measure the concentration of a specific gas in a gas mixture. A
common approach is to force the gas mixture through a cell and direct light of a set wavelength,
commonly infrared (IR) or ultraviolet (UV), through the cell in the direction of a detector. If
the gas mixture contains a gas that absorbs light of the set wavelength this will be detected by
the detector and the extent of attenuation of the light can be used to determine the actual
concentration of the gas. A standard IR gas analyzer typically measures 1–3 gases
simultaneously.
A technology that effectively measures more gases simultaneously is Fourier-Transform
Infrared (FTIR) spectroscopy, which scans a wide range of wavelengths in the IR spectrum.
Instead of using a light source that has only one wavelength (monochromatic), FTIR
spectroscopy uses a light source with multiple wavelengths (polychromatic). The light from
this source enters a so-called Michelson interferometer (Figure 11) where the light beam is split
into two beams: one is refracted to a fixed mirror, while the other is refracted to a moving
mirror. The beams are reflected back to the beam splitter, where destructive and constructive
interference phenomena occur depending on whether the wavelengths are in phase, which in
turn is dependent upon the distances between the mirrors and the beam splitter. The resulting
beam enters a sample cell that is filled with the gas mixture, where absorption of certain
wavelengths occurs depending on the gases present in the mixture. The remaining beam is
measured with a detector. Since one of the mirrors is moving, different distances between the
mirror and beam splitter are created, so that different wavelengths experience
constructive/destructive interference, and this means that the light entering the sample cell
varies. The result is a so-called ‘interferogram’, which is transformed into a spectrum using the
Fast Fourier Transform. A computer then compares this spectrum with a reference spectrum
(typically, an N2 spectrum) and analyzes which wavelengths have been absorbed and to what
extent. Knowing which wavelengths are relevant for which gases, it calculates the concentration
of each gas. An issue with FTIR gas analyzers is that although every gas can be associated with
a unique set of absorption wavelengths, a gas may share individual wavelengths with other
gases, which may result in an error. For example, if gas A absorbs wavelengths x and y, which
are also absorbed by gases B and C, it may appear that gas A is present even though only gases
B and C are present. Therefore, it is necessary to have an inkling as to which gases could be
present in the mixture. Another drawback is that FTIR spectrometers do not detect symmetrical
diatomic gases (e.g., O2), since these molecules lack a dipole moment and, therefore, will not
interact with the electric field of the light. In the case of O2 measurements, it is possible to use
a paramagnetic instrument that relies on the magnetic property of O2.

28
Figure 11. Schematic of the Michaelson interferometer, which is a central component of FTIR spectroscopy.
For the gas concentration measurements performed in Papers I and V, the in-flame gases were
extracted by suction probes and analyzed using FTIR spectroscopy for CO2, H2O, CO, HCl,
HF, N2O, NH3, NO, NO2, SO2 and HNO3, and using paramagnetism for O2. The gas was passed
through a filter, to protect the measurement equipment from particles, and was then led through
an electrically heated tube (≈190°C), to avoid condensation. The gas was assumed to experience
instantaneous quenching. A schematic of the probe tip and a photograph of the probe tip before
measurements are presented in Figure 12. A potential problem with these measurements is
clogging of the filter by particles, which may cause unwanted heterogeneous reactions when
the gas is suctioned through the filter. This can also cause unwanted pressure drops in the
measurement equipment.
Figure 12. Top panel: Schematic side-view of the gas probe. Courtesy of Adrian Gunnarsson [96]. Bottom panel:
Frontal view of the gas probe before any measurements were performed.
Suction line
Cooling water outlet
Cooling water inlet
Heated tube
Sintered alumina filter
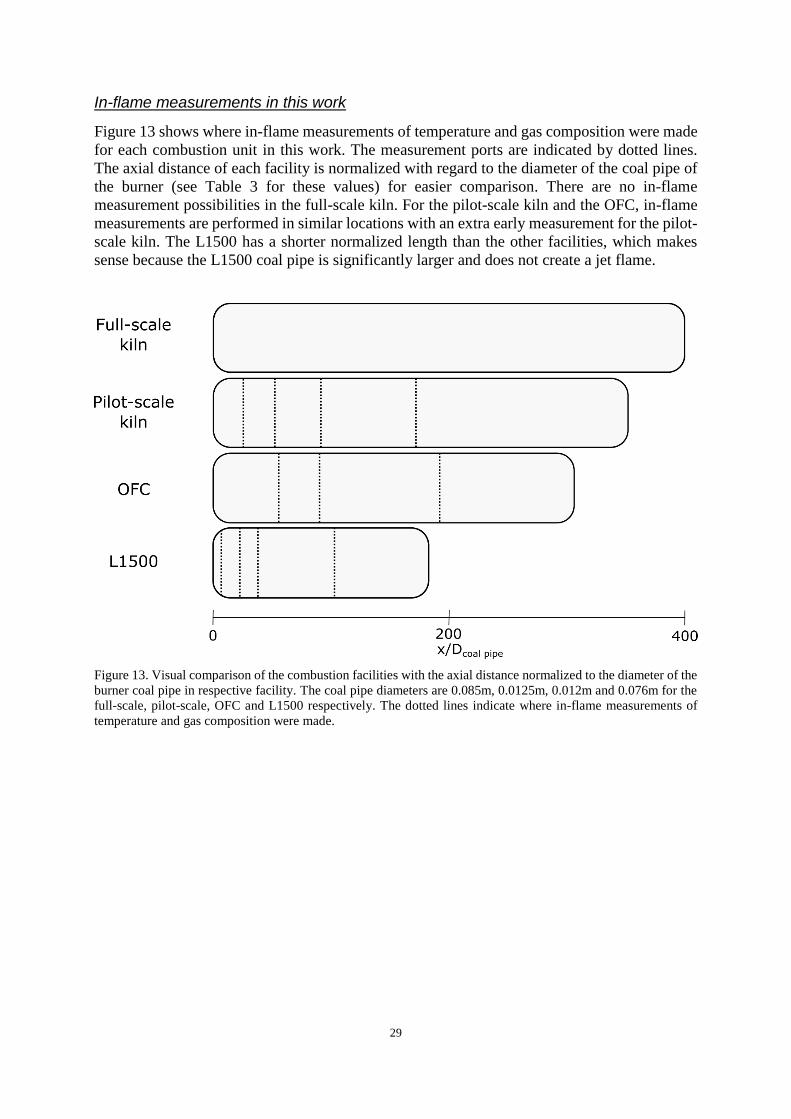
29
In-flame measurements in this work
Figure 13 shows where in-flame measurements of temperature and gas composition were made
for each combustion unit in this work. The measurement ports are indicated by dotted lines.
The axial distance of each facility is normalized with regard to the diameter of the coal pipe of
the burner (see Table 3 for these values) for easier comparison. There are no in-flame
measurement possibilities in the full-scale kiln. For the pilot-scale kiln and the OFC, in-flame
measurements are performed in similar locations with an extra early measurement for the pilot-
scale kiln. The L1500 has a shorter normalized length than the other facilities, which makes
sense because the L1500 coal pipe is significantly larger and does not create a jet flame.
Figure 13. Visual comparison of the combustion facilities with the axial distance normalized to the diameter of the
burner coal pipe in respective facility. The coal pipe diameters are 0.085m, 0.0125m, 0.012m and 0.076m for the
full-scale, pilot-scale, OFC and L1500 respectively. The dotted lines indicate where in-flame measurements of
temperature and gas composition were made.

30

31
6 Modeling
When using modeling to describe a phenomenon that occurs during a complex process, such as
solid fuel combustion, it is highly challenging to decide on what to include and exclude in the
model. A common dilemma when modeling combustion is that while both the aerodynamics
and the reaction rates are of great importance, describing both of these simultaneously is
problematic. One reason for this is the computational power required for detailed descriptions
of both aspects. Another reason is that the interactions of all combustion phenomena are not
well understood and trying to introduce as many aspects as possible will inevitably introduce
uncertainties and result in errors. Modeling using Computational Fluid Dynamics (CFD)
typically relies on detailed descriptions of the flow fields and the mixing processes but uses
less-detailed descriptions of reaction rates. In contrast, detailed reaction modeling relies on
simplified approaches to describe mixing but includes detailed reaction schemes. In this work,
a detailed reaction model is used.
6.1 Model description
Figure 14 presents a schematic overview of the model. The model describes the combustion
chemistry and NO formation during the combustion of a fuel. In theory, it can be used as a
predictive model. However, for this, the model would require information on heat losses, to
calculate the temperature profile, as well as an estimation of the mixing profile between the fuel
and oxidizer. Instead, providing the model with a temperature profile (from, for example,
measurements) and fitting the mixing profile to existing O2 and CO measurements avoids these
uncertainties and provides a detailed description of the combustion conditions in a given
process. Analyses of the reaction pathways and the governing reaction mechanisms may then
be performed. Table 4 presents an overview of how the model treats the characteristics of
combustion, such as the kinetics, mixing, heat release, heat transfer, species concentrations,
temperature, and fuel, all of which are important and interconnected.
Kinetics and mixing
The in-flame combustion chemistry is investigated using a plug flow reactor (PFR) model. The
fuel is injected at the inlet of the PFR and the air is introduced in a staged manner, i.e., the fuel
stream is gradually diluted with air. This process represents the mixing of fuel and air. The air
is divided into primary air and secondary air, with the primary air being mixed with the fuel at
a higher rate. The mixing rate is dependent upon the total flow of air and the share of the flow
introduced at a given distance within the PFR (defined by the user). The mixing rate is high if
a lot of air has been injected at a short distance in the PFR. A longer injection distance equals
a slower mixing rate. The combustion chemistry is described by the detailed reaction kinetics
proposed by Mendiara and Glarborg [97] for the homogeneous reactions, and the apparent
kinetics are described by Jensen [98] for the heterogeneous reactions. The detailed
homogeneous reaction mechanism involves 97 species and 779 reactions. In addition, the
following irreversible heterogeneous reactions with apparent kinetics are included: (i) the
conversion of char into CO (R1); (ii) the oxidation of char-N to NO (R2); and (iii) the reduction
of NO by char (R3 and R4). The reduction of NO by char is described by two reactions. Table
5 presents the reactions and the corresponding kinetics.

32
Figure 14. Illustration of the model structure, showing the inputs and outputs.
Table 4. Summary of the ways in which combustion characteristics are treated in the modeling.
Combustion characteristic(s) Treatment in the modeling
Kinetics • Detailed homogeneous reaction kinetics are used for
the volatiles
• Apparent kinetics are used for the heterogeneous
kinetics
Mixing • Mixing is defined by how rapidly air is added to the
fuel in the axial direction
• Mixing on a smaller scale (e.g., through eddies and
vortexes) is not considered
Heat release, heat transfer,
and temperature • The energy equation is not solved. Instead, the
temperature profile is given as an input from
measurements (or CFD)
Fuel composition • The volatiles are assumed to consist of CH4, CO, H2
and HCN
• Char and Char-N are modeled as C2(s) and N2(s) that
are converted only through irreversible heterogeneous
oxidation
• Ash is treated as a fully inert component
• Water is assumed to be in the form of vapor from the
start
Ignition and pyrolysis • Ignition is inherently controlled by the kinetics and
depends on the temperature and gas composition
• The pyrolysis is assumed to be instantaneous
• Tars are neglected
Particle characteristics • Properties related to the solid particles, such as
porosity, surface area, fragmenting, and swelling, are
ignored

33
Table 5. Reactions and kinetics of the heterogeneous mechanism.
Reaction A
[cm3/mol/s]
Ea
[cal/mol]
R1 C2(s) + O2(g) -> 2 CO (g) 2.24×10¹¹ 29,400
R2 N2(s) + O2(g) -> 2 NO (g) 2.24×10¹¹ 29,400
R3 NO(g) + C2(s) -> CO(g) + CN(s)* 1.46×10¹¹ 29,400
R4 2 CN(s) -> C2(s) + N2(g)* 1.00E×1020 0
*The overall reaction of NO(g) + ½ C2(s) -> ½ N2(g) + CO(g) is implemented as a two-step reaction, with R3 as
the controlling step.
This mechanism assumes full conversion of char-N to NO. Thus, the reduction of NO by char
dictates the apparent conversion. In the original heterogeneous mechanism proposed by Jensen
[98], the conversion of char-N to NO was 75% (25% conversion to N2), based on observed
values of 50%–100% under single-particle conditions for temperatures in the range of 850°–
1150°C. However, it was only at 850°C that the char-N-to-NO conversion did not reach 100%
under single-particle conditions [55]. Since the operating temperatures during char combustion
in iron ore rotary kilns will be even higher, 100% conversion of char-N to NO is applied in the
present work.
Fuel properties
The contents of volatiles, moisture, and ash, as well as the elemental composition of the fuel
are given as inputs to the model. Moisture in the fuel is modeled as water vapor, i.e., the impact
of vaporization is not included, and the ash is modeled as an inert component that does not
interact with the combustion process. The char is represented as C2(s), and the volatiles are
assumed to consist of CH4, H2, and CO. The split between the volatile components is
determined by the elemental balances for C, H, and O:
𝑌𝐶𝑂 (
𝑀𝐶
𝑀𝐶𝑂) + 𝑌𝐶𝐻4 (
𝑀𝐶
𝑀𝐶𝐻4
) =𝑋𝐶,𝑓𝑢𝑒𝑙 − 𝑋𝑐ℎ𝑎𝑟
1 − 𝑋𝑐ℎ𝑎𝑟
Eq. 7
𝑌𝐻2 (
2𝑀𝐻
𝑀𝐻2
) + 𝑌𝐶𝐻4 (4𝑀𝐻
𝑀𝐶𝐻4
) =𝑋𝐻,𝑓𝑢𝑒𝑙
1 − 𝑋𝑐ℎ𝑎𝑟
Eq. 8
𝑌𝐶𝑂 (
𝑀𝑂
𝑀𝐶𝑂) =
𝑋𝑂,𝑓𝑢𝑒𝑙
1 − 𝑋𝑐ℎ𝑎𝑟
Eq. 9
where Yi is the mass fraction of species i in the volatiles, Mi is the molar mass of species i, and
Xk is the fuel mass fraction of element k in the fuel (dry, ash-free basis). The system of equations
is then solved to obtain the value of Y for CH4, H2, and CO. This is a simplification of the
approach proposed by Thunman et al [99].
The nitrogen content of the fuel is split between the volatiles and char, i.e., a share is released
with the volatiles as HCN, while the remainder is released with the char as ‘N2(s)’. This share
is set by the user. Table 6 gives an example of the composition of the modeled and actual fuel
composition assuming that vol-N and char-N have 50/50 shares and using Eqs. 3–5. In Paper
IV, the char yield results from the flat-flame burner were used as input to the model in the form
of Xchar (instead of the proximate analysis). The nitrogen content in the char was also used to
determine the nitrogen partitioning (rather than simply assuming it).

34
Table 6. Fuel composition of Coal A used in the pilot-scale kiln and the corresponding modeled fuel composition
(assuming a 50/50 split between vol-N and char-N). The composition is given on a wet basis.
Actual
composition
Unit Value Modeled
composition
Unit Value
Fixed carbon* mass-% 64.6 C2 (s) mass-% 63.9
Ash mass-% 13.1 Ash mass-% 13.1
H2O mass-% 0.9 H2O (g) mass-% 0.9
Volatiles mass-% 21.4 CO (g) mass-% 8.2
C mass-% 75.4 CH4 (g) mass-% 11.1
H mass-% 3.9 H2 (g) mass-% 0.79
O mass-% 5.9 HCN (g) mass-% 1.32
N mass-% 1.37 N2 (s) mass-% 0.68
O2-demand m3n/kgfuel 1.59 O2-demand m3
n/kgfuel 1.58
*Calculated by difference (100-Volatiles-Ash-H2O).
Reaction analysis
The Chemkin solver calculates the rates of all the reactions at each step in the PFR using the
law of mass action:
𝑟𝑎𝑡𝑒 = 𝑘∏𝑐𝑖𝜈𝑖 Eq. 10
where k is the rate constant (see Eq. 1), ci is the concentration of the ith reactant in the reaction,
andνi is the stoichiometric coefficient for the ith reactant. Reverse reactions are calculated
through the use of thermodynamic data. The resulting rate at each step in the PFR is given in
mole/cm3/s. Since the purpose of the model is to evaluate NO formation during combustion,
each rate is integrated, either over volume or residence time, in order to evaluate its overall
importance. The net formation of NO (in mol/s) in the PFR is derived by integrating the net NO
formation rate over the volume of the reactor. Likewise, the level of NO production from char-
N and the level of NO reduction by char are calculated by integrating R2 and R3, respectively.
The thermal formation of NO is usually described by R3-2–R3-4. However, due to the fact that
the reverse reaction of R3-2 and the forward reaction of R3-4 are central to the net conversion
of vol-N to NO, these reactions cannot simply be integrated to obtain the thermal NO formation.
In Paper II, only the forward reactions of R3-2 and R3-3 are considered to be part of the thermal
NO formation mechanism.
To compare NO formation between combustion systems at different scales, the formation of
NO is divided by the fuel input (in MWfuel). The resulting value is then in units of molNO/MJfuel.
This can then be converted to e.g. mgNO2/MJfuel.
6.2 Modeling NO formation
To illustrate how NO formation via the thermal NO mechanism and the conversion of volatile
nitrogen are affected by temperature and local stoichiometry (mixing rate) in the model, a
sensitivity analysis is provided in Figure 15–17. The simulations are performed using an
isothermal PFR with a length of 5 m. The gas velocity is set at 5 m/s so that the residence time
is 1 s in all the simulations. In Figure 15a, only air is present in the reactor. In Figure 15b, air
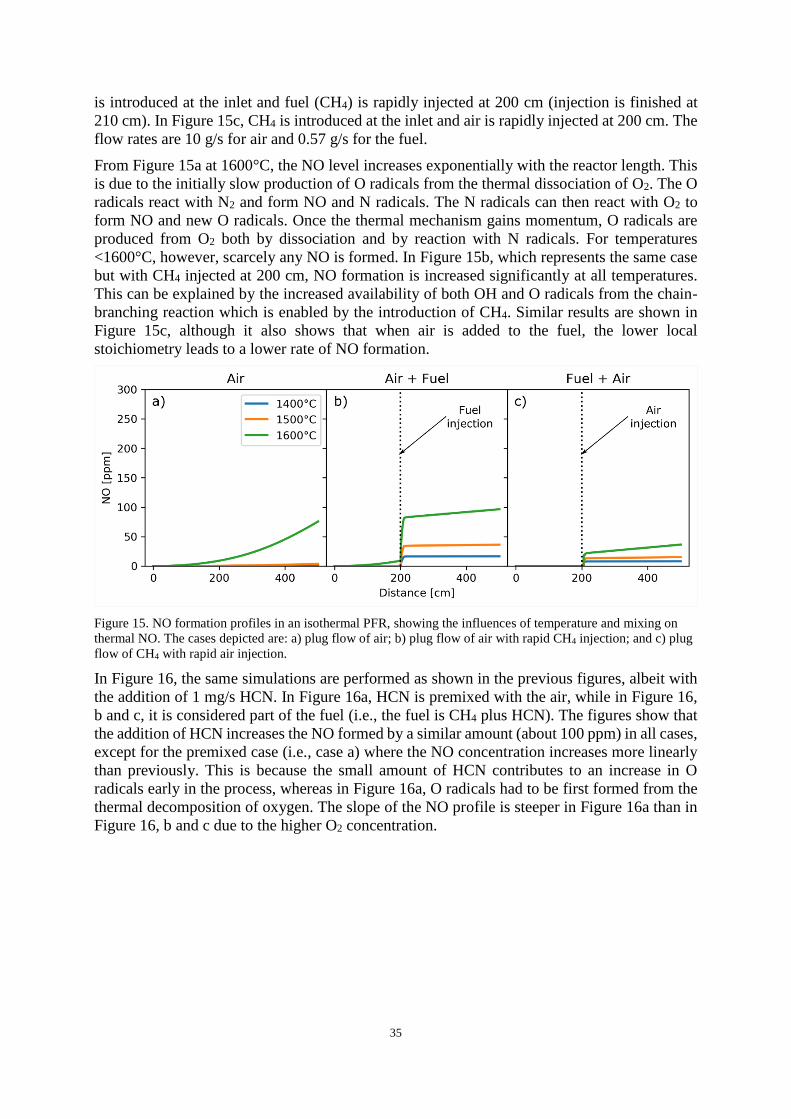
35
is introduced at the inlet and fuel (CH4) is rapidly injected at 200 cm (injection is finished at
210 cm). In Figure 15c, CH4 is introduced at the inlet and air is rapidly injected at 200 cm. The
flow rates are 10 g/s for air and 0.57 g/s for the fuel.
From Figure 15a at 1600°C, the NO level increases exponentially with the reactor length. This
is due to the initially slow production of O radicals from the thermal dissociation of O2. The O
radicals react with N2 and form NO and N radicals. The N radicals can then react with O2 to
form NO and new O radicals. Once the thermal mechanism gains momentum, O radicals are
produced from O2 both by dissociation and by reaction with N radicals. For temperatures
<1600°C, however, scarcely any NO is formed. In Figure 15b, which represents the same case
but with CH4 injected at 200 cm, NO formation is increased significantly at all temperatures.
This can be explained by the increased availability of both OH and O radicals from the chain-
branching reaction which is enabled by the introduction of CH4. Similar results are shown in
Figure 15c, although it also shows that when air is added to the fuel, the lower local
stoichiometry leads to a lower rate of NO formation.
Figure 15. NO formation profiles in an isothermal PFR, showing the influences of temperature and mixing on
thermal NO. The cases depicted are: a) plug flow of air; b) plug flow of air with rapid CH4 injection; and c) plug
flow of CH4 with rapid air injection.
In Figure 16, the same simulations are performed as shown in the previous figures, albeit with
the addition of 1 mg/s HCN. In Figure 16a, HCN is premixed with the air, while in Figure 16,
b and c, it is considered part of the fuel (i.e., the fuel is CH4 plus HCN). The figures show that
the addition of HCN increases the NO formed by a similar amount (about 100 ppm) in all cases,
except for the premixed case (i.e., case a) where the NO concentration increases more linearly
than previously. This is because the small amount of HCN contributes to an increase in O
radicals early in the process, whereas in Figure 16a, O radicals had to be first formed from the
thermal decomposition of oxygen. The slope of the NO profile is steeper in Figure 16a than in
Figure 16, b and c due to the higher O2 concentration.

36
Figure 16. NO formation profiles in an isothermal PFR, showing the influences of temperature and mixing on
NO formation when HCN is present. The cases depicted are: a) plug flow of air plus HCN; b) plug flow of air
with rapid CH4 plus HCN injection; and c) plug flow of CH4 plus HCN with rapid air injection.
In Figure 15b-c and Figure 16b-c, the mixing of the fuel and air occurred rapidly. In Figure 17,
the mixing rate is reduced (continuous injection between 200 cm and 400 cm). When fuel is
added to the air (Figure 17a), NO formation is higher than when the mixing is fast (Figure 16b),
and the formation rate is sensitive to the temperature. When air is injected into the fuel (Figure
17b), the NO concentrations are about half the concentrations noted when the injection is rapid
(Figure 16c), and the formation of NO appears to be less sensitive to the temperature. These
graphs illustrate the importance of local stoichiometry. In Figure 17a, the air-to-fuel
equivalence ratio increases from 0 to 1.02, while in Figure 17, it goes from infinity to 1.02. This
means that the local conditions are oxygen-rich for a significant amount of time in a) but are
oxygen-lean in b). In Figure 16, the time spent at an air-to-fuel equivalence ratio above or below
1.02 is significantly shorter.
Figure 17. NO formation profiles in an isothermal PFR showing the influences of temperature and mixing on NO
formation. The cases shown are: a) plug flow of air with slow CH4 plus HCN injection; and b) plug flow of CH4
plus HCN with slow injection of air.
Figure 15–17 show that the NO formation from gaseous reactions is heavily dependent upon
the local conditions. A turbulent diffusion flame consists of several zones with different local
temperatures, gas compositions, and stoichiometries, and the residence times in these zones
vary. When a solid fuel such as coal or biomass is combusted, heterogeneous reactions add to
this complexity.

37
7 Results and Discussion
This chapter summarizes the most important results from the appended papers in relation to the
research topics of this thesis.
7.1 NO formation routes
In-flame measurements from Paper I were used as input to the model in Papers II and III to
investigate the contributions of homogeneous and heterogeneous reactions to total NO
formation. The simulations of the pilot-scale kiln showed that the partitioning of the fuel-
nitrogen is crucial. In general, the NO formation from the vol-N was low, but the combustion
conditions during char combustion contributed significantly to NO formation. Since the
apparent conversion of char-N to NO is primarily dependent upon the reduction of NO by char,
it means that the reduction of NO by char was inefficient. The amount of NOx formed through
the thermal NO mechanism was of low importance. When the amount of primary air was
increased, vol-N contributed significantly more.
In Paper III, the effects of scaling were investigated by applying the same (normalized)
temperature and mixing profiles in the pilot-scale and full-scale kilns. The results for NO
formation are shown in Figure 18. The model captures the reduced level of NO formation in
the full-scale (which was observed experimentally) and attributes it to a lower NO contribution
from the heterogeneous reactions, i.e. a more efficient reduction of NO by char in full-scale.
This turns out to be the combined effect of the constant velocity scaling and the rate of char
conversion. Since the velocities are the same in both kilns, but the full-scale kiln is significantly
longer, the fuel residence time under oxygen-lean conditions becomes longer in full-scale. In
contrast, the fuel stream penetrates further into the pilot-scale kiln where more oxygen is
available. As a consequence, char is oxidized faster by O2 and the reduction of NO becomes
less efficient. If the combustion would have been entirely controlled by mixing, this would not
be an issue, but since the char consumes O2 slower than the rate of which O2 is becoming
available, the char experiences a more oxidizing atmosphere in the pilot-scale kiln. The
contribution from homogeneous reactions, i.e. vol-N conversion and thermal NO formation, are
however well preserved during the scaling process.
Figure 18. Bar diagram showing the levels of NO formation normalized to the fuel input in the full-scale and pilot-
scale as calculated by the model using a vol-N:char-N ratio of 1:1. The first bar represents the total NO formation,
the second bar is the formation of NO from the homogeneous reactions, and the third bar represents the NO
formation from the heterogeneous reactions. The dotted lines represent the measured emissions. The error bars are
for vol-N:char-N ratios of 1:3 (upper error bar) and 3:1 (lower error bar), respectively.

38
The simulations performed in Papers II and III2 were performed such that air was mixed into
a stream of fuel, similar to what was performed in the experiments described in Figure 17b, i.e.,
combustion starts under sub-stoichiometric conditions and then gradually attains the global
stoichiometry. As shown in the modeling section, this approach leads to less thermal NO
formation than if the fuel is injected into a stream of air. Figure 19 presents modeling results
from when CH4 is injected into an air stream, representing a ‘worst case scenario’ where the
conditions for thermal NO formation are optimized. This result is presented along with the
measured and calculated NO profiles in Paper II. The temperature profile (based on
measurements3) was the same in both simulations as well as the exit concentration of O2. A
third case with CH4 injection into an air stream but with the temperature profile increased by
100°C at all points is also provided. Even with an increase of 100°C at all positions and
favorable mixing conditions, thermal NO formation is low compared to the NO formed from
the fuel-bound nitrogen.
Figure 19. NO profiles for three modelled cases. In-flame measurements of temperature as well as O2 and CO
concentration are used for the temperature and injection profiles (based on Coal A combustion). Coal A: Fuel is
described by the model according to the fuel analysis of Coal A. CH4 to air: Same simulation as Coal A but with
methane instead of Coal A (same stoichiometry). CH4 to air, T+100°C: Same simulation as ‘CH4 to air’ but with
the entire temperature profile increased by 100°C. Symbols: measurement points.
From the results in Paper I-III it is established that char-N dominates the NO formation in iron
ore rotary kilns. The apparent conversion of char-N to NO is the result of O2 and NO competing
for char sites, and the concentration ratio [O2]/[NO] during char conversion is thus a controlling
factor. The high level of excess air entrainment into the flame leads to a high O2 concentration
and also results in a low NO concentration due to dilution by N2. This knowledge should be
kept in mind when attempting to reduce NOx formation in iron ore rotary kilns.
7.2 The impact of fuel type on NOx emissions
Figure 20 shows the measured levels of NOx emissions from the solid fuel experiments in the
pilot-scale kiln (Paper I) and in the full-scale kiln (Paper III). For comparison, data from other,
mostly unstaged, flame studies taken from the literature [52, 74, 90, 100] are included as gray
symbols. The limit stated in the Medium Combustion Plant Directive (MCPD) [101] by the EU
is also included as a reference to what a ‘low’ level of NOx infers. Some important observations
from this graph are that: (i) the levels of emissions are clearly higher from the pilot-scale kiln
2See Appendix B for a discussion of the differences between the mixing profiles used in Paper II and Paper III.
3See Appendix C for temperature measurements of the Coal A flames obtained in Paper I
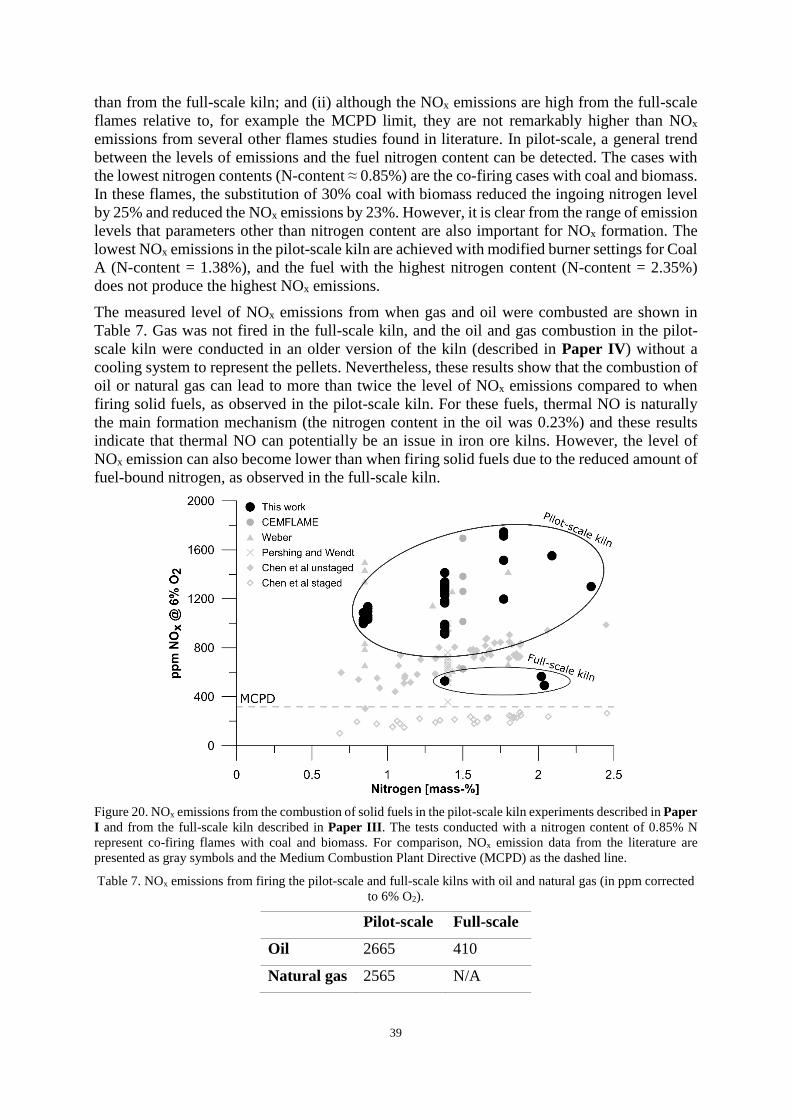
39
than from the full-scale kiln; and (ii) although the NOx emissions are high from the full-scale
flames relative to, for example the MCPD limit, they are not remarkably higher than NOx
emissions from several other flames studies found in literature. In pilot-scale, a general trend
between the levels of emissions and the fuel nitrogen content can be detected. The cases with
the lowest nitrogen contents (N-content ≈ 0.85%) are the co-firing cases with coal and biomass.
In these flames, the substitution of 30% coal with biomass reduced the ingoing nitrogen level
by 25% and reduced the NOx emissions by 23%. However, it is clear from the range of emission
levels that parameters other than nitrogen content are also important for NOx formation. The
lowest NOx emissions in the pilot-scale kiln are achieved with modified burner settings for Coal
A (N-content = 1.38%), and the fuel with the highest nitrogen content (N-content = 2.35%)
does not produce the highest NOx emissions.
The measured level of NOx emissions from when gas and oil were combusted are shown in
Table 7. Gas was not fired in the full-scale kiln, and the oil and gas combustion in the pilot-
scale kiln were conducted in an older version of the kiln (described in Paper IV) without a
cooling system to represent the pellets. Nevertheless, these results show that the combustion of
oil or natural gas can lead to more than twice the level of NOx emissions compared to when
firing solid fuels, as observed in the pilot-scale kiln. For these fuels, thermal NO is naturally
the main formation mechanism (the nitrogen content in the oil was 0.23%) and these results
indicate that thermal NO can potentially be an issue in iron ore kilns. However, the level of
NOx emission can also become lower than when firing solid fuels due to the reduced amount of
fuel-bound nitrogen, as observed in the full-scale kiln.
Figure 20. NOx emissions from the combustion of solid fuels in the pilot-scale kiln experiments described in Paper
I and from the full-scale kiln described in Paper III. The tests conducted with a nitrogen content of 0.85% N
represent co-firing flames with coal and biomass. For comparison, NOx emission data from the literature are
presented as gray symbols and the Medium Combustion Plant Directive (MCPD) as the dashed line.
Table 7. NOx emissions from firing the pilot-scale and full-scale kilns with oil and natural gas (in ppm corrected
to 6% O2).
Pilot-scale Full-scale
Oil 2665 410
Natural gas 2565 N/A
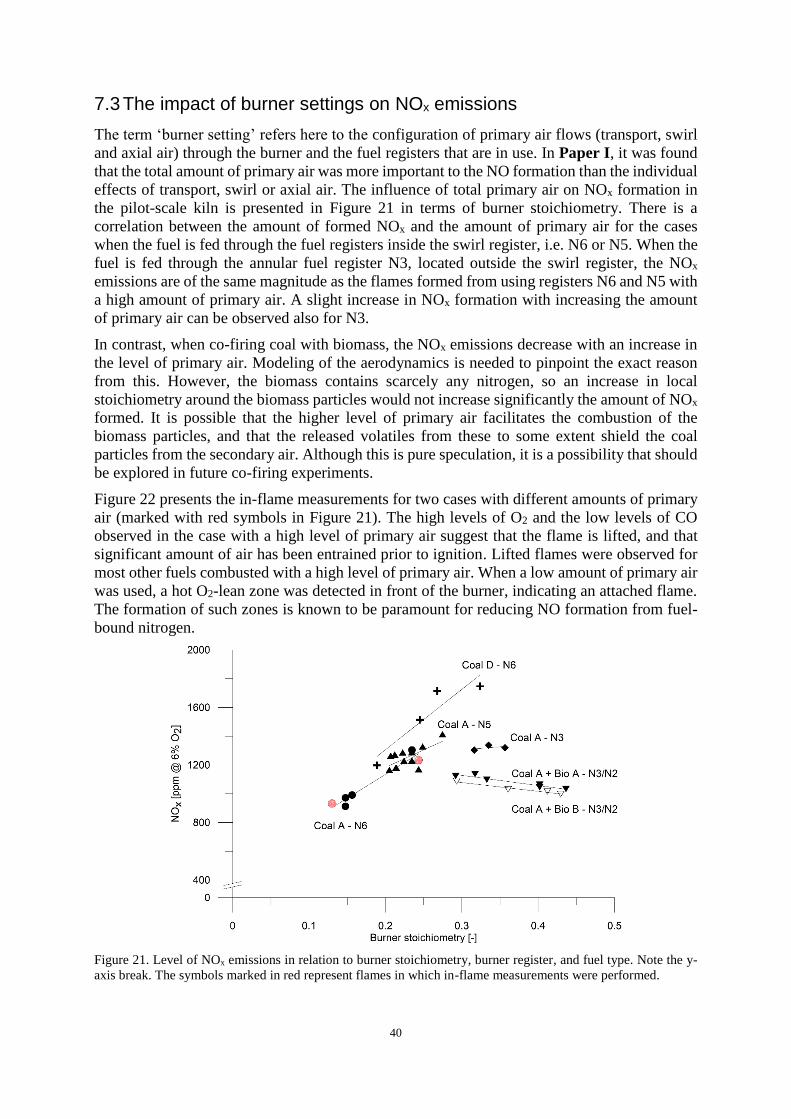
40
7.3 The impact of burner settings on NOx emissions
The term ‘burner setting’ refers here to the configuration of primary air flows (transport, swirl
and axial air) through the burner and the fuel registers that are in use. In Paper I, it was found
that the total amount of primary air was more important to the NO formation than the individual
effects of transport, swirl or axial air. The influence of total primary air on NOx formation in
the pilot-scale kiln is presented in Figure 21 in terms of burner stoichiometry. There is a
correlation between the amount of formed NOx and the amount of primary air for the cases
when the fuel is fed through the fuel registers inside the swirl register, i.e. N6 or N5. When the
fuel is fed through the annular fuel register N3, located outside the swirl register, the NOx
emissions are of the same magnitude as the flames formed from using registers N6 and N5 with
a high amount of primary air. A slight increase in NOx formation with increasing the amount
of primary air can be observed also for N3.
In contrast, when co-firing coal with biomass, the NOx emissions decrease with an increase in
the level of primary air. Modeling of the aerodynamics is needed to pinpoint the exact reason
from this. However, the biomass contains scarcely any nitrogen, so an increase in local
stoichiometry around the biomass particles would not increase significantly the amount of NOx
formed. It is possible that the higher level of primary air facilitates the combustion of the
biomass particles, and that the released volatiles from these to some extent shield the coal
particles from the secondary air. Although this is pure speculation, it is a possibility that should
be explored in future co-firing experiments.
Figure 22 presents the in-flame measurements for two cases with different amounts of primary
air (marked with red symbols in Figure 21). The high levels of O2 and the low levels of CO
observed in the case with a high level of primary air suggest that the flame is lifted, and that
significant amount of air has been entrained prior to ignition. Lifted flames were observed for
most other fuels combusted with a high level of primary air. When a low amount of primary air
was used, a hot O2-lean zone was detected in front of the burner, indicating an attached flame.
The formation of such zones is known to be paramount for reducing NO formation from fuel-
bound nitrogen.
Figure 21. Level of NOx emissions in relation to burner stoichiometry, burner register, and fuel type. Note the y-
axis break. The symbols marked in red represent flames in which in-flame measurements were performed.

41
Figure 22. Filled contour maps for temperature, CO, O2, and NO for two cases: one with a high level of primary
air and one with a low level of primary air in the kiln. These flames are marked with red symbols in Figure 21.
7.4 NOx mitigation measures
For conventional combustion units, for example plants in the heat and power industry, a
combination of primary and secondary measures is often used to comply with emission
regulations. The LKAB KK4 plant was the first Grate-Kiln plant to implement a secondary
measure in the form of a SCR. Bolen [28] writes that this plant marked the start of a new era in
pollution control for the production of iron ore. The installed SCR succeeds in reducing NOx
efficiently when running. However, the large volumetric gas flow, the dusty environment and
the inherent variations in operating conditions make the SCR costly to run and it is not easily
integrated in the process. For practical reasons, the SCR is therefore often bypassed. Primary
measures are thus preferred.
Over the years, a significant number of tests has been conducted by LKAB with the aim of
reducing NOx emissions. The original goal was to reduce NOx in the full-scale kiln with 40%
by using primary measures. This section presents the measures that have been applied in both
pilot-scale and full-scale and the corresponding NOx reductions. Suggestions for future NOx
mitigation measures are provided by the end.
Summary of tested primary measures
Table 8 lists the primary measures for NOx reduction that have been tested by LKAB in the
pilot-scale and full-scale kilns (reviewed in Paper IV). It is evident from the table that the goal
of achieving 40% NOx reduction has not been accomplished. Since the pilot-scale kiln has been
rebuilt several times, it is not possible to relate all measures to one baseline value. It can
however be established that the measures that achieve NOx reduction in pilot-scale only achieve
modest NOx reductions in the full-scale. This is to some extent expected given that the initial
NO level is higher in the pilot-scale kiln and that a higher NO partial pressure will facilitate
both the homogeneous and heterogeneous reduction of NO. Some measures, e.g., the use of
water sprays, aim to reduce thermal NO formation; the fact that the NOx emissions are not
reduced is in line with the low-level importance of thermal NO discussed in the previous
section. Primary measures that target the reduction of vol-N conversion, such as burner design

42
and burner air flow configuration, achieve noteworthy reductions in pilot-scale but fail to reduce
NOx significantly in full-scale.
Table 8. A summary of the primary measures for NOx reduction that have been tested by LKAB in pilot-scale
and full-scale kilns.
Primary measure Description NOx
reduction
pilot-scale
NOx
reduction
full-scale
Low NOx burners ‘Precessing jet’ burner
‘Large swirl’ burner
15%
10%
0%
5%
Kiln hood modifications Reduced mixing intensity
of secondary air 10% 5%
Decreased secondary air
temperature
From 1080°C to 970°C 0%–15%* Not tested
Heating of primary air 340°C 0% Not tested
Heating of coal 85°C 0% Not tested
Reducing excess air λ: 4.6 → 4.3
λ: 4.0 → 1.1
Not tested
5%–50%
8.5%**
Not tested
Reducing primary air λburner: 0.25 → 0.13 25%*** Not tested
Increasing transport air
velocity
0% 0%–10%
Propane co-firing 0% Not tested
Primary air partly replaced
by steam, N2 or Ar
0% Not tested
Addition of water sprays
around burner
0% Not tested
Addition of water to the
secondary air
0% Not tested
* Only reduced NOx in the absence of a cooling system to represent the pellet bed
** Resulted in pellet quality problems
*** Change from lifted flame to attached flame
One of the most efficient ways to reduce NOx formation in both pilot-scale and full-scale is to
reduce the amount of excess air. By only reducing it slightly in full-scale, a reduction of 8.5%
is achieved. The strong effect of excess air is supported by modelling. Figure 23 presents
simulation results (from Paper IV) for reductions in stoichiometry so that the exit O2
concentration went from 16% to 13% and 10% respectively. The reduction in excess air reduces
primarily the amount of NO formed the heterogeneous reactions, although a slight reduction in
the homogeneous contribution can also be observed. However, as noted in Table 8, the
reduction of excess air also resulted in issues with the pellet quality.

43
Figure 23. NO formation in pilot-scale and full-scale as a function of excess air. For these simulations, the amount
of primary air is high (λburner = 0.25). PS: pilot-scale kiln; FS: full-scale kiln; homogeneous: net NO formation
from homogeneous reactions (including vol-N conversion and thermal NO formation); heterogeneous: net NO
formation from the oxidation of char-N and the reduction of NO by char.
Apart from reducing the amount of excess air, increasing the transport air is the only primary
measures that has had any significant effect in full-scale. Boateng [78] writes that for confined
jet flames, high primary air velocities recirculates combustion products to the burner and thus
facilitates an attached flame. This is a likely explanation, although in the pilot-scale flame, high
amounts of primary air resulted in lifted flames, which is also in-line with the results from other
work on pilot-scale kilns, e.g. the CEMFLAME project [89, 90].
Proposed mitigation measures
Based on the results presented in this chapter, measures for efficient NOx reduction in iron ore
rotary kilns should focus on:
A) Addressing the high char-N conversion to NO; and/or
B) Reducing the amount of nitrogen in the char
Regarding point A), the high conversion of char-N is primarily an effect of the high level of
excess air, since it leads to high concentrations of O2 and also dilutes the formed NO, making
NO reduction reactions less-efficient. However, because the reduction of excess air resulted in
problems with product quality, it is not a viable option in the absence of actions to adapt the
heat treatment process. An alternative way to reduce the high char-N conversion is to apply
burners that do not produce jet flames (i.e., not Type-0 flames), such that more of the char is
combusted and gasified in an internal recirculation zone in front of the burner. Results from a
flat-burner flame was used as input to the model in Paper IV and showed that the gasification
of char and char-N results in considerably lower NOx emissions. Type 1-3 flames are
significantly shorter than Type-0 (jet) flames, and an evaluation of the impact on pellet quality
would need to be made. It is also not clear whether such flames can be maintained given the
large flow of secondary air.
Regarding point B), the model suggests that if the nitrogen could be released with the volatiles
rather than being retained in the char, NO formation would be reduced drastically. In theory,
this could be achieved by increasing the pyrolysis temperature. This concept has been
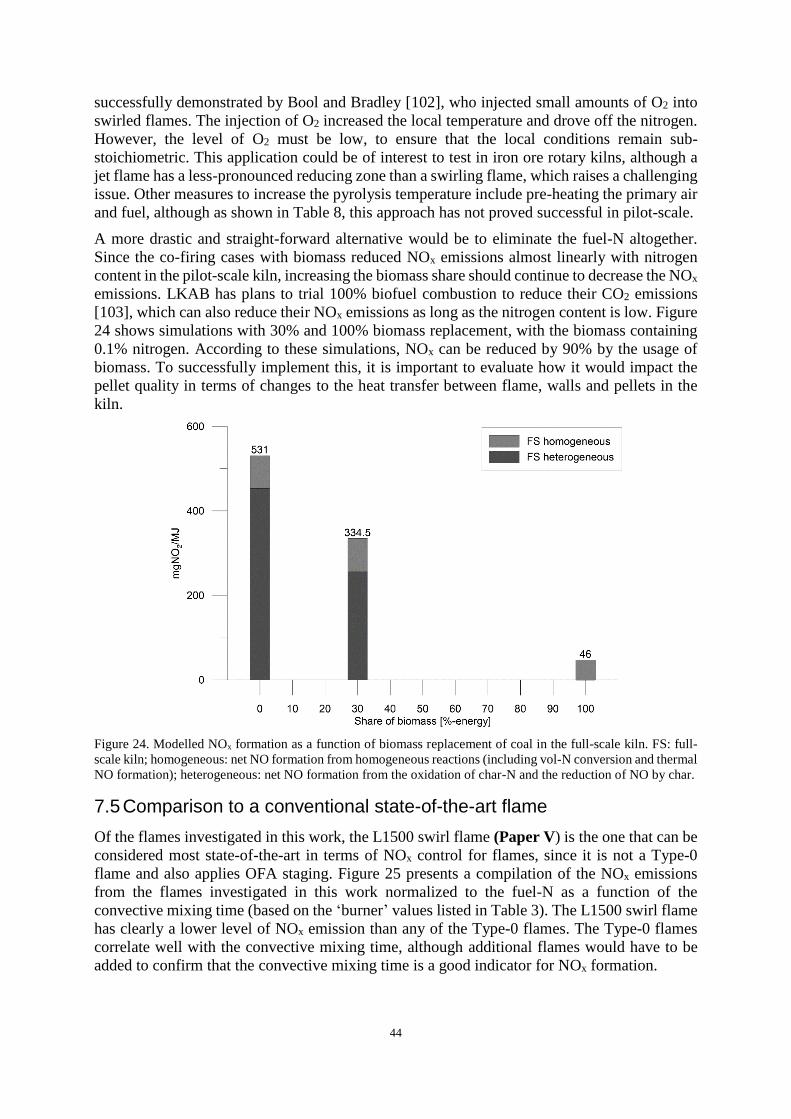
44
successfully demonstrated by Bool and Bradley [102], who injected small amounts of O2 into
swirled flames. The injection of O2 increased the local temperature and drove off the nitrogen.
However, the level of O2 must be low, to ensure that the local conditions remain sub-
stoichiometric. This application could be of interest to test in iron ore rotary kilns, although a
jet flame has a less-pronounced reducing zone than a swirling flame, which raises a challenging
issue. Other measures to increase the pyrolysis temperature include pre-heating the primary air
and fuel, although as shown in Table 8, this approach has not proved successful in pilot-scale.
A more drastic and straight-forward alternative would be to eliminate the fuel-N altogether.
Since the co-firing cases with biomass reduced NOx emissions almost linearly with nitrogen
content in the pilot-scale kiln, increasing the biomass share should continue to decrease the NOx
emissions. LKAB has plans to trial 100% biofuel combustion to reduce their CO2 emissions
[103], which can also reduce their NOx emissions as long as the nitrogen content is low. Figure
24 shows simulations with 30% and 100% biomass replacement, with the biomass containing
0.1% nitrogen. According to these simulations, NOx can be reduced by 90% by the usage of
biomass. To successfully implement this, it is important to evaluate how it would impact the
pellet quality in terms of changes to the heat transfer between flame, walls and pellets in the
kiln.
Figure 24. Modelled NOx formation as a function of biomass replacement of coal in the full-scale kiln. FS: full-
scale kiln; homogeneous: net NO formation from homogeneous reactions (including vol-N conversion and thermal
NO formation); heterogeneous: net NO formation from the oxidation of char-N and the reduction of NO by char.
7.5 Comparison to a conventional state-of-the-art flame
Of the flames investigated in this work, the L1500 swirl flame (Paper V) is the one that can be
considered most state-of-the-art in terms of NOx control for flames, since it is not a Type-0
flame and also applies OFA staging. Figure 25 presents a compilation of the NOx emissions
from the flames investigated in this work normalized to the fuel-N as a function of the
convective mixing time (based on the ‘burner’ values listed in Table 3). The L1500 swirl flame
has clearly a lower level of NOx emission than any of the Type-0 flames. The Type-0 flames
correlate well with the convective mixing time, although additional flames would have to be
added to confirm that the convective mixing time is a good indicator for NOx formation.

45
Figure 25. Ratio of outgoing NOx to ingoing fuel-nitrogen as a function of the convective mixing time based on
the combustion facilities used in this work.
Figure 26 compares the in-flame measurements of temperature, CO, and NO for the pilot-scale
kiln flame, the OFC flame and the L1500 swirl flame. The flame in the pilot-scale kiln is the
same as shown in Figure 22 when a low amount of primary air was used. The two axes are
normalized to the burner diameter of the respective burner. Starting from the right-hand side,
the L1500 swirl flame has a hot reducing region in front of the burner, indicating a strong
recirculation zone. This is an effect of the sub-stoichiometric conditions of the burner and the
swirled air registers. Additionally, the low velocity of the fuel stream (facilitated by the use of
OFA staging) likely results in a significant particle residence time in this zone. NO is formed
at high concentrations in the beginning of the furnace, to the right of the burner, although the
concentration of NO rapidly decreases. To the left of the burner, the NO concentration is
significantly lower. This agrees with the higher CO concentration on the left-hand side,
signifying a more reducing environment.
The temperatures were significantly lower in the OFC flame and no reducing zone was
observed. Compared to the L1500 case, measurements were not performed in the early part of
the flame, and it is possible that a reducing zone exists there. However, since it is a jet flame it
is unlikely that it is as reducing as the L1500 flame. The NO concentration increases along the
length of the OFC, indicating that the particles are burning far from the burner and that NO is
being formed continuously.
Regarding the pilot-scale kiln flame, the temperatures near the burner are similar to those
observed in the L1500 swirl flame. However, the CO concentrations are significantly lower
(peak concentration of 2.2% compared to 9.3%), and the residence time in this zone is
significantly shorter in the pilot-scale kiln due to the nature of jet flames. The NO concentration
in the stack is 367 ppm, although the average spatial concentration of NO in the last
measurement port is clearly below this value, confirming that NO formation continues in the
later part of the kiln (i.e., there is significant formation of NO from char combustion).
Achieving the same reducing conditions in a rotary kiln flame as observed in the L1500 flame
is not realistic due to the requirement of excess air and the fact that the kiln rotation prevents
external staging. This work has shown that optimizing the burner configuration can enhance
the formation of a sub-stoichiometric zone in front of the burner where vol-N conversion is
suppressed, and where char is to some extent gasified. The inherent high particle velocity in jet

46
flames will however prevent significant residence time in such zones. These results emphasize
the need to either eliminate the fuel-bound nitrogen or turn to secondary measures.
Figure 26. In-flame measurements of temperature, CO, and NO in the pilot-scale kiln, the OFC, and the L1500.
The axes are normalized to the burner diameter of the specific combustion unit.
47
8 Conclusion
This thesis investigates the formation of NOx in iron ore rotary kilns. The reaction routes for
NO formation in the Type-0 flame used have been mapped and evaluated through detailed
reaction modeling and a series of measurement campaigns in different units and at different
scales.
The mapping of the reaction routes reveal that the formation of NOx is mainly from the fuel-
bound nitrogen, and that the design of the solid-fuel firing system manages to suppress thermal
formation of NO. This finding, which is discordant with the findings of previous studies on
rotary kilns, will have an important impact on efforts to design efficient primary measures. This
thesis concludes that the high concentrations of oxygen required to sustain the iron ore oxidation
process increase significantly the rate of mainly char-N to NO conversion.
The mapping of the reaction routes and the evaluation of the constant velocity scaling principle
for the Type-0 flame also explain the modest effects seen previously for low-NOx techniques
tested in the full-scale rotary kiln. This work proposes that future efforts should focus on
reducing the amount of char-bound nitrogen through: A) shifting to a low-N fuel; or B)
increasing the share of nitrogen released with the volatiles.

48

49
9 Outlook
Implementation of (low-nitrogen) biomass combustion in full-scale shows promising effects on
NOx reduction by the work performed in this thesis and is thus a recommended for future work.
Efforts are being made by LKAB to reduce their CO2 emissions, and full-scale biomass
combustion could become reality in the coming years.
Suggestions for additional future work includes evaluating the effect of char characteristics on
NOx and developing the modeling approach. Since the char-NO interaction is controlling the
NO formation in rotary kiln flames, investigating how to enhance the NO reduction by char
would be interesting. For example, the influence of ash minerals or fuel properties that affect
the char surface area could be investigated. Furthermore, adapting the heterogeneous kinetics
to the fuel (e.g., type and particle size) and to the combustion conditions relevant for rotary
kilns is recommended for a more accurate description of the NO-char interaction. A particle
model could be developed to complement the model.
Finally, an aspect that has not been covered in this work is the potential interaction between the
pellet bed and the NOx gases in full-scale. Both the iron oxide and the binding ingredients in
the pellets could potentially reduce NOx under the right circumstances. Establishing whether
such effects should be considered, or taken advantage of, would be useful.
50
References
[1] J. Lelieveld, K. Klingmuller, A. Pozzer, U. Poschl, M. Fnais, A. Daiber, and T. Munzel,
"Cardiovascular disease burden from ambient air pollution in Europe reassessed using
novel hazard ratio functions," European Heart Journal, vol. 40, no. 20, pp. 1590-1596,
May 21 2019.
[2] "Ambient air pollution: A global assessment of exposure and burden of disease," World
Health Organization9241511354, 2016.
[3] A. J. Cohen, M. Brauer, R. Burnett, H. R. Anderson, J. Frostad, K. Estep, K.
Balakrishnan, B. Brunekreef, L. Dandona, R. Dandona, V. Feigin, G. Freedman, B.
Hubbell, A. Jobling, H. Kan, L. Knibbs, Y. Liu, R. Martin, L. Morawska, C. A. Pope,
H. Shin, K. Straif, G. Shaddick, M. Thomas, R. van Dingenen, A. van Donkelaar, T.
Vos, C. J. L. Murray, and M. H. Forouzanfar, "Estimates and 25-year trends of the
global burden of disease attributable to ambient air pollution: an analysis of data from
the Global Burden of Diseases Study 2015," The Lancet, vol. 389, no. 10082, pp. 1907-
1918, 2017/05/13/ 2017.
[4] M. Brauer, G. Freedman, J. Frostad, A. van Donkelaar, R. V. Martin, F. Dentener, R. v.
Dingenen, K. Estep, H. Amini, J. S. Apte, K. Balakrishnan, L. Barregard, D. Broday,
V. Feigin, S. Ghosh, P. K. Hopke, L. D. Knibbs, Y. Kokubo, Y. Liu, S. Ma, L.
Morawska, J. L. T. Sangrador, G. Shaddick, H. R. Anderson, T. Vos, M. H. Forouzanfar,
R. T. Burnett, and A. Cohen, "Ambient Air Pollution Exposure Estimation for the
Global Burden of Disease 2013," Environmental Science & Technology, vol. 50, no. 1,
pp. 79-88, 2016/01/05 2016.
[5] H. Olstrup, B. Forsberg, H. Orru, M. Spanne, H. Nguyen, P. Molnar, and C. Johansson,
"Trends in air pollutants and health impacts in three Swedish cities over the past three
decades," (in English), Atmospheric Chemistry and Physics, vol. 18, no. 21, pp. 15705-
15723, Nov 1 2018.
[6] A. W. Correia, C. Arden Pope, D. W. Dockery, Y. Wang, M. Ezzati, and F. Dominici,
"Effect of air pollution control on life expectancy in the United States: An analysis of
545 U.S. Counties for the period from 2000 to 2007," Epidemiology, Article vol. 24, no.
1, pp. 23-31, 2013.
[7] A. S. V. Shah, J. P. Langrish, H. Nair, D. A. McAllister, A. L. Hunter, K. Donaldson,
D. E. Newby, and N. L. Mills, "Global association of air pollution and heart failure: a
systematic review and meta-analysis," The Lancet, vol. 382, no. 9897, pp. 1039-1048,
2013/09/21/ 2013.
[8] R. Bobbink, M. Hornung, and J. G. M. Roelofs, "The effects of air-borne nitrogen
pollutants on species diversity in natural and semi-natural European vegetation,"
Journal of Ecology, Review vol. 86, no. 5, pp. 717-738, 1998.
[9] E. A. Ainsworth, C. R. Yendrek, S. Sitch, W. J. Collins, and L. D. Emberson, "The
effects of tropospheric ozone on net primary productivity and implications for climate
change," Annual Review of Plant Biology, vol. 63, pp. 637-61, 2012.
51
[10] J. Rose, Acid rain: current situation and remedies. Yverdon: Gordon and Breach, 1994.
[11] C. Vovelle, Pollutants from combustion: formation and impact on atmospheric
chemistry. Springer Science & Business Media, 2013.
[12] M. Z. Jacobson, Atmospheric pollution: history, science, and regulation. Cambridge
University Press, 2002.
[13] M. L. Bell, D. L. Davis, and T. Fletcher, "A retrospective assessment of mortality from
the London smog episode of 1952: the role of influenza and pollution," Environmental
health perspectives, vol. 112, no. 1, p. 6, 2004.
[14] S. Sillman, "Tropospheric ozone and photochemical smog," Environmental
geochemistry, vol. 9, pp. 407-31, 2003.
[15] S. Manahan, Environmental chemistry. CRC press, 2017.
[16] U. Kulshrestha, "Acid rain," vol. 1, ed: Taylor & Francis, New York, 2013, pp. 8-22.
[17] T. Rafstedt, "Effekter av kalkning på myrvegetation," in "Havs-och vattenmyndighetens
rapport 2016:19," Havs-och vattenmyndigheten2016, Available:
https://www.havochvatten.se/hav/uppdrag--kontakt/publikationer/publikationer/2016-
09-30-effekter-av-kalkning-pa-myrvegetation.html.
[18] M. Muntean, D. Guizzardi, E. Schaaf, M. Crippa, E. Solazzo, J. Olivier, and E. Vignati,
"Fossil CO2 Emissions of All World Countries-2018 Report," 2018.
[19] M. Crippa, D. Guizzardi, M. Muntean, E. Schaaf, F. Dentener, J. A. v. Aardenne, S.
Monni, U. Doering, J. G. Olivier, and V. Pagliari, "Gridded emissions of air pollutants
for the period 1970–2012 within EDGAR v4. 3.2," Earth System Science Data, vol. 10,
no. 4, pp. 1987-2013, 2018.
[20] Naturvårdsverket. Utsläpp i siffror [Online].
[21] "World Steel in Figures 2019," World Steel Association 2019, Available:
https://www.worldsteel.org/media-centre/press-releases/2019/world-steel-in-figures-
2019.html.
[22] S. Pauliuk, T. Wang, and D. B. Muller, "Steel all over the world: Estimating in-use
stocks of iron for 200 countries," Resources Conservation and Recycling, vol. 71, pp.
22-30, Feb 2013.
[23] D. B. Müller, T. Wang, and B. Duval, "Patterns of Iron Use in Societal Evolution,"
Environmental Science & Technology, vol. 45, no. 1, pp. 182-188, 2011/01/01 2011.
[24] P. Mbele, "Pelletizing of Sishen concentrate," Journal of the Southern African Institute
of Mining and Metallurgy, vol. 112, no. 3, pp. 221-228, 2012.
[25] D. Zhu, J. Pan, L. Lu, and R. J. Holmes, "Iron ore pelletization," in Iron Ore: Elsevier,
2015, pp. 435-473.
52
[26] J. Mourão, M. Huerta, U. de Medeiros, I. Cameron, K. O’Leary, and C. Howey,
"Guidelines for selecting pellet plant technology," in Proceedings of the 6th
International Congress on the Science and Technology of Ironmaking–ICSTI, 2012.
[27] N.-O. Lindfors and P. Kostamo, BAT examples from the Nordic iron and steel industry.
Nordic Council of Ministers, 2006.
[28] J. Bolen, "Modern air pollution control for iron ore induration," Minerals &
Metallurgical Processing, vol. 31, no. 2, pp. 103-114, 2014.
[29] D. W. Pershing and J. O. L. Wendt, "Pulverized coal combustion: The influence of
flame temperature and coal composition on thermal and fuel NOx," in Symposium
(International) on Combustion, 1977, vol. 16, no. 1, pp. 389-399: Elsevier.
[30] Y. Zeldovich, D. Frank-Kamenetskii, and P. Sadovnikov, Oxidation of nitrogen in
combustion. Publishing House of the Acad of Sciences of USSR, 1947.
[31] R. P. van der Lans, P. Glarborg, and K. Dam-Johansen, "Influence of process parameters
on nitrogen oxide formation in pulverized coal burners," Progress in Energy and
Combustion Science, vol. 23, no. 4, pp. 349-377, // 1997.
[32] P. Glarborg, A. D. Jensen, and J. E. Johnsson, "Fuel nitrogen conversion in solid fuel
fired systems," (in English), Progress in Energy and Combustion Science, vol. 29, no.
2, pp. 89-113, 2003.
[33] H. Zhang and T. H. Fletcher, "Nitrogen transformations during secondary coal
pyrolysis," Energy & fuels, vol. 15, no. 6, pp. 1512-1522, 2001.
[34] D. W. Blair, J. O. L. Wendt, and W. Bartok, "Evolution of nitrogen and other species
during controlled pyrolysis of coal," in Symposium (International) on Combustion,
1977, vol. 16, no. 1, pp. 475-489: Elsevier.
[35] J. H. Pohl and A. F. Sarofim, "Devolatilization and oxidation of coal nitrogen," in
Symposium (International) on Combustion, 1977, vol. 16, no. 1, pp. 491-501: Elsevier.
[36] P. R. Solomon and M. B. Colket, "Evolution of fuel nitrogen in coal devolatilization,"
Fuel, vol. 57, no. 12, pp. 749-755, 1978.
[37] S. Kambara, T. Takarada, Y. Yamamoto, and K. Kato, "Relation between functional
forms of coal nitrogen and formation of nitrogen oxide (NOx) precursors during rapid
pyrolysis," Energy & Fuels, vol. 7, no. 6, pp. 1013-1020, 1993.
[38] P. R. Solomon, D. G. Hamblen, M. A. Serio, Z.-Z. Yu, and S. Charpenay, "A
characterization method and model for predicting coal conversion behaviour," Fuel, vol.
72, no. 4, pp. 469-488, 1993.
[39] S. Niksa, "FLASHCHAIN theory for rapid coal devolatilization kinetics. 3. Modeling
the behavior of various coals," Energy & Fuels, vol. 5, no. 5, pp. 673-683, 1991.
[40] T. H. Fletcher, A. R. Kerstein, R. J. Pugmire, M. Solum, and D. M. Grant, "A chemical
percolation model for devolatilization: summary," Brigham Young University, 1992.
53
[41] J. O. L. Wendt and C. V. Sternling, "Effect of ammonia in gaseous fuels on nitrogen
oxide emissions," Journal of the Air Pollution Control Association, vol. 24, no. 11, pp.
1055-1058, 1974.
[42] J. A. Miller and C. T. Bowman, "Mechanism and Modeling of Nitrogen Chemistry in
Combustion," (in English), Progress in Energy and Combustion Science, vol. 15, no. 4,
pp. 287-338, 1989/01/01 1989.
[43] G. P. Smith, D. M. Golden, M. Frenklach, N. W. Moriarty, B. Eiteneer, M. Goldenberg,
C. Bowman, R. Hanson, S. Song, and W. Gardiner Jr. GRI-Mech 3.0, 2000 [Online].
[44] J. C. Chen and S. Niksa, "Suppressed nitrogen evolution from coal-derived soot and
low-volatility coal chars," Symposium (International) on Combustion, vol. 24, no. 1, pp.
1269-1276, 1992/01/01 1992.
[45] G. J. Haussmann and C. H. Kruger, "Evolution and reaction of coal fuel nitrogen during
rapid oxidative pyrolysis and combustion," Symposium (International) on Combustion,
vol. 23, no. 1, pp. 1265-1271, 1991/01/01 1991.
[46] J. C. Chen, C. Castagnoli, and S. Niksa, "Coal devolatilization during rapid transient
heating. 2. Secondary pyrolysis," Energy & Fuels, vol. 6, no. 3, pp. 264-271, 1992.
[47] M. T. Cheng, M. J. Kirsch, and T. W. Lester, "Reaction of nitric oxide with bound
carbon at flame temperatures," Combustion and Flame, vol. 77, no. 2, pp. 213-217,
1989/08/01 1989.
[48] M. Østberg, P. Glarborg, A. Jensen, J. E. Johnsson, L. S. Pedersen, and K. Dam-
Johansen, "A model of the coal reburning process," Symposium (International) on
Combustion, vol. 27, no. 2, pp. 3027-3035, 1998/01/01 1998.
[49] D. Phong-Anant, L. Wibberley, and T. Wall, "Nitrogen oxide formation from Australian
coals," Combustion and flame, vol. 62, no. 1, pp. 21-30, 1985.
[50] Y. H. Song, J. H. Pohl, J. M. Beer, and A. F. Sarofim, "Nitric-Oxide Formation during
Pulverized Coal Combustion," (in English), Combustion Science and Technology, vol.
28, no. 1-2, pp. 31-39, 1982.
[51] J. P. Spinti and D. W. Pershing, "The fate of char-N at pulverized coal conditions,"
Combustion and Flame, vol. 135, no. 3, pp. 299-313, 2003.
[52] D. W. Pershing and J. O. L. Wendt, "Relative contributions of volatile nitrogen and char
nitrogen to NOx emissions from pulverized coal flames," Industrial & Engineering
Chemistry Process Design and Development, vol. 18, no. 1, pp. 60-67, 1979.
[53] A. Molina, E. G. Eddings, D. W. Pershing, and A. F. Sarofim, "Nitric oxide destruction
during coal and char oxidation under pulverized-coal combustion conditions,"
Combustion and Flame, vol. 136, no. 3, pp. 303-312, 2// 2004.
[54] P. F. Nelson, P. C. Nancarrow, J. Bus, and A. Prokopiuk, "Fractional conversion of char
N to NO in an entrained flow reactor," Proceedings of the Combustion Institute, vol. 29,
no. 2, pp. 2267-2274, 2002.

54
[55] L. S. Jensen, H. E. Jannerup, P. Glarborg, A. Jensen, and K. Dam-Johansen,
"Experimental investigation of NO from pulverized char combustion," Proceedings of
the Combustion Institute, vol. 28, no. 2, pp. 2271-2278, 2000.
[56] K. Zhao, P. Glarborg, and A. D. Jensen, "NO reduction over biomass and coal char
during simultaneous combustion," Energy & Fuels, vol. 27, no. 12, pp. 7817-7826,
2013.
[57] A. Molina, J. J. Murphy, F. Winter, B. S. Haynes, L. G. Blevins, and C. R. Shaddix,
"Pathways for conversion of char nitrogen to nitric oxide during pulverized coal
combustion," Combustion and Flame, vol. 156, no. 3, pp. 574-587, 2009.
[58] S. P. Visona and B. R. Stanmore, "Modeling NOx release from a single coal particle II.
Formation of NO from char-nitrogen," Combustion and Flame, vol. 106, no. 3, pp. 207-
218, 1996.
[59] T. Shimizu, Y. Sazawa, T. Adschiri, and T. Furusawa, "Conversion of Char-Bound
Nitrogen to Nitric-Oxide during Combustion," (in English), Fuel, vol. 71, no. 4, pp.
361-365, Apr 1992.
[60] W. Wang, S. D. Brown, C. J. Hindmarsh, and K. M. Thomas, "NOx release and
reactivity of chars from a wide range of coals during combustion," Fuel, vol. 73, no. 9,
pp. 1381-1388, 1994.
[61] I. Glassman and R. A. Yetter, "Chapter 9 - Combustion of Nonvolatile Fuels," in
Combustion (Fourth Edition)Burlington: Academic Press, 2008, pp. 495-550.
[62] R. H. Hurt and J. M. Calo, "Semi-global intrinsic kinetics for char combustion
modeling," Combustion and Flame, vol. 125, no. 3, pp. 1138-1149, 2001/05/01/ 2001.
[63] R. Barranco, A. Rojas, J. Barraza, and E. Lester, "A new char combustion kinetic model
1. Formulation," Fuel, vol. 88, no. 12, pp. 2335-2339, 2009/12/01/ 2009.
[64] W. Chen, L. Smoot, S. Hill, and T. Fletcher, "Global rate expression for nitric oxide
reburning. Part 2," Energy & fuels, vol. 10, no. 5, pp. 1046-1052, 1996.
[65] B. Coda, F. Kluger, D. Förtsch, H. Spliethoff, K. Hein, and L. Tognotti, "Coal-nitrogen
release and NOx evolution in air-staged combustion," Energy & fuels, vol. 12, no. 6, pp.
1322-1327, 1998.
[66] I. Aarna and E. M. Suuberg, "A review of the kinetics of the nitric oxide-carbon
reaction," Fuel, vol. 76, no. 6, pp. 475-491, 1997.
[67] Y. H. Song, J. M. Beér, and A. F. Sarofim, "Reduction of Nitric Oxide by Coal Char at
Temperatures of 1250–1750 K," Combustion Science and Technology, vol. 25, no. 5-6,
pp. 237-240, 2008.
[68] L. Chan, A. Sarofim, and J. Beer, "Kinetics of the NO carbon reaction at fluidized bed
combustor conditions," Combustion and Flame, vol. 52, pp. 37-45, 1983.
[69] A.-K. Hjalmarsson, NOx control technologies for coal combustion. IEA Coal Research,
1990.
55
[70] M. Sami, K. Annamalai, and M. Wooldridge, "Co-firing of coal and biomass fuel
blends," Progress in Energy and Combustion Science, vol. 27, no. 2, pp. 171-214,
2001/01/01/ 2001.
[71] G. Salvi and R. Payne, "Investigation Into the Scaling of Combustion Systems: A Report
on the 018 and 019 Trials Carried Out Piecemeal in the Period from December 1978 to
June 1980," International Flame Research Foundation, IJmuidenF 31/a/52, 1981.
[72] J. Smart and D. Morgan, "Exploring the effects of employing different scaling criteria
on swirl stabilised pulverised coal burner performance," Combustion science and
technology, vol. 100, no. 1-6, pp. 331-343, 1994.
[73] T.-C. A. Hsieh, W. J. Dahm, and J. F. Driscoll, "Scaling laws for NOx emission
performance of burners and furnaces from 30 kW to 12 MW," Combustion and Flame,
vol. 114, no. 1-2, pp. 54-80, 1998.
[74] R. Weber, "Scaling characteristics of aerodynamics, heat transfer, and pollutant
emissions in industrial flames," in Symposium (International) on Combustion, 1996,
vol. 26, no. 2, pp. 3343-3354: Elsevier.
[75] D. D. Toporov, "Chapter 6 - Coal Combustion in CO2/O2 Atmosphere," in Combustion
of Pulverised Coal in a Mixture of Oxygen and Recycled Flue Gas, D. D. Toporov, Ed.
Boston: Elsevier, 2014, pp. 111-139.
[76] R. Weber and M. Mancini, "On scaling and mathematical modelling of large scale
industrial flames," Journal of the Energy Institute, 2019/04/10/ 2019.
[77] C. Baukal and P. Eleazer, "Quantifying NOx for industrial combustion processes,"
Journal of the Air & Waste Management Association, vol. 48, no. 1, pp. 52-58, 1998.
[78] A. A. Boateng, Rotary kilns: transport phenomena and transport processes.
Butterworth-Heinemann, 2008.
[79] F. Akgun, "Investigaton of energy saving and NOx reduction possibilities in a rotary
cement kiln," International journal of energy research, vol. 27, no. 4, pp. 455-465,
2003.
[80] G. L. Young, "NOx formation in rotary kilns producing cement clinker applicable NOx
control techniques and cost effectiveness of these control techniques," in IEEE-IAS/PCS
2002 Cement Industry Technical Conference. Conference Record (Cat. No.
02CH37282), 2002, pp. 239-254: IEEE.
[81] C. Y. C. Jonsson, J. Stjernberg, H. Wiinikka, B. Lindblom, D. Bostrom, and M. Ohman,
"Deposit Formation in a Grate-Kiln Plant for Iron-Ore Pellet Production. Part 1:
Characterization of Process Gas Particles," (in English), Energy & Fuels, vol. 27, no.
10, pp. 6159-6170, Oct 2013.
[82] LKAB. (2017). Pelletizing. Available: https://www.lkab.com/en/about-lkab/from-
mine-to-port/processing/pelletizing/
[83] A. T. McQueen, S. J. Bortz, M. S. Hatch, and R. L. Leonard, "Cement Kiln NOx
Control," IEEE Transactions on Industry Applications, vol. 31, no. 1, pp. 36-44, 1995.

56
[84] X.-Z. Feng, O. Lugovoy, and H. Qin, "Co-controlling CO2 and NOx emission in China's
cement industry: An optimal development pathway study," Advances in Climate
Change Research, vol. 9, no. 1, pp. 34-42, 2018.
[85] J.-m. Li and G.-d. Li, "Present situation and countermeasures of nitrogen oxides
emissions in Chinese cement industry," Appl Chem Ind, vol. 42, no. 9, pp. 1687-1689,
2013.
[86] S. Frauke, K. Ioanna, S. B. Maria, R. Serge, and D. S. Luis, "Best Available Techniques
(BAT) Reference Document for the Production of Cement, Lime and Magnesium
Oxide: Industrial Emissions Directive 2010/75/EU:(Integrated Pollution Prevention and
Control)," 2013.
[87] ADEME, "The French Cement Industry Guide to NOx Emissions Reduction Measures,"
2002, Available: https://www.ademe.fr/french-cement-industry-guide-to-nox-
emissions-reduction-measures.
[88] M. H. Vaccaro, "Low NOx rotary kiln burner technology: design principles & case
study," in Cement Industry Technical Confernece, 2002. IEEE-IAS/PCA 44th, 2002, pp.
265-270: IEEE.
[89] J. Hass, A. Agostini, C. Martens, E. Carrea, and W. van de Kamp, "The combustion of
pulverized coal and alternative fuels in cement kilns. Results on the CEMFLAME-3
experiments," International Flame Research Foundation (IFRF), IFRF doc no F97/y,
vol. 4, 1999.
[90] W. van de Kamp and J. Daimon, "Further studies on the effect of burner design variables
and fuel properties on the characteristics of cement kiln flames—report on the
CEMFLAME-2 experiments," International Flame Research Foundation (IFRF), 1996.
[91] R. Battye, S. J. Walsh, J. Lee-Greco, and D. Sanders, NOx Control Technologies for the
Cement Industry. US Environmental Protection Agency, Office of Air Quality Planning
and Standards, Air Quality Strategies and Standards Division, 2000.
[92] F. Schorcht, I. Kourti, B. Scalet, S. Roudier, and L. Sancho, "Best Available Techniques
(BAT), Reference Document for the Production of Cement, Lime and Magnesium
Oxide: Industrial Emissions Directive 2010/75/EU:(Integrated Pollution Prevention and
Control)," JRC Reference Reports; Publications Office of the European Union, 2013.
[93] R. Remus, M. Aguado Monsonet, S. Roudier, and L. Delgado Sancho, "JRC reference
report," Best Available Techniques (BAT) Reference Document for Iron and Steel
Production, 2013.
[94] R. A. Davis, "Nitric oxide formation in an iron oxide pellet rotary kiln furnace," Journal
of the Air & Waste Management Association, vol. 48, no. 1, pp. 44-51, 1998.
[95] R. K. Zahl, L. A. Haas, and J. Engesser, "Formation of NOx in iron oxide pelletizing
furnaces," University of Minnesota1995.
[96] A. Gunnarsson, "Experimental and numerical studies of thermal radiation in gas, coal
and co-fired pilot test facilities," Licentiate thesis, Energy and Environment, Chalmers
University of Technology, 2017.

57
[97] T. Mendiara and P. Glarborg, "Ammonia chemistry in oxy-fuel combustion of
methane," Combustion and Flame, vol. 156, no. 10, pp. 1937-1949, 10// 2009.
[98] L. S. Jensen, "NOx from cement production-Reduction by Primary Measures," Doctoral
thesis, Department of Chemical and Biochemical Engineering, Technical University of
Denmark, 1999.
[99] H. Thunman, F. Niklasson, F. Johnsson, and B. Leckner, "Composition of volatile gases
and thermochemical properties of wood for modeling of fixed or fluidized beds," Energy
& Fuels, vol. 15, no. 6, pp. 1488-1497, 2001.
[100] S. L. Chen, M. P. Heap, D. W. Pershing, and G. B. Martin, "Influence of coal
composition on the fate of volatileand char nitrogen during combustion," Symposium
(International) on Combustion, vol. 19, no. 1, pp. 1271-1280, 1982.
[101] Directive (EU) 2015/2193 of the European Parliament and of the Council of 25
November 2015 on the limitation of emissions of certain pollutants into the air from
medium combustion plants (Text with EEA relevance), 2015.
[102] L. Bool and J. Bradley, "NOx reduction from a 44 MW wall-fired boiler utilizing
oxygen enhanced combustion," in MEGA Symposium, Washington, DC, 2003: Citeseer.
[103] LKAB, "HYBRIT: Construction begins – LKAB takes the leap towards fossil-free
production of iron ore pellets", Press Release, 2019

APPENDIX A
Conversion of units of NOx
The two most common ways of reporting NOx emission are 1) mgNO2/MJ and 2) ppm (or
mg/m3n) corrected to an oxygen concentration. When converting one measurement unit to the
other, the key is to establish the molar flow of the flue gases.
If NOx emissions are given in mgNO2/MJ, it is easy to simply multiply by the heat input (fuel
input in this work) in MW to get the mass flow of NO2. Dividing by the molar mass of NO2
(46 g/mol) yields the molar flow of NOx (the assumption is that all NOx eventually converts to
NO2). To get the NOx concentration one must divide this molar flow by the total molar flow of
flue gases. This is not an issue if the flue gas flow is known, but otherwise it must be calculated
as:
𝑛𝑡𝑜𝑡 = 𝑛𝐶𝑂2,𝑜𝑢𝑡 + 𝑛𝐻2𝑂,𝑜𝑢𝑡 + 𝑛𝑁2,𝑜𝑢𝑡 + 𝑛𝑂2,𝑜𝑢𝑡
= 𝑛𝐶,𝑖𝑛 + 0.5𝑛𝐻,𝑖𝑛 + 0.79𝜆𝑁0,𝑠𝑡𝑜𝑖𝑐ℎ + 0.21(𝜆 − 1)𝑁0,𝑠𝑡𝑜𝑖𝑐ℎ
where 𝑛𝑡𝑜𝑡 is the flue gas molar flow, 𝑛𝑖,𝑜𝑢𝑡 is the molar flow of specie i in the flue gases, 𝑛𝑖,𝑖𝑛
is the molar flow of specie i by the inlet, 𝑁0,𝑠𝑡𝑜𝑖𝑐ℎ is the stoichiometric air demand for the fuel
and 𝜆 is the stoichiometric ratio. 𝑁0,𝑠𝑡𝑜𝑖𝑐ℎ is calculated as:
𝑁0,𝑠𝑡𝑜𝑖𝑐ℎ = 𝑛𝐶,𝑖𝑛 + 0.25𝑛𝐻,𝑖𝑛 − 0.5𝑛𝑂,𝑖𝑛
Using the values for 𝑛𝑖,𝑖𝑛 from the ultimate analysis of the fuel and using the value of 𝜆 (can
be calculated with knowledge of the outlet molar fraction of O2 and 𝑁0,𝑠𝑡𝑜𝑖𝑐ℎ), the molar flue
gas flow can be calculated, and thus also the NOx molar fraction. When the molar fractions of
NOx and O2 are known, it is simple to just use Eq.6 to get the ppm value corrected to an oxygen
concentration

APPENDIX B
Difference between modelling in Paper II and III
Both Paper II and Paper III conclude that NO formation from the heterogeneous reactions
dominate due to the high air-to-fuel ratio in the Grate-Kiln process. However, in Paper II a
good fit between modelled and measured NOx emission is achieved when the nitrogen
partitioning is 50/50 between volatiles and char, while in Paper III a good fit is achieved with
the nitrogen partitioning being 25/75. This is due to differences in the mixing profiles used for
the secondary air.
The mixing profiles of the secondary air used in in Paper II and Paper III are presented in Figure
1 and the resulting O2 profiles are presented in Figure 2. The mixing is similar in both papers,
but in Paper II it is faster in the region stretching from 1000 mm to the end of the kiln, which
results in a higher O2 concentration and thus more NO is formed during the char combustion.
The reason for the discrepancy in the mixing profiles is that a smooth profile was desired in
Paper III (for smoother scale-up to the full-scale kiln), while the profile in Paper II consisted
of only 6 points with linear interpolation between. Fitting a second-order polynomial to the
Paper II profile resulted in a faster-than-desired mixing profile during the first 1000 mm (the
modelled O2 and CO profiles did not match the measured values). The polynomial became
0.9863x2 + 0.2244x-0.0103, which was reduced to 0.95x2 + 0.17x to fit the O2 and CO
measurements. The mixing profile in Paper III became thus:
𝑖𝑛𝑗𝑒𝑐𝑡𝑒𝑑 𝑎𝑖𝑟 = 740 (0.95 ∗ (𝑥
440)
2
+ 0.17 ∗𝑥
440)
Figure 1. Mixing profiles in Paper II and Paper III Figure 2. O2 profiles in Paper II and Paper III
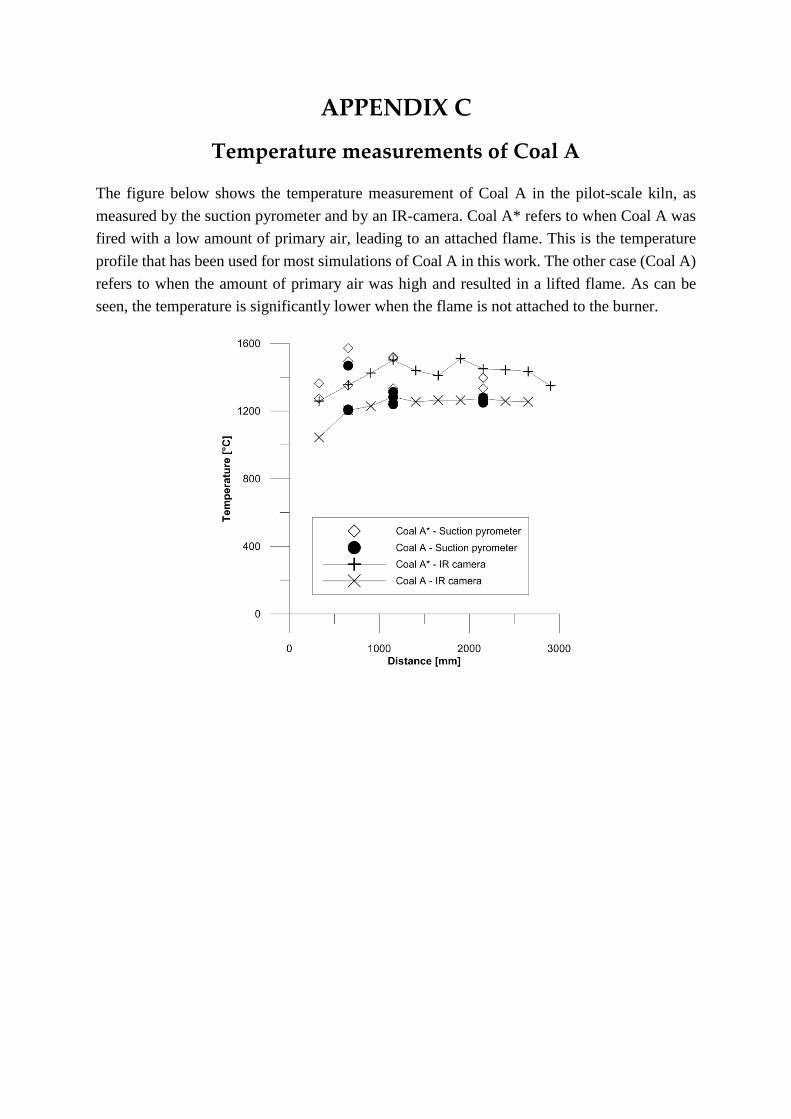
APPENDIX C
Temperature measurements of Coal A
The figure below shows the temperature measurement of Coal A in the pilot-scale kiln, as
measured by the suction pyrometer and by an IR-camera. Coal A* refers to when Coal A was
fired with a low amount of primary air, leading to an attached flame. This is the temperature
profile that has been used for most simulations of Coal A in this work. The other case (Coal A)
refers to when the amount of primary air was high and resulted in a lifted flame. As can be
seen, the temperature is significantly lower when the flame is not attached to the burner.