novo nordisk's operating profit decreased by 8% in danish … · sales and distribution costs...
TRANSCRIPT

Financial report for the period 1 January 2018 to 30 June 2018
8 August 2018
Novo Nordisk's operating profit decreased by 8% in Danish kroner andincreased by 4% in local currencies in the first six months of 2018
Sales decreased by 5% in Danish kroner and increased by 4% in local currencies to DKK 54.3 billion.• Sales of Victoza® increased by 2% to DKK 11.7 billion (12% in local currencies).• Sales of Saxenda® increased by 35% to DKK 1.7 billion (50% in local currencies).• Sales of Tresiba® were unchanged at DKK 3.7 billion (increased by 11% in local currencies).• Sales of Xultophy® increased by 154% to DKK 720 million (165% in local currencies).• Sales in North America Operations decreased by 10% (unchanged in local currencies).• Sales in International Operations increased by 1% (8% in local currencies).
Sales within diabetes care and obesity decreased by 4% to DKK 45.6 billion (increased by 5% in local currencies).Sales within biopharmaceuticals decreased by 9% to DKK 8.7 billion (decreased by 1% in local currencies).
Operating profit decreased by 8% in Danish kroner and increased by 4% in local currencies to DKK 24.7 billion,reflecting the significant depreciation of the US dollar and related currencies versus the Danish krone.
Net profit increased by 5% to DKK 21.1 billion. Diluted earnings per share increased by 7% to DKK 8.66.
In February 2018, Novo Nordisk launched Ozempic® in the USA, a new once-weekly GLP-1, and the initial feedbackfrom prescribers and payers is positive and the formulary coverage for Ozempic® is progressing. The weekly new-to-brand prescription market share for Ozempic® has reached 14%.
During second quarter of 2018, Novo Nordisk announced the phase 3a results from four of the 10 clinical trials inthe PIONEER programme with oral semaglutide, a new once-daily GLP-1 tablet for people with type 2 diabetes. Thetrials confirmed statistically significant reductions in both HbA1c and weight for oral semaglutide compared toempagliflozin, sitagliptin and Victoza®.
The Board of Directors has approved an interim dividend for 2018 of DKK 3.00 per share of DKK 0.20 to be paid inAugust 2018.
For 2018, sales growth is still expected to be 3-5% and operating profit growth is still expected to be 2-5%, bothmeasured in local currencies. Sales growth and operating profit growth reported in Danish kroner are nowexpected to be 5 and 7 percentage points lower than in local currencies, respectively.
For 2019, formulary negotiations with pharmacy benefit managers and managed care organisations in the USA areprogressing. Subject to the final outcome of these negotiations, average prices after rebates are expected to belower compared with the levels in 2018, predominantly due to basal insulin pricing and changed Medicare Part Dcoverage gap legislation. The market access for Novo Nordisk’s key products is expected to remain broadlyunchanged compared to 2018.
Lars Fruergaard Jørgensen, president and CEO: “Sales growth in the first half of 2018 was driven by solidperformance of our key innovative products: Victoza®, Tresiba®, Xultophy® and Saxenda®, and the launch ofOzempic® is off to a good start in North America. We are encouraged about the clinical trial results for oralsemaglutide and we are looking forward to making the first oral GLP-1 treatment available for people with type 2diabetes.”
Novo Nordisk A/S Novo Allé Telephone: CVR Number:Investor Relations 2880 Bagsværd +45 4444 8888 24 25 67 90
Denmark www.novonordisk.com
Company announcement No 60 / 2018

About Novo Nordisk
Novo Nordisk is a global healthcare company with 95 years of innovation and leadership in diabetes care. Thisheritage has given us experience and capabilities that also enable us to help people defeat obesity, haemophilia,growth disorders and other serious chronic diseases. Headquartered in Denmark, Novo Nordisk employsapproximately 43,100 people in 79 countries, and markets its products in more than 170 countries. Novo Nordisk’sB shares are listed on Nasdaq Copenhagen (Novo-B). Its ADRs are listed on the New York Stock Exchange (NVO).For more information, visit novonordisk.com, Facebook, Twitter, LinkedIn, YouTube.
Conference call details
On 8 August 2018 at 13.00 CEST, corresponding to 7.00 am EDT, a conference call will be held. Investors will beable to listen in via a link on novonordisk.com, which can be found under ‘Investors’. Presentation material for theconference call will be available approximately one hour before on the same page.
Webcast details
On 9 August 2018 at 13.30 CEST, corresponding to 7.30 am EDT, management will give a presentation toinstitutional investors and sell-side analysts in London. A webcast of the presentation can be followed via a link onnovonordisk.com, which can be found under ‘Investors’. Presentation material for the webcast will be madeavailable on the same page.
Financial calendar
1 November 2018 Financial statement for first nine months of 20181 February 2019 Financial statement for 2018
Contacts for further information
Media:Katrine Sperling +45 3079 6718 [email protected] Inchausti (USA) +1 609 240 9429 [email protected]
Investors:Peter Hugreffe Ankersen +45 3075 9085 [email protected] Mikkelsen +45 3079 4461 [email protected] Borum Svarrer +45 3079 0301 [email protected]
Further information about Novo Nordisk is available on novonordisk.com.
Financial report for the period 1 January 2018 to 30 June 2018 Page 2 of 30
Company announcement No 60 / 2018

LIST OF CONTENTS
FINANCIAL PERFORMANCE .............................................................................................................. 4
Consolidated financial statement for the first six months of 2018 ................................................ 4
Sales development ....................................................................................................................... 5
Diabetes care and obesity, sales development .............................................................................. 6
Biopharmaceuticals, sales development ........................................................................................ 9
Development in costs and operating profit ................................................................................... 10
Financial items (net) ..................................................................................................................... 10
Capital expenditure and free cash flow ........................................................................................ 11
OUTLOOK ........................................................................................................................................ 12
RESEARCH & DEVELOPMENT UPDATE .............................................................................................. 14
SUSTAINABILITY UPDATE ................................................................................................................. 17
EQUITY ............................................................................................................................................ 18
LEGAL MATTERS .............................................................................................................................. 18
MANAGEMENT STATEMENT ............................................................................................................ 20
FINANCIAL INFORMATION ............................................................................................................... 21
Appendix 1: Quarterly numbers in DKK ........................................................................................ 21
Appendix 2: Income statement and statement of other comprehensive income ............................ 22
Appendix 3: Cash flow statement ................................................................................................ 23
Appendix 4: Balance sheet ........................................................................................................... 24
Appendix 5: Equity statement ...................................................................................................... 25
Appendix 6: Regional sales split ................................................................................................... 26
Appendix 7: Key currency assumptions ........................................................................................ 28
Appendix 8: New accounting standards in 2018 .......................................................................... 28
Appendix 9: Quarterly numbers in USD (additional information) ................................................... 29
Appendix 10: Non-IFRS financial measures (additional information) .............................................. 30
Financial report for the period 1 January 2018 to 30 June 2018 Page 3 of 30
Financial Performance Outlook R&D Sustainability Equity Legal Financial
Information
Company announcement No 60 / 2018

FINANCIAL PERFORMANCE
CONSOLIDATED FINANCIAL STATEMENT FOR THE FIRST SIX MONTHS OF 2018
These unaudited consolidated financial statements for the first six months of 2018 have been prepared inaccordance with IAS 34 ‘Interim Financial Reporting’. The accounting policies adopted in the preparation areconsistent with those applied in the Annual Report 2017 of Novo Nordisk, except for the adoption of new,amended or revised standards and interpretations (‘IFRSs’) as published by the IASB that are endorsed by the EU andeffective as of 1 January 2018. This includes IFRS 9 'Financial Instruments' applied prospectively and IFRS 15'Revenue from Contracts with Customers' applied on a modified retrospective basis, see appendix 8. Furthermore,the financial report including the consolidated financial statements for the first six months of 2018 andManagement’s review have been prepared in accordance with additional Danish disclosure requirements for interimreports of listed companies.
Amounts are in DKK million, except for number of shares, earnings per share and full-time equivalent employees.
PROFIT AND LOSS H1 2018 H1 2017
% change H1 2017
to H1 2018
DKK million
Net sales 54,337 57,090 (5%)
Gross profit 45,788 48,430 (5%)Gross margin 84.3% 84.8%
Sales and distribution costs 13,541 13,548 0%Percentage of sales 24.9% 23.7%
Research and development costs 6,617 6,703 (1%)Percentage of sales 12.2% 11.7%
Administrative costs 1,715 1,770 (3%)Percentage of sales 3.2% 3.1%
Other operating income, net 737 467 58%
Operating profit 24,652 26,876 (8%)Operating margin 45.4% 47.1%
Financial items (net) 1,455 (1,229) N/A
Profit before income taxes 26,107 25,647 2%
Income taxes 5,013 5,540 (10%)Effective tax rate 19.2% 21.6%
Net profit 21,094 20,107 5%Net profit margin 38.8% 35.2%
OTHER KEY NUMBERS
Depreciation, amortisation and impairment losses 1,500 1,571 (5%)Capital expenditure (tangible assets) 3,897 3,538 10%
Net cash generated from operating activities 25,585 22,215 15%Free cash flow 20,468 18,792 9%
Total assets 103,248 97,825 6%Equity 49,081 48,436 1%Equity ratio 47.5% 49.5%
Average number of diluted shares outstanding (million) 2,436.6 2,492.0 (2%)Diluted earnings per share / ADR (in DKK) 8.66 8.07 7%
Full-time equivalent employees end of period 43,105 41,385 4%
Financial report for the period 1 January 2018 to 30 June 2018 Page 4 of 30
Financial Performance Outlook R&D Sustainability Equity Legal Financial
Information
Company announcement No 60 / 2018

SALES DEVELOPMENT
Sales decreased by 5% measured in Danish kroner and increased by 4% in local currencies in the first six months of2018, reflecting a significant impact from the depreciation of the US dollar and related currencies versus the Danishkrone. Sales growth in local currencies was realised within diabetes care and obesity with the majority of growthoriginating from Victoza®, Tresiba®, Xultophy®and Saxenda®, partly offset by declining sales of Levemir®. Decliningsales within biopharmaceuticals was driven by declining sales of NovoSeven® and 'Other biopharmaceuticals' partlyoffset by increased sales of NovoEight® and Norditropin®.
Sales split per therapy
Sales H12018 DKK
million
Sales H12017 DKK
millionGrowth
as reported
Growthin local
currencies
Share ofgrowthin local
currencies
The diabetes care and obesity segment
Long-acting insulin 10,230 11,582 (12%) (3%) (17%)- Tresiba® 3,707 3,689 0% 11% 19%- Xultophy® 720 284 154% 165% 22%- Levemir® 5,803 7,609 (24%) (16%) (58%)
Premix insulin 5,229 5,565 (6%) 1% 3%- Ryzodeg® 320 196 63% 79% 7%- NovoMix® 4,909 5,369 (9%) (2%) (4%)
Fast-acting insulin 9,714 10,419 (7%) 2% 9%- Fiasp® 220 16 - - 10%- NovoRapid® 9,494 10,403 (9%) 0% (1%)
Human insulin 4,701 4,971 (5%) 1% 4%
Total insulin 29,874 32,537 (8%) 0% (1%)
Total GLP-1 11,982 11,525 4% 14% 77%- Victoza® 11,718 11,525 2% 12% 63%- Ozempic® 264 - - - 14%
Other diabetes care1) 2,132 2,244 (5%) 2% 2%
Total diabetes care 43,988 46,306 (5%) 4% 78%
Obesity (Saxenda®) 1,653 1,225 35% 50% 29%
Diabetes care and obesity total 45,641 47,531 (4%) 5% 106%
The biopharmaceuticals segmentHaemophilia2) 4,797 5,315 (10%) (2%) (6%)
- NovoSeven® 4,040 4,663 (13%) (6%) (13%)- NovoEight® 635 576 10% 16% 4%
Growth disorders (Norditropin®) 3,184 3,325 (4%) 5% 7%Other biopharmaceuticals3) 715 919 (22%) (18%) (7%)Biopharmaceuticals total 8,696 9,559 (9%) (1%) (6%)
Total sales 54,337 57,090 (5%) 4% 100%
1) Primarily NovoNorm®, needles and GlucaGen® HypoKit®.2) Comprises NovoSeven®, NovoEight®, NovoThirteen® and Refixia®.3) Primarily Vagifem® and Activelle®.
International Operations was the main driver of the sales growth, and the growth contributors were Region AAMEO(Africa, Asia, Middle East and Oceania), Region Latin America, Region China and Region Europe, partly offset byRegion Japan & Korea. Sales growth in Region Latin America of 46% measured in local currencies was positivelyimpacted by 7 percentage points due to inflationary price effects in countries with high inflation.
Financial report for the period 1 January 2018 to 30 June 2018 Page 5 of 30
Financial Performance Outlook R&D Sustainability Equity Legal Financial
Information
Company announcement No 60 / 2018
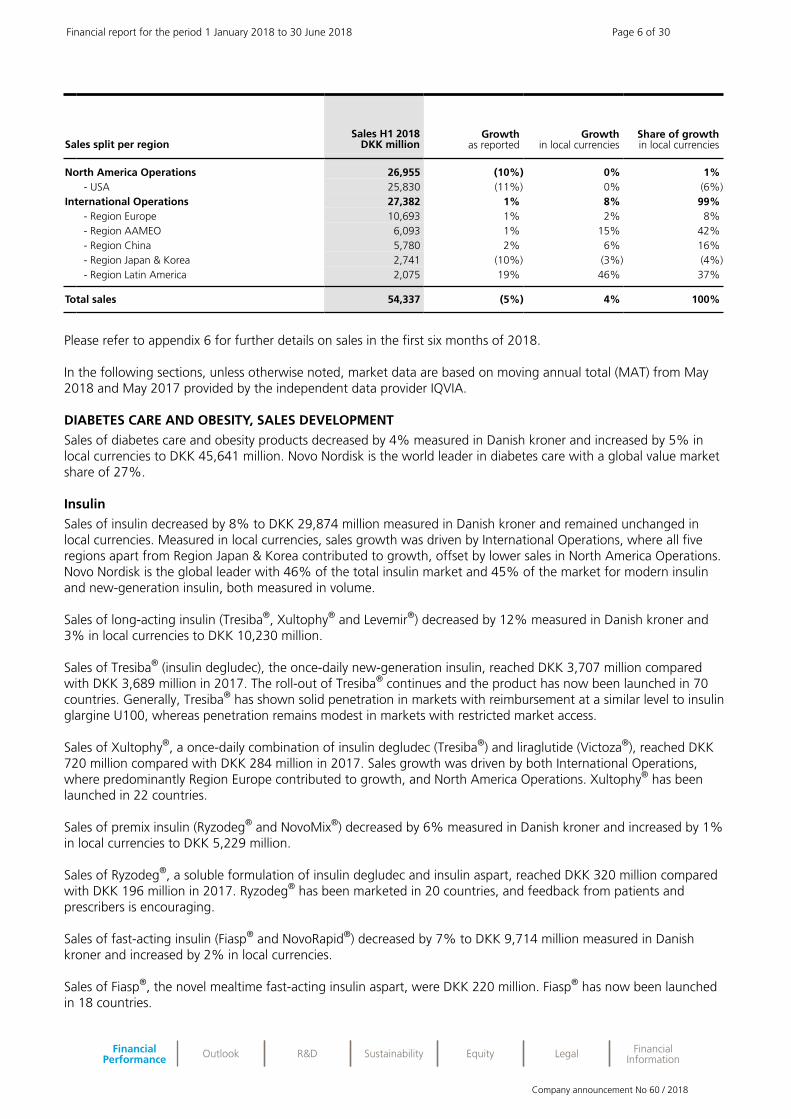
Sales split per regionSales H1 2018
DKK millionGrowth
as reportedGrowth
in local currenciesShare of growthin local currencies
North America Operations 26,955 (10%) 0% 1%- USA 25,830 (11%) 0% (6%)
International Operations 27,382 1% 8% 99%- Region Europe 10,693 1% 2% 8%- Region AAMEO 6,093 1% 15% 42%- Region China 5,780 2% 6% 16%- Region Japan & Korea 2,741 (10%) (3%) (4%)- Region Latin America 2,075 19% 46% 37%
Total sales 54,337 (5%) 4% 100%
Please refer to appendix 6 for further details on sales in the first six months of 2018.
In the following sections, unless otherwise noted, market data are based on moving annual total (MAT) from May2018 and May 2017 provided by the independent data provider IQVIA.
DIABETES CARE AND OBESITY, SALES DEVELOPMENT
Sales of diabetes care and obesity products decreased by 4% measured in Danish kroner and increased by 5% inlocal currencies to DKK 45,641 million. Novo Nordisk is the world leader in diabetes care with a global value marketshare of 27%.
Insulin
Sales of insulin decreased by 8% to DKK 29,874 million measured in Danish kroner and remained unchanged inlocal currencies. Measured in local currencies, sales growth was driven by International Operations, where all fiveregions apart from Region Japan & Korea contributed to growth, offset by lower sales in North America Operations.Novo Nordisk is the global leader with 46% of the total insulin market and 45% of the market for modern insulinand new-generation insulin, both measured in volume.
Sales of long-acting insulin (Tresiba®, Xultophy® and Levemir®) decreased by 12% measured in Danish kroner and3% in local currencies to DKK 10,230 million.
Sales of Tresiba® (insulin degludec), the once-daily new-generation insulin, reached DKK 3,707 million comparedwith DKK 3,689 million in 2017. The roll-out of Tresiba® continues and the product has now been launched in 70countries. Generally, Tresiba® has shown solid penetration in markets with reimbursement at a similar level to insulinglargine U100, whereas penetration remains modest in markets with restricted market access.
Sales of Xultophy®, a once-daily combination of insulin degludec (Tresiba®) and liraglutide (Victoza®), reached DKK720 million compared with DKK 284 million in 2017. Sales growth was driven by both International Operations,where predominantly Region Europe contributed to growth, and North America Operations. Xultophy® has beenlaunched in 22 countries.
Sales of premix insulin (Ryzodeg® and NovoMix®) decreased by 6% measured in Danish kroner and increased by 1%in local currencies to DKK 5,229 million.
Sales of Ryzodeg®, a soluble formulation of insulin degludec and insulin aspart, reached DKK 320 million comparedwith DKK 196 million in 2017. Ryzodeg® has been marketed in 20 countries, and feedback from patients andprescribers is encouraging.
Sales of fast-acting insulin (Fiasp® and NovoRapid®) decreased by 7% to DKK 9,714 million measured in Danishkroner and increased by 2% in local currencies.
Sales of Fiasp®, the novel mealtime fast-acting insulin aspart, were DKK 220 million. Fiasp® has now been launchedin 18 countries.
Financial report for the period 1 January 2018 to 30 June 2018 Page 6 of 30
Financial Performance Outlook R&D Sustainability Equity Legal Financial
Information
Company announcement No 60 / 2018

INSULIN MARKET SHARES(volume, MAT)
Novo Nordisk’s shareof the total insulin market
Novo Nordisk’s shareof the modern insulin and
new-generation insulin market*
May May May May2018 2017 2018 2017
Global 46.1% 45.9% 45.1% 44.6%North America Operations 39.6% 37.7% 40.4% 38.5%
- USA 39.9% 37.8% 41.1% 38.9%International Operations 48.9% 49.4% 47.5% 47.9%
- Region Europe 43.8% 44.6% 43.5% 44.2%- Region AAMEO** 56.0% 56.5% 50.8% 51.3%- Region China*** 51.9% 53.4% 60.7% 61.1%- Region Japan & Korea 50.0% 49.3% 49.9% 48.6%- Region Latin America**** 43.4% 41.8% 38.6% 39.8%
Source: IQVIA, May 2018 data. * Modern insulin and new-generation insulin comprises the following Novo Nordisk products: Levemir®, NovoMix®, NovoRapid®,Tresiba®, Xultophy®, Ryzodeg® and Fiasp® ** Data available for 11 private markets representing approximately 70% of total Novo Nordisk’s diabetes care sales in theregion. *** Data for mainland China, excluding Hong Kong and Taiwan. **** Data available for three private markets representing approximately 70% of total NovoNordisk’s diabetes care sales in the region.
North America Operations
Sales of insulin in North America Operations decreased by 17% in Danish kroner and by 7% in local currencies. Thedecline in sales in the USA in the basal insulin segment was mainly driven by lower realised prices for Levemir® andphasing of rebates in 2017 for Tresiba® partly offset by higher sales of Tresiba® following a net market share gain ofapproximately 3 percentage points in the basal insulin segment, underlying volume growth as well as increased salesof Xultophy® 100/3.6. The decline in sales decline in the USA in the short-acting insulin segment was driven by lowerrealised prices due to phasing of rebates in 2017 for NovoLog® partly offset by underlying volume growth.
International Operations
Sales of insulin in International Operations remained unchanged in Danish kroner and increased by 7% in localcurrencies. Sales growth measured in local currencies was driven by modern and new-generation, long-acting,premix and fast-acting insulin, partly offset by declining human insulin sales.
Region Europe
Sales of insulin in Region Europe increased by 1% in Danish kroner and by 2% in local currencies. Sales were drivenby the penetration of Xultophy®, Fiasp® and Tresiba® across the region, partly offset by contracting Levemir® salesreflecting the continued roll-out of Tresiba®, as well as declining NovoMix® and human insulin sales.
Region AAMEO
Sales of insulin in Region AAMEO increased by 2% in Danish kroner and by 16% in local currencies. The salesgrowth measured in local currencies was driven by growth of the overall diabetes care market and positivecontribution from all three insulin segments: long-acting, premix and fast-acting as well as human insulin.
Region China
Sales of insulin in Region China increased by 1% in Danish kroner and by 5% in local currencies. The sales growthmeasured in local currencies was driven by continued growth in the three insulin segments: long-acting, premix andfast-acting, and Novo Nordisk has improved its market share in the long-acting insulin segment and broadlystabilised the modern insulin market share, partly offset by lower human insulin sales.
Region Japan & Korea
Sales of insulin in Region Japan & Korea decreased by 10% in Danish kroner and by 3% in local currencies. Thedecline in sales was driven by NovoMix® and NovoRapid®, as both products reached the 15-year price protectionlimit 1 April 2018 leading to significant mandatory price reductions, as well as lower human insulin sales, partlyoffset by positive contribution from market share gains for Ryzodeg® and Tresiba® in Japan.
Financial report for the period 1 January 2018 to 30 June 2018 Page 7 of 30
Financial Performance Outlook R&D Sustainability Equity Legal Financial
Information
Company announcement No 60 / 2018

Region Latin America
Sales of insulin in Region Latin America decreased by 3% in Danish kroner and increased by 22% in local currencies.The sales growth measured in local currencies was driven by growth of the overall diabetes care market, inflationaryprice effects and positive volume contribution from all three insulin segments: long-acting, premix and fast-acting aswell as human insulin.
GLP-1 therapy for type 2 diabetes
Sales of GLP-1 therapy for type 2 diabetes (Victoza® and Ozempic®) increased by 4% in Danish kroner and by 14%in local currencies to DKK 11,982 million. Sales growth is predominantly driven by North America Operationscomprising 77% share of the GLP-1 growth. The GLP-1 segment’s value share of the total diabetes care market hasincreased to 13.0% compared with 10.7% 12 months ago. Victoza® continues to be the market leader in the GLP-1segment with a 47% value market share.
GLP-1 MARKET SHARES(value, MAT)
GLP-1 share of totaldiabetes care market
Victoza® shareof GLP-1 market
May May May May2018 2017 2018 2017
Global 13.0% 10.7% 47% 53%North America Operations 15.4% 12.6% 46% 52%
- USA 15.5% 12.7% 45% 51%International Operations 7.1% 6.1% 54% 61%
- Region Europe 11.1% 10.0% 56% 61%- Region AAMEO* 2.9% 2.5% 46% 51%- Region China** 1.0% 0.9% 78% 61%- Region Japan & Korea 5.2% 4.0% 36% 50%- Region Latin America*** 5.7% 4.9% 70% 83%
Source: IQVIA, May 2018 data MAT. * Data for 11 selected private markets representing approximately 70% of Novo Nordisk’s total diabetes care sales in the region.** Data for mainland China, excluding Hong Kong and Taiwan. *** Data for three selected private markets representing approximately 70% of Novo Nordisk’s totaldiabetes care sales in the region.
North America Operations
Sales of Novo Nordisk's GLP-1 diabetes products (Victoza® and Ozempic®) in North America Operations increased by3% in Danish kroner and increased by 15% in local currencies. Sales growth is driven by an underlying prescriptionvolume growth of the GLP-1 class of more than 20%, and Novo Nordisk is the market leader with a 46% valuemarket share. The value share of the GLP-1 class of the total North American diabetes care market has increased to15.4%.
In February 2018, Novo Nordisk launched Ozempic® in the USA, a new once-weekly GLP-1, and the initial feedbackfrom prescribers and payers is positive and the formulary coverage for Ozempic® is progressing well. The weeklynew-to-brand prescription market share for Ozempic® has reached 14%. Sales of Victoza® remained unchanged inDanish kroner and increased by 11% in local currencies. Sales growth of Victoza® is driven by the positive impactfrom the updated label for Victoza® reflecting cardiovascular benefits, partly offset by rebate adjustments related toprior periods and an impact from the launch of Ozempic®.
International Operations
Sales of Victoza® in International Operations increased by 8% in Danish kroner and by 13% in local currencies. Salesgrowth is driven by all regions. The value share of the GLP-1 class of the total International Operations diabetes caremarket has increased to 7.1% from 6.1% in 2017. Victoza® is the market leader with a 54% value market share.
Region Europe
Sales in Region Europe increased by 9% in both Danish kroner and in local currencies. The sales developmentreflects positive impact from the expanded CV label for Victoza® as well as competition from a once-weekly product.In Region Europe, the value share of the GLP-1 class of the total diabetes care market has increased to 11.1%.Victoza® remains the market leader in Region Europe with a 56% value market share.
Financial report for the period 1 January 2018 to 30 June 2018 Page 8 of 30
Financial Performance Outlook R&D Sustainability Equity Legal Financial
Information
Company announcement No 60 / 2018

Region AAMEO
Sales in Region AAMEO decreased by 5% in Danish kroner and increased by 8% in local currencies. Sales growth isprimarily driven by a number of countries in the Middle East. The value share of the GLP-1 class of the total diabetescare market increased to 2.9%. Victoza® is the GLP-1 market leader across Region AAMEO with a value marketshare of 46%.
Region China
Sales in Region China increased by 50% in Danish kroner and by 57% in local currencies. The increase in salesreflects the inclusion of Victoza® in the Chinese National Reimbursement Drug List in July 2017. In China, Victoza®
has increased its GLP-1 value market share to 78%, however, the GLP-1 class only represents 1.0% of the totaldiabetes care market measured in value.
Region Japan & Korea
Sales in Region Japan & Korea decreased by 1% in Danish kroner and increased by 6% in local currencies. The salesgrowth measured in local currencies reflects the continued expansion of the GLP-1 market in Japan, partly offset byintensified competition from a once-weekly product. In Region Japan & Korea, the GLP-1 class represents 5.2% ofthe total diabetes care market value compared with 4.0% in 2017. Victoza® holds a value market share of 36%.
Region Latin America
Sales in Region Latin America increased by 8% in Danish kroner and by 30% in local currencies. The sales growthreflects the continued expansion of the GLP-1 markets across the region. In Region Latin America, the GLP-1 classrepresents 5.7% of the total diabetes care market value compared with 4.9% in 2017. Victoza® remains the leaderin the class with a value market share of 70%.
Other diabetes care
Sales of other diabetes care products, predominantly consisting of oral antidiabetic products, needles andGlucaGen®HypoKit®, declined by 5% to DKK 2,132 million and increased by 2% in local currencies. Increasing salesmeasured in local currencies were both seen in North America Operations and in International Operations, whereRegion Latin America and Region China contributed to sales growth.
Saxenda® (obesity)
Sales of Saxenda®, liraglutide 3 mg for weight management, increased by 35% in Danish kroner and by 50% inlocal currencies to DKK 1,653 million. Sales growth was driven by both North America Operations and InternationalOperations, where Region AAMEO, Region Latin America and Region Europe contributed to growth. Saxenda® waslaunched in May 2015 in the USA and has obtained broad commercial formulary market access, but generally withprior authorisation requirements. Saxenda® has now been launched in 30 countries.
BIOPHARMACEUTICALS, SALES DEVELOPMENT
Sales of biopharmaceutical products decreased by 9% measured in Danish kroner and by 1% in local currencies toDKK 8,696 million. Decreasing sales were realised in North America Operations, partly offset by increased sales inInternational Operations.
Haemophilia
Sales of haemophilia products decreased by 10% measured in Danish kroner and by 2% in local currencies to DKK4,797 million. The sales decrease was primarily driven by lower NovoSeven® sales in the USA and Region Europereflecting increased competition from a recently introduced product as well as increased clinical trial activity fromcompeting products, partly offset by increased NovoSeven® sales in Region Latin America due to timing of tenderdeliveries. Furthermore, sales of NovoEight® in Region Europe and Region AAMEO contributed positively to the salesdevelopment.
Growth disorders (Norditropin®)
Sales of growth disorder products decreased by 4% to DKK 3,184 million measured in Danish kroner and increasedby 5% in local currencies. The sales development measured in local currencies was driven by positive contributionfrom North America Operations driven by higher realised prices in the USA, offset by declining sales in InternationalOperations predominantly Region Europe and Region Japan & Korea. Novo Nordisk is the leading company in theglobal human growth disorder market with a 27% market share measured in volume.
Financial report for the period 1 January 2018 to 30 June 2018 Page 9 of 30
Financial Performance Outlook R&D Sustainability Equity Legal Financial
Information
Company announcement No 60 / 2018

Other biopharmaceuticals
Sales of other products within biopharmaceuticals, which predominantly consist of hormone replacement therapy-related (HRT) products, declined by 22% measured in Danish kroner and by 18% in local currencies to DKK 715million, primarily reflecting an effect from the launch of a generic version of Vagifem® in the USA.
Financial report for the period 1 January 2018 to 30 June 2018 Page 10 of 30
Financial Performance Outlook R&D Sustainability Equity Legal Financial
Information
Company announcement No 60 / 2018
DEVELOPMENT IN COSTS AND OPERATING PROFIT
The cost of goods sold declined by 1% at DKK 8,549 million, resulting in a gross margin of 84.3% measured inDanish kroner, compared with 84.8% in 2017. The decline in gross margin reflects a negative currency impact of 1.0percentage point. The gross margin was positively impacted by improved productivity and positive contribution fromproduct mix due to higher Victoza®, Tresiba® and Saxenda® sales, but partly countered by lower contribution fromNovoSeven®. The gross margin was negatively impacted by lower prices primarily related to the basal insulinsegment in the USA.
Sales and distribution costs remained unchanged in Danish kroner and increased by 8% in local currencies to DKK13,541 million. The increase in sales and distribution costs reflects higher promotional activities in both NorthAmerica Operations and International Operations to support Victoza® and Saxenda® as well as launch activities forOzempic® in the USA, partly offset by lower costs for legal cases.
Research and development costs declined by 1% in Danish kroner and increased by 2% in local currencies to DKK6,617 million, reflecting higher costs for both research and development. The increase in research costs was drivenby increased costs for the diabetes care and obesity portfolio. The increase in development costs was predominantlydriven by injectable semaglutide in obesity and the phase 3b SUSTAIN programme for Ozempic®.
Administration costs declined by 3% in Danish kroner and increased by 2% in local currencies to DKK 1,715 million.
Other operating income (net) was DKK 737 million compared with DKK 467 million in 2017. In the first six monthsof 2018, Novo Nordisk received a milestone payment from a partner related to an out-licensed clinical asset andNovo Nordisk recorded a net gain of DKK 122 million following the disposal of 2 million shares in NNIT to NovoHoldings A/S.
Operating profit decreased by 8% in Danish kroner and increased by 4% in local currencies to DKK 24,652 million.
FINANCIAL ITEMS (NET)
Financial items (net) showed a net gain of DKK 1,455 million compared with a net loss of DKK 1,229 million in2017.
In line with Novo Nordisk’s treasury policy, the most significant foreign exchange risks for the Group have beenhedged, primarily through foreign exchange forward contracts. The foreign exchange result was a gain of DKK1,495 million compared with a loss of DKK 1,161 million in 2017. This development reflects a gain on foreignexchange hedging involving especially the US dollar versus the Danish krone, partly offset by a net loss from non-hedged currencies.
A negative market value of financials contracts as per the end of June 2018 of approximately DKK 1.3 billion hasbeen deferred for recognition later in 2018 and 2019.

CAPITAL EXPENDITURE AND FREE CASH FLOW
Net capital expenditure for property, plant and equipment was DKK 3.9 billion compared with DKK 3.5 billion in2017. Net capital expenditure was primarily related to investments in a new production facility for a range ofdiabetes active pharmaceutical ingredients in Clayton, North Carolina, USA, a new diabetes care filling capacity inHillerød, Denmark and an expansion of the manufacturing capacity for biopharmaceutical products in Kalundborg,Denmark.
Free cash flow was DKK 20.5 billion compared with DKK 18.8 billion in 2017. The increase of 9% compared with2017 primarily reflects the timing of rebate payments in the USA and higher net profit partly offset by increasedcapital expenditure and increased investment in intangible assets reflecting an acquisition of a priority reviewvoucher for Novo Nordisk diabetes care and obesity development portfolio.
Financial report for the period 1 January 2018 to 30 June 2018 Page 11 of 30
Financial Performance Outlook R&D Sustainability Equity Legal Financial
Information
Company announcement No 60 / 2018
KEY DEVELOPMENTS IN THE SECOND QUARTER OF 2018
Please refer to appendix 1 for an overview of the quarterly numbers in DKK and to appendix 6 for details on salesin the second quarter of 2018.
Sales in the second quarter of 2018 decreased by 4% in Danish kroner and increased by 2% in local currenciescompared with the same period in 2017. The growth was driven by Victoza®, Ozempic®, Xultophy® and Saxenda®,partly offset by Levemir® and NovoSeven®. From a geographic perspective, sales growth in local currencies wasdriven by International Operations growing 8%, partly offset by North America Operations declining 3%. The salesdevelopment in the USA was negatively impacted by rebate adjustments related to prior periods for Victoza® insecond quarter of 2018 and rebate adjustments in 2017 for Tresiba® and NovoLog®.
The gross margin was 84.1% in the second quarter of 2018 compared with 84.6% in the same period last year.The decline of 0.5 percentage point of the gross margin reflects a negative currency impact of 1.4 percentagepoints. The gross margin was positively impacted by improved productivity and positive contribution from productmix due to higher Victoza®, Tresiba®, Saxenda® and Ozempic® sales, partly countered by lower contribution fromNovoSeven®. The gross margin was negatively impacted by lower prices primarily within the basal insulin segmentin the USA.
Sales and distribution costs increased by 5% in Danish kroner and by 12% in local currencies compared with thesame period in 2017 reflecting higher costs in both operating units. In North America Operations, the increase incosts reflected promotional activities for the launch of Ozempic® as well as Saxenda® promotion. In InternationalOperations, growth in costs was mainly in Region AAMEO and in Region China.
Research and development costs decreased by 3% in Danish kroner and by 1% in local currencies compared withthe same period in 2017. The decrease in research and development costs reflects the high level of research costsin second quarter of 2017 following impairment of early-stage diabetes and obesity assets. There was anunderlying increase in development costs driven by injectable semaglutide in obesity and the preparation for thephase 2 initiation of once-weekly insulin LAI287, partly offset by lower costs for oral semaglutide due to thefinalisation of the PIONEER trials.
Administrative costs decreased by 1% in Danish kroner and increased by 3% in local currencies compared with thesame period in 2017 mainly related to higher spend across the regions.
Other operating income (net) was DKK 386 million in the second quarter of 2018 compared with DKK 189 millionin the same period last year. In second quarter of 2018, Novo Nordisk received a milestone payment from a partnerrelated to an out-licensed clinical asset.
Operating profit decreased by 9% in Danish kroner and increased by 2% in local currencies compared with thesame period in 2017.

OUTLOOK
OUTLOOK 2018
The current expectations for 2018 are summarised in the table below:
Expectations are as reported,if not otherwise stated
Expectations8 August 2018
Expectations2 May 2018
Sales growthin local currencies 3% to 5% 3% to 5%
as reported Around 5 percentage points lower than inlocal currencies
Around 6 percentage points lower than in localcurrencies
Operating profit growthin local currencies 2% to 5% 2% to 5%
as reported Around 7 percentage points lower than inlocal currencies
Around 9 percentage points lower than in localcurrencies
Financial items (net) Gain of around DKK 0.9 billion Gain of around DKK 1.9 billion
Effective tax rate 19% to 20% 20% to 22%
Capital expenditure Around DKK 9.5 billion Around DKK 9.5 billion
Depreciation, amortisationand impairment losses Around DKK 3 billion Around DKK 3 billion
Free cash flow DKK 27-32 billion DKK 27-32 billion
For 2018, sales growth is expected to be 3% to 5%, measured in local currencies. This guidance reflectsexpectations for robust performance for the portfolio of new-generation insulin and the GLP-1-based productsVictoza®, Ozempic® and Saxenda®. Sales growth is expected to be partly countered by intensifying globalcompetition both within diabetes care and biopharmaceuticals, especially within the haemophilia inhibitor segment,as well as continued pricing pressure within diabetes care, especially in the USA. Overall, the expectations are basedon an assumption of a broadly unchanged global macroeconomic environment. Given the current exchange ratesversus the Danish krone, growth reported in DKK is now expected to be around 5 percentage points lower than inlocal currencies.
For 2019, formulary negotiations with pharmacy benefit managers and managed care organisations in the USA areprogressing. Subject to the final outcome of these negotiations, average prices after rebates are expected to belower compared with the levels in 2018, predominantly due to basal insulin pricing and changed Medicare Part Dcoverage gap legislation. The market access for Novo Nordisk’s key products is expected to remain broadlyunchanged compared to 2018.
For 2018, operating profit growth is expected to be 2% to 5%, measured in local currencies. The expectation foroperating profit growth primarily reflects the sales growth outlook and continued focus on cost control. The outlookalso reflects a planned increase in the sales and distribution costs to support the commercialisation efforts forOzempic®. Given the current exchange rates versus the Danish krone, growth reported in DKK is now expected to bearound 7 percentage points lower than in local currencies.
For 2018, Novo Nordisk now expects financial items (net) to amount to a gain of around DKK 0.9 billion, partlyoffsetting the negative currency impact on operating profit. The current expectation for 2018 reflects gainsassociated with foreign exchange hedging contracts, mainly related to the US dollar and Japanese yen versus theDanish krone, partly offset by losses on non-hedged currencies. The expectation for financial items (net) reflects thatnet losses of DKK 0.7 billion in relation to foreign exchange hedging contracts as per 2 August 2018 are expected tobe income recognised later in 2018.
The effective tax rate for 2018 is now expected to be in the range of 19-20%. The lower effective tax rate reflectsa non-recurring change in tax provisions related to settlement of international tax cases covering multiple years.Furthermore, the effective tax rate in 2018 is positively impacted by the reduced federal corporate tax rate in theUSA.
Financial report for the period 1 January 2018 to 30 June 2018 Page 12 of 30
Financial Performance Outlook R&D Sustainability Equity Legal Financial
Information
Company announcement No 60 / 2018

Capital expenditure is expected to be around DKK 9.5 billion in 2018, primarily related to investments in additionalcapacity for active pharmaceutical ingredient production within diabetes care and an expansion of the diabetes carefilling capacity. Depreciation, amortisation and impairment losses are expected to be around DKK 3 billion.Free cash flow is expected to be DKK 27-32 billion.
All of the above expectations are based on assumptions that the global economic and political environment will notsignificantly change business conditions for Novo Nordisk during 2018, and that currency exchange rates, especiallythe US dollar, will remain at the current level versus the Danish krone. Please refer to appendix 7 for key currencyassumptions.
Novo Nordisk has hedged expected net cash flows in a number of invoicing currencies and, all other things beingequal, movements in key invoicing currencies will impact Novo Nordisk’s operating profit as outlined in the tablebelow.
Key invoicing currencies
Impact on Novo Nordisk's operating profit in the next 12 months of a 5%immediate movement in currency Hedging period (months)
USD DKK 2,000 million 11CNY DKK 330 million 6*JPY DKK 180 million 12GBP DKK 95 million 11CAD DKK 80 million 10
* Chinese yuan traded offshore (CNH) used as proxy when hedging Novo Nordisk’s CNY currency exposure
The financial impact from foreign exchange hedging is included in Financial items (net).
Financial report for the period 1 January 2018 to 30 June 2018 Page 13 of 30
Financial Performance Outlook R&D Sustainability Equity Legal Financial
Information
Company announcement No 60 / 2018
RESEARCH & DEVELOPMENT UPDATE
DIABETES
Ozempic® (NN9535) label updated in the EU to reflect updated device offeringIn May 2018, Novo Nordisk received an approval from the European Medicines Agency (EMA) to update the label forOzempic® to reflect the updated device offering in the EU. Following the positive opinion, Ozempic® will be availablein three pens; the titration dosage, 0.25 mg and the therapeutic dosages, 0.5 mg and 1 mg, and will be launched inthe Ozempic® FlexTouch® pen, the latest generation of Novo Nordisk prefilled devices.
Approval of updated Xultophy® (NN9068) label in the EU based on LEADER and DEVOTE In June 2018, the EU Commission approved the proposed update of the Xultophy® EU label to include data from theLEADER and DEVOTE trials. The LEADER trial was a multi-centre, international, randomised, double-blinded, placebo-controlled trial investigating the long-term (3.5-5 years) effects of Victoza® (liraglutide up to 1.8 mg) compared toplacebo, both in addition to standard of care, in people with type 2 diabetes at high risk of major cardiovascularevents. The DEVOTE trial, a long-term, randomised, double-blinded event-driven trial, was conducted to confirm thecardiovascular safety of Tresiba® (insulin degludec U100) compared to insulin glargine U100 when added tostandard of care, in people with type 2 diabetes at high risk of cardiovascular events.
Additional four clinical trials successfully completed with oral semaglutide (NN9924) in the phase 3aprogramme PIONEERIn May and June 2018, Novo Nordisk announced the headline results from PIONEER 2, 3, 4 and 7, the phase 3a trialswith oral semaglutide for treatment of adults with type 2 diabetes. Oral semaglutide is a new GLP-1 analogue takenonce daily as a tablet.
Two distinct statistical approaches to evaluating the effects of oral semaglutide were applied in all the PIONEER trials;a primary statistical approach required by recent regulatory guidance, evaluating the effect regardless ofdiscontinuation of treatment and use of rescue medication, and a secondary statistical approach describing theeffect while on treatment and without use of rescue medication.
PIONEER 2: oral semaglutide compared with empagliflozinPIONEER 2 was a 52-week, open label trial investigating the efficacy and safety of 14 mg oral semaglutide comparedwith 25 mg empagliflozin in 816 people with type 2 diabetes, inadequately controlled on metformin. Theconfirmatory endpoints were defined after 26 weeks of treatment.
The trial achieved its primary objective according to the primary statistical approach by demonstrating a statisticallysignificant and superior improvement in HbA1c
with oral semaglutide compared to empagliflozin at 26 weeks.Difference in weight loss at 26 weeks between oral semaglutide and empagliflozin was not statistically significantwhen applying the primary statistical approach.
When applying the secondary statistical approach, people treated with 14 mg oral semaglutide achieved astatistically significant improvement in HbA1c
of 1.4% at 26 weeks and 1.3% at 52 weeks, compared to animprovement in HbA1c of 0.9% and 0.8% with 25 mg empagliflozin at 26 and 52 weeks, respectively. The 14 mgdose of oral semaglutide demonstrated weight loss of 4.2 kg at 26 weeks and 4.7 kg at 52 weeks versus 3.8 kg with25 mg empagliflozin at both 26 weeks and 52 weeks. The increased weight loss with oral semaglutide wasstatistically significant compared to empagliflozin at the 52-week time point.
In addition, applying the secondary statistical approach, the American Diabetes Association (ADA) treatment targetof HbA1c below 7.0% was achieved by 72% of people treated with 14 mg oral semaglutide compared with 47% ofpeople treated with 25 mg empagliflozin at 52 weeks.
In the trial, oral semaglutide was well-tolerated and with a profile consistent with GLP-1-based therapy. The mostcommon adverse event for oral semaglutide was mild to moderate nausea, which diminished over time. In PIONEER2, 20% of people treated with oral semaglutide experienced nausea during the trial. The proportion of people whodiscontinued treatment due to adverse events was 11% for people treated with 14 mg oral semaglutide comparedto 4% for people treated with 25 mg empagliflozin.
Financial report for the period 1 January 2018 to 30 June 2018 Page 14 of 30
Financial Performance Outlook R&D Sustainability Equity Legal Financial
Information
Company announcement No 60 / 2018

PIONEER 3: oral semaglutide compared with sitagliptinPIONEER 3 was a 78-week trial investigating the efficacy and long-term safety of 3, 7 and 14 mg oral semaglutidecompared with 100 mg sitagliptin in 1,864 people with type 2 diabetes inadequately controlled with metformin,with or without sulfonylurea. The confirmatory endpoints were assessed after 26 weeks of treatment.
The trial achieved its primary objective according to the primary statistical approach by demonstrating statisticallysignificant and superior reductions in HbA1c with oral semaglutide 7 and 14 mg compared to sitagliptin at week 26.Furthermore, people treated with oral semaglutide 7 and 14 mg achieved statistically significant and superiorreductions in body weight compared to sitagliptin at week 26.
When applying the secondary statistical approach for week 26 and week 78, respectively, people treated with 7 and14 mg oral semaglutide experienced statistically significantly greater reductions in HbA1c
of 1.1% and 0.7% with 7mg oral semaglutide, 1.4% and 1.1% with 14 mg oral semaglutide compared to 0.8% and 0.4% with sitagliptin.Reductions in HbA1c with 3 mg oral semaglutide at 26 and 78 weeks were 0.5% and 0.3%, respectively. Thereduction was statistically significantly less than sitagliptin at week 26, but was not statistically different at week 78.Reductions in body weight from baseline were statistically significantly greater with 3, 7 and 14 mg oral semaglutideat week 26 and 78, respectively, with reductions of 1.2 and 1.9 kg for 3 mg oral semaglutide, 2.2 and 2.7 kg for 7mg oral semaglutide and 3.3 and 3.5 kg for 14 mg oral semaglutide compared to 0.7 and 1.1 kg with sitagliptin.
In this 78-week trial, oral semaglutide was well-tolerated and with a profile consistent with GLP-1-based therapy.The most common adverse event for oral semaglutide was mild to moderate nausea, which diminished over time. InPIONEER 3, 7-15% of people treated with oral semaglutide experienced nausea, compared to 7% of people treatedwith sitagliptin. The proportion of people who discontinued treatment due to adverse events was 6-12% for peopletreated with oral semaglutide compared to 5% with sitagliptin.
PIONEER 4: oral semaglutide compared with Victoza®
PIONEER 4 was a 52-week double-blinded, double-dummy trial investigating the efficacy and safety of 14 mg oralsemaglutide compared with Victoza® 1.8 mg and placebo in 711 people with type 2 diabetes inadequatelycontrolled on metformin, with or without an SGLT-2 inhibitor.
PIONEER 4 achieved its primary objective according to the primary statistical approach by demonstrating a non-inferior reduction in HbA1c and statistically significant and superior weight loss at 26 weeks with oral semaglutidecompared to Victoza®. Furthermore, oral semaglutide provided statistically significant and superior reductions inHbA1c and weight compared to placebo.
When applying the secondary statistical approach for week 26 and week 52, respectively, people treated with oralsemaglutide experienced a reduction in HbA1c of 1.3% and 1.2% compared to 1.1% and 0.9% with Victoza®
whereas placebo declined by 0.1% and increased by 0.2%. Reductions in HbA1c were statistically significantlygreater with oral semaglutide compared to both Victoza® and placebo. Reduction in body weight from baseline wasstatistically significantly greater with oral semaglutide at 4.7 and 5.0 kg at 26 and 52 weeks, respectively, comparedto 3.2 and 3.1 kg with Victoza®, and 0.7 and 1.2 kg with placebo. The American Diabetes Association (ADA)treatment target of HbA1c below 7.0% was achieved by 69% of people treated with oral semaglutide, 63% ofpeople treated with Victoza® and 18% of people treated with placebo after 52 weeks; the difference between oralsemaglutide and placebo was statistically significant.
In the trial, oral semaglutide was well-tolerated and with a profile consistent with GLP-1-based therapy. The mostcommon adverse event for oral semaglutide was mild to moderate nausea which diminished over time. In PIONEER4, 20% of people treated with oral semaglutide experienced nausea, compared to 18% of people treated withVictoza® and 4% of people treated with placebo. The proportion of people who discontinued treatment due toadverse events was 11% for people treated with oral semaglutide compared to 9% for people treated with Victoza®
and 4% for people receiving placebo.
PIONEER 7: oral semaglutide compared with sitagliptin in a flexible dose setting PIONEER 7 was a 52-week open-label trial investigating the efficacy and safety of oral semaglutide with doseadjustment based on clinical evaluation of glycaemic control and drug tolerability compared with the DPP-IV inhibitor100 mg sitagliptin in 504 people with type 2 diabetes, inadequately controlled on 1-2 oral antidiabetics.
Financial report for the period 1 January 2018 to 30 June 2018 Page 15 of 30
Financial Performance Outlook R&D Sustainability Equity Legal Financial
Information
Company announcement No 60 / 2018

The trial achieved its primary objective according to the primary statistical principle by demonstrating that oralsemaglutide was statistically significant and superior to sitagliptin 100 mg in the proportion of people achieving theAmerican Diabetes Association (ADA) treatment target of HbA1c below 7% at week 52. Oral semaglutide alsodemonstrated statistically significant and superior reductions in body weight versus sitagliptin.
When applying the secondary statistical approach, people treated with oral semaglutide experienced a statisticallysignificant reduction in HbA1c of 1.4% compared to 0.7% with sitagliptin at week 52. From a baseline HbA1c of8.3%, 63% of people treated with oral semaglutide achieved the target HbA1c below 7% after 52 weeks oftreatment compared to 28% of people treated with sitagliptin, and the difference was statistically significant. Thereduction in body weight of 2.9 kg with oral semaglutide was statistically significantly greater at week 52 comparedto 0.8 kg with sitagliptin. After 52 weeks of treatment, approximately 9% of the people receiving oral semaglutidetreatment were receiving 3 mg oral semaglutide, while approximately 31% and 60% were receiving 7 mg and 14mg oral semaglutide, respectively.
In the trial, oral semaglutide was well-tolerated and with a profile consistent with GLP-1-based therapy. The mostcommon adverse event for oral semaglutide was mild to moderate nausea, which diminished over time. In PIONEER7, 21% of people treated with oral semaglutide experienced nausea, compared to 2% of people treated withsitagliptin. The proportion of people who discontinued treatment due to adverse events was 9% for people treatedwith oral semaglutide compared to 3% for people treated with sitagliptin.
Novo Nordisk updates its CVOT plans for Ozempic® (NN9535) and oral semaglutide (NN9924) followingdialogue with FDAFollowing the US FDA's (Food and Drug Administration) approval of Ozempic® in December 2017, Novo Nordisk hasengaged in a constructive dialogue with the FDA focusing on minimising the need for additional large cardiovascularoutcomes trials (CVOTs) to obtain a cardiovascular (CV) indication for Ozempic®, as well as the overall number oflarge cardiovascular outcomes trials necessary for the semaglutide molecule in different formulations. At this point intime, Novo Nordisk has agreed with FDA that a bridging strategy between Ozempic® and oral semaglutide could beutilised to pursue a CV indication. The originally planned CVOT (SOUL) for Ozempic® is expected to be replaced by anew CVOT with oral semaglutide to pursue a CV indication for both products. This study is expected to be initiatedin 2019. A potential alternative scenario that Novo Nordisk is evaluating is the possibility to obtain a CV indicationfor Ozempic® based on the already obtained clinical data from the CVOT SUSTAIN 6 in combination with the CVOTtrial PIONEER 6 with oral semaglutide, which is expected to be reported before the end of 2018.
Phase 3b trial Ellipse with Victoza® (NN2211) in children and adolescents (10-17 years) successfullycompletedIn August 2018, Novo Nordisk completed the Ellipse trial with Victoza® in children and adolescents (10-17 years)with type 2 diabetes. This two-arm trial investigated the efficacy and safety of the maximum tolerated or requireddose of Victoza® (0.6, 1.2 or 1.8 mg) compared to placebo when added to metformin, with or without basal insulin.The trial was randomised and double-blinded until week 26 and continued with an open-label extension until week52.
The trial successfully met its primary objective of demonstrating superiority of Victoza® over placebo in loweringHbA1c after 26 weeks. From a mean baseline HbA1c of 7.8%, people treated with Victoza® experienced a reductionin HbA1c of 0.6% while people treated with placebo experienced an increase of 0.4%. Reductions in HbA1c werestatistically significantly greater with Victoza® compared to placebo at week 26. The treatment difference in HbA1c
was 1.3% after 52 weeks and confirmed the sustained glycaemic control with Victoza®. The safety profile ofVictoza® was comparable to that observed in the adult population treated with Victoza®.
Novo Nordisk plans to submit the results from the Ellipse trial to the FDA in the USA and the EMA in the EU in fourthquarter of 2018 to seek label expansion and six months patent extension related to the paediatric data in the USAand the EU.
Phase 3b trial LIRA-ADD2SGLT2i with Victoza® (NN2211) as add-on to any SGLT2 inhibitor successfullycompletedIn June 2018, Novo Nordisk completed the LIRA-ADD2SGLT2i trial with Victoza®. The trial investigated the effect ofliraglutide 1.8 mg versus placebo as add-on to any SGLT2 inhibitor on glycaemic control in people with type 2diabetes insufficiently controlled despite stable treatment with SGLT2 inhibitor with or without metformin for atleast 90 days. The trial successfully met the primary endpoint and fulfilled its primary objective of demonstrating thattreatment with liraglutide was superior with regards to lowering of HbA1c with a treatment difference of -0.7%
Financial report for the period 1 January 2018 to 30 June 2018 Page 16 of 30
Financial Performance Outlook R&D Sustainability Equity Legal Financial
Information
Company announcement No 60 / 2018

versus placebo. Treatment with liraglutide resulted in a weight loss of 2.8 kg compared to a weight loss of 2.0 kgwith placebo, with no statistically significant difference between groups. Liraglutide was well-tolerated and with aprofile consistent with GLP-1-based therapy.
OBESITY
Four clinical phase 3a trials initiated with injectable semaglutide (NN9536) in people with obesity in theSTEP programmeDuring second quarter of 2018 and in August 2018, Novo Nordisk initiated the STEP programme with injectablesemaglutide 2.4 mg for people with obesity. Four trials were initiated under the STEP programme and approximately4,500 people with obesity are expected to be enrolled. All four trials have a duration of 68 weeks and the STEPprogramme is expected to be completed in 2020.
Obesity portfolio review leads to discontinuation of FGF-21 (NN9499) and G530L (NN9030)Novo Nordisk has conducted a review of its obesity portfolio and based on this review, it was concluded todiscontinue two projects currently in phase 1 clinical development, FGF-21 and G530L. Novo Nordisk intends topursue clinical development of FGF-21 in other serious chronic diseases. The decision to discontinue these projectswas made in order to balance the investments in Novo Nordisk's obesity projects. The projects were not discontinueddue to any major safety issues.
BIOPHARMACEUTICALS
Refixia® (NN7999) approved in JapanIn July 2018, Refixia® was approved in Japan for suppression of bleeding tendency in people with blood coagulationfactor IX deficiency. The label includes use in all ages for routine prophylaxis, surgery and treatment of bleeds. As anext step, prior to commercial launch, the list price will be negotiated with the Japanese authorities.
Positive results from phase 2 trial with long-acting growth hormone somapacitan (NN8640) for treatmentof Growth Hormone Deficiency (GHD).In May 2018, Novo Nordisk completed the main phase of REAL 3, the phase 2 trial with long-acting recombinantgrowth hormone, somapacitan. REAL 3 was a multinational, randomised, parallel-group active-controlled trial withthe primary endpoint to evaluate the efficacy of multiple dose regimens of once-weekly somapacitan after 26 weeksof treatment in 59 growth hormone treatment-naïve pre-pubertal children with growth hormone deficiency,compared to daily Norditropin® administration. The trial demonstrated dose dependency with no statisticallysignificant difference in height velocity between somapacitan and daily growth hormone at the two upper doses ofsomapacitan. The mean annualised height velocity for the three dose levels of somapacitan was 8.0 cm, 10.9 cmand 12.9 cm, respectively, as compared to 11.4 cm for daily Norditropin®. The observed safety profile in the studywas consistent with that known for Norditropin®. Novo Nordisk is now preparing for the pivotal phase 3somapacitan programmes in GHD children as well as in children born small for gestational age (SGA), based on thedose direction obtained from the REAL 3 trial.
In July 2018, the Committee for Orphan Medicinal Products (COMP) Europe issued a positive opinion on theapplication for orphan drug designation for somapacitan for the treatment of growth hormone deficiency.
Financial report for the period 1 January 2018 to 30 June 2018 Page 17 of 30
Financial Performance Outlook R&D Sustainability Equity Legal Financial
Information
Company announcement No 60 / 2018
SUSTAINABILITY UPDATE
The number of employees in Novo Nordisk increased by 4%The number of full-time employees at the end of the first six months of 2018 increased by 4% compared to 12months ago. The total number of employees was 43,642, corresponding to 43,105 full-time positions. The growthin employees was mainly driven by the continued expansion of the global service centre in Bangalore, India, as wellas increases in Region AAMEO, Product Supply and Research & Development.
Novo Nordisk secures renewable power for its production sites in Europe In July 2018, Novo Nordisk signed a long-term power purchase agreement with the energy company Vattenfall,which will secure supplies of renewable power for all Novo Nordisk's production sites in Europe. With thisagreement, Novo Nordisk has made an important step towards reaching its ambition that all Novo Nordiskproduction facilities worldwide will run on renewable power by 2020. Novo Nordisk will source power consumption

from the offshore wind farm Kriegers Flak in the Baltic Sea, which will be Denmark's largest wind farm. Theagreement is effective as of 1 January 2020.
Financial report for the period 1 January 2018 to 30 June 2018 Page 18 of 30
Company announcement No 60 / 2018
EQUITY
Total equity was DKK 49,081 million at the end of the first six months of 2018, equivalent to 47.5% of total assets,compared with 49.5% at the end of the first six months of 2017. Please refer to appendix 5 for further elaborationof changes in equity.
Interim dividendThe Board of Directors has decided to pay out interim dividend for 2018 of DKK 3.00 for each Novo Nordisk A and Bshare of DKK 0.20, which will be paid in August 2018. The ex-dividend date for the interim dividend will be 17August 2018. The record date will be 20 August 2018 for the A and B shares as well as ADRs. The payment date forthe A and B shares will be 21 August 2018, while the payment date for the ADRs will be 28 August 2018. Nodividend will be paid on the company’s holding of B shares.
2018 share repurchase programme
On 4 May 2018, Novo Nordisk announced a share repurchase programme of up to DKK 2.7 billion to be executedfrom 7 May to 6 August 2018, as part of an overall programme February 2018 to January 2019 of up to DKK 14billion to be executed during a 12-month period. The purpose of the programme was to reduce the company’s sharecapital and to meet obligations arising from share-based incentive programmes. Under the programme, NovoNordisk has repurchased 8,855,013 B shares for an amount of DKK 2.7 billion in the period from 7 May to 6 August2018. The programme was concluded on 6 August 2018. As of 6 August 2018, Novo Nordisk A/S has repurchased atotal of 23,626,435 B shares equal to a transaction value of DKK 7.2 billion under the DKK 14 billion programmebeginning 1 February 2018.
As of 6 August 2018, Novo Nordisk A/S and its wholly-owned affiliates owned 33,598,106 of its own B shares,corresponding to 1.4% of the total share capital.
Share repurchase under the overall programme of up to DKK 14 billion in the period February 2018 to January 2019is expected to be resumed shortly. As announced in February 2018, Novo Nordisk’s majority shareholder NovoHoldings A/S, a holding company fully owned by the Novo Nordisk Foundation, has informed Novo Nordisk that itintends to consider its participation in the Novo Nordisk share repurchase programme on a year-by-year basis. For2018, Novo Holdings A/S has informed Novo Nordisk that it plans to participate in the share repurchase programme.Novo Holdings A/S has an ownership of 28.4% of the Novo Nordisk share capital after the implementation of theshare capital decrease and Novo Holdings A/S currently intends to maintain its ownership of the Novo Nordisk sharecapital around 28%.
LEGAL MATTERS
Product liability lawsuits related to Victoza® Novo Nordisk, along with the majority of incretin-based product manufacturers in the USA, is a defendant inproduct liability lawsuits related to use of incretin-based medications. As of 6 August 2018, 267 plaintiffs havenamed Novo Nordisk in product liability lawsuits, predominantly claiming damages for pancreatic cancer thatallegedly developed as a result of using Victoza® and other GLP-1/DPP-IV (incretin-based) products. 172 of theNovo Nordisk plaintiffs have also named other defendants in their lawsuits. Most Novo Nordisk plaintiffs have filedsuit in California federal and state courts.
In November 2015, all cases pending in the California federal and state courts were dismissed on Federal pre-emption grounds. Plaintiffs subsequently appealed these rulings to the Federal and California state appeals courts. In November 2017, the U.S. Court of Appeals for the Ninth Circuit reversed and vacated the Federal District CourtJudge’s ruling, thereby reinstating the dismissed federal lawsuits and sending them back to the Federal DistrictCourt in California for further proceedings. The ruling by the U.S. Court of Appeals does not bind the CaliforniaState Appeals Court, which is currently reviewing the State Court judge’s pre-emption ruling. Currently, NovoNordisk does not have any individual trials scheduled in 2018. Novo Nordisk does not expect the pending claims tohave a material impact on its financial position, operating profit or cash flow.
Financial Performance Outlook R&D Sustainability Equity Legal Financial
Information

Forward-looking statements
Novo Nordisk’s reports filed with or furnished to the US Securities and Exchange Commission (SEC), including thisdocument as well as the company’s statutory Annual Report 2017 and Form 20-F, both filed with the SEC inFebruary 2018, and written information released, or oral statements made, to the public in the future by or onbehalf of Novo Nordisk, may contain forward-looking statements. Words such as ‘believe’, ‘expect’, ‘may’, ‘will’,‘plan’, ‘strategy’, ‘prospect’, ‘foresee’, ‘estimate’, ‘project’, ‘anticipate’, ‘can’, ‘intend’, ‘target’ and other words andterms of similar meaning in connection with any discussion of future operating or financial performance identifyforward-looking statements. Examples of such forward-looking statements include, but are not limited to:
• statements of targets, plans, objectives or goals for future operations, including those related to NovoNordisk’s products, product research, product development, product introductions and product approvals aswell as cooperation in relation thereto
• statements containing projections of or targets for revenues, costs, income (or loss), earnings per share,capital expenditures, dividends, capital structure, net financials and other financial measures
• statements regarding future economic performance, future actions and outcome of contingencies such aslegal proceedings, and
• statements regarding the assumptions underlying or relating to such statements.
In this document, examples of forward-looking statements can be found under the headings ‘Outlook’, ‘Researchand Development update’ and Equity’.
These statements are based on current plans, estimates and projections. By their very nature, forward-lookingstatements involve inherent risks and uncertainties, both general and specific. Novo Nordisk cautions that a numberof important factors, including those described in this document, could cause actual results to differ materially fromthose contemplated in any forward-looking statements.
Factors that may affect future results include, but are not limited to, global as well as local political and economicconditions, including interest rate and currency exchange rate fluctuations, delay or failure of projects related toresearch and/or development, unplanned loss of patents, interruptions of supplies and production, product recalls,unexpected contract breaches or terminations, government-mandated or market-driven price decreases for NovoNordisk’s products, introduction of competing products, reliance on information technology, Novo Nordisk’s ability tosuccessfully market current and new products, exposure to product liability and legal proceedings and investigations,changes in governmental laws and related interpretation thereof, including on reimbursement, intellectual propertyprotection and regulatory controls on testing, approval, manufacturing and marketing, perceived or actual failure toadhere to ethical marketing practices, investments in and divestitures of domestic and foreign companies,unexpected growth in costs and expenses, failure to recruit and retain the right employees, and failure to maintain aculture of compliance.
For an overview of some, but not all, of the risks that could adversely affect Novo Nordisk’s results or the accuracy offorward-looking statements in this document, reference is made to the overview of risk factors in ‘The Risks of DoingBusiness’ on pp 40-43 of the Annual Report 2017.
Unless required by law, Novo Nordisk is under no duty and undertakes no obligation to update or revise anyforward-looking statement after the distribution of this document, whether as a result of new information, futureevents or otherwise.
Financial report for the period 1 January 2018 to 30 June 2018 Page 19 of 30
Financial Performance Outlook R&D Sustainability Equity Legal Financial
Information
Company announcement No 60 / 2018

MANAGEMENT STATEMENT
The Board of Directors and Executive Management have reviewed and approved the financial report of Novo NordiskA/S for the first six months of 2018. The financial report has not been audited or reviewed by the company’sindependent auditors.
The financial report for the first six months of 2018 has been prepared in accordance with IAS 34 'Interim FinancialReporting’. The accounting policies adopted in the preparation are consistent with those applied in the AnnualReport 2017 of Novo Nordisk, except for the adoption of new, amended or revised standards and interpretations(IFRSs) as published by the IASB that are endorsed by the EU effective as of 1 January 2018. This includes IFRS 9'Financial Instruments' applied prospectively and IFRS 15 'Revenue from Contracts with Customers' applied modifiedretrospectively. Furthermore, the financial report for the first six months of 2018 and Management’s Review areprepared in accordance with additional Danish disclosure requirements for interim reports of listed companies.
In our opinion, the accounting policies used are appropriate and the overall presentation of the financial report forthe first six months of 2018 is adequate. Furthermore, in our opinion, Management’s Review includes a true and fairaccount of the development in the operations and financial circumstances, of the results for the period and of thefinancial position of the Group as well as a description of the most significant risks and elements of uncertaintyfacing the Group in accordance with Danish disclosure requirements for listed companies.
Besides what has been disclosed in the quarterly financial report, no changes in the Group’s most significant risksand uncertainties have occurred relative to what was disclosed in the consolidated annual report for 2017.
Bagsværd, 8 August 2018
Executive Management:
Lars Fruergaard JørgensenPresident and CEO
Karsten Munk KnudsenCFO
Jesper Brandgaard
Lars Green Camilla Sylvest Mads Krogsgaard Thomsen
Henrik Wulff
Board of Directors:
Helge LundChairman
Jeppe ChristiansenVice chairman
Brian Daniels
Andreas Fibig Sylvie Grégoire Liz Hewitt
Mette Bøjer Jensen Kasim Kutay Anne Marie Kverneland
Martin Mackay Thomas Rantzau Stig Strøbæk
Financial report for the period 1 January 2018 to 30 June 2018 Page 20 of 30
Financial Performance Outlook R&D Sustainability Equity Legal Financial
Information
Company announcement No 60 / 2018

APPENDIX 1: QUARTERLY NUMBERS IN DKK
(Amounts in DKK million, except number of full-time equivalent employees, earnings per share and number of shares outstanding).% change
2018 2017 Q2 2018 vsQ2 Q1 Q4 Q3 Q2 Q1 Q2 2017
Net sales 27,407 26,930 27,992 26,614 28,638 28,452 (4%)
Gross profit 23,055 22,733 23,292 22,342 24,229 24,201 (5%)Gross margin 84.1% 84.4% 83.2% 83.9% 84.6% 85.1%
Sales and distribution costs 7,090 6,451 8,295 6,497 6,761 6,787 5%Percentage of sales 25.9% 24.0% 29.6% 24.4% 23.6% 23.9%Research and development costs 3,296 3,321 3,983 3,328 3,414 3,289 (3%)Percentage of sales 12.0% 12.3% 14.2% 12.5% 11.9% 11.6%Administrative costs 851 864 1,118 896 857 913 (1%)Percentage of sales 3.1% 3.2% 4.0% 3.4% 3.0% 3.2%Other operating income, net 386 351 151 423 189 278 104%
Operating profit 12,204 12,448 10,047 12,044 13,386 13,490 (9%)Operating margin 44.5% 46.2% 35.9% 45.3% 46.7% 47.4%
Financial income 1,039 1,198 175 392 421 258 147%Financial expenses 745 37 (349) (26) 1,164 744 (36%)Financial items (net) 294 1,161 524 418 (743) (486) (140%)
Profit before income taxes 12,498 13,609 10,571 12,462 12,643 13,004 (1%)
Income taxes 2,155 2,858 2,318 2,692 2,692 2,848 (20%)
Net profit 10,343 10,751 8,253 9,770 9,951 10,156 4%
Depreciation, amortisation and impairment losses 768 732 905 706 863 708 (11%)Capital expenditure (net) 1,587 2,310 3,043 2,098 1,934 1,604 (18%)Net cash generated from operating activities 15,770 9,815 6,032 12,921 10,117 12,098 56%Free cash flow 13,227 7,241 2,866 10,930 8,392 10,400 58%
Total assets 103,248 93,558 102,355 97,891 97,825 94,213 6%Total equity 49,081 44,238 49,815 46,946 48,436 40,301 1%Equity ratio 47.5% 47.3% 48.7% 48.0% 49.5% 42.8%
Full-time equivalent employees end of period 43,105 42,688 42,076 41,656 41,385 41,636 4%
Basic earnings per share/ADR (in DKK) 4.27 4.41 3.38 3.96 4.01 4.07 6%Diluted earnings per share/ADR (in DKK) 4.26 4.40 3.36 3.96 4.01 4.06 6%Average number of shares outstanding (million) 2,425.8 2,437.3 2,451.2 2,465.6 2,480.2 2,495.8 (2%)Average number of diluted sharesoutstanding (million) 2,430.9 2,442.3 2,456.1 2,469.4 2,484.1 2,500.0 (2%)
Sales by business segment: Long-acting insulin 5,357 4,873 5,494 5,098 5,976 5,606 (10%) Premix insulin 2,587 2,642 2,622 2,562 2,704 2,861 (4%) Fast-acting insulin 4,936 4,778 4,618 5,087 5,102 5,317 (3%) Human insulin1) 2,335 2,366 2,393 2,429 2,455 2,516 (5%) Total insulin 15,215 14,659 15,127 15,176 16,237 16,300 (6%) Total GLP-1 5,924 6,058 6,305 5,343 5,775 5,750 3% Other diabetes care1) 1,011 1,121 1,014 1,044 1,072 1,172 (6%) Total diabetes care 22,150 21,838 22,446 21,563 23,084 23,222 (4%) Obesity (Saxenda®) 883 770 697 640 686 539 29% Diabetes care and obesity total 23,033 22,608 23,143 22,203 23,770 23,761 (3%)
Haemophilia 2,294 2,503 2,750 2,404 2,739 2,576 (16%) Growth disorders (Norditropin®) 1,703 1,481 1,709 1,621 1,679 1,646 1% Other biopharmaceuticals 377 338 390 386 450 469 (16%) Biopharmaceuticals total 4,374 4,322 4,849 4,411 4,868 4,691 (10%)
Sales by geographic segment: North America Operations 13,589 13,366 14,434 13,532 15,103 14,940 (10%)
- USA 12,952 12,878 13,879 12,967 14,583 14,402 (11%)International Operations 13,818 13,564 13,558 13,082 13,535 13,512 2%- Region Europe 5,460 5,233 5,418 5,190 5,355 5,226 2%- Region AAMEO 3,194 2,899 3,068 2,929 3,057 2,964 4%- Region China 2,751 3,029 2,510 2,531 2,608 3,060 5%- Region Japan & Korea 1,484 1,257 1,570 1,462 1,573 1,467 (6%)- Region Latin America 929 1,146 992 970 942 795 (1%)
Segment operating profit: Diabetes care and obesity 9,760 9,934 7,689 9,298 10,735 10,631 (9%) Biopharmaceuticals 2,444 2,514 2,358 2,746 2,651 2,859 (8%)1) Comparative figures have been restated as sales of bulk insulin are now disclosed as part of other diabetes care.
Financial report for the period 1 January 2018 to 30 June 2018 Page 21 of 30
Financial Performance Outlook R&D Sustainability Equity Legal Financial
Information
Company announcement No 60 / 2018

APPENDIX 2: INCOME STATEMENT AND STATEMENT OF COMPREHENSIVE INCOME
H1 H1 Q2 Q2DKK million 2018 2017 2018 2017
Income statement
Net sales 54,337 57,090 27,407 28,638Cost of goods sold 8,549 8,660 4,352 4,409
Gross profit 45,788 48,430 23,055 24,229
Sales and distribution costs 13,541 13,548 7,090 6,761Research and development costs 6,617 6,703 3,296 3,414Administrative costs 1,715 1,770 851 857Other operating income, net 737 467 386 189
Operating profit 24,652 26,876 12,204 13,386
Financial income 2,237 679 1,039 421Financial expenses 782 1,908 745 1,164
Profit before income taxes 26,107 25,647 12,498 12,643
Income taxes 5,013 5,540 2,155 2,692
NET PROFIT 21,094 20,107 10,343 9,951
Basic earnings per share (DKK) 8.68 8.08 4.27 4.01Diluted earnings per share (DKK) 8.66 8.07 4.26 4.01
Segment Information
Segment sales: Diabetes care and obesity 45,641 47,531 23,033 23,770 Biopharmaceuticals 8,696 9,559 4,374 4,868
Segment operating profit: Diabetes care and obesity 19,694 21,366 9,760 10,735 Operating margin 43.1% 45.0% 42.4% 45.2%
Biopharmaceuticals 4,958 5,510 2,444 2,651 Operating margin 57.0% 57.6% 55.9% 54.5%
Total segment operating profit 24,652 26,876 12,204 13,386
Statement of comprehensive income
Net profit for the Period 21,094 20,107 10,343 9,951
Other comprehensive income Items that will not subsequently be reclassified to the Income statement
Remeasurements on defined benefit plans 68 85 (8) —
Items that will be reclassified subsequently to the Income statement
Exchange rate adjustments of investments in subsidiaries 125 (357) 92 (301) Cash flow hedges, realisation of previously deferred (gains)/losses (1,758) 1,236 (674) 647 Cash flow hedges, deferred gains/(losses) incurred during the period (1,574) 2,276 (2,211) 2,282 Other items (10) (152) (23) (14) Tax on other comprehensive income, income/(expense) 704 (733) 642 (752)
Other comprehensive income for the Period, net of tax (2,445) 2,355 (2,182) 1,862
TOTAL COMPREHENSIVE INCOME FOR THE PERIOD 18,649 22,462 8,161 11,813
Financial report for the period 1 January 2018 to 30 June 2018 Page 22 of 30
Financial Performance Outlook R&D Sustainability Equity Legal Financial
Information
Company announcement No 60 / 2018

APPENDIX 3: CASH FLOW STATEMENT
DKK million H1 2018 H1 2017
Net profit 21,094 20,107
Adjustment for non-cash items: Income taxes in the Income Statement 5,013 5,540 Depreciation, amortisation and impairment losses 1,500 1,571 NNIT non-recurring income included in 'other operating income' (122) — Other non-cash items 3,557 1,463Change in working capital 27 (1,683)Interest received 22 69Interest paid (45) (41)Income taxes paid (5,461) (4,811)
Net cash generated from operating activities 25,585 22,215
Proceeds from the partial divestment NNIT A/S 368 —Purchase of intangible assets (1,059) (255)Proceeds from sale of property, plant and equipment 1 6Purchase of property, plant and equipment (4,458) (3,159)Proceeds from other financial assets 21 11Purchase of other financial assets — (40)Sale of marketable securities — 2,006Dividend received from associated company 10 14
Net cash used in investing activities (5,117) (1,417)
Purchase of treasury shares, net (7,750) (8,005)Dividends paid (11,810) (11,448)
Net cash used in financing activities (19,560) (19,453)
NET CASH GENERATED FROM ACTIVITIES 908 1,345
Cash and cash equivalents at the beginning of the year 17,158 18,461Exchange gain/(loss) on cash and cash equivalents 81 (162)
Cash and cash equivalents at the end of the period 18,147 19,644
Financial report for the period 1 January 2018 to 30 June 2018 Page 23 of 30
Financial Performance Outlook R&D Sustainability Equity Legal Financial
Information
Company announcement No 60 / 2018

APPENDIX 4: BALANCE SHEET
DKK million 30 Jun 2018 31 Dec 2017
ASSETS
Intangible assets 4,197 3,325Property, plant and equipment 37,971 35,247Investment in associated company 533 784Deferred income tax assets 2,057 1,941Other financial assets 988 978
TOTAL NON-CURRENT ASSETS 45,746 42,275
Inventories 16,134 15,373Trade receivables 18,973 20,165Tax receivables 724 958Other receivables and prepayments 2,635 2,428Derivative financial instruments 643 2,304Cash at bank 18,393 18,852
TOTAL CURRENT ASSETS 57,502 60,080
TOTAL ASSETS 103,248 102,355
EQUITY AND LIABILITIES
Share capital 490 500Treasury shares (6) (11)Retained earnings 50,671 48,977Other reserves (2,074) 349
TOTAL EQUITY 49,081 49,815
Deferred income tax liabilities 476 846Retirement benefit obligations 1,247 1,336Provisions 3,265 3,302
Total non-current liabilities 4,988 5,484
Current debt 247 1,694Trade payables 5,830 5,610Tax payables 3,383 4,242Other liabilities 13,451 14,446Derivative financial instruments 1,523 309Provisions 24,745 20,755
Total current liabilities 49,179 47,056
TOTAL LIABILITIES 54,167 52,540
TOTAL EQUITY AND LIABILITIES 103,248 102,355
Financial report for the period 1 January 2018 to 30 June 2018 Page 24 of 30
Financial Performance Outlook R&D Sustainability Equity Legal Financial
Information
Company announcement No 60 / 2018

APPENDIX 5: EQUITY STATEMENT
Other reserves
DKK millionShare
capitalTreasury
sharesRetainedearnings
Exchangerate
adjust-ments
Cashflow
hedges
Tax andother
adjust-ments
Totalother
reserves Total
H1 2018
Balance at the beginning of the period 500 (11) 48,977 (1,556) 2,027 (122) 349 49,815Change in accounting policy, IFRS 9 (90) 90 90 —Net profit for the period 21,094 21,094Other comprehensive income for the period 68 125 (3,332) 694 (2,513) (2,445)
Total comprehensive income for the period 21,072 125 (3,332) 784 (2,423) 18,649
Transactions with owners:Dividends (11,810) (11,810)Share-based payments 194 194Tax credit related to restricted stock units (17) (17)Purchase of treasury shares (5) (7,745) (7,750)Reduction of the B share capital (10) 10 —
Balance at the end of the period 490 (6) 50,671 (1,431) (1,305) 662 (2,074) 49,081
Other reserves
DKK millionShare
capitalTreasury
sharesRetainedearnings
Exchangerate
adjust-ments
Cashflow
hedges
Tax andother
adjust-ments
Totalother
reserves Total
H1 2017
Balance at the beginning of the period 510 (9) 46,111 (924) (1,915) 1,496 (1,343) 45,269Net profit for the period 20,107 20,107Other comprehensive income for the period 85 (357) 3,512 (885) 2,270 2,355
Total comprehensive income for the period 20,192 (357) 3,512 (885) 2,270 22,462
Transactions with owners:Dividends (11,448) (11,448)Share-based payments 158 158Tax credit related to restricted stock units — —Purchase of treasury shares (6) (7,999) (8,005)Reduction of the B share capital (10) 10 —
Balance at the end of the period 500 (5) 47,014 (1,281) 1,597 611 927 48,436
Financial report for the period 1 January 2018 to 30 June 2018 Page 25 of 30
Financial Performance Outlook R&D Sustainability Equity Legal Financial
Information
Company announcement No 60 / 2018

APPENDIX 6: REGIONAL SALES SPLIT
Q2 2018 sales split per region
DKK million Total
NorthAmerica
Operations USA
Inter-national
OperationsRegionEurope
RegionAAMEO
Region China
RegionJapan &
Korea
RegionLatin
America
The diabetes care and obesity segment
Long-acting insulin 5,357 3,330 3,252 2,027 1,078 334 205 228 182
% change in local currencies (4%) (12%) (13%) 15% 10% 24% 20% 7% 29%
Tresiba® 1,952 1,247 1,228 705 316 82 2 199 106
% change in local currencies (4%) (16%) (17%) 27% 27% 48% 200% 13% 39%
Levemir® 3,023 1,955 1,896 1,068 522 241 203 29 73
% change in local currencies (10%) (14%) (14%) 0% (11%) 14% 19% (21%) 14%
Premix insulin 2,587 295 286 2,292 428 713 949 170 32
% change in local currencies 2% (27%) (27%) 7% (11%) 18% 9% (3%) 20%
NovoMix® 2,408 295 286 2,113 412 646 949 82 24
% change in local currencies (2%) (27%) (27%) 3% (13%) 11% 9% (30%) 22%
Fast-acting insulin 4,936 2,512 2,413 2,424 1,151 631 360 198 84
% change in local currencies 4% (2%) (3%) 11% 7% 23% 17% (14%) 34%
NovoRapid® 4,799 2,456 2,362 2,343 1,070 631 360 198 84
% change in local currencies 1% (4%) (5%) 8% 0% 23% 17% (14%) 34%
Human insulin 2,335 532 495 1,803 399 508 664 51 181
% change in local currencies 0% 14% 17% (3%) (10%) 8% (7%) (13%) (3%)
Total insulin 15,215 6,669 6,446 8,546 3,056 2,186 2,178 647 479
% change in local currencies 0% (8%) (8%) 7% 3% 18% 6% (5%) 16%
Victoza® 5,729 4,135 3,994 1,594 962 212 132 159 129
% change in local currencies 6% 3% 3% 14% 12% 0% 61% 9% 37%
Other diabetes care1) 1,206 399 341 807 154 156 384 98 15
% change in local currencies 19% 98% 109% (2%) 5% (10%) (2%) (3%) 59%
Total diabetes care 22,150 11,203 10,781 10,947 4,172 2,554 2,694 904 623
% change in local currencies 2% (2%) (2%) 8% 5% 14% 6% (2%) 20%
Obesity (Saxenda®) 883 603 551 280 52 122 — 14 92
% change in local currencies 40% 13% 12% 181% 130% 340% — — 91%
Diabetes care and obesity total 23,033 11,806 11,332 11,227 4,224 2,676 2,694 918 715
% change in local currencies 4% (1%) (2%) 9% 5% 18% 6% (1%) 26%
The biopharmaceuticals segment
Haemophilia 2,294 976 880 1,318 666 292 52 156 152
% change in local currencies (11%) (24%) (30%) 2% (8%) 29% (4%) 0% 13%
NovoSeven® 1,886 846 780 1,040 458 268 50 116 148
% change in local currencies (14%) (25%) (30%) (3%) (19%) 27% (5%) 3% 10%
NovoEight® 339 77 68 262 201 19 2 36 4
% change in local currencies 1% (40%) (47%) 29% 33% 100% 100% (11%) 200%
Growth disorders (Norditropin®) 1,703 680 676 1,023 388 184 4 387 60
% change in local currencies 9% 20% 20% 3% (6%) 22% 0% 5% 8%
Other biopharmaceuticals 377 127 64 250 182 42 1 23 2
% change in local currencies (12%) (25%) (44%) (3%) 4% (19%) — (23%) 100%
Biopharmaceuticals total 4,374 1,783 1,620 2,591 1,236 518 57 566 214
% change in local currencies (4%) (12%) (16%) 2% (6%) 21% (2%) 2% 12%
Total sales 27,407 13,589 12,952 13,818 5,460 3,194 2,751 1,484 929
% change in local currencies 2% (3%) (4%) 8% 3% 18% 6% 0% 22%
% change as reported (4%) (10%) (11%) 2% 2% 4% 5% (6%) (1%)
Share of growth 100% (65%) (88%) 165% 21% 86% 25% 1% 32%1) Primarily NovoNorm®, Ozempic® and needles.
Financial report for the period 1 January 2018 to 30 June 2018 Page 26 of 30
Financial Performance Outlook R&D Sustainability Equity Legal Financial
Information
Company announcement No 60 / 2018

APPENDIX 6: REGIONAL SALES SPLIT (CONTINUED)
H1 2018 sales split per region
DKK million Total
NorthAmerica
Operations USA
Inter-national
OperationsRegionEurope
RegionAAMEO
Region China
RegionJapan &
Korea
RegionLatin
America
The diabetes care and obesity segment
Long-acting insulin 10,230 6,311 6,169 3,919 2,083 644 409 425 358
% change in local currencies (3%) (11%) (11%) 14% 7% 27% 21% 7% 35%
Tresiba® 3,707 2,366 2,338 1,341 590 172 4 371 204
% change in local currencies 11% 3% 2% 29% 26% 64% 150% 11% 49%
Levemir® 5,803 3,723 3,609 2,080 1,032 443 405 54 146
% change in local currencies (16%) (22%) (22%) (3%) (16%) 11% 20% (18%) 14%
Premix insulin 5,229 706 688 4,523 856 1,348 1,938 317 64
% change in local currencies 1% (21%) (21%) 6% (10%) 16% 8% 0% 21%
NovoMix® 4,909 706 688 4,203 831 1,223 1,938 162 49
% change in local currencies (2%) (21%) (21%) 3% (12%) 11% 8% (26%) 20%
Fast-acting insulin 9,714 5,054 4,867 4,660 2,247 1,129 729 388 167
% change in local currencies 2% (5%) (5%) 10% 7% 19% 17% (11%) 40%
NovoRapid® 9,494 4,978 4,800 4,516 2,103 1,129 729 388 167
% change in local currencies 0% (6%) (6%) 8% 0% 19% 17% (11%) 40%
Human insulin 4,701 1,017 948 3,684 803 982 1,463 93 343
% change in local currencies 1% 22% 26% (3%) (9%) 8% (8%) (16%) 4%
Total insulin 29,874 13,088 12,672 16,786 5,989 4,103 4,539 1,223 932
% change in local currencies 0% (7%) (7%) 7% 2% 16% 5% (3%) 22%
Victoza® 11,718 8,653 8,384 3,065 1,833 449 242 285 256
% change in local currencies 12% 11% 11% 13% 9% 8% 57% 6% 30%
Other diabetes care1) 2,396 688 590 1,708 292 316 886 181 33
% change in local currencies 15% 68% 76% 1% (2%) (8%) 5% (1%) 51%
Total diabetes care 43,988 22,429 21,646 21,559 8,114 4,868 5,667 1,689 1,221
% change in local currencies 4% 1% 0% 7% 3% 13% 6% (2%) 24%
Obesity (Saxenda®) 1,653 1,153 1,055 500 90 214 — 14 182
% change in local currencies 50% 30% 30% 133% 133% 222% — — 69%
Diabetes care and obesity total 45,641 23,582 22,701 22,059 8,204 5,082 5,667 1,703 1,403
% change in local currencies 5% 2% 1% 9% 4% 17% 6% (1%) 28%
The biopharmaceuticals segment
Haemophilia 4,797 1,904 1,780 2,893 1,374 579 103 289 548
% change in local currencies (2%) (18%) (21%) 13% (7%) 15% (2%) (5%) 157%
NovoSeven® 4,040 1,664 1,572 2,376 992 531 101 212 540
% change in local currencies (6%) (21%) (23%) 10% (16%) 10% (3%) (4%) 157%
NovoEight® 635 153 144 482 368 35 2 69 8
% change in local currencies 16% (15%) (20%) 32% 35% 171% 100% (10%) 175%
Growth disorders (Norditropin®) 3,184 1,230 1,223 1,954 766 339 8 719 122
% change in local currencies 5% 16% 16% (2%) (5%) 3% 0% (4%) 14%
Other biopharmaceuticals 715 239 126 476 349 93 2 30 2
% change in local currencies (18%) (30%) (46%) (10%) (2%) (14%) (33%) (49%) 100%
Biopharmaceuticals total 8,696 3,373 3,129 5,323 2,489 1,011 113 1,038 672
% change in local currencies (1%) (10%) (12%) 5% (5%) 7% (2%) (6%) 106%
Total sales 54,337 26,955 25,830 27,382 10,693 6,093 5,780 2,741 2,075
% change in local currencies 4% 0% 0% 8% 2% 15% 6% (3%) 46%
% change as reported (5%) (10%) (11%) 1% 1% 1% 2% (10%) 19%
Share of growth 100% 1% (6%) 99% 8% 42% 16% (4%) 37%
1) Primarily NovoNorm®, Ozempic® and needles.
Financial report for the period 1 January 2018 to 30 June 2018 Page 27 of 30
Financial Performance Outlook R&D Sustainability Equity Legal Financial
Information
Company announcement No 60 / 2018
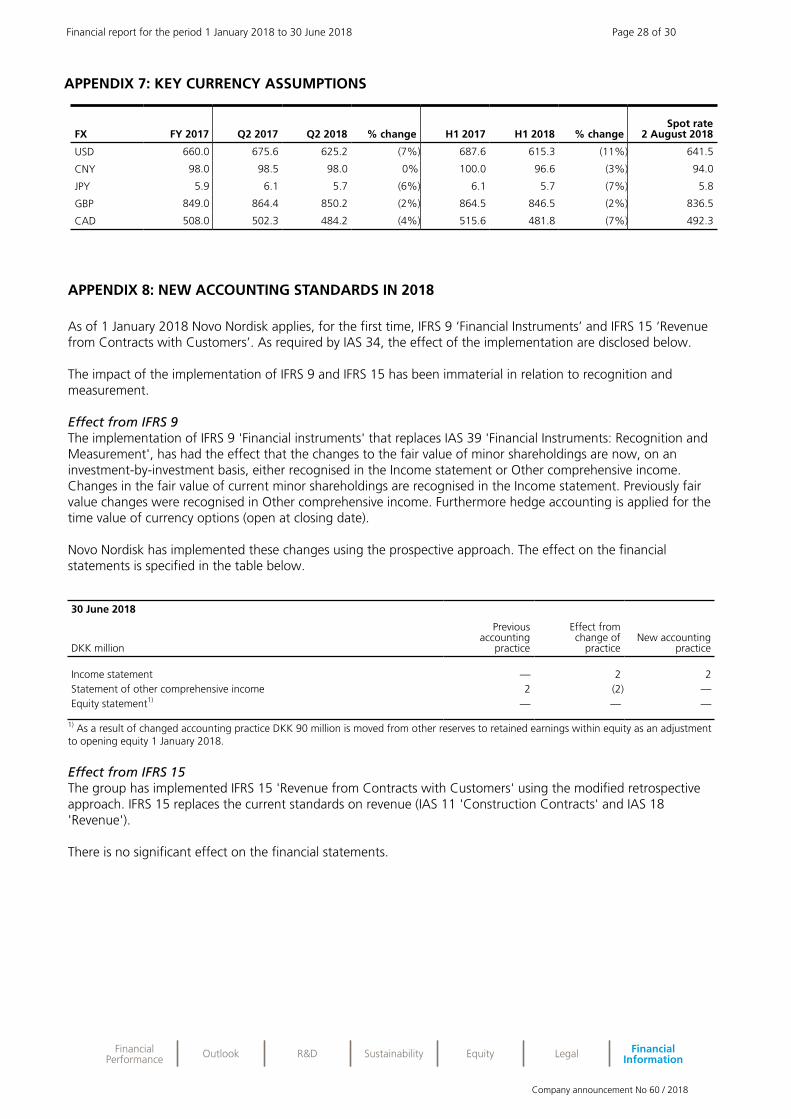
APPENDIX 7: KEY CURRENCY ASSUMPTIONS
FX FY 2017 Q2 2017 Q2 2018 % change H1 2017 H1 2018 % changeSpot rate
2 August 2018
USD 660.0 675.6 625.2 (7%) 687.6 615.3 (11%) 641.5
CNY 98.0 98.5 98.0 0% 100.0 96.6 (3%) 94.0
JPY 5.9 6.1 5.7 (6%) 6.1 5.7 (7%) 5.8
GBP 849.0 864.4 850.2 (2%) 864.5 846.5 (2%) 836.5
CAD 508.0 502.3 484.2 (4%) 515.6 481.8 (7%) 492.3
Financial report for the period 1 January 2018 to 30 June 2018 Page 28 of 30
Financial Performance Outlook R&D Sustainability Equity Legal Financial
Information
Company announcement No 60 / 2018
APPENDIX 8: NEW ACCOUNTING STANDARDS IN 2018
As of 1 January 2018 Novo Nordisk applies, for the first time, IFRS 9 ‘Financial Instruments’ and IFRS 15 ‘Revenuefrom Contracts with Customers’. As required by IAS 34, the effect of the implementation are disclosed below.
The impact of the implementation of IFRS 9 and IFRS 15 has been immaterial in relation to recognition andmeasurement.
Effect from IFRS 9The implementation of IFRS 9 'Financial instruments' that replaces IAS 39 'Financial Instruments: Recognition andMeasurement', has had the effect that the changes to the fair value of minor shareholdings are now, on aninvestment-by-investment basis, either recognised in the Income statement or Other comprehensive income.Changes in the fair value of current minor shareholdings are recognised in the Income statement. Previously fairvalue changes were recognised in Other comprehensive income. Furthermore hedge accounting is applied for thetime value of currency options (open at closing date).
Novo Nordisk has implemented these changes using the prospective approach. The effect on the financialstatements is specified in the table below.
30 June 2018
DKK million
Previousaccounting
practice
Effect fromchange of
practiceNew accounting
practice
Income statement — 2 2Statement of other comprehensive income 2 (2) —Equity statement1) — — —
1) As a result of changed accounting practice DKK 90 million is moved from other reserves to retained earnings within equity as an adjustmentto opening equity 1 January 2018.
Effect from IFRS 15The group has implemented IFRS 15 'Revenue from Contracts with Customers' using the modified retrospectiveapproach. IFRS 15 replaces the current standards on revenue (IAS 11 'Construction Contracts' and IAS 18'Revenue').
There is no significant effect on the financial statements.

APPENDIX 9: QUARTERLY NUMBERS IN USD (ADDITIONAL INFORMATION)Key figures are translated into USD as additional information - the translation is based on the average exchange rate for income statement and the exchange rate atthe balance sheet date for balance sheet items. The specified percent changes in DKK are based on the changes in the 'Quarterly numbers in DKK', see appendix 1.The specified percentage change in USD is calculated as a development in USD numbers in this appendix.
(Amounts in USD million, except number of full-time equivalent employees, earnings per share and number of shares outstanding).
% change % change2018 2017 Q2 2018 vs Q2 2018 vs
Q2 Q1 Q4 Q3 Q2 Q1 Q2 2017 inUSD
Q2 2017 inDKK
Net sales 4,384 4,446 4,418 4,198 4,230 4,073 4% (4%)
Gross profit 3,688 3,753 3,678 3,526 3,579 3,465 3% (5%)Gross margin 84.1% 84.4% 83.2% 83.9% 84.6% 85.1%
Sales and distribution costs 1,136 1,065 1,299 1,023 999 972 14% 5%Percentage of sales 25.9% 24.0% 29.6% 24.4% 23.6% 23.9%Research and development costs 527 548 625 523 504 471 5% (3%)Percentage of sales 12.0% 12.3% 14.2% 12.5% 11.9% 11.6%Administrative costs 136 143 175 141 126 131 8% (1%)Percentage of sales 3.1% 3.2% 4.0% 3.4% 3.0% 3.2%Other operating income, net 62 58 25 65 28 40 121% 104%
Operating profit 1,951 2,055 1,604 1,904 1,978 1,931 (1%) (9%)Operating margin 44.5% 46.2% 35.9% 45.3% 46.7% 47.4%
Financial income 166 198 29 61 62 37 168% 147%Financial expenses 121 6 (49) 3 172 106 (30%) (36%)Financial items (net) 45 192 78 58 (110) (69) (141%) (140%)
Profit before income taxes 1,996 2,247 1,682 1,962 1,868 1,862 7% (1%)
Income taxes 343 472 368 424 398 408 (14%) (20%)
Net profit 1,653 1,775 1,314 1,538 1,470 1,454 12% 4%
Depreciation, amortisation and impairment losses 123 121 142 112 127 101 (3%) (11%)Capital expenditure (net) 252 381 473 327 285 230 (12%) (18%)Net cash generated from operating activities 2,538 1,620 988 2,017 1,499 1,732 69% 56%Free cash flow 2,131 1,195 497 1,706 1,244 1,489 71% 58%
Total assets 16,143 15,577 16,491 15,540 15,004 13,532 8% 6%Total equity 7,674 7,365 8,026 7,452 7,429 5,789 3% 1%Equity ratio 47.5% 47.3% 48.7% 48.0% 49.5% 42.8%
Full-time equivalent employees end of period 43,105 42,688 42,076 41,656 41,385 41,636 4% 4%
Basic earnings per share/ADR (in USD) 0.68 0.73 0.54 0.62 0.60 0.58 13% 6%Diluted earnings per share/ADR (in USD) 0.68 0.73 0.53 0.63 0.59 0.58 15% 6%Average number of shares outstanding (million) 2,425.8 2,437.3 2,451.2 2,465.6 2,480.2 2,495.8 (2%) (2%)Average number of diluted sharesoutstanding (million) 2,430.9 2,442.3 2,456.1 2,469.4 2,484.1 2,500.0 (2%) (2%)
Sales by business segment: Long-acting insulin 857 805 868 806 883 802 (3%) (10%) Premix insulin 414 436 414 405 399 410 4% (4%) Fast-acting insulin 790 789 732 800 755 761 5% (3%)
Human insulin1) 373 391 378 382 363 360 3% (5%) Total insulin 2,434 2,421 2,392 2,393 2,400 2,333 1% (6%) Total GLP-1 947 1,000 991 843 853 823 11% 3% Other diabetes care1) 161 185 161 165 158 168 2% (6%) Total diabetes care 3,542 3,606 3,544 3,401 3,411 3,324 4% (4%) Obesity (Saxenda®) 142 127 109 101 101 77 41% 29% Diabetes care and obesity total 3,684 3,733 3,653 3,502 3,512 3,401 5% (3%)
Haemophilia 367 413 434 380 403 369 (9%) (16%) Growth disorders (Norditropin®) 273 244 269 255 248 236 10% 1% Other biopharmaceuticals 60 56 62 61 67 67 (10%) (16%) Biopharmaceuticals total 700 713 765 696 718 672 (3%) (10%)
Sales by geographic segment: North America Operations 2,174 2,206 2,279 2,139 2,230 2,139 (3%) (10%)
- USA 2,072 2,126 2,191 2,050 2,154 2,062 (4%) (11%)International Operations 2,210 2,240 2,139 2,059 2,000 1,934 11% 2%- Region Europe 875 864 855 816 791 748 11% 2%- Region AAMEO 511 479 483 461 452 424 13% 4%- Region China 439 500 397 401 386 438 14% 5%- Region Japan & Korea 237 208 248 230 232 210 2% (6%)- Region Latin America 148 189 156 151 139 114 6% (1%)
Segment operating profit: Diabetes care and obesity 1,560 1,640 1,229 1,472 1,586 1,522 (2%) (9%) Biopharmaceuticals 391 415 375 432 392 409 0% (8%)1) Comparative figures have been restated as sales of bulk insulin are now disclosed as part of other diabetes care.
Financial report for the period 1 January 2018 to 30 June 2018 Page 29 of 30
Financial Performance Outlook R&D Sustainability Equity Legal Financial
Information
Company announcement No 60 / 2018

APPENDIX 10: NON-IFRS FINANCIAL MEASURES (ADDITIONAL INFORMATION)In this Company Announcement, Novo Nordisk discloses certain financial measures of the Group’s financial performance, financialposition and cash flows that reflect adjustments to the directly comparable measures calculated and presented in accordance withIFRS. These non-IFRS financial measures may not be defined and calculated by other companies in the same manner and may thusnot be comparable with such measures.
The non-IFRS financial measures presented in the Company Announcement are:• Sales growth in local currencies• Operating profit growth in local currencies• Free cash flow
Sales and operating profit growth in local currenciesGrowth in local currencies’ means that the effect of changes in exchange rates is excluded. It is defined as sales/operating profitfor the period measured at the average exchange rates for the same period prior year compared with realised sales/operatingprofit for the same period prior year. Countries with hyperinflation as defined in IAS 29 ‘Financial reporting in hyperinflationeconomies’ are excluded from the calculation to avoid that growth in local currencies are artificially inflated. Managementbelieves that growth in local currencies is relevant information for investors in order to understand the underlying development insales and operating profit by adjusting for the impact of currency fluctuations.
Sales in local currencies
DKK million H1 2018 H1 2017 Q2 2018 Q2 2017
Net sales 54,337 57,090 27,407 28,638
Effect of exchange rate 4,882 (692) 1,876 (242)
Sales in local currencies 59,219 56,398 29,283 28,396
Operating profit in local currencies
DKK million H1 2018 H1 2017 Q2 2018 Q2 2017
Operating profit 24,652 26,876 12,204 13,386
Effect of exchange rate 3,293 (562) 1,412 (104)
Operating profit in local currencies 27,945 26,314 13,616 13,282
Free cash flowNovo Nordisk defines free cash flow as ’net cash generated from operating activities’ less ‘net cash used in investing activities’excluding net change of marketable securities. A positive free cash flow shows that the Group is able to finance its activities andthat external financing is thus not necessary for the Group’s operating activities. Therefore, management believes that this non-IFRS liquidity measure provides useful information to investors in addition to the most directly comparable IFRS financial measure‘Net cash generated from operating activities’.
Free cash flow
DKK million H1 2018 H1 2017 Q2 2018 Q2 2017
Net cash generated from operating activities 25,585 22,215 15,770 10,117
Net cash used in investing activities (5,117) (1,417) (2,543) (725)
Net purchase of marketable securities — (2,006) — (1,000)
Free cash flow 20,468 18,792 13,227 8,392
Financial report for the period 1 January 2018 to 30 June 2018 Page 30 of 30
Financial Performance Outlook R&D Sustainability Equity Legal Financial
Information
Company announcement No 60 / 2018