lg electronics · other financial assets 5,7,31 13,541 17,430 inventories 8 6,288,079 4,838,830 ......
TRANSCRIPT

LG ElectronicsInterim Consolidated Financial StatementsSeptember 30, 2014 and 2013

1
Page(s)
Report on Review of Interim Financial Statements ............................................. 1 - 2
Interim Consolidated Financial Statements
Interim Consolidated Statements of Financial Position ............................................ 3
Interim Consolidated Statements of Income ............................................................ 4
Interim Consolidated Statements of Comprehensive Income .................................... 5
Interim Consolidated Statements of Changes in Equity ........................................... 6
Interim Consolidated Statements of Cash Flows ...................................................... 7
Notes to the Interim Consolidated Financial Statements .......................................... 8 - 95


LG ElectronicsInterim Consolidated Statements of Financial Position
September 30, 2014 and December 31, 2013
(in millions of Korean won) Note
Assets
Current assetsCash and cash equivalents 5,31 2,949,709 2,645,270Financial deposits 5,31 67,700 67,896Trade receivables 5,6,31 8,277,702 7,117,402Loans and other receivables 5,31 545,112 596,505Other financial assets 5,7,31 13,541 17,430Inventories 8 6,288,079 4,838,830Current income tax assets 209,450 116,254Other current assets 969,537 925,471
19,320,830 16,325,058
Non-current assetsFinancial deposits 5,31 81,641 96,992Loans and other receivables 5,31 564,494 601,978Other financial assets 5,7,31 53,302 55,714Property, plant and equipment 9 10,504,096 10,341,993Intangible assets 9 1,309,429 1,363,690Deferred income tax assets 25 1,476,438 1,619,551Investments in associates and joint ventures 10 4,450,695 4,329,583Investment property 2,969 4,923Other non-current assets 739,570 788,582
19,182,634 19,203,006Total assets 38,503,464 35,528,064Liabilities
Current liabilities
Trade payables 5,31 7,404,914 5,691,114Borrowings 5,11,31 2,781,234 3,022,723Other payables 5,31 2,448,853 2,829,686Other financial liabilities 5,7,31 2,753 10,890Current income tax liabilities 60,345 74,131Provisions 13 684,578 663,701Other current liabilities 3,215,889 2,721,759
16,598,566 15,014,004Non-current liabilities
Borrowings 5,11,31 6,648,445 6,188,306Other payables 5,31 17,162 27,670Other financial liabilities 5,7,31 63,248 10,663Deferred income tax liabilities 25 7,021 7,651Net defined benefit liability 12 928,520 580,919Provisions 13 974,579 998,795Other non-current liabilities 10,332 10,687
8,649,307 7,824,691Total liabilities 25,247,873 22,838,695Equity attributable to owners of the Parent Company
Paid-in capital: 14
Capital stock 904,169 904,169
Share premium 3,088,179 3,088,179
Retained earnings 15 9,380,546 8,885,523Accumulated other comprehensive loss 16 (1,172,307) (907,440)Other components of equity 17 (210,249) (231,229)
11,990,338 11,739,202Non-controlling interests 1,265,253 950,167Total equity 13,255,591 12,689,369Total liabilities and equity 38,503,464 35,528,064
September 30, 2014 December 31, 2013
The accompanying notes are an integral part of these interim consolidated financial statements.
3
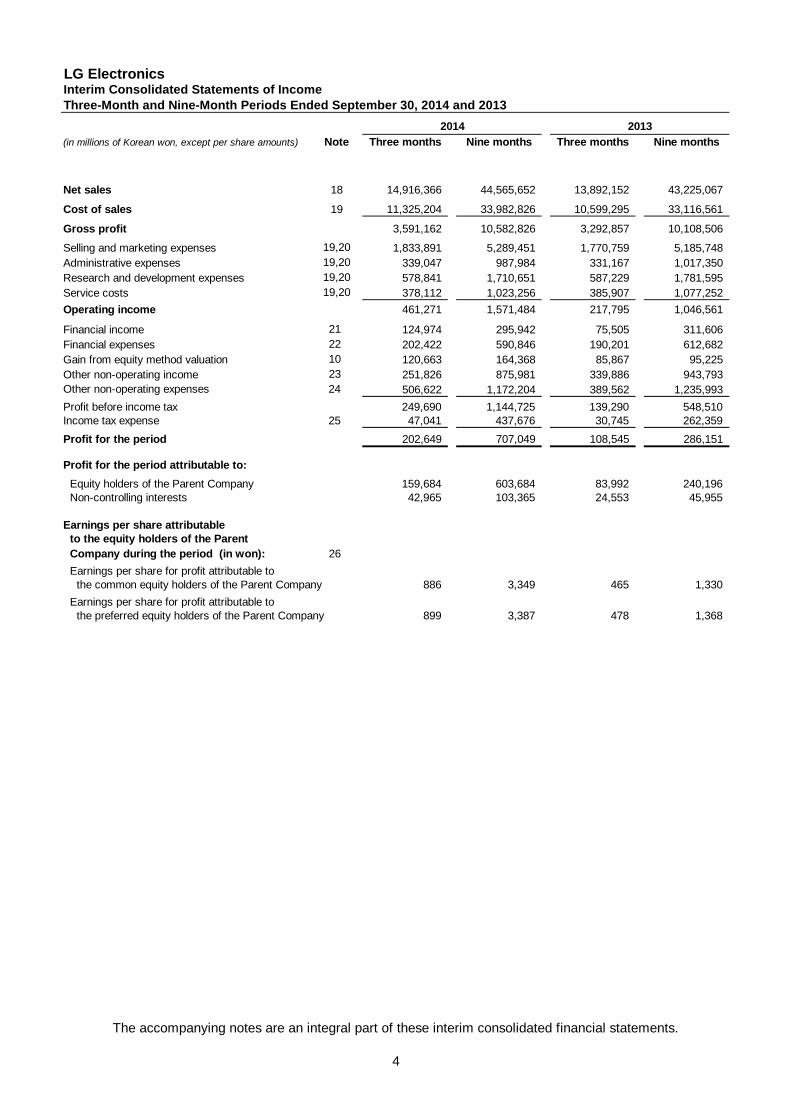
LG ElectronicsInterim Consolidated Statements of Income
Three-Month and Nine-Month Periods Ended September 30, 2014 and 2013
Note Three months Nine months Three months Nine months
Net sales 18 14,916,366 44,565,652 13,892,152 43,225,067
Cost of sales 19 11,325,204 33,982,826 10,599,295 33,116,561
Gross profit 3,591,162 10,582,826 3,292,857 10,108,506
Selling and marketing expenses 19,20 1,833,891 5,289,451 1,770,759 5,185,748
Administrative expenses 19,20 339,047 987,984 331,167 1,017,350
Research and development expenses 19,20 578,841 1,710,651 587,229 1,781,595
Service costs 19,20 378,112 1,023,256 385,907 1,077,252
Operating income 461,271 1,571,484 217,795 1,046,561
Financial income 21 124,974 295,942 75,505 311,606
Financial expenses 22 202,422 590,846 190,201 612,682
Gain from equity method valuation 10 120,663 164,368 85,867 95,225
Other non-operating income 23 251,826 875,981 339,886 943,793
Other non-operating expenses 24 506,622 1,172,204 389,562 1,235,993
Profit before income tax 249,690 1,144,725 139,290 548,510Income tax expense 25 47,041 437,676 30,745 262,359
Profit for the period 202,649 707,049 108,545 286,151
Profit for the period attributable to:
Equity holders of the Parent Company 159,684 603,684 83,992 240,196Non-controlling interests 42,965 103,365 24,553 45,955
Earnings per share attributableto the equity holders of the Parent
Company during the period (in won): 26
Earnings per share for profit attributable tothe common equity holders of the Parent Company 886 3,349 465 1,330
Earnings per share for profit attributable tothe preferred equity holders of the Parent Company 899 3,387 478 1,368
(in millions of Korean won, except per share amounts)
20132014
The accompanying notes are an integral part of these interim consolidated financial statements.
4

LG ElectronicsInterim Consolidated Statements of Comprehensive Income
Three-Month and Nine-Month Periods Ended September 30, 2014 and 2013
Note Three months Nine months Three months Nine months
Profit for the period 202,649 707,049 108,545 286,151
Other comprehensive income(loss), net of tax
Items that will not be reclassified subsequently to profit or loss:
Remeasurements of the net defined benefit liability 12 (47,700) (76,841) 2,045 14,881
Share of remeasurements for the net defined benefit liability of associates 10 (101) (1,054) (29) 82
Items that will be reclassified subsequently to profit or loss:
Share of other comprehensive income or loss(excluding
remeasurements) of associates and joint ventures10 42,646 (32,620) (66,705) (3,314)
Cash flow hedges 31 (11,884) (25,851) 11,597 7,404
Available-for-sale financial assets 7 (512) (1,216) 93 2,773
Currency translation differences 13,739 (215,566) (352,524) (107,997)
Other comprehensive loss for the period, net of tax (3,812) (353,148) (405,523) (86,171)
Total comprehensive income(loss) for the period, net of tax 198,837 353,901 (296,978) 199,980
Comprehensive income(loss) for the period, net of tax,attributable to:
Equity holders of the Parent Company 140,822 267,028 (295,161) 146,437Non-controlling interests 58,015 86,873 (1,817) 53,543
Total comprehensive income(loss) for the period, net of tax 198,837 353,901 (296,978) 199,980
(in millions of Korean won)
2014 2013
The accompanying notes are an integral part of these interim consolidated financial statements.
5
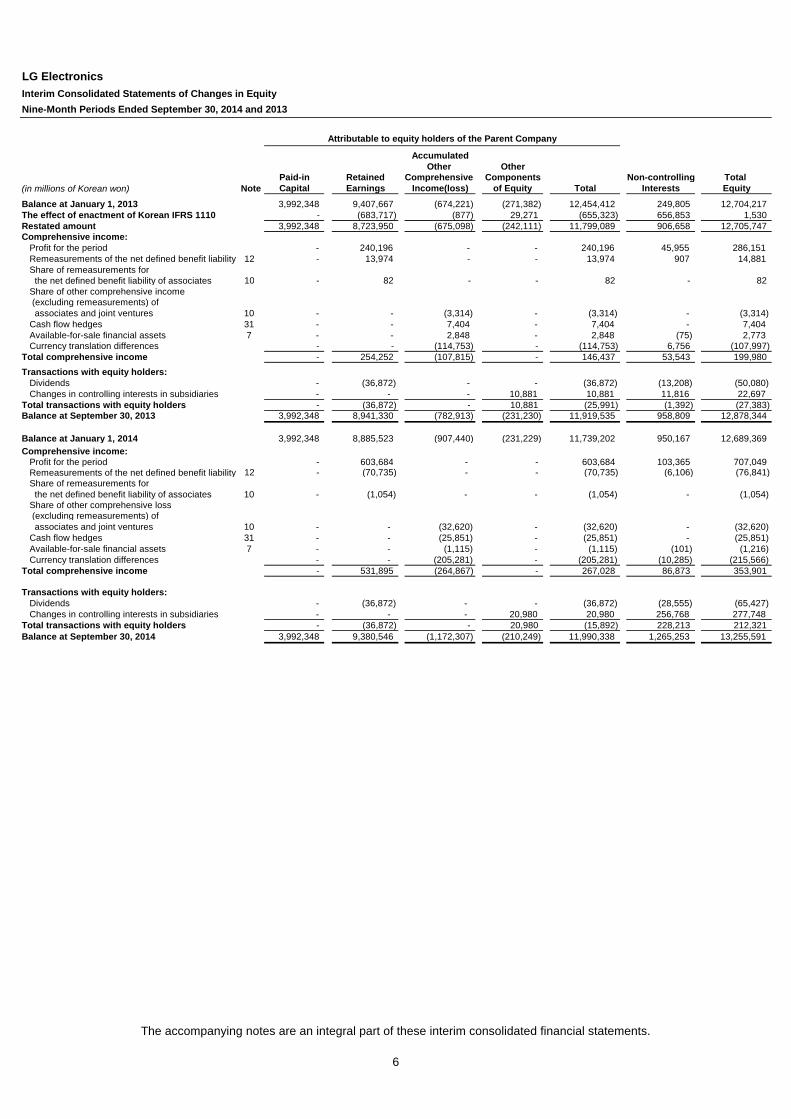
LG Electronics
Interim Consolidated Statements of Changes in Equity
Nine-Month Periods Ended September 30, 2014 and 2013
(in millions of Korean won) Note
Balance at January 1, 2013 3,992,348 9,407,667 (674,221) (271,382) 12,454,412 249,805 12,704,217The effect of enactment of Korean IFRS 1110 - (683,717) (877) 29,271 (655,323) 656,853 1,530Restated amount 3,992,348 8,723,950 (675,098) (242,111) 11,799,089 906,658 12,705,747Comprehensive income:
Profit for the period - 240,196 - - 240,196 45,955 286,151Remeasurements of the net defined benefit liability 12 - 13,974 - - 13,974 907 14,881Share of remeasurements for
the net defined benefit liability of associates 10 - 82 - - 82 - 82Share of other comprehensive income(excluding remeasurements) ofassociates and joint ventures 10 - - (3,314) - (3,314) - (3,314)
Cash flow hedges 31 - - 7,404 - 7,404 - 7,404Available-for-sale financial assets 7 - - 2,848 - 2,848 (75) 2,773Currency translation differences - - (114,753) - (114,753) 6,756 (107,997)
Total comprehensive income - 254,252 (107,815) - 146,437 53,543 199,980
Transactions with equity holders:Dividends - (36,872) - - (36,872) (13,208) (50,080)Changes in controlling interests in subsidiaries - - - 10,881 10,881 11,816 22,697
Total transactions with equity holders - (36,872) - 10,881 (25,991) (1,392) (27,383)Balance at September 30, 2013 3,992,348 8,941,330 (782,913) (231,230) 11,919,535 958,809 12,878,344
Balance at January 1, 2014 3,992,348 8,885,523 (907,440) (231,229) 11,739,202 950,167 12,689,369
Comprehensive income:Profit for the period - 603,684 - - 603,684 103,365 707,049Remeasurements of the net defined benefit liability 12 - (70,735) - - (70,735) (6,106) (76,841)Share of remeasurements for
the net defined benefit liability of associates 10 - (1,054) - - (1,054) - (1,054)Share of other comprehensive loss(excluding remeasurements) ofassociates and joint ventures 10 - - (32,620) - (32,620) - (32,620)
Cash flow hedges 31 - - (25,851) - (25,851) - (25,851)Available-for-sale financial assets 7 - - (1,115) - (1,115) (101) (1,216)Currency translation differences - - (205,281) - (205,281) (10,285) (215,566)
Total comprehensive income - 531,895 (264,867) - 267,028 86,873 353,901
Transactions with equity holders:Dividends - (36,872) - - (36,872) (28,555) (65,427)Changes in controlling interests in subsidiaries - - - 20,980 20,980 256,768 277,748
Total transactions with equity holders - (36,872) - 20,980 (15,892) 228,213 212,321Balance at September 30, 2014 3,992,348 9,380,546 (1,172,307) (210,249) 11,990,338 1,265,253 13,255,591
Non-controllingInterests
TotalEquity
Attributable to equity holders of the Parent Company
Accumulated
ComponentsTotalEarnings
Other
Income(loss)Comprehensive
Other
Capital of EquityPaid-in Retained
The accompanying notes are an integral part of these interim consolidated financial statements.
6

LG ElectronicsInterim Consolidated Statements of Cash FlowsNine-Month Periods Ended September 30, 2014 and 2013
(in millions of Korean won) Note
Cash flows from operating activitiesCash generated from operations 27 2,323,091 2,104,005Interest received 57,343 55,751Interest paid (330,477) (284,543)Dividend received 17,359 10,577Income tax paid (391,784) (331,583)
Net cash generated from operating activities 1,675,532 1,554,207
Cash flows from investing activitiesDecrease in financial deposits 31,467 14,040Decrease in loans and other receivables 161,153 177,832Proceeds from redemption and disposal of other financial assets 31,917 81,383Proceeds from disposal of property, plant and equipment 82,887 50,400Proceeds from disposal of intangible assets 16,687 2,824Proceeds from redemption and disposal of investments
in associates and joint ventures 680 -Decrease in others 3,948 16,277Increase in financial deposits (17,715) (22,569)Increase in loans and other receivables (125,203) (147,095)Acquisition of other financial assets (38,307) (17,734)Acquisition of property, plant and equipment (1,580,895) (1,622,076)Acquisition of intangible assets (330,115) (310,045)Acquisition of investments in associates and joint ventures (7,782) (46,628)Decrease in cash and cash equivalents due to changes in scope of
subsidiaries - (3,822)Increase in others (414) (75)
Net cash used in investing activities (1,771,692) (1,827,288)
Cash flows from financing activitiesProceeds from borrowings 5,100,944 3,005,224Repayments of borrowings (4,536,014) (2,516,446)Dividends paid (65,621) (50,131)
Net cash provided by financing activities 499,309 438,647
Exchange losses on cash and cash equivalents (98,710) (11,458)
Net increase in cash and cash equivalents 304,439 154,108Cash and cash equivalents at the beginning of period 2,645,270 2,185,000Cash and cash equivalents at the end of period 2,949,709 2,339,108
20132014Nine-Month Period Ended September 30
The accompanying notes are an integral part of these interim consolidated financial statements.
7

LG ElectronicsNotes to the Interim Consolidated Financial StatementsSeptember 30, 2014 and 2013, and December 31, 2013
8
1. General Information
LG Electronics Inc.(the Parent Company) was spun off from LG Electronics Investment Ltd. on
April 1, 2002. The Parent Company’s shares are listed on the Korea Exchange, and some of its
preferred shares, in form of global depositary receipts (“DRs”), are listed on the London Stock
Exchange as of the reporting date. The Parent Company is domiciled in Korea at Yeoui-daero,
Yeungdeungpo-gu, Seoul.
As of September 30, 2014, LG Corp. owns 33.7% of the Parent Company’s total shares, excluding
preferred shares, while financial institutions, foreign investors and others own the rest.
The Group is engaged in the manufacture and sale of electronic products including mobile phones,
TV, air conditioners, refrigerators, washing machines, personal computers and their core parts. As
of September 30, 2014, the Group operates six business segments and other supporting segments
through the Parent Company and subsidiaries all over the world. The Parent Company as of
September 30, 2014, has 141 subsidiaries and its consolidated subsidiaries as of September 30,
2014, are as follows:

LG ElectronicsNotes to the Interim Consolidated Financial StatementsSeptember 30, 2014 and 2013, and December 31, 2013
9
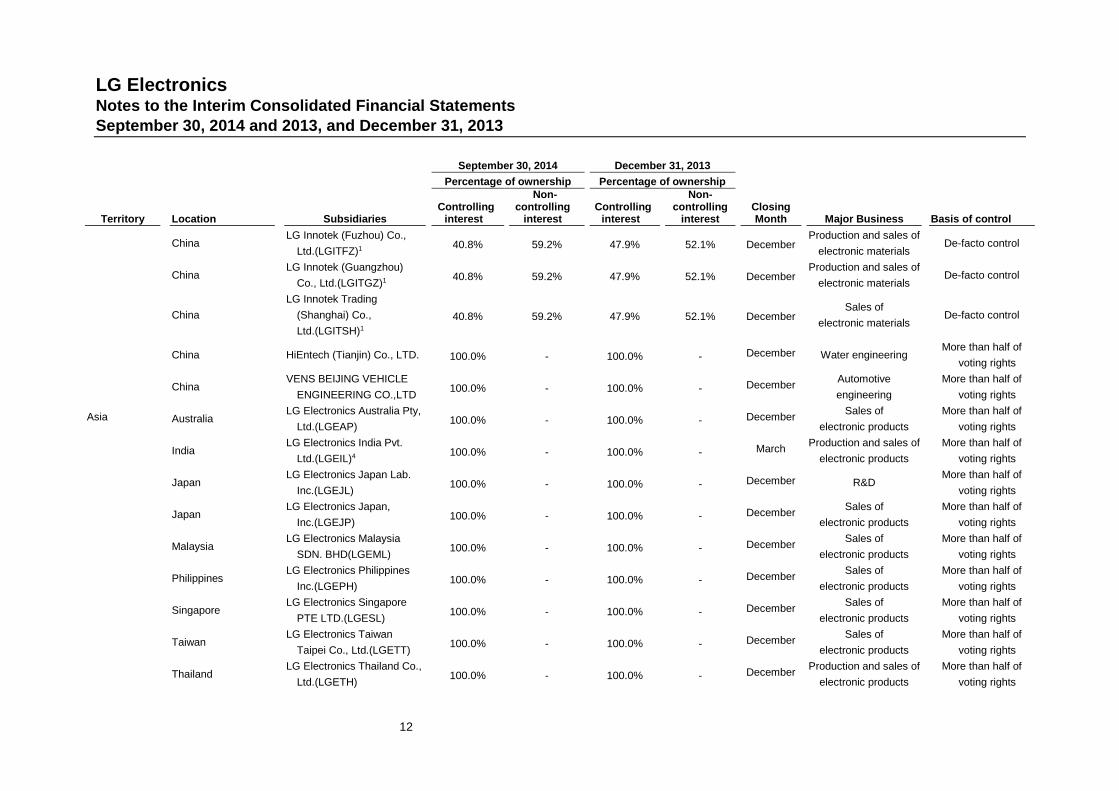
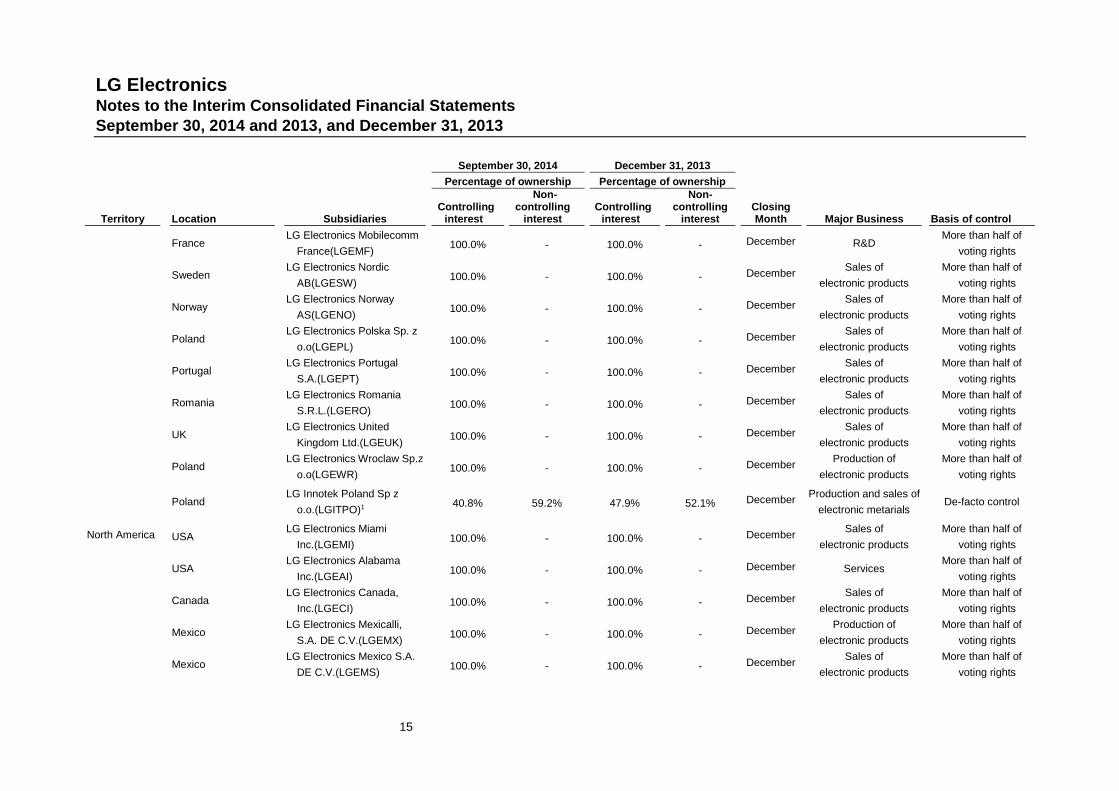
(a) Consolidated subsidiaries as of September 30, 2014 and December 31, 2013, are as follows:
September 30, 2014 December 31, 2013
Percentage of ownership Percentage of ownership
Territory Location SubsidiariesControlling
interest
Non-controlling
interestControlling
interest
Non-controlling
interestClosingMonth Major Business Basis of control
The Republicof Korea
Korea Hiplaza Co., Ltd. 100.0% - 100.0% - DecemberWholesales and retails
of electronic products
More than half of
voting rights
KoreaHi Business Logistics Co.,
Ltd.100.0% - 100.0% - December Services of logistics
More than half of
voting rights
Korea Hi Entech Co., Ltd. 100.0% - 100.0% - December Water engineeringMore than half of
voting rights
KoreaLG Hitachi Water Solution
Co., Ltd.51.0% 49.0% 51.0% 49.0% December Water treatment
More than half of
voting rights
Korea ACE R&A Co., Ltd. 100.0% - 100.0% - DecemberProduction and sales of
air conditioner
More than half of
voting rights
Korea Hi M Solutek 100.0% - 100.0% - December MaintenanceMore than half of
voting rights
Korea Hi Teleservice Co., Ltd. 100.0% - 100.0% - December Marketing servicesMore than half of
voting rights
Korea LGE Alliance Fund 96.2% 3.8% 96.2% 3.8% December InvestmentMore than half of
voting rights
Korea Innovation Investment Fund 83.3% 16.7% 83.3% 16.7% December InvestmentMore than half of
voting rights
Korea LG Innotek Co., Ltd.140.8% 59.2% 47.9% 52.1% December
Production and sales of
electronic materialsDe-facto control
Korea LG Innotek Alliance Fund140.4% 59.6% 47.4% 52.6% December Investment De-facto control
Korea Innowith Co., Ltd.140.8% 59.2% 47.9% 52.1% December Cleaning services De-facto control
Korea Hanuri Co., Ltd. 100.0% - 100.0% - December Cleaning servicesMore than half of
voting rights
LG ElectronicsNotes to the Interim Consolidated Financial StatementsSeptember 30, 2014 and 2013, and December 31, 2013
10
September 30, 2014 December 31, 2013
Percentage of ownership Percentage of ownership
Territory Location SubsidiariesControlling
interest
Non-controlling
interestControlling
interest
Non-controlling
interestClosingMonth Major Business Basis of control
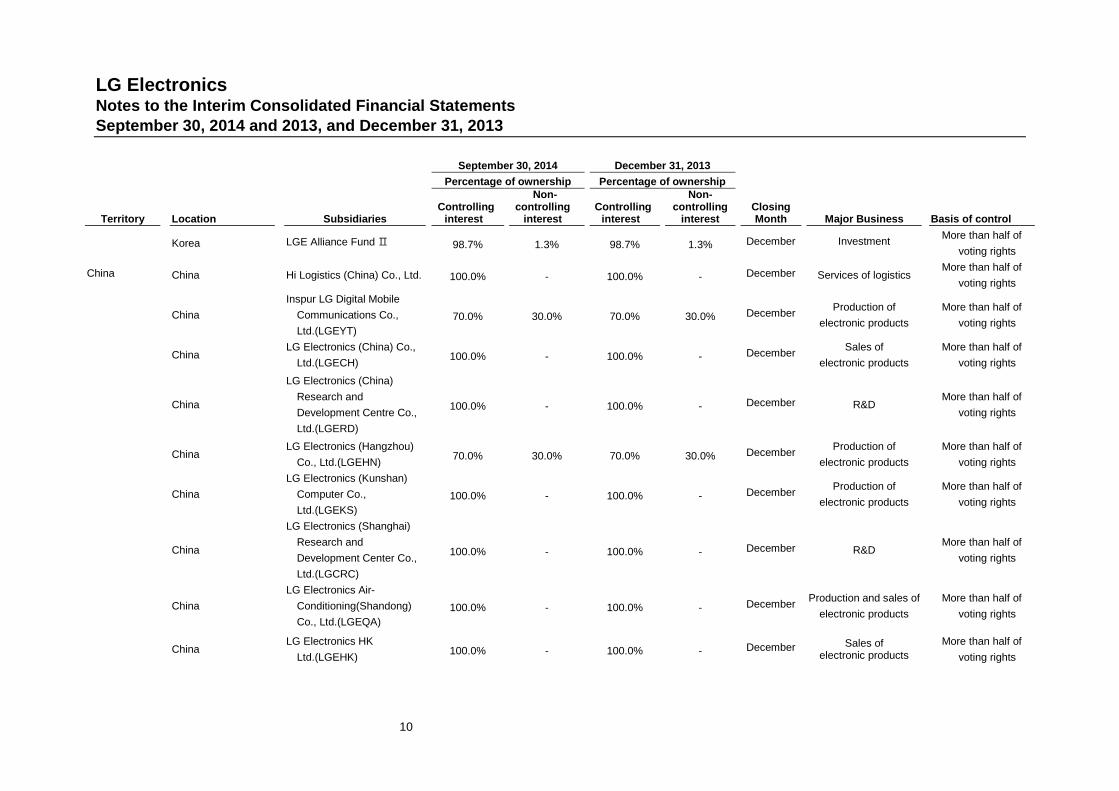
Korea LGE Alliance Fund Ⅱ 98.7% 1.3% 98.7% 1.3% December InvestmentMore than half of
voting rights
China China Hi Logistics (China) Co., Ltd. 100.0% - 100.0% - December Services of logisticsMore than half of
voting rights
China
Inspur LG Digital Mobile
Communications Co.,
Ltd.(LGEYT)
70.0% 30.0% 70.0% 30.0% DecemberProduction of
electronic products
More than half of
voting rights
ChinaLG Electronics (China) Co.,
Ltd.(LGECH)100.0% - 100.0% - December
Sales of
electronic products
More than half of
voting rights
China
LG Electronics (China)
Research and
Development Centre Co.,
Ltd.(LGERD)
100.0% - 100.0% - December R&DMore than half of
voting rights
ChinaLG Electronics (Hangzhou)
Co., Ltd.(LGEHN)70.0% 30.0% 70.0% 30.0% December
Production of
electronic products
More than half of
voting rights
China
LG Electronics (Kunshan)
Computer Co.,
Ltd.(LGEKS)
100.0% - 100.0% - DecemberProduction of
electronic products
More than half of
voting rights
China
LG Electronics (Shanghai)
Research and
Development Center Co.,
Ltd.(LGCRC)
100.0% - 100.0% - December R&DMore than half of
voting rights
China
LG Electronics Air-
Conditioning(Shandong)
Co., Ltd.(LGEQA)
100.0% - 100.0% - DecemberProduction and sales of
electronic products
More than half of
voting rights
ChinaLG Electronics HK
Ltd.(LGEHK)100.0% - 100.0% - December Sales of
electronic products
More than half of
voting rights

LG ElectronicsNotes to the Interim Consolidated Financial StatementsSeptember 30, 2014 and 2013, and December 31, 2013
11
September 30, 2014 December 31, 2013
Percentage of ownership Percentage of ownership
Territory Location SubsidiariesControlling
interest
Non-controlling
interestControlling
interest
Non-controlling
interestClosingMonth Major Business Basis of control
ChinaLG Electronics Huizhou
Ltd.(LGEHZ)80.0% 20.0% 80.0% 20.0% December
Production of
electronic products
More than half of
voting rights
ChinaLG Electronics Nanjing
Display Co., Ltd.(LGEND)70.0% 30.0% 70.0% 30.0% December
Production of
electronic products
More than half of
voting rights
ChinaLG Electronics Qinhuangdao
Inc.(LGEQH)100.0% - 100.0% - December Production of casting
More than half of
voting rights
ChinaLG Electronics Shenyang
Inc.(LGESY)78.9% 21.1% 78.9% 21.1% December
Production of
electronic products
More than half of
voting rights
China
LG Electronics Tianjin
Appliances Co.,
Ltd.(LGETA)
80.0% 20.0% 80.0% 20.0% DecemberProduction of
electronic products
More than half of
voting rights
China
NanJing LG-Panda
Appliances Co.,
Ltd.(LGEPN)
70.0% 30.0% 70.0% 30.0% DecemberProduction of
electronic products
More than half of
voting rights
China
Qingdao LG Inspur Digital
Communication Co.,
Ltd.(LGEQD)
70.0% 30.0% 70.0% 30.0% DecemberProduction of
electronic products
More than half of
voting rights
ChinaShanghai LG Electronics
Co., Ltd.(LGESH)70.0% 30.0% 70.0% 30.0% December
Production of
electronic products
More than half of
voting rights
China
Taizhou LG Electronics
Refrigeration Co.,
Ltd.(LGETR)
100.0% - 100.0% - DecemberProduction of
electronic products
More than half of
voting rights
ChinaTianjin Lijie Cartridge Heater
Co., Ltd.(LGETL)66.7% 33.3% 66.7% 33.3% December Production of heater
More than half of
voting rights
ChinaLG Innotek (Yantai) Co.,
Ltd.(LGITYT)1 40.8% 59.2% 47.9% 52.1% DecemberProduction and sales of
electronic materialsDe-facto control
ChinaLG Innotek (Huizhou) Co.,
Ltd.(LGITHZ)1 40.8% 59.2% 47.9% 52.1% DecemberProduction and sales of
electronic materialsDe-facto control
LG ElectronicsNotes to the Interim Consolidated Financial StatementsSeptember 30, 2014 and 2013, and December 31, 2013
12
September 30, 2014 December 31, 2013
Percentage of ownership Percentage of ownership
Territory Location SubsidiariesControlling
interest
Non-controlling
interestControlling
interest
Non-controlling
interestClosingMonth Major Business Basis of control
ChinaLG Innotek (Fuzhou) Co.,
Ltd.(LGITFZ)1 40.8% 59.2% 47.9% 52.1% DecemberProduction and sales of
electronic materialsDe-facto control
ChinaLG Innotek (Guangzhou)
Co., Ltd.(LGITGZ)1 40.8% 59.2% 47.9% 52.1% DecemberProduction and sales of
electronic materialsDe-facto control
China
LG Innotek Trading
(Shanghai) Co.,
Ltd.(LGITSH)1
40.8% 59.2% 47.9% 52.1% DecemberSales of
electronic materialsDe-facto control
China HiEntech (Tianjin) Co., LTD. 100.0% - 100.0% - December Water engineeringMore than half of
voting rights
ChinaVENS BEIJING VEHICLE
ENGINEERING CO.,LTD100.0% - 100.0% - December
Automotive
engineering
More than half of
voting rights
Asia AustraliaLG Electronics Australia Pty,
Ltd.(LGEAP)100.0% - 100.0% - December
Sales of
electronic products
More than half of
voting rights
IndiaLG Electronics India Pvt.
Ltd.(LGEIL)4 100.0% - 100.0% - MarchProduction and sales of
electronic products
More than half of
voting rights
JapanLG Electronics Japan Lab.
Inc.(LGEJL)100.0% - 100.0% - December R&D
More than half of
voting rights
JapanLG Electronics Japan,
Inc.(LGEJP)100.0% - 100.0% - December
Sales of
electronic products
More than half of
voting rights
MalaysiaLG Electronics Malaysia
SDN. BHD(LGEML)100.0% - 100.0% - December
Sales of
electronic products
More than half of
voting rights
PhilippinesLG Electronics Philippines
Inc.(LGEPH)100.0% - 100.0% - December
Sales of
electronic products
More than half of
voting rights
SingaporeLG Electronics Singapore
PTE LTD.(LGESL)100.0% - 100.0% - December
Sales of
electronic products
More than half of
voting rights
TaiwanLG Electronics Taiwan
Taipei Co., Ltd.(LGETT)100.0% - 100.0% - December
Sales of
electronic products
More than half of
voting rights
ThailandLG Electronics Thailand Co.,
Ltd.(LGETH)100.0% - 100.0% - December
Production and sales of
electronic products
More than half of
voting rights

LG ElectronicsNotes to the Interim Consolidated Financial StatementsSeptember 30, 2014 and 2013, and December 31, 2013
13
September 30, 2014 December 31, 2013
Percentage of ownership Percentage of ownership
Territory Location SubsidiariesControlling
interest
Non-controlling
interestControlling
interest
Non-controlling
interestClosingMonth Major Business Basis of control
VietnamLG Electronics Vietnam Co.,
Ltd.(LGEVN)100.0% - 100.0% - December
Production and sales of
electronic products
More than half of
voting rights
IndiaLG Soft India Private
Limited.(LGSI)4 100.0% - 100.0% - March R&DMore than half of
voting rights
IndonesiaP.T. LG Electronics
Indonesia(LGEIN)100.0% 0.0% 100.0% - December
Production and sales of
electronic products
More than half of
voting rights
Philippines LG Electronics Pasig Inc.338.0% 62.0% 38.0% 62.0% December Real estates De-facto control
IndiaHi Logistics India Private
Limited4 100.0% - 100.0% - March Services of logisticsMore than half of
voting rights
MalaysiaHI LOGISTICS MALAYSIA
SDN BHD100.0% - 100.0% - December Services of logistics
More than half of
voting rights
IndonesiaPT LG Innotek
Indonesia(LGITIN)1 40.8% 59.2% 47.9% 52.1% DecemberProduction and sales of
electronic materials De-facto control
TaiwanLG Innotek (Taiwan)
Ltd.(LGITTW)1 40.8% 59.2% 47.9% 52.1% DecemberSales of
electronic materialsDe-facto control
Malaysia V-ENS (M) Sdn. Bhd. 100.0% - 100.0% - DecemberAutomotive
engineering
More than half of
voting rights
Vietnam
LG Electronics Vietnam
Haiphong Co.,
Ltd.(LGEVH)
100.0% - 100.0% - DecemberProduction of
electronic products
More than half of
voting rights
IndonesiaPT.LG Electronics Service
Indonesia(LGEID)99.8% 0.2% - - December Services
More than half of
voting rights
VietnamHi Logistics Vietnam Co.,
LTD.100.0% - - - December Services of logistics
More than half of
voting rights

LG ElectronicsNotes to the Interim Consolidated Financial StatementsSeptember 30, 2014 and 2013, and December 31, 2013
14
September 30, 2014 December 31, 2013
Percentage of ownership Percentage of ownership
Territory Location SubsidiariesControlling
interest
Non-controlling
interestControlling
interest
Non-controlling
interestClosingMonth Major Business Basis of control
Europe Netherlands Hi Logistics Europe B.V. 100.0% - 100.0% - December Services of logisticsMore than half of
voting rights
AustriaLG Electronics Austria
GmbH(LGEAG)100.0% - 100.0% - December
Sales of
electronic products
More than half of
voting rights
NetherlandsLG Electronics Benelux
Sales B.V.(LGEBN)100.0% - 100.0% - December
Sales of
electronic products
More than half of
voting rights
Czech RepublicLG Electronics CZ,
s.r.o.(LGECZ)100.0% - 100.0% - December
Sales of
electronic products
More than half of
voting rights
GermanyLG Electronics Deutschland
GmbH(LGEDG)100.0% - 100.0% - December
Sales of
electronic products
More than half of
voting rights
SpainLG Electronics Espana
S.A.(LGEES)100.0% - 100.0% - December
Sales of
electronic products
More than half of
voting rights
NetherlandsLG Electronics European
Holdings B.V.(LGEEH)100.0% - 100.0% - December European holding
More than half of
voting rights
Netherlands
LG Electronics European
Shared Service Center
B.V.(LGESC)
100.0% - 100.0% - December ServicesMore than half of
voting rights
FranceLG Electronics France
S.A.S.(LGEFS)100.0% - 100.0% - December
Sales of
electronic products
More than half of
voting rights
GreeceLG Electronics Hellas
S.A.(LGEHS)100.0% - 100.0% - December
Sales of
electronic products
More than half of
voting rights
ItalyLG Electronics Italia
S.p.A(LGEIS)100.0% - 100.0% - December
Sales of
electronic products
More than half of
voting rights
LatviaLG Electronics Latvia,
LLC(LGELA)100.0% - 100.0% - December
Sales of
electronic products
More than half of
voting rights
HungaryLG Electronics Magyar
KFT(LGEMK)100.0% - 100.0% - December
Sales of
electronic products
More than half of
voting rights
PolandLG Electronics Mlawa Sp. z
o.o(LGEMA)100.0% - 100.0% - December
Production of
electronic products
More than half of
voting rights
LG ElectronicsNotes to the Interim Consolidated Financial StatementsSeptember 30, 2014 and 2013, and December 31, 2013
15
September 30, 2014 December 31, 2013
Percentage of ownership Percentage of ownership
Territory Location SubsidiariesControlling
interest
Non-controlling
interestControlling
interest
Non-controlling
interestClosingMonth Major Business Basis of control
FranceLG Electronics Mobilecomm
France(LGEMF)100.0% - 100.0% - December R&D
More than half of
voting rights
SwedenLG Electronics Nordic
AB(LGESW)100.0% - 100.0% - December
Sales of
electronic products
More than half of
voting rights
NorwayLG Electronics Norway
AS(LGENO)100.0% - 100.0% - December
Sales of
electronic products
More than half of
voting rights
PolandLG Electronics Polska Sp. z
o.o(LGEPL)100.0% - 100.0% - December
Sales of
electronic products
More than half of
voting rights
PortugalLG Electronics Portugal
S.A.(LGEPT)100.0% - 100.0% - December
Sales of
electronic products
More than half of
voting rights
RomaniaLG Electronics Romania
S.R.L.(LGERO)100.0% - 100.0% - December
Sales of
electronic products
More than half of
voting rights
UKLG Electronics United
Kingdom Ltd.(LGEUK)100.0% - 100.0% - December
Sales of
electronic products
More than half of
voting rights
PolandLG Electronics Wroclaw Sp.z
o.o(LGEWR)100.0% - 100.0% - December
Production of
electronic products
More than half of
voting rights
PolandLG Innotek Poland Sp z
o.o.(LGITPO)1 40.8% 59.2% 47.9% 52.1% DecemberProduction and sales of
electronic metarialsDe-facto control
North America USALG Electronics Miami
Inc.(LGEMI)100.0% - 100.0% - December
Sales of
electronic products
More than half of
voting rights
USALG Electronics Alabama
Inc.(LGEAI)100.0% - 100.0% - December Services
More than half of
voting rights
CanadaLG Electronics Canada,
Inc.(LGECI)100.0% - 100.0% - December
Sales of
electronic products
More than half of
voting rights
MexicoLG Electronics Mexicalli,
S.A. DE C.V.(LGEMX)100.0% - 100.0% - December
Production of
electronic products
More than half of
voting rights
MexicoLG Electronics Mexico S.A.
DE C.V.(LGEMS)100.0% - 100.0% - December
Sales of
electronic products
More than half of
voting rights

LG ElectronicsNotes to the Interim Consolidated Financial StatementsSeptember 30, 2014 and 2013, and December 31, 2013
16
September 30, 2014 December 31, 2013
Percentage of ownership Percentage of ownership
Territory Location SubsidiariesControlling
interest
Non-controlling
interestControlling
interest
Non-controlling
interestClosingMonth Major Business Basis of control
USA
LG Electronics Mobile
Research U.S.A.,
L.L.C.(LGEMR)
100.0% - 100.0% - December R&DMore than half of
voting rights
USALG Electronics Mobilecomm
U.S.A., Inc.(LGEMU)100.0% - 100.0% - December
Sales of
electronic products
More than half of
voting rights
Mexico
LG Electronics Monterrey
Mexico S.A.de
C.V.(LGEMM)
100.0% - 100.0% - DecemberProduction of
electronic products
More than half of
voting rights
MexicoLG Electronics Reynosa S.A.
DE C.V.(LGERS)100.0% - 100.0% - December
Production of
electronic products
More than half of
voting rights
USALG Electronics U.S.A.,
Inc.(LGEUS)100.0% - 100.0% - December
Sales of
electronic products
More than half of
voting rights
MexicoServicios Integrales LG S.A
DE C.V100.0% - 100.0% - December Services
More than half of
voting rights
MexicoServicios LG Monterrey
Mexico S.A. de C.V.100.0% - 100.0% - December Services
More than half of
voting rights
USA
Zenith Electronics
Corporation of
Pennsylvania
100.0% - 100.0% - DecemberProduction of
electronic products
More than half of
voting rights
USAZenith Electronics
Corporation(Zenith)100.0% - 100.0% - December R&D
More than half of
voting rights
USALG Innotek USA,
Inc.(LGITUS)1 40.8% 59.2% 47.9% 52.1% DecemberSales of
electronic productsDe-facto control
MexicoHILOGISTICS MEXICO SA
DE CV100.0% - 100.0% - December Services of logistics
More than half of
voting rights
Mexico HiLogistics Reynosa 100.0% - 100.0% - December Services of logisticsMore than half of
voting rights

LG ElectronicsNotes to the Interim Consolidated Financial StatementsSeptember 30, 2014 and 2013, and December 31, 2013
17
September 30, 2014 December 31, 2013
Percentage of ownership Percentage of ownership
Territory Location SubsidiariesControlling
interest
Non-controlling
interestControlling
interest
Non-controlling
interestClosingMonth Major Business Basis of control
USA HiLogistics USA 100.0% - 100.0% - December Services of logisticsMore than half of
voting rights
MexicoLG Innotek Mexico SA DE
CV(LGITMX)1 40.8% 59.2% 47.9% 52.1% DecemberProduction and sales of
automotive materialsDe-facto control
South America Brazil LG Armagem Geral Ltda. 100.0% - 100.0% - December ServicesMore than half of
voting rights
ArgentinaLG Electronics Argentina
S.A.(LGEAR)100.0% - 100.0% - December
Sales of
electronic products
More than half of
voting rights
ColombiaLG Electronics Colombia
Ltda.(LGECB)100.0% - 100.0% - December
Sales of
electronic products
More than half of
voting rights
BrazilLG Electronics do Brasil
Ltda.(LGEBR)100.0% - 100.0% - December
Production and sales of
electronic products
More than half of
voting rights
HondurasLG Electronics Honduras
S.de R.L.2 20.0% 80.0% 20.0% 80.0% DecemberSales of
electronic productsDe-facto control
ChileLG Electronics Inc Chile
Ltda.(LGECL)100.0% - 100.0% - December
Sales of
electronic products
More than half of
voting rights
PanamaLG Electronics Panama,
S.A.(LGEPS)100.0% - 100.0% - December
Sales of
electronic products
More than half of
voting rights
PeruLG Electronics Peru
S.A.(LGEPR)100.0% - 100.0% - December
Sales of
electronic products
More than half of
voting rights
VenezuelaLG Electronics Venezuela
S.A.(LGEVZ)100.0% - 100.0% -
December Sales of
electronic products
More than half of
voting rights
Brazil SOCIO VIP Ltda. 100.0% - 100.0% -December Services
More than half of
voting rights
Panama C&S America Solutions 100.0% - 100.0% -December Services
More than half of
voting rights
Panama LG Consulting Corp. 100.0% - 100.0% -December Services
More than half of
voting rights

LG ElectronicsNotes to the Interim Consolidated Financial StatementsSeptember 30, 2014 and 2013, and December 31, 2013
18
September 30, 2014 December 31, 2013
Percentage of ownership Percentage of ownership
Territory Location SubsidiariesControlling
interest
Non-controlling
interestControlling
interest
Non-controlling
interestClosingMonth Major Business Basis of control
GuatemalaLG Electronics Guatemala
S.A.100.0% - 100.0% - December
Sales of
electronic products
More than half of
voting rights
Middle Eastand Africa Nigeria
Easytec Global Services
Innovation Limited100.0% - 100.0% - December Services
More than half of
voting rights
AngolaLG Electronics Angola
Limitada(LGEAO)100.0% - 100.0% - December
Sales and services of
electronic products
More than half of
voting rights
JordanLG Electronics (Levant)
Jordan(LGELF)100.0% - 100.0% - December
Sales of
electronic products
More than half of
voting rights
UAELG Electronics Africa
Logistics FZE(LGEAF)100.0% - 100.0% - December
Sales of
electronic products
More than half of
voting rights
AlgeriaLG Electronics Algeria
SARL(LGEAS)70.0% 30.0% 70.0% 30.0% December
Sales of
electronic products
More than half of
voting rights
UAELG Electronics Dubai
FZE(LGEDF)100.0% - 100.0% - December
Sales of
electronic products
More than half of
voting rights
EgyptLG Electronics Egypt
S.A.E(LGEEG)100.0% - 100.0% - December
Production and sales of
electronic products
More than half of
voting rights
UAELG Electronics Gulf
FZE(LGEGF)100.0% - 100.0% - December
Sales of
electronic products
More than half of
voting rights
UAELG Electronics Middle East
Co., Ltd.(LGEME)100.0% - 100.0% - December Services
More than half of
voting rights
MoroccoLG Electronics Morocco
S.A.R.L(LGEMC)100.0% - 100.0% - December
Sales of
electronic products
More than half of
voting rights
NigeriaLG Electronics Nigeria
Limited(LGENI)100.0% - 100.0% - December
Sales of
electronic products
More than half of
voting rights
TunisiaLG Electronics North Africa
Service Company S.A.R.L100.0% - 100.0% - December
Sales of
electronic products
More than half of
voting rights
UAELG Electronics Overseas
Trading FZE(LGEOT)100.0% - 100.0% - December
Sales of
electronic products
More than half of
voting rights

LG ElectronicsNotes to the Interim Consolidated Financial StatementsSeptember 30, 2014 and 2013, and December 31, 2013
19
September 30, 2014 December 31, 2013
Percentage of ownership Percentage of ownership
Territory Location SubsidiariesControlling
interest
Non-controlling
interestControlling
interest
Non-controlling
interestClosingMonth Major Business Basis of control
South AfricaLG Electronics S.A. (Pty)
Ltd.(LGESA)100.0% - 100.0% - December
Production and sales of
electronic products
More than half of
voting rights
TurkeyLG Electronics Ticaret
A.S.(LGETK)100.0% - 100.0% - December
Sales of
electronic products
More than half of
voting rights
Saudi ArabiaLG-Shaker Co.,
Ltd.(LGESR)51.0% 49.0% 49.0% 51.0% December
Production of electronic
products
More than half of
voting rights
KenyaLG Electronics Service
Kenya Limited(LGESK)100.0% - 100.0% - December Services
More than half of
voting rights
Saudi ArabiaLG Electronics Saudi Arabia
Limited100.0% - 100.0% - December Services
More than half of
voting rights
UAE Hi Logistics Middle East FZE 100.0% - 100.0% - December Services of logisticsMore than half of
voting rights
Egypt Hi Logistics Egypt 100.0% - - - December Services of logisticsMore than half of
voting rights
Other Russia LG Alina Electronics(LGERI) 95.0% 5.0% 95.0% 5.0% December ServicesMore than half of
voting rights
RussiaHI LOGISTICS RUS Limited
Liability Company100.0% - - - December Services of logistics
More than half of
voting rights
KazakhstanLG Electronics Almaty
Kazakhstan(LGEAK)100.0% - 100.0% - December
Production and sales of
electronic products
More than half of
voting rights
RussiaLG Electronics RUS,
LLC(LGERA)100.0% - 100.0% - December
Production and sales of
electronic products
More than half of
voting rights
UkraineLG Electronics Ukraine
Inc.(LGEUR)100.0% - 100.0% - December
Sales of
electronic products
More than half of
voting rights
1 Although the Parent Company holds less than half of the voting rights of LG Innotek Co., Ltd. which is an intermediate parent of its subsidiaries, the Parent
Company is deemed to have control over LG Innotek Co., Ltd. when considering the size and dispersion of holdings of the other vote holders and the voting
patterns at previous shareholders’ meetings (Note 3).
2 Control exists as there is power over more than half of the voting rights by virtue of an agreement with other investors although the Parent Company holds less

LG ElectronicsNotes to the Interim Consolidated Financial StatementsSeptember 30, 2014 and 2013, and December 31, 2013
20
than half of the voting power.
3 Although the Parent Company holds less than half of the voting rights, the Group is deemed to have control as the Parent Company has the substantial power
to direct the relevant activities and is exposed to variable returns.
4 In the preparation of consolidated financial statements, the financial statements for the nine-month period ended September 30, 2014, were used for those
subsidiaries with different fiscal year ends.
(b) Financial information of major subsidiaries as of September 30, 2014 and December 31, 2013, and for the three-month and nine-month periods ended
September 30, 2014 and 2013, is as follows (before elimination of intercompany transactions):
September 30, 2014 2014
Three months Nine months
(in millions of Korean won) Assets Liabilities Equity Sales Net Income (Loss) Sales Net Income (Loss)
LG Innotek Co., Ltd. 4,243,919 2,708,186 1,535,733 1,502,712 54,673 4,148,626 45,894
LG Electronics do Brasil Ltda.(LGEBR) 1,751,629 1,343,874 407,755 875,291 (566) 2,733,890 53,877
LG Electronics U.S.A., Inc.(LGEUS) 2,161,304 1,899,248 262,056 1,473,180 (14,895) 4,356,798 (5,567)
Zenith Electronics Corporation(Zenith) 1,010,582 39,520 971,062 34,241 4,483 108,558 15,197
LG Electronics European Shared Service Center B.V.(LGESC) 1,008,404 978,272 30,132 54,142 (592) 164,135 6,295
LG Electronics RUS, LLC(LGERA) 1,060,363 612,822 447,541 662,589 23,087 1,911,096 105,109
LG Electronics (China) Co. Ltd.(LGECH) 871,833 846,825 25,008 427,335 (184) 1,100,373 2,106
LG Electronics Tianjin Appliances Co., Ltd.(LGETA) 570,983 320,151 250,832 219,764 (2,652) 923,675 15,676
LG Electronics Mobilecomm U.S.A., Inc.(LGEMU) 1,092,488 1,013,683 78,805 1,778,862 (9,406) 4,086,148 3,075
LG Electronics India Pvt. Ltd.(LGEIL) 609,874 329,667 280,207 514,665 22,475 1,711,727 120,075
Inspur LG Digital Mobile Communications Co., Ltd.(LGEYT) 804,403 693,997 110,406 937,976 14,268 2,420,857 34,818
LG Electronics Mlawa Sp. z o.o(LGEMA) 628,929 336,706 292,223 365,327 6,552 1,023,502 17,032
LG Electronics Reynosa S.A. DE C.V.(LGERS) 653,205 398,874 254,331 655,019 11,323 1,732,644 17,847
P.T. LG Electronics Indonesia(LGEIN) 529,415 297,021 232,394 401,819 11,647 1,229,783 21,250
LG Electronics Nanjing Display Co., Ltd.(LGEND) 429,049 303,527 125,522 325,291 4,547 1,115,541 23,017
LG Electronics Wroclaw Sp.z.o.o(LGEWR) 463,563 296,209 167,354 324,945 3,375 1,150,834 12,346

LG ElectronicsNotes to the Interim Consolidated Financial StatementsSeptember 30, 2014 and 2013, and December 31, 2013
21
September 30, 2014 2014
Three months Nine months
(in millions of Korean won) Assets Liabilities Equity Sales Net Income (Loss) Sales Net Income (Loss)
Hiplaza Co., Ltd. 474,451 335,194 139,257 385,613 (3,819) 1,120,263 (2,300)
LG Electronics Mexico S.A. DE C.V.(LGEMS) 565,935 479,732 86,203 394,643 7,924 1,203,623 16,559
Nanjing LG-Panda Appliances Co., Ltd.(LGEPN) 468,236 346,433 121,803 300,185 6,769 906,081 14,366
Taizhou LG Electronics Refrigeration Co., Ltd.(LGETR) 422,493 287,096 135,397 235,555 1,225 649,877 9,518
LG Electronics Monterrey Mexico S.A.de C.V.(LGEMM) 379,218 334,023 45,195 155,364 1,320 462,429 4,602
December 31, 2013 2013
Three months Nine months
(in millions of Korean won) Assets Liabilities Equity Sales Net Income (Loss) Sales Net Income (Loss)
LG Innotek Co., Ltd. 4,260,285 3,039,627 1,220,658 1,386,341 (8,009) 4,144,795 (15,588)
LG Electronics do Brasil Ltda.(LGEBR) 1,679,815 1,305,953 373,862 992,091 48,195 2,743,239 147,100
LG Electronics U.S.A., Inc.(LGEUS) 1,825,282 1,555,954 269,328 1,457,676 2,634 4,523,079 2,139
Zenith Electronics Corporation(Zenith) 995,877 35,986 959,891 45,616 7,662 117,019 29,050
LG Electronics European Shared Service Center B.V.(LGESC) 1,071,932 1,045,305 26,627 53,790 841 159,034 5,879
LG Electronics RUS, LLC(LGERA) 963,916 537,408 426,508 737,554 56,068 2,059,507 89,639
LG Electronics (China) Co. Ltd.(LGECH) 694,585 671,465 23,120 409,258 (6,715) 1,046,975 3,404
LG Electronics Tianjin Appliances Co., Ltd.(LGETA) 566,860 311,851 255,009 220,399 (4,730) 970,369 19,631
LG Electronics Mobilecomm U.S.A., Inc.(LGEMU) 581,012 504,592 76,420 924,372 (4,796) 2,860,049 (6,438)
LG Electronics India Pvt. Ltd.(LGEIL) 456,472 227,511 228,961 457,102 25,073 1,685,229 85,052
Inspur LG Digital Mobile Communications Co., Ltd.(LGEYT) 448,362 371,472 76,890 548,764 8,528 1,648,799 (14,073)
LG Electronics Mlawa Sp. z o.o(LGEMA) 540,236 236,240 303,996 266,120 1,879 917,611 17,701
LG Electronics Reynosa S.A. DE C.V.(LGERS) 392,973 154,526 238,447 552,081 (1,516) 1,539,361 (1,888)
P.T. LG Electronics Indonesia(LGEIN) 480,206 268,369 211,837 471,663 (8,123) 1,542,868 2,447
LG Electronics Nanjing Display Co., Ltd.(LGEND) 505,656 332,843 172,813 397,458 5,136 1,213,693 33,707

LG ElectronicsNotes to the Interim Consolidated Financial StatementsSeptember 30, 2014 and 2013, and December 31, 2013
22
December 31, 2013 2013
Three months Nine months
(in millions of Korean won) Assets Liabilities Equity Sales Net Income (Loss) Sales Net Income (Loss)
LG Electronics Wroclaw Sp.z.o.o(LGEWR) 500,773 329,144 171,629 372,113 9,307 1,285,376 18,049
Hiplaza Co., Ltd. 434,154 292,415 141,739 402,053 (466) 1,122,579 3,622
LG Electronics Mexico S.A. DE C.V.(LGEMS) 409,158 336,857 72,301 322,509 15,906 1,087,053 6,041
Nanjing LG-Panda Appliances Co., Ltd.(LGEPN) 404,019 282,849 121,170 311,070 12,216 858,914 29,402
Taizhou LG Electronics Refrigeration Co., Ltd.(LGETR) 357,812 229,260 128,552 206,958 264 603,428 16,351
LG Electronics Monterrey Mexico S.A.de C.V.(LGEMM) 398,895 356,658 42,237 168,362 3,386 479,082 8,479

LG ElectronicsNotes to the Interim Consolidated Financial StatementsSeptember 30, 2014 and 2013, and December 31, 2013
23
(c) Information of non-controlling interests of subsidiaries and subsidiaries with material non-
controlling interests
i) Subsidiaries held at less than 100% of interest
Subsidiaries LocationControlling
interest
Non-controlling
interest
LG Innotek Co., Ltd. and its subsidiaries1 Korea 40.8% 59.2%
LG Hitachi Water Solution Co., Ltd. Korea 51.0% 49.0%
LGE Alliance Fund Korea 96.2% 3.8%
LGE Alliance FundⅡ Korea 98.7% 1.3%
Innovation Investment Fund Korea 83.3% 16.7%
Inspur LG Digital Mobile Communications Co.,
Ltd.(LGEYT)China 70.0% 30.0%
LG Electronics (Hangzhou) Co., Ltd.(LGEHN) China 70.0% 30.0%
LG Electronics Huizhou Ltd.(LGEHZ) China 80.0% 20.0%
LG Electronics Nanjing Display Co.,
Ltd.(LGEND)China 70.0% 30.0%
LG Electronics Shenyang Inc.(LGESY) China 78.9% 21.1%
LG Electronics Tianjin Appliances Co.,
Ltd.(LGETA)China 80.0% 20.0%
NanJing LG-Panda Appliances Co.,
Ltd.(LGEPN)China 70.0% 30.0%
Qingdao LG Inspur Digital Communication Co.,
Ltd.(LGEQD)China 70.0% 30.0%
Shanghai LG Electronics Co., Ltd.(LGESH) China 70.0% 30.0%
Tianjin Lijie cartridge heater Co., Ltd.(LGETL) China 66.7% 33.3%
LG Electronics Pasig Inc. Philippines 38.0% 62.0%
LG Electronics Honduras S.de R.L. Honduras 20.0% 80.0%
LG Electronics Algeria SARL(LGEAS) Algeria 70.0% 30.0%
LG-Shaker Co., Ltd.(LGESR) Saudi Arabia 51.0% 49.0%
LG Alina Electronics(LGERI) Russia 95.0% 5.0%
P.T. LG Electronics Indonesia(LGEIN)2 Indonesia 100.0% 0.0%
PT.LG Electronics Service Indonesia(LGEID) Indonesia 99.8% 0.2%
1 Above location of LG Innotek Co., Ltd. and its subsidiaries represents the location of the head
office only.2 P.T.LG Electronics Indonesia’s shares held by the Parent Company are 51,916 out of the total
number of shares of 51,920.
LG ElectronicsNotes to the Interim Consolidated Financial StatementsSeptember 30, 2014 and 2013, and December 31, 2013
24
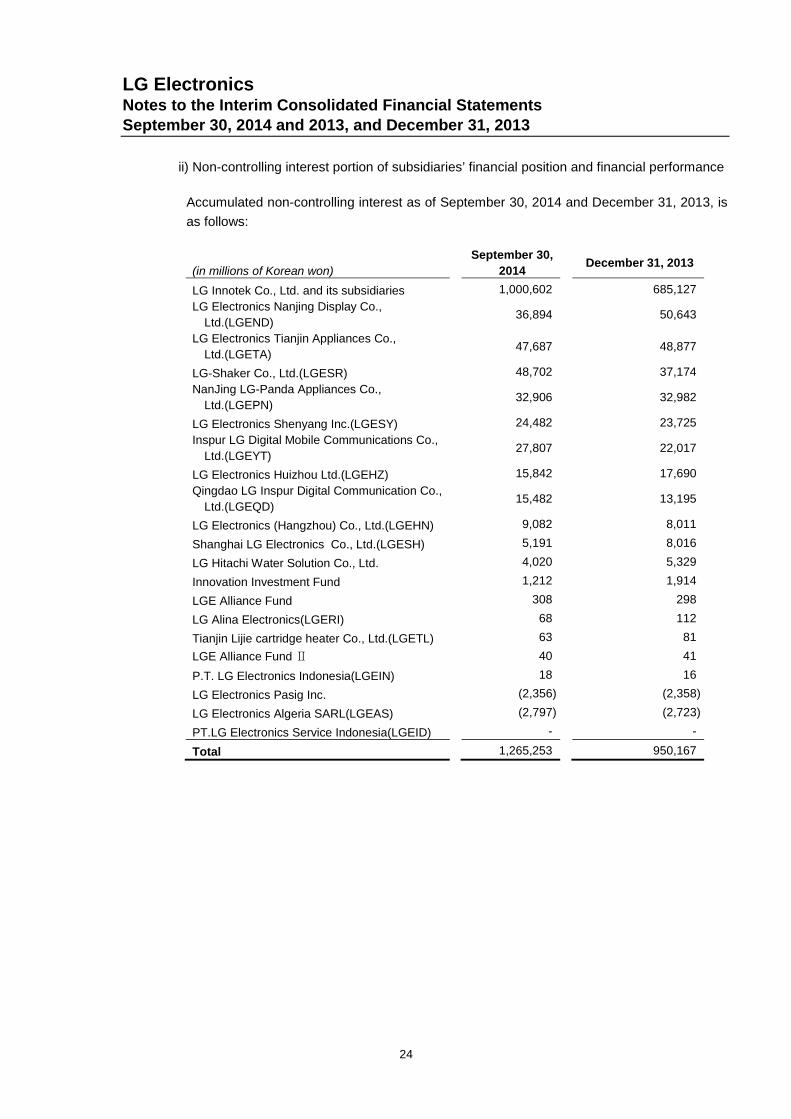
ii) Non-controlling interest portion of subsidiaries’ financial position and financial performance
Accumulated non-controlling interest as of September 30, 2014 and December 31, 2013, is
as follows:
(in millions of Korean won)
September 30,
2014December 31, 2013
LG Innotek Co., Ltd. and its subsidiaries 1,000,602 685,127
LG Electronics Nanjing Display Co.,
Ltd.(LGEND)36,894 50,643
LG Electronics Tianjin Appliances Co.,
Ltd.(LGETA)47,687 48,877
LG-Shaker Co., Ltd.(LGESR) 48,702 37,174
NanJing LG-Panda Appliances Co.,
Ltd.(LGEPN)32,906 32,982
LG Electronics Shenyang Inc.(LGESY) 24,482 23,725
Inspur LG Digital Mobile Communications Co.,
Ltd.(LGEYT)27,807 22,017
LG Electronics Huizhou Ltd.(LGEHZ) 15,842 17,690
Qingdao LG Inspur Digital Communication Co.,
Ltd.(LGEQD)15,482 13,195
LG Electronics (Hangzhou) Co., Ltd.(LGEHN) 9,082 8,011
Shanghai LG Electronics Co., Ltd.(LGESH) 5,191 8,016
LG Hitachi Water Solution Co., Ltd. 4,020 5,329
Innovation Investment Fund 1,212 1,914
LGE Alliance Fund 308 298
LG Alina Electronics(LGERI) 68 112
Tianjin Lijie cartridge heater Co., Ltd.(LGETL) 63 81
LGE Alliance FundⅡ 40 41
P.T. LG Electronics Indonesia(LGEIN) 18 16
LG Electronics Pasig Inc. (2,356) (2,358)
LG Electronics Algeria SARL(LGEAS) (2,797) (2,723)
PT.LG Electronics Service Indonesia(LGEID) - -
Total 1,265,253 950,167
LG ElectronicsNotes to the Interim Consolidated Financial StatementsSeptember 30, 2014 and 2013, and December 31, 2013
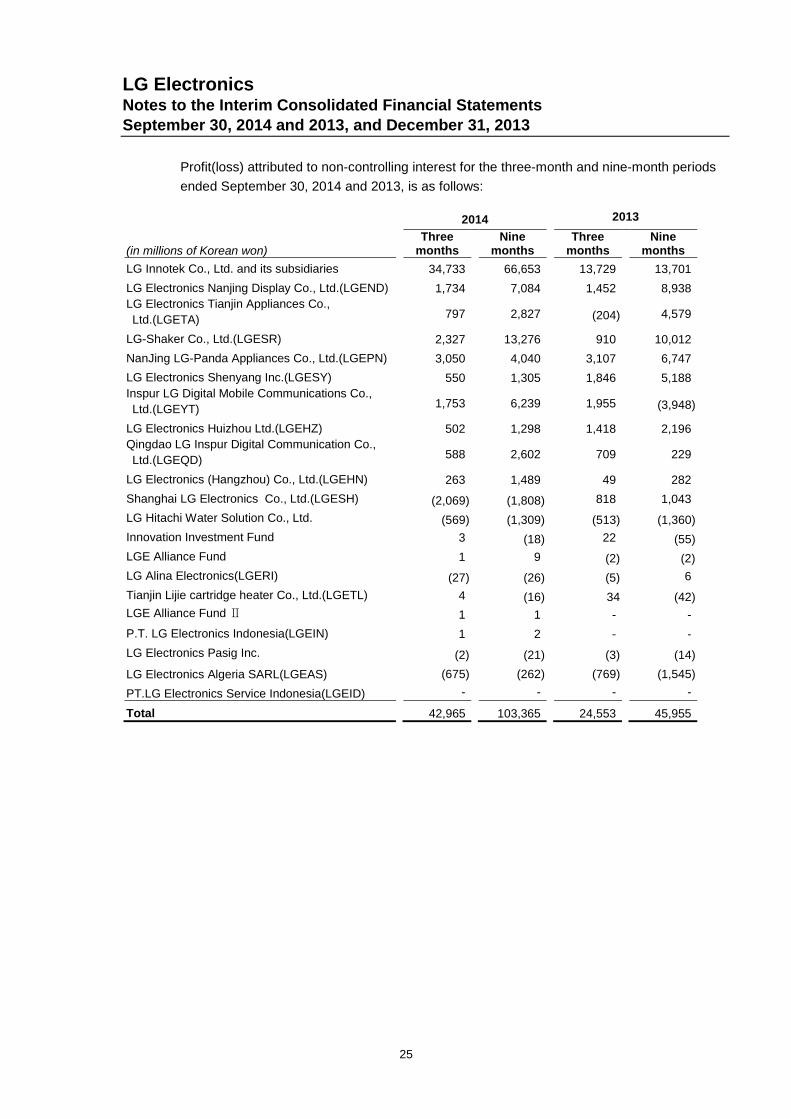
25
Profit(loss) attributed to non-controlling interest for the three-month and nine-month periods
ended September 30, 2014 and 2013, is as follows:
2014 2013
(in millions of Korean won)Three
monthsNine
monthsThree
monthsNine
months
LG Innotek Co., Ltd. and its subsidiaries 34,733 66,653 13,729 13,701
LG Electronics Nanjing Display Co., Ltd.(LGEND) 1,734 7,084 1,452 8,938
LG Electronics Tianjin Appliances Co.,
Ltd.(LGETA) 797 2,827 (204) 4,579
LG-Shaker Co., Ltd.(LGESR) 2,327 13,276 910 10,012
NanJing LG-Panda Appliances Co., Ltd.(LGEPN) 3,050 4,040 3,107 6,747
LG Electronics Shenyang Inc.(LGESY) 550 1,305 1,846 5,188
Inspur LG Digital Mobile Communications Co.,
Ltd.(LGEYT) 1,753 6,239 1,955 (3,948)
LG Electronics Huizhou Ltd.(LGEHZ) 502 1,298 1,418 2,196
Qingdao LG Inspur Digital Communication Co.,
Ltd.(LGEQD) 588 2,602 709 229
LG Electronics (Hangzhou) Co., Ltd.(LGEHN) 263 1,489 49 282
Shanghai LG Electronics Co., Ltd.(LGESH) (2,069) (1,808) 818 1,043
LG Hitachi Water Solution Co., Ltd. (569) (1,309) (513) (1,360)
Innovation Investment Fund 3 (18) 22 (55)
LGE Alliance Fund 1 9 (2) (2)
LG Alina Electronics(LGERI) (27) (26) (5) 6
Tianjin Lijie cartridge heater Co., Ltd.(LGETL) 4 (16) 34 (42)
LGE Alliance FundⅡ 1 1 - -
P.T. LG Electronics Indonesia(LGEIN) 1 2 - -
LG Electronics Pasig Inc. (2) (21) (3) (14)
LG Electronics Algeria SARL(LGEAS) (675) (262) (769) (1,545)
PT.LG Electronics Service Indonesia(LGEID) - - - -
Total 42,965 103,365 24,553 45,955
LG ElectronicsNotes to the Interim Consolidated Financial StatementsSeptember 30, 2014 and 2013, and December 31, 2013
26
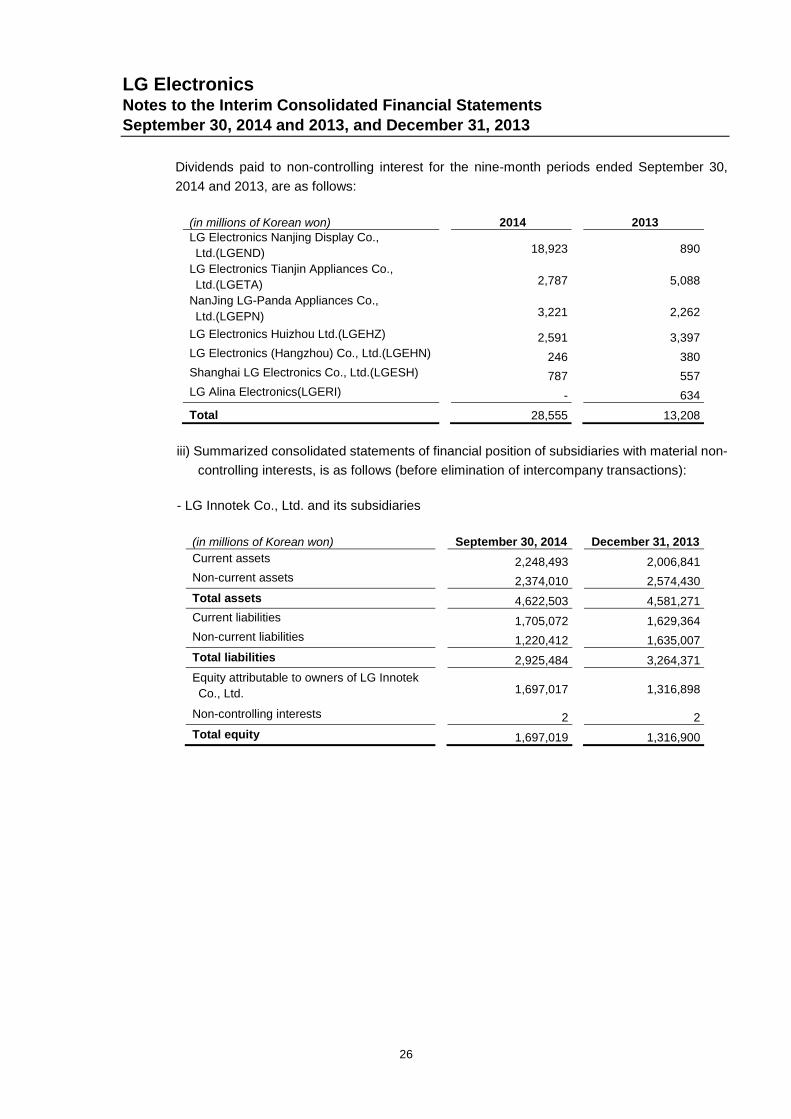
Dividends paid to non-controlling interest for the nine-month periods ended September 30,
2014 and 2013, are as follows:
(in millions of Korean won) 2014 2013LG Electronics Nanjing Display Co.,
Ltd.(LGEND) 18,923 890
LG Electronics Tianjin Appliances Co.,
Ltd.(LGETA) 2,787 5,088
NanJing LG-Panda Appliances Co.,
Ltd.(LGEPN) 3,221 2,262
LG Electronics Huizhou Ltd.(LGEHZ) 2,591 3,397
LG Electronics (Hangzhou) Co., Ltd.(LGEHN) 246 380
Shanghai LG Electronics Co., Ltd.(LGESH) 787 557
LG Alina Electronics(LGERI) - 634
Total 28,555 13,208
iii) Summarized consolidated statements of financial position of subsidiaries with material non-
controlling interests, is as follows (before elimination of intercompany transactions):
- LG Innotek Co., Ltd. and its subsidiaries
(in millions of Korean won) September 30, 2014 December 31, 2013
Current assets 2,248,493 2,006,841
Non-current assets 2,374,010 2,574,430
Total assets 4,622,503 4,581,271
Current liabilities 1,705,072 1,629,364
Non-current liabilities 1,220,412 1,635,007
Total liabilities 2,925,484 3,264,371
Equity attributable to owners of LG Innotek
Co., Ltd. 1,697,017 1,316,898
Non-controlling interests 2 2
Total equity 1,697,019 1,316,900

LG ElectronicsNotes to the Interim Consolidated Financial StatementsSeptember 30, 2014 and 2013, and December 31, 2013
27
iv) Summarized consolidated statements of comprehensive income of subsidiaries with
material non-controlling interests for the three-month and nine-month periods ended
September 30, 2014 and 2013, is as follows (before elimination of intercompany
transactions):
- LG Innotek Co., Ltd. and its subsidiaries
2014 2013
(in millions of Korean won)Three
monthsNine
monthsThree
monthsNine
months
Net sales 1,649,296 4,651,074 1,595,508 4,667,557
Profit for the period 58,354 118,365 27,735 28,126
Other comprehensive income(loss),
net of tax 7,586 (17,590) (18,036) 4,924
Total comprehensive income, net of tax 65,940 100,775 9,699 33,050
v) Summarized consolidated statements of cash flows of subsidiaries with material non-
controlling interests for the nine-month periods ended September 30, 2014 and 2013, is as
follows (before elimination of intercompany transactions):
- LG Innotek Co., Ltd. and its subsidiaries
(in millions of Korean won) 2014 2013
Cash flows from operating activities 593,109 263,634
Cash flows from investing activities (221,509) (364,900)
Cash flows from financing activities (263,575) 207,861
Exchange gains on cash and cash equivalents 1,198 263
Net increase in cash and cash equivalents 109,223 106,858
Cash and cash equivalents at the beginning of period 399,610 352,808
Cash and cash equivalents at the end of period 508,833 459,666
(d) Significant restrictions on its subsidiaries
i) The significant restrictions on the use of assets and on settlement of liabilities by the Group
are as follows:
Cash and cash equivalents and other deposits with financial institutions held by subsidiaries in
Egypt, Algeria, Russia, Kazakhstan and Uzbekistan are subject to currency regulations of each
relevant country. Accordingly, there are transfer limits on their cash and short-term financial
instruments from these countries.

LG ElectronicsNotes to the Interim Consolidated Financial StatementsSeptember 30, 2014 and 2013, and December 31, 2013
28
ii) The nature and limitation of the protective rights of non-controlling interest which may
restrict use of assets and settlement of liabilities by the Group are as follows:
SubsidiariesThe nature and limitation of the protective rights for non-
controlling interest
LG Hitachi Water Solution
Co., Ltd.
For the following special resolutions of the board of directors,
consents from directors who were appointed by non-controlling
interest holder are required.
- Acquisitions and disposals of assets over₩1,000 million not
included in the business plan
- Borrowings and issues of debentures over ₩1,000 million
not included in the business plan
- Expenditures over ₩1,000 million not included in the
business plan
- Initial agreement, amendment and termination of significant
contracts over₩1,000 million
LG-Shaker Co., Ltd.(LGESR) Unanimous approval is required for the confirmation of financial
statements and dividend declaration.
(e) Changes in the Parent Company’s interest in the subsidiaries
Changes in the Parent Company’s interest in the subsidiaries without loss of control for the
nine-month periods ended September 30, 2014 and 2013, are as follows:
(in millions of Korean won) 2014 2013
LG Innotek Co., Ltd. and its subsidiaries1
Decrease in the Parent Company’s interest byexercise of conversion rights (A) 20,180 -
Consideration received from non-controllinginterest (B) - -
Changes of the Parent Company’s ownershipinterest (A+B) 20,180 -
LG-Shaker Co., Ltd.(LGESR)Increase in the Parent Company’s interest by
exercise of stock option (A) 1,813 -
Consideration paid to non-controlling interest (B) 1,013 -Changes of the Parent Company’s ownership
interest (A-B) 800 -
1 The controlling interest of the parent company changed due to the conversion of the convertible bonds that
were issued by LG Innotek Co., Ltd, a subsidiary (Note 11).

LG ElectronicsNotes to the Interim Consolidated Financial StatementsSeptember 30, 2014 and 2013, and December 31, 2013
29
(f) Subsidiary newly included in scope of preparation of consolidated financial statements for the
nine-month period ended September 30, 2014, is:
Subsidiary Reason CountryPercentage of
ownershipClosingMonth
MajorBusiness
HI LOGISTICS RUS Limited
Liability Company
Newly
established Russia 100% December Logistics
PT.LG Electronics Service
Indonesia(LGEID)
Newly
established Indonesia 99.8% December Service
Hi Logistics Egypt
Newly
established Egypt 100.0% December Logistics
Hi Logistics Vietnam Co.,
LTD.
Newly
established Vietnam 100.0% December Logistics
(g) Subsidiary excluded from the scope of preparation of consolidated financial statements for the
nine-month period ended September 30, 2014, is:
Subsidiary Reason Country
LG Receivable Funding LLC Liquidation USA
(h) Gain or loss resulted from loss of control over subsidiaries
During the period, no gain or loss occurred due to the loss of control over LG ReceivableFunding LLC which was a former subsidiary of the Group.
2. Significant Accounting Policies
Basis of Preparation
The interim consolidated financial statements for the nine-month period ended September 30, 2014,
have been prepared in accordance with Korean IFRS 1034, ‘Interim Financial Reporting’. These
interim consolidated financial statements have been prepared in accordance with the Korean IFRS
standards and interpretations effective at September 30, 2014.
Changes in Accounting Policy and Disclosures
i. New and amended standards and interpretations effective for the financial year beginning
January 1, 2014.
The new and amended standards early adopted by the Group from the financial year, 2013
- Korean IFRS 1032(Amendment),’ Financial Instruments: Presentation’
Amendment to Korean IFRS 1032 provides that the right to offset must not be contingent on a
future event and must be legally enforceable in all of circumstances; and if an entity can settle
amounts in a manner such that outcome is, in effect, equivalent to net settlement, the entity will meet
the net settlement criterion. The amendments of Korean IFRS 1032 do not have a significant impact
on these consolidated financial statements.
The new and amended standards, and interpretations adopted by the Group during 2014

LG ElectronicsNotes to the Interim Consolidated Financial StatementsSeptember 30, 2014 and 2013, and December 31, 2013
30
- Korean IFRS 1036(Amendment): ‘Impairment of Assets’
Amendments to Korean IFRS 1036, ‘Impairment of Assets’, clarify the facts that it shall disclose the
recoverable amount of an individual asset (including goodwill) or a cash-generating unit for which
an impairment loss is recognized or reversed. These amendments also prescribe disclosures in
case the recoverable amount of an individual asset (including goodwill) or a cash-generating unit
for which an impairment loss is recognized or reversed is the fair value less costs to sell. The
amendments do not have a significant impact on these consolidated financial statements.
- Korean IFRS 1039(Amendment): ‘Financial Instruments: Recognition and Measurement’
Amendments to Korean IFRS 1039, ‘Financial Instruments: Recognition and Measurement’, allows
the continuation of hedge accounting for a derivative that has been designated as a hedging
instrument in a circumstance in which that derivative is novated to a central counterparty (CCP) as
a consequence of laws or regulations. The amendments do not have a significant impact on these
consolidated financial statements.
- Korean IFRS 2121(Enactment): ‘Levies’
Korean IFRS 2121, ‘Levies’, are applied to a liability to pay a levy imposed by a government in
accordance with the legislation. The interpretation requires that the liability to pay a levy is
recognized when the activity that triggers the payment of the levy occurs, as identified by the
legislation. The enactments do not have a significant impact on these consolidated financial
statements.
ii. New and amended standards and interpretations effective for the financial year beginning
January 1, 2015.
There are no new and amended standards early adopted by the Group from the financial year, 2014.
New and amended standards and interpretations not yet adopted by the Group are as follows:
- Korean IFRS 1019(Amendment): ‘Employee Benefits’
In defined benefit plans with contributions from employees or third parties, if such contributions are
linked to service provided by employees or third parties at the same period when contributions were
made, a practical expedient of reducing such contributions from the service cost is allowed. It was
clarified that when contributions reflect the actuarial valuation method, such contributions made by
employees or third parties should be attributed by the same method used to attribute the total benefit.
The amendments do not have a significant impact on these consolidated financial statements.
- Annual improvements of Korean IFRS
Korean IFRS 1102, ‘Share-based Payment’
Korean IFRS 1103, ‘Business Combination’
Korean IFRS 1108, ‘Operating Segment’

LG ElectronicsNotes to the Interim Consolidated Financial StatementsSeptember 30, 2014 and 2013, and December 31, 2013
31
Korean IFRS 1113, ‘Fair Value Measurement’
Korean IFRS 1016, ‘Property, Plant and Equipment’
Korean IFRS 1038, ‘Intangible Assets’
Korean IFRS 1024, ‘Related Party Disclosures’
Korean IFRS 1040, ‘Investment Property’
The annual improvements of Korean IFRS do not have a significant impact on these consolidated
financial statements.
Application of Accounting Policies
The significant accounting policies and computation method used in the preparation of these interim
consolidated financial statements are the same as the policies and methods adopted for the
preparation of the financial statements for the year ended December 31, 2013, unless otherwise
stated in Note 2.
Income Tax Expense
Income tax expense for the interim period is recognized based on management’s best estimate of
the weighted average annual income tax rate expected for the full financial year. The estimated
average annual tax rate is applied to the pre-tax income for the period.

LG ElectronicsNotes to the Interim Consolidated Financial StatementsSeptember 30, 2014 and 2013, and December 31, 2013
32
3. Critical Accounting Estimates and Assumptions
For the interim consolidated financial statements, the Group's management makes judgments,
estimates and assumptions which affect accounting policies and its assets, liabilities, income and
cost. Estimates and assumptions are continually evaluated and are based on historical experience
and other factors, including expectations of future events that are believed to be reasonable under
the circumstances. The resulting accounting estimates will, by definition, seldom equal the related
actual results.
(a) Revenue Recognition
The Group recognizes revenue using the percentage of completion method for the rendering of
service such as installation. When using the percentage of completion method, revenue shall be
recognized in accordance with the progress of the transaction. It is calculated based on potential
economic benefits and the estimated cost for the completion of the transaction. The factors for the
estimation of revenue may vary.
(b) Impairment of Goodwill
The Group tests goodwill regularly for impairment. The recoverable amounts of cash-generating
units have been determined based on fair value after deducting the costs of disposal and value-in-
use calculations. These calculations require the use of estimates.
(c) Income Taxes
The Group is subject to income taxes in numerous jurisdictions. Significant judgment is required in
determining the worldwide provision for income taxes. There are many transactions and calculations
for which the ultimate tax determination is uncertain. The Group recognizes assets and liabilities for
anticipated tax audit issues based on the best estimates of whether additional taxes will be due.
Income tax expense in each interim period is recognized based on the best estimate of the weighted
average annual income tax rate expected for the full financial year as explained in Note 2. Where
final tax obligation is different from the amount that was initially recorded, such differences will
impact the current and deferred income tax assets and liabilities in the period when tax obligation is
finalized.
(d) Fair Value of Financial Instruments
The fair value of financial instruments that are not traded in an active market is determined by using
valuation techniques. The Group uses its judgement to select a variety of methods and makes
assumptions that are mainly based on market conditions existing at the end of each reporting period.

LG ElectronicsNotes to the Interim Consolidated Financial StatementsSeptember 30, 2014 and 2013, and December 31, 2013
33
(e) Provisions
The Group recognizes provisions for product warranties and sales returns based on their historical
data.
(f) Net Defined Benefit Liability
The present value of the defined benefit obligation depends on various factors that are determined
on an actuarial basis using a number of assumptions. The assumptions used in determining the net
cost(income) for pensions include the discount rate. Any changes in these assumptions will impact
the carrying amount of the defined benefit obligation. The Group determines the appropriate
discount rate at the end of each year. This is the interest rate that is used to determine the present
value of estimated future cash outflows expected to be required to settle the defined benefit
obligation. In determining the appropriate discount rate, the Group considers the interest rates of
high-quality corporate bonds that are denominated in the currency in which the benefits will be paid,
and that have terms to maturity approximating the terms of the related pension liability. Other key
assumptions for defined benefit obligation are based on current market conditions.
Significant Judgment on Accounting Policies Adopted by the Group
In order to determine the Group’s de-facto control, the Group considers the size of the Group’s
holding of voting rights relative to the size and dispersion of holdings of the other vote holders and
additional facts and circumstances including voting patterns at previous shareholders’ meetings.
4. Segment Information
The segments of the Group are strategic business divisions providing different products and services.
Each business division operates separately according to unique technologies and marketing
strategies. The main products of each business division are as follows and the comparative
information is presented in conformity with the same classification in the current period.
Divisions Products
Home Entertainment (HE)TV, Monitors, PCs, Security devices, Audio, Videoand others
Mobile Communications (MC) Mobile communications
Home Appliance (HA)Refrigerators, Washing machines, Microwaves,Vacuum cleaners, Water purifier and others
Air Conditioning & Energy Solution (AE)Residential air conditioners, Commercial airconditioners and others
LG Innotek Co.,Ltd. and its subsidiaries(Innotek)
LED, Display & Network, Substrate & Material,Optics solution, Auto & Motor and others
Other segments Vehicle components, Compressor, Motor, Displaymaterial, Lighting, Solar and others
(a) The segment information for sales and operating income(losses) for the three-month and nine-
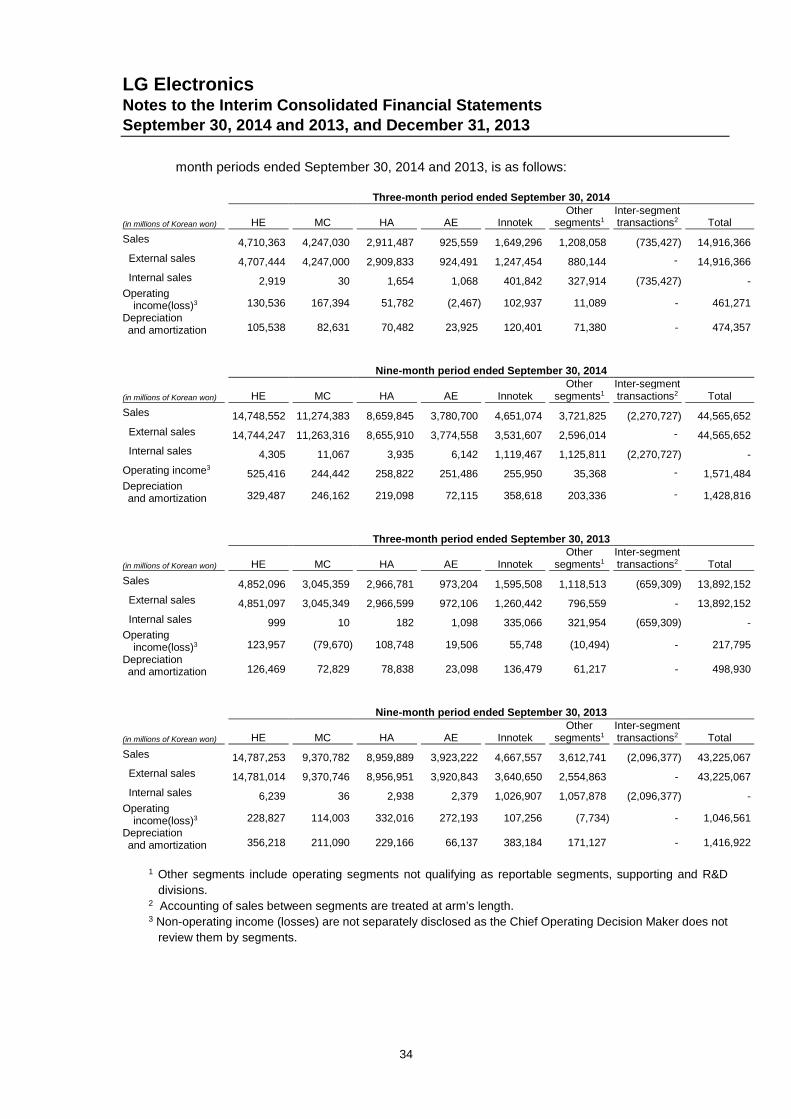
LG ElectronicsNotes to the Interim Consolidated Financial StatementsSeptember 30, 2014 and 2013, and December 31, 2013
34
month periods ended September 30, 2014 and 2013, is as follows:
Three-month period ended September 30, 2014
(in millions of Korean won) HE MC HA AE InnotekOther
segments1Inter-segmenttransactions2 Total
Sales 4,710,363 4,247,030 2,911,487 925,559 1,649,296 1,208,058 (735,427) 14,916,366
External sales 4,707,444 4,247,000 2,909,833 924,491 1,247,454 880,144 - 14,916,366
Internal sales 2,919 30 1,654 1,068 401,842 327,914 (735,427) -Operating
income(loss)3 130,536 167,394 51,782 (2,467) 102,937 11,089 - 461,271
Depreciationand amortization 105,538 82,631 70,482 23,925 120,401 71,380 - 474,357
Nine-month period ended September 30, 2014
(in millions of Korean won) HE MC HA AE InnotekOther
segments1Inter-segmenttransactions2 Total
Sales 14,748,552 11,274,383 8,659,845 3,780,700 4,651,074 3,721,825 (2,270,727) 44,565,652
External sales 14,744,247 11,263,316 8,655,910 3,774,558 3,531,607 2,596,014 - 44,565,652
Internal sales 4,305 11,067 3,935 6,142 1,119,467 1,125,811 (2,270,727) -
Operating income3525,416 244,442 258,822 251,486 255,950 35,368 - 1,571,484
Depreciationand amortization 329,487 246,162 219,098 72,115 358,618 203,336 - 1,428,816
Three-month period ended September 30, 2013
(in millions of Korean won) HE MC HA AE InnotekOther
segments1Inter-segmenttransactions2 Total
Sales 4,852,096 3,045,359 2,966,781 973,204 1,595,508 1,118,513 (659,309) 13,892,152
External sales 4,851,097 3,045,349 2,966,599 972,106 1,260,442 796,559 - 13,892,152
Internal sales 999 10 182 1,098 335,066 321,954 (659,309) -Operating
income(loss)3 123,957 (79,670) 108,748 19,506 55,748 (10,494) - 217,795
Depreciationand amortization 126,469 72,829 78,838 23,098 136,479 61,217 - 498,930
Nine-month period ended September 30, 2013
(in millions of Korean won) HE MC HA AE InnotekOther
segments1Inter-segmenttransactions2 Total
Sales 14,787,253 9,370,782 8,959,889 3,923,222 4,667,557 3,612,741 (2,096,377) 43,225,067
External sales 14,781,014 9,370,746 8,956,951 3,920,843 3,640,650 2,554,863 - 43,225,067
Internal sales 6,239 36 2,938 2,379 1,026,907 1,057,878 (2,096,377) -Operating
income(loss)3 228,827 114,003 332,016 272,193 107,256 (7,734) - 1,046,561
Depreciationand amortization 356,218 211,090 229,166 66,137 383,184 171,127 - 1,416,922
1 Other segments include operating segments not qualifying as reportable segments, supporting and R&D
divisions.2 Accounting of sales between segments are treated at arm’s length.3 Non-operating income (losses) are not separately disclosed as the Chief Operating Decision Maker does not
review them by segments.
LG ElectronicsNotes to the Interim Consolidated Financial StatementsSeptember 30, 2014 and 2013, and December 31, 2013
35
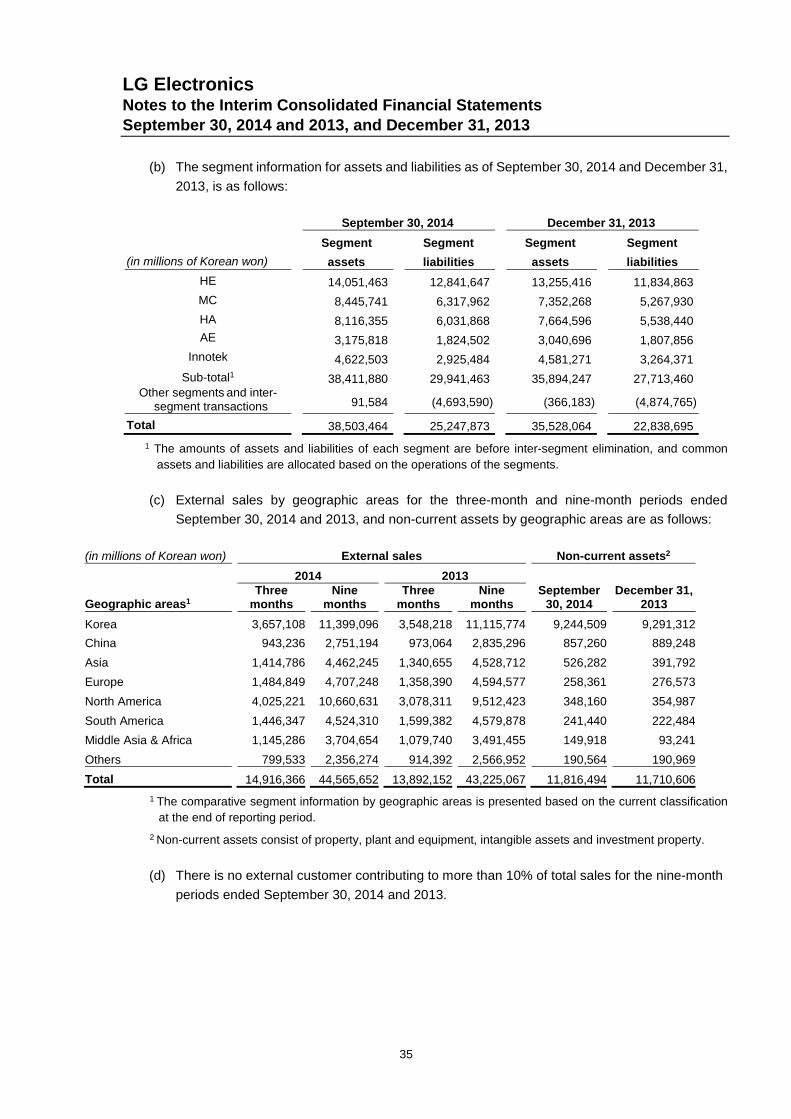
(b) The segment information for assets and liabilities as of September 30, 2014 and December 31,
2013, is as follows:
September 30, 2014 December 31, 2013
(in millions of Korean won)
Segment
assets
Segment
liabilities
Segment
assets
Segment
liabilities
HE 14,051,463 12,841,647 13,255,416 11,834,863
MC 8,445,741 6,317,962 7,352,268 5,267,930
HA 8,116,355 6,031,868 7,664,596 5,538,440
AE 3,175,818 1,824,502 3,040,696 1,807,856
Innotek 4,622,503 2,925,484 4,581,271 3,264,371
Sub-total1 38,411,880 29,941,463 35,894,247 27,713,460Other segments and inter-
segment transactions 91,584 (4,693,590) (366,183) (4,874,765)
Total 38,503,464 25,247,873 35,528,064 22,838,695
1 The amounts of assets and liabilities of each segment are before inter-segment elimination, and common
assets and liabilities are allocated based on the operations of the segments.
(c) External sales by geographic areas for the three-month and nine-month periods ended
September 30, 2014 and 2013, and non-current assets by geographic areas are as follows:
(in millions of Korean won) External sales Non-current assets2
2014 2013
Geographic areas1Three
monthsNine
monthsThree
monthsNine
monthsSeptember
30, 2014December 31,
2013
Korea 3,657,108 11,399,096 3,548,218 11,115,774 9,244,509 9,291,312
China 943,236 2,751,194 973,064 2,835,296 857,260 889,248
Asia 1,414,786 4,462,245 1,340,655 4,528,712 526,282 391,792
Europe 1,484,849 4,707,248 1,358,390 4,594,577 258,361 276,573
North America 4,025,221 10,660,631 3,078,311 9,512,423 348,160 354,987
South America 1,446,347 4,524,310 1,599,382 4,579,878 241,440 222,484
Middle Asia & Africa 1,145,286 3,704,654 1,079,740 3,491,455 149,918 93,241
Others 799,533 2,356,274 914,392 2,566,952 190,564 190,969
Total 14,916,366 44,565,652 13,892,152 43,225,067 11,816,494 11,710,606
1 The comparative segment information by geographic areas is presented based on the current classification
at the end of reporting period.
2 Non-current assets consist of property, plant and equipment, intangible assets and investment property.
(d) There is no external customer contributing to more than 10% of total sales for the nine-month
periods ended September 30, 2014 and 2013.

LG ElectronicsNotes to the Interim Consolidated Financial StatementsSeptember 30, 2014 and 2013, and December 31, 2013
36
5. Financial Instruments by Category
(a) Categorizations of financial instruments as of September 30, 2014 and December 31, 2013,
are as follows:
September 30, 2014
(in millions of Korean won)
Assets at fairvalue throughprofit or loss
Loans andreceivables
Assetsclassified
asavailable-for-sale
Held-to-maturityfinancialassets Other Total
Cash and cash equivalents - 2,949,709 - - - 2,949,709
Financial deposits - 149,341 - - - 149,341
Trade receivables - 8,277,702 - - - 8,277,702
Loans and other receivables - 1,109,606 - - - 1,109,606
Other financial assets 3,008 - 50,659 2,692 10,484 66,843
Total 3,008 12,486,358 50,659 2,692 10,484 12,553,201
September 30, 2014
(in millions of Korean won)
Liabilities atfair value through
profit or loss
Liabilitiescarried at
amortized cost Other Total
Trade payables - 7,404,914 - 7,404,914
Borrowings - 9,429,679 - 9,429,679
Other payables - 2,466,015 - 2,466,015
Other financial liabilities 917 - 65,084 66,001
Total 917 19,300,608 65,084 19,366,609
December 31, 2013
(in millions of Korean won)
Assets at fairvalue throughprofit or loss
Loans andreceivables
Assetsclassified
asavailable-for-sale
Held-to-maturityfinancialassets Other Total
Cash and cash equivalents - 2,645,270 - - - 2,645,270
Financial deposits - 164,888 - - - 164,888
Trade receivables - 7,117,402 - - - 7,117,402
Loans and other receivables - 1,198,483 - - - 1,198,483
Other financial assets 16,080 - 53,075 2,576 1,413 73,144
Total 16,080 11,126,043 53,075 2,576 1,413 11,199,187

LG ElectronicsNotes to the Interim Consolidated Financial StatementsSeptember 30, 2014 and 2013, and December 31, 2013
37
December 31, 2013
(in millions of Korean won)
Liabilities atfair value through
profit or loss
Liabilitiescarried at
amortized cost Other Total
Trade payables - 5,691,114 - 5,691,114
Borrowings - 9,211,029 - 9,211,029
Other payables - 2,857,356 - 2,857,356
Other financial liabilities 1,457 - 20,096 21,553
Total 1,457 17,759,499 20,096 17,781,052
(b) Income and expenses by category of financial instruments for the nine-month periods ended
September 30, 2014 and 2013, are as follows:
2014
(in millions of Korean won)
Assets at fairvalue throughprofit or loss
Loans andreceivables
Assetsclassified asavailable-for-
sale
Held-to-maturityfinancialassets Other Total
Interest income - 69,560 195 54 - 69,809
Exchange differences - (119,518) - - - (119,518)
Bad debt expense - (25,765) - - - (25,765)
Loss on disposal of trade
receivables- (13,962) - - - (13,962)
Loss on valuation of available-
for-sale financial assets, net
of tax (through other
comprehensive loss)
- - (1,216) - - (1,216)
Gain on disposal of available-
for-sale financial assets- - 1,509 - - 1,509
Impairment loss of available-for-
sale financial assets- - (1,114) - - (1,114)
Dividend income - - 322 - - 322
Gain on derivatives (through
profit or loss)27,378 - - - - 27,378
Loss on derivatives, net of tax
(through other comprehensive
loss)- - - - (43) (43)
2014
(in millions of Korean won)
Liabilities atfair value through
profit or loss
Liabilitiescarried at
amortized cost Other Total
Interest expenses - (342,588) - (342,588)
Exchange differences - (102,385) - (102,385)
Loss on derivatives (through profit or loss) (36,539) - - (36,539)
Loss on derivatives, net of tax (through
other comprehensive loss)- - (25,808) (25,808)
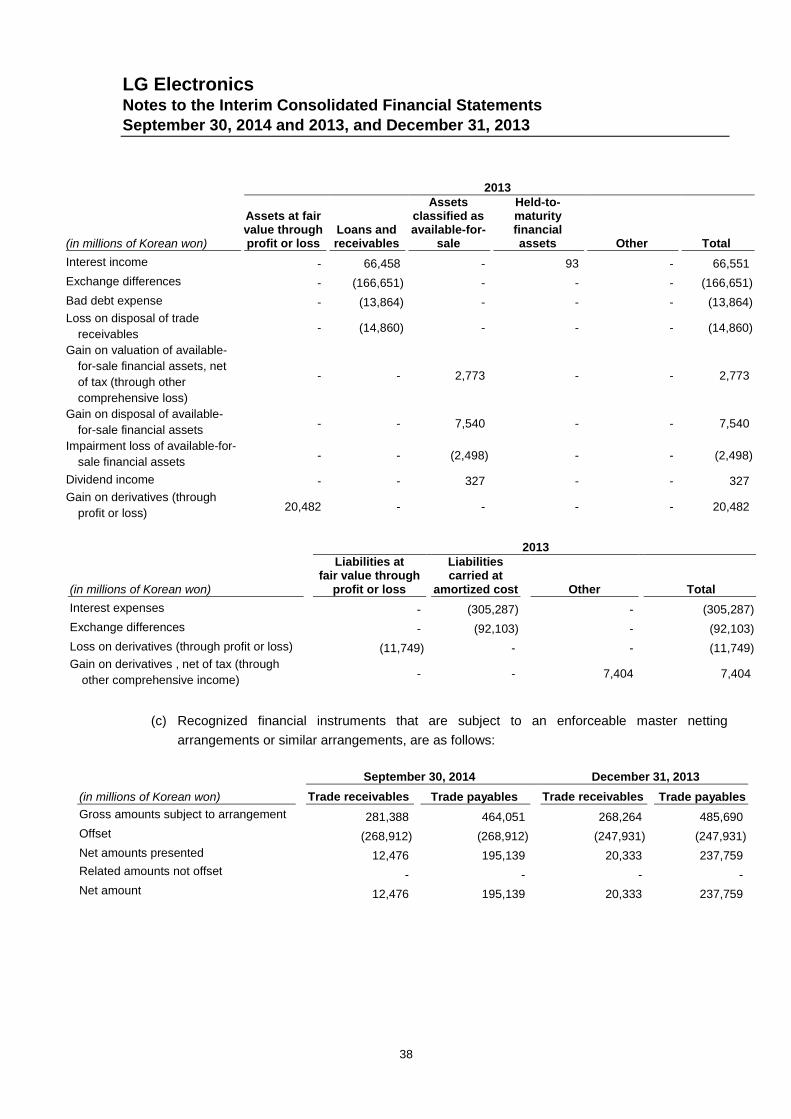
LG ElectronicsNotes to the Interim Consolidated Financial StatementsSeptember 30, 2014 and 2013, and December 31, 2013
38
2013
(in millions of Korean won)
Assets at fairvalue throughprofit or loss
Loans andreceivables
Assetsclassified asavailable-for-
sale
Held-to-maturityfinancialassets Other Total
Interest income - 66,458 - 93 - 66,551
Exchange differences - (166,651) - - - (166,651)
Bad debt expense - (13,864) - - - (13,864)
Loss on disposal of trade
receivables- (14,860) - - - (14,860)
Gain on valuation of available-
for-sale financial assets, net
of tax (through other
comprehensive loss)
- - 2,773 - - 2,773
Gain on disposal of available-
for-sale financial assets- - 7,540 - - 7,540
Impairment loss of available-for-
sale financial assets- - (2,498) - - (2,498)
Dividend income - - 327 - - 327
Gain on derivatives (through
profit or loss)20,482 - - - - 20,482
2013
(in millions of Korean won)
Liabilities atfair value through
profit or loss
Liabilitiescarried at
amortized cost Other Total
Interest expenses - (305,287) - (305,287)
Exchange differences - (92,103) - (92,103)
Loss on derivatives (through profit or loss) (11,749) - - (11,749)
Gain on derivatives , net of tax (through
other comprehensive income)- - 7,404 7,404
(c) Recognized financial instruments that are subject to an enforceable master netting
arrangements or similar arrangements, are as follows:
September 30, 2014 December 31, 2013
(in millions of Korean won) Trade receivables Trade payables Trade receivables Trade payables
Gross amounts subject to arrangement 281,388 464,051 268,264 485,690
Offset (268,912) (268,912) (247,931) (247,931)
Net amounts presented 12,476 195,139 20,333 237,759
Related amounts not offset - - - -
Net amount 12,476 195,139 20,333 237,759

LG ElectronicsNotes to the Interim Consolidated Financial StatementsSeptember 30, 2014 and 2013, and December 31, 2013
39
6. Trade Receivables
(a) Carrying amounts of trade receivables, and allowance for doubtful accounts, as of September
30, 2014 and December 31, 2013, are as follows:
(in millions of Korean won) September 30, 2014 December 31, 2013
Trade receivables 8,410,081 7,231,763
Less: allowance for doubtful accounts (132,379) (114,361)
Carrying amount 8,277,702 7,117,402
(b) The aging analysis as of September 30, 2014 and December 31, 2013, is as follows:
(in millions of Korean won) September 30, 2014 December 31, 2013
Current 7,662,200 6,560,428
Past due : Up to 6 months 540,791 501,327
Past due : 7 to 12 months 62,232 40,113
Past due : Over one year 51,996 19,761
Defaulted 92,862 110,134
Total 8,410,081 7,231,763
(c) Movements in allowance for doubtful accounts for the nine-month periods ended September
30, 2014 and 2013, are as follows
(in millions of Korean won) 2014 2013
At January 1 114,361 138,418
Addition 26,175 12,174
Write-off (2,918) (12,313)
Other (5,239) 2,752
At September 30 132,379 141,031

LG ElectronicsNotes to the Interim Consolidated Financial StatementsSeptember 30, 2014 and 2013, and December 31, 2013
40
(d) Transferred financial assets that are not derecognized in their entirety are as follows:
As of September 30, 2014, there are no trade receivables which are transferred to financial
institutions but recorded as short-term borrowings as the transfer did not qualify for
derecognition.
September 30, 2014 December 31, 2013
(in millions of Korean won)
Discounted
receivables
Securitized
receivables
Discounted
receivables
Securitized
receivables
Carrying amount of asset1
Trade receivables - - 26,322 527,574
Carrying amount of
associated liability1
Short-term borrowings - - 26,322 -
Net position2 - - - 527,574
1 Fair values of the above trade receivables and short-term borrowings are the same as their carrying amounts,
respectively.2 Net position is the difference of fair value between the above transferred financial asset and the associated
liability.
7. Other Financial Assets and Liabilities
(a) Details of other financial assets and liabilities are as follows:
(in millions of Korean won) September 30, 2014 December 31, 2013
Other financial assets
Derivatives 13,492 17,493
Available-for-sale 50,659 53,075
Held-to-maturity 2,692 2,576
Total 66,843 73,144
Current 13,541 17,430
Non-current 53,302 55,714
(in millions of Korean won) September 30, 2014 December 31, 2013
Other financial liabilities
Derivatives 65,454 20,928
Financial guarantees 547 625
Total 66,001 21,553
Current 2,753 10,890
Non-current 63,248 10,663

LG ElectronicsNotes to the Interim Consolidated Financial StatementsSeptember 30, 2014 and 2013, and December 31, 2013
41
(b) Details of derivatives as of September 30, 2014 and December 31, 2013, are as follows:
(in millions of Korean won)
September 30, 2014 December 31, 2013
Assets Liabilities Assets Liabilities
Current
Currency Forward 3,008 917 1,116 580
Currency Swap 10,484 1,730 16,283 10,204
Sub-total 13,492 2,647 17,399 10,784
Non- current
Currency Swap - 37,065 94 10,144
Interest Rate Swap - 25,742 - -
Sub-total - 62,807 94 10,144
Total 13,492 65,454 17,493 20,928
The maximum exposure to credit risk as of the reporting date is the fair value of derivatives as
of the same date.
The details of major derivative contracts as of the reporting date are presented in Note 31.
(c) Financial assets classified as available-for-sale
i) Changes in carrying amounts of available-for-sale financial assets for the nine-month
periods ended September 30, 2014 and 2013, are as follows:
2014
(in millions of Korean won)
Beginning
Balance Acquisitions Disposals
Valuation1(Other
Comprehensive loss) Impairment Others
Ending
Balance
Listed equity securities 17,720 - (1,000) (1,427) (17) - 15,276
Unlisted equity securities 33,515 1,907 (765) - (797) (8) 33,852
Debt securities 1,840 - (191) 13 (300) 169 1,531
Total 53,075 1,907 (1,956) (1,414) (1,114) 161 50,659
2013
(in millions of Korean won)
Beginning
Balance Acquisitions Disposals
Valuation1(Other
Comprehensive Income) Impairment Others
Ending
Balance
Listed equity securities 8,169 - (532) 4,223 - - 11,860
Unlisted equity securities 43,760 6,888 (10,006) - (2,498) - 38,144
Debt securities 2,670 1,205 (835) - - - 3,040
Total 54,599 8,093 (11,373) 4,223 (2,498) - 53,044
1 The profit of\824 million (2013:\422 million) and the loss of\317 million (2013: nil) from the accumulated
other comprehensive income relating to available-for-sale financial assets have been reclassified to profit
and loss during the nine-month period ended September 30, 2014.
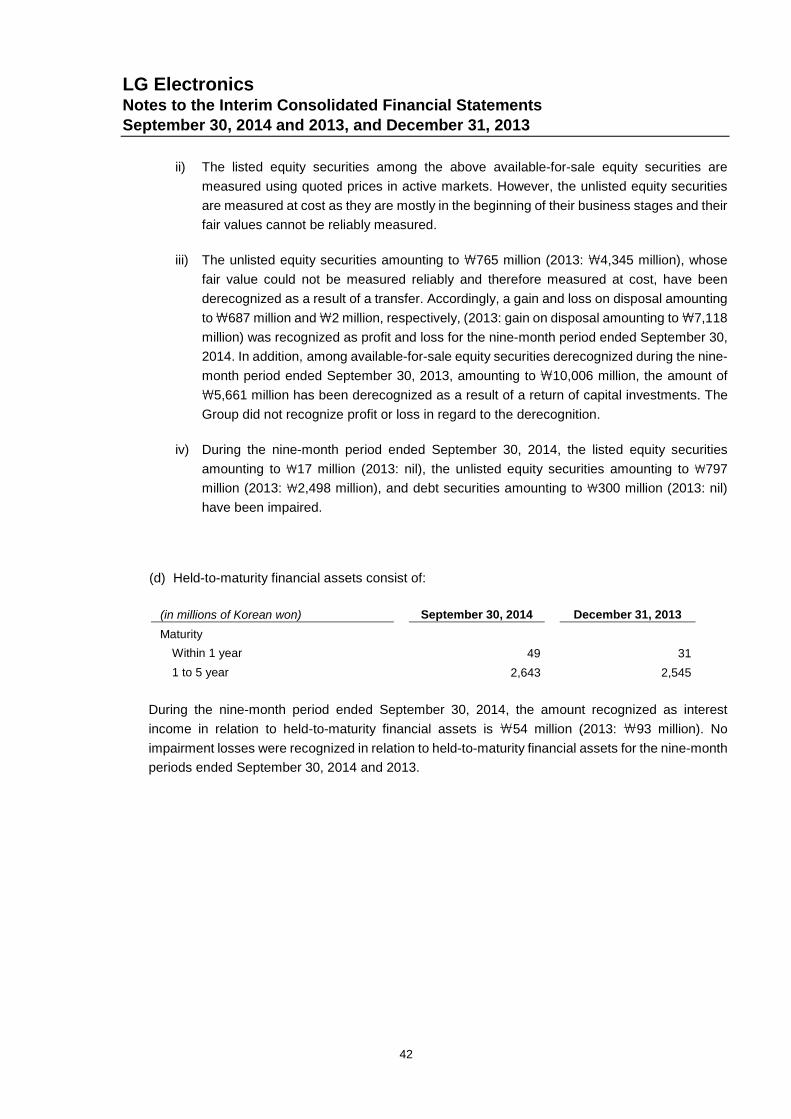
LG ElectronicsNotes to the Interim Consolidated Financial StatementsSeptember 30, 2014 and 2013, and December 31, 2013
42
ii) The listed equity securities among the above available-for-sale equity securities are
measured using quoted prices in active markets. However, the unlisted equity securities
are measured at cost as they are mostly in the beginning of their business stages and their
fair values cannot be reliably measured.
iii) The unlisted equity securities amounting to \765 million (2013: \4,345 million), whose
fair value could not be measured reliably and therefore measured at cost, have been
derecognized as a result of a transfer. Accordingly, a gain and loss on disposal amounting
to\687 million and\2 million, respectively, (2013: gain on disposal amounting to\7,118
million) was recognized as profit and loss for the nine-month period ended September 30,
2014. In addition, among available-for-sale equity securities derecognized during the nine-
month period ended September 30, 2013, amounting to \10,006 million, the amount of
\5,661 million has been derecognized as a result of a return of capital investments. The
Group did not recognize profit or loss in regard to the derecognition.
iv) During the nine-month period ended September 30, 2014, the listed equity securities
amounting to \17 million (2013: nil), the unlisted equity securities amounting to \797
million (2013: \2,498 million), and debt securities amounting to \300 million (2013: nil)
have been impaired.
(d) Held-to-maturity financial assets consist of:
(in millions of Korean won) September 30, 2014 December 31, 2013
Maturity
Within 1 year 49 31
1 to 5 year 2,643 2,545
During the nine-month period ended September 30, 2014, the amount recognized as interest
income in relation to held-to-maturity financial assets is ₩54 million (2013: ₩93 million). No
impairment losses were recognized in relation to held-to-maturity financial assets for the nine-month
periods ended September 30, 2014 and 2013.
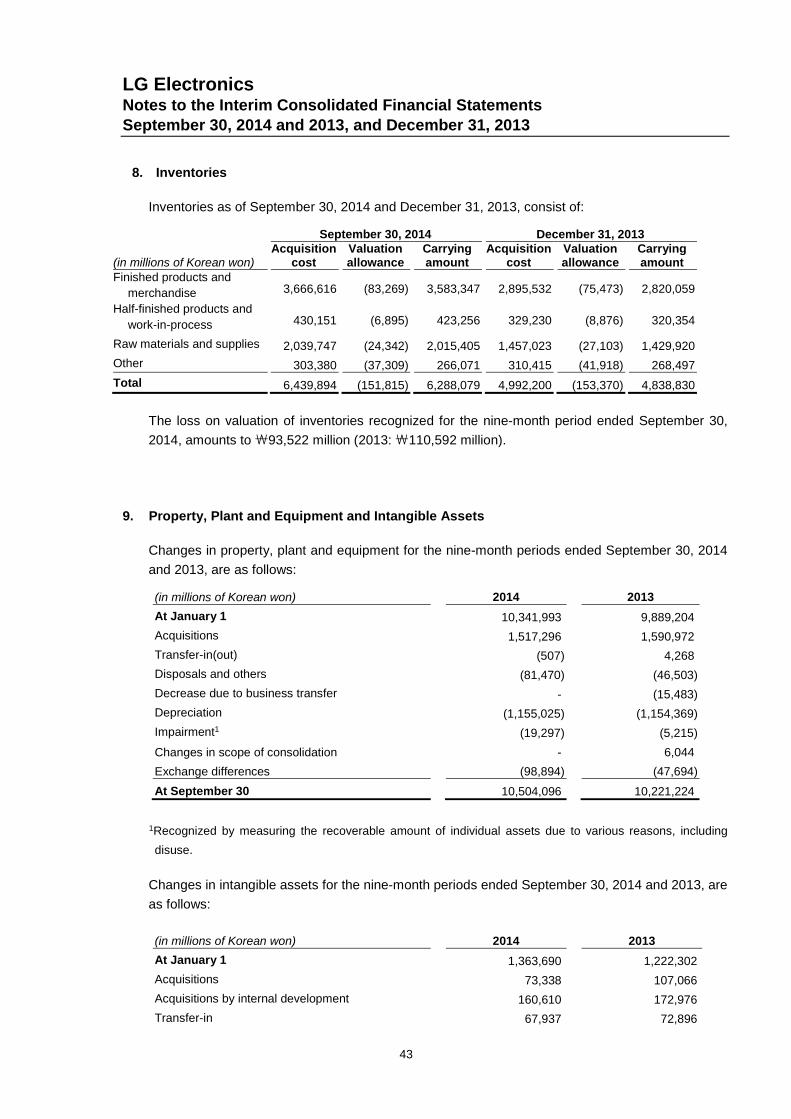
LG ElectronicsNotes to the Interim Consolidated Financial StatementsSeptember 30, 2014 and 2013, and December 31, 2013
43
8. Inventories
Inventories as of September 30, 2014 and December 31, 2013, consist of:
September 30, 2014 December 31, 2013
(in millions of Korean won)Acquisition
costValuationallowance
Carryingamount
Acquisitioncost
Valuationallowance
Carryingamount
Finished products and
merchandise 3,666,616 (83,269) 3,583,347 2,895,532 (75,473) 2,820,059
Half-finished products and
work-in-process 430,151 (6,895) 423,256 329,230 (8,876) 320,354
Raw materials and supplies 2,039,747 (24,342) 2,015,405 1,457,023 (27,103) 1,429,920
Other 303,380 (37,309) 266,071 310,415 (41,918) 268,497
Total 6,439,894 (151,815) 6,288,079 4,992,200 (153,370) 4,838,830
The loss on valuation of inventories recognized for the nine-month period ended September 30,
2014, amounts to₩93,522 million (2013:₩110,592 million).
9. Property, Plant and Equipment and Intangible Assets
Changes in property, plant and equipment for the nine-month periods ended September 30, 2014
and 2013, are as follows:
(in millions of Korean won) 2014 2013
At January 1 10,341,993 9,889,204
Acquisitions 1,517,296 1,590,972
Transfer-in(out) (507) 4,268
Disposals and others (81,470) (46,503)
Decrease due to business transfer - (15,483)
Depreciation (1,155,025) (1,154,369)
Impairment1 (19,297) (5,215)
Changes in scope of consolidation - 6,044
Exchange differences (98,894) (47,694)
At September 30 10,504,096 10,221,224
1Recognized by measuring the recoverable amount of individual assets due to various reasons, including
disuse.
Changes in intangible assets for the nine-month periods ended September 30, 2014 and 2013, are
as follows:
(in millions of Korean won) 2014 2013
At January 1 1,363,690 1,222,302
Acquisitions 73,338 107,066
Acquisitions by internal development 160,610 172,976
Transfer-in 67,937 72,896

LG ElectronicsNotes to the Interim Consolidated Financial StatementsSeptember 30, 2014 and 2013, and December 31, 2013
44
(in millions of Korean won) 2014 2013
Disposals and others (19,447) (14,448)
Decrease due to business transfer - (731)
Amortization (323,643) (277,605)
Impairment1 (11,570) (4,044)
Changes in scope of consolidation - 5,934
Exchange differences (1,486) (464)
At September 30 1,309,429 1,283,882
1Recognized by measuring the recoverable amount of individual assets due to various reasons, including
disuse.
10. Investments in Associates and Joint Ventures
(a) Investments in associates and joint ventures
i) Carrying amounts of investments in associates and joint ventures, as of September 30,
2014 and December 31, 2013, are as follows:
(in millions of Korean won) September 30, 2014 December 31, 2013
Associates 4,271,173 4,149,345
Joint ventures 179,522 180,238
Total 4,450,695 4,329,583
ii) Investments in associates as of September 30, 2014 and December 31, 2013, are as
follows:
September 30, 2014 December 31, 2013
(in millions of Korean won)Acquisition
costNet assetamount
Unrealizedgain
Carryingamount
Acquisitioncost
Net assetamount
Unrealizedgain
Carryingamount
LG Display Co., Ltd. 679,218 4,194,481 (55,451) 4,139,030 679,218 4,022,016 (46,916) 3,975,100
Ericsson-LG Co., Ltd 26,629 78,666 (74) 78,592 26,629 89,445 (107) 89,338Hitachi-LG Data StorageInc.(HLDS) 51,184 (2,371) (1,120) - 51,184 29,930 (1,921) 28,009
Global OLED TechnologyLLC. 53,454 28,050 - 28,050 53,454 30,767 - 30,767
Korea InformationCertificate Authority Inc. 852 3,141 - 3,141 852 2,890 - 2,890
LG Fuel Cell Systems Inc. 44,051 19,133 - 19,133 36,785 20,102 - 20,102
SKT Vietnam PTE., Ltd.1 72,194 717 - - 72,194 739 - -
One-Red, LLC2 3,128 3,227 - 3,227 3,128 3,139 - 3,139
Total 930,710 4,325,044 (56,645) 4,271,173 923,444 4,199,028 (48,944) 4,149,345
1 The use of the equity method is discontinued as impairment losses were recognized in full during 2009.
2 The financial statements as of August 31, 2013 were used due to a different closing date.
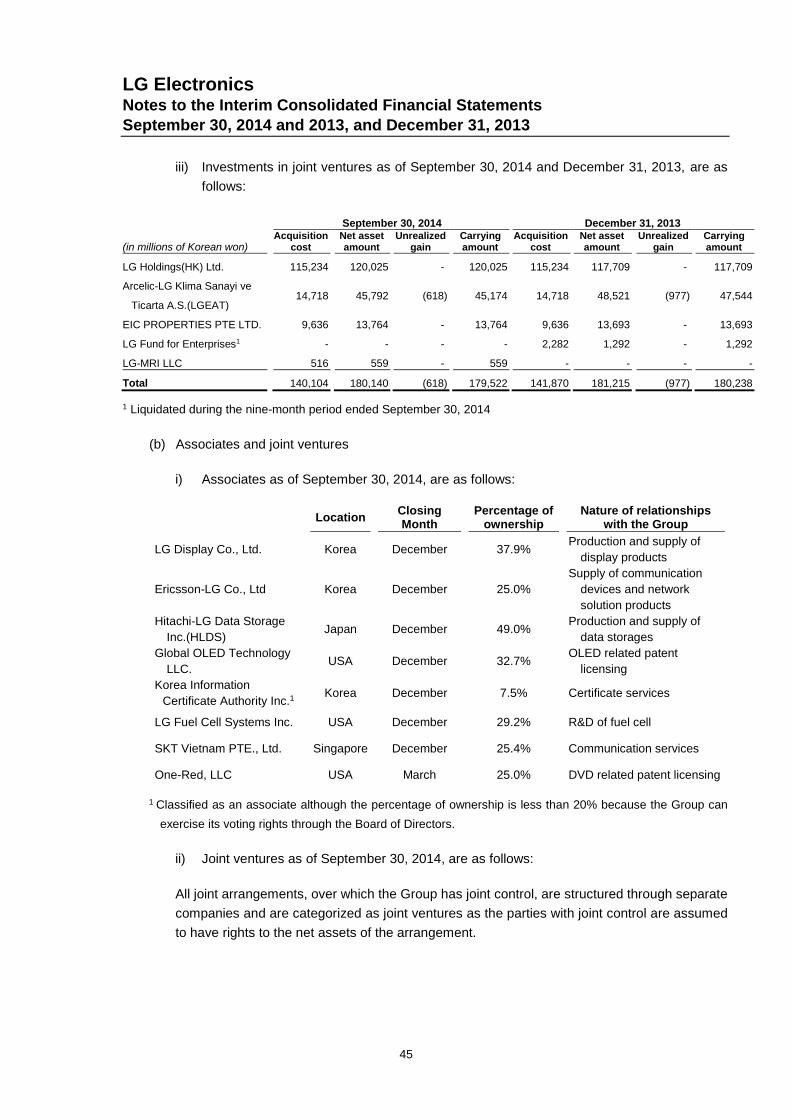
LG ElectronicsNotes to the Interim Consolidated Financial StatementsSeptember 30, 2014 and 2013, and December 31, 2013
45
iii) Investments in joint ventures as of September 30, 2014 and December 31, 2013, are as
follows:
September 30, 2014 December 31, 2013
(in millions of Korean won)Acquisition
costNet assetamount
Unrealizedgain
Carryingamount
Acquisitioncost
Net assetamount
Unrealizedgain
Carryingamount
LG Holdings(HK) Ltd. 115,234 120,025 - 120,025 115,234 117,709 - 117,709
Arcelic-LG Klima Sanayi ve
Ticarta A.S.(LGEAT)14,718 45,792 (618) 45,174 14,718 48,521 (977) 47,544
EIC PROPERTIES PTE LTD. 9,636 13,764 - 13,764 9,636 13,693 - 13,693
LG Fund for Enterprises1 - - - - 2,282 1,292 - 1,292
LG-MRI LLC 516 559 - 559 - - - -
Total 140,104 180,140 (618) 179,522 141,870 181,215 (977) 180,238
1 Liquidated during the nine-month period ended September 30, 2014
(b) Associates and joint ventures
i) Associates as of September 30, 2014, are as follows:
LocationClosingMonth
Percentage ofownership
Nature of relationshipswith the Group
LG Display Co., Ltd. Korea December 37.9%Production and supply of
display products
Ericsson-LG Co., Ltd Korea December 25.0%
Supply of communication
devices and network
solution products
Hitachi-LG Data Storage
Inc.(HLDS)Japan December 49.0%
Production and supply of
data storages
Global OLED Technology
LLC.USA December 32.7%
OLED related patent
licensing
Korea Information
Certificate Authority Inc.1Korea December 7.5% Certificate services
LG Fuel Cell Systems Inc. USA December 29.2% R&D of fuel cell
SKT Vietnam PTE., Ltd. Singapore December 25.4% Communication services
One-Red, LLC USA March 25.0% DVD related patent licensing
1 Classified as an associate although the percentage of ownership is less than 20% because the Group can
exercise its voting rights through the Board of Directors.
ii) Joint ventures as of September 30, 2014, are as follows:
All joint arrangements, over which the Group has joint control, are structured through separate
companies and are categorized as joint ventures as the parties with joint control are assumed
to have rights to the net assets of the arrangement.

LG ElectronicsNotes to the Interim Consolidated Financial StatementsSeptember 30, 2014 and 2013, and December 31, 2013
46
(in millions of Korean won)Location
Closingmonth
Percentage ofownership
Nature of relationshipswith the Group
LG Holdings(HK) Ltd. China December 49.0% Real estate
Arcelic-LG Klima Sanayi ve
Ticarta A.S.(LGEAT)Turkey December 50.0%
Production and supply of air
conditioning products
EIC PROPERTIES PTE
LTD.Singapore December 38.2% Real estate
LG-MRI LLC USA December 50.0%Production and supply of
digital display products
iii) All associates and joint ventures are accounted for using the equity method.
(c) Changes in the carrying amounts of investments in associates and joint ventures
i) Changes in the carrying amounts of investments in associates for the nine-month periods
ended September 30, 2014 and 2013, are as follows:
(in millions of Korean won) 2014 2013
Opening carrying amount 4,149,345 4,005,768
Acquisitions 7,266 46,628
Gain from equity method 158,624 80,140
Share of remeasurements for the net
defined benefit liability of associates(1,054) 82
Share of other comprehensive
income(loss) (excluding
remeasurements) of associates(26,327) 3,110
Dividend/ recovery (17,060) (10,250)
Exchange differences (7) (76)
Changes in ownership interest over
associates386 -
Closing carrying amount 4,271,173 4,125,402
ii) Changes in the carrying amounts of investments in joint ventures for the nine-month
periods ended September 30, 2014 and 2013, are as follows:
(in millions of Korean won) 2014 2013
Opening carrying amount 180,238 177,110
Acquisition 516 -
Gain from equity method 5,744 15,085
Share of other comprehensive
income(loss) (excluding
remeasurements) of joint ventures(6,293) (6,424)
Dividend/ recovery (686) -
Exchange differences 3 -
Closing carrying amount 179,522 185,771

LG ElectronicsNotes to the Interim Consolidated Financial StatementsSeptember 30, 2014 and 2013, and December 31, 2013
47
(d) Summary of the consolidated financial information on an associate material to the reporting
entity is as follows:
- LG Display Co., Ltd. and its subsidiaries
(in millions of Korean won) September 30, 2014 December 31, 2013
Current assets 8,767,943 7,731,788
Non-current assets 13,921,177 13,983,496
Total assets 22,689,120 21,715,284
Current liabilities 7,548,692 6,788,919
Non-current liabilities 3,748,194 4,128,945
Total liabilities 11,296,886 10,917,864
Equity attributable to owners of LG Display
Co., Ltd.11,066,183 10,611,173
Non-controlling interests 326,051 186,247
Total equity 11,392,234 10,797,420
2014 2013
(in millions of Korean won)
Three
months
Nine
months
Three
months
Nine
months
Net sales 6,546,853 18,113,591 6,578,735 19,954,023
Profit for the period 354,129 528,198 239,417 345,811
Equity holders of LG Display Co., Ltd.
Profit for the period 349,804 528,180 244,997 352,231
Other comprehensive income(loss), net of tax 99,400 (73,170) (114,164) 11,056
Total comprehensive income, net of tax 449,204 455,010 130,833 363,287
Dividends received from associates - - - -
(e) Reconciliations of the summarized financial information of an associate material to the reporting
entity to the carrying amount of the Group’s interest for the nine-month periods ended
September 30, 2014 and 2013, are as follows:
- LG Display Co., Ltd. and its subsidiaries
(in millions of Korean won) 2014 2013
Opening equity attributable to owners of LG Display
Co., Ltd.10,611,173 10,209,039
Profit for the period 528,180 352,231
Other comprehensive income(loss), net of tax (73,170) 11,056
Closing equity attributable to owners of LG Display
Co., Ltd.11,066,183 10,572,326
Group ownership(%) 37.9 37.9
The Group’s share at the end of the reporting period 4,194,481 4,007,291
Unrealized loss (55,451) (53,316)
Carrying amount at the reporting date 4,139,030 3,953,975

LG ElectronicsNotes to the Interim Consolidated Financial StatementsSeptember 30, 2014 and 2013, and December 31, 2013
48
(f) The Group’s share in the operating results in the individually insignificant associates and joint
ventures for the nine-month periods ended September 30, 2014 and 2013, is as follows:
2014 2013
(in millions of Korean won) Associates Joint ventures Associates Joint ventures
Three
months
Nine
months
Three
months
Nine
months
Three
months
Nine
months
Three
months
Nine
months
Profit(loss) for the period (5,076) (33,015) 924 5,365 (7,406) (46,685) 1,394 15,188
Other comprehensive
income (loss), net of tax1,307 269 3,653 (6,293) (7,471) (1,032) (16,024) (6,424)
Total comprehensive
income(loss), net of tax (3,769) (32,746) 4,577 (928) (14,877) (47,717) (14,630) 8,764
(g) Accumulated comprehensive income and loss that were not recognized due to discontinuation
of the equity method for the nine-month period ended September 30, 2014 and the year ended
December 31, 2013, are as follows:
September 30, 2014 December 31, 2013
(in millions of Korean won)
Losses of the
equity-method
investees
Accumulated losses
of the equity-
method investees
Losses of the
equity-method
investees
Accumulated losses
of the equity-
method investees
SKT Vietnam PTE., Ltd. 22 52,116 6,701 52,094
Hitachi-LG Data Storage
Inc.(HLDS) 3,491 3,491 - -
(h) The fair value and book value of marketable associate securities as of September 30, 2014 and
December 31, 2013, are as follows:
September 30, 2014
Name
Type Shares held
(Unit: shares)
Price per share
(Unit: won)
Fair value Book value
(in millions of Korean won)
LG Display Co., Ltd. Associate 135,625,000 34,000 4,611,250 4,139,030
Korea Information
Certificate
Authority Inc.1Associate 2,000,000 4,125 8,250 3,141
December 31, 2013
Name
Type Shares held
(Unit: shares)
Price per share
(Unit: won)
Fair value Book value
(in millions of Korean won)
LG Display Co., Ltd. Associate 135,625,000 25,350 3,438,094 3,975,100
1Listed on KOSDAQ during the nine-month period ended September 30, 2014.
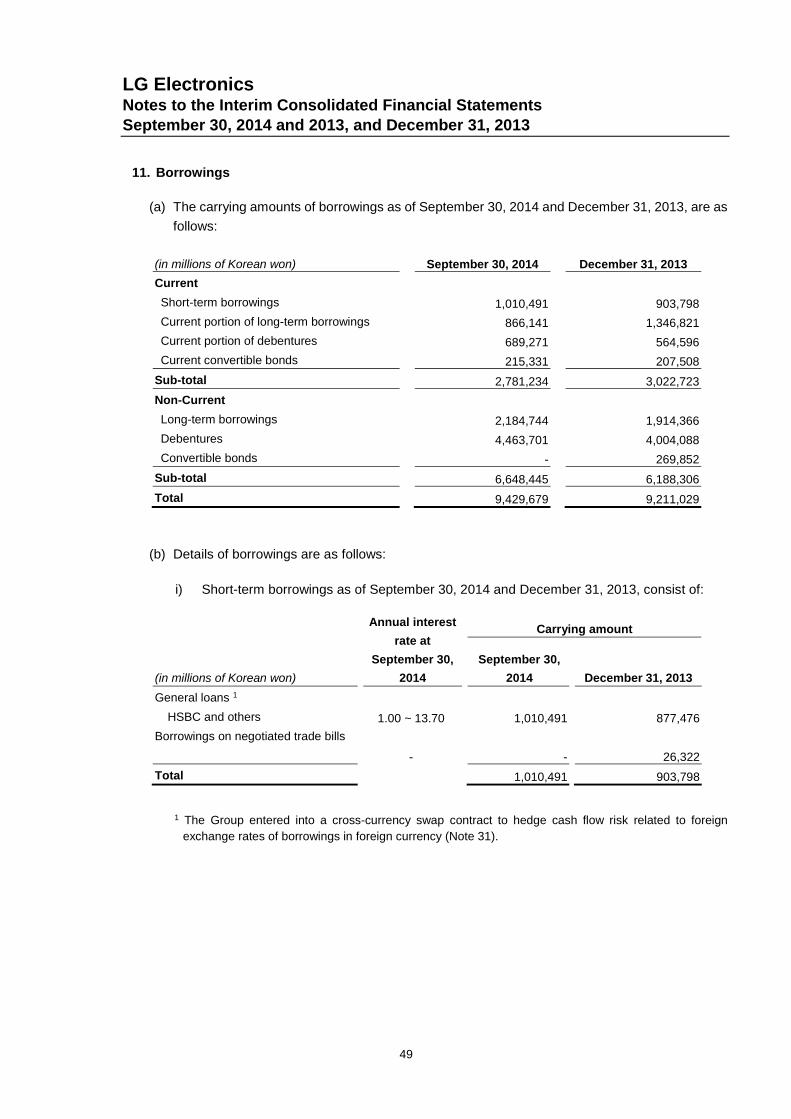
LG ElectronicsNotes to the Interim Consolidated Financial StatementsSeptember 30, 2014 and 2013, and December 31, 2013
49
11. Borrowings
(a) The carrying amounts of borrowings as of September 30, 2014 and December 31, 2013, are as
follows:
(in millions of Korean won) September 30, 2014 December 31, 2013
Current
Short-term borrowings 1,010,491 903,798
Current portion of long-term borrowings 866,141 1,346,821
Current portion of debentures 689,271 564,596
Current convertible bonds 215,331 207,508
Sub-total 2,781,234 3,022,723
Non-Current
Long-term borrowings 2,184,744 1,914,366
Debentures 4,463,701 4,004,088
Convertible bonds - 269,852
Sub-total 6,648,445 6,188,306
Total 9,429,679 9,211,029
(b) Details of borrowings are as follows:
i) Short-term borrowings as of September 30, 2014 and December 31, 2013, consist of:
1 The Group entered into a cross-currency swap contract to hedge cash flow risk related to foreign
exchange rates of borrowings in foreign currency (Note 31).
(in millions of Korean won)
Annual interest
rate at
September 30,
2014
Carrying amount
September 30,
2014 December 31, 2013
General loans 1
HSBC and others 1.00 ~ 13.70 1,010,491 877,476
Borrowings on negotiated trade bills
- - 26,322
Total 1,010,491 903,798

LG ElectronicsNotes to the Interim Consolidated Financial StatementsSeptember 30, 2014 and 2013, and December 31, 2013
50
ii) Long-term borrowings as of September 30, 2014 and December 31, 2013, consist of:
Annual interest
rate at
September 30,
2014(%)
September 30, 2014
(in millions of Korean won) Maturity date Total Current Non-current
Local currency loans
Kookmin Bank 2014.11.12 4.62 150,000 150,000 -
Kookmin Bank 2014.12.10 4.72 12,500 12,500 -
Kookmin Bank 2015.3.4 5.16 55,000 55,000 -
Kookmin Bank 2016.5.24 4.73 190,000 - 190,000
Kookmin Bank1 2029.4.30 3M CD+1.14 200,000 - 200,000
Shinhan Bank 2016.5.22 2.75 100 67 33
Shinhan Bank 2016.10.19 4.37 118,750 47,500 71,250
Shinhan Bank 2017.2.16 4.60 190,000 - 190,000
Shinhan Bank 2017.2.27 3.63 50,000 - 50,000
Shinhan Bank 2017.9.15 1.75 671 224 447
IBK Securities 2016.10.14 3.35 83,774 - 83,774
Woori Bank 2017.10.28 4.62 190,000 - 190,000
Hana Bank 2015.6.28 3.11 270 270 -
Hana Bank 2015.9.28 3.11 240 240 -
Hana Bank 2016.3.28 3.11 990 660 330
Hana Bank1 2024.1.3 3M CD+0.98 200,000 - 200,000
Korea Development Bank 2014.11.24 4.55 150,000 150,000 -
Korea Development Bank 2014.12.24 4.71 140,000 140,000 -
Korea Development Bank 2015.3.10 5.06 90,000 90,000 -
Korea Development Bank 2016.5.9 3.84 30,000 - 30,000
Korea Development Bank 2018.5.28 3.76 50,000 - 50,000
Korea Finance Corporation 2015.2.28 4.80 100,000 100,000 -
Korea Finance Corporation 2015.9.13 4.57 80,000 80,000 -
Korea Finance Corporation 2015.12.24 4.64 40,000 - 40,000
Korea Finance Corporation 2016.4.20 4.63 30,000 - 30,000
Korea Finance Corporation 2016.7.27 3.81 50,000 - 50,000
Korea Finance Corporation 2016.7.27 3.78 50,000 - 50,000
Korea Finance Corporation 2016.7.27 3.71 30,000 - 30,000
Korea Finance Corporation 2016.7.27 3.75 20,000 - 20,000
Korea Finance Corporation 2017.2.28 3.58 70,000 - 70,000
Korea Finance Corporation 2017.2.28 3.76 30,000 - 30,000
Korea Finance Corporation 2017.2.28 4.01 40,000 - 40,000
Korea Finance Corporation 2017.2.29 3.97 130,000 - 130,000
Korea Finance Corporation 2017.3.29 4.62 190,000 - 190,000
Foreign currency loans
HSBC and others2016.3.31 ~2019.6.17 1.66 ~ 10.40 288,590 39,680 248,910
Total 3,050,885 866,141 2,184,744
1 The Group entered into an interest rate swap contract to hedge cash flow risk related to floating interest
rates (Note 31).

LG ElectronicsNotes to the Interim Consolidated Financial StatementsSeptember 30, 2014 and 2013, and December 31, 2013
51
Annual interest
rate at December
31, 2013(%)
December 31, 2013
(in millions of Korean won) Maturity date Total Current Non-current
Local currency loans
Kookmin Bank 2014.11.12 4.62 150,000 150,000 -
Kookmin Bank 2014.12.10 4.72 50,000 50,000 -
Kookmin Bank 2015. 3. 4 5.16 110,000 82,500 27,500
Kookmin Bank 2016. 5.24 4.73 190,000 - 190,000
Nonghyup Bank 2014. 3. 9 4.70 190,000 190,000 -
Shinhan Bank 2014. 9. 8 4.78 22,500 22,500 -
Shinhan Bank 2016. 5.22 2.75 149 66 83
Shinhan Bank 2016.10.19 4.37 142,500 47,500 95,000
Shinhan Bank 2017. 2.16 4.60 190,000 - 190,000
Shinhan Bank 2017. 2.27 3.63 50,000 - 50,000
Shinhan Bank 2017. 9.15 1.75 839 224 615
IBK Securities 2016.10.14 3.35 81,599 - 81,599
Woori Bank 2015. 5. 8 3.85 10,000 - 10,000
Woori Bank 2017.10.28 4.62 190,000 - 190,000
Small & Medium BusinessCorporation 2014.11.16 3.97 68 68 -
Hana Bank 2014. 3.28 2.92 160 160 -
Hana Bank 2015. 6.28 3.22 540 360 180
Hana Bank 2015. 9.28 3.22 420 240 180
Hana Bank 2016. 3.28 3.22 1,485 660 825
Korea Development Bank 2014. 4. 5 4.45 190,000 190,000 -
Korea Development Bank 2014.11.24 4.55 150,000 150,000 -
Korea Development Bank 2014.12.24 4.71 140,000 140,000 -
Korea Development Bank 2015. 3.10 5.06 90,000 - 90,000
Korea Development Bank 2015. 5. 4 4.52 10,000 10,000
Korea Development Bank 2018. 5.28 3.76 50,000 - 50,000
Korea EXIM Bank 2014. 6. 2 4.90 60,000 60,000 -
Korea Finance Corporation 2014. 2.28 4.56 90,000 90,000 -
Korea Finance Corporation 2015. 2.28 4.80 100,000 - 100,000
Korea Finance Corporation 2015. 9.13 4.57 80,000 - 80,000
Korea Finance Corporation 2015.12.24 4.64 40,000 - 40,000
Korea Finance Corporation 2016. 4.20 4.63 30,000 - 30,000
Korea Finance Corporation 2016. 7.27 3.81 50,000 - 50,000
Korea Finance Corporation 2016. 7.27 3.78 50,000 - 50,000
Korea Finance Corporation 2016. 7.27 3.71 30,000 - 30,000
Korea Finance Corporation 2016. 7.27 3.75 20,000 - 20,000
Korea Finance Corporation 2017. 2.28 3.58 70,000 - 70,000
Korea Finance Corporation 2017. 2.28 3.76 30,000 - 30,000
Korea Finance Corporation 2017. 2.28 4.01 40,000 - 40,000
Korea Finance Corporation 2017. 3.29 4.62 190,000 - 190,000

LG ElectronicsNotes to the Interim Consolidated Financial StatementsSeptember 30, 2014 and 2013, and December 31, 2013
52
Annual interest
rate at December
31, 2013(%)
December 31, 2013
(in millions of Korean won) Maturity date Total Current Non-current
Foreign currency loans
HSBC and others2016. 3.31~2018.10.15 1.26 ~ 10.40 370,927 172,543 198,384
Total 3,261,187 1,346,821 1,914,366
iii) Debentures as of September 30, 2014 and December 31, 2013, consist of:
Maturitydate
Annual interestrate at
September 30,2014 (%)
September 30, 2014
(in millions of Korean won) Total Current Non-current
Fixed rate notes in local currency Public, non-guaranteed bonds(28th) 2015.11.29 5.10 200,000 - 200,000
Fixed rate notes in local currency Public, non-guaranteed bonds(29th) 2015.2.24 5.01 190,000 190,000 -
Fixed rate notes in local currency Public, non-guaranteed bonds(30-1st) 2015.2.9 4.32 30,000 30,000 -
Fixed rate notes in local currency Public, non-guaranteed bonds(30-2nd) 2017.2.9 4.90 50,000 - 50,000
Fixed rate notes in local currency Public, non-guaranteed bonds(31-1st) 2016.11.12 3.61 70,000 - 70,000
Fixed rate notes in local currency Public, non-guaranteed bonds(31-2nd) 2017.11.12 3.73 80,000 - 80,000
Fixed rate notes in local currency Public, non-guaranteed bonds (56th) 2015.9.9 4.63 190,000 190,000 -
Fixed rate notes in local currency Public, non-guaranteed bonds (57th) 2015.10.22 4.30 190,000 - 190,000
Fixed rate notes in local currency Public, non-guaranteed bonds (58-2nd) 2016.2.16 4.91 60,000 - 60,000
Fixed rate notes in local currency Public, non-guaranteed bonds (60th) 2016.5.20 4.41 190,000 - 190,000
Fixed rate notes in local currency Public, non-guaranteed bonds (61st) 2016.6.29 4.38 190,000 - 190,000
Fixed rate notes in local currency Public, non-guaranteed bonds (62-2nd) 2016.8.5 4.34 80,000 - 80,000
Fixed rate notes in local currency Public, non-guaranteed bonds (64th) 2016.9.30 4.32 190,000 - 190,000
Fixed rate notes in foreign currency Public, non-guaranteed bonds (65th)1 2016.12.2 2.00 237,504 - 237,504
Fixed rate notes in local currency Public, non-guaranteed bonds (66-1st) 2015.9.10 3.18 170,000 170,000 -
Fixed rate notes in local currency Public, non-guaranteed bonds (66-2nd) 2017.9.10 3.28 130,000 - 130,000
Fixed rate notes in local currency Private, non-guaranteed bonds(67th) 2018.3.21 3.11 300,000 - 300,000
Fixed rate notes in local currency Private, non-guaranteed bonds(68-1st) 2020.5.23 3.29 100,000 - 100,000
Fixed rate notes in local currency Private, non-guaranteed bonds(68-2nd) 2020.5.24 3.29 20,000 - 20,000
Fixed rate notes in local currency Private, non-guaranteed bonds(68-3rd) 2023.5.22 3.68 50,000 - 50,000
Fixed rate notes in local currency Private, non-guaranteed bonds(68-4th) 2023.5.23 3.68 30,000 - 30,000
Fixed rate notes in local currency Public, non-guaranteed bonds(69-1st) 2015.7.31 2.86 110,000 110,000 -
Fixed rate notes in local currency Public, non-guaranteed bonds(69-2nd) 2018.7.31 3.54 140,000 - 140,000
Fixed rate notes in local currency Public, non-guaranteed bonds(69-3rd) 2020.7.31 3.85 150,000 - 150,000
Floating rate notes in foreign currency Private, guaranteed bonds(70th) 1 2019.1.31 3ML+1.60 210,120 - 210,120
Fixed rate notes in local currency Public, non-guaranteed bonds(71-1st) 2018.10.18 3.55 200,000 - 200,000
Fixed rate notes in local currency Public, non-guaranteed bonds(71-2nd) 2020.10.19 3.82 110,000 - 110,000

LG ElectronicsNotes to the Interim Consolidated Financial StatementsSeptember 30, 2014 and 2013, and December 31, 2013
53
Maturitydate
Annual interestrate at
September 30,2014 (%)
September 30, 2014
(in millions of Korean won) Total Current Non-current
Fixed rate notes in local currency Public, non-guaranteed bonds(71-3rd) 2023.10.18 4.25 90,000 - 90,000
Floating rate notes in foreign currency Private, non-guaranteed bonds(72nd) 1 2017.6.19 3ML+1.30 210,120 - 210,120
Fixed rate notes in local currency Public, non-guaranteed bonds(73-1st) 2017.1.24 3.16 100,000 - 100,000
Fixed rate notes in local currency Public, non-guaranteed bonds(73-2nd) 2019.1.24 3.60 120,000 - 120,000
Fixed rate notes in local currency Public, non-guaranteed bonds(73-3rd) 2021.1.25 3.95 160,000 - 160,000
Fixed rate notes in local currency Public, non-guaranteed bonds(73-4th) 2024.1.24 4.44 120,000 - 120,000
Fixed rate notes in local currency Public, non-guaranteed bonds(74-1st) 2019.5.29 3.30 200,000 - 200,000
Fixed rate notes in local currency Public, non-guaranteed bonds(74-2nd) 2021.5.29 3.52 130,000 - 130,000
Fixed rate notes in local currency Public, non-guaranteed bonds(74-3rd) 2024.5.29 4.04 210,000 - 210,000
Fixed rate notes in local currency Public, non-guaranteed bonds(74-4th) 2029.5.29 4.44 60,000 - 60,000
Fixed rate notes in local currency Private, non-guaranteed bonds(75th) 2026.7.16 3.96 100,000 - 100,000
Less: discount on debentures (14,772) (729) (14,043)
Total 5,152,972 689,271 4,463,701
Maturitydate
Annual interestrate at
December 31,2013(%)
December 31, 2013
(in millions of Korean won) Total Current Non-current
Fixed rate notes in local currency Public, non-guaranteed bonds(25-2nd) 2014. 2. 9 5.70 150,000 150,000 -
Fixed rate notes in local currency Public, non-guaranteed bonds(28th) 2015.11.29 5.10 200,000 - 200,000
Fixed rate notes in local currency Public, non-guaranteed bonds(29th) 2015. 2.24 5.01 200,000 - 200,000
Fixed rate notes in local currency Public, non-guaranteed bonds(30-1st) 2015. 2. 9 4.32 50,000 - 50,000
Fixed rate notes in local currency Public, non-guaranteed bonds(30-2nd) 2017. 2. 9 4.90 50,000 - 50,000
Fixed rate notes in local currency Public, non-guaranteed bonds(31-1st) 2016.11.12 3.61 70,000 - 70,000
Fixed rate notes in local currency Public, non-guaranteed bonds(31-2nd) 2017.11.12 3.73 80,000 - 80,000
Fixed rate notes in local currency Public, non-guaranteed bonds (56th) 2015. 9. 9 4.63 190,000 - 190,000
Fixed rate notes in local currency Public, non-guaranteed bonds (57th) 2015.10.22 4.30 190,000 - 190,000
Fixed rate notes in local currency Public, non-guaranteed bonds (58-1st) 2014. 2.16 4.44 130,000 130,000 -
Fixed rate notes in local currency Public, non-guaranteed bonds (58-2nd) 2016. 2.16 4.91 60,000 - 60,000
Floating rate notes in foreign currency Public, non-guaranteed bonds (59th)1 2014. 4.28 3ML+1.00 179,401 179,401 -
Fixed rate notes in local currency Public, non-guaranteed bonds (60th) 2016. 5.20 4.41 190,000 - 190,000
Fixed rate notes in local currency Public, non-guaranteed bonds (61st) 2016. 6.29 4.38 190,000 - 190,000
Fixed rate notes in local currency Public, non-guaranteed bonds (62-2nd) 2016. 8. 5 4.34 80,000 - 80,000
Floating rate notes in foreign currency Private, non-guaranteed bonds(63rd)1 2014. 8.23 3ML+0.70 105,530 105,530 -
Fixed rate notes in local currency Public, non-guaranteed bonds (64th) 2016. 9.30 4.32 190,000 - 190,000
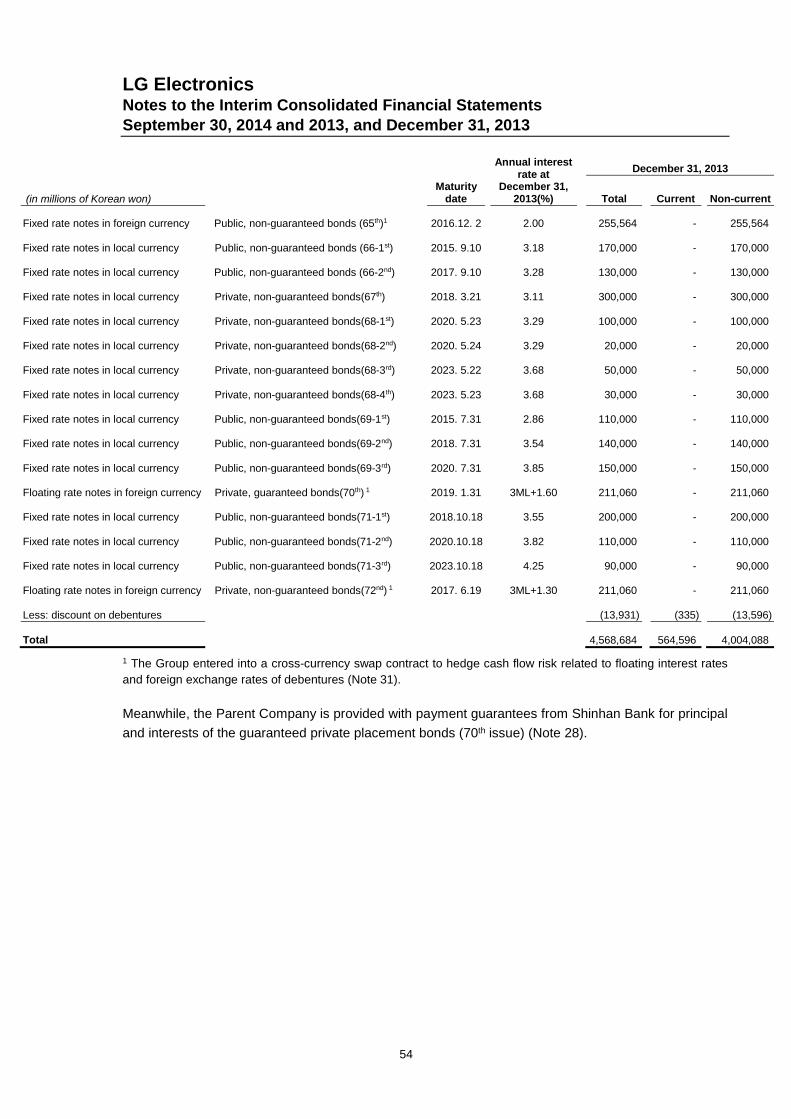
LG ElectronicsNotes to the Interim Consolidated Financial StatementsSeptember 30, 2014 and 2013, and December 31, 2013
54
Maturitydate
Annual interestrate at
December 31,2013(%)
December 31, 2013
(in millions of Korean won) Total Current Non-current
Fixed rate notes in foreign currency Public, non-guaranteed bonds (65th)1 2016.12. 2 2.00 255,564 - 255,564
Fixed rate notes in local currency Public, non-guaranteed bonds (66-1st) 2015. 9.10 3.18 170,000 - 170,000
Fixed rate notes in local currency Public, non-guaranteed bonds (66-2nd) 2017. 9.10 3.28 130,000 - 130,000
Fixed rate notes in local currency Private, non-guaranteed bonds(67th) 2018. 3.21 3.11 300,000 - 300,000
Fixed rate notes in local currency Private, non-guaranteed bonds(68-1st) 2020. 5.23 3.29 100,000 - 100,000
Fixed rate notes in local currency Private, non-guaranteed bonds(68-2nd) 2020. 5.24 3.29 20,000 - 20,000
Fixed rate notes in local currency Private, non-guaranteed bonds(68-3rd) 2023. 5.22 3.68 50,000 - 50,000
Fixed rate notes in local currency Private, non-guaranteed bonds(68-4th) 2023. 5.23 3.68 30,000 - 30,000
Fixed rate notes in local currency Public, non-guaranteed bonds(69-1st) 2015. 7.31 2.86 110,000 - 110,000
Fixed rate notes in local currency Public, non-guaranteed bonds(69-2nd) 2018. 7.31 3.54 140,000 - 140,000
Fixed rate notes in local currency Public, non-guaranteed bonds(69-3rd) 2020. 7.31 3.85 150,000 - 150,000
Floating rate notes in foreign currency Private, guaranteed bonds(70th) 1 2019. 1.31 3ML+1.60 211,060 - 211,060
Fixed rate notes in local currency Public, non-guaranteed bonds(71-1st) 2018.10.18 3.55 200,000 - 200,000
Fixed rate notes in local currency Public, non-guaranteed bonds(71-2nd) 2020.10.18 3.82 110,000 - 110,000
Fixed rate notes in local currency Public, non-guaranteed bonds(71-3rd) 2023.10.18 4.25 90,000 - 90,000
Floating rate notes in foreign currency Private, non-guaranteed bonds(72nd) 1 2017. 6.19 3ML+1.30 211,060 - 211,060
Less: discount on debentures (13,931) (335) (13,596)
Total 4,568,684 564,596 4,004,088
1 The Group entered into a cross-currency swap contract to hedge cash flow risk related to floating interest rates
and foreign exchange rates of debentures (Note 31).
Meanwhile, the Parent Company is provided with payment guarantees from Shinhan Bank for principal
and interests of the guaranteed private placement bonds (70th issue) (Note 28).

LG ElectronicsNotes to the Interim Consolidated Financial StatementsSeptember 30, 2014 and 2013, and December 31, 2013
55
iv) Details of LG Innotek’s Co., Ltd. convertible bonds as of September 30, 2014 and
December 31, 2013, are as follows:
(in millions of Korean won)
September 30, 2014
Issue date
Redemption
date
Carrying
amount Current Non-current
Convertible bonds(27th)1 2010.11.11 2014.11.11 199,928 199,928 -
Add: Redemption premium 16,608 16,608 -
Less: Adjustment for conversion
right and discount on bonds(1,205) (1,205) -
Total 215,331 215,331 -
(in millions of Korean won)
December 31, 2013
Issue date
Redemption
date
Carrying
amount Current Non-current
Convertible bonds(27th)1 2010.11.11 2014.11.11 199,961 199,961 -
Convertible bonds(32nd)1 2013. 9.17 2016. 9.17 299,984 - 299,984
Add: Redemption premium 17,512 16,611 901
Less: Adjustment for conversion
right and discount on bonds (40,097) (9,064) (31,033)
Total 477,360 207,508 269,852
1 Terms and conditions of the 27th issue and 32nd issue convertible bonds, issued by LG Innotek Co., Ltd.,
a subsidiary, are as follows:
Type Convertible bonds(27th issue)Coupon rate 0%
Rate of return 2% (8.3071% terms of payment for redemption premium)
Exercise period 2010.12.11∼2014.10.11
Shares to be issued upon
exerciseRegistered common shares
Major terms and conditions 1. Exercise price : \150,000 per share
2. Right of claim for early redemption:
The early redemption of the bonds to repay the outstanding
balance can be exercised from when three years have elapsed
from the date of issue (November 11, 2013) until one month before
the maturity (October 11, 2014).
However, in order to exercise the early redemption, the closing
price of the common share of the issuing company must exceed
140% of the conversion price for 20 consecutive trading days since
the start of exercise period of the early redemption.
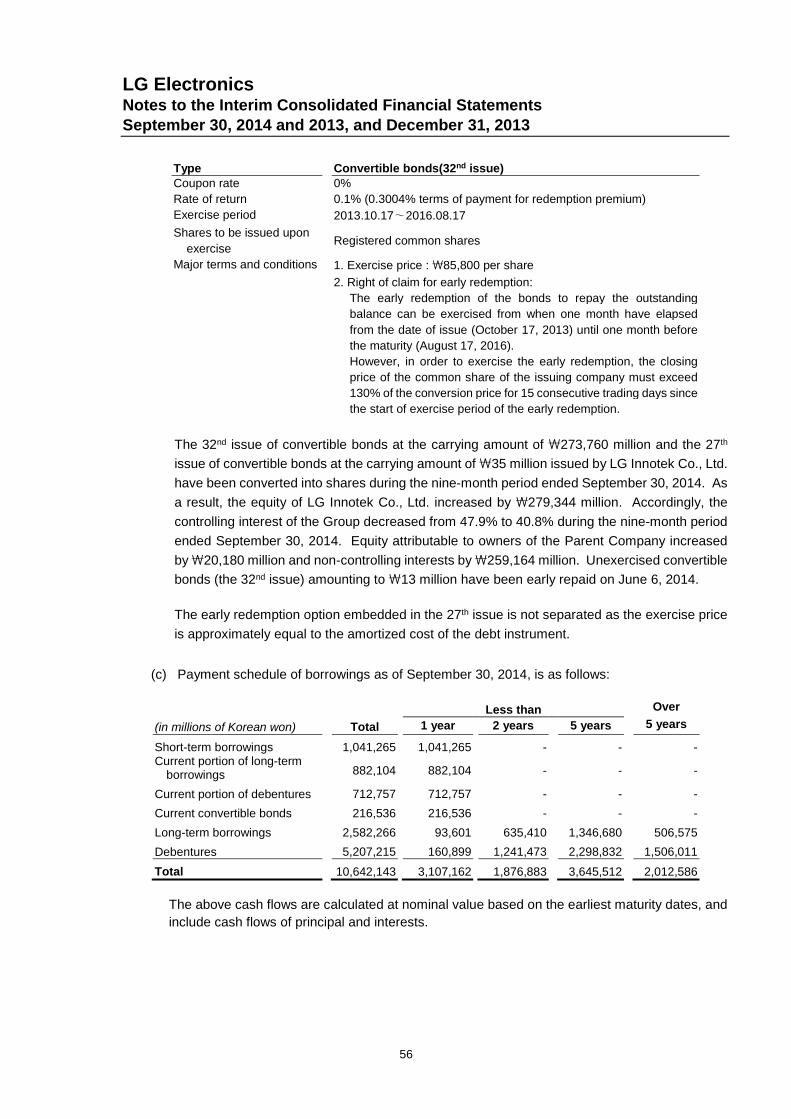
LG ElectronicsNotes to the Interim Consolidated Financial StatementsSeptember 30, 2014 and 2013, and December 31, 2013
56
Type Convertible bonds(32nd issue)Coupon rate 0%
Rate of return 0.1% (0.3004% terms of payment for redemption premium)
Exercise period 2013.10.17∼2016.08.17
Shares to be issued upon
exerciseRegistered common shares
Major terms and conditions 1. Exercise price : \85,800 per share
2. Right of claim for early redemption:
The early redemption of the bonds to repay the outstanding
balance can be exercised from when one month have elapsed
from the date of issue (October 17, 2013) until one month before
the maturity (August 17, 2016).
However, in order to exercise the early redemption, the closing
price of the common share of the issuing company must exceed
130% of the conversion price for 15 consecutive trading days since
the start of exercise period of the early redemption.
The 32nd issue of convertible bonds at the carrying amount of \273,760 million and the 27th
issue of convertible bonds at the carrying amount of\35 million issued by LG Innotek Co., Ltd.
have been converted into shares during the nine-month period ended September 30, 2014. As
a result, the equity of LG Innotek Co., Ltd. increased by \279,344 million. Accordingly, the
controlling interest of the Group decreased from 47.9% to 40.8% during the nine-month period
ended September 30, 2014. Equity attributable to owners of the Parent Company increased
by\20,180 million and non-controlling interests by\259,164 million. Unexercised convertible
bonds (the 32nd issue) amounting to \13 million have been early repaid on June 6, 2014.
The early redemption option embedded in the 27th issue is not separated as the exercise price
is approximately equal to the amortized cost of the debt instrument.
(c) Payment schedule of borrowings as of September 30, 2014, is as follows:
Less than Over
(in millions of Korean won) Total 1 year 2 years 5 years 5 years
Short-term borrowings 1,041,265 1,041,265 - - -Current portion of long-term
borrowings 882,104 882,104 - - -
Current portion of debentures 712,757 712,757 - - -
Current convertible bonds 216,536 216,536 - - -
Long-term borrowings 2,582,266 93,601 635,410 1,346,680 506,575
Debentures 5,207,215 160,899 1,241,473 2,298,832 1,506,011
Total 10,642,143 3,107,162 1,876,883 3,645,512 2,012,586
The above cash flows are calculated at nominal value based on the earliest maturity dates, and
include cash flows of principal and interests.

LG ElectronicsNotes to the Interim Consolidated Financial StatementsSeptember 30, 2014 and 2013, and December 31, 2013
57
12. Post-employment Benefits
Defined Benefit Plan
(a) The amounts recognized in the consolidated statements of financial position as of September
30, 2014 and December 31, 2013, are determined as follows:
(in millions of Korean won) September 30, 2014 December 31, 2013
Present value of funded obligations 2,162,040 1,849,385
Present value of unfunded obligations 35,158 33,549
Sub-total 2,197,198 1,882,934
Fair value of plan assets (1,268,678) (1,302,015)
Net defined benefit liability 928,520 580,919
(b) The amounts recognized in the consolidated statements of income for the three-month and
nine-month periods ended September 30, 2014 and 2013, are as follows:
2014 2013
(in millions of Korean won) Three months Nine months Three months Nine months
Current service cost 78,994 239,958 76,354 225,998
Net interest cost 6,462 18,914 5,108 15,383
Past service cost - 25,592 - -
Managing cost 335 1,113 343 1,021
Total 85,791 285,577 81,805 242,402
(c) The line items in which expenses are included for the three-month and nine-month periods
ended September 30, 2014 and 2013, are as follows:
2014 2013
(in millions of Korean won) Three months Nine months Three months Nine months
Manufacturing costs 39,795 139,136 41,392 121,522
Selling and marketing
expenses15,653 48,088 14,004 39,824
Administrative expenses 7,182 20,638 4,256 14,758
Research and
development expenses20,946 71,100 20,382 60,340
Service costs 2,215 6,615 1,771 5,958
Total 85,791 285,577 81,805 242,402

LG ElectronicsNotes to the Interim Consolidated Financial StatementsSeptember 30, 2014 and 2013, and December 31, 2013
58
(d) Changes in the defined benefit obligations for the nine-month periods ended September 30,
2014 and 2013, are as follows:
(in millions of Korean won) 2014 2013
At January 1 1,882,934 1,648,334
Current service cost 239,958 225,998
Interest expense 55,880 44,826
Past service cost 25,592 -
Remeasurements for:- Actuarial gain(loss) arising from changes
in financial assumptions 117,050 (23,374)
- Actuarial gain (loss) arising fromexperience adjustments (22,365) -
Benefits paid (100,797) (66,009)
Decrease due to business transfer - (4,251)
Business combinations and changes in
scope of consolidation- 1,521
Others (1,054) (2,278)
At September 30 2,197,198 1,824,767
(e) Changes in the fair value of plan assets for the nine-month periods ended September 30, 2014
and 2013, are as follows:
(in millions of Korean won) 2014 2013
At January 1 1,302,015 1,018,196
Interest income 36,966 29,443
Remeasurements for:
- Return on plan assets (6,669) (1,749)
Employer contributions 6,393 8,517
Benefits paid (68,908) (38,213)
Decrease due to business transfer - (2,939)
Business combinations and changes in
scope of consolidation- 979
Managing cost (1,113) (1,021)
Others (6) (525)
At September 30 1,268,678 1,012,688
(f) The principal actuarial assumptions used as of September 30, 2014 and December 31, 2013,
are as follows:
September 30, 2014 December 31, 2013
Weighted average of discount rate 3.4% 4.1%
Weighted average of future salary increase 6.1% 6.1%
The discount rates applied to the Parent Company and subsidiaries are between 0.9%~9.5% (2013:
0.9%~9.5%), and the expected rates of future salary increase are between 4.0%~13.0% (2013:
4.0%~13.0%).

LG ElectronicsNotes to the Interim Consolidated Financial StatementsSeptember 30, 2014 and 2013, and December 31, 2013
59
(g) The sensitivity analysis of the defined benefit obligation to changes in principal assumptions as
of September 30, 2014 and December 31, 2013, is as follows:
(in millions of Korean won) 1% increase 1% decrease
Discount rate (173,550) 199,816
Future salary increase 189,857 (175,973)
The above sensitivity analyses are based on a change in an assumption while holding all other
assumptions constant. In practice, this is unlikely to occur, and changes in some of the assumptions
may be correlated. The sensitivity of the defined benefit obligation to changes in principal actuarial
assumptions is calculated using the projected unit credit method, the same method applied when
calculating the defined benefit obligations.
(h) Plan assets as of September 30, 2014 and December 31, 2013, consist of:
(in millions of Korean won)
September 30, 2014 December 31, 2013
Amount Composition(%) Amount Composition(%)Securities combined with derivatives(principal and interest protected) 907,985 71.6 897,349 68.9
Time deposits and others 360,693 28.4 404,666 31.1
Total 1,268,678 100.0 1,302,015 100.0
Defined Contribution Plan
Recognized expense related to the defined contribution plan during the nine-month period ended
September 30, 2014, amounts to \ 6,533 million (2013: \ 6,293 million).
13. Provisions
Changes in provisions for the nine-month periods ended September 30, 2014 and 2013, are as
follows:
2014
(in millions of Korean won) Warranty Sales returns Restoration
Litigation
and others Total
At January 1, 2014 612,101 63,183 11,265 975,947 1,662,496
Additions 648,613 195,136 2,831 3,164 849,744
Utilizations (605,553) (189,644) (1,066) (21,555) (817,818)
Exchange differences (21,631) (2,728) (145) (10,761) (35,265)
At September 30, 2014 633,530 65,947 12,885 946,795 1,659,157
Current 577,251 65,947 - 41,380 684,578
Non-current 56,279 - 12,885 905,415 974,579

LG ElectronicsNotes to the Interim Consolidated Financial StatementsSeptember 30, 2014 and 2013, and December 31, 2013
60
2013
(in millions of Korean won) Warranty Sales returns Restoration
Litigation
and others Total
At January 1, 2013 598,329 61,498 8,882 908,444 1,577,153
Additions 721,539 196,180 2,521 107,642 1,027,882
Utilizations (717,463) (193,667) (835) (46,873) (958,838)
Exchange differences (8,863) (1,331) 61 (9,325) (19,458)
Increase due to business
combination 131 - - - 131
At September 30, 2013 593,673 62,680 10,629 959,888 1,626,870
Current 539,830 62,680 - 41,242 643,752
Non-current 53,843 - 10,629 918,646 983,118
14. Paid-in Capital
(a) As of September 30, 2014 and December 31, 2013, the number of shares authorized is 600
million.
The preferred shareholders have no voting rights and are entitled to preferred dividends at a rate of
one percentage point over that of common shares. This preferred dividend rate is not applicable to
stock dividends. In addition, the preferred shareholders have the same rights on the remaining
assets as common shareholders. Repayment and conversion are not applicable to preferred shares.
(b) Share premium balances are as follows:
(in millions of Korean won) September 30, 2014 December 31, 2013
Share premium 3,088,179 3,088,179
Share premium includes the amount of ₩1,876,153 million, less capital stock amounting to
₩783,961 million and capital adjustment amounting to ₩155,593 million from net book amount of
net assets amounting to₩2,815,707 million taken over upon the split-off on April 1, 2002. In addition,
the amount of ₩331,766 million paid in excess of par value at the issuance of common shares
(merged with LG IBMPC Co., Ltd.) and the exercise of conversion right and warrants in 2005 and
2006 are included. The excess in paid-in capital amounting to ₩880,260 million over the par value
was recognized as share premium at the issuance of common shares in 2011.
Par value
per share
(in won)
September 30, 2014 December 31, 2013
Number of
shares issued
Amount
(in millions)
Number of
shares issued
Amount
(in millions)
Common stock 5,000 163,647,814 818,239 163,647,814 818,239
Preferred stock 5,000 17,185,992 85,930 17,185,992 85,930
Total 180,833,806 904,169 180,833,806 904,169

LG ElectronicsNotes to the Interim Consolidated Financial StatementsSeptember 30, 2014 and 2013, and December 31, 2013
61
15. Retained Earnings
Retained earnings as of September 30, 2014 and December 31, 2013, consist of:
(in millions of Korean won) September 30, 2014 December 31, 2013
Legal reserve1153,190 149,503
Discretionary reserve25,666,922 5,872,588
Unappropriated retained earnings 3,560,434 2,863,432
Total 9,380,546 8,885,523
1 The Commercial Code of the Republic of Korea requires the Parent Company to appropriate, as a legal
reserve, an amount equal to a minimum of 10% of cash dividends paid until such reserve equals 50% of its
issued capital stock. The reserve is not available for the payment of cash dividends, but may be transferred
to capital stock or used to reduce accumulated deficit. When the accumulated legal reserves (the sum of
capital reserves and earned profit reserves) are greater than 1.5 times the paid-in capital amount, the excess
legal reserves may be distributed.2 The Parent Company separately accumulates a discretionary reserve for research and human resource
development through appropriation of retained earnings, which has been included as deductible expense for
the corporate income tax return according to the Special Tax Treatment Law. If reserves are reversed, the
amount may be distributed in accordance with the terms of related tax laws.
16. Accumulated Other Comprehensive Income (loss)
Details of accumulated other comprehensive income (loss) as of September 30, 2014 and
December 31, 2013, consist of:
(in millions of Korean won) September 30, 2014 December 31, 2013Accumulated other comprehensiveincome(loss) of associates and joint ventures (125,376) (92,756)
Cash flow hedge (20,817) 5,034
Available-for-sale financial assets 10,151 11,266
Currency translation differences (1,036,265) (830,984)
Total (1,172,307) (907,440)

LG ElectronicsNotes to the Interim Consolidated Financial StatementsSeptember 30, 2014 and 2013, and December 31, 2013
62
17. Other Components of Equity
Details of other components of equity as of September 30, 2014 and December 31, 2013, consist
of:
(in millions of Korean won) September 30, 2014 December 31, 2013
Treasury shares1 (44,893) (44,893)
Consideration for conversion rights 9,891 9,891
Gain on disposal of treasury shares 2,183 2,183
Capital transactions within the Group2 (177,430) (198,410)
Total (210,249) (231,229)
1 The Parent Company has treasury shares consisting of 763,168 common shares (2013: 763,168 common
shares) and 4,690 preferred shares (2013: 4,690 preferred shares) at the reporting date. The Parent
Company intends to either grant these treasury shares to employees and directors as compensation, or to
sell them in the future.
2 The amounts include gain (loss) from transactions with non-controlling interests and other reserves of
subsidiaries, net of related deferred tax. Changes during the period are due to the conversion of the
convertible bonds issued by LG Innotek Co., Ltd., amounting to \20,180 million, and due to the exercise of
appraisal rights for the shares of a subsidiary, LG-Shaker Co., Ltd., amounting to \800 million (Note 1).
18. Net Sales
Details of net sales for the three-month and nine-month periods ended September 30, 2014 and
2013, are as follows:
2014 2013
(in millions of Korean won) Three months Nine months Three months Nine months
Sales of goods 14,737,783 44,029,215 13,734,723 42,767,038
Sales of services 116,747 330,018 91,610 258,549
Royalty income 61,836 206,419 65,819 199,480
Total 14,916,366 44,565,652 13,892,152 43,225,067

LG ElectronicsNotes to the Interim Consolidated Financial StatementsSeptember 30, 2014 and 2013, and December 31, 2013
63
19. Expenses by Nature
Expenses that are recorded by nature for the three-month and nine-month periods ended
September 30, 2014 and 2013, consist of:
2014 2013
(in millions of Korean won) Three months Nine months Three months Nine monthsChanges in finishedproducts, work-in-processand others
(212,949) (346,661) (211,326) (239,779)
Usage of raw materials,merchandise and other 9,472,056 28,077,791 8,837,328 27,435,409
Employee benefitexpense 1,639,078 4,882,729 1,638,075 4,891,390
Depreciation andamortization 474,357 1,428,816 498,930 1,416,922
Advertising expense 334,390 839,239 295,847 814,054
Promotion expense 226,120 597,604 192,930 532,499
Transportation expense 401,311 1,235,606 416,657 1,273,389
Commission expense 687,571 2,067,240 691,632 1,966,094
Other expenses 1,433,161 4,211,804 1,314,284 4,088,528
Total 114,455,095 42,994,168 13,674,357 42,178,506
1 Cost of sales, selling and marketing expenses, administrative expenses, research and development expenses
and service costs are included.
20. Selling and Marketing Expenses, Administrative Expenses
Details of general operating expenses for the three-month and nine-month periods ended
September 30, 2014 and 2013, are as follows:
2014 2013
(in millions of Korean won) Three months Nine months Three months Nine months
Wages and salaries 690,441 2,040,728 694,246 2,094,556
Severance benefits 51,609 160,118 40,940 122,597
Welfare expense 145,164 431,700 144,380 434,433
Transportation expense 395,959 1,216,494 410,514 1,253,504
Rental expense 104,824 318,988 107,831 325,660
Commission expense 497,839 1,478,780 489,504 1,391,968
Depreciation 65,083 190,896 65,420 192,517
Amortization 45,758 139,969 45,861 174,028
Taxes and dues 46,122 118,685 61,631 150,724
Advertising expense 334,390 839,239 295,847 814,054
Promotion expense 226,120 597,604 192,930 532,499
R&D expense 80,708 242,149 91,039 300,277
Service related expense 235,391 607,046 237,540 642,500
Bad debt expense 633 26,175 (18,441) 12,174
Other 209,850 602,771 215,820 620,454

LG ElectronicsNotes to the Interim Consolidated Financial StatementsSeptember 30, 2014 and 2013, and December 31, 2013
64
2014 2013
(in millions of Korean won) Three months Nine months Three months Nine months
Total 3,129,891 9,011,342 3,075,062 9,061,945
21. Financial Income
Financial income for the three-month and nine-month periods ended September 30, 2014 and 2013,
consists of:
2014 2013
(in millions of Korean won) Three months Nine months Three months Nine months
Interest income 22,578 69,809 20,783 66,551
Foreign exchange gain 97,967 208,901 53,761 227,802
Gain on derivatives 4,404 17,125 960 17,252
Other 25 107 1 1
Total 124,974 295,942 75,505 311,606
22. Financial Expenses
Financial expenses for the three-month and nine-month periods ended September 30, 2014 and
2013, consist of:
2014 2013
(in millions of Korean won) Three months Nine months Three months Nine months
Interest expense 113,427 342,588 102,578 305,287
Foreign exchange loss 77,057 210,160 79,589 284,064
Loss on derivatives 5,615 22,204 2,695 7,190Loss on disposal of tradereceivables 5,987 13,962 4,989 14,860
Other 336 1,932 350 1,281
Total 202,422 590,846 190,201 612,682

LG ElectronicsNotes to the Interim Consolidated Financial StatementsSeptember 30, 2014 and 2013, and December 31, 2013
65
23. Other Non-operating Income
Other non-operating income for the three-month and nine-month periods ended September 30,
2014 and 2013, consists of:
2014 2013
(in millions of Korean won) Three months Nine months Three months Nine months
Dividend income 5 322 - 327
Exchange differences 205,473 742,408 320,276 895,463
Gain on derivatives 4,732 10,253 2,451 3,229Gain on disposal ofproperty, plant andequipment
8,089 24,973 9,625 17,257
Gain on disposal ofintangible assets 11 14,902 1,073 1,338
Gain on disposal ofinvestments in associatesand joint ventures
- 386 - -
Other 33,516 82,737 6,461 26,179
Total 251,826 875,981 339,886 943,793
24. Other Non-operating Expenses
Other non-operating expenses for the three-month and nine-month periods ended September 30,
2014 and 2013, consist of:
2014 2013
(in millions of Korean won) Three months Nine months Three months Nine months
Exchange differences 404,254 963,052 360,607 1,097,955
Loss on derivatives 853 14,335 3,066 4,558Loss on disposal ofproperty, plant andequipment
15,662 25,320 2,317 11,672
Loss on disposal ofintangible assets 2,352 16,926 3,814 13,603
Impairment loss onavailable-for-salefinancial assets
- 1,114 45 2,498
Other 83,501 151,457 19,713 105,707
Total 506,622 1,172,204 389,562 1,235,993
25. Income Tax Expense
In accordance with the Local Tax Act which was amended and announced on January 1, 2014, tax
credit carryforwards amounting to₩84,776 million recognized as deferred tax assets of the Parent
Company and subsidiaries domiciled in the Republic of Korea at December 31, 2013, was expensed
during the reporting period.

LG ElectronicsNotes to the Interim Consolidated Financial StatementsSeptember 30, 2014 and 2013, and December 31, 2013
66
26. Earnings per Share
The Group has no potential dilutive common shares. Accordingly, basic earnings per share is
identical to diluted earnings per share.
(a) Basic earnings per common share for the three-month and nine-month periods ended
September 30, 2014 and 2013, is as follows:
2014 2013
Three
months
Nine
months
Three
months
Nine
months
Profit attributable to common shares1
(in millions of won) 144,254 545,500 75,784 216,695
Weighted average number of common
shares outstanding (unit: shares)2 162,884,646 162,884,646 162,884,646 162,884,646
Basic earnings per common share (in won) 886 3,349 465 1,330
(b) Basic earnings per preferred share for the three-month and nine-month periods ended
September 30, 2014 and 2013, is as follows:
2014 2013
Three
months
Nine
months
Three
months
Nine
months
Profit attributable to preferred shares1
(in millions of won) 15,430 58,184 8,208 23,501
Weighted average number of preferredshares outstanding (unit: shares)2 17,181,302 17,181,302 17,181,302 17,181,302
Basic earnings per preferred share (in won) 899 3,387 478 1,368
1 Profit attributable to common and preferred shares for the three-month and nine-month periods ended
September 30, 2014 and 2013, is as follows:
2014 2013
(in millions of Korean won)
Three
months
Nine
months
Three
months
Nine
monthsProfit for the year attributable to the
Parent Company(A) 159,684 603,684 83,992 240,196
Common share dividends(B) 8,145 24,433 8,145 24,433
Preferred share dividends(C) 1,073 3,221 1,073 3,221
Undistributed earnings (D=A-B-C) 150,466 576,030 74,774 212,542
Undistributed earnings available forcommon shares(E) 136,109 521,067 67,639 192,262
Undistributed earnings available forpreferred shares (F) 14,357 54,963 7,135 20,280
Profit attributable to commonshares(G=B+E) 144,254 545,500 75,784 216,695
Profit attributable to preferredshares(H=C+F) 15,430 58,184 8,208 23,501

LG ElectronicsNotes to the Interim Consolidated Financial StatementsSeptember 30, 2014 and 2013, and December 31, 2013
67
2 Weighted average numbers of shares for the three-month and nine-month periods ended September 30, 2014
and 2013, are calculated as follows:
2014 2013
(in millions of Korean won)
Three
months
Nine
months
Three
months
Nine
months
Common shares outstanding 163,647,814 163,647,814 163,647,814 163,647,814
Common treasury shares (763,168) (763,168) (763,168) (763,168)
Common shares 162,884,646 162,884,646 162,884,646 162,884,646
Weighted average number of commonshares outstanding 162,884,646 162,884,646 162,884,646 162,884,646
Preferred shares outstanding 17,185,992 17,185,992 17,185,992 17,185,992
Preferred treasury shares (4,690) (4,690) (4,690) (4,690)
Preferred shares 17,181,302 17,181,302 17,181,302 17,181,302
Weighted average number of preferredshares outstanding 17,181,302 17,181,302 17,181,302 17,181,302
27. Information on Cash Flow
Cash flows from operating activities are prepared using the indirect method. Details of cash
generated from operating activities are as follows:
(in millions of Korean won) 2014 2013
Profit for the period 707,049 286,151
Adjustments:
Interest expense, net 272,779 238,736
Foreign exchange loss, net 115,375 51,702
Loss(gain) on derivatives, net 9,161 (8,733)
Depreciation 1,155,025 1,154,369
Amortization 323,643 277,605Loss on disposal of property, plant and
equipment and intangible assets, net 2,371 6,680
Provisions for severance benefits 285,577 242,402
Provisions 849,744 1,027,882
Income tax expense 437,676 262,359
Gain from equity method (164,368) (95,225)
Other 207,861 195,282
3,494,844 3,353,059
Changes in operating assets and liabilities:
Increase in trade receivables (1,491,422) (332,437)Decrease(increase) in loans and other
receivables 45,831 (169,595)
Increase in inventories (1,733,904) (1,065,669)
Increase in other assets (88,234) (119,521)

LG ElectronicsNotes to the Interim Consolidated Financial StatementsSeptember 30, 2014 and 2013, and December 31, 2013
68
(in millions of Korean won) 2014 2013
Increase in trade payables 1,916,690 1,056,083
Increase(decrease) in other payables 426,484 (357,117)
Decrease in provisions (817,818) (958,838)
Increase(decrease) in other liabilities (68,963) 474,875
Payment of defined benefit liability (31,889) (27,796)
Deposit in plan assets, net (35,577) (35,190)
(1,878,802) (1,535,205)
Cash generated from operating activities 2,323,091 2,104,005
Significant transactions not affecting cash flows for the nine-month periods ended September 30,
2014 and 2013, are as follows:
(in millions of Korean won) 2014 2013
Reclassification of construction-in-progress
of property, plant and equipment618,066 805,196
Reclassification of intangible assets in
progress174,866 168,028
Reclassification of long-term prepayment to
intangible assets67,937 71,447
Reclassification of current maturities of
borrowings and debentures1,111,971 1,509,379
Other payables to acquire property, plant and
equipment125,628 114,391
Other payables to acquire intangible assets 2,546 31,948
Conversion of subsidiaries’ convertible bonds 273,795 -
The assets and liabilities of the transferred business
i) The Group transferred the Data Storage business to Hitachi-LG Data Storage Inc. and its
subsidiaries on March 1, 2013.
ii) Total consideration received and the assets and liabilities of the transferred business are
as follows:
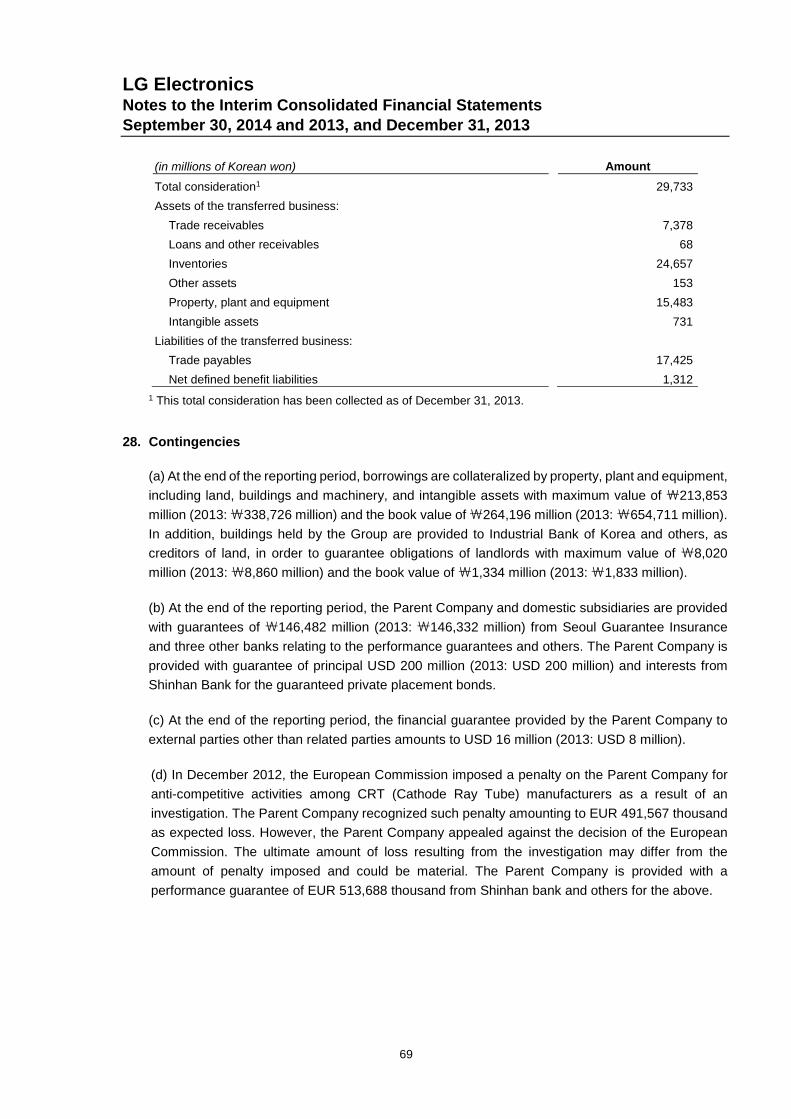
LG ElectronicsNotes to the Interim Consolidated Financial StatementsSeptember 30, 2014 and 2013, and December 31, 2013
69
(in millions of Korean won) Amount
Total consideration1 29,733
Assets of the transferred business:
Trade receivables 7,378
Loans and other receivables 68
Inventories 24,657
Other assets 153
Property, plant and equipment 15,483
Intangible assets 731
Liabilities of the transferred business:
Trade payables 17,425
Net defined benefit liabilities 1,312
1 This total consideration has been collected as of December 31, 2013.
28. Contingencies
(a) At the end of the reporting period, borrowings are collateralized by property, plant and equipment,
including land, buildings and machinery, and intangible assets with maximum value of ₩213,853
million (2013:₩338,726 million) and the book value of₩264,196 million (2013: ₩654,711 million).
In addition, buildings held by the Group are provided to Industrial Bank of Korea and others, as
creditors of land, in order to guarantee obligations of landlords with maximum value of ₩8,020
million (2013:₩8,860 million) and the book value of ₩1,334 million (2013:₩1,833 million).
(b) At the end of the reporting period, the Parent Company and domestic subsidiaries are provided
with guarantees of ₩146,482 million (2013: ₩146,332 million) from Seoul Guarantee Insurance
and three other banks relating to the performance guarantees and others. The Parent Company is
provided with guarantee of principal USD 200 million (2013: USD 200 million) and interests from
Shinhan Bank for the guaranteed private placement bonds.
(c) At the end of the reporting period, the financial guarantee provided by the Parent Company to
external parties other than related parties amounts to USD 16 million (2013: USD 8 million).
(d) In December 2012, the European Commission imposed a penalty on the Parent Company for
anti-competitive activities among CRT (Cathode Ray Tube) manufacturers as a result of an
investigation. The Parent Company recognized such penalty amounting to EUR 491,567 thousand
as expected loss. However, the Parent Company appealed against the decision of the European
Commission. The ultimate amount of loss resulting from the investigation may differ from the
amount of penalty imposed and could be material. The Parent Company is provided with a
performance guarantee of EUR 513,688 thousand from Shinhan bank and others for the above.
LG ElectronicsNotes to the Interim Consolidated Financial StatementsSeptember 30, 2014 and 2013, and December 31, 2013
70
In addition, the Parent Company is under investigation and has been named as defendants in class
actions in countries including the United States and Canada, in connection with the alleged anti-
competitive activities among CRT manufacturers. There are also a number of other legal actions,
disputes, and investigations that remain pending at the end of the reporting period. Details of
relevant provisions are not disclosed as such information could affect the outcome of the legal
actions and investigations. The management believes that the consequences of those lawsuits
would not have material impact on the financial position of the Group.
As of the reporting date, LG Display Co., Ltd., one of the associates, has been named as a
defendant in a case related to the infringement of patents. In addition, LG Display Co., Ltd. is
currently under the investigation for anti-competitive activities. The outcome of the case may affect
the gain or loss from the equity method valuation. The Group does not have individual responsibility
in the case and the investigation above.
At the end of the reporting period, Hitachi-LG Data Storage Inc. (HLDS), an associate of the Group,
is currently under the investigation from the European Commission in connection with the alleged
anti-competitive activities among Optical Disk Drive (ODD) manufactures. The outcome of the
investigation may affect gain or loss from equity method valuation. The Group does not have
responsibility in the investigation above.
There are pending lawsuits other than above. However, management does not expect the outcome
of the litigation will have a material effect on the Group’s financial position.

LG ElectronicsNotes to the Interim Consolidated Financial StatementsSeptember 30, 2014 and 2013, and December 31, 2013
71
29. Commitments
(a) At the end of the reporting period, the Parent Company has overdraft facility agreements with
various banks, including Shinhan Bank, with a limit of₩195,500 million (2013:₩195,500 million).
Its overseas subsidiaries, including LG Electronics European Shared Service Center B.V., have
overdraft facility agreements with a limit of ₩1,155,296 million (2013: ₩1,140,667 million) with
various banks, including Citibank and others.
In addition, LG Innotek Co., Ltd. and its subsidiaries and other three subsidiaries, have overdraft
facility agreements with various banks, including Hana Bank, with a limit of₩116,932 million (2013:
₩129,013 million).
(b) At the end of the reporting period, the Parent Company has sales agreements for export trade
receivables with Shinhan Bank and other 25 banks amounting to ₩3,401,843 million (2013:
₩4,066,071 million). The Parent Company has corporate electronic settlement services contracts
for collection of trade receivables with Hana Bank for up to ₩126,000 million (2013: ₩126,000
million).
In addition, LG Innotek Co., Ltd. and its subsidiaries have trade receivables transfer agreements
with Hana Bank and others amounting to ₩339,537 million (2013: ₩413,110 million) at the end of
the reporting period.
In addition, the European subsidiaries, including LG Electronics European Shared Service Center
B.V., transfer their trade receivables to Societe Generale Bank on a revolving basis, for up to USD
228 million (2013: USD 434 million).
(c) At the end of the reporting period, the Parent Company has corporate electronic settlement
services contracts with Shinhan Bank and other seven banks for up to ₩840,000 million (2013:
₩895,450 million) which guarantee the payment of trade accounts payable in case the suppliers
sell their trade receivables.
In addition, LG Innotek Co., Ltd. and its subsidiaries and other four domestic subsidiaries, provided
payment guarantees to financial institutions, including Woori Bank, amounting to₩221,304 million
(2013:₩291,332 million) in connection with the discounting of notes which are paid to their suppliers.
(d) LG Innotek Co., Ltd. has an agreement for underwriting commercial paper amounting to
₩34,000 million (2013:₩34,000 million). In addition, at the end of the reporting period, the Group
has other trade financing agreements and loan commitments with financial institutions, including
Industrial Bank of Korea.

LG ElectronicsNotes to the Interim Consolidated Financial StatementsSeptember 30, 2014 and 2013, and December 31, 2013
72
(e) Contractual commitments for the acquisition of assets
The property, plant and equipment, and intangible assets contracted for, but not yet acquired at the
end of the reporting period are as follows:
(in millions of Korean won) September 30, 2014 December 31, 2013
Property, plant and equipment 36,410 16,772
Intangible assets 2,687 13,627
Total 39,097 30,399
(f) Operating lease commitments – the Group as lessee
The future aggregate minimum lease payments under non-cancellable operating leases at the end
of the reporting period are as follows:
September 30, 2014
(in millions of Korean won)
No later than
1 year
Later than 1 year and
no later than 5 years
Over
5 years Total
Buildings and offices 190,755 360,598 29,007 580,360
Vehicles 26,983 39,894 - 66,877
Equipment 22,281 21,641 - 43,922
Total 240,019 422,133 29,007 691,159
Lease payment under operating lease recognized in the statement of income during the nine-month
period ended September 30, 2014, amounts to₩218,876 million (2013:₩194,473 million).
(g) Operating lease commitments – the Group as lessor
The Group has an operating lease agreement regarding the healthcare rental business that lends
water purifiers to customers. The future minimum lease receipts under operating leases at the end
of the reporting period are as follows:
September 30, 2014
(in millions of Korean won)
No later than
1 year
Later than 1 year and
no later than 3 years Total
Healthcare rental 90,320 144,620 234,940
The Group recognized ₩66,690 million (2013: ₩56,399 million) in lease income during the nine-
month period ended September 30, 2014.
At the end of reporting period, acquisition cost of operating lease assets amounts to₩79,729 million
(2013: ₩73,910 million) and their accumulated depreciation amounts to ₩36,294 million (2013:
₩29,780 million).

LG ElectronicsNotes to the Interim Consolidated Financial StatementsSeptember 30, 2014 and 2013, and December 31, 2013
73
(h) Trademark license commitments
At the end of the reporting period, the Group has various agreements as follows:
Purpose Related products Provided by Used byUse of license Mobile/LED Qualcomm Incorporated
and othersThe Group
Provision of license Home appliance The Group Panasonic Corporationand others
30. Related Party Transactions
(a) The related parties of the Group are as follows:
Classification
Name
September 30, 2014 December 31, 2013 NoteSignificantlyinfluencing theGroup
LG Corp. LG Corp. -
Associates LG Display Co., Ltd., and subsidiaries LG Display Co., Ltd., and subsidiaries -
LG Display Co., Ltd. LG Display Co., Ltd. -
LG Display Germany GmbH LG Display Germany GmbH -
LG Display Shanghai Co.,Ltd. LG Display Shanghai Co.,Ltd. -
LG Display Yantai Co.,Ltd. LG Display Yantai Co.,Ltd. -
LG. Display America,Inc. LG Display America,Inc. -
LG Display Japan Co., Ltd. LG Display Japan Co., Ltd. -
LG Display Taiwan Co., Ltd. LG Display Taiwan Co., Ltd. -
LG Display Nanjing Co., Ltd. LG Display Nanjing Co., Ltd. -
LG Display Poland Sp. zo.o. LG Display Poland Sp. zo.o. -
LG Display Guangzhou Co., Ltd LG Display Guangzhou Co., Ltd -
LG Display Shenzhen Co., Ltd. LG Display Shenzhen Co., Ltd. -
LG Display Singapore Pte. Ltd. LG Display Singapore Pte. Ltd. -
LG Display U.S.A Inc LG Display U.S.A Inc -
L&T Display Technology (Xiamen)
Limited
L&T Display Technology (Xiamen)
Limited-
L&T Display Technology (Fujian)
Limited
L&T Display Technology (Fujian)
Limited-
LUCOM Display Technology (Kunshan)
Limited-
LG Display Reynosa S.A. de C.V. LG Display Reynosa S.A. de C.V. -
Nanumnuri Co., Ltd. Nanumnuri Co., Ltd. -
LG Display (China) Co., Ltd. LG Display (China) Co., Ltd. -
Unified Innovative Technology, LLC - -
Ericsson-LG Co., Ltd., and subsidiaries Ericsson-LG Co., Ltd., and subsidiaries -
Ericsson-LG Co., Ltd. Ericsson-LG Co., Ltd. -
LN Srithai Com Co., Ltd. LN Srithai Com Co., Ltd. -
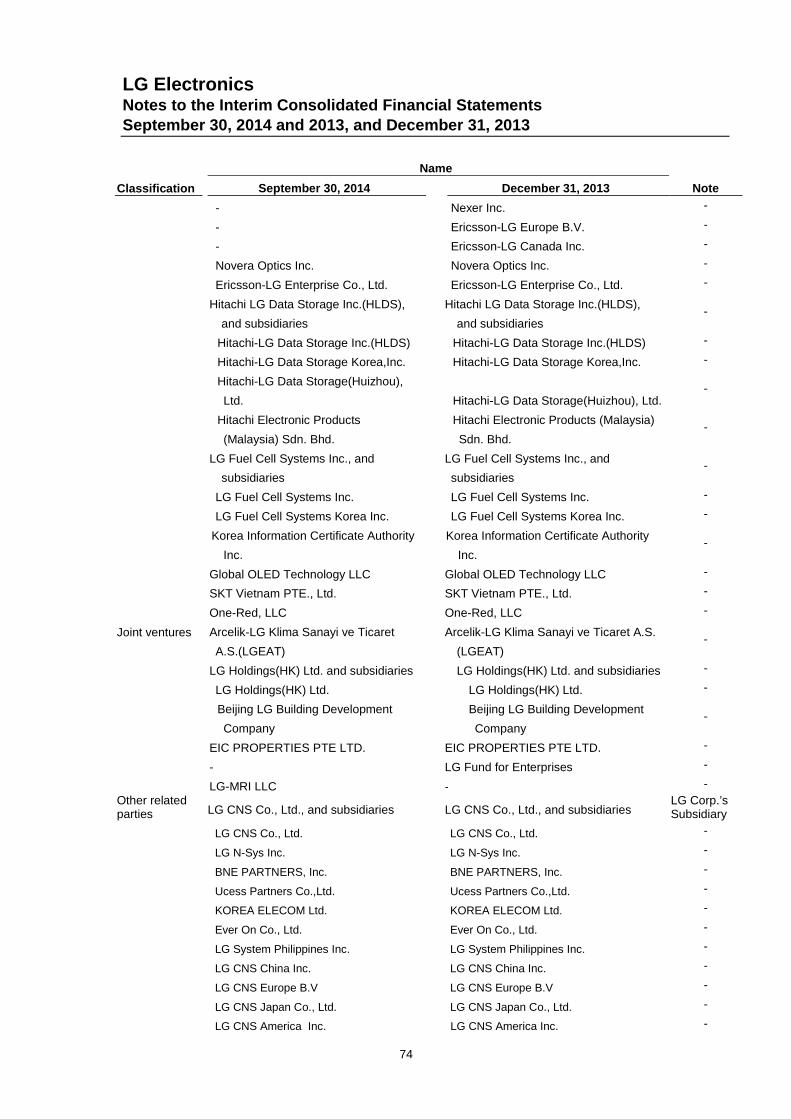
LG ElectronicsNotes to the Interim Consolidated Financial StatementsSeptember 30, 2014 and 2013, and December 31, 2013
74
Classification
Name
September 30, 2014 December 31, 2013 Note
- Nexer Inc. -
- Ericsson-LG Europe B.V. -
- Ericsson-LG Canada Inc. -
Novera Optics Inc. Novera Optics Inc. -
Ericsson-LG Enterprise Co., Ltd. Ericsson-LG Enterprise Co., Ltd. -
Hitachi LG Data Storage Inc.(HLDS),
and subsidiaries
Hitachi LG Data Storage Inc.(HLDS),
and subsidiaries-
Hitachi-LG Data Storage Inc.(HLDS) Hitachi-LG Data Storage Inc.(HLDS) -
Hitachi-LG Data Storage Korea,Inc. Hitachi-LG Data Storage Korea,Inc. -
Hitachi-LG Data Storage(Huizhou),
Ltd. Hitachi-LG Data Storage(Huizhou), Ltd.-
Hitachi Electronic Products
(Malaysia) Sdn. Bhd.
Hitachi Electronic Products (Malaysia)
Sdn. Bhd.-
LG Fuel Cell Systems Inc., and
subsidiaries
LG Fuel Cell Systems Inc., and
subsidiaries-
LG Fuel Cell Systems Inc. LG Fuel Cell Systems Inc. -
LG Fuel Cell Systems Korea Inc. LG Fuel Cell Systems Korea Inc. -
Korea Information Certificate Authority
Inc.
Korea Information Certificate Authority
Inc.-
Global OLED Technology LLC Global OLED Technology LLC -
SKT Vietnam PTE., Ltd. SKT Vietnam PTE., Ltd. -
One-Red, LLC One-Red, LLC -
Joint ventures Arcelik-LG Klima Sanayi ve Ticaret
A.S.(LGEAT)
Arcelik-LG Klima Sanayi ve Ticaret A.S.
(LGEAT)-
LG Holdings(HK) Ltd. and subsidiaries LG Holdings(HK) Ltd. and subsidiaries -
LG Holdings(HK) Ltd. LG Holdings(HK) Ltd. -
Beijing LG Building Development
Company
Beijing LG Building Development
Company-
EIC PROPERTIES PTE LTD. EIC PROPERTIES PTE LTD. -
- LG Fund for Enterprises -
LG-MRI LLC - -
Other relatedparties LG CNS Co., Ltd., and subsidiaries LG CNS Co., Ltd., and subsidiaries
LG Corp.’sSubsidiary
LG CNS Co., Ltd. LG CNS Co., Ltd. -
LG N-Sys Inc. LG N-Sys Inc. -
BNE PARTNERS, Inc. BNE PARTNERS, Inc. -
Ucess Partners Co.,Ltd. Ucess Partners Co.,Ltd. -
KOREA ELECOM Ltd. KOREA ELECOM Ltd. -
Ever On Co., Ltd. Ever On Co., Ltd. -
LG System Philippines Inc. LG System Philippines Inc. -
LG CNS China Inc. LG CNS China Inc. -
LG CNS Europe B.V LG CNS Europe B.V -
LG CNS Japan Co., Ltd. LG CNS Japan Co., Ltd. -
LG CNS America Inc. LG CNS America Inc. -

LG ElectronicsNotes to the Interim Consolidated Financial StatementsSeptember 30, 2014 and 2013, and December 31, 2013
75
Classification
Name
September 30, 2014 December 31, 2013 Note
LG CNS India Pvt. Ltd. LG CNS India Pvt. Ltd. -
PT LG CNS Indonesia PT LG CNS Indonesia -
Entrue Brasil Servicos de T.I. Ltda. Entrue Brasil Servicos de T.I. Ltda. -
LG CNS Shenyang Inc. LG CNS Shenyang Inc. -
LG CNS Tianjin Inc. LG CNS Tianjin Inc. -
SBI-LG Systems Co., Ltd. SBI-LG Systems Co., Ltd. -
LG CNS Colombia S.A.S LG CNS Colombia S.A.S -
Ucess Philippines, Inc. Ucess Philippines, Inc. -
Oneseen Skytech Co., Ltd. Oneseen Skytech Co., Ltd. -
LG CNS Malaysia Sdn. Bhd. LG CNS Malaysia Sdn. Bhd. -
LG CNS Saudi Arabia LLC LG CNS Saudi Arabia LLC -
TXCNS Healthcare, LLC TXCNS Healthcare, LLC -
LG CNS GB Ltd. LG CNS GB Ltd. -
LG CNS Smart Green Co,.Ltd. LG CNS Smart Green Co,.Ltd. -
LLC LG CNS RUS LLC LG CNS RUS -
- LG N-Sys China, Inc -
- LG CNS UK Limited -
Collain Healthcare, LLC - -
SERVEONE Co., Ltd., and subsidiaries SERVEONE Co., Ltd., and subsidiariesLG Corp.’ssubsidiary
SERVEONE Co., Ltd. SERVEONE Co., Ltd. -
LG-TOYO Engineering LG-TOYO Engineering -
Konjiam Yewon Konjiam Yewon -
Serveone(Nanjing).Co.,LTD Serveone(Nanjing).Co.,LTD -
Serveone Construction(Nanjing)
Co.,Ltd.
Serveone Construction(Nanjing)
Co.,Ltd.-
Serveone(Guangzhou).Co.,LTD - -
SERVEONE VIETNAM Co.,Ltd - -
LG Siltron Incorporated and
subsidiariesLG Siltron Incorporated and subsidiaries
LG Corp.’ssubsidiary
LG Siltron Incorporated LG Siltron Incorporated -
LG Siltron America, Inc. LG Siltron America, Inc. -
LG Siltron JAPAN Inc. LG Siltron JAPAN Inc. -
LUSEM CO., LTD. LUSEM CO., LTD.LG Corp.’ssubsidiary
LG Management Development Institute LG Management Development InstituteLG Corp.’ssubsidiary
LG SPORTS Ltd. LG SPORTS Ltd.LG Corp.’ssubsidiary
LG Solar Energy Inc. LG Solar Energy Inc.LG Corp.’ssubsidiary
LG Holdings Japan Co.,Ltd. -LG Corp.’ssubsidiary
LG MMA Ltd. LG MMA Ltd.LG Corp.’s
joint venture

LG ElectronicsNotes to the Interim Consolidated Financial StatementsSeptember 30, 2014 and 2013, and December 31, 2013
76
(b) Major balances and transactions
i) Major transactions for the nine-month periods ended September 30, 2014 and 2013, areas follows:
(in millions of Korean won)2014
Purchases
Classification Name Sales1
Raw
materials
Fixed and
intangible
assets
General
Operating
Expenses Others
Total
Purchases
Significantlyinfluencing theGroup
LG Corp. 402 - - 114,940 - 114,940
AssociatesLG Display Co., Ltd., and
subsidiaries760,533 4,859,325 - 9,723 - 4,869,048
Ericsson-LG Co., Ltd., and
subsidiaries7,070 4,407 - - - 4,407
Hitachi LG Data Storage Inc.,
and subsidiaries57,483 461,206 - - - 461,206
LG Fuel Cell Systems Inc.,
and subsidiaries25 - - - - -
Korea Information Certificate
Authority Inc.- - - 21 - 21
Subtotal 825,111 5,324,938 - 9,744 - 5,334,682
Joint venturesArcelik-LG Klima Sanayi ve
Ticaret A.S.46,359 91,348 - - - 91,348
LG HOLDINGS (HK)
LIMITED and subsidiaries- - - 2,179 - 2,179
EIC PROPERTIES PTE LTD. - - - 640 - 640
Subtotal 46,359 91,348 - 2,819 - 94,167Other relatedparties SERVEONE Co., Ltd., and
subsidiaries16,063 853,536 8,814 96,001 3,563 961,914
LG Siltron Incorporated 3,469 1,649 - 24 - 1,673
LG CNS Co., Ltd., and
subsidiaries22,992 47,478 26,744 310,299 - 384,521
LG SPORTS Ltd. 403 - - 10,119 - 10,119
LG Management
Development Institute12 327 - 19,553 - 19,880
LUSEM CO., LTD. 42,287 22,504 - 411 - 22,915
LG MMA Ltd. 1,198 36 - - - 36
LG Holdings Japan Co., Ltd. 9 - - 1,542 - 1,542
Subtotal 86,433 925,530 35,558 437,949 3,563 1,402,600
Total 958,305 6,341,816 35,558 565,452 3,563 6,946,389
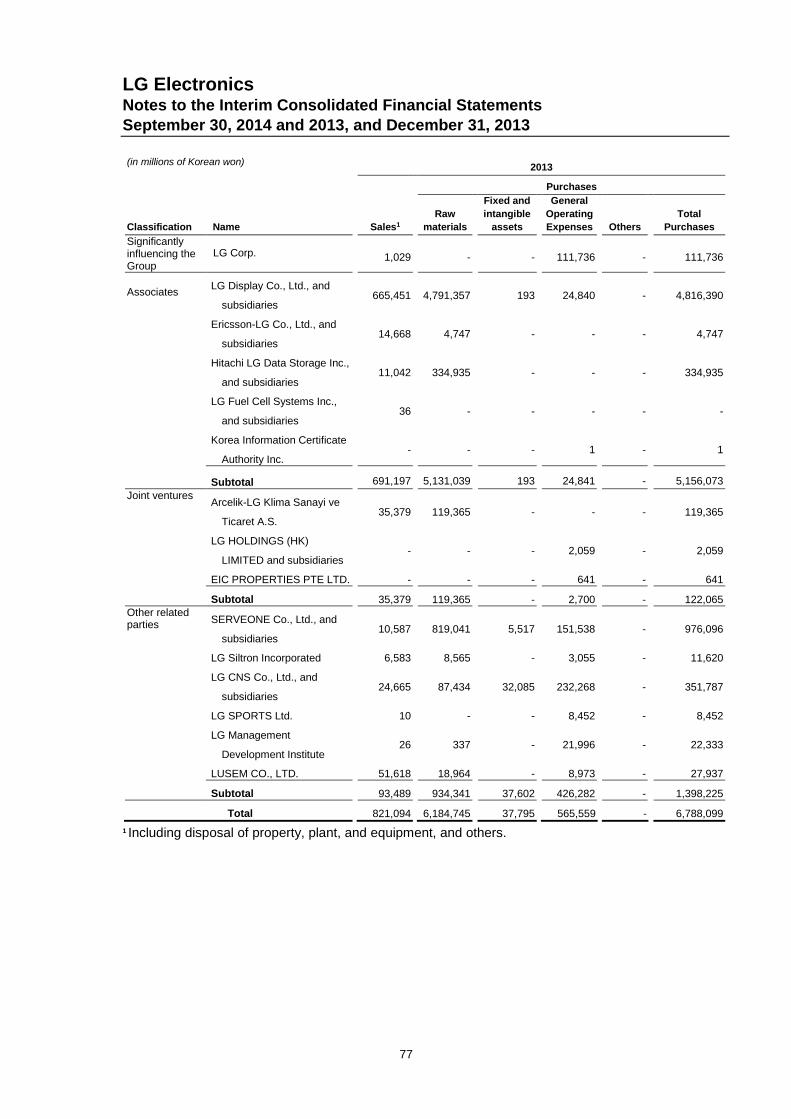
LG ElectronicsNotes to the Interim Consolidated Financial StatementsSeptember 30, 2014 and 2013, and December 31, 2013
77
(in millions of Korean won)2013
Purchases
Classification Name Sales1
Raw
materials
Fixed and
intangible
assets
General
Operating
Expenses Others
Total
Purchases
Significantlyinfluencing theGroup
LG Corp. 1,029 - - 111,736 - 111,736
AssociatesLG Display Co., Ltd., and
subsidiaries665,451 4,791,357 193 24,840 - 4,816,390
Ericsson-LG Co., Ltd., and
subsidiaries14,668 4,747 - - - 4,747
Hitachi LG Data Storage Inc.,
and subsidiaries11,042 334,935 - - - 334,935
LG Fuel Cell Systems Inc.,
and subsidiaries36 - - - - -
Korea Information Certificate
Authority Inc.- - - 1 - 1
Subtotal 691,197 5,131,039 193 24,841 - 5,156,073
Joint venturesArcelik-LG Klima Sanayi ve
Ticaret A.S.35,379 119,365 - - - 119,365
LG HOLDINGS (HK)
LIMITED and subsidiaries- - - 2,059 - 2,059
EIC PROPERTIES PTE LTD. - - - 641 - 641
Subtotal 35,379 119,365 - 2,700 - 122,065Other relatedparties SERVEONE Co., Ltd., and
subsidiaries10,587 819,041 5,517 151,538 - 976,096
LG Siltron Incorporated 6,583 8,565 - 3,055 - 11,620
LG CNS Co., Ltd., and
subsidiaries24,665 87,434 32,085 232,268 - 351,787
LG SPORTS Ltd. 10 - - 8,452 - 8,452
LG Management
Development Institute26 337 - 21,996 - 22,333
LUSEM CO., LTD. 51,618 18,964 - 8,973 - 27,937
Subtotal 93,489 934,341 37,602 426,282 - 1,398,225
Total 821,094 6,184,745 37,795 565,559 - 6,788,099
1 Including disposal of property, plant, and equipment, and others.

LG ElectronicsNotes to the Interim Consolidated Financial StatementsSeptember 30, 2014 and 2013, and December 31, 2013
78
ii) Major balances as of September 30, 2014 and December 31, 2013, are as follows:
(in millions of Korean won) September 30, 2014
Receivables Payables
Classification Name
Trade
receivables Loans
Other
receivables Total
Trade
payables Borrowings
Other
payables Total
Significantlyinfluencing theGroup
LG Corp. - - 22,914 22,914 - - 2,682 2,682
AssociatesLG Display Co., Ltd.,
and subsidiaries271,313 - 17,409 288,722 969,948 - 42,937 1,012,885
Ericsson-LG Co., Ltd.,
and subsidiaries322 - 31 353 1,065 - - 1,065
Hitachi-LG Data
Storage Inc., and
subsidiaries
10,199 - - 10,199 45,781 - 28 45,809
Korea Information
Certificate Authority
Inc
- - - - - - 21 21
Subtotal 281,834 - 17,440 299,274 1,016,794 - 42,986 1,059,780Joint ventures
Arcelik-LG Klima
Sanayi ve Ticaret A.S.4,359 - - 4,359 2,421 - - 2,421
LG HOLDINGS (HK)
LIMITED and subs- - - - - - 1,437 1,437
EIC PROPERTIES
PTE LTD.- - - - - - 74 74
Subtotal 4,359 - - 4,359 2,421 - 1,511 3,932Other relatedparties SERVEONE Co., Ltd.,
and subsidiaries3,491 - 60,757 64,248 241,723 - 40,503 282,226
LG Siltron
Incorporated1,021 - - 1,021 887 - 1,541 2,428
LG CNS Co., Ltd., and
subsidiaries3,284 - 2 3,286 26,092 - 108,058 134,150
LG SPORTS Ltd. 11 - 4 15 39 - 23 62
LG Management
Development Institute- - 17,864 17,864 - - 2,193 2,193
LUSEM CO., LTD. 7,945 - 2 7,947 3,931 - 559 4,490
LG MMA Ltd 975 - - 975 - - - -
LG Holdings Japan
Co., Ltd.- - 309 309 - - - -
Subtotal 16,727 - 78,938 95,665 272,672 - 152,877 425,549
Total 302,920 - 119,292 422,212 1,291,887 - 200,056 1,491,943

LG ElectronicsNotes to the Interim Consolidated Financial StatementsSeptember 30, 2014 and 2013, and December 31, 2013
79
(in millions of Korean won) December 31, 2013
Receivables Payables
Classification Name
Trade
receivables Loans
Other
receivables Total
Trade
payables Borrowings
Other
payables Total
Significantlyinfluencing theGroup
LG Corp. - - 22,045 22,045 - - 8,893 8,893
AssociatesLG Display Co., Ltd.,
and subsidiaries 143,597 - 23,014 166,611 621,040 - 85 621,125
Ericsson-LG Co., Ltd.,
and subsidiaries 165 - 45 210 2,222 - 150 2,372
Hitachi-LG Data
Storage Inc., and
subsidiaries 11,122 - 586 11,708 49,126 - 84 49,210
Subtotal 154,884 - 23,645 178,529 672,388 - 319 672,707Joint ventures
Arcelik-LG Klima
Sanayi ve Ticaret A.S. 8,227 - - 8,227 5,687 - 2 5,689
LG HOLDINGS (HK)
LIMITED and subs - - - - - - 1,460 1,460
EIC PROPERTIES
PTE LTD. - - - - - - 77 77
Subtotal 8,227 - - 8,227 5,687 - 1,539 7,226Other relatedparties SERVEONE Co., Ltd.,
and subsidiaries 1,558 - 60,736 62,294 245,900 - 65,207 311,107
LG Siltron
Incorporated 9,052 - - 9,052 744 - 3,170 3,914
LG CNS Co., Ltd., and
subsidiaries 7,439 - 663 8,102 24,323 - 238,876 263,199
LG SPORTS Ltd. - - - - 121 - 132 253
LG Management
Development Institute - - 17,864 17,864 - - 1,457 1,457
LUSEM CO., LTD. 9,122 - 30 9,152 4,776 - 475 5,251
LG MMA Ltd 35 - - 35 - - - -
Subtotal 27,206 - 79,293 106,499 275,864 - 309,317 585,181
Total 190,317 - 124,983 315,300 953,939 - 320,068 1,274,007

LG ElectronicsNotes to the Interim Consolidated Financial StatementsSeptember 30, 2014 and 2013, and December 31, 2013
80
iii) Major capital transactions for the nine-month periods ended September 30, 2014 and 2013
are as follows:
(in millions of Korean won) 2014
Financing loan
transactions
Financing borrowing
transactions
Classification Name
Dividend
Income
Cash
investments
(Recovery)
Disposal of
shares Loans Repayments Borrowings Repayments
Associates Ericsson-LG Co., Ltd. 17,000 - - - - - -
LG Fuel Cell Systems - 7,267 - - - - -
Korea Information
Certificate Authority Inc.60 - - - - - -
Subtotals 17,060 7,267 - - - - -
Joint ventures LG Fund for Enterprises 6 (680) - - - - -
Totals 17,066 6,587 - - - - -
(in millions of Korean won) 2013
Financing loan
transactions
Financing borrowing
transactions
Classification Name
Dividend
Income
Cash
investments
(recovery)
Disposal of
shares Loans Repayments Borrowings Repayments
Associates Ericsson-LG Co., Ltd. 10,250 - - - - - -
Hitachi-LG Data Storage
Inc.- 43,500 - - - - -
Subtotals 10,250 43,500 - - - - -Other related
partiesLG CNS Co., Ltd.,1
- 17,000 - - - - -
Totals 10,250 60,500 - - - - -
1The Group acquired 100% of V-ENS Co., Ltd.'s ordinary shares from LG CNS Co., Ltd. in May
2013 (Note 32).
iv) During the nine-month period ended September 30, 2013, the Group transferred the Data
Storage business to Hitachi-LG Data Storage Inc. and its subsidiaries (Note 27).
(c) The compensation paid or payable to key management of the Group for the nine-month periods
ended September 30, 2014 and 2013, consists of:
(in millions of Korean won) 2014 2013
Wages and salaries 10,074 8,609
Severance benefits 3,192 1,245
Total 13,266 9,854
Key management refers to the directors who have significant control and responsibilities on
the Group’s business plans, operations and control.
LG ElectronicsNotes to the Interim Consolidated Financial StatementsSeptember 30, 2014 and 2013, and December 31, 2013
81
(d) There is no payment guarantee provided by the Group for the funding sources of the related
parties other than subsidiaries at the end of the reporting period.
(e) There is no collateral provided by the Group for the funding sources of related parties at the
end of the reporting period.
(f) The Group has not recognized any bad debt expense or allowance for trade receivables from
related parties at the end of the reporting period.
31. Risk Management
Financial Risk Management
The Group’s financial risk management (“FRM”) policy supports each business division to achieve
excellent performance solidly and continuously against market risk, credit risk and liquidity risk. In
addition, FRM helps the Group to enhance cost competitiveness through cost-efficient financing
cost by improving financial structure and effective cash management.
While cooperating with other divisions, the finance team in the Parent Company mainly implements
FRM. This involves setting-up risk management policies and recognizing, evaluating and hedging
risks from a global point of view.
The Group anticipatively and systematically manages the financial risks over global business
activities through its four overseas treasury centers in New Jersey(United States),
Amsterdam(Netherlands), Beijing(China), and Singapore in coordination with the finance team in
the Parent Company. And it also helps to improve overseas subsidiaries’ business competitiveness
by performing integration of their finance functions.
The Group mitigates the adverse effects from financial risk by monitoring the risk periodically and
updating FRM policy each year.
The information of the carrying amount and profit or loss of each category of financial instruments
and the details of borrowings related to the financial risk management are presented in Note 5 and
Note 11, respectively.
(a) Market risk
i) Foreign exchange risk
Due to its multinational business operations, the Group is mainly exposed to foreign exchange
risk on the US Dollar and Euro, Brazilian Real, Russian Ruble and Japanese Yen.
The purpose of foreign exchange risk management is to provide the foundation of a stable
business operation by minimizing the uncertainty and volatility of foreign exchange gains and
losses from foreign exchange rate fluctuations.

LG ElectronicsNotes to the Interim Consolidated Financial StatementsSeptember 30, 2014 and 2013, and December 31, 2013
82
The Group’s foreign exchange risk management is implemented under its own foreign exchange
policy through which the Group can minimize the exposure to foreign exchange risk by
preferentially making equal amount of foreign exchange assets and liabilities from general
operating activities. And the Group continuously considers efficient foreign exchange risk hedges
against its remaining exposure with derivative financial instruments and scrutinizes changes in
foreign exchange exposure and the results of hedging activities on a monthly basis. Speculative
foreign exchange trading is prohibited in principle.
As of September 30, 2014 and December 31, 2013, if the foreign exchange rate of the Korean
won fluctuated by 10% while other variables were fixed, the effects on income(loss) before tax
would be as follows:
(in millions of Korean won)
September 30, 2014 December 31, 2013
10% increase 10% decrease 10% increase 10% decrease
USD/KRW (74,248) 74,248 (156,312) 156,312
EUR/KRW 46,961 (46,961) 41,062 (41,062)
Other1/KRW 73,184 (73,184) 81,864 (81,864)
1 Other currency includes Brazilian Real, Russian Ruble and Japanese Yen.
The above sensitivity analysis is done with foreign currency denominated assets and liabilities
which are not in the Group’s functional currency.
ii) Interest rate risk
The Group is exposed to interest rate risk through changes in interest-bearing liabilities or assets.
The risk mainly arises from borrowings and financial deposits with variable interest rates linked
to market interest rate changes in the future. The objective of interest rate risk management lies
in improving corporate value by minimizing uncertainty caused by fluctuations in interest rates
and minimizing net interest expense.
Though the Group is exposed to interest rate risk from financial deposits and borrowings held
with variable interest rates. The Group periodically establishes countermeasures by the
monitoring trends of internal and external interest rates, and minimizes the risk of net interest
expense by properly operating short-term borrowings with variable interest rates and deposits.

LG ElectronicsNotes to the Interim Consolidated Financial StatementsSeptember 30, 2014 and 2013, and December 31, 2013
83
At the end of the reporting period, if interest rates fluctuate by 1% without other variables
changing, the effects on income and expenses related to borrowings and financial deposits with
variable interest rates for the nine-month periods ended September 30, 2014 and 2013, are as
follows:
(in millions of Korean won)
2014 2013
1% increase 1% decrease 1% increase 1% decrease
Interest expense 4,409 (4,409) 9,053 (9,053)
Interest income 20,150 (20,150) 16,044 (16,044)
iii) Details of derivatives contracts are as follows:
Hedging purposes
The Group entered into the cross-currency swap contracts to hedge cash flow risks related to
the floating interest rates and foreign exchange rates of debentures.
September 30,
2014 Contractor
Contracted
amount
(in millions)
Contracted
currency
rate
Interest rate
(received)
Interest rate
(paid)
Contract
date
Expiration
date
USD/KRW CRS
Shinhan Bank USD200USD/KRW
1,113.63ML +160bp 3.22% 2013.7.11 2019.1.31
BNP PARIBAS and
othersUSD200
USD/KRW
1,052.13ML +130bp 3.42% 2013.11.28 2017.6.19
CHF/KRW CRS UBS and others CHF215CHF/KRW
1,213.62.00% 3.64~3.74% 2012.7.6 2016.12.2
USD/BRL CRS Standard Chartered USD25USD/BRL
2.21701.73% 10.90% 2013.10.23 2014.10.27
USD20USD/BRL
2.34901.70% 10.65% 2013.11.26 2014.12.16
USD15USD/BRL
2.42451.96% 10.50% 2013.12.20 2015.1.6
USD25USD/BRL
2.38352.05% 10.95% 2014.2.25 2015.3.17
USD20USD/BRL
2.28921.35% 11.20% 2014.4.17 2014.12.19
USD10USD/BRL
2.28921.35% 11.10% 2014.4.17 2014.12.19
USD20USD/BRL
2.28921.35% 11.02% 2014.4.17 2014.12.19
USD80USD/BRL
2.28921.30% 10.90% 2014.7.7 2014.12.23
JP Morgan USD20USD/BRL
2.39501.61% 10.65% 2013.12.3 2014.12.19

LG ElectronicsNotes to the Interim Consolidated Financial StatementsSeptember 30, 2014 and 2013, and December 31, 2013
84
September 30,
2014 Contractor
Contracted
amount
(in millions)
Contracted
currency
rate
Interest rate
(received)
Interest rate
(paid)
Contract
date
Expiration
date
CITIBANK USD15USD/BRL
2.38671.62% 10.50% 2013.12.20 2015.1.6
ITAU UNIBANCO USD25USD/BRL
2.33341.33% 10.95% 2014.2.25 2015.3.5
The Group entered into the interest rate swap contracts to hedge cash flow risks related to the
floating interest rates of debentures.
September 30, 2014 Contractor
Contracted amount
(in millions of
Korean won)
Interest rate
(received)
Interest rate
(paid)
Contract
date
Expiration
date
Interest rate swapHana Bank 200,000 3M CD+98bp 4.53% 2014. 1. 3 2024. 1. 3
Kookmin Bank 200,000 3M CD+114bp 4.52% 2014. 4.29 2029.4.30
At the end of the reporting period, the swap contracts are evaluated at fair value and the loss on
valuation of the effective portion amounting to₩51,538 million in 2014 (2013: loss on valuation
amounting to₩2,663 million) after applying the tax effect, is recognized in other comprehensive
income(loss). The Group has reclassified ₩25,687 million to loss from equity in 2014 (2013:
₩10,067 million). Therefore, other comprehensive loss from cash flow hedges amounts to
₩25,851 million in 2014 (2013: other comprehensive income of ₩7,404 million) after applying
the tax effect.
Trading purposes
The Group entered into the currency forward contracts to hedge against possible future changes
in foreign exchange rates. The subsidiaries’ currency forward contracts as of September 30,
2014 and related profit or loss for the nine-month periods ended September 30, 2014, are as
follows:
(in millions of Korean won) Purchase Sale
Gain on
valuation
Loss on
transaction
Currency forward 170,689 170,601 1,757 (3,920)
iv) Price risk
The Group is exposed to price risk through securities owned by the Group classified as available-
for-sale financial assets on the consolidated financial statements.
The listed securities owned by the Group are traded in the open market, and related to KOSDAQ
and NASDAQ Indices.
The table below summarizes the impact of increases/decreases of the listed securities on the
equity (before applying the tax effect). The analysis is based on the assumption that the equity
indexes had increased/decreased by 30% with all other variables held constant and all the
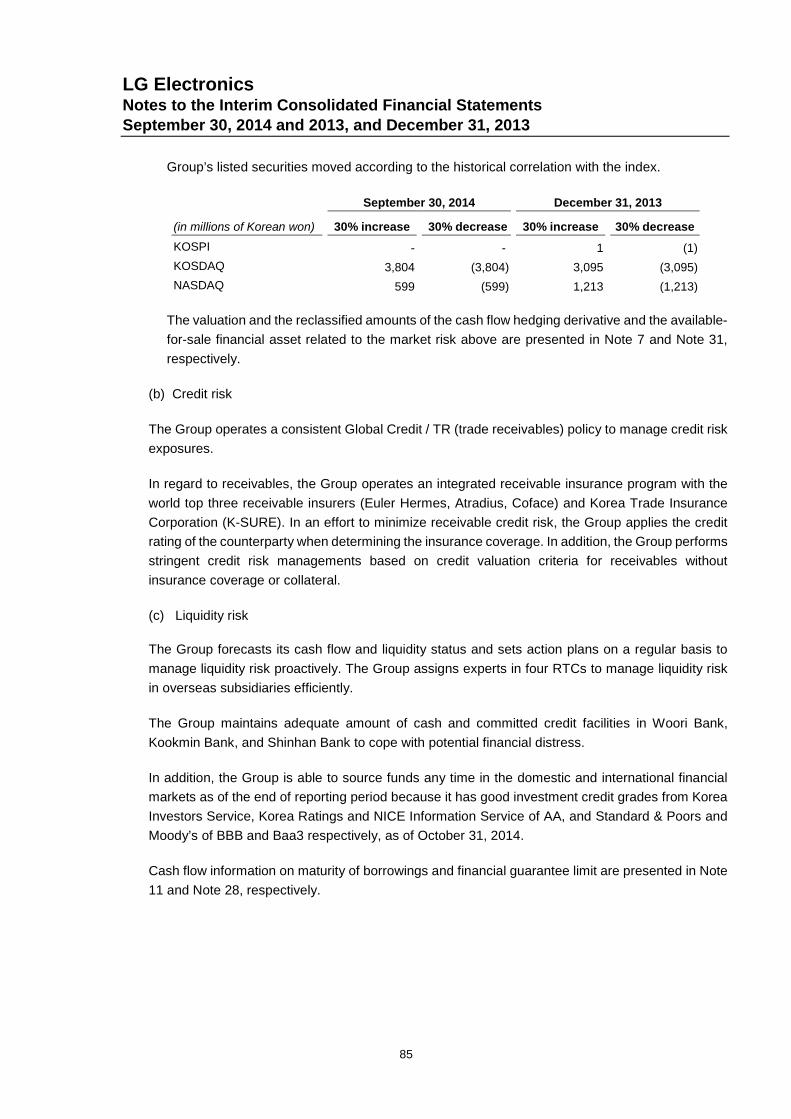
LG ElectronicsNotes to the Interim Consolidated Financial StatementsSeptember 30, 2014 and 2013, and December 31, 2013
85
Group’s listed securities moved according to the historical correlation with the index.
(in millions of Korean won)
September 30, 2014 December 31, 2013
30% increase 30% decrease 30% increase 30% decrease
KOSPI - - 1 (1)
KOSDAQ 3,804 (3,804) 3,095 (3,095)
NASDAQ 599 (599) 1,213 (1,213)
The valuation and the reclassified amounts of the cash flow hedging derivative and the available-
for-sale financial asset related to the market risk above are presented in Note 7 and Note 31,
respectively.
(b) Credit risk
The Group operates a consistent Global Credit / TR (trade receivables) policy to manage credit risk
exposures.
In regard to receivables, the Group operates an integrated receivable insurance program with the
world top three receivable insurers (Euler Hermes, Atradius, Coface) and Korea Trade Insurance
Corporation (K-SURE). In an effort to minimize receivable credit risk, the Group applies the credit
rating of the counterparty when determining the insurance coverage. In addition, the Group performs
stringent credit risk managements based on credit valuation criteria for receivables without
insurance coverage or collateral.
(c) Liquidity risk
The Group forecasts its cash flow and liquidity status and sets action plans on a regular basis to
manage liquidity risk proactively. The Group assigns experts in four RTCs to manage liquidity risk
in overseas subsidiaries efficiently.
The Group maintains adequate amount of cash and committed credit facilities in Woori Bank,
Kookmin Bank, and Shinhan Bank to cope with potential financial distress.
In addition, the Group is able to source funds any time in the domestic and international financial
markets as of the end of reporting period because it has good investment credit grades from Korea
Investors Service, Korea Ratings and NICE Information Service of AA, and Standard & Poors and
Moody’s of BBB and Baa3 respectively, as of October 31, 2014.
Cash flow information on maturity of borrowings and financial guarantee limit are presented in Note
11 and Note 28, respectively.
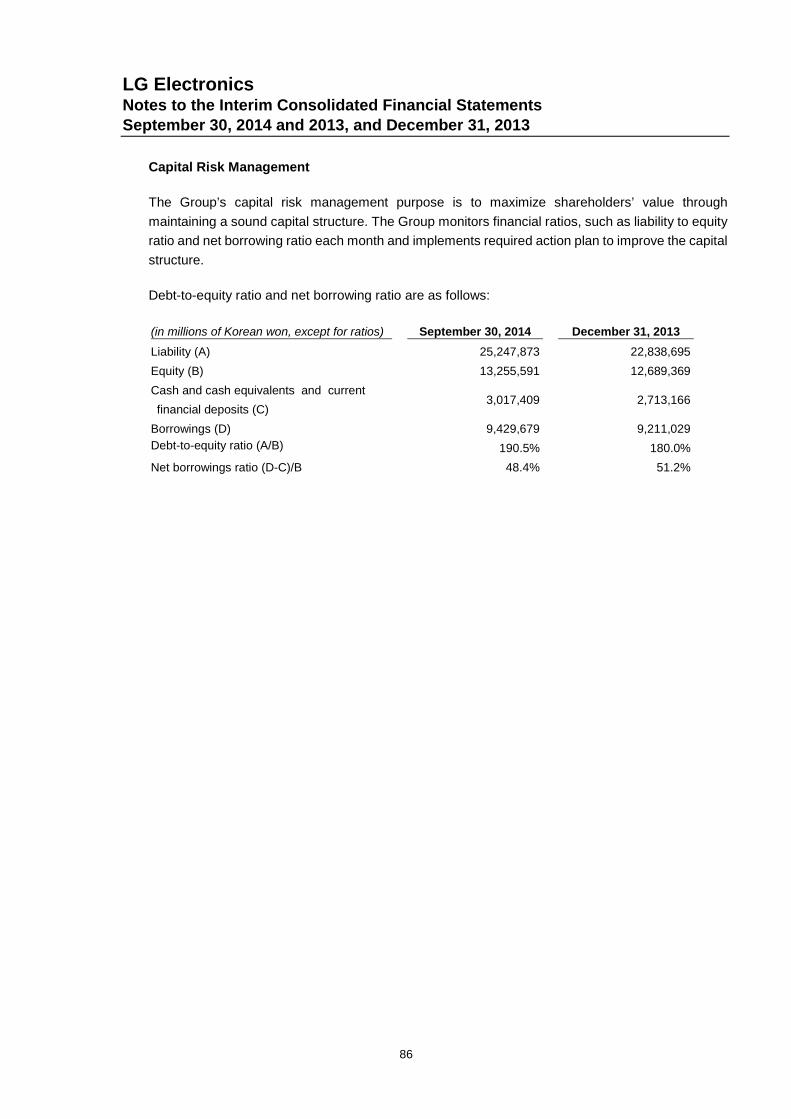
LG ElectronicsNotes to the Interim Consolidated Financial StatementsSeptember 30, 2014 and 2013, and December 31, 2013
86
Capital Risk Management
The Group’s capital risk management purpose is to maximize shareholders’ value through
maintaining a sound capital structure. The Group monitors financial ratios, such as liability to equity
ratio and net borrowing ratio each month and implements required action plan to improve the capital
structure.
Debt-to-equity ratio and net borrowing ratio are as follows:
(in millions of Korean won, except for ratios) September 30, 2014 December 31, 2013
Liability (A) 25,247,873 22,838,695
Equity (B) 13,255,591 12,689,369
Cash and cash equivalents and current
financial deposits (C)3,017,409 2,713,166
Borrowings (D) 9,429,679 9,211,029
Debt-to-equity ratio (A/B) 190.5% 180.0%
Net borrowings ratio (D-C)/B 48.4% 51.2%

LG ElectronicsNotes to the Interim Consolidated Financial StatementsSeptember 30, 2014 and 2013, and December 31, 2013
87
Fair Value Estimation
(a) Carrying amount and fair values of the Group’s financial assets and liabilities are as follows:
September 30, 2014 December 31, 2013
(in millions of Korean won)
Carrying
amount Fair value
Carrying
amount Fair value
Current financial asset items
[Assets at fair value]
Financial assets at fair value through
profit or loss
Other financial assets 3,008 3,008 16,080 16,080
Derivatives for hedging purposes
Other financial assets 10,484 10,484 1,319 1,319
[Assets at amortized cost]
Loans and other receivables
Cash and cash equivalents 2,949,709 1 2,645,270 1
Financial deposits 67,700 1 67,896 1
Trade receivables 8,277,702 1 7,117,402 1
Other receivables 545,112 1 596,505 1
Held-to-maturity financial assets
Other financial assets 49 1 31 1
Non-current financial asset items
[Assets at fair value]
Derivatives for hedging purposes
Other financial assets - - 94 94
Available-for-sale financial assets
Other financial assets 16,807 16,807 19,560 19,560
[Assets at amortized cost]
Loans and other receivables
Financial deposits 81,641 81,641 96,992 96,992
Other receivables 564,494 542,838 601,978 577,737
Held-to-maturity financial assets
Other financial assets 2,643 1 2,545 1
[Assets at cost]
Available-for-sale financial assets
Other financial assets 33,852 2 33,515 2
Total 12,553,201 11,199,187

LG ElectronicsNotes to the Interim Consolidated Financial StatementsSeptember 30, 2014 and 2013, and December 31, 2013
88
September 30, 2014 December 31, 2013
(in millions of Korean won)
Carrying
amount Fair value
Carrying
amount Fair value
Current financial liability items
[Liabilities at fair value]
Financial liabilities at fair value
through profit or loss
Other financial liabilities 917 917 684 684
Derivatives for hedging purposes
Other financial liabilities 1,730 1,730 10,100 10,100
[Liabilities at amortized cost]
Trade payables 7,404,914 1 5,691,114 1
Borrowings 2,781,234 1 3,022,723 1
Other payables 2,448,853 1 2,829,686 1
[Other liabilities]
Other financial liabilities 106 3 105 3
Non-current financial liability items
[Liabilities at fair value]
Financial liabilities at fair value
through profit or loss
Other financial liabilities - - 773 773
Derivatives for hedging purposes
Other financial liabilities 62,807 62,807 9,371 9,371
[Liabilities at amortized cost]
Borrowings 6,648,445 6,918,924 6,188,306 6,308,304
Other payables 17,162 17,444 27,670 27,670
[Other liabilities]
Other financial liabilities 441 3 520 3
Total 19,366,609 17,781,052
1 Excluded from disclosure as the carrying amount is the rational approximate fair value.
2 Unlisted equity securities are calculated at cost because the variability in the range of the estimated future
cash flows is significant and the probabilities of the various estimates within the range cannot be reasonably
assessed.
3 Measured at the higher of the amount determined in accordance with Korean IFRS 1037, ‘Provisions,
Contingent Liabilities and Contingent Assets’, and the amount initially recognized less cumulative
amortization recognized in accordance with Korean IFRS 1018, ‘Revenue’.
No significant changes in the business and economic environment that affects the fair value of
financial assets and financial liabilities occurred during the reporting period.
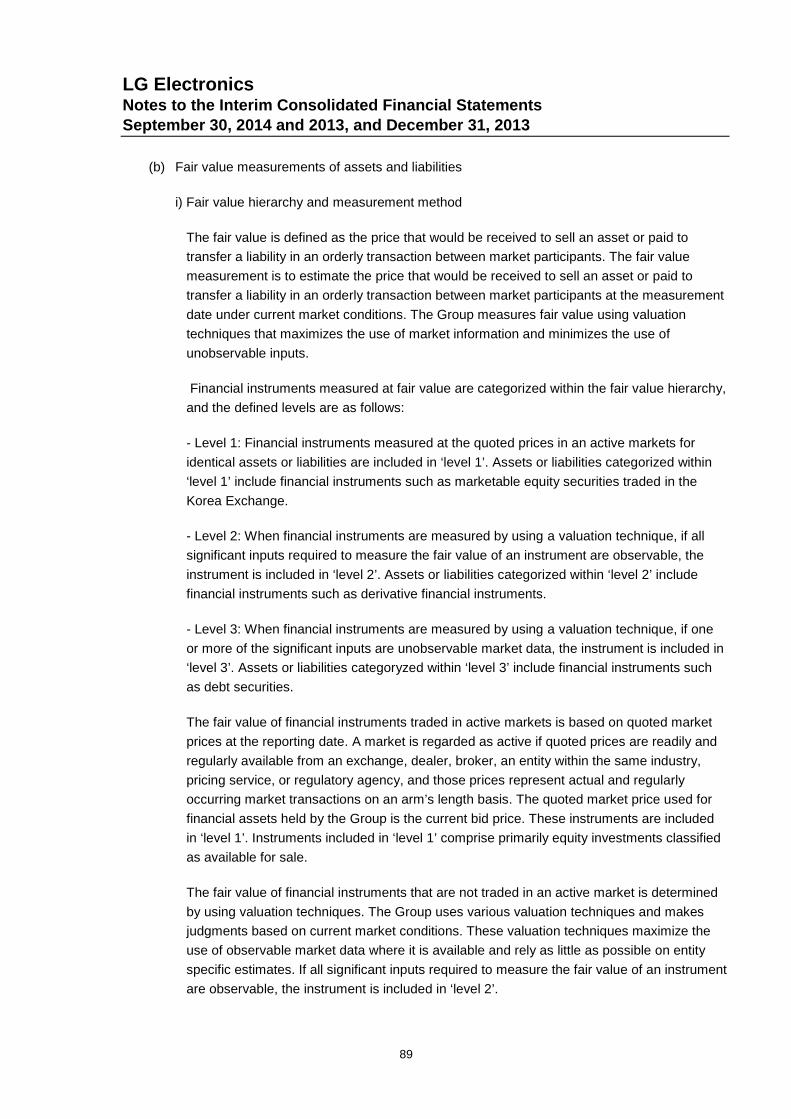
LG ElectronicsNotes to the Interim Consolidated Financial StatementsSeptember 30, 2014 and 2013, and December 31, 2013
89
(b) Fair value measurements of assets and liabilities
i) Fair value hierarchy and measurement method
The fair value is defined as the price that would be received to sell an asset or paid to
transfer a liability in an orderly transaction between market participants. The fair value
measurement is to estimate the price that would be received to sell an asset or paid to
transfer a liability in an orderly transaction between market participants at the measurement
date under current market conditions. The Group measures fair value using valuation
techniques that maximizes the use of market information and minimizes the use of
unobservable inputs.
Financial instruments measured at fair value are categorized within the fair value hierarchy,
and the defined levels are as follows:
- Level 1: Financial instruments measured at the quoted prices in an active markets for
identical assets or liabilities are included in ‘level 1’. Assets or liabilities categorized within
‘level 1’ include financial instruments such as marketable equity securities traded in the
Korea Exchange.
- Level 2: When financial instruments are measured by using a valuation technique, if all
significant inputs required to measure the fair value of an instrument are observable, the
instrument is included in ‘level 2’. Assets or liabilities categorized within ‘level 2’ include
financial instruments such as derivative financial instruments.
- Level 3: When financial instruments are measured by using a valuation technique, if one
or more of the significant inputs are unobservable market data, the instrument is included in
‘level 3’. Assets or liabilities categoryzed within ‘level 3’ include financial instruments such
as debt securities.
The fair value of financial instruments traded in active markets is based on quoted market
prices at the reporting date. A market is regarded as active if quoted prices are readily and
regularly available from an exchange, dealer, broker, an entity within the same industry,
pricing service, or regulatory agency, and those prices represent actual and regularly
occurring market transactions on an arm’s length basis. The quoted market price used for
financial assets held by the Group is the current bid price. These instruments are included
in ‘level 1’. Instruments included in ‘level 1’ comprise primarily equity investments classified
as available for sale.
The fair value of financial instruments that are not traded in an active market is determined
by using valuation techniques. The Group uses various valuation techniques and makes
judgments based on current market conditions. These valuation techniques maximize the
use of observable market data where it is available and rely as little as possible on entity
specific estimates. If all significant inputs required to measure the fair value of an instrument
are observable, the instrument is included in ‘level 2’.

LG ElectronicsNotes to the Interim Consolidated Financial StatementsSeptember 30, 2014 and 2013, and December 31, 2013
90
If one or more of the significant inputs are not based on observable market data, the
instrument is included in ‘level 3’. Financial instrument included ‘level 3' uses other method
including discounting cash flow method and others.
ii) Financial instruments measured at fair value
Fair value hierarchy classifications of the financial assets and financial liabilities that are
measured at fair value as of September 30, 2014 and December 31, 2013, are as follows:
September 30, 2014
(in millions of Korean won) Level 1 Level 2 Level 3 Total
Assets
Other financial assets
Available-for-sale financial assets
- Marketable equity securities 15,276 - - 15,276
- Debt securities - - 1,531 1,531
Financial assets at fair value
through profit or loss - 3,008 - 3,008
Derivatives for hedging purposes - 10,484 - 10,484
Liabilities
Other financial liabilities
Financial liabilities at fair value
through profit or loss - 917 - 917
Derivatives for hedging purposes - 64,537 - 64,537
December 31, 2013
(in millions of Korean won) Level 1 Level 2 Level 3 Total
Assets
Other financial assets
Available-for-sale financial assets
- Marketable equity securities 17,720 - - 17,720
- Debt securities - - 1,840 1,840
Financial assets at fair value
through profit or loss - 16,080 - 16,080
Derivatives for hedging purposes - 1,413 - 1,413
Liabilities
Other financial liabilities
Financial liabilities at fair value
through profit or loss - 1,457 - 1,457
Derivatives for hedging purposes - 19,471 - 19,471
The above fair value amounts are recurring fair value measurements.
In case of investments in equity instruments that do not have a quoted market price in an active
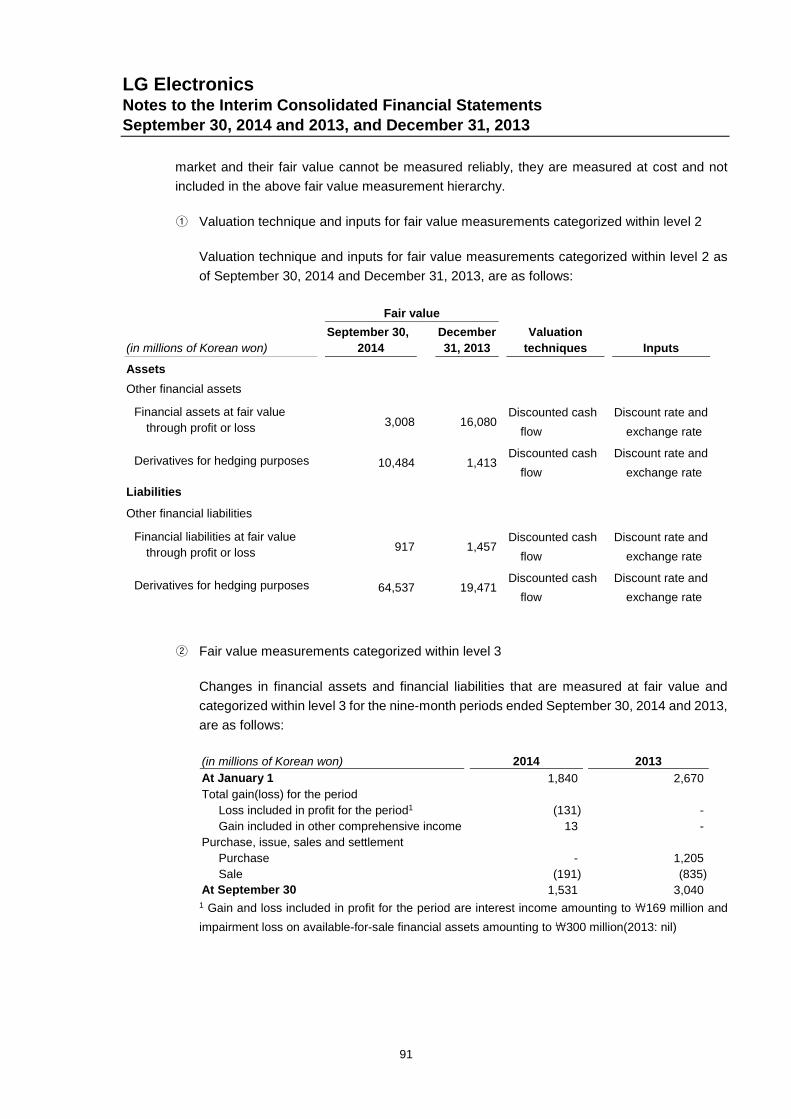
LG ElectronicsNotes to the Interim Consolidated Financial StatementsSeptember 30, 2014 and 2013, and December 31, 2013
91
market and their fair value cannot be measured reliably, they are measured at cost and not
included in the above fair value measurement hierarchy.
① Valuation technique and inputs for fair value measurements categorized within level 2
Valuation technique and inputs for fair value measurements categorized within level 2 as
of September 30, 2014 and December 31, 2013, are as follows:
Fair value
(in millions of Korean won)
September 30,
2014
December
31, 2013
Valuation
techniques Inputs
Assets
Other financial assets
Financial assets at fair value
through profit or loss 3,008 16,080Discounted cash
flow
Discount rate and
exchange rate
Derivatives for hedging purposes 10,484 1,413Discounted cash
flow
Discount rate and
exchange rate
Liabilities
Other financial liabilities
Financial liabilities at fair value
through profit or loss 917 1,457Discounted cash
flow
Discount rate and
exchange rate
Derivatives for hedging purposes 64,537 19,471Discounted cash
flow
Discount rate and
exchange rate
② Fair value measurements categorized within level 3
Changes in financial assets and financial liabilities that are measured at fair value and
categorized within level 3 for the nine-month periods ended September 30, 2014 and 2013,
are as follows:
(in millions of Korean won) 2014 2013
At January 1 1,840 2,670
Total gain(loss) for the period
Loss included in profit for the period1 (131) -
Gain included in other comprehensive income 13 -
Purchase, issue, sales and settlement
Purchase - 1,205
Sale (191) (835)
At September 30 1,531 3,0401 Gain and loss included in profit for the period are interest income amounting to \169 million and
impairment loss on available-for-sale financial assets amounting to \300 million(2013: nil)

LG ElectronicsNotes to the Interim Consolidated Financial StatementsSeptember 30, 2014 and 2013, and December 31, 2013
92
Valuation technique, inputs, and range of significant but unobservable inputs of financial
instruments that are measured at fair value and categorized within level 3 as of September
30, 2014 and December 31, 2013, as of follows:
Fair value Significant but
Range of
Significant but
(in millions of Korean
won)
September
30, 2014
December
31, 2013
Valuation
techniques Inputs
unobservable
inputs
unobservable
inputs
Other financial assets
Available-for-sale
financial assets
- Debt securities 1,531 1,840Discounted
cash flowDiscount rate
Discount rate
(credit spread)3.7%~8.1%
iii) Financial instruments not measured at fair value but for which the fair value is disclosed
Financial instruments not measured at fair value but for which the fair value is disclosed as of
September 30, 2014 and December 31, 2013, are as follows:
September 30, 2014
(in millions of Korean won) Level 1 Level 2 Level 3 Total
Assets
Non-current financial deposits - - 81,641 81,641
Non-current other receivables - - 542,838 542,838
Liabilities
Non-current borrowings - - 6,918,924 6,918,924
Non-current other payables - - 17,444 17,444
December 31, 2013
(in millions of Korean won) Level 1 Level 2 Level 3 Total
Assets
Non-current financial deposits - - 96,992 96,992
Non-current other receivables - - 577,737 577,737
Liabilities
Non-current borrowings - - 6,308,304 6,308,304
Non-current other payables - - 27,670 27,670

LG ElectronicsNotes to the Interim Consolidated Financial StatementsSeptember 30, 2014 and 2013, and December 31, 2013
93
① Valuation technique and inputs for fair value measurements categorized within level 2
As of September 30, 2014, there are no financial instruments that are not measured at fair
value but for which the fair value is disclosed and categorized within level 2.
② Disclosure in relation to fair value measurements categorized within level 3
Valuation technique, inputs and unobservable inputs of financial instruments that are not
measured at fair value but for which the fair value is disclosed and categorized within level 3
as of September 30, 2014 and December 31, 2013, are as follows:
September 30, 2014 December 31, 2013Significant but
Range of
Significant but
(in millions of
Korean won)
Carrying
amount Fair value
Carrying
amount Fair value
Valuation
techniques Inputs
Unobservable
inputs
unobservable
inputs
Assets
Non-current
financial
deposits
81,641 81,641 96,992 96,992Discounted
cash flow
Discount rate
and Exchange
rate
Discount rate 0.1% ~ 3.1%
Non-current
other
receivables
564,494 542,838 601,978 577,737Discounted
cash flow
Discount rate
and Exchange
rate
Discount rate 3.5% ~ 4.7%
Liabilities
Non-current
borrowings
6,648,445 6,918,924 6,188,306 6,308,304Discounted
cash flow
Discount rate
and Exchange
rate
Discount rate 2.3% ~ 4.0%
Non-current
other
payables
17,162 17,444 27,670 27,670Discounted
cash flow
Discount rate
and Exchange
rate
Discount rate 4.0% ~ 4.7%

LG ElectronicsNotes to the Interim Consolidated Financial StatementsSeptember 30, 2014 and 2013, and December 31, 2013
94
32. Business Combinations
i) The Group is promoting the smart car and electricity car components business as future
strategic business by utilizing current capability driven by its IT, home appliances and parts
technology. The Group acquired 100% of V-ENS Co., Ltd.'s ordinary shares from its related
party, LG CNS Co., Ltd., on May 1, 2013, for the merger with V-ENS Co., Ltd., which has
strength in the machinery field, including vehicle design and practical vehicle verification. The
Group's intention is to amplify the value of fostering business and to accelerate the growth of
auto parts business in the future.
ii) The following table summarizes the consideration paid and the fair value of assets acquired
and liabilities assumed:
(in millions of Korean won) Amount
Consideration
Cash and cash equivalents 17,028
Total consideration 17,028
Recognized amounts of identifiable assets acquired and liabilities
assumed
Current assets
Cash and cash equivalents 13,474
Trade receivables 40,748
Loans and other receivables 1,092
Inventory 1,017
Current income tax assets 188
Other current assets 1,482
Non-current assets
Financial deposit 3
Loans and other receivables 39
Property, plant and equipment 6,044
Intangible assets 5,934
Other non-current assets 436
Current liabilities
Trade payables (17,489)
Other payables (8,162)
Current income tax liabilities (31)
Provisions (131)
Other current liabilities (27,074)
Non-current liabilities
Net defined benefit liability (542)
Total identifiable net assets 17,028
Goodwill -

LG ElectronicsNotes to the Interim Consolidated Financial StatementsSeptember 30, 2014 and 2013, and December 31, 2013
95
iii) The acquisition-related costs amounting to ₩293 million were all expensed at the time they
were incurred.
iv) The above fair value of trade receivables and other receivables are the same as the gross
contractual amounts.
v) Sales and net loss contributed by V-ENS Co., Ltd. included in the interim consolidated
statements of income from May 1, 2013, were\49,500 million and\5,066 million, respectively.
If V-ENS Co., Ltd. had been consolidated from January 1, 2013, sales and profit for the period
in the consolidated statement of comprehensive income for the nine-month period ended
September 30, 2014, would have been as follows:
(in millions of Korean won) Before adjustments Adjustment After adjustments
Sales 43,225,067 41,362 43,266,429
Profit for the period 286,151 4,226 290,377
vi) As a result of the acquisition, V-ENS Co., Ltd. and its subsidiaries (V-ENS (M) Sdn., Bhd and
VENS BEIJING VEHICLE ENGINEERING CO.,LTD.) were incorporated into the consolidated
subsidiaries. The Group merged with V-ENS Co., Ltd. on July 1, 2013, based on the resolution
approved by the board of directors on April 24, 2013. It was a merger with exchange ratio of 1
to 0 without issuance of new stock. As it falls under both a small scale merger (for the Parent
Company) and a simplicity merger (for V-ENS Co., Ltd.), the approval of the shareholders was
replaced by a resolution of the board of directors dated May 23, 2013. This merger does not
have any impact on the consolidated financial statements.
33. Event After the Reporting Period
On October 28, 2014, the Board of Directors of the Parent Company resolved to discontinue
production and sales of PDP Module and PDP TV due to the decrease in demand of PDP TV
products and the discontinuation of supply from major suppliers. The date of discontinuing the
operations is expected to be November 30, 2014, and the sales generated by discontinued
operations for the year ended December 31, 2013 and the nine-month period ended September
30, 2014, are \1,368,074 million and \796,945 million, respectively.