novel ultrasonic instrumentation developments for real ...€¦ · . ... “sct” & “ibl”)...
TRANSCRIPT
Sensors & Transducers, Vol. 207, Issue 12, December 2016, pp. 4-14
4
Sensors & Transducers
Published by IFSA Publishing, S. L., 2016 http://www.sensorsportal.com
Novel Ultrasonic Instrumentation Developments for Real-time Monitoring of Binary Gas Mixtures
and Flow: Description and Applications
3 M. Battistin, 3 S. Berry, 3 P. Bonneau, 3 O. Crespo-Lopez, 4 C. Deterre, 6 M. Doubek, 3 G. Favre, 7 G. Hallewell, 8 S. Katunin, 3 D. Lombard, 4 A. O’Rourke, 4 A. Madsen, 9 S. McMahon, 10 K. Nagai, 1, * C. Rossi,
5 B. Pearson, 11 D. Robinson, 7 A. Rozanov, 12 E. Stanecka, 2 M. Strauss, 6 V. Vacek, 3 R. Vaglio, 2 J. Young
1 INFN Genova, via Dodecaneso 33, 16146 Genova, Italy 2, 5 Department of Physics and Astronomy, University of Oklahoma, Norman, OK 73019, USA
3 CERN, 1211 Geneva 23, Switzerland 4 DESY, Notkestraße 85, Hamburg 22607, Germany
6 Czech Technical University, Technická 4, 166 07 Prague 6, Czech Republic 7 Centre de Physique des Particules de Marseille, 163 Avenue de Luminy, 13288 Marseille, France
8 B.P. Konstantinov Petersburg Nuclear Physics Institute (PNPI), 188300 St. Petersburg, Russia 9 Rutherford Appleton Lab, Science & Technology Facilities Council, Chilton, OX11OQX, UK
10 Department of Physics, Oxford University, Keble Road, Oxford OX1 3RH, UK 11 Department of Physics, Cambridge University, J. J.Thomson Avenue, Cambridge, CB3 0HE, UK
12 Institute of Nuclear Physics PAS, ul. Radzikowskiego 152, 31-342 Kraków, Poland Tel.: +390103536236
* E-mail: [email protected]
Received: 5 November 2016 /Accepted: 5 December 2016 /Published: 30 December 2016 Abstract: Custom ultrasonic instruments have been developed for continuous monitoring and real-time measurement of composition and flow in binary gas mixtures. These characteristics are derived from measurements of sound transit time along two opposite directions - parallel or tilted to the gas flow direction. The flow rate is then calculated from the transit time difference while the average is used to compute sound velocity by comparison with a sound velocity/composition database. Five devices are integrated in the Detector Control System of the ATLAS experiment at the CERN Large Hadron Collider. Three instruments monitor C3F8 and CO2 coolant leaks into the nitrogen-purged envelopes of the inner silicon tracker; respectively with precisions better than ±2 × 10⁻⁵ and ±10-4. Two further instruments are used to monitor the new thermosiphon C3F8 evaporative coolant recirculator. One of these measures C3F8 vapour return flow to the condenser while the other tracks air ingress into the condenser with a precision better than 10-3. The precision of these instruments highlights their potential in other applications requiring continuous binary gas composition monitoring. Keywords: Ultrasonic binary gas analysis, ATLAS Detector Control System, Sonar, thermosiphon, Evaporative cooling system.
http://www.sensorsportal.com/HTML/DIGEST/P_2878.htm

Sensors & Transducers, Vol. 207, Issue 12, December 2016, pp. 4-14
5
1. Introduction
Custom ultrasonic (“sonar”) instruments have been developed for real-time monitoring and measurement of binary gas mixtures in the ATLAS experiment, one of the major experiments at the CERN Large Hadron Collider (LHC). ATLAS is a particle physics detector consisting of a series of concentric sub-detectors arranged around one of the LHC proton beam collision points [1]. The innermost sub-detector - the ATLAS Inner Detector (ID) - tracks charged particles in a solenoidal magnetic field using gas-based tracking elements and high resolution silicon detectors in microstrip and pixelated configurations. The silicon sub-detectors are closest to the beam collisions and
must be kept at low temperature (-10 ⁰C or lower) to mitigate radiation damage. They are evaporatively cooled using C3F8 (octafluropropane) and CO2. Three of five ultrasonic instruments monitor coolant leaks into the nitrogen-purged envelopes of these silicon tracking detectors. Two further instruments form part of the control system of the new thermosiphon C3F8 evaporative cooling recirculator plant [2], being commissioned to replace the present compressor-driven system. One (angled acoustic path) instrument was built to measure the C3F8 vapour flow returning to the thermosiphon condenser while another detects and eliminates (“degasses”) ingressed air from the condenser. The locations of the five instruments are shown in Fig. 1.
Fig. 1. Installations in the ATLAS Inner Detector. Three sonars monitor the N2 envelopes of the (“Pixel”, “SCT” & “IBL”) silicon sub-detectors, while a degassing sonar and an angled flowmeter monitor the thermosiphon recirculator.
2. The Instrument and its Operating Principle
The instruments contain facing pairs of 50 kHz capacitive ultrasonic transducers [3] within flanged envelopes through which gas flows. When transmitting, a transducer is excited by (3000V) square pulses, generated from low-voltage precursors in a dsPIC33F microcontroller. A 40 MHz transit time clock is started synchronously with the leading edge of the first transmitted pulse. The acoustic signal received by the other transducer is passed through amplifiers and a comparator, stopping the clock when a user-defined threshold is crossed (Fig. 2).
The micro-controller also reverses the transmission direction for the transit time to be
measured in both directions (Fig. 2). These transit times are then used with geometrical parameters to evaluate the gas flow rate.
The ultrasonic instruments can be used for simultaneous gas flow measurement and composition analysis, exploiting the physical phenomenon whereby - at known temperature and pressure - the sound velocity in a binary gas mixture depends on the molar concentration of its components. For binary gas analysis, the sound velocity is calculated from the average of the transit times in opposite directions and then compared in real-time to a stored concentration vs. sound velocity database for a given temperature and pressure. This database can be generated from theoretical models and/or from previously-made calibration mixtures [4].

Sensors & Transducers, Vol. 207, Issue 12, December 2016, pp. 4-14
6
Fig. 2. Principle of operation of bi-directional ultrasonic transmission and detection in the instrument.
The software employssound velocity vs. concentration look-up tables using the general formalism for the speed of sound in a gas mixture, combining the thermodynamic properties of pairs of component gases:
∙ ∙, (1)
where R is the molar gas constant (8.3145 J·mol-1·K-1), T is the absolute temperature in Kelvin, Mm is the combined molar mass of the mixture and is the adiabatic index for the mixture.
Mm and are given respectively by
and ∑
∑, (2)
where is the molar fraction of component i in the mixture while and are the component’s molar specific heats at constant pressure and volume respectively. The and values for the individual mixture components are calculated using the NIST REFPROP package [5] over the expected range of
operating temperature and pressure. Examples of these calculations are shown in in Fig. 3, Fig. 4 and Fig. 5 for C3F8 and N2.
Fig. 3. Molar specific heat at constant pressure vs. temperature for N2 (left vertical axis) and C3F8 (right
vertical axis) at a range of temperatures and pressures.
For each pair of gases a database is created of sound velocity vs. concentration of the components, covering the expected range of temperature and pressure. Sound velocity vs. concentration is stored as a series of polynomial fit parameters at each temperature and pressure. These fit parameters can be thought of as being vertically-suspended above the intersections of a 2-D grid of temperature and pressure points. For the C3F8/N2 and CO2/N2 gas combinations this grid runs from 13-25⁰C in 1⁰C steps and from 900-1100 mbarabs in 20 mbar steps. In the case of the degassing sonar of the thermosiphon condenser (Section 3) the range is from 10-45⁰C in 1⁰C steps and from 300-1500 mbarabs in 100 mbar steps.
Fig. 4. Molar specific heat at constant volume vs. temperature for N2 (left vertical axis) and C3F8 (right
vertical axis) at a range of temperatures and pressures.

Sensors & Transducers, Vol. 207, Issue 12, December 2016, pp. 4-14
7
Fig. 5. Variation of Sound velocity in the range 0-0.1 % C3F8 in N2.
In practice the temperature and pressure (measured simultaneously with transit times) will fall between the grid: sound velocity vs. concentration fit parameters are first interpolated to intermediate values corresponding to the measurement temperature at grid pressures immediately above and below the measurement pressure. In a second step a linear interpolation between the intermediate fit parameters is made along the orthogonal (pressure) direction to calculate the final parameters corresponding to both the measured temperature and pressure. From these parameters the relative concentrations of the two components are calculated.
The precision of the instrument for measurements of sound velocity is better than 0.05 m.s-1. Contributions to this uncertainty, c, are due to:
±0.2 ºC temperature stability in the sonar tube (equivalent to ±0.044 m.s-1); ±4 mbar pressure stability (±0.012 m.s-1); ±0.1 mm transducer inter-foil measurement
uncertainty (±0.018 m.s-1); ±100 ns electronic transit time measurement
uncertainty (0.002 m.s-1). The precision of mixture determination, (mix), at
any concentration of the N2 and C3F8 components is given by:
, (3)
where m is the local slope of the sound velocity vs. concentration curve (m.s-1[%C3F8]-1).
As an example, the average gradient of the sound velocity vs. concentration curve is -12.55 m.s-1. [%C3F8]-1 for C3F8 concentrations in the range 0-0.1 % in N2. The intrinsic sound velocity measurement uncertainty of ±0.05 m.s-1 yields, via Eq. (3) a corresponding mixture uncertainty of ±0.004 %.
To accurately measure the distance, L, between the membranes of the ultrasonic transducers a calibration based on two gases with different sound velocities can be used. This method takes into account the possibility
that the measured transit times (tt) in the two gases might include a transit time offset, ttoffset, for the time taken for the signals from the detected sound pulses to rise sufficiently to cross the comparator thresholds (Fig. 2). The real transit time (tt’) in each gas has therefore to be corrected with an offset time (e.g. ′ ). It is also necessary to
know the true sound velocity, Vs, in each component gas at the temperature and pressure where the calibration is carried out. These can be also calculated using the NIST-REFPROP package [5].
Taking as an example a two-gas calibration based on real component sound velocities and measured transit times in pure C3F8 and pure N2:
; , (4)
∙ ∙
, (5)
′∙
(6)
′∙
, (7)
∙ ∙ (8)
Each of the five sonar instruments integrated into
the Detector Control System (DCS) of the ATLAS experiment (Fig. 1) has local electronics consisting of an acoustic timing module, analog input modules for the acquisition of temperatures and pressures and an external communication module, communicating with each other through a local bus running a custom 2-wire communication protocol. A schematic of the 2-wire protocol electronics is shown in Fig. 6 and an implementation photograph in Fig. 7. The 2-wire bus can also house additional modules for 4-20 mA DAC outputs and for the control of sampling valves and aspirating pumps. The external communication interface is based on an MBED module [6]. Due to the long distances (hundreds of meters) between the dispersed instruments, communication to the central Dell R610 SCADA (Supervisory, Control And Data Acquisition) computer uses the TCP/IP Modbus protocol over Ethernet (Fig. 8).
The data acquisition software is implemented in Siemens Symantic WINCC-OA version 3.11 [8] running on Linux. The WINCC project runs the Graphical User Interface (GUI) and also handles the continuous archiving of speed of sound, transit time, concentration, temperature and pressure data from each sonar to the ATLAS DCS oracle database. The software also controls the system through a finite state machine (FSM). Out-of-range alarms can be generated and are propagated through the FSM to an external GSM and e-mail alert system.

Sensors & Transducers, Vol. 207, Issue 12, December 2016, pp. 4-14
8
Fig. 6. Diagram of the 2-wire protocol electronics [7].
Fig. 7. Electronic implementation in weatherproof cabinet (degassing sonar).
Fig. 8. Readout architecture of the full sonar system [9].
Fig. 9 illustrates part of the WINCC-OA GUI which handles the gas selection for the sonar tubes used to monitor coolant leaks into the N2-purged volumes surrounding the sub-elements of the ATLAS silicon tracker.
Fig. 9. Part of the sonar system graphical user interface implemented in Siemens Symantec ® WinCC-OA [8].
3. Application and Commissioning of the Instruments in the ATLAS Thermosiphon Cooling Recirculator
3.1. Degassing Sonar Two instruments are directly implemented in the
new ATLAS thermosiphon C3F8 evaporative coolant circulation system shown in Fig. 1. The thermosiphon takes advantage of the typical configuration of the LHC experiments located around 100 m underground. It is based on the physical phenomenon of natural circulation: C3F8 is condensed at the lowest temperature/pressure (-60°C, 309 mbarabs) but at the highest elevation in the system. In ATLAS the driving force of the circuit is given by the 92 m liquid column, starting from the condenser. The C3F8 refrigerant exits the detector as a vapour at -25°C and 1.67 barabs and returns to the condenser against gravity due to pressure differential. The thermosiphon system must provide 60 kW of on-detector cooling capacity, and guarantee a vapour pressure of 1.67 barabs at the end of the on-detector cooling loops for stable operation of the silicon tracking detector components in the high radiation zone near the LHC beams. To achieve 60 kW cooling capacity 1.2 kg·s-1 of C3F8 must be circulated and condensed. A diagram of the thermosiphon plant is shown in Fig. 10. The purpose of the new cooling system is to replace the compressors of the present cooling plant recirculator, removing “active” (reciprocating) components from the primary cooling loop, leading to a more reliable system requiring less maintenance.

Sensors & Transducers, Vol. 207, Issue 12, December 2016, pp. 4-14
9
The “degassing” sonar (Fig. 1) represents the key tool for the detection and elimination of air leaks into the thermosiphon plant. The instrument is placed on the top of the thermosiphon condenser, at the lowest temperature and pressure of the cooling system, and therefore at the point where any air leaks will accumulate. The ingress of air must be avoided since an increase in condenser pressure will erode the pressure differential needed to circulate the 1.2 kg·s-1 C3F8 vapour flow back to the condenser against gravity. Fig. 11 illustrates the sound velocity dependence on air concentration in C3F8 vapour at three temperatures of the degassing sonar and a
pressure of 300 mbar abs. For example, for 0-10 % air
contamination in C3F8 where the average slope of the velocity/concentration curve is ~0.56 ms-1[%air]-1, a sound velocity measurement precision of ±0.05 ms-1 would yield an uncertainty in air concentration of ±0.09 %.
During the commissioning of the thermosiphon with C3F8 circulation through a dummy load in July 2016 several tests were performed on the degassing sonar. Fig. 12 shows a direct shot taken from the GUI. The variation of air concentration in C3F8 and the speed of sound during a condenser cool-down test (July 08-11, 2016) are displayed.
Fig. 10. Schematic and thermodynamic phase diagram of the new thermosiphon cooling system [2].
Fig. 11. Sound velocity dependence on air concentration in C3F8 vapour at three temperatures
of the degassing sonar and a pressure of 300 mbarabs.
The pressure in the degassing sonar envelope is also shown, which reflects that of the condenser since both volumes are connected. During the test the
condenser temperature was decreased from -20 °C to -55 °C leading to a decrease in the saturated vapour pressure of the C3F8 liquid in the condenser. A consequent increase in the speed of sound and apparent air concentration is therefore noticeable. Air is not entering the condenser but the ratio between C3F8 vapour and air is changing in the headspace above the C3F8 liquid. The regular fluctuations of speed of sound are related to the day/night temperature variation. The rise in apparent air concentration is however not affected by these fluctuations, and is indicative of the robustness of the air-in-C3F8 concentration-finding algorithm.
Fig. 13 illustrates results with the condenser containing liquid C3F8 with a starting pressure of 410 mbarabs.
Around 12.00 on July 12, 2016 20 normal litres of N2 were injected into the lowest point of the vapour side of the thermosiphon recirculator (around 90 metres below the condenser) to simulate an air ingress. A rise in apparent air concentration of 2.6 % in the vapour seen by the degassing sonar was observed over the next 24 hours as the N2 gas migrated

Sensors & Transducers, Vol. 207, Issue 12, December 2016, pp. 4-14
10
through C3F8 vapour in the chicane and baffle structure of the condenser toward the degassing sonar. This increase was relative to a baseline level of around
26 % from previous N2 injections and the unvented accumulation from small leaks encountered and repaired over several weeks of running.
Fig. 12. Variation of concentration and speed of sound during the cool-down test (July 08-11, 2016). Sonar pressure is also shown.
Fig. 13. Effect on concentration (in green), speed of sound (in black), of adding 20 litres of N2 to the vapour side
of the ATLAS thermosiphon system (July 11-14, 2016). As mentioned above, the main purpose of the
degassing sonar is to detect and eliminate air ingress to avoid an increase in the condenser pressure which would reduce the return vapour flow to the condenser. Due to their density difference, N2 (or air) will accumulate in the headspace of the condenser volume (N2: MW = 28, C3F8: MW = 188). If air accumulates in the degassing sonar a sequence of valves is opened to evacuate or “release” it. The results of releasing tests made on July 14, 2016 are shown in Fig. 14. The starting apparent air concentration of 30.6 % is due to the N2 introduced in previous tests, including those shown in Fig. 12 and Fig. 13. While N2 is diffusing into the degassing sonar volume, the air concentration is seen to be slightly increasing. In order to remove the N2 from the condenser, a release of the system is required.
The degassing sonar volume is evacuated and a new mixture from the condenser headspace enters the
sonar. The abrupt increase in concentration corresponds to the entry of additional N2 from the condenser headspace. Each subsequent release shows a decrease in the measured “air” concentration, confirming that the degassing sonar is working properly by removing the accumulated N2. If more releases had been made, the concentration would have continued to decrease.
Fig. 14. Measurement of the apparent air concentration in the degassing sonar during the “releasing” tests made
on July 14, 2016.
3.2. Angled Flowmeter The precise measurement of high C3F8 vapour
return flows (up to 1.2 m.s-1) to the ATLAS thermosiphon condenser is ensured with a custom angled ultrasonic flowmeter (Fig. 1 and Fig. 15).
The device was constructed in stainless steel with the acoustic path crossing the gas flow at 45°. Quarter

Sensors & Transducers, Vol. 207, Issue 12, December 2016, pp. 4-14
11
turn ball valves in the acoustic tubes can be closed to allow ultrasonic transducer replacement without interrupting the main gas flow. The instrument has been calibrated against an anemometer in air (Fig. 15) and has demonstrated a flow precision of ±2.3 % full scale for flows up to 10.5 m.s-1[4]. Operation of the device in high returning flows of C3F8 vapour is planned soon.
The difference between the transit times in opposite directions is used to calculate the gas flow rate. In the angled ultrasonic flowmeter the acoustic path segment is at an angle α of 45° to the gas flow, with a “moving gas” length, L, defined as DMain /sinα, where DMain is the diameter of the return gas tube (135 mm). The remaining length of the sound path, L’, is in static gas, and has components L1 and L2 on either side of the flow tube (Fig. 16).
Fig. 15. Calibration in air of the 45° angled ultrasonic flowmeter prior to installation in the ATLAS thermosiphon recirculator (vs. an Amprobe TMA10A anemometer) [4].
Fig. 16. Geometrical layout of the angled flowmeter.
The gas flow velocity, vg (ms-1), can be calculated using the measured sound velocity, vs, as
′
′ (9)
and
(10)
The sound velocity can be calculated as the physical root of:
16 ′
4,
(11)
where the definition of A is:
2 (12)
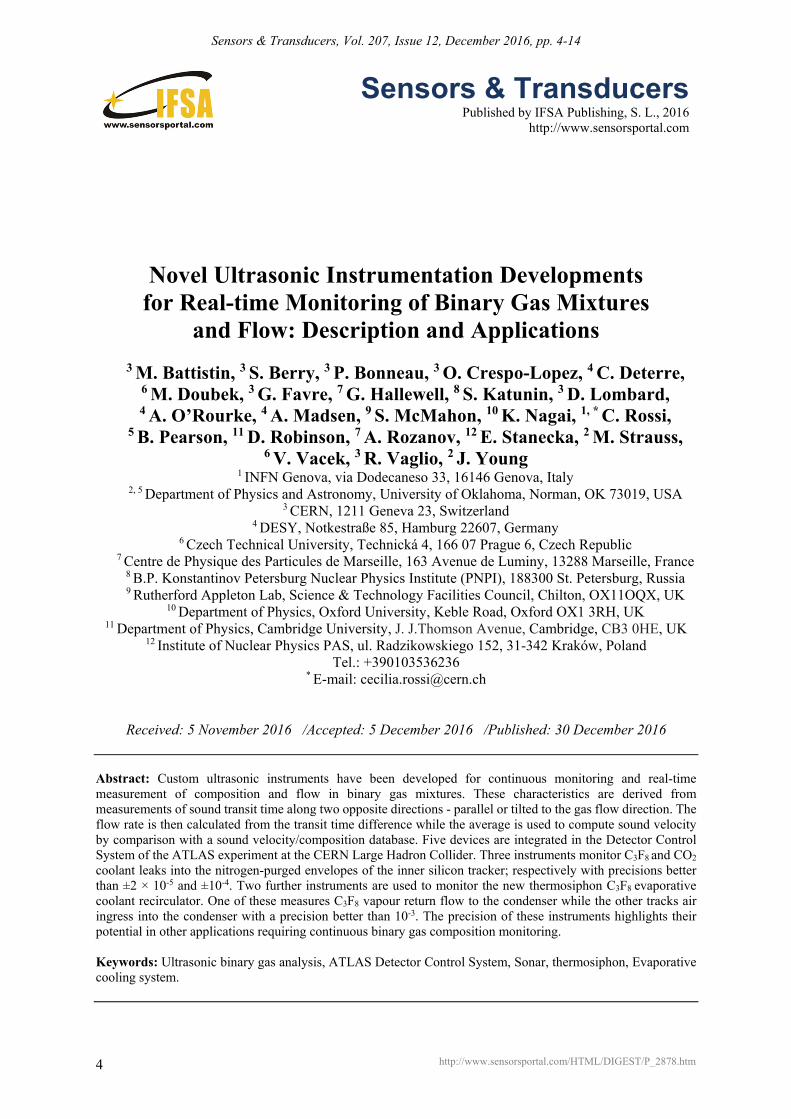
The algebra of equations (9)-(12) can be adapted to ultrasonic flowmeters in the other common geometries illustrated in Fig. 17. In each case the total acoustic path length can be expressed as distances, L, in moving gas and L’ in static (or closed circulating vortices of) gas. In some cases these lengths are best found in Computational Fluid Dynamics (CFD) calculations. Fig. 18 illustrates such a study made with the OpenFoam® CFD package [10] for a pinched axial flowmeter geometry built by this group [11].
Fig. 17. Illustration of four principal geometries of ultrasonic flowmeters with illustration of the acoustic
path segment, L, in uniformly moving gas.
Sensors & Transducers, Vol. 207, Issue 12, December 2016, pp. 4-14
12
Fig. 18. Stream lines and contours of the axial component of gas flow velocity (ms−1) in a pinched axial geometry
flowmeter geometry [11].
4. Measurements in the Triple Sonar Instrumentation The triple sonar instrumentation (Fig. 1) monitors
coolant leaks from the ATLAS SCT, Pixel and IBL silicon tracking subsystems into their separate N2-purged anti-humidity envelopes.
Fig. 19 illustrates the change in effective C3F8 concentration in the N2-purged envelope surrounding the ATLAS Pixel subsystem following the start-up of its C3F8 evaporative cooling on January 28, 2016. The sensitivity to molar concentration changes was better than 2.10-5. An increase in C3F8 concentration was seen, from < 5.10-5 to around 1.3.10-3, allowing identification of leaking cooling sub-circuits.
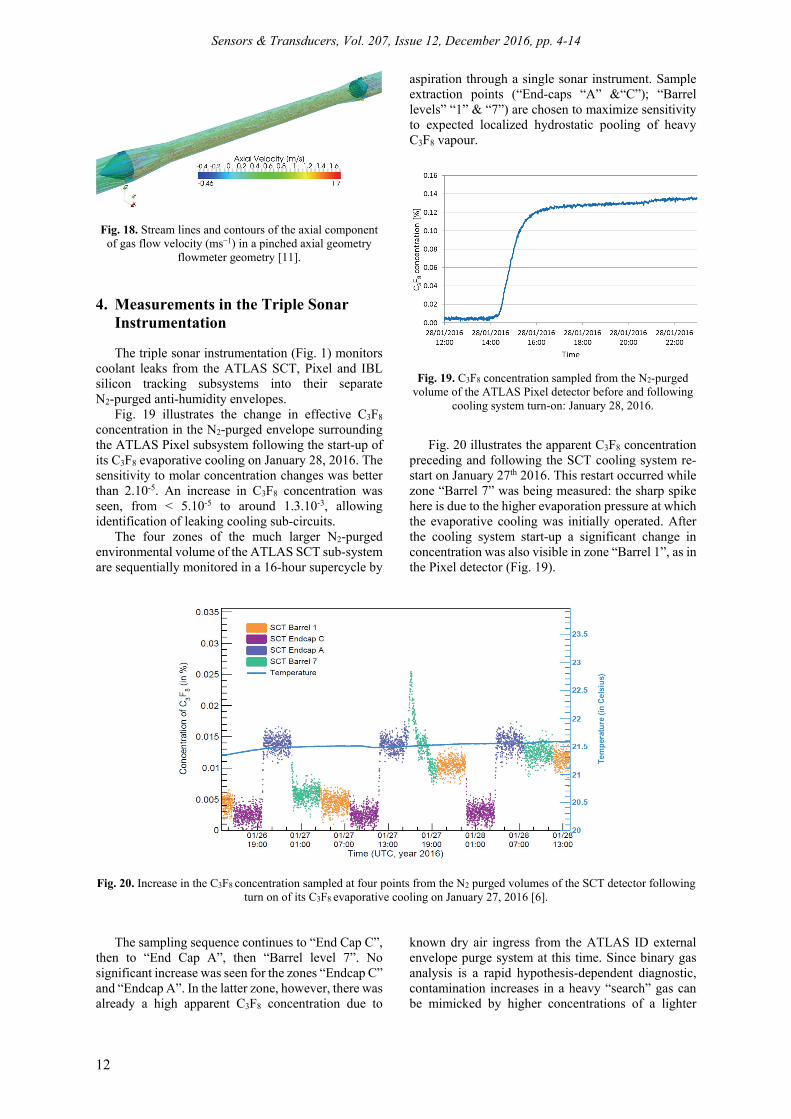
The four zones of the much larger N2-purged environmental volume of the ATLAS SCT sub-system are sequentially monitored in a 16-hour supercycle by
aspiration through a single sonar instrument. Sample extraction points (“End-caps “A” &“C”); “Barrel levels” “1” & “7”) are chosen to maximize sensitivity to expected localized hydrostatic pooling of heavy C3F8 vapour.
Fig. 19. C3F8 concentration sampled from the N2-purged volume of the ATLAS Pixel detector before and following
cooling system turn-on: January 28, 2016.
Fig. 20 illustrates the apparent C3F8 concentration preceding and following the SCT cooling system re-start on January 27th 2016. This restart occurred while zone “Barrel 7” was being measured: the sharp spike here is due to the higher evaporation pressure at which the evaporative cooling was initially operated. After the cooling system start-up a significant change in concentration was also visible in zone “Barrel 1”, as in the Pixel detector (Fig. 19).
Fig. 20. Increase in the C3F8 concentration sampled at four points from the N2 purged volumes of the SCT detector following turn on of its C3F8 evaporative cooling on January 27, 2016 [6].
The sampling sequence continues to “End Cap C”, then to “End Cap A”, then “Barrel level 7”. No significant increase was seen for the zones “Endcap C” and “Endcap A”. In the latter zone, however, there was already a high apparent C3F8 concentration due to
known dry air ingress from the ATLAS ID external envelope purge system at this time. Since binary gas analysis is a rapid hypothesis-dependent diagnostic, contamination increases in a heavy “search” gas can be mimicked by higher concentrations of a lighter

Sensors & Transducers, Vol. 207, Issue 12, December 2016, pp. 4-14
13
contaminant. Warnings given by a continuously-sensitive sonar instrument can however indicate the need for further investigation with more expensive multi-gas sensitive instrumentation, including gas chromatography.
Fig. 21 illustrates the time history of the molar concentration of C3F8 coolant leaks into the N2 environment of the SCT and Pixel sub-detectors over a 4-day period in May 2016.
Fig. 21. Variation of the C3F8 concentration in the N2 environment surrounding the ATLAS Pixel and SCT sub-detectors recorded for a period of 4 days in May 2016.
For the SCT, the highest C3F8 concentraton is seen at the lowest of the points monitoring the SCT N2 environmental volume (“Barrel level 1”) where more heavy C3F8 vapour leaking from the evaporative cooling circuits has had more time to pool after several months of operation. The increased apparent C3F8 concentration, particularly in the “Endcap A” zone is also in part due to a change of the ATLAS ID external envelope purge gas from nitrogen to heavier CO2.
5. Conclusions
We have developed ultrasonic instruments that have provided high-precision real-time measurements both for flow measurement and binary gas composition analysis.
For binary gas analysis, the precision of mixture determination also depends on the difference between the molecular weights of the two components: the larger the difference the greater the precision. In the case of C3F8 (m.w. = 188) leaks into N2 (m.w. = 28) envelopes of the ATLAS Pixel and SCT silicon tracker subdetectors a mixture precision is ±0.002 % was demonstrated for C3F8 concentration for the 0 – 0.1 % range, of most interest in leak detection.
A pair of ultrasonic instruments is included in the controls of the new ATLAS thermosiphon C3F8
evaoprative cooling recirculator. Numerous measurements were performed before and during the recent commissioning of the thermosiphon plant. For flow measurement, a precision of < 2.3 % for flows up to 10 m.s-1 was measured in a custom angled flowmeter. Another instrument built to measure air
ingress into a C3F8 condenser operating below atmospheric pressure has demonstrated a precision better than 10-3.
References
[1]. G. Aad, et al., The ATLAS experiment at the CERN Large Hadron Collider, Journal of Instrumentation, Vol. 3, August 2008.
[2]. M. Battistin, et al., The thermosiphon cooling system of the ATLAS experiment at the CERN Large Hadron Collider, International Journal of Chemical Reactor Engineering, 2015, pp. 13511–13521.
[3]. Originally designed by Polaroid® for autofocus cameras: now available and marketed as the SensComp model 600 transducer. http://www.senscomp.com/ultrasonic-sensors/
[4]. R. Bates, et al., A Custom Online Ultrasonic Gas Mixture Analyzer With Simultaneous Flowmetry, Developed for the Upgraded Evaporative Cooling System of the ATLAS Silicon Tracker, IEEE Transactions on Nuclear Science, Vol. 61, Issue 4, August 2014, pp. 2059-2065.
[5]. Lemmon E., Huber M., McLinden M., REFPROP Standard reference database 23, version 9.0, U.S. National Institute of Standards and Technology, 2010.
[6]. http://mbed.org/platforms/mbed-LPC1768. [7]. C. Rossi, et al., Application of New Ultrasonic
Instrumentation to Real-time Monitoring and Analysis of Binary Gases Mixtures, in Proceedings of the 2nd
International Conference on Sensors and Electronic Instrumentation Advances (SEIA’ 2016), Barcelona, Castelldefels, Spain, 22-23 September 2016, pp. 22-27.
[8]. http://w3.siemens.com/mcms/human-machine-interface/en/visualization-software/scada/simatic-wincc/Pages/default.aspx

Sensors & Transducers, Vol. 207, Issue 12, December 2016, pp. 4-14
14
[9]. M. Alhoob, et al., Implementations of Custom Sonar Instruments for Binary Gas Mixture and Flow Analysis in the ATLAS Experiment at the CERN LHC, IEEE Transactions on Nuclear Science, Vol. 63, Issue 3, June 2016, pp. 1659–1667.
[10]. OpenFOAM®, The open source computational fluid dynamics toolbox, version 2.1.0 (2011).
[11]. R. Bates, et al., A combined ultrasonic flow meter and binary vapour mixture analyzer for the ATLAS silicon tracker, Journal of Instrumentation, Vol. 8, Issue 02, 2013, p. 02006.
__________________
Published by International Frequency Sensor Association (IFSA) Publishing, S. L., 2016 (http://www.sensorsportal.com).