northwest power and conservation council slide 1 the 6 th northwest power and conservation plan...
TRANSCRIPT

Northwest Power and ConservationCouncil
Slide 1
The 6The 6thth Northwest Power and Northwest Power and Conservation PlanConservation Plan
It’s About CarbonIt’s About Carbon
Tom EckmanTom EckmanManager, Conservation ResourcesManager, Conservation Resources
Northwest Power and Conservation CouncilNorthwest Power and Conservation Council
Presented at Presented at Bonneville Power AdministrationBonneville Power Administration
SECURING OUR ENERGY FUTURE SECURING OUR ENERGY FUTURE UTILITY ENERGY EFFICIENCY SUMMITUTILITY ENERGY EFFICIENCY SUMMIT
March 18, 2009March 18, 2009
slide 2
Northwest Power and ConservationCouncil
Slide 2
Before I StartBefore I Start The Northwest’s The Northwest’s
Energy Efficiency Energy Efficiency Labor Force Has Labor Force Has Expanded RapidlyExpanded Rapidly
Bonneville’s regional Bonneville’s regional meetings revealed a meetings revealed a need for more need for more background on the background on the PNW PNW Energy Energy Efficiency NetworkEfficiency Network
Because . .Because . . .
It’s Not Easy Being Green.It’s Not Easy Being Green.

How A Kilowatt-Hour is Saved:How A Kilowatt-Hour is Saved:The Northwest Energy Efficiency Implementation WebThe Northwest Energy Efficiency Implementation Web
Bonneville Power
Administration
PublicUtilities
InvestorOwnedUtilities
Northwest Powerand Conservation
Council
StateRegulatory
Commissions Northwest EnergyEfficiencyAlliance
Energy TrustEnergy Trustofof
OregonOregon
RegionalTechnical
Forum
End Use ConsumersEnd Use Consumers
Markets, Markets, Codes & Codes & StandardsStandards
= = Policy Policy RecommendationsRecommendations
= Technical= TechnicalRecommendationsRecommendations
= Program= ProgramFundingFunding
= Conservation= ConservationProgramsPrograms
= Market TransformationPrograms/Projects
The “Plan”The “Plan”
= = Policy Policy
= Rate= Rate RevenuesRevenues

slide 4
Northwest Power and ConservationCouncil
Slide 4
To Understand the Present, You To Understand the Present, You Need to Know Our PastNeed to Know Our Past
Why Is It So *&%# Complicated?Why Is It So *&%# Complicated?
slide 5
Northwest Power and ConservationCouncil
Slide 5
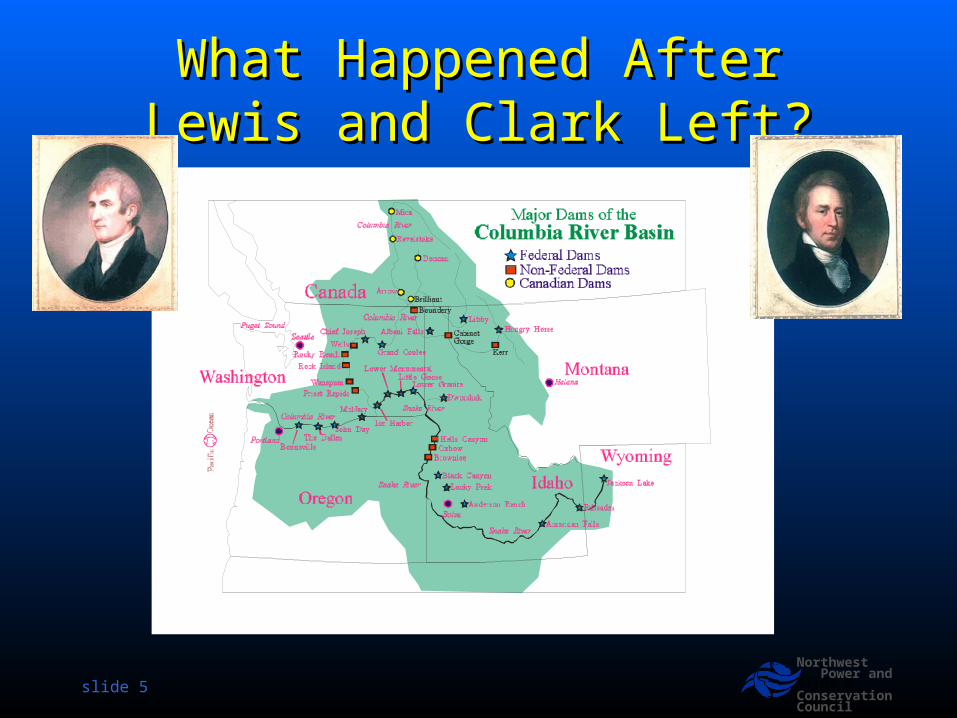
What Happened AfterWhat Happened AfterLewis and Clark Left?Lewis and Clark Left?

slide 6
Northwest Power and ConservationCouncil
Slide 6
The First Three “Eras” of The First Three “Eras” of Power Planning in the PNWPower Planning in the PNW
““New Deal” Mysticism New Deal” Mysticism (1930-1950)(1930-1950)– Politicians plan using “chicken entrails and crystal Politicians plan using “chicken entrails and crystal
balls” balls” legislatelegislate what’s needed and when what’s needed and when Engineering Determinism Engineering Determinism (1950- 1970)(1950- 1970)
– Engineers, using graph paper and rulers Engineers, using graph paper and rulers scheduleschedule the next power plantsthe next power plants
Economic Determinism Economic Determinism (1970 to April 27, (1970 to April 27, 1983)1983)– Economist, using price elasticity Economist, using price elasticity slowslow the the
engineer’s construction schedulesengineer’s construction schedules

slide 7
Northwest Power and ConservationCouncil
Slide 7
Actions Taken in Response to Actions Taken in Response to “Engineering and Economic “Engineering and Economic
Determinist’s” ForecastsDeterminist’s” Forecasts Utilities planned and/or started construction Utilities planned and/or started construction
on on 28 coal and nuclear power plants28 coal and nuclear power plants to be to be completed over a 20-year period.completed over a 20-year period.
Native American tribes Native American tribes suedsued the state and the state and federal government over loss of salmonfederal government over loss of salmon
Environmental groups Environmental groups suedsued Bonneville Power Bonneville Power Administration over plans to turn the Administration over plans to turn the Columbia River into “Columbia River into “Wave WorldWave World””

slide 8
Northwest Power and ConservationCouncil
Slide 8
Impact of Actions Taken in Response Impact of Actions Taken in Response to “Engineering and Economic to “Engineering and Economic
Determinist’s Forecasts and PlansDeterminist’s Forecasts and Plans
0.0
0.5
1.0
1.5
2.0
2.5
3.0
3.5
193819
4019
4219
4419
4619
4819
5019
5219
5419
5619
5819
6019
6219
6419
6619
6819
7019
7219
7419
7619
7819
8019
8219
8419
86
Year
BPA
Whole
sale
Pow
er R
ate
(Cen
ts/k
Wh)
Nominal DollarsYear 2000 Dollars
416% Rate Increase 416% Rate Increase over 5 yearsover 5 years

slide 9
Northwest Power and ConservationCouncil
Slide 9
Reaction to Impact of Actions Taken in Reaction to Impact of Actions Taken in Response to “Engineering and Economic Response to “Engineering and Economic
Determinist’s Forecasts and PlansDeterminist’s Forecasts and Plans
Terminate or mothball 9 nuclear and 5 Terminate or mothball 9 nuclear and 5 coal plants at a cost to the region’s coal plants at a cost to the region’s consumers of more than consumers of more than $7 billion$7 billion. .
Motivated the region’s politicians, Motivated the region’s politicians, utilities, larger industries and public utilities, larger industries and public interest groups to accept the “deals” interest groups to accept the “deals” embodied in the embodied in the Northwest Power and Northwest Power and Conservation Planning Act of 1980Conservation Planning Act of 1980

The Evolution of Energy PolicyThe Evolution of Energy Policy
April 18, 1977 – Conservation means a cold dark house
President Carter announces we are engaged in the moral equivalent of war (MEOW)
December 5, 1980 - Conservation declared a resource equivalentto generation
President Carter signs Northwest Powerand Conservation Act
President Carter Awarded Nobel Peace Prize

slide 11
Northwest Power and ConservationCouncil
Slide 11
The Fourth Era -The Fourth Era - Northwest Power and Conservation Northwest Power and Conservation
Planning Act of 1980 (PL96-501)Planning Act of 1980 (PL96-501)
Authorized States of ID, OR, MT and WA to form an Authorized States of ID, OR, MT and WA to form an “interstate compact” (aka, “The Council”)“interstate compact” (aka, “The Council”)
Directed the Council to develop 20-year load forecast and Directed the Council to develop 20-year load forecast and resource plan (“The Plan”) and update it every 5 – yearsresource plan (“The Plan”) and update it every 5 – years
– ““The Plan” shall call for the development of the The Plan” shall call for the development of the least costleast cost mix of resourcesmix of resources
– ““The Plan” shall considerThe Plan” shall consider conservation (energy efficiency) conservation (energy efficiency) its highest priority resourceits highest priority resource equivalent to generation with a equivalent to generation with a 10% cost advantage over power generating resources10% cost advantage over power generating resources
Mandated Mandated public involvementpublic involvement in Council’s planning process. in Council’s planning process.

slide 12
Northwest Power and ConservationCouncil
Slide 12
Who Are Those Guys?Who Are Those Guys?
Eight Council Eight Council MembersMembers
Two From Each Two From Each PNW StatePNW State
Appointed by Appointed by GovernorsGovernors
Cabinet Level Cabinet Level Positions in State Positions in State GovernmentGovernment

slide 13
Northwest Power and ConservationCouncil
Slide 13
How Has It Worked?How Has It Worked?

slide 14
Northwest Power and ConservationCouncil
Slide 14
Utility Reaction to Council’s First Utility Reaction to Council’s First Plan Was “Mixed”Plan Was “Mixed”

Over the Last Three Decades Regional Utility Over the Last Three Decades Regional Utility Conservation Acquisitions Resulted in “Mr. Toad’s Wild Conservation Acquisitions Resulted in “Mr. Toad’s Wild
Ride”* for the PNW’s Energy Efficiency IndustryRide”* for the PNW’s Energy Efficiency Industry
0
50
100
150
200
250
1978 1982 1986 1990 1994 1998 2002 2006
Conse
rvati
on A
cquis
itio
ns
(aM
W)
See: http://en.wikipedia.org/wiki/Mr._Toad's_Wild_Ride

slide 16
Northwest Power and ConservationCouncil
Slide 16
Nevertheless – We’ve Nevertheless – We’ve Accomplished “Mass Quantities”Accomplished “Mass Quantities”
0
500
1,000
1,500
2,000
2,500
3,000
3,500
4,000
Avera
ge M
egaw
att
s
1978 1982 1986 1990 1994 1998 2002 2006
BPA and Utility Programs Alliance Programs State Codes Federal Standards
Since 1978 Utility & BPA Since 1978 Utility & BPA Programs, Energy Codes & Programs, Energy Codes & Federal Efficiency Standards Have Federal Efficiency Standards Have Produced Produced Almost Almost 3600 aMW of 3600 aMW of Savings.Savings.

slide 17
Northwest Power and ConservationCouncil
Slide 17
So What’s 3600 aMW?So What’s 3600 aMW?
It’s enough electricity to serve more It’s enough electricity to serve more than the than the entireentire state of Idahostate of Idaho and and all all of Western Montanaof Western Montana
It saved the region’s consumers nearly It saved the region’s consumers nearly than than $1.6 billion$1.6 billion in 2007 in 2007
It lowered 2007 PNW carbon emissions It lowered 2007 PNW carbon emissions by an estimated by an estimated 14.1 million14.1 million tons. tons.

slide 18
Northwest Power and ConservationCouncil
Slide 18
Since 1980 Energy Efficiency Resources Since 1980 Energy Efficiency Resources
Met About Half of PNW Load GrowthMet About Half of PNW Load Growth
-2000
0
2000
4000
6000
8000
10000
1980
1982
1984
1986
1988
1990
1992
1994
1996
1998
2000
2002
2004
2006
Cum
ula
tive G
row
th (
aM
W) Cumulative Load Growth w/o Conservation
Cumulative Load Growth w/Conservation
slide 19
Northwest Power and ConservationCouncil
Slide 19
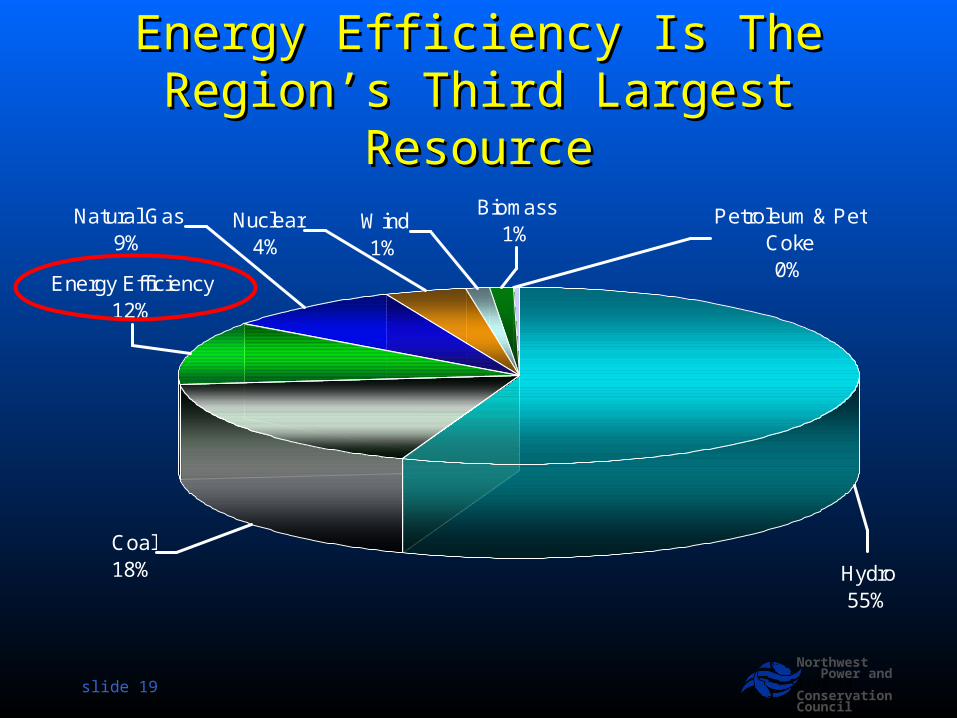
Energy Efficiency Is The Region’s Energy Efficiency Is The Region’s Third Largest ResourceThird Largest Resource
Energy Efficiency12%
Hydro55%
Coal18%
Biomass1%
Wind1%
Nuclear4%
Natural Gas9%
Petroleum & Pet Coke0%

slide 20
Northwest Power and ConservationCouncil
Slide 20
Utility Acquired Energy Efficiency Has Been AUtility Acquired Energy Efficiency Has Been A
BARGAIN!BARGAIN!
$0
$10
$20
$30
$40
$50
$60
$70
$80
$90
$100
May
-96
Nov-9
6
May
-97
Nov-9
7
May
-98
Nov-9
8
May
-99
Nov-9
9
May
-00
Nov-0
0
May
-01
Nov-0
1
May
-02
Nov-0
2
May
-03
Nov-0
3
May
-04
Nov-0
4
May
-05
Nov-0
5
May
-06
Nov-0
6
May
-07
Nov-0
7
Whole
sale
Ele
ctri
city
Pri
ce (
2006$/M
WH
)
Levelized Cost of Utility Efficiency AcquisitionsMonthly Average Wholesale Market Price @ Mid-C Trading Hub

slide 21
Northwest Power and ConservationCouncil
Slide 21
5th Plan Relied on Conservation and Renewable 5th Plan Relied on Conservation and Renewable Resources to Meet Resources to Meet Nearly AllNearly All Load Growth Load Growth
0
500
1000
1500
2000
2500
3000
3500
4000
4500
5000
2004 2007 2010 2013 2016 2019 2022
Cum
ula
tive
Cap
acit
y (M
W)*
Coal (ICG) (MW)
CCGTurbine (MW)
SCGTurbine (MW)
Wind (MW)
Conservation (aMW)
**Actual future conditions (gas prices, CO2 control, conservation Actual future conditions (gas prices, CO2 control, conservation accomplishments) will change resource development schedule and amounts.accomplishments) will change resource development schedule and amounts.

slide 22
Northwest Power and ConservationCouncil
Slide 22
Meeting 5Meeting 5thth Plan’s Conservation Targets Reduces Plan’s Conservation Targets Reduces Forecast PNW Power System COForecast PNW Power System CO2 2 Emissions in 2024 by Emissions in 2024 by
Nearly 20%Nearly 20%
0
10
20
30
40
50
60
70
80
90
With 5th Plan's Conservation Without 5th Plan's Conservation
CO
2 E
mis
sions
(mill
ion t
ons)

slide 23
Northwest Power and ConservationCouncil
Slide 23
The Region Is The Region Is ExceedingExceeding the the 55thth Plan’s Targets With Utility Funded Plan’s Targets With Utility Funded
Programs Alone!Programs Alone!
0
20
40
60
80
100
120
140
160
180
2005Target
2005Actual
2006Target
2006Actual
2007Target
2007Actual
An
nu
al S
avin
gs
(MW
a)
5th Plan Target
Bonneville FundedConservation (CarryOver)Alliance Programs(Utility, SBC andBonneville Funded)Bonneville FundedConservation
Utility & SBC FundedConservation

slide 24
Northwest Power and ConservationCouncil
Slide 24
When Overall Market Changes Are When Overall Market Changes Are Considered, The Region Set An All Considered, The Region Set An All
Time Savings Record in 2007Time Savings Record in 2007
0
20
40
60
80
100
120
140
160
180
200
220
2005Target
2005Actual
2006Target
2006Actual
2007Target
2007Actual
An
nu
al
Savin
gs (
MW
a)
5th Plan Target
Non-Programatic MarketEffects
Bonneville FundedConservation (Carry Over)
Alliance Programs (Utility,SBC and Bonneville Funded)
Bonneville FundedConservation
Utility & SBC FundedConservation

slide 25
Northwest Power and ConservationCouncil
Slide 25
Why Worry?Why Worry?
slide 26
Northwest Power and ConservationCouncil
Slide 26
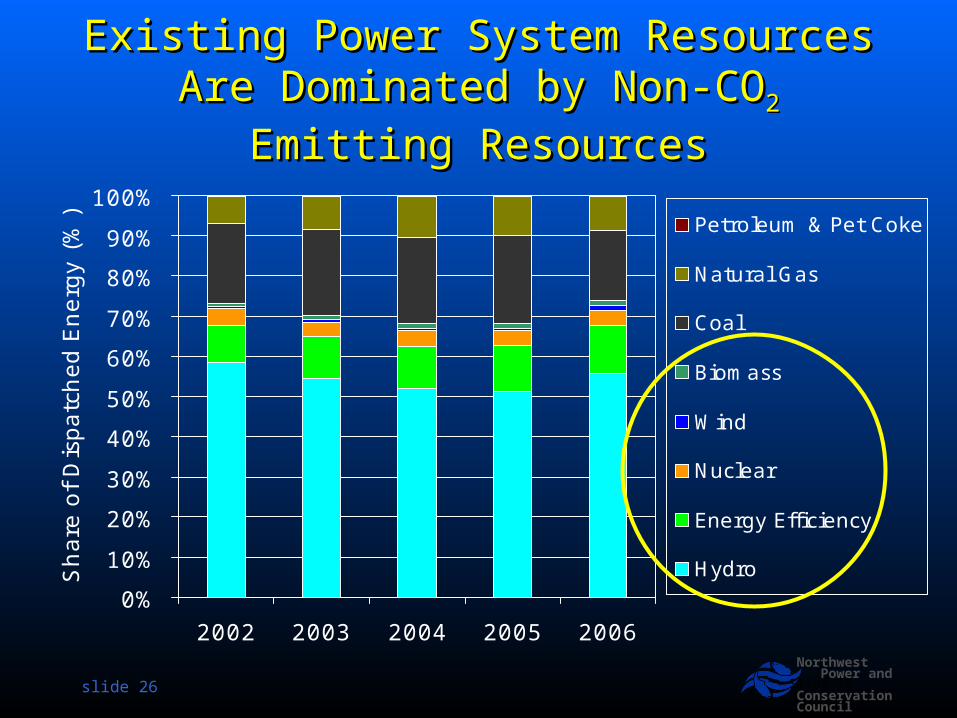
Existing Power System Resources Existing Power System Resources Are Dominated by Non-COAre Dominated by Non-CO2 2 Emitting Emitting
ResourcesResources
0%
10%
20%
30%
40%
50%
60%
70%
80%
90%
100%
2002 2003 2004 2005 2006
Sh
are
of
Dis
patc
hed E
nerg
y (
%)
Petroleum & Pet Coke
Natural Gas
Coal
Biomass
Wind
Nuclear
Energy Efficiency
Hydro

slide 27
Northwest Power and ConservationCouncil
Slide 27
Total PNW Power System Carbon Emissions Total PNW Power System Carbon Emissions Have Grown Significantly Since 1990Have Grown Significantly Since 1990
0
10
20
30
40
50
60
70
Actual 1990 Emissions Actual 2005 Emissions Simulated 2005w/average hydro
output
CO
2 E
mis
sions
(mill
ion t
ons)
~ 15 Coal Plants
~23 Coal Plants
Existing Coal Plants Produce 85% of Total PNW Power Existing Coal Plants Produce 85% of Total PNW Power System COSystem CO22 and Provide 20% of the Region’s Power and Provide 20% of the Region’s Power

slide 28
Northwest Power and ConservationCouncil
Slide 28
The PNW Now Plans To Meet Nearly All Future The PNW Now Plans To Meet Nearly All Future Load Growth With Conservation and Renewable Load Growth With Conservation and Renewable
ResourcesResources
0
1,000
2,000
3,000
4,000
5,000
6,000
20072009
20112013
20152017
20192021
20232025
Dis
pa
tch
ed
En
erg
y (M
Wa
)
RPS Hydro
RPS Solar
RPSGeothermalRPS Biomass
RPS Wind
Conservation
CommittedWind

slide 29
Northwest Power and ConservationCouncil
Slide 29
How Will This Impact the Power How Will This Impact the Power System’s Carbon Footprint?System’s Carbon Footprint?

slide 30
Northwest Power and ConservationCouncil
Slide 30
Even If We Meet All Load Growth With Energy Even If We Meet All Load Growth With Energy Efficiency and Renewable Resources Efficiency and Renewable Resources
COCO2 2 Emissions from Existing Fossil Fueled Plants Emissions from Existing Fossil Fueled Plants Remain UnchangedRemain Unchanged
0%
10%
20%
30%
40%
50%
60%
70%
80%
90%
100%
Sh
are
of
Dis
pa
tch
ed
En
erg
y (%
) Natural Gas
Coal
Biogas
Geothermal
Biomass
Nuclear
Wind
Conservation
Hydro

slide 31
Northwest Power and ConservationCouncil
Slide 31
Meeting the 5Meeting the 5thth Plan’s Conservation Goals Plan’s Conservation Goals ANDAND State State Renewable Portfolio Standards Renewable Portfolio Standards Will NotWill Not Meet WCI CO Meet WCI CO22
Emissions TargetsEmissions Targets
0
10
20
30
40
50
60
70
80
Emissions from NorthwestSources
Carb
on E
mis
sions
(mill
ion t
ons)
Actual 1990 Emissions
Actual 2005 Emissions
Simulated 2005 w/average hydrooutput
Forecast 5th Plan Resource 2025Portfolio Emissions
Forecast 2025 Emissions w/RPSRenewables
WCI GoalWCI Goal

OK, So What’s The Answer?

slide 33
Northwest Power and ConservationCouncil
Slide 33
55thth Plan Identified Nearly 4,600 MWa Plan Identified Nearly 4,600 MWa of “Technically Available” of “Technically Available”
Conservation PotentialConservation Potential
0
500
1,000
1,500
2,000
2,500
3,000
3,500
4,000
4,500
5,000
$10 $20 $30 $40 $50 $60 $70 $80 $90 $100 $100+
Real Levelized Cost (2000$/MWH)
Ave
rag
e M
eg
aw
att
s b
y 2
02
5 Lost Opportunity Conservation
Dispatchable Conservation

slide 34
Northwest Power and ConservationCouncil
Slide 34
Adjustments to 5Adjustments to 5thth Plan’s Plan’s Conservation Resource PotentialConservation Resource Potential Reductions in Available PotentialReductions in Available Potential
– Program AccomplishmentsProgram Accomplishments– Changes in Law Changes in Law
» Federal Standards for general service lightingFederal Standards for general service lighting» State Building CodesState Building Codes
– Changes in MarketsChanges in Markets» Improved “Current Practice” due to Energy Star, LEED, Improved “Current Practice” due to Energy Star, LEED,
Programs, Market TransformationPrograms, Market Transformation» Other Changes to Federal Standards (10 adopted, 21 Other Changes to Federal Standards (10 adopted, 21
under revision, and 12 with effective dates by 2014)under revision, and 12 with effective dates by 2014)– Changes in ForecastChanges in Forecast
» Less new commercial floor areaLess new commercial floor area» Lower industrial forecastLower industrial forecast

slide 35
Northwest Power and ConservationCouncil
Slide 35
Adjustments to 5Adjustments to 5thth Plan’s Plan’s ConservationConservation Resource Potential Resource Potential
Increases in Available PotentialIncreases in Available Potential– Changes in ScopeChanges in Scope
» Distribution System Efficiency ImprovementsDistribution System Efficiency Improvements» Consumer electronics (TV’s, set top boxes)Consumer electronics (TV’s, set top boxes)» Irrigation Water Management and Dairy FarmIrrigation Water Management and Dairy Farm
– Changes in Data and TechnologyChanges in Data and Technology» Detailed Industrial Sector PotentialDetailed Industrial Sector Potential» New Measures (e.g. ductless heat pumps, solid New Measures (e.g. ductless heat pumps, solid
state lighting, 2 gpm Showerheads)state lighting, 2 gpm Showerheads)

slide 36
Northwest Power and ConservationCouncil
Slide 36
Avoided Costs Are Forecast to Avoided Costs Are Forecast to Be Significantly HigherBe Significantly Higher
$0
$10
$20
$30
$40
$50
$60
$70
$80
$90
2007 2010 2013 2016 2019 2022 2025 2028
Wh
ole
sale
Mark
et
Pri
ce
(20
06
$/M
Wh
)
5th Plan
Preliminary Draft 6th Plan

slide 37
Northwest Power and ConservationCouncil
Slide 37
Energy Efficiency is Still the Energy Efficiency is Still the Cheapest OptionCheapest Option
Assumptions :
Efficiency Cost = Average Cost of All Conservation Targeted in 5th Power Plan
Transmission cost & losses to point of LSE wholesale delivery
No federal investment or production tax credits
Baseload operation (CC - 85%CF, Nuclear 87.5% CF, SCPC 85%, Wind 32% CF)
Medium NG and coal price forecast (Proposed 6th Plan)
Bingaman/Specter safety valve CO2 cost
$0
$20
$40
$60
$80
$100
$120
$140
$160
Energ
y Effic
iency
Gas C
omb
Cycle
MT
Wind
(Loc
al)
Advan
ced N
uclea
r
Super
critic
al PC (W
A/OR)
Colum
bia B
asin
Wind
AB Wind
> W
A/OR
ID W
ind (L
ocal)
MT
Wind
> W
A/OR
Le
veliz
ed
Life
cycl
e C
ost
(2
00
6$
/MW
h)
Emission (CO2) cost
Transmission & Losses
System Integration
Plant costs
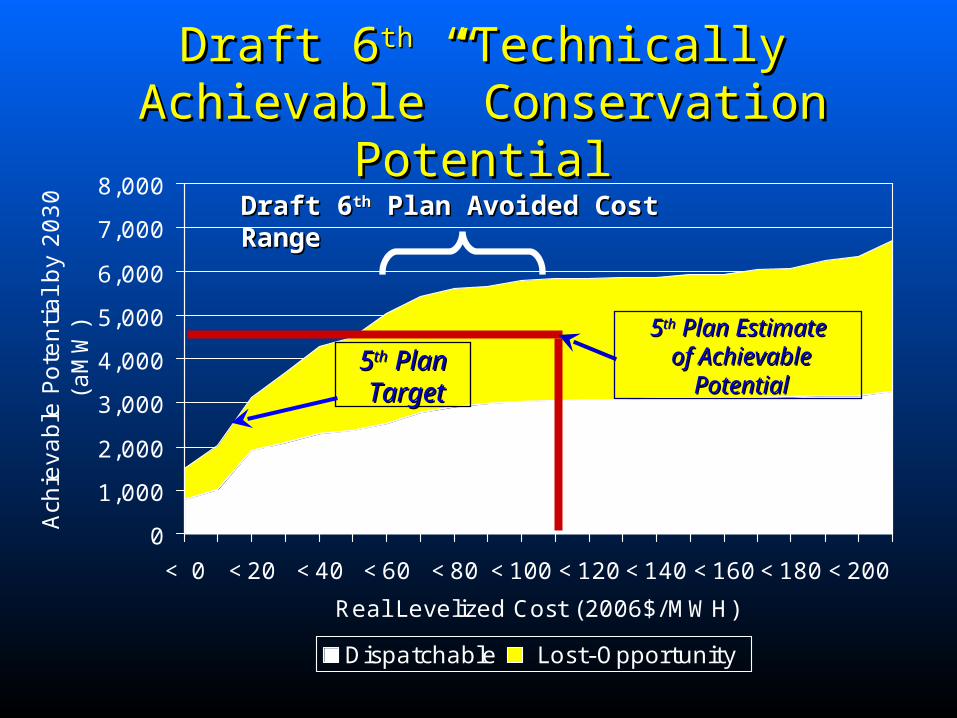
Draft 6Draft 6thth “Technically “Technically Achievable” Conservation Achievable” Conservation
PotentialPotential
0
1,000
2,000
3,000
4,000
5,000
6,000
7,000
8,000
< 0 <20 <40 <60 <80 <100 <120 <140 <160 <180 <200
Real Levelized Cost (2006$/MWH)
Ach
ieva
ble
Pote
nti
al by
2030
(aM
W)
Dispatchable Lost-Opportunity
55thth Plan Estimate Plan Estimate of Achievableof Achievable
PotentialPotential55thth Plan Plan TargetTarget
Draft 6Draft 6thth Plan Avoided Cost Range Plan Avoided Cost Range

slide 39
Northwest Power and ConservationCouncil
Slide 39

slide 40
Northwest Power and ConservationCouncil
Slide 40
Spring 2009Spring 2009
Your Comments and Questions WelcomedYour Comments and Questions Welcomed
1

slide 41
Northwest Power and ConservationCouncil
Slide 41
Where Is It? Where Is It? Technically Achievable by SectorTechnically Achievable by Sector
0
1,000
2,000
3,000
4,000
5,000
6,000
7,000
8,000
<0 10 20 30 40 50 60 70 80 90 10
011
012
013
014
015
016
017
018
019
020
0
>20
0
Real Levelized Cost (2006$/MWh)
Tec
hnic
allly
Ach
ieva
ble
Pote
nti
al (
MW
a) DEI_Non-LOAgr_Non-LOInd_Non-LOCom_Non-LORes_Non-LOCom_LORes_LO

Residential Water Heating, Lighting, Appliance Residential Water Heating, Lighting, Appliance & Consumer Electronics Technically & Consumer Electronics Technically
Achievable PotentialAchievable Potential
0
500
1000
1500
2000
2500
< 0<10
<20
<30
<40
<50
<60
<70
<80
<90
<10
0
<11
0
<12
0
<13
0
<14
0
<15
0
<16
0
<17
0
<18
0
<19
0
<20
0
>20
0
Real Levelized Cost (2006$)
Tec
hnic
ally
Ach
ieva
ble
Pote
nti
al b
y 2030 (
aMW
)
Solar PV
Solar DHW
Microwaves & Ovens
Clothes Dryer
Dishwasher
Freezer
Refrigerator
Waste Water HeatRecovery Efficient DHW Tanks
Clothes Washer
Showerheads
Lighting
HPWH
Consumer Electronics

slide 43
Northwest Power and ConservationCouncil
Slide 43
Residential Space Conditioning Residential Space Conditioning Technically Achievable PotentialTechnically Achievable Potential
0
200
400
600
800
1000
1200
1400
1600
< 0<10<20<30<40<50<60<70<80<90
<100
<110
<120
<130
<140
<150
<160
<170
<180
<190
<200
>200
Real Levelized Cost (2006$)
Tech
nic
ally
Ach
ievable
Pote
ntial by 2
030
(aM
W)
HVAC Supplement(DHP) HVAC HP Upgrade
HVAC HP Conversion
New MF - ShellUpgradeNew MF - ShellUpgradeNew SF - ShellUpgrade ResWX MH
ResWX MF
ResWX SF

Achievable Savings Potential - Retrofit - Cumulative by 2030
0
50
100
150
200
250
300
350
400
450
500
<0 20 40 60 80 100
120
140
160
180
200
Cost: TRC Net Levelized Cost in $2006 ($/MWh)
MW
a
DCV Parking Garage-Retro
DCV Restaurant Hood-Retro
Municipal Water Supply-Retro
Municipal Sewage Treatment-Retro
Signage-Retro
LED Traffic Lights-Retro
Parking Lighting-Retro
Street and Roadway Lighitng-Retro
Exterior Building Lighting-Retro
Computer Servers and IT-Retro
Network PC Power Management-Retro
Pre-Rinse Spray Wash-Retro
Plug Load Sensor-Retro
Lodging Measures-Retro
Grocery Refrigeration Bundle-Retro
Duct Sealing and Repair-Retro
Efficienct fans, pumps and drives-Retro
Demand Control Ventilation-Retro
Controls Commission Complex HVAC-Retro
Package Roof Top Optimization and Repair-Retro
Windows-Retro
Lighting Controls Interior-Retro
Lighting Power Density-Retro
Commercial Sector Technically Commercial Sector Technically Achievable Potential - RetrofitsAchievable Potential - Retrofits

Achievable Savings Potential - Lost-Opportunity - Cumulative by 2030
0
100
200
300
400
500
600
700
800
900
1000
Cost: TRC Net Levelized Cost in $2006 ($/MWh)
MW
a
Signage-NR
Parking Lighting-NR
Parking Lighting-New
Street and Roadw ay Lighitng-NR
Street and Roadw ay Lighitng-New
Exterior Building Lighting-NR
Exterior Building Lighting-New
Office Equipment-New
Cooking Equipment-New
Packaged Refrigeration Equipment-New
Exit Signs-NR
Premium Fume Hood-New
Lodging Measures-NR
Lodging Measures-New
Roof Insulation-NR
Efficienct fans, pumps and drives-NR
Efficienct fans, pumps and drives-New
Demand Control Ventilation-NR
Demand Control Ventilation-New
Low Pressure Distribution Complex HVAC-New
Evaporative Assist Cooling-NR
Evaporative Assist Cooling-New
Controls Commission Complex HVAC-New
Variable Speed Chiller-NR
Variable Speed Chiller-New
Package Roof Top Optimization and Repair-NR
Package Roof Top Optimization and Repair-New
Window s-NR
Window s-New
Premium HVAC Equipment-NR
Premium HVAC Equipment-New
ECM Motors on Variable Air Volume Boxes-NR
ECM Motors on Variable Air Volume Boxes-New
Lighting Controls Interior-NR
Lighting Controls Interior-New
Daylighting w ith Window s-NR
Daylighting w ith Window s-New
Daylighting w ith Skylights-New
Lighting Pow er Density-NR
Lighting Pow er Density-New
Integrated Building Design-New
Commercial Sector Technically AchievableCommercial Sector Technically Achievable Potential – Lost OpportunityPotential – Lost Opportunity
slide 46
Northwest Power and ConservationCouncil
Slide 46
Industrial Energy Savings PotentialIndustrial Energy Savings Potential
High-Efficiency EquipmentHigh-Efficiency Equipment– Cross-industry systems (pumping or lighting)Cross-industry systems (pumping or lighting)– Industry-specific (refiner plates in mechanical Industry-specific (refiner plates in mechanical
pulping)pulping)
Systems ImprovementSystems Improvement– Optimization, demand management, sizingOptimization, demand management, sizing
PeoplePeople– Operational & Business PracticesOperational & Business Practices

slide 47
Northwest Power and ConservationCouncil
Slide 47
Industrial Sector Technically Industrial Sector Technically Achievable PotentialAchievable Potential
0
100
200
300
400
500
600
700
800
900
< 0 <20 <40 <60 <80 <100 <120 <140 <160 <180 <200
Real Levelized Cost (2006$/MWh)
Te
chn
ica
lly A
chie
vab
le P
ote
ntia
l (M
Wa
)

slide 48
Northwest Power and ConservationCouncil
Slide 48

slide 49
Northwest Power and ConservationCouncil
Slide 49
Utility Distribution System Technically Utility Distribution System Technically Achievable PotentialAchievable Potential
0
50
100
150
200
250
300
350
400
450
< 0 <20 <40 <60 <80 <100 <120 <140 <160 <180 <200
Real Levelized Cost (2006$/MWh)
Tec
hnic
ally
Ach
ieva
ble
Pot
entia
l (M
Wa)

slide 50
Northwest Power and ConservationCouncil
Slide 50
Utility Distribution System Utility Distribution System EfficiencyEfficiency
What’s CoveredWhat’s Covered
System OptimizationSystem Optimization
Line Drop CompensationLine Drop Compensation
End of Line Voltage FeedbackEnd of Line Voltage Feedback
Home Voltage RegulationHome Voltage Regulation

slide 51
Northwest Power and ConservationCouncil
Slide 51
Agriculture Sector Conservation Agriculture Sector Conservation PotentialPotential
0
20
40
60
80
100
120
< 0
<20
<40
<60
<80
<100
<120
<140
<160
<180
<200
Levelized Cost (2006$/MWh)
Te
chn
ica
lly A
chie
vab
le P
ote
ntia
l (
Ave
rag
e M
eg
aw
att
s)
Irrigation Water Management Irrigation Hardware Dairy

slide 52
Northwest Power and ConservationCouncil
Slide 52
Dairy Milk Production Dairy Milk Production Conservation PotentialConservation Potential
““On farm” dairy milk On farm” dairy milk production is the largest production is the largest single use of electricity in single use of electricity in agriculture sector after agriculture sector after irrigationirrigation
New Measure for 6New Measure for 6thth PlanPlan– Current conservation Current conservation
programs are targeting programs are targeting savings from dairies, but savings from dairies, but no regional estimate of no regional estimate of savings potentialsavings potential
Average dairy uses 800 – 1200 Average dairy uses 800 – 1200 kWh/cow-yrkWh/cow-yr
There are approximately There are approximately 885,000 milking cows in PNW885,000 milking cows in PNW

slide 53
Northwest Power and ConservationCouncil
Slide 53
Take This With YouTake This With You
Meeting Meeting ALLALL Regional Load Growth With Regional Load Growth With Conservation Conservation AND AND Renewable Resources Will Not Renewable Resources Will Not Meet WCI COMeet WCI CO22 Emissions Targets Emissions Targets
Technically Achievable Conservation Potential Could Technically Achievable Conservation Potential Could Reduce Projected 2030 Loads By Reduce Projected 2030 Loads By 4000 – 6000 MWa4000 – 6000 MWa– At the low end this would mean sustaining the current pace At the low end this would mean sustaining the current pace
of regional conservation developmentof regional conservation development
It Will Require A Much Larger (2x-3x) Investment In It Will Require A Much Larger (2x-3x) Investment In Cost-Effective Energy Efficiency and New Cost-Effective Energy Efficiency and New Technology To Reduce Our Carbon Footprint To Technology To Reduce Our Carbon Footprint To 1990 Levels1990 Levels