6.2m - northwest power & conservation council
TRANSCRIPT

CH 3 ASSESSMENT.DOC 3-1
3 Subbasin Assessment
3.1 Subbasin Overview
3.1.1 General DescriptionThe Willamette Subbasin occupies more than 11,000 square miles in northwest Oregon and ishome to 70 percent of Oregon’s population. Its main geographic features include Oregon’slargest river, the Willamette; the Coast Range, which borders the subbasin on the west; and theCascade Range on the east. The 4,000-square-mile Willamette Valley has some of the richestfarmland in the nation and produces about half of Oregon’s yearly farm sales.
3.1.1.1 LocationThe Willamette Subbasin runs north to south between the Cascade Mountains on the east and theCoast Range on the west. It is bounded to the south by the Calapooia Range of the CascadeMountains. The basin’s northern boundary is the mouth of the Willamette, at approximately Mile86 of the Columbia River. The basin lies within the Lower Columbia ecological province definedby the Northwest Power and Conservation Council. All or parts of 13 Oregon counties fallwithin the Willamette Basin (see Table 3-1).
Table 3-1: Oregon Counties with Acreage in the Willamette Basin
CountyTotal Area of theCounty (acres)
Acres within theWillamette Basin
Percentage of TotalCounty Area in theWillamette Basin
Percentage of theWillamette Basin in
the County
Benton 434,201 328,097 75.6% 4.5%
Clackamas 1,201,728 943,429 78.5% 12.8%
Columbia 423,101 83,774 19.8% 1.1%
Douglas 3,236,500 65,112 2% 0.9%
Lane 2,950,997 2,255,820 76.4% 30.7%
Lincoln 627,843 9,331 1.5% 0.1%
Linn 1,476,732 1,468,204 99.4% 20%
Marion 764,295 760,714 99.5% 10.4%
Multnomah 281,735 140,633 49.9% 1.9%
Polk 475,890 422,518 88.8% 5.8%
Tillamook 704,962 6146 .9% 0.1%
Washington 469,001 413,944 88.3% 5.6%
Yamhill 459,391 422,481 92.0% 5.8%
Source: Adapted from Pacific Northwest Ecosystem Research Consortium, 2002.

DRAFT WILLAMETTE SUBBASIN PLAN
3-2 CH 3 ASSESSMENT.DOC
3.1.1.2 SizeThe Willamette River Subbasin is approximately 180 miles long and 100 miles wide. With anarea of 11,478 square miles (7.3 million acres), the Willamette Basin occupies nearly 12 percentof the state of Oregon (see Figure 3-1) (U.S. Army Corps of Engineers, 2000; Pacific NorthwestEcosystem Research Consortium, 2002). The Willamette River has a mainstem channel length of185 miles. A tributary to the Columbia River, the Willamette is Oregon’s largest river whollycontained within state boundaries (see Figure 3-2). In addition, it is the nation’s 13th largest riverby volume, with more runoff per square mile of drainage than any other large river in thecoterminous United States (Kammerer, 1990).
Figure 3-1: The Willamette and Other Basins Within the State of Oregon

DRAFT WILLAMETTE SUBBASIN PLAN
CH 3 ASSESSMENT.DOC 3-3
Figure 3-2: The Willamette BasinSource: Uhrich and Wentz, 1999:
3.1.1.3 GeologyThe Willamette Basin lies within the Cascadia geologic province, which extends from BritishColumbia to Northern California. The western boundary of the province is about 70 miles off thePacific Coast where the Juan de Fuca tectonic plate slides beneath the North America plate. Over

DRAFT WILLAMETTE SUBBASIN PLAN
3-4 CH 3 ASSESSMENT.DOC
millions of years, as the Juan de Fuca oceanic plate has collided with the western edge of theNorth American continent, the Coast Range has been lifted, forming the western boundary of thebasin. As the Juan de Fuca plate continued its slow northeastern migration, the once-shallowocean floor on the western edge of the Cascade Range also lifted, from south to north, drainingwhat has become the Willamette Valley. The eastern boundary of the Willamette Basin isdefined by the volcanic crest of the Cascade Range (Pacific Northwest Ecosystem ResearchConsortium, 2002; Atlas of Oregon, 2001; Thieman, 2000)
A variety of rock types are present in the Willamette Basin. The Coast Range consistspredominantly of marine sedimentary rock such as sandstone, siltstone, and mudstone. Theslopes and foothills of the Coast Range make up about 20 percent of the basin area. The CascadeRange consists of numerous lava flows and volcanic sediments. The slopes and foothills of theCascade Range account for more than 50 percent of the basin area (Oregon Department ofEnvironmental Quality, 2004; Lee and Risley, 2002)
During the early stages of the basin’s development, basalt flows accumulated in the northerntwo-thirds of the basin. Tectonic forces folded and faulted these flows, creating uplands thatseparate the valley into four smaller subbasins. Alluvial sediments such as clay, silt, sand, andgravel have accumulated in the subbasins. Recent alluvium (less than 10,000 years old) occursalong the Willamette River and tributaries to depths of less than 60 feet. Older alluvial depositscan be up to 1,500 feet deep. A silt and clay layer, called the Willamette Silt, is on top of theolder alluvium in the basin’s northern part and can be 120 feet thick, but it thins to zero in thesouthern end of the Willamette Valley near Eugene (Oregon Department of EnvironmentalQuality, 2004).
The Willamette Valley, generally considered the part of the basin below 500 feet, representsabout 30 percent of the basin area. Much of the valley up to an elevation of about 400 feet iscovered by sandy to silty terrace deposits that border existing rivers and form alluvial fans nearriver mouths. These deposits came from the surrounding mountains and consist of interminglinglayers of clay, silt, sand, and gravel. At the surface, the valley floor is covered mostly by fine-grained deposits (silt to fine sand), except in the Portland area, Canby, and the floodplain ofsome of the major streams where coarse-grained deposits predominate. Coarse-grained materialunderlies the fine-grained deposits. In some areas, such as in buried alluvial fans along the eastside of the valley, these deposits are hundreds of feet thick. With the exception of theWillamette, Santiam, and McKenzie rivers, most rivers flow over the fine-grained material. (Leeand Risley, 2002)
Volcanic activity has played a major role in shaping the Willamette Valley. The Cascade Rangeis part of what is known as “the ring of fire,” a series of volcanoes that encircles the PacificOcean. More than 1,000 volcanoes exist between Mount Rainier to the north and Lassen Peak tothe south in Northern California (Pacific Northwest Ecosystem Research Consortium, 2002). TheCascade Range consists of belts of older and newer rock. The Western Cascades, which beganerupting about 40 million years ago, are lower and more eroded. The High Cascades to the east,which erupted around 10 million years ago, include higher and less eroded areas topped byvolcanic peaks (Bishop, 2003).
The High Cascades represent a huge hydrologic sponge that stores many decades worth of water.This water rises from springs along the Cascade crest, fed by very large regional aquifers flowingthrough the young volcanic rock. Even during drought years, creeks and rivers fed by this

DRAFT WILLAMETTE SUBBASIN PLAN
CH 3 ASSESSMENT.DOC 3-5
groundwater flow at nearly constant levels. Prior to construction of dams on the Willamettetributaries, 60 percent of the late summer streamflow of the Willamette in Portland came fromthe McKenzie drainage, a High Cascade watershed (Grant, 2002). Much of the basin’s biologicalsignature, including its salmon runs, was historically tied to this clear, cold discharge.
The Willamette Valley also has been greatly influenced by volcanic activity originating outsideof the basin boundaries. The northern two-thirds of the valley is underlain by Columbia RiverBasalt that flooded over southern Washington and northern Oregon around 15 million years ago(Pacific Northwest Ecosystem Research Consortium, 1998). The flows originated 200 miles tothe east and arrived as fluid lavas, pouring through the ancestral Columbia River valley (Bishop,2003). One of these flows solidified at the northern edge of the valley, creating the 40-foot-tallWillamette Falls—a significant geographic feature that has influenced fish distribution andfloodplain characteristics in the upper basin (Thieman, 2000). The flows also formed Portland’sWest Hills and are the bedrock of the Salem and Eola hills (Bishop, 2003).
One of the most important aspects of Willamette geology is its history of repeated ice ageflooding. There may have been upwards of 100 massive floods caused by the repeated formationand bursting of ice dams near Missoula, Montana. Starting approximately 19,000 years ago andending about 6,000 years later, glaciers periodically dammed the Clark Fork River canyon,forming a 3,000-square-mile lake. When the ice dams gave way, 500 cubic miles of water blewout at about 17 million gallons per second. The resulting floods swept across Idaho, throughsoutheast Washington, and down the Columbia and rushed into the Willamette Valley, creating aWillamette lake 100 miles long, 60 miles wide, and 300 feet deep. More than 300 feet ofsediment now coats the Willamette Valley floor (Bishop, 2003).
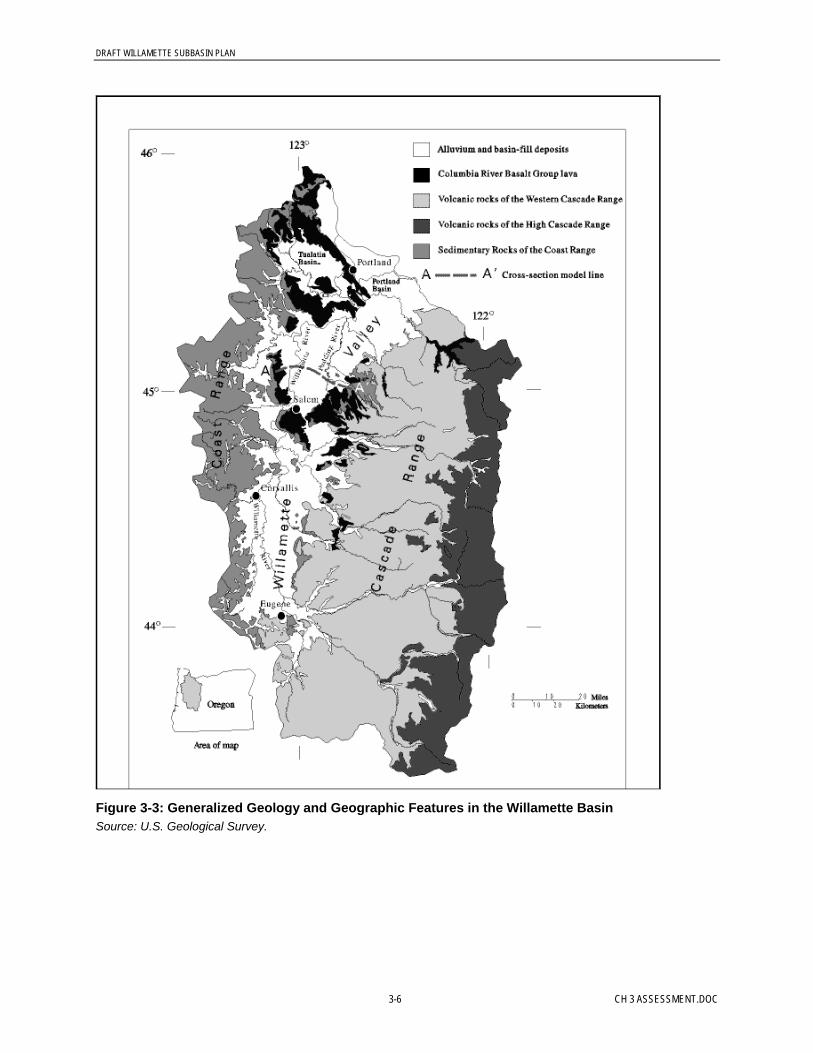
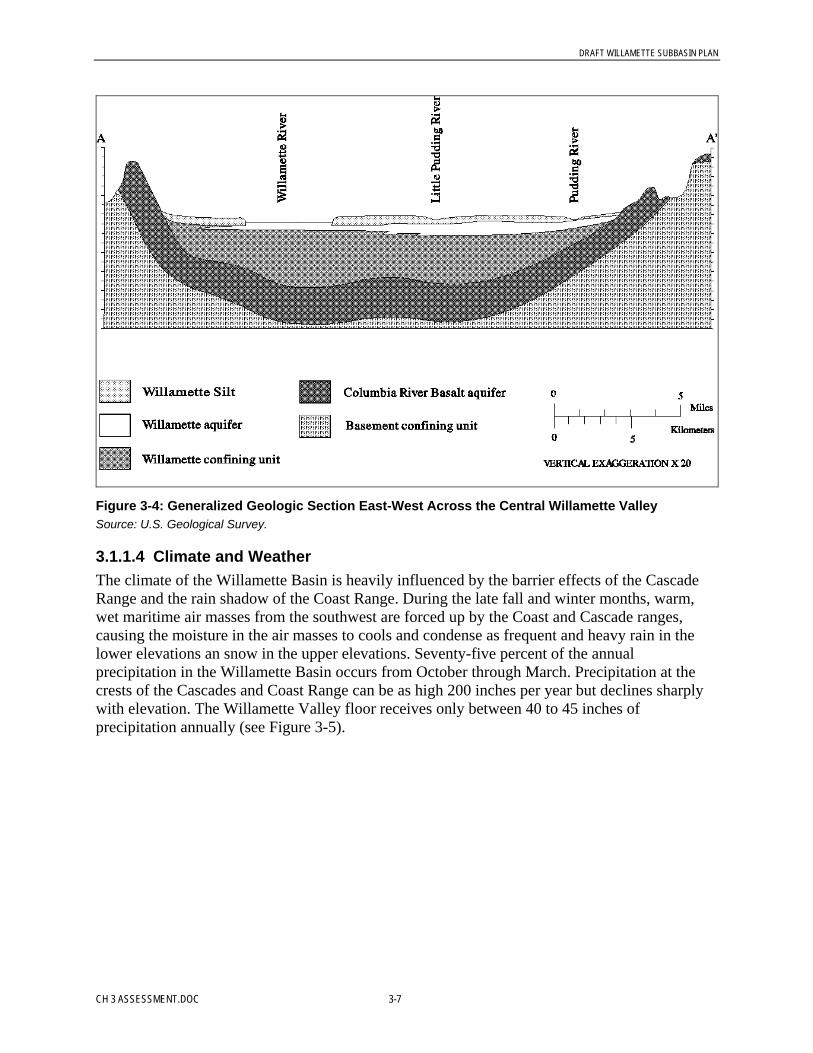
The generalized geography of the basin and a geologic cross section of the Willamette Valley areshown in Figures 3-3 and 3-4, respectively.
DRAFT WILLAMETTE SUBBASIN PLAN
3-6 CH 3 ASSESSMENT.DOC
Figure 3-3: Generalized Geology and Geographic Features in the Willamette BasinSource: U.S. Geological Survey.
DRAFT WILLAMETTE SUBBASIN PLAN
CH 3 ASSESSMENT.DOC 3-7
Figure 3-4: Generalized Geologic Section East-West Across the Central Willamette ValleySource: U.S. Geological Survey.
3.1.1.4 Climate and WeatherThe climate of the Willamette Basin is heavily influenced by the barrier effects of the CascadeRange and the rain shadow of the Coast Range. During the late fall and winter months, warm,wet maritime air masses from the southwest are forced up by the Coast and Cascade ranges,causing the moisture in the air masses to cools and condense as frequent and heavy rain in thelower elevations an snow in the upper elevations. Seventy-five percent of the annualprecipitation in the Willamette Basin occurs from October through March. Precipitation at thecrests of the Cascades and Coast Range can be as high 200 inches per year but declines sharplywith elevation. The Willamette Valley floor receives only between 40 to 45 inches ofprecipitation annually (see Figure 3-5).

DRAFT WILLAMETTE SUBBASIN PLAN
3-8 CH 3 ASSESSMENT.DOC
Figure 3-5: Precipitation in the Willamette BasinSource: Uhrich and Wentz, 1999.
During the summer months, the Coast Range blocks maritime air from the Willamette basin,creating warmer, drier conditions. Only five percent of the total annual precipitation in theWillamette Basin occurs in the summer months from July through September (Uhrich andWentz, 1999; Pacific Northwest Ecosystem Research Consortium, 2002) (Wentz, 1998; Uhrichand Wentz, 1999). Most precipitation falls as snow above 5,000 feet in the Cascades (Uhrich andWentz, 1998). Mean monthly temperatures in the valley range from about 40 degrees Fahrenheitduring January to just above 60 degrees F during August.

DRAFT WILLAMETTE SUBBASIN PLAN
CH 3 ASSESSMENT.DOC 3-9
3.1.1.5 Land Cover and HabitatDue in large part to the influence of the Coast Range and Cascades, 60 percent of the subbasin isforested. Agricultural land makes up 27 percent of the basin and is located mainly in theWillamette Valley. About a third of the agricultural land is irrigated (Wentz et al., 1998). Urbanareas account for 5 percent of the basin (Oregon Watershed Enhancement Board, 2003; seeFigure 3-6).
Figure 3-6: Land Cover in the Willamette BasinSource: Oregon Watershed Enhancement Board, 2003.
A variety of systems are used to describe the Willamette Basin’s habitats. The first in commonuse is that of ecoregions. In turn, each ecoregion hosts different kinds of fish and wildlife habitat.These are described generally, below. More detailed habitat information is included in Section3.1.4.7.
Ecoregions. Ecoregions are ecologically distinct areas that result from the interplay of differentenvironmental factors, ecosystems, physical and landscape features, and human interactions(Pacific Northwest Ecosystem Research Consortium, 2002). Ecoregions have unique“fingerprints” of landform, geology, soil, climate, potential vegetation, and land use cover. Theycross over watershed boundaries and are made up of different habitat types.
The Willamette Basin has five ecoregions: Coastal Mountains, Willamette Valley Plains,Willamette Valley Foothills, Western Cascades, and High Cascades (Clarke and others, 1991).These are described in Table 3-2 and shown in Figure 3-7.

DRAFT WILLAMETTE SUBBASIN PLAN
3-10 CH 3 ASSESSMENT.DOC
Table 3-2: Descriptions of Ecoregions in the Willamette Basin
EcoregionPercent of
Basin Description
Coastal Mountains 8 Generally 1,500 to 2,000 feet in elevation. Extensively dissected bystreams, with a typical density of 2 to 3 miles of perennial streams persquare mile (Omernick and Gallant, 1986). Very wet and dominated byproductive and intensively logged Douglas fir plantations (PacificNorthwest Ecosystem Research Consortium, 2002).
Willamette Valley Plains 22 Nearly level to low sloping floodplains, ranging from 100 to 300 feet inelevation. Once hosted prairies and savannas of Oregon white oak,Oregon ash, and Douglas fir. Agriculture mixed with urban and ruraldevelopment now occupies this region.
Willamette ValleyFoothills
20 The foothills border the plains and have steeper slopes; elevationsaverage 1,000 feet in the north to more than 2,000 feet in the centraland southern basin. The foothills are characterized by Oregon whiteoak and madrone on dry sites and Douglas fir and western red cedar onwet. Current land use supports forestlands, orchards, vineyards, andChristmas tree farms, as well as rural residential development.
Western Cascades 44 Generally 5,000 to 6,000 feet in elevation and stream densities of 1.5 to2 miles of perennial streams per square mile (Omernick and Gallant,1986). Dominant vegetation types include conifer forests of Douglas fir,western hemlock, and western red cedar, interspersed with alder andvine maples.
High Cascades 6 High plateaus and glaciated, volcanic peaks that rise above subalpinemeadows. Elevations range from 5,600 to 10,000 feet. Glaciationoccurs on the highest volcanoes. In lower elevations, the ecoregion isextensively forested with mountain hemlock and Pacific silver fir. Athigher elevations, cold winters and short growing seasons favorherbaceous and shrubby subalpine meadow vegetation and scatteredpatches of mountain hemlock, subalpine fir, and whitebark pine.

DRAFT WILLAMETTE SUBBASIN PLAN
CH 3 ASSESSMENT.DOC 3-11
Figure 3-7: Locations of Ecoregions in the Willamette BasinSource: Uhrich and Wentz, 1997.
Fish and Wildlife Habitat. Biologists estimate that there are 18 species of native amphibians, 15reptiles, 154 birds, 69 mammals, and 31 native fish currently breeding in the basin (PacificNorthwest Ecosystem Research Consortium, 2002). These species make their homes in widelydiverse areas across the Willamette landscape. There are many ways scientists and landmanagers catalog these habitats.
For example, the Willamette Restoration Strategy (Willamette Restoration Initiative, 2001) usedsix types based on historical habitats in the Willamette. The Interactive Biodiversity InformationSystem1 (IBIS, 2004) describes 10 historical habitat types and 14 current habitat types associatedwith the Willamette Basin. Adamus and others have defined 31 distinct habitat types (Adamus et.al., 2001). The Oregon Natural Heritage Center and The Nature Conservancy identified 96subcategories of habitat types within nine structural classes (July 2000). The Willamette
1 “The IBIS is an informational resource developed by the Northwest Habitat Institute (NHI) to promote the conservation ofNorthwest fish, wildlife, and their habitats through education and the distribution of timely, peer-reviewed scientific data … IBIScontains extensive information about Pacific Northwest fish, wildlife, and their habitats, but more noteworthy, IBIS attempts to revealand analyze the relationships among these species and their habitats. … IBIS [is] not only a fish, wildlife, and habitat informationdistribution system but also as a peer-review system for species data” (Interactive Biodiversity Information System, 2004).
DRAFT WILLAMETTE SUBBASIN PLAN
3-12 CH 3 ASSESSMENT.DOC
Subbasin Summary (Willamette Restoration Initiative, 2001) also describes nine general habitattypes but categorizes them differently (NPCC, 2001).
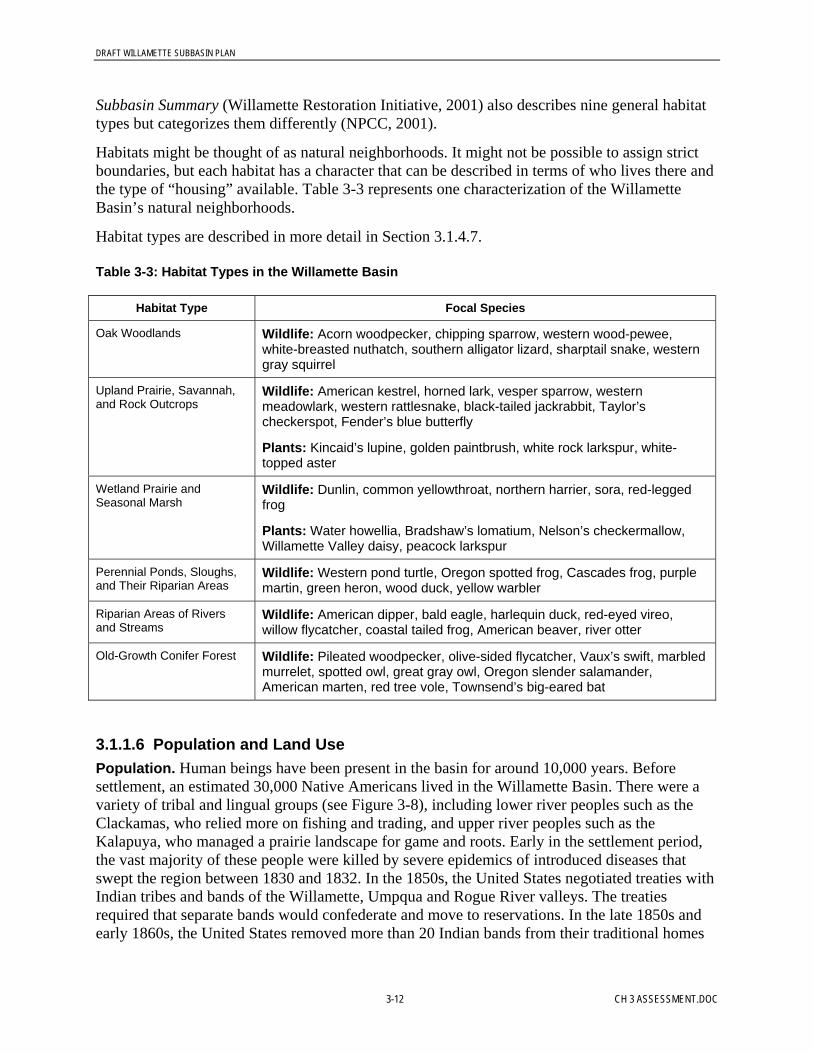
Habitats might be thought of as natural neighborhoods. It might not be possible to assign strictboundaries, but each habitat has a character that can be described in terms of who lives there andthe type of “housing” available. Table 3-3 represents one characterization of the WillametteBasin’s natural neighborhoods.
Habitat types are described in more detail in Section 3.1.4.7.
Table 3-3: Habitat Types in the Willamette Basin
Habitat Type Focal Species
Oak Woodlands Wildlife: Acorn woodpecker, chipping sparrow, western wood-pewee,white-breasted nuthatch, southern alligator lizard, sharptail snake, westerngray squirrel
Upland Prairie, Savannah,and Rock Outcrops
Wildlife: American kestrel, horned lark, vesper sparrow, westernmeadowlark, western rattlesnake, black-tailed jackrabbit, Taylor’scheckerspot, Fender’s blue butterfly
Plants: Kincaid’s lupine, golden paintbrush, white rock larkspur, white-topped aster
Wetland Prairie andSeasonal Marsh
Wildlife: Dunlin, common yellowthroat, northern harrier, sora, red-leggedfrog
Plants: Water howellia, Bradshaw’s lomatium, Nelson’s checkermallow,Willamette Valley daisy, peacock larkspur
Perennial Ponds, Sloughs,and Their Riparian Areas
Wildlife: Western pond turtle, Oregon spotted frog, Cascades frog, purplemartin, green heron, wood duck, yellow warbler
Riparian Areas of Riversand Streams
Wildlife: American dipper, bald eagle, harlequin duck, red-eyed vireo,willow flycatcher, coastal tailed frog, American beaver, river otter
Old-Growth Conifer Forest Wildlife: Pileated woodpecker, olive-sided flycatcher, Vaux’s swift, marbledmurrelet, spotted owl, great gray owl, Oregon slender salamander,American marten, red tree vole, Townsend’s big-eared bat
3.1.1.6 Population and Land UsePopulation. Human beings have been present in the basin for around 10,000 years. Beforesettlement, an estimated 30,000 Native Americans lived in the Willamette Basin. There were avariety of tribal and lingual groups (see Figure 3-8), including lower river peoples such as theClackamas, who relied more on fishing and trading, and upper river peoples such as theKalapuya, who managed a prairie landscape for game and roots. Early in the settlement period,the vast majority of these people were killed by severe epidemics of introduced diseases thatswept the region between 1830 and 1832. In the 1850s, the United States negotiated treaties withIndian tribes and bands of the Willamette, Umpqua and Rogue River valleys. The treatiesrequired that separate bands would confederate and move to reservations. In the late 1850s andearly 1860s, the United States removed more than 20 Indian bands from their traditional homes

DRAFT WILLAMETTE SUBBASIN PLAN
CH 3 ASSESSMENT.DOC 3-13
and relocated them on the Grand Ronde Indian Reservation, located on the headwaters of theYamhill River in the Coast Range. In 1954, federal legislation severed the trust relationshipbetween the federal government and the tribes of western Oregon, terminating the Grand RondeReservation. However, in 1983, Congress restored the trust relationship between the federalgovernment and the Confederated Tribes of the Grand Ronde Community (Confederated Tribesof the Grande Ronde, 2004a).
Figure 3-8: Native American Languages and Tribes, 1840-1850Source: Confederated Tribes of the Grande Ronde, 2004b.
The first large wave of settlers arrived in the 1840s. By 1848 Oregon was a territory of theUnited States, and it became a state in 1859. The first census, which was taken in 1850, showed apopulation of just more than 13,000, nearly all in the Willamette Valley. By 1880, about 105,000people lived in the Willamette Valley (Pacific Northwest Ecosystem Research Consortium,2002).
Today, about 2.5 million people, or 70 percent of Oregon’s population, live in the WillametteBasin. The Portland metropolitan area has 1.2 million people and is the state’s largest urban area.
DRAFT WILLAMETTE SUBBASIN PLAN
3-14 CH 3 ASSESSMENT.DOC
The three largest population centers of Portland, Salem, and Eugene-Springfield are situatedalong the banks of the Willamette River and the Interstate 5 corridor. Population growth in thebasin is expected to double to nearly 4.0 million by 2050 (Willamette Restoration Initiative,2001). In the Portland metropolitan region, a 37 percent increase is expected between 2000 and2020 (Metro, 2003).
From 1990 to 2000, the basin grew by approximately 418,000 people, with about 68 percent ofthe increase due to in-migration; in the Portland metro region, about two-thirds of populationgrowth came from in-migration. Growth during this period is attributed to a strong economy andattractive quality of life (Metro, 2003). Less than half of the current population was born in theWillamette Valley, and roughly one out of seven has moved to the valley in the last 5 years(Willamette Valley Livability Forum, 1999). Currently, about 80 percent of the basin’spopulation lives in areas with 1,000 or more people per square mile (Pacific NorthwestEcosystem Research Consortium, 2002).
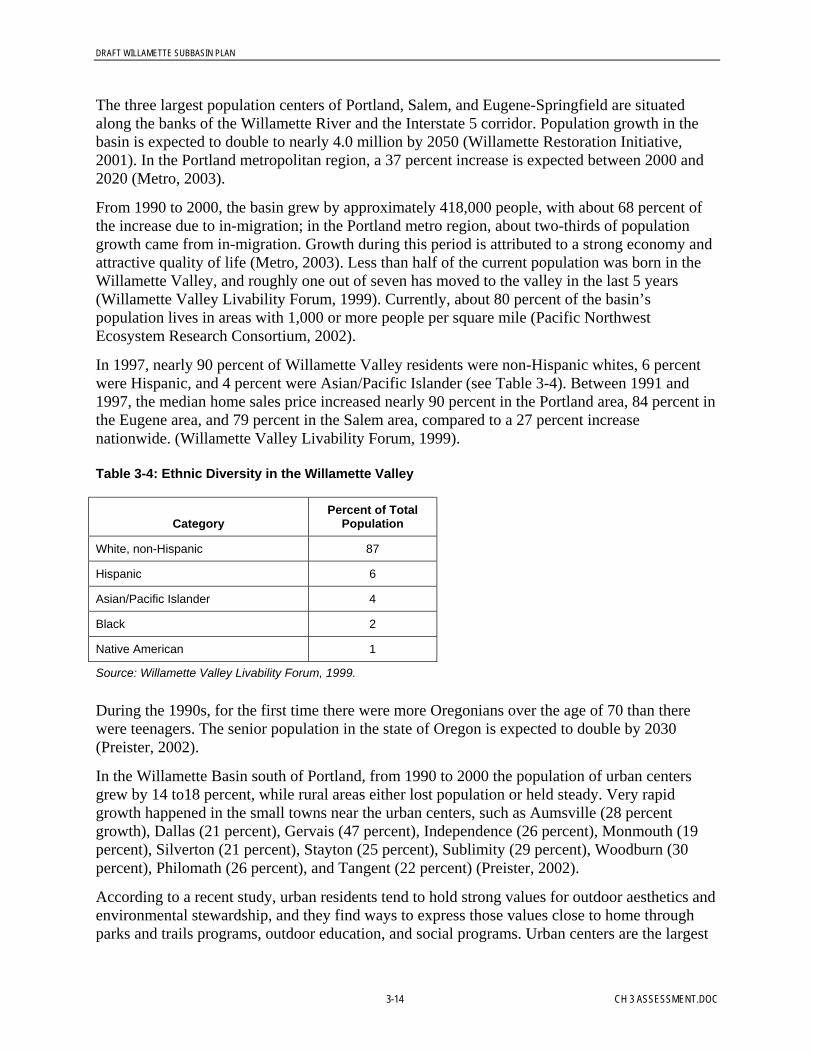
In 1997, nearly 90 percent of Willamette Valley residents were non-Hispanic whites, 6 percentwere Hispanic, and 4 percent were Asian/Pacific Islander (see Table 3-4). Between 1991 and1997, the median home sales price increased nearly 90 percent in the Portland area, 84 percent inthe Eugene area, and 79 percent in the Salem area, compared to a 27 percent increasenationwide. (Willamette Valley Livability Forum, 1999).
Table 3-4: Ethnic Diversity in the Willamette Valley
CategoryPercent of Total
Population
White, non-Hispanic 87
Hispanic 6
Asian/Pacific Islander 4
Black 2
Native American 1
Source: Willamette Valley Livability Forum, 1999.
During the 1990s, for the first time there were more Oregonians over the age of 70 than therewere teenagers. The senior population in the state of Oregon is expected to double by 2030(Preister, 2002).
In the Willamette Basin south of Portland, from 1990 to 2000 the population of urban centersgrew by 14 to18 percent, while rural areas either lost population or held steady. Very rapidgrowth happened in the small towns near the urban centers, such as Aumsville (28 percentgrowth), Dallas (21 percent), Gervais (47 percent), Independence (26 percent), Monmouth (19percent), Silverton (21 percent), Stayton (25 percent), Sublimity (29 percent), Woodburn (30percent), Philomath (26 percent), and Tangent (22 percent) (Preister, 2002).
According to a recent study, urban residents tend to hold strong values for outdoor aesthetics andenvironmental stewardship, and they find ways to express those values close to home throughparks and trails programs, outdoor education, and social programs. Urban centers are the largest
DRAFT WILLAMETTE SUBBASIN PLAN
CH 3 ASSESSMENT.DOC 3-15
source of recreational impacts on public lands and reveal a diverse orientation to public lands.South of Portland, the Willamette River forms an important boundary, with people living west ofthe river relating more to the coast and people living east of the river oriented more to theCascades and central Oregon. Primary users of public lands are individuals who are notparticularly organized (Preister, 2002).
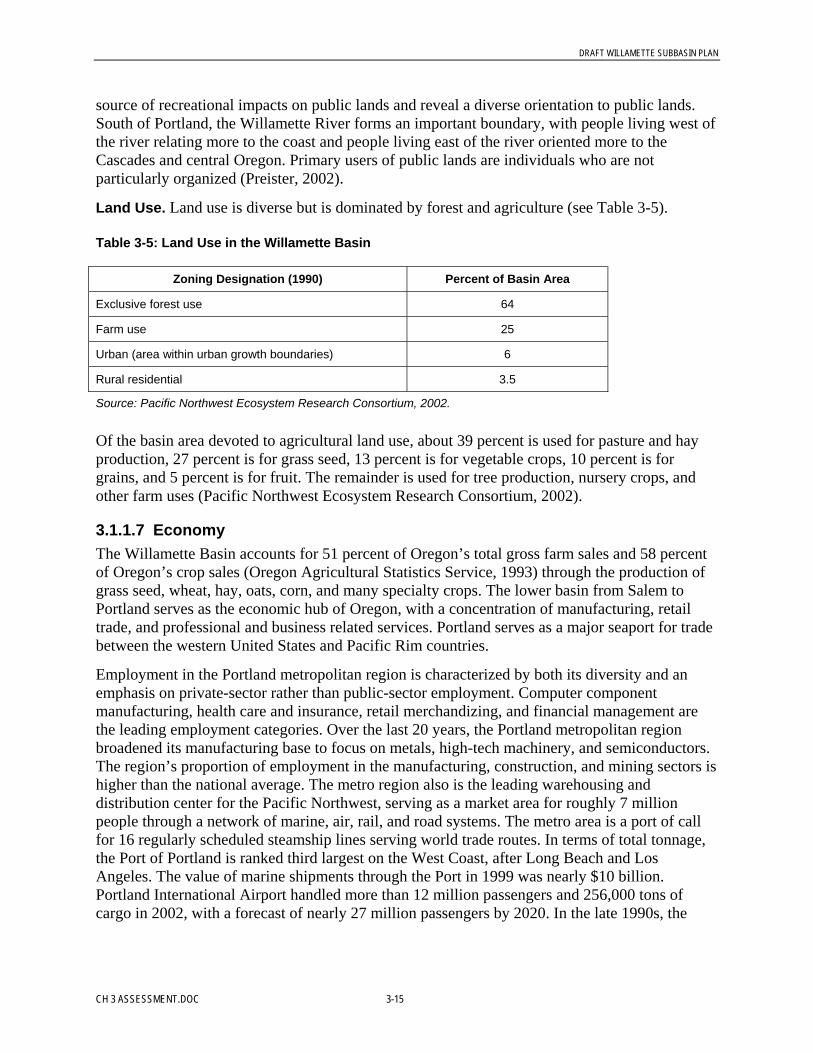
Land Use. Land use is diverse but is dominated by forest and agriculture (see Table 3-5).
Table 3-5: Land Use in the Willamette Basin
Zoning Designation (1990) Percent of Basin Area
Exclusive forest use 64
Farm use 25
Urban (area within urban growth boundaries) 6
Rural residential 3.5
Source: Pacific Northwest Ecosystem Research Consortium, 2002.
Of the basin area devoted to agricultural land use, about 39 percent is used for pasture and hayproduction, 27 percent is for grass seed, 13 percent is for vegetable crops, 10 percent is forgrains, and 5 percent is for fruit. The remainder is used for tree production, nursery crops, andother farm uses (Pacific Northwest Ecosystem Research Consortium, 2002).
3.1.1.7 EconomyThe Willamette Basin accounts for 51 percent of Oregon’s total gross farm sales and 58 percentof Oregon’s crop sales (Oregon Agricultural Statistics Service, 1993) through the production ofgrass seed, wheat, hay, oats, corn, and many specialty crops. The lower basin from Salem toPortland serves as the economic hub of Oregon, with a concentration of manufacturing, retailtrade, and professional and business related services. Portland serves as a major seaport for tradebetween the western United States and Pacific Rim countries.
Employment in the Portland metropolitan region is characterized by both its diversity and anemphasis on private-sector rather than public-sector employment. Computer componentmanufacturing, health care and insurance, retail merchandizing, and financial management arethe leading employment categories. Over the last 20 years, the Portland metropolitan regionbroadened its manufacturing base to focus on metals, high-tech machinery, and semiconductors.The region’s proportion of employment in the manufacturing, construction, and mining sectors ishigher than the national average. The metro region also is the leading warehousing anddistribution center for the Pacific Northwest, serving as a market area for roughly 7 millionpeople through a network of marine, air, rail, and road systems. The metro area is a port of callfor 16 regularly scheduled steamship lines serving world trade routes. In terms of total tonnage,the Port of Portland is ranked third largest on the West Coast, after Long Beach and LosAngeles. The value of marine shipments through the Port in 1999 was nearly $10 billion.Portland International Airport handled more than 12 million passengers and 256,000 tons ofcargo in 2002, with a forecast of nearly 27 million passengers by 2020. In the late 1990s, the
DRAFT WILLAMETTE SUBBASIN PLAN
3-16 CH 3 ASSESSMENT.DOC
region also underwent a transformation in its agricultural sector, with nursery and seed growersbecoming the top-grossing sales category for the entire state (Metro, 2003).
The major employers in the Willamette Basin south of the Portland metro area are medical carefacilities, forest products manufacturing, high technology manufacturing, recreational vehiclemanufacturing, higher and secondary education, government, and trades and services (Preister,2002) .
A change that has recently accelerated is the rise of the “commuting economy.” Particularly withthe decrease in timber-related activity in rural economies, commuting patterns have changedfrom going up to the mountains for work to going down to the larger communities. While thishas increased a number of employment and educational opportunities, it also has resulted in“leakage” of workers, local jobs, community structure, and leaders from smaller communities(Preister, 2002). Nearly 250,000 people, or 25 percent of Willamette Basin workers, traveloutside the county they reside in to go to work (Pacific Northwest Ecosystem ResearchConsortium, 2002).
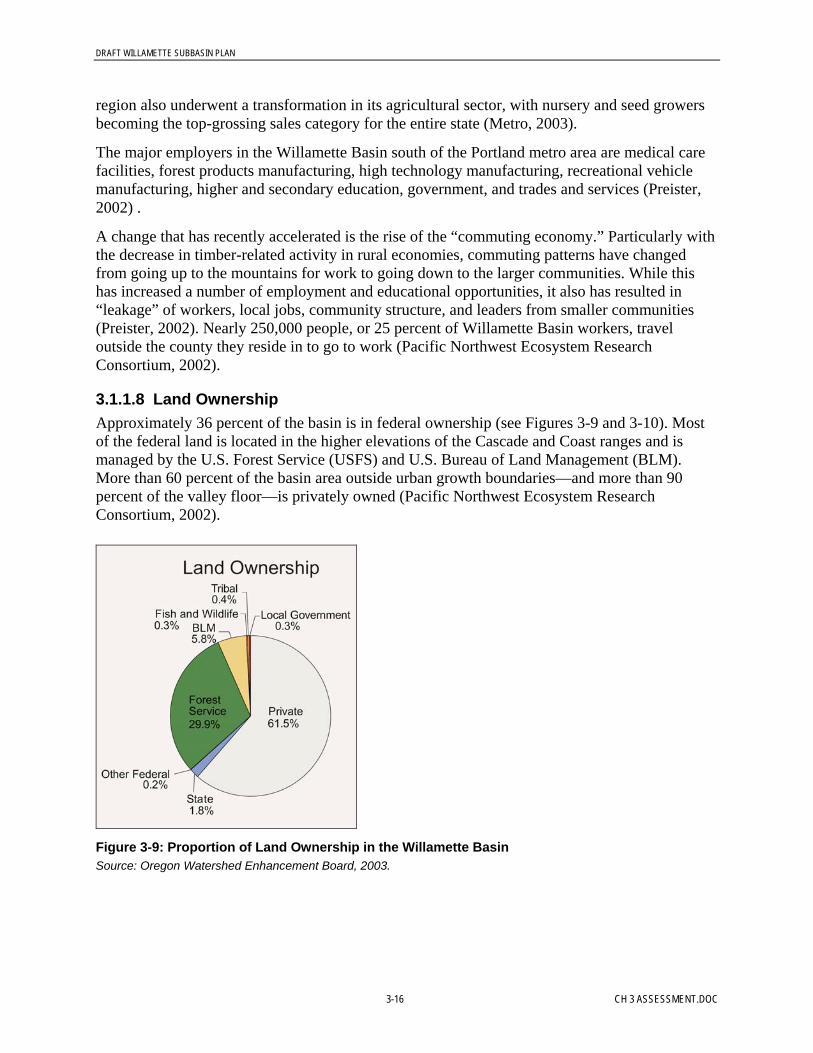
3.1.1.8 Land OwnershipApproximately 36 percent of the basin is in federal ownership (see Figures 3-9 and 3-10). Mostof the federal land is located in the higher elevations of the Cascade and Coast ranges and ismanaged by the U.S. Forest Service (USFS) and U.S. Bureau of Land Management (BLM).More than 60 percent of the basin area outside urban growth boundaries—and more than 90percent of the valley floor—is privately owned (Pacific Northwest Ecosystem ResearchConsortium, 2002).
Figure 3-9: Proportion of Land Ownership in the Willamette BasinSource: Oregon Watershed Enhancement Board, 2003.

DRAFT WILLAMETTE SUBBASIN PLAN
CH 3 ASSESSMENT.DOC 3-17
Figure 3-10: Land Ownership in the Willamette SubbasinSource: Northwest Power and Conservation Council, 1999.

DRAFT WILLAMETTE SUBBASIN PLAN
3-18 CH 3 ASSESSMENT.DOC
3.1.1.9 Human Disturbances to the Aquatic and Terrestrial EnvironmentsHuman disturbance has played a role in the Willamette Valley for the entire history of itshabitation—more than 10,000 years. Native Americans burned the valley to produce food andfiber. Tree ring studies suggest that frequent fires took place at least from 1647 to 1848. Burninggrasslands in late summer suppressed invading shrubs and trees and kept ecological conditionsfavorable for camas and tarweed, which were dietary staples (Pacific Northwest EcosystemResearch Consortium, 2002).
The extent and pace of human disturbance increased with Euro-American settlement in the mid-1800s. Intensive trapping essentially eradicated beaver populations by the early 1830s,dramatically changing the basin’s hydrology, vegetation, fish, and wildlife. As settlers displaceda native population decimated by disease, grassland burning stopped and farming began. (PacificNorthwest Ecosystem Research Consortium 2002)
Habitat Conversion. The Pacific Northwest Ecosystem Research Consortium concluded in its2002 Willamette River Basin Planning Atlas that land and water uses over the past 150 yearshave dramatically changed the patterns and composition of natural vegetation. More than 60percent of the basin’s older conifer forests have been converted to other land cover types or landuses. In the lowlands, natural grasslands have almost entirely been eradicated, shrubland hasbeen cut in half, and hardwood forests have diminished by three-quarters (see Table 3-6). About75 percent of what formerly was wet and dry prairie, and about 60 percent of what was wetland,is now in agricultural production. Today, less than 3 percent of the original area of bottomlandprairie grasslands remain, with the rest having been converted to agricultural and urban uses. Thearea of riparian (also called bottomland) forests along the valley’s streams and rivers hasdiminished by 80 percent as a result of conversion to agriculture, logging, and human-causedchanges to stream systems (Pacific Northwest Ecosystem Research Consortium, 2002).
Table 3-6: Changes in Land Cover in the Willamette Basin
Vegetation TypesPercentage of Valley,
PresettlementPercentage of Valley,
circa 1990
Natural grasslands 22.9 0.7
Natural shrubland 14.6 9.8
Hardwood forest 22.5 6.5
Mixed forest 4.8 10.5
Conifer forest 23.3 13.8
Wetlands 9.8 0.6
Roads. One of the greatest manifestations of human disturbance has been the construction of thebasin’s extensive road network. As of 1990, less than 1.5 percent of the basin was more than amile from roads mapped by the Oregon Department of Transportation. On average, there arenearly 4 miles of road for every square mile of land in the basin. This road network is estimatedto have a combined length of more than 44,000 miles, a figure that rivals or exceeds someestimates of the stream network. Roads affect ecosystem functions by increasing the volume and

DRAFT WILLAMETTE SUBBASIN PLAN
CH 3 ASSESSMENT.DOC 3-19
rate of runoff, which in turn can increase sediment and pollutant loads and temperature. Roadsalso can fragment wildlife habitat, disrupt or cut off fish migration, and expand the dispersal ofinvasive plant species (Pacific Northwest Ecosystem Research Consortium, 2002).
Channel Structure and Hydrology. Human manipulation of stream flows and channel structurealso has had enormous impacts on aquatic and terrestrial environments. Upon Euro-Americansettlement, the Willamette River became a principal arterial for transporting farm and forestgoods. From 1880 to around 1950, the U.S. Army Corps of Engineers removed more than 69,000snags and overhanging trees from the river to protect river boats. In 1908, the Corps begandredging the Willamette above Oregon City. For the next 20 years, it removed an average of102,000 cubic yards of material per year. Dredging continued on the Upper Willamette until theearly 1970s. In addition, the Corps blocked side channels, scraped gravel bars, and built wingdikes to change the depth and course of the river (Benner, 1997).
Beginning in the 1960s, the U.S. Army Corps of Engineers built the Willamette River BasinProject, a complex of 13 flood-control dams on tributaries, mostly in the Cascades. These damshave dramatically altered the flow regime of the Willamette by controlling downstream floodingin the winter, nearly doubling the flow in the summer (which dilutes pollution), and alteringchannel dynamics. The project also included a bank protection component that protectsagricultural, suburban, and urban land from erosion along the mainstem Willamette River fromNew Era upstream to each of the Willamette River Basin Project dams on the tributaries. As ofSeptember 1996, the program had protected a total of 489,795 linear feet (or nearly 93 miles) ofbanks at 230 locations. Project components include riverbank revetments, pile and timberbulkheads, drift barriers, minor channel improvements, and maintenance of existing works forthe control of floods and prevention of bank erosion.
These streamflow and channel structure activities are largely responsible for large-scaledecreases in channel complexity in the Willamette River, with the loss of many different habitats(for example, side channels, wetlands, and wet prairies) important for salmonids and numerouswildlife species.
Human disturbance is discussed further in Sections 3.1.3, 3.1.4, and 3.2.
3.1.2 Existing Subbasin Water Resources
3.1.2.1 Watershed HydrographyHydrographic Overview. The average annual runoff of the Willamette, which is about 24million acre feet, contributes approximately 15 percent of the total annual discharge of theColumbia River (U.S. Army Corps of Engineers, 2000). Major tributaries include the Santiam,McKenzie, Clackamas, Middle Fork, Coast Fork, Long Tom, Luckiamute, Mary’s, Molalla,Calapooia, Tualatin, and Yamhill rivers. The tributaries have their headwaters along the easternslopes of the Coast Range, the northern slopes of the Calapooya Mountains, and the westernslopes of the Cascade Range.
The mainstem of the Willamette River is formed by the confluence of the Coast and Middleforks near Eugene and flows 187 miles to the Columbia. The mainstem has four distinct reacheswhose physical nature governs the hydraulics of flow. The upper reach extends from Eugene toAlbany, roughly from River Mile (RM) 187 to RM 119. This reach has a braided, meanderingchannel with many islands and sloughs. The river is shallow and its bed consists almost entirely

DRAFT WILLAMETTE SUBBASIN PLAN
3-20 CH 3 ASSESSMENT.DOC
of cobbles and gravel that, during the summer, are covered with biological growth. The middlereach—roughly from Albany to the mouth of the Yamhill River (RM 119 to RM 55)—ischaracterized by a meandering channel that is deeply cut into the valley. The Newberg Poolreach extends from RM 55 to Willamette Falls at RM 26.5. In essence, this deep, slow-movingpool acts as a reservoir. The pool is a depositional area for small gravel- to silt-sized material. Itterminates at Willamette Falls, a 42-foot-high natural falls, with flashboards used to control poolelevation during the summer. Lastly, the tidal reach extends downstream from Willamette Fallsand is controlled by backwater from the Columbia River (Lee and Risley, 2002).
The Willamette’s hydrography has three major distinguishing elements:
• Upper and lower basin. The Willamette system is strongly influenced by Willamette Fallsat Oregon City, which divides the Willamette basin into two distinct areas. Below the falls,the very low-gradient river is subject to tidal influences and backwater effects of theColumbia (Pacific Northwest Ecosystem Research Consortium, 2002). With a drop of 42 feetand a width of 1,300 feet, these falls are some of the biggest in the Pacific Northwest. Theyhave been altered by human additions such as timber cribs and concrete revetments tomanage flow, navigation locks (the oldest west of the Mississippi), and fish ladders.Historically, the falls acted as a biological control. They were passable to fish only in highwater; thus, only winter steelhead could get above them. Coho tended to use onlydownstream tributaries, and cutthroat trout’s “sea-run” life form existed below the falls, notabove.
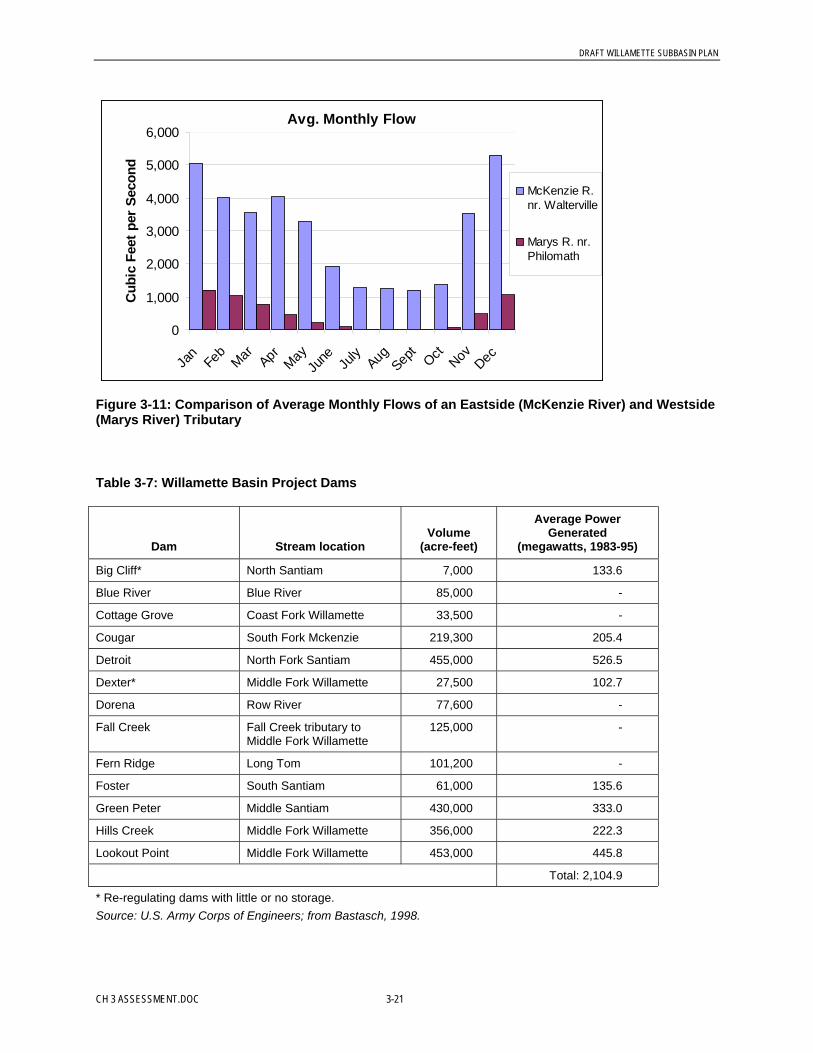
• Coast Range (west side) and Cascade (east side) tributaries. The Willamette system ischaracterized by very unequal contributions from east and west (see Figure 3-11). TheCascade streams are larger, colder, and historically supported more salmon runs. Flows onthe east side are maintained by snow-melt and springs during the summer. About 73 percentof the Willamette’s total annual flow is from the east side of the basin. Coast Range streams,on the other hand, are shorter, with less volume, and hosted a different suite of native fishspecies. These streams are warmer and have very little flow in the summer. About 20 percentof the Willamette’s total annual flow is from the west side (Bastasch, 1998).
• Major dams. Because the source of most of the Willamette’s water (and flooding) is the eastside, the basin’s major dams all have been built on streams originating in the Cascades (seeTable 3-7 and Figure 3-10). Combined, the eastside reservoirs control approximately 27percent of the runoff from the watershed and provide approximately 1.6 million acre-feet offlood control storage in the basin. This means that the fish and wildlife impacts of hydrologicchange, habitat inundation, and downstream in-channel habitat disruption have occurredpredominantly on the east side of the basin.
DRAFT WILLAMETTE SUBBASIN PLAN
CH 3 ASSESSMENT.DOC 3-21
Avg. Monthly Flow
0
1,000
2,000
3,000
4,000
5,000
6,000
Jan
Feb
Mar Apr MayJu
ne July
Aug Sept
Oct Nov Dec
Cub
ic F
eet p
er S
econ
d
McKenzie R.nr. Walterville
Marys R. nr.Philomath
Figure 3-11: Comparison of Average Monthly Flows of an Eastside (McKenzie River) and Westside(Marys River) Tributary
Table 3-7: Willamette Basin Project Dams
Dam Stream locationVolume
(acre-feet)
Average PowerGenerated
(megawatts, 1983-95)
Big Cliff* North Santiam 7,000 133.6
Blue River Blue River 85,000 -
Cottage Grove Coast Fork Willamette 33,500 -
Cougar South Fork Mckenzie 219,300 205.4
Detroit North Fork Santiam 455,000 526.5
Dexter* Middle Fork Willamette 27,500 102.7
Dorena Row River 77,600 -
Fall Creek Fall Creek tributary toMiddle Fork Willamette
125,000 -
Fern Ridge Long Tom 101,200 -
Foster South Santiam 61,000 135.6
Green Peter Middle Santiam 430,000 333.0
Hills Creek Middle Fork Willamette 356,000 222.3
Lookout Point Middle Fork Willamette 453,000 445.8
Total: 2,104.9
* Re-regulating dams with little or no storage.Source: U.S. Army Corps of Engineers; from Bastasch, 1998.

DRAFT WILLAMETTE SUBBASIN PLAN
3-22 CH 3 ASSESSMENT.DOC
In addition to the major flood-control dams operated by the U.S. Army Corps of Engineers, thereare more than 350 other large dams in the basin that control water for agricultural, municipal,and power production purposes.
Hydrographic Classifications. There are two major and slightly different classificationschemes for characterizing the Willamette’s hydrography.
The first is the Hydrologic Unit Coding of the U.S. Geological Survey (USGS). In this system,USGS has divided the United States into 21 major regions that usually contain the drainage areaof a major river. These regions are further divided into subregions (there are 222 in the UnitedStates), based on smaller river systems; these subregions, in turn, are further divided on the basisof smaller tributaries (U.S. Geological Survey, 2004).
The Willamette Basin is within the Pacific Northwest Region (17), the Willamette subregion(09), basin (00). Within the basin, major tributary areas—a fourth division—are given anadditional two-digit code. These are called “4th-field” hydrologic unit codes. They correspond tothe major tributary drainages of the Willamette. Further subdivisions include smaller “5th-field”(or HUC-5) and “6th-field” (HUC-6) watersheds. For example, the Willamette Basin has a codeof 17090000. The Mohawk River, a McKenzie tributary, has a hydrologic unit code of1709000402, as illustrated in Figure 3-12.
17 09 00 04 02
Pacific NWregion
WillametteSubregion
Willamettebasin
McKenziedrainage
Mohawksub-drainage
"4th-fieldHUC"
"5th-fieldHUC"
Figure 3-12: USGS Hydrologic Unit Coding of the Mohawk River
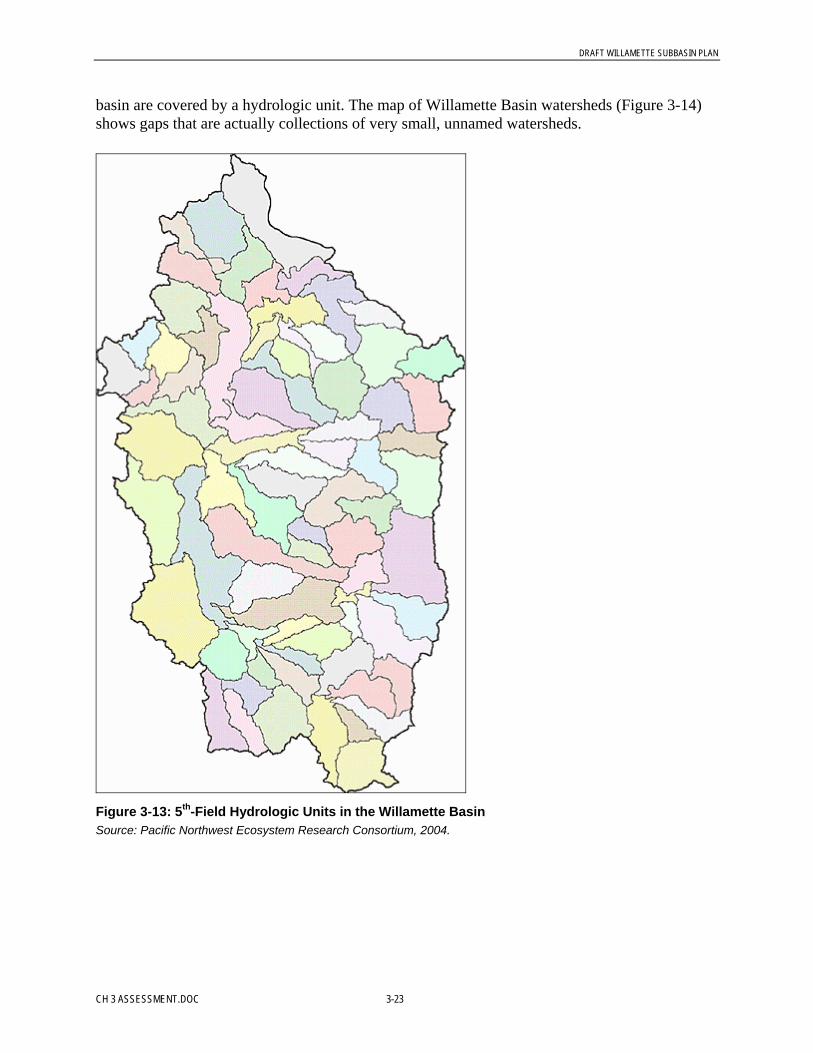
The Willamette Basin contains 12 4th-field hydrologic units, 72 5th-field hydrologic units, and170 6th-field hydrologic units (Pacific Northwest Ecosystem Research Consortium, 2002). Thebasin’s 5th-field hydrologic units are shown in Figure 3-13. Hydrologic units tend to be used byhydrologists and other technical experts, especially at the federal level, when describingstreamflows, water quality, and other measurements.
However, another classification system is used more frequently for management purposes:watersheds. Although similar to hydrologic unit codes, watersheds are defined by how thelandscape catches and conveys water down channels, and the system is not as detailed as USGShydrologic coding. Watersheds have names, not numbers, and any smaller drainage areas aresimilarly identified by name, not a code. Watersheds are used especially by citizens, watershedcouncils, and state agencies to describe the natural subunits of the Willamette Basin. Unlikehydrologic units, the trace of a watershed begins right at its confluence with the stream it flowsinto, so each watershed tends to be shaped like a leaf with the tip of the stem being the mouth ofthe river or stream. Hydrologic units tack on other areas near the mouth so that all areas of the
DRAFT WILLAMETTE SUBBASIN PLAN
CH 3 ASSESSMENT.DOC 3-23
basin are covered by a hydrologic unit. The map of Willamette Basin watersheds (Figure 3-14)shows gaps that are actually collections of very small, unnamed watersheds.
Figure 3-13: 5th-Field Hydrologic Units in the Willamette BasinSource: Pacific Northwest Ecosystem Research Consortium, 2004.

DRAFT WILLAMETTE SUBBASIN PLAN
3-24 CH 3 ASSESSMENT.DOC
Figure 3-14: Watershed Council BoundariesSource: Oregon Watershed Enhancement Board, undated.
Watersheds are primary management units that will be used in this plan to ground the subbasinassessment and strategies in ways that make sense for local managers and project planners andinitiators.
3.1.2.2 Hydrologic RegimeStreamflow in the Willamette Basin reflects the seasonal distribution of precipitation, with 60 to85 percent of the streamflow occurring from October through March, but with less than 10

DRAFT WILLAMETTE SUBBASIN PLAN
CH 3 ASSESSMENT.DOC 3-25
percent during July and August. Releases from 13 major tributary reservoirs operated by the U.S.Army Corps of Engineers are managed to control flood flows in winter and for water qualityenhancement in the summer by maintaining a flow of 6,000 cubic feet per second (cfs) in theWillamette River at Salem (U.S. Army Corps of Engineers, 1989). Combined, these reservoirscontrol approximately 27 percent of the runoff from the watershed and provide approximately1.6 million acre-feet of flood control storage in the Willamette Basin.
Annual discharge of the Willamette River near its mouth at Portland averages 32,400 cubic feetper second (cfs), or nearly 24 million acre-feet. Typical monthly flows at Portland range fromabout 8,000 cfs in August to about 70,000 cfs in December. Recorded extreme flows were 4,200cfs in July 1978 and 283,000 cfs in January 1974, although the river reached an estimated peakflow of 460,000 cfs during the flood of February 1996.
There are significant variations in streamflow regimes throughout the basin. Summertime flowsin westside streams originating in the Coast Range are extremely low. These streams include theMarys, Yamhill, and Tualatin rivers. Eastside streams in low-lying watersheds, such as theCalapooia, Pudding, and Mohawk rivers, have similar flow patterns. Other streams with higherelevation headwaters generally have more abundant summer flow conditions. These include theSantiam and McKenzie rivers. In addition, the federal flood control projects on these streams areused to augment flows below the dams, including in the mainstem Willamette River. Figure 3-11illustrates the differences between eastside and westside flows.
3.1.2.3 GroundwaterThe main groundwater aquifers in the Willamette Basin occur in the alluvial sediment and basaltgeologic units (Oregon Department of Environmental Quality, 2004). There are four regionalhydrogeologic units for the Willamette Basin: the low-yield bedrock unit, the Columbia RiverBasalt unit, the basin-fill sediment unit, and the Willamette Silt unit (Oregon Water ResourcesDepartment, 2002; see Figure 3-15).

DRAFT WILLAMETTE SUBBASIN PLAN
3-26 CH 3 ASSESSMENT.DOC
Figure 3-15: Generalized Hydrogeology of the Willamette Basin and Areas of Groundwater SupplyConcernSource: OWRD, 2002.
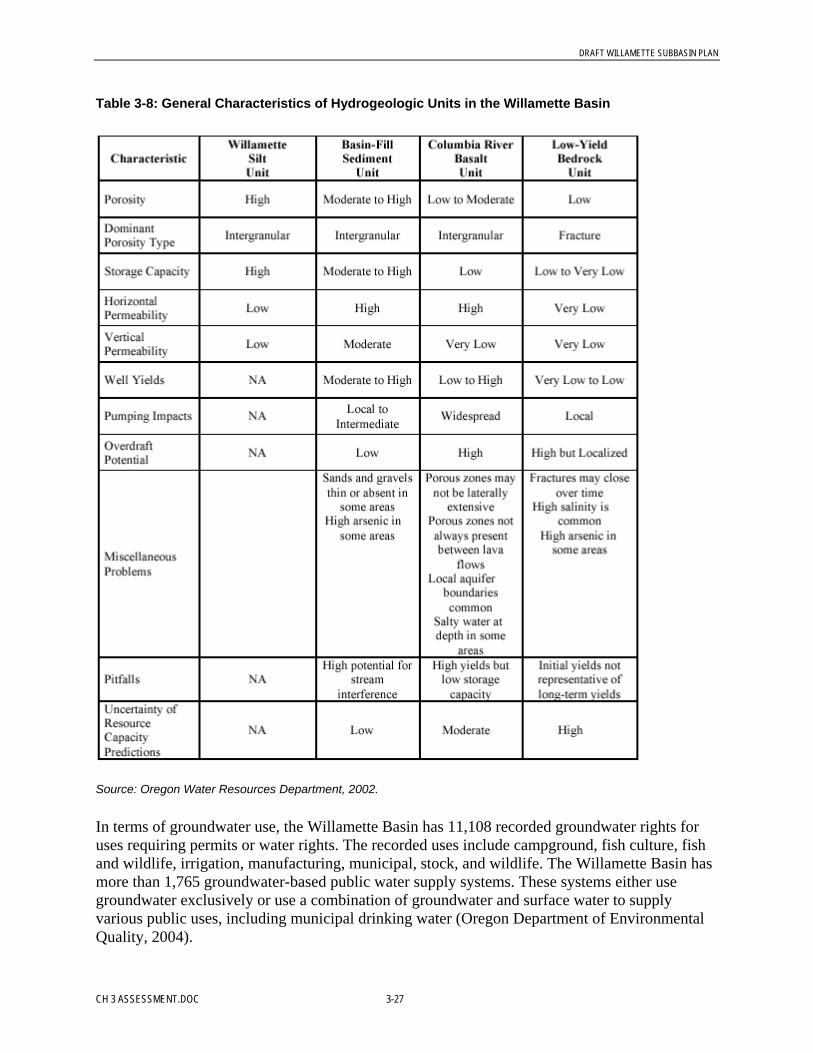
Groundwater Use and Supply. There can be several types of water supply problems withinthese units. For example, production from individual wells may deteriorate with time.Neighboring wells may interfere with each other such that neither gets enough water. Waterlevels in entire aquifers may decline if pumping is excessive. And overuse may gradually createan inflow of saline water, making the water supply unusable. These types of problems along withthe distribution and general characteristics of each unit are described Table 3-8.
DRAFT WILLAMETTE SUBBASIN PLAN
CH 3 ASSESSMENT.DOC 3-27
Table 3-8: General Characteristics of Hydrogeologic Units in the Willamette Basin
Source: Oregon Water Resources Department, 2002.
In terms of groundwater use, the Willamette Basin has 11,108 recorded groundwater rights foruses requiring permits or water rights. The recorded uses include campground, fish culture, fishand wildlife, irrigation, manufacturing, municipal, stock, and wildlife. The Willamette Basin hasmore than 1,765 groundwater-based public water supply systems. These systems either usegroundwater exclusively or use a combination of groundwater and surface water to supplyvarious public uses, including municipal drinking water (Oregon Department of EnvironmentalQuality, 2004).
DRAFT WILLAMETTE SUBBASIN PLAN
3-28 CH 3 ASSESSMENT.DOC
Groundwater rights or permits are not required for small domestic wells. The Oregon WaterResources Department has record of more than 100,400 domestic water wells on file for theWillamette Basin. The number of water wells in the basin is probably higher because, prior to1955, state law did not require water well owners to file well logs for wells drilled and completedon their property (Oregon Department of Environmental Quality, 2004).
In response to the different types of groundwater supply problems described above, the OregonWater Resources Department has restricted groundwater use in 13 groundwater administrativeareas in the Willamette Basin, as shown in Table 3-9.

DRAFT WILLAMETTE SUBBASIN PLAN
CH 3 ASSESSMENT.DOC 3-29
Table 3-9: Designated Groundwater Areas and Areas of Supply Concern inWillamette Valley Counties
LYU = Low-yield bedrock unit.CRB = Columbia River Basalt unit.BFS = Basin fill sediment unit.Source: Oregon Water Resources Department, 2002.
Groundwater Quality. DEQ, USGS, and other organizations have conducted at least 17extensive studies of Willamette Basin groundwater quality since 1984, four of which have beenbasinwide in extent. A March 2004 report summarized the results of these studies (OregonDepartment of Environmental Quality, 2004). Unless otherwise noted, the information in thissection is taken entirely from that report.
DRAFT WILLAMETTE SUBBASIN PLAN
3-30 CH 3 ASSESSMENT.DOC
While much of the basin is forestland, these recent studies have focused on groundwater qualityin the following:
• Willamette Valley agricultural lands• Areas of significant Willamette Valley population density• Urban areas, including the three largest cities in Oregon (Portland, Salem, and Eugene)
Groundwater in the Willamette Basin is an important natural resource. The basin has more than11,000 water rights for groundwater use. More than 1,700 public drinking water systems in thebasin use groundwater either exclusively or in combination with surface water. Another 100,000domestic water wells in the basin provide drinking water to rural residences and areas with nopublic water supply systems.
Shallow Willamette Valley alluvial sediments contain productive aquifers that are vulnerable topollution from human activities. In fact, groundwater quality studies in the Willamette Basinhave shown impacts from several pollutants, including nitrate, pesticides, and volatile organiccompounds (VOCs), as described below.
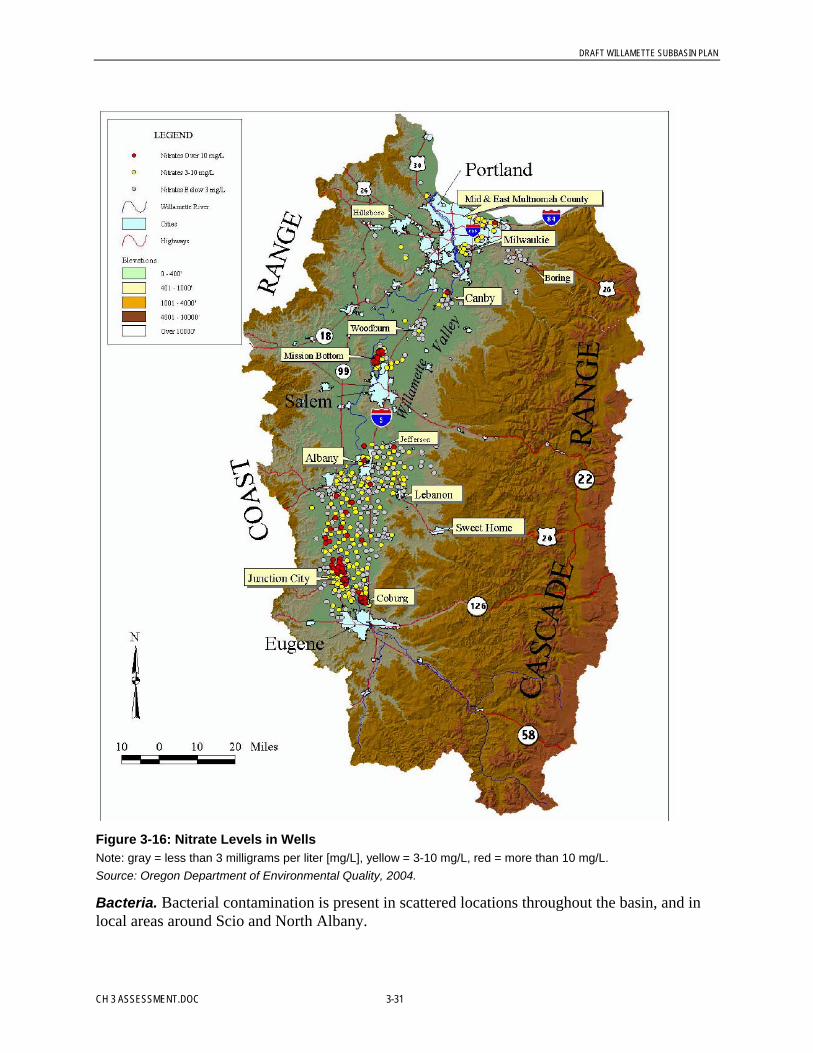
Nitrates. Willamette Basin nitrate contamination is widespread, particularly in the southernWillamette Valley near Coburg and Junction City (see Figure 3-16). The Mission Bottom areanorth of Salem also has significant nitrate levels, and DEQ has proposed a GroundwaterManagement Area (GWMA) for parts of Lane, Linn, and Benton counties. The GWMA wouldinclude a management plan specifying actions, such as best management practices (BMPs), toaddress high nitrate levels.
DRAFT WILLAMETTE SUBBASIN PLAN
CH 3 ASSESSMENT.DOC 3-31
Figure 3-16: Nitrate Levels in WellsNote: gray = less than 3 milligrams per liter [mg/L], yellow = 3-10 mg/L, red = more than 10 mg/L.Source: Oregon Department of Environmental Quality, 2004.
Bacteria. Bacterial contamination is present in scattered locations throughout the basin, and inlocal areas around Scio and North Albany.
DRAFT WILLAMETTE SUBBASIN PLAN
3-32 CH 3 ASSESSMENT.DOC
Pesticides. Pesticide-contaminated groundwater has been found throughout the basin at levelsgenerally in the part-per-trillion range. These levels are below risk-based standards. A USGSbasinwide assessment found pesticide contaminated groundwater in one third of sampled wells.Atrazine is the most commonly detected pesticide. In some of the studies, pesticides have notbeen detected using analytical methods with detection limits in the part per billion range.
VOCs. Groundwater contaminated with VOCs has been found in several urban areas in thebasin, and in areas of dense population. In one study, the USGS found VOCs in eight of tenmonitoring wells. VOCs have contaminated public drinking water supplies in four basin studyareas.
Point and Nonpoint Sources. Many potential point sources of nitrate and VOC pollution existwithin the Willamette Basin, including the following:
• Permitted waste discharge facilities• Underground injection control systems• Confined animal feeding operations• Hazardous substance release sites• Leaking underground storage tanks• Onsite sewage disposal systems• Solid waste facilities
Nonpoint sources of nitrate and pesticide pollution include agricultural land use areas and areaswith high population densities using onsite sewage disposal systems. The occurrence of VOCs insome areas may also be a nonpoint source problem from areawide industrial or other activitiestypically using chlorinated solvents.
3.1.2.4 Water QualitySurface Water. Studies showing serious pollution problems in the Willamette River started asearly as 1927. At least eight other major studies followed through 1963 and documented that theWillamette had high loads of organic wastes, dense beds of algae, and floating and river-bottomsludge, which resulted in critically low dissolved oxygen concentrations that limited salmonmigration. In some instances, the pollutant levels were lethal to local trout and salmonpopulations (Altman, Henson, and Waite, 1997).
The main pollutants being directly discharged into the river were untreated sewage frommunicipalities and residences and industrial wastes from canneries and paper mills. Thedischarge of sulphite pulp liquor from these mills was the most serious pollutant affecting fisheryresources because of its toxicity. In addition to the Willamette, the lower portions of severaltributaries—including Rickreall Creek and the Calapooia, Pudding, Tualatin, Yamhill, North andSouth Santiam, and Long Tom rivers—also were highly polluted (Altman, Henson, and Waite,1997).
Historically, the pollution load from domestic and industrial wastes discharged into theWillamette River was the most important factor contributing to the great decline of former greatruns of anadromous fish (Altman, Henson, and Waite, 1997). However, most current pollutionproblems in the Willamette Basin are from nonpoint sources, such as urban development, forestpractices, and agriculture. Recent Oregon Department of Environmental Quality (DEQ) studiessuggest that agricultural land is the largest source of nonpoint-source pollution. Most of the

DRAFT WILLAMETTE SUBBASIN PLAN
CH 3 ASSESSMENT.DOC 3-33
nonpoint-source pollution to the Willamette River is from the Pudding, Tualatin, Yamhill, andLong Tom subbasins (Altman, Henson, and Waite, 1997).
Point and nonpoint pollution problems are addressed through a process called total maximumdaily load (TMDL). A maximum daily load is a pollution limit set for any stream segment thatviolates current water quality standards. There are about 150 TMDLs being developed in theWillamette Basin. The biggest water quality problems are temperature and bacterialcontamination; they make up about two-thirds of the listings. Some sections of the mainstemWillamette are listed for biological issues relating to water quality, based on observed skeletaldeformities in fish. Mercury is the cause of a number of listings and appears to be related to pastmining activities in the Upper Basin. There also are some scattered listings for various toxicmaterials, including dieldrin, DDT, arsenic, and polychlorinated biphenyls (PCBs). Theremaining listings are for violations relating to excessive nutrients, dissolved oxygen, and pH.The pollutants of concern for the mainstem are bacteria, temperature, mercury, and—for theMiddle and Lower Willamette River—biological criteria (fish skeletal deformities). (There arealso seven listings for habitat and flow modification; however, these do not require TMDLsbased upon direction from the U.S. Environmental Protection Agency) (Oregon Department ofEnvironmental Quality, 2000).
Table 3-10: Willamette TMDLs by Subbasin
Number of Stream Segments Listed for Each Condition/Pollutant
Subbasin TempDissolvedOxygen Bacteria pH Toxics
NutrientRelated
BiologicalCriteria
FlowModifi-cation Other
TotalSegment
s
Tualatin 19 22 49 2 1 each forarsenic,manganese,and iron
6 10 111
UpperWillamette
7 2 9 4 formercury, 2for PAHs,1for arsenic
1 1 1 28
McKenzie 9 9
Coast Fork 6 2 3 formercury
11
Middle Fork 15 15
NorthSantiam
6 6
SouthSantiam
6 1 7
MiddleWillamette
4 6 2 formercury, 1for dieldrin
2 1 16
Clackamas 1 1-hab. 2

DRAFT WILLAMETTE SUBBASIN PLAN
3-34 CH 3 ASSESSMENT.DOC
Table 3-10: Willamette TMDLs by Subbasin
Number of Stream Segments Listed for Each Condition/Pollutant
Subbasin TempDissolvedOxygen Bacteria pH Toxics
NutrientRelated
BiologicalCriteria
FlowModifi-cation Other
TotalSegment
s
LowerWillamette
4 1 9 5 1 eachdioxin, DDE,PCBs, DDTlead, dieldrin
7 3 2 2 forhabitat
41
Yamhill(2007)
9 1 12 1, forchloropyrifos
1 2 26
Molalla/Pudding (2007)
8 1 6 1 each forarsenic, iron,manganese,and DDT
1 20
TOTAL 94 27 94 7 29 14 16 7 4 292
Source: Oregon Department of Environmental Quality, 2000.
DEQ regulates several types of waste discharges through permits. Permitted facilities andactivities include the following:
• Sewage• Pulp and paper waste• Food processing waste• Smelting/refining waste• Cooling water• Industrial stormwater• Mining• Municipal wastewater
Figure 3-17 shows the locations of the following permitted facilities in the Willamette Basin:
• 27 major permits for industries with large pollutant loads, toxic discharges, or large domesticwaste treatment facilities
• 1,208 minor permits for other types of discharges (Oregon Department of EnvironmentalQuality, 2000)
Approximately one-third of the minor permittees and two-thirds of the major permitteesdischarge into the mainstem Willamette River. Thus, most concern regarding the effects of point-source pollution on aquatic biota is within the valley floor, including the Willamette River andthe lower reaches of its tributaries (Altman, Henson, and Waite, 1997).
Table 3-11 shows the types and numbers of water quality pollution sources that are known andregulated by DEQ.

DRAFT WILLAMETTE SUBBASIN PLAN
CH 3 ASSESSMENT.DOC 3-35
Figure 3-17: Permitted Discharges in the Willamette BasinNote: NWR=DEQ Northwest Region; WR=DEQ Willamette Region.Source: Oregon Department of Environmental Quality, 2004.

DRAFT WILLAMETTE SUBBASIN PLAN
3-36 CH 3 ASSESSMENT.DOC
Table 3-11: Known and Regulated Water Quality Pollution Sources
SourceNumber in the
Willamette Basin
Underground Injection Control (UIC) Systems: A UIC system includesstructures or activities that place or discharge fluids into the subsurface.Examples of UICs include dry wells, sumps, septic system drainfields above acertain service or design size, and other wells used for injection purposes.
20,146
Confined Animal Feeding Operations: These include animal confinementareas; manure storage areas, such as lagoons, runoff ponds, storage sheds,stockpiles, and liquid impoundments; and waste containment areas, such assettling basins.
259
Hazardous Substance Release Sites. 334
Leaking Underground Storage Tanks (LUSTs): Cleanups of releases fromtanks, including home heating oil tanks.
21,681
Solid and Hazardous Waste Facilities: Landfills in the Willamette Basin forwhich DEQ has groundwater, surface water, or leachate monitoring data.
22
Source: Oregon Department of Environmental Quality, 2004.
Hyporheic Zone. Water in alluvial rivers often flows through a hyporheic zone—an area belowand alongside the streambed where water percolates through spaces between gravel, rocks, andcobbles. The most visible channel features associated with this zone are point bars, islands,gravel bars, and alcoves. Under natural conditions these features are not permanent; rather, theyare continuously being created, destroyed, and modified by changing river flows.
During summer, water emerging from the hyporheic zone is often cooler than water in the mainchannel of the river. Based on dye studies, Fernald has calculated that as much as 70 percent ofthe summer flow of the Willamette River spends some time in the hyporheic zone in the 67-kilometer-long reach between Eugene and Corvallis (Fernald et al., 2000).
Over the last 150 years, human actions have reduced the surface extent of the Willamette’shyporheic zone by about 80 percent by regulating flow and armoring river banks (such as withriprap) (Hulse, Gregory et al., 2002). However, even with this reduction, during the summer riverwater has been found to be cooled significantly (that is, from 2 oC to 7 oC) by traveling throughpoint bar hyporheic zones. (Fernald et al., 2000) It is estimated that the current amount ofhyporheic-caused cooling in the 67-kilometer Eugene-to-Corvallis reach of the Willamette Rivermay range from 0.2 oC to about 2.5 oC. There is significant uncertainty (that is, one order ofmagnitude) in this estimate because of the rudimentary understanding of hyporheic processes andextent in the Willamette system (Fernald, personal communication).
3.1.2.5 Riparian ResourcesRiparian areas are the areas immediately adjacent to streams and rivers. Although they occupy afairly small percentage of any watershed, riparian areas have large impacts on fish and wildlife:
• Their vegetation controls stream temperature and contributes organic matter and wood usedby aquatic organisms for food and shelter. The contribution of wood also controls channelform and complexity.

DRAFT WILLAMETTE SUBBASIN PLAN
CH 3 ASSESSMENT.DOC 3-37
• They can act as vegetative filters, screening out sediment and other pollutants from nearbyrunoff.
• They have a high level of biodiversity, providing the interface between aquatic and terrestrialspecies.
• They link land and water habitats by capturing the interdependencies of physical processes,such as channel formation and flooding, and the strongly coupled processes such as energyand nutrient exchanges.
Riparian resources of the Willamette Basin fall into three categories: those along the Willamettemainstem, those in major tributaries, and those in small streams.
Mainstem Riparian Areas. Historically, along the mainstem, riparian areas were often wideforests of black cottonwood, Oregon ash, alder, big-leaf maple, willow, Douglas fir, western redcedar, and Ponderosa pine. In 1850, hardwood riparian forests made up nearly 70 percent of theWillamette’s length, with mixed forests constituting about 14 percent and the rest in coniferforests. As a result of human activity, by 1895 more than half of the hardwood riparian areas hadbeen converted to other uses and nearly all the conifer riparian forests were gone. By 1990,hardwood riparian forests occupied about 17 percent of the Willamette’s length, mixed forests 18percent, farmland 30 percent, and development 16 percent. In other words, today about half ofthe riparian areas along the mainstem are in either agricultural or urban land uses (PacificNorthwest Ecosystem Research Consortium, 2002).
Riparian Areas in Major Tributaries. Historically, the riparian areas of major tributaries, suchas the Santiam and McKenzie rivers, were similar in makeup to mainstem riparian areas butsmaller in extent, and they took on more open, upland characteristics. In 1850, hardwood forestsmade up about 50 percent of tributary riparian areas, with about another one-third in mixed orconiferous forests and 20 percent in grass- and shrubland. Hardwood and mixed forests nowmake up about a quarter of the riparian zone, with conifer forests occupying but 2 percent.Today, agricultural and urban lands occupy about 55 percent of the riparian area (PacificNorthwest Ecosystem Research Consortium, 2002).
Riparian Areas of Small Streams. About 96 percent of all the riparian area in the WillametteBasin lies along small streams. Small streams have very different characters, depending onwhether they are in the lowlands or uplands of the basin. Lowland streams are marked by flatgradients and less steep banks, while upland streams tend to have steep banks and high gradients.In 1850, coniferous and hardwood forests together occupied about 55 percent of lowland streamriparian areas. Wetlands, grasslands, and shrublands made up the remainder, each about equally.By 1990, more than half the riparian area of lowland streams had been converted to farming orcity uses. Forests now make up about a third of the riparian area. Riparian areas of uplandstreams in 1850 were 98 percent coniferous forest. By 1990, half of the riparian area wasconiferous and half was mixed and hardwood forests, largely as a result of commercial forestrypractices. About two percent was farm and city land (Pacific Northwest Ecosystem ResearchConsortium, 2002).
3.1.2.6 Wetland ResourcesWetlands provide unique and significant ecological functions, including flood detention, thecooling and filtering of overland flow, nutrient cycling, and aquatic and terrestrial habitat.
DRAFT WILLAMETTE SUBBASIN PLAN
3-38 CH 3 ASSESSMENT.DOC
Before settlement, there were approximately 320,000 acres of wetlands in the lowlands of theWillamette Basin (Pacific Northwest Ecosystem Research Consortium, 2002). In 1982, wetlandsconstituted an estimated 8.5 percent of the Willamette Valley ecoregion, or about 273,000 acres.The major wetland types were palustrine forested, palustrine emergent, and palustrine farmed.By 1994, more than 6,500 wetland acres had been lost, with many of them having beenconverted to agricultural uses. In addition, some wetland types changed; about 17,000 acres wereconverted from one wetland type to another (Daggett et al., 1998).
3.1.3 Hydrologic and Ecologic Trends in the Subbasin
3.1.3.1 Influence of Human Use on Hydrology in the SubbasinHuman influence on the Willamette Basin’s hydrology has been great. As previouslysummarized, the strongest influences began with Euro-American settlement and the eradicationof beavers. Human influence grew to include major channel modifications to support navigationin the mainstem Willamette and tributaries—modifications that included dredging, miles of bankarmoring, removal of large wood, and the closing of side channels. Other modifications haveincluded the construction of major dams on the Willamette’s main tributaries, the diking anddamming of smaller channels, the draining of wetlands, surface and groundwater uses to supportagriculture and cities, the development of a very dense road network, surface drainage ditches,subsurface tiling, and creation of large areas of impervious surfaces from urban development.The affects of federal dams are addressed specifically below.
In general these human modifications have tended to do the following:
• Simplify channels• Create “flashier” runoff patterns in undammed drainages• Cause lower summer flows in streams• Create lower winter flows and higher summer flows in dammed drainages• Increase the duration of bank-full flows in dammed tributaries
Physical Channel Changes. Perhaps one of the biggest changes in the Willamette system hasbeen the result of the construction of navigation and bank-protection structures. Beginning in1870 the U.S. Army Corps of Engineers initiated efforts to increase navigational flows byclosing unwanted side channels, thus confining water from many braided channels into fewerchannels. Dredging spoils were deposited into side channels and gravel bars were scraped away.In addition, downed trees and drift piles of large wood were systematically cleared; between1870 and 1950, the Corps removed more than 69,000 snags and overhanging trees (Benner andSedell, 1997).
The River and Harbor Act/Flood Control Act of 1938 authorized the Corps to construct andmaintain a navigation channel on the Willamette River from Willamette Falls to Eugene. Themaintained channel ranged from 4.5 to 2.5 feet deep and up to 100 feet wide, with additionaldepth provided by streamflow augmentation from the reservoirs. Owing to dwindlingcommercial navigation on the river, continued maintenance of the navigation channel aboveWillamette Falls was determined to be economically infeasible. The last maintenance dredgingcompleted by the Corps of Engineers was in 1973 (U.S. Army Corps of Engineers, 1999).
The Corps of Engineers’ Willamette River Bank Protection Program is managed as part of itsWillamette River Basin Project. The program, which protects agricultural, suburban, and urban
DRAFT WILLAMETTE SUBBASIN PLAN
CH 3 ASSESSMENT.DOC 3-39
land from erosion along the mainstem Willamette River from New Era upstream to each of theWillamette Project dams, represents one of the earliest flood protection efforts in the basin. Itpredates the construction of flood control dams by many decades and has had at least asprofound an impact on habitat as the dams have had. As of September 1996, the program hadprotected a total of 489,795 linear feet (or nearly 93 miles) of banks at 230 locations. Projectcomponents include riverbank revetments, pile and timber bulkheads, drift barriers, minorchannel improvements, and maintenance of existing works for control of floods and preventionof bank erosion.
The impacts of these Corps of Engineer management activities on habitat have been profound.With fewer meanders in the river, the length of the Willamette’s channel has been cut nearly inhalf. The result has been an 84 percent loss of tributary and slough habitat (Benner and Sedell,1997; Institute for the Northwest, 1999).
An estimated 75 percent of the original shoreline has been lost to channelization, which waslargely completed in the Willamette River by 1946. The river was channelized to aid rivernavigation, reduce land erosion, and increase land available for farming. Several kinds ofstabilization techniques have been used since the first revetment on the Willamette River in1888, with use of stone (riprap) being the most extensive. More than 100 miles of stonerevetments have been constructed in the Willamette Basin, which means that 11 percent of theWillamette River shoreline is riprapped. Most revetments have been built by the U.S. ArmyCorps of Engineers since the 1930s as part of its Willamette River Bank Protection Program(Altman, Henson, and Waite, 1997).
Stone revetments change the physical environment of shoreline substrate, shoreline gradient, andwater velocity. The principal change in the shoreline is a reduction in riparian vegetation andlarge wood. Revetments also reduce side channels, backwater areas, and oxbows, which areimportant habitat for juvenile salmonids and the Oregon chub. Fish assemblages at stonerevetments on the Willamette below Salem are characterized by lower species richness anddiversity than at natural banks but higher densities of small fish. Fish species associatedpositively with revetments are likely attracted by the high densities of invertebrate prey (Altman,Henson, and Waite, 1997).
Federal Columbia River Power System Dams. Dams have been a part of the basin since themid-1800s. However, extensive flood-control efforts began in the 1930s. Most of these flood-control dams were built by the U.S. Army Corps of Engineers between 1941 and 1968.Currently, there are 25 major dams in the Willamette Basin: 11 single-purpose hydroelectricprojects operated by public and private utilities, one multipurpose project on the Tualatin River,and 13 multipurpose reservoirs operated by the Corps of Engineers (Altman, Henson, and Waite,1997).
These 13 reservoirs are operated for flood control, power generation, recreation, irrigation,public water supply, navigation, pollution abatement, and anadromous fish propagation. Summerflows in the Willamette are due primarily to releases from these dams and are higher and coolerthan those before the dams were constructed. When combined with passage improvements atWillamette Falls and hatchery inputs, this improved water quality has helped establish upriverruns of summer steelhead, coho, and fall Chinook, which historically did not occur (Altman,Henson, and Waite, 1997).
DRAFT WILLAMETTE SUBBASIN PLAN
3-40 CH 3 ASSESSMENT.DOC
Dams affect aquatic species upstream and downstream of the dam in both beneficial and harmfulways. Benefits include control of floods, which has reduced siltation, and augmentation ofhistorical low flows in the summer with cooler water. The principal negative impact of dams isthe inundation of spawning areas and physical blockage of migration to upstream spawningareas. Roughly 400 miles of previously important spawning and rearing habitat for salmon is nolonger accessible. Other negative impacts include increased water temperature variations andextremes, a reduction in the amount of production and rearing habitat for some species of fish,alteration of the natural hydrologic functions of seasonal flooding and recruitment of spawninggravel, and mortality in turbines at the dams. In addition, reservoirs may contribute to diseaseproblems and favor warm-water introduced fish species that often prosper at the expense ofnative fish (Altman, Henson, and Waite, 1997).
Dams and reservoirs in the Willamette Basin also adversely affect fish behavior and reproductivecapacity. Dams can delay the migration of adult salmonids, particularly during spring high flows,when Chinook have difficulty using fishways. Natural migration timing can also change as aresult of water temperature modifications caused by dams. And flow disruption from drawdownsmay expose redds or strand adults (Altman, Henson, and Waite, 1997).
The Willamette Basin Project. The Willamette Basin Project (the U.S. Army Corps ofEngineer’s system of 11 flood control and two re-regulating dams) has reduced the frequency ofextremely high and low flows and disrupted the once-dynamic rhythm of floods and dry spells.Flow and temperature regimes in the Willamette have been drastically altered as a result ofextensive development of flood control structures in the upper basin (Hughes and Gammon,1987). Flood control modifications have largely disconnected the Willamette River from itsbraided channels, oxbows, and sloughs—wetland types that characterized much of its historicalfloodplain (Oregon Progress Board, 2000). The loss of sloughs, islands, and side channels hasnot only destroyed habitat for fish and wildlife, but has also reduced the river system’s ability toabsorb floodwaters (Oregon Progress Board, 2000). The speed and severity of modern floodinghas been exacerbated by the loss of the “sponge effect” of the natural floodplains. TheWillamette Bank Protection Program, a major component of the Corps’ Willamette BasinProject, is a primary cause of this disconnection.
Prior to the construction of the 11 water storage dams in the Willamette basin, beginning in theearly 1940s, frequent and substantial flooding was a dominant ecological process along themainstem Willamette. Mainstem floodplains used to be refreshed by floods every 10 years,which maintained vital ecological processes such as nutrient exchange, sediment trapping andrecycling, and the movement of large wood within the land and the river channel (OregonProgress Board, 2000). This flooding now happens only once every 100 years, on average(Benner and Sedell, 1997).
In addition, recent studies indicate that erosion has increased downstream from the Corps damsto compensate for sediment trapped by reservoirs. With dams capturing upstream sediment andreducing flood peaks, sediment characteristics in downstream reaches are affectedproportionately more by channel velocities from bank protection, channel incision, bank erosion,land-use conversions, and downstream sources of coarse sediments. In other words, about thesame amount of sediment is being transported as before dam construction, which means that theamount trapped by the reservoirs is being made up for by channel- or other land-erosiondownstream (Wentz et al., 1998).

DRAFT WILLAMETTE SUBBASIN PLAN
CH 3 ASSESSMENT.DOC 3-41
The impacts on habitat from these Corps of Engineers activities have been profound. The uppermainstem Willamette River’s channel length has been nearly halved as a result of thesemanagement activities, with a resulting 84 percent loss of tributary and slough habitat (Bennerand Sedell, 1997; Institute for the Northwest, 1999).
3.1.3.2 Nonfederal Hydropower FacilitiesFor most nonfederal hydroelectric power projects, the Federal Energy Regulatory Commission(FERC) must issue a license authorizing construction or, in the case of an existing project,continued project operation. Licenses are issued for a term of between 30 to 50 years, andexemptions are granted in perpetuity. Most hydroelectric projects serve other purposes such asnavigation, flood control, recreation, irrigation, and flow augmentation.
Projects authorized by Congress and operated by the U.S. Army Corps of Engineers or the U.S.Bureau of Reclamation do not require FERC licenses. All nonfederal hydroelectric projectsoperating in Oregon, whether FERC-licensed or not, require either a state license or a powerclaim issued by the Oregon Water Resources Department. Relicensing takes a minimum of 5years and involves a series of public reviews as well as new studies to address current needs,including for environmental protection. At the end of this period, FERC either approves ordenies a relicensing request. There are 18 active FERC projects in the Willamette Basin (seeTable 3-12).
Once FERC receives an application to renew the license of an existing operation, it consults withthe U.S. Fish and Wildlife Service (USFWS) and/or NOAA Fisheries under Section 7 of thefederal Endangered Species Act (ESA). This is done within the framework of ensuringcompliance with National Environmental Policy Act (NEPA). Often an applicant is required todevelop a biological assessment. Based on this assessment, FERC works with the USFWS and/orNOAA Fisheries on a biological opinion that will result in a determination of a species’ jeopardyand, where needed, a reasonable and prudent alternative to the proposal that will avoid anyjeopardy.
Table 3-12: Active FERC Hydroelectric Power Projects (identified by the Oregon Department ofFish and Wildlife)
Project Name and FERCNumber Stream Relicensing Issues
Oak Grove (135) Oak Grove Fork of the Clackamas Work groups studying mitigation needs
North Fork/Faraday/River MillProjects (2195)
Clackamas Screening, passage; work groups studyingmitigation needs
Sullivan Plant (2233) Willamette Falls—WillametteRiver
Fish passage, turbine mortality; workgroups studying mitigation needs
Carmen-Smith (2242) McKenzie
Leaburg/Walterville (2496) McKenzie Fish passage, flow; ESA Section 7consultation under way
Blue River (3109) Blue River tributary to McKenzie Mitigation for fish passage problems, costshare for temperature study

DRAFT WILLAMETTE SUBBASIN PLAN
3-42 CH 3 ASSESSMENT.DOC
Table 3-12: Active FERC Hydroelectric Power Projects (identified by the Oregon Department ofFish and Wildlife)
Project Name and FERCNumber Stream Relicensing Issues
Stone Creek (5264) Stone Creek tributary to OakGrove Fork of the Clackamas
Flows, velocities, mitigation forendangered plant
Canyon Creek (6414) Canyon Creek tributary toClackamas
No fish and wildlife concerns currentlyidentified
Brunswick Creek (6564) Brunswick Creek tributary toTualatin
Blocks 2 miles of cutthroat habitat;reservoir stocked with exotic rainbow
LaComb (6648) Crabtree Creek tributary to SouthSantiam
Fish passage, flow problems, water quality
Falls Creek (6661 Falls Creek tributary to SouthSantiam
Screening improvements
Water Street (6943) North Santiam Screening
Wolf Creek (7058) (City of Portland water system) No fish and wildlife concerns identified
Thompson’s Mills (9169) Calapooia Flows
Woodcock Creek (1423) Woodcock Creek tributary toMolalla
Stayton (11429) Flows, passage, water quality, screening
Albany Hydroelectric Project(11509)
South Santiam Screening, passage, flows, habitatprotection
Bigelow (11512) McKenzie Screens, passage, bull trout mitigationrequired by ESA consultation
3.1.3.3 Influence of Human Use on Ecology in the SubbasinFish Impacts. Beginning 40 years ago, all Willamette Project dams (except Foster) completelyblocked fish migration, either because no passage facilities were provided or because thoseprovided did not work. Upper Willamette spring Chinook and winter steelhead are no longerfound above these dams (see Figure 3-10).
In addition to blocking migration, much historical spawning and rearing habitat has beeninundated by reservoir (see Table 3-13). Dams built in the 1950s and 1960s on the Santiam,Middle Fork Willamette, and McKenzie rivers blocked more than 400 stream miles that wereoriginally the most important spawning areas for native Chinook salmon (Bennett, 1994).
Table 3-13: Summary of Federal Columbia River Power System Impacts on Anadromous Fish
Species Stream Impacts
Spring Chinook Santiam 71 percent of production occurred above Detroit Dam(Mattson, 1948). All access to upstream spawninghabitat was lost because the dam was built without fish
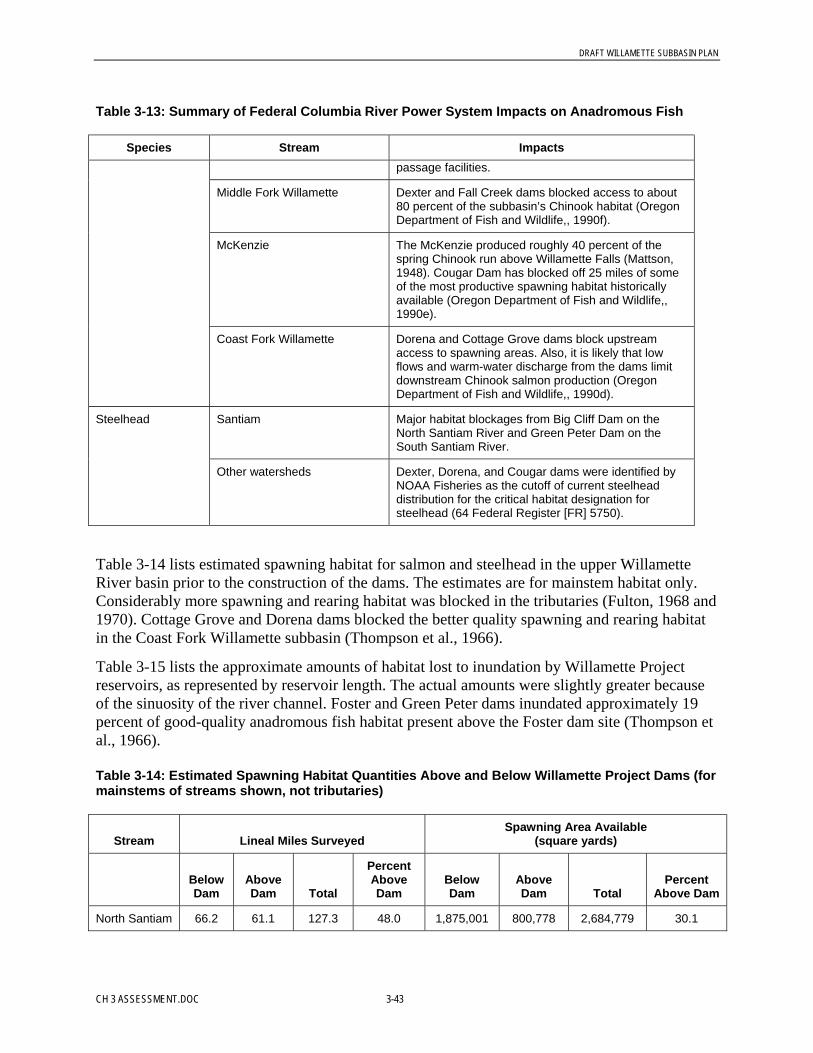
DRAFT WILLAMETTE SUBBASIN PLAN
CH 3 ASSESSMENT.DOC 3-43
Table 3-13: Summary of Federal Columbia River Power System Impacts on Anadromous Fish
Species Stream Impactspassage facilities.
Middle Fork Willamette Dexter and Fall Creek dams blocked access to about80 percent of the subbasin’s Chinook habitat (OregonDepartment of Fish and Wildlife,, 1990f).
McKenzie The McKenzie produced roughly 40 percent of thespring Chinook run above Willamette Falls (Mattson,1948). Cougar Dam has blocked off 25 miles of someof the most productive spawning habitat historicallyavailable (Oregon Department of Fish and Wildlife,,1990e).
Coast Fork Willamette Dorena and Cottage Grove dams block upstreamaccess to spawning areas. Also, it is likely that lowflows and warm-water discharge from the dams limitdownstream Chinook salmon production (OregonDepartment of Fish and Wildlife,, 1990d).
Steelhead Santiam Major habitat blockages from Big Cliff Dam on theNorth Santiam River and Green Peter Dam on theSouth Santiam River.
Other watersheds Dexter, Dorena, and Cougar dams were identified byNOAA Fisheries as the cutoff of current steelheaddistribution for the critical habitat designation forsteelhead (64 Federal Register [FR] 5750).
Table 3-14 lists estimated spawning habitat for salmon and steelhead in the upper WillametteRiver basin prior to the construction of the dams. The estimates are for mainstem habitat only.Considerably more spawning and rearing habitat was blocked in the tributaries (Fulton, 1968 and1970). Cottage Grove and Dorena dams blocked the better quality spawning and rearing habitatin the Coast Fork Willamette subbasin (Thompson et al., 1966).
Table 3-15 lists the approximate amounts of habitat lost to inundation by Willamette Projectreservoirs, as represented by reservoir length. The actual amounts were slightly greater becauseof the sinuosity of the river channel. Foster and Green Peter dams inundated approximately 19percent of good-quality anadromous fish habitat present above the Foster dam site (Thompson etal., 1966).
Table 3-14: Estimated Spawning Habitat Quantities Above and Below Willamette Project Dams (formainstems of streams shown, not tributaries)
Stream Lineal Miles SurveyedSpawning Area Available
(square yards)
BelowDam
AboveDam Total
PercentAboveDam
BelowDam
AboveDam Total
PercentAbove Dam
North Santiam 66.2 61.1 127.3 48.0 1,875,001 800,778 2,684,779 30.1

DRAFT WILLAMETTE SUBBASIN PLAN
3-44 CH 3 ASSESSMENT.DOC
Table 3-14: Estimated Spawning Habitat Quantities Above and Below Willamette Project Dams (formainstems of streams shown, not tributaries)
Stream Lineal Miles SurveyedSpawning Area Available
(square yards)
BelowDam
AboveDam Total
PercentAboveDam
BelowDam
AboveDam Total
PercentAbove Dam
SouthSantiam
87.7 63.5 151.2 42.0 2,352,539 874,278 3,226,817 27.1
McKenzie 76.7 103.3 180.0 57.4 3,224,923 1,841,112 5,066,035 36.3
Middle ForkWillamette
83.6 74.5 158.1 47.1 2,501,145 1,226,140 3,727,285 32.9
Total 314.2 302.4 616.6 9,953,608 4,751,308 14,704,916
Source: Craig and Townsend, 1946.
Table 3-15: Approximate Miles* of River Habitat Inundated by Willamette ProjectReservoirs
Dam StreamLength of Reservoir
(miles)
Big Cliff North Santiam River 2.8
Detroit North Santiam River 9.0
Green Peter Middle Fork Santiam River 10.0
Foster South Fork Santiam River 3.5
Blue River Blue River 6.4
Cougar South Fork McKenzie 6.5
Fall Creek Fall Creek 10.3
Hills Creek Middle Fork Willamette River 7.6
Lookout Point Middle Fork Willamette River 14.2
Dexter Middle Fork Willamette River 2.8
Dorena Row River 5.0
Cottage Grove Coast Fork River 3.0
Fern Ridge Long Tom River 4.5
* Does not necessarily account for former sinuosity.Source: USACE project data.
Willamette Project dams may delay migration as adult salmon and winter steelhead are turnedaround and forced to search for spawning habitat elsewhere. Winter steelhead returning belowFoster Dam also are delayed before they are collected and transported upstream. Any delays mayresult in reduced spawning fitness of the adults or survival and their progeny.
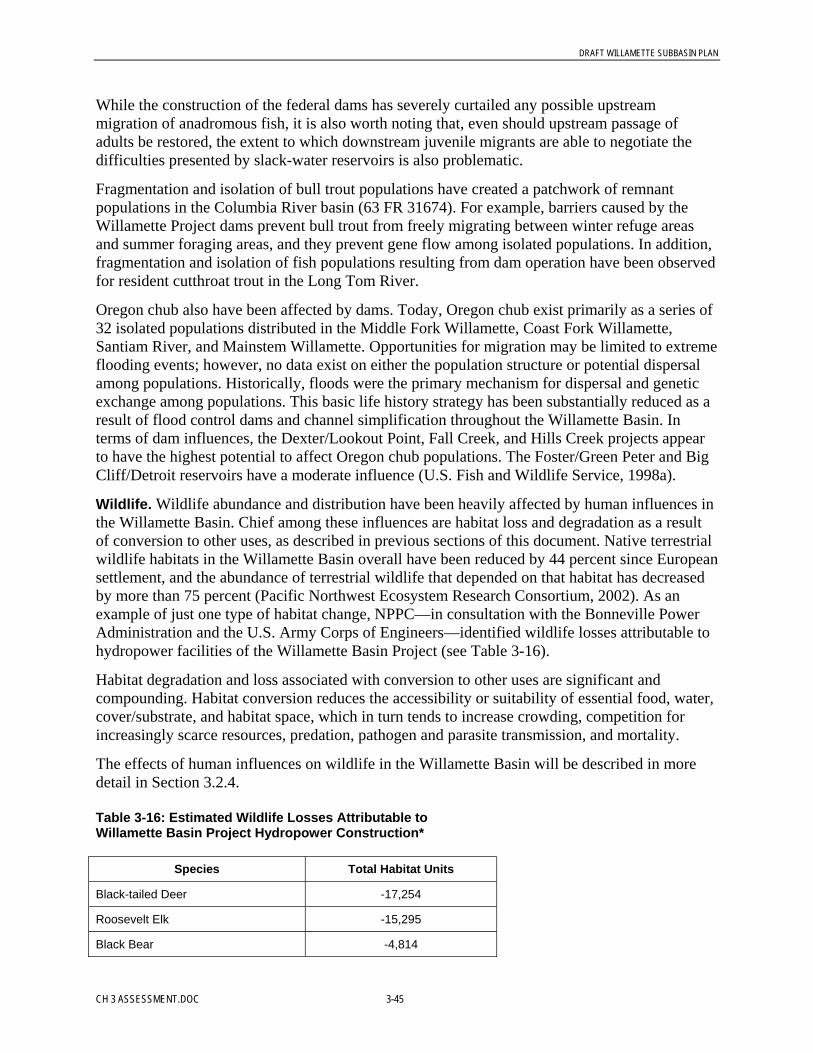
DRAFT WILLAMETTE SUBBASIN PLAN
CH 3 ASSESSMENT.DOC 3-45
While the construction of the federal dams has severely curtailed any possible upstreammigration of anadromous fish, it is also worth noting that, even should upstream passage ofadults be restored, the extent to which downstream juvenile migrants are able to negotiate thedifficulties presented by slack-water reservoirs is also problematic.
Fragmentation and isolation of bull trout populations have created a patchwork of remnantpopulations in the Columbia River basin (63 FR 31674). For example, barriers caused by theWillamette Project dams prevent bull trout from freely migrating between winter refuge areasand summer foraging areas, and they prevent gene flow among isolated populations. In addition,fragmentation and isolation of fish populations resulting from dam operation have been observedfor resident cutthroat trout in the Long Tom River.
Oregon chub also have been affected by dams. Today, Oregon chub exist primarily as a series of32 isolated populations distributed in the Middle Fork Willamette, Coast Fork Willamette,Santiam River, and Mainstem Willamette. Opportunities for migration may be limited to extremeflooding events; however, no data exist on either the population structure or potential dispersalamong populations. Historically, floods were the primary mechanism for dispersal and geneticexchange among populations. This basic life history strategy has been substantially reduced as aresult of flood control dams and channel simplification throughout the Willamette Basin. Interms of dam influences, the Dexter/Lookout Point, Fall Creek, and Hills Creek projects appearto have the highest potential to affect Oregon chub populations. The Foster/Green Peter and BigCliff/Detroit reservoirs have a moderate influence (U.S. Fish and Wildlife Service, 1998a).
Wildlife. Wildlife abundance and distribution have been heavily affected by human influences inthe Willamette Basin. Chief among these influences are habitat loss and degradation as a resultof conversion to other uses, as described in previous sections of this document. Native terrestrialwildlife habitats in the Willamette Basin overall have been reduced by 44 percent since Europeansettlement, and the abundance of terrestrial wildlife that depended on that habitat has decreasedby more than 75 percent (Pacific Northwest Ecosystem Research Consortium, 2002). As anexample of just one type of habitat change, NPPC—in consultation with the Bonneville PowerAdministration and the U.S. Army Corps of Engineers—identified wildlife losses attributable tohydropower facilities of the Willamette Basin Project (see Table 3-16).
Habitat degradation and loss associated with conversion to other uses are significant andcompounding. Habitat conversion reduces the accessibility or suitability of essential food, water,cover/substrate, and habitat space, which in turn tends to increase crowding, competition forincreasingly scarce resources, predation, pathogen and parasite transmission, and mortality.
The effects of human influences on wildlife in the Willamette Basin will be described in moredetail in Section 3.2.4.
Table 3-16: Estimated Wildlife Losses Attributable toWillamette Basin Project Hydropower Construction*
Species Total Habitat Units
Black-tailed Deer -17,254
Roosevelt Elk -15,295
Black Bear -4,814

DRAFT WILLAMETTE SUBBASIN PLAN
3-46 CH 3 ASSESSMENT.DOC
Table 3-16: Estimated Wildlife Losses Attributable toWillamette Basin Project Hydropower Construction*
Species Total Habitat Units
Cougar -3,853
Beaver -4,477
River Otter -2,408
Mink -2,418
Red Fox -2,590
Ruffed Grouse -11,145
California Quail -2,986
Ring-necked Pheasant -1,986
Band-tailed Pigeon -3,487
Western Gray Squirrel -1,354
Harlequin Duck -551
Wood Duck -1,947
Spotted Owl -5,711
Pileated Woodpecker -8,690
American Dipper -954
Yellow Warbler -2,355
Common Merganser +1,042
Greater Scaup +820
Waterfowl +423
Bald Eagle +5,693
Osprey +6,159
Source: National Power and Conservation Council, 2000.*Reflects pre- versus post-dam conditions, with the first federalhydropower dam (Fern Ridge) being built in 1941 and the last (Blue River)built in 1969.“-” indicates losses.“+” indicates gains.A habitat unit is a measure of habitat based on the acreage of a givenhabitat at a particular site multiplied by a suitability index factor under theHabitat Evaluation Procedure developed by USFWS. The suitability factorcharacterizes the amount of optimal habitat present. For example, if a 20-acre site had a suitability index of 0.5 for black-tailed deer, the site wouldbe “worth” 10 habitat units.
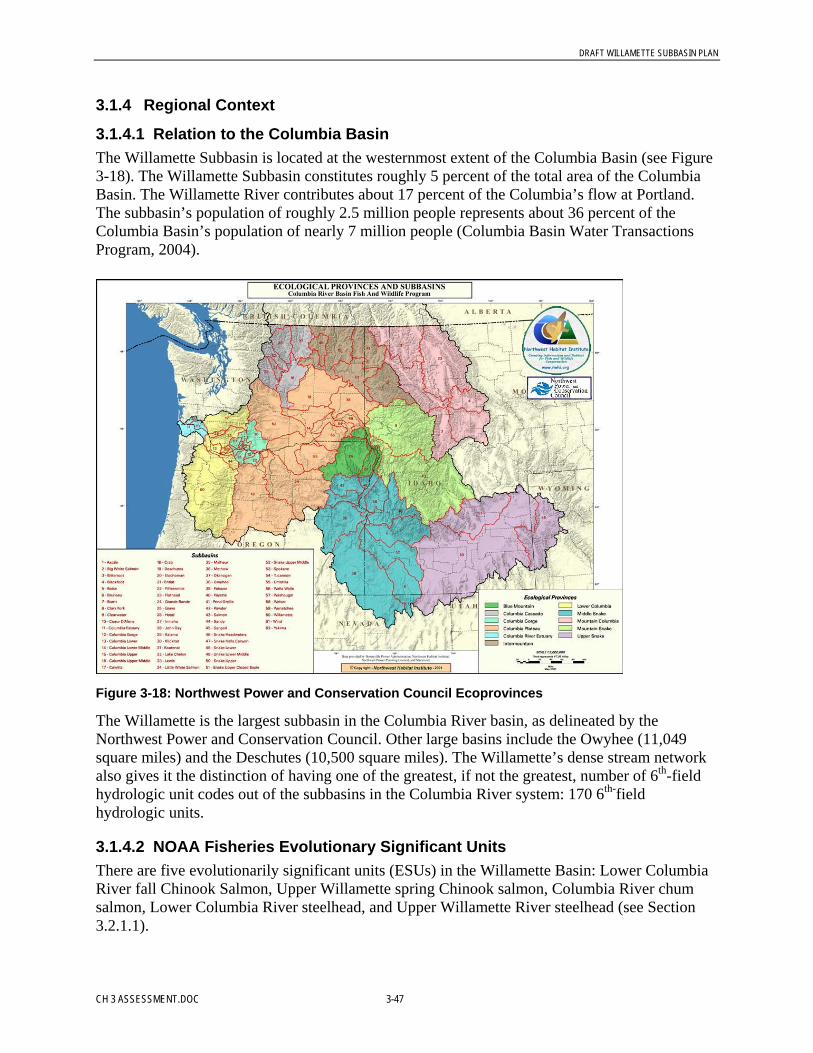
DRAFT WILLAMETTE SUBBASIN PLAN
CH 3 ASSESSMENT.DOC 3-47
3.1.4 Regional Context
3.1.4.1 Relation to the Columbia BasinThe Willamette Subbasin is located at the westernmost extent of the Columbia Basin (see Figure3-18). The Willamette Subbasin constitutes roughly 5 percent of the total area of the ColumbiaBasin. The Willamette River contributes about 17 percent of the Columbia’s flow at Portland.The subbasin’s population of roughly 2.5 million people represents about 36 percent of theColumbia Basin’s population of nearly 7 million people (Columbia Basin Water TransactionsProgram, 2004).
Figure 3-18: Northwest Power and Conservation Council Ecoprovinces
The Willamette is the largest subbasin in the Columbia River basin, as delineated by theNorthwest Power and Conservation Council. Other large basins include the Owyhee (11,049square miles) and the Deschutes (10,500 square miles). The Willamette’s dense stream networkalso gives it the distinction of having one of the greatest, if not the greatest, number of 6th-fieldhydrologic unit codes out of the subbasins in the Columbia River system: 170 6th-fieldhydrologic units.
3.1.4.2 NOAA Fisheries Evolutionary Significant UnitsThere are five evolutionarily significant units (ESUs) in the Willamette Basin: Lower ColumbiaRiver fall Chinook Salmon, Upper Willamette spring Chinook salmon, Columbia River chumsalmon, Lower Columbia River steelhead, and Upper Willamette River steelhead (see Section3.2.1.1).

DRAFT WILLAMETTE SUBBASIN PLAN
3-48 CH 3 ASSESSMENT.DOC
3.1.4.3 USFWS-Designated Bull Trout Planning UnitsThe Willamette Basin is a designated bull trout planning unit. Recovery criteria in the draftrecovery plan call for populations in the Clackamas, McKenzie, and Middle Fork Willamettesubbasins (U.S. Fish and Wildlife Service, 2003).
3.1.4.4 USFWS-Designated Oregon Chub Planning UnitsThe 1998 Oregon Chub Recovery Plan calls for at least four populations in each of threesubbasins: the Willamette River mainstem, the Middle Fork Willamette, and the Santiam (U.S.Fish and Wildlife Service, 1998).
3.1.4.5 Priority Species and HabitatsAs of this writing, the following numbers of Willamette Basin species are listed as threatenedand endangered (includes both state and federal designations of threatened, endangered, andspecies of concern):
• 10 plant species• 7 fish species• 110 wildlife species (includes bird species listed in Partners in Flight continental watchlist,
draft 2002 super region rankings, Oregon priority and focal species, Breeding Bird SurveyWillamette, and NPAC)
Habitats of concern include streams and six terrestrial habitats: oak woodlands; upland prairiesand savanna; wetland prairie and seasonal marsh; perennial ponds, sloughs, and their riparianareas; stream riparian; and old-growth conifer forest.
See Section 3.2.3.2 for a more detailed discussion of priority species and habitats.
3.1.4.6 Summary of External Environmental Impacts on Fish and WildlifeThe most significant out-of-subbasin influence for fish in the Willamette Basin is oceanconditions. Ocean conditions are associated with fluctuations in abundance of anadromous fish.At present, ocean conditions are favorable and Willamette Basin salmon runs are abundant—more than 100,000 Chinook salmon are expected to pass Willamette Falls by the end of thespring run. See Section 3.3 for more discussion about the impact of climatic cycles and oceanconditions on the focal species of this plan.
Migratory bird species have vast ranges and may be affected by a variety of factors outside theWillamette Basin. Information about the factors and influence of out-of-subbasin effects onmigratory bird species is generally lacking.
3.2 Focal Species Characterization and Status
3.2.1 Native/Nonnative Wildlife, Plant, and Resident/Anadromous Fish ofEcological Importance
The Willamette Basin has a very rich assemblage of plants, fish, and wildlife. It is difficult toassign a scientifically based import to any individual species, for all play a role in maintainingecosystem integrity and function. However, a number of species are recognized as ecologicallyimportant by virtue of their role as indicator species or because they are culturally and positively
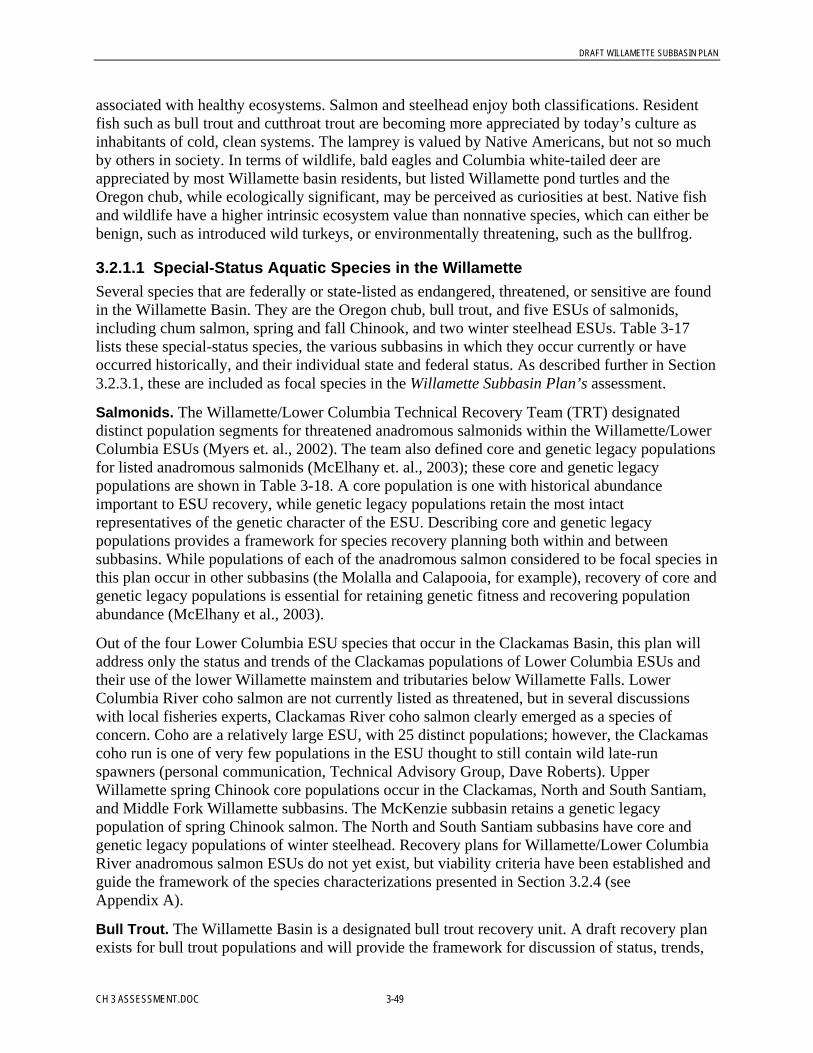
DRAFT WILLAMETTE SUBBASIN PLAN
CH 3 ASSESSMENT.DOC 3-49
associated with healthy ecosystems. Salmon and steelhead enjoy both classifications. Residentfish such as bull trout and cutthroat trout are becoming more appreciated by today’s culture asinhabitants of cold, clean systems. The lamprey is valued by Native Americans, but not so muchby others in society. In terms of wildlife, bald eagles and Columbia white-tailed deer areappreciated by most Willamette basin residents, but listed Willamette pond turtles and theOregon chub, while ecologically significant, may be perceived as curiosities at best. Native fishand wildlife have a higher intrinsic ecosystem value than nonnative species, which can either bebenign, such as introduced wild turkeys, or environmentally threatening, such as the bullfrog.
3.2.1.1 Special-Status Aquatic Species in the WillametteSeveral species that are federally or state-listed as endangered, threatened, or sensitive are foundin the Willamette Basin. They are the Oregon chub, bull trout, and five ESUs of salmonids,including chum salmon, spring and fall Chinook, and two winter steelhead ESUs. Table 3-17lists these special-status species, the various subbasins in which they occur currently or haveoccurred historically, and their individual state and federal status. As described further in Section3.2.3.1, these are included as focal species in the Willamette Subbasin Plan’s assessment.
Salmonids. The Willamette/Lower Columbia Technical Recovery Team (TRT) designateddistinct population segments for threatened anadromous salmonids within the Willamette/LowerColumbia ESUs (Myers et. al., 2002). The team also defined core and genetic legacy populationsfor listed anadromous salmonids (McElhany et. al., 2003); these core and genetic legacypopulations are shown in Table 3-18. A core population is one with historical abundanceimportant to ESU recovery, while genetic legacy populations retain the most intactrepresentatives of the genetic character of the ESU. Describing core and genetic legacypopulations provides a framework for species recovery planning both within and betweensubbasins. While populations of each of the anadromous salmon considered to be focal species inthis plan occur in other subbasins (the Molalla and Calapooia, for example), recovery of core andgenetic legacy populations is essential for retaining genetic fitness and recovering populationabundance (McElhany et al., 2003).
Out of the four Lower Columbia ESU species that occur in the Clackamas Basin, this plan willaddress only the status and trends of the Clackamas populations of Lower Columbia ESUs andtheir use of the lower Willamette mainstem and tributaries below Willamette Falls. LowerColumbia River coho salmon are not currently listed as threatened, but in several discussionswith local fisheries experts, Clackamas River coho salmon clearly emerged as a species ofconcern. Coho are a relatively large ESU, with 25 distinct populations; however, the Clackamascoho run is one of very few populations in the ESU thought to still contain wild late-runspawners (personal communication, Technical Advisory Group, Dave Roberts). UpperWillamette spring Chinook core populations occur in the Clackamas, North and South Santiam,and Middle Fork Willamette subbasins. The McKenzie subbasin retains a genetic legacypopulation of spring Chinook salmon. The North and South Santiam subbasins have core andgenetic legacy populations of winter steelhead. Recovery plans for Willamette/Lower ColumbiaRiver anadromous salmon ESUs do not yet exist, but viability criteria have been established andguide the framework of the species characterizations presented in Section 3.2.4 (seeAppendix A).
Bull Trout. The Willamette Basin is a designated bull trout recovery unit. A draft recovery planexists for bull trout populations and will provide the framework for discussion of status, trends,

DRAFT WILLAMETTE SUBBASIN PLAN
3-50 CH 3 ASSESSMENT.DOC
limiting factors, and recovery strategies. Recovery criteria in the draft plan call for populations inthe Clackamas, McKenzie, and Middle Fork Willamette subbasins (U.S. Fish and WildlifeService, 2003). Recovery criteria for bull trout are presented in Appendix B.
Oregon Chub. USFWS adopted a recovery plan for Oregon Chub in 1998. The recovery plancriteria for delisting require the existence of 20 populations, with at least 500 adults in eachpopulation and at least four populations located in each of the three subbasins: the WillametteRiver mainstem, Middle Fork Willamette, and Santiam (U.S. Fish and Wildlife Service, 1998).Recovery criteria for Oregon chub are presented in Appendix C.
Table 3-17: Threatened and Endangered Fish Species of the Willamette Basin*
Fish Common Name
Subbasin Occurrence(Historical or Current
Populations)FederalStatus State Status
Oncorhynchus tshawytscha Chinook salmon
Lower Columbia ESU Fall Chinook Clackamas Threatened Sensitive-critical
Upper Willamette RiverESU
Spring Chinook Clackamas, Molalla, NorthSantiam, South Santiam,Calapooia, McKenzie,Middle Fork
Threatened
Oncorhynchus keta
Columbia River ESU
Chum salmon Clackamas Threatened Sensitive-critical
Oncorhynchus mykiss Steelhead
Lower Columbia River ESU Winter steelhead Clackamas Threatened Sensitive-critical
Upper Willamette RiverESU
Winter steelhead Molalla, North Santiam,South Santiam, Calapooia
Threatened Sensitive-critical
Salvelinus confluentus Bull trout McKenzie, Middle Fork,Clackamas, North Santiam,South Santiam
Threatened Sensitive-critical
Oregonichthys cramer) Oregon chub Clackamas, North Santiam,South Santiam, McKenzie,Middle Fork, Coast Fork,Long Tom, Marys,Luckiamute, Mainstem
Endangered Sensitive-critical
*Includes both state and federal designations of threatened, endangered, and sensitive species.
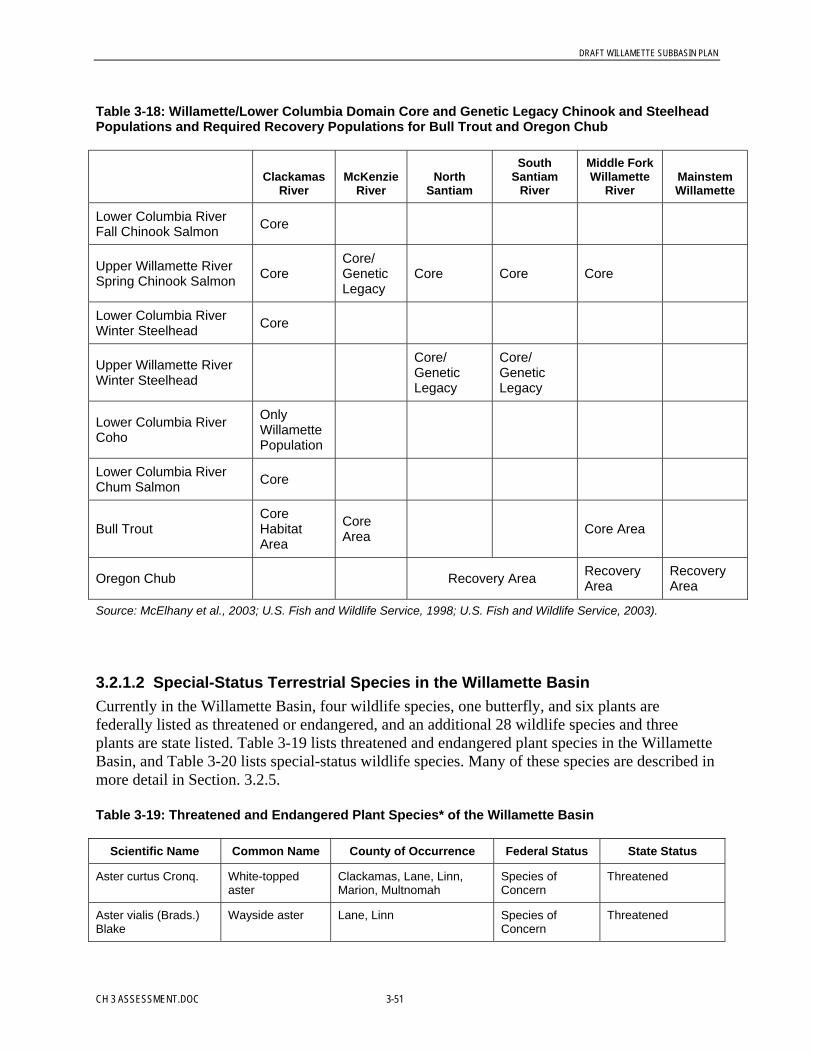
DRAFT WILLAMETTE SUBBASIN PLAN
CH 3 ASSESSMENT.DOC 3-51
Table 3-18: Willamette/Lower Columbia Domain Core and Genetic Legacy Chinook and SteelheadPopulations and Required Recovery Populations for Bull Trout and Oregon Chub
ClackamasRiver
McKenzieRiver
NorthSantiam
SouthSantiam
River
Middle ForkWillamette
RiverMainstemWillamette
Lower Columbia RiverFall Chinook Salmon Core
Upper Willamette RiverSpring Chinook Salmon Core
Core/GeneticLegacy
Core Core Core
Lower Columbia RiverWinter Steelhead Core
Upper Willamette RiverWinter Steelhead
Core/GeneticLegacy
Core/GeneticLegacy
Lower Columbia RiverCoho
OnlyWillamettePopulation
Lower Columbia RiverChum Salmon Core
Bull TroutCoreHabitatArea
CoreArea Core Area
Oregon Chub Recovery Area RecoveryArea
RecoveryArea
Source: McElhany et al., 2003; U.S. Fish and Wildlife Service, 1998; U.S. Fish and Wildlife Service, 2003).
3.2.1.2 Special-Status Terrestrial Species in the Willamette BasinCurrently in the Willamette Basin, four wildlife species, one butterfly, and six plants arefederally listed as threatened or endangered, and an additional 28 wildlife species and threeplants are state listed. Table 3-19 lists threatened and endangered plant species in the WillametteBasin, and Table 3-20 lists special-status wildlife species. Many of these species are described inmore detail in Section. 3.2.5.
Table 3-19: Threatened and Endangered Plant Species* of the Willamette Basin
Scientific Name Common Name County of Occurrence Federal Status State Status
Aster curtus Cronq. White-toppedaster
Clackamas, Lane, Linn,Marion, Multnomah
Species ofConcern
Threatened
Aster vialis (Brads.)Blake
Wayside aster Lane, Linn Species ofConcern
Threatened

DRAFT WILLAMETTE SUBBASIN PLAN
3-52 CH 3 ASSESSMENT.DOC
Table 3-19: Threatened and Endangered Plant Species* of the Willamette Basin
Scientific Name Common Name County of Occurrence Federal Status State Status
Castillejalevisecta(Greenm.)
Goldenpaintbrush
Linn, Marion, Multnomah Threatened Endangered
Delphiniumleucophaeum Greene
White rocklarkspur
Clackamas, Marion,Multnomah, Washington,Yamhill
Species ofConcern
Endangered
Delphiniumpavonaceum Ewan
Peacock larkspur Benton, Lane, Linn, Marion,Polk, Washington, Yamhill
Species ofConcern
Endangered
Erigeron decumbensNutt. Var. decumbens
Willamette Valleydaisy
Benton, Clackamas, Lane,Linn, Marion, Polk,Washington, Yamhill
Endangered Endangered
Howellia aquatilis A.Gray
Howellia Clackamas, Marion,Multnomah
Threatened -
Lomatium bradshawii Bradshaw’slomatium
Benton, Lane, Linn, Marion Endangered Endangered
Lupinus sulphureusDouglas ssp. Kinkaidii
Kinkaid’s lupine Benton, Lane, Linn, Marion,Polk, Washington, Yamhill
Threatened Threatened
Sidalcea nelsonianaPiper
Nelson’s sidalcea Benton, Linn, Marion, Polk,Washington, Yamhill
Threatened Threatened
* Includes both state and federal designations of threatened, endangered, and species of concern.Source: Willamette Restoration Initiative, 2001.
Table 3-20: Threatened and Endangered Wildlife Species and Species of Concern in the WillametteBasin
CommonName
FederalStatusOregon
StateStatusOregon
Partners inFlight 1998-
1999ContinentalWatchlist
Partners inFlight Ranking
by Super-Region, draft
2002
OregonPartnersin Flight
Priority &Focal
Species
BreedingBird SurveyWillamette
BreedingBird
SurveyNPAC
AcornWoodpecker
PIF
AmericanDipper
PIF
AmericanGoldfinch
D D
AmericanKestrel
PIF
AmericanMarten
SS-V
Bald Eagle FT ST

DRAFT WILLAMETTE SUBBASIN PLAN
CH 3 ASSESSMENT.DOC 3-53
Table 3-20: Threatened and Endangered Wildlife Species and Species of Concern in the WillametteBasin
CommonName
FederalStatusOregon
StateStatusOregon
Partners inFlight 1998-
1999ContinentalWatchlist
Partners inFlight Ranking
by Super-Region, draft
2002
OregonPartnersin Flight
Priority &Focal
Species
BreedingBird SurveyWillamette
BreedingBird
SurveyNPAC
Band-TailedPigeon
PIF MA (Pacific) PIF D
Barrow’sGoldeneye
SS-US
Black Swift SS-PN PIF IM (Pacific,Intermountain
West)
PIF
Black-BackedWoodpecker
SS-C PR (NorthernForests)
PIF
Black-HeadedGrosbeak
PIF
Black-ThroatedGray Warbler
MO (Pacific) PIF
Blue Grouse MA (Pacific,Intermountain
West)
Brown Creeper PIF
Bufflehead SS-US
Bullock’s Oriole PIF
Bushtit PIF D
CascadeTorrentSalamander
SS-V
Cascades Frog SS-V
Cassin’s Verio D
Chestnut-BackedChickadee
PR (Pacific)
ChippingSparrow
PIF
Clark’sNutcracker
PR(Intermountain
West)
PIF
CloudedSalamander
SS-US

DRAFT WILLAMETTE SUBBASIN PLAN
3-54 CH 3 ASSESSMENT.DOC
Table 3-20: Threatened and Endangered Wildlife Species and Species of Concern in the WillametteBasin
CommonName
FederalStatusOregon
StateStatusOregon
Partners inFlight 1998-
1999ContinentalWatchlist
Partners inFlight Ranking
by Super-Region, draft
2002
OregonPartnersin Flight
Priority &Focal
Species
BreedingBird SurveyWillamette
BreedingBird
SurveyNPAC
CommonNighthawk
SS-C
Common Snipe D
CommonYellowthroat
D
DownyWoodpecker
PIF D
DuskyFlycatcher
MA(Intermountain
West)
PIF
Fisher SS-C
Foothill Yellow-legged Frog
SS-V
Fox Sparrow PIF
Fringed Myotis SS-V
GrasshopperSparrow
SS-V/PN
MA (Prairies) PIF
Gray Jay PR (NorthernForests)
D
Great BlueHeron
D
Great Gray Owl SS-V PIF
Hammond’sFlycatcher
PIF
Harlequin Duck SS-US
Hermit Thrush PIF
Hermit Warbler PIF MO (Pacific) PIF
Horned Lark FC SS-C PIF
House Wren PIF D
Hutton’s Vireo PIF
Killdeer D
Lark Sparrow PIF
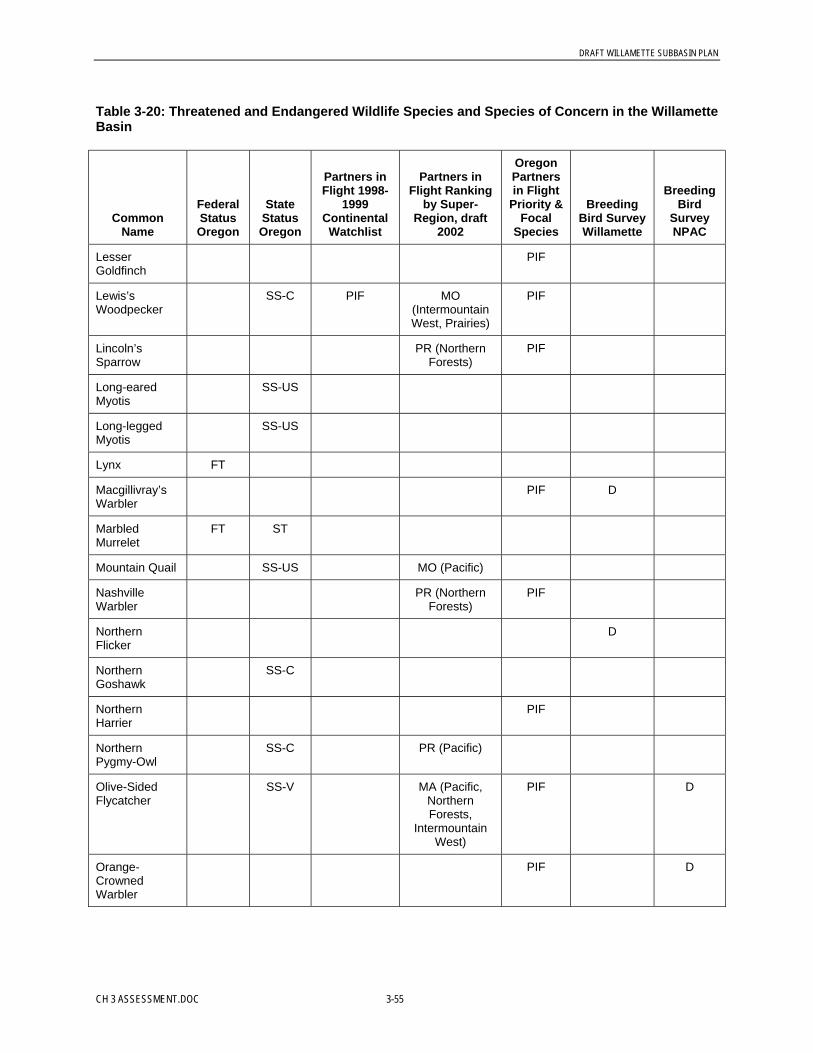
DRAFT WILLAMETTE SUBBASIN PLAN
CH 3 ASSESSMENT.DOC 3-55
Table 3-20: Threatened and Endangered Wildlife Species and Species of Concern in the WillametteBasin
CommonName
FederalStatusOregon
StateStatusOregon
Partners inFlight 1998-
1999ContinentalWatchlist
Partners inFlight Ranking
by Super-Region, draft
2002
OregonPartnersin Flight
Priority &Focal
Species
BreedingBird SurveyWillamette
BreedingBird
SurveyNPAC
LesserGoldfinch
PIF
Lewis’sWoodpecker
SS-C PIF MO(IntermountainWest, Prairies)
PIF
Lincoln’sSparrow
PR (NorthernForests)
PIF
Long-earedMyotis
SS-US
Long-leggedMyotis
SS-US
Lynx FT
Macgillivray’sWarbler
PIF D
MarbledMurrelet
FT ST
Mountain Quail SS-US MO (Pacific)
NashvilleWarbler
PR (NorthernForests)
PIF
NorthernFlicker
D
NorthernGoshawk
SS-C
NorthernHarrier
PIF
NorthernPygmy-Owl
SS-C PR (Pacific)
Olive-SidedFlycatcher
SS-V MA (Pacific,NorthernForests,
IntermountainWest)
PIF D
Orange-CrownedWarbler
PIF D
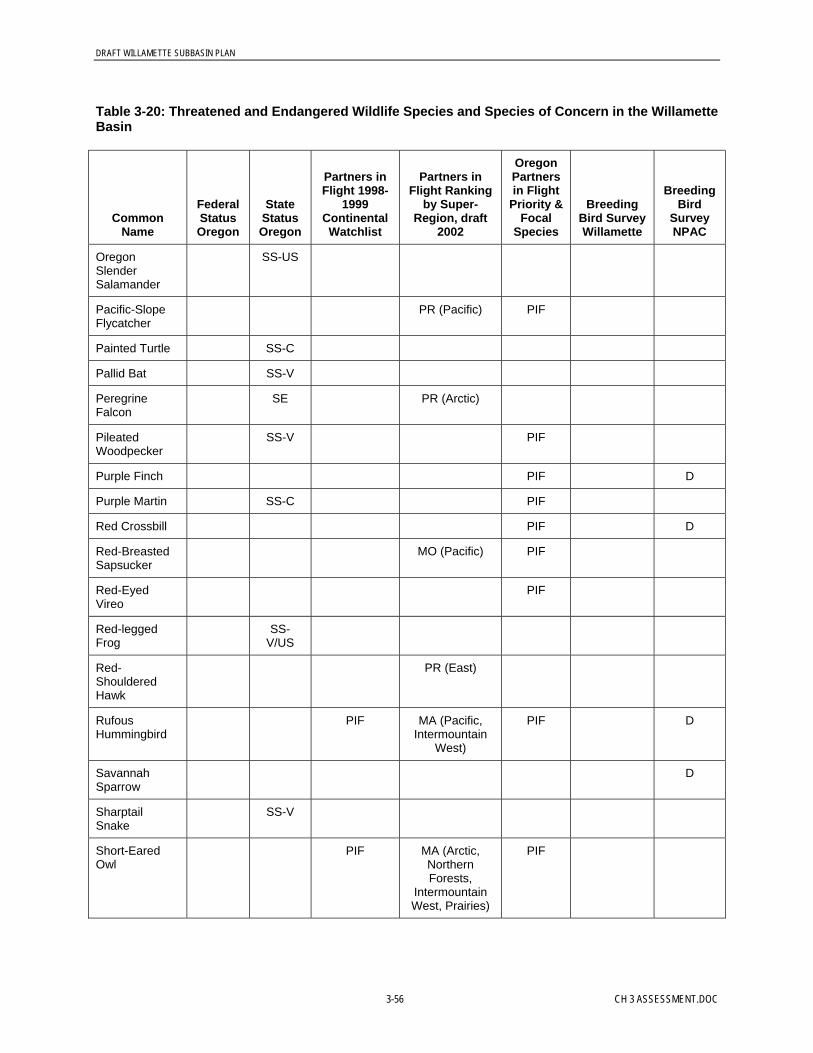
DRAFT WILLAMETTE SUBBASIN PLAN
3-56 CH 3 ASSESSMENT.DOC
Table 3-20: Threatened and Endangered Wildlife Species and Species of Concern in the WillametteBasin
CommonName
FederalStatusOregon
StateStatusOregon
Partners inFlight 1998-
1999ContinentalWatchlist
Partners inFlight Ranking
by Super-Region, draft
2002
OregonPartnersin Flight
Priority &Focal
Species
BreedingBird SurveyWillamette
BreedingBird
SurveyNPAC
OregonSlenderSalamander
SS-US
Pacific-SlopeFlycatcher
PR (Pacific) PIF
Painted Turtle SS-C
Pallid Bat SS-V
PeregrineFalcon
SE PR (Arctic)
PileatedWoodpecker
SS-V PIF
Purple Finch PIF D
Purple Martin SS-C PIF
Red Crossbill PIF D
Red-BreastedSapsucker
MO (Pacific) PIF
Red-EyedVireo
PIF
Red-leggedFrog
SS-V/US
Red-ShoulderedHawk
PR (East)
RufousHummingbird
PIF MA (Pacific,Intermountain
West)
PIF D
SavannahSparrow
D
SharptailSnake
SS-V
Short-EaredOwl
PIF MA (Arctic,NorthernForests,
IntermountainWest, Prairies)
PIF
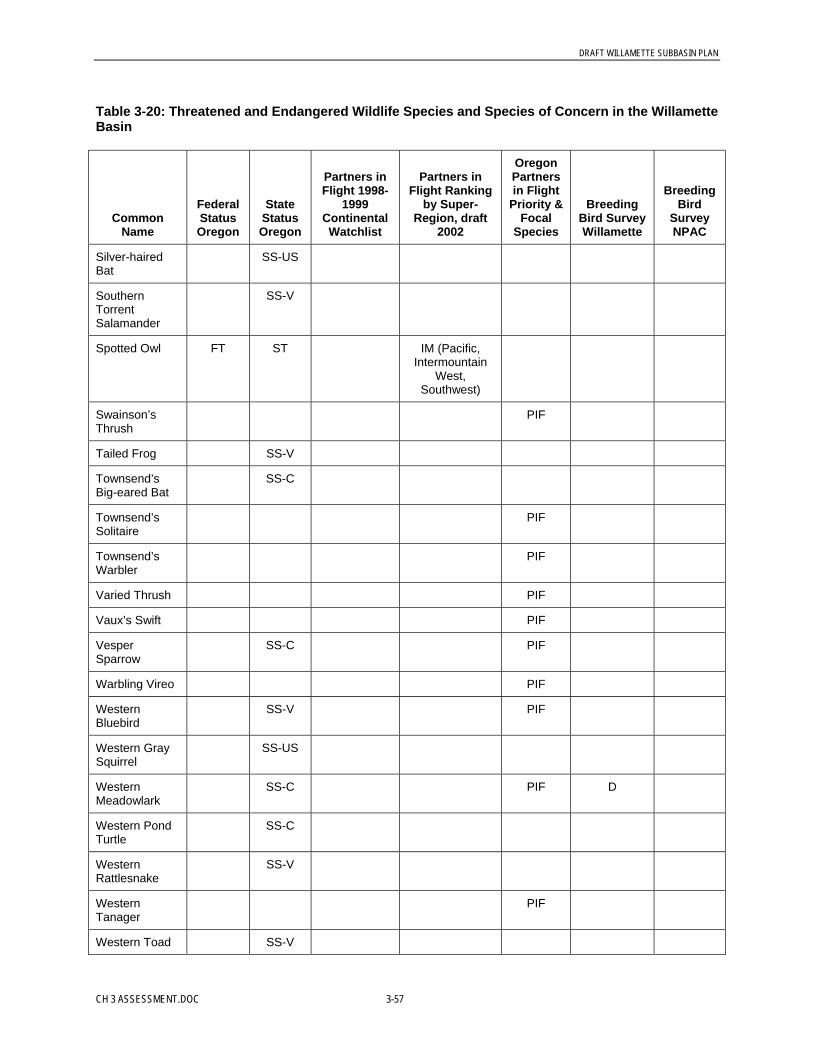
DRAFT WILLAMETTE SUBBASIN PLAN
CH 3 ASSESSMENT.DOC 3-57
Table 3-20: Threatened and Endangered Wildlife Species and Species of Concern in the WillametteBasin
CommonName
FederalStatusOregon
StateStatusOregon
Partners inFlight 1998-
1999ContinentalWatchlist
Partners inFlight Ranking
by Super-Region, draft
2002
OregonPartnersin Flight
Priority &Focal
Species
BreedingBird SurveyWillamette
BreedingBird
SurveyNPAC
Silver-hairedBat
SS-US
SouthernTorrentSalamander
SS-V
Spotted Owl FT ST IM (Pacific,Intermountain
West,Southwest)
Swainson’sThrush
PIF
Tailed Frog SS-V
Townsend’sBig-eared Bat
SS-C
Townsend’sSolitaire
PIF
Townsend’sWarbler
PIF
Varied Thrush PIF
Vaux’s Swift PIF
VesperSparrow
SS-C PIF
Warbling Vireo PIF
WesternBluebird
SS-V PIF
Western GraySquirrel
SS-US
WesternMeadowlark
SS-C PIF D
Western PondTurtle
SS-C
WesternRattlesnake
SS-V
WesternTanager
PIF
Western Toad SS-V
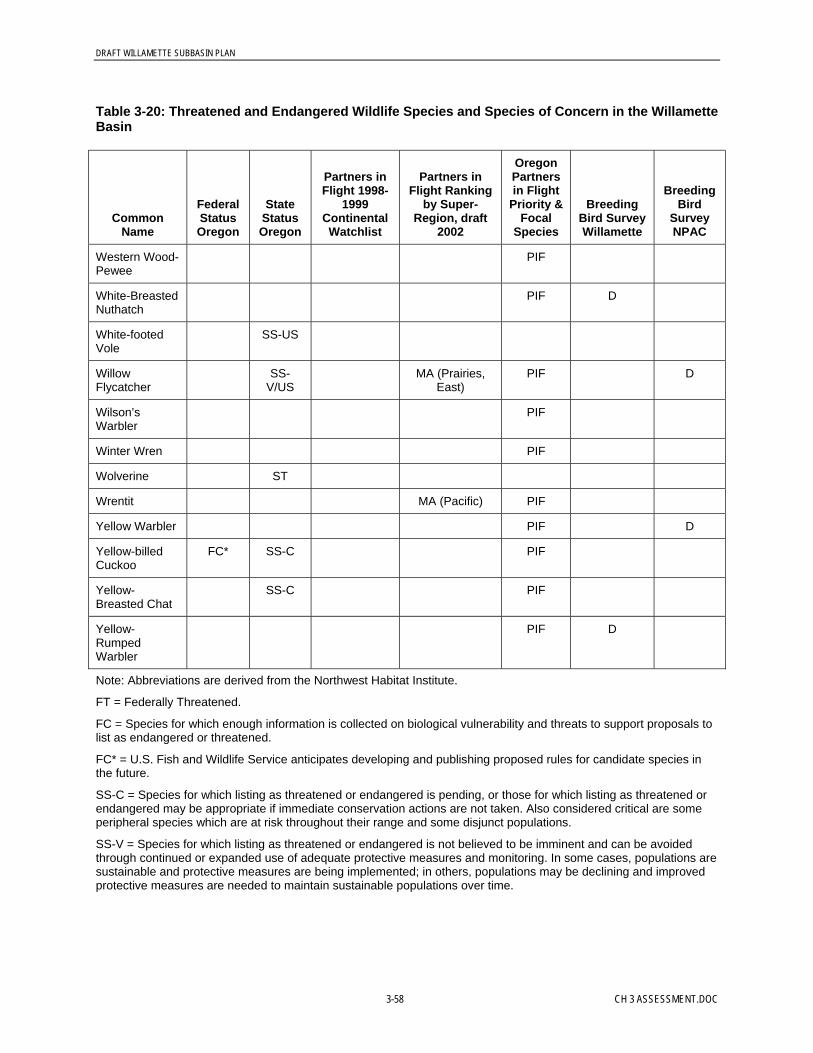
DRAFT WILLAMETTE SUBBASIN PLAN
3-58 CH 3 ASSESSMENT.DOC
Table 3-20: Threatened and Endangered Wildlife Species and Species of Concern in the WillametteBasin
CommonName
FederalStatusOregon
StateStatusOregon
Partners inFlight 1998-
1999ContinentalWatchlist
Partners inFlight Ranking
by Super-Region, draft
2002
OregonPartnersin Flight
Priority &Focal
Species
BreedingBird SurveyWillamette
BreedingBird
SurveyNPAC
Western Wood-Pewee
PIF
White-BreastedNuthatch
PIF D
White-footedVole
SS-US
WillowFlycatcher
SS-V/US
MA (Prairies,East)
PIF D
Wilson’sWarbler
PIF
Winter Wren PIF
Wolverine ST
Wrentit MA (Pacific) PIF
Yellow Warbler PIF D
Yellow-billedCuckoo
FC* SS-C PIF
Yellow-Breasted Chat
SS-C PIF
Yellow-RumpedWarbler
PIF D
Note: Abbreviations are derived from the Northwest Habitat Institute.
FT = Federally Threatened.
FC = Species for which enough information is collected on biological vulnerability and threats to support proposals tolist as endangered or threatened.
FC* = U.S. Fish and Wildlife Service anticipates developing and publishing proposed rules for candidate species inthe future.
SS-C = Species for which listing as threatened or endangered is pending, or those for which listing as threatened orendangered may be appropriate if immediate conservation actions are not taken. Also considered critical are someperipheral species which are at risk throughout their range and some disjunct populations.
SS-V = Species for which listing as threatened or endangered is not believed to be imminent and can be avoidedthrough continued or expanded use of adequate protective measures and monitoring. In some cases, populations aresustainable and protective measures are being implemented; in others, populations may be declining and improvedprotective measures are needed to maintain sustainable populations over time.

DRAFT WILLAMETTE SUBBASIN PLAN
CH 3 ASSESSMENT.DOC 3-59
Table 3-20: Threatened and Endangered Wildlife Species and Species of Concern in the WillametteBasin
CommonName
FederalStatusOregon
StateStatusOregon
Partners inFlight 1998-
1999ContinentalWatchlist
Partners inFlight Ranking
by Super-Region, draft
2002
OregonPartnersin Flight
Priority &Focal
Species
BreedingBird SurveyWillamette
BreedingBird
SurveyNPAC
SS-PN = Peripheral species refer to those whose Oregon populations are on the edge of their range. Naturally rarespecies are those which had low population numbers historically in Oregon because of naturally limiting factors.Maintaining the status quo is a minimum necessity. Disjunct populations of several species which occur in Oregonshould not be confused with peripheral species.
SS-V/PN = Species has a combined status for definitions, please see above.
SS-US = Species for which status is unclear. Species may be susceptible to population decline of sufficientmagnitude to qualify for endangered, threatened, critical or vulnerable status, but scientific study would be neededbefore a judgment can be made.
SS-V/US = Species has a combined status: for definitions, please see above.
SE = State Endangered.
ST = State Threatened.
SS = State Sensitive.
SC = Special Concern.
PIF = Partners in Flight.
D = Declining.
3.2.1.3 Other Species of ImportanceMany native species were central to tribal life. Table 3-21 lists species that have been historicallydocumented as important resources throughout the ceded lands. This is followed by a descriptionof lamprey, a tribally significant aquatic species found in the Willamette Basin.
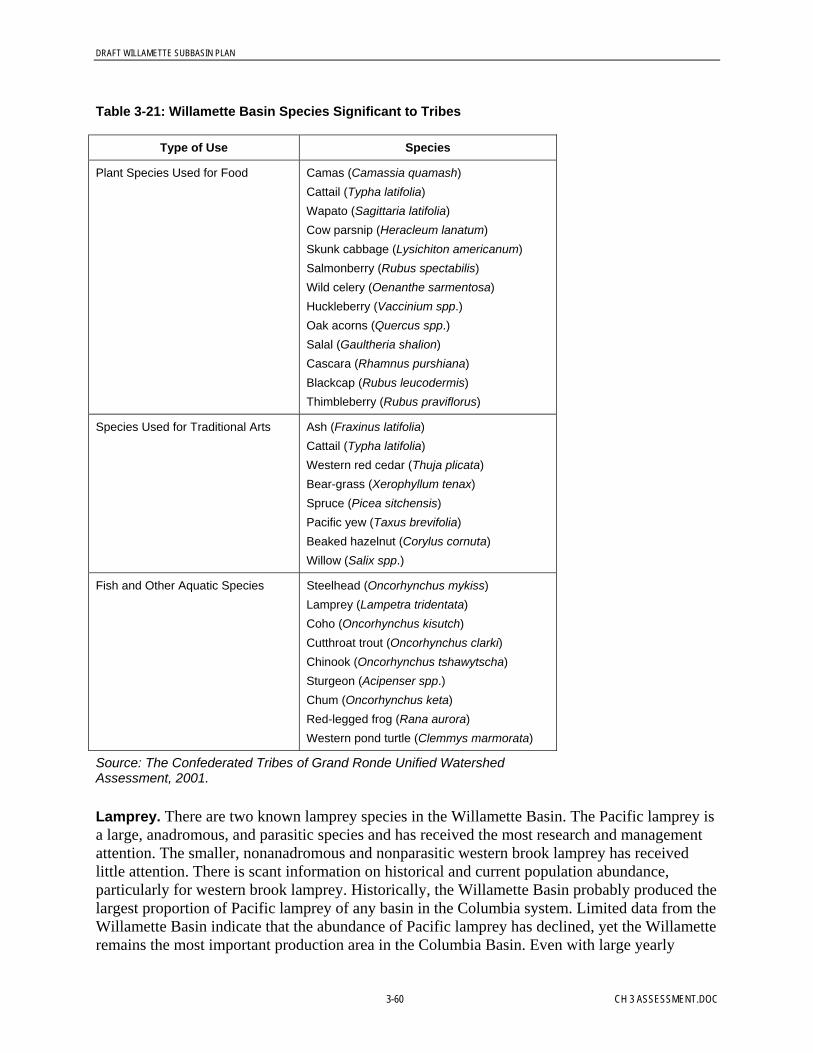
DRAFT WILLAMETTE SUBBASIN PLAN
3-60 CH 3 ASSESSMENT.DOC
Table 3-21: Willamette Basin Species Significant to Tribes
Type of Use Species
Plant Species Used for Food Camas (Camassia quamash)Cattail (Typha latifolia)Wapato (Sagittaria latifolia)Cow parsnip (Heracleum lanatum)Skunk cabbage (Lysichiton americanum)Salmonberry (Rubus spectabilis)Wild celery (Oenanthe sarmentosa)Huckleberry (Vaccinium spp.)Oak acorns (Quercus spp.)Salal (Gaultheria shalion)Cascara (Rhamnus purshiana)Blackcap (Rubus leucodermis)Thimbleberry (Rubus praviflorus)
Species Used for Traditional Arts Ash (Fraxinus latifolia)Cattail (Typha latifolia)Western red cedar (Thuja plicata)Bear-grass (Xerophyllum tenax)Spruce (Picea sitchensis)Pacific yew (Taxus brevifolia)Beaked hazelnut (Corylus cornuta)Willow (Salix spp.)
Fish and Other Aquatic Species Steelhead (Oncorhynchus mykiss)Lamprey (Lampetra tridentata)Coho (Oncorhynchus kisutch)Cutthroat trout (Oncorhynchus clarki)Chinook (Oncorhynchus tshawytscha)Sturgeon (Acipenser spp.)Chum (Oncorhynchus keta)Red-legged frog (Rana aurora)Western pond turtle (Clemmys marmorata)
Source: The Confederated Tribes of Grand Ronde Unified WatershedAssessment, 2001.
Lamprey. There are two known lamprey species in the Willamette Basin. The Pacific lamprey isa large, anadromous, and parasitic species and has received the most research and managementattention. The smaller, nonanadromous and nonparasitic western brook lamprey has receivedlittle attention. There is scant information on historical and current population abundance,particularly for western brook lamprey. Historically, the Willamette Basin probably produced thelargest proportion of Pacific lamprey of any basin in the Columbia system. Limited data from theWillamette Basin indicate that the abundance of Pacific lamprey has declined, yet the Willametteremains the most important production area in the Columbia Basin. Even with large yearly
DRAFT WILLAMETTE SUBBASIN PLAN
CH 3 ASSESSMENT.DOC 3-61
fluctuations, it appears that more lamprey pass over Willamette Fall annually than are counted atBonneville Dam (Kostow, 2002). Harvest of Pacific lamprey at Willamette Falls provides thebest estimate of trends in Pacific lamprey abundance. Hundreds of thousands of adult lampreywere harvested at Willamette Falls during the 1940s and early 1950s, and it is unlikely that thisnumber currently passes the Falls (Kostow, 2002).
There have been no systematic inventories of lamprey distribution within the Willamette Basin(Kostow, 2002). Most observations of lamprey have been incidental observations noted duringstream habitat inventories or winter steelhead spawning surveys. Most observations are ofjuvenile lamprey (ammocoetes). Because ammocoetes from western brook and Pacific lampreyare difficult to distinguish, distribution observations tend to generalize across the species. Theselimited observations suggest that lampreys are still well distributed through the Willamette CoastRange subbasins, in the Molalla/Pudding system, and in the lower Santiam and Calapooia rivers(Kostow, 2002). However, lamprey distribution has been substantially restricted as a result ofbarriers at U.S. Army Corps of Engineers dams, other dams, and fish passage barriers at culvertsand other structures (Kostow, 2002). There is evidence that lamprey cannot pass above many fishladders. For example, lampreys are restricted below the North Fork Dam on the ClackamasRiver, even though the dam is equipped with a functional fish ladder (Kostow, 2002). Waterdiversions and dams also can contribute to lamprey mortality during downstream migration(Kostow, 2002). Lampreys continue to be harvested (by permit) at Willamette Falls. In 2001about 15,500 lampreys were harvested (Kostow, 2002).
3.2.1.4 Introduced SpeciesThe annual cost imposed by nonnative (exotic) species in the United States is estimated to be$123 billion (Oregon Progress Board, 2000) Exotic species can compete with native species,change food sources for native and commercial species, impede forest regeneration, increaseunnatural wildland fire risks, and change the character of streambanks and streams.
Nearly 1,000 exotic species have been introduced to Oregon since about 1850. Some have beenintentionally introduced for sport, such as bass and wild turkey (by the state of Oregon) orbullfrogs and baitfish (by private individuals). Many exotic species are kept as pets or raisedcommercially, and these animals occasionally escape and establish breeding populations(examples include nutria, snapping turtles, and carp). Some species introduce themselves—forexample, English sparrows and European starlings flew into Oregon on their own, while walleyeswam into the Willamette from introductions in the Columbia. (Oregon Progress Board, 2000;Altman et al., 1997)
Introduced Aquatic Species. The Willamette River Basin has 31 native fish species and 30introduced fish species (see Figure 3-19 and Table 3-22). Generally, the greatest number ofspecies are found in the lower Willamette mainstem, and fewer species are found in headwaterstreams. More than half of the fish species present in the Portland Harbor have been introducedto the Willamette River system. It is likely that an increase in slow-moving, deep-water habitatcreated by dam construction and bank revetments has helped support many of the introducedspecies in the basin (Pacific Northwest Ecosystem Research Consortium, 2002; Altman et al.,1997).
Introduced fish tend to dominate in highly disturbed habitats, with the greatest diversity ofintroduced species being found in lowland rivers, lakes, and ponds that have warm water
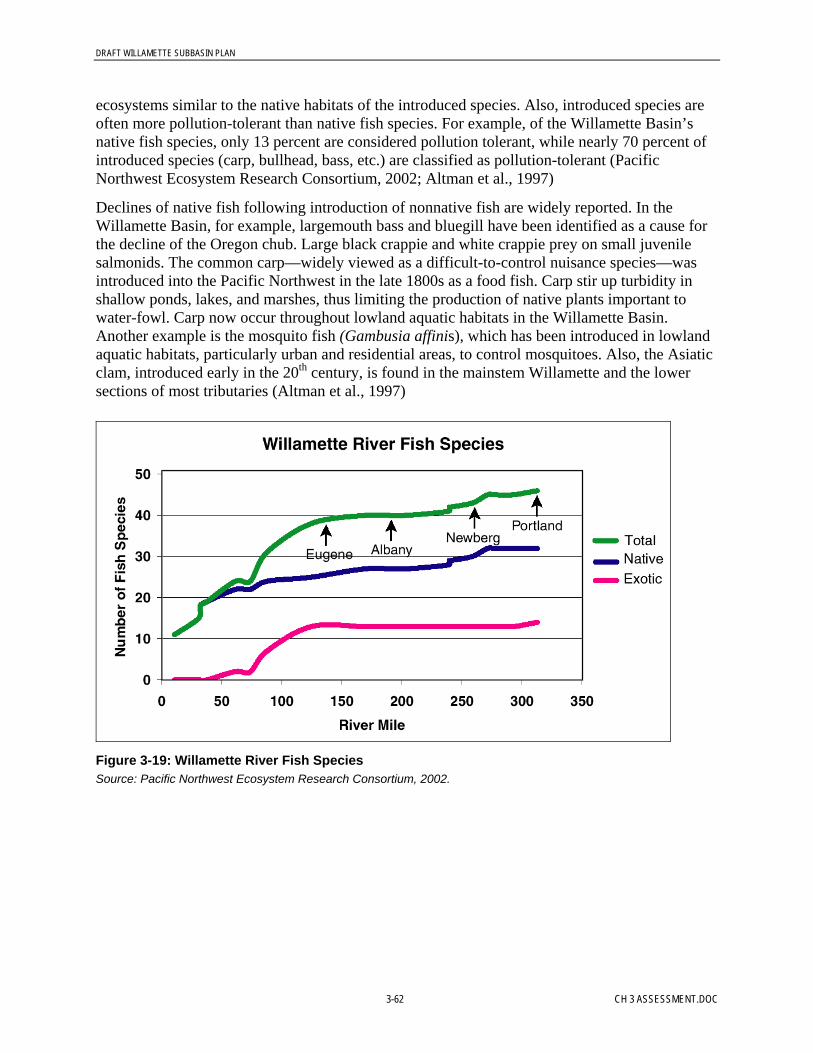
DRAFT WILLAMETTE SUBBASIN PLAN
3-62 CH 3 ASSESSMENT.DOC
ecosystems similar to the native habitats of the introduced species. Also, introduced species areoften more pollution-tolerant than native fish species. For example, of the Willamette Basin’snative fish species, only 13 percent are considered pollution tolerant, while nearly 70 percent ofintroduced species (carp, bullhead, bass, etc.) are classified as pollution-tolerant (PacificNorthwest Ecosystem Research Consortium, 2002; Altman et al., 1997)
Declines of native fish following introduction of nonnative fish are widely reported. In theWillamette Basin, for example, largemouth bass and bluegill have been identified as a cause forthe decline of the Oregon chub. Large black crappie and white crappie prey on small juvenilesalmonids. The common carp—widely viewed as a difficult-to-control nuisance species—wasintroduced into the Pacific Northwest in the late 1800s as a food fish. Carp stir up turbidity inshallow ponds, lakes, and marshes, thus limiting the production of native plants important towater-fowl. Carp now occur throughout lowland aquatic habitats in the Willamette Basin.Another example is the mosquito fish (Gambusia affinis), which has been introduced in lowlandaquatic habitats, particularly urban and residential areas, to control mosquitoes. Also, the Asiaticclam, introduced early in the 20th century, is found in the mainstem Willamette and the lowersections of most tributaries (Altman et al., 1997)
Figure 3-19: Willamette River Fish SpeciesSource: Pacific Northwest Ecosystem Research Consortium, 2002.
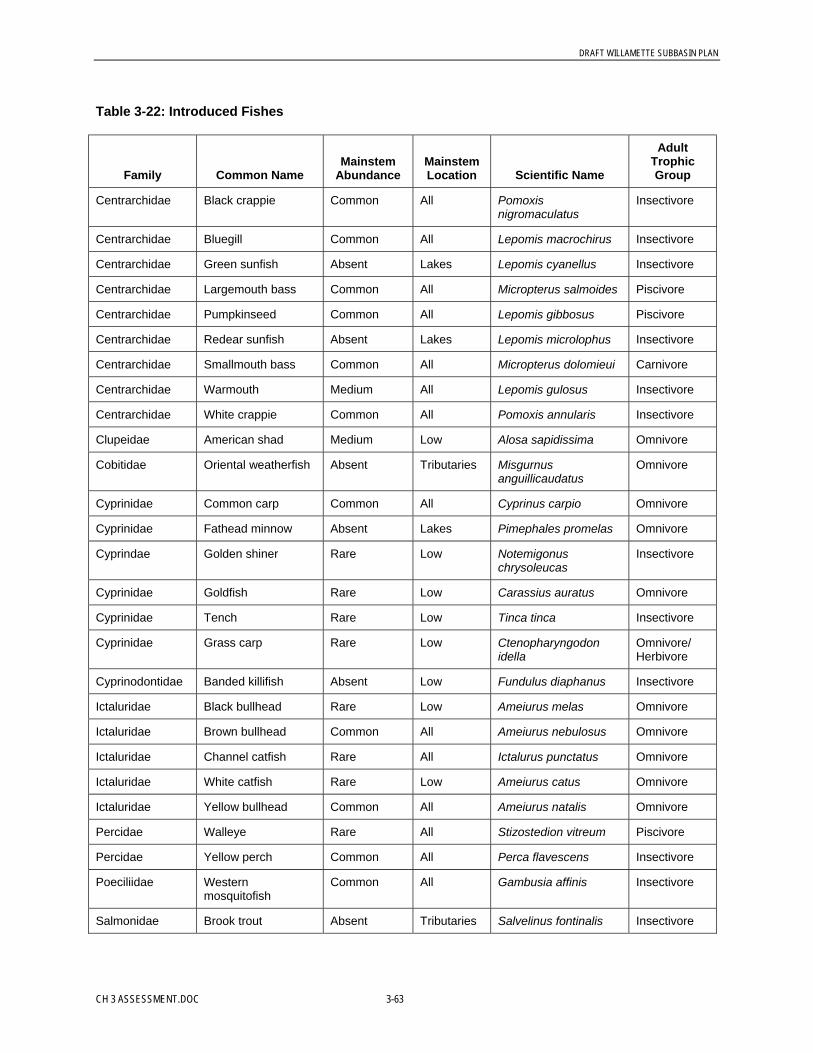
DRAFT WILLAMETTE SUBBASIN PLAN
CH 3 ASSESSMENT.DOC 3-63
Table 3-22: Introduced Fishes
Family Common NameMainstem
AbundanceMainstemLocation Scientific Name
AdultTrophicGroup
Centrarchidae Black crappie Common All Pomoxisnigromaculatus
Insectivore
Centrarchidae Bluegill Common All Lepomis macrochirus Insectivore
Centrarchidae Green sunfish Absent Lakes Lepomis cyanellus Insectivore
Centrarchidae Largemouth bass Common All Micropterus salmoides Piscivore
Centrarchidae Pumpkinseed Common All Lepomis gibbosus Piscivore
Centrarchidae Redear sunfish Absent Lakes Lepomis microlophus Insectivore
Centrarchidae Smallmouth bass Common All Micropterus dolomieui Carnivore
Centrarchidae Warmouth Medium All Lepomis gulosus Insectivore
Centrarchidae White crappie Common All Pomoxis annularis Insectivore
Clupeidae American shad Medium Low Alosa sapidissima Omnivore
Cobitidae Oriental weatherfish Absent Tributaries Misgurnusanguillicaudatus
Omnivore
Cyprinidae Common carp Common All Cyprinus carpio Omnivore
Cyprinidae Fathead minnow Absent Lakes Pimephales promelas Omnivore
Cyprindae Golden shiner Rare Low Notemigonuschrysoleucas
Insectivore
Cyprinidae Goldfish Rare Low Carassius auratus Omnivore
Cyprinidae Tench Rare Low Tinca tinca Insectivore
Cyprinidae Grass carp Rare Low Ctenopharyngodonidella
Omnivore/Herbivore
Cyprinodontidae Banded killifish Absent Low Fundulus diaphanus Insectivore
Ictaluridae Black bullhead Rare Low Ameiurus melas Omnivore
Ictaluridae Brown bullhead Common All Ameiurus nebulosus Omnivore
Ictaluridae Channel catfish Rare All Ictalurus punctatus Omnivore
Ictaluridae White catfish Rare Low Ameiurus catus Omnivore
Ictaluridae Yellow bullhead Common All Ameiurus natalis Omnivore
Percidae Walleye Rare All Stizostedion vitreum Piscivore
Percidae Yellow perch Common All Perca flavescens Insectivore
Poeciliidae Westernmosquitofish
Common All Gambusia affinis Insectivore
Salmonidae Brook trout Absent Tributaries Salvelinus fontinalis Insectivore
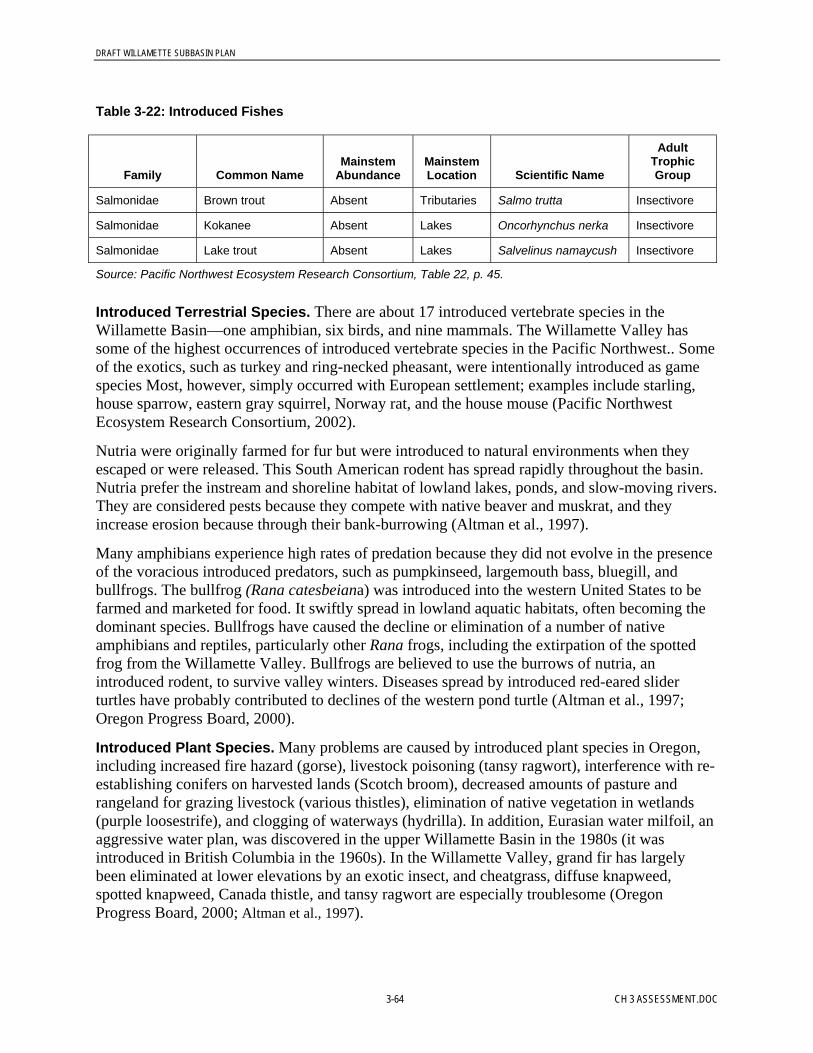
DRAFT WILLAMETTE SUBBASIN PLAN
3-64 CH 3 ASSESSMENT.DOC
Table 3-22: Introduced Fishes
Family Common NameMainstem
AbundanceMainstemLocation Scientific Name
AdultTrophicGroup
Salmonidae Brown trout Absent Tributaries Salmo trutta Insectivore
Salmonidae Kokanee Absent Lakes Oncorhynchus nerka Insectivore
Salmonidae Lake trout Absent Lakes Salvelinus namaycush Insectivore
Source: Pacific Northwest Ecosystem Research Consortium, Table 22, p. 45.
Introduced Terrestrial Species. There are about 17 introduced vertebrate species in theWillamette Basin—one amphibian, six birds, and nine mammals. The Willamette Valley hassome of the highest occurrences of introduced vertebrate species in the Pacific Northwest.. Someof the exotics, such as turkey and ring-necked pheasant, were intentionally introduced as gamespecies Most, however, simply occurred with European settlement; examples include starling,house sparrow, eastern gray squirrel, Norway rat, and the house mouse (Pacific NorthwestEcosystem Research Consortium, 2002).
Nutria were originally farmed for fur but were introduced to natural environments when theyescaped or were released. This South American rodent has spread rapidly throughout the basin.Nutria prefer the instream and shoreline habitat of lowland lakes, ponds, and slow-moving rivers.They are considered pests because they compete with native beaver and muskrat, and theyincrease erosion because through their bank-burrowing (Altman et al., 1997).
Many amphibians experience high rates of predation because they did not evolve in the presenceof the voracious introduced predators, such as pumpkinseed, largemouth bass, bluegill, andbullfrogs. The bullfrog (Rana catesbeiana) was introduced into the western United States to befarmed and marketed for food. It swiftly spread in lowland aquatic habitats, often becoming thedominant species. Bullfrogs have caused the decline or elimination of a number of nativeamphibians and reptiles, particularly other Rana frogs, including the extirpation of the spottedfrog from the Willamette Valley. Bullfrogs are believed to use the burrows of nutria, anintroduced rodent, to survive valley winters. Diseases spread by introduced red-eared sliderturtles have probably contributed to declines of the western pond turtle (Altman et al., 1997;Oregon Progress Board, 2000).
Introduced Plant Species. Many problems are caused by introduced plant species in Oregon,including increased fire hazard (gorse), livestock poisoning (tansy ragwort), interference with re-establishing conifers on harvested lands (Scotch broom), decreased amounts of pasture andrangeland for grazing livestock (various thistles), elimination of native vegetation in wetlands(purple loosestrife), and clogging of waterways (hydrilla). In addition, Eurasian water milfoil, anaggressive water plan, was discovered in the upper Willamette Basin in the 1980s (it wasintroduced in British Columbia in the 1960s). In the Willamette Valley, grand fir has largelybeen eliminated at lower elevations by an exotic insect, and cheatgrass, diffuse knapweed,spotted knapweed, Canada thistle, and tansy ragwort are especially troublesome (OregonProgress Board, 2000; Altman et al., 1997).

DRAFT WILLAMETTE SUBBASIN PLAN
CH 3 ASSESSMENT.DOC 3-65
3.2.2 Scientific Foundation for Assessment of Willamette River Aquatic HabitatsDevelopment of the assessment elements of this Willamette Subbasin Plan was guided by aconceptual, scientific foundation that grew, in part, out of the work of the Northwest Power andConservation Council and its Independent Scientific Group (Northwest Power Planning Council,2000).
In 1996, the Northwest Power and Conservation Council charged its Independent ScientificGroup (ISG, now called the Independent Scientific Advisory Board) to review the scientific basisfor the NPCC’s Fish and Wildlife Program. The ISG review, entitled Return to the River, notedthat NPCC’s program was a collection of ideas and solutions without a coherent scientific basis(Independent Scientific Group, 2000). In other words, there were no grounds for evaluating thescientific rationale for potential restoration actions or their efficacy in achieving identifiedrecovery goals.
In response, NPCC developed a scientific foundation for restoration actions—a foundation thatwas intended to provide an explicit scientific link between identified goals and actions within aframework of adaptive management. Elements of the scientific foundation were incorporatedinto NPCC’s 2000 Columbia River Basin Fish and Wildlife Program (Northwest Power PlanningCouncil, 2000). Among other things, the scientific foundation described a new conceptualfoundation for salmon management in the Columbia River. This conceptual foundation wasbased on the premise that goals for specific species, such as salmon, can only be achieved bymanaging those species’ ecosystems to provide needed environmental conditions. This was thebasis for NPCC’s assertion that its program was “habitat-based” and that it intended to rebuildfish runs and wildlife populations by “protecting, mitigating and restoring habitats and biologicalsystems.”
NPCC’s conceptual foundation has two key elements that guided the construction of this plan forthe Willamette Basin. First, NPCC defined the concept of biological objectives as the basis forshaping and evaluating measures incorporated into its Columbia River Basin Fish and WildlifeProgram (Northwest Power Planning Council, 2000). Second, NPCC defined a set of principlesthat describe the scientific basis for how species performance is controlled by their environment.During the development of this Willamette Subbasin Plan, NPCC’s definition of biologicalobjectives guided the overall approach to habitat assessment and management, while thescientific principles shaped the working hypothesis of the Willamette River system.
3.2.2.1 Application of NPCC’s Scientific Principles to the Willamette RiverSubbasin Plan
A key element of NPCC’s scientific foundation was a set of eight scientific principles that layout the scientific basis for NPCC’s habitat-based approach (Northwest Power Planning Council,2000). NPCC’s program states that “actions taken at the basin, province, and basin levels tofulfill [NPCC’s vision] should be consistent with, and based upon, these principles.” Thescientific principles recognize the fundamental relationship between species performance andtheir environments and argued against the “command and control” paradigm that guided fisheries

DRAFT WILLAMETTE SUBBASIN PLAN
3-66 CH 3 ASSESSMENT.DOC
management throughout much of the 20th century. The following is a description of how theworking hypothesis of this Willamette Subbasin Plan is structured around NPCC’s principles.2
1. The abundance, productivity, and diversity of organisms are integrally linked to thecharacteristics of their ecosystems.
An ecosystem is an organized complex of physical and biological components (Tansley,1935). Physical and biological elements such as minerals, soil, vegetation and animals self-organize into a system that captures and processes energy to produce the observed diversity,abundance and productivity of plant and animal species, including humans (Kauffman, 1993;Odum, 1993). The characteristics and abundance of individual species reflect theircoevolution with other species and their response to their environment. Because of thepervasive impact of human actions on ecological systems (Vitousek et al., 1997), achievinggoals for individual species of commercial, cultural or other human interest will requiremanaging human activities to support ecological processes (Christensen et al., 1996).
Although scientists may have an intuitive feel for what constitutes an ecosystem, manage-ment goals and actions frequently focus on individual species rather than on the species’ecosystems—the physical and biological systems that species are a part of, contribute to anddepend on. In the past, species of commercial and cultural concern have been given priority,with sporadic success. There is increasing recognition of the need for multiple speciesmanagement and the integration of land management with fish and wildlife management(Puchy and Marshall, 1993; Christensen et al., 1996; Dale et al., 2000). This meansrecognizing both the processes that form the habitats necessary for species (processes such aschannel dynamics and habitat connectivity) and the functions that species provide to theecosystem (such as input of organic matter, primary and secondary production and energyflow). For example, many of the flood control dams constructed in the upper WillametteRiver basin did not provide fish passage, thereby eliminating crucial nutrient cycling. Thecombination of suitable habitats and needed ecological functions combine to form theecosystems needed to provide the desired abundance and productivity of specific species.
Local climate, hydrology and geomorphologic factors as well as species interactions stronglyaffect ecological processes and the abundance and distribution of species at any one place(Dale et al., 2000). The life histories, physical features and diversity of individual species areshaped by climate, the physical structure of their habitat and biological interactions. Changein physical or biological features of the ecosystem, either natural or human-induced, affectsthe capacity, productivity and diversity of fish and wildlife species.
Implications. Management of species or ecological problems in isolation at best provides anincomplete picture and at worst misleads by not accounting for the context and mechanismsthat control species abundance, capacity and diversity, or the ecological processes thatsupport these. This principle notes the integral relationship between species and theirenvironment and the role that species themselves play in maintaining that environment. Itcouples ecological conditions with the productivity and abundance of species, includingthose of management interest.
2 Much of the language used to explain these principles is taken from the public review draft of the City of Portland’s Framework forIntegrated Management of Watershed Health (March 2004).

DRAFT WILLAMETTE SUBBASIN PLAN
CH 3 ASSESSMENT.DOC 3-67
Natural resource management, especially fisheries management, often isolates species fromtheir environment to insulate them from habitat loss or other impacts of human actions(Bottom, 1997). Insulating species in this manner neglects the role of biological and physicalfactors of the ecosystem—such as dynamic conditions of flow, habitat and water quality—inshaping individuals, populations and species through natural selection. In addition, thisapproach does not replace habitats themselves or the ecological functions that speciesprovide, such as supplying nutrients and food to other species. For salmon, hatcherieshistorically have not been successful. This is not to say that hatcheries do not have a role toplay in salmonid recovery, particularly during the stages in which habitat and ecologicalfunctions are being restored. Rather, hatchery operations should be conducted with anunderstanding of the contribution salmonids make to healthy functioning of the ecosystemand the reliance of salmonids on biological and physical characteristics of their environment.
Application to Assessment. The Willamette system consists of a diverse set of biologicaland environmental elements. For portions of the Willamette system, the authors of thisWillamette Subbasin Plan have brought these elements together within an EDT frameworkthat explicitly links environmental characteristics and biological performance. For EDT-treated watersheds, these relationships are embodied in the species-habitat rules in EDT. Forother watersheds, these linkages are made qualitatively through professional judgment basedon experience and literature review. It is expected that eventually the entire basin will becaptured in a common analytical framework.
Our assessment of aquatic habitat in the Willamette River has focused on spring Chinook,winter steelhead, cutthroat trout, bull trout, Oregon Chub, and Pacific lamprey; however,anadromous salmonids are the only species included in the EDT analytical framework.Anadromous salmonids are indicators of a particular type of the environment thatcharacterizes the normative condition for the Willamette system. The habitat requirements ofsalmon have been extensively documented and are captured in the habitat rating rules ofEDT. This allows us to construct explicit linkages between habitat and species performance.
2. Ecosystems are dynamic, resilient, and develop over time.
Although ecosystems have definable structures and characteristics, their behavior is highlydynamic, changing in response to internal and external factors (Dale et al., 2000). The systempresent today is the product of its geological, biological and human legacy. Natural cycles ofchange structure biological communities and affect species abundance and distribution(Beamish et al., 1999). Disturbance and change are normal ecological processes and areessential to the structure and maintenance of habitats (Bisson et al., 1997).
Disturbance can be the result of natural processes such as fire, flood or insect outbreaks, orthey can result from human activities, such as the creation of impervious surfaces,development of riparian zones, timber harvest or agriculture. Natural disturbance patternscreate a mosaic of habitats across the landscape and through time (Reeves et al., 1995). Atthe same time, ecosystems maintain characteristic features and support definablecommunities of organisms. Habitat-forming processes—which result from the underlyinggeology, climate and hydrology and species’ ecological functions—impart a degree ofresilience to the system, allowing it to accommodate change and maintain essentialcharacteristics (Holling, 1973). Once a disturbance dissipates, the ecosystem may come to

DRAFT WILLAMETTE SUBBASIN PLAN
3-68 CH 3 ASSESSMENT.DOC
resemble its previous condition, depending on the type and degree of disturbance and theecosystem’s resilience.
However, an ecosystem’s ability to absorb change and retain its original characteristics islimited (Holling, 1973; Reice et al., 1990). Human actions and natural events candramatically alter ecological systems such that the system is not destroyed but instead shiftsinto a new configuration in which different species are favored and new biological andphysical interactions develop. This is particularly true in urban ecosystems, wheredisturbance is essentially a continuous rather than episodic event and the resilience of theecosystem is compromised to the extent that it will not return to predisturbancecharacteristics even when the disturbance is reduced or eliminated.
A natural ecosystem will show describable, if not generally predictable, patterns of changeover time (Odum, 1969). For example, a forest, like other ecosystems, may appear stablewhen observed at one point in time, but it changes over longer time frames. Similarly, a lakeor stream matures to have a dramatically different ecological character at various points intime (Cummins et al., 1984). Natural disturbances can interrupt succession locally, leading toa mosaic of habitats across the landscape (Reeves et al., 1995). More widespread andpervasive disturbance, including many human activities, can stop or reset ecologicalsuccession patterns and prevent the formation of habitats and processes that may be essentialto the continuation and abundance of some species.
Many natural resource management actions are designed to control the environment, reducevariability, and achieve a stable and predictable yield from a highly dynamic system (Hollingand Meffe, 1996). For example, dams and other structures are designed to dampen seasonalvariation in water flow. In many developed areas, river and streambanks are stabilized anddiked to minimize out-of-channel flooding during high flow events. Fish hatcheries wereconceived, in part, to smooth out natural variation in fish populations and to sustain harvestover time (Bottom, 1997). Hatchery production and fish passage measures are timed andengineered to provide a predictable fish migration with minimal conflict with human uses ofthe river. Fires are suppressed, altering forest succession, species composition and thefrequency and severity of insect outbreaks (Quigley et al., 1996).
Implications. Natural resource management programs should anticipate and accommodateboth natural and human-induced change. This would be a departure from traditionalmanagement, which has attempted to freeze the system in a certain constant state and manageit for constant yields by not allowing natural change to occur. Expectations of constantabundance or yield from natural resources are unrealistic and ignore fundamental features ofecological systems. Similarly, efforts to protect only areas that currently possess desirableconditions, without considering the long-term, dynamic nature of ecosystems, will not resultin successful, comprehensive natural resource management. Natural patterns of disturbanceshould be recognized as events that develop and maintain a diversity of habitats. Efforts tostabilize the environment and reduce disturbance will fundamentally alter habitats to thedetriment of the abundance, productivity, spatial structure and diversity of species ofmanagement interest.
Given the limited resilience of ecosystems in urban areas, it is not realistic to expect a returnto predisturbance conditions. Nonetheless, ecological functions can be restored to somedegree. The challenge for urban areas in particular is to allow habitat-forming processes to

DRAFT WILLAMETTE SUBBASIN PLAN
CH 3 ASSESSMENT.DOC 3-69
occur in a built-out environment with high human population densities. The Johnson CreekRestoration Plan (City of Portland Bureau of Environmental Services 2001) is one exampleof an approach that has attempted to do this. The plan calls for buying properties alongJohnson Creek to provide flood storage in the floodplain, as well as create off-channel habitatfor salmonids. This approach came about as a result of a combination of factors, includingstrong public support, a history of failed flood control attempts, and increased regulatoryscrutiny by federal and state agencies as a result of the Endangered Species Act.
Application to Assessment. Our assessment is based on human development of theWillamette Basin from about 1850 to the present. This provides a basis for hypothesesregarding the effect of future conditions. Much work remains to analytically characterizestochastic and dynamic elements responsible for creation and maintenance of habitatcharacteristics.
3. Biological systems operate on various spatial and time scales that can be organizedhierarchically.
Ecosystems, landscapes, communities and populations are usefully described as hierarchiesof nested components (Allen and Hoekstra, 1992), with levels in the hierarchies distinguishedby different spatial and time scales. A higher level addresses larger areas that fluctuate overrelatively long time intervals, whereas lower levels encompass smaller areas and vary atgreater frequencies. For example, factors such as climate and geology might be addressed at aregional scale, hydrology and water quality might be addressed at the watershed scale andlocalized habitat components might be addressed on a local, site-specific scale. Expansiveecological patterns and processes constrain, and in turn reflect, localized patterns andprocesses (Wiens, 1989).
The appropriate hierarchy and scale to use for watershed management depend on thequestion asked (Levin, 1992). There is no single, intrinsically correct scale, only one thatusefully addresses the issue in question. Conditions at any given level reflect both thecumulative effect of actions at lower levels and the constraints imposed by higher levelfactors (Allen and Hoekstra, 1992). Therefore, to understand conditions at any particularlevel, it is necessary to consider the higher level constraints (the context) and the lower levelmechanisms, both of which influence conditions (Wiens, 1989). This suggests neither a top-down nor a bottom-up management approach but rather an integration of both.
Viewing ecosystems as hierarchies is useful in depicting the underlying structure ofecological components. Regional climates, for example, vary through time on scales rangingfrom millennial to interannual (Greenland, 1998). Disturbance regimes within ecosystemscan be described at a variety of spatial and temporal scales (Delcourt et al., 1983) that canaffect life history patterns and genetic structure (Wissmar and Simenstad, 1998). Frissell etal., (1986) describe a hierarchical classification system for aquatic habitats based onunderlying geomorphic hierarchies.
This principle also provides an ecologically based way to structure recovery efforts (Quigleyet al., 1996). As a necessary first step, the ecosystem is defined at the point in the ecologicalcontinuum appropriate to the problem to be solved. The ecosystem at that point reflects boththe characteristics of the features nested within it and higher level constraints onperformance.

DRAFT WILLAMETTE SUBBASIN PLAN
3-70 CH 3 ASSESSMENT.DOC
Implications. If ecosystems are viewed as nested hierarchies, it is necessary to defineappropriate scales for their management and study (Holling and Meffe, 1996). To addressproblems in the entire Willamette Basin, for example, it may be necessary to filter out local,site-specific data. On the other hand, questions concerning localized components (such as theWillamette’s reach within Portland or tributaries to the Willamette, such as Johnson andTryon creeks) cannot be effectively addressed by looking solely at the entire basin.Understanding basin-level problems requires knowledge of actions and processes that takeplace in individual reaches and tributaries, while the success of reach- or tributary-levelactions may depend on factors operating at basin and regional levels.
Effective restoration of physical, chemical, and biological components of the WillametteRiver and its tributaries requires coordination with upstream and downstream jurisdictions aswell as with agencies that control water flows, water quality and fish and wildlifecommunities. This involves working at multiple scales involving both the site-specific andthe basinwide context.
Application to Assessment. Our assessment is constructed hierarchically. The environmentis described in the analytical framework for portions of the basin at the scale of thegeomorphic reach and then aggregated to form geographic areas within watersheds. For non-EDT-treated areas of the basin, the environment is described at the 4th–field HUC scale. Thishierarchical physical description is reflected in biological performance that is scaled from lifestages occurring in reaches and over geographic areas to populations that reflect conditionsacross geographic areas and watersheds. We have scaled species performance at thewatershed scale to the total life-cycle scale by using appropriate out-of basin-factors withinour EDT depiction. We also have begun to form an overall picture of the Willamette basinthat is composed of populations within each of the major watersheds.
4. Habitats develop, and are maintained, by physical and biological processes.
Habitat refers to the resources and conditions present in an area that allow a species or agroup of species to exist and thrive (Hall et al., 1997). From a species perspective, the habitatis the string of conditions encountered over the species’ life cycle that contribute to thespecies’ survival and reproduction (Independent Scientific Group, 2000). Factors such asgeology, climate, geomorphology, soils, hydrology, vegetation and topography regulatehabitat-forming processes, which for salmonids include stream flow, contributions of largewood, sediment supply, temperature and channel dynamics (Frissell et al., 1986; Imhof et al.,1996; Beechie and Bolton, 1999). All of these elements act over a range of spatial and timescales to create, alter and maintain habitats (Allen and Hoekstra, 1992).
Regional-scale climatic conditions determine temperatures and precipitation that areimportant in the development of habitats. At both the regional and local scales, habitats arecreated and maintained by hydrologic, geologic and biotic processes that affect other aquaticand terrestrial conditions throughout the watershed. Locally observed conditions often reflectmore than local processes and influences; in fact, they often reflect non-local—evenregional—processes, including human actions. The presence of essential habitat featurescreated by these processes determines the abundance, productivity, spatial structure anddiversity of species and communities (Morrison et al., 1998).
DRAFT WILLAMETTE SUBBASIN PLAN
CH 3 ASSESSMENT.DOC 3-71
The active agent of many aquatic habitat-forming processes is water acting with theunderlying geology and topography. Because habitat processes are hydrologically linked, theimpacts of actions can manifest themselves downstream. As an example, downstream habitatconditions (such as high water temperature or increased sediment) can be the result ofupstream actions and conditions (such as the removal of trees along streambanks orstreamside construction). The impacts of these terrestrial actions and conditions accumulate(that is, the water temperature increases continually) as water moves downhill, affectingaquatic habitat conditions downstream.
Terrestrial habitats are often described in terms of food, water and cover. Formation of thesefeatures is related to vegetative and biotic patterns that result from the environmental needsof individual plant species, succession and patterns of human-caused and natural disturbance(Whittaker, 1975). In turn, the vegetation pattern is related to local geology, topography andclimate in the context of the regional climate and other factors. In an urban context, terrestrialhabitats are often described in terms of their land uses, levels of impervious surface andvegetative cover.
Implications. Understanding the processes that create and maintain aquatic and terrestrialhabitats is key to managing the human impacts on those habitats (Imhof et al., 1996; Beechieand Bolton, 1999). Even though the perceived problem may be local, it is necessary toconsider the habitat-forming processes acting at the watershed or basin level. Often effortsare focused on correcting the symptoms of habitat degradation and loss, rather than on theircauses, and problems are addressed with local, technological solutions. Often these effortsprove futile because the process and conditions creating the problem are still in place(Kauffman et al., 1997).
This principle stresses the need to understand and address habitat-forming processes in orderto restore and maintain aquatic and terrestrial habitats (Beechie and Bolton, 1999). Habitatrestoration actions undertaken without appreciation of the underlying habitat-formingprocesses will not be effective in the long term (Reeves et al., 1995). Land use affectshabitats through processes similar to those structuring natural habitats. Understanding therelationship between land use practices and their impacts on watershed processes is key toensuring that habitats are available to support biological communities and species of interest.
In urban areas, efforts have been made to control or eliminate the impacts of flooding, withthe result that important habitat-forming processes that native aquatic species have adapted tohave been altered. Controlling water flows through reservoirs and dams has given manypeople the sense that rivers can effectively be separated from their floodplains. Activitiessuch as filling floodplains and building flood control bank structures has given humanpopulations the perception that they can safely build next to streams and rivers.
As the population continues to increase in the Willamette Basin, the size and impact of citieslocated along the river corridor will increase. This will present the challenge of how to allowhabitat-forming processes to occur via careful management of high flows, in conjunctionwith restored bank and floodplain habitat. It also will be necessary to change themanagement of reservoirs and dams and redesign fish-friendly bank and near-shoretreatments to handle the increased flows while also providing ecological benefits. Given thepotential for conflict with regard to historical uses and properties, there will need to be an

DRAFT WILLAMETTE SUBBASIN PLAN
3-72 CH 3 ASSESSMENT.DOC
educational component in addition to coordination to facilitate decisions at site- andbasinwide scales.
Application to Assessment. Habitat-forming processes in the Willamette River basin havebeen heavily altered by human activities. Natural processes such as flow dynamics have beenaltered by regulation, while new processes, such as the effects of urbanization, road building,and agricultural field tiling, have been introduced. Many of these changes are captured withinour analytical framework, but much work is needed to fully understand the cumulativesystemic interactions and impacts of these alterations.
Ideally, physical process models of sediment and temperature dynamics, channel structure,and so on could be linked to our environmental characterization to provide an analytical basisfor linking aquatic and terrestrial processes and to describe the effect of human actions. In theabsence of these analytical linkages, we have explicitly made qualitative linkages betweenmanagement actions and habitat change.
5. Species play key roles in developing and maintaining ecological health.
Organisms do not act as passive occupants of their habitats. Instead, each species has anecological function that may be key to the development and maintenance of ecologicalconditions such as habitat and food supply (Walker, 1995). Although not every species’ecological role is well understood, it is clear that each group of species has a distinct job or“occupation” that is essential to the diversity, sustainability and productivity of theecosystem over time (Morrison et al., 1998). For example, plant, animal and bacterial speciesstructure habitats, cycle energy and control species abundance and diversity. Beavers createponds, plants make the sun’s energy available to herbivores (and ultimately carnivores) andbats help keep mosquitoes in check. The existence, productivity and abundance of speciesdepend on functions such as these.
To varying degrees, similar ecological functions may be performed by different species, andhaving a diversity of species with similar “occupations” enhances the resilience of the entireecosystem in the face of disturbance or environmental variation (Walker, 1995). However,some ecological functions are performed by a limited number of species. The decline ordisappearance of these species can have significant impacts on their associated ecologicalfunction, the ecosystem as a whole and other species.
In Pacific Northwest ecosystems, for example, salmon often play a unique role in cyclingnutrients and energy from the ocean to freshwater and terrestrial habitats (Cederholm et al.,1999). Salmon carcasses naturally fertilize freshwater systems, providing a unique array ofnutrients, lipids and biochemicals to freshwater and riparian food webs. Algae, bacteria,invertebrates and young salmon fry in particular depend on these nutrients—many of themmarine-derived—to survive and remain viable throughout the year. In fact, “the watershedfertility once provided by healthy runs of salmon may be essential to recovery of decliningsalmon stocks” (Pacific Northwest Research Station, 2001). The disappearance or decline ofsalmon stocks in a particular watershed can have far-reaching impacts on coexisting aquaticand terrestrial plants and wildlife; these impacts include changing the nutrient cycle and otherecological functions (Willson and Halupka, 1995; Cederholm et al., 1999).
DRAFT WILLAMETTE SUBBASIN PLAN
CH 3 ASSESSMENT.DOC 3-73
Salmon hatcheries may provide harvest benefits to some human users when habitats havebeen altered or destroyed, but generally hatcheries do not replace the ecological role thatsalmon play in the ecosystem, such as nutrient cycling. Recent experiments show that placinghatchery-origin salmon carcasses into streams (one carcass per square meter) jump-startstrophic level production and results in accelerated growth rates in fish. Through its SalmonTrout Enhancement Project, ODFW enlists volunteers to place carcasses in streams.Although the ecological impact of these particular carcass placements has not beenmeasured, the strategy of carcass placement remains a potential short-term method forincorporating marine-derived fatty acids and biochemicals into aquatic food webs. (It shouldbe noted, however, that just as some streams have never supported certain fish populations,individual watersheds will respond differently to added nutrient loads, depending onbiological, chemical and physical attributes unique to that system.)
Implications. This principle affirms the need to consider resource management actions in thecontext of species’ ecological functions. In the case of salmon, it is generally understood thatspawned-out carcasses provide important nutrients to ecosystems as the carcasses decomposeand release minerals. Although scientists do not know the degree to which declines in localsalmon runs—and the concomitant changes in nutrient cycling—have affected Portland’swatershed ecosystems, the declines have doubtless had an effect. The result can besignificant ecological change affecting the presence and abundance of other aquatic andterrestrial species (Cederholm et al., 2000).
Ill-placed or poorly designed culverts or other fish passage barriers affect the number ofsalmonids that can return to spawn, the temporal and spatial distribution of salmonidsthroughout a subbasin and—ultimately—the nutrient balance of that freshwater system.Managing waterways so that salmonids can return unimpeded to spawn is critical toreestablishing the nutrient bank in those freshwater systems.
Hatcheries may continue to play a role in natural resource management, but their operationmust be changed so that they not only bolster salmon survival but so they restore or replacethe functions that salmon provide in the ecosystem and boost the overall carrying capacityand productivity of the environment.
Application to Assessment. Because scientific knowledge of the effects of species onecological conditions is limited (although rapidly increasing), we have probably not fullycaptured all aspects of how species shape habitats.
6. Biological diversity allows ecosystems to persist in the face of environmental variation.
Biological diversity occurs at a variety of scales: in the variety of life forms across the land-scape, in the ecological roles they play and in the genetic diversity within their populations(Odum, 1993). Biological diversity develops as a result of various physical and biologicalprocesses in response to variability in the physical and biological conditions of the environ-ment (Southwood, 1977). Variation in biological characteristics among species, populationsand individuals is what drives adaptation in response to environmental variation.
Biological diversity contributes to ecological stability and resilience (Walker et al., 1999) attwo levels:

DRAFT WILLAMETTE SUBBASIN PLAN
3-74 CH 3 ASSESSMENT.DOC
• Within ecosystems. Resilience is enhanced by the presence of multiple, functionallysimilar species within a single ecosystem. As the populations of individual speciesincrease or decrease over time, they can alternate in providing essential ecologicalfunctions (Morrison et al., 1998; Peterson et al., 1998; Walker et al., 1999). Species thatare abundant contribute to ecological function and performance at a particular time,whereas rarer species contribute to ecological resilience over time (Walker et al., 1999).Loss of species, particularly those for which there are few ecological equivalents,jeopardizes overall ecological structure and stability (Walker 1995).
• Within a species. Genetic diversity contributes to the stability of a species over time byproviding a wider range of possible evolutionary responses to the challenges posed byvariation in the environment. As the environment changes over time, survival rates varyfrom one population to the next. As some populations suffer under an environmentalextreme such as an El Niño condition, others might fare better. However, the species as awhole survives, bolstered by its ability to respond to the shifting environment (Bisbal andMcConnaha, 1998).
Human actions often reduce biological variation at both levels (Urban et al., 1987;Policansky and Magnuson, 1998). As the environment is simplified and its natural variabilityis decreased, biological variation at the various scales is reduced as well. This leads to thepotential loss of organisms as they become less capable of responding adaptively toenvironmental change. The subsequent loss of ecological functions (functions that theorganisms formerly provided) can decrease the stability and resilience of ecosystems.
Implications. Activities should be managed to encourage natural expression of biologicaldiversity. While diversity can be quantified, it probably is not possible to determine the“proper” level of biological diversity, partly because it varies over time in response tovarious physical and biological processes. Furthermore, because future environments orsituations cannot be predicted, the level of biological diversity needed to maintain futureecological systems cannot be known. It is not simply that more diversity is always good; infact, increasing diversity by introducing nonnative species can actually disrupt ecologicalfunctions. Rather, it is important that the ecosystem be able to express its own speciescomposition and diversity, so that it remains productive and resilient in the face ofenvironmental variation. The challenge is to manage human activities to encourage thedevelopment of compatible native biological communities while at the same time minimizingour impacts on selection so that diversity can develop accordingly.
Application to Assessment. Biological diversity is one of four biological performanceattributes that we use to characterize the quality and quantity of habitat. EDT uses life historytrajectories to sample habitat along a stream length and across months within a year. Thenumber of these trajectories that can be sustained (productivity > 1.0) compared to areference condition is a measure of the spatial and temporal heterogeneity of habitat and thediversity of life histories within a species.
In addition, we have characterized habitat for multiple species, for multiple populationswithin species and, finally, for multiple life stages within populations.

DRAFT WILLAMETTE SUBBASIN PLAN
CH 3 ASSESSMENT.DOC 3-75
7. Ecological management is adaptive and experimental
Our depiction of the Willamette system is a working hypothesis. We expect that hypothesisto continually evolve as scientific knowledge advances and social conditions change. Forthose areas characterized within EDT, this working hypothesis is composed of a number ofindividual hypotheses about species/life stage-habitat relationships. These hypotheses arebased on an environmental depiction composed of specific attributes.
We propose a three-step adaptive management system for the Willamette subbasin:
1. A working hypothesis based on an assessment of the Willamette watersheds is createdwithin the subbasin plan.
2. Monitoring and evaluation to address the following questions:
− Did we take the actions proposed in our management plan?
− Did these actions produce the kind of environmental change contained in ouranalysis?
− Did biological performance change in response to the environmental change aspredicted in the model?
3. Change the working hypothesis in response to monitoring and evaluation.
8. Ecosystem function, habitat structure, and biological performance are affected byhuman actions.
Humans are integral parts of ecosystems, and human actions have a pervasive impact on thestructure and function of ecosystems; at the same time, human health and well-being are tiedto the condition of the ecosystem (Vitousek et al., 1997). Like many other organisms, peoplestructure and control ecosystems for their own needs. In some ecosystems, particularly urbanones, human impacts are major factors controlling the environment. However, unlike otherorganisms, humans can consciously control their actions to allow needed ecologicalconditions to develop. While human actions may be unique in the scale of their impact onecological systems, the method of interaction is not; ecological principles apply to humaninteractions with ecosystems as much as they do to the interactions of fish and wildlifespecies with the ecosystem.
It is a reasonable assumption that for most species, the ecological conditions that are mostconducive to their long-term survival and productivity are those under which they evolved.But urbanization and associated human actions have shifted ecosystems away from theirpredevelopment conditions, with negative impacts for many native species, especially fish.Some changes are irreversible: the urbanized landscape has been permanently changed;increased stormwater runoff has altered flow, water quality and habitat conditions in streamchannels; and nonnative plant and animal species have been introduced that compete withand in some cases displace native species. Even with complete cessation of urbandevelopment, the ecosystem would not return to its previous condition. However, the impactsof urbanization and associated human actions on ecosystems can be managed to move thesystem to a state that is more compatible with the needs of other species.
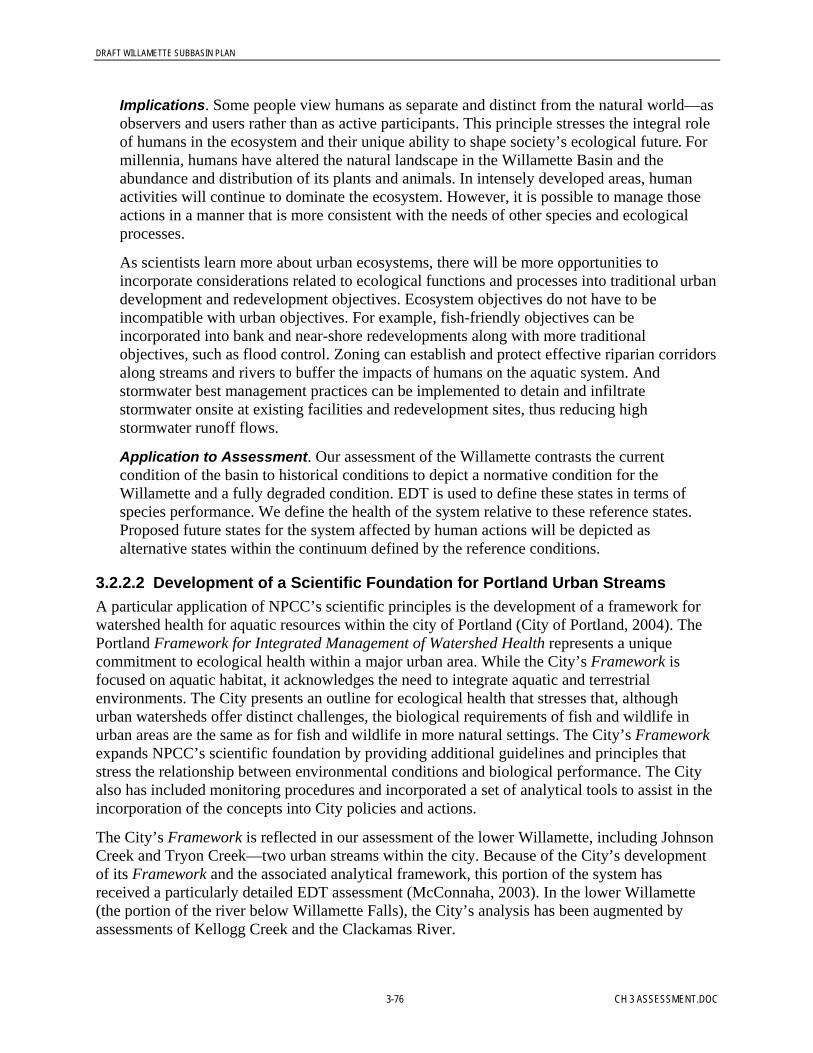
DRAFT WILLAMETTE SUBBASIN PLAN
3-76 CH 3 ASSESSMENT.DOC
Implications. Some people view humans as separate and distinct from the natural world—asobservers and users rather than as active participants. This principle stresses the integral roleof humans in the ecosystem and their unique ability to shape society’s ecological future. Formillennia, humans have altered the natural landscape in the Willamette Basin and theabundance and distribution of its plants and animals. In intensely developed areas, humanactivities will continue to dominate the ecosystem. However, it is possible to manage thoseactions in a manner that is more consistent with the needs of other species and ecologicalprocesses.
As scientists learn more about urban ecosystems, there will be more opportunities toincorporate considerations related to ecological functions and processes into traditional urbandevelopment and redevelopment objectives. Ecosystem objectives do not have to beincompatible with urban objectives. For example, fish-friendly objectives can beincorporated into bank and near-shore redevelopments along with more traditionalobjectives, such as flood control. Zoning can establish and protect effective riparian corridorsalong streams and rivers to buffer the impacts of humans on the aquatic system. Andstormwater best management practices can be implemented to detain and infiltratestormwater onsite at existing facilities and redevelopment sites, thus reducing highstormwater runoff flows.
Application to Assessment. Our assessment of the Willamette contrasts the currentcondition of the basin to historical conditions to depict a normative condition for theWillamette and a fully degraded condition. EDT is used to define these states in terms ofspecies performance. We define the health of the system relative to these reference states.Proposed future states for the system affected by human actions will be depicted asalternative states within the continuum defined by the reference conditions.
3.2.2.2 Development of a Scientific Foundation for Portland Urban StreamsA particular application of NPCC’s scientific principles is the development of a framework forwatershed health for aquatic resources within the city of Portland (City of Portland, 2004). ThePortland Framework for Integrated Management of Watershed Health represents a uniquecommitment to ecological health within a major urban area. While the City’s Framework isfocused on aquatic habitat, it acknowledges the need to integrate aquatic and terrestrialenvironments. The City presents an outline for ecological health that stresses that, althoughurban watersheds offer distinct challenges, the biological requirements of fish and wildlife inurban areas are the same as for fish and wildlife in more natural settings. The City’s Frameworkexpands NPCC’s scientific foundation by providing additional guidelines and principles thatstress the relationship between environmental conditions and biological performance. The Cityalso has included monitoring procedures and incorporated a set of analytical tools to assist in theincorporation of the concepts into City policies and actions.
The City’s Framework is reflected in our assessment of the lower Willamette, including JohnsonCreek and Tryon Creek—two urban streams within the city. Because of the City’s developmentof its Framework and the associated analytical framework, this portion of the system hasreceived a particularly detailed EDT assessment (McConnaha, 2003). In the lower Willamette(the portion of the river below Willamette Falls), the City’s analysis has been augmented byassessments of Kellogg Creek and the Clackamas River.

DRAFT WILLAMETTE SUBBASIN PLAN
CH 3 ASSESSMENT.DOC 3-77
3.2.2.3 The Use of EDT for Assessment of Aquatic HabitatsThe Northwest Power Act of 1981 directed NPCC to adopt cost-effective means of achieving“sound biological objectives.” In its 2000 Columbia River Basin Fish and Wildlife Program,NPCC defined biological objectives as consisting of two parts (Northwest Power PlanningCouncil, 2000):
• Biological performance of specific species. This included NPCC’s definition of a healthysalmon and steelhead population: “Healthy populations are defined as having an 80 percentprobability of maintaining themselves for 200 years at a level that can support harvest ratesof at least 30 percent.”
• Environmental characteristics. These describe features of the environment needed toachieve the biological performance objectives, including NPCC’s definition of a healthy fishpopulation.
For portions of the Willamette Basin, the authors of this Willamette Subbasin Plan captured thissimple relationship within an analytical framework based on Ecosystem Diagnosis andTreatment (EDT), a habitat model that links a reach-level description of the environment to thelife stage and population level performance of salmonid fishes (Mobrand Biometrics, 2004).EDT depictions were developed of the environment for the McKenzie River (spring Chinook),the Clackamas River (spring Chinook, fall Chinook, coho, and steelhead), and lower Willametteurban streams: Johnson Creek (coho and steelhead), Tryon Creek (coho and steelhead) andKellogg Creek (coho and steelhead). Time and resources did not allow construction of EDTdepictions of the other major subbasins in the Willamette Basin. However, there is broadagreement that EDT assessment is needed to create a common, basinwide framework fordecision making. In fact, work has already begun with the U.S. Army Corps of Engineers tofacilitate EDT development in the Santiam, Middle Fork, and Coast Fork. For those streams forwhich EDT assessments have not yet been completed, this document used qualitative depictionsbased on the terminology and logic employed by EDT.
EDT uses a set of explicit rules that link habitat characteristics to life stage survival. For eachbasin treated with EDT, local technical experts were convened to assemble an environmentaltemplate using a software application called the Stream Reach Editor (SRE). Local planners andbiologists defined reaches within each subbasin and documented habitat conditions in each reachusing the 45 environmental attributes in EDT. The boxes in Figure 3-20 show how the species-habitat rules in EDT relate the environmental depiction developed in the SRE to biologicalperformance of fish species. Details of how these rules work and the species-habitat relationshipsare provided in Mobrand Biometrics (2003).
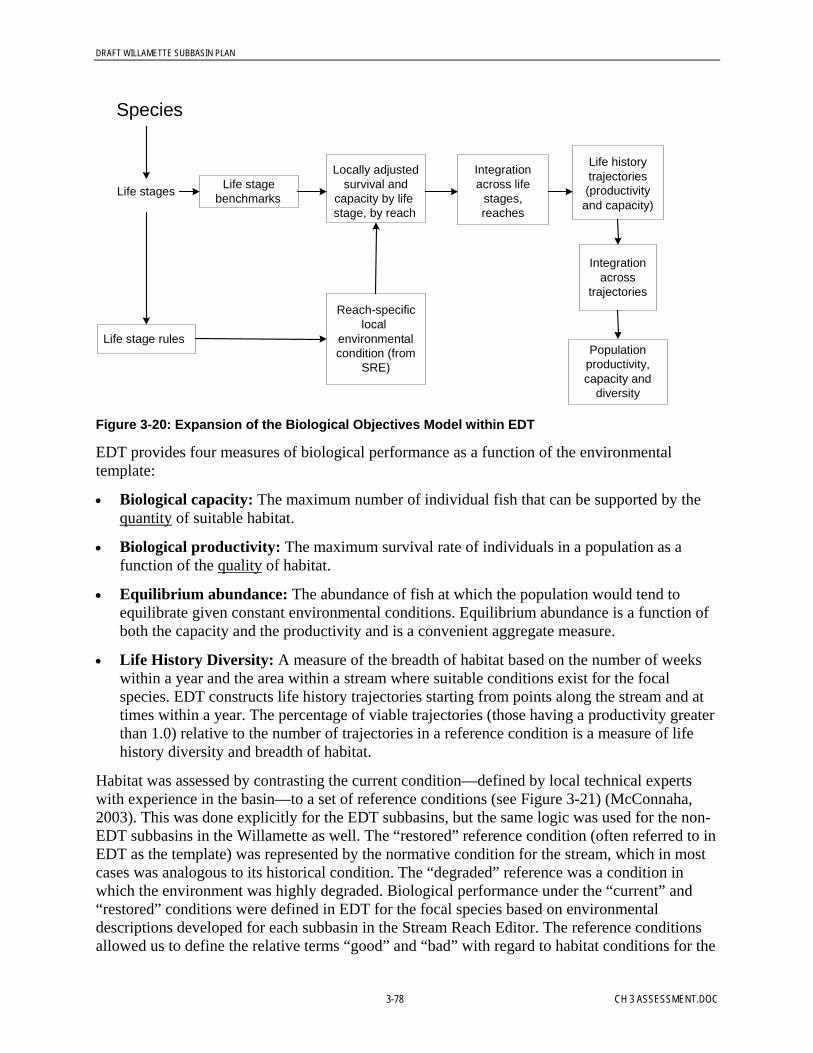
DRAFT WILLAMETTE SUBBASIN PLAN
3-78 CH 3 ASSESSMENT.DOC
Species
Life stages Life stagebenchmarks
Life stage rules
Reach-specificlocal
environmentalcondition (from
SRE)
Locally adjustedsurvival and
capacity by lifestage, by reach
Integrationacross life
stages,reaches
Populationproductivity,capacity and
diversity
Life historytrajectories(productivity
and capacity)
Integrationacross
trajectories
Figure 3-20: Expansion of the Biological Objectives Model within EDT
EDT provides four measures of biological performance as a function of the environmentaltemplate:
• Biological capacity: The maximum number of individual fish that can be supported by thequantity of suitable habitat.
• Biological productivity: The maximum survival rate of individuals in a population as afunction of the quality of habitat.
• Equilibrium abundance: The abundance of fish at which the population would tend toequilibrate given constant environmental conditions. Equilibrium abundance is a function ofboth the capacity and the productivity and is a convenient aggregate measure.
• Life History Diversity: A measure of the breadth of habitat based on the number of weekswithin a year and the area within a stream where suitable conditions exist for the focalspecies. EDT constructs life history trajectories starting from points along the stream and attimes within a year. The percentage of viable trajectories (those having a productivity greaterthan 1.0) relative to the number of trajectories in a reference condition is a measure of lifehistory diversity and breadth of habitat.
Habitat was assessed by contrasting the current condition—defined by local technical expertswith experience in the basin—to a set of reference conditions (see Figure 3-21) (McConnaha,2003). This was done explicitly for the EDT subbasins, but the same logic was used for the non-EDT subbasins in the Willamette as well. The “restored” reference condition (often referred to inEDT as the template) was represented by the normative condition for the stream, which in mostcases was analogous to its historical condition. The “degraded” reference was a condition inwhich the environment was highly degraded. Biological performance under the “current” and“restored” conditions were defined in EDT for the focal species based on environmentaldescriptions developed for each subbasin in the Stream Reach Editor. The reference conditionsallowed us to define the relative terms “good” and “bad” with regard to habitat conditions for the

DRAFT WILLAMETTE SUBBASIN PLAN
CH 3 ASSESSMENT.DOC 3-79
species. The position of the current condition relative to these reference states also allowed us todefine the restoration and protection priorities for a subbasin. For example, if the currentcondition was located very close to the restored reference condition (far to the right inFigure 3-21), it would have a high protection value but relatively small restoration potential.Similarly, if the current condition was near the degraded reference condition (far to the left inFigure 3-21), it would have little protection value but a high restoration value. Because thedepiction of the environment captured in the Stream Reach Editor was developed for each reach,it was possible to disaggregate the EDT rating of the environment and define restoration andprotection values for each reach and for the subbasin as a whole.
Degradedreferencecondition
Currentcondition of
habitat
Restoredreferencecondition
Protection Restoration
A1A2
A3
A4
Figure 3-21: Analytical Framework for Subbasin Assessment in the Willamette
The assessment framework in Figure 3-21 makes it possible to examine management alternativesfor the EDT subbasins in the Willamette. Actions that would change the current condition(including alternatives that make conditions worse) are represented as points A1 through A4 inFigure 3-21. One of these—Point A3, for example—might represent the environmental conditionfor a stream needed to achieve a “healthy” fish population as defined in NPCC’s biologicalobjectives (see above and Section C.2. of Northwest Power Planning Council, 2000).
The examination of management alternatives in the Willamette has not been completed. Work todate has progressed to the point of establishing the assessment framework shown in Figure 3-21,including establishment of the current and reference points within EDT. However, managementalternatives have not yet been analytically developed. The authors of this Willamette SubbasinPlan recommend that an analysis of management alternatives be completed in the near future asa means of evaluating a complete suite of alternatives and analytically linking managementstrategies to the assessment presented in this document. In the meantime, management strategies(see Chapter 5) have been qualitatively matched to the habitat limitations revealed in theassessment presented in this chapter of the Willamette Subbasin Plan.
3.2.2.4 Limitations of EDT Within the Willamette SystemNo model can incorporate all aspects of a complex natural system. Models are designed forspecific use and capture only a small portion of the natural world that we understand. EDT haslimitations that should be understood in interpreting its results. The first limitation is the overallpurpose of the model. EDT is system to rate aquatic habitat with respect to a salmonid fishspecies. It is not a population model. Questions of extinction risk, viable population parameters,and genetic interactions are best addressed using other tools. However, EDT can addconsiderably to the discussion of these issues because it relates habitat characteristics to thecapacity and productivity of a potential fish population. This allows EDT to be used to explore
DRAFT WILLAMETTE SUBBASIN PLAN
3-80 CH 3 ASSESSMENT.DOC
the habitat implications of population goals such as NPCC’s definition of a healthy fishpopulation.
Although EDT contains a considerable library of species-habitat rules, it is not all encompassing.The library continues to evolve as new information is presented and new issues arise. In theWillamette Basin, two rule limitations were identified that should be highlighted because theyaffect potentially important aspects of the Willamette system in particular: the use of off-channelhabitat by Chinook salmon and indirect temperature effects on survival. These are discussedbelow.
Use of Off-Channel Habitat by Chinook Salmon. Conventional wisdom has held that, duringwinter, juvenile Chinook salmon make little use of off-channel habitats but instead occupystream margins and the main channel areas. However, off-channel areas, which include channelelements distinct from the primary and secondary channels but connected to the main channel,provide key over-wintering habitat for juvenile coho salmon. This hypothesis has beenincorporated into the habitat rules for Chinook and coho in EDT (Mobrand Biometrics, 2003).
In addition, there is increasing evidence (much of it for the Willamette River) of winter use ofoff-channel habitat by Chinook. Several studies point to the use of off-channel sloughs, tributarymouths, and even gravel pits by Chinook in the lower McKenzie and Willamette rivers. Thisknowledge has not yet been incorporated into the EDT rules, although new rules are likely to beformulated over the next year. To the extent that off-channel areas are important over-winteringhabitat for juvenile Chinook, EDT will underestimate the effects of these areas on Chinookpotential.
Indirect Temperature Effects on Survival. Temperature plays an important role in determiningspecies potential in EDT. For example, EDT has rules that relate acute temperature effects on lifestage survival3. However, indirect effects of temperature that might be the result of effects onalevin growth or emergence time are not incorporated into EDT rules at the present time.Recognition of this limitation is particularly important in the Willamette, where high-head damson the McKenzie and Santiam rivers result in a markedly altered temperature regime in streamreaches below the dams. The altered temperature regimes have been shown to have a pronouncedeffect on fish development and emergence timing. While EDT does account for direct mortalityto eggs and other life stages as a result of temperature, the indirect effects of temperature are notincorporated and the effect of these dams on fish potential is underestimated.
3.2.3 Focal Species SelectionBoth aquatic and terrestrial focal species were selected for this subbasin plan, as describedbelow.
3.2.3.1 Aquatic Focal Species SelectionAquatic focal species were identified and agreed to by the Subbasin Planning TechnicalAdvisory Group in meeting discussions and through draft list reviews. Criteria used to determinewhether a species should be considered a focal species were based on NPCCl technical guidanceand included the following:
3 Temperature also affects species performance in EDT through other attributes such as predator activity and water quality.
DRAFT WILLAMETTE SUBBASIN PLAN
CH 3 ASSESSMENT.DOC 3-81
• Does the species have special state or federal status?• Is the species important culturally or ecologically?• Is the species a good indicator of aquatic habitat conditions?• Is enough known about the species that a management plan can be developed?
The group agreed that it was important to consider all special-status species, but there also wasan interest in considering more widely distributed species that are good indicators of habitatconditions. Currently, all management direction for special-status species in the WillametteBasin is directed toward eastside tributaries. For the Willamette Subbasin Plan, resident cutthroattrout was chosen as a focal species because of its broad distribution (including westsidetributaries) and its value as an indicator of habitat conditions. In addition, there is great interest inresident and anadromous lamprey species in the Willamette Basin, but the lack of sufficientinformation to develop an adequate management plan minimized the potential impact that thissubbasin plan could make for the species. The final list of focal aquatic species, managementunits, and analysis tools that will be used in this plan is presented in Table 3-23.

DRAFT WILLAMETTE SUBBASIN PLAN
3-82 CH 3 ASSESSMENT.DOC
Table 3-23: Focal Fish Species Selection and Assessment Tool by Planning Unit
WatershedManagement Units Resident Focal Fish Species Anadromous Focal Fish Species Evaluation Technique
Mainstem andTributaries from Mouthto Falls
Cutthroat EDT, HSI, watershed assessments,professional opinion
Clackamas RiverWatershed
Bull trout (thought to beextirpated after 1960, butincluded in USFWS recoveryplan as core habitat withpotential to contribute todelisting)
Cutthroat
Coho salmon (The Clackamas may have one ofthe last remaining wild populations.)
Lower Columbia fall Chinook (TRT-identifiedcore population)
Upper Willamette spring Chinook (TRT-identified core population)
Lower Columbia winter steelhead (TRT-identified core population)
Lower Columbia chum salmon (Historicallypresent and recovery opportunity exists—nocurrent population exists)
Note: EDT analysis will treat the entire drainagebelow Willamette Falls as one planning unit.
EDT, HSI, USFWS draft bull troutrecovery plan, watershedassessments, professional opinion
Molalla Watershed Cutthroat Upper Willamette spring Chinook
Upper Willamette winter steelhead
HSI, watershed assessments,professional opinion
Pudding Watershed Cutthroat Not considered by NOAA Fisheries for recovery foreither steelhead or Chinook
HSI, watershed assessments,professional opinion
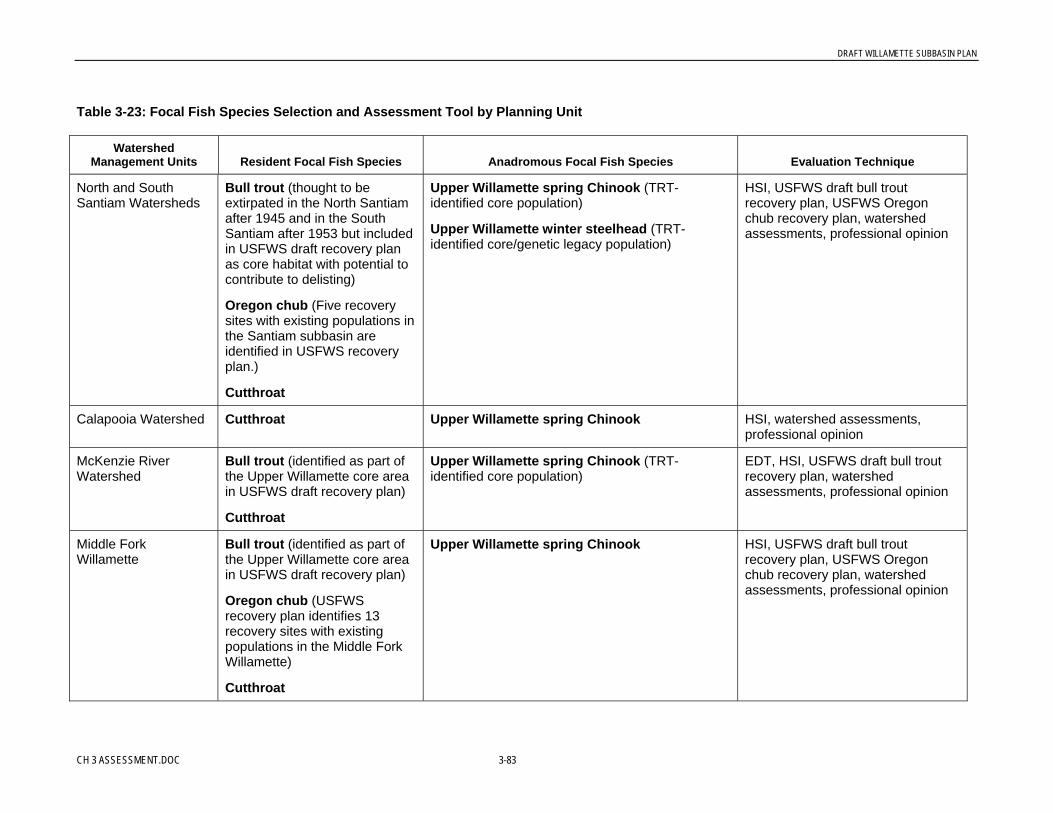
DRAFT WILLAMETTE SUBBASIN PLAN
CH 3 ASSESSMENT.DOC 3-83
Table 3-23: Focal Fish Species Selection and Assessment Tool by Planning Unit
WatershedManagement Units Resident Focal Fish Species Anadromous Focal Fish Species Evaluation Technique
North and SouthSantiam Watersheds
Bull trout (thought to beextirpated in the North Santiamafter 1945 and in the SouthSantiam after 1953 but includedin USFWS draft recovery planas core habitat with potential tocontribute to delisting)
Oregon chub (Five recoverysites with existing populations inthe Santiam subbasin areidentified in USFWS recoveryplan.)
Cutthroat
Upper Willamette spring Chinook (TRT-identified core population)
Upper Willamette winter steelhead (TRT-identified core/genetic legacy population)
HSI, USFWS draft bull troutrecovery plan, USFWS Oregonchub recovery plan, watershedassessments, professional opinion
Calapooia Watershed Cutthroat Upper Willamette spring Chinook HSI, watershed assessments,professional opinion
McKenzie RiverWatershed
Bull trout (identified as part ofthe Upper Willamette core areain USFWS draft recovery plan)
Cutthroat
Upper Willamette spring Chinook (TRT-identified core population)
EDT, HSI, USFWS draft bull troutrecovery plan, watershedassessments, professional opinion
Middle ForkWillamette
Bull trout (identified as part ofthe Upper Willamette core areain USFWS draft recovery plan)
Oregon chub (USFWSrecovery plan identifies 13recovery sites with existingpopulations in the Middle ForkWillamette)
Cutthroat
Upper Willamette spring Chinook HSI, USFWS draft bull troutrecovery plan, USFWS Oregonchub recovery plan, watershedassessments, professional opinion

DRAFT WILLAMETTE SUBBASIN PLAN
3-84 CH 3 ASSESSMENT.DOC
Table 3-23: Focal Fish Species Selection and Assessment Tool by Planning Unit
WatershedManagement Units Resident Focal Fish Species Anadromous Focal Fish Species Evaluation Technique
Upper WillametteMainstem
Cutthroat
Oregon chub (USFWSrecovery plan identifies recoverysites with existing populations inthe Upper Willamette)
Upper Willamette spring Chinook
Upper Willamette winter steelhead
HSI, watershed assessments,Oregon chub recovery planprofessional opinion
Coast Fork Willamette Cutthroat
Oregon chub (One recoverysite with an existing populationis identified in the Coast Fork.)
Not considered by NOAA Fisheries foranadromous fish
HSI, USFWS draft bull troutrecovery plan, USFWS Oregonchub recovery plan, watershedassessments, professional opinion
Long Tom Watershed Cutthroat Upper Willamette spring Chinook (juvenilerearing only)
HSI, watershed assessments,professional opinion
Marys RiverWatershed
Cutthroat Upper Willamette spring Chinook (juvenilerearing only)
Upper Willamette winter steelhead (juvenilerearing only)
HSI, watershed assessments,professional opinion
Luckiamute River w
Watershed
Cutthroat Upper Willamette spring Chinook (juvenilerearing only)
Upper Willamette winter steelhead (juvenilerearing only)
HSI, watershed assessments,professional opinion
Rickreall CreekWatershed
Cutthroat Upper Willamette spring Chinook (juvenilerearing only)
Upper Willamette winter steelhead (juvenilerearing only)
HSI, watershed assessments,professional opinion

DRAFT WILLAMETTE SUBBASIN PLAN
CH 3 ASSESSMENT.DOC 3-85
Table 3-23: Focal Fish Species Selection and Assessment Tool by Planning Unit
WatershedManagement Units Resident Focal Fish Species Anadromous Focal Fish Species Evaluation Technique
Tualatin RiverWatershed
Cutthroat Upper Willamette spring Chinook (juvenilerearing only)
Upper Willamette winter steelhead (juvenilerearing only)
HSI, watershed assessments,professional opinion
Yamhill RiverWatershed
Cutthroat Upper Willamette spring Chinook (juvenilerearing only)
Upper Willamette winter steelhead (juvenilerearing only)
HSI, watershed assessments,professional opinion
EDT = Ecosystem Diagnosis and Treatment.HSI = Habitat Suitability Index.

DRAFT WILLAMETTE SUBBASIN PLAN
3-86 CH 3 ASSESSMENT.DOC
3.2.3.2 Terrestrial Focal Species SelectionThis plan uses focal habitats as an organizing concept to discuss the terrestrial focal speciesin the Willamette Basin. Focal habitats are land cover or vegetation classes that areconsidered to be the most important in the Willamette Basin because of their scarcity, rate ofdecline from their historical extent, exceptional wildlife or plant diversity, and/or consistentuse by a relatively large number of plant and wildlife species that are threatened, endangered,sensitive, or declining in the basin (see Appendix D for the analytical approach). Table 3-24lists the focal habitats used in this plan and shows how they compare to habitats identified inprevious plans and assessments of wildlife in the Willamette Basin.
Terrestrial focal species are plant or wildlife species or subspecies that serve to focusmanagement and/or monitoring activities. Some authors have used this phrase to denotespecies that encompass the structural and functional needs of broader ecologicalcommunities. Some of the terrestrial focal species in this plan were chosen not only toaddress this concept, but also (or instead) because they are keystone species (that is, speciesthat significantly alter the physical environment), endemic to Oregon, highly specialized,declining, or especially vulnerable to extirpation. Table 3-25 lists the terrestrial focal speciesselected for this plan, and Table 3-26 groups those terrestrial focal species by habitat typeand shows how the groupings compare with those of previous plans and assessments ofwildlife in the Willamette Basin.
Several agencies and groups involved with the Willamette Basin (for example, USDA ForestService, BLM, Corps of Engineers, ODFW) had previously used diverse criteria to designateparticular species as “focal.” The composition of these lists is largely a function of legal andgeographic responsibilities of the particular agency. The authors of this plan drew heavilyfrom such lists, using the following criteria to select species for our purposes:
• The species is listed or a current candidates for listing as threatened or endangered byfederal agencies.
• The species is listed by ODFW as sensitive, i.e., endangered, threatened, critical, orvulnerable.
• The species is declining in the basin or region as indicated by Breeding Bird Survey(BBS) data.
• The species is endemic to the Willamette Basin.
• The species performs ecological functions quite different from those performed by otherspecies that regularly occur in the same habitat type.
All species that met the first of these five criteria were included, except for Canada lynx(federally listed as threatened), which probably has been extirpated as a resident of theWillamette Basin. Including species that met any of the other criteria would have resulted inan impractically long list of more than 120 species.4 The geographic range of several of the 4 State-listed wildlife species of the Willamette Basin that were not designated as focal species are: endangered: peregrinefalcon; threatened: wolverine; critical: fisher, black-backed woodpecker, northern goshawk, common nighthawk, northernpygmy-owl, yellow-breasted chat, painted turtle; vulnerable: western toad, Cascade torrent salamander, southern torrentsalamander, foothill yellow-legged frog, pallid bat, fringed myotis. These species were excluded because of low fidelity to anyof the focal habitats, likely extirpation, narrow geographic range within the Willamette Basin, or because other sensitive species

DRAFT WILLAMETTE SUBBASIN PLAN
CH 3 ASSESSMENT.DOC 3-87
focal species does not encompass the entire Willamette Basin, and this should be consideredwhen using these species to monitor focal habitats. In addition, the focal species in this planshould not be considered to be the only ones deserving heightened concern and attention.
A few of this plan’s focal species did not meet any of these criteria but were includedbecause of their consistent association with a particular focal habitat type and/or apparentlyminimal redundancy between their habitat associations and those of species already selectedas focal species. To determine redundancy, Spearman rank correlations were computedamong habitat scores of all species pairings (83,282 total). A flexible number of non-focalspecies that had a large negative correlation with the species already selected as focal --indicating their habitat needs might be unmet by managing only for the focal species -- wereadded to the list of focal species. This was done iteratively. Additions were made basedpartly on our experience with the species, rather than by establishing a finite, rigid thresholdbased on statistical significance, e.g., as one might do in an attempt to optimize mechanicallythe suite of final suite of focal species. We compared the ability of the final 55 focal speciesto represent the six focal habitat types by comparing, within each focal habitat type, thescores of our focal species for that habitat type with scores of species used by the HabitatEvaluation Procedures (HEP; USFWS 1981) to represent that habitat type or the closestsimilar type. In all instances we found the habitat suitability means for our chosen focalspecies were higher than those of the HEP species. This suggests our focal species may bemore tightly associated than the HEP species with the six focal habitat types.
Species were added in this manner mostly where a focal habitat hosts relatively few legallylisted species. No attempt was made to mathematically optimize the suite of focal speciesselected to represent a particular focal habitat type.
Appendix D presents a list of some of the more important indicators of ecological conditionfor each focal habitat type. These are suggested partly because the focal species alone are notintended to represent the full spectrum of important successional stages, geomorphicconditions, and structural elements contained within each focal habitat type.
Although the focal species have been grouped according to the focal habitats in which theyare most likely to occur, focal species are not necessarily the same as “indicator species” or“umbrella species.” Among the species identified as focal in this plan, there is considerablevariation in the strength of their association with the focal habitat under which they are listedand with their association with non-focal species. Most of these focal species use multiplehabitat types, and the other habitats they use may or may be considered to be focal. Thus, anyuse of species surveys to monitor status and trends in the condition of focal habitats shouldnot be limited just to species categorized as focal by this plan. The focal species concept isused mainly to ensure that evaluation and management of focal habitat types includesconsideration of the needs of some of the rarest and most dependent species that use thattype. Of course, by addressing only a limited list of focal species, one potentially overlooksthe needs of many other species. Although this is unavoidable, an analytical approach used inthis effort provided an estimate of the degree to which protecting only the selected focalspecies might “sweep” the habitat needs of the non-focal species (see Appendix D).
associated with the focal habitat are mostly sufficient to address needs of the excluded species. ODFW is currently updating itslisting of sensitive species. The presence of state-listed wildlife species in a particular area is a legal concern mainly if the areais a state-owned forest or other forest subject to the Oregon Forest Practices Act.
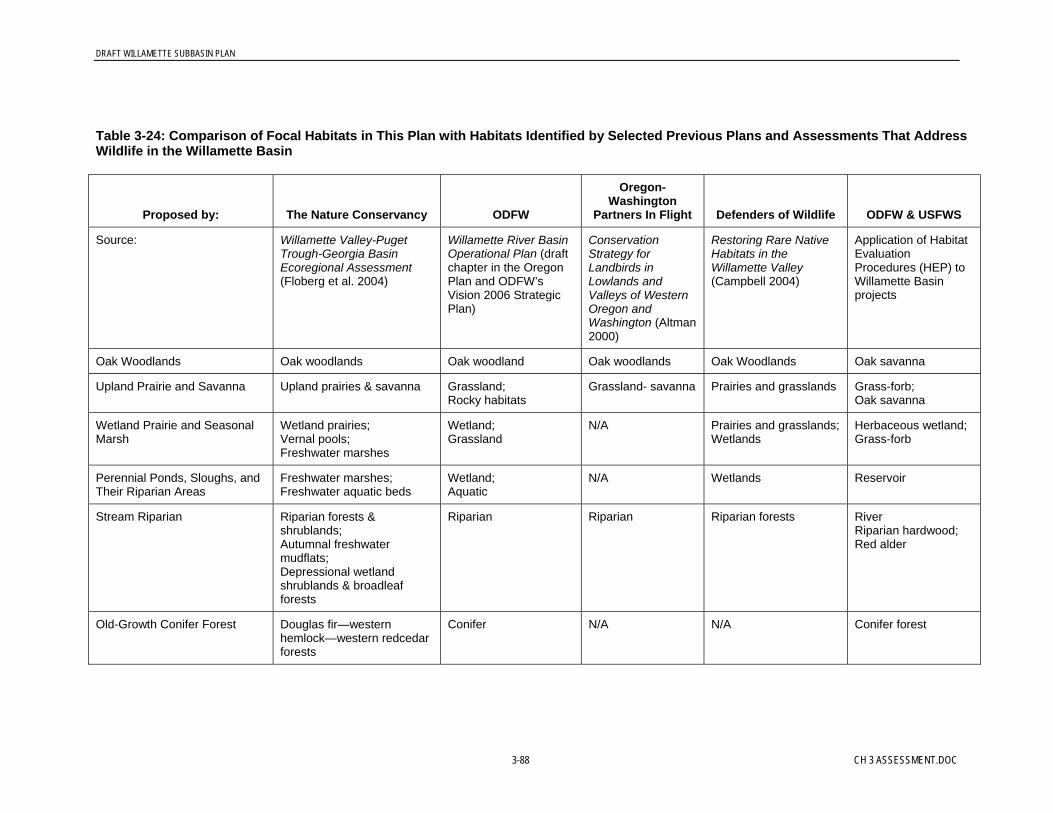
DRAFT WILLAMETTE SUBBASIN PLAN
3-88 CH 3 ASSESSMENT.DOC
Table 3-24: Comparison of Focal Habitats in This Plan with Habitats Identified by Selected Previous Plans and Assessments That AddressWildlife in the Willamette Basin
Proposed by: The Nature Conservancy ODFW
Oregon-Washington
Partners In Flight Defenders of Wildlife ODFW & USFWS
Source: Willamette Valley-PugetTrough-Georgia BasinEcoregional Assessment(Floberg et al. 2004)
Willamette River BasinOperational Plan (draftchapter in the OregonPlan and ODFW’sVision 2006 StrategicPlan)
ConservationStrategy forLandbirds inLowlands andValleys of WesternOregon andWashington (Altman2000)
Restoring Rare NativeHabitats in theWillamette Valley(Campbell 2004)
Application of HabitatEvaluationProcedures (HEP) toWillamette Basinprojects
Oak Woodlands Oak woodlands Oak woodland Oak woodlands Oak Woodlands Oak savanna
Upland Prairie and Savanna Upland prairies & savanna Grassland;Rocky habitats
Grassland- savanna Prairies and grasslands Grass-forb;Oak savanna
Wetland Prairie and SeasonalMarsh
Wetland prairies;Vernal pools;Freshwater marshes
Wetland;Grassland
N/A Prairies and grasslands;Wetlands
Herbaceous wetland;Grass-forb
Perennial Ponds, Sloughs, andTheir Riparian Areas
Freshwater marshes;Freshwater aquatic beds
Wetland;Aquatic
N/A Wetlands Reservoir
Stream Riparian Riparian forests &shrublands;Autumnal freshwatermudflats;Depressional wetlandshrublands & broadleafforests
Riparian Riparian Riparian forests RiverRiparian hardwood;Red alder
Old-Growth Conifer Forest Douglas fir—westernhemlock—western redcedarforests
Conifer N/A N/A Conifer forest
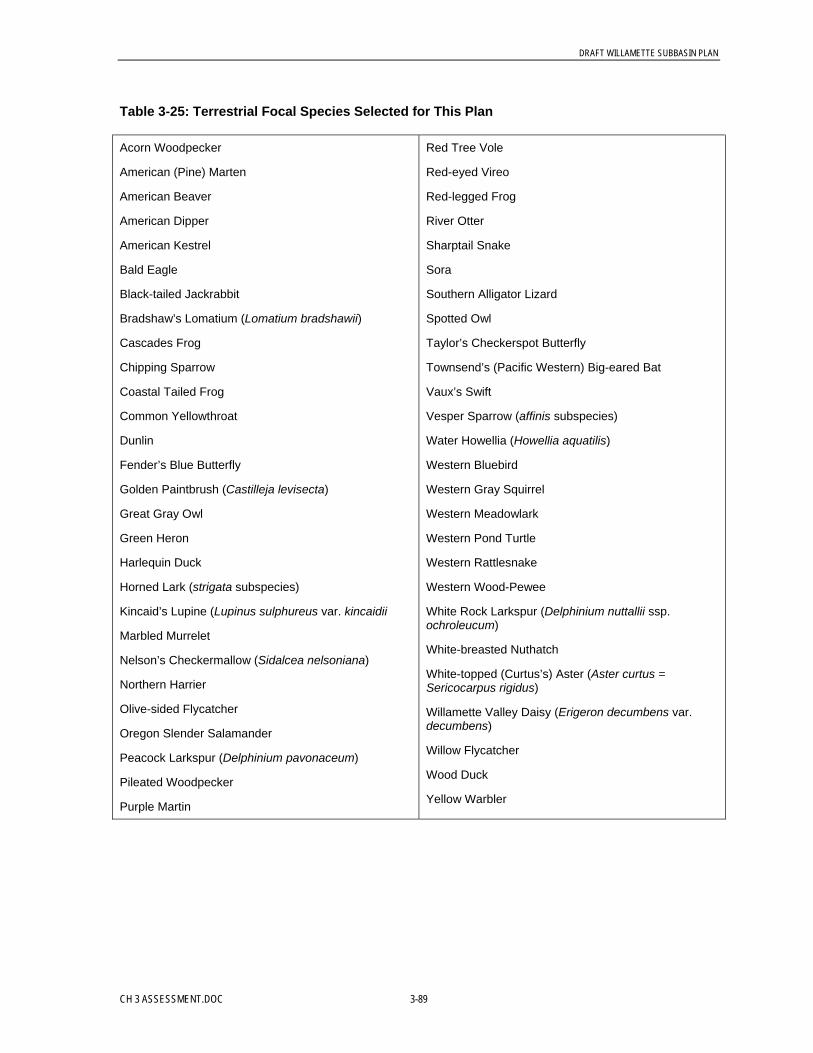
DRAFT WILLAMETTE SUBBASIN PLAN
CH 3 ASSESSMENT.DOC 3-89
Table 3-25: Terrestrial Focal Species Selected for This Plan
Acorn Woodpecker
American (Pine) Marten
American Beaver
American Dipper
American Kestrel
Bald Eagle
Black-tailed Jackrabbit
Bradshaw’s Lomatium (Lomatium bradshawii)
Cascades Frog
Chipping Sparrow
Coastal Tailed Frog
Common Yellowthroat
Dunlin
Fender’s Blue Butterfly
Golden Paintbrush (Castilleja levisecta)
Great Gray Owl
Green Heron
Harlequin Duck
Horned Lark (strigata subspecies)
Kincaid’s Lupine (Lupinus sulphureus var. kincaidii
Marbled Murrelet
Nelson’s Checkermallow (Sidalcea nelsoniana)
Northern Harrier
Olive-sided Flycatcher
Oregon Slender Salamander
Peacock Larkspur (Delphinium pavonaceum)
Pileated Woodpecker
Purple Martin
Red Tree Vole
Red-eyed Vireo
Red-legged Frog
River Otter
Sharptail Snake
Sora
Southern Alligator Lizard
Spotted Owl
Taylor’s Checkerspot Butterfly
Townsend’s (Pacific Western) Big-eared Bat
Vaux’s Swift
Vesper Sparrow (affinis subspecies)
Water Howellia (Howellia aquatilis)
Western Bluebird
Western Gray Squirrel
Western Meadowlark
Western Pond Turtle
Western Rattlesnake
Western Wood-Pewee
White Rock Larkspur (Delphinium nuttallii ssp.ochroleucum)
White-breasted Nuthatch
White-topped (Curtus’s) Aster (Aster curtus =Sericocarpus rigidus)
Willamette Valley Daisy (Erigeron decumbens var.decumbens)
Willow Flycatcher
Wood Duck
Yellow Warbler

DRAFT WILLAMETTE SUBBASIN PLAN
3-90 CH 3 ASSESSMENT.DOC
Table 3-26: Comparison of Focal Species with Species Identified as “Indicators” or “Focal Species” by Previous Wildlife Plans andAssessments in the Willamette Basin, Grouped by the Most Similar Focal Habitat Type
Sponsor: WRI/ NPCC OWEB—ONHP PIF ODFW ODFW & USFWS
Source: This plan “Key species for landacquisition priorities”(Wiley, 2004)
Strategy for Landbirds inLowlands and Valleys ofWestern Oregon andWashington
Willamette River BasinOperational Plan (draftchapter in the OregonPlan and ODFW’s Vision2006 Strategic Plan)
Application of HabitatEvaluation Procedures(HEP) to WillametteBasin projects
OakWoodlands
Acorn woodpeckerChipping sparrowW. Wood-peweeWhite-breasted nuthatchSouthern alligator lizardSharptail snakeW. gray squirrel
Acorn woodpeckerChipping sparrowW. Wood-peweeWhite-breasted nuthatchSharptail snakeW. gray squirrelBullock’s oriole
Acorn woodpeckerBewick’s wrenBushtitChipping sparrowW. Wood-peweeWhite-breasted nuthatch
Acorn woodpeckerBand-tailed pigeonWhite-breasted nuthatch
ElkBlack-tailed deerBlack bearCougarRuffed grouseYellow warblerPileated woodpeckerRed foxWestern gray squirrelRing-necked pheasantCalifornia quailWood duck
UplandPrairie-Savanna andRockOutcrops
American kestrelHorned larkVesper sparrowWestern meadowlarkWestern rattlesnakeBlack-tailed jackrabbitTaylor’s checkerspotFender’s blue butterflyKincaid’s lupineGolden paintbrushWhite rock larkspurWhite-topped aster
American kestrelBullock’s orioleGrasshopper sparrowHorned larkNorthern harrierVesper sparrowWestern meadowlarkTaylor’s checkerspotFender’s blue butterfly
American kestrelGrasshopper sparrowHorned larkNorthern harrierVesper sparrowWestern meadowlark
Horned larkVesper sparrowWestern bluebirdWestern meadowlarkWestern rattlesnake
ElkBlack-tailed deerRed foxWestern gray squirrelRing-necked pheasantCalifornia quailWood duck

DRAFT WILLAMETTE SUBBASIN PLAN
CH 3 ASSESSMENT.DOC 3-91
Table 3-26: Comparison of Focal Species with Species Identified as “Indicators” or “Focal Species” by Previous Wildlife Plans andAssessments in the Willamette Basin, Grouped by the Most Similar Focal Habitat Type
Sponsor: WRI/ NPCC OWEB—ONHP PIF ODFW ODFW & USFWS
WetlandPrairie andSeasonalMarsh
DunlinCommon yellowthroatNorthern harrierSoraRed-legged frogWater howelliaBradshaw’s lomatiumNelson’s checkermallowWillamette Valley daisyPeacock larkspur
DunlinShort-eared owl
N/A DunlinPainted turtlePond turtleRed-legged frogWood duck
Roosevelt elkBlack-tailed deerBlack bearCougarRuffed grouseRed foxRing-necked pheasantCalifornia quailCommon merganser
PerennialPonds,Sloughs, andTheir RiparianAreas
Western pond turtleOregon spotted frogCascades frogPurple martinGreen heronWood duckYellow warbler
Western pond turtlePainted turtleRed-legged frogPurple martinAmerican bitternHooded merganserWood duck
Purple martinYellow warbler
Western pond turtlePainted turtleRed-legged frogYellow warbler
River otterAmerican beaverCommon merganserMinkWood duck
StreamRiparian
American dipperBald eagleHarlequin duckRed-eyed vireoWillow flycatcherCoastal tailed frogAmerican beaverRiver otter
Foothill yellow-legged frogYellow warbler
Downy woodpeckerRed-eyed vireoSwainson’s thrushWillow flycatcher
Bald eagleGreat blue heronAmerican beaver
American BeaverAmerican DipperBlack BearBlack-tailed DeerCalifornia QuailCommon MerganserCougarElkHarlequin DuckMinkPileated WoodpeckerRed FoxRing-necked PheasantRiver OtterRuffed GrouseWestern Gray SquirrelWood DuckYellow Warbler
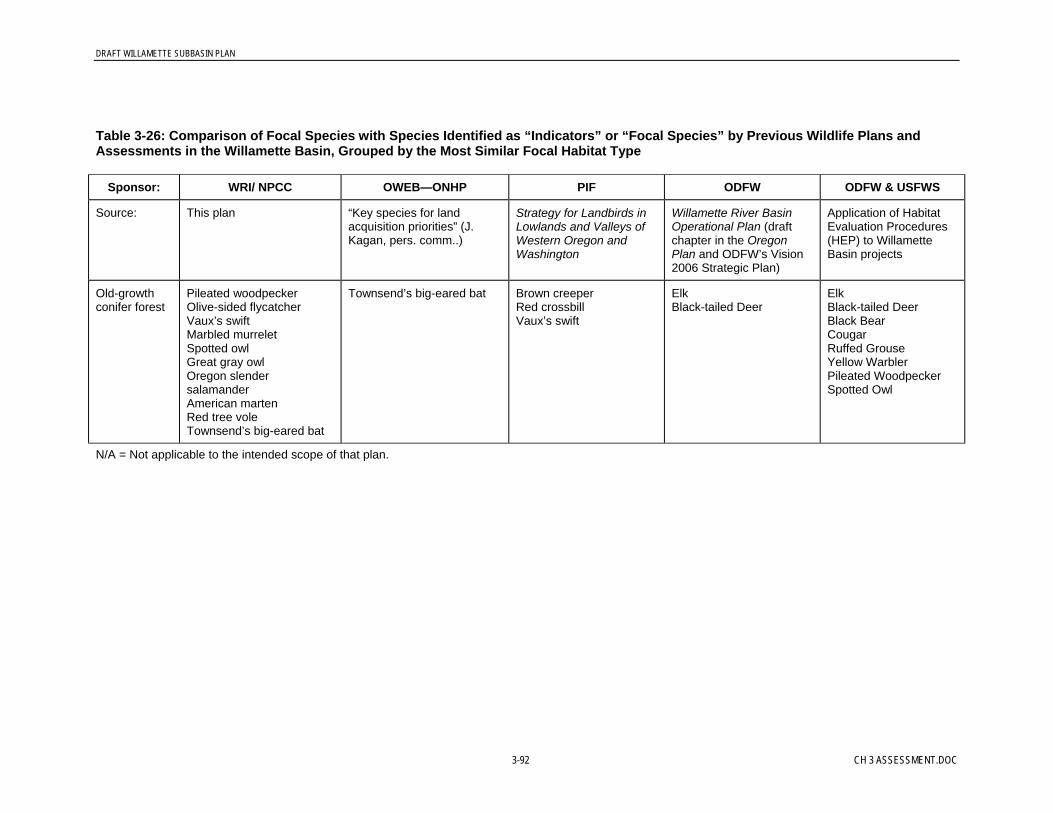
DRAFT WILLAMETTE SUBBASIN PLAN
3-92 CH 3 ASSESSMENT.DOC
Table 3-26: Comparison of Focal Species with Species Identified as “Indicators” or “Focal Species” by Previous Wildlife Plans andAssessments in the Willamette Basin, Grouped by the Most Similar Focal Habitat Type
Sponsor: WRI/ NPCC OWEB—ONHP PIF ODFW ODFW & USFWS
Source: This plan “Key species for landacquisition priorities” (J.Kagan, pers. comm..)
Strategy for Landbirds inLowlands and Valleys ofWestern Oregon andWashington
Willamette River BasinOperational Plan (draftchapter in the OregonPlan and ODFW’s Vision2006 Strategic Plan)
Application of HabitatEvaluation Procedures(HEP) to WillametteBasin projects
Old-growthconifer forest
Pileated woodpeckerOlive-sided flycatcherVaux’s swiftMarbled murreletSpotted owlGreat gray owlOregon slendersalamanderAmerican martenRed tree voleTownsend’s big-eared bat
Townsend’s big-eared bat Brown creeperRed crossbillVaux’s swift
ElkBlack-tailed Deer
ElkBlack-tailed DeerBlack BearCougarRuffed GrouseYellow WarblerPileated WoodpeckerSpotted Owl
N/A = Not applicable to the intended scope of that plan.
DRAFT WILLAMETTE SUBBASIN PLAN
CH 3 ASSESSMENT.DOC 3-93
3.2.4 Aquatic Focal Species Population Delineation and CharacterizationThis section begins by characterizing the population status, trends, and key life historycharacteristics for five focal fish species in the Willamette Basin: Chinook salmon, wintersteelhead, cutthroat trout, bull trout, and Oregon chub. Pacific lamprey also is discussed,briefly, because it is an important species culturally and one that is believed to havesignificantly declining trends. However, the absence of life history and distribution data onPacific lamprey limits an adequate species characterization within the Willamette Basin.
The section concludes with a discussion of artificial production.
3.2.4.1 Chinook Life History, Population Status, and TrendsThe Willamette River Basin historically provided important spawning and rearing groundsfor large numbers of spring Chinook salmon of the Columbia River basin. Mattson (1948)estimated that the spring Chinook salmon run in the 1920s may have been five times the55,000 fish counted in 1947. From 1946 to 1951, annual spring Chinook runs—including themainstem Willamette River sport catch, escapement above Willamette Falls, and escapementto the Clackamas River—ranged from 25,100 to 96,800 fish (Mattson, 1963). Mean annualrun size for this same period averaged 55,600, which was more than half the run size thatpassed Bonneville Dam in 1948: 97,543 fish (Fish Commission, 1948). In 2003 and 2004,more than 100,000 adult spring Chinook have crossed Willamette Falls each year. Theaverage run size in the last 50 years has been around 40,000, with peaks as low as 11,000. Alarge fraction of fish passing the falls are of hatchery origin. The largest run on record was156,033 adults in 1953 (Oregon Department of Fish and Wildlife 2000b).
Historically there were seven demographically independent populations of spring Chinooksalmon in the Upper Willamette River spring Chinook salmon ESU: Clackamas,Molalla/Pudding, Calapooia, North Santiam, South Santiam, McKenzie, and Middle ForkWillamette—all eastside tributaries (Meyers et al., 2003). Today, four core populationssurvive in the Clackamas, North Santiam, McKenzie and Middle Fork Willamette subbasins,which historically sustained large populations and may have the intrinsic capacity to sustainlarge populations into the future (McElhany et al., 2003). In addition to these corepopulations, the McKenzie subbasin population represents an important element of thegenetic legacy of the Upper Willamette ESU. The McKenzie spring Chinook salmonpopulation has been the least influenced by intra- or interbasin transfers of hatchery stocksand probably has retained a relatively high degree of adaptation to local watershedconditions. It is thought that the Molalla and Calapooia spring Chinook salmon populationshave been extirpated, or nearly so (U.S. Army Corps of Engineers, 2002).
Life History Patterns and DiversityAdult Migration and Spawning. Before the Willamette Falls fish ladder was constructed,passage by returning adult spring Chinook salmon was possible only during the winter andspring high flow periods. As early as 1903, state fish biologists noted that Willamette Riversalmon are an early-run fish that entered the Columbia River system early in the season tonavigate above Willamette Falls and get up into remote areas of the upper basin (OregonDepartment of Fisheries, 1905). The early run timing of the Upper Willamette populationrelative to other Lower Columbia River populations is viewed as an adaptation to flowconditions and optimal passage at Willamette Falls (Myers et al., 2003). This adaptation to
DRAFT WILLAMETTE SUBBASIN PLAN
3-94 CH 3 ASSESSMENT.DOC
run timing during optimal flow conditions at the falls has led to significant local geneticadaptation relative to other Columbia River spring Chinook salmon (Myers et al., 2003).
Spring Chinook salmon begin to appear at in the Lower Willamette and at the base of thefalls (RM 26) falls in February. The majority of the run ascends the falls in April and Mayand completes its migration back to natal spawning grounds through July. Passage overWillamette Falls was believed to be related to flow and temperature; passage increased whenthe river levels dropped and water temperatures exceeded 53.0 degrees F (OregonDepartment of Fish and Wildlife, 1990). Although a large portion of the spring run passedand occupied the area above Willamette Falls, historical records show that an early runentered the Clackamas River in March, prior to the Upper Willamette fish run.
Adult spring Chinook sampled from 1946 through 1951 were mostly 4- and 5-year-oldadults; 4 percent were 3-year-old fish, 24 percent were 4-year-old fish, 61 percent were 5-year-old fish, and 10 percent were 6-year-old fish (Mattson, 1963). Scales taken from adultsshowed that older adults experienced longer juvenile freshwater rearing (either in their natalstream or in the lower Willamette River) than younger adult returns. The number of yearlingmigrants increased proportionally with the age of adult return, and fry and fingerlingemigrants made up a higher proportion of 3-year-old adults (Mattson, 1963).
Rich and Holmes (1929) observed that “5-year-old adults predominated, 6-year-old salmonreturned in larger numbers than 4’s, and only a few 3-year-olds were recovered.” Rich andHolmes’ observations a quarter century earlier were consistent with Mattson’s observationsthat 5-year-old adults predominated; however, a key distinction was that 6-year-old fishreturned in greater numbers than did 4-year-old fish. One hypothesis is that summer-runChinook may have populated tributaries of the lower Willamette River. Fisherman of thelower Willamette claimed that (prior to 1927) a run of large salmon passed through the lowerriver each June. However, this summer run may have also been the later part of the springrun; these fish averaged 25 to 30 pounds and were believed to be mostly 6-year-old fish.
Regardless, the last sizeable run of June migrants passed Willamette Falls in 1934, whichnotably coincided with the loss of the Clackamas River fall run (Mattson, 1963). Thedisappearance of the June spring Chinook salmon run in the 1920s and 1930s was associatedwith the dramatic decline of water quality in the Willamette River during this period (Myerset al., 2003). A number of destructive activities in the 1880s and 1890s, along with poorwater quality conditions in the lower Willamette River (for example, low dissolved oxygen),particularly during adult migrations, are believed to have significantly affected these nativeChinook populations.
As a result of the fish ladder at Willamette Falls, the current run of spring Chinook salmonover the falls extends into July and August, which overlaps with the introduced fall run ofChinook salmon.
The earliest recorded observation of spring Chinook salmon spawning occurred at the NorthFork Santiam hatchery rack (RM 65 at a site that is currently under Detroit Reservoir) onAugust 22, 1947 (Mattson, 1948). Spring Chinook salmon spawned near the rack in mid-August and continued spawning as late as the third week in October.

DRAFT WILLAMETTE SUBBASIN PLAN
CH 3 ASSESSMENT.DOC 3-95
The timing of the run in the McKenzie River is monitored at Leaburg Dam, where passageusually peaks in June (Howell et al., 1988). A smaller pulse moves above the dam during theSeptember spawning period. The period of peak passage appears to depend on temperature,occurring as early as the second half of May in warmer water years and as late as the firstpart of July in cooler years. Homolka and Downey (1995) calculated that spring Chinooksalmon upstream of Leaburg Dam spawned from very late August until mid-October in 1992,with the peak centered on September 23. In comparison, from 1902 through 1907, hatcheryoperations on the McKenzie began egg takes in early- to mid-August, and peak eggcollections generally occurred during the second week of September (Howell et al., 1988).The McKenzie River spawn timing observed in 1992 was a considerable shift from thehistorical pattern (Homolka and Downey 1995). In comparison to historical patterns, thecurrent duration of the spawning period appears to have decreased by two-thirds or morefrom 1919 through 1985 (Lichatowich, 2000).
Above Willamette Falls, native spring Chinook declined in abundance and distribution afterthe construction of the Willamette Valley dams. In the 1940s, state biologists surveyed themiddle and upper basin and estimated that nearly 48 percent of the spring Chinook spawninghabitat would be lost with construction of the dams in the McKenzie, Santiam, and MiddleFork Willamette rivers (Fish Commission of Oregon, 1948). Notably, only 400 miles ofspawning and rearing habitat remain today (Oregon Department of Fish and Wildlife, 2000a).
Changes in water temperature regimes from the dams have affected Upper Willamette springChinook spawn timing. Ingram and Korn (1969) reported that the timing of adult Chinooksalmon reaching the Cougar Dam trap and haul facility changed after the project wascompleted (1964). About 60 percent of the run passed upstream in June during the 4 yearsbefore impoundment, but almost all passed upstream after June in 1964, 1965, and 1966.Mattson (1962) noted that, as a result of the thermal effects of Lookout Point and Dexterdams, spawning below Dexter was delayed until early October and lasted through November.Surveys above and below Fall Creek Dam in 1969 showed that spawning started in early- tomid-September and was completed by mid-October (Oregon Department of Fish andWildlife, 1990). However, because naturally produced fish now make up a minute portion ofthe Middle Fork Willamette Subbasin population, little is known about the time of entry orspawning of the wild stock.
Adult Productivity and Abundance. The productivity and abundance of adult springChinook in subbasins throughout the Willamette Basin are described below. This is followedby information on distribution—again, organized by subbasin.
Calapooia Subbasin. A small run of spring Chinook salmon historically existed in theCalapooia River. Parkhurst et al. (1950) reported that the run size in 1941 was approximately200 adults, while Mattson (1948) estimated the run at 30 adults in 1947.
A 2002 survey of 11.1 miles of stream in the Calapooia above Brownsville found 16 redds(Schroeder et al., 2002). The carcasses recovered in the Calapooia in 2002 were toodecomposed to determine the presence or absence of fin clips. However, it was assumed thatall the fish were surplus hatchery fish outplanted from the South Santiam hatchery(Schroeder et al., 2002). The Calapooia natural spring Chinook population is believed to beextirpated (Nicholas, 1995).

DRAFT WILLAMETTE SUBBASIN PLAN
3-96 CH 3 ASSESSMENT.DOC
Hatchery releases to the Calapooia River from 1981 to 2002 are shown in Table 3-27.
Table 3-27: Hatchery Releases to the Calapooia, 1981-2002
Calapooia River Spring-Run DIP—Spring-Run Releases Total Releases
Watershed Duration Years Source (Within ESU) (Outside ESU)
Calapooia 1981-1985 2 Santiam R. 46,188
1982-1985 4 Willamette R. 500,522
1991-1996 6 Dexter Ponds 3,698,362
1993-1997 4 McKenzie 2,596,851
1996 1 Bonneville (So. Santiam) 960,660
Total 7,802,583 0
Source: Northwest Fisheries Science Center, 2003.
Clackamas River Subbasin. The Clackamas River historically contained a spring run of Chinooksalmon, but relatively little information about that native run exists. Barin (1886) observed arun of Chinook salmon that “commences in March or April, sometimes even in February.”The construction of the Cazadero Dam in 1904 (River Kilometer [RKm] 43) and River MillDam in 1911 (RKm 37) limited migratory access to the majority of the historical spawninghabitat for the spring run. In 1917, the fish ladder at Cazadero Dam was destroyed byfloodwaters, eliminating fish passage to the upper basin (Oregon Department of Fish andWildlife, 1992). Hatchery production of spring-run Chinook salmon in the basin continuedusing broodstock captured at the Cazadero and River Mill dams (Willis et al., 1995).
Transfers of upper Willamette River hatchery stocks (primarily from the McKenzie RiverHatchery) began in 1913, and between 1913 and 1959 more than 21.3 million eggs weretransferred to the Clackamas River Basin (Wallis, 1961, 1962, and 1963). Furthermore, alarge proportion of the transfers occurred during the late 1920s and early 1930s tosupplement the failure of the runs in the Clackamas River Basin at that time (Leach, 1932).In 1942, spring-run Chinook salmon propagation programs in the Clackamas River Basinwere discontinued.
The recolonization of the upper Clackamas River progressed very slowly, with the averageannual dam count (River Mill or North Fork Dam) from 1952 to 1959 being 461 (Murtagh etal., 1992). More importantly, 30 percent of the adult passage counts occurred in Septemberand October. Artificial propagation activities were restarted in 1956 using eggs from anumber of upper Willamette River hatchery stocks. The program released approximately600,000 smolts annually through 1985. In 1976, the ODFW Clackamas Hatchery (locatedbelow River Mill Dam) began releasing spring-run Chinook salmon; Willamette Riverhatchery broodstocks were used because it was believed that the returns from the localpopulation were too small to meet the needs of the hatchery (Murtagh et al., 1992)). Increasesin adult returns over the North Fork Dam and increases in redd counts above the North ForkReservoir corresponded to the initial return of adults to the hatchery in 1980 (OregonDepartment of Fish and Wildlife, 1992; Willis et al., 1995). Adult counts over North ForkDam rose from 592 in 1979 to 2,122 in 1980 (Murtagh et al., 1992). Recent changes in
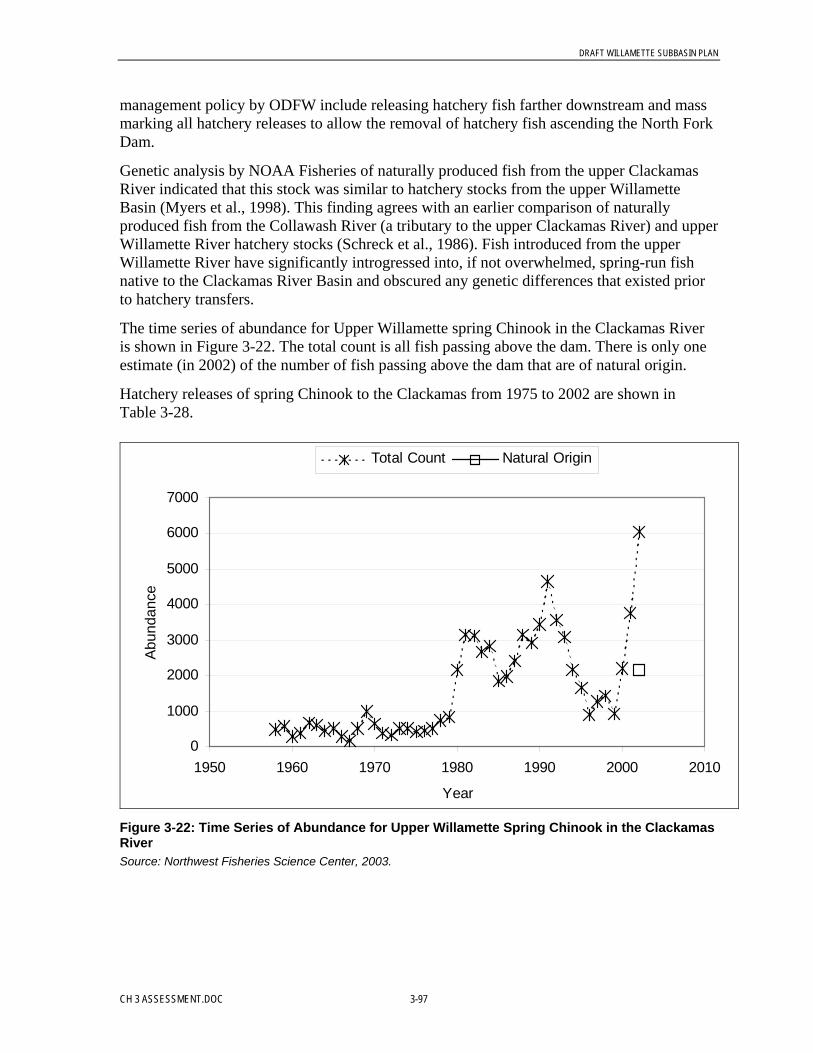
DRAFT WILLAMETTE SUBBASIN PLAN
CH 3 ASSESSMENT.DOC 3-97
management policy by ODFW include releasing hatchery fish farther downstream and massmarking all hatchery releases to allow the removal of hatchery fish ascending the North ForkDam.
Genetic analysis by NOAA Fisheries of naturally produced fish from the upper ClackamasRiver indicated that this stock was similar to hatchery stocks from the upper WillametteBasin (Myers et al., 1998). This finding agrees with an earlier comparison of naturallyproduced fish from the Collawash River (a tributary to the upper Clackamas River) and upperWillamette River hatchery stocks (Schreck et al., 1986). Fish introduced from the upperWillamette River have significantly introgressed into, if not overwhelmed, spring-run fishnative to the Clackamas River Basin and obscured any genetic differences that existed priorto hatchery transfers.
The time series of abundance for Upper Willamette spring Chinook in the Clackamas Riveris shown in Figure 3-22. The total count is all fish passing above the dam. There is only oneestimate (in 2002) of the number of fish passing above the dam that are of natural origin.
Hatchery releases of spring Chinook to the Clackamas from 1975 to 2002 are shown inTable 3-28.
0
1000
2000
3000
4000
5000
6000
7000
1950 1960 1970 1980 1990 2000 2010
Year
Abu
ndan
ce
Total Count Natural Origin
Figure 3-22: Time Series of Abundance for Upper Willamette Spring Chinook in the ClackamasRiverSource: Northwest Fisheries Science Center, 2003.
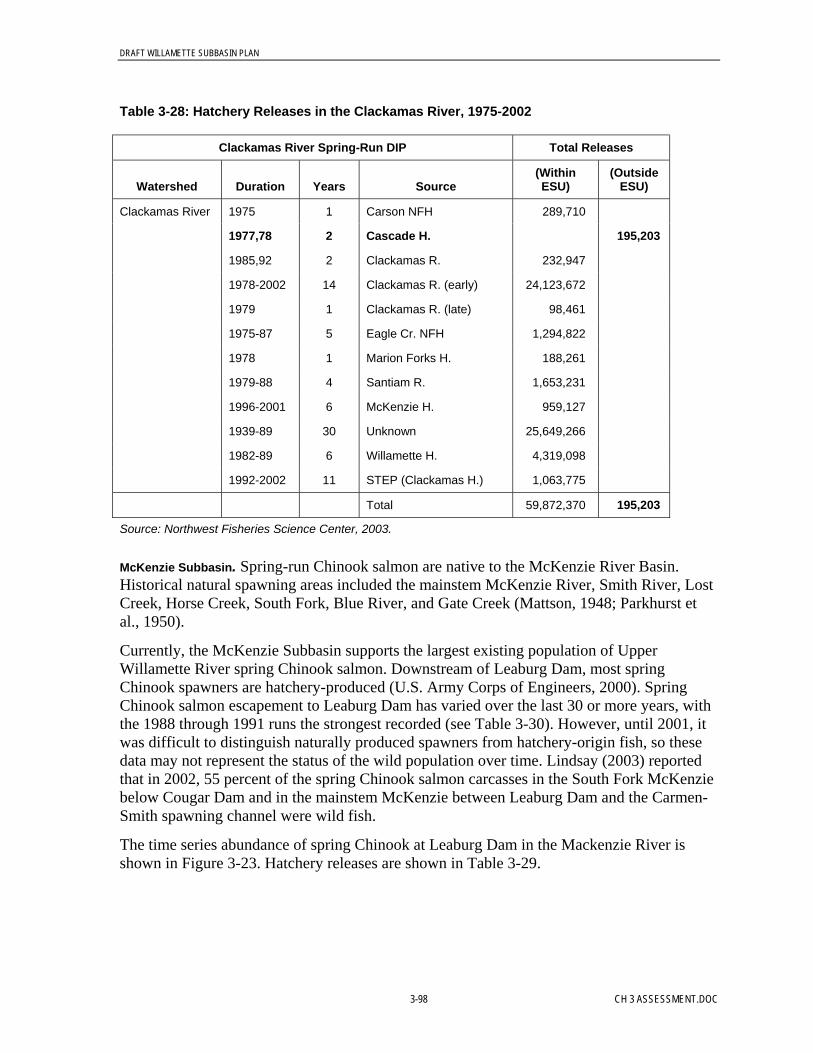
DRAFT WILLAMETTE SUBBASIN PLAN
3-98 CH 3 ASSESSMENT.DOC
Table 3-28: Hatchery Releases in the Clackamas River, 1975-2002
Clackamas River Spring-Run DIP Total Releases
Watershed Duration Years Source(WithinESU)
(OutsideESU)
Clackamas River 1975 1 Carson NFH 289,710
1977,78 2 Cascade H. 0 195,203
1985,92 2 Clackamas R. 232,947
1978-2002 14 Clackamas R. (early) 24,123,672
1979 1 Clackamas R. (late) 98,461
1975-87 5 Eagle Cr. NFH 1,294,822
1978 1 Marion Forks H. 188,261
1979-88 4 Santiam R. 1,653,231
1996-2001 6 McKenzie H. 959,127
1939-89 30 Unknown 25,649,266
1982-89 6 Willamette H. 4,319,098
1992-2002 11 STEP (Clackamas H.) 1,063,775
Total 59,872,370 195,203
Source: Northwest Fisheries Science Center, 2003.
McKenzie Subbasin. Spring-run Chinook salmon are native to the McKenzie River Basin.Historical natural spawning areas included the mainstem McKenzie River, Smith River, LostCreek, Horse Creek, South Fork, Blue River, and Gate Creek (Mattson, 1948; Parkhurst etal., 1950).
Currently, the McKenzie Subbasin supports the largest existing population of UpperWillamette River spring Chinook salmon. Downstream of Leaburg Dam, most springChinook spawners are hatchery-produced (U.S. Army Corps of Engineers, 2000). SpringChinook salmon escapement to Leaburg Dam has varied over the last 30 or more years, withthe 1988 through 1991 runs the strongest recorded (see Table 3-30). However, until 2001, itwas difficult to distinguish naturally produced spawners from hatchery-origin fish, so thesedata may not represent the status of the wild population over time. Lindsay (2003) reportedthat in 2002, 55 percent of the spring Chinook salmon carcasses in the South Fork McKenziebelow Cougar Dam and in the mainstem McKenzie between Leaburg Dam and the Carmen-Smith spawning channel were wild fish.
The time series abundance of spring Chinook at Leaburg Dam in the Mackenzie River isshown in Figure 3-23. Hatchery releases are shown in Table 3-29.

DRAFT WILLAMETTE SUBBASIN PLAN
CH 3 ASSESSMENT.DOC 3-99
0
1 0 0 0
2 0 0 0
3 0 0 0
4 0 0 0
5 0 0 0
6 0 0 0
7 0 0 0
8 0 0 0
1 9 6 5 1 9 7 0 1 9 7 5 1 9 8 0 1 9 8 5 1 9 9 0 1 9 9 5 2 0 0 0 2 0 0 5
Y e a r
Abu
ndan
ce
To ta l C o u n t N a tu ra l O rig in
Figure 3-23: Time Series of Abundance of Spring Chinook at Leaburg Dam in the MackenzieRiverSource: Northwest Fisheries Science Center, 2003.
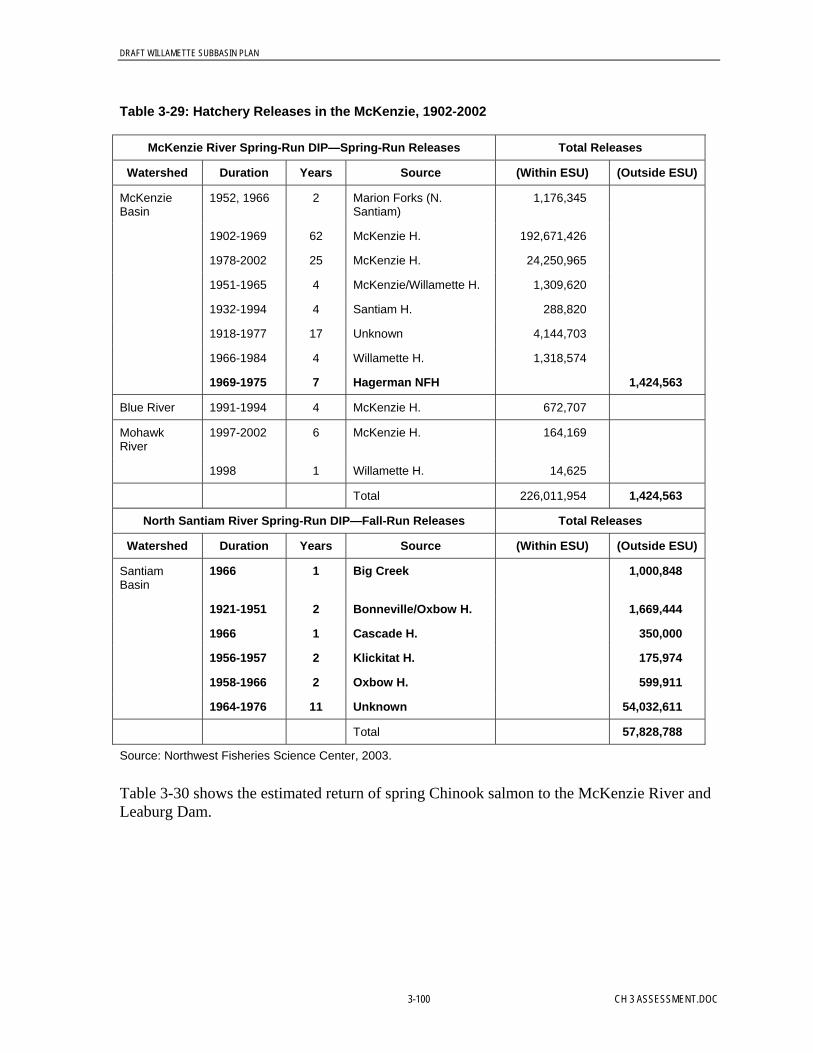
DRAFT WILLAMETTE SUBBASIN PLAN
3-100 CH 3 ASSESSMENT.DOC
Table 3-29: Hatchery Releases in the McKenzie, 1902-2002
McKenzie River Spring-Run DIP—Spring-Run Releases Total Releases
Watershed Duration Years Source (Within ESU) (Outside ESU)
McKenzieBasin
1952, 1966 2 Marion Forks (N.Santiam)
1,176,345
1902-1969 62 McKenzie H. 192,671,426
1978-2002 25 McKenzie H. 24,250,965
1951-1965 4 McKenzie/Willamette H. 1,309,620
1932-1994 4 Santiam H. 288,820
1918-1977 17 Unknown 4,144,703
1966-1984 4 Willamette H. 1,318,574
1969-1975 7 Hagerman NFH 0 1,424,563
Blue River 1991-1994 4 McKenzie H. 672,707 0
MohawkRiver
1997-2002 6 McKenzie H. 164,169 0
1998 1 Willamette H. 14,625 0
Total 226,011,954 1,424,563
North Santiam River Spring-Run DIP—Fall-Run Releases Total Releases
Watershed Duration Years Source (Within ESU) (Outside ESU)
SantiamBasin
1966 1 Big Creek 1,000,848
1921-1951 2 Bonneville/Oxbow H. 1,669,444
1966 1 Cascade H. 350,000
1956-1957 2 Klickitat H. 175,974
1958-1966 2 Oxbow H. 599,911
1964-1976 11 Unknown 54,032,611
Total 57,828,788
Source: Northwest Fisheries Science Center, 2003.
Table 3-30 shows the estimated return of spring Chinook salmon to the McKenzie River andLeaburg Dam.

DRAFT WILLAMETTE SUBBASIN PLAN
CH 3 ASSESSMENT.DOC 3-101
Table 3-30: Estimated Return of Spring Chinook Salmon to the McKenzie River andLeaburg Dam
Run YearTotal Escapement to
McKenzie RiverEscapement toLeaburg Dam
Percentage (No.) of NaturallyProduced Fish in Leaburg Dam
Escapement
1970 4,787 2,991 N/A1971 6,323 3,6021972 3,770 1,5471973 7,938 3,8701974 7,840 3,7171975 3,392 1,3741976 4,275 1,8991977 9,127 2,7141978 8,142 3,0581979 3,018 1,2191980 4,154 1,980 N/A1981 3,624 1,0781982 5,413 2,2411983 3,377 1,5611984 4,739 1,0001985 4,930 8251986 5,567 2,0611987 7,370 3,4551988 12,637 6,7531989 10,020 3,9761990 12,743 7,1151991 11,553 4,3591992 8,976 3,8161993 8,148 3,6171994 2,992 1,526 54% (825)1995 3,162 1,622 57% (933)1996 3,640 1,445 76% (1,105)1997 3,110 1,176 84% (991)1998 3,997 1,874 77% (1,415)1999 4,557 1,909 72% (1,383)2000 6,804 2,657 75% (1,985)2001 9,5481 4,428 76% (3,380)2002 4,4702
1 Includes an estimated 750 fish harvested below Leaburg Dam.2 Based on counts at Leaburg Dam, counts of naturally spawned carcasses, and the number of unmarked
fish taken for broodstock at Leaburg hatchery.
Source: Oregon Department of Fish and Wildlife, 2001.
DRAFT WILLAMETTE SUBBASIN PLAN
3-102 CH 3 ASSESSMENT.DOC
Middle Fork Willamette Subbasin. Historically, the Middle Fork Willamette River springChinook salmon run may have been the largest in the Upper Willamette Basin (Hutchison,1966; Thompson et al. 1966). Based on egg collections at the Willamette River Hatchery(Dexter Ponds, 1909 to the present), the largest egg collection, which was 11.3 million in1918 (Wallis, 1962), would correspond to 3,559 females (3,200 eggs per female). This leadsto an estimated minimum run size of approximately 7,100 adult spring Chinook for the areathat is now above Lookout Point Dam (U.S. Army Corps of Engineers, 2002). This estimatedoes not include fish that spawned downstream of the hatchery rack (such as in the mainstemMiddle Fork Willamette River below Dexter and in the Fall Creek watershed). Mattson(1948) estimated a run size of 2,550 naturally produced spring Chinook to the Middle ForkWillamette River in 1947. USFWS (1962) reported that approximately 450 spring Chinooksalmon spawned above the site of Fall Creek Dams in the years immediately beforeconstruction (the project was completed in 1966).
Currently, the naturally spawning population of spring Chinook salmon in the Middle ForkWillamette Subbasin is very small and probably is made up mostly of the progeny ofhatchery fish that were released to spawn in the wild. There is no estimate of the populationgrowth rate or productivity for naturally spawning spring Chinook salmon in the Middle ForkWillamette subbasin. Lindsay (2003) reported that 4 percent of the spring Chinook salmoncarcasses collected between Jasper and Dexter and in Fall Creek below the dam were wildfish.
From 1953 through 1966 (after the construction of Dexter and Lookout Point dams blockedaccess to the historical spawning grounds), an average of 3,502 Chinook salmon were caughtin the trap at the base of Dexter Dam (U.S. Army Corps of Engineers, 2000). These totalcounts probably included some hatchery-origin fish. Thompson et al. (1966) estimated a totalpopulation of 6,100 naturally and artificially produced adults in the Middle Fork WillametteSubbasin in the mid-1960s.
For the 1,150 spring Chinook salmon released above Fall Creek Reservoir during 2002,biologists observed only 121 redds below the natural falls (Ziller, 2002). The high ratio offish to redds indicates a high level of prespawning mortality, probably as a result of handlingin the trap and haul system. In the North Fork Middle Fork River, Ziller (2002) estimated 162redds over 35 miles of habitat. The ratio of 3,700 spawners to 162 redds also indicates a highlevel of prespawning mortality as a result of handling in the trap and haul system. Firman etal. (2002) estimated a natural-origin run of spring Chinook salmon to the Middle ForkWillamette subbasin of 987 fish in 2002, based on counts of naturally spawned carcasses andthe number of unmarked fish taken for hatchery broodstock at Dexter Dam.
It appears that the Middle Fork Willamette Subbasin does not currently support a self-sustaining population of naturally produced spring Chinook salmon. A small amount ofnatural production probably does occur from spawning both above and below the dams but isbased on ODFW’s releases of hatchery-origin adults into the upper Middle Fork above HillsCreek Reservoir since 1992 and into the North Fork of the Middle Fork above Lookout PointReservoir since 1999. Natural spawning occurs in the mainstem Middle Fork Willamettebelow Dexter Dam, although ODFW investigations indicated that warm water temperaturescause eggs to succumb to fungus infections, and those eggs that do survive produce juvenilesthat emerge early (Ziller et al., 2002).
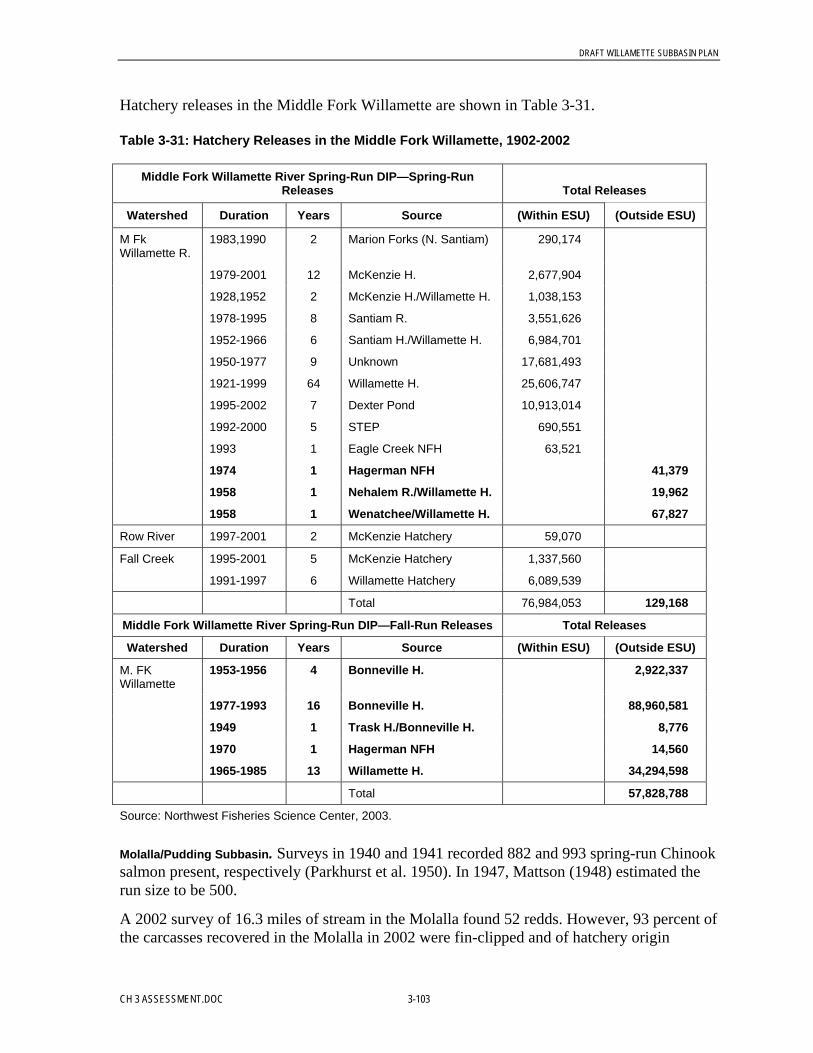
DRAFT WILLAMETTE SUBBASIN PLAN
CH 3 ASSESSMENT.DOC 3-103
Hatchery releases in the Middle Fork Willamette are shown in Table 3-31.
Table 3-31: Hatchery Releases in the Middle Fork Willamette, 1902-2002
Middle Fork Willamette River Spring-Run DIP—Spring-RunReleases Total Releases
Watershed Duration Years Source (Within ESU) (Outside ESU)
M FkWillamette R.
1983,1990 2 Marion Forks (N. Santiam) 290,174
1979-2001 12 McKenzie H. 2,677,904
1928,1952 2 McKenzie H./Willamette H. 1,038,153
1978-1995 8 Santiam R. 3,551,626
1952-1966 6 Santiam H./Willamette H. 6,984,701
1950-1977 9 Unknown 17,681,493
1921-1999 64 Willamette H. 25,606,747
1995-2002 7 Dexter Pond 10,913,014
1992-2000 5 STEP 690,551
1993 1 Eagle Creek NFH 63,521
1974 1 Hagerman NFH 0 41,379
1958 1 Nehalem R./Willamette H. 0 19,962
1958 1 Wenatchee/Willamette H. 0 67,827
Row River 1997-2001 2 McKenzie Hatchery 59,070 0
Fall Creek 1995-2001 5 McKenzie Hatchery 1,337,560 0
1991-1997 6 Willamette Hatchery 6,089,539 0
Total 76,984,053 129,168
Middle Fork Willamette River Spring-Run DIP—Fall-Run Releases Total Releases
Watershed Duration Years Source (Within ESU) (Outside ESU)
M. FKWillamette
1953-1956 4 Bonneville H. 2,922,337
1977-1993 16 Bonneville H. 88,960,581
1949 1 Trask H./Bonneville H. 8,776
1970 1 Hagerman NFH 14,560
1965-1985 13 Willamette H. 34,294,598
Total 57,828,788
Source: Northwest Fisheries Science Center, 2003.
Molalla/Pudding Subbasin. Surveys in 1940 and 1941 recorded 882 and 993 spring-run Chinooksalmon present, respectively (Parkhurst et al. 1950). In 1947, Mattson (1948) estimated therun size to be 500.
A 2002 survey of 16.3 miles of stream in the Molalla found 52 redds. However, 93 percent ofthe carcasses recovered in the Molalla in 2002 were fin-clipped and of hatchery origin
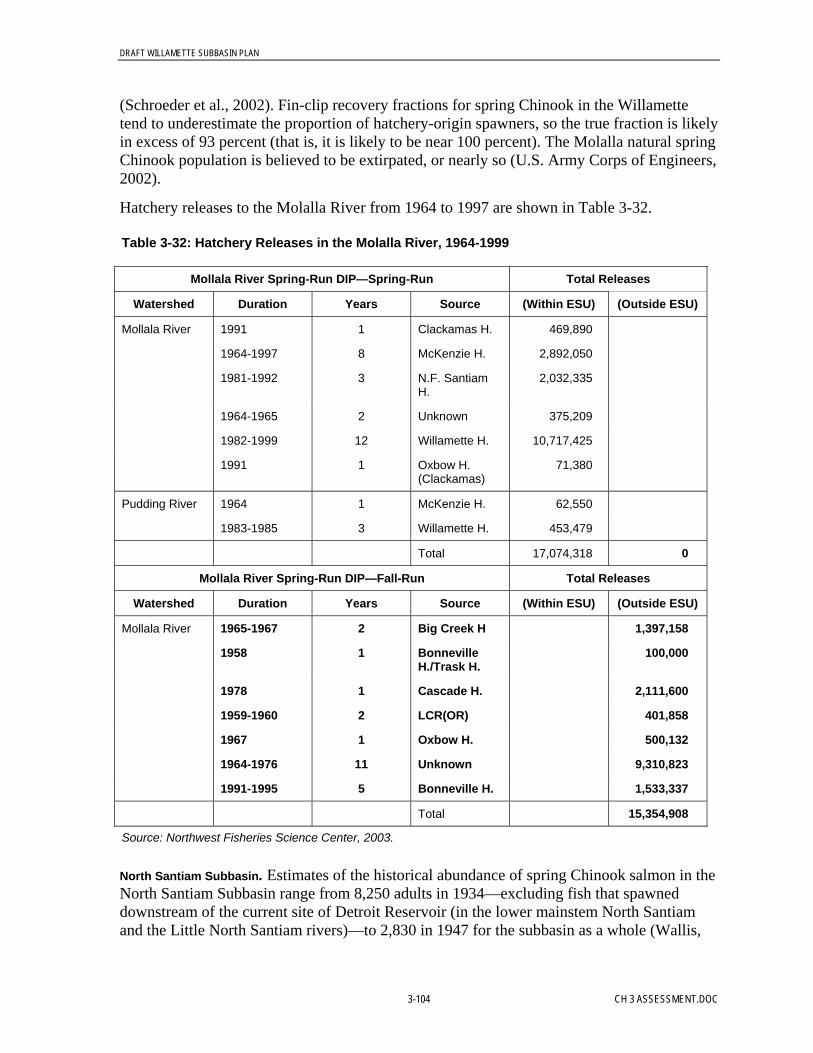
DRAFT WILLAMETTE SUBBASIN PLAN
3-104 CH 3 ASSESSMENT.DOC
(Schroeder et al., 2002). Fin-clip recovery fractions for spring Chinook in the Willamettetend to underestimate the proportion of hatchery-origin spawners, so the true fraction is likelyin excess of 93 percent (that is, it is likely to be near 100 percent). The Molalla natural springChinook population is believed to be extirpated, or nearly so (U.S. Army Corps of Engineers,2002).
Hatchery releases to the Molalla River from 1964 to 1997 are shown in Table 3-32.
Table 3-32: Hatchery Releases in the Molalla River, 1964-1999
Mollala River Spring-Run DIP—Spring-Run Total Releases
Watershed Duration Years Source (Within ESU) (Outside ESU)
Mollala River 1991 1 Clackamas H. 469,890
1964-1997 8 McKenzie H. 2,892,050
1981-1992 3 N.F. SantiamH.
2,032,335
1964-1965 2 Unknown 375,209
1982-1999 12 Willamette H. 10,717,425
1991 1 Oxbow H.(Clackamas)
71,380
Pudding River 1964 1 McKenzie H. 62,550
1983-1985 3 Willamette H. 453,479
Total 17,074,318 0
Mollala River Spring-Run DIP—Fall-Run Total Releases
Watershed Duration Years Source (Within ESU) (Outside ESU)
Mollala River 1965-1967 2 Big Creek H 1,397,158
1958 1 BonnevilleH./Trask H.
100,000
1978 1 Cascade H. 2,111,600
1959-1960 2 LCR(OR) 401,858
1967 1 Oxbow H. 500,132
1964-1976 11 Unknown 9,310,823
1991-1995 5 Bonneville H. 1,533,337
Total 15,354,908
Source: Northwest Fisheries Science Center, 2003.
North Santiam Subbasin. Estimates of the historical abundance of spring Chinook salmon in theNorth Santiam Subbasin range from 8,250 adults in 1934—excluding fish that spawneddownstream of the current site of Detroit Reservoir (in the lower mainstem North Santiamand the Little North Santiam rivers)—to 2,830 in 1947 for the subbasin as a whole (Wallis,

DRAFT WILLAMETTE SUBBASIN PLAN
CH 3 ASSESSMENT.DOC 3-105
1963; Mattson, 1948). Based on the proportion of marked hatchery adults at return versusrelease, ODFW (1995) concluded that fewer than 300 naturally produced spring Chinooksalmon adults returned to the subbasin in 1994.
Systematic aerial inventories of fall and spring Chinook salmon spawning within the SantiamRiver watershed began in 1970. During these inventories, it was difficult to distinguishbetween spring Chinook salmon and the introduced fall Chinook salmon redds because somuch introgression of fall Chinook spawning into areas once used by spring Chinook salmonhad occurred (U.S. Army Corps of Engineers, 2002). It is likely that only redds observed inthe uppermost reaches (upstream of Stayton on the North Santiam River) were attributed tospring Chinook salmon. From 1991 to 1994, redd counts in the North Santiam Riverupstream of the confluence with the Little Santiam ranged from 80 to 112 (Willis et al.,1995).
Because hatchery fish were not consistently marked prior to 1996, NOAA Fisheries cannotestimate a population growth rate for the natural-spawning population (U.S. Army Corps ofEngineers, 2002). ODFW has begun to address this problem by collecting otoliths fromadults caught in the sport fishery, on the spawning grounds, and at the Minto trap facility(Oregon Department of Fish and Wildlife, 1998). Lindsay (2003) reported that, based on theotolith data, 4 percent of the spring Chinook salmon carcasses collected between the Upperand Lower Bennett dams and Minto (including the Little North Santiam River) in 2000 werewild fish, that 2 percent collected in 2001 were wild fish, and that 8 percent collected in 2002were wild fish. Firman et al. (2002) estimated a natural-origin run of spring Chinook salmonto the North Santiam subbasin of 1,233 fish in 2002, based on passage at Upper and LowerBennett dams, counts of naturally spawned carcasses, and the number of unmarked fish takenfor hatchery broodstock at the Minto trap.
ODFW released a total of 933 hatchery-origin adults into the Breitenbush and North Santiamrivers in 2000 and 1,068 adults in 2001 to assess the potential for establishing a naturallyreproducing run above the reservoir. Limited surveys shortly after release indicate that thesefish spawned successfully, and snorkel surveys during the summer of 2001 confirmed thepresence of naturally produced juveniles (Mamoyac and Ziller, 2001). Hatchery releases tothe North Santiam from 1918-1994 and 1991-2002 are shown in Tables 3-33 and 3-34,respectively.
Spring Chinook salmon also spawn in the Little North Santiam River up to Henline Creek(Olsen et al., 1992). There appears to be declining numbers of fish in the system, with 801counted in 1946, 273 in 1954, 236 in 1971, and 242 in 1991 (Willis et al., 1995, BLMS,1998; U.S. Army Corps of Engineers, 2000); counts dropped below 16 per year during 1992through 1995 (Willis et al., 1995). In the period 1998 through 2001, redd counts in the LittleNorth Santiam varied from 11 to 39 (Lindsay et al., 1998).
The time series of abundance for Upper Willamette Spring Chinook North Santiam redds permile is shown in Figure 3-24. The number of stream miles surveyed varies from 26.8 to 43.5,and the total redds counted in a year varies from 116 to 310. It is estimated that more than 95percent of the spawners are of hatchery origin.
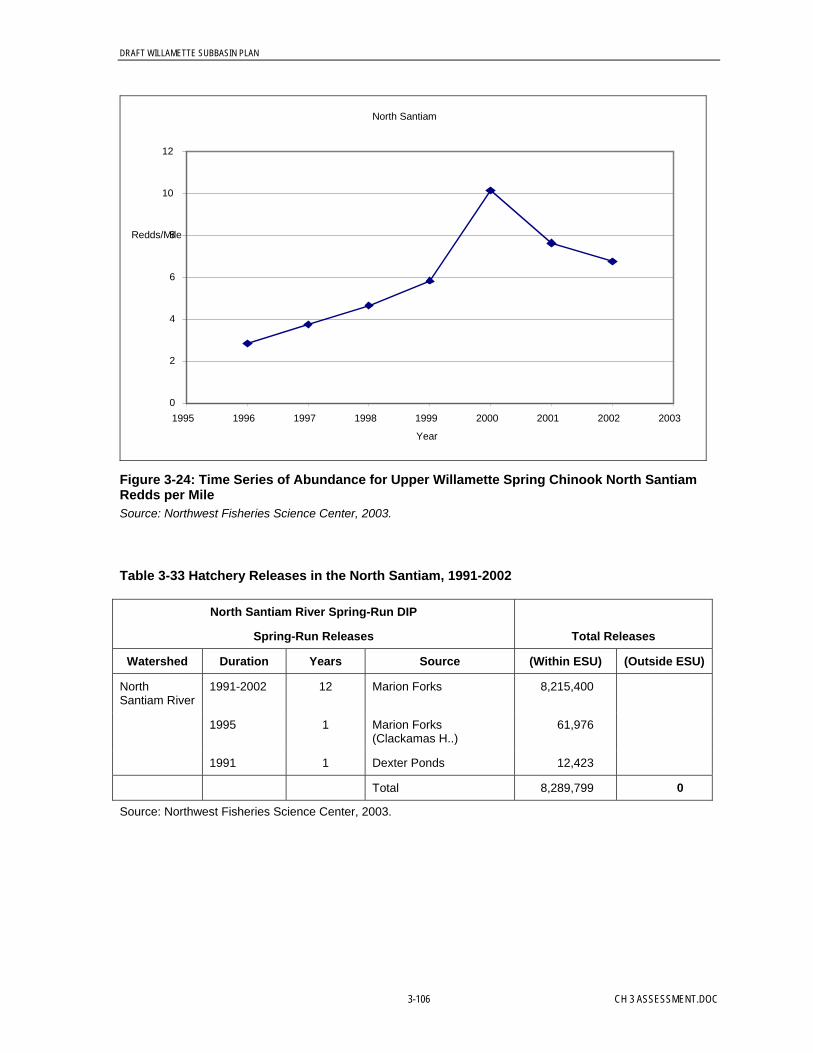
DRAFT WILLAMETTE SUBBASIN PLAN
3-106 CH 3 ASSESSMENT.DOC
North Santiam
0
2
4
6
8
10
12
1995 1996 1997 1998 1999 2000 2001 2002 2003
Year
Redds/Mile
Figure 3-24: Time Series of Abundance for Upper Willamette Spring Chinook North SantiamRedds per MileSource: Northwest Fisheries Science Center, 2003.
Table 3-33 Hatchery Releases in the North Santiam, 1991-2002
North Santiam River Spring-Run DIP
Spring-Run Releases Total Releases
Watershed Duration Years Source (Within ESU) (Outside ESU)
NorthSantiam River
1991-2002 12 Marion Forks 8,215,400
1995 1 Marion Forks(Clackamas H..)
61,976
1991 1 Dexter Ponds 12,423
Total 8,289,799 0
Source: Northwest Fisheries Science Center, 2003.

DRAFT WILLAMETTE SUBBASIN PLAN
CH 3 ASSESSMENT.DOC 3-107
Table 3-34: Hatchery Releases in the North Santiam, 1918-1994
North Santiam River Spring-Run DIP—Spring-Run Releases Total Releases
Watershed Duration Years Source (Within ESU) (Outside ESU)
Santiam Basin 1980-1981 2 Clackamas (early) 752,939
1923-1994 53 Marion Forks (N. Santiam) 87,932,370
1936-1937 2 Marion Forks/McKenzie 8,441,800
1961-1978 7 McKenzie H. 1,009,442
1941-1948 2 McKenzie/Santiam H. 1,63,717
1932-1994 46 Santiam H. 61,605,990
1963-1964 2 Santiam R./Willamette H 1,989,604
1918-1981 26 Unknown 16,976,462
1881-1986 6 Willamette H. 10,566,693
1965-1982 7 Carson NFH 0 1,416,271
1967-1975 4 Hagerman NFH 0 645,175
1962 1 Spring Creek NFH 0 191,298
Total 189,339,018 2,252,744
North Santiam River Spring-Run DIP—Fall-Run Releases Total Releases
Watershed Duration Years Source (Within ESU) (Outside ESU)
Santiam Basin 1966 1 Big Creek 1,000,848
1921-1951 2 Bonneville/Oxbow H. 1,669,444
1966 1 Cascade H. 350,000
1956-1957 2 Klickitat H. 175,974
1958-1966 2 Oxbow H. 599,911
1964-1976 11 Unknown 54,032,611
1991-1995 5 Bonneville H. 22,490,131
Total 80,318,919
Source: Northwest Fisheries Science Center, 2003.
South Santiam Subbasin. Mattson (1948) estimated an escapement of 1,300 spring Chinooksalmon to the South Santiam River in 1947. USFWS (1963) reported an annual spawning runof about 1,400 above the current site of Foster Dam. About 70 percent of these were destinedfor the Middle Santiam River (above the current site of Green Peter Dam), 7 percent spawnedin the reach that is now under Foster Reservoir, and 23 percent spawned in the South SantiamRiver above Foster. Thompson et al. (1966) estimated a total annual run size (natural- andhatchery-origin) of 3,700 adults during the 1960s. Estimates based on the sport catch andreturns to Foster Dam indicate that the minimum total (natural-origin plus hatchery-origin)

DRAFT WILLAMETTE SUBBASIN PLAN
3-108 CH 3 ASSESSMENT.DOC
run size to the subbasin during the 1970s and 1980s varied from less than 500 to nearly10,000 per year.
Spawning ground survey data reported in Lindsay et al. (1999) indicated a total of 163 springChinook salmon redds in the South Santiam below Foster Dam during September 1998. Reddcounts in the South Santiam River upstream of Lebanon Dam ranged from 10 to 144 duringthe period 1970 to 1993 (Willis et al., 1995). Firman et al. (2002) estimated a natural-originrun of spring Chinook salmon to the South Santiam subbasin of 965 fish in 2002, based oncounts of naturally spawned carcasses and the number of unmarked fish taken for hatcherybroodstock at Foster Dam. Based on otoliths, Lindsay (2003) found that 14 percent of thespring Chinook carcasses collected between Waterloo and Foster in 2002 were naturallyspawned fish. Snorkel surveys during 1998 through 2001 indicated significant naturalproduction of spring Chinook salmon in the South Santiam above Foster Reservoir (OregonDepartment of Fish and Wildlife, 2001).
Hatchery releases to the South Santiam from 1991 to 2002 are shown in Table 3-35.
Table 3-35: Hatchery Releases 1991-2002
South Santiam River Spring-Run DIP—Spring-Run Releases Total Releases
Watershed Duration Years Source (Within ESU) (Outside ESU)
SouthSantiam River
1991-2002 12 South Santiam 8,818,120
1998 1 McKenzie H. 242,000
1991-1996 6 Dexter Ponds 3,698,362
CrabtreeCreek
1994-1995 2 Dexter Ponds 50,157
1996-1998 3 Willamette Hatchery 81,168
ThomasCreek
1994-1995 2 Dexter Ponds 40.436
1996-1998 3 Willamette Hatchery 60,009
Total 12,949,856 s 0
South Santiam River Spring-Run DIP—Fall-Run Releases Total Releases
Watershed Duration Years Source (Within ESU) (Outside ESU)
NorthSantiam River
1991-1995 5 Bonneville H. 29,620,627
Total 29,620,627
Source: Northwest Fisheries Science Center, 2003.
Emergence and Juvenile Out-Migration or Movement. Upper Willamette spring Chinook salmonexhibit highly variable life history patterns. Fry emerge from February through March, andsometimes as late as June (Mattson, 1962). There appear to be three distinct phases ofjuvenile emigration out of the tributaries into the Willamette River:
DRAFT WILLAMETTE SUBBASIN PLAN
CH 3 ASSESSMENT.DOC 3-109
• Late winter to early spring as fry• Fall to early winter as fingerlings• Late winter through spring as yearling fish (Myers et al., 2003)
Historically, many of the juvenile fish resided for a period of time in the Willamette River. Inthe 1940s it was reported that large numbers of fry were present in the Willamette River fromFebruary through early April (Dimick and Merryfield, 1945).
Juvenile spring Chinook salmon begin their downstream migration from the North SantiamRiver at a variety of ages and sizes. Craig and Townsend (1946) showed that juveniles beganmoving downstream during March, soon after emergence. Changes in the water temperatureregimes below the dams also have affected juvenile out migration patterns. Cramer et al.(1996) report that Chinook salmon fry in the North Santiam River move downstream in lateNovember. This shift in emergence and migration timing is presumed to result from warmincubation temperatures below the dam. Emigration of juvenile fish was continuousthroughout summer and fall. Since the construction of Lookout Point and Dexter dams, therelease of warm water in the fall has accelerated the development of Chinook embryosdownstream, leading to early emergence (U.S. Army Corps of Engineers, 2000).
Homolka and Downey (1995) calculated emergence dates for spring Chinook in the SouthFork McKenzie based on USGS temperature data for 1992. Temperatures were below themedian lethal high temperature for Chinook eggs (61°F), indicating that eggs would incubatequickly but not necessarily die. Homolka and Downey predicted that fry spawned during themedian spawning week, which was centered on September 15, 1992, would emerge 57 daysearlier than fry from eggs incubated in Lost Creek and 99 days earlier than fry incubated inHorse Creek, two unregulated tributaries to the upper McKenzie River. Warm water out ofCougar and Blue River reservoirs also affected emergence timing in the mainstem McKenzieRiver some distance below the South Fork and Blue River; the calculated emergence date forredds in the South Fork below Cougar Dam was 36 days earlier than for redds 6 miles belowthe mouth of the South Fork near Finn Rock. Field sampling generally supported this pattern.Holmolka and Downey (1995) began catching fry in the lower South Fork in early Decemberand in the mainstem just below the South Fork during late January but did not catch the firstemergent fry upstream of the South Fork until late January through mid-March. The SouthFork of the McKenzie below Cougar Dam is an important spawning area. In 2002, 51 percentof the 922 spring Chinook salmon redds counted in the McKenzie Subbasin were below thedam (Schroeder et al., 2002), and presumably these redds were influenced by the warmerwater temperatures.
Habitat: Rearing, Refuge, and Forage. Juvenile McKenzie River spring Chinook salmondemonstrate a variety of out-migration and rearing patterns, varying in nature between years.Zakel and Reed (1984) defined three life history types of wild Chinook at Leaburg Dam:
• Age-0 fry that migrate in late winter through early spring• Age-0 fingerlings that migrate in the fall• Yearling smolts that migrate in early spring
During the spring after emergence, an unknown proportion of fry from the upper subbasinpass Leaburg Dam and move downstream to rear in reaches of the lower McKenzie and inthe Willamette Rivers (primarily between Harrisburg and Eugene). Juvenile spring Chinook
DRAFT WILLAMETTE SUBBASIN PLAN
3-110 CH 3 ASSESSMENT.DOC
salmon have been observed passing Willamette Falls as fry, but most appear to rear in thelower McKenzie and mainstem Willamette system. Studies in the 1960s confirm the patternof rearing in the mainstem of rivers. Scale analyses of returning adults indicated that only 10percent had entered the ocean as subyearlings, suggesting that a large proportion of thejuveniles observed migrating downstream had overwintered in the mainstem Willamette orColumbia rivers (Mattson ,1963). Some subyearlings have been observed in off-channelareas of the Willamette and the lower reaches of valley floor tributaries, and their movementsmay be timed to co-occur with (or may be triggered by) fall and early winter freshets, whichflood habitat that would be unsuitable during summer because of high temperatures and lowflow (Kenaston, 2003). ODFW has found spring Chinook fingerlings up some valley floortributaries as far as 20 miles from the mainstem. Juvenile spring Chinook have been observedduring the winter in seasonal streams in the lower Calapooia Subbasin (Colvin, Oregon StateUniversity, personal communication, 2004).
There are considerable differences in out-migration timing of native and hatchery-producedspring Chinook salmon (Kenaston, 2003). Most of the subyearlings PIT-tagged at LeaburgDam during the fall passed Willamette Falls the next spring (March though May). Thepassage of migrating yearlings tagged at Leaburg Dam during the spring peaked atWillamette Falls that May. The median transit time for tagged yearlings from Leaburg Damto Willamette Falls was 46 days in 2001 and 53 days in 2002 (Schroeder et al., 2001 and2002). In comparison, the median travel time to Willamette Falls for juvenile spring Chinookreleased from the Leaburg Hatchery was 6 days.
Population Distribution: Historical and Current Capacity. Maps showing the distributionof spring Chinook in the Willamette Basin are presented in Appendix E.
Calapooia Subbasin. Historically, spring Chinook salmon used the river between Holley(RM 45) and just upstream from the confluence with United States Creek (RM 80) forspawning and rearing (Wevers et al., 1992). Today, most of the spring Chinook salmonspawn upriver in the forested portion of the subbasin (RM 45). Parkhurst et al. (1950)estimated suitable habitat for 9,000 fish. In contrast, in the 1960s the estimated run size wasonly 100 to 500 fish (Willis et al., 1960). Nicholas (1995) considered the Calapooia River runextinct, with limited future production potential.
Clackamas River Subbasin. According to ODFW (2001), historical spawning byindigenous spring Chinook occurred in the upper Clackamas Basin in the mainstem and intributaries including Eagle Creek, Fish Creek, Roaring River, and the Collawash River.Access to spawning areas was severely impeded or prevented by the Faraday and River Milldams from 1906 to 1939. During this period, natural production of spring Chinook wasrestricted to the lower 23 miles of the Clackamas River and Eagle Creek. Passage intoupriver spawning areas was restored in 1940 and counts of spring Chinook past River MillDam in the early 1950s indicate recolonization of the upper basin. The source of the springChinook that recolonized the upper Clackamas Basin is not known. Most likely, in includedsome Clackamas fish that persisted below Faraday Dam, plus strays that were deterred fromtheir destination in upper Willamette River tributaries by passage problems at WillametteFalls (located just above the mouth of the Clackamas) and pollution in the lower Willamette.
Currently natural production habitat is thought to be relatively productive in at least theClackamas mainstem and tributaries above North Fork Dam. Spawning ground surveys for

DRAFT WILLAMETTE SUBBASIN PLAN
CH 3 ASSESSMENT.DOC 3-111
spring Chinook salmon were conducted in the Clackamas River basin from 1996 through1998 to document timing, distribution, and abundance of natural spawning. The mainstem ofthe upper Clackamas River above North Fork Dam is the most important spawning area forspring Chinook salmon accounting for an average of 85 percent of the reds in 3 years ofintensive surveys (1996 to 1998). Only 15 percent are accounted for in tributaries. Meanannual red counts in the upper mainstem in 1996 to 1999 were 236. Reds in the uppermainstem from Sisi Creek to the head of North Fork reservoir are fairly uniformly distributedwith the section from the mouth of the Collowash River to cripple Creek usually containingthe highest red densities. Of the tributaries, the Collowash River is the most used by springChinook in the basin. Spring Chinook salmon also spawned in the lower Clackamas Riverbelow River Mill Dam, but not as heavily as above North Fork Dam. The lower ClackamasRiver accounted for 11 percent of the total rent in the Clackamas Basin in 1998 when both ofher lower sections were surveyed. Although fall Chinook salmon also use the lowerClackamas River, spring Chinook predominate in the area just below River Mill dam.
McKenzie Subbasin. Historical spawning areas included the mainstem McKenzie River,Smith River, Lost Creek, Horse Creek, South Fork, Blue River, and Gate Creek (Mattson,1948; Parkhurst et al., 1950). It has been estimated that historically there was suitable habitatfor 80,000 fish in the McKenzie River Subbasin (Parkhurst et al., 1950). Construction ofCougar Dam at RM 4.5 on the South Fork McKenzie River in 1963 blocked access to at least25 miles of high-quality spawning habitat. The South Fork was considered the best springChinook salmon production area in the McKenzie Basin (U.S. Fish and Wildlife Service,1948). In 1956, 805 redds were observed in the South Fork (Willis et al., 1960). AlthoughCougar Dam was built with fish passage facilities, these did not function as intended andwere not used for this function after 1966. Construction of Blue River Dam (at RM 1.8 in1968) blocked a smaller amount of habitat; the Blue River watershed probably supported ahistorical population of about 200 adult Chinook salmon (WNF BRRD, 1996). The EugeneWater and Electric Board (EWEB) completed construction of its Carmen-Smith project onthe upper mainstem McKenzie River in 1963. Of the three dams that make up the Carmen-Smith project, Trail Bridge Dam cut off access to about 4 miles of historical spring Chinooksalmon spawning habitat and Smith Dam cut off about 3 miles. Carmen Dam is above anatural barrier to migration (Tamolich pool and falls).
Most of the current natural production of spring Chinook salmon is above Leaburg Dam (RM39). Based on aerial redd surveys, approximately 10 to 20 percent of the Chinook salmon thatspawn above Leaburg Dam use the lower few miles of the South Fork McKenzie River (thatis, below Cougar Dam), 30 to 40 percent spawn in the mainstem McKenzie below theconfluence with the South Fork, and 45 to 60 percent spawn in headwater areas above themouth of the South Fork up to Trail Bridge Dam (U.S. Fish and Wildlife Service, 1994;Oregon Department of Fish and Wildlife 1999a).
Middle Fork Willamette Subbasin. Historically, spring Chinook salmon in the Middle ForkWillamette Subbasin spawned in Fall Creek, Salmon Creek, the North Fork of the MiddleWillamette River, Salt Creek, and the mainstem Middle Fork Willamette River (Parkhurst etal., 1950). Mattson (1948) estimated that 98 percent of the 1947 run in the Middle ForkWillamette system spawned upstream of the Lookout Point dam site and that the remaining 2percent spawned upstream of the Fall Creek dam site. Construction of these dams restrictedthe population to only 20 percent of its historical spawning area, below Dexter/Lookout Point

DRAFT WILLAMETTE SUBBASIN PLAN
3-112 CH 3 ASSESSMENT.DOC
and above Fall Creek Reservoir (Oregon Department of Fish and Wildlife, 1990). In 1998, 10redds were observed in the reach between the town of Jasper and Dexter Dam, which was notused for spawning before the dams were built (Lindsay et al., 1999). ODFW (1998) statesthat there may be a small but unquantified amount of natural production in Little Fall Creek.
The Fall Creek Basin remains accessible to anadromous salmonids. Although Parkhurst et al.(1950) estimated that the Fall Creek Basin could support several thousand salmon, by 1938the run had already been severally depleted. In 1947, the run had dwindled to an estimated 60fish (Mattson, 1948). Construction of the Fall Creek Dam (1965) included fish passagefacilities, but passage is only possible during high flow years (Connolly et al., 1992). ODFW(1995) concluded that the native spring-run population was extinct, although some naturalproduction, presumably by hatchery-origin adults, still occurs. Of the 260 carcassesexamined from the Middle Fork Willamette River (including Fall Creek), 11 (4 percent) wereestimated to have been naturally produced (Schroder et al., 2003).
Molalla/Pudding River Subbasin. There is very little information on the historical run sizeor distribution of the Molalla spring Chinook population. By 1903, the abundance of springChinook salmon in the subbasin had already decreased dramatically (Myers et al., 2004).Surveys in 1940 and 1941 recorded 882 and 993 spawning spring Chinook salmon,respectively (Parkhurst et al., 1950). Surveys in the 1940s observed 250 spring Chinooksalmon in Abiqua Creek, a tributary to the Pudding River (Parkhust et al., 1950). It wasestimated in the 1950s that there was sufficient habitat in the Molalla River Subbasin toaccommodate at least 5,000 fish (Parkhurst et al., 1950).
The historical run of spring Chinook in the Molalla and Pudding watersheds was believed tohave declined to the point where it could no longer sustain a viable population during the1960s (Cramer et al., 1996). Hatchery releases of spring Chinook have been made in theMolalla watershed since 1981 in an attempt to restore the population, although there is noevidence that this population has become self-sustaining (U.S. Army Corps of Engineers,2000). There have been no recent observations of spring Chinook in the Pudding Riverwatershed (Oregon Department of Fish and Wildlife, 1999a).
North Santiam Subbasin. Historically, the mainstem North Santiam River was free ofnatural barriers up to its headwaters, approximately 35 mainstem miles above the current siteof Detroit Dam (WNF DRD, 1995). Before Detroit Dam was built, adult Chinook salmonspawned in the upper reaches of the North Santiam River and in headwater tributaries such asthe Breitenbush River, Blowout Creek, and Marion Creek (WNF DRD, 1994, 1996, and1997). Mattson (1948) estimated that 71 percent of the spring Chinook production in theNorth Santiam subbasin occurred above the dam site. Since dam construction, springChinook salmon have been restricted to the area below Big Cliff Dam. Spring Chinooksalmon spawn and rear primarily in the first 10 miles of the North Santiam River below theMinto barrier weir and trap (Schroder et al., 2001), but also as far downstream as Stayton.The historical spring Chinook spawning areas within the North Santiam River Subbasin werelocated just above the town of Stayton up through the upper mainstem (Mattson, 1948). Keyspawning tributaries included the Little North Fork and Breitenbush rivers. The mainstemSantiam River below the confluence with the North and South Santiam rivers also is believedto have supported spawning spring Chinook salmon (Wevers et al., 1992). Most of thehistorical spring Chinook salmon spawning habitat in the North Santiam Subbasin is now

DRAFT WILLAMETTE SUBBASIN PLAN
CH 3 ASSESSMENT.DOC 3-113
inaccessible because of dams. Detroit and Big Cliff Dam (RM 58) block access to the uppermainstem and Breitenbush River. Parkhurst et al. (1950) estimated that the historical habitatcould accommodate at least 30,000 adults.
Currently the Little North Santiam River watershed has the largest spring Chinook salmonproduction potential of all accessible streams in the Santiam River Subbasin (U.S. ArmyCorps of Engineers, 2002). Midsummer snorkel surveys of the Little North Santiam Riverduring the period 1991 to 1995 observed adult spring Chinook counts that ranged from 0 in1994 and 1995 to 242 in 1994. There are no dams on this tributary and it is not subjected tothe negative water temperature impacts from the storage reservoirs.
South Santiam Subbasin. Historically, spring Chinook salmon spawned in the mainstemSouth Santiam and Middle Santiam rivers and in all of their major tributaries, includingThomas, Crabtree, and Quartzville creeks (Thompson et. al, 1966; Fulton, 1968; WNFSHRD, 1995 and 1996). Construction of Foster and Green Peter dams blocked or impairedaccess into much of the area where Mattson (1948) observed Chinook spawning during 1947.
Beginning in 1996, ODFW transported and released spring Chinook that returned to theFoster trap into areas above Foster Reservoir in an effort to reestablish a naturally producingrun. The number released increased from 120 fish (in 1996) to 980 (in 2001) (Hunt, 2003).Snorkel surveys (1998 through 2001) indicated significant natural production in this area(Hunt, 2003). Of 762 adult spring Chinook released above Foster in 2002, most (92 percent)were unclipped (Hunt, 2003). ODFW also has released spring Chinook trapped at Foster intoCrabtree and Thomas creeks, tributaries to the South Santiam below Foster, as well as intoother Willamette basin tributaries (Abiqua Creek and the Calapooia River).
Historical Hatchery Production and Distribution of Spring ChinookNorth Santiam. Genetic analysis of naturally produced juveniles from the North SantiamRiver indicated that the naturally produced fish were most closely related to, although stillsignificantly different from, other naturally and hatchery-produced spring-run Chinook fromthe upper Willamette and Clackamas rivers (NMFS, 1998a). Fish marked in the NorthSantiam River return primarily to the North Santiam (95 percent); there are few recoveriesoutside the upper Willamette River basin (W/LC TRT, 2002).
The native population of spring Chinook in the North Santiam has been affected by hatcheryproduction since the first egg-take by the Oregon Fish Commission (OFC) in 1906 (Wallis,1963). Although over the past century most of the fish released into the North Santiam havecome from locally collected broodstock, stocks outside the ESU also have been released. Thecurrent program at Marion Forks Hatchery began in 1951, to mitigate for the loss of springChinook production upstream of Detroit and Big Cliff dams (completed in 1953). Hatcheryfish have probably spawned in the wild every year since this hatchery program began.Genetic analyses of naturally produced juveniles from the North Santiam River indicated thatthe fish were most closely related to other naturally and hatchery-produced spring Chinookfrom the Upper Willamette River ESU (although they were still significantly different,P>0.05; Myers et al., 1998). Wild fish probably have been incorporated into the hatcherybroodstock since the collections began at the Minto weir. However, until the 2001 returnyear, hatchery fish could not be distinguished from wild fish, and the numbers of hatcheryfish that have spawned in the wild and the numbers of wild fish that have been incorporatedinto the hatchery program have been unknown. Now that all hatchery fish are externally

DRAFT WILLAMETTE SUBBASIN PLAN
3-114 CH 3 ASSESSMENT.DOC
marked, the current management strategy, as outlined in NMFS (2000), is to incorporatesome wild fish into the broodstock (so that the hatchery broodstock reflects local adaptation)and to control the percentage of hatchery fish spawning in the wild. NOAA Fisheries’ currentBiological Opinion on the U.S. Army Corps of Engineers’ hatchery program for UpperWillamette River Chinook salmon expired in September 2003. The Biological Opinion isexpected to be updated in 2004.
McKenzie River. A number of hatcheries have operated on the McKenzie River since theearly 1900s. The McKenzie River Salmon Hatchery, located on Highway 126 betweenLeaburg and Vida, collects returning hatchery adults and some spring Chinook of naturalorigin. The broodstock for this program originated from fish collected upstream at theLeaburg Trout Hatchery (near Leaburg Dam) and from mainstem reaches and tributaries ofthe McKenzie River. Relatively few intrabasin transfers have been received compared toother Upper Willamette River Chinook salmon hatchery stocks. ODFW’s (1998) WillametteBasin Fish Management Plan called for incorporating 10 to 25 percent natural-origin fishinto the broodstock each year. However, until 2001, when all of the hatchery fish (throughage 5) returning to the McKenzie were fin-clipped, the unmarked fish collected forbroodstock may have included some of hatchery origin. Since 1996, the percentage of thebroodstock of known natural origin has ranged from 9 percent to 25 percent (Kruzic, 2003);according to ODFW (2003), an average of at least 15 percent wild fish has been incorporatedinto the McKenzie Hatchery broodstock each year since 1997. NOAA Fisheries’ BiologicalOpinion on the U.S. Army Corps of Engineers hatchery program for Upper Willamette RiverChinook salmon expired in September 2003. The Biological Opinion is expected to beupdated in 2004.
Conversely, the rate of spawning by hatchery Chinook salmon in the wild has been high;hatchery fish constituted 63, 59, and 47 percent of the natural spawners below Leaburg Damin 1990, 1994, and 1995, respectively (Willis et al., 1995). ODFW (1998) found that coded-wire tags collected from carcasses in the McKenzie River below Leaburg Dam includedstrays from Clackamas and South Santiam hatchery stocks that had been transferred toMcKenzie Hatchery for rearing but then released in the Clackamas and South Santiamsubbasins. Similar recoveries of non-McKenzie hatchery stock were made in 1997 (ODFW,1997). To limit introgression of hatchery fish into the naturally spawning population, NMFS(2000) directed the federal action agencies for the Willamette Basin hatchery program (theU.S. Army Corps of Engineers and BPA) to limit the number of hatchery-origin fish allowedto pass above Leaburg Dam. However, the Leaburg trap has been inadequate for removing allthe hatchery fish during the peak of the run without some level of injury to natural-originfish.5
South Santiam. Hatchery-produced spring Chinook have been present in the South SantiamRiver since egg collection activities began in 1923, when a weir was placed across the rivernear the town of Foster (Mattson, 1948; Wallis, 1961). Sporadic and inefficient operation ofthe weir probably allowed a large portion of the run to escape upstream (Wallis, 1961). Inother years, the hatchery may have taken all the naturally produced adults each year for
5 The U.S. Army Corps of Engineers, ODFW, and EWEB are currently developing plans to improve the Leaburg laddertrapping facility.
DRAFT WILLAMETTE SUBBASIN PLAN
CH 3 ASSESSMENT.DOC 3-115
broodstock. The South Santiam Hatchery began operations in 1966 to mitigate for FosterDam, which blocked spring Chinook salmon from nearly all their historical spawning areas.
Hatchery fish have probably spawned naturally below Foster Dam. Schroeder et al. (2002)reported that 84 percent of the carcasses on the South Santiam spawning grounds6 in 2002were fin-clipped, compared to 73 percent in the North Santiam and 77 percent in the MiddleFork Willamette subbasin. Most freshwater coded-wire tag recoveries from South Santiamhatchery spring Chinook salmon were made within 6 miles of the hatchery of origin (W/LCTRT, 2002).
Middle Fork Willamette. Hatchery Chinook were first released in the Middle ForkWillamette Subbasin in 1919 (ODFW, 1990). Before 1950, two temporary collecting rackswere set up in the Middle Fork each year, one about 2 miles above the town of Oakridge andthe other 1 mile above the mouth of Salmon Creek (Mattson, 1948; ODFW, 1990). Little isknown about the contribution of hatchery releases to subbasin production during this period,but few adults are believed to have returned from releases made before the 1960s because ofpoor hatchery practices (Howell et al., 1985; ODFW, 1990).
The Willamette Hatchery, built as mitigation for lost production above U.S. Army Corps ofEngineers dams, is located on the Middle Fork Willamette River near the town of Oakridge.Stock for the Willamette Hatchery comes from collection facilities at Dexter Dam and atFoster Dam on the South Santiam River (U.S. Army Corps of Engineers, 1997). Smolts havebeen released below Dexter each year since dam construction; fry and fingerlings have beenreleased in Fall Creek Reservoir each year since Fall Creek Dam was completed (1965),except that no releases were made during 1970.
It is likely that hatchery-origin spring Chinook salmon have spawned naturally below DexterDam since the hatchery began operations and upstream passage was blocked by the dams.Hatchery fish were not marked until recently, so the fraction of natural spawners that were ofhatchery origin was unknown. Surveys by ODFW have shown low numbers of Chinookspawning below Dexter Dam, which suggests that natural production in this reach, whetherof hatchery- or natural-origin fish, is low. Of the 8,330 spring Chinook captured at thehatchery trap in 2002, 9.5 percent were unmarked (that is, naturally produced) (Firman,2003). This suggests that some level of natural production is still occurring in the MiddleFork, either from spawning below Dexter Dam or from adults outplanted above Dexter andLookout Point dams to spawn in historical habitat. NOAA Fisheries’ current biologicalopinion on the U.S. Army Corps of Engineers hatchery program for Upper Willamette RiverChinook salmon will expire in September 2003.
3.2.4.2 Winter Steelhead Life History, Population Status, and TrendsOf the three runs of steelhead currently found in the Upper Willamette River ESU, only thelate-run winter steelhead is considered to be native (Myers et al., 2003). Summer and fall-runsteelhead populations have been introduced to the Willamette River system. The same flowconditions at the Willamette Falls that distinguish Upper Willamette spring Chinook alsodistinguish winter steelhead. Flow conditions at the falls blocked access for steelhead during
6 Spawning ground surveys covered the mainstem South Santiam below Foster Dam and Thomas, Crabtree, and Wiley creeks(Schroeder et al., 2002).

DRAFT WILLAMETTE SUBBASIN PLAN
3-116 CH 3 ASSESSMENT.DOC
fall and summer months prior to construction of the locks. The native late-run wintersteelhead are distinguished from nonnative fall-run steelhead by the date of passage atWillamette Falls—February 15. Those fish ascending the falls prior to February 15 areconsidered introduced, nonnative early-run steelhead and those ascending after February 15are considered native late-run steelhead (McElhany, 2003b).
Winter steelhead are only considered native to the eastside tributaries draining the CascadeRange. No native historical populations of winter steelhead existed above the CalapooiaRiver Subbasin (McElhany, 2003b). Naturally spawning steelhead are present in westsidetributaries draining the Coast Range, although there is considerable debate as to whether theexisting fish are native or derived from introduced stocks (Myers et al., 2003). Wintersteelhead have been observed spawning in the Tualatin (Gales Creek), the Luckiamute,Rickreall Creek, and the Yamhill River. With the exception of Gales Creek in the TualatinSubbasin, Parkhurst et al. (1950) did not report the presence of any salmon or steelhead inwestside tributaries. Based on hatchery records, large numbers of early-run winter steelheadwere stocked in the Yamhill and Luckiamute rivers (Myers et al., 2003). ODFW observationssuggest that late-run winter steelhead may have recently colonized the Yamhill River(National Marine Fisheries Service, 1999a). With the exception of the Tualatin River, there islittle evidence to suggest that self-sustaining spawning aggregations of winter steelheadexisted historically in the westside tributaries (Myers et al., 2003).
Most of the populations of winter steelhead have a large introduced component. While countsat Willamette falls have increased in the last 3 years, the overall trend of winter steelhead isdeclining in the last 30 years (McElhany, 2003b). In 1982 it was estimated that 15 percent ofthe late-run winter steelhead ascending Willamette Falls were of hatchery origin (OregonDepartment of Fish and Wildlife, 1998). Through 1997, counts of native late-run wintersteelhead past Willamette Falls had a 5-year geometric mean abundance of just more than3,000 fish (Oregon Department of Fish and Wildlife, 1998). The North and South Santiamsubbasins have the only core and genetic legacy populations of winter steelhead in the UpperWillamette Basin (McElhany et al., 2003).
Life History Patterns and Diversity: Adult Migration and Spawning. Winter steelheadspend 1 to 4 years in the ocean before spawning. Stone (1878) reported that steelhead beganarriving at the base of Willamette Falls around Christmas but were most abundant in April.Spawning peaked in May and was completed by June. Dimick and Merryfield (1945) thoughtthat the bulk of the run occurred somewhat earlier, in January and February. Prior to damconstruction, some steelhead arrived in the upper reaches of the Santiam system between lateMarch and the first of May, with spawning usually taking place between April and the first ofJune (Dimick and Merryfield, 1945). Winter steelhead spawn high in the Cascade tributarystreams and do not spawn in the mainstem of the Willamette River. There appears to be littlechange from historical spawn timing. Currently, winter steelhead return to the Minto trap onthe North Santiam from April through May (Wevers et al., 1992). Adult winter steelheadarrive at Foster Dam from February through June, with the peak of the run usually in mid-April, and there is no evidence that there has been a shift from the historical run timing(Oregon Department of Fish and Wildlife, 1990). Redd counts for winter steelhead in theUpper Willamette Basin are conducted in May.

DRAFT WILLAMETTE SUBBASIN PLAN
CH 3 ASSESSMENT.DOC 3-117
Life History Patterns and Diversity: Abundance and Population Trends. While there islittle historical information on the population status of upper Willamette River wintersteelhead, the geographic range and historical abundance are believed to be relatively smallin comparison to the range and abundance of other steelhead ESUs. The current productionof winter steelhead probably represents a larger proportion of historical production than is thecase in other Columbia Basin ESUs (Busby et al., 1996).
The limited data on winter steelhead adult escapement appear to indicate a decliningpopulation. Of the three winter steelhead subpopulations that have adequate adult escapementinformation to compute trends, the populations range from a 4.9 percent annual decline to a2.4 percent annual increase. However, none of these winter steelhead population trends issignificantly different from zero, indicating the precarious status of the stock. ODFW (1997)has determined that the South Santiam winter steelhead subpopulation is close to beingunable to sustain itself.
Calapooia Subbasin. A time series of redds-per-mile data from the Calapooia shows adeclining trend from 1980 to 2001 (WCS BRT, 2003). Based on indices of wild steelheadspawner abundance for the five Upper Willamette winter steelhead subpopulations, Chilcote(1998) determined that the Calapooia Subbasin meets the criteria for endangeredclassification (more than a 20 percent chance of extinction in 20 years).
The time series of abundance for winter steelhead in the Calapooia is shown in Figure 3-25.
Calapooia
0
2
4
6
8
10
12
14
16
18
1975 1980 1985 1990 1995 2000 2005
Year
Red
ds p
er M
ile
Figure 3-25: Time Series of Abundance for Upper Willamette Winter Steelhead in the CalapooiaSource: Northwest Fisheries Science Center, 2003.

DRAFT WILLAMETTE SUBBASIN PLAN
3-118 CH 3 ASSESSMENT.DOC
Molalla/Pudding Subbasin. The Molalla River currently contains three distinct runs ofsteelhead: native late-run winter steelhead, introduced early-run steelhead (from the LowerColumbia River and Puget Sound populations), and introduced Skamania Hatchery summer-run steelhead (Chilcote, 1997). Releases of the early-run steelhead into the Molalla Riverwere discontinued in 1997 (Chilcote, 1997), although some natural production of early-runwinter steelhead may still occur. Most of the life history information available for MolallaRiver steelhead is specific to introduced Big Creek Hatchery early-run winter steelheadrather than native late-run fish.
A time series of redds-per-mile data from the Molalla shows a declining trend from 1980 to2000 (WCS BRT 2003). Based on indices of wild steelhead spawner abundance for the fiveUpper Willamette winter steelhead subpopulations, Chilcote (1998) determined thatMolalla/Pudding Subbasin meets the criteria for endangered classification (more than a 20percent chance of extinction in 20 years).
Redd surveys for winter steelhead in the Molalla are shown in Figure 3-26. Hatchery releasesare shown in Table 3-36.
Mollala
0
5
10
15
20
25
30
1975 1980 1985 1990 1995 2000 2005
Year
Red
ds p
er M
ile
Figure 3-26: Redd Surveys of Winter Steelhead in the Molalla RiverSource: Northwest Fisheries Science Center, 2003.

DRAFT WILLAMETTE SUBBASIN PLAN
CH 3 ASSESSMENT.DOC 3-119
Table 3-36: Winter Steelhead Hatchery Releases in the Mollala, 1957–1997
Watershed Duration Years Source (Within ESU) (Outside ESU) Run
Molalla River 1970-1996 10 Gnat Creek 497,922 W
1984-1997 7 Skamania 909,134 S
1976-1993 17 Big Creek Stock 908,516 W
1970-1974 4 Alsea R. (Fall Cr.H.)
156,683 W
1957-1977 6 Marion Forks/S.Santiam
270,912 0 W
1982 1 Marion Forks 23,492 0 W
Total 294,404 2,472,255
Source: Northwest Fisheries Science Center, 2003.
North Santiam Subbasin. Surveys performed in 1940 estimated at least 2,000 steelheadspawning in the mainstem North Santiam, with additional runs to the Breitenbush, MarionFork, and Little North Santiam rivers (Parkhurst et al., 1950). Thompson et al. (1966)estimated that the subbasin supported a population of 3,500 winter steelhead in the 1950s and1960s, including adults trapped at Minto. Escapement to the Minto trap averaged 446 fishduring the period 1971 through 1997. ODFW’s (2001) redd count data show decliningnumbers of naturally spawned steelhead in the North Santiam over the period 1983 through2000. The 6-year moving average of approximately 21 natural preharvest spawners appearsto have been stable for several years (U.S. Army Corps of Engineers, 2002).
Redd surveys of winter steelhead in the North Santiam are shown in Figure 3-27. Figure 3-28shows the time series of abundance for winter steelhead in the North Santiam at Minto. Thefact that Minto is a hatchery-acclimation pond and release site suggests that the majority offish are of hatchery origin.
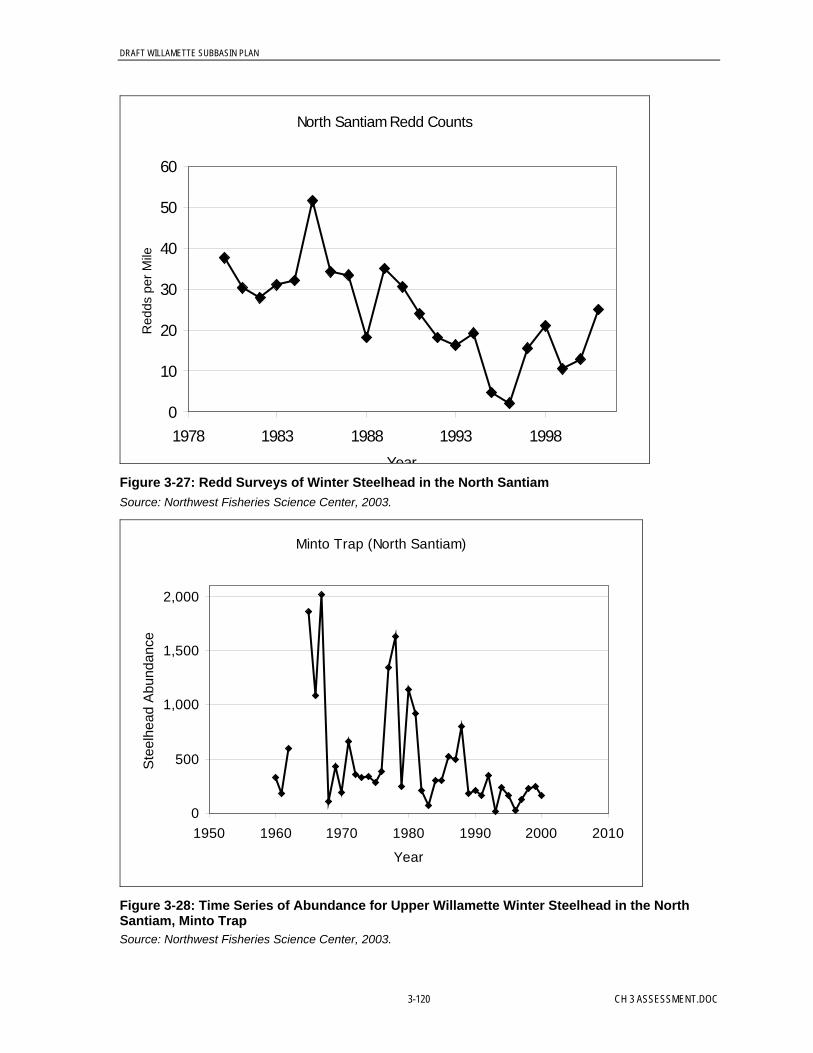
DRAFT WILLAMETTE SUBBASIN PLAN
3-120 CH 3 ASSESSMENT.DOC
North Santiam Redd Counts
0
10
20
30
40
50
60
1978 1983 1988 1993 1998Year
Red
ds p
er M
ile
Figure 3-27: Redd Surveys of Winter Steelhead in the North SantiamSource: Northwest Fisheries Science Center, 2003.
Minto Trap (North Santiam)
0
500
1,000
1,500
2,000
1950 1960 1970 1980 1990 2000 2010
Year
Ste
elhe
ad A
bund
ance
Figure 3-28: Time Series of Abundance for Upper Willamette Winter Steelhead in the NorthSantiam, Minto TrapSource: Northwest Fisheries Science Center, 2003.

DRAFT WILLAMETTE SUBBASIN PLAN
CH 3 ASSESSMENT.DOC 3-121
Table 3-37 shows hatchery releases of winter steelhead to the North Santiam.
Table 3-37: Winter Steelhead Hatchery Releases in the North Santiam, 1931–2002
Watershed Duration Years Source (Within ESU) (Outside ESU) Run
NorthSantiamRiver
1931-1985 18 Marion Forks 11,528,482 NA
1968-1975 4 Unknown 394,191 NA
1983-1997 9 S. Santiam H.(Skamania
0 296,308 S
1991-1994 4 McKenzie H.(Skamania)
0 159,715 S
1991-1997 7 Roaring River(Skamania)
0 799,121 S
1998-2001 2 Marion Forks(Skamania)
324346 S
2001-2002 2 Minto Ponds 292,080 S
1976-1998 16 Marion Forks 2,267.428 0 W
1984 1 S. Santiam H 21,064 0 W
1969-1977 5 Unknown 354,692 0 W
Total 14,172,779 1,871,570
Source: Northwest Fisheries Science Center, 2003.
South Santiam Subbasin. Native late-run winter steelhead and introduced SkamaniaHatchery summer-run steelhead are both present in the south Santiam River. Hatcheryreleases have not occurred in this basin since 1989, and the proportion of hatchery-reared fishthat currently spawn naturally in the South Santiam river is believed to be less than 5 percent(Chilcote, 1997). Hatchery releases in the South Santiam are shown in Table 3-38.
Spawning ground surveys in the South Santiam Subbasin by personnel of the FishCommission of Oregon, Oregon State Game Commission, and Bureau of CommercialFisheries indicated a minimum annual spawning population of about 2,600 steelhead abovethe site of Foster Dam each year prior to the dam’s construction (U.S. Fish and WildlifeService, 1963). ODFW (2001) redd count data show declining numbers of wild spawners inthe South Santiam from 1983 through 1996. The 6-year moving average of approximately300 wild preharvest spawners appears to have been stable for several years (U.S. Army Corpof Engineers, 2002). Based on indices of wild steelhead spawner abundance for the fiveUpper Willamette winter steelhead subpopulations, Chilcote (1998) determined that theSouth Santiam Subbasin meets the criteria for endangered classification (more than a 20percent chance of extinction in 20 years).
Redd surveys of winter steelhead in the South Santiam are shown in Figure 3-29, whileFigure 3-30 shows the time series of abundance of steelhead in the South Santiam.

DRAFT WILLAMETTE SUBBASIN PLAN
3-122 CH 3 ASSESSMENT.DOC
South Santiam
0
5
10
15
20
25
30
35
1975 1980 1985 1990 1995 2000 2005Year
Red
ds p
er M
ile
Figure 3-29: Redd Surveys of Winter Steelhead in the South Santiam Below Foster DamSource: Northwest Fisheries Science Center, 2003.
Foster Dam (South Santiam)
0
1,000
2,000
3,000
4,000
1965 1970 1975 1980 1985 1990 1995 2000 2005
Year
Abu
ndan
ce
Total Winter Steelhead Natural Origin Steelhead
Figure 3-30: Time Series of Abundance for Upper Willamette Winter Steelhead South Santiam,Foster Dam
Source: Northwest Fisheries Science Center, 2003.
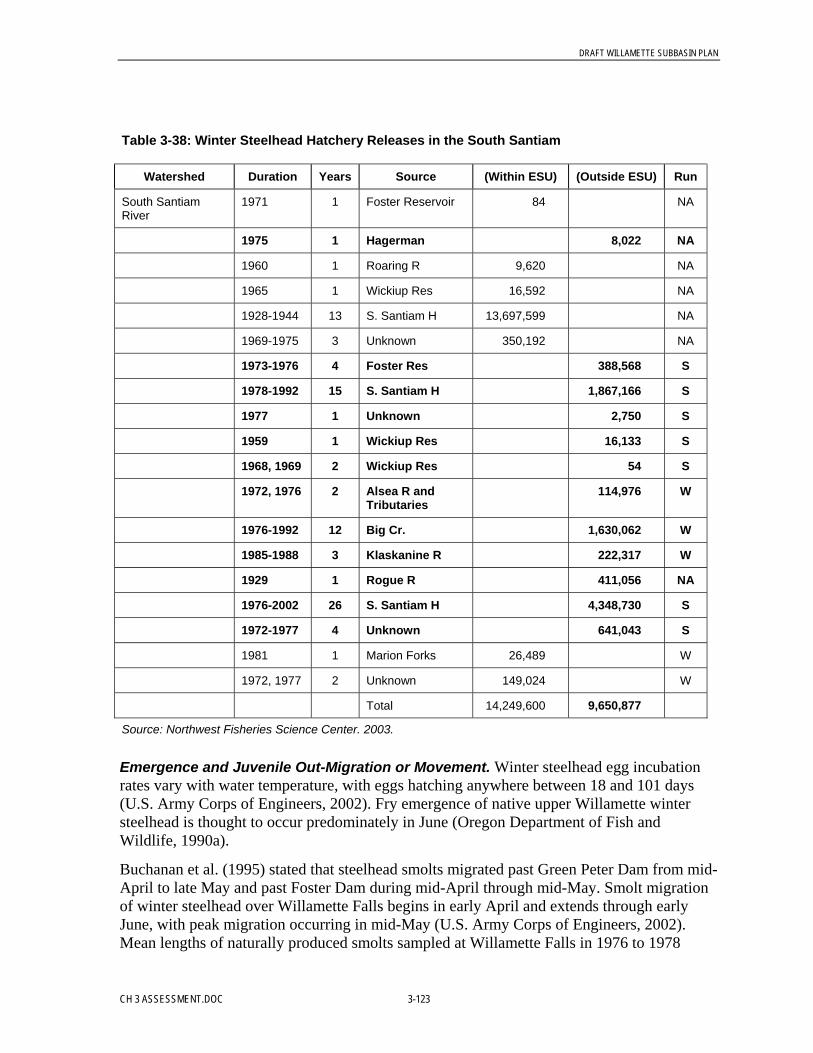
DRAFT WILLAMETTE SUBBASIN PLAN
CH 3 ASSESSMENT.DOC 3-123
Table 3-38: Winter Steelhead Hatchery Releases in the South Santiam
Watershed Duration Years Source (Within ESU) (Outside ESU) Run
South SantiamRiver
1971 1 Foster Reservoir 84 NA
1975 1 Hagerman 0 8,022 NA
1960 1 Roaring R 9,620 0 NA
1965 1 Wickiup Res 16,592 0 NA
1928-1944 13 S. Santiam H 13,697,599 0 NA
1969-1975 3 Unknown 350,192 0 NA
1973-1976 4 Foster Res 0 388,568 S
1978-1992 15 S. Santiam H 0 1,867,166 S
1977 1 Unknown 0 2,750 S
1959 1 Wickiup Res 0 16,133 S
1968, 1969 2 Wickiup Res 0 54 S
1972, 1976 2 Alsea R andTributaries
0 114,976 W
1976-1992 12 Big Cr. 0 1,630,062 W
1985-1988 3 Klaskanine R 0 222,317 W
1929 1 Rogue R 0 411,056 NA
1976-2002 26 S. Santiam H 0 4,348,730 S
1972-1977 4 Unknown 0 641,043 S
1981 1 Marion Forks 26,489 0 W
1972, 1977 2 Unknown 149,024 0 W
Total 14,249,600 9,650,877
Source: Northwest Fisheries Science Center. 2003.
Emergence and Juvenile Out-Migration or Movement. Winter steelhead egg incubationrates vary with water temperature, with eggs hatching anywhere between 18 and 101 days(U.S. Army Corps of Engineers, 2002). Fry emergence of native upper Willamette wintersteelhead is thought to occur predominately in June (Oregon Department of Fish andWildlife, 1990a).
Buchanan et al. (1995) stated that steelhead smolts migrated past Green Peter Dam from mid-April to late May and past Foster Dam during mid-April through mid-May. Smolt migrationof winter steelhead over Willamette Falls begins in early April and extends through earlyJune, with peak migration occurring in mid-May (U.S. Army Corps of Engineers, 2002).Mean lengths of naturally produced smolts sampled at Willamette Falls in 1976 to 1978
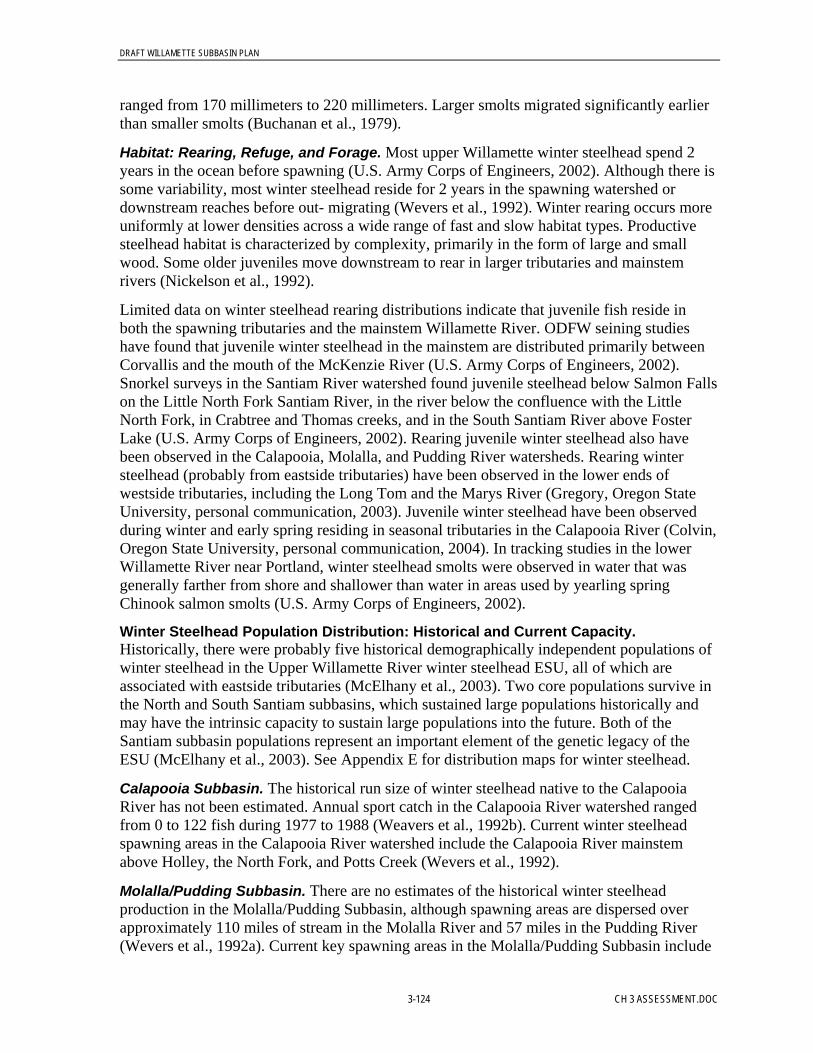
DRAFT WILLAMETTE SUBBASIN PLAN
3-124 CH 3 ASSESSMENT.DOC
ranged from 170 millimeters to 220 millimeters. Larger smolts migrated significantly earlierthan smaller smolts (Buchanan et al., 1979).
Habitat: Rearing, Refuge, and Forage. Most upper Willamette winter steelhead spend 2years in the ocean before spawning (U.S. Army Corps of Engineers, 2002). Although there issome variability, most winter steelhead reside for 2 years in the spawning watershed ordownstream reaches before out- migrating (Wevers et al., 1992). Winter rearing occurs moreuniformly at lower densities across a wide range of fast and slow habitat types. Productivesteelhead habitat is characterized by complexity, primarily in the form of large and smallwood. Some older juveniles move downstream to rear in larger tributaries and mainstemrivers (Nickelson et al., 1992).
Limited data on winter steelhead rearing distributions indicate that juvenile fish reside inboth the spawning tributaries and the mainstem Willamette River. ODFW seining studieshave found that juvenile winter steelhead in the mainstem are distributed primarily betweenCorvallis and the mouth of the McKenzie River (U.S. Army Corps of Engineers, 2002).Snorkel surveys in the Santiam River watershed found juvenile steelhead below Salmon Fallson the Little North Fork Santiam River, in the river below the confluence with the LittleNorth Fork, in Crabtree and Thomas creeks, and in the South Santiam River above FosterLake (U.S. Army Corps of Engineers, 2002). Rearing juvenile winter steelhead also havebeen observed in the Calapooia, Molalla, and Pudding River watersheds. Rearing wintersteelhead (probably from eastside tributaries) have been observed in the lower ends ofwestside tributaries, including the Long Tom and the Marys River (Gregory, Oregon StateUniversity, personal communication, 2003). Juvenile winter steelhead have been observedduring winter and early spring residing in seasonal tributaries in the Calapooia River (Colvin,Oregon State University, personal communication, 2004). In tracking studies in the lowerWillamette River near Portland, winter steelhead smolts were observed in water that wasgenerally farther from shore and shallower than water in areas used by yearling springChinook salmon smolts (U.S. Army Corps of Engineers, 2002).
Winter Steelhead Population Distribution: Historical and Current Capacity.Historically, there were probably five historical demographically independent populations ofwinter steelhead in the Upper Willamette River winter steelhead ESU, all of which areassociated with eastside tributaries (McElhany et al., 2003). Two core populations survive inthe North and South Santiam subbasins, which sustained large populations historically andmay have the intrinsic capacity to sustain large populations into the future. Both of theSantiam subbasin populations represent an important element of the genetic legacy of theESU (McElhany et al., 2003). See Appendix E for distribution maps for winter steelhead.
Calapooia Subbasin. The historical run size of winter steelhead native to the CalapooiaRiver has not been estimated. Annual sport catch in the Calapooia River watershed rangedfrom 0 to 122 fish during 1977 to 1988 (Weavers et al., 1992b). Current winter steelheadspawning areas in the Calapooia River watershed include the Calapooia River mainstemabove Holley, the North Fork, and Potts Creek (Wevers et al., 1992).
Molalla/Pudding Subbasin. There are no estimates of the historical winter steelheadproduction in the Molalla/Pudding Subbasin, although spawning areas are dispersed overapproximately 110 miles of stream in the Molalla River and 57 miles in the Pudding River(Wevers et al., 1992a). Current key spawning areas in the Molalla/Pudding Subbasin include

DRAFT WILLAMETTE SUBBASIN PLAN
CH 3 ASSESSMENT.DOC 3-125
the North Fork, Table Rock Fork, Milk Creek, and Copper Creek in the Molalla Riverwatershed and Butte and Abiqua creeks in the Pudding River watershed.
North Santiam Subbasin. Historically, winter steelhead spawning occurred throughout theupper mainstem North Santiam River, in all the major tributaries (such as the Breitenbushand Little North Santiam Rivers), and in many smaller tributaries (BLMS, 1998; Olsen et al.,1992; WNF DRD, 1994, 1995, 1996, 1997). Steelhead also used most of the mainstem NorthSantiam for spawning.
Since dam construction, winter steelhead have been restricted to the area below Big CliffDam, spawning in the mainstem both upstream of the Minto weir (to Big Cliff Dam) anddownstream of the weir and in tributaries, including the Little North Santiam River, MadCreek, and Rock Creek. Tributaries to the upper Little North Santiam River, such as ElkhornCreek and Sinker Creek, are also used extensively. Because spawning takes place primarilyin May, it is separated in time from that of spring Chinook salmon (which takes placeprimarily in September). Some spatial separation occurs as well (winter steelhead typicallyspawn in smaller streams than spring Chinook salmon), but there is considerable spatialoverlap in larger streams such as the mainstem North Santiam and the Little North SantiamRiver.
South Santiam Subbasin. Winter steelhead spawned historically in the upper SouthSantiam subbasin, above the sites of Foster and Green Peter dams. Buchanan et al. (1993)estimated that 2,600 winter steelhead spawned in the upper mainstem of the South SantiamRiver and in Thomas, Crabtree, McDowell, Wiley, Canyon, Moose, and Soda Fork creeks.However, inadequate downstream passage at Foster and Green Peter dams and inadequateupstream passage at the latter facility are believed to have caused a drastic reduction ofnative winter steelhead in the upper subbasin. For these reasons, ODFW has not passed adultwinter steelhead above Green Peter Dam since 1987. An average of 296 winter steelheadtrapped in the Foster ladder were released above the dam during 1996 to 2000; the numberrose to 728 in 2001 (Chilcote, 2001). Moose and Canyon creeks, which are tributaries to theSouth Santiam River above Foster Reservoir, are important areas for natural spawning (U.S.Army Corps of Engineers, 2000). Current key spawning areas in the South Santiam Subbasininclude Rock, Crabtree, Wiley, Canyon, and Moose creeks (Wevers et al., 1992).
Nonnative Populations. Nonnative populations of winter steelhead are found in severalwestside tributaries and in the McKenzie River.
Westside Tributaries (Tualatin, Yamhill, Rickreall, and Luckiamute Rivers). Naturally spawning wintersteelhead are currently found in several westside tributaries of the Willamette River;however, there is considerable debate on the origin of these fish. Surveys in 1940 reportedanecdotal information of steelhead spawning in Gales Creek, a tributary to the Tualatin River(Parkhurst et al., 1950). Numerous introductions of early-run winter steelhead (Big CreekHatchery stock) and late-run (North Santiam stock) winter steelhead have been made into theTualatin River; this makes it difficult to determine whether the existing fish represent nativeor introduced lineages. Parkhurst et al. (1950) did not report the presence of any salmon orsteelhead in the Yamhill, Rickreall, Luckiamute, and Marys rivers (although the surveyswere conducted during the summer months when only juveniles would be present).
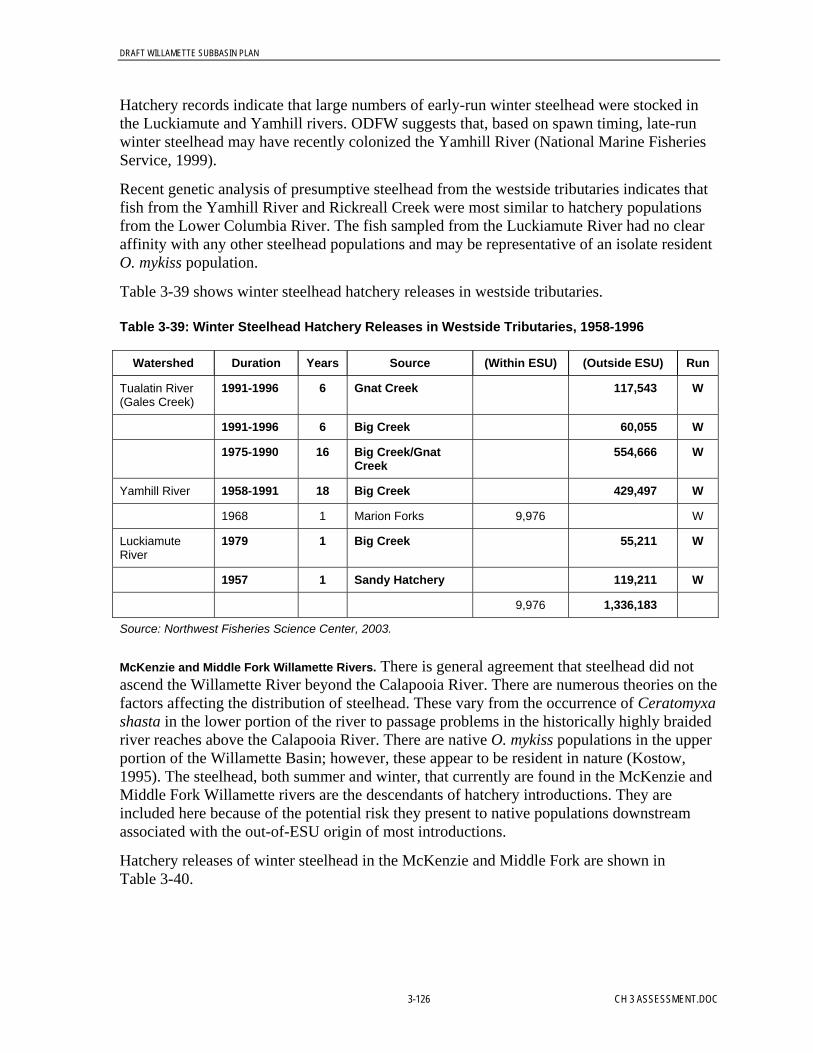
DRAFT WILLAMETTE SUBBASIN PLAN
3-126 CH 3 ASSESSMENT.DOC
Hatchery records indicate that large numbers of early-run winter steelhead were stocked inthe Luckiamute and Yamhill rivers. ODFW suggests that, based on spawn timing, late-runwinter steelhead may have recently colonized the Yamhill River (National Marine FisheriesService, 1999).
Recent genetic analysis of presumptive steelhead from the westside tributaries indicates thatfish from the Yamhill River and Rickreall Creek were most similar to hatchery populationsfrom the Lower Columbia River. The fish sampled from the Luckiamute River had no clearaffinity with any other steelhead populations and may be representative of an isolate residentO. mykiss population.
Table 3-39 shows winter steelhead hatchery releases in westside tributaries.
Table 3-39: Winter Steelhead Hatchery Releases in Westside Tributaries, 1958-1996
Watershed Duration Years Source (Within ESU) (Outside ESU) Run
Tualatin River(Gales Creek)
1991-1996 6 Gnat Creek 117,543 W
1991-1996 6 Big Creek 60,055 W
1975-1990 16 Big Creek/GnatCreek
554,666 W
Yamhill River 1958-1991 18 Big Creek 429,497 W
1968 1 Marion Forks 9,976 0 W
LuckiamuteRiver
1979 1 Big Creek 0 55,211 W
1957 1 Sandy Hatchery 0 119,211 W
9,976 1,336,183
Source: Northwest Fisheries Science Center, 2003.
McKenzie and Middle Fork Willamette Rivers. There is general agreement that steelhead did notascend the Willamette River beyond the Calapooia River. There are numerous theories on thefactors affecting the distribution of steelhead. These vary from the occurrence of Ceratomyxashasta in the lower portion of the river to passage problems in the historically highly braidedriver reaches above the Calapooia River. There are native O. mykiss populations in the upperportion of the Willamette Basin; however, these appear to be resident in nature (Kostow,1995). The steelhead, both summer and winter, that currently are found in the McKenzie andMiddle Fork Willamette rivers are the descendants of hatchery introductions. They areincluded here because of the potential risk they present to native populations downstreamassociated with the out-of-ESU origin of most introductions.
Hatchery releases of winter steelhead in the McKenzie and Middle Fork are shown inTable 3-40.
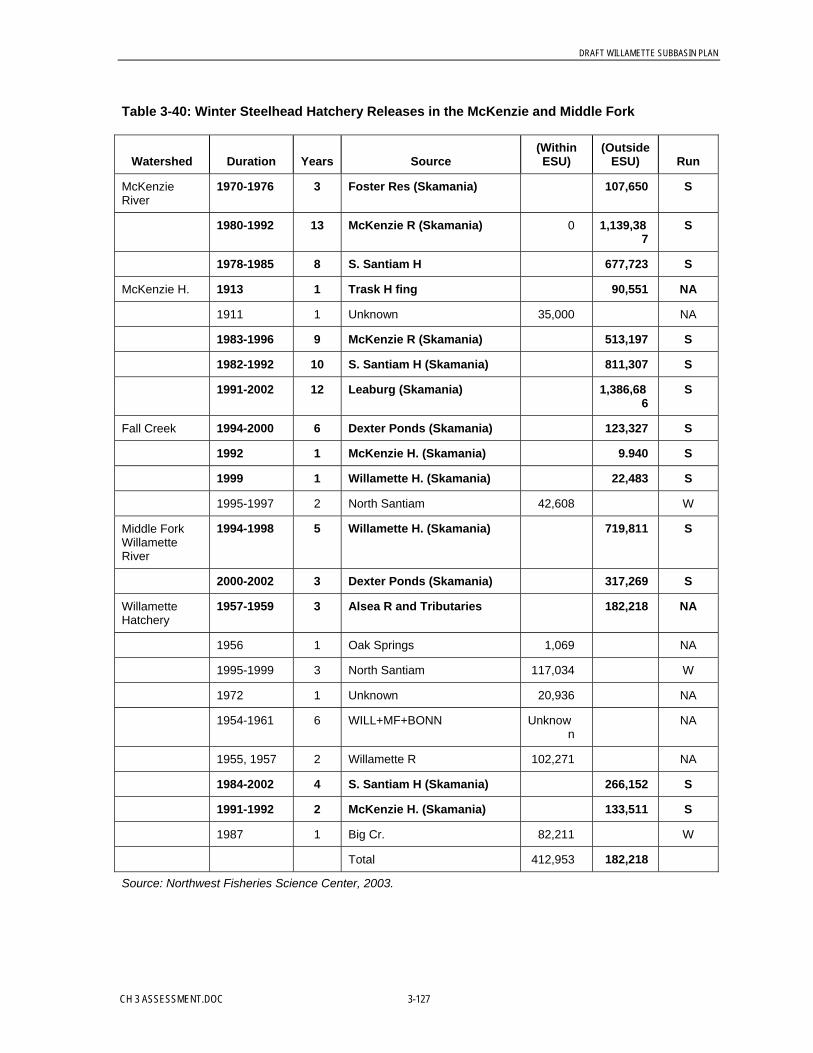
DRAFT WILLAMETTE SUBBASIN PLAN
CH 3 ASSESSMENT.DOC 3-127
Table 3-40: Winter Steelhead Hatchery Releases in the McKenzie and Middle Fork
Watershed Duration Years Source(WithinESU)
(OutsideESU) Run
McKenzieRiver
1970-1976 3 Foster Res (Skamania) 107,650 S
1980-1992 13 McKenzie R (Skamania) 0 1,139,387
S
1978-1985 8 S. Santiam H 677,723 S
McKenzie H. 1913 1 Trask H fing 90,551 NA
1911 1 Unknown 35,000 NA
1983-1996 9 McKenzie R (Skamania) 513,197 S
1982-1992 10 S. Santiam H (Skamania) 811,307 S
1991-2002 12 Leaburg (Skamania) 1,386,686
S
Fall Creek 1994-2000 6 Dexter Ponds (Skamania) 123,327 S
1992 1 McKenzie H. (Skamania) 9.940 S
1999 1 Willamette H. (Skamania) 22,483 S
1995-1997 2 North Santiam 42,608 W
Middle ForkWillametteRiver
1994-1998 5 Willamette H. (Skamania) 719,811 S
2000-2002 3 Dexter Ponds (Skamania) 317,269 S
WillametteHatchery
1957-1959 3 Alsea R and Tributaries 182,218 NA
1956 1 Oak Springs 1,069 NA
1995-1999 3 North Santiam 117,034 W
1972 1 Unknown 20,936 NA
1954-1961 6 WILL+MF+BONN Unknown
NA
1955, 1957 2 Willamette R 102,271 NA
1984-2002 4 S. Santiam H (Skamania) 266,152 S
1991-1992 2 McKenzie H. (Skamania) 133,511 S
1987 1 Big Cr. 82,211 W
Total 412,953 182,218
Source: Northwest Fisheries Science Center, 2003.
DRAFT WILLAMETTE SUBBASIN PLAN
3-128 CH 3 ASSESSMENT.DOC
Historical Hatchery Production and Distribution of Winter SteelheadNorth Santiam. A winter-run hatchery stock, developed primarily from North Santiam wildfish, but with some fish from the Big Creek and Klaskanine River stocks, was released intothe Santiam Subbasin beginning in 1952 (ODFW, 1990). Approximately 100,000 steelheadsmolts were released each year, mostly in the mainstem North Santiam River and Big CliffReservoir, until the program was discontinued in 1998 (NMFS 1999a) . Traps installed atStayton in the North Santiam River caught 42 percent marked winter steelhead in 1993 and85 percent in 1994 (Kostow, 1995). Hatchery strays from outside the system represented 2percent of the catch in both years.
Native winter steelhead were artificially propagated at the North Santiam Hatchery beginningin 1930, when a record 2.8 million eggs (686 females at 4,170 eggs/female) were taken(Wallis, 1963). Beginning in 1952, ODFW tried to compensate for the loss of wildproduction areas above Detroit and Big Cliff dams by releasing hatchery winter steelhead,but these attempts were generally unsuccessful (ODFW, 1990). ODFW ended the wintersteelhead hatchery program in the Santiam in 1998 because of concerns over the potentialeffects of residualized steelhead on the native population,7 interbreeding and geneticinteractions with the native population, and the cost-effectiveness of the program8
(Mamoyac, 2003).
Introduced late-winter and Skamania summer-run steelhead are both present in the NorthSantiam River (Chilcote, 1997), but ODFW discontinued the release of the late-winter run in1998 (NMFS 1999a). Now the only hatchery steelhead released into the North Santiam are161,000 summer-run fish. The purpose of this hatchery program is to augment the sportfishery while minimizing natural production (that is, straying) by summer steelhead (NMFS,2000).
South Santiam. Winter steelhead returning to the South Santiam River were reared at theformer South Santiam Hatchery on Coal Creek from 1926 through 1944. After 1944, theSouth Santiam stock was infrequently reared in a hatchery (ODFW, 1986). It was oftensupplemented with fish from the Marion Forks Hatchery in the North Santiam Subbasin(ODFW, 1990). Less than 2 percent of the steelhead that ODFW released above Green Peteras presmolts migrated past the dam as smolts, and less than 50 percent of the juvenilesreleased as smolts emigrated. By 1997, Chilcote (1997) estimated that the natural productionof hatchery-origin steelhead spawning naturally in the South Santiam River was less than 5percent (Chilcote, 1997). Releases of hatchery-origin winter steelhead above Green Peterwere discontinued in 1989, although summer steelhead continue to be released with the intentof augmenting the sport fishery. ODFW ended the winter steelhead hatchery program in theSantiam in 1998 because of concerns over the potential effects of residualized steelhead onthe native population, interbreeding and genetic interactions with the native population, andthe cost-effectiveness of the program (Mamoyac, 2003).
7
Cold water at the Marion Forks Hatchery precluded the accelerated growth typical of most hatchery programs, and all smoltswere released at age 2 instead of age 1. The protracted development period resulted in a high percentage of precocial males(up to 25 percent), which residualized in the system.8 Cost-effectiveness was low, in part, because of the residualism mentioned above.
DRAFT WILLAMETTE SUBBASIN PLAN
CH 3 ASSESSMENT.DOC 3-129
3.2.4.3 Cutthroat Trout Life History, Population Status, and TrendsCutthroat have the widest distribution of any trout in the Willamette Basin. Cutthroat troutare present in all the subbasins of the Willamette. Cutthroat trout are the only trout native towestside tributaries draining the Coast Range. In the eastside tributaries draining the CascadeRange, cutthroat trout coexist with rainbow trout and have higher population densities in thesmaller headwater streams. Southwest Washington/Columbia River coastal cutthroat troutpreviously were considered a “candidate” species for federal ESA listing by the USFWS. InJune 2002, USFWS determined that the population did not warrant protection under the ESAbased on trends in population abundance; recently USFWS enacted fish and habitatprotections.
Two life history patterns of cutthroat trout are native to the Willamette Basin; these aregenerally referred to as the sea-run (anadromous) and the resident forms, which exhibitvarious migration strategies within freshwater. Sea-run anadromous forms of cutthroat troutare thought to exist only below the Willamette Falls (RM26). As with other anadromoussalmonids, the Willamette Falls presented an obstacle to movement. The primary life historyform of cutthroat trout in the Willamette Basin appears to be freshwater migratory. UpperWillamette cutthroat trout are highly heterogeneous genetically, but they do not appear toform groupings of isolated and semi-isolated populations (Johnson et al., 1999). In 1945,Dimmick noted that except for differences in size (of adults), no morphological differenceswere noted between the two races (anadromous and resident) of cutthroat.
Life History Patterns and Diversity. This section presents life history patterns and diversityof resident and anadromous cutthroat, both of which are found in the Willamette Basin.
Adult Migration and Spawning. Cutthroat trout exhibit a variety of life strategies, includingfish that do not migrate from their resident stream and those that migrate from larger streamsand lakes into smaller tributaries. Many fish reside and spawn in small tributaries (this is aresident life history), while other fish reside in larger tributaries and move in and out of smallstreams (this is a fluvial life history). For both resident and migratory life history types,spawning occurs primarily, if not exclusively, in small tributaries.
Resident Cutthroat. Resident cutthroat trout can include two population types: fish that canmove and breed within an interconnected stream system and fish that exist in isolatedpopulations above impassible natural barriers (for example, waterfalls) or fish passagebarriers resulting from land use practices (such as road crossing culverts or dams). Forcutthroat trout that are restricted to small tributaries, the youngest age classes (ages 0, 1, and2) predominate in the age structure (Wevers et al., 1992).
The fluvial cutthroat trout life history is common in the Willamette River system (Sumner,1972). For example, a population of cutthroat trout resides in the Willamette River betweenCorvallis and the mouth of the McKenzie and spawns in small streams in the lowerMcKenzie River watershed, including tributaries to the Mohawk River (Jeff Ziller, ODFW,personal communication, 2002). Cutthroat trout movement from larger rivers and streamsinto small tributaries takes place from November through June (Wyatt, 1959; Nicholas,1978). In contrast to resident cutthroat trout, the fluvial form grows larger and has a higherpercentage of older fish. In rivers and larger streams, the 2- and 3-year-old cutthroat trout arethe most prevalent (Wevers et al., 1992). This observation supports the belief that portions of
DRAFT WILLAMETTE SUBBASIN PLAN
3-130 CH 3 ASSESSMENT.DOC
tributary cutthroat trout populations migrate and reside in eastside and westside rivers and theUpper Willamette River for most of their growth.
Cutthroat trout in the Willamette Basin exhibit a long period of spawning that extends fromJanuary through July, depending on the location. Spawning takes place earlier in tributariesin the valley floor and later in the high mountain tributaries, with the timing pattern related totemperature regimes and runoff patterns (Nicholas, 1978). The resident form resides andspawns in the same stream. For example, 97 percent of the cutthroat trout in the CascadeRange tributary Lookout Creek appear to exhibit a nonmigratory strategy (Wyatt, 1959).
Sea-Run (Anadromous) Cutthroat. The current distribution of sea-run (anadromous) cutthroattrout in the lower Willamette is unknown. Anecdotal evidence suggests the presence of sea-run cutthroat in very small numbers in the Clackamas River and Johnson Creek (DickCaldwell, personal communication). No systematic population abundance and distributiondata are available.
Historically, sea-run cutthroat migrated into the mainstem Willamette River in the spring,reared throughout the summer, and then migrated to ocean in the fall or early winter.Notably, their use of the mainstem reaches included not spawning but rather spring, summer,fall, and early winter rearing. Sea-run cutthroat were predominantly noted residing neartributary confluence regions of the lower mainstem area.
Dimmick (1945) noted that sea-run cutthroat spawned in January, February, and March,while resident cutthroat spawned in May, June, and July. Sea-run cutthroat returned to theirnatal freshwater streams (and moved out of the mainstem Willamette) before juvenileChinook emigrating seaward and used lower mainstem habitats.
Emergence and Juvenile Out-Migration or Movement. Fry move downstream to largerstreams from June through November (Wyatt). Cutthroat trout are sexually mature at age 2 to3 (Nicholas, 1978). Adult cutthroat trout in higher elevation tributaries generally mature atsmaller sizes than trout found in lower elevation tributaries and the Willamette River. Basedon scale collections from cutthroat trout in the McKenzie, Santiam, and Willamette rivers,there appears to be an increase in growth rates in the third and fourth year that is attributed tomovement from small tributaries into rivers where there is a more abundant food supply(Nicholas, 1978).
Rearing, Refuge, and Forage. Cutthroat trout residing in headwater streams are generallysmaller at each age than those inhabiting areas lower in the drainage (Nicholas, 1978).Populations that are isolated, as a result of natural or human-caused fish passage barriers,tend to have smaller fish than do populations below barriers (Hunt, 1982). For example,cutthroat trout above the falls on the Little Luckiamute River are generally smaller than thosefound in streams of similar size below barriers (Wevers et al., 1992). Cutthroat trout also willuse seasonal streams for rearing, refuge, and forage habitat. In the Calapooia Subbasin,cutthroat trout were observed in seasonal streams during high flow periods in the winter andearly spring (Randy Colvin, Oregon State University, personal communication, 2004).Artificial barriers, such as road crossing culverts, keep cutthroat trout from accessingspawning and rearing areas in both perennial and seasonal streams.
DRAFT WILLAMETTE SUBBASIN PLAN
CH 3 ASSESSMENT.DOC 3-131
Population Distribution: Historical and Current Capacity. Compared to historicalconditions, there have been dramatic changes to the distribution of cutthroat trout in theUpper Willamette Subbasin and the ability of the habitat to support abundant and geneticallydiverse populations. Dams, road crossing culverts, and other fish passage barriers havelimited the distribution of cutthroat and their access to spawning and rearing habitat. Forexample, in the Long Tom River below Fern Ridge Dam, younger cutthroat are absent andlarger adults appear only seasonally (Connolly et al., 1992). In addition, Brownsville Dam onthe Calapooia River appears to hinder the movement of migrating adult and juvenile fluvialcutthroat trout during the spring high flow periods (Gary Galovich, ODFW, personalcommunication, 2003).
A number of studies have shown that adult and juvenile salmonids, including cutthroat troutdo not pass through a majority of culverts at road crossings. Fish passage at culverts is aconcern regarding both adult and juvenile fish. Juvenile cutthroat trout are weak swimmersand can be stopped by less than a 6-inch drop at the outlet of a culvert. Fish passageguidelines developed by ODFW specify that culverts need to be installed at a gradient of lessthan 0.5 percent and have no more than a 6-inch drop at the culvert outlet. The majority ofculverts throughout the Upper Willamette Basin do not meet these criteria for fish passage;this has affected cutthroat trout distributions. For example, in an inventory of more than 80culverts in the Calapooia Subbasin, more than 90 percent of the culverts did not meet theODFW fish passage criteria (Runyon et al., 2004).
It appears that the forested upper portions of the Willamette Subbasin have higher qualitycutthroat habitat than do lowland streams. Lowland streams that flow through the floor of theWillamette Valley have been disproportionately affected by agriculture and urban/residentialdevelopment. The forested upland streams draining the Coast and Cascade ranges have beenmodified through timber harvest, road building, and other activities, but the impact onaquatic habitat has not been as dramatic as in the lowland systems. Historically, lowlandstreams, which were characterized by abundant side channels, large wood jams, and othercomplex and diverse habitats, provided the most productive fish habitat (IMST, 2002).
Other evidence points to the significant loss of cutthroat trout habitat capacity in lowlandstreams. In a study of 2nd- to 4th-order streams in the Willamette Basin, Baker et al. (2002)developed a cutthroat Habitat Suitability Index based on key aquatic/riparian conditions andother watershed characteristics (see Table 3-41).
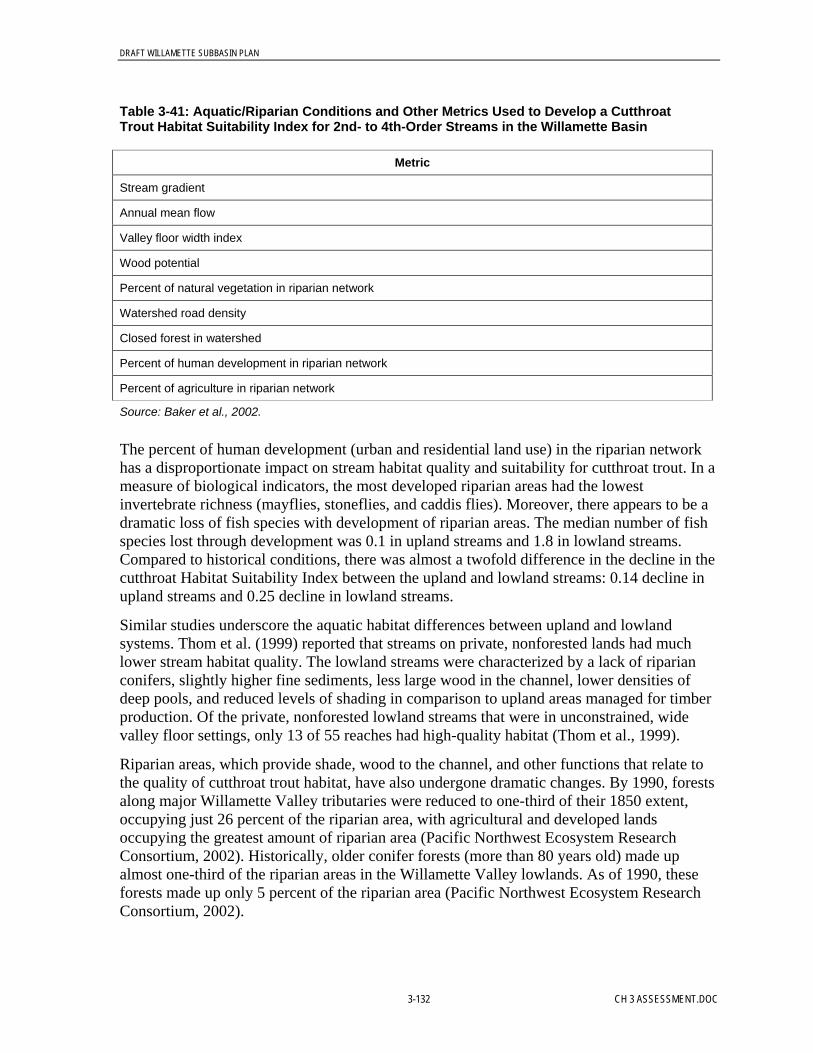
DRAFT WILLAMETTE SUBBASIN PLAN
3-132 CH 3 ASSESSMENT.DOC
Table 3-41: Aquatic/Riparian Conditions and Other Metrics Used to Develop a CutthroatTrout Habitat Suitability Index for 2nd- to 4th-Order Streams in the Willamette Basin
Metric
Stream gradient
Annual mean flow
Valley floor width index
Wood potential
Percent of natural vegetation in riparian network
Watershed road density
Closed forest in watershed
Percent of human development in riparian network
Percent of agriculture in riparian network
Source: Baker et al., 2002.
The percent of human development (urban and residential land use) in the riparian networkhas a disproportionate impact on stream habitat quality and suitability for cutthroat trout. In ameasure of biological indicators, the most developed riparian areas had the lowestinvertebrate richness (mayflies, stoneflies, and caddis flies). Moreover, there appears to be adramatic loss of fish species with development of riparian areas. The median number of fishspecies lost through development was 0.1 in upland streams and 1.8 in lowland streams.Compared to historical conditions, there was almost a twofold difference in the decline in thecutthroat Habitat Suitability Index between the upland and lowland streams: 0.14 decline inupland streams and 0.25 decline in lowland streams.
Similar studies underscore the aquatic habitat differences between upland and lowlandsystems. Thom et al. (1999) reported that streams on private, nonforested lands had muchlower stream habitat quality. The lowland streams were characterized by a lack of riparianconifers, slightly higher fine sediments, less large wood in the channel, lower densities ofdeep pools, and reduced levels of shading in comparison to upland areas managed for timberproduction. Of the private, nonforested lowland streams that were in unconstrained, widevalley floor settings, only 13 of 55 reaches had high-quality habitat (Thom et al., 1999).
Riparian areas, which provide shade, wood to the channel, and other functions that relate tothe quality of cutthroat trout habitat, have also undergone dramatic changes. By 1990, forestsalong major Willamette Valley tributaries were reduced to one-third of their 1850 extent,occupying just 26 percent of the riparian area, with agricultural and developed landsoccupying the greatest amount of riparian area (Pacific Northwest Ecosystem ResearchConsortium, 2002). Historically, older conifer forests (more than 80 years old) made upalmost one-third of the riparian areas in the Willamette Valley lowlands. As of 1990, theseforests made up only 5 percent of the riparian area (Pacific Northwest Ecosystem ResearchConsortium, 2002).

DRAFT WILLAMETTE SUBBASIN PLAN
CH 3 ASSESSMENT.DOC 3-133
Abundance and Population Trends. There have been very few systematic studies of UpperWillamette River cutthroat trout population trends. Most of the information presented here isqualitative and descriptive, rather than quantitative. There are reports from the 1920s and1930s of good cutthroat trout sport fishing in the mainstem Willamette River aboveIndependence. It appears that pollution in the river during the 1920s and 1930s eliminatedthis fishery. Cutthroat trout populations appear to be stable or increasing in the UpperWillamette above Corvallis. Populations of cutthroat tout are limited in the lower WillametteRiver below its confluence with the Marys River as a result of high summer watertemperatures and the presence of the fish parasite Certomyxa shasta. Increasing numbers ofcutthroat trout in the Willamette River between Corvallis and the mouth of the McKenzieRiver were noted in a 1992 to 1998 inventory (U.S. Army Corps of Engineers, 2002). Overthe 7 years of sampling, the numbers of fish caught increased by 11 percent to 82 percent peryear, depending on the location. In electrofishing sampling results from the lower McKenzieRiver between 1988 and 1993, the estimated number of river-migrating cutthroat trout longerthan 20 centimeters ranged from 113 to 333 fish per mile of shoreline (U.S. Army Corps ofEngineers, 2002).
There appears to be considerable variability in cutthroat trout population densities within thesubbasins of the Upper Willamette. In some cases, fish passage barriers have led to reducedcutthroat trout population densities. The construction of Fern Ridge Dam isolated the upperLong Tom Subbasin cutthroat trout population, which resulted in reduced numbers of adultand juvenile fish residing in the river below the dam (Connolly et al., 1992). Cutthroat troutpopulations in small headwater streams that were isolated above impassible culverts havebeen extirpated when the streams have gone dry (Lorensen, ODF, personal communication,2003). In other cases, it is difficult to understand the mechanisms controlling the variabilityin cutthroat trout population densities. Combined counts of cutthroat trout and rainbow troutin index pools in the North Fork of the Middle Fork Willamette River increased between1975 and 1991, and the counts have remained stable since then. The abundance of juvenilecutthroat trout in an index reach of Dead Horse Creek, a tributary to the Molalla River, wasstable from 1981 to 1991 (U.S. Army Corps of Engineers, 2002). Numbers of cutthroat troutin streams draining the Coast Range ranged from 166 fish per mile, in the North YamhillRiver, to more than 1,700 per mile, in the Luckiamute Subbasin (Hooton, 1997; Johnson etal., 1999).
All of these population counts of cutthroat trout were completed after the major changes toriver and stream habitat. By the 1950s, most of the stream systems in the Willamette Basinhad already been altered through removal of large wood, channel straightening, loss ofriparian forests, and other modifications (Pacific Northwest Ecosystem ResearchConsortium, 2002). Pollution in the Willamette River below Corvallis during the 1920s and1930s and the current presence of the fish parasite Certomyxa shasta has eliminated thefluvial population of cutthroat trout from this portion of the river.
3.2.4.4 Bull Trout Life History, Population Status, and TrendsPrior to 1978, Dolly Varden (Salvelinus malma) were classified into an anadromous and aninterior form. Cavender (1978) classified the interior form as a distinct species, Salvelinusconfluentus—the bull trout. Bull trout are large char weighing up to 18 kilograms andgrowing to more than 1 meter in length (Goetz, 1989). They are distinguished by a broad flat

DRAFT WILLAMETTE SUBBASIN PLAN
3-134 CH 3 ASSESSMENT.DOC
head; large, downward-curving maxillaries that extend beyond the eye; a well-developedfleshy knob and a notch in the lower terminus of the snout; and light colored spots normallysmaller than the pupil of the eye (Cavender, 1978).
Bull trout are found throughout northwestern North America from latitude 41°N to latitude60°N. In Oregon, bull trout were once distributed throughout 12 basins in the Klamath andColumbia River systems, including the Clackamas, Santiam, McKenzie, and Middle ForkWillamette subbasins west of the Cascades (Buchanan et al., 1997). However, it is believedthat bull trout have been extirpated from west of the Cascades with the exception of theMcKenzie subbasin.
Buchanan et al. (1997) listed the bull trout population in the mainstem McKenzie as “ofspecial concern,” the South Fork McKenzie population as “high risk,” and the bull troutabove Trail Bridge Reservoir as “high risk.” Bull trout in the Middle Fork Willamette arelisted as “probably extinct.” On June 10, 1998, USFWS listed the Columbia River bull troutpopulation segment (including the McKenzie subbasin) as threatened under the federalEndangered Species Act.
Bull Trout Life History Patterns and Diversity. This section presents life history patternsand diversity of bull trout in the Willamette Basin.
Adult Migration and Spawning. Adult bull trout overwinter in the McKenzie River and aredistributed throughout the river as far downstream as the confluence with the WillametteRiver. Typically, adult bull trout begin to move upstream from overwintering sites in themainstem McKenzie or Cougar Reservoir in the late spring. The fish move upstreamthroughout the summer, stage within several miles of spawning tributaries in August, andenter spawning tributaries in late August or early September. Spawning occurs fromSeptember through the middle of October, with peak spawning in the middle of September.Bull trout remain in the spawning tributaries for up to 1 month before quickly migratingdownstream to overwintering sites lower in the river in October.
Abundance and Population Trends
North Santiam Subbasin. Bull trout were last observed in the North Santiam in 1945. Noabundance or trend data available.
McKenzie Subbasin. There are populations of bull trout in the mainstem McKenzie, TrailBridge Reservoir, and the South Fork.
Mainstem McKenzie River. The McKenzie River local population occurs from the confluence ofthe McKenzie River with the Willamette River upstream to Trail Bridge Dam, in the SouthFork McKenzie River below Cougar Dam, and in portions of Gate Creek, Blue River, HorseCreek, Deer Creek, Olallie Creek, and Anderson Creek. A total of 170 kilometers (105.6miles) of stream habitat have been identified as being used by bull trout in the McKenzieRiver subbasin downstream of Trail Bridge Dam (Ziller and Taylor, 2000). Spawningactivity is confined to just 5.8 RKm of Anderson and Olallie Creeks.
This population of bull trout appears to be the largest and most secure in the WillametteBasin. Anderson and Olallie creeks are key spawning and juvenile rearing areas and arerelatively protected by USFS land management. An estimated 100 to 200 bull trout spawn
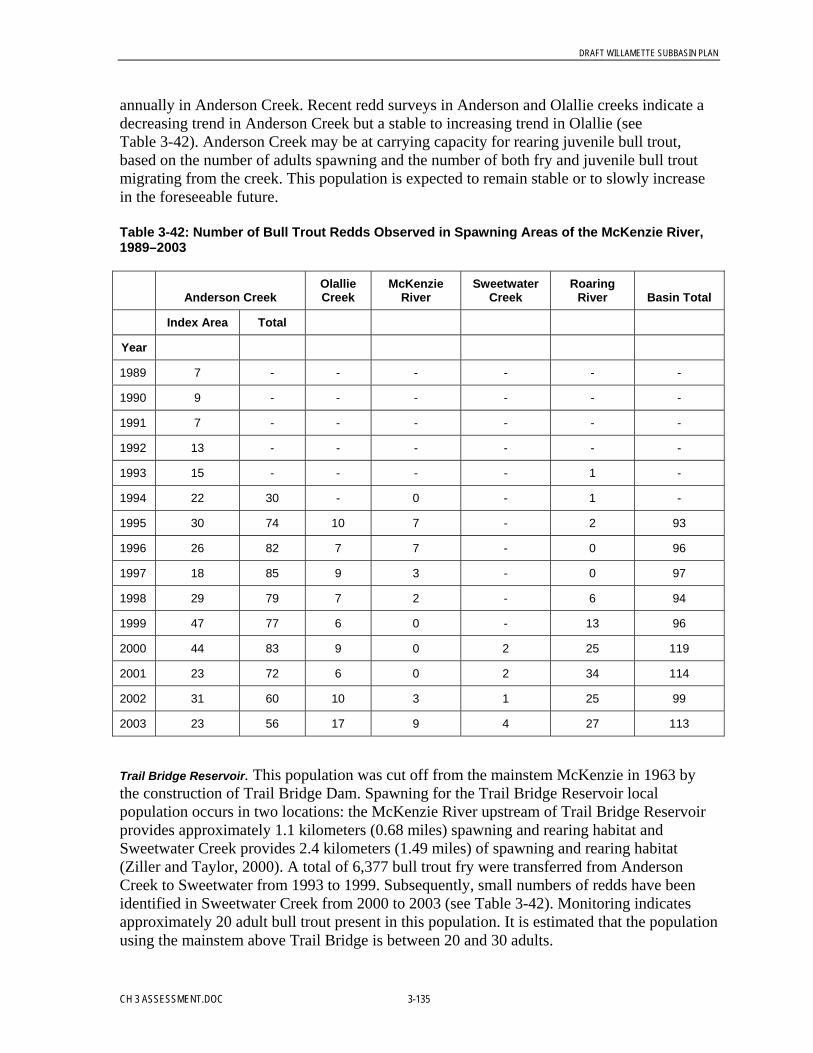
DRAFT WILLAMETTE SUBBASIN PLAN
CH 3 ASSESSMENT.DOC 3-135
annually in Anderson Creek. Recent redd surveys in Anderson and Olallie creeks indicate adecreasing trend in Anderson Creek but a stable to increasing trend in Olallie (seeTable 3-42). Anderson Creek may be at carrying capacity for rearing juvenile bull trout,based on the number of adults spawning and the number of both fry and juvenile bull troutmigrating from the creek. This population is expected to remain stable or to slowly increasein the foreseeable future.
Table 3-42: Number of Bull Trout Redds Observed in Spawning Areas of the McKenzie River,1989–2003
Anderson CreekOlallieCreek
McKenzieRiver
SweetwaterCreek
RoaringRiver Basin Total
Index Area Total
Year
1989 7 - - - - - -
1990 9 - - - - - -
1991 7 - - - - - -
1992 13 - - - - - -
1993 15 - - - - 1 -
1994 22 30 - 0 - 1 -
1995 30 74 10 7 - 2 93
1996 26 82 7 7 - 0 96
1997 18 85 9 3 - 0 97
1998 29 79 7 2 - 6 94
1999 47 77 6 0 - 13 96
2000 44 83 9 0 2 25 119
2001 23 72 6 0 2 34 114
2002 31 60 10 3 1 25 99
2003 23 56 17 9 4 27 113
Trail Bridge Reservoir. This population was cut off from the mainstem McKenzie in 1963 bythe construction of Trail Bridge Dam. Spawning for the Trail Bridge Reservoir localpopulation occurs in two locations: the McKenzie River upstream of Trail Bridge Reservoirprovides approximately 1.1 kilometers (0.68 miles) spawning and rearing habitat andSweetwater Creek provides 2.4 kilometers (1.49 miles) of spawning and rearing habitat(Ziller and Taylor, 2000). A total of 6,377 bull trout fry were transferred from AndersonCreek to Sweetwater from 1993 to 1999. Subsequently, small numbers of redds have beenidentified in Sweetwater Creek from 2000 to 2003 (see Table 3-42). Monitoring indicatesapproximately 20 adult bull trout present in this population. It is estimated that the populationusing the mainstem above Trail Bridge is between 20 and 30 adults.

DRAFT WILLAMETTE SUBBASIN PLAN
3-136 CH 3 ASSESSMENT.DOC
South Fork McKenzie River. This population was cut off from the mainstem McKenzie in 1963by the construction of Cougar Dam. Bull trout inhabit approximately 29 RKm of stream inthe South Fork McKenzie from Cougar Reservoir up to approximately the Three SistersWilderness Area boundary. Spawning activity has been documented in 5 RKm of RoaringRiver. Spawning surveys conducted in Roaring River have shown a sharp increase in bulltrout redds over the past 5 years (see Table 3-42). It is estimated that this population numbersfrom 25 to 75 adults.
Middle Fork Subbasin. No bull trout were identified during extensive surveys of the MiddleFork Willamette Subbasin in the early to mid-1990s. Buchanan et al. (1997) listed bull troutas “probably extinct.” A plan to rehabilitate bull trout to the upper Middle Fork WillametteRiver was completed and approved by the Willamette Basin Bull Trout Working Group in1997 (ODFW, 1997). Beginning in 1997 and continuing through 2004, bull trout fry fromAnderson Creek in the McKenzie River Subbasin were reintroduced by USFS and ODFW tofour cold-water springs and four creeks above Hills Creek Reservoir as part of therehabilitation plan (ODFW and USFS, 1998). Monitoring has revealed good growth andsurvival of juvenile bull trout in the release sites. Information on survival and dispersal of thenearly 9,696 fry to the Middle Fork Willamette is limited, although distribution in 2001 wasdocumented to be at least 5.5 miles in the Middle Fork Willamette, from approximatelyChuckle Springs downstream to Sacandaga Campground (ODFW, 2001). ODFS and USFSpersonnel observed 28 bull trout and sampled approximately 25 percent of available habitatin the survey reach. Juvenile abundance in the Middle Fork was estimated at approximately250 individuals (ODFW, 2001a).
In 2003, ODFW personnel captured a subadult bull trout in Hills Creek Reservoir.
The current abundance of bull trout in the Middle Fork Willamette River is believed to be, atmost, a handful of adults (ODFW, 2001a). The population size that the Middle ForkWillamette River can support is not known, but local biologists believe the potential issimilar to that of the South Fork McKenzie River (ODFW and USFS, 1998).
Emergence and Juvenile Out-Migration or Movement. Data from a downstream migrantfish trap that has operated seasonally since 1993, and that is located immediately downstreamof the culvert passing under Highway 126 (approximately 0.4 kilometer or 0.25 mileupstream from the mouth of Anderson Creek) (Ziller and Taylor, 2000), indicates that themajority of bull trout fry and juveniles migrate from Anderson Creek to the McKenzie Riverbetween February and June (ODFW, 2001a). Peak fry and juvenile out-migration occursfrom the middle to the end of March (ODFW, 2001a).
Habitat: Rearing, Refuge, and Forage. McKenzie River streams used by bull trout forspawning and rearing are characterized by abundant large wood, high channel complexity,and a mature conifer canopy. Adult bull trout predominantly use large pools, side channelsand river margins. Taylor (2001) characterized juvenile bull trout rearing habitat in themainstem McKenzie using eight quantitative measurements. Bull trout occupied shallow(mean total depth was 1.3 feet ± 0.2), low-velocity habitat ( mean = 0.08 ft/sec. ± 0.05) nearthe stream margins. Mean water temperature was 47 º F. The predominant substrateidentified was cobble followed by sand, organic debris, and bedrock. Ninety-one percent ofjuvenile bull trout observed were in micro-backwater pools associated with boulders, and 9percent of the bull trout were in small, lateral scour pools associated with boulders.
DRAFT WILLAMETTE SUBBASIN PLAN
CH 3 ASSESSMENT.DOC 3-137
Population Distribution: Historical and Current Capacity. Maps showing the distributionof bull trout are presented in Appendix E. The following section addresses the populationdistribution of bull trout in the Willamette Basin.
North Santiam Subbasin. The last verified sighting of a bull trout in the North Santiamsubbasin, according to Goetz (1989), was in 1945. Buchanan et al. (1997) in a statewideassessment considered the current status of bull trout in the North Santiam as “probablyextinct.” Furthermore, presence and absence surveys conducted in the North SantiamSubbasin during the 1990s by personnel from USFS and ODFW failed to detect bull trout,affirming the likelihood that bull trout have been extirpated from this subbasin.
McKenzie Subbasin. The McKenzie River local population occurs from the confluence ofthe McKenzie River with the Willamette River upstream to Trail Bridge Dam, in the SouthFork McKenzie River below Cougar Dam, and in portions of Gate Creek, Blue River, HorseCreek, Deer Creek, Olallie Creek, and Anderson Creek. A total of 170 kilometers (105.6miles) of stream habitat has been identified as being used by bull trout in the McKenzie RiverSubbasin downstream of Trail Bridge Dam (Ziller and Taylor, 2000). Although the majorityof the population resides upstream of Leaburg Dam in the McKenzie River, color videoequipment added to the dam’s monitoring facility in 1995 facilitated identification of bulltrout and provided documentation of bull trout migrating through the facility. Bull trout havebeen observed passing the facility annually from 1995 to 2002, with a minimum of four and amaximum of 28 passing annually (EWEB et al., 2001; ODFW, 2001a).
In March 1999, a 74-centimeter (29-inch) bull trout was captured by ODFW crews whileseining near the confluence of the McKenzie and Willamette rivers (WRUT, in litt., 1997b).The capture of this individual provided the first evidence that bull trout are using the lowerMcKenzie River, and perhaps the upper Willamette River, seasonally for foraging. BlueRiver Dam on Blue River, Cougar Dam on the South Fork McKenzie River, and Trail BridgeDam on the upper McKenzie River limit movement of bull trout from the McKenzie Riverlocal population to historical habitat above these dams.
Middle Fork Subbasin. Little information exists on the historical distribution and abundanceof bull trout in the Middle Fork Willamette subbasin. Buchanan et al. (1997) reported thathistorical distribution included the mainstem Middle Fork Willamette Subbasin from itsconfluence with the Willamette River upstream to its headwaters, including Salmon Creekand Salt Creek below Hills Creek Reservoir; and the Middle Fork Willamette River aboveHills Creek Reservoir, including Swift and Staley creeks. It is likely that historicaloverwintering and foraging would have extended bull trout distribution into many othertributaries in the subbasin, including the North Fork of the Middle Fork Willamette River.Current known distribution of bull trout in the Middle Fork Willamette extends from ChuckleSprings to Hills Creek Reservoir.
3.2.4.5 Oregon Chub Life History, Population Status, and TrendsOregon chub are endemic to the Willamette River drainage of western Oregon (Markle et al.,1991). This species was formerly distributed throughout the Willamette River Valley in off-channel habitats such as beaver ponds, oxbows, side channels, backwater sloughs, low-gradient tributaries, and flooded marshes (Snyder, 1908). Historical records show thatOregon chub were found as far downstream as Oregon City and as far upstream as Oakridge.

DRAFT WILLAMETTE SUBBASIN PLAN
3-138 CH 3 ASSESSMENT.DOC
Historical records also report that Oregon chub were collected from the Clackamas River,Molalla River, South Santiam River, North Santiam River, Luckiamute River, Long TomRiver, McKenzie River, Mary’s River, Coast Fork Willamette River, Middle ForkWillamette River, and the mainstem Willamette River from Oregon City to Eugene (Markleet al., 1991).
The current distribution of Oregon chub is limited to 24 known naturally occurringpopulations and eight recently reintroduced populations. The naturally occurring populationsare found in the Santiam River, Middle Fork Willamette River, Coast Fork Willamette River,McKenzie River, and several tributaries to the mainstem Willamette River downstream of theCoast Fork/Middle Fork confluence. Only 10 of these populations exceed 1,000 fish, andnine populations contain fewer than 100 individuals. Introduced populations of Oregon chubexist within the Willamette River watershed at Foster Pullout Pond, Finley Display Pond,Cheadle Pond, Wicopee Pond, Fall Creek Spillway Pond, Russell Pond, Herman Pond, andDunn Wetland (Scheerer et al., 2004).
In the last 100 years, backwater and off-channel habitats have disappeared rapidly because ofchanges in seasonal flows resulting from the construction of dams throughout the basin,channelization of the Willamette River and its tributaries, removal of snags for rivernavigation, and agricultural practices. A variety of nonnative aquatic species were introducedto the Willamette Valley over the same period. Consequently, these activities reducedavailable Oregon chub habitat, isolated the existing Oregon chub populations, restrictedmixing between populations, reduced the probability of successful recolonization by Oregonchub, and introduced new competitors and predators into Oregon chub habitat. In 1983, CarlBond and James Long of Oregon State University noted that Oregon chub were becomingrare in the Willamette River and suggested that some efforts might be necessary to protectthis species (Bond and Long, 1984). In 1989, Pearsons surveyed historical locations ofOregon chub populations and documented the decline of this species (Pearsons, 1989). Thisprompted the petition for listing Oregon chub as a federal endangered species in 1990 (U.S.Fish and Wildlife Service, 1998), and the subsequent federal listing in 1993.
Oregon chub in the Willamette River drainage are not separated into distinct populationsegments. Historically there was downstream mixing and limited upstream mixing of chubpopulations throughout the basin. Currently the species is distributed among five subbasinsof the Willamette River: the mainstem Willamette, Middle Fork Willamette, Coast ForkWillamette, McKenzie, and Santiam. Preliminary genetic studies are being conducted toprovide information regarding the amount of variability or distinctness between populations.
Of the 32 known Oregon chub populations, the sites with the highest diversity of native fish,amphibian, and reptile species have the largest populations of Oregon chub (Scheerer andApke, 1998). Beaver (Castor canadensis) appear to be especially important in creating andmaintaining habitats that support these diverse native species assemblages (Scheerer andApke, 1998).
Life History Patterns. The reproductive and feeding habits of Oregon chub are describedbelow, along with reasons for the species’ decline.
Reproduction. Oregon chub spawn from April through September. Before and afterspawning season, chub are social and nonaggressive. As described by Pearsons (1989),
DRAFT WILLAMETTE SUBBASIN PLAN
CH 3 ASSESSMENT.DOC 3-139
spawning behavior begins with the male establishing a territory in or near dense aquaticvegetation. If an adult male enters the territory of another male, aggressive skirmishes occur.When an adult female enters the territory the courting begins with head rubbing behavior,where the male rubs his head in the ventral region of the female between the pectoral andanal fins. The female is then directed into the aquatic vegetation by slight changes in theangle and pressure of the head on the lateral undersides of the female. Twirling of both fish,arranged head to head and tail to tail, follows and eggs and sperm are released. Twirlingbehavior is rarely observed; however, the territorial behavior, head rubbing, and directingoccur only during spawning (Pearsons, 1989). Observation of these behaviors is recorded asspawning activity. Spawning activity has been observed only at temperatures exceeding 16degrees Celsius (61 degrees Fahrenheit). Males longer than 35 millimeters (1.4 inches) havebeen observed exhibiting spawning behavior.
Feeding Habits. Oregon chub are obligatory sight feeders (Davis and Miller, 1967). Theyfeed throughout the day and stop feeding after dusk (Pearsons, 1989). Chub feed mostly onwater column fauna. The diet of Oregon chub adults collected in a May sample consistedprimarily of minute crustaceans including copepods, cladocerans, and chironomid larvae(Markle et al., 1991). The diet of juvenile chub also consisted of minute organisms such asrotifers, copepods, and cladocerans (Pearsons, 1989).
Reasons for Decline. It is likely that a variety of factors are responsible for the decline ofthe Oregon chub. These include habitat alteration; the proliferation of nonnative fish andamphibians; accidental chemical spills; runoff from herbicide or pesticide application onfarms and timberlands or along roadways, railways, and power line rights-of way; theapplication of rotenone to manage sport fisheries; desiccation of habitats; unauthorized waterwithdrawals, diversions or fill and removal activities; sedimentation resulting from timberharvesting in the watershed; and possibly the demographic risks that result from afragmented distribution of small, isolated populations.
Habitat Alteration. Based on a 1987 survey (Markle et al., 1989) and compilation of all knownhistorical records, at the time of the petition for listing in 1991, viable populations of theOregon chub occurred in the following locations: Dexter Reservoir, Shady Dell Pond,Buckhead Creek near Lookout Point Reservoir, Elijah Bristow State Park, William L. FinleyNational Wildlife Refuge, Greens Bridge, and East Fork Minnow Pond. These locationsrepresented a small fraction—estimated as 2 percent, based on stream miles—of the species’formerly extensive distribution within the Willamette River drainage.
The decline of Oregon chub has been correlated with the construction of dams. Based on thedate of last capture at a site, Pearsons (1989) estimated that the most severe decline occurredduring the 1950s and 1960s. Eight of 11 flood control projects in the Willamette Riverdrainage were completed between 1953 and 1968 (U.S. Army Corps of Engineers, 1970).Other structural changes along the Willamette River corridor such as revetment andchannelization, diking and drainage, and the removal of floodplain vegetation, haveeliminated or altered the slackwater habitats of the Oregon chub (Willamette Basin TaskForce, 1969; Hjort et al.,1984; Sedell and Froggatt, 1984; Li et al., 1987). Channelconfinement, isolation of the Willamette River from the majority of its floodplain, andelimination or degradation of both seasonal and permanent wetland habitats within thefloodplain began as early as 1872 and, as an example, have reduced the 25-kilometer (15.5-
DRAFT WILLAMETTE SUBBASIN PLAN
3-140 CH 3 ASSESSMENT.DOC
mile) reach between Harrisburg and the McKenzie River confluence from more than 250kilometers (155 miles) of shoreline in 1854 to less than 64 kilometers (40 miles) currently(Sedell and Froggatt, 1984; Sedell et al., 1990).
Predation and Competition with Nonnative Species. The establishment and expansion of nonnativespecies in Oregon have contributed to the decline of the Oregon chub and limits the species’ability to expand beyond its current range. Many species of nonnative fish have beenintroduced and are common throughout the Willamette Valley, including largemouth bass(Micropterus salmoides), smallmouth bass (Micropterus dolomieui), crappie (Pomoxis sp.),bluegill (Lepomis macrochirus), and western mosquitofish (Gambusia affinis). The bullfrog(Rana catesbiana), a nonnative amphibian, also occurs in the valley and breeds in habitatspreferred by the Oregon chub (Willamette Basin Task Force, 1969; Hjort et al.,1984; Li etal., 1984; Scheerer et al., 1992). The period of severe decline of the Oregon chub does notcoincide well with the initial dates of introduction of nonindigenous species. However, manysites formerly inhabited by the Oregon chub are now occupied by nonnative species (Markleet al., 1989). Formerly successful Oregon chub populations, whether natural or introduced,have declined in sites where nonnatives have become established (Scheerer, pers. comm.,2004). The 1996 flooding in the Santiam River was probably responsible for several of thesemovements of nonnative fish. Other sites, located in the Middle Fork Willamette Riverdrainage, were likely the result of unauthorized introductions or spread of nonnative fishfrom reservoirs (Scheerer and Jones, 1997).
Specific interactions responsible for the exclusion of Oregon chub from habitats dominatedby nonnative species are not clear in all cases. While information confirming the presence ofOregon chub in stomach contents of predatory fishes is lacking, many nonnative fishes,particularly adult centrarchids (bass, for example) and ictalurids (catfish, for example) aredocumented piscivores (fish eaters) (U.S. Fish and Wildlife Service, 1998). These fishes arefrequently the dominant inhabitants of ponds and sloughs within the Willamette Riverdrainage and may constitute a major obstacle to Oregon chub recolonization efforts. Adultbullfrogs prefer habitat similar in characteristics (that is, little to no water velocity, abundantaquatic and emergent vegetation) to the habitat preferred by Oregon chub and are known toconsume small fish as part of their diet (U.S. Fish and Wildlife Service, 1998). Nonnativefishes may also serve as sources of parasites and diseases; however, disease and parasiteproblems have not been studied in the Oregon chub.
In many cases the observed feeding strategies and diet of introduced fishes, particularlyjuvenile centrarchids (bass and crappie, for example) and adult mosquitofish (Li et al.,1987)and bullfrogs (U.S. Fish and Wildlife Service, 1998), overlap with the diet and feedingstrategies described for Oregon chub (Pearsons, 1989). This suggests that direct competitionfor food between Oregon chub and introduced species may further impede chub’s survivaland chub recovery efforts. The rarity of finding Oregon chub in waters also inhabited bymosquitofish may reflect many negative interactions, including but not limited to food-basedcompetition, aggressive spatial exclusion, and predation on eggs and larvae (Dr. DouglasMarkle, Oregon State University, pers. comm., 1997; Meffe, 1984).
Water Quality. Many of the known extant populations of Oregon chub occur near rail,highway, and power transmission corridors and within public park and campground facilities.These populations are threatened by chemical spills from overturned truck or rail tankers;
DRAFT WILLAMETTE SUBBASIN PLAN
CH 3 ASSESSMENT.DOC 3-141
runoff or accidental spills of vegetation control chemicals; overflow from chemical toilets incampgrounds; sedimentation of shallow habitats from construction activities; and changes inwater level or flow conditions from construction, diversions, or natural desiccation. Oregonchub populations near agricultural areas are subject to poor water quality as a result of runoffladen with sediment, pesticides, and nutrients. Logging in the watershed can result inincreased sedimentation and herbicide runoff.
Population Distribution: Historical and Current Capacity. The following is a summary ofthe historical and current distribution of Oregon chub (Paul Scheerer, Oregon Department ofFish and Wildlife, pers. comm., 2004).
Calapooia River. Oregon chub were found historically in the Calapooia River. One recordexists for chub presence in Oak Creek near Albany (1894). Recent ODFW surveys have notlocated any Oregon chub populations in this subbasin. Nonnative fish and loss of habitatlimit Oregon chub recovery in this subbasin.
Clackamas River. Oregon chub were found historically in the Clackamas River. Recordsexist for chub presence in lower Clear Creek (1899) and near the mouth of the Clackamas(1953). Currently no known populations exist in the Clackamas drainage. Recent surveys atthe historical locations yielded no chub.
Coast Fork Willamette River. Oregon chub were found historically in the Coast ForkWillamette River. Three record exists for chub presence near Cottage Grove (1950), Saginaw(1967), and Dorena (1958). Currently, there is one natural and one introduced population inthe Coast Fork Subbasin (near Creswell and in the upper Layng Creek drainage). Nonnativefish and loss of off-channel habitats (two flood control dams, revetments) limit Oregon chubrecovery in this subbasin.
Long Tom River. Oregon chub were found historically in the Long Tom River. One recordexists for chub presence near Monroe (1899). Recent ODFW surveys have not located anyOregon chub populations in this subbasin. Nonnative fish and loss of habitat limit Oregonchub recovery in this subbasin.
Luckiamute River. Oregon chub were found historically in the Luckiamute River. Onerecord exists for chub presence in Cooper Creek near its confluence with the LuckiamuteRiver (1949). Recent ODFW surveys have not located any Oregon chub populations in thissubbasin. Nonnative fish limit Oregon chub recovery in this subbasin.
McKenzie River. Oregon chub were found historically in the McKenzie River. One recordexists for chub presence near Eugene (1899). Currently, there are two natural and oneintroduced populations in the McKenzie Subbasin (near Marcola and Springfield). Nonnativefish and loss of off-channel habitats (two flood control dams, revetments) limit Oregon chubrecovery in this subbasin.
Middle Fork Willamette River. Oregon chub were found historically in the Middle ForkWillamette River. Seven records exist for chub presence between Lowell and Oakridge.Currently, there are 14 natural and two introduced populations in the Middle Fork WillametteSubbasin (Jasper to Wicopee). Nonnative fish and loss of off-channel habitats (four floodcontrol dams, revetments) limit Oregon chub recovery in this subbasin.
DRAFT WILLAMETTE SUBBASIN PLAN
3-142 CH 3 ASSESSMENT.DOC
Molalla River. No records for Oregon chub exist in the historical records. Recent ODFWsurveys have not located any Oregon chub populations in this subbasin. Nonnative fish limitOregon chub recovery in this subbasin.
North Santiam River. Oregon chub were found historically in the North Santiam River. Onerecord exists for chub presence near Green’s Bridge (1983). Currently, there are four knownpopulations in the North Santiam Subbasin, including Green’s Bridge, Geren Island, GraySlough (near Stayton), and Pioneer Park (near Stayton). Nonnative fish and loss of off-channel habitats (two flood control dams, revetments) limit Oregon chub recovery in thissubbasin.
Rickreall Creek. No records for Oregon chub exist in the historical records. Recent ODFWsurveys have not located any Oregon chub populations in this subbasin. Nonnative fish limitOregon chub recovery in this subbasin.
Santiam River. No records for Oregon chub exist in the historical records. Recent ODFWsurveys located one Oregon chub population in this subbasin (near Interstate I-5). Nonnativefish and loss of off-channel habitats (four flood control dams in tributaries, revetments) limitOregon chub recovery in this subbasin.
South Santiam River. Oregon chub were found historically in the South Santiam River.Three records exist for chub presence near Lebanon (1957). Currently, there is oneintroduced population in the South Santiam subbasin (near Foster Dam). Nonnative fish andloss of off-channel habitats (two flood control dams, revetments) limit Oregon chub recoveryin this subbasin.
Tualatin River. No records for Oregon chub exist in the historical records. No knownpopulations currently exist. Nonnative fish may limit Oregon chub recovery in this subbasin.
Willamette River (Mainstem). Oregon chub were found historically in the Willamette River.Four records exist for chub presence near Junction City (1967), Eugene (1894), Oregon City(1897), and Corvallis (1899). Recent ODFW surveys have not located any Oregon chubpopulations in this subbasin. Nonnative fish and loss of habitat limit Oregon chub recovery inthis subbasin.
Yamhill River. No records for Oregon chub exist in the historical records. Recent ODFWsurveys have not located any Oregon chub populations in this subbasin. Nonnative fish limitOregon chub recovery in this subbasin.
3.2.4.6 Pacific LampreyTwo species of lamprey are known to be distributed in all subbasins of the Willamette Basin.The Pacific lamprey (Lampetra tridentata) is a large, anadromous, and parasitic species andhas received the most research and management attention. The western brook lamprey (L.richardsoni) is smaller, nonanadromous, and nonparasitic. There is little information on thelife history or population status of western brook lamprey in the Willamette Basin. Riverlamprey (L. ayresi) may reside in the system, but little information exists on the species, andits continued existence is not certain (Kostow, 2002). This description of lamprey life history,population status, and trends is from Kostow (2002).
DRAFT WILLAMETTE SUBBASIN PLAN
CH 3 ASSESSMENT.DOC 3-143
Pacific and western brook lamprey were listed as an Oregon State sensitive species in 1993because a serious decline in abundance had been observed since the 1950s; both species weregiven further legal protective status by the state in 1997 (OAR 635-044-0130).
Life History Patterns and Diversity. This section presents life history patterns and diversityof anadromous Pacific lamprey and resident western brook lamprey, both of which are foundin the Willamette Basin.
Adult Migration and SpawningPacific Lamprey. Pacific lampreys enter saltwater and become parasitic, feeding on a widevariety of fish. It is not known how long they reside in the ocean. Pacific lamprey return tofreshwater in the lower Columbia River as early as February, with peak numbers passingover Willamette Falls in May and June. They do not feed after entering freshwater. Aftercompleting part of their migration into the Willamette system, Pacific lamprey generallyover-winter before spawning in the spring. Pacific lampreys select gravel substrate forspawning, usually near pools and ammocoete habitat. Most adults die after spawning, butthere have been observations of repeat spawners and out-migration after spawning.
Western Brook Lamprey. The western brook lamprey is a nonparasitic, resident species. Theselampreys spawn and live in smaller tributaries. Upon becoming adults, they go dormant untillate winter or spring, when spawning occurs. Spawning takes place in small gravels upstreamof riffles. Fecundity measured in the Willamette Basin ranged from about 2,500 to 5,500eggs per female. Adults die after spawning.
Emergence and Juvenile Out-Migration and MovementPacific Lamprey. Most downstream movement occurs at night. After rearing for 5 to 7 years inthe river or lower tributaries, the ammocoetes begin out-migrating as macropthalmia,eventually returning to the ocean. Out-migration to the ocean occurs November through June,peaking in the spring.
Western Brook Lamprey. Western brook lampreys probably move very little from spawningareas in tributary streams, with most of the movement passive downstream drift.
Rearing, Refuge and ForagePacific Lamprey. Pacific lampreys may live as ammocoetes in freshwater for a number of yearsas filter feeders living in the substrate. Pacific lamprey ammocoetes move progressivelydownstream, eventually accumulating in the lower parts of the subbasins and in theWillamette River, preferring low-gradient areas in the river and tributaries.
Western Brook Lamprey. Western brook lamprey ammocoetes distribute in the stream systembased on size, with the smaller ammocoetes further upstream in areas with fewer silt depositsand shallower waters. The ammocoetes are filter feeders that metamorphose into nonfeedingadults after 4 to 6 years.
Population Distribution: Historical and Current Capacity. There have been nosystematic inventories of lamprey distribution within the Willamette Basin. Mostobservations of lamprey have been incidental observations noted during stream habitatinventories or spawning surveys. Most observations are of juvenile lamprey (ammocoetes).Because ammocoetes from western brook and Pacific lamprey are difficult to distinguish,distribution observations tend to generalize across the species. These limited observations
DRAFT WILLAMETTE SUBBASIN PLAN
3-144 CH 3 ASSESSMENT.DOC
suggest that lampreys are still well distributed through the Willamette Coast Rangesubbasins, in the Molalla/Pudding system, and in the lower Santiam and Calapooia rivers.However, lamprey distribution has been substantially restricted by barriers at U.S. ArmyCorps of Engineers dams, other dams, and fish passage barriers at culverts and otherstructures. There is evidence that lamprey cannot pass above many fish ladders. For example,lampreys are restricted below the North Fork Dam on the Clackamas River, even though thedam is equipped with a functional fish ladder. Culverts at road crossings, weirs, and otherinstream structures can block upstream passage for lamprey. Any barrier that has a sharp lip,a high-velocity current, a smooth downstream surface, or a hanging drop more than a fewinches high will be a passage problem. Diversions and dams also can contribute to lampreymortality during downstream migration.
Abundance and Population Trends. The Willamette Basin is probably the most importantproduction area for Pacific lamprey in the Columbia system. This was probably truehistorically as well as currently. Anecdotal historical observations indicate that lamprey werevery abundant in the Willamette Basin. In the 1880s an observer from the United States FishCommission at Willamette Falls stated that “the rocks at the particular point of the Fallswhere salmon ascend were at times completely covered with lampreys. In places where theforce of the current was least, they were several layers deep, and at a short distance the rockappeared to be covered with a profuse growth of kelp or other water plants” (McDonald1884, as quoted in Kostow, 2002).
Limited data from the Willamette Basin indicate that Pacific lamprey abundance hasdeclined, yet the Willamette remains the most important production area in the ColumbiaBasin. Even with large yearly fluctuations, it appears that more lampreys pass overWillamette Fall annually than are counted at Bonneville Dam.
Harvest of Pacific lamprey at Willamette Falls provides the best estimate of trends in Pacificlamprey abundance. Hundreds of thousands of adult lamprey were harvested at WillametteFalls during the 1940s and early 1950s, and it is unlikely that this number currently passesWillamette Falls. Since completion of the Willamette Valley Project and the 13 U.S. ArmyCorps of Engineers dams in 1967, the annual commercial harvest has decreased considerablyfrom the estimated average of more than 312,000 lampreys from 1943 to 1949. Lampreyscontinue to be harvested (by permit) at Willamette Falls. In 2001, about 15,500 lampreyswere harvested.
Lamprey abundance can vary dramatically from one stream to the next. This variability inabundance is reflected in juveniles collected in smolt traps in 2001 on tributaries to the lowerClackamas River (not identified to species). Clear Creek had extremely large numbers ofjuvenile lamprey (9,480), while far fewer were observed in Deep Creek (173 ) and EagleCreek (101). ODFW recently completed surveys of urban stream within the City of Portland(Tinus et al., 2003a) and streams within Clackamas County (Tinus et al., 2003b). Lampreyswere observed throughout a number of watersheds. Although most lampreys were notidentified to species, both Pacific and western brook lamprey were observed in the streams.In some streams, a relatively high abundance of lampreys was observed.
DRAFT WILLAMETTE SUBBASIN PLAN
CH 3 ASSESSMENT.DOC 3-145
3.2.4.7 Aquatic Introductions, Artificial Production, and Captive BreedingPrograms
Hatchery operations have had a number of direct and indirect effects on focal fish species inthe Willamette Basin. One of the most important influences has involved heavysupplementation of naturally reproducing populations with hatchery-origin spawners.Willamette Basin populations of spring Chinook salmon and winter steelhead all have beeninfluenced in this way. Most of these naturally reproducing populations are currently atcritically low levels of abundance.
Native winter steelhead were artificially propagated in hatcheries in the South Santiam Riverbeginning in 1926 (Wallis, 1961) and in the North Santiam River beginning in 1930 (Wallis,1963). However, Willamette Basin hatchery production of native winter steelhead wasdiscontinued in 1998.
Introduced Skamania Hatchery summer steelhead is now the only stock produced andreleased from Willamette Basin hatcheries. However, hatchery releases of steelhead have notoccurred in the South Santiam River since 1989. Chilcote (1997) estimated that theproportion of naturally spawning fish that are of hatchery origin in this subbasin is less than 5percent.
Differences in the run timing of returning adult spawners may limit, but does not eliminate,the potential for interbreeding of the native winter steelhead stock with the introducedhatchery summer steelhead stock. These stocks are genetically distinct. Genetic monitoringin the Clackamas Subbasin has indicated that hatchery-origin summer steelhead spawning innatural production areas above North Fork Reservoir have replaced a significant proportionof the natural production once provided by native winter steelhead. The extent to which thisproblem may also occur in the North Santiam River is unknown.
A healthy population must be able to sustain itself naturally. That is, naturally reproducedspawners must be able to replace themselves in subsequent generations. Hatchery fish thatare left unharvested stray into natural production areas and spawn, competing with naturallyproduced spawners in those areas in many important ways, some of which are discussedbelow.
Where naturally reproducing populations are heavily supplemented with hatchery fish, it isimportant to know the relative contributions that fish of natural origin and of hatchery originare making to subsequent generations of naturally produced spawners. This is necessary todetermine whether the population is self-sustaining. If most naturally produced spawners in apopulation originate from parents that are hatchery fish, closure of the hatchery (because of,say, dysfunction, disease problems, or financial hardship) and subsequent loss of thehatchery-origin spawners could put the local population at risk of extirpation. If relativelyfew naturally produced spawners originate from parents that are hatchery fish, then mostoriginate from parents of natural origin and the population is more likely to be self-sustaining. Consequently, lack of knowledge about the proportion of natural spawners thatare of hatchery origin and the contribution of these fish to subsequent generations cansubstantially increases the risks to persistence of a local population.
Before 2000, most spring Chinook salmon of hatchery origin that returned to the WillametteRiver were unmarked, making it difficult or impossible to determine the proportion of natural

DRAFT WILLAMETTE SUBBASIN PLAN
3-146 CH 3 ASSESSMENT.DOC
spawners that were of hatchery origin. In 2000 and 2001, ODFW estimated that more than 94percent and 98 percent, respectively, of spring Chinook spawning naturally in the NorthSantiam River were of hatchery origin (Schroeder et al., 2002). Likewise, Schroeder et al.(2002) found that more than 84 percent of spring Chinook spawning in the South SantiamRiver and more than 77 percent of spring Chinook spawning in the Middle Fork WillametteRiver in 2002 were of hatchery origin. The recoveries of marked (that is, fin-clipped)hatchery fish upon which these estimates were made tend to underestimate the actualproportion of hatchery-origin spawners because marking is not 100 percent effective.
Given the high contributions of hatchery-origin spawners to natural production in these areas,it is unlikely that any of these local populations are currently self-sustaining. Development ofnatural production sanctuary areas, where natural spawning of hatchery-origin fish can bereduced or eliminated, is essential if these local populations are ever to recover to a pointwhere they are once again self-sustaining.
Recovering the use of high-quality spawning and rearing habitat located above major dams inthe Willamette Basin through adult spawner trap-and-transport programs has the additionaladvantage of providing the opportunity to sort the transported fish and remove those ofknown hatchery origin. Thus, natural production sanctuaries could be developed above thesedams. Although there is often a challenge in providing sufficient passage downstream forjuveniles produced in areas above dams, the development of a natural production sanctuaryin the South Santiam River above Foster Dam has worked relatively well for production ofnative winter steelhead.
The only remaining local population of spring Chinook in the Willamette Basin that may stillbe naturally self-sustaining is the population located above Leaburg Dam in the McKenzieSubbasin. In 1994 and 1995, ODFW estimated that 52 percent and 55 percent, respectively,of spring Chinook spawners passing Leaburg Dam were of natural origin (Willis et al.,1995). From 1998 through 2001, the average proportion of natural-origin spawners passingabove Leaburg Dam was estimated at about 74 percent (Schroeder et al., 2002).
The straying rate of hatchery fish into this natural production area, which is in excess of 20percent, is still threatening to the long-term persistence of the local population. For example,based on a hatchery-origin fish spawning at a rate of just 40 percent of all natural spawners,Neeley (1996) showed that if a particular gene (that is, the “hatchery” gene type) were justhalf as effective with respect to survival of hatchery-parent offspring as the same gene (thatis, the “wild” gene type) was for wild fish, the frequency of the “wild” gene type woulddiminish within the population from 100 percent to just below 20 percent after only 25 years.If the natural spawning rate of hatchery-origin fish were then reduced to only 10 percent, the“wild” gene frequency within the population would slowly recover to just more than 60percent after 70 years.
Under conditions of low to moderate numbers of fish passing at Leaburg Dam, an effort ismade to capture and remove marked hatchery spring Chinook. The existing capture andhandling facilities at Leaburg Dam are inadequate to safely handle large numbers of fish, somany hatchery-origin spawners escape to spawn naturally above the dam during the peak ofthe run.
DRAFT WILLAMETTE SUBBASIN PLAN
CH 3 ASSESSMENT.DOC 3-147
A Biological Opinion developed by NOAA Fisheries and issued to BPA and the PortlandDistrict of the U.S. Army Corps of Engineers in July 2002 directed the Corps to provideimproved fish trapping and handling facilities at Leaburg Dam in an effort to provide anatural production sanctuary above the dam. To date, multiple challenges and problems haveprevented development of these facilities. The Biological Opinion will be updated in 2004.
Additional adverse effects resulting from hatchery programs in the Willamette Basin haveincluded genetic change to populations through extensive interbasin stock transfers atWillamette Project hatchery facilities and subsequent interbreeding between naturallyproduced (wild) and hatchery-origin fish.
Originally, life history characteristics among local populations of salmonid species in theWillamette Basin originally markedly (Willis et al., 1995). For example, the timing of springChinook spawning was different in the Clackamas (early July to late August), Santiam (lateAugust to the last week in October), and McKenzie (mid-August to the third week inOctober) subbasins. Currently, the time of spawning throughout the Willamette Basin forspring Chinook is truncated and uniform, beginning in early September and extendingthrough mid-October with a peak around the third week in September (Willis et al., 1995).
Other adverse effects artificial production include increased competition between artificiallyand naturally produced juveniles for food and rearing habitat. Juvenile rearing habitat hasbeen substantially reduced in the basin. For example, juvenile spring Chinook rear incomplex habitat such as that found in braided stream channels and in near-shore areas thatcontain rooted aquatic vegetation and large wood. Much of this type of habitat was lost in theupper Willamette Basin, and elsewhere, between 1854 and 1946 as a result of deforestationand large wood removal from streams for boat navigation and agricultural development(Maser and Sedell, 1994). Usually, hatchery fish are larger at release than comparably aged,naturally produced fish and thus have a competitive advantage.
Production of large numbers of hatchery fish, which can be sustainably harvested at a muchhigher rate than naturally produced fish, has encouraged the over-harvesting of wild stocks.For example, cohort analysis of Willamette spring Chinook salmon by Cramer et al. (1996)showed that early ocean survival (to age 2) and consequent overall smolt-to-adult survivalvaried five- to twelvefold for the 1975-1989 brood years, ranging from 1 percent to 5 percentfor subyearling emigrants and from 1 percent to 12 percent for yearling emigrants. However,harvest rates remained high every year, ranging between 70 percent and 80 percent for nearlyall broods. At these high harvest rates, over-harvesting of naturally produced fish in lowsurvival years would have been substantial. Marking and selective harvest of hatchery fishhas substantially reduce this problem in recent years.
In July 2000, the NOAA Fisheries developed a Biological Opinion under Section 7 of theEndangered Species Act in consultation with BPA and the U.S. Army Corps of Engineers onthe effects of Willamette Basin hatcheries on species listed under the act. (NMFS, 2000).Hatcheries considered in the Biological Opinion are listed in Table 3-43.
The U.S. Army Corps of Engineers and BPA fund more than 90 percent of the artificialpropagation programs that potentially affect listed spring Chinook and winter steelhead in theupper Willamette River ESUs. However, all of the hatcheries included in the consultation areoperated and maintained by ODFW. The area considered in the Biological Opinion

DRAFT WILLAMETTE SUBBASIN PLAN
3-148 CH 3 ASSESSMENT.DOC
encompasses the entire Willamette Basin from the mouth to the uppermost range of thedefined ESUs.
The effects of hatchery program activities in the upper Willamette River ESUs were cited byNOAA Fisheries’ status reviews as potential factors for the decline of these ESUs (Busby etal., 1996; Myers et al., 1998). Interbreeding among hatchery-origin and natural-origin fishand the incidental harvest of listed fish in commercial and recreational fisheries targetingabundant hatchery runs were identified as particular concerns.
Table 3-43: Willamette Subbasin Hatcheries
Clackamas Hatchery The Clackamas Hatchery is located at approximately RM 23 on the Clackamas River, whichflows into the Willamette River approximately 2 miles downstream from Willamette Falls. Thepurpose of this spring Chinook hatchery program is to mitigate for fisheries losses associatedwith hydropower development and habitat degradation within the subbasin.
Marion ForksHatchery
The purpose of this hatchery program is to mitigate for the loss of spring Chinook productionassociated with the construction of Big Cliff and Detroit dams on the North Santiam River,which blocked all upstream fish passage. The Marion Forks Hatchery is located above DetroitDam, on the North Santiam River at RM 73.
South SantiamHatchery
The purpose of the hatchery program is to mitigate for fishery losses associated with theconstruction of Foster and Green Peter dams on the South Santiam River. The South SantiamHatchery is located adjacent to Foster Dam at RM 38. The South Santiam River is a tributary tothe Santiam River, which flows into the Willamette River.
McKenzie Hatchery The purpose of this hatchery program is to mitigate for fish production losses associated withthe development and operation of Blue River and Cougar dams on the McKenzie River. TheMcKenzie Hatchery is located on the McKenzie River approximately 22 miles east ofSpringfield, Oregon. The proposed smolt production goal is 1.485 million fish.
Leaburg Hatchery The purpose of this hatchery program is to mitigate for lost trout habitat caused by theconstruction of Blue River and Cougar dams and other Willamette Valley projects. LeaburgHatchery is located on the McKenzie River approximately 23 miles east of Springfield, Oregon,and is used for egg incubation and rearing of summer steelhead and rainbow trout.
Willamette Hatchery The purpose of the hatchery program is to mitigate for fishery losses caused by the Hills Creek,Lookout Point, and Dexter hydroelectric/flood control projects. The Willamette Hatchery islocated along Salmon Creek, approximately 3 miles upstream from its confluence with theMiddle Fork Willamette River.
Source: NMFS, 2000.
Willamette Basin Hatchery and Genetic Management Plans (HGMPs) required under NMFS4(d) rule will be completed in 2004. HGMPs are described in the final salmon and steelhead4(d) rule (July 10, 2000; 65 FR 42422) as a mechanism for addressing the take of certainlisted species that may occur as a result of artificial propagation activities. A number of“mini” HGMPs based on early NOAA Fisheries guidance have been completed for springChinook programs at the Clackamas, Marion Forks, South Santiam, McKenzie, andWillamette hatcheries (see Figure 3-31). A prototype HGMP also was developed for thesummer steelhead hatchery program at Leaburg Hatchery.

DRAFT WILLAMETTE SUBBASIN PLAN
CH 3 ASSESSMENT.DOC 3-149
Figure 3-31: Willamette Subbasin Hatcheries
The July 2000 NOAA Fisheries Biological Opinion considered the impacts of proposedactions by BPA, the U.S. Army Corps of Engineers and ODFW, including the release of atotal of 5.7 million artificially propagated spring Chinook, 570 thousand summer steelhead,and 325 thousand rainbow trout in the upper Willamette Basin. Table 3-44 lists annual

DRAFT WILLAMETTE SUBBASIN PLAN
3-150 CH 3 ASSESSMENT.DOC
release goals of hatchery fish in the upper Willamette ESUs. Consequently, the BiologicalOpinion identified three key issues regarding hatchery management in the Willamette Basin:
• Hatchery spring Chinook cannot be differentiated from naturally produced fish on thespawning grounds and in hatchery broodstocks.
• There is the possibility of significant interbreeding between hatchery fish and natural fishin the wild, which results in the loss of local adaptation among the wild populations. Theactual level of hatchery fish straying is uncertain.
• The majority of hatchery production in the basin is to mitigate for habitat loss anddegradation from federal dams. However, the abundance of hatchery fish promotesfisheries that may significantly affect the remaining listed fish populations.
Table 3-44: Annual Release Goals of Hatchery Fish by Location and Species from ArtificialPropagation Programs in the Upper Willamette River ESUs
Release Location(Subbasins Except
Where Noted)Spring
ChinookFall
ChinookWinter
SteelheadSummer
SteelheadCoho
SalmonRainbow
Trout Total
Coast Fork Willamette 0 0 0 0 0 200,000 200,000
Middle Fork Willamette 1,427,240 0 0 157,000 0 0 1,584,240
Upper Willamette 0 0 0 0 0 0 0
McKenzie 985,000 0 0 108,000 125,000 1,218,000
South Santiam 1,021,000 0 0 144,000 0 0 1,165,000
North Santiam 667,000 0 0 161,500 0 0 828,500
Middle Willamette 0 0 0 0 0 0 0
Yamhill 0 0 0 0 0 0 0
Molalla 100,000 0 0 0 0 0 100,000
Tualatin 0 0 0 0 0 0 0
Clackamas 1,257,700 0 0 0 0 0 1,257,700
mainstem LowerWillamette River
260,000 n/a 0 0 n/a 0 260,000
Columbia Riverestuary*
900,000 n/a n/a n/a n/a 900,000
TOTAL 6,617,940 0 0 570,500 0 325,000 7,513,440
* Juvenile releases in the estuary are from broodstock collected in the Upper Willamette spring Chinook ESU.Notes: Subbasins are listed from upstream to downstream based on 4th-field HUCs. “N/A” represents hatchery productionaddressed.
The Biological Opinion concluded that the proposed actions will likely result in changes inthe abundance, productivity, population structure, and/or genetic integrity of the UpperWillamette River spring Chinook and winter steelhead ESUs. NOAA Fisheries found thefollowing:

DRAFT WILLAMETTE SUBBASIN PLAN
CH 3 ASSESSMENT.DOC 3-151
• The hatchery programs as described in the proposed actions appreciably reduce both thesurvival and recovery of listed spring Chinook and thus jeopardize the continuedexistence of the Upper Willamette spring Chinook ESU.
• The proposed actions do not appreciably reduce the survival and recovery of listed wintersteelhead; thus, they do not jeopardize the continued existence of the Upper WillametteRiver winter steelhead ESU.
• The proposed actions will not result in the destruction or adverse modification of criticalhabitat for the listed Upper Willamette River ESUs.
• The proposed actions do not jeopardize the continued existence of or result in adversemodification of critical habitat for the following listed ESUs: Lower Columbia RiverChinook and steelhead, Columbia River chum, Middle Columbia River steelhead, SnakeRiver spring/summer Chinook, fall Chinook, steelhead, and sockeye, and UpperColumbia River spring Chinook and steelhead.
The reasonable and prudent alternative contained in the Biological Opinion identifies fourmeasures that will avoid jeopardy of the Upper Willamette River spring Chinook ESU:
• Immediately reducing the number of hatchery fish spawning naturally
• Modifying the numbers and release locations of hatchery fish to reduce adverseecological effects
• Developing locally adapted hatchery stocks
• Facilitating the identification of hatchery and naturally produced fish.
NMFS developed several additional conservation recommendations related to hatcheries:
• Recommendations for All Agencies:
− Fund and/or continue to collaboratively develop Hatchery and Genetic ManagementPlans (HGMPs) for hatchery programs in the Upper Willamette River spring Chinookand winter steelhead ESUs (before September 30, 2003, with spring Chinook thehighest priority).
− Develop distinguishable marks (or a representative sample) for hatchery springChinook within each of the subbasins.
− Develop production plans that minimize transfers of fish among hatcheries forrearing.
− Consider relocating some of the mitigation hatchery production to Lower ColumbiaRiver “select areas” to reduce the number of surplus fish returning to hatcheries in theWillamette Basin.
• Agency-Specific Recommendations:
− The U.S. Army Corps of Engineers should develop contingency plans for productiongoals (and release strategies) if future monitoring and evaluation suggest that

DRAFT WILLAMETTE SUBBASIN PLAN
3-152 CH 3 ASSESSMENT.DOC
hatchery mitigation is not being used in fisheries and that the percentage of hatcheryfish on the spawning grounds is high.
− ODFW should recycle adult hatchery (of known origin) salmon and steelheadcaptured at hatchery facilities within the Willamette Basin to promote the maximumharvest of hatchery fish in recreational fisheries and reduce the number of surplus fishat the end of the season.
3.2.5 Terrestrial Focal Species Population Delineation and CharacterizationAs described in Section 3.2.3, this plan uses focal habitats as an organizing concept todiscuss the terrestrial focal species in the Willamette Basin. Both focal habitats and thepopulations of their associated terrestrial focal species are characterized below.
Much of the terrestrial analysis described in this plan, and the data tools included herein forapplication to conservation decisionmaking, originated with five types of data:
• Land cover (or vegetation) maps• Species distributional data and maps• Species-habitat relationship models• Species attribute databases• Conservation priority maps
Details regarding the manner in which these were used together are described, as are theirindividual and collective assumptions and limitations, in Section 1.4 of Appendix T.
At the project outset the Technical Technical Advisory Group (TTAG), after weighing thestrengths and limitations of numerous sources of information for the above, recommendedthat for the first three items the spatial data layers and biological databases of the PNW-ERCbe used as the primary source, and that for item #4 the IBIS database could be used afterreview and minor modification by the TTAG. For item #5, the primary sources suggestedwere the Priority Conservation Areas (PCAs) identified through application of the SITESmodel by TNC’s Ecoregional Assessment (Floberg et al. 2004) and the Conservation-Restoration Opportunity Areas (CROAs) identified with extensive stakeholder input by thePNW-ERC’s Alternative Futures analysis (Hulse et al. 2002). The TTAG reached thisdecision for the following reasons:
• The PNW-ERC maps are the only source that maps the predominant land cover orvegetation over the entire subbasin at fine (0.22 acre) resolution.
• The PNW-ERC database identifies species distributions at the sub-county scale. Thisinformation Moreover, we updated and refined this information using ORNHIC’sElement of Record (EOR) database (the standard repository for documented records ofmost threatened, endangered, and sensitive species) and the Oregon Breeding Bird Atlas(Adamus et al. 2001) database.
• Of species-habitat models currently available for the subbasin, those of the PNW-ERC(Adamus et al. 2001) provide the greatest level of technical sophistication. Specifically,they recognize 34 land cover types and for each species they score these on a 0-10 scale.An alternative source (IBIS, Johnson and O’Neil 2002) recognizes just 14 cover types inthis subbasin and scores them on a 4-level scale. Moreover, the PNW-ERC models are

DRAFT WILLAMETTE SUBBASIN PLAN
CH 3 ASSESSMENT.DOC 3-153
unique in that the scoring regime for each species takes into account the adjacency of aparticular pixel (patch of potential habitat) to other pixels, as determined through anautomated (GIS) process for each of the 2 million-plus pixels that comprise theWillamette subbasin.
• All the above sources had previously undergone extensive peer review.
The terrestrial habitat analysis presented in this plan (and incorporated in its data tools)encompasses all terrestrial vertebrates, but the narrative accounts for practical reasons arelimited to 55 focal species. The process used to select these species is described inSection 3.2.3.2.
Appendix F contains historical and current range maps. These maps are based on occurrenceof habitat "associations." The maps only predict habitat associations and do not ensure thespecies is or could be present. The maps are intended to show overall distribution patternsand should not be used without field data to infer possible presence of a species or its habitaton a particular land parcel. Models used to plot these maps were peer-reviewed but not field-validated. The maps themselves have not been peer reviewed or field-verified. The mapshave not incorporated all observations of sensitive species from specific locations, asreported to the ORNHIC. Alternative maps showing finer gradations of habitat suitabilitycould be generated by alternative existing models but were not, due partly to time andresource constraints of this project.
3.2.5.1 Focal Habitat: Oak WoodlandsDefinition. For purposes of this plan, oak woodland is defined as stands of Oregon white oak(Quercus garryana), with either closed canopies (oak forest) or with open canopy but treedensities of generally greater than about 100 trees per acre (oak woodland). At least duringrecent decades, oak woodlands have increasingly become oak forests with Doug-fir(Pseudotsuga menziesii) as a common co-dominant. Oak woodlands may include thefollowing seven plant communities recognized by TNC’s Ecoregional Assessment:
• Oregon white oak—Oregon ash/common snowberry• Oregon white oak—long-stolon sedge—common camas• Oregon white oak—wedgeleaf ceanothus—Roemer’s fescue• Oregon white oak—Roemer’s fescue• Oregon white oak—common snowberry—long-stolon sedge• Oregon white oak—common snowberry—sword fern• Oregon white oak—oval-leaf viburnum—poison-oak
Recognition of Importance. Oak woodland has been identified explicitly as a priority forprotection and restoration in nearby regions and specifically in the Willamette Basin.Although no legally-listed threatened or endangered species use oak woodlandpredominantly, several may use it periodically or as part of an overall mosaic of naturalhabitats. Several occur along oak woodland edges. These include the following legally listedspecies: Kincaid’s lupine and Fender’s blue butterfly (both federal—endangered); vespersparrow (state—critical); and sharptail snake, western rattlesnake, and western bluebird(state-vulnerable). Wildlife species that may have used oak woodland regularly beforevanishing (as breeders) from the Willamette Basin include: Lewis’s woodpecker, black-billed
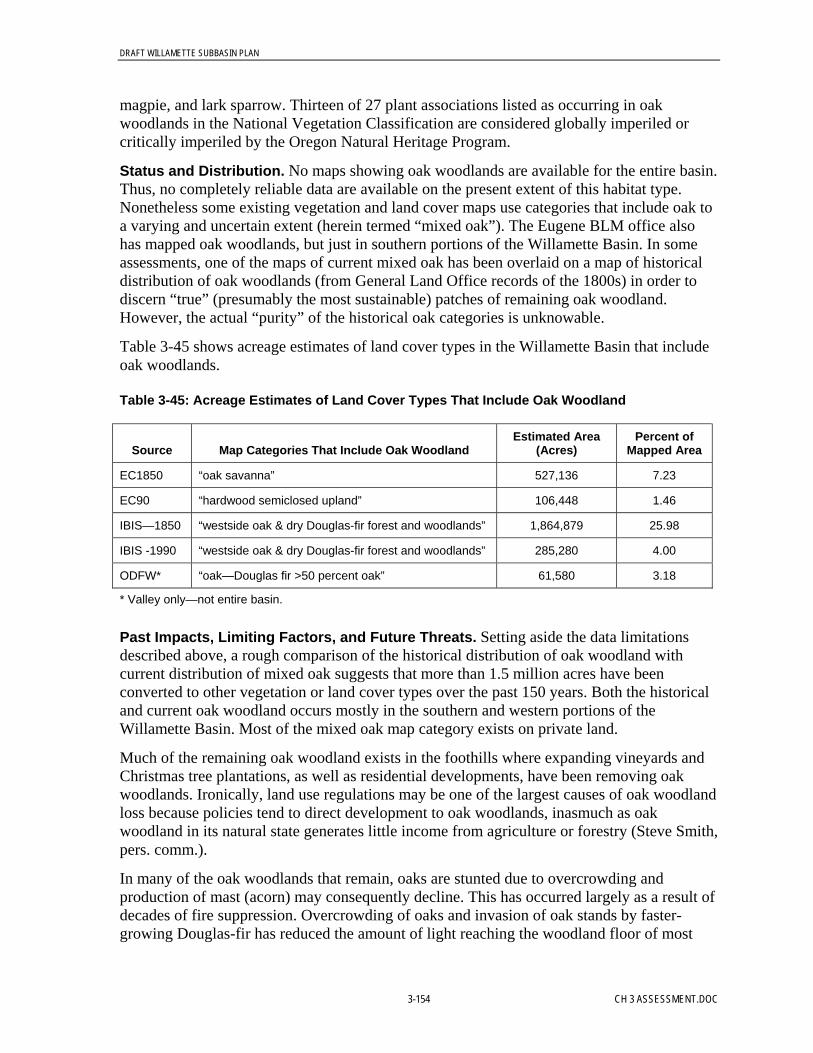
DRAFT WILLAMETTE SUBBASIN PLAN
3-154 CH 3 ASSESSMENT.DOC
magpie, and lark sparrow. Thirteen of 27 plant associations listed as occurring in oakwoodlands in the National Vegetation Classification are considered globally imperiled orcritically imperiled by the Oregon Natural Heritage Program.
Status and Distribution. No maps showing oak woodlands are available for the entire basin.Thus, no completely reliable data are available on the present extent of this habitat type.Nonetheless some existing vegetation and land cover maps use categories that include oak toa varying and uncertain extent (herein termed “mixed oak”). The Eugene BLM office alsohas mapped oak woodlands, but just in southern portions of the Willamette Basin. In someassessments, one of the maps of current mixed oak has been overlaid on a map of historicaldistribution of oak woodlands (from General Land Office records of the 1800s) in order todiscern “true” (presumably the most sustainable) patches of remaining oak woodland.However, the actual “purity” of the historical oak categories is unknowable.
Table 3-45 shows acreage estimates of land cover types in the Willamette Basin that includeoak woodlands.
Table 3-45: Acreage Estimates of Land Cover Types That Include Oak Woodland
Source Map Categories That Include Oak WoodlandEstimated Area
(Acres)Percent of
Mapped Area
EC1850 “oak savanna” 527,136 7.23
EC90 “hardwood semiclosed upland” 106,448 1.46
IBIS—1850 “westside oak & dry Douglas-fir forest and woodlands” 1,864,879 25.98
IBIS -1990 “westside oak & dry Douglas-fir forest and woodlands” 285,280 4.00
ODFW* “oak—Douglas fir >50 percent oak” 61,580 3.18
* Valley only—not entire basin.
Past Impacts, Limiting Factors, and Future Threats. Setting aside the data limitationsdescribed above, a rough comparison of the historical distribution of oak woodland withcurrent distribution of mixed oak suggests that more than 1.5 million acres have beenconverted to other vegetation or land cover types over the past 150 years. Both the historicaland current oak woodland occurs mostly in the southern and western portions of theWillamette Basin. Most of the mixed oak map category exists on private land.
Much of the remaining oak woodland exists in the foothills where expanding vineyards andChristmas tree plantations, as well as residential developments, have been removing oakwoodlands. Ironically, land use regulations may be one of the largest causes of oak woodlandloss because policies tend to direct development to oak woodlands, inasmuch as oakwoodland in its natural state generates little income from agriculture or forestry (Steve Smith,pers. comm.).
In many of the oak woodlands that remain, oaks are stunted due to overcrowding andproduction of mast (acorn) may consequently decline. This has occurred largely as a result ofdecades of fire suppression. Overcrowding of oaks and invasion of oak stands by faster-growing Douglas-fir has reduced the amount of light reaching the woodland floor of most

DRAFT WILLAMETTE SUBBASIN PLAN
CH 3 ASSESSMENT.DOC 3-155
oak woodlands, thus reducing the percent cover and diversity of understory plants. This trendtoward structural simplification and smaller-diameter trees has been documented as havingadverse effects on at least 12 bird species (Hagar & Stern 2001). Unfortunately, in oakwoodlands that are regulated by the Oregon Forest Practices Act, harvested oaks must bereplaced with conifers (150/ac) unless prior exemption is requested. In running computersimulations of future environmental conditions in the Willamette Basin, one researcher(Payne 2002) assumed the maximum rate at which Douglas-fir might invade oak stands to beabout 100 lateral feet per 15 years, as opposed to an expansion rate for oak of 100 ft per 100years. Oak stands that are perhaps least vulnerable to Douglas-fir dominance are those in thedriest settings.
Surely the most potent future threat to oak woodland is Sudden Oak Death, a disease that isdecimating California oaks and has begun spreading to Oregon. Depending on accompanyingchanges in precipitation patterns, global warming has the potential to create microclimates inthe Willamette Basin that are even more favorable for oak woodlands. Especially near urbanareas and roads, oak woodlands are vulnerable to invasive plants such as English ivy (Hederahelix), false-brome (Brachypodium sylvaticum), and scotch broom (Cytiscus scoparius).Minor harvesting of oaks for firewood and lumber also occurs.
Contribution of Oak Woodlands to Regional Biodiversity. Compared with otherWillamette habitat types, oak woodlands in good condition provide the best habitat for 37wildlife species, and are used regularly by at least an additional 100 wildlife species. The oakwoodland avifauna includes 27 birds whose numbers appear to be declining regionally.
Selected Focal Species in Oak Woodlands. The following wildlife species are proposedas focal species for this habitat type: acorn woodpecker, chipping sparrow, western wood-pewee, white-breasted nuthatch, southern alligator lizard, sharptail snake, and western graysquirrel.
On a scale of 0 to 10, these species’ average degree of association with oak woodlands9 is a9.2. Compare this with HEP “loss assessment” species10 used in many previous mitigationcalculations and land acquisitions in the Willamette Basin. Of the “hardwood forest” speciesused in HEP applications, the average degree of association with oak woodlands is only 7.5.This suggests there may have been an unintentional but systematic bias against oakwoodlands in previous mitigation land dealings in the Willamette Basin.
Acorn WoodpeckerSpecial Designations: “Species of Concern” (USFWS). Partners In Flight focal species.
Distribution, Status, and Trends: In the Willamette Basin this non-migratory, cavity-nestingspecies seldom occurs above 1000 ft elevation. Application of simple species-habitat modelsto aerial imagery (that did not delineate oak woodlands specifically) using GIS suggests5.75 percent of the basin might contain habitat that could be at least marginally suitable and0.26 might contain good habitat. The Oregon BBA Project (Adamus et al. 2001) confirmed
9 Calculated from file HABTYPE, using the “Hardwood Open” class as a surrogate for oak woodland, which could not bemapped.10 HEP = Habitat Evaluation Procedure (USFWS 1980). HEP is the procedure that has been used most often by BonnevillePower Administration and other agencies to determine the amount of mitigation required for loss of habitat in the region due toconstruction of reservoirs.

DRAFT WILLAMETTE SUBBASIN PLAN
3-156 CH 3 ASSESSMENT.DOC
nesting in 17 percent of the large survey units in the basin and found evidence of possible orprobable nesting in an additional 13 percent of the units11 Along Willamette Basin BBSroutes12, the species was detected at 0.25 percent of surveyed points in 2003, with amaximum during the period 1968-2003 of 0.86 percent in 1976. Wintering birds are found bymost basin CBCs; numbers are generally 10-30 birds per count area. Acorn woodpeckerapparently was absent in the Willamette Basin until about 1920. Its spread northward hascoincided with disappearance of the closely-related Lewis’ woodpecker. BBS data coveringthe period 1968-2003 show a decrease in the Willamette Valley and western Oregon-Washington generally, with possibly a slight increase since 1980 in the Willamette. Severalpairs may nest in the same oak stand, forming a loose colony. Populations may fluctuate inresponse to semi-annual cycles in acorn production, so several years of monitoring data areneeded to infer trends.
Key Environmental Correlates: A main requirement seems to be a relatively open area, such aslawn or heavily grazed pasture, beneath a high canopy that contains some oaks (Simmons2003). Occupied oak stands in Benton County had a mean density of 107 trees/ac and 167trees/home range, with a mean diameter of 19.2 inches and 2 dead limbs per tree (Doerge1978). Granary trees (required for storing acorns) are generally of large diameter. Generallynot found within the interior of short, dense oak stands. Occupies patches of oak woodland ofless than 1 acre in size provided additional oak stands are not too distant and other structuralrequirements are met (personal observation).
Threats, Limiting Factors, Population Viability: Although it seems to thrive where oaks are large,its increase in the basin also has coincided with increased canopy closure and stunting ofoaks within remaining oak stands. Possibly the greatest threats are the gradual loss (due tofire suppression) of oak stands having at least a few larger-diameter trees, and increasedtraffic on roads between suitable oak stands thus endangering dispersing birds. Thiswoodpecker sometimes nests along lightly-trafficked roads in suburbs and does not appear tobe extremely sensitive to human presence, but its flycatching behavior may put it at greaterrisk around roads with high-speed traffic. No estimates are available of population size orviability.
Biological Objectives: As proposed in Conservation Strategy for Landbirds in Lowlands andValleys of Western Oregon and Washington (Altman 2000), the habitat objectives shouldinclude:
• Maintain a mean oak tree diameter of at least 15 inches, with >20 percent of the treeslarger than 22 inches.
• Maintain canopy cover of douglas-fir at less than 5 percent
• Maintain or create a deciduous (predominantly oak) canopy cover of less than 75 percentand a subcanopy cover of less than 50 percent
11 The area of each survey unit was 245 square miles, and obviously no unit could be surveyed in its entirety. Speciesoccurrence in a unit means it was found in at least one spot within the unit—not necessarily throughout the unit—during atleast one year (late spring and summer) 1995-1999. About 53 units were located entirely or mainly within the Willamette Basin.12 Beginning in 1968, an average of 8 Breeding Bird Survey (BBS) routes have been run each year in the Willamette Basin(range = 2 to 14), with 50 point counts conducted per route. As a result of this relatively small sample size none of the speciestrends reported herein and using the BBS data are statistically, unless noted otherwise.
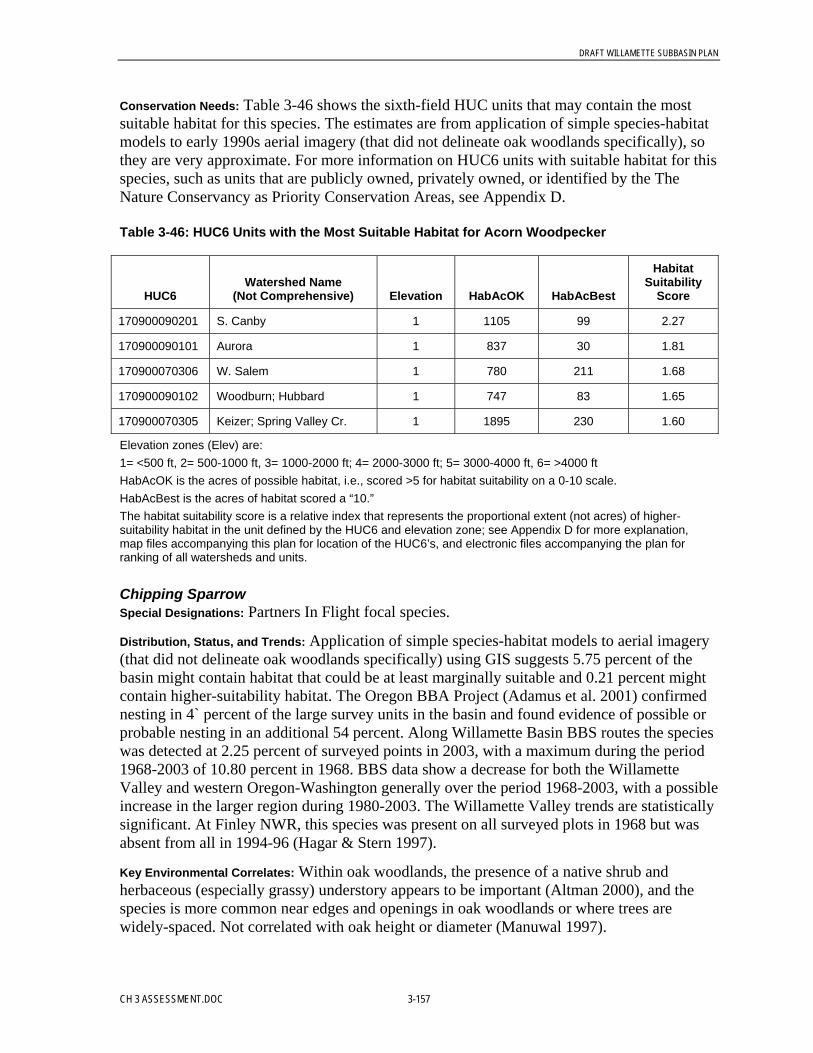
DRAFT WILLAMETTE SUBBASIN PLAN
CH 3 ASSESSMENT.DOC 3-157
Conservation Needs: Table 3-46 shows the sixth-field HUC units that may contain the mostsuitable habitat for this species. The estimates are from application of simple species-habitatmodels to early 1990s aerial imagery (that did not delineate oak woodlands specifically), sothey are very approximate. For more information on HUC6 units with suitable habitat for thisspecies, such as units that are publicly owned, privately owned, or identified by the TheNature Conservancy as Priority Conservation Areas, see Appendix D.
Table 3-46: HUC6 Units with the Most Suitable Habitat for Acorn Woodpecker
HUC6Watershed Name
(Not Comprehensive) Elevation HabAcOK HabAcBest
HabitatSuitability
Score
170900090201 S. Canby 1 1105 99 2.27
170900090101 Aurora 1 837 30 1.81
170900070306 W. Salem 1 780 211 1.68
170900090102 Woodburn; Hubbard 1 747 83 1.65
170900070305 Keizer; Spring Valley Cr. 1 1895 230 1.60
Elevation zones (Elev) are:1= <500 ft, 2= 500-1000 ft, 3= 1000-2000 ft; 4= 2000-3000 ft; 5= 3000-4000 ft, 6= >4000 ftHabAcOK is the acres of possible habitat, i.e., scored >5 for habitat suitability on a 0-10 scale.HabAcBest is the acres of habitat scored a “10.”The habitat suitability score is a relative index that represents the proportional extent (not acres) of higher-suitability habitat in the unit defined by the HUC6 and elevation zone; see Appendix D for more explanation,map files accompanying this plan for location of the HUC6’s, and electronic files accompanying the plan forranking of all watersheds and units.
Chipping SparrowSpecial Designations: Partners In Flight focal species.
Distribution, Status, and Trends: Application of simple species-habitat models to aerial imagery(that did not delineate oak woodlands specifically) using GIS suggests 5.75 percent of thebasin might contain habitat that could be at least marginally suitable and 0.21 percent mightcontain higher-suitability habitat. The Oregon BBA Project (Adamus et al. 2001) confirmednesting in 4` percent of the large survey units in the basin and found evidence of possible orprobable nesting in an additional 54 percent. Along Willamette Basin BBS routes the specieswas detected at 2.25 percent of surveyed points in 2003, with a maximum during the period1968-2003 of 10.80 percent in 1968. BBS data show a decrease for both the WillametteValley and western Oregon-Washington generally over the period 1968-2003, with a possibleincrease in the larger region during 1980-2003. The Willamette Valley trends are statisticallysignificant. At Finley NWR, this species was present on all surveyed plots in 1968 but wasabsent from all in 1994-96 (Hagar & Stern 1997).
Key Environmental Correlates: Within oak woodlands, the presence of a native shrub andherbaceous (especially grassy) understory appears to be important (Altman 2000), and thespecies is more common near edges and openings in oak woodlands or where trees arewidely-spaced. Not correlated with oak height or diameter (Manuwal 1997).

DRAFT WILLAMETTE SUBBASIN PLAN
3-158 CH 3 ASSESSMENT.DOC
Threats, Limiting Factors, Population Viability: Habitat loss and degradation is the greatest threat,with loss of an open grassy ground cover in oak woodlands being a likely limiting factor.Habitat degradation consists of increased density of oaks within stands as a consequence offire suppression. Other limiting factors may include cowbird parasitism of nests. Noestimates are available of population size or viability.
Biological Objectives: As proposed in Conservation Strategy for Landbirds in Lowlands andValleys of Western Oregon and Washington (Altman 2000), the habitat objectives shouldinclude:
• Maintain or create multiple patches of native shrub cover (for example, snowberry,poison oak) and herbaceous openings within oak woodlands such that cover of nativeshrubs is 10-40 percent, cover of blackberries is <10 percent, and cover of herbaceousplants is 30-70 percent
And the following population objectives:
• Reverse declining BBS trends to achieve stable populations ( trends of <2 percent/year)or increasing trends by 2020. Maintain cowbird parasitism rates below 5 percent withinspecific woodlands.
Conservation Needs: Table 3-47 shows the sixth-field HUC units that may contain the mostsuitable habitat for this species. The estimates are from application of simple species-habitatmodels to early 1990s aerial imagery (that did not delineate oak woodlands specifically), sothey are very approximate. For more information on HUC6 units with suitable habitat for thisspecies, such as units that are publicly owned, privately owned, or identified by the TheNature Conservancy as Priority Conservation Areas, see Appendix D.
Table 3-47: HUC6 Units with the Most Suitable Habitat for Chipping Sparrow
HUC6Watershed Name
(Not Comprehensive) Elevation HabAcOK HabAcBest
HabitatSuitability
Score
170900080601 Yamhill 1 2520 1 1.89
170900090102 Woodburn; Hubbard 1 1667 0 1.75
170900070303 Chehalem Cr. 1 3427 0 1.64
170900070301 Saint Paul 1 1838 0 1.54
170900110103 Sandy 2 4363 0 1.45
Elevation zones (Elev) are:1= <500 ft, 2= 500-1000 ft, 3= 1000-2000 ft; 4= 2000-3000 ft; 5= 3000-4000 ft, 6= >4000 ftHabAcOK is the acres of possible habitat, i.e., scored >5 for habitat suitability on a 0-10 scale.HabAcBest is the acres of habitat scored a “10.”The habitat suitability score is a relative index that represents the proportional extent (not acres) of higher-suitability habitat in the unit defined by the HUC6 and elevation zone; see Appendix D for more explanation,map files accompanying this plan for location of the HUC6’s, and electronic files accompanying the plan forranking of all watersheds and units.

DRAFT WILLAMETTE SUBBASIN PLAN
CH 3 ASSESSMENT.DOC 3-159
Western Wood-PeweeSpecial Designations: Partners In Flight focal species.
Distribution, Status, and Trends: This migratory species is fairly common in wooded and partlywooded landscapes of the Willamette Basin, except in moderate- and high-density residentialareas and in landscapes with unbroken conifer forests. Application of simple species-habitatmodels to aerial imagery (that did not delineate oak woodlands specifically) using GISsuggests 9.95 percent of the basin might contain habitat that could be at least marginallysuitable and 1.61 percent might contain good habitat. The Oregon BBA Project (Adamus etal. 2001) confirmed nesting in 37 percent of the large survey units in the basin and foundevidence of possible or probable nesting in an additional 59 percent. Along Willamette BasinBBS routes the species was detected at 20 percent of surveyed points in 2003, with amaximum during the period 1968-2003 of 23 percent in 1974. BBS data covering the period1968-2003 and 1980-2003 show a decrease in the Willamette Valley, but possibly anincrease in western Oregon-Washington generally.
Key Environmental Correlates: A main requirement seems to be a somewhat open canopy ofoaks or other deciduous trees, with few or no conifers (Schrock 2003). The understory maycontain herbaceous plants or shrubs.
Threats, Limiting Factors, Population Viability: Possibly the greatest threats are the gradual loss(due to fire suppression) of oak stands having at somewhat open canopy, and increasedconversion of its habitat to agriculture, conifer forest, or residential use. The species’flycatching behavior may put it at higher risk around roads with heavy traffic. Sometimesnests along lightly-trafficked roads in suburbs. No estimates are available of population sizeor viability.
Biological Objectives: As proposed in Conservation Strategy for Landbirds in Lowlands andValleys of Western Oregon and Washington (Altman 2000), the habitat objectives shouldinclude:
• maintain canopy cover of Douglas-fir at less than 5 percent
• maintain or create a deciduous canopy cover of 40-85 percent of which more than 80percent is oak
And the following population objective:
• reverse declining BBS trends to achieve stable populations (trends of <2 percent/year) orincreasing trends by 2020.
Conservation Needs: Table 3-48 shows the sixth-field HUC units that may contain the mostsuitable habitat for this species. The estimates are from application of simple species-habitatmodels to early 1990s aerial imagery (that did not delineate oak woodlands specifically), sothey are very approximate. For more information on HUC6 units with suitable habitat for thisspecies, such as units that are publicly owned, privately owned, or identified by the TheNature Conservancy as Priority Conservation Areas, see Appendix D.
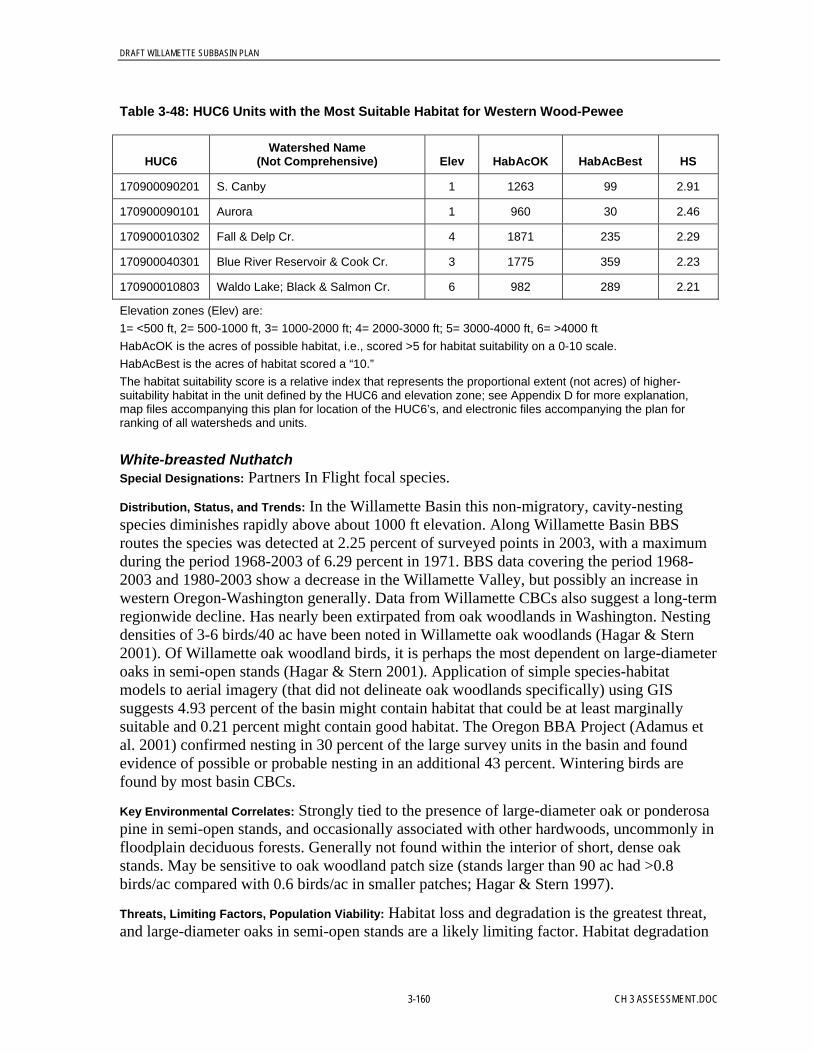
DRAFT WILLAMETTE SUBBASIN PLAN
3-160 CH 3 ASSESSMENT.DOC
Table 3-48: HUC6 Units with the Most Suitable Habitat for Western Wood-Pewee
HUC6Watershed Name
(Not Comprehensive) Elev HabAcOK HabAcBest HS
170900090201 S. Canby 1 1263 99 2.91
170900090101 Aurora 1 960 30 2.46
170900010302 Fall & Delp Cr. 4 1871 235 2.29
170900040301 Blue River Reservoir & Cook Cr. 3 1775 359 2.23
170900010803 Waldo Lake; Black & Salmon Cr. 6 982 289 2.21
Elevation zones (Elev) are:1= <500 ft, 2= 500-1000 ft, 3= 1000-2000 ft; 4= 2000-3000 ft; 5= 3000-4000 ft, 6= >4000 ftHabAcOK is the acres of possible habitat, i.e., scored >5 for habitat suitability on a 0-10 scale.HabAcBest is the acres of habitat scored a “10.”The habitat suitability score is a relative index that represents the proportional extent (not acres) of higher-suitability habitat in the unit defined by the HUC6 and elevation zone; see Appendix D for more explanation,map files accompanying this plan for location of the HUC6’s, and electronic files accompanying the plan forranking of all watersheds and units.
White-breasted NuthatchSpecial Designations: Partners In Flight focal species.
Distribution, Status, and Trends: In the Willamette Basin this non-migratory, cavity-nestingspecies diminishes rapidly above about 1000 ft elevation. Along Willamette Basin BBSroutes the species was detected at 2.25 percent of surveyed points in 2003, with a maximumduring the period 1968-2003 of 6.29 percent in 1971. BBS data covering the period 1968-2003 and 1980-2003 show a decrease in the Willamette Valley, but possibly an increase inwestern Oregon-Washington generally. Data from Willamette CBCs also suggest a long-termregionwide decline. Has nearly been extirpated from oak woodlands in Washington. Nestingdensities of 3-6 birds/40 ac have been noted in Willamette oak woodlands (Hagar & Stern2001). Of Willamette oak woodland birds, it is perhaps the most dependent on large-diameteroaks in semi-open stands (Hagar & Stern 2001). Application of simple species-habitatmodels to aerial imagery (that did not delineate oak woodlands specifically) using GISsuggests 4.93 percent of the basin might contain habitat that could be at least marginallysuitable and 0.21 percent might contain good habitat. The Oregon BBA Project (Adamus etal. 2001) confirmed nesting in 30 percent of the large survey units in the basin and foundevidence of possible or probable nesting in an additional 43 percent. Wintering birds arefound by most basin CBCs.
Key Environmental Correlates: Strongly tied to the presence of large-diameter oak or ponderosapine in semi-open stands, and occasionally associated with other hardwoods, uncommonly infloodplain deciduous forests. Generally not found within the interior of short, dense oakstands. May be sensitive to oak woodland patch size (stands larger than 90 ac had >0.8birds/ac compared with 0.6 birds/ac in smaller patches; Hagar & Stern 1997).
Threats, Limiting Factors, Population Viability: Habitat loss and degradation is the greatest threat,and large-diameter oaks in semi-open stands are a likely limiting factor. Habitat degradation
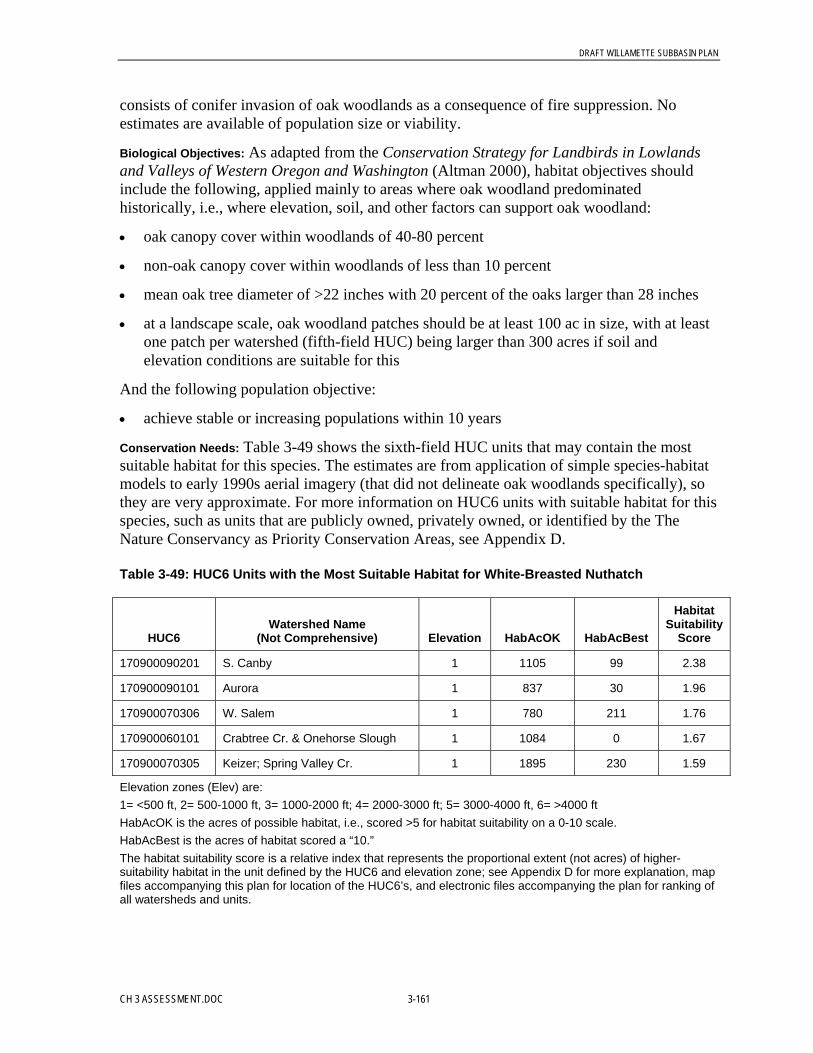
DRAFT WILLAMETTE SUBBASIN PLAN
CH 3 ASSESSMENT.DOC 3-161
consists of conifer invasion of oak woodlands as a consequence of fire suppression. Noestimates are available of population size or viability.
Biological Objectives: As adapted from the Conservation Strategy for Landbirds in Lowlandsand Valleys of Western Oregon and Washington (Altman 2000), habitat objectives shouldinclude the following, applied mainly to areas where oak woodland predominatedhistorically, i.e., where elevation, soil, and other factors can support oak woodland:
• oak canopy cover within woodlands of 40-80 percent
• non-oak canopy cover within woodlands of less than 10 percent
• mean oak tree diameter of >22 inches with 20 percent of the oaks larger than 28 inches
• at a landscape scale, oak woodland patches should be at least 100 ac in size, with at leastone patch per watershed (fifth-field HUC) being larger than 300 acres if soil andelevation conditions are suitable for this
And the following population objective:
• achieve stable or increasing populations within 10 years
Conservation Needs: Table 3-49 shows the sixth-field HUC units that may contain the mostsuitable habitat for this species. The estimates are from application of simple species-habitatmodels to early 1990s aerial imagery (that did not delineate oak woodlands specifically), sothey are very approximate. For more information on HUC6 units with suitable habitat for thisspecies, such as units that are publicly owned, privately owned, or identified by the TheNature Conservancy as Priority Conservation Areas, see Appendix D.
Table 3-49: HUC6 Units with the Most Suitable Habitat for White-Breasted Nuthatch
HUC6Watershed Name
(Not Comprehensive) Elevation HabAcOK HabAcBest
HabitatSuitability
Score
170900090201 S. Canby 1 1105 99 2.38
170900090101 Aurora 1 837 30 1.96
170900070306 W. Salem 1 780 211 1.76
170900060101 Crabtree Cr. & Onehorse Slough 1 1084 0 1.67
170900070305 Keizer; Spring Valley Cr. 1 1895 230 1.59
Elevation zones (Elev) are:1= <500 ft, 2= 500-1000 ft, 3= 1000-2000 ft; 4= 2000-3000 ft; 5= 3000-4000 ft, 6= >4000 ftHabAcOK is the acres of possible habitat, i.e., scored >5 for habitat suitability on a 0-10 scale.HabAcBest is the acres of habitat scored a “10.”The habitat suitability score is a relative index that represents the proportional extent (not acres) of higher-suitability habitat in the unit defined by the HUC6 and elevation zone; see Appendix D for more explanation, mapfiles accompanying this plan for location of the HUC6’s, and electronic files accompanying the plan for ranking ofall watersheds and units.

DRAFT WILLAMETTE SUBBASIN PLAN
3-162 CH 3 ASSESSMENT.DOC
Sharptail SnakeSpecial Designations: “Vulnerable” (ODFW). “Rare, threatened, or uncommon” (ONHP).
Distribution, Status, and Trends: Based on information from other states, this species probablyoccurs in suitable habitat in all parts of the Willamette Basin, but documented records arefew. The ORNHIC database contains documented records from 8 of the 170 Willamettewatersheds. Little is known of status or trends. Some evidence suggests the Willamettepopulation may be a separate race or species (Hoyer 2001).
Key Environmental Correlates: South-facing talus slopes provide critical sites for egg incubationand hibernation. The relatively few records from the Willamette Basin are mainly fromlowland oak woodlands. However, data from other areas suggest that if ground cover (logs,boulders, etc.) is adequate this snake may occur in conifer forests, clearcuts, deciduousriparian areas, low-density residential areas, and grasslands at any elevation (Nussbaum et al.1983, Leonard & Ovaska 1998). Feeds largely on slugs.
Threats, Limiting Factors, Population Viability: No estimates are available of population size orviability, but among the snake species currently inhabiting the basin its rarity appears to besecond only to that of western rattlesnake. Threats might include conversion of woodlands toagriculture land cover; fragmentation of habitat by roads; mining near talus slopes;decimation of invertebrate foods by pesticides; influence of non-native soil invertebrates onsoil leaf litter and slugs; reduced subsoil moisture (required by slugs) as a result ofagricultural drainage, global warming, and groundwater extraction; and removal of downedwood by landowners (for example, for fire risk reduction or landscaping).
Biological Objectives:
• Maintain or increase downed wood (especially large-diameter logs) within oakwoodlands
• Survey and maintain or increase present population in the basin.
Conservation Needs: Table 3-50 shows the sixth-field HUC units that may contain the mostsuitable habitat for this species. The estimates are from application of simple species-habitatmodels to early 1990s aerial imagery (that did not delineate oak woodlands specifically), sothey are very approximate. For more information on HUC6 units with suitable habitat for thisspecies, such as units that are publicly owned, privately owned, or identified by the TheNature Conservancy as Priority Conservation Areas, see Appendix D.
Table 3-50: HUC6 Units with the Most Suitable Habitat for Sharptail Snake
HUC6Watershed Name
(Not Comprehensive) Elevation HabAcOK HabAcBest
HabitatSuitability
Score
170900080502 Amity 1 3274 3133 3.03
170900070102 Independence; Monmouth 1 3606 3191 2.80
170900030602 Soap Cr. 1 2287 1714 2.45
170900030101 W. Eugene; Junction City 1 5345 3820 2.03
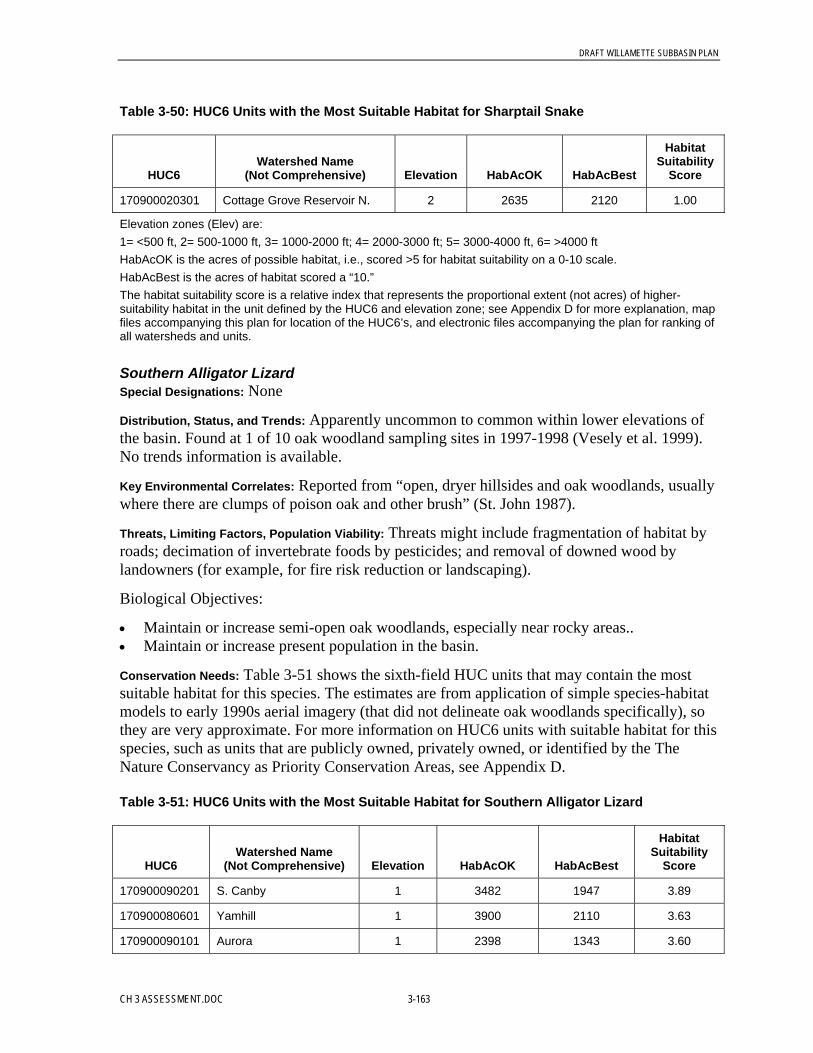
DRAFT WILLAMETTE SUBBASIN PLAN
CH 3 ASSESSMENT.DOC 3-163
Table 3-50: HUC6 Units with the Most Suitable Habitat for Sharptail Snake
HUC6Watershed Name
(Not Comprehensive) Elevation HabAcOK HabAcBest
HabitatSuitability
Score
170900020301 Cottage Grove Reservoir N. 2 2635 2120 1.00
Elevation zones (Elev) are:1= <500 ft, 2= 500-1000 ft, 3= 1000-2000 ft; 4= 2000-3000 ft; 5= 3000-4000 ft, 6= >4000 ftHabAcOK is the acres of possible habitat, i.e., scored >5 for habitat suitability on a 0-10 scale.HabAcBest is the acres of habitat scored a “10.”The habitat suitability score is a relative index that represents the proportional extent (not acres) of higher-suitability habitat in the unit defined by the HUC6 and elevation zone; see Appendix D for more explanation, mapfiles accompanying this plan for location of the HUC6’s, and electronic files accompanying the plan for ranking ofall watersheds and units.
Southern Alligator LizardSpecial Designations: None
Distribution, Status, and Trends: Apparently uncommon to common within lower elevations ofthe basin. Found at 1 of 10 oak woodland sampling sites in 1997-1998 (Vesely et al. 1999).No trends information is available.
Key Environmental Correlates: Reported from “open, dryer hillsides and oak woodlands, usuallywhere there are clumps of poison oak and other brush” (St. John 1987).
Threats, Limiting Factors, Population Viability: Threats might include fragmentation of habitat byroads; decimation of invertebrate foods by pesticides; and removal of downed wood bylandowners (for example, for fire risk reduction or landscaping).
Biological Objectives:
• Maintain or increase semi-open oak woodlands, especially near rocky areas..• Maintain or increase present population in the basin.
Conservation Needs: Table 3-51 shows the sixth-field HUC units that may contain the mostsuitable habitat for this species. The estimates are from application of simple species-habitatmodels to early 1990s aerial imagery (that did not delineate oak woodlands specifically), sothey are very approximate. For more information on HUC6 units with suitable habitat for thisspecies, such as units that are publicly owned, privately owned, or identified by the TheNature Conservancy as Priority Conservation Areas, see Appendix D.
Table 3-51: HUC6 Units with the Most Suitable Habitat for Southern Alligator Lizard
HUC6Watershed Name
(Not Comprehensive) Elevation HabAcOK HabAcBest
HabitatSuitability
Score
170900090201 S. Canby 1 3482 1947 3.89
170900080601 Yamhill 1 3900 2110 3.63
170900090101 Aurora 1 2398 1343 3.60

DRAFT WILLAMETTE SUBBASIN PLAN
3-164 CH 3 ASSESSMENT.DOC
Table 3-51: HUC6 Units with the Most Suitable Habitat for Southern Alligator Lizard
HUC6Watershed Name
(Not Comprehensive) Elevation HabAcOK HabAcBest
HabitatSuitability
Score
170900070301 Saint Paul 1 2444 1463 3.44
170900080702 Lafayette 1 2412 1131 3.36
Elevation zones (Elev) are:1= <500 ft, 2= 500-1000 ft, 3= 1000-2000 ft; 4= 2000-3000 ft; 5= 3000-4000 ft, 6= >4000 ftHabAcOK is the acres of possible habitat, i.e., scored >5 for habitat suitability on a 0-10 scale.HabAcBest is the acres of habitat scored a “10.”The habitat suitability score is a relative index that represents the proportional extent (not acres) of higher-suitability habitat in the unit defined by the HUC6 and elevation zone; see Appendix D for more explanation, mapfiles accompanying this plan for location of the HUC6’s, and electronic files accompanying the plan for ranking ofall watersheds and units.
Western Gray SquirrelSpecial Designations: ODFW “status uncertain.”
Distribution, Status, and Trends: Widely distributed within the basin’s deciduous woodlands,especially at lower elevations. No data on density or trends are available, but in southernOregon a density of 3/ac was documented in one area over a 2-year period (Cross 1969).Populations fluctuate partly in response to semi-annual cycles in acorn production so severalyears of monitoring data are needed to infer trends.
Key Environmental Correlates: Acorns comprise a major portion of diet so this species inhabitsoak woodlands extensively but not exclusively. Also occurs in riparian woodlands, orchards,and mixed forest. Nests (dreys) are constructed in tall trees but large tree cavities also areapparently important for birthing, sleeping, and shelter.
Threats, Limiting Factors, Population Viability: Loss of contiguous oak woodland and degradationof remaining tracts (i.e., reduced occurrence of large oaks suitable for nest cavities) may limitpopulations. Populations also have been impacted by disease (mange), at least in Washington(Larsen & Morgan 1998). Increased fragmentation of woodlands with heavily traffickedroads may be having a substantial impact, as roadkill of dispersing squirrels appears to becommon.
Biological Objectives:
• Maintain or increase conditions supportive of sustaining a supply of large oaks withinwoodlands
• Survey and maintain (or increase) the present population in the basin.
Conservation Needs: Table 3-52 shows the sixth-field HUC units that may contain the mostsuitable habitat for this species. The estimates are from application of simple species-habitatmodels to early 1990s aerial imagery (that did not delineate oak woodlands specifically), sothey are very approximate. For more information on HUC6 units with suitable habitat for this
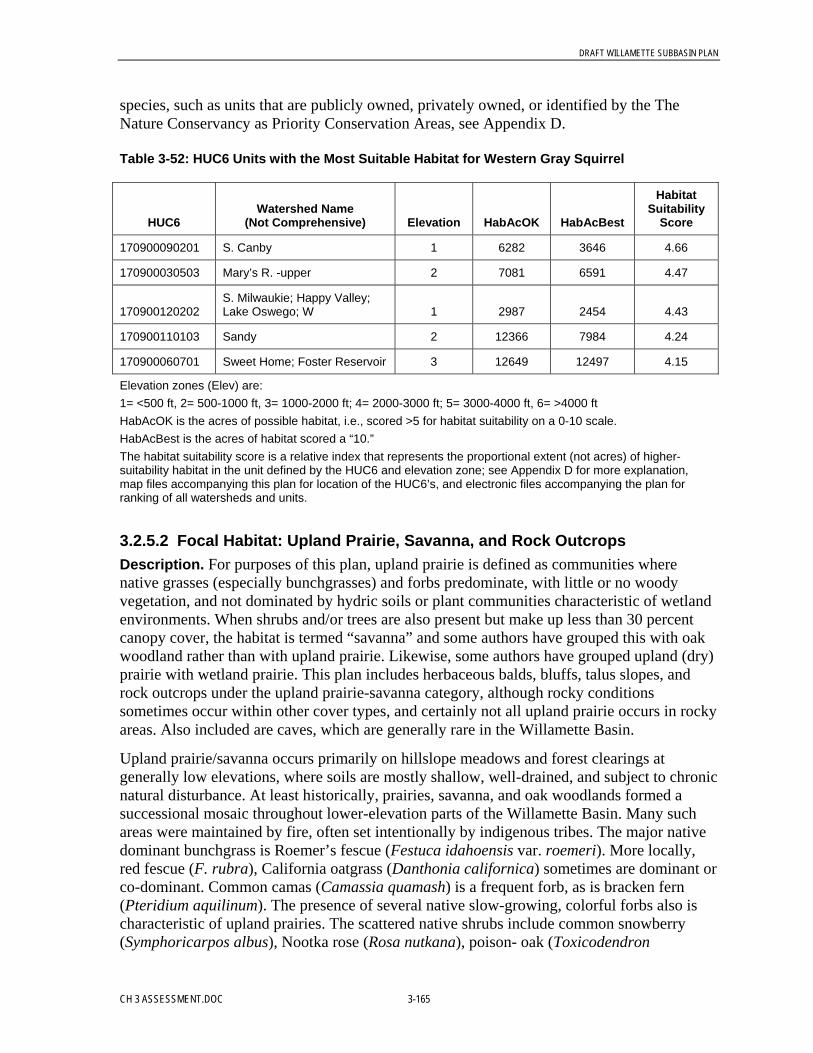
DRAFT WILLAMETTE SUBBASIN PLAN
CH 3 ASSESSMENT.DOC 3-165
species, such as units that are publicly owned, privately owned, or identified by the TheNature Conservancy as Priority Conservation Areas, see Appendix D.
Table 3-52: HUC6 Units with the Most Suitable Habitat for Western Gray Squirrel
HUC6Watershed Name
(Not Comprehensive) Elevation HabAcOK HabAcBest
HabitatSuitability
Score
170900090201 S. Canby 1 6282 3646 4.66
170900030503 Mary’s R. -upper 2 7081 6591 4.47
170900120202S. Milwaukie; Happy Valley;Lake Oswego; W 1 2987 2454 4.43
170900110103 Sandy 2 12366 7984 4.24
170900060701 Sweet Home; Foster Reservoir 3 12649 12497 4.15
Elevation zones (Elev) are:1= <500 ft, 2= 500-1000 ft, 3= 1000-2000 ft; 4= 2000-3000 ft; 5= 3000-4000 ft, 6= >4000 ftHabAcOK is the acres of possible habitat, i.e., scored >5 for habitat suitability on a 0-10 scale.HabAcBest is the acres of habitat scored a “10.”The habitat suitability score is a relative index that represents the proportional extent (not acres) of higher-suitability habitat in the unit defined by the HUC6 and elevation zone; see Appendix D for more explanation,map files accompanying this plan for location of the HUC6’s, and electronic files accompanying the plan forranking of all watersheds and units.
3.2.5.2 Focal Habitat: Upland Prairie, Savanna, and Rock OutcropsDescription. For purposes of this plan, upland prairie is defined as communities wherenative grasses (especially bunchgrasses) and forbs predominate, with little or no woodyvegetation, and not dominated by hydric soils or plant communities characteristic of wetlandenvironments. When shrubs and/or trees are also present but make up less than 30 percentcanopy cover, the habitat is termed “savanna” and some authors have grouped this with oakwoodland rather than with upland prairie. Likewise, some authors have grouped upland (dry)prairie with wetland prairie. This plan includes herbaceous balds, bluffs, talus slopes, androck outcrops under the upland prairie-savanna category, although rocky conditionssometimes occur within other cover types, and certainly not all upland prairie occurs in rockyareas. Also included are caves, which are generally rare in the Willamette Basin.
Upland prairie/savanna occurs primarily on hillslope meadows and forest clearings atgenerally low elevations, where soils are mostly shallow, well-drained, and subject to chronicnatural disturbance. At least historically, prairies, savanna, and oak woodlands formed asuccessional mosaic throughout lower-elevation parts of the Willamette Basin. Many suchareas were maintained by fire, often set intentionally by indigenous tribes. The major nativedominant bunchgrass is Roemer’s fescue (Festuca idahoensis var. roemeri). More locally,red fescue (F. rubra), California oatgrass (Danthonia californica) sometimes are dominant orco-dominant. Common camas (Camassia quamash) is a frequent forb, as is bracken fern(Pteridium aquilinum). The presence of several native slow-growing, colorful forbs also ischaracteristic of upland prairies. The scattered native shrubs include common snowberry(Symphoricarpos albus), Nootka rose (Rosa nutkana), poison- oak (Toxicodendron
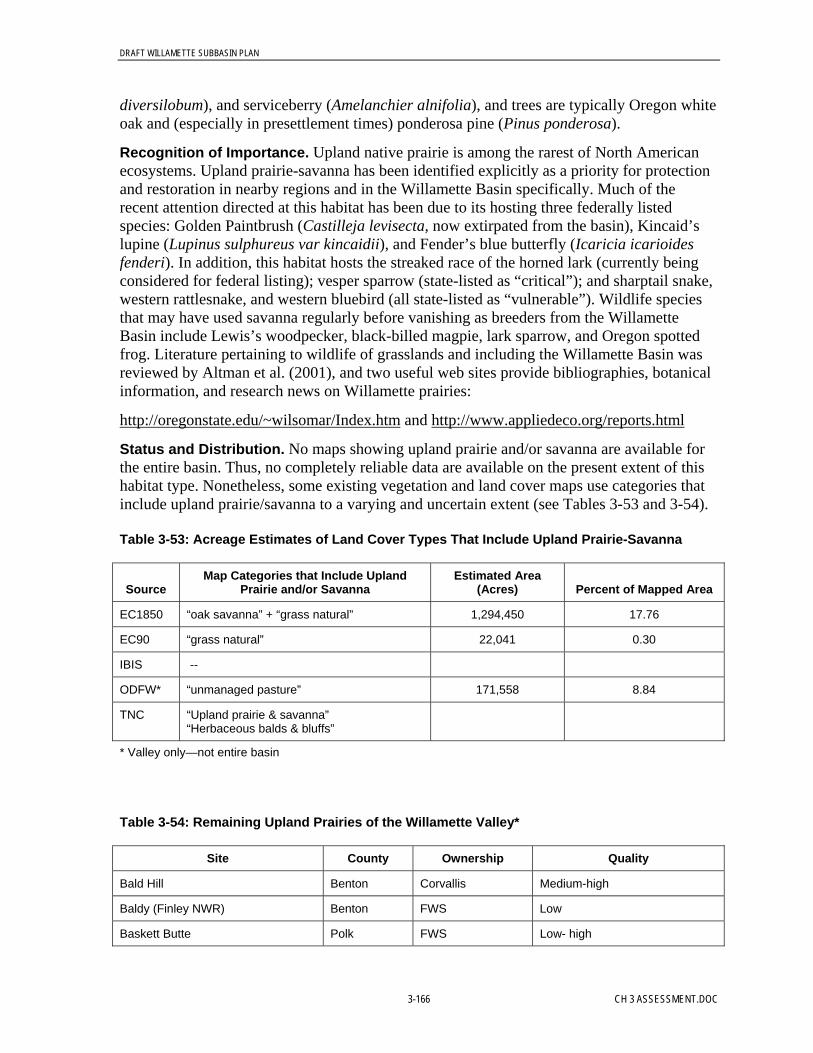
DRAFT WILLAMETTE SUBBASIN PLAN
3-166 CH 3 ASSESSMENT.DOC
diversilobum), and serviceberry (Amelanchier alnifolia), and trees are typically Oregon whiteoak and (especially in presettlement times) ponderosa pine (Pinus ponderosa).
Recognition of Importance. Upland native prairie is among the rarest of North Americanecosystems. Upland prairie-savanna has been identified explicitly as a priority for protectionand restoration in nearby regions and in the Willamette Basin specifically. Much of therecent attention directed at this habitat has been due to its hosting three federally listedspecies: Golden Paintbrush (Castilleja levisecta, now extirpated from the basin), Kincaid’slupine (Lupinus sulphureus var kincaidii), and Fender’s blue butterfly (Icaricia icarioidesfenderi). In addition, this habitat hosts the streaked race of the horned lark (currently beingconsidered for federal listing); vesper sparrow (state-listed as “critical”); and sharptail snake,western rattlesnake, and western bluebird (all state-listed as “vulnerable”). Wildlife speciesthat may have used savanna regularly before vanishing as breeders from the WillametteBasin include Lewis’s woodpecker, black-billed magpie, lark sparrow, and Oregon spottedfrog. Literature pertaining to wildlife of grasslands and including the Willamette Basin wasreviewed by Altman et al. (2001), and two useful web sites provide bibliographies, botanicalinformation, and research news on Willamette prairies:
http://oregonstate.edu/~wilsomar/Index.htm and http://www.appliedeco.org/reports.html
Status and Distribution. No maps showing upland prairie and/or savanna are available forthe entire basin. Thus, no completely reliable data are available on the present extent of thishabitat type. Nonetheless, some existing vegetation and land cover maps use categories thatinclude upland prairie/savanna to a varying and uncertain extent (see Tables 3-53 and 3-54).
Table 3-53: Acreage Estimates of Land Cover Types That Include Upland Prairie-Savanna
SourceMap Categories that Include Upland
Prairie and/or SavannaEstimated Area
(Acres) Percent of Mapped Area
EC1850 “oak savanna” + “grass natural” 1,294,450 17.76
EC90 “grass natural” 22,041 0.30
IBIS --
ODFW* “unmanaged pasture” 171,558 8.84
TNC “Upland prairie & savanna”“Herbaceous balds & bluffs”
* Valley only—not entire basin
Table 3-54: Remaining Upland Prairies of the Willamette Valley*
Site County Ownership Quality
Bald Hill Benton Corvallis Medium-high
Baldy (Finley NWR) Benton FWS Low
Baskett Butte Polk FWS Low- high
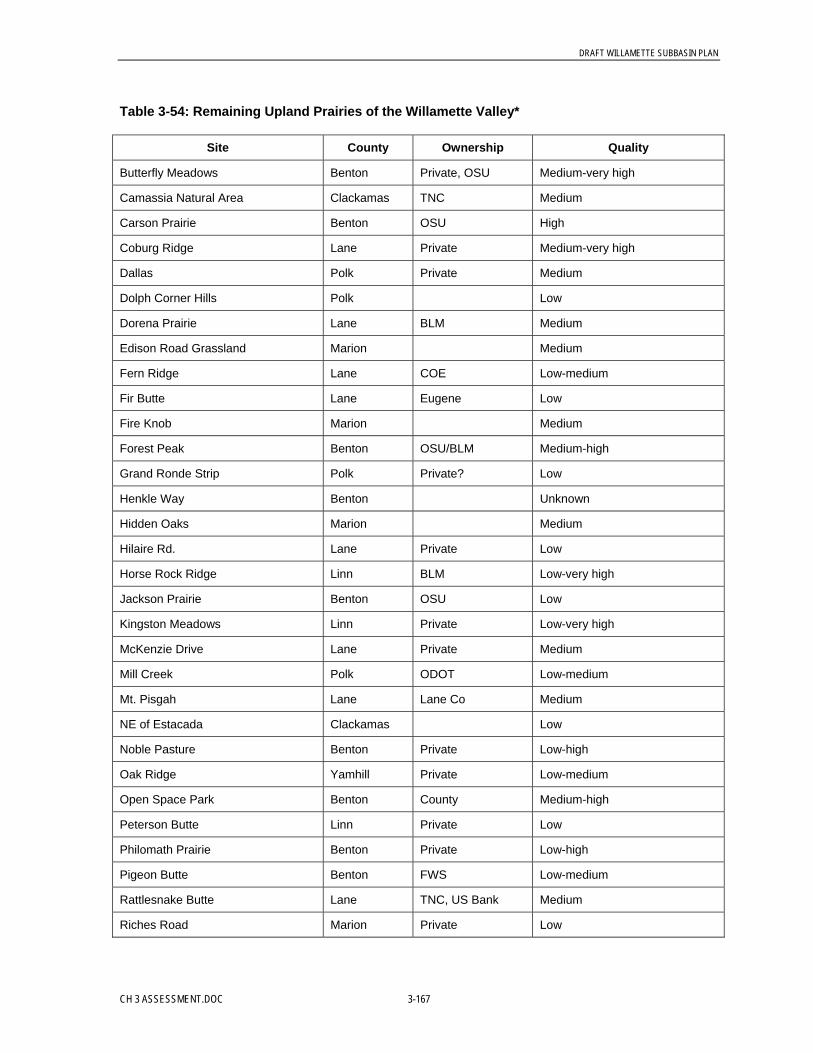
DRAFT WILLAMETTE SUBBASIN PLAN
CH 3 ASSESSMENT.DOC 3-167
Table 3-54: Remaining Upland Prairies of the Willamette Valley*
Site County Ownership Quality
Butterfly Meadows Benton Private, OSU Medium-very high
Camassia Natural Area Clackamas TNC Medium
Carson Prairie Benton OSU High
Coburg Ridge Lane Private Medium-very high
Dallas Polk Private Medium
Dolph Corner Hills Polk Low
Dorena Prairie Lane BLM Medium
Edison Road Grassland Marion Medium
Fern Ridge Lane COE Low-medium
Fir Butte Lane Eugene Low
Fire Knob Marion Medium
Forest Peak Benton OSU/BLM Medium-high
Grand Ronde Strip Polk Private? Low
Henkle Way Benton Unknown
Hidden Oaks Marion Medium
Hilaire Rd. Lane Private Low
Horse Rock Ridge Linn BLM Low-very high
Jackson Prairie Benton OSU Low
Kingston Meadows Linn Private Low-very high
McKenzie Drive Lane Private Medium
Mill Creek Polk ODOT Low-medium
Mt. Pisgah Lane Lane Co Medium
NE of Estacada Clackamas Low
Noble Pasture Benton Private Low-high
Oak Ridge Yamhill Private Low-medium
Open Space Park Benton County Medium-high
Peterson Butte Linn Private Low
Philomath Prairie Benton Private Low-high
Pigeon Butte Benton FWS Low-medium
Rattlesnake Butte Lane TNC, US Bank Medium
Riches Road Marion Private Low
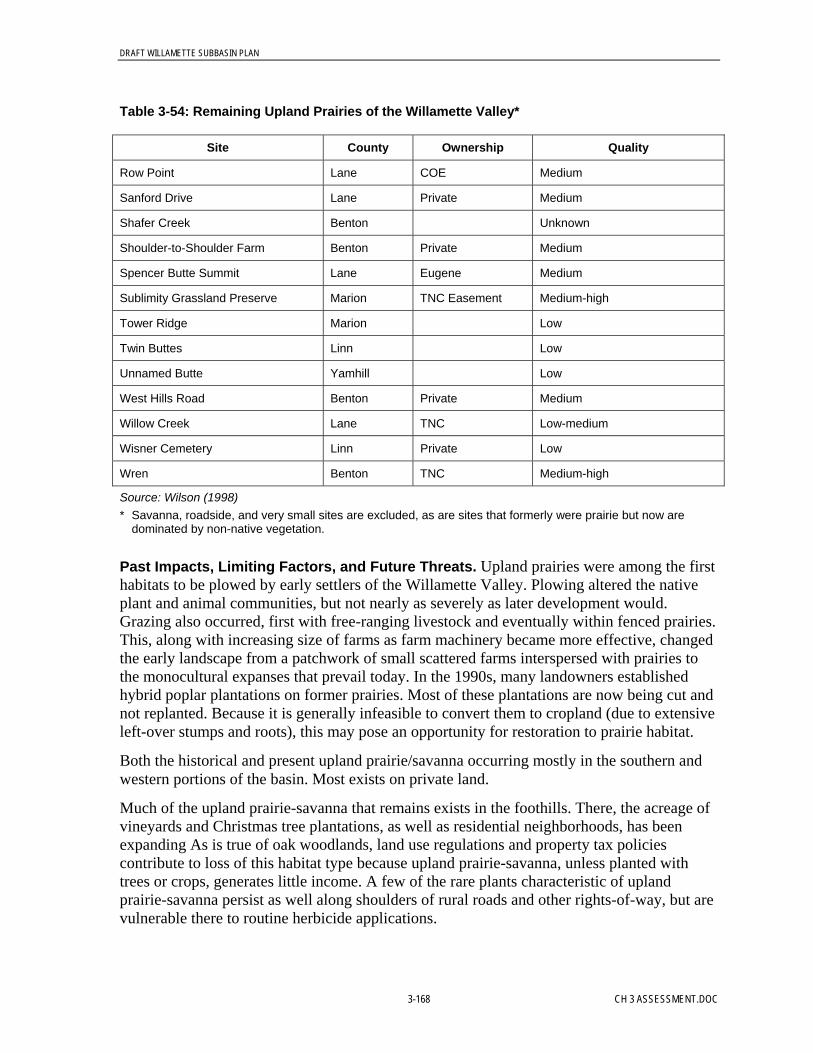
DRAFT WILLAMETTE SUBBASIN PLAN
3-168 CH 3 ASSESSMENT.DOC
Table 3-54: Remaining Upland Prairies of the Willamette Valley*
Site County Ownership Quality
Row Point Lane COE Medium
Sanford Drive Lane Private Medium
Shafer Creek Benton Unknown
Shoulder-to-Shoulder Farm Benton Private Medium
Spencer Butte Summit Lane Eugene Medium
Sublimity Grassland Preserve Marion TNC Easement Medium-high
Tower Ridge Marion Low
Twin Buttes Linn Low
Unnamed Butte Yamhill Low
West Hills Road Benton Private Medium
Willow Creek Lane TNC Low-medium
Wisner Cemetery Linn Private Low
Wren Benton TNC Medium-high
Source: Wilson (1998)* Savanna, roadside, and very small sites are excluded, as are sites that formerly were prairie but now are
dominated by non-native vegetation.
Past Impacts, Limiting Factors, and Future Threats. Upland prairies were among the firsthabitats to be plowed by early settlers of the Willamette Valley. Plowing altered the nativeplant and animal communities, but not nearly as severely as later development would.Grazing also occurred, first with free-ranging livestock and eventually within fenced prairies.This, along with increasing size of farms as farm machinery became more effective, changedthe early landscape from a patchwork of small scattered farms interspersed with prairies tothe monocultural expanses that prevail today. In the 1990s, many landowners establishedhybrid poplar plantations on former prairies. Most of these plantations are now being cut andnot replanted. Because it is generally infeasible to convert them to cropland (due to extensiveleft-over stumps and roots), this may pose an opportunity for restoration to prairie habitat.
Both the historical and present upland prairie/savanna occurring mostly in the southern andwestern portions of the basin. Most exists on private land.
Much of the upland prairie-savanna that remains exists in the foothills. There, the acreage ofvineyards and Christmas tree plantations, as well as residential neighborhoods, has beenexpanding As is true of oak woodlands, land use regulations and property tax policiescontribute to loss of this habitat type because upland prairie-savanna, unless planted withtrees or crops, generates little income. A few of the rare plants characteristic of uplandprairie-savanna persist as well along shoulders of rural roads and other rights-of-way, but arevulnerable there to routine herbicide applications.

DRAFT WILLAMETTE SUBBASIN PLAN
CH 3 ASSESSMENT.DOC 3-169
Most of the few remaining areas of upland prairie-savanna, if not being planted with trees onpurpose, are changing to upland forest through natural succession. This has occurred largelyas a result of decades of fire suppression. It is mainly the sites located in extremely rocky,steep terrain that have not succumbed to this or to development pressures. Upland prairie-savanna is vulnerable to invasion by a wide variety of plants, both herbaceous (for example,tall oatgrass, Arrhenatherum elatius) and woody (for example, scotch broom), and bothnative (for example, snowberry) and non-native (for example, Himalayan blackberry). Theseform dense patches that exclude most native plant species, consequently altering habitatstructure. In some situations grazing may help check the spread of invasive shrubs (forexample, short-duration, high-intensity grazing by goats) whereas in other situations it canserve as a vector for introduction or spread of non-native grasses and forbs. If globalwarming results in increased frequency and severity of drought in the basin, the area ofupland prairie might eventually increase, provided seed banks in the soil are still viable.
Contribution of Upland Prairie-Savanna to Regional Biodiversity. In the WillametteBasin, this habitat includes the most endemic species (species that occur nowhere else in theworld). Upland prairie in good condition provides the best reproductive habitat for 22wildlife species, and is used regularly by at least an additional 56 breeding wildlife species.Adding the list of oak savanna species to the upland prairie list brings the total number ofpotentially-occurring wildlife species in upland prairie-savanna to 135. Several speciesassociated with upland prairie also use wetland prairie. Some use agricultural lands as well,perhaps at some cost to reproductive success and survival. The upland prairie-savanna habitattype supports several birds whose numbers appear to be declining regionally, based on BBSdata.
Selected Focal Species in Upland Prairie, Savanna, and Rock Outcrops. The followingare proposed as focal species for this habitat type:
• Plants: golden paintbrush, white rock larkspur, white-topped aster, Kincaid’s lupine
• Wildlife: Fender’s blue butterfly, Taylor’s checkerspot butterfly, horned lark (streakedsubspecies), vesper sparrow (Oregon subspecies), western meadowlark, western bluebird,western rattlesnake, black-tailed jackrabbit
On a scale of 0 to 10, these species’ average degree of association with upland prairie is a7.0, and their association with savanna13 is 8.3. Compare this with HEP “loss assessment”species used in many previous mitigation credit calculations and land acquisitions in theWillamette Basin. Of the “grass-forb” species used in HEP applications, the average degreeof association with upland prairie is 4.6 and the association of HEP’s “hardwood forest”species is 7.7. This suggests there may have been an unintentional but systematic bias againstupland prairie-savanna in previous mitigation land dealings in the Willamette Basin.
Golden Paintbrush (Castilleja levisecta)Special Designations: “Threatened” (federal). “Endangered” (ODA). “Possibly Extirpated”(ONHP).
13 Calculated from file HABTYPE, using the “Oak Savanna” class as a surrogate for savanna, which could not be mapped, andthe “Grassland Natural” as a surrogate for upland prairie.
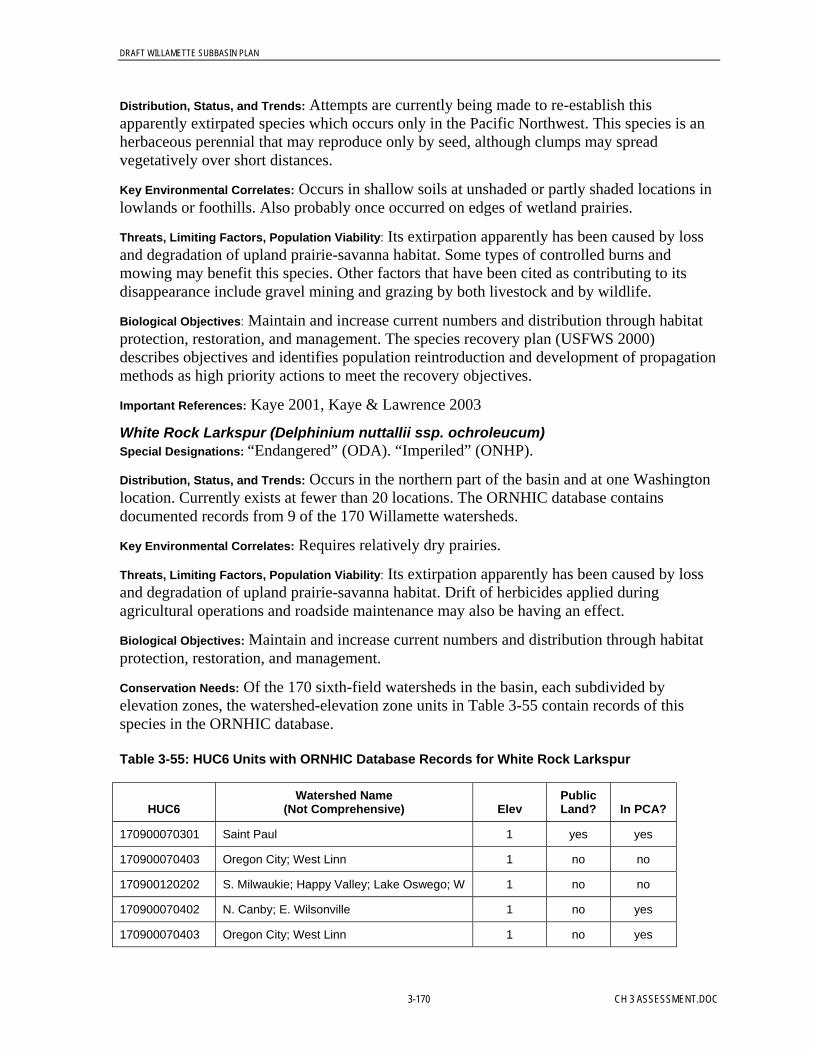
DRAFT WILLAMETTE SUBBASIN PLAN
3-170 CH 3 ASSESSMENT.DOC
Distribution, Status, and Trends: Attempts are currently being made to re-establish thisapparently extirpated species which occurs only in the Pacific Northwest. This species is anherbaceous perennial that may reproduce only by seed, although clumps may spreadvegetatively over short distances.
Key Environmental Correlates: Occurs in shallow soils at unshaded or partly shaded locations inlowlands or foothills. Also probably once occurred on edges of wetland prairies.
Threats, Limiting Factors, Population Viability: Its extirpation apparently has been caused by lossand degradation of upland prairie-savanna habitat. Some types of controlled burns andmowing may benefit this species. Other factors that have been cited as contributing to itsdisappearance include gravel mining and grazing by both livestock and by wildlife.
Biological Objectives: Maintain and increase current numbers and distribution through habitatprotection, restoration, and management. The species recovery plan (USFWS 2000)describes objectives and identifies population reintroduction and development of propagationmethods as high priority actions to meet the recovery objectives.
Important References: Kaye 2001, Kaye & Lawrence 2003
White Rock Larkspur (Delphinium nuttallii ssp. ochroleucum)Special Designations: “Endangered” (ODA). “Imperiled” (ONHP).
Distribution, Status, and Trends: Occurs in the northern part of the basin and at one Washingtonlocation. Currently exists at fewer than 20 locations. The ORNHIC database containsdocumented records from 9 of the 170 Willamette watersheds.
Key Environmental Correlates: Requires relatively dry prairies.
Threats, Limiting Factors, Population Viability: Its extirpation apparently has been caused by lossand degradation of upland prairie-savanna habitat. Drift of herbicides applied duringagricultural operations and roadside maintenance may also be having an effect.
Biological Objectives: Maintain and increase current numbers and distribution through habitatprotection, restoration, and management.
Conservation Needs: Of the 170 sixth-field watersheds in the basin, each subdivided byelevation zones, the watershed-elevation zone units in Table 3-55 contain records of thisspecies in the ORNHIC database.
Table 3-55: HUC6 Units with ORNHIC Database Records for White Rock Larkspur
HUC6Watershed Name
(Not Comprehensive) ElevPublicLand? In PCA?
170900070301 Saint Paul 1 yes yes
170900070403 Oregon City; West Linn 1 no no
170900120202 S. Milwaukie; Happy Valley; Lake Oswego; W 1 no no
170900070402 N. Canby; E. Wilsonville 1 no yes
170900070403 Oregon City; West Linn 1 no yes

DRAFT WILLAMETTE SUBBASIN PLAN
CH 3 ASSESSMENT.DOC 3-171
Table 3-55: HUC6 Units with ORNHIC Database Records for White Rock Larkspur
HUC6Watershed Name
(Not Comprehensive) ElevPublicLand? In PCA?
170900100102 Hillsboro 1 no yes
170900110101 Estacada; E. Gladstone 1 no yes
170900110102 Clear Cr. 1 no yes
170900090401 Scotts Mills Senecal Cr. & Mill Cr. 2 no yes
170900090501 Molalla 2 no yes
170900090501 Molalla 3 no yes
Elevation zones (Elev) are:1= <500 ft, 2= 500-1000 ft, 3= 1000-2000 ft; 4= 2000-3000 ft; 5= 3000-4000 ft, 6= >4000 ftPCA = Priority Conservation Area.
White-topped (Curtus’s) Aster (Aster curtus = Sericocarpus rigidus)Special Designations: “Threatened” (ODA). “Imperiled” (ONHP).
Distribution, Status, and Trends: Restricted to the Pacific Northwest. The ORNHIC databasedocuments records from 8 of the 170 Willamette watersheds.
Key Environmental Correlates: Requires relatively dry prairies.
Threats, Limiting Factors, Population Viability: Its extirpation apparently has been caused by lossand degradation of upland prairie-savanna habitat. Other threats include the continued loss ordegradation of habitat due to development, grazing, and off-road vehicle use.
Biological Objectives: Maintain and increase current numbers and distribution through habitatprotection, restoration, and management.
Conservation Needs: Of the 170 sixth-field watersheds in the basin, each subdivided byelevation zones, the watershed-elevation zone units in Table 3-56 contain records of thisspecies in the ORNHIC database.
Table 3-56: HUC6 Units with ORNHIC Database Records for White-Topped (Curtus’s)Aster
HUC6Watershed Name
(Not Comprehensive) ElevPublicLand? In PCA?
170900030101 W. Eugene; Junction City 1 yes yes
170900030102 Veneta; Poodle & Swamp Cr.; Fern Ridge Res 1 yes yes
170900090702 Drift Cr. 2 no no
170900090704 Silverton S. 2 no no
170900030103 Coyote Cr. 3 no no
170900030101 W. Eugene; Junction City 1 no yes

DRAFT WILLAMETTE SUBBASIN PLAN
3-172 CH 3 ASSESSMENT.DOC
Table 3-56: HUC6 Units with ORNHIC Database Records for White-Topped (Curtus’s)Aster
HUC6Watershed Name
(Not Comprehensive) ElevPublicLand? In PCA?
170900030102 Veneta; Poodle & Swamp Cr.; Fern Ridge Res 1 no yes
170900030103 Coyote Cr. 1 no yes
170900070403 Oregon City; West Linn 1 no yes
170900020102 Creswell W.; Camas Swale 2 no yes
170900030103 Coyote Cr. 2 no yes
170900050601 Jefferson; Lyons; Bear Branch 2 no yes
170900090702 Drift Cr. 2 no yes
Elevation zones (Elev) are:1= <500 ft, 2= 500-1000 ft, 3= 1000-2000 ft; 4= 2000-3000 ft; 5= 3000-4000 ft, 6= >4000 ftPCA = Priority Conservation Areas
Kincaid’s Lupine (Lupinus sulphureus var. kincaidii)Special Designations: “Threatened” on both federal and state lists. “Imperiled” (ONHP).
Distribution, Status, and Trends: Occupies 51 sites comprising 357 acres and located within 21of the 170 watersheds in the Willamette Basin (ORNHIC data). It persists in the areas whereupland prairie has been protected but future survival will require active management withinthese areas and probably the protection of additional upland prairies.
Key Environmental Correlates: The species is restricted almost entirely to upland prairie.Although sometimes found on steep grassy slopes and rock outcrops, these habitats areusually too dry to sustain significant populations. The lupine is a long-lived (up to 25 years)perennial that requires pollination by insects. Populations have been invigorated bycontrolled burns, fall mowing, and other measures to reduce shading (Clark & Wilson 1998).The species is amenable to re-establishment in suitable habitats using seeding or transplants.
Threats, Limiting Factors, Population Viability: Habitat loss and degradation are the main limitingfactors. Long-term viability depends largely on control of shading plants, reducingcompetition from invasive herbaceous plants, and maintaining pollinator populations.
Biological Objectives: Maintain and increase current numbers and distribution through habitatprotection, restoration, and management.
Conservation Needs: Of the 170 sixth-field watersheds in the basin, each subdivided byelevation zones, the watershed-elevation zone units in Table 3-57 contain records of thisspecies in the ORNHIC database.

DRAFT WILLAMETTE SUBBASIN PLAN
CH 3 ASSESSMENT.DOC 3-173
Table 3-57: HUC6 Units with ORNHIC Database Records for Kincaid’s Lupine
HUC6Watershed Name
(Not Comprehensive) ElevationPublicLand?
InPCA?
HabitatSuitability
Score
170900080601 Yamhill 1 no no 2.49
170900070102 Independence; Monmouth 1 no no 1.54
170900030601 Luckiamute R.4 1 no no 1.24
170900030606 Little Luckiamute R.—lower 1 no yes 0.75
170900080603 Panther & Haskins Cr. 1 no no 0.75
170900030504 Finley NWR; Muddy & Hammer Cr. 1 no yes 0.74
170900080403 Deer Cr. 1 no no 0.74
170900030602 Soap Cr. 1 no yes 0.73
170900030604 Luckiamute R.2. 1 no no 0.65
170900030103 Coyote Cr. 1 no yes 0.55
170900030103 Coyote Cr. 2 no no 0.53
170900030501 Corvallis; Philomath; Mary’s R.-lower 1 no yes 0.50
170900030603 Luckiamute R.1. 1 no no 0.49
170900070101 Baskett Slough NWR 1 yes yes 0.41
170900030502 Mary’s R -middle 2 no no 0.33
170900080403 Deer Cr. 1 no yes 0.32
170900030101 W. Eugene; Junction City 1 no yes 0.25
170900030102 Veneta; Poodle & Swamp Cr.; FernRidge Res
1 no yes 0.21
170900030504 Finley NWR; Muddy & Hammer Cr. 1 yes yes 0.16
170900030502 Mary’s R -middle 2 no yes 0.12
170900080301 Mill & Gooseneck Cr. 1 no yes 0.10
170900080603 Panther & Haskins Cr. 2 no yes 0.08
170900080604 Turner Cr. 2 no yes 0.07
170900030201 Corvallis N.; Adair Village 2 no no 0.04
170900030101 W. Eugene; Junction City 1 yes yes 0.03
170900030102 Veneta; Poodle & Swamp Cr.; FernRidge Res
1 yes yes 0.03
170900030501 Corvallis; Philomath; Mary’s R.-lower 3 no yes 0.02
170900040201 Horse & Parsons & Cash & Mill Cr. 3 no yes 0.01

DRAFT WILLAMETTE SUBBASIN PLAN
3-174 CH 3 ASSESSMENT.DOC
Table 3-57: HUC6 Units with ORNHIC Database Records for Kincaid’s Lupine
HUC6Watershed Name
(Not Comprehensive) ElevationPublicLand?
InPCA?
HabitatSuitability
Score
Elevation zones (Elev) are:1= <500 ft, 2= 500-1000 ft, 3= 1000-2000 ft; 4= 2000-3000 ft; 5= 3000-4000 ft, 6= >4000 ftThe habitat suitability score is a relative index that represents the proportional extent (not acres) of higher-suitability habitat in the unit defined by the HUC6 and elevation zone; see Appendix D for more explanation,map files accompanying this plan for location of the HUC6’s, and electronic files accompanying the plan forranking of all watersheds and units.Important References: Kaye & Kuykendall 2001, Kaye & Cramer 2002
Fender’s Blue ButterflySpecial Designations: “Endangered” (federal). “Critically Imperiled” (ONHP).
Distribution, Status, and Trends: Once thought extirpated from the Willamette Basin, it wasrediscovered in 1989. The population fluctuates annually but current estimates are of about3,000 to 4,000 individuals at about 32 sites in 12 (of 170) watersheds in the WillametteBasin.
Key Environmental Correlates: Distribution parallels that of Kincaid’s lupine (see above), uponwhich it is completely dependent. Thus, it is restricted to upland prairie and shares the samerequirements as the lupine. Biological information is summarized in Schultz et al. (2003).
Threats, Limiting Factors, Population Viability: Habitat loss and degradation are the main limitingfactors. Of 12 sites identified as having this species in 1991, agricultural or urbandevelopment had caused habitat loss in six sites by 1997 (Hammond 1998). Habitatdestruction is the largest threat to the survival of both the Fender’s blue butterfly andKincaid’s lupine (USFWS 1998). Pesticide drift has the potential to imperil local populationsin some instances. Population viability is discussed by Schultz & Hammond (2003).
Biological Objectives: Maintain and increase current numbers and distribution through habitatprotection, restoration, and management.
Conservation Needs: Of the 170 sixth-field watersheds in the basin, each subdivided byelevation zones, the watershed-elevation zone units in Table 3-58 contain records of thisspecies in the ORNHIC database.
Table 3-58: HUC6 Units with ORNHIC Database Records for Fender’s Blue Butterfly
HUC6Watershed Name
(Not Comprehensive) ElevPublicLand?
InPCA? HS
170900070102 Independence; Monmouth 1 no no 1.63
170900030101 W. Eugene; Junction City 1 no no 1.10
170900030606 Little Luckiamute R.—lower 1 no yes 0.89
170900080403 Deer Cr. 1 no no 0.84
170900030604 Luckiamute R.2. 1 no no 0.76
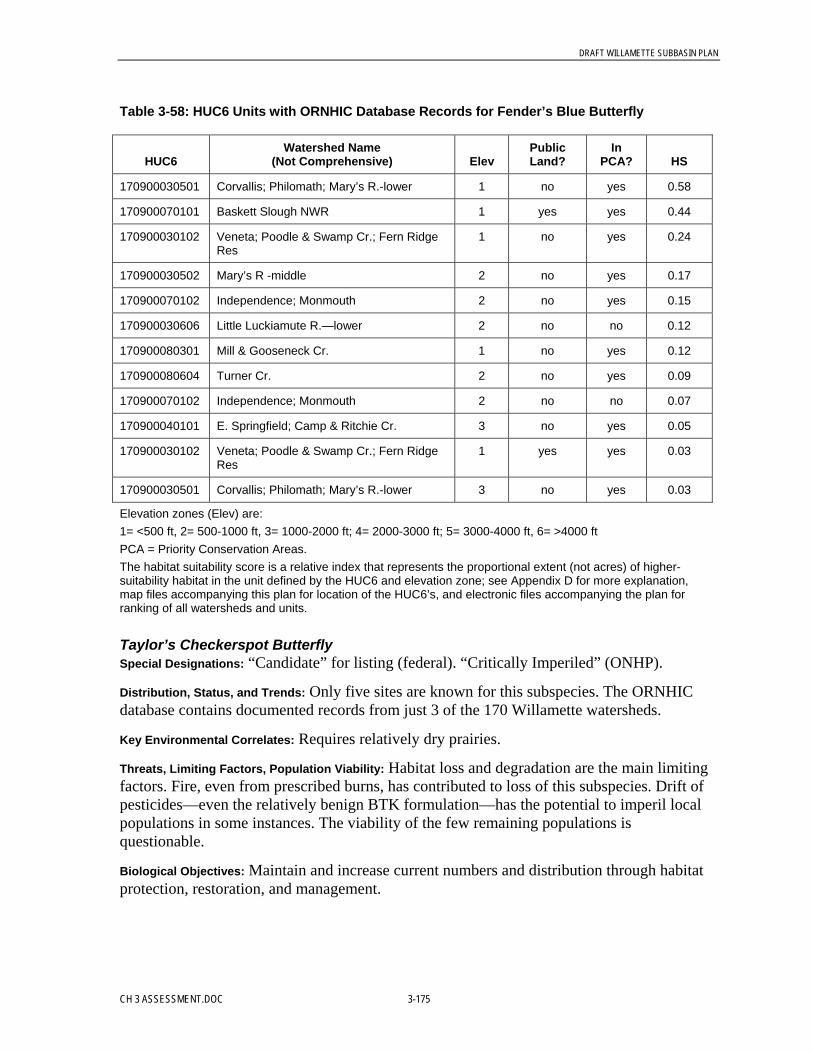
DRAFT WILLAMETTE SUBBASIN PLAN
CH 3 ASSESSMENT.DOC 3-175
Table 3-58: HUC6 Units with ORNHIC Database Records for Fender’s Blue Butterfly
HUC6Watershed Name
(Not Comprehensive) ElevPublicLand?
InPCA? HS
170900030501 Corvallis; Philomath; Mary’s R.-lower 1 no yes 0.58
170900070101 Baskett Slough NWR 1 yes yes 0.44
170900030102 Veneta; Poodle & Swamp Cr.; Fern RidgeRes
1 no yes 0.24
170900030502 Mary’s R -middle 2 no yes 0.17
170900070102 Independence; Monmouth 2 no yes 0.15
170900030606 Little Luckiamute R.—lower 2 no no 0.12
170900080301 Mill & Gooseneck Cr. 1 no yes 0.12
170900080604 Turner Cr. 2 no yes 0.09
170900070102 Independence; Monmouth 2 no no 0.07
170900040101 E. Springfield; Camp & Ritchie Cr. 3 no yes 0.05
170900030102 Veneta; Poodle & Swamp Cr.; Fern RidgeRes
1 yes yes 0.03
170900030501 Corvallis; Philomath; Mary’s R.-lower 3 no yes 0.03
Elevation zones (Elev) are:1= <500 ft, 2= 500-1000 ft, 3= 1000-2000 ft; 4= 2000-3000 ft; 5= 3000-4000 ft, 6= >4000 ftPCA = Priority Conservation Areas.The habitat suitability score is a relative index that represents the proportional extent (not acres) of higher-suitability habitat in the unit defined by the HUC6 and elevation zone; see Appendix D for more explanation,map files accompanying this plan for location of the HUC6’s, and electronic files accompanying the plan forranking of all watersheds and units.
Taylor’s Checkerspot ButterflySpecial Designations: “Candidate” for listing (federal). “Critically Imperiled” (ONHP).
Distribution, Status, and Trends: Only five sites are known for this subspecies. The ORNHICdatabase contains documented records from just 3 of the 170 Willamette watersheds.
Key Environmental Correlates: Requires relatively dry prairies.
Threats, Limiting Factors, Population Viability: Habitat loss and degradation are the main limitingfactors. Fire, even from prescribed burns, has contributed to loss of this subspecies. Drift ofpesticides—even the relatively benign BTK formulation—has the potential to imperil localpopulations in some instances. The viability of the few remaining populations isquestionable.
Biological Objectives: Maintain and increase current numbers and distribution through habitatprotection, restoration, and management.

DRAFT WILLAMETTE SUBBASIN PLAN
3-176 CH 3 ASSESSMENT.DOC
Conservation Needs: Of the 170 sixth-field watersheds in the basin, each subdivided byelevation zones, the watershed-elevation zone units in Table 3-59 contain records of thisspecies in the ORNHIC database.
Table 3-59: HUC6 Units with ORNHIC Database Records for Taylor’s CheckerspotButterfly
HUC6Watershed Name
(Not Comprehensive) Elevation Public land? In PCA?
170900030501 Corvallis; Philomath; Mary’s R.-lower
2 yes yes
170900030501 Corvallis; Philomath; Mary’s R.-lower
2 no yes
170900030502 Mary’s R -middle 2 no yes
170900030602 Soap Cr. 2 yes yes
PCA = Priority Conservation Area.
American KestrelSpecial Designations: Partners In Flight focal species.
Distribution, Status, and Trends: This resident species once bred commonly in savanna andforest edges in the Willamette Basin, and is still moderately common. Application of simplespecies-habitat models to aerial imagery using GIS suggests 4 percent of the basin mightcontain habitat that could be at least marginally suitable and less than 1 percent might containgood habitat. The Oregon BBA Project (Adamus et al. 2001) confirmed nesting in 28 percentof the large survey units in the basin and found evidence of possible or probable nesting in anadditional 48 percent. Along Willamette Basin BBS routes the species was detected at fewerthan 1 percent of surveyed points in 2003, with a maximum during the period 1968-2003 of3.25 percent in 1968. BBS data covering the period 1968-2003 and 1980-2003 showdecreases in the Willamette Valley and western Oregon-Washington generally, but perhapsnot in the Cascades. At least 525 were present almost simultaneously in January 2004 infarmlands of Lane-Linn-Benton-Polk-Yamhill-Marion Counties (J. Fleischer, pers. comm.).
Key Environmental Correlates: For nest sites, kestrels require tree cavities excavated by otherspecies, but will occasionally use nest boxes. Nests are within or along the edge of clearcuts,pastures, or other open areas dominated by grasses and forbs. Kestrels generally do not nestor forage in closed-canopy forest or in fields totally overgrown by shrubs. At all seasons,requires elevated perch within or along a field.
Threats, Limiting Factors, Population Viability: Habitat loss and degradation have been the greatestcontributors to decline of the species in the basin. Being largely insectivorous, kestrels arevulnerable to pesticide-related reductions in their prey. Also, increases in residentialdevelopment are typically accompanied by increases in European starling and house sparrow,non-native species that usurp nesting cavities. Increased high-speed traffic on rural roads alsomay contribute to mortality.

DRAFT WILLAMETTE SUBBASIN PLAN
CH 3 ASSESSMENT.DOC 3-177
Biological Objectives:
• Manage woodlands to provide a sustained supply of cavities (especially in oaks) in treesof at least 24 inch diameter and located either along forest edges that adjoin open areas orwithin the open areas themselves, i.e., areas with <30 percent canopy.
Population objectives should include:
• Achieve stable populations (negative trends of less than 2 percent per year) or increasingtrends by 2010.
Conservation Needs: Table 3-60 shows the sixth-field HUC units that may contain the mostsuitable habitat for this species. The estimates are from application of simple species-habitatmodels to early 1990s aerial imagery (that did not delineate upland prairie specifically), sothey are very approximate. For more information on HUC6 units with suitable habitat for thisspecies, such as units that are publicly owned, privately owned, or identified by the TheNature Conservancy as Priority Conservation Areas, see Appendix D.
Table 3-60: HUC6 Units with the Most Suitable Habitat for American Kestrel
HUC6Watershed Name
(Not Comprehensive) Elevation HabAcOK HabAcBest
HabitatSuitability
Score
170900080601 Yamhill 1 2096 1 1.00
170900070301 Saint Paul 1 1510 0 0.96
170900050103 Pyramid Cr. 5 315 49 0.91
170900090201 S. Canby 1 2190 0 0.90
170900080702 Lafayette 1 1232 0 0.87
Elevation zones (Elev) are:1= <500 ft, 2= 500-1000 ft, 3= 1000-2000 ft; 4= 2000-3000 ft; 5= 3000-4000 ft, 6= >4000 ftHabAcOK is the acres of possible habitat, i.e., scored >5 for habitat suitability on a 0-10 scale.HabAcBest is the acres of habitat scored a “10.”The habitat suitability score is a relative index that represents the proportional extent (not acres) of higher-suitability habitat in the unit defined by the HUC6 and elevation zone; see Appendix D for more explanation,map files accompanying this plan for location of the HUC6’s, and electronic files accompanying the plan forranking of all watersheds and units.
Horned Lark (strigata subspecies)Special Designations: The streaked (strigata) subspecies of horned lark was proposed forfederal listing in 2002. “Critical” (ODFW). “Critically Imperiled” (ORHP). Partners In Flightfocal species.
Distribution, Status, and Trends: The horned lark occurs in large numbers throughout much ofeastern Oregon, but the resident population in the Willamette Basin is a different subspeciesand has declined dramatically over the past 50 years. The current breeding population in thebasin is estimated at under 200 pairs (Altman 2003). Research on the wintering population iscurrently underway (R. Moore and D. Robinson, pers. comm.). The ORNHIC databasecontains documented records from 18 of the 170 Willamette watersheds. Along Willamette
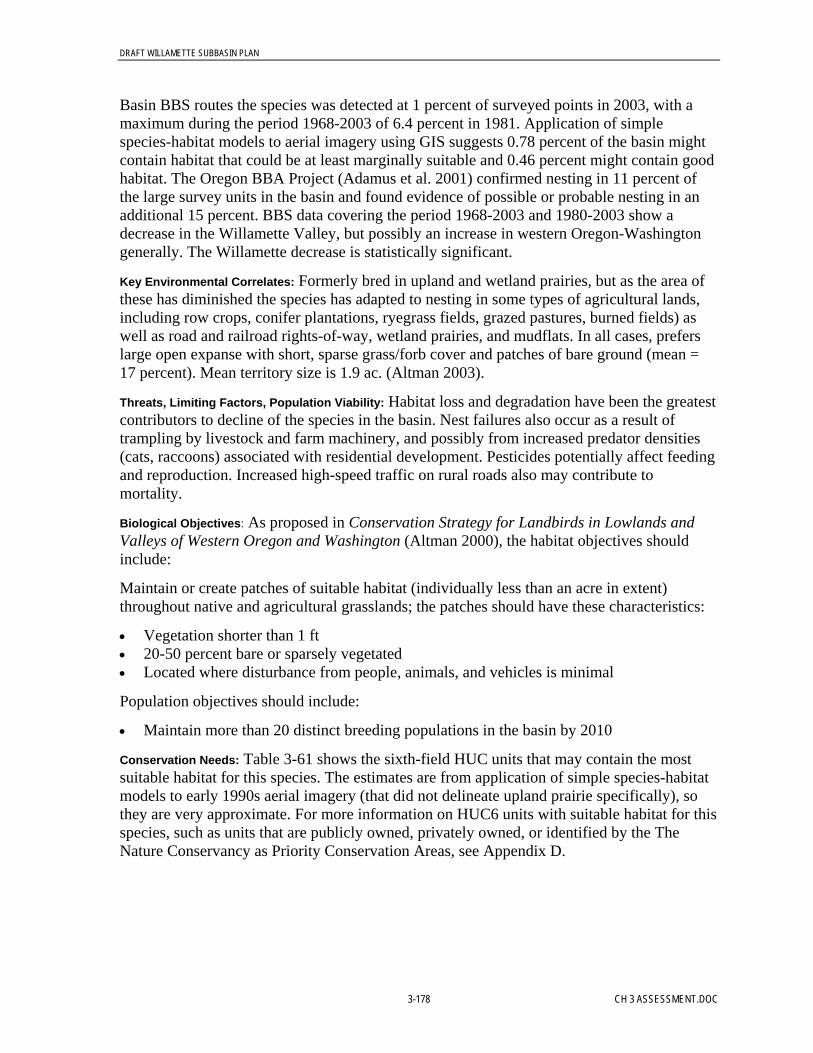
DRAFT WILLAMETTE SUBBASIN PLAN
3-178 CH 3 ASSESSMENT.DOC
Basin BBS routes the species was detected at 1 percent of surveyed points in 2003, with amaximum during the period 1968-2003 of 6.4 percent in 1981. Application of simplespecies-habitat models to aerial imagery using GIS suggests 0.78 percent of the basin mightcontain habitat that could be at least marginally suitable and 0.46 percent might contain goodhabitat. The Oregon BBA Project (Adamus et al. 2001) confirmed nesting in 11 percent ofthe large survey units in the basin and found evidence of possible or probable nesting in anadditional 15 percent. BBS data covering the period 1968-2003 and 1980-2003 show adecrease in the Willamette Valley, but possibly an increase in western Oregon-Washingtongenerally. The Willamette decrease is statistically significant.
Key Environmental Correlates: Formerly bred in upland and wetland prairies, but as the area ofthese has diminished the species has adapted to nesting in some types of agricultural lands,including row crops, conifer plantations, ryegrass fields, grazed pastures, burned fields) aswell as road and railroad rights-of-way, wetland prairies, and mudflats. In all cases, preferslarge open expanse with short, sparse grass/forb cover and patches of bare ground (mean =17 percent). Mean territory size is 1.9 ac. (Altman 2003).
Threats, Limiting Factors, Population Viability: Habitat loss and degradation have been the greatestcontributors to decline of the species in the basin. Nest failures also occur as a result oftrampling by livestock and farm machinery, and possibly from increased predator densities(cats, raccoons) associated with residential development. Pesticides potentially affect feedingand reproduction. Increased high-speed traffic on rural roads also may contribute tomortality.
Biological Objectives: As proposed in Conservation Strategy for Landbirds in Lowlands andValleys of Western Oregon and Washington (Altman 2000), the habitat objectives shouldinclude:
Maintain or create patches of suitable habitat (individually less than an acre in extent)throughout native and agricultural grasslands; the patches should have these characteristics:
• Vegetation shorter than 1 ft• 20-50 percent bare or sparsely vegetated• Located where disturbance from people, animals, and vehicles is minimal
Population objectives should include:
• Maintain more than 20 distinct breeding populations in the basin by 2010
Conservation Needs: Table 3-61 shows the sixth-field HUC units that may contain the mostsuitable habitat for this species. The estimates are from application of simple species-habitatmodels to early 1990s aerial imagery (that did not delineate upland prairie specifically), sothey are very approximate. For more information on HUC6 units with suitable habitat for thisspecies, such as units that are publicly owned, privately owned, or identified by the TheNature Conservancy as Priority Conservation Areas, see Appendix D.

DRAFT WILLAMETTE SUBBASIN PLAN
CH 3 ASSESSMENT.DOC 3-179
Table 3-61: HUC6 Units with the Most Suitable Habitat for Horned Lark
HUC6Watershed Name
(Not Comprehensive) Elev HabAcOK HabAcBest HS
170900030602 Soap Cr. 1 933 474 0.90
170900030302 Brownsville 1 513 269 0.93
170900030504 Finley NWR; Muddy & Hammer Cr. 1 2029 1271 0.81
170900030402 S. Albany; Tangent. 1 613 421 1.59
170900030202 Monroe; Muddy Cr. E. 1 1488 1130 1.48
Elevation zones (Elev) are:1= <500 ft, 2= 500-1000 ft, 3= 1000-2000 ft; 4= 2000-3000 ft; 5= 3000-4000 ft, 6= >4000 ftHabAcOK is the acres of possible habitat, i.e., scored >5 for habitat suitability on a 0-10 scale.HabAcBest is the acres of habitat scored a “10.”The habitat suitability score is a relative index that represents the proportional extent (not acres) of higher-suitability habitat in the unit defined by the HUC6 and elevation zone; see Appendix D for more explanation,map files accompanying this plan for location of the HUC6’s, and electronic files accompanying the plan forranking of all watersheds and units.
Vesper Sparrow (affinis subspecies)Special Designations: “Critical” (ODFW). “Imperiled” (ONHP). Partners In Flight focalspecies.
Distribution, Status, and Trends: Like the horned lark, the vesper sparrow is common throughoutmuch of eastern Oregon but the population in the Willamette Basin (which is migratory) is adifferent subspecies and has declined dramatically over the past 50 years. The currentbreeding population in the basin is estimated at under 200 pairs (Altman 2003). TheORNHIC database contains documented records from 24 of the 170 Willamette watersheds.Along Willamette Basin BBS routes the species was detected at 0.75 percent of surveyedpoints in 2003, with a maximum during the period 1968-2003 of 3.2 percent in 1981.Application of simple species-habitat models to aerial imagery using GIS suggests 0.71percent of the basin might contain habitat that could be at least marginally suitable and 0.20percent might contain higher-suitability habitat. The Oregon BBA Project (Adamus et al.2001) confirmed nesting in 20 percent of the large survey units in the basin and foundevidence of possible or probable nesting in an additional 26 percent. BBS data covering theperiod 1968-2003 show a decrease in the Willamette Valley and in western Oregon-Washington generally.
Key Environmental Correlates: Formerly bred in upland prairie-savanna, but as this habitat hasdiminished the species has adapted to nesting in two environments: (1) lightly grazedpastures with generally short grass and scattered shrubs, and (2) conifer plantations youngerthan 5 years old with extensive weeds and grasses. Mean territory size is 3.1 ac (Altman2003). Along with other grassland species, this species may be impacted by increases inpredator densities associated with urbanization, as well as by diminished inclusion ofhedgerows in croplands as farm parcel sizes increase, i.e., agricultural intensification.
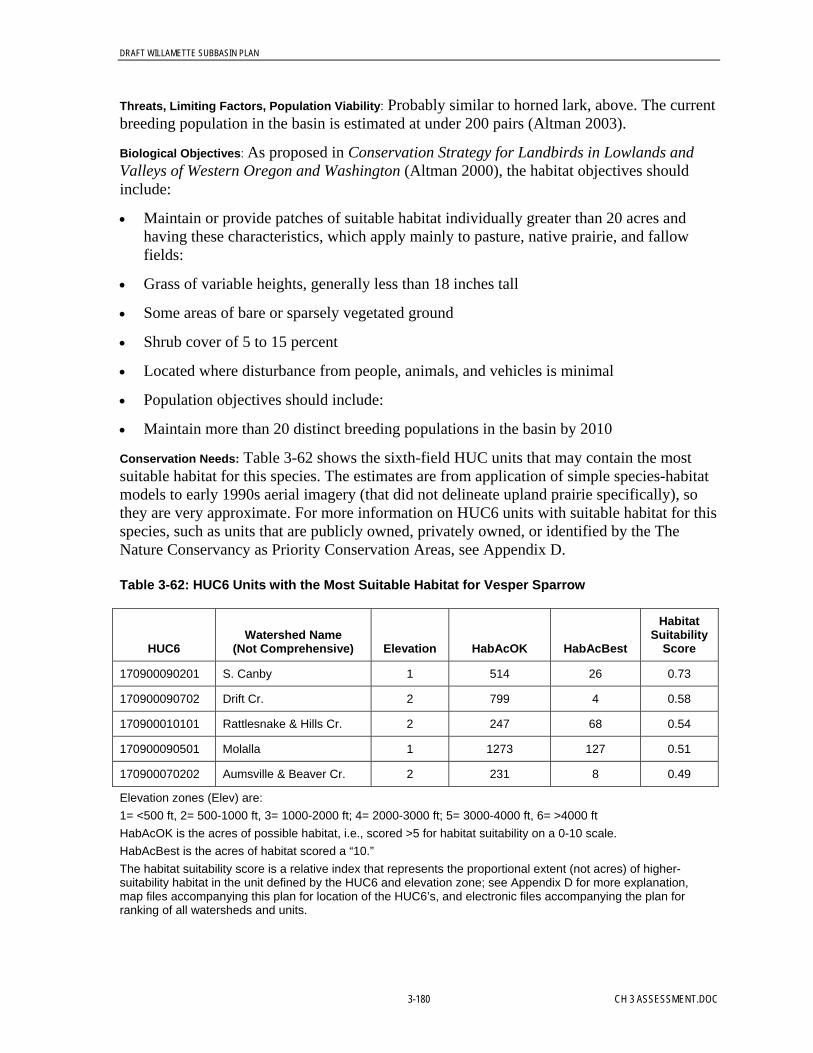
DRAFT WILLAMETTE SUBBASIN PLAN
3-180 CH 3 ASSESSMENT.DOC
Threats, Limiting Factors, Population Viability: Probably similar to horned lark, above. The currentbreeding population in the basin is estimated at under 200 pairs (Altman 2003).
Biological Objectives: As proposed in Conservation Strategy for Landbirds in Lowlands andValleys of Western Oregon and Washington (Altman 2000), the habitat objectives shouldinclude:
• Maintain or provide patches of suitable habitat individually greater than 20 acres andhaving these characteristics, which apply mainly to pasture, native prairie, and fallowfields:
• Grass of variable heights, generally less than 18 inches tall
• Some areas of bare or sparsely vegetated ground
• Shrub cover of 5 to 15 percent
• Located where disturbance from people, animals, and vehicles is minimal
• Population objectives should include:
• Maintain more than 20 distinct breeding populations in the basin by 2010
Conservation Needs: Table 3-62 shows the sixth-field HUC units that may contain the mostsuitable habitat for this species. The estimates are from application of simple species-habitatmodels to early 1990s aerial imagery (that did not delineate upland prairie specifically), sothey are very approximate. For more information on HUC6 units with suitable habitat for thisspecies, such as units that are publicly owned, privately owned, or identified by the TheNature Conservancy as Priority Conservation Areas, see Appendix D.
Table 3-62: HUC6 Units with the Most Suitable Habitat for Vesper Sparrow
HUC6Watershed Name
(Not Comprehensive) Elevation HabAcOK HabAcBest
HabitatSuitability
Score
170900090201 S. Canby 1 514 26 0.73
170900090702 Drift Cr. 2 799 4 0.58
170900010101 Rattlesnake & Hills Cr. 2 247 68 0.54
170900090501 Molalla 1 1273 127 0.51
170900070202 Aumsville & Beaver Cr. 2 231 8 0.49
Elevation zones (Elev) are:1= <500 ft, 2= 500-1000 ft, 3= 1000-2000 ft; 4= 2000-3000 ft; 5= 3000-4000 ft, 6= >4000 ftHabAcOK is the acres of possible habitat, i.e., scored >5 for habitat suitability on a 0-10 scale.HabAcBest is the acres of habitat scored a “10.”The habitat suitability score is a relative index that represents the proportional extent (not acres) of higher-suitability habitat in the unit defined by the HUC6 and elevation zone; see Appendix D for more explanation,map files accompanying this plan for location of the HUC6’s, and electronic files accompanying the plan forranking of all watersheds and units.

DRAFT WILLAMETTE SUBBASIN PLAN
CH 3 ASSESSMENT.DOC 3-181
Western MeadowlarkSpecial Designations: “Critical” (ODFW) just in the Willamette Valley ecoregion. Partners InFlight focal species.
Distribution, Status, and Trends: Like the above two species (horned lark and vesper sparrow)the western meadowlark is common throughout much of eastern Oregon but the WillametteBasin population (which is mostly resident) has declined dramatically over the past 50 years.The current breeding population in the basin is estimated to be less than 300 pairs (Altman2003). Along Willamette Basin BBS routes the species was detected at a maximum of 14.3percent surveyed points (in 1974), but none during 2003. Application of simple species-habitat models to aerial imagery using GIS suggests 0.25 percent of the basin might containhabitat that could be at least marginally suitable and 0.20 percent might contain good habitat.The Oregon BBA Project (Adamus et al. 2001) confirmed nesting in 11 percent of the largesurvey units in the basin and found evidence of possible or probable nesting in an additional30 percent.. BBS data covering the period 1968-2003 show a decrease in the WillametteValley as well as in western Oregon-Washington generally. These declines are statisticallysignificant. Willamette CBC data show a decline from about 100 birds per CBC in the late1970s to about 50 birds per CBC in the mid 1990s.
Key Environmental Correlates: Formerly bred in upland prairie-savanna, but as this habitat hasdiminished the species has adapted to nesting in some fallow fields and lightly grazedpastures. Prefers large open expanse (greater than 100 ac) of uncultivated grassland withgrass-forb cover of 1-2 ft height and scattered shrubs (less than 10 percent cover) or artificialperches (fences, telephone poles). Only 24 percent of the Willamette territories includedcultivated grass fields and none contained more than 50 percent cultivated grass. Meanterritory size is 14.3 ac (Altman 2003).
Threats, Limiting Factors, Population Viability: Probably similar to horned lark and vespersparrow, above. The current breeding population in the basin is estimated to be less than 300pairs (Altman 2003).
Biological Objectives: As proposed in Conservation Strategy for Landbirds in Lowlands andValleys of Western Oregon and Washington (Altman 2000), the habitat objectives shouldinclude:
• Maintain or create patches of suitable habitat (individually less than 200 acres in extent)throughout native and agricultural grasslands; the patches should have thesecharacteristics:
− Variable grass heights, generally shorter than 30 inches− Containing some shrubs, trees, or other perches, but over less than 10 percent of area− Located where disturbance from people, animals, and vehicles is minimal
Guidance on Willamette grassland management for this species is provided in ODFW(2001).
Population objectives should include:
• Reverse the declining BBS trends to achieve stable populations ( negative trends of lessthan 2 percent per year) or increasing trends by 2010.
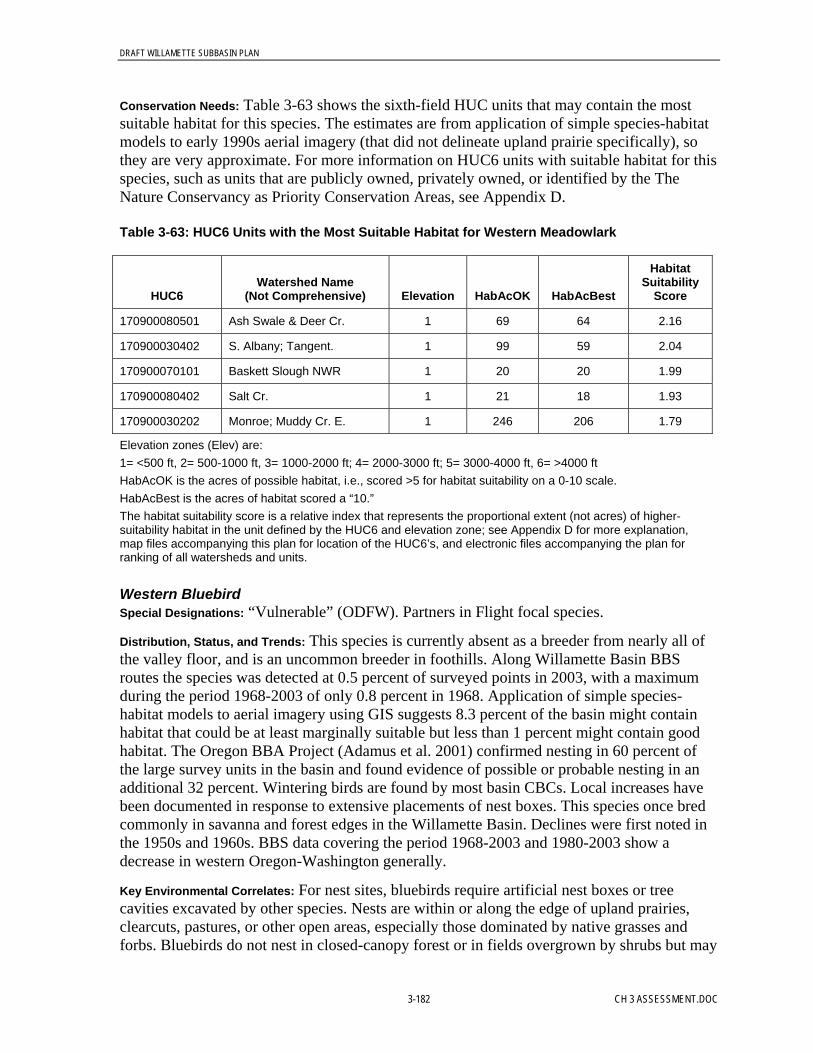
DRAFT WILLAMETTE SUBBASIN PLAN
3-182 CH 3 ASSESSMENT.DOC
Conservation Needs: Table 3-63 shows the sixth-field HUC units that may contain the mostsuitable habitat for this species. The estimates are from application of simple species-habitatmodels to early 1990s aerial imagery (that did not delineate upland prairie specifically), sothey are very approximate. For more information on HUC6 units with suitable habitat for thisspecies, such as units that are publicly owned, privately owned, or identified by the TheNature Conservancy as Priority Conservation Areas, see Appendix D.
Table 3-63: HUC6 Units with the Most Suitable Habitat for Western Meadowlark
HUC6Watershed Name
(Not Comprehensive) Elevation HabAcOK HabAcBest
HabitatSuitability
Score
170900080501 Ash Swale & Deer Cr. 1 69 64 2.16
170900030402 S. Albany; Tangent. 1 99 59 2.04
170900070101 Baskett Slough NWR 1 20 20 1.99
170900080402 Salt Cr. 1 21 18 1.93
170900030202 Monroe; Muddy Cr. E. 1 246 206 1.79
Elevation zones (Elev) are:1= <500 ft, 2= 500-1000 ft, 3= 1000-2000 ft; 4= 2000-3000 ft; 5= 3000-4000 ft, 6= >4000 ftHabAcOK is the acres of possible habitat, i.e., scored >5 for habitat suitability on a 0-10 scale.HabAcBest is the acres of habitat scored a “10.”The habitat suitability score is a relative index that represents the proportional extent (not acres) of higher-suitability habitat in the unit defined by the HUC6 and elevation zone; see Appendix D for more explanation,map files accompanying this plan for location of the HUC6’s, and electronic files accompanying the plan forranking of all watersheds and units.
Western BluebirdSpecial Designations: “Vulnerable” (ODFW). Partners in Flight focal species.
Distribution, Status, and Trends: This species is currently absent as a breeder from nearly all ofthe valley floor, and is an uncommon breeder in foothills. Along Willamette Basin BBSroutes the species was detected at 0.5 percent of surveyed points in 2003, with a maximumduring the period 1968-2003 of only 0.8 percent in 1968. Application of simple species-habitat models to aerial imagery using GIS suggests 8.3 percent of the basin might containhabitat that could be at least marginally suitable but less than 1 percent might contain goodhabitat. The Oregon BBA Project (Adamus et al. 2001) confirmed nesting in 60 percent ofthe large survey units in the basin and found evidence of possible or probable nesting in anadditional 32 percent. Wintering birds are found by most basin CBCs. Local increases havebeen documented in response to extensive placements of nest boxes. This species once bredcommonly in savanna and forest edges in the Willamette Basin. Declines were first noted inthe 1950s and 1960s. BBS data covering the period 1968-2003 and 1980-2003 show adecrease in western Oregon-Washington generally.
Key Environmental Correlates: For nest sites, bluebirds require artificial nest boxes or treecavities excavated by other species. Nests are within or along the edge of upland prairies,clearcuts, pastures, or other open areas, especially those dominated by native grasses andforbs. Bluebirds do not nest in closed-canopy forest or in fields overgrown by shrubs but may

DRAFT WILLAMETTE SUBBASIN PLAN
CH 3 ASSESSMENT.DOC 3-183
feed in such areas during winter, especially where mistletoe, madrone, and other berries areavailable.
Threats, Limiting Factors, Population Viability: Habitat loss and degradation have been the greatestcontributors to decline of the species in the basin. May be more sensitive to changes in forestpractices (rotation ages, patterns) than other focal species inhabiting this habitat type. Also,increases in residential development are typically accompanied by increases in Europeanstarling and house sparrow, non-native species that usurp nesting cavities. This may be less aproblem at higher-elevation forested areas. Increased high-speed traffic on rural roads alsomay contribute to mortality.
Biological Objectives: Habitat objectives should include:
• Manage woodlands to provide a sustained supply of snags (at least 10 ft tall and 15 inchdiameter) located along edges that adjoin open areas, i.e., areas with fewer than 5 trees/ac(Hansen et al. 1995)
• Following forest fires, leave larger snags whenever feasible.
Population objectives should include:
• Achieve stable populations (negative trends of less than 2 percent per year) or increasingtrends by 2010.
Conservation Needs: Table 3-64 shows the sixth-field HUC units that may contain the mostsuitable habitat for this species. The estimates are from application of simple species-habitatmodels to early 1990s aerial imagery (that did not delineate upland prairie specifically), sothey are very approximate. For more information on HUC6 units with suitable habitat for thisspecies, such as units that are publicly owned, privately owned, or identified by the TheNature Conservancy as Priority Conservation Areas, see Appendix D.
Table 3-64: HUC6 Units with the Most Suitable Habitat for Western Bluebird
HUC6Watershed Name
(Not Comprehensive) Elev HabAcOK HabAcBest HS
170900010302 Fall & Delp Cr. 4 2800 0 1.66
170900050103 Pyramid Cr. 5 4367 0 1.59
170900011101 Groundhog Cr: S.Fork 5 3005 0 1.49
170900110402 Timothy Lake; Dinger Lake 5 9977 0 1.46
170900060501 Pyramid Cr. & Quartzville Cr.-lower 5 9141 0 1.42
DRAFT WILLAMETTE SUBBASIN PLAN
3-184 CH 3 ASSESSMENT.DOC
Table 3-64: HUC6 Units with the Most Suitable Habitat for Western Bluebird
HUC6Watershed Name
(Not Comprehensive) Elev HabAcOK HabAcBest HS
Elevation zones (Elev) are:1= <500 ft, 2= 500-1000 ft, 3= 1000-2000 ft; 4= 2000-3000 ft; 5= 3000-4000 ft, 6= >4000 ftHabAcOK is the acres of possible habitat, i.e., scored >5 for habitat suitability on a 0-10 scale.HabAcBest is the acres of habitat scored a “10.”The habitat suitability score is a relative index that represents the proportional extent (not acres) of higher-suitability habitat in the unit defined by the HUC6 and elevation zone; see Appendix D for more explanation,map files accompanying this plan for location of the HUC6’s, and electronic files accompanying the plan forranking of all watersheds and units.
Black-tailed JackrabbitSpecial Designations: none
Distribution, Status, and Trends: Jackrabbits once were abundant on the valley floor andfoothills, but anecdotal evidence suggests a long term population decline has occurred (Verts& Carraway 1998). ORNHIC databases contain no records from the last 20 years. Incidentalto avian surveys conducted during summers 1996-1999, the species was noted at 15 rurallocations in the Willamette Valley (Altman et al. 2001). Apparently extirpated from thegreater Portland area (Metro 2003) and generally more common in southern parts of thebasin.
Key Environmental Correlates: Historically this species inhabited upland prairie-savannah withscattered shrubs. Most recent observations have been from the vicinity of conifer plantations.
Threats, Limiting Factors, Population Viability: Habitat loss and fragmentation have been thegreatest contributors to decline of the species in the basin. Other factors that might becontributing to decline include hunting, disease (tularemia), increases in predator densities,increases in farming efficiency and field size (i.e., fewer hedgerows), and roadkill due toincreased high-speed traffic on rural roads. Home range is about 500 acres.
Biological Objectives: Survey, then maintain or increase present densities and distribution in thebasin, consistent with minimizing potential damage to nearby crops.
Conservation Needs: Table 3-65 shows the sixth-field HUC units that may contain the mostsuitable habitat for this species. The estimates are from application of simple species-habitatmodels to early 1990s aerial imagery (that did not delineate upland prairie specifically), sothey are very approximate. For more information on HUC6 units with suitable habitat for thisspecies, such as units that are publicly owned, privately owned, or identified by the TheNature Conservancy as Priority Conservation Areas, see Appendix D.

DRAFT WILLAMETTE SUBBASIN PLAN
CH 3 ASSESSMENT.DOC 3-185
Table 3-65: HUC6 Units with the Most Suitable Habitat for Black-Tailed Jackrabbit
HUC6Watershed Name
(Not Comprehensive) Elevation HabAcOK HabAcBest
HabitatSuitability
Score
170900080501 Ash Swale & Deer Cr. 1 16810 0 5.24
170900030402 S. Albany; Tangent. 1 27257 0 5.22
170900080402 Salt Cr. 1 7986 0 4.96
170900070101 Baskett Slough NWR 1 10697 0 4.86
170900030203 Coburg; Halsey; Little Muddy R.;Pierce Cr
1 59165 0 4.41
Elevation zones (Elev) are:1= <500 ft, 2= 500-1000 ft, 3= 1000-2000 ft; 4= 2000-3000 ft; 5= 3000-4000 ft, 6= >4000 ftHabAcOK is the acres of possible habitat, i.e., scored >5 for habitat suitability on a 0-10 scale.HabAcBest is the acres of habitat scored a “10.”The habitat suitability score is a relative index that represents the proportional extent (not acres) of higher-suitability habitat in the unit defined by the HUC6 and elevation zone; see Appendix D for more explanation, mapfiles accompanying this plan for location of the HUC6’s, and electronic files accompanying the plan for ranking ofall watersheds and units.
Western RattlesnakeSpecial Designations: “Vulnerable” (ODFW, Willamette Valley ecoregion only).
Distribution, Status, and Trends: Formerly common on the valley floor and in foothills,rattlesnakes now persist at fewer than a dozen locations in the basin.
Key Environmental Correlates: Historically this species inhabited upland prairie-savannah aswell as rock outcrops, but as this habitat has declined the remaining populations have becomerestricted to rock outcrops, especially ones on grassy south-facing slopes below 2000 ftelevation (Alan St. John, pers. comm.).
Threats, Limiting Factors, Population Viability: Loss, fragmentation, and degradation of uplandprairie-savanna has been a major contributor to decline of the species in the basin.Persecution surely has also been a major contributor, especially around ranches andresidential areas. Animal burrows are important for refuge during inclement weather andhave diminished as prairies have been converted to cropland.
Biological Objectives: Survey present densities in the basin and then formulate biologicalobjectives.
Conservation Needs: Table 3-66 shows the sixth-field HUC units that may contain the mostsuitable habitat for this species. The estimates are from application of simple species-habitatmodels to early 1990s aerial imagery (that did not delineate upland prairie specifically), sothey are very approximate. For more information on HUC6 units with suitable habitat for thisspecies, such as units that are publicly owned, privately owned, or identified by the TheNature Conservancy as Priority Conservation Areas, see Appendix D.

DRAFT WILLAMETTE SUBBASIN PLAN
3-186 CH 3 ASSESSMENT.DOC
Table 3-66: HUC6 Units with the Most Suitable Habitat for Western Rattlesnake
HUC6Watershed Name
(Not Comprehensive) Elevation HabAcOK HabAcBest
HabitatSuitability
Score
170900090702 Drift Cr. 2 2933 2933 0.73
170900090703 Silverton N. 2 764 764 0.46
170900060102 E. Lebanon; Hamilton Cr. 2 1445 1445 0.46
170900080604 Turner Cr. 2 594 594 0.44
170900060301 Lower Thomas Cr. -lower; Scio 2 1063 1063 0.40
Elevation zones (Elev) are:1= <500 ft, 2= 500-1000 ft, 3= 1000-2000 ft; 4= 2000-3000 ft; 5= 3000-4000 ft, 6= >4000 ftHabAcOK is the acres of possible habitat, i.e., scored >5 for habitat suitability on a 0-10 scale.HabAcBest is the acres of habitat scored a “10.”The habitat suitability score is a relative index that represents the proportional extent (not acres) of higher-suitability habitat in the unit defined by the HUC6 and elevation zone; see Appendix D for more explanation,map files accompanying this plan for location of the HUC6’s, and electronic files accompanying the plan forranking of all watersheds and units.
3.2.5.3 Focal Habitat: Wetland Prairie and Seasonal MarshDescription. The wetland prairie and seasonal marsh (hereinafter termed simply “wetlandprairie”) includes areas that are outside of the annual floodplain of rivers, are inundated orsaturated for only part of the year by lentic (non-flowing) water, are dominated by the typesof herbaceous vegetation that are characteristically associated with wetlands according toUSFWS databases, and show evidence of reducing conditions in the upper soil horizon orcontain soils considered by the NRCS to be “hydric.” In the Willamette Basin most suchareas exist (or existed) on the valley floor, but this definition also includes some springs andseeps on the valley margin and foothills if these are dominated by herbaceous vegetation—that is, marsh. This definition includes vernal pools but not Sphagnum-dominated bogs.Many wetland prairies appear to be isolated, meaning that they are not permanentlyconnected to other water bodies by surface water. Wetland prairies are classified as “slope”or “flats” wetland according to the classification scheme used by Oregon Division of StateLands (Brinson 1993, Adamus 2001) and includes “emergent wetland” (with semipermanent,seasonal, or temporarily inundated hydroperiod) as defined by the Cowardin et al. (1978)classification and used in maps published by the National Wetland Inventory.
Recognition of Importance. Wetlands included under this definition have been identifiedexplicitly as a priority for protection and restoration in other regions and specifically in theWillamette Basin (Titus et al. 1996, Morlan 2000). Legally listed species that are stronglyassociated with this habitat include Bradshaw’s lomatium (federal “endangered,”);Willamette Valley daisy and Nelson’s checker-mallow (federal “threatened”); streakedhorned lark (proposed for federal listing, and state-listed as “critical”); red-legged andCascades frogs (both ODFW “vulnerable”), and western toad (now almost extirpated, ODFW“vulnerable”).
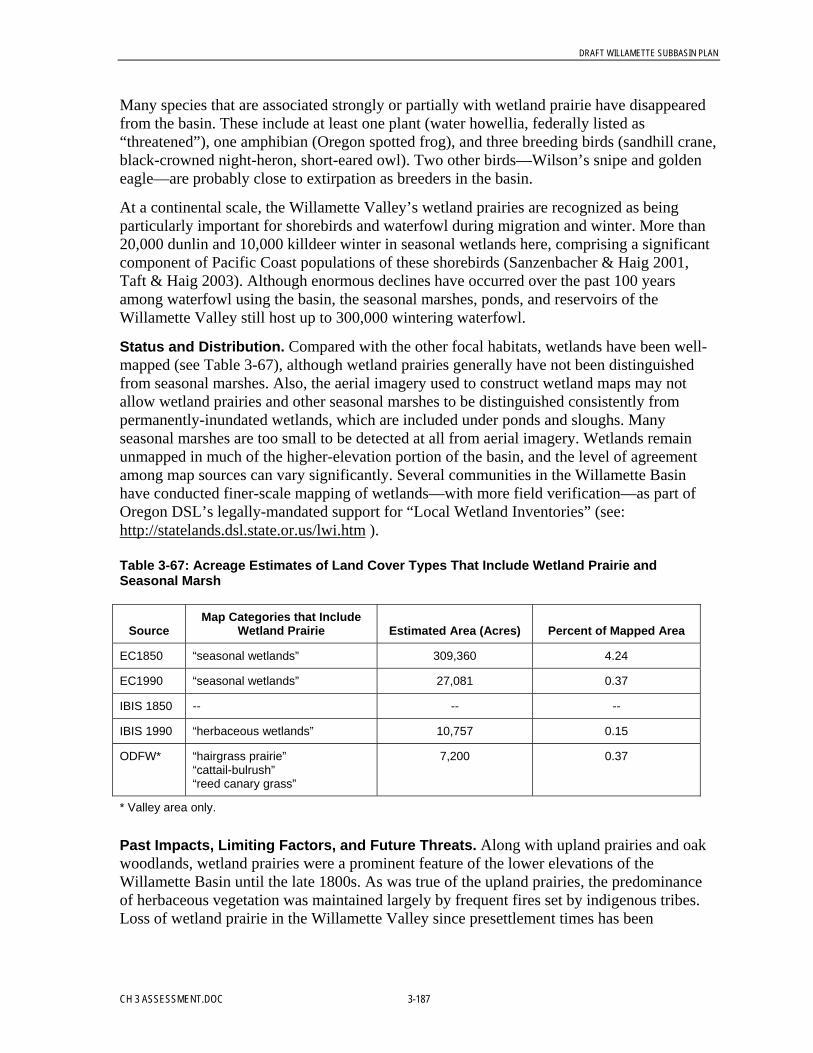
DRAFT WILLAMETTE SUBBASIN PLAN
CH 3 ASSESSMENT.DOC 3-187
Many species that are associated strongly or partially with wetland prairie have disappearedfrom the basin. These include at least one plant (water howellia, federally listed as“threatened”), one amphibian (Oregon spotted frog), and three breeding birds (sandhill crane,black-crowned night-heron, short-eared owl). Two other birds—Wilson’s snipe and goldeneagle—are probably close to extirpation as breeders in the basin.
At a continental scale, the Willamette Valley’s wetland prairies are recognized as beingparticularly important for shorebirds and waterfowl during migration and winter. More than20,000 dunlin and 10,000 killdeer winter in seasonal wetlands here, comprising a significantcomponent of Pacific Coast populations of these shorebirds (Sanzenbacher & Haig 2001,Taft & Haig 2003). Although enormous declines have occurred over the past 100 yearsamong waterfowl using the basin, the seasonal marshes, ponds, and reservoirs of theWillamette Valley still host up to 300,000 wintering waterfowl.
Status and Distribution. Compared with the other focal habitats, wetlands have been well-mapped (see Table 3-67), although wetland prairies generally have not been distinguishedfrom seasonal marshes. Also, the aerial imagery used to construct wetland maps may notallow wetland prairies and other seasonal marshes to be distinguished consistently frompermanently-inundated wetlands, which are included under ponds and sloughs. Manyseasonal marshes are too small to be detected at all from aerial imagery. Wetlands remainunmapped in much of the higher-elevation portion of the basin, and the level of agreementamong map sources can vary significantly. Several communities in the Willamette Basinhave conducted finer-scale mapping of wetlands—with more field verification—as part ofOregon DSL’s legally-mandated support for “Local Wetland Inventories” (see:http://statelands.dsl.state.or.us/lwi.htm ).
Table 3-67: Acreage Estimates of Land Cover Types That Include Wetland Prairie andSeasonal Marsh
SourceMap Categories that Include
Wetland Prairie Estimated Area (Acres) Percent of Mapped Area
EC1850 “seasonal wetlands” 309,360 4.24
EC1990 “seasonal wetlands” 27,081 0.37
IBIS 1850 -- -- --
IBIS 1990 “herbaceous wetlands” 10,757 0.15
ODFW* “hairgrass prairie”“cattail-bulrush”“reed canary grass”
7,200 0.37
* Valley area only.
Past Impacts, Limiting Factors, and Future Threats. Along with upland prairies and oakwoodlands, wetland prairies were a prominent feature of the lower elevations of theWillamette Basin until the late 1800s. As was true of the upland prairies, the predominanceof herbaceous vegetation was maintained largely by frequent fires set by indigenous tribes.Loss of wetland prairie in the Willamette Valley since presettlement times has been

DRAFT WILLAMETTE SUBBASIN PLAN
3-188 CH 3 ASSESSMENT.DOC
estimated at 99 percent, and loss of other herbaceous wetlands (probably including someperennially-inundated ones) is estimated at 57 percent (Titus et al. 1996, Morlan 2000).
Despite laws that regulate some activities in wetlands, the net (uncompensated) loss anddegradation of wetlands—and especially of wetland prairie and seasonal marsh in theWillamette Basin—continues. For example, destruction of 546 wetland acres per yearbetween 1982 and 1994 was measured in the Willamette Valley (Daggett et al. 1998, Bernertet al. 1999). Probably the largest contributing factor to wetland destruction in the basin hasbeen legally-exempted agricultural activities (Shaich 2000). Remaining wetland prairies havebecome so fragmented and separated by roads carrying high-speed traffic that populations ofwildlife, and especially reptiles and amphibians, may not be self-sustaining in some areas ofthe basin. And being supported by only a seasonal water regime, wetland prairies areparticularly vulnerable to potential effects of global warming (Graham 2000).
Wetland prairies also are being ecologically degraded. Many are being gradually invaded byshrubs, especially Oregon ash (Fraxinus latifolia) and Himalayan blackberry, due to alteredlocal water regimes and long term suppression of fires. In running computer simulations offuture environmental conditions in the Willamette Basin, one researcher (Payne 2002)assumed the maximum rate at which ash might invade wet prairies and other open areas to beabout 100 lateral feet per 40 years. Within the past few decades, highly invasive reed canarygrass (Phalaris arundinacea) also has come to dominate many, if not most ,of the basin’sseasonal marshes, choking out large numbers of native species and profoundly alteringwildlife habitat structure and food sources.
Pesticides, toxic substances, and excessive loads of sediment from roads, logging, andsuburban and agricultural lands reach wetlands and diminish their capacity to supportwildlife and rare plants. Some recent evidence suggests that nitrate fertilizers potentiallyimpact the reproduction of native amphibians (Marco et al. 1999). Near residential areas,increased predator densities (cats, raccoons) may be significantly impacting some birds thatnest in wetland prairies. Scientific literature on all of these impacts to wetland plants andanimals was reviewed by Adamus & Brandt (1990) and Adamus et al. (2001).
Contribution of Wetland Prairies to Regional Biodiversity. Compared with otherWillamette habitat types, wetland prairies in good condition provide the best reproductivehabitat for 38 wildlife species, and are used regularly by at least an additional 54 breedingwildlife species. Many of these species are associated as well with upland prairie. Some useseasonally-inundated agricultural lands, perhaps at some cost to reproductive success andsurvival. The wetland prairie—seasonal marsh avifauna includes several nesting bird specieswhose numbers appear to be declining regionally. Many plant species found in theWillamette Basin’s wetland prairies are rare and found in none of the other 5 habitat typesfeatured in this plan (Titus et al. 1996, Wilson 1998b).
Selected Focal Species in Wetland Prairie. The following are proposed as focal speciesfor this habitat type:
• Plants: Bradshaw’s lomatium, Nelson’s checker-mallow (sidalcea), Willamette Valleydaisy, peacock larkspur
• Wildlife: red-legged frog, sora, northern harrier, common yellowthroat, dunlin

DRAFT WILLAMETTE SUBBASIN PLAN
CH 3 ASSESSMENT.DOC 3-189
On a scale of 0 to 10, these species’ average degree of association with wetland prairies andseasonal marshes is a 8.43. Compare this with HEP “loss assessment” species used in manyprevious mitigation calculations and land acquisitions in the Willamette Basin. Of the “grass-forb” species used in HEP applications, the average degree of association with wetlandprairie or seasonal wetland is only 2.78. This suggests there may have been an unintentionalbut systematic bias against the wetland prairie habitat type in previous mitigation landdealings in the Willamette Basin.
Bradshaw’s Lomatium (Lomatium bradshawii)Special Designations: “Endangered” (federal). “Imperiled” (ONHP).
Distribution, Status, and Trends: This species occurs only in the Willamette Valley and southernWashington. Once abundant, there now are documented records from just 13 of the 170Willamette watersheds.
Key Environmental Correlates: This species occurs mainly on clayey soils with seasonally highwater tables and little or no shade.
Threats, Limiting Factors, Population Viability: Habitat loss to development and succession ofwetland prairies to woodland as a result of fire suppression and altered soil moisture regimespose the greatest threat (Kagan 1980). Insects are essential for pollinating this plant and maybe impacted by pesticides drifting from residential, forest (gypsy moth control), andagricultural areas.
Biological Objectives:
• Maintain or expand existing numbers and geographic distribution through protection,restoration, and management of suitable habitat.
Conservation Needs: Table 3-68 shows the sixth-field HUC units that may contain the mostsuitable habitat for this species. The estimates are from application of simple species-habitatmodels to early 1990s aerial imagery, so they are very approximate. For more information onHUC6 units with suitable habitat for this species, such as units that are publicly owned,privately owned, or identified by the The Nature Conservancy as Priority ConservationAreas, see Appendix D.
Table 3-68: HUC6 Units with the Most Suitable Habitat for Bradshaw’s Lomatium
HUC6Watershed Name
(Not Comprehensive) Elevation HabAcOK HabAcBest
HabitatSuitability
Score
170900030101 W. Eugene; Junction City 1 2177 1008 1.26
170900030504 Finley NWR; Muddy & Hammer Cr. 1 1253 612 1.20
170900030302 Brownsville 1 364 154 1.18
170900030403 Sodaville 1 169 59 1.05
170900020102 Creswell W.; Camas Swale 2 175 121 0.89
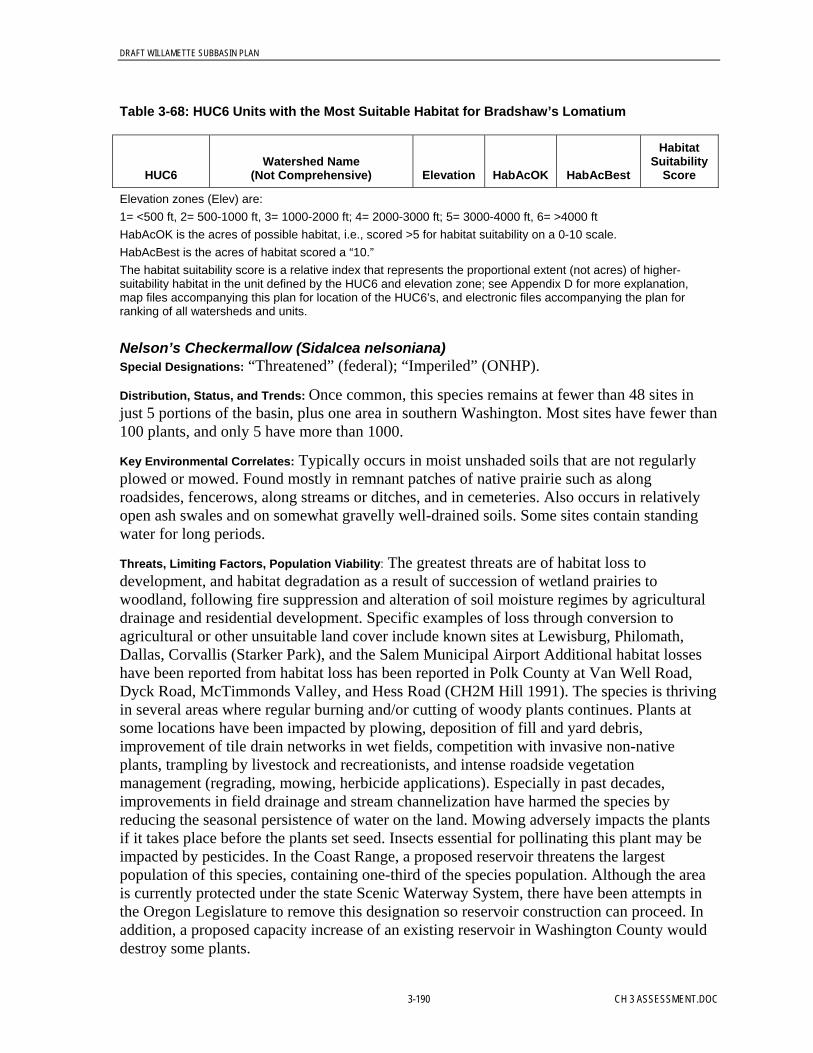
DRAFT WILLAMETTE SUBBASIN PLAN
3-190 CH 3 ASSESSMENT.DOC
Table 3-68: HUC6 Units with the Most Suitable Habitat for Bradshaw’s Lomatium
HUC6Watershed Name
(Not Comprehensive) Elevation HabAcOK HabAcBest
HabitatSuitability
Score
Elevation zones (Elev) are:1= <500 ft, 2= 500-1000 ft, 3= 1000-2000 ft; 4= 2000-3000 ft; 5= 3000-4000 ft, 6= >4000 ftHabAcOK is the acres of possible habitat, i.e., scored >5 for habitat suitability on a 0-10 scale.HabAcBest is the acres of habitat scored a “10.”The habitat suitability score is a relative index that represents the proportional extent (not acres) of higher-suitability habitat in the unit defined by the HUC6 and elevation zone; see Appendix D for more explanation,map files accompanying this plan for location of the HUC6’s, and electronic files accompanying the plan forranking of all watersheds and units.
Nelson’s Checkermallow (Sidalcea nelsoniana)Special Designations: “Threatened” (federal); “Imperiled” (ONHP).
Distribution, Status, and Trends: Once common, this species remains at fewer than 48 sites injust 5 portions of the basin, plus one area in southern Washington. Most sites have fewer than100 plants, and only 5 have more than 1000.
Key Environmental Correlates: Typically occurs in moist unshaded soils that are not regularlyplowed or mowed. Found mostly in remnant patches of native prairie such as alongroadsides, fencerows, along streams or ditches, and in cemeteries. Also occurs in relativelyopen ash swales and on somewhat gravelly well-drained soils. Some sites contain standingwater for long periods.
Threats, Limiting Factors, Population Viability: The greatest threats are of habitat loss todevelopment, and habitat degradation as a result of succession of wetland prairies towoodland, following fire suppression and alteration of soil moisture regimes by agriculturaldrainage and residential development. Specific examples of loss through conversion toagricultural or other unsuitable land cover include known sites at Lewisburg, Philomath,Dallas, Corvallis (Starker Park), and the Salem Municipal Airport Additional habitat losseshave been reported from habitat loss has been reported in Polk County at Van Well Road,Dyck Road, McTimmonds Valley, and Hess Road (CH2M Hill 1991). The species is thrivingin several areas where regular burning and/or cutting of woody plants continues. Plants atsome locations have been impacted by plowing, deposition of fill and yard debris,improvement of tile drain networks in wet fields, competition with invasive non-nativeplants, trampling by livestock and recreationists, and intense roadside vegetationmanagement (regrading, mowing, herbicide applications). Especially in past decades,improvements in field drainage and stream channelization have harmed the species byreducing the seasonal persistence of water on the land. Mowing adversely impacts the plantsif it takes place before the plants set seed. Insects essential for pollinating this plant may beimpacted by pesticides. In the Coast Range, a proposed reservoir threatens the largestpopulation of this species, containing one-third of the species population. Although the areais currently protected under the state Scenic Waterway System, there have been attempts inthe Oregon Legislature to remove this designation so reservoir construction can proceed. Inaddition, a proposed capacity increase of an existing reservoir in Washington County woulddestroy some plants.
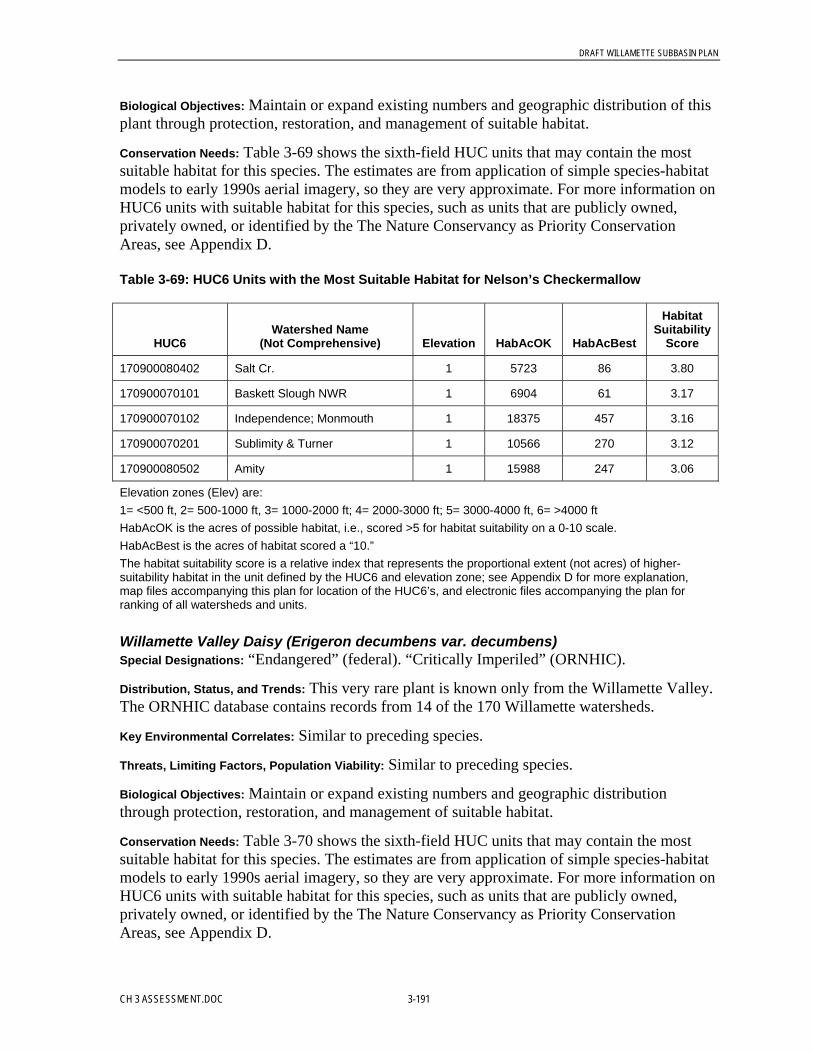
DRAFT WILLAMETTE SUBBASIN PLAN
CH 3 ASSESSMENT.DOC 3-191
Biological Objectives: Maintain or expand existing numbers and geographic distribution of thisplant through protection, restoration, and management of suitable habitat.
Conservation Needs: Table 3-69 shows the sixth-field HUC units that may contain the mostsuitable habitat for this species. The estimates are from application of simple species-habitatmodels to early 1990s aerial imagery, so they are very approximate. For more information onHUC6 units with suitable habitat for this species, such as units that are publicly owned,privately owned, or identified by the The Nature Conservancy as Priority ConservationAreas, see Appendix D.
Table 3-69: HUC6 Units with the Most Suitable Habitat for Nelson’s Checkermallow
HUC6Watershed Name
(Not Comprehensive) Elevation HabAcOK HabAcBest
HabitatSuitability
Score
170900080402 Salt Cr. 1 5723 86 3.80
170900070101 Baskett Slough NWR 1 6904 61 3.17
170900070102 Independence; Monmouth 1 18375 457 3.16
170900070201 Sublimity & Turner 1 10566 270 3.12
170900080502 Amity 1 15988 247 3.06
Elevation zones (Elev) are:1= <500 ft, 2= 500-1000 ft, 3= 1000-2000 ft; 4= 2000-3000 ft; 5= 3000-4000 ft, 6= >4000 ftHabAcOK is the acres of possible habitat, i.e., scored >5 for habitat suitability on a 0-10 scale.HabAcBest is the acres of habitat scored a “10.”The habitat suitability score is a relative index that represents the proportional extent (not acres) of higher-suitability habitat in the unit defined by the HUC6 and elevation zone; see Appendix D for more explanation,map files accompanying this plan for location of the HUC6’s, and electronic files accompanying the plan forranking of all watersheds and units.
Willamette Valley Daisy (Erigeron decumbens var. decumbens)Special Designations: “Endangered” (federal). “Critically Imperiled” (ORNHIC).
Distribution, Status, and Trends: This very rare plant is known only from the Willamette Valley.The ORNHIC database contains records from 14 of the 170 Willamette watersheds.
Key Environmental Correlates: Similar to preceding species.
Threats, Limiting Factors, Population Viability: Similar to preceding species.
Biological Objectives: Maintain or expand existing numbers and geographic distributionthrough protection, restoration, and management of suitable habitat.
Conservation Needs: Table 3-70 shows the sixth-field HUC units that may contain the mostsuitable habitat for this species. The estimates are from application of simple species-habitatmodels to early 1990s aerial imagery, so they are very approximate. For more information onHUC6 units with suitable habitat for this species, such as units that are publicly owned,privately owned, or identified by the The Nature Conservancy as Priority ConservationAreas, see Appendix D.

DRAFT WILLAMETTE SUBBASIN PLAN
3-192 CH 3 ASSESSMENT.DOC
Table 3-70: HUC6 Units with the Most Suitable Habitat for Willamette Valley Daisy
HUC6Watershed Name
(Not Comprehensive) Elevation HabAcOK HabAcBest
HabitatSuitability
Score
170900030203 Coburg; Halsey; Little MuddyR.; Pierce Cr
1 1957 230 1.96
170900070101 Baskett Slough NWR 1 62 12 1.57
170900030504 Finley NWR; Muddy & HammerCr.
1 813 168 1.13
170900030101 W. Eugene; Junction City 1 1325 654 0.97
170900020102 Creswell W.; Camas Swale 2 190 134 0.84
Elevation zones (Elev) are:1= <500 ft, 2= 500-1000 ft, 3= 1000-2000 ft; 4= 2000-3000 ft; 5= 3000-4000 ft, 6= >4000 ftHabAcOK is the acres of possible habitat, i.e., scored >5 for habitat suitability on a 0-10 scale.HabAcBest is the acres of habitat scored a “10.”The habitat suitability score is a relative index that represents the proportional extent (not acres) of higher-suitability habitat in the unit defined by the HUC6 and elevation zone; see Appendix D for more explanation, mapfiles accompanying this plan for location of the HUC6’s, and electronic files accompanying the plan for ranking ofall watersheds and units.
Peacock Larkspur (Delphinium pavonaceum)Special Designations: “Endangered” (ODA). “Critically Imperiled” (ONHP). Not recognized asa species by some authorities because of its propensity to hybridize..
Distribution, Status, and Trends: The ORNHIC database contains documented records from 10of the 170 Willamette watersheds.
Key Environmental Correlates: Native prairies, especially wetland prairies.
Threats, Limiting Factors, Population Viability: Its extirpation apparently has been caused by lossand degradation of upland prairie-savanna habitat. Drift of herbicides applied duringagricultural operations and roadside maintenance may also be having an effect.
Biological Objectives: Maintain and increase current numbers and distribution through habitatprotection, restoration, and management.
Conservation Needs: Of the 170 sixth-field watersheds in the basin, each subdivided byelevation zones, the watershed-elevation zone units in Table 3-71 contain records of thisspecies in the ORNHIC database.
Table 3-71: HUC6 Units with ORNHIC Database Records for Peacock Larkspur
HUC6Watershed Name
(Not Comprehensive) Elev Public Land? In PCA?
170900030504 Finley NWR; Muddy & Hammer Cr. 1 yes yes
170900050601 Jefferson; Lyons; Bear Branch 1 yes yes

DRAFT WILLAMETTE SUBBASIN PLAN
CH 3 ASSESSMENT.DOC 3-193
Table 3-71: HUC6 Units with ORNHIC Database Records for Peacock Larkspur
HUC6Watershed Name
(Not Comprehensive) Elev Public Land? In PCA?
170900070103 Ankeny NWR 1 yes yes
170900070301 Saint Paul 1 yes yes
170900030201 Corvallis N.; Adair Village 1 no no
170900030602 Soap Cr. 1 no no
170900070102 Independence; Monmouth 1 no no
170900070103 Ankeny NWR 1 no no
170900090202 Molalla R. -middle 1 no no
170900030501 Corvallis; Philomath; Mary’s R.-lower 1 no yes
170900030601 Luckiamute R.4 1 no yes
170900030602 Soap Cr. 1 no yes
Elevation zones (Elev) are:1= <500 ft, 2= 500-1000 ft, 3= 1000-2000 ft; 4= 2000-3000 ft; 5= 3000-4000 ft, 6= >4000 ftPCA = Priority Conservation Area.
Water Howellia (Howellia aquatilis)Special Designations: “Threatened” (federal). “Extirpated” (ONHP).
Distribution, Status, and Trends: This species once occurred widely in the Pacific Northwest.Currently, the remaining individuals are clustered mainly at two locations, one in easternWashington and one in Montana, with a third cluster in Mendocino County, California.
Key Environmental Correlates: Historically this plant occurred in vernal wetlands withconsolidated mud bottoms. These probably included edges of some oxbows and sloughs inportions of the floodplains of the Willamette and other rivers.
Threats, Limiting Factors, Population Viability: Reasons for its apparent disappearance are unclear,but could be related to river regulation, reduction in riparian shade, and increased waterpollution (particularly increased deposition of sediment).
Biological Objectives: Determine limiting factors through research and seek opportunities toreintroduce if and where suitable habitat is found.
Red-legged FrogSpecial Designations: “Vulnerable” (ONHP).
Distribution, Status, and Trends: The ORNHIC database contains documented records from 34of the 170 Willamette watersheds. This frog potentially occurs at all elevations but is morecommon in the foothills and in southern parts of the basin.
Key Environmental Correlates: Although listed here as a focal species for wetland prairie andseasonal marshes, red-legged frogs often prefer ponds and sloughs with more-permanentwater, especially when they are bounded by partly inundated shrubs and are relatively free of
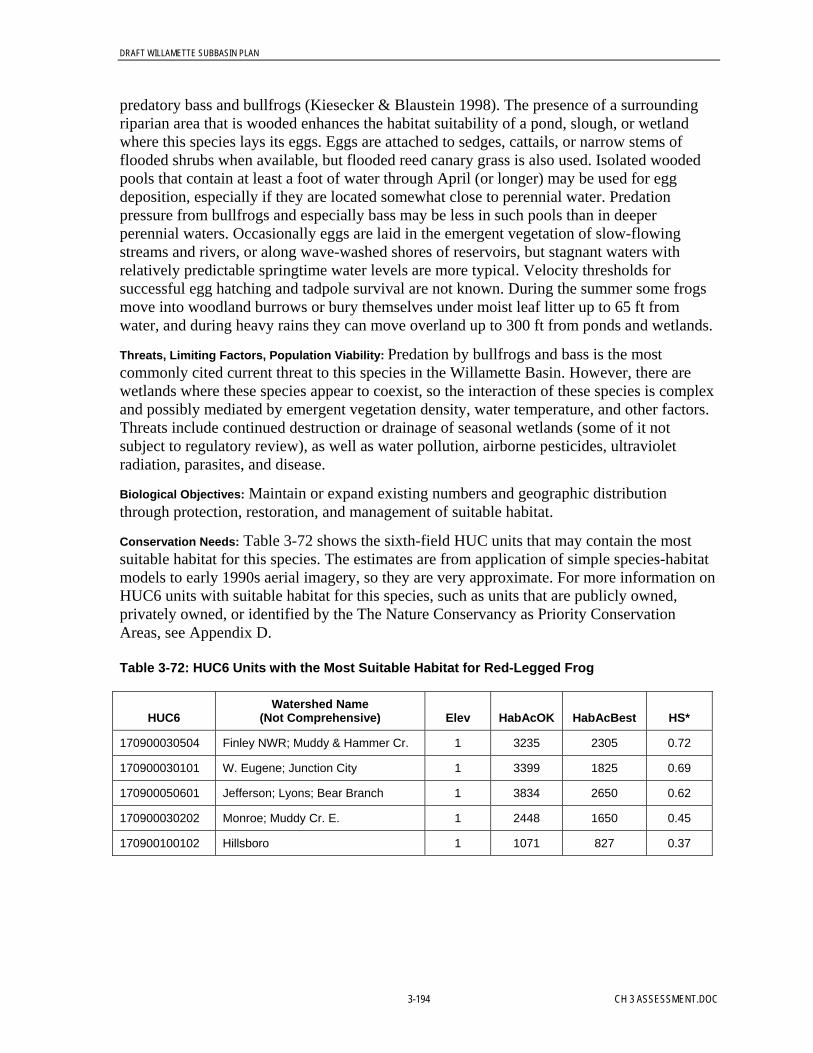
DRAFT WILLAMETTE SUBBASIN PLAN
3-194 CH 3 ASSESSMENT.DOC
predatory bass and bullfrogs (Kiesecker & Blaustein 1998). The presence of a surroundingriparian area that is wooded enhances the habitat suitability of a pond, slough, or wetlandwhere this species lays its eggs. Eggs are attached to sedges, cattails, or narrow stems offlooded shrubs when available, but flooded reed canary grass is also used. Isolated woodedpools that contain at least a foot of water through April (or longer) may be used for eggdeposition, especially if they are located somewhat close to perennial water. Predationpressure from bullfrogs and especially bass may be less in such pools than in deeperperennial waters. Occasionally eggs are laid in the emergent vegetation of slow-flowingstreams and rivers, or along wave-washed shores of reservoirs, but stagnant waters withrelatively predictable springtime water levels are more typical. Velocity thresholds forsuccessful egg hatching and tadpole survival are not known. During the summer some frogsmove into woodland burrows or bury themselves under moist leaf litter up to 65 ft fromwater, and during heavy rains they can move overland up to 300 ft from ponds and wetlands.
Threats, Limiting Factors, Population Viability: Predation by bullfrogs and bass is the mostcommonly cited current threat to this species in the Willamette Basin. However, there arewetlands where these species appear to coexist, so the interaction of these species is complexand possibly mediated by emergent vegetation density, water temperature, and other factors.Threats include continued destruction or drainage of seasonal wetlands (some of it notsubject to regulatory review), as well as water pollution, airborne pesticides, ultravioletradiation, parasites, and disease.
Biological Objectives: Maintain or expand existing numbers and geographic distributionthrough protection, restoration, and management of suitable habitat.
Conservation Needs: Table 3-72 shows the sixth-field HUC units that may contain the mostsuitable habitat for this species. The estimates are from application of simple species-habitatmodels to early 1990s aerial imagery, so they are very approximate. For more information onHUC6 units with suitable habitat for this species, such as units that are publicly owned,privately owned, or identified by the The Nature Conservancy as Priority ConservationAreas, see Appendix D.
Table 3-72: HUC6 Units with the Most Suitable Habitat for Red-Legged Frog
HUC6Watershed Name
(Not Comprehensive) Elev HabAcOK HabAcBest HS*
170900030504 Finley NWR; Muddy & Hammer Cr. 1 3235 2305 0.72
170900030101 W. Eugene; Junction City 1 3399 1825 0.69
170900050601 Jefferson; Lyons; Bear Branch 1 3834 2650 0.62
170900030202 Monroe; Muddy Cr. E. 1 2448 1650 0.45
170900100102 Hillsboro 1 1071 827 0.37

DRAFT WILLAMETTE SUBBASIN PLAN
CH 3 ASSESSMENT.DOC 3-195
Table 3-72: HUC6 Units with the Most Suitable Habitat for Red-Legged Frog
HUC6Watershed Name
(Not Comprehensive) Elev HabAcOK HabAcBest HS*
Elevation zones (Elev) are:1= <500 ft, 2= 500-1000 ft, 3= 1000-2000 ft; 4= 2000-3000 ft; 5= 3000-4000 ft, 6= >4000 ftHabAcOK is the acres of possible habitat, i.e., scored >5 for habitat suitability on a 0-10 scale.HabAcBest is the acres of habitat scored a “10.”The habitat suitability score is a relative index that represents the proportional extent (not acres) of higher-suitability habitat in the unit defined by the HUC6 and elevation zone; see Appendix D for more explanation,map files accompanying this plan for location of the HUC6’s, and electronic files accompanying the plan forranking of all watersheds and units.
Common YellowthroatSpecial Designations: none.
Distribution, Status, and Trends: Fairly common in the basin’s lowland wetlands. AlongWillamette Basin BBS routes the species was detected at 9 percent of surveyed points in2003, with a maximum during the period 1968-2003 of 17 percent in 1993. Application ofsimple species-habitat models to aerial imagery suggests 10.2 percent of the basin mightcontain habitat that could be at least marginally suitable and 0.38 percent might contain goodhabitat. The Oregon BBA Project (Adamus et al. 2001) confirmed nesting in 52 percent ofthe large survey units in the basin and found evidence of possible or probable nesting in anadditional 35 percent. BBS data show statistically significant increases in the WillametteValley for both the periods 1968-2003 and 1980-2003, but a decline in western Oregon-Washington generally during these periods.
Key Environmental Correlates: Nests in a wide variety of marsh vegetation types, including reedcanary grass. Especially thrives in marshes with scattered plants that are more robust, forexample, cattail, bulrush, shrubs.
Threats, Limiting Factors, Population Viability: Like other low-nesting marsh birds, this speciesmight be especially vulnerable to feral cats, raccoons, snakes, and all-terrain vehicles. Nestsare destroyed when fields are mowed before mid-July. Pesticides potentially affect theinsects it consumes. As a neotropical migrant, its abundance could be limited by factorsalong its migration route or in its wintering range. Prairie restoration activities that featurecomplete removal of shrubs might adversely affect this common species.
Biological Objectives: Maintain or expand existing numbers and geographic distributionthrough protection, restoration, and management of suitable habitat.
Conservation Needs: Table 3-73 shows the sixth-field HUC units that may contain the mostsuitable habitat for this species. The estimates are from application of simple species-habitatmodels to early 1990s aerial imagery, so they are very approximate. For more information onHUC6 units with suitable habitat for this species, such as units that are publicly owned,privately owned, or identified by the The Nature Conservancy as Priority ConservationAreas, see Appendix D.

DRAFT WILLAMETTE SUBBASIN PLAN
3-196 CH 3 ASSESSMENT.DOC
Table 3-73: HUC6 Units with the Most Suitable Habitat for Common Yellowthroat
HUC6Watershed Name
(Not Comprehensive) Elevation HabAcOK HabAcBest
HabitatSuitability
Score
170900080501 Ash Swale & Deer Cr. 1 7572 259 4.31
170900070101 Baskett Slough NWR 1 5130 171 4.08
170900030402 S. Albany; Tangent. 1 8783 192 4.02
170900030202 Monroe; Muddy Cr. E. 1 16338 624 3.92
170900080402 Salt Cr. 1 3257 125 3.87
Elevation zones (Elev) are:1= <500 ft, 2= 500-1000 ft, 3= 1000-2000 ft; 4= 2000-3000 ft; 5= 3000-4000 ft, 6= >4000 ftHabAcOK is the acres of possible habitat, i.e., scored >5 for habitat suitability on a 0-10 scale.HabAcBest is the acres of habitat scored a “10.”The habitat suitability score is a relative index that represents the proportional extent (not acres) of higher-suitability habitat in the unit defined by the HUC6 and elevation zone; see Appendix D for more explanation,map files accompanying this plan for location of the HUC6’s, and electronic files accompanying the plan forranking of all watersheds and units.
DunlinSpecial Designations: none
Distribution, Status, and Trends: This arctic-nesting shorebird resides in the Willamette Basinfrom autumn to late spring. Largest wintering concentrations (more than 10,000 individuals)are regularly reported from the vicinity of Fern Ridge Reservoir, Halsey, Junction City,Tangent, and in parts of the national wildlife refuges that are managed for shorebirds. Trendsare unmeasured, but widespread loss of wetland prairie over the last century seems likely tohave had a major adverse impact.
Key Environmental Correlates: Flocks of dunlin feed in vernal pools and other seasonal wetlandswith very short grass (<6 inches) or with bare saturated soils. Dunlin generally avoidwetlands bordered by woody vegetation (especially tall trees) unless such wetlands are verylarge. Pools or wet soils that are richest in earthworms, fly larvae, and other soil invertebratesare probably favored. Because invertebrate productivity of wet soil shows enormoustemporal and spatial variability, dunlin flocks frequently wander large portions of thelandscape (over 100 square miles per day) searching for food (Haig et al. 1998). When notfeeding, dunlin flocks roost in bare or short-grass areas relatively free from constant humanactivity, such as gravel islands in rivers, sewage treatment plants, and large agriculturalfields.
Threats, Limiting Factors, Population Viability: Improvements in agricultural drainage probablypose the greatest immediate threat to this species. Other threats include pesticides, invasionof wet prairies by woody shrubs as a result of fire suppression, conversion of favoredroosting sites to other cover types or uses, and harassment of flocks by dogs and humans.Mowing, burning, plowing, and grazing probably benefit this species to some degree.
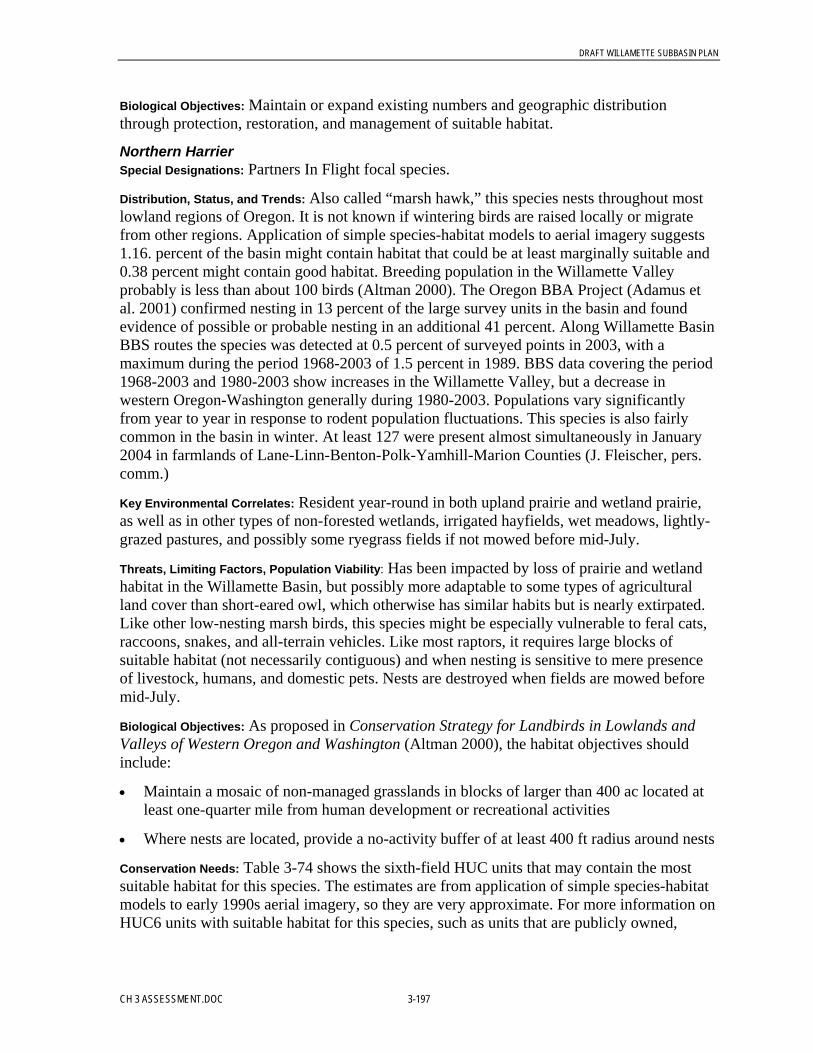
DRAFT WILLAMETTE SUBBASIN PLAN
CH 3 ASSESSMENT.DOC 3-197
Biological Objectives: Maintain or expand existing numbers and geographic distributionthrough protection, restoration, and management of suitable habitat.
Northern HarrierSpecial Designations: Partners In Flight focal species.
Distribution, Status, and Trends: Also called “marsh hawk,” this species nests throughout mostlowland regions of Oregon. It is not known if wintering birds are raised locally or migratefrom other regions. Application of simple species-habitat models to aerial imagery suggests1.16. percent of the basin might contain habitat that could be at least marginally suitable and0.38 percent might contain good habitat. Breeding population in the Willamette Valleyprobably is less than about 100 birds (Altman 2000). The Oregon BBA Project (Adamus etal. 2001) confirmed nesting in 13 percent of the large survey units in the basin and foundevidence of possible or probable nesting in an additional 41 percent. Along Willamette BasinBBS routes the species was detected at 0.5 percent of surveyed points in 2003, with amaximum during the period 1968-2003 of 1.5 percent in 1989. BBS data covering the period1968-2003 and 1980-2003 show increases in the Willamette Valley, but a decrease inwestern Oregon-Washington generally during 1980-2003. Populations vary significantlyfrom year to year in response to rodent population fluctuations. This species is also fairlycommon in the basin in winter. At least 127 were present almost simultaneously in January2004 in farmlands of Lane-Linn-Benton-Polk-Yamhill-Marion Counties (J. Fleischer, pers.comm.)
Key Environmental Correlates: Resident year-round in both upland prairie and wetland prairie,as well as in other types of non-forested wetlands, irrigated hayfields, wet meadows, lightly-grazed pastures, and possibly some ryegrass fields if not mowed before mid-July.
Threats, Limiting Factors, Population Viability: Has been impacted by loss of prairie and wetlandhabitat in the Willamette Basin, but possibly more adaptable to some types of agriculturalland cover than short-eared owl, which otherwise has similar habits but is nearly extirpated.Like other low-nesting marsh birds, this species might be especially vulnerable to feral cats,raccoons, snakes, and all-terrain vehicles. Like most raptors, it requires large blocks ofsuitable habitat (not necessarily contiguous) and when nesting is sensitive to mere presenceof livestock, humans, and domestic pets. Nests are destroyed when fields are mowed beforemid-July.
Biological Objectives: As proposed in Conservation Strategy for Landbirds in Lowlands andValleys of Western Oregon and Washington (Altman 2000), the habitat objectives shouldinclude:
• Maintain a mosaic of non-managed grasslands in blocks of larger than 400 ac located atleast one-quarter mile from human development or recreational activities
• Where nests are located, provide a no-activity buffer of at least 400 ft radius around nests
Conservation Needs: Table 3-74 shows the sixth-field HUC units that may contain the mostsuitable habitat for this species. The estimates are from application of simple species-habitatmodels to early 1990s aerial imagery, so they are very approximate. For more information onHUC6 units with suitable habitat for this species, such as units that are publicly owned,

DRAFT WILLAMETTE SUBBASIN PLAN
3-198 CH 3 ASSESSMENT.DOC
privately owned, or identified by the The Nature Conservancy as Priority ConservationAreas, see Appendix D.
Table 3-74: HUC6 Units with the Most Suitable Habitat for Northern Harrier
HUC6Watershed Name
(Not Comprehensive) Elevation HabAcOK HabAcBest
HabitatSuitability
Score
170900030402 S. Albany; Tangent. 1 1001 602 1.54
170900080501 Ash Swale & Deer Cr. 1 766 447 1.54
170900060101 Crabtree Cr. & Onehorse Slough 1 754 227 1.52
170900070101 Baskett Slough NWR 1 481 265 1.45
170900030203 Coburg; Halsey; Little Muddy R.;Pierce Cr
1 2788 1067 1.41
Elevation zones (Elev) are:1= <500 ft, 2= 500-1000 ft, 3= 1000-2000 ft; 4= 2000-3000 ft; 5= 3000-4000 ft, 6= >4000 ftHabAcOK is the acres of possible habitat, i.e., scored >5 for habitat suitability on a 0-10 scale.HabAcBest is the acres of habitat scored a “10.”The habitat suitability score is a relative index that represents the proportional extent (not acres) of higher-suitability habitat in the unit defined by the HUC6 and elevation zone; see Appendix D for more explanation, mapfiles accompanying this plan for location of the HUC6’s, and electronic files accompanying the plan for ranking ofall watersheds and units.
SoraSpecial Designations: none
Distribution, Status, and Trends: At least historically, this species occurred throughout lowlandsof the Willamette Basin. Due to its secretive nature it is seldom detected on BBS routes solocal trends are unknown. Application of simple species-habitat models to aerial imagerysuggests 0.57 percent of the basin might contain habitat that could be at least marginallysuitable. The Oregon BBA Project (Adamus et al. 2001) confirmed nesting in 7 percent ofthe large survey units in the basin and found evidence of possible or probable nesting in anadditional 31 percent. On BBS routes in the Willamette Basin, soras have seldom beendetected.
Key Environmental Correlates: This species inhabits taller denser marsh vegetation than may betypical of some wetland prairies, but perhaps not as tall as that used by two other secretivemarsh species (American bittern and Virginia rail). Marshes of sedge or cattail, floodedeither seasonally or year-round, are frequently used, as are (occasionally) irrigated hayfields,wet meadows, and lightly-grazed pastures on poorly-drained soils.
Threats, Limiting Factors, Population Viability: This species apparently has not been recordednesting in reed canary grass so the recent proliferation of that invasive throughout the basin’smarshes may be having an effect. Populations may also decline as woody plants invade wetprairies, inasmuch as soras do not tolerate much tree cover. Soras may be more sensitive tomarsh water quality and pesticide drift than some other species due to its consumption of

DRAFT WILLAMETTE SUBBASIN PLAN
CH 3 ASSESSMENT.DOC 3-199
aquatic invertebrates. Also may be more likely to suffer collision mortality due to habit ofmigrating at low elevations at night.
Biological Objectives: Maintain or expand existing numbers and geographic distributionthrough protection, restoration, and management of suitable habitat.
Conservation Needs: Table 3-75 shows the sixth-field HUC units that may contain the mostsuitable habitat for this species. The estimates are from application of simple species-habitatmodels to early 1990s aerial imagery, so they are very approximate. For more information onHUC6 units with suitable habitat for this species, such as units that are publicly owned,privately owned, or identified by the The Nature Conservancy as Priority ConservationAreas, see Appendix D.
Table 3-75: HUC6 Units with the Most Suitable Habitat for Sora
HUC6Watershed Name
(Not Comprehensive) Elev HabAcOK HabAcBest HS
170900090201 S. Canby 1 326 298 0.73
170900060101 Crabtree Cr. & Onehorse Slough 1 311 301 0.70
170900030101 W. Eugene; Junction City 1 1644 1426 0.55
170900030204 E. Eugene; Harrisburg; Springfield 1 639 565 0.49
170900090101 Aurora 1 256 232 0.48
Elevation zones (Elev) are:1= <500 ft, 2= 500-1000 ft, 3= 1000-2000 ft; 4= 2000-3000 ft; 5= 3000-4000 ft, 6= >4000 ftHabAcOK is the acres of possible habitat, i.e., scored >5 for habitat suitability on a 0-10 scale.HabAcBest is the acres of habitat scored a “10.”The habitat suitability score is a relative index that represents the proportional extent (not acres) of higher-suitability habitat in the unit defined by the HUC6 and elevation zone; see Appendix D for more explanation,map files accompanying this plan for location of the HUC6’s, and electronic files accompanying the plan forranking of all watersheds and units.
3.2.5.4 Focal Habitat: Perennial Ponds and Their Riparian AreasDescription. In this report, this focal habitat includes all lentic (non-flowing) areas that areinundated year-round, extending spatially to include basically lentic areas that are inundatedseasonally by other lentic water bodies or by rivers (“sloughs”). This focal type includesnatural ponds, sloughs, lakes, and perennially-inundated marshes as well as regulatedreservoirs, farm ponds, gravel-pit ponds, irrigation ponds, beaver-created ponds, and pondsconstructed for wildlife, fire control, or as visual amenities in developed areas. Vegetation(woody or herbaceous) within one tree-length of the lentic waters at the time of annualmaximum inundation is included. As such, this type includes some of the systems included inTNC’s Ecoregional Assessment “depressional wetland broadleaf forests” and “depressionalwetland shrublands.”
Recognition of Importance. Compared with other focal habitat types featured in this report,ponds and most other lentic waters have not been accorded high priority in other ecologicalassessments of the Willamette Basin. This may be due to their relative abundance, lack of

DRAFT WILLAMETTE SUBBASIN PLAN
3-200 CH 3 ASSESSMENT.DOC
evidence of major decline from historical extent (see below), apparent absence of anyendemic species, and lack of ecological survey effort, for example, of aquatic plants andlentic invertebrates. Nonetheless, ponds and their riparian areas provide a remarkablecontribution to regional biodiversity, as described further below.
Status and Distribution. Defined broadly, the acreage of perennially inundated lentic waterbodies in the Willamette Basin probably has not diminished since presettlement times and ifanything, has increased. Maps of their current distribution (from NHI and other sources) areprobably quite accurate and relatively complete. However, historical maps and accounts ofvegetation almost surely do not adequately depict the distribution of very small sloughs,ponds, and perennial marshes. Rough estimates suggest they may have occupied at least40,000 acres (0.55 percent of the basin) (see Table 3-76).
Table 3-76: Acreage Estimates of Land Cover Types That Include Lentic Habitat
SourceMap Categories that Include Lentic
HabitatsEstimated Area
(Acres)Percent of Mapped
Area
EC1850 “lakes & permanent wetlands” 40,693 0.55
EC90 “lakes, reservoirs, & permanent wetlands” 53,191 0.72
IBIS 1850 “lakes, rivers, and streams” 23,009 0.32
IBIS 1990 “lakes, rivers, and streams” 77,710 1.09
ODFW* “water” 30,728 1.58
*Valley area only.
Past Impacts, Limiting Factors, and Future Threats. Regardless of possible change intotal area of the basin’s lentic waters, the size distribution of these waters has changed. Priorto colonial settlement, very large bodies of lentic perennial water may have been virtuallynonexistent on the valley floor, and existed at higher elevations only as scattered lakes, forexample, Waldo Lake. As more settlers arrived, small perennial sloughs along the WillametteRiver were isolated from the river with berms to improve river navigation. Some weresubsequently drained to provide additional agricultural land (IMST 2002). Moredramatically, new lentic waters were created by damming rivers, for example, Fern RidgeReservoir, Foster Reservoir, Bull Run Reservoir. This may have had the effect of increasingthe mean size and depth of lentic waters in the basin, and decreasing the mean watertemperature within this habitat type. These changes would be expected to have caused shiftsin the composition of wildlife communities that historically used the basin. Species that aremore likely to occur in wooded lowland ponds (for example, hooded merganser, river otter,red-legged frog) than in large reservoirs (or for which only the shoreline of reservoirs countsas suitable habitat) may now have less habitat. In contrast, species that are more likely to uselarge and/or marsh-fringed water bodies than wooded ponds (for example, Canada goose,black tern) may now have more habitat available.
Ponds, lakes, sloughs, and other lentic waters of the Willamette Basin have been ecologicallydegraded to varying degrees. Alien species of fish (especially bass, carp) and wildlife(bullfrog, nutria) intentionally released into lentic waters are believed to be at least partly

DRAFT WILLAMETTE SUBBASIN PLAN
CH 3 ASSESSMENT.DOC 3-201
responsible for decline of some native species (for example, Oregon spotted frog)unaccustomed to new predators or competitors. Some scientists have suggested thatconstruction of perennial ponds for farm use or wetland mitigation, as well as construction oflarge reservoirs, has facilitated the establishment and spread of some harmful non-nativeanimals (Gwin et al. 1999). Many of the basin’s lentic waters have become degraded byinvasive aquatic weeds and abnormal blooms of algae. Although some invasive aquaticplants provide food for waterfowl, they can deprive small lentic water bodies of light andoxygen, thus diminishing or changing communities of bottom-dwelling invertebratesimportant to many birds and amphibians, reducing the diversity of native aquatic plants, andharming larval amphibians.
Pesticides, toxic substances, and excessive loads of sediment from roads, logging,motorboats, and suburban and agricultural lands reach lentic waters and potentially diminishtheir capacity to support wildlife and rare plants. In some cases, changes in physicalcharacteristics of receiving waters (temperature, oxygen, pH) triggered by drought, reservoirdrawdown, or land clearing in adjoining watersheds can mobilize heavy metals and othercontaminants lying latent in sediments, accelerating their bioconcentration in food chains.
Increased frequency and duration of human visits can cause some wildlife species to avoidlentic waters, at least temporarily. Local waterbird populations can be harmed when thisoccurs in smaller bodies of lentic water, and/or during sensitive times (for example, nesting),and/or when it involves chronic visitation and/or highly disturbing activities (for example,use of jet-skis).
Riparian areas associated with lentic waters in the Willamette Basin are being completelycleared in some instances, and degraded by several factors in other instances (IMST 2002).Consequently, the associated lentic waters can be degraded by increased water temperature,excessive sediment, and nutrient runoff. The supply of partly-submerged woody materialimportant to turtles and a few other wildlife inhabitants also has been reduced (IMST 2002).
Contribution of Ponds and Their Riparian Areas to Regional Biodiversity. Whethernatural or man-made, lentic water bodies and their riparian areas support a fauna quite unlikethat found in other habitats. However, introduced animals—such as bullfrogs, bass, carp, andnutria—have increased the direct or indirect loss of native wildlife and especially nativeplants (such as wapato, Sagittaria latifolia) in many lentic waters of the Willamette Basin.
Selected Focal Species in Perennial Ponds and Their Riparian Areas. The followingspecies are proposed as focal species for this habitat type: western pond turtle, Cascades frog,Oregon spotted frog, purple martin, green heron, wood duck, and yellow warbler.
On a scale of 0 to 10, these species’ average degree of association with pond and pondriparian habitat is 8.5. Compare this with HEP “loss assessment” species used in manyprevious mitigation calculations and land acquisitions in the Willamette Basin. Of the“reservoir” species used in HEP applications, the average degree of association with pondand/or pond riparian is 7.8. This suggests there may have been an unintentional butsystematic bias against pond and pond riparian habitat in previous mitigation land dealings inthe Willamette Basin.

DRAFT WILLAMETTE SUBBASIN PLAN
3-202 CH 3 ASSESSMENT.DOC
Western Pond TurtleSpecial Designations: “Critical” (ODFW).
Distribution, Status, and Trends: Most turtle population centers are in lowlands of the central andsouthern parts of the basin. The ORNHIC database contains documented records from 78 ofthe 170 Willamette watersheds, covering over 400 sites. Several biologists have noted therarity of reports of hatchlings and sub-adult turtles in the Willamette Basin in recent years(Holland 1993, Adamus 2003a). This is perhaps only partly due to the difficulties in locatingturtle nests and detecting young. There is growing concern that it may largely reflectdeclining reproductive success and diminished subadult survival. Naturalists in the early1900s reported turtles to be abundant in the region, with hundreds present in some sloughs.At least initially, precipitous declines were a result of habitat loss (near-extirpation of beaverwhich where responsible for creating productive pond habitat), habitat alteration (especiallychannelization of rivers), and intensive commercial collecting. Most current populations areon private lands below about 2000 ft elevation. Public lands that appear to host the mostindividuals are within the Willamette River Greenway, Fern Ridge Reservoir, Fall CreekReservoir, and scattered holdings of the US Bureau of Land Management (Adamus 2003b).
Key Environmental Correlates: Pond turtle habitat is not limited to ponds, but potentiallyincludes nearly all water bodies with stagnant or slow-flowing water, whether seasonal orperennial. Turtles use sloughs and wetlands that contain surface water only seasonally ifperennially inundated areas are nearby. Pools, alcoves, and backwater sloughs along riverssuch as the mainstem Willamette, McKenzie, Calapooia, and Row contain many turtles.Some seasonal movement may occur between habitats, with some turtles (especiallyjuveniles) tending to use warmer, invertebrate-rich vernal pools and shallow wetlands moreoften during spring when river currents are too swift, and then moving to cooler and morepermanent waters of rivers, deep ponds, and reservoirs during late summer. Turtles arefrequently sighted where ponds or rivers are situated near relatively open areas—includingnatural gaps in the forest canopy, agricultural lands, golf courses, sewage treatment facilities,and prairies—especially if these are not far from wooded areas. Turtles lay eggs on land, andapparently the open land provides warmth needed for egg development andthermoregulation. The understory of wooded areas is at least equally important to turtleswhen it provides a thick mat of leaves suitable for hibernation.. Riparian wood, when itenters rivers and ponds, provides important basking sites. Nest and hibernation sites aregenerally within about 100 ft of surface water, but can be over 300 ft away. Within rivers andlarge reservoirs, movements of over 1 mile are common.
Threats, Limiting Factors, Population Viability: Threats to this species include the following in noparticular order: habitat loss and fragmentation, habitat degradation (for example, channeldowncutting, blanketing of floodplains with Himalayan blackberry), roads (collisions withvehicles), water pollution (Henny et al. 2003), predation of juveniles, illegal shooting/collecting, and introduction of exotic turtles (Holland 1994, Adamus 2003b). Increasedresidential or recreational use of an area can imperil turtles because of associated increases inroad traffic, trampling of nest and hibernation sites, introduction of warmwater fish, illegalshooting, accidental take on fish hooks, garbage that attracts predators such as raccoons, andlethal puncturing of turtle carapaces (shells) by curious dogs.
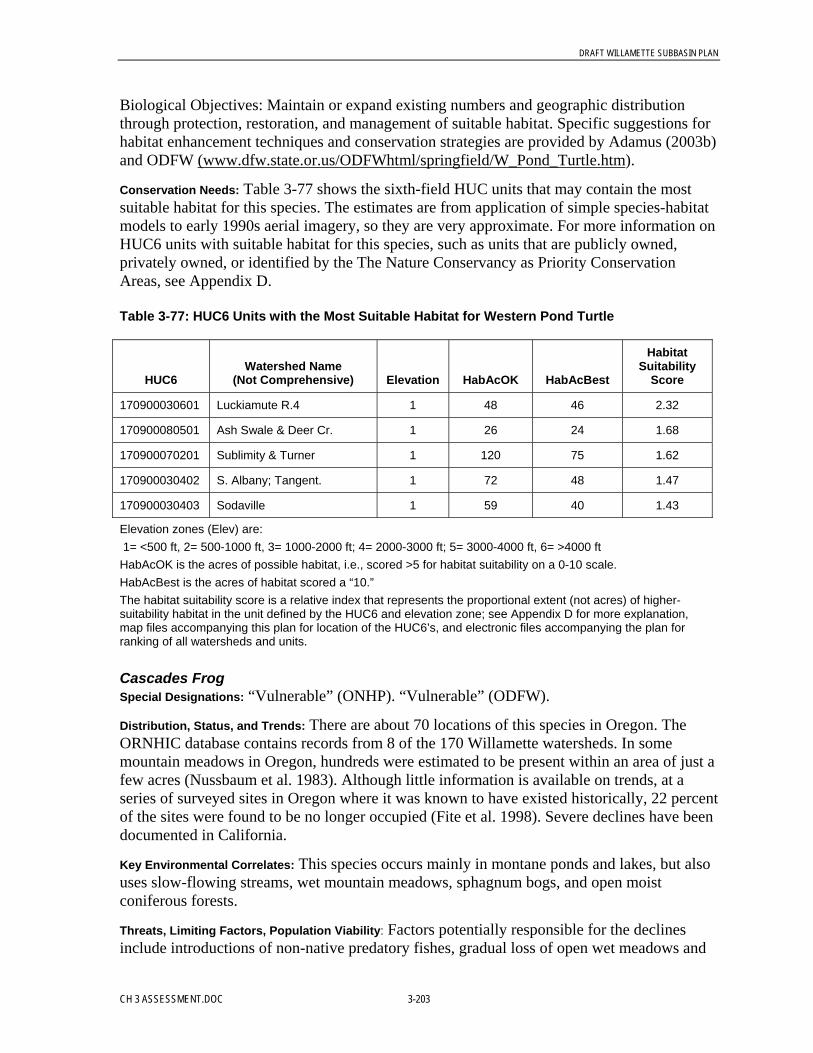
DRAFT WILLAMETTE SUBBASIN PLAN
CH 3 ASSESSMENT.DOC 3-203
Biological Objectives: Maintain or expand existing numbers and geographic distributionthrough protection, restoration, and management of suitable habitat. Specific suggestions forhabitat enhancement techniques and conservation strategies are provided by Adamus (2003b)and ODFW (www.dfw.state.or.us/ODFWhtml/springfield/W_Pond_Turtle.htm).
Conservation Needs: Table 3-77 shows the sixth-field HUC units that may contain the mostsuitable habitat for this species. The estimates are from application of simple species-habitatmodels to early 1990s aerial imagery, so they are very approximate. For more information onHUC6 units with suitable habitat for this species, such as units that are publicly owned,privately owned, or identified by the The Nature Conservancy as Priority ConservationAreas, see Appendix D.
Table 3-77: HUC6 Units with the Most Suitable Habitat for Western Pond Turtle
HUC6Watershed Name
(Not Comprehensive) Elevation HabAcOK HabAcBest
HabitatSuitability
Score
170900030601 Luckiamute R.4 1 48 46 2.32
170900080501 Ash Swale & Deer Cr. 1 26 24 1.68
170900070201 Sublimity & Turner 1 120 75 1.62
170900030402 S. Albany; Tangent. 1 72 48 1.47
170900030403 Sodaville 1 59 40 1.43
Elevation zones (Elev) are: 1= <500 ft, 2= 500-1000 ft, 3= 1000-2000 ft; 4= 2000-3000 ft; 5= 3000-4000 ft, 6= >4000 ftHabAcOK is the acres of possible habitat, i.e., scored >5 for habitat suitability on a 0-10 scale.HabAcBest is the acres of habitat scored a “10.”The habitat suitability score is a relative index that represents the proportional extent (not acres) of higher-suitability habitat in the unit defined by the HUC6 and elevation zone; see Appendix D for more explanation,map files accompanying this plan for location of the HUC6’s, and electronic files accompanying the plan forranking of all watersheds and units.
Cascades FrogSpecial Designations: “Vulnerable” (ONHP). “Vulnerable” (ODFW).
Distribution, Status, and Trends: There are about 70 locations of this species in Oregon. TheORNHIC database contains records from 8 of the 170 Willamette watersheds. In somemountain meadows in Oregon, hundreds were estimated to be present within an area of just afew acres (Nussbaum et al. 1983). Although little information is available on trends, at aseries of surveyed sites in Oregon where it was known to have existed historically, 22 percentof the sites were found to be no longer occupied (Fite et al. 1998). Severe declines have beendocumented in California.
Key Environmental Correlates: This species occurs mainly in montane ponds and lakes, but alsouses slow-flowing streams, wet mountain meadows, sphagnum bogs, and open moistconiferous forests.
Threats, Limiting Factors, Population Viability: Factors potentially responsible for the declinesinclude introductions of non-native predatory fishes, gradual loss of open wet meadows and
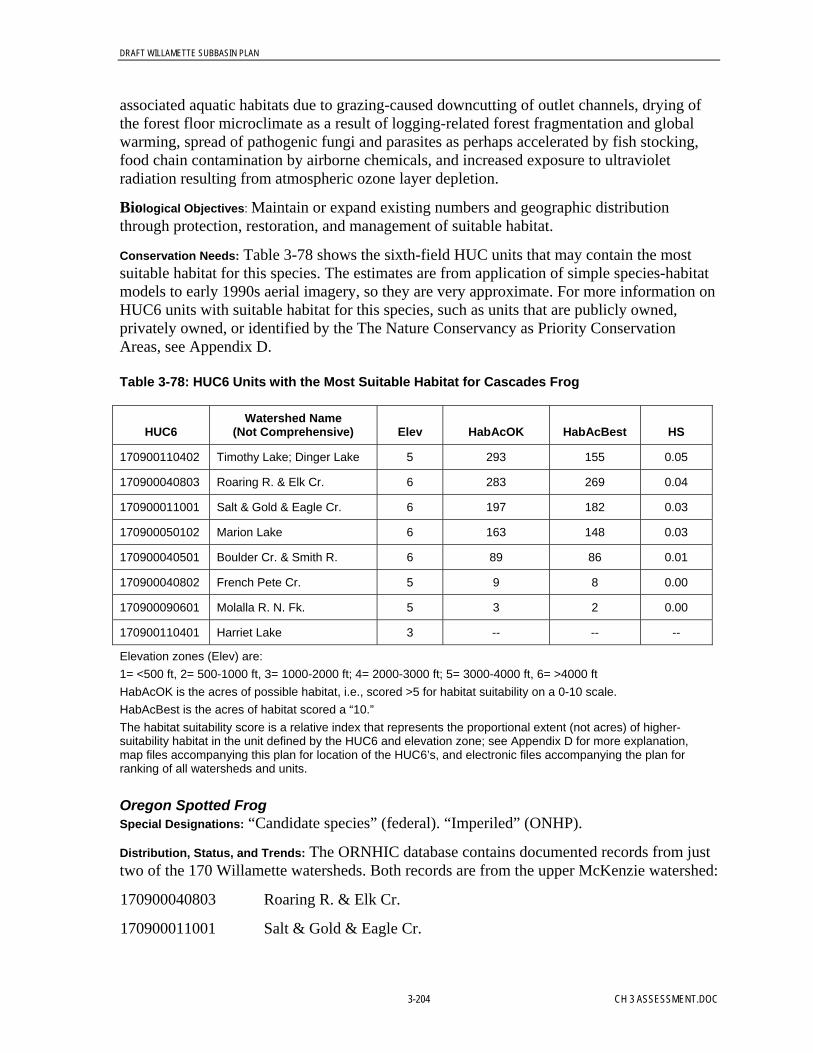
DRAFT WILLAMETTE SUBBASIN PLAN
3-204 CH 3 ASSESSMENT.DOC
associated aquatic habitats due to grazing-caused downcutting of outlet channels, drying ofthe forest floor microclimate as a result of logging-related forest fragmentation and globalwarming, spread of pathogenic fungi and parasites as perhaps accelerated by fish stocking,food chain contamination by airborne chemicals, and increased exposure to ultravioletradiation resulting from atmospheric ozone layer depletion.
Biological Objectives: Maintain or expand existing numbers and geographic distributionthrough protection, restoration, and management of suitable habitat.
Conservation Needs: Table 3-78 shows the sixth-field HUC units that may contain the mostsuitable habitat for this species. The estimates are from application of simple species-habitatmodels to early 1990s aerial imagery, so they are very approximate. For more information onHUC6 units with suitable habitat for this species, such as units that are publicly owned,privately owned, or identified by the The Nature Conservancy as Priority ConservationAreas, see Appendix D.
Table 3-78: HUC6 Units with the Most Suitable Habitat for Cascades Frog
HUC6Watershed Name
(Not Comprehensive) Elev HabAcOK HabAcBest HS
170900110402 Timothy Lake; Dinger Lake 5 293 155 0.05
170900040803 Roaring R. & Elk Cr. 6 283 269 0.04
170900011001 Salt & Gold & Eagle Cr. 6 197 182 0.03
170900050102 Marion Lake 6 163 148 0.03
170900040501 Boulder Cr. & Smith R. 6 89 86 0.01
170900040802 French Pete Cr. 5 9 8 0.00
170900090601 Molalla R. N. Fk. 5 3 2 0.00
170900110401 Harriet Lake 3 -- -- --
Elevation zones (Elev) are:1= <500 ft, 2= 500-1000 ft, 3= 1000-2000 ft; 4= 2000-3000 ft; 5= 3000-4000 ft, 6= >4000 ftHabAcOK is the acres of possible habitat, i.e., scored >5 for habitat suitability on a 0-10 scale.HabAcBest is the acres of habitat scored a “10.”The habitat suitability score is a relative index that represents the proportional extent (not acres) of higher-suitability habitat in the unit defined by the HUC6 and elevation zone; see Appendix D for more explanation,map files accompanying this plan for location of the HUC6’s, and electronic files accompanying the plan forranking of all watersheds and units.
Oregon Spotted FrogSpecial Designations: “Candidate species” (federal). “Imperiled” (ONHP).
Distribution, Status, and Trends: The ORNHIC database contains documented records from justtwo of the 170 Willamette watersheds. Both records are from the upper McKenzie watershed:
170900040803 Roaring R. & Elk Cr.
170900011001 Salt & Gold & Eagle Cr.

DRAFT WILLAMETTE SUBBASIN PLAN
CH 3 ASSESSMENT.DOC 3-205
Drastic declines in distribution and abundance have occurred in much of its range, which islimited to the Pacific Northwest. Apparently it once occupied much of the Willamette Valley,but now is confined to higher elevations.
Key Environmental Correlates: Similar to the Cascades frog, this species occurs along grassyedges of ponds and lakes as well as slow-flowing streams and wet mountain meadows. Athick layer of dead leaves beneath the water surface, in areas shallower than 1 ft, may beimportant.
Threats, Limiting Factors, Population Viability: Similar to Cascades frog, but reasons for its more-dramatic decline are unknown. Nitrate contamination, e.g. from fertilizers, may be at leastpartly responsible inasmuch as tadpoles of this species were found to be 4 times moresensitive to nitrate than was another frog (Pacific tree frog) that has healthy populationsthroughout the basin (Marco et al. 2001, Hatch et al. 2001). Lower-elevation populations areaggressively preyed on by bullfrogs.
Biological Objectives: Maintain or expand existing numbers and geographic distributionthrough protection, restoration, and management of suitable habitat.
Conservation Needs: See above.
Purple MartinSpecial Designations: “Critical” (ODFW sensitive species). “Imperiled” (ONHP). Partners inFlight focal species.
Distribution, Status, and Trends: Formerly common in this region, the martin is now anuncommon to rare and localized colonial nester, occurring mainly at Fern Ridge Reservoirand at scattered locations in the foothills. Statewide, there are about 784 pairs (Horvath1999). The ORNHIC database contains documented records from 13 of the 170 Willamettewatersheds. The Oregon BBA Project (Adamus et al. 2001) confirmed nesting in 28 percentof the large survey units in the basin and found evidence of possible or probable nesting in anadditional 7 percent. Along Willamette Basin BBS routes the species was detected at amaximum of 0.4 percent of surveyed points (1981). BBS data covering the period 1968-2003and 1980-2003 show increases in western Oregon-Washington generally, but there were toofew detections in the Willamette Valley to calculate trends for there.
Key Environmental Correlates: Martins historically nested in cavities of enormous old-growthtrees located near water bodies or other open areas. With widespread reduction of this habitatelement, the species has adapted to nesting in artificial structures (bird houses, hollowgourds, hollow pilings in rivers) erected for its use by humans.
Threats, Limiting Factors, Population Viability: The greatest threats are continued loss of oldgrowth snags of the proper proportions situated in suitable landscapes, and lack ofmaintenance of artificial nesting structures. In addition, the artificial nest sites are sometimesusurped by exotic species (European starling, house sparrow). Like other swallows, martinsare wide-ranging aerial foragers and consequently are vulnerable to collisions with vehiclesand reductions in insect prey as a result of severe weather and contaminants.
Biological Objectives: Maintain or expand existing numbers and geographic distributionthrough protection, restoration, and management of suitable habitat.

DRAFT WILLAMETTE SUBBASIN PLAN
3-206 CH 3 ASSESSMENT.DOC
Conservation Needs: Table 3-79 shows the sixth-field HUC units that may contain the mostsuitable habitat for this species. The estimates are from application of simple species-habitatmodels to early 1990s aerial imagery, so they are very approximate. For more information onHUC6 units with suitable habitat for this species, such as units that are publicly owned,privately owned, or identified by the The Nature Conservancy as Priority ConservationAreas, see Appendix D.
Table 3-79: HUC6 Units with the Most Suitable Habitat for Purple Martin
HUC6Watershed Name
(Not Comprehensive) Elevation Habitat Suitability Score
170900030605 Luckiamute R.3. 3 0.43
170900030607 Little Luckiamute R. -upper 4 0.32
170900030607 Little Luckiamute R. -upper 3 0.30
170900030502 Mary’s R -middle 3 0.19
170900020301 Cottage Grove Reservoir N. 2 0.15
Elevation zones (Elev) are:1= <500 ft, 2= 500-1000 ft, 3= 1000-2000 ft; 4= 2000-3000 ft; 5= 3000-4000 ft, 6= >4000 ftThe habitat suitability score is a relative index that represents the proportional extent (not acres) of higher-suitability habitat in the unit defined by the HUC6 and elevation zone; see Appendix D for more explanation,map files accompanying this plan for location of the HUC6’s, and electronic files accompanying the plan forranking of all watersheds and units.
Green HeronSpecial Designations: none
Distribution, Status, and Trends: This small heron is an uncommon to fairly common breeder atlower elevations in much of the basin. Application of simple species-habitat models to aerialimagery suggests about 1.6 percent of the basin might contain habitat that could be at leastmarginally suitable. The Oregon BBA Project (Adamus et al. 2001) confirmed nesting in24 percent of the large survey units in the basin and found evidence of possible or probablenesting in an additional 35 percent. Along Willamette Basin BBS routes the species wasdetected at 0.7 percent of surveyed points (1986), with none found in 2003. The speciesappears to have increased since the 1920s (Stryker 2003). However, BBS data covering theperiod 1968-2003 and 1980-2003 show decreases in the Willamette Valley.
Key Environmental Correlates: This species is strongly associated with wooded or brushy pondsand channels, especially those that contain water year-round.
Threats, Limiting Factors, Population Viability: A diet comprised mainly of small fish and frogsmay make this species especially vulnerable to bioaccumulation of pesticides. Destruction ofriparian areas by residential development, agricultural and forestry operations also isdetrimental.
Biological Objectives: Maintain or expand existing numbers and geographic distributionthrough protection, restoration, and management of suitable habitat.
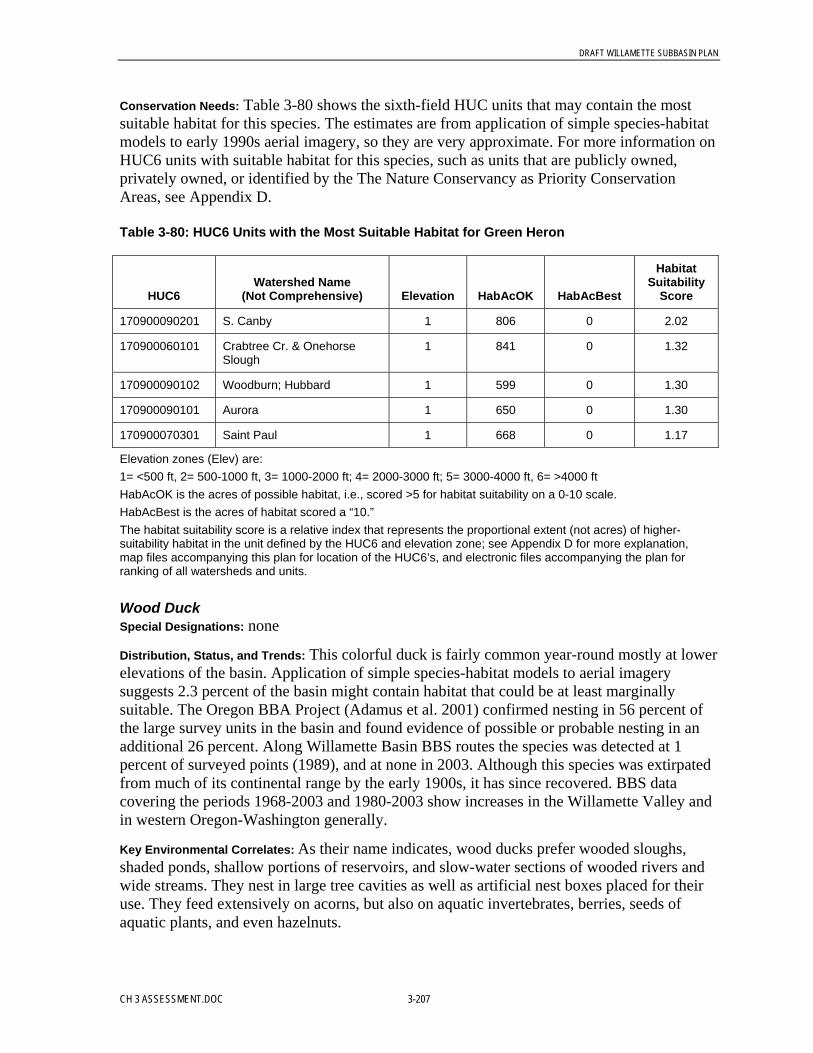
DRAFT WILLAMETTE SUBBASIN PLAN
CH 3 ASSESSMENT.DOC 3-207
Conservation Needs: Table 3-80 shows the sixth-field HUC units that may contain the mostsuitable habitat for this species. The estimates are from application of simple species-habitatmodels to early 1990s aerial imagery, so they are very approximate. For more information onHUC6 units with suitable habitat for this species, such as units that are publicly owned,privately owned, or identified by the The Nature Conservancy as Priority ConservationAreas, see Appendix D.
Table 3-80: HUC6 Units with the Most Suitable Habitat for Green Heron
HUC6Watershed Name
(Not Comprehensive) Elevation HabAcOK HabAcBest
HabitatSuitability
Score
170900090201 S. Canby 1 806 0 2.02
170900060101 Crabtree Cr. & OnehorseSlough
1 841 0 1.32
170900090102 Woodburn; Hubbard 1 599 0 1.30
170900090101 Aurora 1 650 0 1.30
170900070301 Saint Paul 1 668 0 1.17
Elevation zones (Elev) are:1= <500 ft, 2= 500-1000 ft, 3= 1000-2000 ft; 4= 2000-3000 ft; 5= 3000-4000 ft, 6= >4000 ftHabAcOK is the acres of possible habitat, i.e., scored >5 for habitat suitability on a 0-10 scale.HabAcBest is the acres of habitat scored a “10.”The habitat suitability score is a relative index that represents the proportional extent (not acres) of higher-suitability habitat in the unit defined by the HUC6 and elevation zone; see Appendix D for more explanation,map files accompanying this plan for location of the HUC6’s, and electronic files accompanying the plan forranking of all watersheds and units.
Wood DuckSpecial Designations: none
Distribution, Status, and Trends: This colorful duck is fairly common year-round mostly at lowerelevations of the basin. Application of simple species-habitat models to aerial imagerysuggests 2.3 percent of the basin might contain habitat that could be at least marginallysuitable. The Oregon BBA Project (Adamus et al. 2001) confirmed nesting in 56 percent ofthe large survey units in the basin and found evidence of possible or probable nesting in anadditional 26 percent. Along Willamette Basin BBS routes the species was detected at 1percent of surveyed points (1989), and at none in 2003. Although this species was extirpatedfrom much of its continental range by the early 1900s, it has since recovered. BBS datacovering the periods 1968-2003 and 1980-2003 show increases in the Willamette Valley andin western Oregon-Washington generally.
Key Environmental Correlates: As their name indicates, wood ducks prefer wooded sloughs,shaded ponds, shallow portions of reservoirs, and slow-water sections of wooded rivers andwide streams. They nest in large tree cavities as well as artificial nest boxes placed for theiruse. They feed extensively on acorns, but also on aquatic invertebrates, berries, seeds ofaquatic plants, and even hazelnuts.

DRAFT WILLAMETTE SUBBASIN PLAN
3-208 CH 3 ASSESSMENT.DOC
Threats, Limiting Factors, Population Viability: River regulation and floodplain development havediminished their favored feeding habitat—flooded stands of trees—as well as reduced thesustained supply of natural nesting cavities. At some locations water quality may limit theaquatic invertebrates upon which they feed.
Biological Objectives: Maintain or expand existing numbers and geographic distributionthrough protection, restoration, and management of suitable habitat.
Conservation Needs: Table 3-81 shows the sixth-field HUC units that may contain the mostsuitable habitat for this species. The estimates are from application of simple species-habitatmodels to early 1990s aerial imagery, so they are very approximate. For more information onHUC6 units with suitable habitat for this species, such as units that are publicly owned,privately owned, or identified by the The Nature Conservancy as Priority ConservationAreas, see Appendix D.
Table 3-81: HUC6 Units with the Most Suitable Habitat for Wood Duck
HUC6Watershed Name
(Not Comprehensive) Elevation HabAcOK HabAcBest
HabitatSuitability
Score
170900090201 S. Canby 1 806 0 2.02
170900060101 Crabtree Cr. & OnehorseSlough
1 841 0 1.32
170900090102 Woodburn; Hubbard 1 599 0 1.31
170900090101 Aurora 1 650 0 1.30
170900070306 W. Salem 1 502 0 1.17
Elevation zones (Elev) are:1= <500 ft, 2= 500-1000 ft, 3= 1000-2000 ft; 4= 2000-3000 ft; 5= 3000-4000 ft, 6= >4000 ftHabAcOK is the acres of possible habitat, i.e., scored >5 for habitat suitability on a 0-10 scale.HabAcBest is the acres of habitat scored a “10.”The habitat suitability score is a relative index that represents the proportional extent (not acres) of higher-suitability habitat in the unit defined by the HUC6 and elevation zone; see Appendix D for more explanation,map files accompanying this plan for location of the HUC6’s, and electronic files accompanying the plan forranking of all watersheds and units.
Yellow WarblerSpecial Designations: Designated as a focal species by Partners In Flight.
Distribution, Status, and Trends: This species is currently uncommon (to locally fairly common)in the Willamette Basin. Application of simple species-habitat models to aerial imagerysuggests 0.8 percent of the basin might contain marginally-suitable habitat and 0.6 percentmight contain good habitat. The Oregon BBA Project (Adamus et al. 2001) confirmednesting in 19 percent of the large survey units in the basin and found evidence of possible orprobable nesting in an additional 67 percent. Along Willamette Basin BBS routes the specieswas detected at 2.5 percent of surveyed points in 2003, with a maximum during the period1968-2003 of 6.4 percent in 1969. This species may have been the most abundant warbler inthe Willamette Valley up until the mid-1900s, but has since declined dramatically. BBS data

DRAFT WILLAMETTE SUBBASIN PLAN
CH 3 ASSESSMENT.DOC 3-209
covering the period 1968-2003 show a decrease in the Willamette Valley and in westernOregon-Washington generally, with a possible increase in the Willamette during the 1980-2003 period.
Key Environmental Correlates: This neotropical migrant prefers deciduous shrubs or trees withina few dozen feet of standing or flowing water. In western Oregon it occurs mostly in lowlandriparian areas containing willow and/or cottonwood.
Threats, Limiting Factors, Population Viability: Nests of yellow warblers are often parasitized bybrown-headed cowbirds, which occur mostly within a few miles of livestock. Thus,fragmentation of riparian forests is likely to threaten this species the most in such agriculturallandscapes. In contrast, dispersed (patch-like) removal of riparian forest canopy in low-density residential or forested landscapes might be beneficial, especially if a subcanopy layerof native shrubs is encouraged. As insectivores, yellow warblers are particularly vulnerableto pesticides. They also appear to fair poorly in high-density residential areas (Hennings2001), perhaps partly because of heightened predation by feral cats and raccoons associatedwith such development.
Biological Objectives: As proposed in Conservation Strategy for Landbirds in Lowlands andValleys of Western Oregon and Washington (Altman 2000), the habitat objectives shouldinclude:
• Maintain or create at least 70 percent deciduous shrub cover, of which at least 40 percentis beneath a forest canopy
• Maintain or create a mosaic of shrub or wetland patches amid a larger landscape of forestor other land devoid of cattle
The ultimate objective is to expand existing numbers and geographic distribution throughprotection, restoration, and management of suitable habitat.
Conservation Needs: Table 3-82 shows the sixth-field HUC units that may contain the mostsuitable habitat for this species. The estimates are from application of simple species-habitatmodels to early 1990s aerial imagery, so they are very approximate. For more information onHUC6 units with suitable habitat for this species, such as units that are publicly owned,privately owned, or identified by the The Nature Conservancy as Priority ConservationAreas, see Appendix D.
Table 3-82. HUC6 Units with the Most Suitable Habitat for Yellow Warbler
HUC6Watershed Name
(Not Comprehensive) Elevation HabAcOK HabAcBest
HabitatSuitability
Score
170900060101 Crabtree Cr. & Onehorse Slough 1 450 430 1.20
170900090101 Aurora 1 328 308 1.03
170900070301 Saint Paul 1 324 284 0.93
170900090201 S. Canby 1 238 204 0.84
170900030602 Soap Cr. 1 1771 1738 0.74
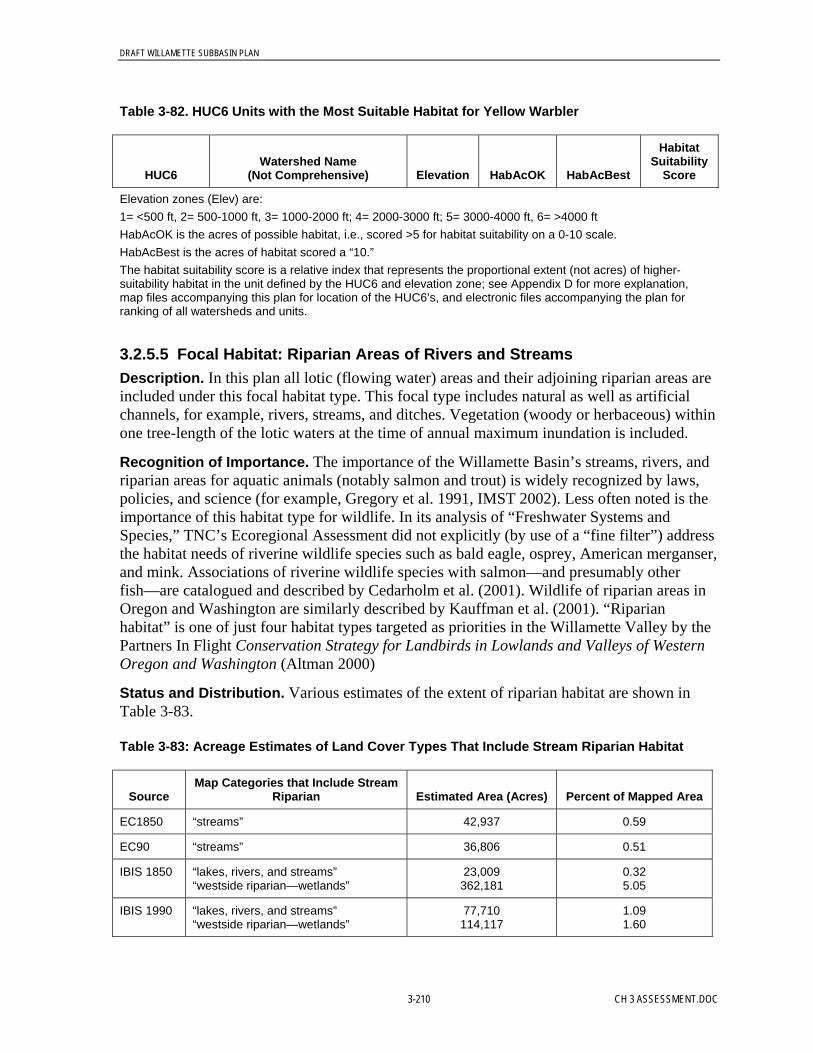
DRAFT WILLAMETTE SUBBASIN PLAN
3-210 CH 3 ASSESSMENT.DOC
Table 3-82. HUC6 Units with the Most Suitable Habitat for Yellow Warbler
HUC6Watershed Name
(Not Comprehensive) Elevation HabAcOK HabAcBest
HabitatSuitability
Score
Elevation zones (Elev) are:1= <500 ft, 2= 500-1000 ft, 3= 1000-2000 ft; 4= 2000-3000 ft; 5= 3000-4000 ft, 6= >4000 ftHabAcOK is the acres of possible habitat, i.e., scored >5 for habitat suitability on a 0-10 scale.HabAcBest is the acres of habitat scored a “10.”The habitat suitability score is a relative index that represents the proportional extent (not acres) of higher-suitability habitat in the unit defined by the HUC6 and elevation zone; see Appendix D for more explanation,map files accompanying this plan for location of the HUC6’s, and electronic files accompanying the plan forranking of all watersheds and units.
3.2.5.5 Focal Habitat: Riparian Areas of Rivers and StreamsDescription. In this plan all lotic (flowing water) areas and their adjoining riparian areas areincluded under this focal habitat type. This focal type includes natural as well as artificialchannels, for example, rivers, streams, and ditches. Vegetation (woody or herbaceous) withinone tree-length of the lotic waters at the time of annual maximum inundation is included.
Recognition of Importance. The importance of the Willamette Basin’s streams, rivers, andriparian areas for aquatic animals (notably salmon and trout) is widely recognized by laws,policies, and science (for example, Gregory et al. 1991, IMST 2002). Less often noted is theimportance of this habitat type for wildlife. In its analysis of “Freshwater Systems andSpecies,” TNC’s Ecoregional Assessment did not explicitly (by use of a “fine filter”) addressthe habitat needs of riverine wildlife species such as bald eagle, osprey, American merganser,and mink. Associations of riverine wildlife species with salmon—and presumably otherfish—are catalogued and described by Cedarholm et al. (2001). Wildlife of riparian areas inOregon and Washington are similarly described by Kauffman et al. (2001). “Riparianhabitat” is one of just four habitat types targeted as priorities in the Willamette Valley by thePartners In Flight Conservation Strategy for Landbirds in Lowlands and Valleys of WesternOregon and Washington (Altman 2000)
Status and Distribution. Various estimates of the extent of riparian habitat are shown inTable 3-83.
Table 3-83: Acreage Estimates of Land Cover Types That Include Stream Riparian Habitat
SourceMap Categories that Include Stream
Riparian Estimated Area (Acres) Percent of Mapped Area
EC1850 “streams” 42,937 0.59
EC90 “streams” 36,806 0.51
IBIS 1850 “lakes, rivers, and streams”“westside riparian—wetlands”
23,009362,181
0.325.05
IBIS 1990 “lakes, rivers, and streams”“westside riparian—wetlands”
77,710114,117
1.091.60

DRAFT WILLAMETTE SUBBASIN PLAN
CH 3 ASSESSMENT.DOC 3-211
Table 3-83: Acreage Estimates of Land Cover Types That Include Stream Riparian Habitat
SourceMap Categories that Include Stream
Riparian Estimated Area (Acres) Percent of Mapped Area
ODFW* “ash-cottonwood-bottomland pasture” 86,559 4.46
*Valley area only.
Past Impacts, Limiting Factors, and Future Threats. As a result of river regulation andland development, major changes in wildlife habitat have occurred within the channels andriparian zones of many of the basin’s rivers and streams. One of the most extreme examplesis the Willamette River itself (see Tables 3-84 and 3-85).
Table 3-84: Changes in Acres of Channel Habitat of the Willamette River,Eugene to Portland.
Year Primary Channel Side Channels Alcoves Islands
1850 35.2 1.6 8.9 54.2
1895 42.8 1.7 9.7 45.7
1932 45.9 1.1 9.5 43.5
1995 55.0 1.9 7.1 36.0
Source: Adapted from Gregory et al. (2002)
Table 3-85: Area of the Willamette Valley Inundated by MajorFloods Since 1860
Year(s) Acres Inundated by Major Floods
1861 & 1890 320,337
1943 & 1945 149,797
1964 152,789
1996 194,533
Source: Adapted from Gregory et al. (2002)
Information on past impacts and future threats to the basin’s riverine systems is provided inthe section of the Willamette Basin plan dealing with aquatic habitat, and in IMST (2002). Inthe basin’s riverine and riparian systems, factors most likely to limit wildlife in particularinclude:
• Decline of fish stocks and their spatial and temporal distribution in some watersheds
• Food chain contamination with agrochemicals and industrial pollutants

DRAFT WILLAMETTE SUBBASIN PLAN
3-212 CH 3 ASSESSMENT.DOC
• Other water quality effects (for example, Excessive sedimentation affecting frog eggs,waterfowl food plants, and riparian plant germination);
• Simplification of channel complexity and consequently riparian vegetation as a result ofriver regulation, altered runoff regimes, and channelization
• Increased disturbance of wildlife and vegetation due to increased frequency and durationof human visits
• Increased cover of invasive plants within riparian areas, largely in response to all of theabove
Potential incompatibilities of listed threatened or endangered species with specific types ofactivities subject to Oregon’s Removal-Fill laws are analyzed in a Division of State Landsreport.
Contribution of Stream Riparian Areas to Regional Biodiversity. No wildlife species arerestricted entirely to streams or stream riparian areas, but several are restricted to aquatichabitats generally, and/or use streams or stream riparian areas predominantly (Kauffman etal. 2001). Hundreds of plant and invertebrate species, none of them listed as threatened orendangered, reside exclusively in flowing water. Many introduced plants and animals—suchas bass, bullfrogs, nutria, and reed canary grass—have increased the direct or indirect loss ofnative wildlife in streams and stream riparian areas.
Selected Focal Species in Stream Riparian Habitat. The following wildlife species areproposed as focal species for this habitat type: American dipper, bald eagle, harlequin duck,red-eyed vireo, willow flycatcher, American beaver, river otter, coastal tailed frog.
On a scale of 0 to 10, these species’ average degree of association with riverine riparian is a4.86. Compare this with HEP “loss assessment” species used in many previous mitigationcalculations and land acquisitions in the Willamette Basin. Of the “riparian” species used inHEP applications, the average degree of association with riverine riparian is only 2.65. Thissuggests there may have been an unintentional but systematic bias against riverine riparian inprevious mitigation land dealings in the Willamette Basin.
American DipperSpecial Designations: none
Distribution, Status, and Trends: Dippers are fairly common year-round residents of streams inforested parts of the Willamette Basin. Along the basin’s BBS routes, dippers were detectedat 0.5 percent of surveyed points in 2003, with a maximum over the period 1968-2003 of 0.8percent (in 1969). The Oregon BBA Project (Adamus et al. 2001) confirmed nesting in 52percent of the 53 survey units in the basin and found evidence of possible or probable nestingin 19 percent. BBS data covering the period 1968-2003 show a decrease in western Oregon-Washington generally, but a possible increase during 1980-2003. It can be hypothesized thatdippers were once present (perhaps even common) along the Willamette River and are nowabsent there due to water pollution, river regulation, and accompanying reduction in gravelbars and downed wood. However, historical data are insufficient to determine this.
Key Environmental Correlates: Dippers occur mostly in larger streams (third order and greater)with noticeable current and exposed boulders, partly submerged logs, and/or gravel bars.
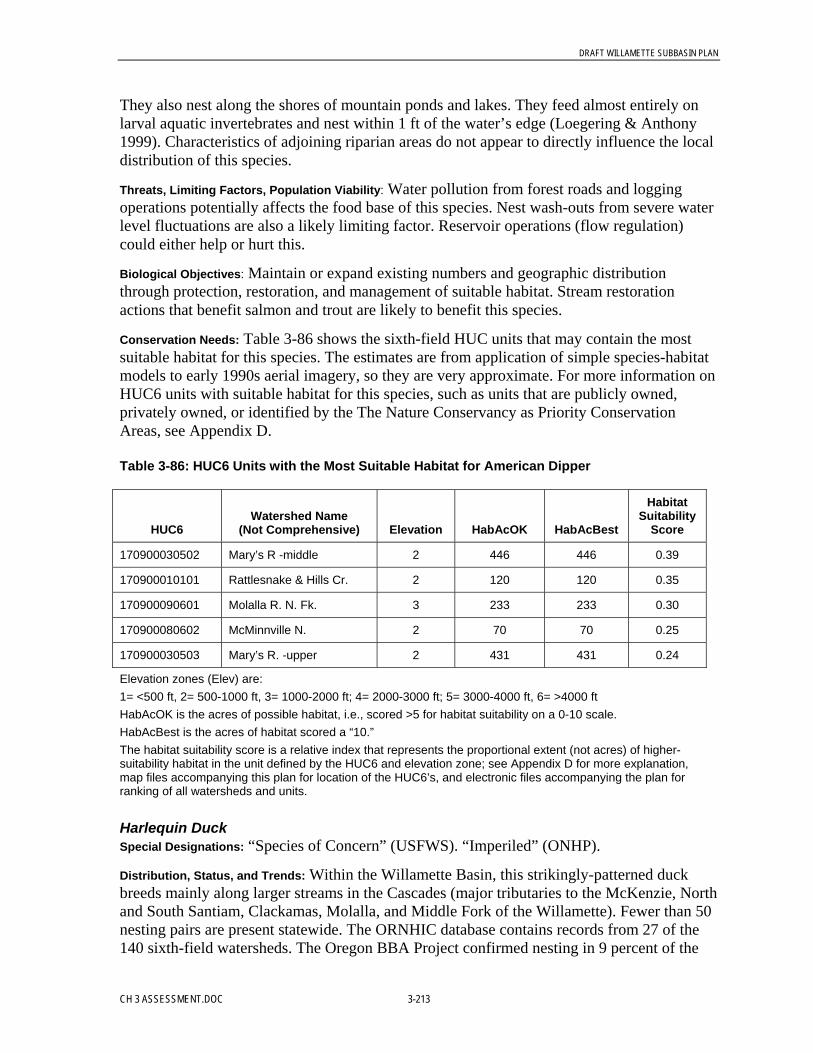
DRAFT WILLAMETTE SUBBASIN PLAN
CH 3 ASSESSMENT.DOC 3-213
They also nest along the shores of mountain ponds and lakes. They feed almost entirely onlarval aquatic invertebrates and nest within 1 ft of the water’s edge (Loegering & Anthony1999). Characteristics of adjoining riparian areas do not appear to directly influence the localdistribution of this species.
Threats, Limiting Factors, Population Viability: Water pollution from forest roads and loggingoperations potentially affects the food base of this species. Nest wash-outs from severe waterlevel fluctuations are also a likely limiting factor. Reservoir operations (flow regulation)could either help or hurt this.
Biological Objectives: Maintain or expand existing numbers and geographic distributionthrough protection, restoration, and management of suitable habitat. Stream restorationactions that benefit salmon and trout are likely to benefit this species.
Conservation Needs: Table 3-86 shows the sixth-field HUC units that may contain the mostsuitable habitat for this species. The estimates are from application of simple species-habitatmodels to early 1990s aerial imagery, so they are very approximate. For more information onHUC6 units with suitable habitat for this species, such as units that are publicly owned,privately owned, or identified by the The Nature Conservancy as Priority ConservationAreas, see Appendix D.
Table 3-86: HUC6 Units with the Most Suitable Habitat for American Dipper
HUC6Watershed Name
(Not Comprehensive) Elevation HabAcOK HabAcBest
HabitatSuitability
Score
170900030502 Mary’s R -middle 2 446 446 0.39
170900010101 Rattlesnake & Hills Cr. 2 120 120 0.35
170900090601 Molalla R. N. Fk. 3 233 233 0.30
170900080602 McMinnville N. 2 70 70 0.25
170900030503 Mary’s R. -upper 2 431 431 0.24
Elevation zones (Elev) are:1= <500 ft, 2= 500-1000 ft, 3= 1000-2000 ft; 4= 2000-3000 ft; 5= 3000-4000 ft, 6= >4000 ftHabAcOK is the acres of possible habitat, i.e., scored >5 for habitat suitability on a 0-10 scale.HabAcBest is the acres of habitat scored a “10.”The habitat suitability score is a relative index that represents the proportional extent (not acres) of higher-suitability habitat in the unit defined by the HUC6 and elevation zone; see Appendix D for more explanation,map files accompanying this plan for location of the HUC6’s, and electronic files accompanying the plan forranking of all watersheds and units.
Harlequin DuckSpecial Designations: “Species of Concern” (USFWS). “Imperiled” (ONHP).
Distribution, Status, and Trends: Within the Willamette Basin, this strikingly-patterned duckbreeds mainly along larger streams in the Cascades (major tributaries to the McKenzie, Northand South Santiam, Clackamas, Molalla, and Middle Fork of the Willamette). Fewer than 50nesting pairs are present statewide. The ORNHIC database contains records from 27 of the140 sixth-field watersheds. The Oregon BBA Project confirmed nesting in 9 percent of the
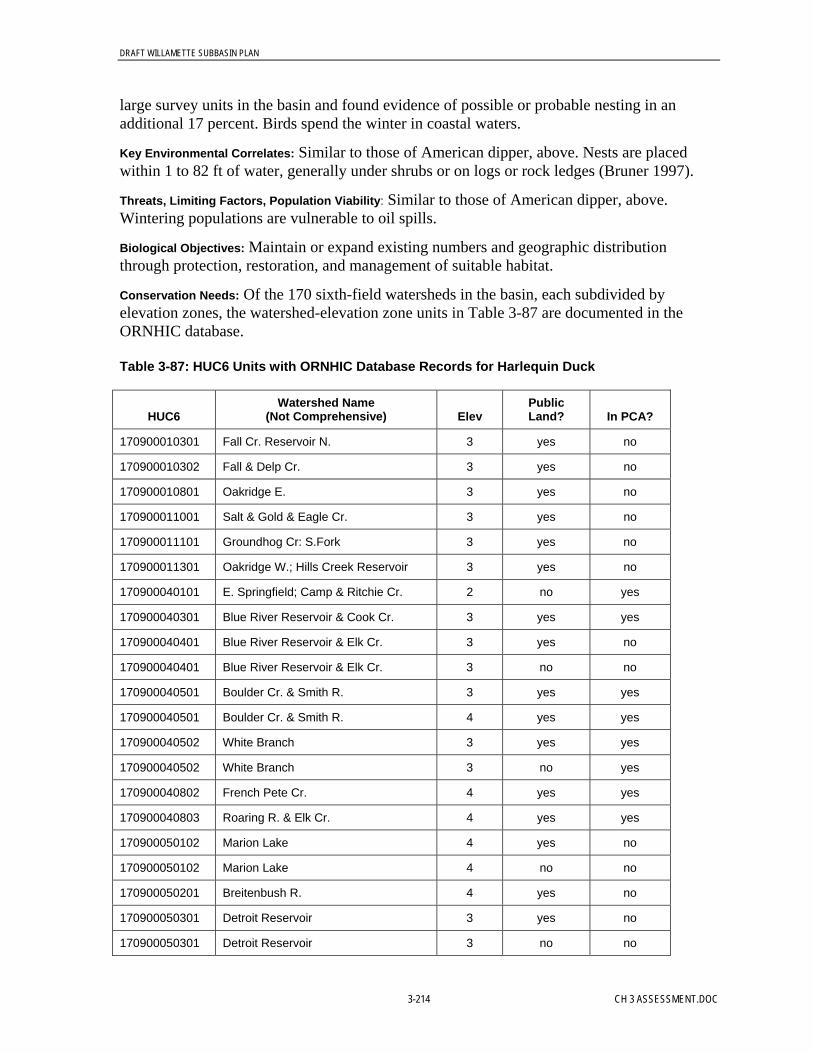
DRAFT WILLAMETTE SUBBASIN PLAN
3-214 CH 3 ASSESSMENT.DOC
large survey units in the basin and found evidence of possible or probable nesting in anadditional 17 percent. Birds spend the winter in coastal waters.
Key Environmental Correlates: Similar to those of American dipper, above. Nests are placedwithin 1 to 82 ft of water, generally under shrubs or on logs or rock ledges (Bruner 1997).
Threats, Limiting Factors, Population Viability: Similar to those of American dipper, above.Wintering populations are vulnerable to oil spills.
Biological Objectives: Maintain or expand existing numbers and geographic distributionthrough protection, restoration, and management of suitable habitat.
Conservation Needs: Of the 170 sixth-field watersheds in the basin, each subdivided byelevation zones, the watershed-elevation zone units in Table 3-87 are documented in theORNHIC database.
Table 3-87: HUC6 Units with ORNHIC Database Records for Harlequin Duck
HUC6Watershed Name
(Not Comprehensive) ElevPublicLand? In PCA?
170900010301 Fall Cr. Reservoir N. 3 yes no
170900010302 Fall & Delp Cr. 3 yes no
170900010801 Oakridge E. 3 yes no
170900011001 Salt & Gold & Eagle Cr. 3 yes no
170900011101 Groundhog Cr: S.Fork 3 yes no
170900011301 Oakridge W.; Hills Creek Reservoir 3 yes no
170900040101 E. Springfield; Camp & Ritchie Cr. 2 no yes
170900040301 Blue River Reservoir & Cook Cr. 3 yes yes
170900040401 Blue River Reservoir & Elk Cr. 3 yes no
170900040401 Blue River Reservoir & Elk Cr. 3 no no
170900040501 Boulder Cr. & Smith R. 3 yes yes
170900040501 Boulder Cr. & Smith R. 4 yes yes
170900040502 White Branch 3 yes yes
170900040502 White Branch 3 no yes
170900040802 French Pete Cr. 4 yes yes
170900040803 Roaring R. & Elk Cr. 4 yes yes
170900050102 Marion Lake 4 yes no
170900050102 Marion Lake 4 no no
170900050201 Breitenbush R. 4 yes no
170900050301 Detroit Reservoir 3 yes no
170900050301 Detroit Reservoir 3 no no
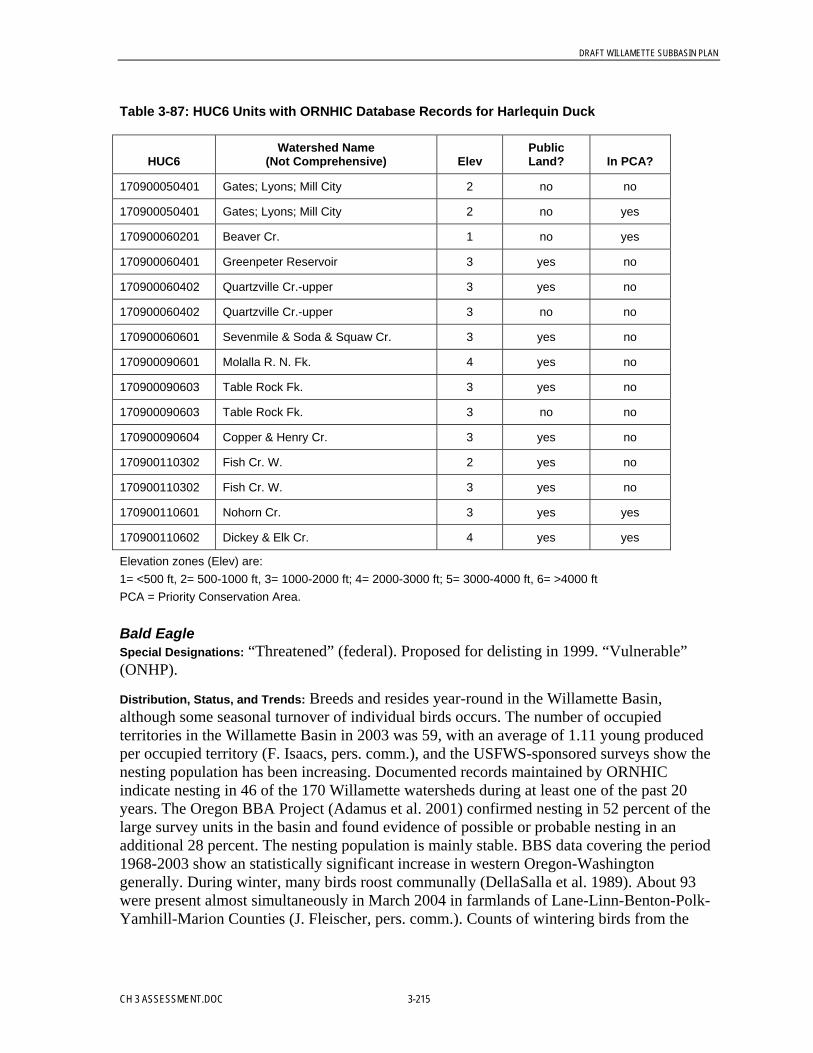
DRAFT WILLAMETTE SUBBASIN PLAN
CH 3 ASSESSMENT.DOC 3-215
Table 3-87: HUC6 Units with ORNHIC Database Records for Harlequin Duck
HUC6Watershed Name
(Not Comprehensive) ElevPublicLand? In PCA?
170900050401 Gates; Lyons; Mill City 2 no no
170900050401 Gates; Lyons; Mill City 2 no yes
170900060201 Beaver Cr. 1 no yes
170900060401 Greenpeter Reservoir 3 yes no
170900060402 Quartzville Cr.-upper 3 yes no
170900060402 Quartzville Cr.-upper 3 no no
170900060601 Sevenmile & Soda & Squaw Cr. 3 yes no
170900090601 Molalla R. N. Fk. 4 yes no
170900090603 Table Rock Fk. 3 yes no
170900090603 Table Rock Fk. 3 no no
170900090604 Copper & Henry Cr. 3 yes no
170900110302 Fish Cr. W. 2 yes no
170900110302 Fish Cr. W. 3 yes no
170900110601 Nohorn Cr. 3 yes yes
170900110602 Dickey & Elk Cr. 4 yes yes
Elevation zones (Elev) are:1= <500 ft, 2= 500-1000 ft, 3= 1000-2000 ft; 4= 2000-3000 ft; 5= 3000-4000 ft, 6= >4000 ftPCA = Priority Conservation Area.
Bald EagleSpecial Designations: “Threatened” (federal). Proposed for delisting in 1999. “Vulnerable”(ONHP).
Distribution, Status, and Trends: Breeds and resides year-round in the Willamette Basin,although some seasonal turnover of individual birds occurs. The number of occupiedterritories in the Willamette Basin in 2003 was 59, with an average of 1.11 young producedper occupied territory (F. Isaacs, pers. comm.), and the USFWS-sponsored surveys show thenesting population has been increasing. Documented records maintained by ORNHICindicate nesting in 46 of the 170 Willamette watersheds during at least one of the past 20years. The Oregon BBA Project (Adamus et al. 2001) confirmed nesting in 52 percent of thelarge survey units in the basin and found evidence of possible or probable nesting in anadditional 28 percent. The nesting population is mainly stable. BBS data covering the period1968-2003 show an statistically significant increase in western Oregon-Washingtongenerally. During winter, many birds roost communally (DellaSalla et al. 1989). About 93were present almost simultaneously in March 2004 in farmlands of Lane-Linn-Benton-Polk-Yamhill-Marion Counties (J. Fleischer, pers. comm.). Counts of wintering birds from the

DRAFT WILLAMETTE SUBBASIN PLAN
3-216 CH 3 ASSESSMENT.DOC
USFWS mid-winter survey are depicted in Table 3-88. The wintering population is stable orincreasing.
Table 3-88: Mean and Maximum (Among-Year) Counts of Bald Eagles from USFWS Mid-Winter Survey Routes in the Willamette Basin, 1988-2000
Survey Area Mean Maximum
Mean Ratio ofImmatures to
AdultsMaximum Ratio of
Immatures to Adults
Fern Ridge Reservoir 1.67 4 0.44 3.00
Lookout Point Reservoir 1.92 7 0.19 1.00
Muddy Creek (Cabell Marsh) 2.38 6 0.78 5.00
Muddy Creek (McFadden Marsh) 1.69 5 0.69 4.00
North Santiam River (Reservoirs) 1.00 4 0.25 1.00
South Santiam River (Reservoirs) 5.09 8 0.17 0.60
Odell Lake 7.50 21 0.51 2.00
Upper Middle Fork Willamette 3.62 6 0.40 1.00
Willamette River (Calapooya R. 1) 14.09 31 1.29 6.00
Willamette River (Calapooya R. 2) 12.00 21 1.65 3.20
Willamette River (Calapooya R. 3) 6.60 21 0.63 2.67
Key Environmental Correlates: Mostly associated with forested rivers and lakes, but during somemonths occurs extensively in open areas with livestock. Nests mainly in large Douglas-fir(mean diameter = 42 inches, Anthony et al. 1982) or cottonwood, either live or dead. Homerange during breeding encompasses 1-10 square miles, and is manyfold larger in winter.During summer, Oregon eagles feed mainly on fish (live or dead), then augment this in atother seasons with waterfowl and sheep (carrion and afterbirth). Very sensitive to humandisturbance at all seasons, but some individuals adapt somewhat, for example, JacksonBottom eagle nest near urban Hillsboro. The increased nesting success and populationincrease in recent years can be attributed largely to reduction of some persistent contaminants(DDT) and to increased protection of nest and roosting sites from harvesting and humanvisitation (Isaacs and Anthony 2001).
Threats, Limiting Factors, Population Viability: Illegal killing of eagles continues, as evidenced byrecent discovery of 17 intentionally poisoned eagles in the Willamette Valley. Long termsurvival of the Willamette eagle population depends on managing forests so they are capableof providing a continuous supply of large-diameter open-branched trees near water, and onimproving water quality.
Biological Objectives: See the species Recovery Plan (USFWS 1986).

DRAFT WILLAMETTE SUBBASIN PLAN
CH 3 ASSESSMENT.DOC 3-217
Conservation Needs: Of the 170 sixth-field watersheds in the basin, each subdivided byelevation zones, the watershed-elevation zone units in Table 3-89 contain records of thisspecies in the ORNHIC database.
Table 3-89: HUC6 Units with ORNHIC Database Records for Bald Eagle
HUC6Watershed Name
(Not Comprehensive) ElevPublicLand?
InPCA?
170900010101 Rattlesnake & Hills Cr. 2 no yes
170900010401 Fall Cr. Reservoir S.; Winberry Cr. 4 yes no
170900010501 Dexter Reservoir 2 no yes
170900010501 Dexter Reservoir 3 no no
170900010502 Hemlock; Lookout Point Reservoir 3 yes no
170900010901 Waldo Lake; Cayuse & Fisher Cr. 6 yes yes
170900011001 Salt & Gold & Eagle Cr. 6 yes no
170900011101 Groundhog Cr: S.Fork 4 yes no
170900011301 Oakridge W.; Hills Creek Reservoir 3 yes no
170900020101 Creswell E. Bear & Gettings Cr. 1 no yes
170900020101 Creswell E. Bear & Gettings Cr. 2 yes yes
170900020301 Cottage Grove Reservoir N. 3 no yes
170900020401 Dorena Reservoir 3 yes no
170900020401 Dorena Reservoir 4 yes no
170900030102 Veneta; Poodle & Swamp Cr.; Fern Ridge Res 1 yes yes
170900030102 Veneta; Poodle & Swamp Cr.; Fern Ridge Res 3 yes yes
170900030201 Corvallis N.; Adair Village 1 no yes
170900030202 Monroe; Muddy Cr. E. 1 no yes
170900030203 Coburg; Halsey; Little Muddy R.; Pierce Cr 3 no yes
170900030204 E. Eugene; Harrisburg; Springfield 1 no yes
170900030301 Courtney Cr.. 2 no yes
170900030302 Brownsville 3 no no
170900030302 Brownsville 3 no yes
170900030501 Corvallis; Philomath; Mary’s R.-lower 2 yes yes
170900030504 Finley NWR; Muddy & Hammer Cr. 1 yes yes
170900040101 E. Springfield; Camp & Ritchie Cr. 3 yes yes
170900040401 Blue River Reservoir & Elk Cr. 3 yes no
170900040501 Boulder Cr. & Smith R. 5 yes yes

DRAFT WILLAMETTE SUBBASIN PLAN
3-218 CH 3 ASSESSMENT.DOC
Table 3-89: HUC6 Units with ORNHIC Database Records for Bald Eagle
HUC6Watershed Name
(Not Comprehensive) ElevPublicLand?
InPCA?
170900040501 Boulder Cr. & Smith R. 6 yes yes
170900050102 Marion Lake 6 yes no
170900050301 Detroit Reservoir 4 no no
170900050601 Jefferson; Lyons; Bear Branch 1 no no
170900050601 Jefferson; Lyons; Bear Branch 1 no yes
170900060101 Crabtree Cr. & Onehorse Slough 1 no yes
170900060102 E. Lebanon; Hamilton Cr. 1 no no
170900060103 Waterloo; Sweet Home; McDowell Cr. 2 no no
170900060401 Greenpeter Reservoir 3 yes no
170900060401 Greenpeter Reservoir 3 no no
170900060701 Sweet Home; Foster Reservoir 2 no no
170900070102 Independence; Monmouth 1 no no
170900070103 Ankeny NWR 1 no yes
170900070302 Dundee; Newberg 1 no no
170900070302 Dundee; Newberg 1 no yes
170900070304 Lincoln 1 no yes
170900070305 Keizer; Spring Valley Cr. 1 no yes
170900070307 Salem 1 no no
170900090101 Aurora 1 yes yes
170900100101 Tigard; Tualatin; Sherwood; King City 1 no yes
170900100102 Hillsboro 1 no yes
170900100202 Diary Cr. E. 2 yes yes
170900100301 Gales & Clear Cr. 1 no yes
170900100302 Sain & Scoggins Cr. 2 no no
170900110101 Estacada; E. Gladstone 1 no yes
170900120201 Portland; Forest Hills; Multnomah Channel 1 no yes
170900120202 S. Milwaukie; Happy Valley; Lake Oswego; W 1 no no
Elevation zones (Elev) are:1= <500 ft, 2= 500-1000 ft, 3= 1000-2000 ft; 4= 2000-3000 ft; 5= 3000-4000 ft, 6= >4000 ftPCA = Priority Conservation Area.
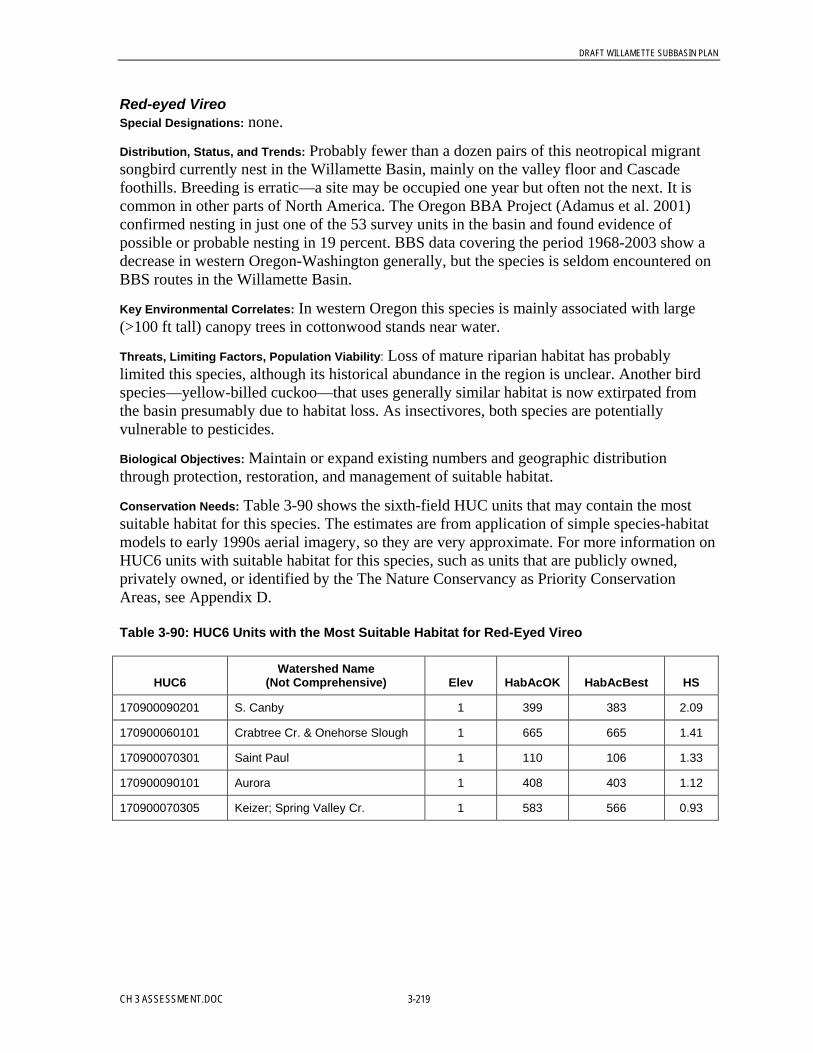
DRAFT WILLAMETTE SUBBASIN PLAN
CH 3 ASSESSMENT.DOC 3-219
Red-eyed VireoSpecial Designations: none.
Distribution, Status, and Trends: Probably fewer than a dozen pairs of this neotropical migrantsongbird currently nest in the Willamette Basin, mainly on the valley floor and Cascadefoothills. Breeding is erratic—a site may be occupied one year but often not the next. It iscommon in other parts of North America. The Oregon BBA Project (Adamus et al. 2001)confirmed nesting in just one of the 53 survey units in the basin and found evidence ofpossible or probable nesting in 19 percent. BBS data covering the period 1968-2003 show adecrease in western Oregon-Washington generally, but the species is seldom encountered onBBS routes in the Willamette Basin.
Key Environmental Correlates: In western Oregon this species is mainly associated with large(>100 ft tall) canopy trees in cottonwood stands near water.
Threats, Limiting Factors, Population Viability: Loss of mature riparian habitat has probablylimited this species, although its historical abundance in the region is unclear. Another birdspecies—yellow-billed cuckoo—that uses generally similar habitat is now extirpated fromthe basin presumably due to habitat loss. As insectivores, both species are potentiallyvulnerable to pesticides.
Biological Objectives: Maintain or expand existing numbers and geographic distributionthrough protection, restoration, and management of suitable habitat.
Conservation Needs: Table 3-90 shows the sixth-field HUC units that may contain the mostsuitable habitat for this species. The estimates are from application of simple species-habitatmodels to early 1990s aerial imagery, so they are very approximate. For more information onHUC6 units with suitable habitat for this species, such as units that are publicly owned,privately owned, or identified by the The Nature Conservancy as Priority ConservationAreas, see Appendix D.
Table 3-90: HUC6 Units with the Most Suitable Habitat for Red-Eyed Vireo
HUC6Watershed Name
(Not Comprehensive) Elev HabAcOK HabAcBest HS
170900090201 S. Canby 1 399 383 2.09
170900060101 Crabtree Cr. & Onehorse Slough 1 665 665 1.41
170900070301 Saint Paul 1 110 106 1.33
170900090101 Aurora 1 408 403 1.12
170900070305 Keizer; Spring Valley Cr. 1 583 566 0.93
DRAFT WILLAMETTE SUBBASIN PLAN
3-220 CH 3 ASSESSMENT.DOC
Table 3-90: HUC6 Units with the Most Suitable Habitat for Red-Eyed Vireo
HUC6Watershed Name
(Not Comprehensive) Elev HabAcOK HabAcBest HS
Elevation zones (Elev) are:1= <500 ft, 2= 500-1000 ft, 3= 1000-2000 ft; 4= 2000-3000 ft; 5= 3000-4000 ft, 6= >4000 ftHabAcOK is the acres of possible habitat, i.e., scored >5 for habitat suitability on a 0-10 scale.HabAcBest is the acres of habitat scored a “10.”The habitat suitability score is a relative index that represents the proportional extent (not acres) of higher-suitability habitat in the unit defined by the HUC6 and elevation zone; see Appendix D for more explanation,map files accompanying this plan for location of the HUC6’s, and electronic files accompanying the plan forranking of all watersheds and units.
Willow FlycatcherSpecial Designations: “Vulnerable” (ODFW sensitive species). Partners In Flight focal species.
Distribution, Status, and Trends: As its name implies, this uncommon migratory songbird isassociated with willows and similar deciduous shrubs. Along Willamette Basin BBS routesthe species was detected at 6.8 percent of surveyed points in 2003, with a maximum duringthe period 1968-2003 of 22.4 percent in 1970. Application of simple species-habitat modelsto aerial imagery suggests 11 percent of the basin might contain habitat that could be at leastmarginally suitable and 0.6 percent might contain good habitat. The Oregon BBA Projectconfirmed nesting in 41 percent of the large survey units in the basin and found evidence ofpossible or probable nesting in an additional 54 percent.. Historical accounts suggest it wasonce much more abundant in the basin. BBS data covering the periods 1968-2003 and 1980-2003 show a decrease both in the Willamette Valley and in western Oregon-Washingtongenerally. Declines have been most noticeable on the valley floor.
Key Environmental Correlates: In addition to using riparian alder, willow, and vine maple, thisspecies regularly uses clearcuts (4 to 15 years post-harvest); patches of scotch broom,hawthorn, trailing blackberry, and bracken fern; and Himalayan blackberry. It tends to prefershrubs in the open rather than ones beneath an extensive forest canopy, and fragmenting oflarge shrub stands with paths may benefit the species. One local study found no difference innest success in native vs. non-native shrubs (Altman 2003). Mean nest height was 3.9 ft. Thisspecies is not typically found in higher-density residential areas.
Threats, Limiting Factors, Population Viability: Loss of riparian habitat as a result of agriculture,forest practices, and urban development is possibly the greatest threat. Regulation of theWillamette River has probably diminished the extent of riverine willow habitat as well. Thespecies’ flycatching behavior may put it at higher risk around roads with heavy traffic.Pesticides and other contaminants potentially diminish its insect foods. Nests are sometimesparasitized by cowbirds. Pesticides can diminish the primary foods of this species. Territorysize averages 1.1 ac at lower elevations and 0.6 ac at higher elevations.
Biological Objectives: As proposed in Conservation Strategy for Landbirds in Lowlands andValleys of Western Oregon and Washington (Altman 2000), habitat objectives should includethe following:

DRAFT WILLAMETTE SUBBASIN PLAN
CH 3 ASSESSMENT.DOC 3-221
• Maintain or provide a patchy deciduous shrub layer with several scattered herbaceousopenings (i.e., 30-80 percent shrub cover)
• Do not allow tree canopy cover to exceed 20 percent
• Provide the above at a distance of no less than 0.6 mi from residential areas and not lessthan 3 miles from areas with livestock (due to cowbird threat)
And the following population objective:
• Reverse declining BBS trends to achieve stable populations ( trends of <2 percent/year)or increasing trends by 2020.
Conservation Needs: Table 3-91 shows the sixth-field HUC units that may contain the mostsuitable habitat for this species. The estimates are from application of simple species-habitatmodels to early 1990s aerial imagery, so they are very approximate. For more information onHUC6 units with suitable habitat for this species, such as units that are publicly owned,privately owned, or identified by the The Nature Conservancy as Priority ConservationAreas, see Appendix D.
Table 3-91. HUC6 Units with the Most Suitable Habitat for Willow Flycatcher
HUC6Watershed Name
(Not Comprehensive) Elevation HabAcOK HabAcBest
HabitatSuitability
Score
170900070301 Saint Paul 1 1832 326 1.45
170900010302 Fall & Delp Cr. 4 2630 0 1.45
170900011101 Groundhog Cr: S.Fork 5 2809 0 1.41
170900090101 Aurora 1 1697 325 1.32
170900060501 Pyramid Cr. & Quartzville Cr.-lower
5 8743 0 1.31
Elevation zones (Elev) are:1= <500 ft, 2= 500-1000 ft, 3= 1000-2000 ft; 4= 2000-3000 ft; 5= 3000-4000 ft, 6= >4000 ftHabAcOK is the acres of possible habitat, i.e., scored >5 for habitat suitability on a 0-10 scale.HabAcBest is the acres of habitat scored a “10.”The habitat suitability score is a relative index that represents the proportional extent (not acres) of higher-suitability habitat in the unit defined by the HUC6 and elevation zone; see Appendix D for more explanation,map files accompanying this plan for location of the HUC6’s, and electronic files accompanying the plan forranking of all watersheds and units.
Coastal Tailed FrogSpecial Designations: “Vulnerable” (ODFW sensitive species). “Imperiled” (ONHP).
Distribution, Status, and Trends: Occurs at all elevations where habitat is suitable. The ORNHICdatabase contains records from 15 of the 170 Willamette watersheds.
Key Environmental Correlates: Occurs in cold streams with moderate to high gradients in moistforests, usually in forests with a full canopy and scattered logs within the channel.
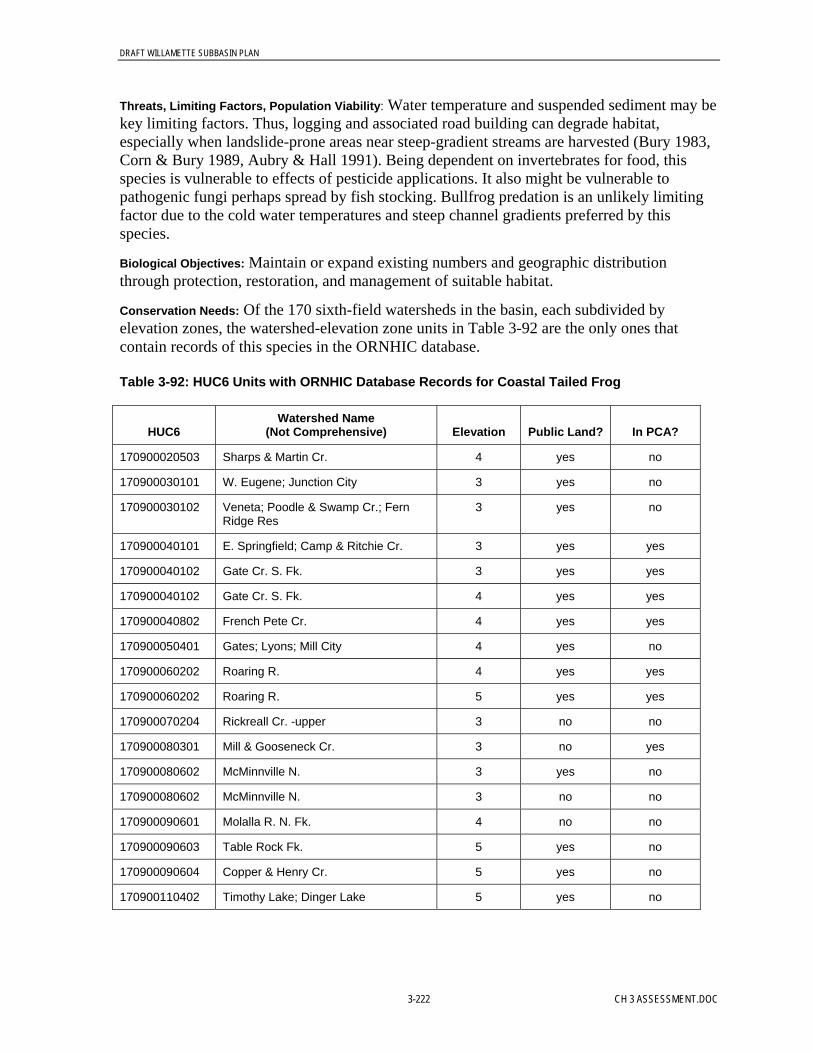
DRAFT WILLAMETTE SUBBASIN PLAN
3-222 CH 3 ASSESSMENT.DOC
Threats, Limiting Factors, Population Viability: Water temperature and suspended sediment may bekey limiting factors. Thus, logging and associated road building can degrade habitat,especially when landslide-prone areas near steep-gradient streams are harvested (Bury 1983,Corn & Bury 1989, Aubry & Hall 1991). Being dependent on invertebrates for food, thisspecies is vulnerable to effects of pesticide applications. It also might be vulnerable topathogenic fungi perhaps spread by fish stocking. Bullfrog predation is an unlikely limitingfactor due to the cold water temperatures and steep channel gradients preferred by thisspecies.
Biological Objectives: Maintain or expand existing numbers and geographic distributionthrough protection, restoration, and management of suitable habitat.
Conservation Needs: Of the 170 sixth-field watersheds in the basin, each subdivided byelevation zones, the watershed-elevation zone units in Table 3-92 are the only ones thatcontain records of this species in the ORNHIC database.
Table 3-92: HUC6 Units with ORNHIC Database Records for Coastal Tailed Frog
HUC6Watershed Name
(Not Comprehensive) Elevation Public Land? In PCA?
170900020503 Sharps & Martin Cr. 4 yes no
170900030101 W. Eugene; Junction City 3 yes no
170900030102 Veneta; Poodle & Swamp Cr.; FernRidge Res
3 yes no
170900040101 E. Springfield; Camp & Ritchie Cr. 3 yes yes
170900040102 Gate Cr. S. Fk. 3 yes yes
170900040102 Gate Cr. S. Fk. 4 yes yes
170900040802 French Pete Cr. 4 yes yes
170900050401 Gates; Lyons; Mill City 4 yes no
170900060202 Roaring R. 4 yes yes
170900060202 Roaring R. 5 yes yes
170900070204 Rickreall Cr. -upper 3 no no
170900080301 Mill & Gooseneck Cr. 3 no yes
170900080602 McMinnville N. 3 yes no
170900080602 McMinnville N. 3 no no
170900090601 Molalla R. N. Fk. 4 no no
170900090603 Table Rock Fk. 5 yes no
170900090604 Copper & Henry Cr. 5 yes no
170900110402 Timothy Lake; Dinger Lake 5 yes no

DRAFT WILLAMETTE SUBBASIN PLAN
CH 3 ASSESSMENT.DOC 3-223
Table 3-92: HUC6 Units with ORNHIC Database Records for Coastal Tailed Frog
HUC6Watershed Name
(Not Comprehensive) Elevation Public Land? In PCA?
Elevation zones (Elev) are:1= <500 ft, 2= 500-1000 ft, 3= 1000-2000 ft; 4= 2000-3000 ft; 5= 3000-4000 ft, 6= >4000 ftPCA = Priority Conservation Area.
American BeaverSpecial Designations: None. Included because it is widely considered by ecologists to be akeystone species due to its capacity to modify habitat in ways that benefit many otherspecies, as documented for example by Perkins (2000) in studies in Coast Range portions ofthe Willamette Basin.
Distribution, Status, and Trends: Beavers occur throughout wooded and partly wooded portionsof the basin. Densities in the Coast Range may be somewhat greater than in the Cascades andvalley, and over the entire basin average about 10 per acre. Unregulated trapping almosteliminated the beaver from Oregon by the early 1900s, but populations have recoveredsignificantly, to the point of being a primary source of damage complaints (due to theirimpounding water and felling trees).
Key Environmental Correlates: Beavers inhabit wooded rivers, streams, lakes, and sloughs. Theygenerally do not reside in wave-swept portions of reservoirs, intermittent streams, and verysteep montane channels. Beavers select relatively low-gradient channels whose geomorphiccharacteristics make them suitable for dam and lodge placement (see Suzuki & McComb1998), but in wide channels and lakes will tunnel into bank and place lodges against thebank.
Threats, Limiting Factors, Population Viability: Densities probably are regulated by availability ofsuitable dam sites, trapping, and disease.
Biological Objectives: Maintain or expand existing numbers and geographic distributionthrough protection, restoration, and management of suitable habitat, consistent withminimizing ecological and economic damages.
Conservation Needs: Table 3-93 shows the sixth-field HUC units that may contain the mostsuitable habitat for this species. The estimates are from application of simple species-habitatmodels to early 1990s aerial imagery, so they are very approximate. For more information onHUC6 units with suitable habitat for this species, such as units that are publicly owned,privately owned, or identified by the The Nature Conservancy as Priority ConservationAreas, see Appendix D.

DRAFT WILLAMETTE SUBBASIN PLAN
3-224 CH 3 ASSESSMENT.DOC
Table 3-93: HUC6 Units with the Most Suitable Habitat for American Beaver
HUC6Watershed Name
(Not Comprehensive) Elevation HabAcOK HabAcBest
HabitatSuitability
Score
170900030204 E. Eugene; Harrisburg; Springfield 1 3057 903 1.28
170900060101 Crabtree Cr. & Onehorse Slough 1 1243 717 1.12
170900090201 S. Canby 1 930 499 1.04
170900070402 N. Canby; E. Wilsonville 1 1256 736 1.00
170900070301 Saint Paul 1 1217 722 0.87
Elevation zones (Elev) are:1= <500 ft, 2= 500-1000 ft, 3= 1000-2000 ft; 4= 2000-3000 ft; 5= 3000-4000 ft, 6= >4000 ftHabAcOK is the acres of possible habitat, i.e., scored >5 for habitat suitability on a 0-10 scale.HabAcBest is the acres of habitat scored a “10.”The habitat suitability score is a relative index that represents the proportional extent (not acres) of higher-suitability habitat in the unit defined by the HUC6 and elevation zone; see Appendix D for more explanation,map files accompanying this plan for location of the HUC6’s, and electronic files accompanying the plan forranking of all watersheds and units.
River OtterSpecial Designations: none.
Distribution, Status, and Trends: Occurs mainly in aquatic and riparian areas throughout thebasin. Application of simple species-habitat models to aerial imagery suggests about 3percent of the Willamette Basin might contain habitat that could be at least marginallysuitable. Unregulated trapping decimated river otters in the 1800s but populations haverecovered significantly.
Key Environmental Correlates: May be associated with relatively clean waters with adequatestreamside cover (for example, downed wood, forest canopy). Often occurs in beaverflowages. Regularly reported from urban waterways and from upland forested areas.
Threats, Limiting Factors, Population Viability: This species is vulnerable to reproductive problemsassociated with chemical contamination (for example, pesticides, endocrine disrupters) of itslargely aquatic foods.
Biological Objectives: Maintain or expand existing numbers and geographic distributionthrough protection, restoration, and management of suitable habitat.
Conservation Needs: Table 3-94 shows the sixth-field HUC units that may contain the mostsuitable habitat for this species. The estimates are from application of simple species-habitatmodels to early 1990s aerial imagery, so they are very approximate. For more information onHUC6 units with suitable habitat for this species, such as units that are publicly owned,privately owned, or identified by the The Nature Conservancy as Priority ConservationAreas, see Appendix D.

DRAFT WILLAMETTE SUBBASIN PLAN
CH 3 ASSESSMENT.DOC 3-225
Table 3-94: HUC6 Units with the Most Suitable Habitat for River Otter
HUC6Watershed Name
(Not Comprehensive) Elevation HabAcOK HabAcBest
HabitatSuitability
Score
170900070402 N. Canby; E. Wilsonville 1 1591 1591 3.19
170900030204 E. Eugene; Harrisburg; Springfield 1 3539 3539 2.82
170900090501 Molalla 1 1453 1453 2.63
170900090201 S. Canby 1 685 685 2.32
170900070403 Oregon City; West Linn 1 1160 1160 2.19
Elevation zones (Elev) are:1= <500 ft, 2= 500-1000 ft, 3= 1000-2000 ft; 4= 2000-3000 ft; 5= 3000-4000 ft, 6= >4000 ftHabAcOK is the acres of possible habitat, i.e., scored >5 for habitat suitability on a 0-10 scale.HabAcBest is the acres of habitat scored a “10.”The habitat suitability score is a relative index that represents the proportional extent (not acres) of higher-suitability habitat in the unit defined by the HUC6 and elevation zone; see Appendix D for more explanation,map files accompanying this plan for location of the HUC6’s, and electronic files accompanying the plan forranking of all watersheds and units.
3.2.5.6 Focal Habitat: Old-Growth Conifer ForestDescription. For this report, old-growth forests were defined as multi-layered (structurallycomplex) forests generally older than 200 years. Some publications include forests as youngas 150 years, but this plan uses 200 years because that is the oldest forested categoryspecified in the spatial layer available for wildlife habitat modeling (the next oldest was 80-200 years). Most old-growth forests are “virgin” forests that have never been subject tologging. Usually, it is not forest stand age that directly accounts for use of old growth bycertain wildlife species, but rather specific features of such stands that correlate (to varyingdegrees) with stand age. Depending on species, this can include canopy closure, abundanceand diversity of downed wood and snags, and extent of deciduous trees within a stand.
Recognition of Importance. The subject of years of debate and litigation, old-growthconifer forest is among the most famous of endangered ecosystems. Public attention to theimportance of this habitat was initially raised by legal listing of the spotted owl as athreatened species, with concomitant restrictions on timber harvest in the old-growth coniferforests that comprise its primary habitat. Literature reviews and summaries documenting theimportance of old growth to wildlife are compiled in the Northwest Forest Plan, specificallyin reports of the Scientific Panel on Late-Successional Forest Ecosystems (Johnson et al.1991, Thomas et al. 1993), the subsequent Record of Decision and Standards and Guidelines,as well as in Kellogg (1992), Haynes & Perez (2001), reports of the CLAMS project, andmany other documents.
Status and Distribution. Reliable information on the extent of old-growth forest, especiallyon private lands, is difficult to obtain. Several maps exist that include categories whichincorporate old-growth conifer forest, but vary in their geographic coverage and definition ofthis habitat type. The CLAMS Project mapped coastal conifer forest, with the largestdiameter category being “greater than 30 inches.” Those data were not obtained for this
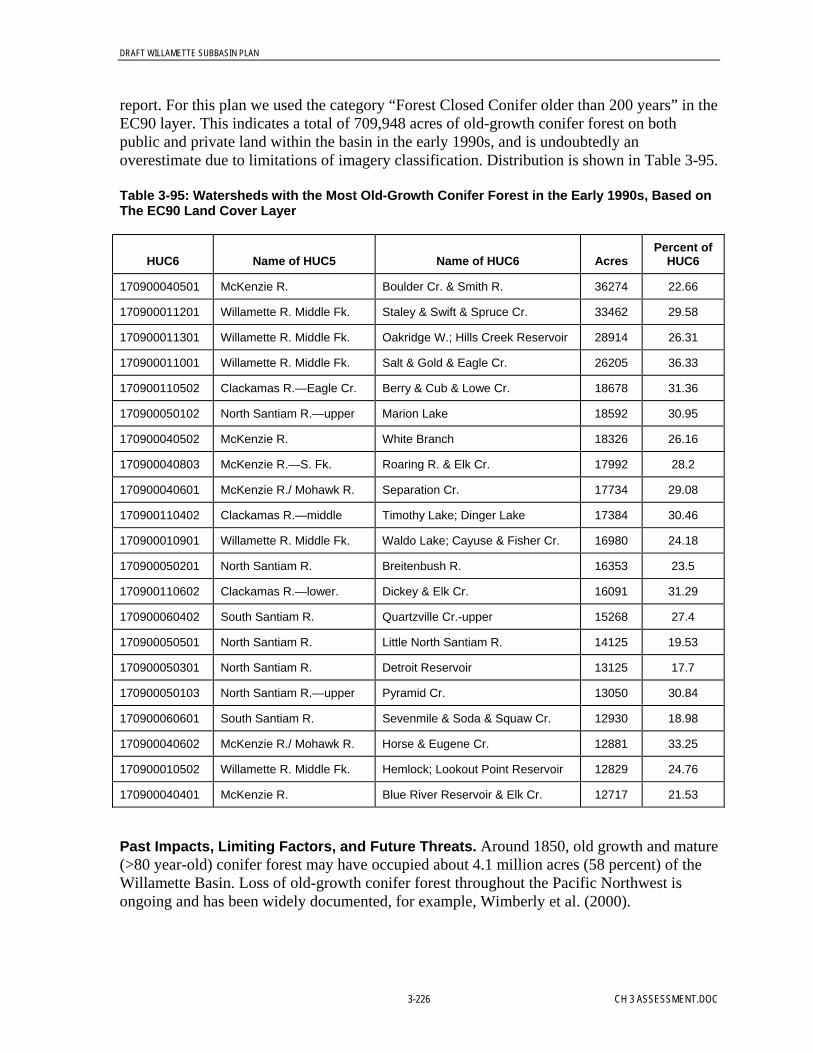
DRAFT WILLAMETTE SUBBASIN PLAN
3-226 CH 3 ASSESSMENT.DOC
report. For this plan we used the category “Forest Closed Conifer older than 200 years” in theEC90 layer. This indicates a total of 709,948 acres of old-growth conifer forest on bothpublic and private land within the basin in the early 1990s, and is undoubtedly anoverestimate due to limitations of imagery classification. Distribution is shown in Table 3-95.
Table 3-95: Watersheds with the Most Old-Growth Conifer Forest in the Early 1990s, Based onThe EC90 Land Cover Layer
HUC6 Name of HUC5 Name of HUC6 AcresPercent of
HUC6
170900040501 McKenzie R. Boulder Cr. & Smith R. 36274 22.66
170900011201 Willamette R. Middle Fk. Staley & Swift & Spruce Cr. 33462 29.58
170900011301 Willamette R. Middle Fk. Oakridge W.; Hills Creek Reservoir 28914 26.31
170900011001 Willamette R. Middle Fk. Salt & Gold & Eagle Cr. 26205 36.33
170900110502 Clackamas R.—Eagle Cr. Berry & Cub & Lowe Cr. 18678 31.36
170900050102 North Santiam R.—upper Marion Lake 18592 30.95
170900040502 McKenzie R. White Branch 18326 26.16
170900040803 McKenzie R.—S. Fk. Roaring R. & Elk Cr. 17992 28.2
170900040601 McKenzie R./ Mohawk R. Separation Cr. 17734 29.08
170900110402 Clackamas R.—middle Timothy Lake; Dinger Lake 17384 30.46
170900010901 Willamette R. Middle Fk. Waldo Lake; Cayuse & Fisher Cr. 16980 24.18
170900050201 North Santiam R. Breitenbush R. 16353 23.5
170900110602 Clackamas R.—lower. Dickey & Elk Cr. 16091 31.29
170900060402 South Santiam R. Quartzville Cr.-upper 15268 27.4
170900050501 North Santiam R. Little North Santiam R. 14125 19.53
170900050301 North Santiam R. Detroit Reservoir 13125 17.7
170900050103 North Santiam R.—upper Pyramid Cr. 13050 30.84
170900060601 South Santiam R. Sevenmile & Soda & Squaw Cr. 12930 18.98
170900040602 McKenzie R./ Mohawk R. Horse & Eugene Cr. 12881 33.25
170900010502 Willamette R. Middle Fk. Hemlock; Lookout Point Reservoir 12829 24.76
170900040401 McKenzie R. Blue River Reservoir & Elk Cr. 12717 21.53
Past Impacts, Limiting Factors, and Future Threats. Around 1850, old growth and mature(>80 year-old) conifer forest may have occupied about 4.1 million acres (58 percent) of theWillamette Basin. Loss of old-growth conifer forest throughout the Pacific Northwest isongoing and has been widely documented, for example, Wimberly et al. (2000).

DRAFT WILLAMETTE SUBBASIN PLAN
CH 3 ASSESSMENT.DOC 3-227
Logging and fire clearly have been responsible for most losses of old-growth forest in theWillamette Basin during the past century, and will likely continue to dominate in the future.Nonetheless, harvest levels of timber generally (not necessarily old growth) are at about halfthe levels of the late 1980s, especially in the Cascades. Past harvesting of old growth wasprobably greater at lower elevations and (at least recently) greater on private than on publiclands. Largely due to Oregon’s strong land use laws, relatively little forest in the WillametteBasin has been converted to residential or agricultural use since the 1970s (Azuma 1999).
Old-growth conifer forests are thought to have once been a major component of the valleyfloor, especially prior to the annual setting of large fires by indigenous tribes. Nearly all ofthe low-elevation conifer forest has now been converted to agriculture or residentialdevelopment. In the Coast Range and Cascades, infrequent but large fires during the pre-settlement era resulted in extensive even-aged stands, forming much of what today is oldgrowth.
Some experts have expressed concern that current government and private industry policiesare creating a strongly bimodal landscape pattern in the Cascades and Coast Range, withmainly old forests on public land, young forests on private land, and little mid-aged forest.Growth and harvest on private timberlands in Oregon generally are believed to be in balance(Johnson 2001) but location-specific data are typically not available. Rotation ages on mostprivate lands are shorter than the ages that would result in maximum growth rates. Rotationsmay continue to shorten if present corporate management strategies persist. The net effect ofcurrent forest management practices may be that, by 2050, the average age of conifers mayfall from about 70 years to around 58 years, assuming an even distribution of age within eachconifer age group (Payne 2002). Shorter rotation lengths may not allow development ofstructural complexity comparable to that found in mature or old-growth forests. Structuralfeatures such as snags and downed wood are often removed from harvested stands forlogistical reasons or to reduce fire or safety hazards.
As world trade continues to expand, increased transnational transport of pathogens and insectpests may increase, and thus threaten plants and animals not adapted to new types of plagues.At the same time spreading urbanization and global warming, if accompanied by prolongeddrought, will lower the resistance of forests to insects and diseases, and possibly increase thefrequency of fires.
Contribution of Old-Growth Forest to Regional Biodiversity. In Oregon, old-growth andlate-successional conifer forests are closely associated with occurrence of 16 amphibians, 38birds, and 21 mammals (Thomas et al.,1993). Many of these species use few other habitattypes.
Selected Focal Species in Old-Growth Conifer Forest. The following wildlife species areproposed as focal species for this habitat type: marbled murrelet, spotted owl, great gray owl,olive-sided flycatcher, pileated woodpecker, Vaux’s swift, Oregon slender salamander,American marten, red tree vole, and Townsend’s big-eared bat.
On a scale of 0 to 10, these species’ average degree of association with old-growth coniferforest is 9.1. Compare this with HEP “loss assessment” species used in many previousmitigation calculations and land acquisitions in the Willamette Basin. Of the “conifer”species used in HEP applications, the average degree of association with old-growth conifer

DRAFT WILLAMETTE SUBBASIN PLAN
3-228 CH 3 ASSESSMENT.DOC
forest is only 7.0. This suggests there may have been an unintentional but systematic biasagainst old-growth forest in previous mitigation land dealings in the Willamette Basin.
Pileated WoodpeckerSpecial Designations: “Vulnerable” (ODFW sensitive species). Partners In Flight focal species.
Distribution, Status, and Trends: This large, uncommon, resident woodpecker occurs throughoutforested parts of the Willamette Basin. Along basin BBS routes, the species was detected at1.5 percent of surveyed points in 2003, with a maximum over the period 1968-2003 of 2.4percent in 1981. Application of simple species-habitat models to aerial imagery suggestsabout 10 percent of the basin might contain habitat that could be at least marginally suitable.The Oregon BBA Project confirmed nesting in 44 percent of the large survey units in thebasin and found evidence of possible or probable nesting in an additional 52 percent.. BBSdata covering the periods 1968-2003 and 1980-2003 show an increase in the WillametteValley, and in western Oregon-Washington generally during the latter period. It is not knownwhat part of these reports might be attributed to birds that formerly inhabited old growthshifting to new areas and habitats as old growth is logged. Wintering birds are found by mostbasin CBCs.
Key Environmental Correlates: Strongly associated with old-growth conifer forest (Mannan et al.1980, Nelson 1989, Carey et al. 1991, Mellen et al. 1992, McGarigal and McComb 1995).Also uses large-diameter stands of deciduous trees (for example, large cottonwoods andmaples) in riparian areas and even in low-density residential neighborhoods. The meandiameter of snags on which it fed in the Coast Range was 41 inches (range 8-73 inches).Forages on both standing and fallen trees, and will use less mature forests if a few large-diameter trees are present or if mature stands are present nearby. Feeds extensively oncarpenter ants. Home range on individual birds during the course of a year encompasses over2000 acres, and birds commonly travel up to 4 miles.
Threats, Limiting Factors, Population Viability: This species faces several threats, includingconversion of forests to non-forest habitats; shift to shorter-rotation even-aged forests; andremoval of downed wood (for fuels reduction) that is important as a foraging substrate.Because they feed extensively on the ground, woodpeckers are vulnerable to being killed byseveral mammalian predators and by vehicles. For this reason downed wood should not beplaced near roads.
Biological Objectives: Maintain or expand existing numbers and geographic distributionthrough protection, restoration, and management of suitable habitat. The density of breedingpairs should be an average of one pair per 1500 acres within the percent of the landscape thatis suitable habitat (Altman 1999). As proposed in Conservation Strategy for Landbirds inConiferous Forests of Western Oregon and Washington habitat objectives should include thefollowing in managed stands older than 60 years:
• Maintain >70 percent canopy closure and >70 percent conifer species canopy trees
• Maintain 2 nest snags per 10 ac, each being >30 inches in diameter
• Retained snags should be spatially well distributed and mostly hard snags, but some maybe defective live trees.

DRAFT WILLAMETTE SUBBASIN PLAN
CH 3 ASSESSMENT.DOC 3-229
• Provide an average of 12 foraging snags per acre (mix of hard and soft snags) in thefollowing size classes:
− 10-20 in dbh = 7/ac− 20-30 in dbh = 3/ac− >30 in dbh = 2/ac (may include the nest snags)
• Maintain a 5 acre no-harvest buffer around known nest or roost sites.
• Extend rotation ages to >80 years to provide potential snags of sufficient size, and retainthese snags and recruit replacement snags (large live trees) at each harvest entry.
• Retain large live trees with defective or dying conditions such as broken tops, fungalconks, and insect infestations.
• If snags have not been retained (or are insufficient in number), create snags throughblasting tops or inoculation with heart rot if size of trees meets species requirements.
• Retain known or suitable nesting and roosting snags from all harvest and salvageactivities and restrict access for fuelwood cutters.
• During harvest operations, retain large logs and stumps in various stages of decay forforaging sites.
• Avoid use of pesticides near retained snags
Conservation Needs: Table 3-96 shows the sixth-field HUC units that may contain the mostsuitable habitat for this species. The estimates are from application of simple species-habitatmodels to early 1990s aerial imagery, so they are very approximate. For more information onHUC6 units with suitable habitat for this species, such as units that are publicly owned,privately owned, or identified by the The Nature Conservancy as Priority ConservationAreas, see Appendix D.
Table 3-96: HUC6 Units with the Most Suitable Habitat for Pileated Woodpecker
HUC6Watershed Name
(Not Comprehensive) Elevation HabAcOK HabAcBest
HabitatSuitability
Score
170900010802 Black & Salmon & Wall Cr. 6 14448 4102 5.86
170900040602 Horse & Eugene Cr. 6 27068 9805 5.51
170900010803 Waldo Lake; Black & Salmon Cr. 6 12510 5297 5.48
170900011001 Salt & Gold & Eagle Cr. 6 39473 19719 4.99
170900040601 Separation Cr. 6 29711 11630 4.94
DRAFT WILLAMETTE SUBBASIN PLAN
3-230 CH 3 ASSESSMENT.DOC
Table 3-96: HUC6 Units with the Most Suitable Habitat for Pileated Woodpecker
HUC6Watershed Name
(Not Comprehensive) Elevation HabAcOK HabAcBest
HabitatSuitability
Score
Elevation zones (Elev) are:1= <500 ft, 2= 500-1000 ft, 3= 1000-2000 ft; 4= 2000-3000 ft; 5= 3000-4000 ft, 6= >4000 ftHabAcOK is the acres of possible habitat, i.e., scored >5 for habitat suitability on a 0-10 scale.HabAcBest is the acres of habitat scored a “10.”The habitat suitability score is a relative index that represents the proportional extent (not acres) of higher-suitability habitat in the unit defined by the HUC6 and elevation zone; see Appendix D for more explanation,map files accompanying this plan for location of the HUC6’s, and electronic files accompanying the plan forranking of all watersheds and units.
Olive-sided FlycatcherSpecial Designations: “Vulnerable” (ODFW sensitive species). Partners In Flight focal species.
Distribution, Status, and Trends: This neotropical migrant songbird is uncommon throughout thebasin. Application of simple species-habitat models to aerial imagery using GIS suggestsabout 0.8 percent of the basin might contain suitable habitat. Along Willamette Basin BBSroutes it was detected at 5.5 percent of surveyed points in 2003. The Oregon BBA Projectconfirmed nesting in 28 percent of the large survey units in the basin and found evidence ofpossible or probable nesting in an additional 65 percent. BBS data covering the periods 1968-2003 and 1980-2003 show a decrease both in the Willamette Valley and in western Oregon-Washington generally. The regional trends are statistically significant.
Key Environmental Correlates: In the Willamette Basin this species is strongly associated withold-growth conifer forest (Carey et al. 1991, McGarigal and McComb 1995). However, it isnot an indicator of old-growth conifer forest per se, but rather is associated with canopy gapscreated by blowdowns, mudflows, lightning strikes, beaver impoundments, and other naturalprocesses or from human-related activities (logging, low-density residential development,controlled burns). In fact, it is one of the few species that appear to benefit from some typesof fragmentation of conifer forests. However, the continuing increase in logged forest runscontrary to the documented overall decline in numbers of this species Habitat requirementswere described by Altman (1999):
Optimal habitat is edges and forest openings where tall trees and snags are present forsinging and foraging perches, and varying sized conifers for nesting. This may includeharvest units, post-fire habitat, natural edges of bodies of water, or old-growth forest withextensive areas of broken canopies. It is more abundant in two-story (green-treeretention) treatments than small (0.1 ac) patch cuts, modified clearcuts, or unharvestedcontrol stands. Optimal habitat in early-seral forest appears to be stands larger than 50acres with an open canopy and retained green-trees and snags. The most importantvariable for nest success in managed early successional forest may be the presence ofsnags taller than 40 ft. Successful nesting in harvest units occurs in both small clumps oftrees (aggregates) with canopy closure less than 50 percent, and in singular, dispersedtrees throughout the harvest unit. Successful nesting also occurs in understory suppressedtrees and in young plantation trees.
DRAFT WILLAMETTE SUBBASIN PLAN
CH 3 ASSESSMENT.DOC 3-231
Threats, Limiting Factors, Population Viability: As is true of all neotropical migrants, numberscurrently may be limited as much or more by conditions on wintering grounds in the tropicsthan by habitat on breeding grounds, but evidence is lacking. An insectivore, this species ispotentially vulnerable to pesticides. Fire suppression, dead wood removal (for example, forfuels reduction and “forest health” programs), and low beaver populations undoubtedly limitthe acreage of available habitat (snags in open-canopy forests and forest gaps).
Biological Objectives: Maintain or expand existing numbers and geographic distributionthrough protection, restoration, and management of suitable habitat. The density of breedingpairs should be an average of one pair per 50 acres within the percent of the landscape that issuitable habitat (early successional with conditions described below or old growth with largecanopy gaps) (Altman 1999). As proposed in Conservation Strategy for Landbirds inConiferous Forests of Western Oregon and Washington habitat objectives should include thefollowing, applied within harvest units larger than 50 acres:
• Retain >2.5 ac areas (aggregate clumps) with 4-12 trees/ac) that are >40 ft high and arewithin the harvest unit, not adjacent to the forest edge.
• The remainder of the harvest unit should average 1-2 trees/ac that are >40 ft high,dispersed relatively equally throughout the harvest unit
• Retained trees should be >50 percent hemlocks or true firs to provide preferred nest trees,and have at least 25 percent foliage volume (canopy lift) for nesting substrate.
• Retain or provide suppressed or plantation trees throughout the harvest unit (>5/ac) thatare 10-40 ft high.
In addition to green-tree retention, seed tree, shelterwood, or group selection cuts may beused to meet the biological objectives.
• In reforestation units, include at least 10 percent hemlock or true fir seedlings, and retainthese trees through thinnings and harvest.
• Retain residual clumps of older forest in association with retained green-trees to increaseedge and reduce effects of wind-throw on retained green-trees.
• Retain large trees in association with retained large snags where snags can serve as guardand foraging perches.
• Maintain retained large canopy trees through stand development and recruit replacementgreen-trees at each harvest entry.
Conservation Needs: Table 3-97 shows the sixth-field HUC units that may contain the mostsuitable habitat for this species. The estimates are from application of simple species-habitatmodels to early 1990s aerial imagery, so they are very approximate. For more information onHUC6 units with suitable habitat for this species, such as units that are publicly owned,privately owned, or identified by the The Nature Conservancy as Priority ConservationAreas, see Appendix D.

DRAFT WILLAMETTE SUBBASIN PLAN
3-232 CH 3 ASSESSMENT.DOC
Table 3-97: HUC6 Units with the Most Suitable Habitat for Olive-Sided Flycatcher
HUC6Watershed Name
(Not Comprehensive) Elevation HabAcOK HabAcBest
HabitatSuitability
Score
170900010802 Black & Salmon & Wall Cr. 6 7069 243 4.40
170900110402 Timothy Lake; Dinger Lake 5 18764 1279 4.09
170900040602 Horse & Eugene Cr. 6 15900 73 3.89
170900010803 Waldo Lake; Black & Salmon Cr. 6 7086 149 3.77
170900011001 Salt & Gold & Eagle Cr. 6 25342 630 3.74
Elevation zones (Elev) are:1= <500 ft, 2= 500-1000 ft, 3= 1000-2000 ft; 4= 2000-3000 ft; 5= 3000-4000 ft, 6= >4000 ftHabAcOK is the acres of possible habitat, i.e., scored >5 for habitat suitability on a 0-10 scale.HabAcBest is the acres of habitat scored a “10.”The habitat suitability score is a relative index that represents the proportional extent (not acres) of higher-suitability habitat in the unit defined by the HUC6 and elevation zone; see Appendix D for more explanation,map files accompanying this plan for location of the HUC6’s, and electronic files accompanying the plan forranking of all watersheds and units.
Vaux’s SwiftSpecial Designations: Partners In Flight focal species.
Distribution, Status, and Trends: This aerial-foraging neotropical migrant traditionally nestedonly in large snags, but with the disappearance of many of these has adapted to nestingmostly in uncapped unused brick chimneys. The Oregon BBA Project confirmed nesting in37 percent of the large survey units in the basin and found evidence of possible or probablenesting in an additional 5 percent. Along Willamette Basin BBS routes the species wasdetected at 2.5 percent of surveyed points in 2003, with a maximum during the period 1968-2003 of 6.3 percent in 1972. BBS data covering the periods 1968-2003 show a decrease bothin western Oregon-Washington generally but possibly not in the Willamette Valley. Tallchimneys are also used as staging and roosting areas by enormous numbers of swifts justprior to migration. As many as 20,000 birds roost annually in one tall chimney at a school inPortland, and a total of 55,000 were estimated to be roosting in the few chimneys in theWillamette Valley used for this purpose in mid-September 2000 (Bull 2003).
Key Environmental Correlates: In forested areas it prefers old growth but will use logged areas ifsnags suitable for nesting are available (Manuwal 1991, Carey et al. 1989, 1991). It is morecommon in old growth on moist soils than on dry soils, and preferentially selects streams andwetlands for aerial foraging (Manuwal 1991, Bull and Beckwith 1993). Swifts also forage inthe multi-layered, broken canopy of old-growth forests, and over agricultural fields, lakes,rivers, and residential neighborhoods. Snags used for nesting by pairs or colonies of swiftsgenerally have a diameter of at least 27 inches and contain holes excavated by pileatedwoodpeckers or resulting from detached limbs or rot.
Threats, Limiting Factors, Population Viability: As is true of all neotropical migrants, numberscurrently may be limited as much or more by conditions on wintering grounds in the tropicsthan by habitat on breeding grounds, but evidence is lacking. Loss of old-growth forest,

DRAFT WILLAMETTE SUBBASIN PLAN
CH 3 ASSESSMENT.DOC 3-233
however, is probably a major contributor to its decline. Fire suppression, dead wood removal(for example, for fuels reduction and “forest health” programs), shorter harvest rotations, andlow beaver populations undoubtedly limit the acreage of available habitat (i.e., snags in open-canopy forests and forest gaps). In developed areas, fewer new houses are being built withbrick chimneys and where they are, they typically are partially capped to exclude swifts andother wildlife. At the same time some of the older, taller brick chimneys have been torn downor are being used to vent heat and gases at times when they are most-needed by stagingswifts. As insectivores, swifts also are potentially vulnerable to pesticides.
Biological Objectives: Maintain or expand existing numbers and geographic distributionthrough protection, restoration, and management of suitable habitat. To accomplish this, theConservation Strategy for Landbirds in Coniferous Forests of Western Oregon andWashington (Altman 1999) recommends the following habitat objectives for managedforests:
• Increase the length of harvest rotations to greater than 100 years;
• Retain or create nest structures with diameter greater than 27 inches and height greaterthan 82 ft, that are in different stages of decay and in stands with less than 60 percentcanopy closure (for example, canopy gaps) so they are accessible to flying swifts;
• Provide an average of 5 of these potential nest/roost structures per square mile at anypoint in time, with up to 30 percent being live trees with broken tops (created or natural),and up to 20 percent being snags;
• Maintain a 5 acre no-harvest buffer around known nest or roost sites.
Conservation Needs: Table 3-98 shows the sixth-field HUC units that may contain the mostsuitable habitat for this species. The estimates are from application of simple species-habitatmodels to early 1990s aerial imagery, so they are very approximate. For more information onHUC6 units with suitable habitat for this species, such as units that are publicly owned,privately owned, or identified by the The Nature Conservancy as Priority ConservationAreas, see Appendix D.
Table 3-98: HUC6 Units with the Most Suitable Habitat for Vaux’s Swift
HUC6Watershed Name
(Not Comprehensive) Elevation HabAcOK HabAcBest
HabitatSuitability
Score
170900120202 S. Milwaukie; Happy Valley; LakeOswego; W
1 13669 13669 4.57
170900100103 Beaverton & Rock & Cedar Mill Cr. 1 20904 20904 4.45
170900120203 Gresham; Portland; N. Milwaukie 1 13256 13256 4.34
170900120201 Portland; Forest Hills; MultnomahChannel
1 15623 15623 3.51
170900010802 Black & Salmon & Wall Cr. 6 4102 4102 3.28
DRAFT WILLAMETTE SUBBASIN PLAN
3-234 CH 3 ASSESSMENT.DOC
Table 3-98: HUC6 Units with the Most Suitable Habitat for Vaux’s Swift
HUC6Watershed Name
(Not Comprehensive) Elevation HabAcOK HabAcBest
HabitatSuitability
Score
Elevation zones (Elev) are:1= <500 ft, 2= 500-1000 ft, 3= 1000-2000 ft; 4= 2000-3000 ft; 5= 3000-4000 ft, 6= >4000 ftHabAcOK is the acres of possible habitat, i.e., scored >5 for habitat suitability on a 0-10 scale.HabAcBest is the acres of habitat scored a “10.”The habitat suitability score is a relative index that represents the proportional extent (not acres) of higher-suitability habitat in the unit defined by the HUC6 and elevation zone; see Appendix D for more explanation, mapfiles accompanying this plan for location of the HUC6’s, and electronic files accompanying the plan for ranking ofall watersheds and units.
Marbled MurreletSpecial Designations: “Threatened” (federal and state). “Imperiled” (ONHP).
Distribution, Status, and Trends: This forest-nesting seabird breeds mostly within about 36 milesof the Oregon coast, so its occurrence in the Willamette Basin is very limited. The ORNHICdatabase contains records from just 3 of the 170 Willamette watersheds. Locational data arealso available from: http://www.reo.gov/gis/data/gisdata/index.htm. During the mid-1990sthe Oregon population was estimated at 6,600—20,000 individuals (Nelson 2003). Predatorsand other factors have caused failure of two-thirds of the nests, and the Pacific populationmay be declining at a rate of 4-7 percent per year.
Key Environmental Correlates: Requires a natural platform high in a conifer tree for laying itseggs (it does not build a nest). The platform, generally of moss or dwarf mistletoe based on astout horizontal limb beneath the forest canopy, must be at least 4 inches wide (preferably10) and located at least 30 ft up (preferably 185) in a large conifer. Unlike spotted owls,whose territories encompass hundreds of acres of well-connected old growth stands, marbledmurrelets do not defend large territories and even tend to nest in loose colonies. Presence ofnearby river corridors may facilitate daily movements between nesting trees and marinewaters. Populations might be influenced as much or more by ocean conditions (wheremurrelets feed and winter) as by the availability of suitable nest sites.
Threats, Limiting Factors, Population Viability: Populations of this species are experiencing verylow recruitment rates, due partly to nest predation and partly to high mortality in young priorto reaching the ocean (USFWS 1994, 1996). Harvest of old-growth forest not only removessuitable egg placement sites, but also—by fragmenting the forest—increases habitatsuitability for and search efficiency of ravens, other corvids, and raptors that prey on murreleteggs and/or young. Although the Northwest Forest Plan established late-successionalreserves, the habitat in large areas within these reserves will not be suitable for 50-100 years.Meanwhile, harvest of suitable habitat continues under the umbrella of Habitat ConservationPlans, land exchanges, and misidentification of habitat suitability during surveys of sitesslated for timber sales (Nelson 2003). Moreover, the “survey and manage” requirements thatapply to many rare species on federal lands may soon be eliminated. In marine waters,murrelets face a wide arrange of threats, including oil spills, marine pollutants, incidentalmortality from gill nets, incidental harvest of some of their fish prey, and effects ofmariculture facility operations (for example, alteration of local food base due to pollution).

DRAFT WILLAMETTE SUBBASIN PLAN
CH 3 ASSESSMENT.DOC 3-235
Biological Objectives: Maintain or expand existing numbers and geographic distributionthrough protection, restoration, and management of suitable habitat.
Conservation Needs: See: USFWS 1996, 1997.
For Further Information See:US Departments of Agriculture and Interior 1993Nelson 2003Nelson et al. 1992Nelson & Hamer 1995aNelson 1997ODF 1995USFWS 1996, 1997Ralph et al. 1994Evans et al. 2000
Spotted OwlSpecial Designations: “Threatened” (federal). “Vulnerable” (ONHP).
Distribution, Status, and Trends: This legendary owl occurs rarely but widely in the WillametteBasin. The ORNHIC database contains records from 96 of the 170 Willamette Basinwatersheds. The relatively large number is attributable partly to implementation of extensivesurveys for this species. Potential habitat for this species was mapped by McComb et al.(2002). Locational data are also available from:http://www.reo.gov/gis/data/gisdata/index.htm.
A population decline (but not necessarily a decline in survival or reproductive rates) duringthe period 1985-1998 was documented partly by an analysis of banding data (Franklin et al.1999).
Key Environmental Correlates: Spotted owls nest and roost within or very near old-growthconifer forest, feeding on forest mammals (primarily flying squirrels and red tree voles)beneath the forest canopy, and sometimes along edges of canopy gaps and clearcuts. Therequirement of this species for large (>3000 acre) blocks of old-growth conifer forest hasbeen well-documented (for example, Forsman et al. 1984, Thomas et al. 1990, Carey et al.1992, Ripple et al. 1997, Swindle et al. 1999). Younger forests are used as well, althoughsecondarily and mainly when they contain relict patches of old growth in locations where noold-growth forest otherwise exists. Nests are placed on natural platforms in trees (forexample, formed by deformed or broken tops) or in cavities of live or dead trees, generally72-99 ft above the ground. Diameter of nest trees averages 42–53 inches in Oregon (Forsmanet al. 1984).
Threats, Limiting Factors, Population Viability: Although the Northwest Forest Plan establishedlate-successional reserves, much of the potential habitat within these reserves will not beoptimal for 50-100 years. Meanwhile, harvest of old growth conifers continues on someforest lands. Simultaneously, the integrity of spotted owl as a species may be threatened byincreasing numbers of barred owls which have displaced spotted owls from some areas andoccasionally hybridize with them (Forsman 2003).
DRAFT WILLAMETTE SUBBASIN PLAN
3-236 CH 3 ASSESSMENT.DOC
Biological Objectives: Maintain or expand existing numbers and geographic distributionthrough protection, restoration, and management of suitable habitat.
For Further Information: Thomas et al. 1990, USDA & USDI 1994, Thrailkill et al. 1997,Marcot & Thomas 1997, Meyer et al. 1998, Irwin et al. 2000, Forsman et al. 2002, Noon &Franklin 2002, Glenn et al. 2004.
Great Gray OwlSpecial Designations: “Vulnerable” (ODFW sensitive species).
Distribution, Status, and Trends: Although this is Oregon’s largest owl, it is difficult to surveyand consequently little is known of its status or trends in the Willamette Basin. In Oregon itresides mainly on the east slope of the Cascades and in the Blue Mountains, but there arescattered reports of birds breeding within the basin, especially at higher elevations (forexample, Goggans and Platt 1992). NHI models and data project that this species has a closeassociation with land cover in less than 1 percent of the basin. Since 1850, suitable habitat forthis species in the basin may have decreased by 95-100 percent (Payne 2002).
Key Environmental Correlates: Like spotted owls, great gray owls nest and roost in old-growthconifer forest, but appear to feed to a greater degree than other owls in montane meadows.They also forage in natural forest gaps and clearcuts if they support a vigorous herbaceouslayer. Flightless fledglings may benefit from partially downed wood which they use asperches.
Threats, Limiting Factors, Population Viability: Loss of old-growth conifer forests, through loggingand fire, is probably the greatest immediate threat. Succession of montane meadows intoforest as a potential result of global warming may be a longer-term problem.
Biological Objectives: Maintain or expand existing numbers and geographic distributionthrough protection, restoration, and management of suitable habitat. Lengthen the usualharvest rotation period to sustain the supply of old growth trees.
For Further Information See: Quintana-Coyer et al. 2004.
Conservation Needs: Table 3-99 shows the sixth-field HUC units that may contain the mostsuitable habitat for this species. The estimates are from application of simple species-habitatmodels to early 1990s aerial imagery, so they are very approximate. For more information onHUC6 units with suitable habitat for this species, such as units that are publicly owned,privately owned, or identified by the The Nature Conservancy as Priority ConservationAreas, see Appendix D.
Table 3-99: HUC6 Units with the Most Suitable Habitat for Great Gray Owl
HUC6Watershed Name
(Not Comprehensive) Elevation HabAcOK HabAcBest
HabitatSuitability
Score
170900010802 Black & Salmon & Wall Cr. 6 7593 77 2.95
170900040602 Horse & Eugene Cr. 6 15867 54 2.34
170900011001 Salt & Gold & Eagle Cr. 6 25511 331 2.32
DRAFT WILLAMETTE SUBBASIN PLAN
CH 3 ASSESSMENT.DOC 3-237
Table 3-99: HUC6 Units with the Most Suitable Habitat for Great Gray Owl
HUC6Watershed Name
(Not Comprehensive) Elevation HabAcOK HabAcBest
HabitatSuitability
Score
170900011101 Groundhog Cr: S.Fork 6 9914 236 1.97
170900040802 French Pete Cr. 6 10491 18 1.97
Elevation zones (Elev) are:1= <500 ft, 2= 500-1000 ft, 3= 1000-2000 ft; 4= 2000-3000 ft; 5= 3000-4000 ft, 6= >4000 ftHabAcOK is the acres of possible habitat, i.e., scored >5 for habitat suitability on a 0-10 scale.HabAcBest is the acres of habitat scored a “10.”The habitat suitability score is a relative index that represents the proportional extent (not acres) of higher-suitability habitat in the unit defined by the HUC6 and elevation zone; see Appendix D for more explanation,map files accompanying this plan for location of the HUC6’s, and electronic files accompanying the plan forranking of all watersheds and units.
Oregon Slender SalamanderSpecial Designations: “Critically Imperiled” (ONHP).
Distribution, Status, and Trends: This salamander is reported to be locally common in parts ofthe eastern (Cascade) portion of the basin, and its range is confined entirely to Oregon. TheORNHIC database contains documented records from 18 of the 170 Willamette watersheds.
Key Environmental Correlates: Moist coniferous forests, especially mature and old growthstands, appear to provide the primary habitat for this species. Nests have been found underbark and in large rotten logs. Tall, multi-layered canopies of old growth retain humidity andintercept fog, which maintains ground-level moisture essential to this species.
Threats, Limiting Factors, Population Viability: Habitat loss and degradation (i.e., reduced soilmoisture) is the major threat. The accumulations of large-diameter moist woody debrisrequired by this species are much less available in younger managed forests, especially withthe implementation of fuels reduction programs and shorter harvest rotations. Fragmentationof forests with roads and clearcuts potentially decreases soil moisture in the adjoining forest.Global climate warming also could potentially diminish soil moisture and result in morefrequent fires, with negative impacts on salamanders.
Biological Objectives: Maintain or expand existing numbers and geographic distributionthrough protection, restoration, and management of suitable habitat. Lengthen the usualharvest rotation period to sustain the supply of old growth trees.
Conservation Needs: Of the 170 sixth-field watersheds in the basin, each subdivided byelevation zones, the watershed-elevation zone units in Table 3-100 contain records of thisspecies in the ORNHIC database.

DRAFT WILLAMETTE SUBBASIN PLAN
3-238 CH 3 ASSESSMENT.DOC
Table 3-100: HUC6 Units with ORNHIC Database Records for Oregon Slender Salamander
HUC6Watershed Name
(Not Comprehensive) Elevation Public Land? In PCA?
170900030302 Brownsville 3 yes no
170900040802 French Pete Cr. 5 yes yes
170900040803 Roaring R. & Elk Cr. 4 yes yes
170900050101 Detroit; Idanha 4 yes no
170900050101 Detroit; Idanha 5 yes no
170900050201 Breitenbush R. 4 yes no
170900050301 Detroit Reservoir 4 yes no
170900050301 Detroit Reservoir 5 yes no
170900050401 Gates; Lyons; Mill City 4 yes no
170900050501 Little North Santiam R. 4 yes no
170900050601 Jefferson; Lyons; Bear Branch 4 yes no
170900060302 Upper Thomas & Neil Cr. & Indian Prairie 3 yes no
170900060401 Greenpeter Reservoir 3 yes no
170900060401 Greenpeter Reservoir 3 no no
170900060401 Greenpeter Reservoir 4 yes no
170900090303 Woodcock Cr. 2 yes yes
170900090401 Scotts Mills Senecal Cr. & Mill Cr. 4 yes no
170900090402 Abiqua Cr. 3 yes no
170900090604 Copper & Henry Cr. 4 yes no
170900110301 Big Cliff Reservoir 3 yes no
170900110301 Big Cliff Reservoir 4 yes no
170900110303 Fish Cr. E. 3 yes no
170900110601 Nohorn Cr. 4 yes yes
Elevation zones (Elev) are:1= <500 ft, 2= 500-1000 ft, 3= 1000-2000 ft; 4= 2000-3000 ft; 5= 3000-4000 ft, 6= >4000 ftPCA = Priority Conservation Area.
American (Pine) MartenSpecial Designations: “Vulnerable” (ODFW sensitive species).
Distribution, Status, and Trends: Mainly resides in higher-elevation portions of the basin. TheORNHIC database contains 3 documented records of this species. All were from onewatershed within the upper Middle Fork of the Willamette River, in the mid-1990s.Application of simple species-habitat models to aerial imagery suggests about 6 percent of

DRAFT WILLAMETTE SUBBASIN PLAN
CH 3 ASSESSMENT.DOC 3-239
the basin might have contained (in the early 1990s) habitat that could be at least marginallysuitable and 0.7 percent might contain good habitat. Historically, unregulated trapping forpelts eliminated martens from some areas.
Key Environmental Correlates: Martens are usually found in dense old-growth conifer forests,possibly favoring those closer to water. To a lesser degree they use dense deciduous or mixedforest, and rocky alpine areas.
Threats, Limiting Factors, Population Viability: Continued loss of unmanaged old growth standsmay threaten this species. Its requirement for accumulations of woody debris makes it lesslikely to survive in younger managed forests, especially with the implementation of fuelsreduction programs and shorter harvest rotations.
Biological Objectives:
• Maintain or expand existing numbers and geographic distribution through protection,restoration, and management of suitable habitat, particularly as:
− Tracts of greater than 640 acres that contain >45 percent mature and old-growthforest.
− Riparian areas or other corridors wider than 600 ft wide
• Lengthen the usual harvest rotation period to sustain the supply of old growth trees andcreate and maintain uneven-aged stands of timber
• Retain downed dead wood to the maximum extent (ideally covering >20 percent of theground) consistent with fuel reduction needs and in a spatially dispersed pattern
Conservation Needs: Table 3-101 shows the sixth-field HUC units that may contain the mostsuitable habitat for this species. The estimates are from application of simple species-habitatmodels to early 1990s aerial imagery, so they are very approximate. For more information onHUC6 units with suitable habitat for this species, such as units that are publicly owned,privately owned, or identified by the The Nature Conservancy as Priority ConservationAreas, see Appendix D.
Table 3-101: HUC6 Units with the Most Suitable Habitat for American (Pine) Marten
HUC6Watershed Name
(Not Comprehensive) Elevation HabAcOK HabAcBest
HabitatSuitability
Score
170900040602 Horse & Eugene Cr. 6 19120 239 3.37
170900040501 Boulder Cr. & Smith R. 6 44810 3752 2.91
170900040802 French Pete Cr. 6 13940 414 2.87
170900050103 Pyramid Cr. 6 12596 2377 2.43
170900011201 Staley & Swift & Spruce Cr. 6 24943 4681 2.13

DRAFT WILLAMETTE SUBBASIN PLAN
3-240 CH 3 ASSESSMENT.DOC
Table 3-101: HUC6 Units with the Most Suitable Habitat for American (Pine) Marten
HUC6Watershed Name
(Not Comprehensive) Elevation HabAcOK HabAcBest
HabitatSuitability
Score
Elevation zones (Elev) are:1= <500 ft, 2= 500-1000 ft, 3= 1000-2000 ft; 4= 2000-3000 ft; 5= 3000-4000 ft, 6= >4000 ftHabAcOK is the acres of possible habitat, i.e., scored >5 for habitat suitability on a 0-10 scale.HabAcBest is the acres of habitat scored a “10.”The habitat suitability score is a relative index that represents the proportional extent (not acres) of higher-suitability habitat in the unit defined by the HUC6 and elevation zone; see Appendix D for more explanation,map files accompanying this plan for location of the HUC6’s, and electronic files accompanying the plan forranking of all watersheds and units.
Red Tree VoleSpecial Designations: “Vulnerable” (ONHP).
Distribution, Status, and Trends: This small, highly specialized rodent resides mainly in theCascade and Coast Range portions of the basin. From 650 surveys in potentially suitablehabitat on national forests and BLM lands in western Oregon, a total of over 254 sites werediscovered (Biswell et al. 2000). Survey data suggest the species may be less frequent in themore northerly part of the Cascades (for example, Clackamas and North Santiamwatersheds).
Key Environmental Correlates: The preferred habitat of this vole appears to be moist, old-growthconiferous forest, especially Douglas-fir. To a lesser degree this vole uses mid-aged closed-canopy forests that have significant stands of large-diameter (>21 inch) trees. It spends nearlyits entire life high in conifer trees (Meiselman and Doyle 1996). Tall, multi-layered canopiesof old growth retain humidity and intercept fog, which functions as a climatic buffer and asource of free water. Large branches provide stable support for nests, protection from storms,and travel routes (Biswell et al. 2000).
Threats, Limiting Factors, Population Viability: Continued loss of unmanaged old growth standsdue to logging and fire will threaten this species. Changes in forest microclimate (drying) asa result of adjoining clearcuts, roads, and global warming also could adversely it.
Biological Objectives: Maintain or expand existing numbers and geographic distributionthrough protection, restoration, and management of suitable habitat. Lengthen the usualharvest rotation period to sustain a supply of old growth trees.
Conservation Needs: Table 3-102 shows the sixth-field HUC units that may contain the mostsuitable habitat for this species. The estimates are from application of simple species-habitatmodels to early 1990s aerial imagery, so they are very approximate. For more information onHUC6 units with suitable habitat for this species, such as units that are publicly owned,privately owned, or identified by the The Nature Conservancy as Priority ConservationAreas, see Appendix D.

DRAFT WILLAMETTE SUBBASIN PLAN
CH 3 ASSESSMENT.DOC 3-241
Table 3-102: HUC6 Units with the Most Suitable Habitat for Red Tree Vole
HUC6Watershed Nam
(Not Comprehensive) Elev HabAcOK HabAcBest HS
170900110402 Timothy Lake; Dinger Lake 5 15565 10823 3.16
170900040301 Blue River Reservoir & Cook Cr. 3 3063 1111 2.80
170900020102 Creswell W.; Camas Swale 2 2500 290 2.73
170900030103 Coyote Cr. 2 12864 1456 2.36
170900110301 Big Cliff Reservoir 4 9847 2759 2.35
Elevation zones (Elev) are:1= <500 ft, 2= 500-1000 ft, 3= 1000-2000 ft; 4= 2000-3000 ft; 5= 3000-4000 ft, 6= >4000 ftHabAcOK is the acres of possible habitat, i.e., scored >5 for habitat suitability on a 0-10 scale.HabAcBest is the acres of habitat scored a “10.”The habitat suitability score is a relative index that represents the proportional extent (not acres) of higher-suitability habitat in the unit defined by the HUC6 and elevation zone; see Appendix D for more explanation,map files accompanying this plan for location of the HUC6’s, and electronic files accompanying the plan forranking of all watersheds and units.
Townsend’s (Pacific Western) Big-eared BatSpecial Designations: “Vulnerable” (ONHP).
Distribution, Status, and Trends: This is one of the least common of the bats that use old-growthconifer forest. The ORNHIC database contains documented records from 16 of the 170Willamette watersheds. It may be more common in the Coast Range than Cascades; numbersin northwestern Oregon were coarsely estimated at 300-400 individuals in 1987 but reliablesurvey data are too few to determine trends or densities.
Key Environmental Correlates: This species may not be highly dependent on old growthconiferous forests, but neither does it appear to be strongly associated with other forestedcover types. Like many bats, its main requirement is for cool roosting and hibernation sites,and for these the bark and cavities of very large trees provides suitable sites. This need is alsomet by caves, large rock outcrops, and some abandoned buildings or mine tunnels. This batforages primarily over water, riparian areas, wetlands, and small canopy gaps in forests.
Threats, Limiting Factors, Population Viability: Major threats include disturbance of cave roosts(especially maternity colonies and hibernation sites) by recreationists; blockage of caveentrances from intentional or natural events; and loss of mature and old-growth forest fromlogging and fire. Pesticide spraying can potentially affect the insect populations upon whichthis bat feeds.
Biological Objectives: Maintain or expand existing numbers and geographic distributionthrough protection, restoration, and management of suitable habitat. Lengthen the usualharvest rotation period to sustain a supply of old growth trees.

DRAFT WILLAMETTE SUBBASIN PLAN
3-242 CH 3 ASSESSMENT.DOC
3.2.6 Future Conditions with No New Actions
3.2.6.1 Plan Trend 2050Given the timeline and budget for development of this Willamette Subbasin Plan, it is notpossible to provide a detailed characterization of future environmental conditions with nonew actions for each of the focal species and habitats selected for assessment. However, thePacific Northwest Ecosystem Research Consortium recently analyzed three alternative futurescenarios for the Willamette Basin. The results are published in the Willamette River BasinPlanning Atlas (Oregon State University Press, 2002).
PNERC evaluated the impacts of plausible actions on aquatic and terrestrial species by usingecological response models keyed to highly detailed land cover information. The scenarioseach identified changes through the year 2050, and each assumed a common 2050 populationof 3.9 million residents—about a doubling of the 1990 human population.
One of the scenarios, Plan Trend 2050, assumes that existing long-term plans and policies(such as the federal Northwest Forest Plan, Oregon’s land use planning system) will beunchanged and fully implemented; the scenario also projects recent trends in humanpopulation growth, land use, and water use through 2050. By combining long-term plans andrecent trends, the scenario portrays forest and agricultural land uses along with residential,industrial, and commercial development. The analysis of the Plan Trend 2050 scenario,therefore, offers insight into the trajectory of Willamette basin environmental conditions andcan approximate environmental conditions absent new actions.
Before describing environmental conditions under Plan Trend 2050, this scenario’sassumptions and settings need to be specified. Plan Trend 2050 has about 93 percent of the2050 population living inside compact urban growth boundaries (UGBs), with residentialdensities increased significantly over current levels. To accommodate the larger basinpopulation, in 2050 UGBs have expanded 51,000 acres beyond their 1990 extent. Nearlytwo-thirds of this expansion occurs in the cities of Portland, Salem, Eugene/Springfield,Albany, and Corvallis.
Consistent with current land use planning regulations, no additional rural residential zonesare established; however, new rural residences built after 1990 are located on vacant ruralparcels existing today. Using densities consistent with each county’s zoning, Plan Trend2050 shows complete rural residential build-out by 2020.
The amount of prime farmland in the Plan Trend 2050 scenario remains about the same astoday, but about 40,000 acres have been converted to urban uses. Plan Trend 2050 showsincreases in the nursery sector and in hybrid poplar plantations, while grass seed, orchards,berries, and Christmas trees remain major crops. Plan Trend 2050 increases the amount ofriparian vegetation along currently regulated water-quality limited streams (Oregon SenateBill 1010 and Clean Water Act section 303d) by approximately 10 percent over today’sconditions.
Federally managed public forest lands in this scenario follow the Northwest Forest Plan. Oldgrowth forests remain concentrated on federal lands. No changes occur in national wildliferefuge management. State and private forest lands in Plan Trend 2050 follow the 1995Oregon Forest Practices Act.

DRAFT WILLAMETTE SUBBASIN PLAN
CH 3 ASSESSMENT.DOC 3-243
3.2.6.2 Environmental Conditions in 2050Aquatic Habitats and Species. Water use has a direct impact on aquatic habitats andpopulations of aquatic species. In Plan Trend 2050, growing surface water demand reflectspopulation and economic growth, with municipal demands nearly doubling from the year2000 and an increased demand for agricultural irrigation. Under Plan Trend 2050, increasesin agricultural, municipal, industrial, and domestic water consumption would result in theloss of nearly an additional 8 percent of current habitat volume.
However, local impacts of water use on habitat quantity can be more significant. Forexample, in the mid-Willamette subbasin, model results suggest that under Plan Trend 2050,habitat volume could decline an additional 19 percent. While all 2nd- to 4th-order streams inthe basin maintained some flow historically, according to PNERC’s models, currently, anestimated 82 miles of stream have gone dry as a result of water withdrawals, and this numberwould double to 169 miles under Plan Trend 2050.
Under Plan Trend 2050, conditions for cutthroat trout would improve slightly in streamsdraining federally managed forest lands but would continue to decline in streams drainingprivately managed and state-managed forest lands. Overall, however, all indices ofenvironmental condition decline under the Plan Trend 2050 scenario, this includes the Indexof Biological Integrity, a native fish richness index, and invertebrate indices) (seeFigure 3-32).
Nevertheless, overall, the models’ projected environmental conditions for Plan Trend 2050(and even a more development-oriented scenario) are not significantly different from todayfor all indicators of stream condition. This is in part because most of the land converted tourban and residential use under Plan Trend 2050 is in agriculture today, and theenvironmental effects of urban development and agricultural land use appear to beequivalent.
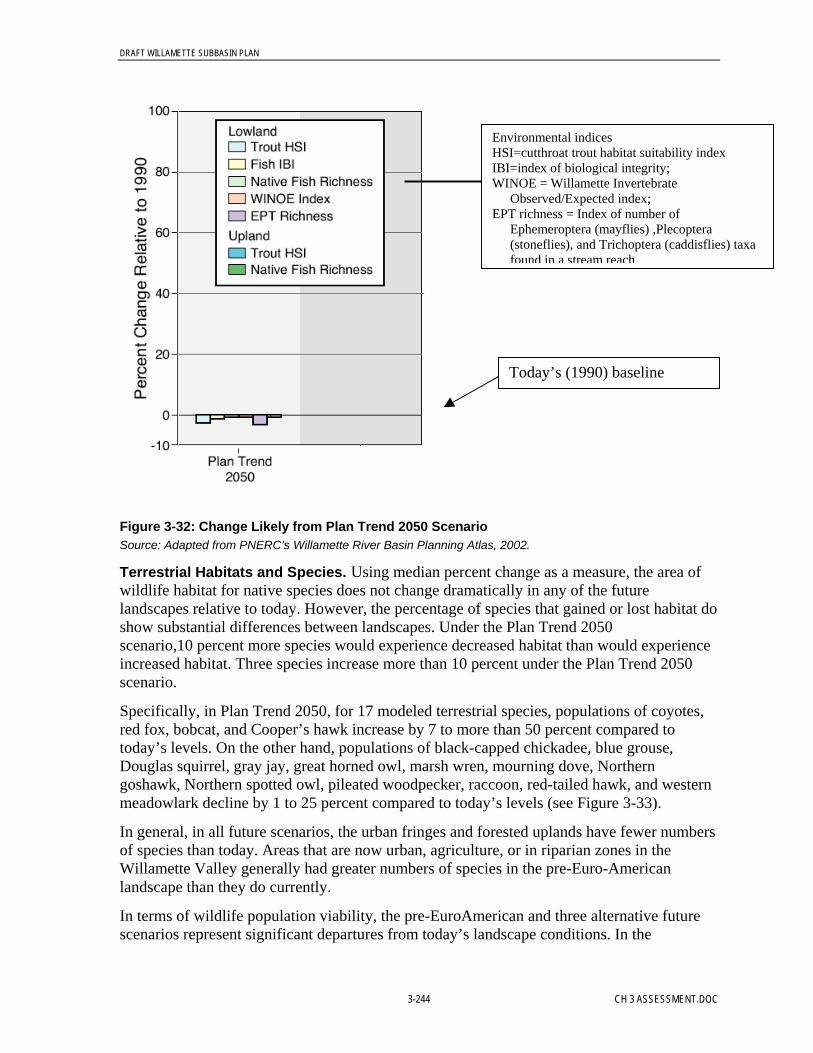
DRAFT WILLAMETTE SUBBASIN PLAN
3-244 CH 3 ASSESSMENT.DOC
Figure 3-32: Change Likely from Plan Trend 2050 ScenarioSource: Adapted from PNERC’s Willamette River Basin Planning Atlas, 2002.
Terrestrial Habitats and Species. Using median percent change as a measure, the area ofwildlife habitat for native species does not change dramatically in any of the futurelandscapes relative to today. However, the percentage of species that gained or lost habitat doshow substantial differences between landscapes. Under the Plan Trend 2050scenario,10 percent more species would experience decreased habitat than would experienceincreased habitat. Three species increase more than 10 percent under the Plan Trend 2050scenario.
Specifically, in Plan Trend 2050, for 17 modeled terrestrial species, populations of coyotes,red fox, bobcat, and Cooper’s hawk increase by 7 to more than 50 percent compared totoday’s levels. On the other hand, populations of black-capped chickadee, blue grouse,Douglas squirrel, gray jay, great horned owl, marsh wren, mourning dove, Northerngoshawk, Northern spotted owl, pileated woodpecker, raccoon, red-tailed hawk, and westernmeadowlark decline by 1 to 25 percent compared to today’s levels (see Figure 3-33).
In general, in all future scenarios, the urban fringes and forested uplands have fewer numbersof species than today. Areas that are now urban, agriculture, or in riparian zones in theWillamette Valley generally had greater numbers of species in the pre-Euro-Americanlandscape than they do currently.
In terms of wildlife population viability, the pre-EuroAmerican and three alternative futurescenarios represent significant departures from today’s landscape conditions. In the
Today’s (1990) baseline
Environmental indicesHSI=cutthroat trout habitat suitability indexIBI=index of biological integrity;WINOE = Willamette Invertebrate
Observed/Expected index;EPT richness = Index of number of
Ephemeroptera (mayflies) ,Plecoptera(stoneflies), and Trichoptera (caddisflies) taxafound in a stream reach
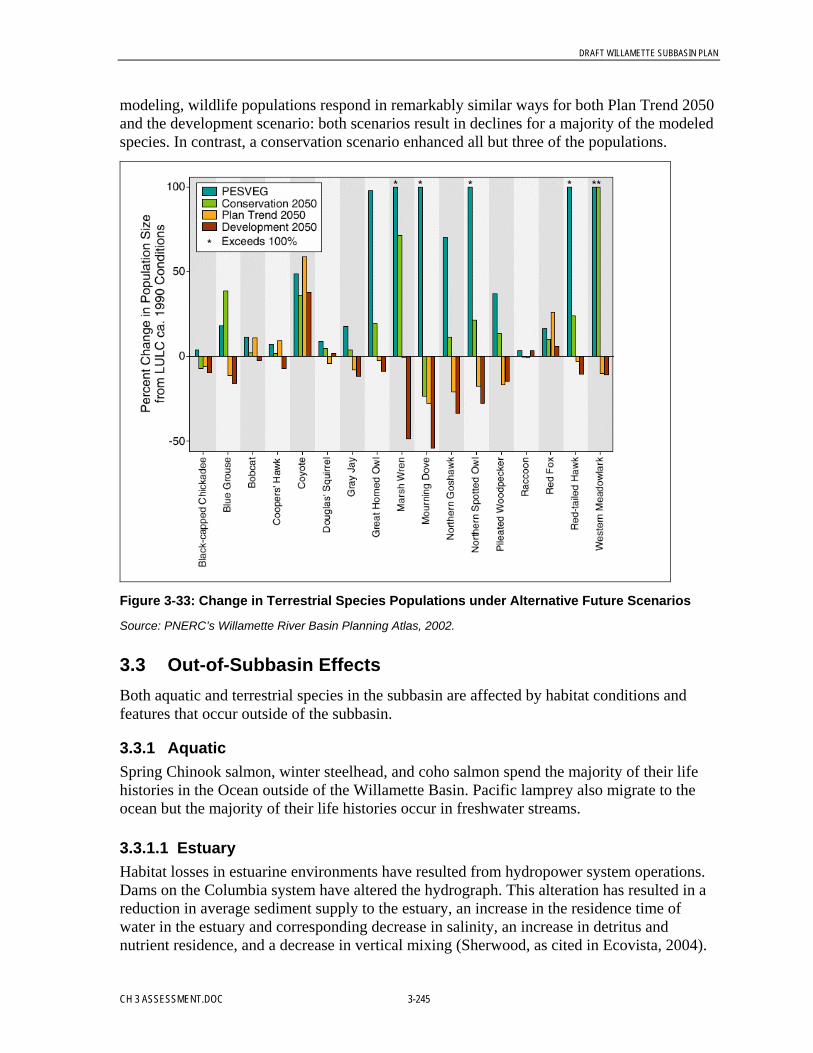
DRAFT WILLAMETTE SUBBASIN PLAN
CH 3 ASSESSMENT.DOC 3-245
modeling, wildlife populations respond in remarkably similar ways for both Plan Trend 2050and the development scenario: both scenarios result in declines for a majority of the modeledspecies. In contrast, a conservation scenario enhanced all but three of the populations.
Figure 3-33: Change in Terrestrial Species Populations under Alternative Future Scenarios
Source: PNERC’s Willamette River Basin Planning Atlas, 2002.
3.3 Out-of-Subbasin EffectsBoth aquatic and terrestrial species in the subbasin are affected by habitat conditions andfeatures that occur outside of the subbasin.
3.3.1 AquaticSpring Chinook salmon, winter steelhead, and coho salmon spend the majority of their lifehistories in the Ocean outside of the Willamette Basin. Pacific lamprey also migrate to theocean but the majority of their life histories occur in freshwater streams.
3.3.1.1 EstuaryHabitat losses in estuarine environments have resulted from hydropower system operations.Dams on the Columbia system have altered the hydrograph. This alteration has resulted in areduction in average sediment supply to the estuary, an increase in the residence time ofwater in the estuary and corresponding decrease in salinity, an increase in detritus andnutrient residence, and a decrease in vertical mixing (Sherwood, as cited in Ecovista, 2004).

DRAFT WILLAMETTE SUBBASIN PLAN
3-246 CH 3 ASSESSMENT.DOC
These changes have converted the estuary to a less energetic system with high organicsedimentation rates. The changes have caused an overall loss of estuarine habitat used forrearing and has contributed to the decline in habitat quantity and quality (Ecovista, 2004)
3.3.1.2 NearshoreEl Niño events, combined with other climatic and oceanic phenomenon, have caused a shiftin ocean conditions over the past two decades; impacting Columbia Basin salmon returns(NMFS, 2000). Based on the cyclic nature of the oceanic and climatic regimes, conditionsare likely going to become more favorable for fish in the next decade (NMFS, 2000).
3.3.1.3 Marine14
Ocean conditions strongly affect overall salmon survival. Salmon spend most of their life inthe ocean and early ocean survival is widely considered to be a time of particularly highmortality. In recent years, a growing body of evidence from field, tagging, and correlationstudies shows that Pacific salmon experience large year-to-year fluctuations in survival ratesof juvenile fish making the transition from freshwater to marine environment (Hare et al.1999). Climate-related changes have the most affect on salmon survival very early in thesalmon’s marine life history (Pearcy 1992, Francis and Hare 1994).
The Pacific Decadal Oscillation is a pan-Pacific, recurring pattern of ocean-atmosphericvariability that alternates between climate regimes every 20-30 years (Hare et al. 1999). ThePDO affects water temperatures off the coast of Oregon and Washington and has cold(negative) and warm (positive) phases (Hare et al. 1999). A positive PDO phase bringswarmer water to the eastern North Pacific, reducing upwelling of nutrient-rich cooler wateroff the coast of North America and decreasing juvenile salmon survival (Hare et al. 1999).The negative phase of the PDO has the opposite effect, tending to increase salmon survival.
Climatic changes are manifested in both returns and harvests. Mantua et al. (1997) foundevidence of an inverse relationship between harvests in Alaska and off the coast of Oregonand Washington. The negative phase of the PDO resulted in larger harvests of ColumbiaRiver stocks and lower harvests of Alaskan stocks. In the positive phase, warmer waterresulted in lower harvests (and runs) in the Columbia River, but higher harvests in Alaska.Phase reversals occurred around 1925, 1947, 1977, and possibly 1999. The periods from1925-1947 and from 1977-1999 were periods of low returns to the Columbia River, whileperiods from 1947-1977 and the current period are periods of high returns.
El Nino/Southern Oscillation. The El Nino-Southern Oscillation (ENSO), commonlyreferred to as El Nino and La Nina), like the PDO, affects water temperatures off the coast ofOregon and Washington and has both a cold (negative) and warm (positive) phase. ENSOevents are much shorter than PDO events in that events typically occur every 2-7 years andlast 12-18 months. Positive ENSO events occur more frequently during positive PDO phasesand less frequently during negative PDO phases (Hare et al. 1999). ENSO events intensify ormoderate the effects of PDO changes on salmon survival.
A positive ENSO (El Nino) event also results in higher North Pacific Ocean temperatures,while a negative ENSO (La Nina) results in lower temperatures. Positive ENSO events occur
14 This information is taken from TOAST, February 2004.

DRAFT WILLAMETTE SUBBASIN PLAN
CH 3 ASSESSMENT.DOC 3-247
more frequently during positive PDO phases and less frequently during negative PDO phases(Hare et al. 1999).
PDO and ENSO also affect freshwater habitat of salmon. Positive PDO and ENSO eventsgenerally result in less precipitation in the Columbia Basin. Lower stream flows result inhigher water temperatures and a longer outmigration. It is likely that less water will be spilledover mainstem Columbia and Snake river dams to assist smolt outmigration (Hare et al.1999).
Climate Change. Climate change on a longer term than the PDO could have a large impacton the survival of Columbia Basin salmon. Finney et al. (2000) used lake sediment elementalcomposition to find evidence of very long term cycles of abundance of sockeye salmon in theBristol Bay and Kodiak Island regions of Alaska over the past 300 years. No doubt therehave been similar variations in the abundance of Columbia Basin salmon.
Computer models generally agree that the climate in the Pacific Northwest will become, overthe next half century, gradually warmer and wetter, with an increase of precipitation in winterand warmer, drier summers (USDA Forest Service 2004). These trends mostly agree withobserved changes over the past century. Wetter winters would likely mean more flooding ofcertain rivers, and landslides on steep coastal bluffs (Mote et al. 1999) with higher levels ofwood and grass fuels and increased wildland fire risk compared to previous disturbanceregimes (USDA Forest Service 2004). The region’s warm, dry summers may see slightincreases in rainfall, according to the models, but the gains in rainfall will be more than offsetby losses due to increased evaporation. Loss of moderate-elevation snowpack in response towarmer winter temperatures would have enormous and mostly negative impacts on theregion’s water resources, forests, and salmon (Mote et al. 1999). Among these impacts are adiminished ability to store water in reservoirs for summer use, and spawning and rearingdifficulties for salmon.
Climate models lack the spatial resolution and detailed representation of critical physicalprocesses that would be necessary to simulate important factors like coastal upwelling andvariation in currents. Different models give different answers on how climate change willaffect patterns and frequencies of climate variations such as ENSO and PDO.
For the factors that climate models can simulate with some confidence, however, theprospects for many Pacific Northwest salmon stocks could worsen. The general picture ofincreased winter flooding and decreased summer and fall streamflows, along with elevatedstream and estuary temperatures, would be especially problematic for in-stream and estuarinesalmon habitat. For salmon runs that are already under stress from degraded freshwater andestuarine habitat, these changes may cause more severe problems than for more robustsalmon runs that utilize healthy streams and estuaries.
While it is straightforward to describe the probable effects of these environmental pattersindividually, their interaction (PDO, ENSO, climate change) is more problematic. The mainquestion appears to be the duration of the present favorable (for salmon) PDO period and thetiming and intensity of the subsequent unfavorable period. Prudence suggests planning for ashorter favorable period and a subsequent longer, if not more intense, unfavorable period.
DRAFT WILLAMETTE SUBBASIN PLAN
3-248 CH 3 ASSESSMENT.DOC
3.3.1.4 Mainstem HabitatPredation seems to be a major impact on juveniles and may be an important factor on adults.Heavy predation by birds on outmigrating juveniles has recently been documented in theColumbia River Estuary. It is also likely that fish predators and marine mammals are turningto salmonids as a response to the very low smelt runs. Marine mammal impacts appear to beimportant for adult winter steelhead and spring chinook. Human caused factors such asconstructing protected nesting islands or causing the spring outmigration flows to be lowerand clearer than normal (due to storage of spring flows) can exacerbate predation problems.Large aggregations of hatchery fish can also attract predators to hit wild fish also (Martin et.al. 1998)
3.3.1.5 HydropowerDams on the Columbia system have altered the hydrograph which may impact springoutmigration flows and habitat (see Sections 3.4.1.1 and 3.4.1.4 ). No hydroelectric damsoccur between the mouth of the Willamette and the ocean.
3.3.1.6 Out-of-Subbasin HarvestHistoric production, release and harvest of large numbers of hatchery produced fishencouraged the incidental over-harvest of wild stocks prior to marking programs (seeSection 3.2.4.7). Harvest rates in the past have been too high for wild stocks to sustain.Ocean and in river harvest rates may have been 50-70% for spring chinook and as high as25% for steelhead. Steelhead are currently unaffected by lower Columbia gillnet seasons andare subject to selective sport fisheries due to fin-clipping. Spring chinook harvest rates havebeen substantially reduced in the Columbia (Martin et. al. 1998). Marking (fin-clipping)enables selective harvest of hatchery fish and has substantially reduced this problem in recentyears, but historic harvest pressure on naturally produced fish likely further contributed togenetic simplification. Reductions in North Pacific Ocean fisheries impacts on Willamette chinookwould be helpful, but appear to be unlikely in the near term (Martin et. al. 1998).
3.3.1.7 HatcheriesHatchery-reared salmon and steelhead have impacts on wild anadromous salmonids throughcompetitive interaction, genetic introgression, and disease transmission (see Section 3.2.4.7).Recent efforts to decrease the likelihood of negative impacts from hatchery competition andinterbreeding have been undertaken through Hatchery and genetics management plans. Thelarge runs of salmonids currently seen in the Willamette are expected to be largely ofhatchery origin (WLCTRT 2002). The impact of non-Willamette hatchery fish in out-of-subbasin life history stages is unknown. Hatchery and genetics management plans arecurrently under development for upper Willamette Pacific salmonid stocks. Implementationof these plans will guide management to address many of the issues associated with risksresulting from decline of genetic diversity. Increased habitat capacity throughout the basinwill, over time, improve the likelihood that new life history strategies will develop inresponse to more diverse and well distributed habitat characteristics.
3.3.2 TerrestrialIn general, most mammals, amphibians, reptiles, and rare plant species are not strongly anddirectly affected by factors outside the Willamette subbasin. This is because, except for a few

DRAFT WILLAMETTE SUBBASIN PLAN
CH 3 ASSESSMENT.DOC 3-249
large predators and scavengers, their seasonal and annual movements are constrained to areasentirely within the subbasin. Thus, external factors most likely to affect these groups are onesthat occur over broad regions, such as global warming, spread of invasive species, and long-distance movement of airborne contaminants and food sources (such as fish). In contrast,many bird species (like fish) migrate or forage beyond the subbasin and thus can be limitedmore strongly by factors elsewhere. However, sound information is lacking with regard towhich species are being limited by which particular external factors, and whether factorsbeyond the subbasin are more limiting than those within.
3.4 Environment/Population RelationshipsOverall, stream management activities, such as restoration and enhancement, provideenormous benefits to stream- and riparian-associated wildlife, both directly by increasing theproductivity of fish and other aquatic organisms upon which some terrestrial animals feed,and indirectly by improving habitat complexity and quality. Approximately six terrestrialvertebrates of the Willamette Basin (four of which are residents) have been documented ashaving a “strong and consistent association” with salmonid fish (see Table 3-103). Anadditional 70 terrestrial vertebrates (including 44 residents) have been documented as havinga “recurrent,” “indirect,” or “rare” association with salmonids (Cedarholm et al., 2001). Nopopulation trends data are available for the mammals or amphibians listed in Table 3-103,and for birds, trends are known only for the period beginning in 1968, from Breeding BirdSurvey data. Those data, which mainly cover roadsides, do not show any statisticallysignificant regional decreases for any bird species having a “strong and consistent” or“recurrent” relationship to salmonids; and in fact, some of the species (such as osprey) havehad significant increases.
Table 3-103: Wildlife Species of the Willamette Basin Documented to Feed on (Or Are OtherwiseFunctionally Linked to) Live or Dead Salmonid Fish*
Species Grouped by Degree ofAssociation with Salmonids
SpeciesStatus How or When Associated with Salmonids
STRONG AND CONSISTENT ASSOCIATION:
Bald Eagle Resident Carcasses
Bald Eagle Resident Spawning—freshwater
Black Bear Resident Carcasses
Black Bear Resident Spawning—freshwater
Common Merganser Resident Freshwater rearing—fry, fingerling, and parr
Common Merganser Resident Incubation—eggs and alevin
Northern River Otter Resident Carcasses
Northern River Otter Resident Freshwater rearing—fry, fingerling, and parr
Northern River Otter Resident Spawning—freshwater
Harlequin Duck Seasonal Incubation—eggs and alevin

DRAFT WILLAMETTE SUBBASIN PLAN
3-250 CH 3 ASSESSMENT.DOC
Table 3-103: Wildlife Species of the Willamette Basin Documented to Feed on (Or Are OtherwiseFunctionally Linked to) Live or Dead Salmonid Fish*
Species Grouped by Degree ofAssociation with Salmonids
SpeciesStatus How or When Associated with Salmonids
Osprey Seasonal Freshwater rearing—fry, fingerling, and parr
Osprey Seasonal Spawning—freshwater
RECURRENT ASSOCIATION:
American Crow Resident Carcasses
American Crow Resident Freshwater rearing—fry, fingerling, and parr
American Dipper Resident Carcasses
American Dipper Resident Freshwater rearing—fry, fingerling, and parr
American Dipper Resident Incubation—eggs and alevin
Barrow’s Goldeneye Resident Carcasses
Barrow’s Goldeneye Resident Freshwater rearing—fry, fingerling, and parr
Barrow’s Goldeneye Resident Incubation—eggs and alevin
Belted Kingfisher Resident Freshwater rearing—fry, fingerling, and parr
Belted Kingfisher Resident Spawning—freshwater
Bobcat Resident Carcasses
Bobcat Resident Spawning—freshwater
Common Merganser Resident Carcasses
Common Raven Resident Carcasses
Common Raven Resident Freshwater rearing – fry, fingerling, and parr
Common Raven Resident Spawning—freshwater
Coyote Resident Carcasses
Great Blue Heron Resident Freshwater rearing—fry, fingerling, and parr
Mink Resident Carcasses
Mink Resident Freshwater rearing—fry, fingerling, and parr
Mink Resident Spawning—freshwater
Pacific Giant Salamander Resident Freshwater rearing—fry, fingerling, and parr
Pacific Giant Salamander Resident Incubation—eggs and alevin
Pied-billed Grebe Resident Freshwater rearing—fry, fingerling, and parr
Raccoon Resident Carcasses
Raccoon Resident Freshwater rearing—fry, fingerling, and parr
Steller’s Jay Resident Carcasses
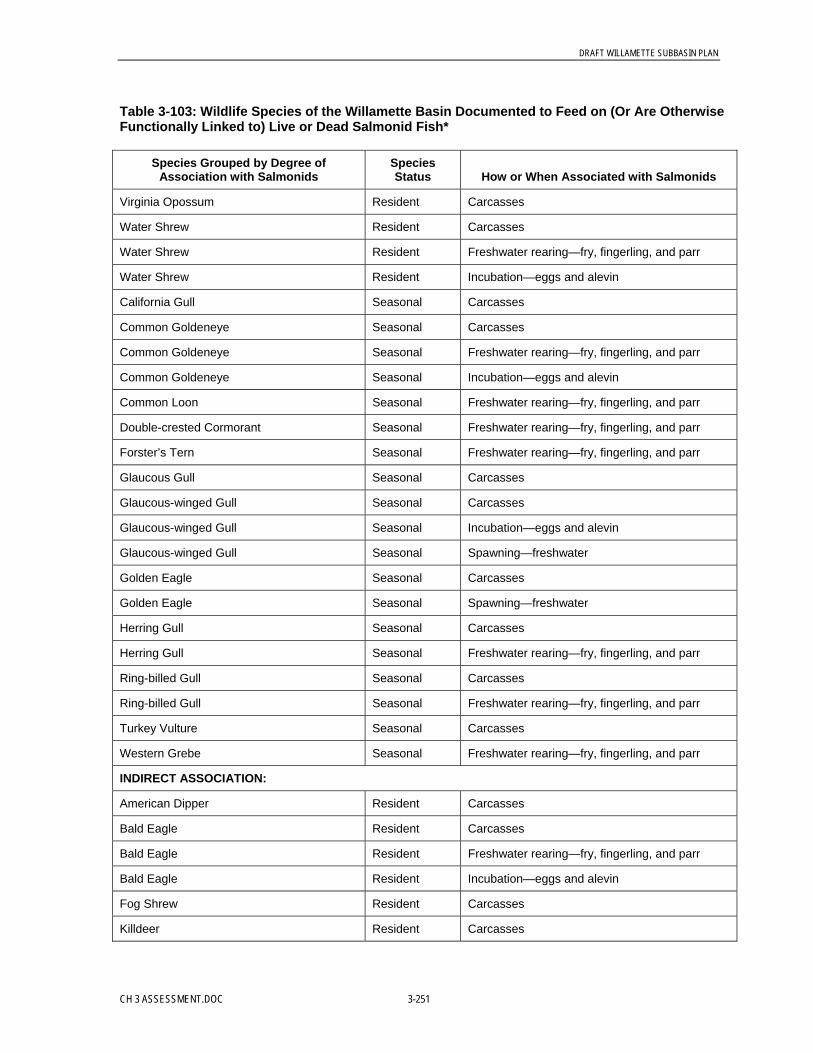
DRAFT WILLAMETTE SUBBASIN PLAN
CH 3 ASSESSMENT.DOC 3-251
Table 3-103: Wildlife Species of the Willamette Basin Documented to Feed on (Or Are OtherwiseFunctionally Linked to) Live or Dead Salmonid Fish*
Species Grouped by Degree ofAssociation with Salmonids
SpeciesStatus How or When Associated with Salmonids
Virginia Opossum Resident Carcasses
Water Shrew Resident Carcasses
Water Shrew Resident Freshwater rearing—fry, fingerling, and parr
Water Shrew Resident Incubation—eggs and alevin
California Gull Seasonal Carcasses
Common Goldeneye Seasonal Carcasses
Common Goldeneye Seasonal Freshwater rearing—fry, fingerling, and parr
Common Goldeneye Seasonal Incubation—eggs and alevin
Common Loon Seasonal Freshwater rearing—fry, fingerling, and parr
Double-crested Cormorant Seasonal Freshwater rearing—fry, fingerling, and parr
Forster’s Tern Seasonal Freshwater rearing—fry, fingerling, and parr
Glaucous Gull Seasonal Carcasses
Glaucous-winged Gull Seasonal Carcasses
Glaucous-winged Gull Seasonal Incubation—eggs and alevin
Glaucous-winged Gull Seasonal Spawning—freshwater
Golden Eagle Seasonal Carcasses
Golden Eagle Seasonal Spawning—freshwater
Herring Gull Seasonal Carcasses
Herring Gull Seasonal Freshwater rearing—fry, fingerling, and parr
Ring-billed Gull Seasonal Carcasses
Ring-billed Gull Seasonal Freshwater rearing—fry, fingerling, and parr
Turkey Vulture Seasonal Carcasses
Western Grebe Seasonal Freshwater rearing—fry, fingerling, and parr
INDIRECT ASSOCIATION:
American Dipper Resident Carcasses
Bald Eagle Resident Carcasses
Bald Eagle Resident Freshwater rearing—fry, fingerling, and parr
Bald Eagle Resident Incubation—eggs and alevin
Fog Shrew Resident Carcasses
Killdeer Resident Carcasses

DRAFT WILLAMETTE SUBBASIN PLAN
3-252 CH 3 ASSESSMENT.DOC
Table 3-103: Wildlife Species of the Willamette Basin Documented to Feed on (Or Are OtherwiseFunctionally Linked to) Live or Dead Salmonid Fish*
Species Grouped by Degree ofAssociation with Salmonids
SpeciesStatus How or When Associated with Salmonids
Pacific Shrew Resident Carcasses
Pacific Water Shrew Resident Carcasses
Peregrine Falcon Resident Carcasses
Peregrine Falcon Resident Freshwater rearing—fry, fingerling, and parr
Spotted Sandpiper Resident Carcasses
Trowbridge’s Shrew Resident Carcasses
Vagrant Shrew Resident Carcasses
Water Shrew Resident Carcasses
Cliff Swallow Seasonal Carcasses
Harlequin Duck Seasonal Carcasses
Northern Rough-winged Swallow Seasonal Carcasses
Tree Swallow Seasonal Carcasses
Violet-green Swallow Seasonal Carcasses
Willow Flycatcher Seasonal Carcasses
RARELY ASSOCIATED:
American Marten Resident Carcasses
American Robin Resident Incubation—eggs and alevin
Canvasback Seasonal Carcasses
Common Garter Snake Resident Freshwater rearing—fry, fingerling, and parr
Common Loon Seasonal Carcasses
Deer Mouse Resident Carcasses
Douglas’ Squirrel Resident Carcasses
Fog Shrew Resident Carcasses
Franklin’s Gull Seasonal Freshwater rearing—fry, fingerling, and parr
Gray Fox Resident Carcasses
Gray Jay Resident Carcasses
Great Egret Seasonal Freshwater rearing—fry, fingerling, and parr
Greater Scaup Seasonal Carcasses
Greater Scaup Seasonal Incubation—eggs and alevin
Greater Yellowlegs Seasonal Incubation—eggs and alevin
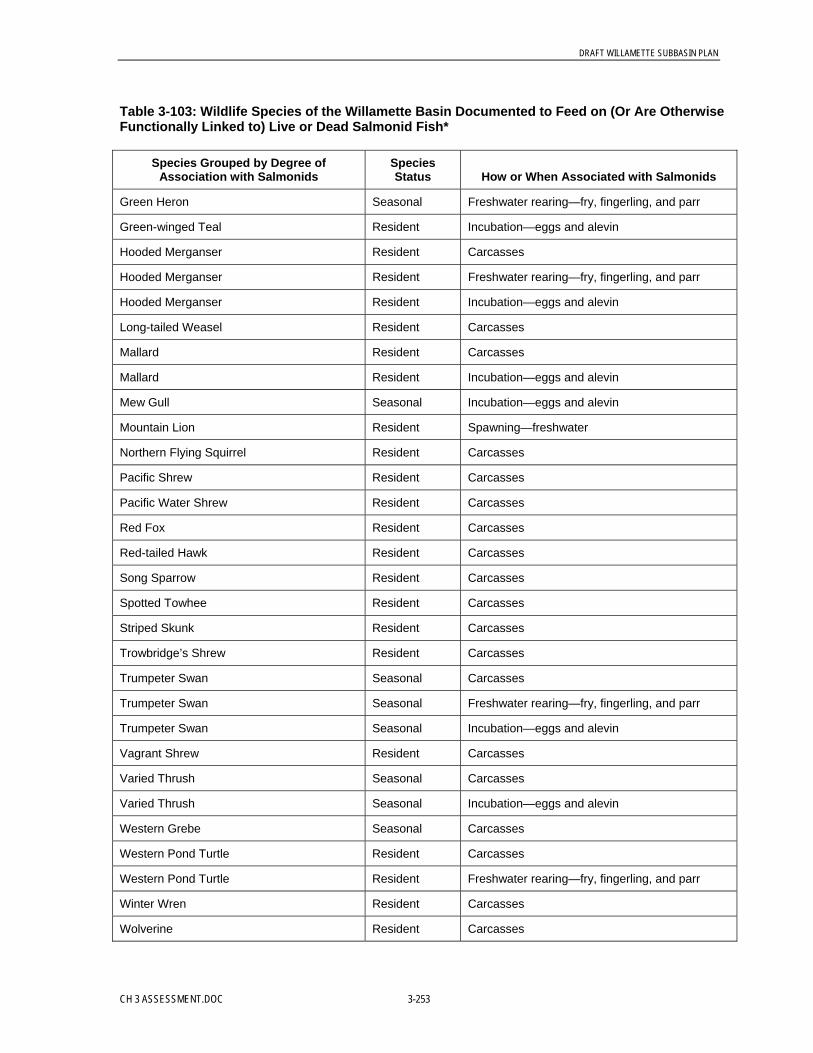
DRAFT WILLAMETTE SUBBASIN PLAN
CH 3 ASSESSMENT.DOC 3-253
Table 3-103: Wildlife Species of the Willamette Basin Documented to Feed on (Or Are OtherwiseFunctionally Linked to) Live or Dead Salmonid Fish*
Species Grouped by Degree ofAssociation with Salmonids
SpeciesStatus How or When Associated with Salmonids
Green Heron Seasonal Freshwater rearing—fry, fingerling, and parr
Green-winged Teal Resident Incubation—eggs and alevin
Hooded Merganser Resident Carcasses
Hooded Merganser Resident Freshwater rearing—fry, fingerling, and parr
Hooded Merganser Resident Incubation—eggs and alevin
Long-tailed Weasel Resident Carcasses
Mallard Resident Carcasses
Mallard Resident Incubation—eggs and alevin
Mew Gull Seasonal Incubation—eggs and alevin
Mountain Lion Resident Spawning—freshwater
Northern Flying Squirrel Resident Carcasses
Pacific Shrew Resident Carcasses
Pacific Water Shrew Resident Carcasses
Red Fox Resident Carcasses
Red-tailed Hawk Resident Carcasses
Song Sparrow Resident Carcasses
Spotted Towhee Resident Carcasses
Striped Skunk Resident Carcasses
Trowbridge’s Shrew Resident Carcasses
Trumpeter Swan Seasonal Carcasses
Trumpeter Swan Seasonal Freshwater rearing—fry, fingerling, and parr
Trumpeter Swan Seasonal Incubation—eggs and alevin
Vagrant Shrew Resident Carcasses
Varied Thrush Seasonal Carcasses
Varied Thrush Seasonal Incubation—eggs and alevin
Western Grebe Seasonal Carcasses
Western Pond Turtle Resident Carcasses
Western Pond Turtle Resident Freshwater rearing—fry, fingerling, and parr
Winter Wren Resident Carcasses
Wolverine Resident Carcasses
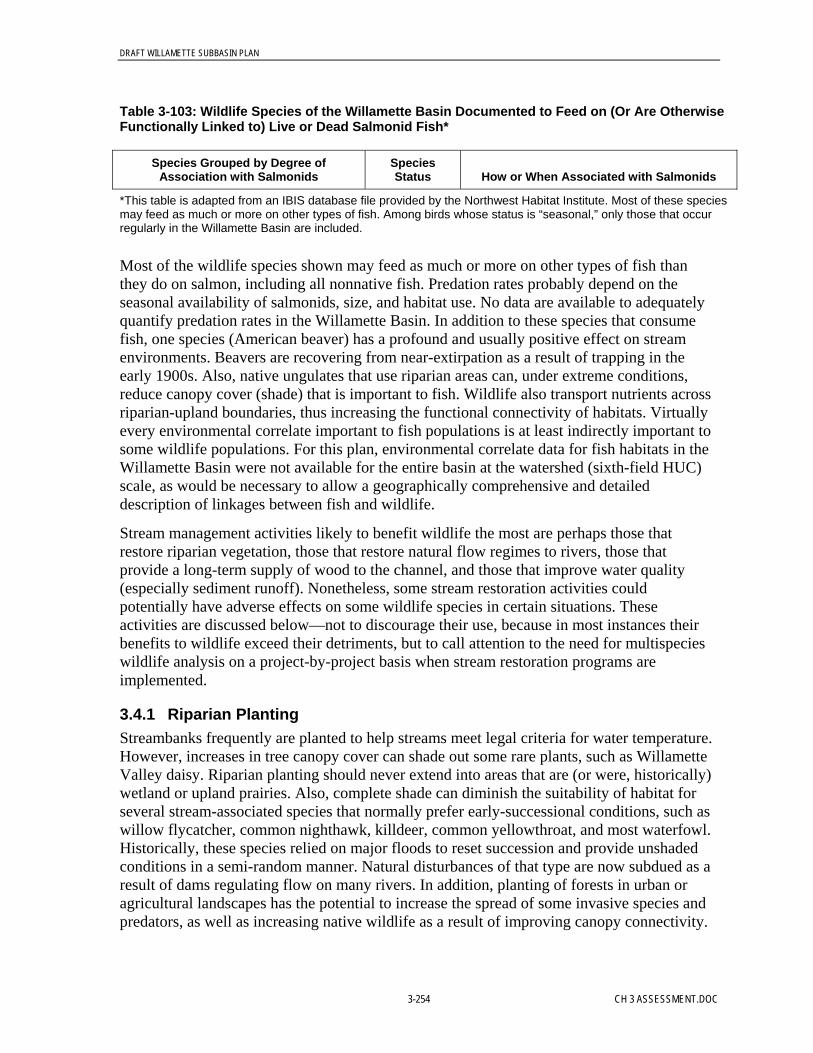
DRAFT WILLAMETTE SUBBASIN PLAN
3-254 CH 3 ASSESSMENT.DOC
Table 3-103: Wildlife Species of the Willamette Basin Documented to Feed on (Or Are OtherwiseFunctionally Linked to) Live or Dead Salmonid Fish*
Species Grouped by Degree ofAssociation with Salmonids
SpeciesStatus How or When Associated with Salmonids
*This table is adapted from an IBIS database file provided by the Northwest Habitat Institute. Most of these speciesmay feed as much or more on other types of fish. Among birds whose status is “seasonal,” only those that occurregularly in the Willamette Basin are included.
Most of the wildlife species shown may feed as much or more on other types of fish thanthey do on salmon, including all nonnative fish. Predation rates probably depend on theseasonal availability of salmonids, size, and habitat use. No data are available to adequatelyquantify predation rates in the Willamette Basin. In addition to these species that consumefish, one species (American beaver) has a profound and usually positive effect on streamenvironments. Beavers are recovering from near-extirpation as a result of trapping in theearly 1900s. Also, native ungulates that use riparian areas can, under extreme conditions,reduce canopy cover (shade) that is important to fish. Wildlife also transport nutrients acrossriparian-upland boundaries, thus increasing the functional connectivity of habitats. Virtuallyevery environmental correlate important to fish populations is at least indirectly important tosome wildlife populations. For this plan, environmental correlate data for fish habitats in theWillamette Basin were not available for the entire basin at the watershed (sixth-field HUC)scale, as would be necessary to allow a geographically comprehensive and detaileddescription of linkages between fish and wildlife.
Stream management activities likely to benefit wildlife the most are perhaps those thatrestore riparian vegetation, those that restore natural flow regimes to rivers, those thatprovide a long-term supply of wood to the channel, and those that improve water quality(especially sediment runoff). Nonetheless, some stream restoration activities couldpotentially have adverse effects on some wildlife species in certain situations. Theseactivities are discussed below—not to discourage their use, because in most instances theirbenefits to wildlife exceed their detriments, but to call attention to the need for multispecieswildlife analysis on a project-by-project basis when stream restoration programs areimplemented.
3.4.1 Riparian PlantingStreambanks frequently are planted to help streams meet legal criteria for water temperature.However, increases in tree canopy cover can shade out some rare plants, such as WillametteValley daisy. Riparian planting should never extend into areas that are (or were, historically)wetland or upland prairies. Also, complete shade can diminish the suitability of habitat forseveral stream-associated species that normally prefer early-successional conditions, such aswillow flycatcher, common nighthawk, killdeer, common yellowthroat, and most waterfowl.Historically, these species relied on major floods to reset succession and provide unshadedconditions in a semi-random manner. Natural disturbances of that type are now subdued as aresult of dams regulating flow on many rivers. In addition, planting of forests in urban oragricultural landscapes has the potential to increase the spread of some invasive species andpredators, as well as increasing native wildlife as a result of improving canopy connectivity.

DRAFT WILLAMETTE SUBBASIN PLAN
CH 3 ASSESSMENT.DOC 3-255
3.4.2 Riparian BuffersRiparian buffers are nearly always beneficial to both fish and wildlife. The main difference isthat many wildlife species prefer wider buffers than those commonly recommended forprotecting fish and water quality. There is no particular width threshold below whichwoodland wildlife will fail to use a buffer. Generally speaking, “the wider the better.”Acceptable widths depend on the density and type of riparian vegetation, the harshness ofadjoining unbuffered landscape (impervious surfaces versus native, nonforest vegetation), thewildlife species, and distance to its source populations. For protecting individual wildlifespecies or wildlife generally, buffer widths (measured on one side of a channel) ranging from100 to more than 1,000 ft have been documented (McComb and Hagar, 1992; WashingtonDepartment of Fish and Wildlife, 1995).
3.4.3 Fencing StreamsBecause riparian areas support habitat for salmon and trout by cooling stream water, fencesare sometimes erected to protect riparian areas from overgrazing. Depending on their designand location, fences also can unintentionally restrict movements of some wildlife species(large mammals), but overall their benefits are more likely to be positive than negative.
3.4.4 Stabilizing StreambanksSteep, eroding streambanks potentially degrade water quality, so they are often the focus ofremedial measures. However, a few wildlife species use this habitat exclusively oropportunistically, to create burrows where they then nest or breed. These include beltedkingfisher, northern rough-winged swallow, bank swallow (rare in the Willamette Basin),barn owl, mink, beaver, and otter. Placement of riprap or planted willows on all erodingbanks potentially can diminish local populations of these species.
3.4.5 Reconnecting Isolated Sloughs, Side Channels, and OxbowsMany backwater sloughs and oxbows were originally connected to rivers year-round orduring high water but became isolated through intentional human activities (such as those toimprove river navigation) or because of natural events such as beaver dams, flood deposits,or channel meandering. When barriers (debris jams, beaver dams, concrete dams, etc.) thatblock fish access to these areas are removed, it increases habitat for several fish species,especially nursery habitat and flood refugia. As a result, several fish-feeding bird andmammal species will reap some benefits. However, other rare aquatic plants and listedaquatic amphibians and turtles could be harmed under the following conditions:
• Current velocities become excessive—for example, they exceed thresholds for frog andsalamander egg deposition, juvenile maturation, aquatic plant metabolism, or waterfowlforaging.
• Water temperatures in the newly reconnected slough rise or fall below optimaltemperatures for particular amphibians or turtles during critical periods.
• Conversion from seasonal to permanent inundation degrades the habitat of some plantsthat thrive only in seasonally wet soils.

DRAFT WILLAMETTE SUBBASIN PLAN
3-256 CH 3 ASSESSMENT.DOC
• Reconnecting increases the isolated slough’s vulnerability to waterborne seeds ofinvasive plants or to fish (especially exotic species) that prey on juvenile turtles andamphibians.
• Newly increased boat access to isolated areas increases disturbance of wildlifesignificantly.
Wildlife species most likely to be directly harmed by the reconnection of isolated sloughsinclude red-legged frog, Oregon spotted frog, northwestern salamander, western pond turtle,and several dabbling ducks.
3.4.6 Removing Barriers; Culvert ReplacementSimilar to the above (see Appendix G for fish barrier maps).
3.5 Identification and Analysis of Limiting Factors/Conditions
3.5.1 Historical Factors Leading to Decline of Aquatic Species and EcologicalFunctions and Processes
This section presents information on the limiting factors for focal species in the varioussubbasins within the Willamette Basin. The section is organized by subbasin, with thosesubbasins not having undergone EDT analysis presented first, as follows:
• Calapooia Subbasin• Coast Fork Willamette Subbasin• Long Tom Subbasin• Luckiamute/Rickreall Subbasin• Marys Subbasin• Middle Fork Willamette Subbasin• Molalla/Pudding Subbasin• North Santiam Subbasin• Salem-area watersheds• South Santiam Subbasin• Tualatin Subbasin• Upper Willamette Mainstem• Yamhill Subbasin
For each of these subbasins, the geographic setting and environmental conditions aredescribed with respect to the aquatic focal species for this plan, along with limiting factors inthe lower and upper subbasins. Appendixes H, E, and G contain overview maps, fishdistribution maps, and fish barrier maps, respectively, for the Willamette Basin.
This is followed by subbasins that have undergone EDT analysis to identify limiting factorsfor the aquatic focal species of this plan:
• Clackamas Subbasin• Johnson Creek Subbasin• McKenzie Subbasin• Tryon Creek Subbasin

DRAFT WILLAMETTE SUBBASIN PLAN
CH 3 ASSESSMENT.DOC 3-257
• Lower Willamette
The information on the limiting factors in these EDT-analyzed subbasins is lengthier and, inmost cases, includes detailed results from the EDT analysis.
3.5.1.1 Limiting Factors in the Calapooia SubbasinThis section describes the Calapooia Subbasin in terms of geographic setting andenvironmental conditions and presents information on the limiting factors for focal species inthe subbasin: winter steelhead, spring Chinook, and Oregon chub.
Focal species present:• Winter steelhead trout• Spring Chinook salmon• Cutthroat trout
Focal species present historically:Oregon chub (all life stages)
Geographic Setting. The Calapooia Subbasin covers an area of 329 square miles on thewestern slope of the Cascade Range and the floor of the Willamette Valley. The CalapooiaRiver is approximately 80 miles long and enters the Willamette River within the city ofAlbany at RM 122. Approximately 94 percent of the land in the subbasin is privately owned.Most of the private lands are in forestry, agricultural, and rural residential land uses. Urbanlands cover about 2 percent of the watershed, primarily within the cities of Albany andLebanon (Runyon et al., 2004). The Willamette National Forest manages a small area in theriver’s headwaters, while the Eugene District of the BLM manages a portion of the lowersubbasin.
The Calapooia River’s headwaters are in the western Cascade Range. The river’s headwatersflow through Willamette National Forest and industrial forestlands, small-acreage farms, andrural residential areas until the river reaches the floor of the Willamette Valley near thecommunity of Holley (RM 48). Major tributaries in the forested upper subbasin include theNorth Fork Calapooia River, and Biggs, McKinley, and Potts creeks. The lower CalapooiaRiver flows through the city of Brownsville, agricultural lands, scattered rural residentialareas, and the city of Albany, where it joins the Willamette River. Brush, Butte, Courtney,and Oak creeks are major tributaries in the lower subbasin.
The upper subbasin drains the western Cascade Range, but most of the river and the largertributaries flow through the Willamette Valley’s recent alluvial deposits. The subbasin’s highflow runoff patterns are dominated by a rain-on-snow hydrology in the mid- to upperelevations and rain-dominated flow patterns in the lower subbasin, which leads to rapiddelivery of water to the stream network. As a result of the subbasin’s low elevations and thewestern Cascade geology, summertime stream flows are not supplemented by large amountsof snowmelt or numerous spring-fed sources.
The headwaters and tributaries of the upper Calapooia Subbasin flow steeply off the CascadeRange. The upper river’s gradient ranges from nearly 2.0 percent in the headwaters to 1.0percent at RM 60. After the river and tributaries enter the Willamette Valley the gradientdecreases and the river meanders through the alluvial deposits of the Willamette River. The
DRAFT WILLAMETTE SUBBASIN PLAN
3-258 CH 3 ASSESSMENT.DOC
gradient of the Calapooia River decreases from 0.44 near Holley to less than 0.06 percentnear the river’s confluence with the Willamette River. Most of the spring Chinook salmonprespawning holding and spawning takes place in the upper river above Holley.
Environmental Conditions. Altered watershed processes, riparian and aquatic habitat, andaccess to historical spawning and rearing areas in the Calapooia Subbasin have affected theproductivity, capacity, and diversity of cutthroat trout, juvenile spring Chinook salmon, andwinter steelhead populations. Table 3-104 summarizes changes in the subbasin’senvironmental conditions and how these changes have affected cutthroat trout, juvenilespring Chinook, and winter steelhead life stages.
Upper and Lower Subbasins. Relative to the lower subbasin, the forested upland portionsof the upper subbasin have aquatic habitat that is closer to the historical baseline, with thehighest proportion of functioning riparian areas, largest amounts of large wood in the riverand tributary channels, and higher quality aquatic habitats (Runyon et al., 2004; Baker et al.,2002). Impacts to aquatic and riparian habitats have been greater in the lower CalapooiaSubbasin than in the forested upper subbasin. Historically, the lower subbasin wascharacterized by very complex and productive fish habitat because the largest proportion ofunconstrained river and stream channels were in the area where the Calapooia River flowedacross the flat Willamette Valley (Pacific Northwest Ecosystem Research Consortium, 2002;Runyon et al., 2004).
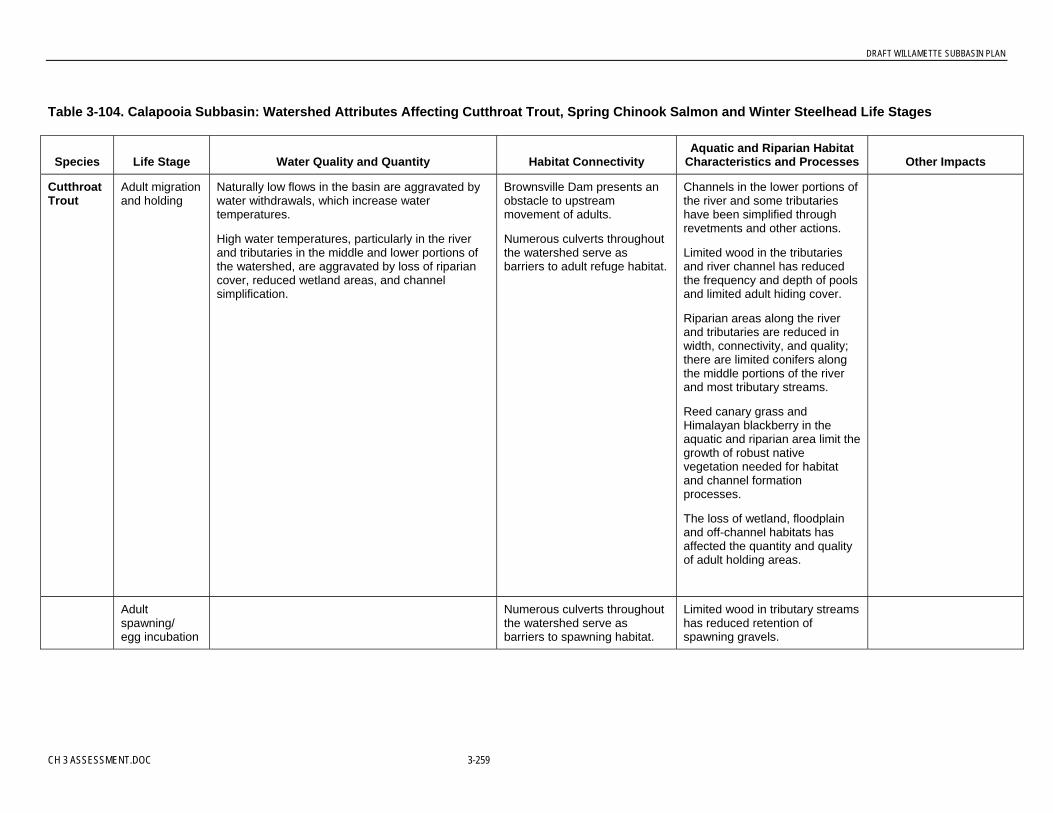
DRAFT WILLAMETTE SUBBASIN PLAN
CH 3 ASSESSMENT.DOC 3-259
Table 3-104. Calapooia Subbasin: Watershed Attributes Affecting Cutthroat Trout, Spring Chinook Salmon and Winter Steelhead Life Stages
Species Life Stage Water Quality and Quantity Habitat ConnectivityAquatic and Riparian Habitat
Characteristics and Processes Other Impacts
CutthroatTrout
Adult migrationand holding
Naturally low flows in the basin are aggravated bywater withdrawals, which increase watertemperatures.
High water temperatures, particularly in the riverand tributaries in the middle and lower portions ofthe watershed, are aggravated by loss of ripariancover, reduced wetland areas, and channelsimplification.
Brownsville Dam presents anobstacle to upstreammovement of adults.
Numerous culverts throughoutthe watershed serve asbarriers to adult refuge habitat.
Channels in the lower portions ofthe river and some tributarieshave been simplified throughrevetments and other actions.
Limited wood in the tributariesand river channel has reducedthe frequency and depth of poolsand limited adult hiding cover.
Riparian areas along the riverand tributaries are reduced inwidth, connectivity, and quality;there are limited conifers alongthe middle portions of the riverand most tributary streams.
Reed canary grass andHimalayan blackberry in theaquatic and riparian area limit thegrowth of robust nativevegetation needed for habitatand channel formationprocesses.
The loss of wetland, floodplainand off-channel habitats hasaffected the quantity and qualityof adult holding areas.
Adultspawning/egg incubation
Numerous culverts throughoutthe watershed serve asbarriers to spawning habitat.
Limited wood in tributary streamshas reduced retention ofspawning gravels.

DRAFT WILLAMETTE SUBBASIN PLAN
3-260 CH 3 ASSESSMENT.DOC
Table 3-104. Calapooia Subbasin: Watershed Attributes Affecting Cutthroat Trout, Spring Chinook Salmon and Winter Steelhead Life Stages
Species Life Stage Water Quality and Quantity Habitat ConnectivityAquatic and Riparian Habitat
Characteristics and Processes Other Impacts
Fry andjuvenile rearingand migration
Naturally low flows in the basin are aggravated bywater withdrawals, which may increase watertemperatures.
High water temperatures, particularly in the riverand tributaries in the middle and lower portions ofthe watershed, do not provide optimal conditionsfor juvenile rearing.
Numerous culverts throughoutthe watershed present barriersto juvenile access to rearingand refuge habitat.
Channels in the lower portions ofthe river and some tributarieshave been simplified throughrevetments and other actions.
Limited wood in the tributariesand river channel has reducedthe frequency and depth ofpools, thus limiting juvenilerearing and refuge habitat.
Riparian areas along the riverand tributaries are reduced inwidth, connectivity, and quality;there are limited conifers alongthe middle portions of the riverand most tributary streams.
The loss of wetland, floodplainand off-channel habitats hasaffected the quantity and qualityof juvenile rearing and refugeareas.
Introduced fish species(small- and large-mouthbass, for example) mayprey on juveniles.
Salmon carcasses arereduced from historicallevels, limiting nutrientinputs to the system andthus food availability forrearing fish.
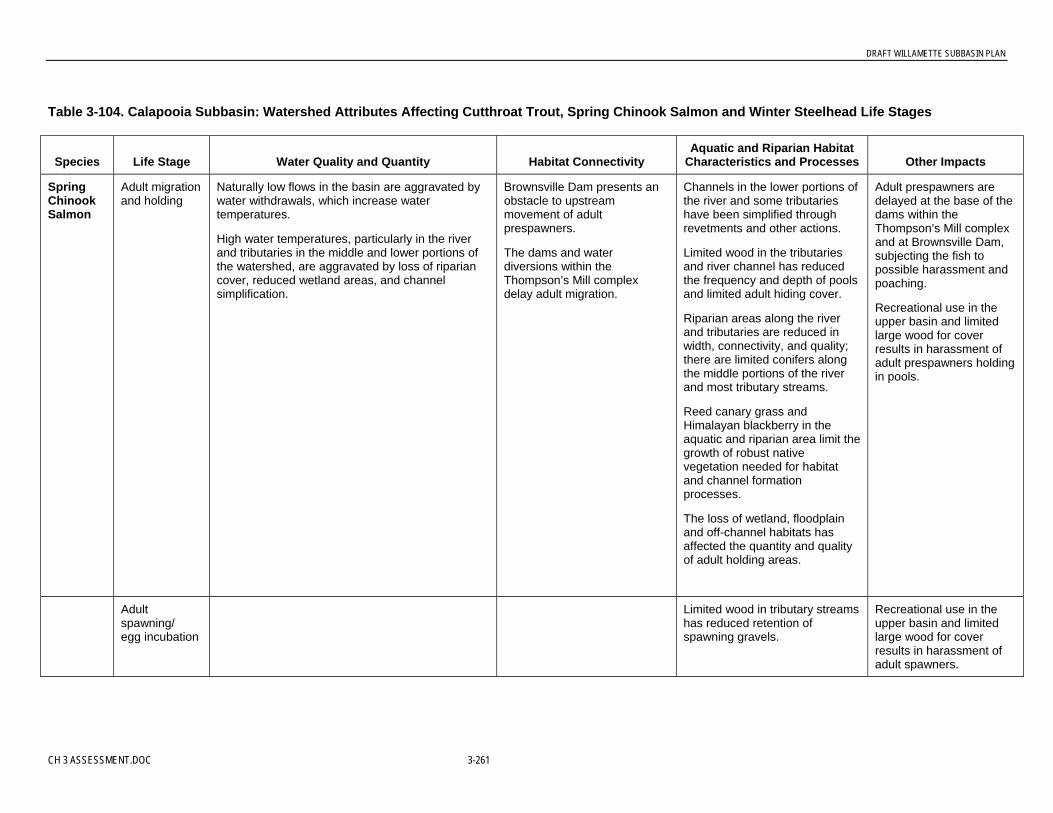
DRAFT WILLAMETTE SUBBASIN PLAN
CH 3 ASSESSMENT.DOC 3-261
Table 3-104. Calapooia Subbasin: Watershed Attributes Affecting Cutthroat Trout, Spring Chinook Salmon and Winter Steelhead Life Stages
Species Life Stage Water Quality and Quantity Habitat ConnectivityAquatic and Riparian Habitat
Characteristics and Processes Other Impacts
SpringChinookSalmon
Adult migrationand holding
Naturally low flows in the basin are aggravated bywater withdrawals, which increase watertemperatures.
High water temperatures, particularly in the riverand tributaries in the middle and lower portions ofthe watershed, are aggravated by loss of ripariancover, reduced wetland areas, and channelsimplification.
Brownsville Dam presents anobstacle to upstreammovement of adultprespawners.
The dams and waterdiversions within theThompson’s Mill complexdelay adult migration.
Channels in the lower portions ofthe river and some tributarieshave been simplified throughrevetments and other actions.
Limited wood in the tributariesand river channel has reducedthe frequency and depth of poolsand limited adult hiding cover.
Riparian areas along the riverand tributaries are reduced inwidth, connectivity, and quality;there are limited conifers alongthe middle portions of the riverand most tributary streams.
Reed canary grass andHimalayan blackberry in theaquatic and riparian area limit thegrowth of robust nativevegetation needed for habitatand channel formationprocesses.
The loss of wetland, floodplainand off-channel habitats hasaffected the quantity and qualityof adult holding areas.
Adult prespawners aredelayed at the base of thedams within theThompson’s Mill complexand at Brownsville Dam,subjecting the fish topossible harassment andpoaching.
Recreational use in theupper basin and limitedlarge wood for coverresults in harassment ofadult prespawners holdingin pools.
Adultspawning/egg incubation
Limited wood in tributary streamshas reduced retention ofspawning gravels.
Recreational use in theupper basin and limitedlarge wood for coverresults in harassment ofadult spawners.

DRAFT WILLAMETTE SUBBASIN PLAN
3-262 CH 3 ASSESSMENT.DOC
Table 3-104. Calapooia Subbasin: Watershed Attributes Affecting Cutthroat Trout, Spring Chinook Salmon and Winter Steelhead Life Stages
Species Life Stage Water Quality and Quantity Habitat ConnectivityAquatic and Riparian Habitat
Characteristics and Processes Other Impacts
Fry andjuvenile rearingand migration
Naturally low flows in the basin are aggravated bywater withdrawals, which may increase watertemperatures.
High water temperatures, particularly in the riverand tributaries in the middle and lower portions ofthe watershed, do not provide optimal conditionsfor juvenile rearing.
Numerous culverts throughoutthe watershed present barriersto juvenile access to rearingand refuge habitat.
Culverts on seasonal streamsin the lower subbasin may belimiting access to winter refugehabitat.
Channels in the lower portions ofthe river and some tributarieshave been simplified throughrevetments and other actions.
Limited wood in the tributariesand river channel has reducedthe frequency and depth ofpools, thus limiting juvenilerearing and refuge habitat.
Riparian areas along the riverand tributaries are reduced inwidth, connectivity, and quality;there are limited conifers alongthe middle portions of the riverand most tributary streams.
The loss of wetland, floodplainand off-channel habitats hasaffected the quantity and qualityof juvenile rearing and refugeareas.
Introduced fish species(small- and large-mouthbass, for example) mayprey on juveniles.
Salmon carcasses arereduced from historicallevels, limiting nutrientinputs to the system andthus food availability forrearing fish.
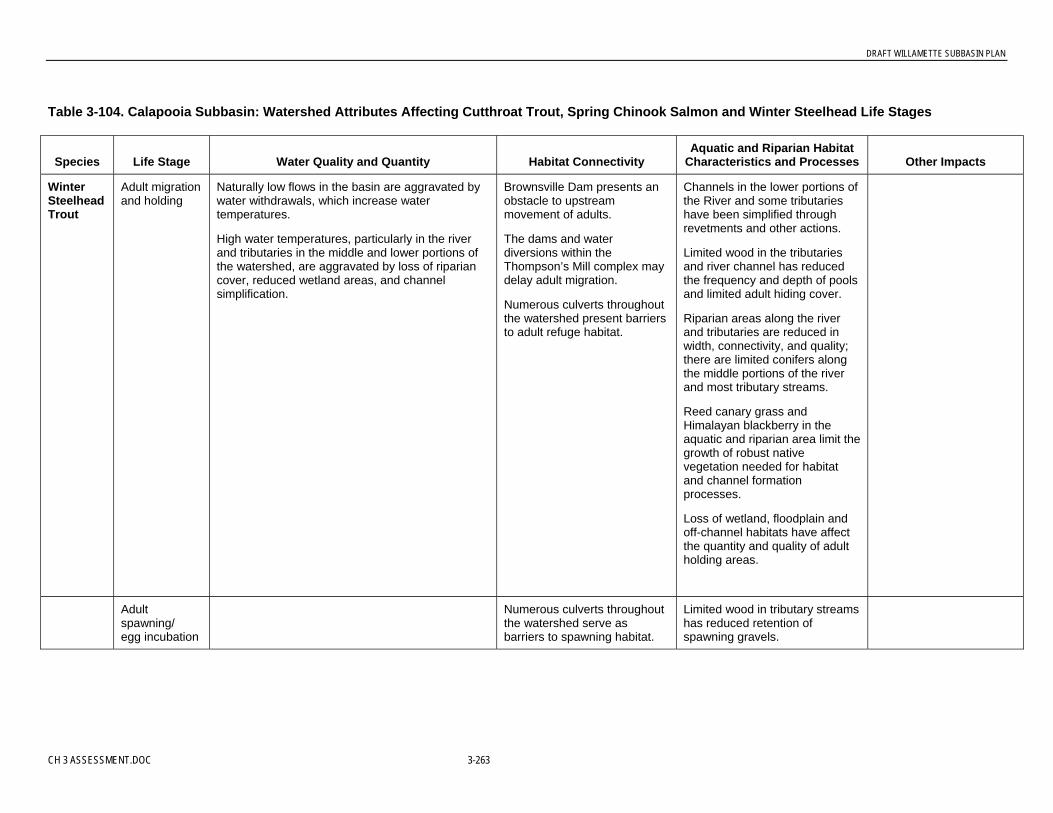
DRAFT WILLAMETTE SUBBASIN PLAN
CH 3 ASSESSMENT.DOC 3-263
Table 3-104. Calapooia Subbasin: Watershed Attributes Affecting Cutthroat Trout, Spring Chinook Salmon and Winter Steelhead Life Stages
Species Life Stage Water Quality and Quantity Habitat ConnectivityAquatic and Riparian Habitat
Characteristics and Processes Other Impacts
WinterSteelheadTrout
Adult migrationand holding
Naturally low flows in the basin are aggravated bywater withdrawals, which increase watertemperatures.
High water temperatures, particularly in the riverand tributaries in the middle and lower portions ofthe watershed, are aggravated by loss of ripariancover, reduced wetland areas, and channelsimplification.
Brownsville Dam presents anobstacle to upstreammovement of adults.
The dams and waterdiversions within theThompson’s Mill complex maydelay adult migration.
Numerous culverts throughoutthe watershed present barriersto adult refuge habitat.
Channels in the lower portions ofthe River and some tributarieshave been simplified throughrevetments and other actions.
Limited wood in the tributariesand river channel has reducedthe frequency and depth of poolsand limited adult hiding cover.
Riparian areas along the riverand tributaries are reduced inwidth, connectivity, and quality;there are limited conifers alongthe middle portions of the riverand most tributary streams.
Reed canary grass andHimalayan blackberry in theaquatic and riparian area limit thegrowth of robust nativevegetation needed for habitatand channel formationprocesses.
Loss of wetland, floodplain andoff-channel habitats have affectthe quantity and quality of adultholding areas.
Adultspawning/egg incubation
Numerous culverts throughoutthe watershed serve asbarriers to spawning habitat.
Limited wood in tributary streamshas reduced retention ofspawning gravels.
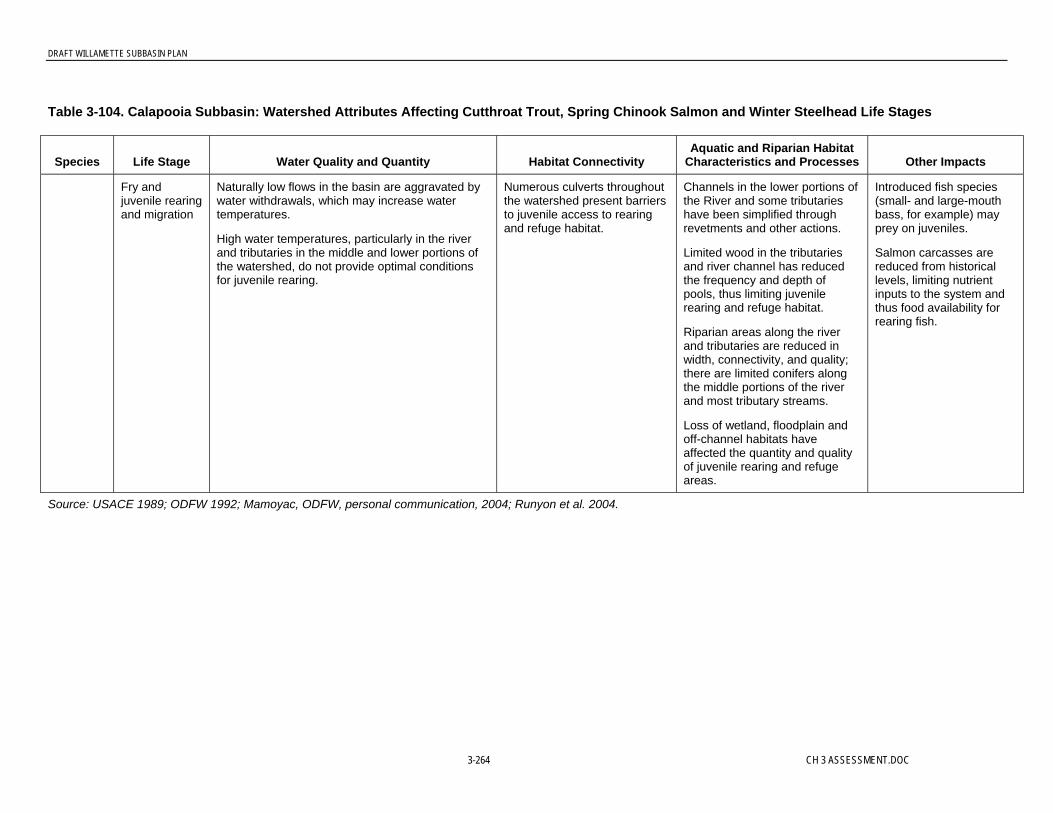
DRAFT WILLAMETTE SUBBASIN PLAN
3-264 CH 3 ASSESSMENT.DOC
Table 3-104. Calapooia Subbasin: Watershed Attributes Affecting Cutthroat Trout, Spring Chinook Salmon and Winter Steelhead Life Stages
Species Life Stage Water Quality and Quantity Habitat ConnectivityAquatic and Riparian Habitat
Characteristics and Processes Other Impacts
Fry andjuvenile rearingand migration
Naturally low flows in the basin are aggravated bywater withdrawals, which may increase watertemperatures.
High water temperatures, particularly in the riverand tributaries in the middle and lower portions ofthe watershed, do not provide optimal conditionsfor juvenile rearing.
Numerous culverts throughoutthe watershed present barriersto juvenile access to rearingand refuge habitat.
Channels in the lower portions ofthe River and some tributarieshave been simplified throughrevetments and other actions.
Limited wood in the tributariesand river channel has reducedthe frequency and depth ofpools, thus limiting juvenilerearing and refuge habitat.
Riparian areas along the riverand tributaries are reduced inwidth, connectivity, and quality;there are limited conifers alongthe middle portions of the riverand most tributary streams.
Loss of wetland, floodplain andoff-channel habitats haveaffected the quantity and qualityof juvenile rearing and refugeareas.
Introduced fish species(small- and large-mouthbass, for example) mayprey on juveniles.
Salmon carcasses arereduced from historicallevels, limiting nutrientinputs to the system andthus food availability forrearing fish.
Source: USACE 1989; ODFW 1992; Mamoyac, ODFW, personal communication, 2004; Runyon et al. 2004.

DRAFT WILLAMETTE SUBBASIN PLAN
CH 3 ASSESSMENT.DOC 3-265
Large Wood. Historical removal of large wood from the river and tributary streams, reduceddelivery and transport of wood through channels, and changes in riparian vegetation all haveinteracted to reduce the quantity and distribution of large wood. While there are areas alongthe lower river with extensive floodplain forests, the extent and composition of riparianvegetation has been modified along the river’s middle reaches and tributaries (Runyon et al.,2004). Over time, a number of historical practices (such as log drives and stream cleaning)have reduced the quantity of large wood in the Calapooia River and tributary channels(Runyon et al., 2004). While riparian areas in the forested upper subbasin have greaternumbers of conifer trees than the lower subbasin does, historical riparian harvests and woodremoval from streams have reduced large wood in these channels. Reduced large wood in theriver and tributary channels limits the formation of pools, thus reducing hiding areas for adultfish and restricting the quality and quantity of juvenile rearing habitat. Reduced wood in theriver, particularly large log jams, has reduced hiding cover for fish and led to increasedharassment of adult spring Chinook salmon holding the upper river’s pools.
Water Quality Changes. Water quality has been modified throughout the subbasin. Watertemperatures exceed criteria in the Calapooia River and some tributaries, particularly in thelower subbasin. Natural low flows in the subbasin are aggravated by water withdrawals,which could increase water temperatures (Runyon et al., 2004). In general, watertemperatures are lower in the forested upper subbasin than in the lower subbasin (Runyon etal., 2004). High water temperatures in the lower subbasin are aggravated by loss of ripariancover, reduced wetland areas, channel simplification, and increased impervious surfaces(Runyon et al., 2004).
Changes in Flow Regimes. There have been some impacts to the subbasin’s hydrologicregimes. Changes in land use in the lower subbasin have affected hydrologic regimes in thetributaries. Channelization of tributaries in the lower subbasin; modification of runoffpatterns as a result of agriculture, impervious surfaces, and urban/residential development;and loss of storage capacity in floodplains and wetlands have accelerated runoff andincreased peak flows (Mamoyac, ODFW, personal communication, 2004).
Fish Passage Barriers. Fish passage barriers are an issue throughout the subbasin. Thereare several dams and diversions that limit upstream migration. The dams and diversionswithin the Thompson’s Mill complex (RM 19.5 to 28.5) have the greatest impact on fishpassage. While Sodom Dam is equipped with a fish ladder, migrating spring Chinook salmonare delayed at the base of the dam, which subjects them to additional stress and possibleharassment and poaching (Runyon et al., 2004). Brownsville Dam (RM 36) is equipped witha fish passage ladder but its effectiveness is limited, particularly during high flow periodswhen spring Chinook salmon, winter steelhead, and cutthroat trout are moving through theriver (Gary Galovich, ODFW, personal communication, 2003). In addition, there arenumerous unscreened small diversions within the subbasin (Mamoyac, ODFW, personalcommunication, 2004).
There are large numbers of road crossing culverts in the lower and upper subbasin that blockor limit fish passage. In an inventory of more than 80 culverts in the middle portions of thesubbasin (for example, Brush and Courtney creeks), more than 90 percent of the culverts didnot meet the ODFW fish passage criteria (Runyon et al., 2004). Access into seasonal streamsin the lower subbasin provides important fish refuge habitat during high flow periods.

DRAFT WILLAMETTE SUBBASIN PLAN
3-266 CH 3 ASSESSMENT.DOC
Cutthroat trout, and juvenile winter steelhead and spring Chinook salmon were observed inseasonal streams in the lower subbasin (for example, Butte and Lake creeks) during highflow periods in the winter and early spring (Randy Colvin, Oregon State University, personalcommunication, 2004). No fish were observed in seasonal streams where there weredownstream culverts blocking fish passage. Limiting the fish passage above culverts restrictsthe amount of habitat available for all cutthroat trout life stages and important rearing habitatfor juvenile winter steelhead and spring Chinook salmon.
Appendix G shows specific fish passage barriers on the Calapooia, based on May 2004 datafrom ODFW; the information was compiled from existing ODFW databases.
Habitat Connectivity. Backwater habitats, including pool margins, side channels, andalcoves, are reduced from historical levels. Actions to stabilize the lower river and tributariesthrough the placement of riprap along banks (and other actions) and limited large wood in thechannel have interacted to reduce the quantity and quality of backwater habitats (Runyon etal., 2004). Backwater areas in the river and lower tributaries provide key habitats for adultand juvenile cutthroat tout and juvenile spring Chinook salmon and winter steelhead. Thesehabitats provide fish with habitat for foraging and refuge from winter flood events.
Key Factors Limiting Fish Populations. The upper and lower portions of the CalapooiaSubbasin are characterized by different patterns of aquatic and riparian habitat, hydrologicregimes, water quality characteristics and fish species distributions. For this reason, factorslimiting populations for the focal fish species are assessed separately for the upper and lowersubbasins.
Limiting Factors in the Lower Calapooia Subbasin. In the lower Calapooia Subbasin, theproductivity, capacity, and diversity of cutthroat trout, spring Chinook salmon, and wintersteelhead populations are limited by the following:
• Flow Regime Change and Channel Structure. Modification of tributary high flowregimes from urbanization, land use changes, channel and bank confinement and waterwithdraws have reduced interactions between aquatic and terrestrial environmentsreducing terrestrial inputs of wood, nutrients, and sediment. This dynamic interaction isessential for habitat formation and maintenance. Flow regime and channel structureinfluence virtually all aspects of habitat quality and quantity.
• Key Habitat Loss. Modifications to key habitats and the natural processes that form andmaintain them have affected all life stages of fish. Changes in interactions between therivers and streams with their floodplain have reduced the delivery and transport of largewood, modified gravel deposition patterns, reduced the frequency and depth of pools,minimized hiding cover for adult and juvenile fish and reduced available spawning areas.
• Habitat Connectivity. Flow modifications and channel confinement and in-streambarriers have reduced access to off-channel habitats essential for juvenile rearing andwinter refuge and decreased connectivity between habitats throughout the watershed andthe dynamic processes needed to form and maintain habitat diversity.
• Habitat Modification. Modifications of key aquatic habitats have affected all life stages.Limited spawning areas and reduced levels of gravels/small cobbles have reduced theareas available for spawning.

DRAFT WILLAMETTE SUBBASIN PLAN
CH 3 ASSESSMENT.DOC 3-267
• Large Wood. Changes in the delivery and transport of large wood in the river andtributaries has modified gravel deposition patterns, reduced the frequency and depth ofpools, and minimized hiding cover for adult and juvenile fish.
• Water Withdrawals. Unscreened water withdrawals affect juvenile fish.
• Water Temperature. Changes in summertime water temperature regimes limit thecapacity of river and tributary streams to support adult and juvenile fish.
• Fish Passage Barriers. Two dams on the river and fish passage barriers at road crossingson tributary streams limit the capacity of the Calapooia to support spring Chinooksalmon, winter steelhead, and cutthroat trout migration and limit juvenile access torearing and refuge habitat.
• Additional Factors. Other factors limiting cutthroat trout, spring Chinook salmon, andwinter steelhead populations include competition with hatchery and introduced fish;lower numbers of salmon carcasses, which reduces nutrient inputs and thus foodavailability; and harassment of adult migrating and holding prespawning fish byrecreational activities such as boating and fishing. All of these factors interact withmodified habitats and other impacts to the aquatic system to limit fish populations.
Table 3-105 shows the EDT attributes related to these limiting factors for cutthroat trout,spring Chinook salmon and winter steelhead in the lower Calapooia Subbasin. The lowersubbasin is largely on the floor of the Willamette Valley and in private ownership. Thepriorities for restoration are qualitative ratings based on the information in Table 3-104 andprofessional opinions from individuals familiar with the subbasin, particularly ODFWbiologists.
Table 3-105: Qualitative Rating of EDT Attributes Related to Limiting Factors for WinterSteelhead, Spring Chinook, and Cutthroat Trout in the Lower Calapooia Subbasin
EDT Attribute Class DescriptionPriority forRestoration
Flow There have been changes in the interannual variability of lowand high flows as a result of land use changes. This hasaffected the quantity of habitat and disrupted the processesthat create a complex array of habitats.
HIGH
Habitat diversity Extensive channel confinement through the river corridor asa result of bank riprap and revetments; loss of floodplain andriparian trees and limited wood in the river and tributarychannels.
HIGH
Harassment Possible harassment and poaching below the dams. HIGH
Obstructions Dams delay migration into the upper subbasin; numerouscomplete and partial barriers on tributary streams.
HIGH
Temperature Changes in riparian canopy cover have increased summerhigh water temperatures on some tributary streams.
HIGH
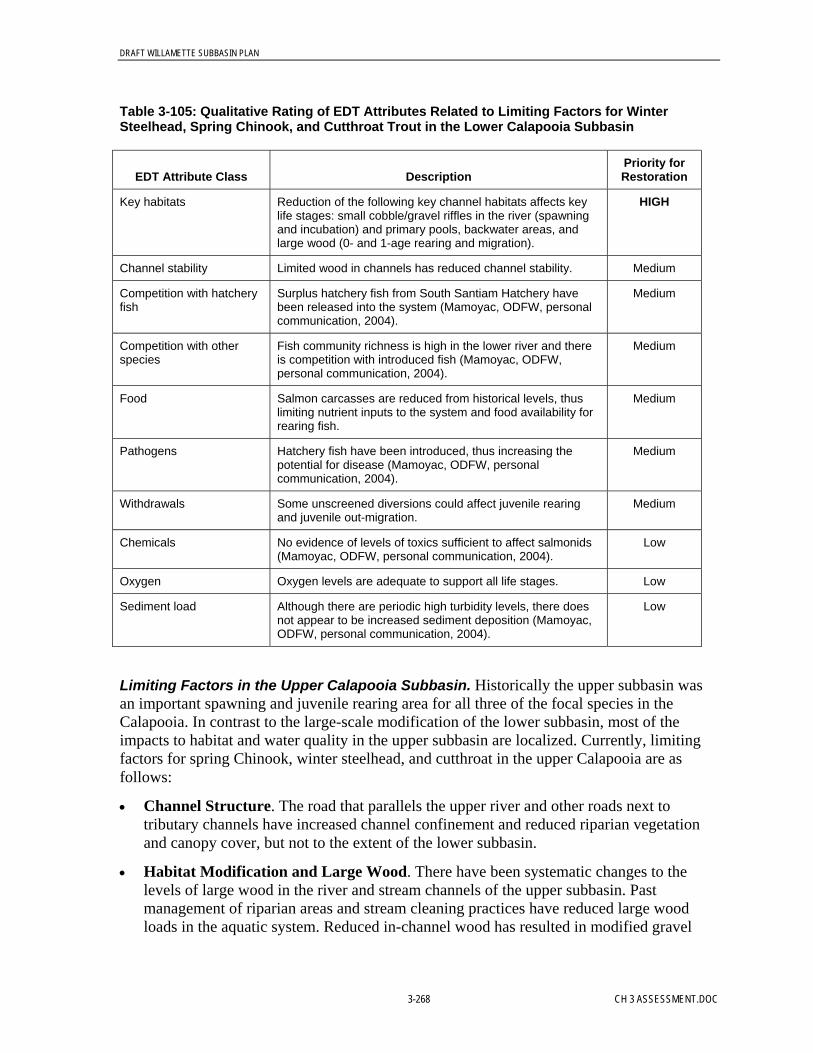
DRAFT WILLAMETTE SUBBASIN PLAN
3-268 CH 3 ASSESSMENT.DOC
Table 3-105: Qualitative Rating of EDT Attributes Related to Limiting Factors for WinterSteelhead, Spring Chinook, and Cutthroat Trout in the Lower Calapooia Subbasin
EDT Attribute Class DescriptionPriority forRestoration
Key habitats Reduction of the following key channel habitats affects keylife stages: small cobble/gravel riffles in the river (spawningand incubation) and primary pools, backwater areas, andlarge wood (0- and 1-age rearing and migration).
HIGH
Channel stability Limited wood in channels has reduced channel stability. Medium
Competition with hatcheryfish
Surplus hatchery fish from South Santiam Hatchery havebeen released into the system (Mamoyac, ODFW, personalcommunication, 2004).
Medium
Competition with otherspecies
Fish community richness is high in the lower river and thereis competition with introduced fish (Mamoyac, ODFW,personal communication, 2004).
Medium
Food Salmon carcasses are reduced from historical levels, thuslimiting nutrient inputs to the system and food availability forrearing fish.
Medium
Pathogens Hatchery fish have been introduced, thus increasing thepotential for disease (Mamoyac, ODFW, personalcommunication, 2004).
Medium
Withdrawals Some unscreened diversions could affect juvenile rearingand juvenile out-migration.
Medium
Chemicals No evidence of levels of toxics sufficient to affect salmonids(Mamoyac, ODFW, personal communication, 2004).
Low
Oxygen Oxygen levels are adequate to support all life stages. Low
Sediment load Although there are periodic high turbidity levels, there doesnot appear to be increased sediment deposition (Mamoyac,ODFW, personal communication, 2004).
Low
Limiting Factors in the Upper Calapooia Subbasin. Historically the upper subbasin wasan important spawning and juvenile rearing area for all three of the focal species in theCalapooia. In contrast to the large-scale modification of the lower subbasin, most of theimpacts to habitat and water quality in the upper subbasin are localized. Currently, limitingfactors for spring Chinook, winter steelhead, and cutthroat in the upper Calapooia are asfollows:
• Channel Structure. The road that parallels the upper river and other roads next totributary channels have increased channel confinement and reduced riparian vegetationand canopy cover, but not to the extent of the lower subbasin.
• Habitat Modification and Large Wood. There have been systematic changes to thelevels of large wood in the river and stream channels of the upper subbasin. Pastmanagement of riparian areas and stream cleaning practices have reduced large woodloads in the aquatic system. Reduced in-channel wood has resulted in modified gravel
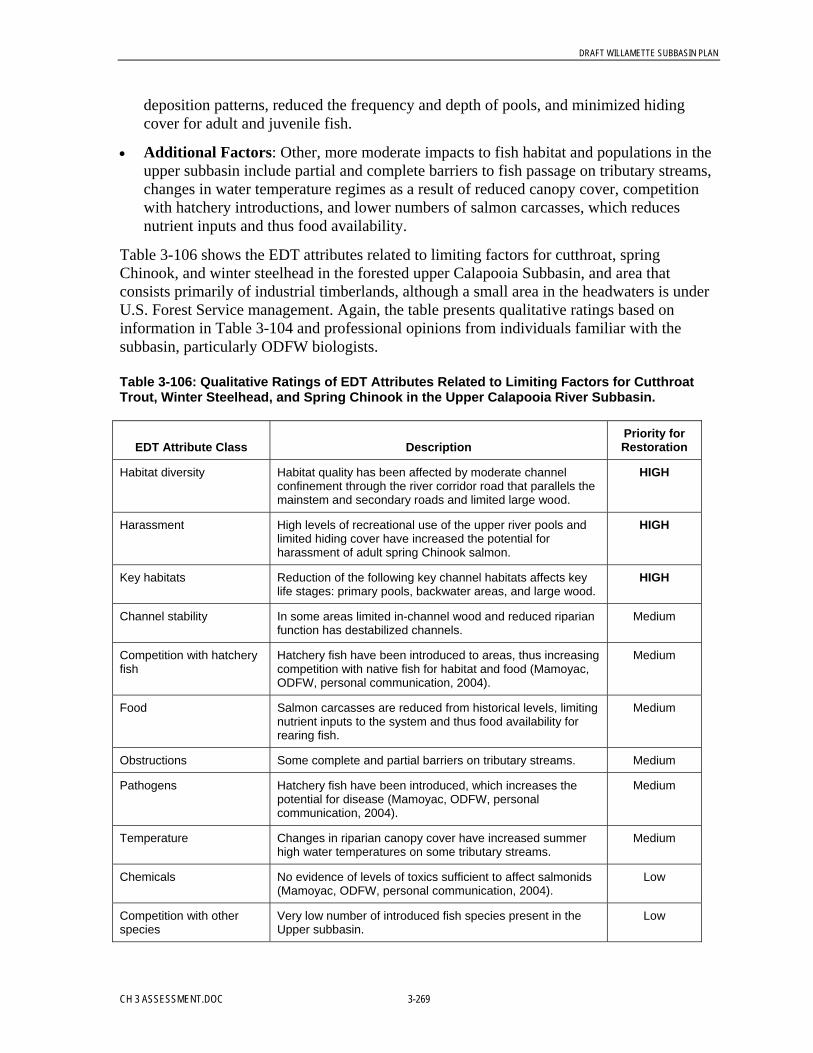
DRAFT WILLAMETTE SUBBASIN PLAN
CH 3 ASSESSMENT.DOC 3-269
deposition patterns, reduced the frequency and depth of pools, and minimized hidingcover for adult and juvenile fish.
• Additional Factors: Other, more moderate impacts to fish habitat and populations in theupper subbasin include partial and complete barriers to fish passage on tributary streams,changes in water temperature regimes as a result of reduced canopy cover, competitionwith hatchery introductions, and lower numbers of salmon carcasses, which reducesnutrient inputs and thus food availability.
Table 3-106 shows the EDT attributes related to limiting factors for cutthroat, springChinook, and winter steelhead in the forested upper Calapooia Subbasin, and area thatconsists primarily of industrial timberlands, although a small area in the headwaters is underU.S. Forest Service management. Again, the table presents qualitative ratings based oninformation in Table 3-104 and professional opinions from individuals familiar with thesubbasin, particularly ODFW biologists.
Table 3-106: Qualitative Ratings of EDT Attributes Related to Limiting Factors for CutthroatTrout, Winter Steelhead, and Spring Chinook in the Upper Calapooia River Subbasin.
EDT Attribute Class DescriptionPriority forRestoration
Habitat diversity Habitat quality has been affected by moderate channelconfinement through the river corridor road that parallels themainstem and secondary roads and limited large wood.
HIGH
Harassment High levels of recreational use of the upper river pools andlimited hiding cover have increased the potential forharassment of adult spring Chinook salmon.
HIGH
Key habitats Reduction of the following key channel habitats affects keylife stages: primary pools, backwater areas, and large wood.
HIGH
Channel stability In some areas limited in-channel wood and reduced riparianfunction has destabilized channels.
Medium
Competition with hatcheryfish
Hatchery fish have been introduced to areas, thus increasingcompetition with native fish for habitat and food (Mamoyac,ODFW, personal communication, 2004).
Medium
Food Salmon carcasses are reduced from historical levels, limitingnutrient inputs to the system and thus food availability forrearing fish.
Medium
Obstructions Some complete and partial barriers on tributary streams. Medium
Pathogens Hatchery fish have been introduced, which increases thepotential for disease (Mamoyac, ODFW, personalcommunication, 2004).
Medium
Temperature Changes in riparian canopy cover have increased summerhigh water temperatures on some tributary streams.
Medium
Chemicals No evidence of levels of toxics sufficient to affect salmonids(Mamoyac, ODFW, personal communication, 2004).
Low
Competition with otherspecies
Very low number of introduced fish species present in theUpper subbasin.
Low

DRAFT WILLAMETTE SUBBASIN PLAN
3-270 CH 3 ASSESSMENT.DOC
Table 3-106: Qualitative Ratings of EDT Attributes Related to Limiting Factors for CutthroatTrout, Winter Steelhead, and Spring Chinook in the Upper Calapooia River Subbasin.
EDT Attribute Class DescriptionPriority forRestoration
Flow There have not been significant changes in the interannualvariability of low and high flows.
Low
Oxygen Oxygen levels are adequate to support all life stages Low
Sediment load Although turbidity levels are periodically high, there does notappear to be increased sediment deposition.
Low
Withdrawals Minimal water withdrawals. Low
3.5.1.2 Limiting Factors in the Coast Fork Willamette SubbasinThis section describes the Coast Fork Willamette Subbasin in terms of geographic andenvironmental conditions and presents information on the limiting factors for focal species inthe subbasin: cutthroat trout and spring Chinook.
Focal species present:• Spring Chinook salmon• Cutthroat trout
Geographic Setting. The Coast Fork Willamette Subbasin covers an area of approximately665 square miles within the Calapooya Mountains and the floor of the Willamette Valley.The river is 40 miles long and joins the Middle Fork Willamette River near Eugene to formthe mainstem Willamette River. Only a third of the land in the Coast Fork WillametteSubbasin is managed by federal agencies. The U.S. Forest Service’s Umpqua National Forestand the Eugene District of the BLM manage a portion of the subbasin. The communities ofCottage Grove and Creswell are in the subbasin.
The Row River, the largest tributary, drains nearly 60 percent of the subbasin and joins theCoast Fork just below the city of Cottage Grove. Sharps and Mosby creeks are importanttributaries to the Row River, which flows through a complex mixture of sedimentary andvolcanic rocks, including tuffs, mudflow and lahar deposits, and basalt flows. Mineral-bearing layers intrude into bedrock in the headwaters of the Row River, and the areacontinues to be mined both commercially and recreationally. Mercury has been minedintensively in the Black Butte area, in the upper reaches of the mainstem Coast ForkWillamette River, and in the Bohemia Mining District, in the upper Row River drainage.Bedrock in the western portion of the basin, including the majority of the Coast ForkWillamette River and Mosby Creek drainages, is composed of marine sand and siltstones ofthe Eugene Formation.
Several dams managed by the U.S. Army Corps of Engineers divide the subbasin, includingCottage Grove Dam on the Coast Fork (at RM 29) and Dorena Dam on the Row River (atRM 7.5). These dams limit upstream fish passage and exert strong control over downstreamhydrologic regimes, temperature patterns, sediment and bedload transport, and large wood

DRAFT WILLAMETTE SUBBASIN PLAN
CH 3 ASSESSMENT.DOC 3-271
delivery to the lower reaches. The upper subbasin is primarily forested with a mix of privateindustrial timberlands and areas managed by the federal government.
The upper subbasin drains the lower elevations of the western Cascade Range and theCalapooya Mountains. The subbasin’s high flow runoff patterns are dominated by a rain-on-snow hydrology in the mid- to upper elevations and rain-dominated flow patterns in thelower subbasin, which leads to rapid delivery of water to the stream network. As a result ofthe subbasin’s low elevations, summertime stream flows are not supplemented by largeamounts of snowmelt or numerous spring-fed sources.
Lower Mosby Creek and the Row and Coast Fork Willamette rivers downstream of the damsflow through narrow valleys filled with erodible alluvial sediments. Slopes are gentle relativeto the volcanic parent materials to the east. The valley widens considerably downstream ofthe confluence of these three streams. Sand and gravel are mined in the lower basin, andmuch of the area is heavily farmed and developed for agriculture. The Row Riverdownstream of Dorena Dam has an average slope of 0.2 percent but is much steeperupstream of the reservoir, where the river flows through narrow, incised valleys (U.S. ArmyCorps of Engineers, 2001).
Environmental Conditions. Alterations to subbasin processes, aquatic habitat, and access tohistorical spawning and rearing areas in the Coast Fork Willamette Subbasin have affectedthe productivity, capacity, and diversity of cutthroat trout and spring Chinook populations.Also, Oregon chub have lost habitat as backwater and off-channel areas have disappeared asa result of changes in seasonal flows associated with the construction of dams throughout theCoast Fork Willamette Subbasin. Table 3-107 summarizes changes in the subbasin’senvironmental conditions and how these changes have affected cutthroat trout and springChinook salmon, while Table 3-108 summarizes the effects of environmental changes onOregon chub.
The U.S. Army Corps of Engineers dams have restricted fish access to the upper subbasinand changed downstream hydrologic processes, water quality, and processes influencinghabitat formation. There are no fish passage facilities at the Cottage Grove or Dorena dams.Cottage Grove Dam does not block access to historical spring Chinook salmon spawningareas, but Dorena Dam does block access to some historical habitat in the Row River. Bothdams limit the movement of cutthroat trout.
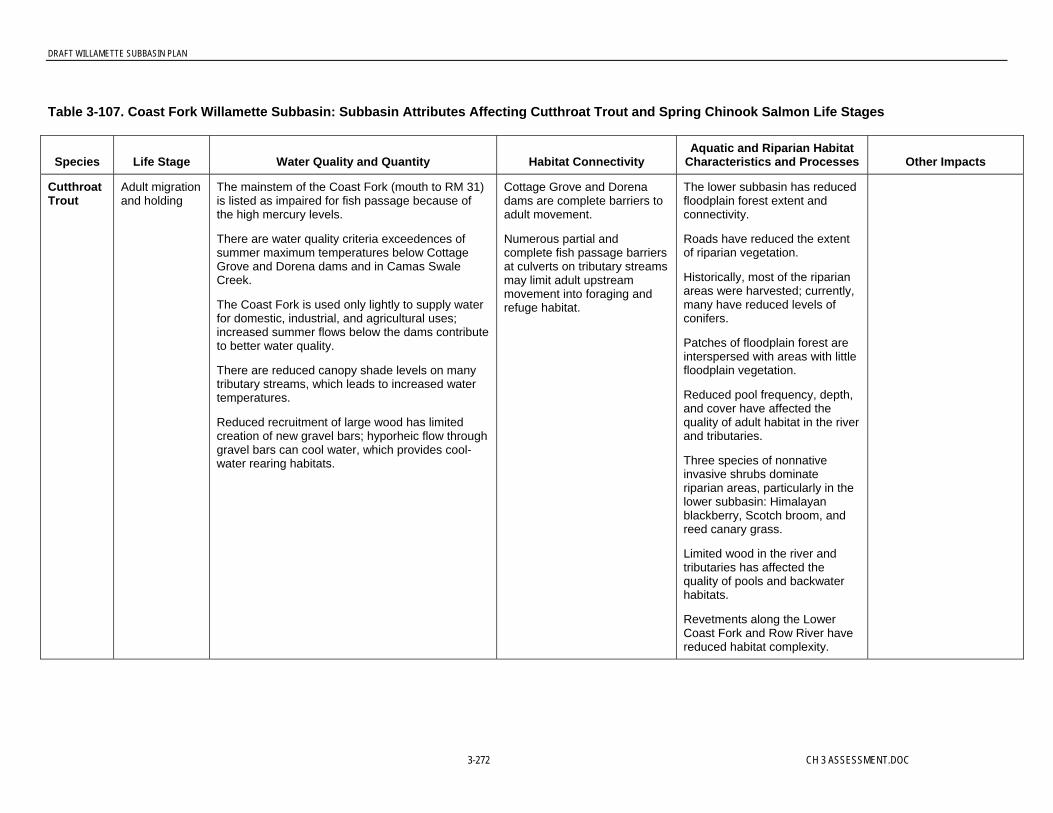
DRAFT WILLAMETTE SUBBASIN PLAN
3-272 CH 3 ASSESSMENT.DOC
Table 3-107. Coast Fork Willamette Subbasin: Subbasin Attributes Affecting Cutthroat Trout and Spring Chinook Salmon Life Stages
Species Life Stage Water Quality and Quantity Habitat ConnectivityAquatic and Riparian Habitat
Characteristics and Processes Other Impacts
CutthroatTrout
Adult migrationand holding
The mainstem of the Coast Fork (mouth to RM 31)is listed as impaired for fish passage because ofthe high mercury levels.
There are water quality criteria exceedences ofsummer maximum temperatures below CottageGrove and Dorena dams and in Camas SwaleCreek.
The Coast Fork is used only lightly to supply waterfor domestic, industrial, and agricultural uses;increased summer flows below the dams contributeto better water quality.
There are reduced canopy shade levels on manytributary streams, which leads to increased watertemperatures.
Reduced recruitment of large wood has limitedcreation of new gravel bars; hyporheic flow throughgravel bars can cool water, which provides cool-water rearing habitats.
Cottage Grove and Dorenadams are complete barriers toadult movement.
Numerous partial andcomplete fish passage barriersat culverts on tributary streamsmay limit adult upstreammovement into foraging andrefuge habitat.
The lower subbasin has reducedfloodplain forest extent andconnectivity.
Roads have reduced the extentof riparian vegetation.
Historically, most of the riparianareas were harvested; currently,many have reduced levels ofconifers.
Patches of floodplain forest areinterspersed with areas with littlefloodplain vegetation.
Reduced pool frequency, depth,and cover have affected thequality of adult habitat in the riverand tributaries.
Three species of nonnativeinvasive shrubs dominateriparian areas, particularly in thelower subbasin: Himalayanblackberry, Scotch broom, andreed canary grass.
Limited wood in the river andtributaries has affected thequality of pools and backwaterhabitats.
Revetments along the LowerCoast Fork and Row River havereduced habitat complexity.
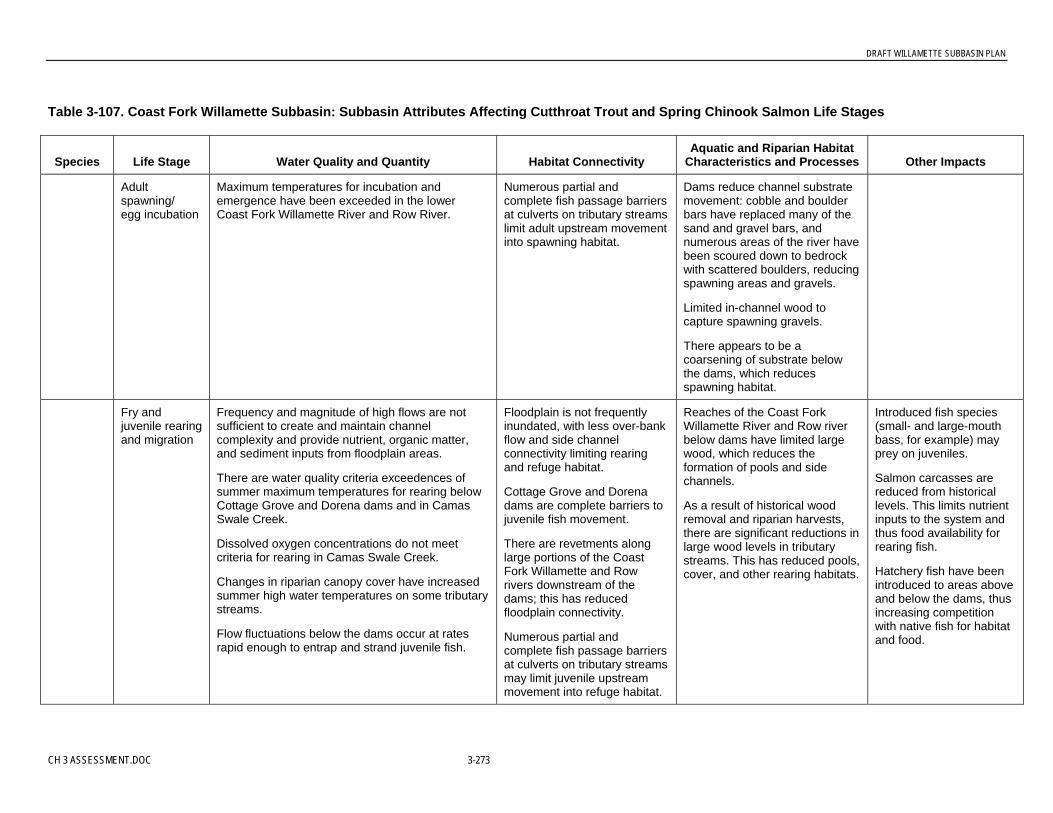
DRAFT WILLAMETTE SUBBASIN PLAN
CH 3 ASSESSMENT.DOC 3-273
Table 3-107. Coast Fork Willamette Subbasin: Subbasin Attributes Affecting Cutthroat Trout and Spring Chinook Salmon Life Stages
Species Life Stage Water Quality and Quantity Habitat ConnectivityAquatic and Riparian Habitat
Characteristics and Processes Other Impacts
Adultspawning/egg incubation
Maximum temperatures for incubation andemergence have been exceeded in the lowerCoast Fork Willamette River and Row River.
Numerous partial andcomplete fish passage barriersat culverts on tributary streamslimit adult upstream movementinto spawning habitat.
Dams reduce channel substratemovement: cobble and boulderbars have replaced many of thesand and gravel bars, andnumerous areas of the river havebeen scoured down to bedrockwith scattered boulders, reducingspawning areas and gravels.
Limited in-channel wood tocapture spawning gravels.
There appears to be acoarsening of substrate belowthe dams, which reducesspawning habitat.
Fry andjuvenile rearingand migration
Frequency and magnitude of high flows are notsufficient to create and maintain channelcomplexity and provide nutrient, organic matter,and sediment inputs from floodplain areas.
There are water quality criteria exceedences ofsummer maximum temperatures for rearing belowCottage Grove and Dorena dams and in CamasSwale Creek.
Dissolved oxygen concentrations do not meetcriteria for rearing in Camas Swale Creek.
Changes in riparian canopy cover have increasedsummer high water temperatures on some tributarystreams.
Flow fluctuations below the dams occur at ratesrapid enough to entrap and strand juvenile fish.
Floodplain is not frequentlyinundated, with less over-bankflow and side channelconnectivity limiting rearingand refuge habitat.
Cottage Grove and Dorenadams are complete barriers tojuvenile fish movement.
There are revetments alonglarge portions of the CoastFork Willamette and Rowrivers downstream of thedams; this has reducedfloodplain connectivity.
Numerous partial andcomplete fish passage barriersat culverts on tributary streamsmay limit juvenile upstreammovement into refuge habitat.
Reaches of the Coast ForkWillamette River and Row riverbelow dams have limited largewood, which reduces theformation of pools and sidechannels.
As a result of historical woodremoval and riparian harvests,there are significant reductions inlarge wood levels in tributarystreams. This has reduced pools,cover, and other rearing habitats.
Introduced fish species(small- and large-mouthbass, for example) mayprey on juveniles.
Salmon carcasses arereduced from historicallevels. This limits nutrientinputs to the system andthus food availability forrearing fish.
Hatchery fish have beenintroduced to areas aboveand below the dams, thusincreasing competitionwith native fish for habitatand food.
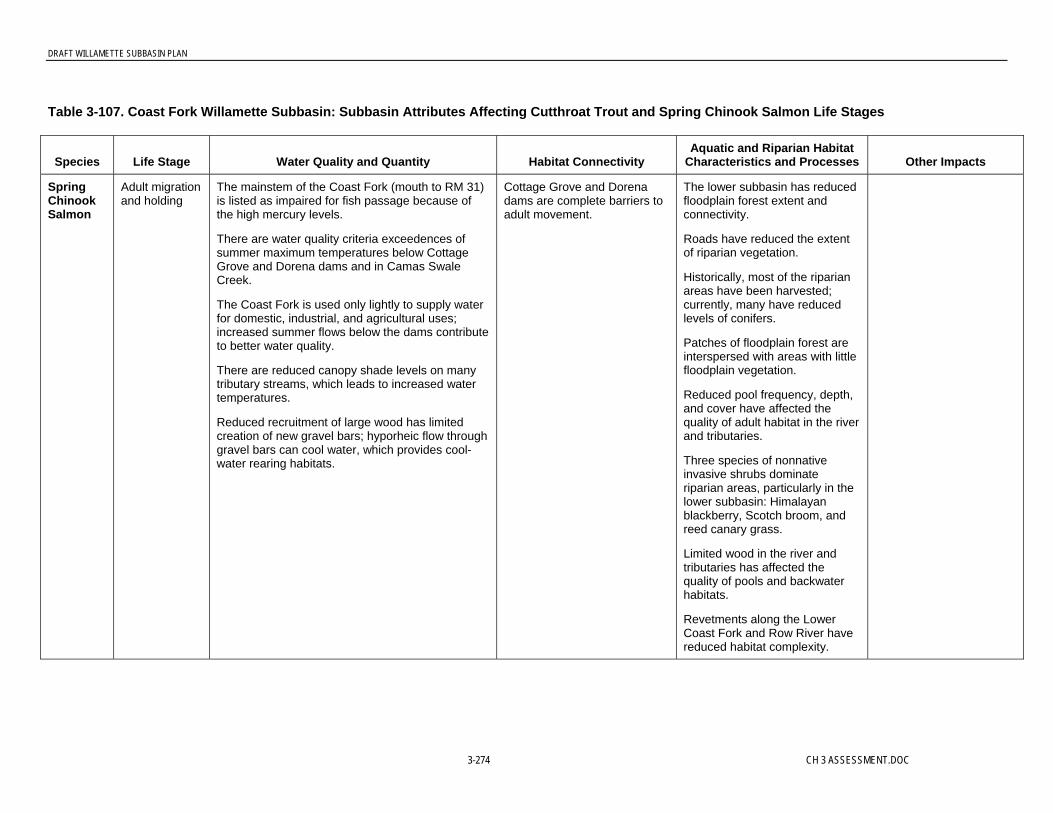
DRAFT WILLAMETTE SUBBASIN PLAN
3-274 CH 3 ASSESSMENT.DOC
Table 3-107. Coast Fork Willamette Subbasin: Subbasin Attributes Affecting Cutthroat Trout and Spring Chinook Salmon Life Stages
Species Life Stage Water Quality and Quantity Habitat ConnectivityAquatic and Riparian Habitat
Characteristics and Processes Other Impacts
SpringChinookSalmon
Adult migrationand holding
The mainstem of the Coast Fork (mouth to RM 31)is listed as impaired for fish passage because ofthe high mercury levels.
There are water quality criteria exceedences ofsummer maximum temperatures below CottageGrove and Dorena dams and in Camas SwaleCreek.
The Coast Fork is used only lightly to supply waterfor domestic, industrial, and agricultural uses;increased summer flows below the dams contributeto better water quality.
There are reduced canopy shade levels on manytributary streams, which leads to increased watertemperatures.
Reduced recruitment of large wood has limitedcreation of new gravel bars; hyporheic flow throughgravel bars can cool water, which provides cool-water rearing habitats.
Cottage Grove and Dorenadams are complete barriers toadult movement.
The lower subbasin has reducedfloodplain forest extent andconnectivity.
Roads have reduced the extentof riparian vegetation.
Historically, most of the riparianareas have been harvested;currently, many have reducedlevels of conifers.
Patches of floodplain forest areinterspersed with areas with littlefloodplain vegetation.
Reduced pool frequency, depth,and cover have affected thequality of adult habitat in the riverand tributaries.
Three species of nonnativeinvasive shrubs dominateriparian areas, particularly in thelower subbasin: Himalayanblackberry, Scotch broom, andreed canary grass.
Limited wood in the river andtributaries has affected thequality of pools and backwaterhabitats.
Revetments along the LowerCoast Fork and Row River havereduced habitat complexity.

DRAFT WILLAMETTE SUBBASIN PLAN
CH 3 ASSESSMENT.DOC 3-275
Table 3-107. Coast Fork Willamette Subbasin: Subbasin Attributes Affecting Cutthroat Trout and Spring Chinook Salmon Life Stages
Species Life Stage Water Quality and Quantity Habitat ConnectivityAquatic and Riparian Habitat
Characteristics and Processes Other Impacts
Adultspawning/egg incubation
Maximum temperatures for incubation andemergence have been exceeded in the lowerCoast Fork Willamette River and Row River.
Dams reduce channel substratemovement: cobble and boulderbars have replaced many of thesand and gravel bars, andnumerous areas of the river havebeen scoured down to bedrockwith scattered boulders, whichreduces spawning areas andgravels.
Limited in-channel wood tocapture spawning gravels.
There appears to be acoarsening of substrate belowthe dams, which reducesspawning habitat.
Boating, fishing, and otherrecreational activitiesharass adults moving andholding in pools.

DRAFT WILLAMETTE SUBBASIN PLAN
3-276 CH 3 ASSESSMENT.DOC
Table 3-107. Coast Fork Willamette Subbasin: Subbasin Attributes Affecting Cutthroat Trout and Spring Chinook Salmon Life Stages
Species Life Stage Water Quality and Quantity Habitat ConnectivityAquatic and Riparian Habitat
Characteristics and Processes Other Impacts
Fry andjuvenile rearingand migration
Frequency and magnitude of high flows are notsufficient to create and maintain channelcomplexity and provide nutrient, organic matter,and sediment inputs from floodplain areas.
There are water quality criteria exceedences ofsummer maximum temperatures for rearing belowCottage Grove and Dorena dams and in CamasSwale Creek.
Dissolved oxygen concentrations do not meetcriteria for rearing in Camas Swale Creek.
Changes in riparian canopy cover have increasedsummer high water temperatures on some tributarystreams.
Flow fluctuations below the dams occur at ratesrapid enough to entrap and strand juvenile fish.
Floodplain is not frequentlyinundated, with less over-bankflow and side channelconnectivity limiting rearingand refuge habitat.
Cottage Grove and Dorenadams are complete barriers tojuvenile fish movement.
There are revetments alonglarge portions of the CoastFork Willamette and RowRivers downstream of thedams; this has reducedfloodplain connectivity.
Numerous partial andcomplete fish passage barriersat culverts on tributary streamsmay limit juvenile upstreammovement into refuge habitat.
Reaches of the Coast ForkWillamette River and Row riverbelow dams have limited largewood, which reduces theformation of pools and sidechannels.
As a result of historical woodremoval and riparian harvests,there are significant reductions inlarge wood levels in tributarystreams. This has reduced pools,cover, and other rearing habitats.
Introduced fish species(small- and large-mouthbass, for example) mayprey on juveniles.
Salmon carcasses arereduced from historicallevels. This limits nutrientinputs to the system andthus food availability forrearing fish.
Hatchery fish have beenintroduced to areas aboveand below the dams, thusincreasing competitionwith native fish for habitatand food.
Source: U.S. Army Corps of Engineers, 2001; ODFW 1992; Fernauld et al., 2001; Landers et al., 2001.
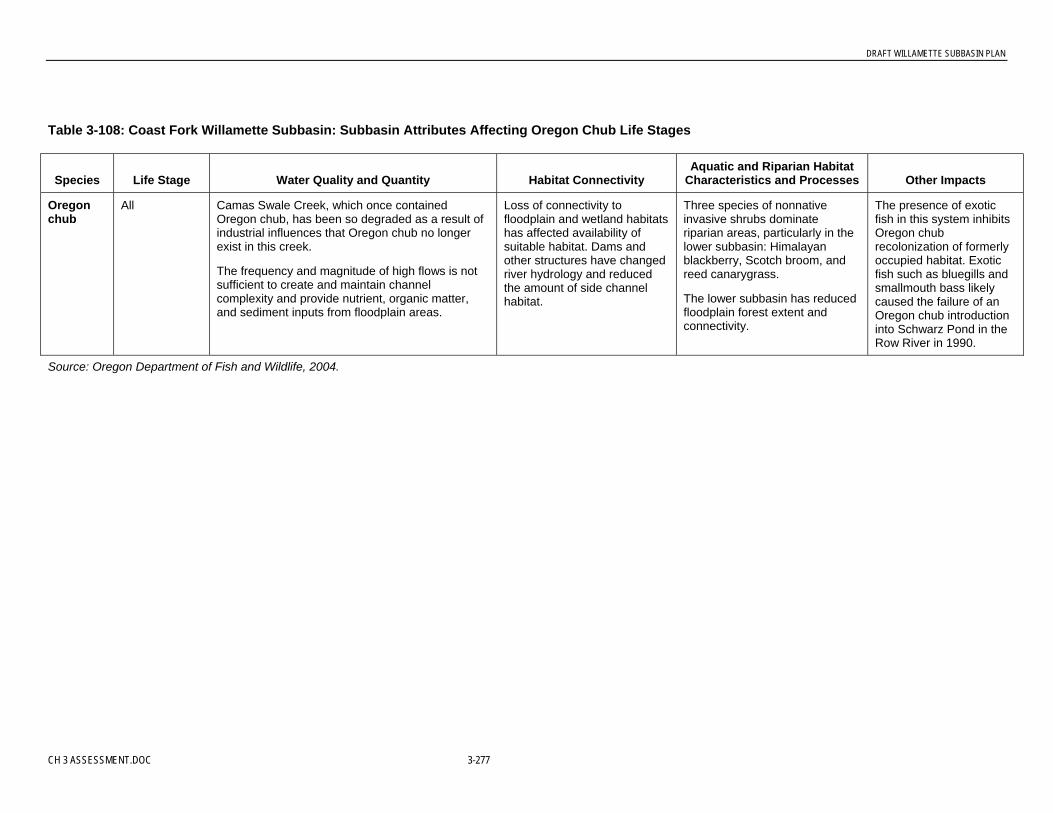
DRAFT WILLAMETTE SUBBASIN PLAN
CH 3 ASSESSMENT.DOC 3-277
Table 3-108: Coast Fork Willamette Subbasin: Subbasin Attributes Affecting Oregon Chub Life Stages
Species Life Stage Water Quality and Quantity Habitat ConnectivityAquatic and Riparian Habitat
Characteristics and Processes Other Impacts
Oregonchub
All Camas Swale Creek, which once containedOregon chub, has been so degraded as a result ofindustrial influences that Oregon chub no longerexist in this creek.
The frequency and magnitude of high flows is notsufficient to create and maintain channelcomplexity and provide nutrient, organic matter,and sediment inputs from floodplain areas.
Loss of connectivity tofloodplain and wetland habitatshas affected availability ofsuitable habitat. Dams andother structures have changedriver hydrology and reducedthe amount of side channelhabitat.
Three species of nonnativeinvasive shrubs dominateriparian areas, particularly in thelower subbasin: Himalayanblackberry, Scotch broom, andreed canarygrass.
The lower subbasin has reducedfloodplain forest extent andconnectivity.
The presence of exoticfish in this system inhibitsOregon chubrecolonization of formerlyoccupied habitat. Exoticfish such as bluegills andsmallmouth bass likelycaused the failure of anOregon chub introductioninto Schwarz Pond in theRow River in 1990.
Source: Oregon Department of Fish and Wildlife, 2004.
DRAFT WILLAMETTE SUBBASIN PLAN
3-278 CH 3 ASSESSMENT.DOC
Upper and Lower Subbasins. Relative to the lower subbasin, the forested upper subbasinabove the dams has aquatic habitat that is closer to the historical baseline, with the highestproportion of functioning riparian areas, the largest amounts of large wood in the river andtributary channels, and the highest quality spawning areas. The dams have altered the linksbetween the upper and lower subbasin, thus reducing the transport and delivery of largewood and substrate to downstream reaches. Changes in the abundance and distribution ofgravels, small cobbles and large wood (particularly in large jams) have reduced suitablespawning areas and limited areas for adult cutthroat trout and juvenile rearing habitat forspring Chinook salmon. In addition, the dams have changed flow regimes and watertemperature patterns. Compared to historical conditions, water temperatures in the riverbelow the dam are cooler in the summer and warmer in the fall and winter, which affects theupstream distribution of spring Chinook salmon adults, alters the timing of spawning, andaffects the period of egg incubation. The change in flow regimes has also altered theavailability and quality of Oregon chub habitat in backwater sloughs, floodplain ponds, andother slow-moving side-channel habitat. Among other things, warmer water temperatures inthese areas encourage the persistence and dispersal of exotic predaceous fish species.
Appendix G shows specific fish passage barriers on the Coast Fork, based on May 2004 datafrom ODFW; the information was compiled from existing ODFW databases.
Water Quality Changes. Water quality has been affected throughout the subbasin. Miningin the upper subbasin has increased mercury concentrations in the drainage over the naturallyhigh background levels. In addition, mercury has been found in fish from the Cottage Groveand Dorena reservoirs at levels that are potentially hazardous to humans (U.S. Army Corps ofEngineers, 2001). The mainstem of the Coast Fork (mouth to RM 31) is listed as impaired foranadromous fish passage because of the high mercury levels (Oregon Department ofEnvironmental Quality, 2004). Water temperatures in the river below the dams do not meetwater quality criteria (Oregon Department of Environmental Quality, 2004). The lowdissolved oxygen levels in Camas Swale Creek in the lower subbasin do not meet waterquality criteria (U.S. Army Corps of Engineers, 2001).
Large Wood. Historical removal of large wood from the river and tributary streams, reducedtransport of wood below the dams, and changes in riparian vegetation all have interacted toreduce the quantity and distribution of large wood in the river and tributaries. Approximately97 percent of the Upper Row River drainage has been harvested, and 76 percent of the UpperCoast Fork Willamette River drainage has been harvested at least once, which hascontributed to riparian areas being having primarily younger aged conifers and hardwoods(U.S. Army Corps of Engineers, 2001). Many of the upper subbasin tributaries do notprovide adequate shading or large wood recruitment. The lower subbasin contains extensiveagricultural, urban, and residential development that has limited the extent and compositionof riparian vegetation. In the lower subbasin, further loss of riparian vegetation and functionwas caused by the U.S. Army Corps of Engineer’s construction of 5 miles of revetmentsalong the banks of the lower Coast Fork Willamette River to protect agriculturaldevelopment from flood damage, and another mile of revetments along the lower Row River(U.S. Army Corps of Engineers, 2000). The construction of I-5 reduced riparian vegetationalong parts of the lower 25 miles of the Coast Fork. Historically, logjams and other largewood were removed from stream channels on both public and private land in a misdirectedeffort to improve fish passage, for timber salvage, and to reduce downstream damage to

DRAFT WILLAMETTE SUBBASIN PLAN
CH 3 ASSESSMENT.DOC 3-279
bridges during floods (U.S. Army Corps of Engineers, 2001). Limited wood in the river andtributary channels limits the formation of pools, thus reducing hiding areas for adult fish andrestricting the quality and quantity of juvenile rearing habitat.
Habitat Connectivity. Backwater habitats, including pool margins, side channels, andalcoves, are reduced from historical levels. Actions to stabilize the lower river through theplacement of riprap along banks (and other actions) and limited large wood in the channelhave interacted to reduce the quantity and quality of backwater habitats. Large sections of theCoast Fork Willamette and Row rivers have revetments (U.S. Army Corps of Engineers,2001). In addition, changes in the frequency and magnitude of high flow events below thedams have altered the formation of these complex habitats. Backwater areas in the river andlower tributaries serve as key habitats for adult and juvenile cutthroat trout and juvenilespring Chinook salmon, providing opportunities for fish to forage and take refuge from highflow events. In addition, backwater habitats are essential for the establishment and survivalof Oregon chub at all life stages.
Key Factors Limiting Fish Populations. The U.S. Army Corps of Engineers dams dividethe Coast Fork Willamette Subbasin, and the upper and lower subbasins are characterized bydifferent patterns of aquatic and riparian habitat, hydrologic regimes, water qualitycharacteristics and fish species distributions. For this reason, factors limiting populations forthe focal fish species are assessed separately for the upper and lower subbasins.
Limiting Factors on the Lower Coast Fork Willamette Subbasin. In the lower Coast ForkWillamette Subbasin, the productivity, capacity, and diversity of cutthroat trout and springChinook populations are limited by the following factors:
• Habitat Connectivity. Modification of the river’s high flow regime from dam regulation,channel and bank confinement through riprap and other actions, and reduced large woodin the channels have interacted to reduce backwater habitats important for juvenilerearing and winter refuge.
• Habitat Modification. Limited spawning areas and reduced levels of gravels/smallcobbles have reduced the areas available for spawning.
• Large Wood. Changes in the delivery and transport of large wood in the river andtributaries have modified gravel deposition patterns, reduced the frequency and depth ofpools, and minimized hiding cover for adult and juvenile fish.
• Water Temperature. Changes in high and low water temperature regimes have affectedadult spawning success and egg incubation and have limited the capacity of river andtributary streams to support juvenile fish.
• Fish Passage Barriers. The U.S. Army Corps of Engineers dams on the river and fishpassage barriers at road crossings on tributary streams prevent access into historicalspring Chinook salmon spawning areas, block the interchange between the upper andlower subbasin cutthroat trout populations, and limit juvenile access into rearing andrefuge habitat.
• Additional Factors. Other factors that are limiting cutthroat trout and spring Chinooksalmon populations include competition with hatchery and introduced fish; lower
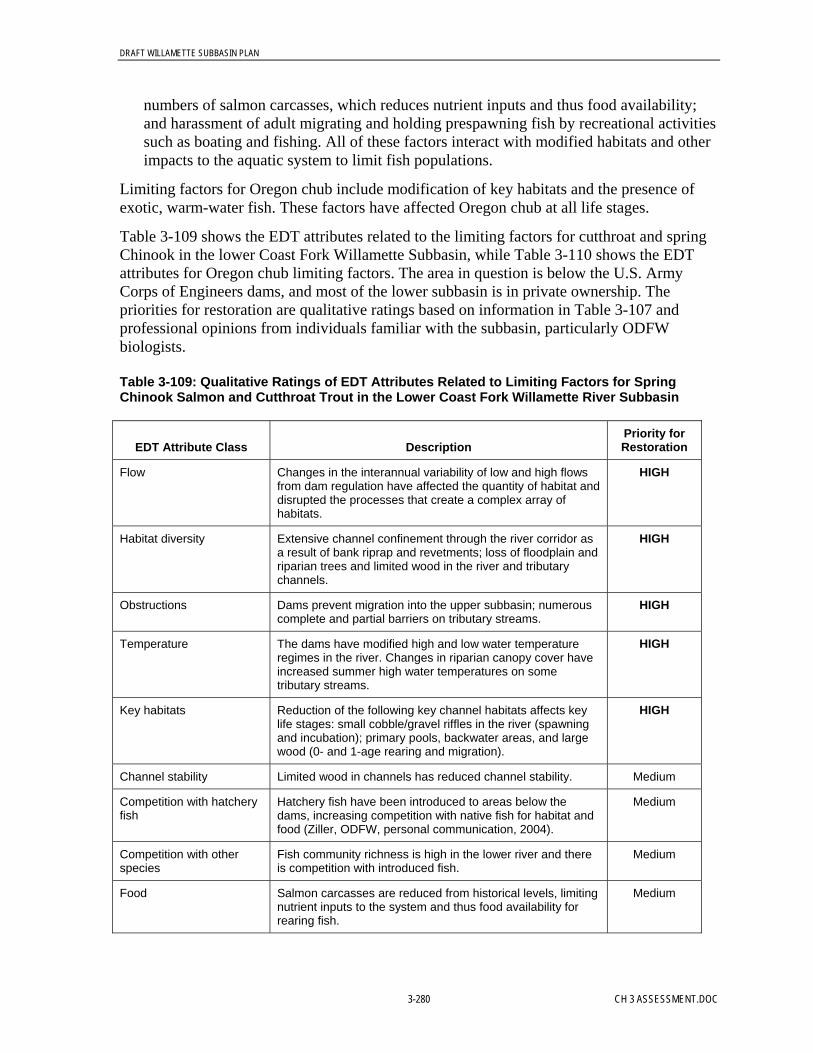
DRAFT WILLAMETTE SUBBASIN PLAN
3-280 CH 3 ASSESSMENT.DOC
numbers of salmon carcasses, which reduces nutrient inputs and thus food availability;and harassment of adult migrating and holding prespawning fish by recreational activitiessuch as boating and fishing. All of these factors interact with modified habitats and otherimpacts to the aquatic system to limit fish populations.
Limiting factors for Oregon chub include modification of key habitats and the presence ofexotic, warm-water fish. These factors have affected Oregon chub at all life stages.
Table 3-109 shows the EDT attributes related to the limiting factors for cutthroat and springChinook in the lower Coast Fork Willamette Subbasin, while Table 3-110 shows the EDTattributes for Oregon chub limiting factors. The area in question is below the U.S. ArmyCorps of Engineers dams, and most of the lower subbasin is in private ownership. Thepriorities for restoration are qualitative ratings based on information in Table 3-107 andprofessional opinions from individuals familiar with the subbasin, particularly ODFWbiologists.
Table 3-109: Qualitative Ratings of EDT Attributes Related to Limiting Factors for SpringChinook Salmon and Cutthroat Trout in the Lower Coast Fork Willamette River Subbasin
EDT Attribute Class DescriptionPriority forRestoration
Flow Changes in the interannual variability of low and high flowsfrom dam regulation have affected the quantity of habitat anddisrupted the processes that create a complex array ofhabitats.
HIGH
Habitat diversity Extensive channel confinement through the river corridor asa result of bank riprap and revetments; loss of floodplain andriparian trees and limited wood in the river and tributarychannels.
HIGH
Obstructions Dams prevent migration into the upper subbasin; numerouscomplete and partial barriers on tributary streams.
HIGH
Temperature The dams have modified high and low water temperatureregimes in the river. Changes in riparian canopy cover haveincreased summer high water temperatures on sometributary streams.
HIGH
Key habitats Reduction of the following key channel habitats affects keylife stages: small cobble/gravel riffles in the river (spawningand incubation); primary pools, backwater areas, and largewood (0- and 1-age rearing and migration).
HIGH
Channel stability Limited wood in channels has reduced channel stability. Medium
Competition with hatcheryfish
Hatchery fish have been introduced to areas below thedams, increasing competition with native fish for habitat andfood (Ziller, ODFW, personal communication, 2004).
Medium
Competition with otherspecies
Fish community richness is high in the lower river and thereis competition with introduced fish.
Medium
Food Salmon carcasses are reduced from historical levels, limitingnutrient inputs to the system and thus food availability forrearing fish.
Medium
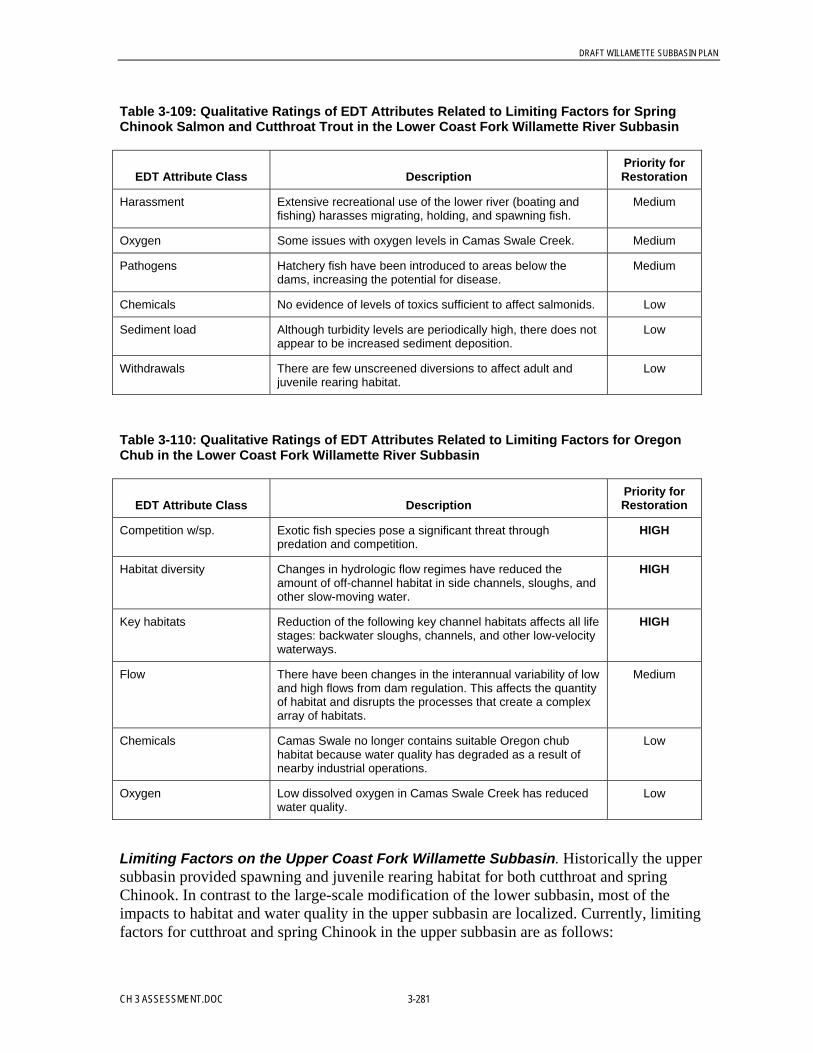
DRAFT WILLAMETTE SUBBASIN PLAN
CH 3 ASSESSMENT.DOC 3-281
Table 3-109: Qualitative Ratings of EDT Attributes Related to Limiting Factors for SpringChinook Salmon and Cutthroat Trout in the Lower Coast Fork Willamette River Subbasin
EDT Attribute Class DescriptionPriority forRestoration
Harassment Extensive recreational use of the lower river (boating andfishing) harasses migrating, holding, and spawning fish.
Medium
Oxygen Some issues with oxygen levels in Camas Swale Creek. Medium
Pathogens Hatchery fish have been introduced to areas below thedams, increasing the potential for disease.
Medium
Chemicals No evidence of levels of toxics sufficient to affect salmonids. Low
Sediment load Although turbidity levels are periodically high, there does notappear to be increased sediment deposition.
Low
Withdrawals There are few unscreened diversions to affect adult andjuvenile rearing habitat.
Low
Table 3-110: Qualitative Ratings of EDT Attributes Related to Limiting Factors for OregonChub in the Lower Coast Fork Willamette River Subbasin
EDT Attribute Class DescriptionPriority forRestoration
Competition w/sp. Exotic fish species pose a significant threat throughpredation and competition.
HIGH
Habitat diversity Changes in hydrologic flow regimes have reduced theamount of off-channel habitat in side channels, sloughs, andother slow-moving water.
HIGH
Key habitats Reduction of the following key channel habitats affects all lifestages: backwater sloughs, channels, and other low-velocitywaterways.
HIGH
Flow There have been changes in the interannual variability of lowand high flows from dam regulation. This affects the quantityof habitat and disrupts the processes that create a complexarray of habitats.
Medium
Chemicals Camas Swale no longer contains suitable Oregon chubhabitat because water quality has degraded as a result ofnearby industrial operations.
Low
Oxygen Low dissolved oxygen in Camas Swale Creek has reducedwater quality.
Low
Limiting Factors on the Upper Coast Fork Willamette Subbasin. Historically the uppersubbasin provided spawning and juvenile rearing habitat for both cutthroat and springChinook. In contrast to the large-scale modification of the lower subbasin, most of theimpacts to habitat and water quality in the upper subbasin are localized. Currently, limitingfactors for cutthroat and spring Chinook in the upper subbasin are as follows:

DRAFT WILLAMETTE SUBBASIN PLAN
3-282 CH 3 ASSESSMENT.DOC
• Channel and Habitat Modification. Roads next to stream channels have increasedchannel confinement and reduced riparian vegetation and canopy cover, but not to theextent as in the lower subbasin.
• Large Wood. There are systematic changes to the levels of large wood in the river andstream channels of the upper subbasin. Past management of riparian areas and streamcleaning practices have led to reduced large wood loads in the aquatic system. Reducedin-channel wood has modified gravel deposition patterns, reduced the frequency anddepth of pools, and minimized hiding cover for adult and juvenile fish.
• Additional Factors. Other, more moderate factors limiting fish populations includepartial and complete barriers to fish passage on tributary streams, changes in watertemperature regimes as a result of reduced canopy cover, competition with hatcheryintroductions, and lower numbers of salmon carcasses, which reduces nutrient input andthus food availability.
Limiting factors for Oregon chub include modification of key habitats and the presence ofexotic, warm-water fish. These factors have affected Oregon chub at all life stages.
Table 3-111 shows the EDT attributes related to the limiting factors for spring Chinook andcutthroat life in the upper Coast Fork Willamette Subbasin, while Table 112 shows the EDTattributes for Oregon chub limiting factors. The area in question is above the U.S. ArmyCorps of Engineers dams and is primarily under U.S. Forest Service management. Again, thetables present qualitative ratings based on the information in Table 3-107 and professionalopinions from individuals familiar with the subbasin, particularly ODFW biologists.
Table 3-111: Qualitative Ratings of EDT Attributes Related to Limiting Factors for CutthroatTrout and Spring Chinook Salmon in the Upper Coast Fork Willamette River Subbasin
EDT Attribute Class DescriptionPriority forRestoration
Habitat diversity Moderate channel confinement through the river corridor asa result of bank riprap, secondary roads, and limited largewood has affected the quality of habitat.
HIGH
Key habitats Reduction of the following key channel habitats affects keylife stages: primary pools, backwater areas, and large wood.
HIGH
Channel stability In some areas limited in-channel wood and reduced riparianfunction has destabilized channels.
Medium
Competition with hatcheryfish
Hatchery fish have been introduced to areas above thedams, increasing competition with native fish for habitat andfood.
Medium
Food Salmon carcasses are reduced from historical levels, limitingnutrient inputs to the system and thus food availability forrearing fish.
Medium
Obstructions Some complete and partial barriers on tributary streams. Medium
Pathogens Hatchery fish have been introduced to areas above thedams, increasing the potential for disease.
Medium

DRAFT WILLAMETTE SUBBASIN PLAN
CH 3 ASSESSMENT.DOC 3-283
Table 3-111: Qualitative Ratings of EDT Attributes Related to Limiting Factors for CutthroatTrout and Spring Chinook Salmon in the Upper Coast Fork Willamette River Subbasin
EDT Attribute Class DescriptionPriority forRestoration
Temperature Changes in riparian canopy cover have increased summerhigh water temperatures on some tributary streams.
Medium
Chemicals No evidence of levels of toxics sufficient to affect salmonids. Low
Competition with otherspecies
Very low number of introduced fish species present. Low
Flow There have not been significant changes in the interannualvariability of low and high flows.
Low
Harassment Moderate recreational use of the upper river (boating andfishing) harasses migrating, holding, and spawning fish.
Low
Oxygen Oxygen levels are adequate to support all life stages Low
Sediment load Although turbidity levels are periodically high, there does notappear to be increased sediment deposition.
Low
Withdrawals Minimal water withdrawals. Low
Table 3-112: Qualitative Ratings of EDT Attributes Related to Limiting Factors for OregonChub in the Upper Coast Fork Willamette River Subbasin
EDT Attribute Class DescriptionPriority forRestoration
Competition with otherspecies
Exotic fish species pose a significant threat throughpredation and competition.
HIGH
Habitat diversity Changes in hydrologic flow regimes have reduced theamount of off-channel habitat in side channels, sloughs, andother slow-moving water.
HIGH
Key habitats Reduction of the following key channel habitats affects all lifestages: backwater sloughs, channels, and other low-velocitywaterways.
HIGH
Flow There have been changes in the interannual variability of lowand high flows from dam regulation. This affects the quantityof habitat and disrupts the processes that create a complexarray of habitats.
Medium
3.5.1.3 Limiting Factors in the Long Tom SubbasinThis section describes the Long Tom Subbasin in terms of geographic setting andenvironmental conditions and presents information on the limiting factors for focal speciesfound in the subbasin: cutthroat and spring Chinook.
DRAFT WILLAMETTE SUBBASIN PLAN
3-284 CH 3 ASSESSMENT.DOC
Focal Species Present:• Cutthroat trout• Spring Chinook salmon (juvenile rearing and refuge; lower basin only)
Focal Species Historically Present:• Oregon chub
Geographic Setting. The Long Tom Subbasin covers an area of 410 square miles on theeastern slope of the Coast Range and the floor of the Willamette Valley. The Long TomRiver is approximately 55 miles long and enters the Willamette River at RM 146,approximately 25 miles downstream of the confluence with the McKenzie River. More than90 percent of the land in the Long Tom Subbasin is privately owned, with most of the privatelands in forestry (approximately 50 percent), agricultural, and rural residential land uses.Urban lands cover about 8 percent of the subbasin, primarily within the city of Eugene(Thieman, 2000). The Eugene District of the BLM, the U.S. Army Corps of Engineers, andthe Oregon Department of Forestry manage a small portion of the subbasin (Thieman, 2000).
Neither the Long Tom River nor its tributaries have spawning populations of anadromousfish, but juvenile Chinook salmon have been observed using the lower portions of the river asrearing and winter refuge habitat (Jeff Ziller, ODFW, personal communication, 2002).Cutthroat trout exist in all of the subbasin’s streams, and historically there was a populationthat moved between the Long Tom River and the Willamette River mainstem (Connolly etal., 1992).
The Long Tom River’s headwaters are on the east side of the Coast Range near Noti. FernRidge Reservoir (RM 26) divides the subbasin. The headwaters of the river flow throughindustrial forestlands, small-acreage farms, and rural residential areas until the river reachesthe Willamette Valley floor near Veneta. The river then flows several more miles throughrural residential areas and small farms and empties into Fern Ridge Reservoir. Majortributaries in the upper subbasin include Amazon (through diversion into the reservoir), Elk,Coyote, and Noti creeks. Most of the headwaters of Amazon Creek are within Eugene’s citylimits. Below Fern Ridge Dam, the Long Tom River flows through primarily agriculturallands, with some rural residential areas. Ferguson and Bear creeks are major tributariesbelow the dam.
Most of the subbasin lies below 1,000 feet in elevation. The upper subbasin drains the CoastRange, but most of the river and the larger tributaries flow through the Willamette Valley’srecent alluvial deposits. The Coast Range bedrock in the upper subbasin is predominantlymedium- to fine-grained marine sandstones of the Tyee Formation. These sedimentary rocksdo not have the permeability of volcanic rock and thus have limited groundwater storagecapacity. Consequently, the streams within the Long Tom Subbasin have lower summertimeflows and higher water temperatures than do Cascade Range streams. The subbasin’s highflow runoff patterns are dominated by a rain-on-snow hydrology in the mid- to upperelevations and rain-dominated flow patterns in the lower subbasin; this leads to rapiddelivery of water to the stream network. As a result of the Long Tom Subbasin’s lowelevations and the Coast Range geology, summertime streamflows are not supplemented bysnowmelt or spring-fed sources.
DRAFT WILLAMETTE SUBBASIN PLAN
CH 3 ASSESSMENT.DOC 3-285
The headwaters and tributaries of the upper Long Tom Subbasin flow steeply off the CoastRange. After the river and tributaries enter the Willamette Valley, the gradient decreases andthe river meanders through the alluvial deposits of the Willamette River. Prior to constructionof upstream flood control dams, flood flows from the Long Tom and Willamette riversinundated the entire lower portions of the Long Tom River Valley (U.S. Army Corps ofEngineers, 1947).
Environmental Conditions. Altered subbasin processes, modified riparian and aquatichabitat, and limited access to historical spawning and rearing areas have affected theproductivity, capacity, and diversity of cutthroat trout (at all life stages) and juvenile springChinook salmon in the Long Tom Subbasin. Table 3-113 summarizes changes in thesubbasin’s environmental conditions and how these impacts have affected cutthroat trout (atall life stages) and juvenile spring Chinook salmon life stages.
Fern Ridge Dam. The U.S. Army Corps of Engineers’ Fern Ridge Dam has restricted fishaccess to the upper subbasin and changed downstream hydrologic regimes, water quality, andprocesses influencing habitat formation. Construction of the dam in 1941 blocked fishpassage and eliminated the downstream transport of sediment and large wood from morethan 60 percent of the subbasin (U.S. Army Corps of Engineers, 2000). Fish passagestructures were not included during construction of Fern Ridge Dam because anadromoussalmonids were considered to be absent from the system (Willis et al., 1960). Fern RidgeDam has affected the fluvial population of cutthroat trout that moved between the uppersubbasin and the Willamette River. In the Long Tom River below the dam, younger cutthroattrout are absent and larger adults appear only seasonally (Connolly et al., 1992).
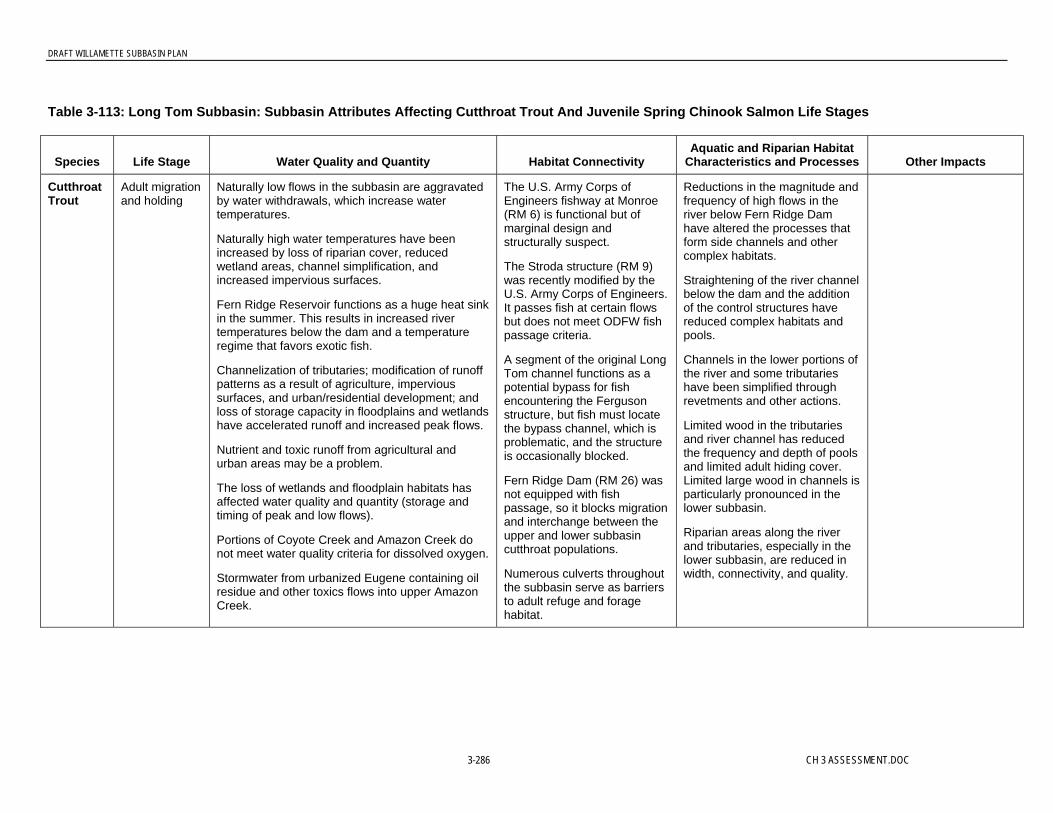
DRAFT WILLAMETTE SUBBASIN PLAN
3-286 CH 3 ASSESSMENT.DOC
Table 3-113: Long Tom Subbasin: Subbasin Attributes Affecting Cutthroat Trout And Juvenile Spring Chinook Salmon Life Stages
Species Life Stage Water Quality and Quantity Habitat ConnectivityAquatic and Riparian Habitat
Characteristics and Processes Other Impacts
CutthroatTrout
Adult migrationand holding
Naturally low flows in the subbasin are aggravatedby water withdrawals, which increase watertemperatures.
Naturally high water temperatures have beenincreased by loss of riparian cover, reducedwetland areas, channel simplification, andincreased impervious surfaces.
Fern Ridge Reservoir functions as a huge heat sinkin the summer. This results in increased rivertemperatures below the dam and a temperatureregime that favors exotic fish.
Channelization of tributaries; modification of runoffpatterns as a result of agriculture, impervioussurfaces, and urban/residential development; andloss of storage capacity in floodplains and wetlandshave accelerated runoff and increased peak flows.
Nutrient and toxic runoff from agricultural andurban areas may be a problem.
The loss of wetlands and floodplain habitats hasaffected water quality and quantity (storage andtiming of peak and low flows).
Portions of Coyote Creek and Amazon Creek donot meet water quality criteria for dissolved oxygen.
Stormwater from urbanized Eugene containing oilresidue and other toxics flows into upper AmazonCreek.
The U.S. Army Corps ofEngineers fishway at Monroe(RM 6) is functional but ofmarginal design andstructurally suspect.
The Stroda structure (RM 9)was recently modified by theU.S. Army Corps of Engineers.It passes fish at certain flowsbut does not meet ODFW fishpassage criteria.
A segment of the original LongTom channel functions as apotential bypass for fishencountering the Fergusonstructure, but fish must locatethe bypass channel, which isproblematic, and the structureis occasionally blocked.
Fern Ridge Dam (RM 26) wasnot equipped with fishpassage, so it blocks migrationand interchange between theupper and lower subbasincutthroat populations.
Numerous culverts throughoutthe subbasin serve as barriersto adult refuge and foragehabitat.
Reductions in the magnitude andfrequency of high flows in theriver below Fern Ridge Damhave altered the processes thatform side channels and othercomplex habitats.
Straightening of the river channelbelow the dam and the additionof the control structures havereduced complex habitats andpools.
Channels in the lower portions ofthe river and some tributarieshave been simplified throughrevetments and other actions.
Limited wood in the tributariesand river channel has reducedthe frequency and depth of poolsand limited adult hiding cover.Limited large wood in channels isparticularly pronounced in thelower subbasin.
Riparian areas along the riverand tributaries, especially in thelower subbasin, are reduced inwidth, connectivity, and quality.
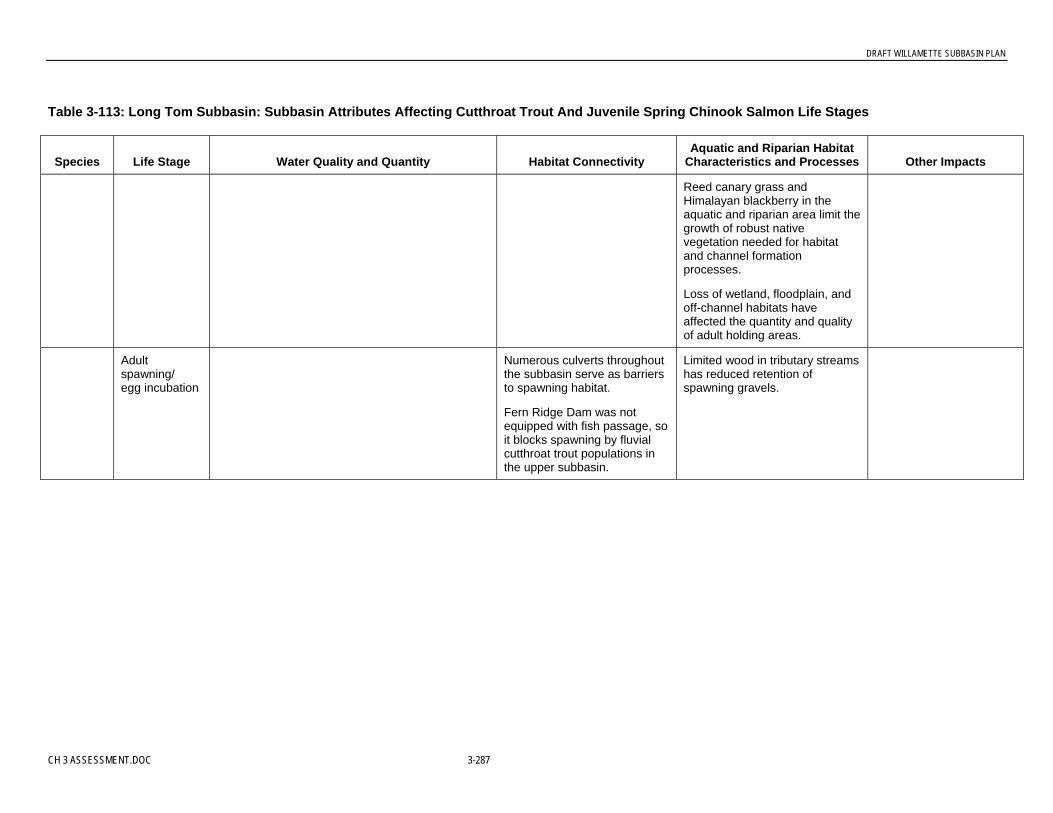
DRAFT WILLAMETTE SUBBASIN PLAN
CH 3 ASSESSMENT.DOC 3-287
Table 3-113: Long Tom Subbasin: Subbasin Attributes Affecting Cutthroat Trout And Juvenile Spring Chinook Salmon Life Stages
Species Life Stage Water Quality and Quantity Habitat ConnectivityAquatic and Riparian Habitat
Characteristics and Processes Other Impacts
Reed canary grass andHimalayan blackberry in theaquatic and riparian area limit thegrowth of robust nativevegetation needed for habitatand channel formationprocesses.
Loss of wetland, floodplain, andoff-channel habitats haveaffected the quantity and qualityof adult holding areas.
Adultspawning/egg incubation
Numerous culverts throughoutthe subbasin serve as barriersto spawning habitat.
Fern Ridge Dam was notequipped with fish passage, soit blocks spawning by fluvialcutthroat trout populations inthe upper subbasin.
Limited wood in tributary streamshas reduced retention ofspawning gravels.
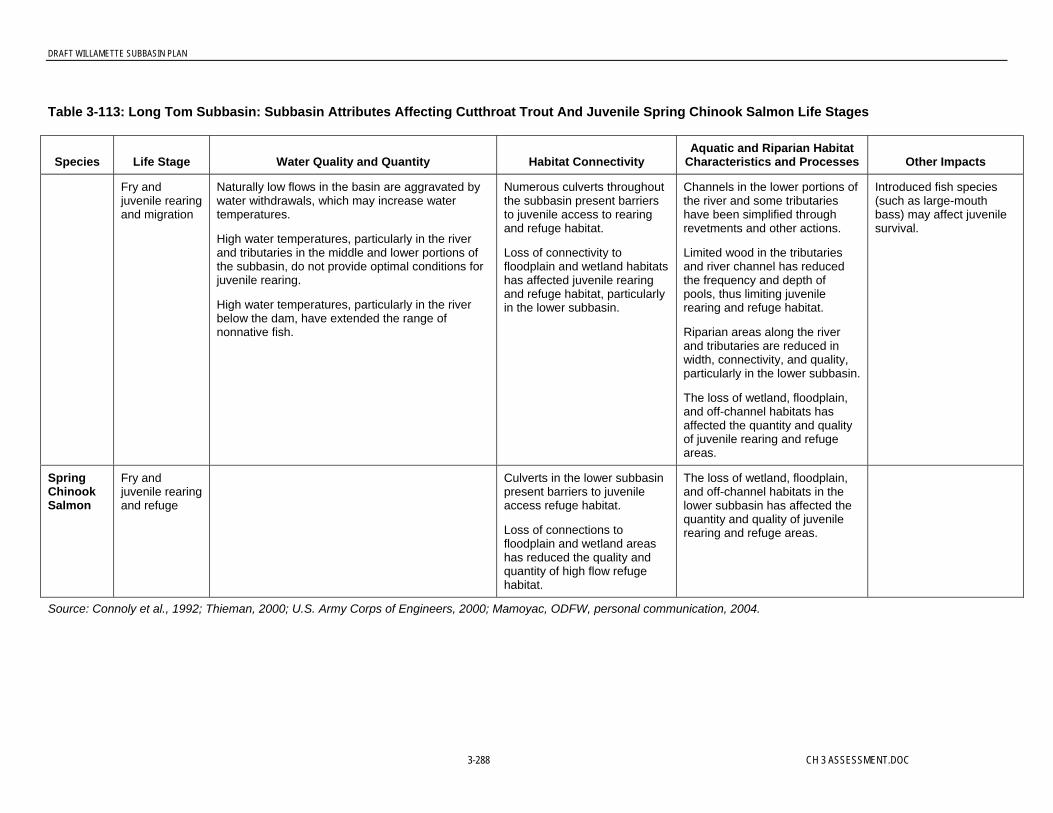
DRAFT WILLAMETTE SUBBASIN PLAN
3-288 CH 3 ASSESSMENT.DOC
Table 3-113: Long Tom Subbasin: Subbasin Attributes Affecting Cutthroat Trout And Juvenile Spring Chinook Salmon Life Stages
Species Life Stage Water Quality and Quantity Habitat ConnectivityAquatic and Riparian Habitat
Characteristics and Processes Other Impacts
Fry andjuvenile rearingand migration
Naturally low flows in the basin are aggravated bywater withdrawals, which may increase watertemperatures.
High water temperatures, particularly in the riverand tributaries in the middle and lower portions ofthe subbasin, do not provide optimal conditions forjuvenile rearing.
High water temperatures, particularly in the riverbelow the dam, have extended the range ofnonnative fish.
Numerous culverts throughoutthe subbasin present barriersto juvenile access to rearingand refuge habitat.
Loss of connectivity tofloodplain and wetland habitatshas affected juvenile rearingand refuge habitat, particularlyin the lower subbasin.
Channels in the lower portions ofthe river and some tributarieshave been simplified throughrevetments and other actions.
Limited wood in the tributariesand river channel has reducedthe frequency and depth ofpools, thus limiting juvenilerearing and refuge habitat.
Riparian areas along the riverand tributaries are reduced inwidth, connectivity, and quality,particularly in the lower subbasin.
The loss of wetland, floodplain,and off-channel habitats hasaffected the quantity and qualityof juvenile rearing and refugeareas.
Introduced fish species(such as large-mouthbass) may affect juvenilesurvival.
SpringChinookSalmon
Fry andjuvenile rearingand refuge
Culverts in the lower subbasinpresent barriers to juvenileaccess refuge habitat.
Loss of connections tofloodplain and wetland areashas reduced the quality andquantity of high flow refugehabitat.
The loss of wetland, floodplain,and off-channel habitats in thelower subbasin has affected thequantity and quality of juvenilerearing and refuge areas.
Source: Connoly et al., 1992; Thieman, 2000; U.S. Army Corps of Engineers, 2000; Mamoyac, ODFW, personal communication, 2004.

DRAFT WILLAMETTE SUBBASIN PLAN
CH 3 ASSESSMENT.DOC 3-289
Fish Passage Barriers. In addition to Fern Ridge Dam there are other fish passage issues inthe subbasin. Three structures on the lower Long Tom River serve as at least partial fishpassage barriers (Mamoyac, ODFW, personal communication, 2004): the fishway at Monroe,the Stroda structure, and the Ferguson structure. These structures are designed to control thegradient on the river, and all of them effectively act as dams. The fishway at Monroe (RM 6)has not been thoroughly assessed for fish passage, but it probably is a partial barrier. TheStroda structure (RM 9) was recently modified for passage and probably passes fish at certainflows but still does not meet ODFW’s fish passage criteria. A segment of the original LongTom River channel functions as a potential bypass for fish encountering the Fergusonstructure; however, fish must first locate this bypass channel, which requires that they dropdownstream 600 feet to enter the bypass. In addition to these barriers on the mainstem LongTom River, many of the road culverts on tributaries throughout the subbasin act as partial ortotal fish passage barriers (Thieman, 2000). Limiting the fish passage above culverts restrictsthe amount of habitat available for all cutthroat trout life stages.
Appendix G shows specific fish passage barriers on the Long Tom, based on May 2004 datafrom ODFW; the information was compiled from existing ODFW databases.
Upper and Lower Subbasins. Compared to the lower subbasin, the primarily forestedupper subbasin above the Fern Ridge Dam has aquatic habitat that is closer to the historicalbaseline, with the highest proportion of functioning riparian areas, largest amounts of largewood in the river and tributary channels, and higher quality aquatic habitats (Baker et al.,2002; Thieman, 2000). Impacts to flow regimes and aquatic-riparian habitats have beengreater in the lower subbasin than in the upper subbasin. Historically, the lower subbasin wascharacterized by very complex and productive fish habitat because it contains the largestproportion of unconstrained river and stream channels (Thieman, 2000; Pacific NorthwestEcosystem Research Consortium, 2002). Many of these channels have been affected bychanges in flow and temperature regimes and channelization.
Changes in Flow Regimes. Fern Ridge Dam (RM 26) has altered the links between theupper and lower subbasin, reducing the transport and delivery of large wood and alteringflow regimes. Changes in the abundance and distribution of large wood (particularly in largejams) have reduced the quantity and quality of habitat for adult cutthroat trout and juvenilespring Chinook salmon in the lower river. Flows in the Long Tom River are regulated by FernRidge Dam and affected by other water diversions and withdrawals. A structure was convertedin 1951 to divert flows (up to 1,250 cfs) from Amazon Creek into Fern Ridge Reservoir, andresidual flow in lower Amazon Creek enters the Long Tom River about 6 miles downstreamof the dam. There are also several small diversions upstream of Monroe (U.S. GeologicalSurvey, 1997). ODFW has indicated that “excessive water withdrawals” have negativelyaffected fish (Connolly et al., 1992). Flood control operations at Fern Ridge Dam havedecreased the magnitude and frequency of extreme high flow events, although the overallreduction has been less than has been observed for the other Willamette River projects. Post-project summer flows are greater than occurred historically because storage is available toredistribute flood volumes and release water later in the year for flow augmentation purposes.Since dam construction, the average daily flows in August and September have increased to81 cfs 228 cfs, respectively (Moffatt et al., 1990).

DRAFT WILLAMETTE SUBBASIN PLAN
3-290 CH 3 ASSESSMENT.DOC
In addition to changes in flow regimes from Fern Ridge Dam, runoff has accelerated andpeak flows in tributaries have increased as a result of channelization of tributaries andmodification of runoff patterns as a result of agriculture, impervious surfaces, andurban/residential development. Increased peak flows have been exacerbated further byextensive loss of wetlands and functioning floodplains, which have reduced the subbasin’scapacity to store and gradually release floodwaters.
Water Quality Changes. Water quality has been modified throughout the subbasin. Waterquality monitoring indicates that that there are low levels of suspended solids in runoff fromagricultural fields and potentially high levels of nitrate and phosphorous (Thieman, 2000).Almost none of the streams that have been monitored in the subbasin meet water qualitycriteria for temperature (Thieman, 2000). Water warming within Fern Ridge Reservoir andits release into the river, loss of riparian cover, reduced wetland areas, channel simplification,and increased impervious surfaces aggravate high water temperatures. Compared to historicalconditions, water temperatures in the river below the dam are warmer in the summer. TheLong Tom River between Fern Ridge Dam and the mouth can exceed 80° F during thesummer (U.S. Army Corps of Engineers, 2001). Warm water temperatures in the LowerLong Tom River favor nonnative fish species (large-mouth bass, for example) over nativefish (Mamoyac, ODFW, personal communication, 2004). Cutthroat trout move out of FernRidge Reservoir in late July and early August, probably because of water warming in thereservoir (Connolly et al., 1992). The subbasin’s natural summertime low flows areaggravated by water withdrawals, which increase water temperatures. Portions of Coyote andAmazon creeks do not meet water quality criteria for dissolved oxygen (Oregon Departmentof Environmental Quality, 1998). In addition, stormwater from urbanized Eugene delivers oilresidue and other toxics to upper Amazon Creek (Thieman, 2000).
Large Wood. Historical removal of large wood from the river and tributary streams, reducedtransport of wood below Fern Ridge Dam, and changes in riparian vegetation all haveinteracted to reduce the quantity and distribution of large wood in the river and tributaries.Riparian areas throughout the subbasin have been modified, with more changes occurring inthe lower subbasin than in the upper. There has been an extreme loss of riparian functionfrom approximately 46 percent of the lower subbasin’s valley bottom areas and 10 percent ofthe upper subbasin’s forested areas (Thieman, 2000). Reduced wood in the river and tributarychannels limits the formation of pools, thus reducing hiding areas for adult fish andrestricting the quality and quantity of juvenile rearing habitat.
Habitat Connectivity. Backwater habitats, including pool margins, side channels, andalcoves, are reduced compared to historical levels. Historically the lower Long Tom Riverwas characterized by numerous wetlands and oxbows, with abundant large wood in thechannel (U.S. Army Corps of Engineers, 2001). Almost the entire length of the mainstem,from its mouth to Fern Ridge Dam, has been channelized, straightened, leveed, or otherwisemodified by projects related to drainage and irrigation (Thieman, 2000). Portions of CoyoteCreek, Amazon Creek, and other tributaries also have been channelized (U.S. Army Corps ofEngineers, 2001). The majority of wetlands in the lower subbasin have been converted toother land uses (Thieman, 2000). In addition, changes in the frequency and magnitude ofhigh flow events below the dam have altered the formation of these complex habitats. Largewood has been removed from many of the streams within the subbasin (Thieman, 2000).

DRAFT WILLAMETTE SUBBASIN PLAN
CH 3 ASSESSMENT.DOC 3-291
Typically, backwater areas in the river and lower tributaries provide key habitats for adultand juvenile cutthroat tout and juvenile spring Chinook salmon. These habitats provide fishwith habitat for foraging and refuge from high flow events.
Key Factors Limiting Fish Populations. Fern Ridge Dam divides the Long Tom Subbasinat RM 26. The upper and lower subbasins are characterized by different patterns of aquaticand riparian habitat, hydrologic regimes, water quality characteristics, and fish speciesdistributions. For this reason, factors limiting populations for the focal fish species areassessed separately for the upper and lower subbasins.
Limiting Factors in the Lower Long Tom. In the lower Long Tom Subbasin, theproductivity, capacity, and diversity of cutthroat trout and juvenile spring Chinook salmonpopulations are limited by the following factors:
• Flow Modification. Modification of the river’s high flow regime from dam regulation;channel and bank confinement through channelization, riprap and other actions; andreduced large wood in the channels have interacted to reduce floodplain connectivity andbackwater habitats important for juvenile Chinook salmon rearing and winter refuge.
• Habitat Modification. Modification of key aquatic habitats has affected all life stages.
• Large Wood. Changes in the delivery and transport of large wood in the river andtributaries has modified gravel deposition patterns, reduced the frequency and depth ofpools, and minimized hiding cover for adult and juvenile cutthroat trout and affectedjuvenile Chinook salmon rearing areas in the lower river.
• Water Temperature. Increased summertime water temperature regimes have affectedadult cutthroat trout populations and limited the capacity of river and tributary streams tosupport juvenile fish.
• Fish Passage Barriers. Fern Ridge Dam, other dams on the lower Long Tom River, andfish passage barriers at road crossings on tributary streams block the interchange betweenthe upper and lower subbasin cutthroat trout populations and limit juvenile access torearing and refuge habitat.
• Additional Factors. Other factors affecting fish populations include competition withintroduced fish, runoff of toxics from urban and agricultural areas, and some unscreenedwater diversions.
Table 3-114 shows the EDT attributes limiting cutthroat trout and juvenile spring Chinooksalmon in the Lower Long Tom Subbasin (below Fern Ridge Dam). The priorities forrestoration are qualitative ratings based on the information in Table 3-113and professionalopinions from individuals familiar with the subbasin, particularly ODFW biologists.
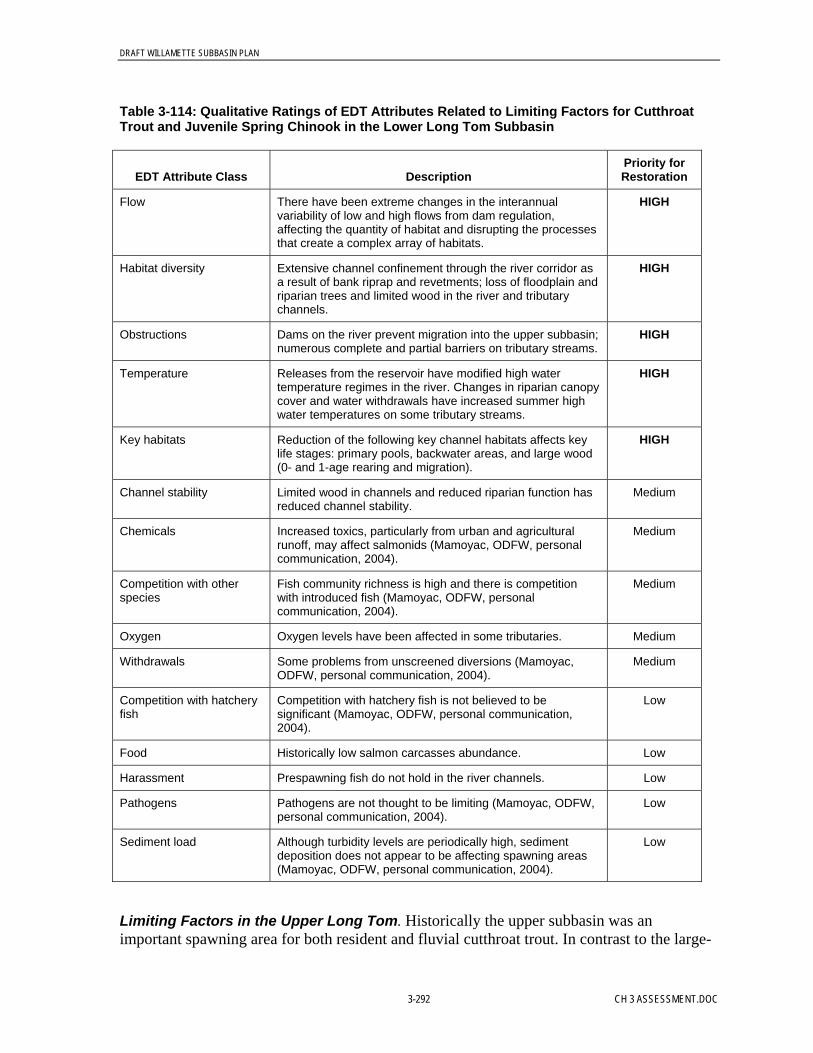
DRAFT WILLAMETTE SUBBASIN PLAN
3-292 CH 3 ASSESSMENT.DOC
Table 3-114: Qualitative Ratings of EDT Attributes Related to Limiting Factors for CutthroatTrout and Juvenile Spring Chinook in the Lower Long Tom Subbasin
EDT Attribute Class DescriptionPriority forRestoration
Flow There have been extreme changes in the interannualvariability of low and high flows from dam regulation,affecting the quantity of habitat and disrupting the processesthat create a complex array of habitats.
HIGH
Habitat diversity Extensive channel confinement through the river corridor asa result of bank riprap and revetments; loss of floodplain andriparian trees and limited wood in the river and tributarychannels.
HIGH
Obstructions Dams on the river prevent migration into the upper subbasin;numerous complete and partial barriers on tributary streams.
HIGH
Temperature Releases from the reservoir have modified high watertemperature regimes in the river. Changes in riparian canopycover and water withdrawals have increased summer highwater temperatures on some tributary streams.
HIGH
Key habitats Reduction of the following key channel habitats affects keylife stages: primary pools, backwater areas, and large wood(0- and 1-age rearing and migration).
HIGH
Channel stability Limited wood in channels and reduced riparian function hasreduced channel stability.
Medium
Chemicals Increased toxics, particularly from urban and agriculturalrunoff, may affect salmonids (Mamoyac, ODFW, personalcommunication, 2004).
Medium
Competition with otherspecies
Fish community richness is high and there is competitionwith introduced fish (Mamoyac, ODFW, personalcommunication, 2004).
Medium
Oxygen Oxygen levels have been affected in some tributaries. Medium
Withdrawals Some problems from unscreened diversions (Mamoyac,ODFW, personal communication, 2004).
Medium
Competition with hatcheryfish
Competition with hatchery fish is not believed to besignificant (Mamoyac, ODFW, personal communication,2004).
Low
Food Historically low salmon carcasses abundance. Low
Harassment Prespawning fish do not hold in the river channels. Low
Pathogens Pathogens are not thought to be limiting (Mamoyac, ODFW,personal communication, 2004).
Low
Sediment load Although turbidity levels are periodically high, sedimentdeposition does not appear to be affecting spawning areas(Mamoyac, ODFW, personal communication, 2004).
Low
Limiting Factors in the Upper Long Tom. Historically the upper subbasin was animportant spawning area for both resident and fluvial cutthroat trout. In contrast to the large-
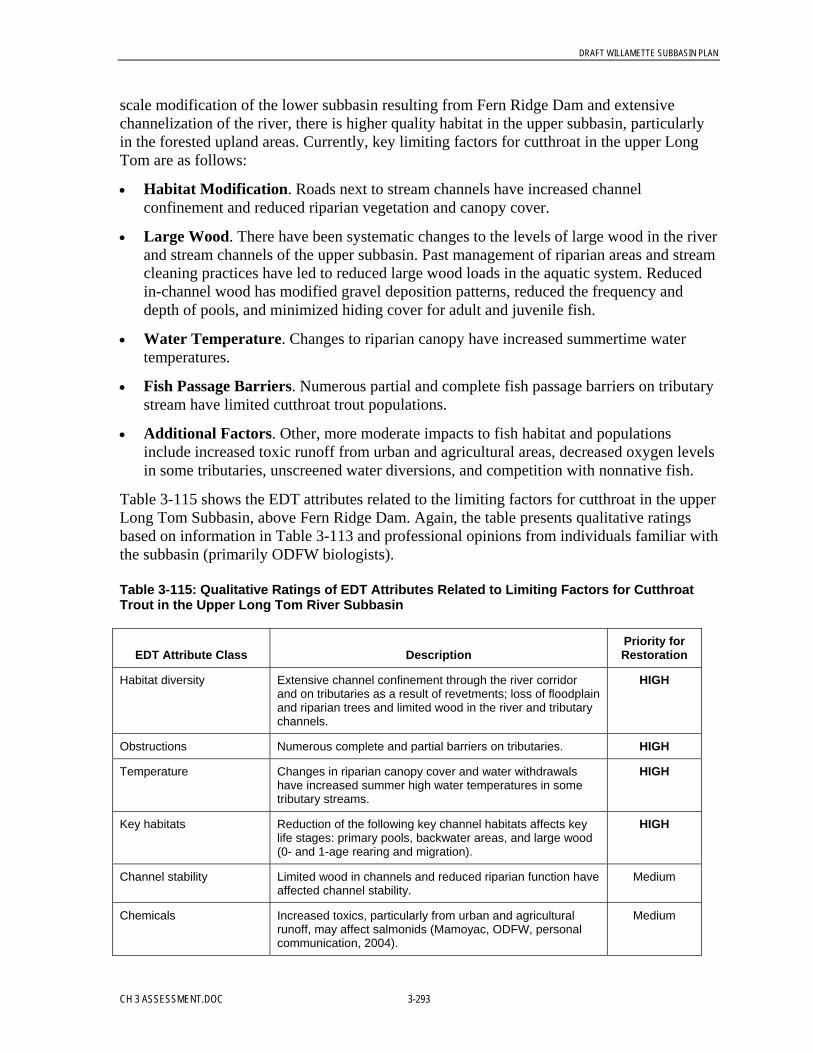
DRAFT WILLAMETTE SUBBASIN PLAN
CH 3 ASSESSMENT.DOC 3-293
scale modification of the lower subbasin resulting from Fern Ridge Dam and extensivechannelization of the river, there is higher quality habitat in the upper subbasin, particularlyin the forested upland areas. Currently, key limiting factors for cutthroat in the upper LongTom are as follows:
• Habitat Modification. Roads next to stream channels have increased channelconfinement and reduced riparian vegetation and canopy cover.
• Large Wood. There have been systematic changes to the levels of large wood in the riverand stream channels of the upper subbasin. Past management of riparian areas and streamcleaning practices have led to reduced large wood loads in the aquatic system. Reducedin-channel wood has modified gravel deposition patterns, reduced the frequency anddepth of pools, and minimized hiding cover for adult and juvenile fish.
• Water Temperature. Changes to riparian canopy have increased summertime watertemperatures.
• Fish Passage Barriers. Numerous partial and complete fish passage barriers on tributarystream have limited cutthroat trout populations.
• Additional Factors. Other, more moderate impacts to fish habitat and populationsinclude increased toxic runoff from urban and agricultural areas, decreased oxygen levelsin some tributaries, unscreened water diversions, and competition with nonnative fish.
Table 3-115 shows the EDT attributes related to the limiting factors for cutthroat in the upperLong Tom Subbasin, above Fern Ridge Dam. Again, the table presents qualitative ratingsbased on information in Table 3-113 and professional opinions from individuals familiar withthe subbasin (primarily ODFW biologists).
Table 3-115: Qualitative Ratings of EDT Attributes Related to Limiting Factors for CutthroatTrout in the Upper Long Tom River Subbasin
EDT Attribute Class DescriptionPriority forRestoration
Habitat diversity Extensive channel confinement through the river corridorand on tributaries as a result of revetments; loss of floodplainand riparian trees and limited wood in the river and tributarychannels.
HIGH
Obstructions Numerous complete and partial barriers on tributaries. HIGH
Temperature Changes in riparian canopy cover and water withdrawalshave increased summer high water temperatures in sometributary streams.
HIGH
Key habitats Reduction of the following key channel habitats affects keylife stages: primary pools, backwater areas, and large wood(0- and 1-age rearing and migration).
HIGH
Channel stability Limited wood in channels and reduced riparian function haveaffected channel stability.
Medium
Chemicals Increased toxics, particularly from urban and agriculturalrunoff, may affect salmonids (Mamoyac, ODFW, personalcommunication, 2004).
Medium
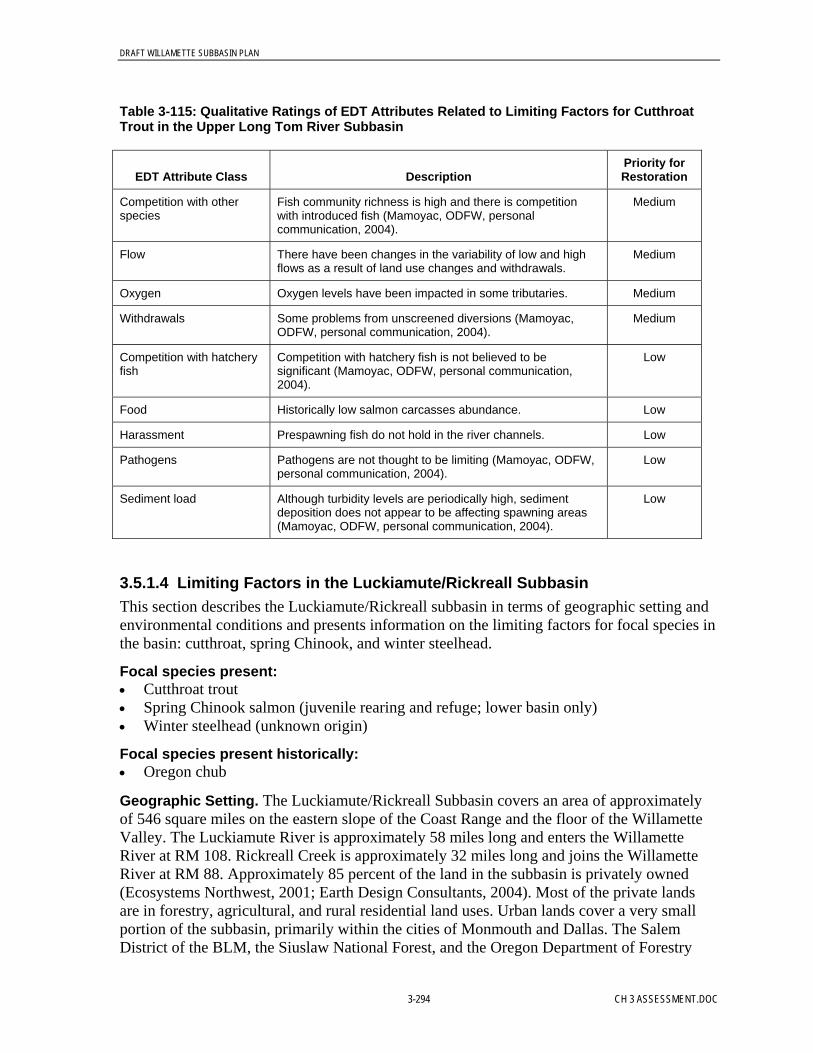
DRAFT WILLAMETTE SUBBASIN PLAN
3-294 CH 3 ASSESSMENT.DOC
Table 3-115: Qualitative Ratings of EDT Attributes Related to Limiting Factors for CutthroatTrout in the Upper Long Tom River Subbasin
EDT Attribute Class DescriptionPriority forRestoration
Competition with otherspecies
Fish community richness is high and there is competitionwith introduced fish (Mamoyac, ODFW, personalcommunication, 2004).
Medium
Flow There have been changes in the variability of low and highflows as a result of land use changes and withdrawals.
Medium
Oxygen Oxygen levels have been impacted in some tributaries. Medium
Withdrawals Some problems from unscreened diversions (Mamoyac,ODFW, personal communication, 2004).
Medium
Competition with hatcheryfish
Competition with hatchery fish is not believed to besignificant (Mamoyac, ODFW, personal communication,2004).
Low
Food Historically low salmon carcasses abundance. Low
Harassment Prespawning fish do not hold in the river channels. Low
Pathogens Pathogens are not thought to be limiting (Mamoyac, ODFW,personal communication, 2004).
Low
Sediment load Although turbidity levels are periodically high, sedimentdeposition does not appear to be affecting spawning areas(Mamoyac, ODFW, personal communication, 2004).
Low
3.5.1.4 Limiting Factors in the Luckiamute/Rickreall SubbasinThis section describes the Luckiamute/Rickreall subbasin in terms of geographic setting andenvironmental conditions and presents information on the limiting factors for focal species inthe basin: cutthroat, spring Chinook, and winter steelhead.
Focal species present:• Cutthroat trout• Spring Chinook salmon (juvenile rearing and refuge; lower basin only)• Winter steelhead (unknown origin)
Focal species present historically:• Oregon chub
Geographic Setting. The Luckiamute/Rickreall Subbasin covers an area of approximatelyof 546 square miles on the eastern slope of the Coast Range and the floor of the WillametteValley. The Luckiamute River is approximately 58 miles long and enters the WillametteRiver at RM 108. Rickreall Creek is approximately 32 miles long and joins the WillametteRiver at RM 88. Approximately 85 percent of the land in the subbasin is privately owned(Ecosystems Northwest, 2001; Earth Design Consultants, 2004). Most of the private landsare in forestry, agricultural, and rural residential land uses. Urban lands cover a very smallportion of the subbasin, primarily within the cities of Monmouth and Dallas. The SalemDistrict of the BLM, the Siuslaw National Forest, and the Oregon Department of Forestry

DRAFT WILLAMETTE SUBBASIN PLAN
CH 3 ASSESSMENT.DOC 3-295
manage a small portion of the forested upper subbasin. Baskett Slough National WildlifeRefuge is in the Rickreall Creek drainage.
Neither the Luckiamute River nor Rickreall Creek has spawning populations of nativeanadromous fish, but juvenile Chinook salmon have been observed using the lower portionsof the Luckiamute as rearing and winter refuge habitat (Gary Galovich, ODFW, personalcommunication, 2003). Cutthroat trout exist in all of the subbasin’s streams, and historicallythere was a population that moved between the Luckiamute River and Rickreall Creek andthe mainstem of the Willamette River (Wevers et al., 1992). Naturally spawning wintersteelhead are present in both the Luckiamute and Rickreall Creek. It appears that these fishare strays or from introduced populations, and there is little evidence to suggest that self-sustaining spawning aggregations of winter steelhead existed historically in theLuckiamute/Rickreall subbasin (Myers et al., 2003). In general, cutthroat trout and wintersteelhead have similar habitat requirements.
The headwaters of the Luckiamute River and Rickreall Creek are on the forested east side ofthe Coast Range. In the upper subbasin land use is primarily private industrial forestlands. Asthe Luckiamute River and Rickreall Creek enter the Willamette Valley they flow past small-acreage farms and rural residential areas. The Luckiamute River enters the floor of theWillamette Valley near the community of Hoskins (RM 40). Rickreall Creek reaches thefloor of the valley near the city of Dallas, but Mercer Dam (RM 23) divides the upper andlower portions of the subbasin. Major tributaries in the upper subbasin of the LuckiamuteRiver include the Little Luckiamute River, Pedee Creek, and Price Creek. Major tributaries inthe forested upper Rickreall Creek include the North and South Fork Rickreall Creeks,Rockhouse Creek, and Canyon Creek. Soap Creek is a major tributary to the LuckiamuteRiver in the lower subbasin.
The Coast Range bedrock in the upper subbasin is composed predominantly of Seltz Riverbasalts with some sedimentary formations. Most of the subbasin lies below 1,000 feet inelevation. The upper subbasin drains the Coast Range, but most of the river and the largertributaries flow through the Willamette Valley’s recent alluvial deposits. The Coast Rangesedimentary rocks have lower groundwater storage capacity than is the case in the CascadeMountains, and the streams within the Luckiamute/Rickreall subbasin experience lowersummertime flows and higher water temperatures than do Cascade Range streams. Thesubbasin’s high flow runoff patterns are dominated by a rain-on-snow hydrology in the mid-to upper-elevations and rain-dominated flow patterns in the lower subbasin; this leads torapid delivery of water to the stream network. As a result of the subbasin’s low elevationsand the geology of the Coast Range, summertime stream flows are not supplemented bysnowmelt or spring-fed sources.
The headwaters and tributaries of the upper subbasin flow steeply off the Coast Range, withthe gradient rapidly decreasing once the streams enter the lower subbasin areas within the flatWillamette Valley (see Table 3-116). The lower Luckiamute River channel is very sinuous asit flows through the old fluvial deposits of the Willamette Valley. Rickreall Creek is moreentrenched and less sinuous (Ecosystems Northwest, 2001).

DRAFT WILLAMETTE SUBBASIN PLAN
3-296 CH 3 ASSESSMENT.DOC
Table 3-116: Percent Gradient for Major Segments of the Lower andUpper Luckiamute River and Rickreall Creek
Subbasin Location River Mile (RM) Percent Gradient
Rickreall: lower subbasin 0 to 24 0.43
Rickreall: upper subbasin 25 to 32 5.74
Luckiamute: lower subbasin 0 to 40 0.08
Luckiamute: upper subbasin 40 to 58 2.12
Environmental Conditions. Altered subbasin processes, modified riparian and aquatichabitat, and limited access to historical spawning and rearing areas in theLuckiamute/Rickreall Subbasin have affected the productivity, capacity, and diversity ofcutthroat tout and juvenile spring Chinook salmon populations. Table 3-117 summarizeschanges in the subbasin’s environmental conditions and how these changes have affectedcutthroat trout and juvenile spring Chinook salmon life stages.
Upper and Lower Subbasins. Relative to the lower subbasin, the upper subbasin, which isprimarily forested, has aquatic habitat that is closer to the historical baseline, with the highestproportion of functioning riparian areas, the largest amounts of large wood in the river andtributary channels, and higher quality aquatic habitats (Ecosystems Northwest, 2001; Bakeret al., 2002). There have been greater impacts to aquatic and riparian habitats in the lowersubbasin than in the upper subbasin. Historically, the lower subbasin was characterized byvery complex and productive fish habitat because the largest proportion of low-gradient,unconstrained river and stream channels were in the area where the Luckiamute River andRickreall Creek flowed across the flat Willamette Valley (Ecosystems Northwest, 2001;Earth Design Consultants, 2004).
Large Wood. Historical removal of large wood from the river and tributary streams, reduceddelivery and transport of wood through channels, and changes in riparian vegetation all haveinteracted to reduce the quantity and distribution of large wood. Mature riparian forests makeup a small proportion of the riparian areas in the lower subbasin (Ecosystems Northwest,2001). Over time, a number of practices (such as splash dams and stream cleaning) removedlarge wood from the Luckiamute River, Rickreall Creek, and tributary channels (EcosystemsNorthwest, 2001; Earth Design Consultants, 2004). While riparian areas in the forested uppersubbasin have greater numbers of conifer trees, historical wood removal from streams andriparian harvest have reduced large wood in the channels. Reduced wood in the river andtributary channels limits the formation of pools, thus reducing hiding and feeding areas foradult fish and restricting the quality and quantity of juvenile rearing habitat.

DRAFT WILLAMETTE SUBBASIN PLAN
CH 3 ASSESSMENT.DOC 3-297
Table 3-117: Luckiamute/Rickreall subbasin: Subbasin Attributes Affecting Cutthroat Trout and Juvenile Spring Chinook Salmon Life Stages
Species Life Stage Water Quality and Quantity Habitat ConnectivityAquatic and Riparian Habitat
Characteristics and Processes Other Impacts
CutthroatTrout
Adult migrationand holding
Naturally low flows in the subbasin are aggravatedby water withdrawals, which increase watertemperatures.
High water temperatures in the subbasin areaggravated by the loss of riparian cover, reducedwetland areas, and channel simplification.
Water diversions in Rickreall Creek have reducedwater flows, contributing to increased watertemperatures.
Channelization of tributaries; modification of runoffpatterns through agriculture, impervious surfaces,and urban/residential development; and loss ofstorage capacity in floodplains and wetlands haveaccelerated runoff and increased peak flows.
Loss of wetlands and floodplain habitats, especiallyin the lower subbasin, have affected water qualityand quantity (storage and timing of peak and lowflows).
The City of Dallas discharges municipal effluentinto Rickreall Creek (RM 10), which contributes asignificant proportion of the summer streamflow.
Numerous culverts throughoutthe subbasin present barriersto adult refuge habitat.
Channels in the lower portions ofthe river and some tributarieshave been simplified throughrevetments and other actions.
Limited wood in the tributariesand river channel has reducedthe frequency and depth of poolsand limited adult hiding cover.Limited large wood in channels isparticularly pronounced in thelower subbasin.
Riparian areas along the riverand tributaries, especially in thelower subbasin, are reduced inwidth, connectivity, and quality.
Reed canary grass andHimalayan blackberry in theaquatic and riparian area limit thegrowth of robust nativevegetation needed for habitatand channel formationprocesses.
The loss of wetland, floodplain,and off-channel habitats hasaffected the quantity and qualityof adult holding areas.

DRAFT WILLAMETTE SUBBASIN PLAN
3-298 CH 3 ASSESSMENT.DOC
Table 3-117: Luckiamute/Rickreall subbasin: Subbasin Attributes Affecting Cutthroat Trout and Juvenile Spring Chinook Salmon Life Stages
Species Life Stage Water Quality and Quantity Habitat ConnectivityAquatic and Riparian Habitat
Characteristics and Processes Other Impacts
Adultspawning/eggincubation
Numerous culverts throughoutthe subbasin present barriersto spawning habitat.
Mercer Dam (RM 24) onRickreall Creek blocks accessto approximately 11 miles ofhabitat, affecting access tospawning habitat.
Limited wood in tributary streamshas reduced retention ofspawning gravels.
Mercer Dam on Rickreall Creek(RM 24) blocks the transport anddelivery of spawning gravels andsubstrate to the lower reaches.
Fry and juvenilerearing andmigration
Naturally low flows in the lower subbasin havebeen aggravated by water withdrawals, which mayincrease water temperatures.
High water temperatures, particularly in the lowersubbasin, do not provide optimal conditions forjuvenile rearing.
The City of Dallas diverts a significant proportion ofRickreall Creek’s summer flow for municipal use,reducing rearing habitat below the point ofdiversion.
Numerous culverts throughoutthe subbasin present barriersto juvenile access to rearingand refuge habitat.
Loss of connectivity tofloodplain and wetland habitatshas affected juvenile rearingand refuge habitat, particularlyin the lower subbasin.
Mercer Dam (RM 24) onRickreall Creek blocks accessto approximately 11 miles ofhabitat, affecting access torearing habitat.
Channels in the lower portions ofthe river and some tributarieshave been simplified throughrevetments and other actions.
Mercer Dam on Rickreall Creek(RM 24) blocks the transport anddelivery of large wood to thelower reaches.
Limited wood in the tributariesand river channel has reducedthe frequency and depth ofpools, thus limiting juvenilerearing and refuge habitat.
Riparian areas along the riverand tributaries are reduced inwidth, connectivity, and quality,particularly in the lower subbasin.
The loss of wetland, floodplainand off-channel habitats hasaffected the quantity and qualityof juvenile rearing and refugeareas.
Introduced fish species(small- and large-mouth bass, forexample) may prey onjuveniles.
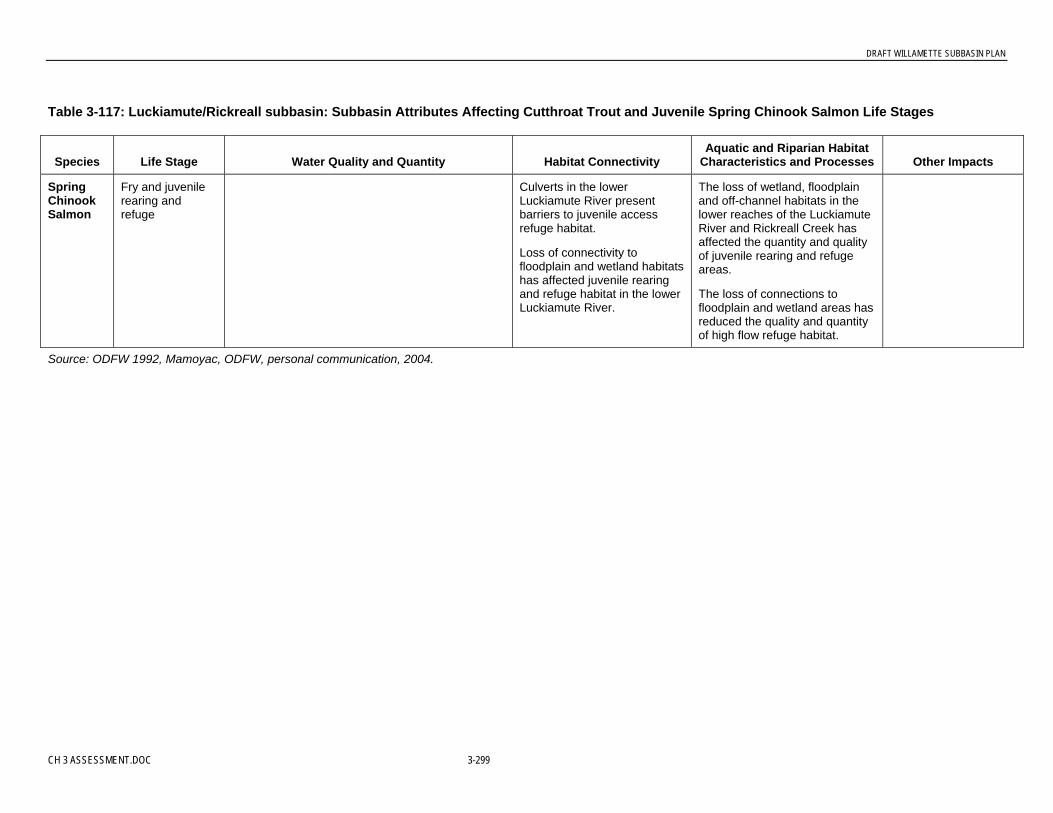
DRAFT WILLAMETTE SUBBASIN PLAN
CH 3 ASSESSMENT.DOC 3-299
Table 3-117: Luckiamute/Rickreall subbasin: Subbasin Attributes Affecting Cutthroat Trout and Juvenile Spring Chinook Salmon Life Stages
Species Life Stage Water Quality and Quantity Habitat ConnectivityAquatic and Riparian Habitat
Characteristics and Processes Other Impacts
SpringChinookSalmon
Fry and juvenilerearing andrefuge
Culverts in the lowerLuckiamute River presentbarriers to juvenile accessrefuge habitat.
Loss of connectivity tofloodplain and wetland habitatshas affected juvenile rearingand refuge habitat in the lowerLuckiamute River.
The loss of wetland, floodplainand off-channel habitats in thelower reaches of the LuckiamuteRiver and Rickreall Creek hasaffected the quantity and qualityof juvenile rearing and refugeareas.
The loss of connections tofloodplain and wetland areas hasreduced the quality and quantityof high flow refuge habitat.
Source: ODFW 1992, Mamoyac, ODFW, personal communication, 2004.
DRAFT WILLAMETTE SUBBASIN PLAN
3-300 CH 3 ASSESSMENT.DOC
Water Quality. Water quality has been modified throughout the subbasin. Watertemperatures exceed criteria in the lower portions of the Luckiamute River and RickreallCreek. May of the tributaries, particularly in the lower subbasin, have elevated watertemperatures (Ecosystems Northwest 2001, Earth Design Consultants 2004). The subbasin’snatural summertime low flows are aggravated by water withdrawals, which increase watertemperatures. There are a number of water withdrawals in the subbasin, particularly in thelower portions as a result of agriculture and urbanization (Ecosystems Northwest, 2001;Earth Design Consultants, 2004). The City of Dallas diverts a significant proportion of theRickreall Creek’s summer flow for municipal use, thus reducing rearing habitat below thepoint of diversion. In general, water temperatures are lower in the forested portions of theupper subbasin. High water temperatures in the lower subbasin are aggravated by the loss ofriparian cover, reduced wetland areas, channel simplification, and increased impervioussurfaces. In addition to temperature issues, Soap Creek, which drains into the lowerLuckiamute River, does not meet water quality criteria for dissolved oxygen (Earth DesignConsultants, 2004), and lower Rickreall Creek appears to be nutrient enriched (EcosystemsNorthwest, 2001).
Flow Modifications. Peak- and low-flow regimes have been modified. While Mercer Dam(Rickreall Creek, RM 24) and other small reservoirs in the subbasin do not exert strongcontrols on peak or low flows, changes in land use have affected hydrologic regimes in thetributaries. Channelization of tributaries; modification of runoff patterns as a result ofagriculture, impervious surfaces, and urban/residential development; and loss of storagecapacity in floodplains and wetlands have accelerated runoff and increased peak flows(Mamoyac, ODFW, personal communication, 2004). There has been extensive loss ofwetlands throughout the subbasin (Ecosystems Northwest, 2001; Earth Design Consultants,2004).
Fish Passage Barriers. Fish passage is restricted throughout the subbasin. Mercer Dam inupper Rickreall Creek blocks fish passage and access to 11 miles of habitat (EcosystemsNorthwest, 2001). In addition there are numerous culverts at road crossings throughout thelower and upper subbasin that block or limit fish passage (Mamoyac, ODFW, personalcommunication, 2004). Limiting the fish passage above culverts restricts the amount ofhabitat available for juvenile spring Chinook rearing and all cutthroat trout life stages.
Appendix G shows specific fish passage barriers on the Luckiamute, based on May 2004 datafrom ODFW; the information was compiled from existing ODFW databases.
Water Temperature and Parasites. The fluvial population of cutthroat trout in the lowerLuckiamute River and Rickreall Creek has been affected by the lower subbasin’s alteredaquatic habitat and water quality (Ecosystems Northwest 2001). In addition, changes in waterquality and the presence of a fish parasite probably restrict the movement of cutthroat troutbetween the subbasin and the Willamette River. In the lower Willamette River below theconfluence with the Luckiamute/Rickreall River, populations of cutthroat tout are limited asa result of high summer water temperatures and the presence of the fish parasite Certomyxashasta (Wevers et al., 1992).
Habitat Connectivity. Backwater habitats, including pool margins, side channels, andalcoves, are reduced from historical levels. Actions to stabilize the lower river through theplacement of riprap along banks (and other actions) and limited large wood in the channel
DRAFT WILLAMETTE SUBBASIN PLAN
CH 3 ASSESSMENT.DOC 3-301
have interacted to reduce the quantity and quality of backwater habitats. Large portions of thelower Luckiamute River and Rickreall Creek and sections of tributary streams have confinedchannels as a result of the placement of riprap and actions that restrict channel movement.Backwater areas in the river and lower tributaries provide key habitats for adult and juvenilecutthroat tout and juvenile spring Chinook salmon. These habitats provide fish with habitatfor foraging and refuge from winter flood events.
Key Factors Limiting Fish Populations. The upper and lower Luckiamute/Rickreallsubbasins are characterized by different patterns of aquatic and riparian habitat, hydrologicregimes, water quality characteristics, and fish species distributions. For this reason, factorslimiting populations for the focal fish species are assessed separately for the upper and lowersubbasin.
Lower Luckiamute/Rickreall Subbasin. In the lower Luckiamute/Rickreall Subbasin,cutthroat trout and juvenile spring Chinook salmon populations are limited by the following:
• Habitat Connectivity. Modification of river and tributary habitat through channel andbank confinement and reduced large wood in the channels has interacted to reducefloodplain connectivity and backwater habitats important for all cutthroat trout life stagesand juvenile Chinook salmon rearing and winter refuge.
• Habitat Modification. Modification of key aquatic habitats has affected all life stages.
• Large Wood. Changes in the delivery and transport of large wood in the river andtributaries has modified gravel deposition patterns, reduced the frequency and depth ofpools, and minimized hiding cover for adult and juvenile cutthroat trout and affectedjuvenile Chinook salmon rearing areas in the lower river.
• Water Temperature. Increased summertime water temperature regimes have affectedadult cutthroat trout populations and limited the capacity of river and tributary streams tosupport juvenile fish.
• Fish Passage Barriers. Fish passage barriers at road crossings on tributary streams blockthe interchange between cutthroat trout populations and limit adult and juvenile accessinto rearing and refuge habitat.
• Additional Factors. Other factors limiting focal species populations include competitionwith introduced fish, runoff of toxics from urban and agricultural areas, and someunscreened water diversions.
Table 3-118 shows the EDT attributes related to these limiting factors for cutthroat trout andjuvenile spring Chinook in the lower Luckiamute/Rickreall Subbasin. The lower subbasin islargely on the Willamette Valley floor (below RM 40 on the Luckiamute and the RM 24 onRickreall Creek) and consists primarily of private land with agricultural, rural residential, andurban land uses. The priorities for restoration are qualitative ratings based on informationpresented in Table 3-117 and professional opinions from individuals familiar with thesubbasin, primarily ODFW biologists.
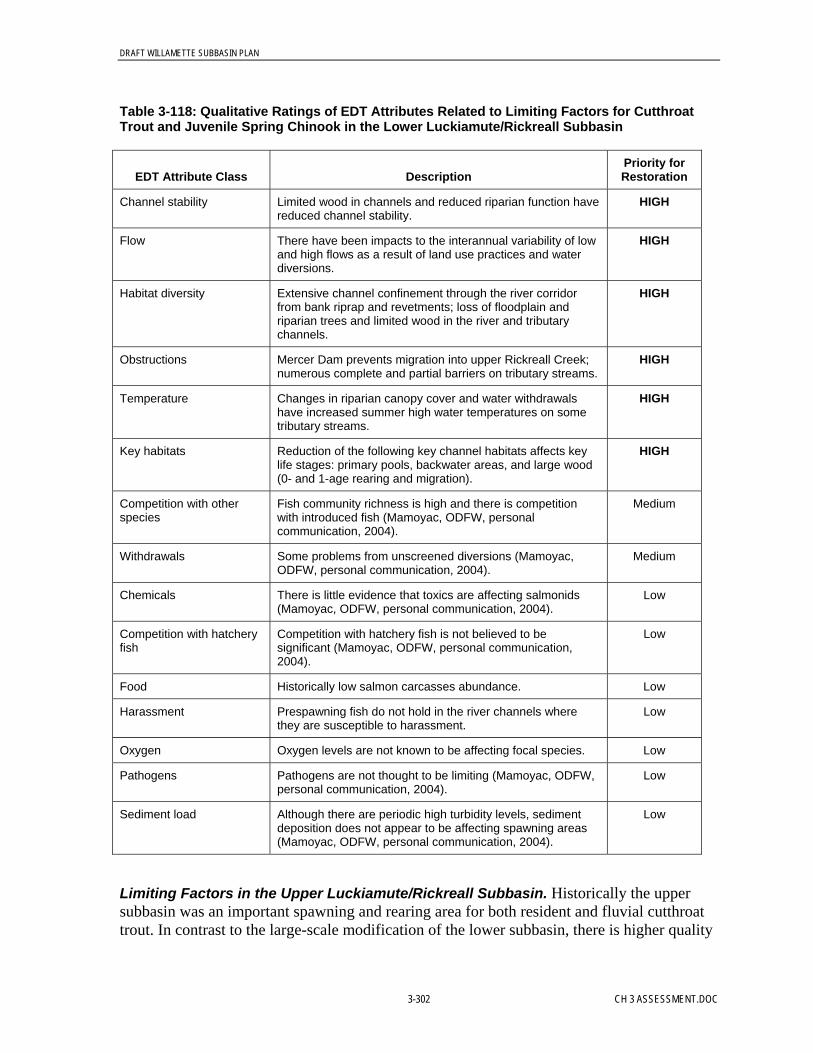
DRAFT WILLAMETTE SUBBASIN PLAN
3-302 CH 3 ASSESSMENT.DOC
Table 3-118: Qualitative Ratings of EDT Attributes Related to Limiting Factors for CutthroatTrout and Juvenile Spring Chinook in the Lower Luckiamute/Rickreall Subbasin
EDT Attribute Class DescriptionPriority forRestoration
Channel stability Limited wood in channels and reduced riparian function havereduced channel stability.
HIGH
Flow There have been impacts to the interannual variability of lowand high flows as a result of land use practices and waterdiversions.
HIGH
Habitat diversity Extensive channel confinement through the river corridorfrom bank riprap and revetments; loss of floodplain andriparian trees and limited wood in the river and tributarychannels.
HIGH
Obstructions Mercer Dam prevents migration into upper Rickreall Creek;numerous complete and partial barriers on tributary streams.
HIGH
Temperature Changes in riparian canopy cover and water withdrawalshave increased summer high water temperatures on sometributary streams.
HIGH
Key habitats Reduction of the following key channel habitats affects keylife stages: primary pools, backwater areas, and large wood(0- and 1-age rearing and migration).
HIGH
Competition with otherspecies
Fish community richness is high and there is competitionwith introduced fish (Mamoyac, ODFW, personalcommunication, 2004).
Medium
Withdrawals Some problems from unscreened diversions (Mamoyac,ODFW, personal communication, 2004).
Medium
Chemicals There is little evidence that toxics are affecting salmonids(Mamoyac, ODFW, personal communication, 2004).
Low
Competition with hatcheryfish
Competition with hatchery fish is not believed to besignificant (Mamoyac, ODFW, personal communication,2004).
Low
Food Historically low salmon carcasses abundance. Low
Harassment Prespawning fish do not hold in the river channels wherethey are susceptible to harassment.
Low
Oxygen Oxygen levels are not known to be affecting focal species. Low
Pathogens Pathogens are not thought to be limiting (Mamoyac, ODFW,personal communication, 2004).
Low
Sediment load Although there are periodic high turbidity levels, sedimentdeposition does not appear to be affecting spawning areas(Mamoyac, ODFW, personal communication, 2004).
Low
Limiting Factors in the Upper Luckiamute/Rickreall Subbasin. Historically the uppersubbasin was an important spawning and rearing area for both resident and fluvial cutthroattrout. In contrast to the large-scale modification of the lower subbasin, there is higher quality

DRAFT WILLAMETTE SUBBASIN PLAN
CH 3 ASSESSMENT.DOC 3-303
habitat in the upper subbasin, particularly in the forested upland areas. Currently, limitingfactors for cutthroat trout in the upper subbasin are as follows:
• Channel and Habitat Modification. Roads next to stream channels have increasedchannel confinement and reduced riparian vegetation and canopy cover.
• Large Wood. There are systematic changes to the levels of large wood in the river andstream channels of the upper subbasin. Past management of riparian areas and streamcleaning practices have lead to reduced large wood loads in the aquatic system. Reducedin-channel wood has modified gravel deposition patterns, reduced the frequency anddepth of pools, and minimized hiding cover for adult and juvenile fish.
• Water Temperature. Changes to riparian canopy have increased summertime watertemperatures.
• Fish Passage Barriers. Numerous partial and complete fish passage barriers on tributarystream have limited cutthroat trout populations.
Table 3-119 outlines the EDT attributes limiting cutthroat trout life stages in theLuckiamute/Rickreall Subbasin, an area that is primarily private land with forestry and ruralresidential land uses. Again, the table presents qualitative ratings based on the information inTable 3-117 and professional opinions from individuals familiar with the subbasin,particularly ODFW biologists.
Table 3-119: Qualitative Ratings of EDT Attributes Related to Limiting Factors for CutthroatTrout in the Upper Luckiamute/Rickreall Subbasin
EDT Attribute Class DescriptionPriority forRestoration
Habitat diversity Some channel confinement through the river corridor as aresult of revetments; loss of floodplain and riparian trees andlimited wood in the river and tributary channels.
HIGH
Temperature Changes in riparian canopy cover have increased summerhigh water temperatures on some tributary streams.
HIGH
Key habitats Reduction of the following key channel habitats affects keylife stages: primary pools, backwater areas, and large wood(0- and 1-age rearing and migration).
HIGH
Channel stability Limited wood in channels and reduced riparian function haveaffected channel stability.
Medium
Obstructions Numerous complete and partial barriers on tributaries. Medium
Withdrawals Limited impacts because most of the unscreened diversionsare in the lower subbasin.
Medium
Chemicals Toxics are probably not an issue because of the limitedurban and agricultural land uses in the upper subbasin.
Low
Competition with hatcheryfish
Competition with hatchery fish is not believed to besignificant (Mamoyac, ODFW, personal communication,2004).
Low

DRAFT WILLAMETTE SUBBASIN PLAN
3-304 CH 3 ASSESSMENT.DOC
Table 3-119: Qualitative Ratings of EDT Attributes Related to Limiting Factors for CutthroatTrout in the Upper Luckiamute/Rickreall Subbasin
EDT Attribute Class DescriptionPriority forRestoration
Competition with otherspecies
There is some competition with introduced fish in the river,but competition in the tributaries is minimal (Mamoyac,ODFW, personal communication, 2004).
Low
Flow There is less area in agricultural and urban land uses thatcontributes to changes in flow regimes.
Low
Food Historically low salmon carcasses abundance. Low
Harassment Prespawning fish do not hold in the river channels. Low
Oxygen Oxygen levels are not known to be affecting focal species. Low
Pathogens Pathogens are not thought to be limiting (Mamoyac, ODFW,personal communication, 2004).
Low
Sediment load Although there are periodic high turbidity levels, sedimentdeposition does not appear to be affecting spawning areas(Mamoyac, ODFW, personal communication, 2004).
Low
3.5.1.5 Limiting Factors in the Marys SubbasinThis section describes the Marys Subbasin in terms of geographic setting and environmentalconditions and presents information on the limiting factors for focal species in the subbasin:cutthroat, spring Chinook, and Oregon chub.
Focal species present:• Cutthroat trout• Spring Chinook salmon (juvenile rearing and refuge; lower subbasin only)• Oregon chub (lower subbasin only)
Geographic Setting. The Marys Subbasin covers an area of 329 square miles on the easternslope of the Coast Range and the floor of the Willamette Valley. The Marys River isapproximately 40 miles long and enters the Willamette River at RM 132. Approximately 90percent of the land in the subbasin is privately owned. Most of the private lands are inforestry, agricultural, and rural residential land uses (Ecosystems Northwest, 1999). Urbanlands cover about 1 percent of the subbasin, primarily within the city of Corvallis(Ecosystems Northwest, 1999). The Salem District of the BLM, the Siuslaw National Forest,and the Oregon Department of Forestry manage a small portion of the subbasin. MuddyCreek, the largest tributary to the lower Marys River, flows through Finley National WildlifeRefuge.
Neither the Marys River nor its tributaries have spawning populations of anadromous fish,but juvenile Chinook salmon have been observed using the lower portions of the river asrearing and winter refuge habitat (Gary Galovich, ODFW, personal communication, 2003).Cutthroat trout exist in all of the subbasin’s streams, and historically there was a populationthat moved between the Marys River and the Willamette River mainstem (Wevers et al.,

DRAFT WILLAMETTE SUBBASIN PLAN
CH 3 ASSESSMENT.DOC 3-305
1992). Populations of Oregon chub exist on Finley National Wildlife Refuge, in the MuddyCreek and in Beaver Creek tributaries (Scheerer, 2004).
The Mary River’s headwaters are on the east side of the Coast Range near Summit andNashville. The river’s headwaters flow through industrial forestlands, small-acreage farms,and rural residential areas until the river reaches the floor of the Willamette Valley nearPhilomath. Major tributaries in the forested upper subbasin include Norton, Woods, andGreasy creeks and the Tum Tum River. Below Philomath, the Marys River flows throughagricultural lands, scattered rural residential areas, and the city of Corvallis, where it joins theWillamette River. Muddy and Oak creeks are major tributaries in the lower subbasin belowPhilomath.
The Coast Range bedrock in the upper subbasin is composed predominantly of sedimentaryrocks with some volcanic formations. Most of the subbasin lies below 1,000 feet in elevation.The upper subbasin drains the Coast Range, but most of the river and the larger tributariesflow through the Willamette Valley’s recent alluvial deposits. The Coast Range sedimentaryrocks have lower groundwater storage capacity than is the case in the Cascade Mountains,and the streams within the Marys Subbasin have lower summertime flows and higher watertemperatures than do Cascade Range streams. The subbasin’s high flow runoff patterns aredominated by a rain-on-snow hydrology in the mid- to upper elevations and rain-dominatedflow patterns in the lower subbasin, which leads to rapid delivery of water to the streamnetwork. As a result of the subbasin’s low elevations and the Coast Range geology,summertime stream flows are not supplemented by snowmelt or numerous spring-fedsources.
The headwaters and tributaries of the upper Marys Subbasin flow steeply off the CoastRange. After the river and tributaries enter the valley, the gradient decreases and the rivermeanders through the alluvial deposits of the Willamette Valley. The gradient of the MarysRiver decreases from 0.26 at RM 40 to 0.15 at RM 20.
Environmental Conditions. Altered subbasin processes, modified riparian and aquatichabitat, and limited access to historical spawning and rearing areas have affected theproductivity, capacity, and diversity of cutthroat tout and juvenile spring Chinook salmonpopulations in the Marys Subbasin.
Table 3-120 summarizes changes in the subbasin’s environmental conditions and how theseimpacts have affected cutthroat trout and juvenile spring Chinook salmon life stages, whileTable 3-121 summarizes how changes in the subbasin’s environmental conditions haveaffected all life stages of Oregon chub.
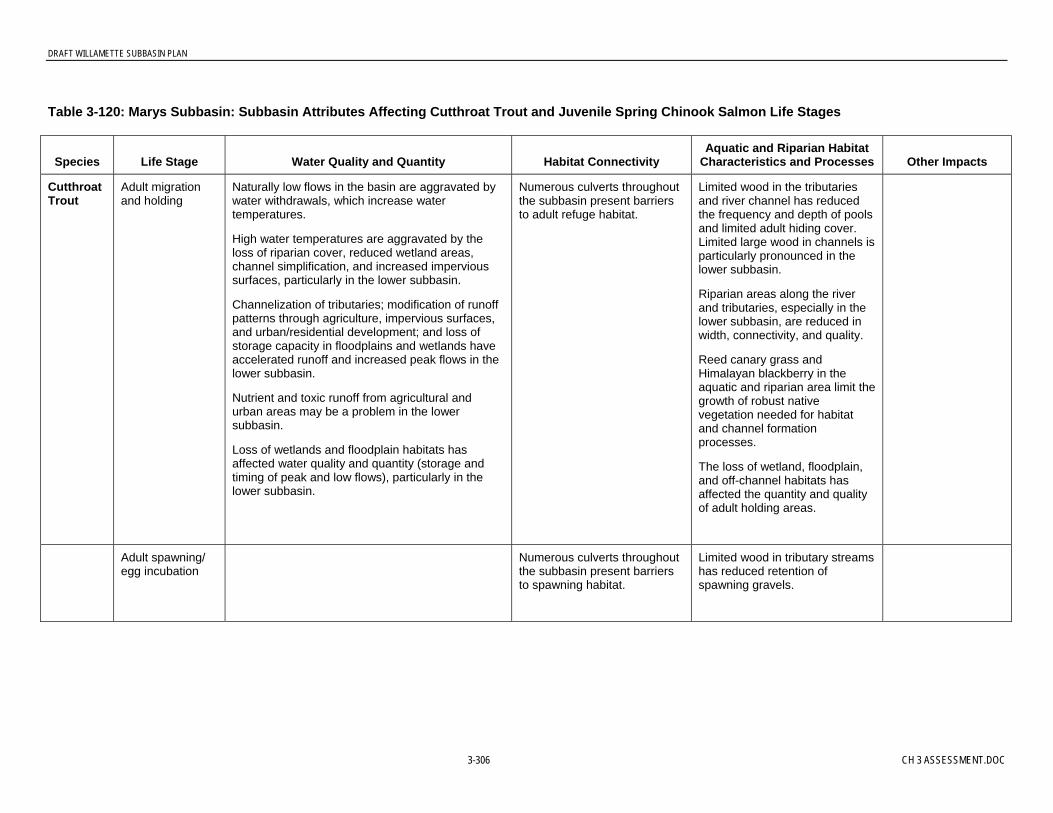
DRAFT WILLAMETTE SUBBASIN PLAN
3-306 CH 3 ASSESSMENT.DOC
Table 3-120: Marys Subbasin: Subbasin Attributes Affecting Cutthroat Trout and Juvenile Spring Chinook Salmon Life Stages
Species Life Stage Water Quality and Quantity Habitat ConnectivityAquatic and Riparian Habitat
Characteristics and Processes Other Impacts
CutthroatTrout
Adult migrationand holding
Naturally low flows in the basin are aggravated bywater withdrawals, which increase watertemperatures.
High water temperatures are aggravated by theloss of riparian cover, reduced wetland areas,channel simplification, and increased impervioussurfaces, particularly in the lower subbasin.
Channelization of tributaries; modification of runoffpatterns through agriculture, impervious surfaces,and urban/residential development; and loss ofstorage capacity in floodplains and wetlands haveaccelerated runoff and increased peak flows in thelower subbasin.
Nutrient and toxic runoff from agricultural andurban areas may be a problem in the lowersubbasin.
Loss of wetlands and floodplain habitats hasaffected water quality and quantity (storage andtiming of peak and low flows), particularly in thelower subbasin.
Numerous culverts throughoutthe subbasin present barriersto adult refuge habitat.
Limited wood in the tributariesand river channel has reducedthe frequency and depth of poolsand limited adult hiding cover.Limited large wood in channels isparticularly pronounced in thelower subbasin.
Riparian areas along the riverand tributaries, especially in thelower subbasin, are reduced inwidth, connectivity, and quality.
Reed canary grass andHimalayan blackberry in theaquatic and riparian area limit thegrowth of robust nativevegetation needed for habitatand channel formationprocesses.
The loss of wetland, floodplain,and off-channel habitats hasaffected the quantity and qualityof adult holding areas.
Adult spawning/egg incubation
Numerous culverts throughoutthe subbasin present barriersto spawning habitat.
Limited wood in tributary streamshas reduced retention ofspawning gravels.
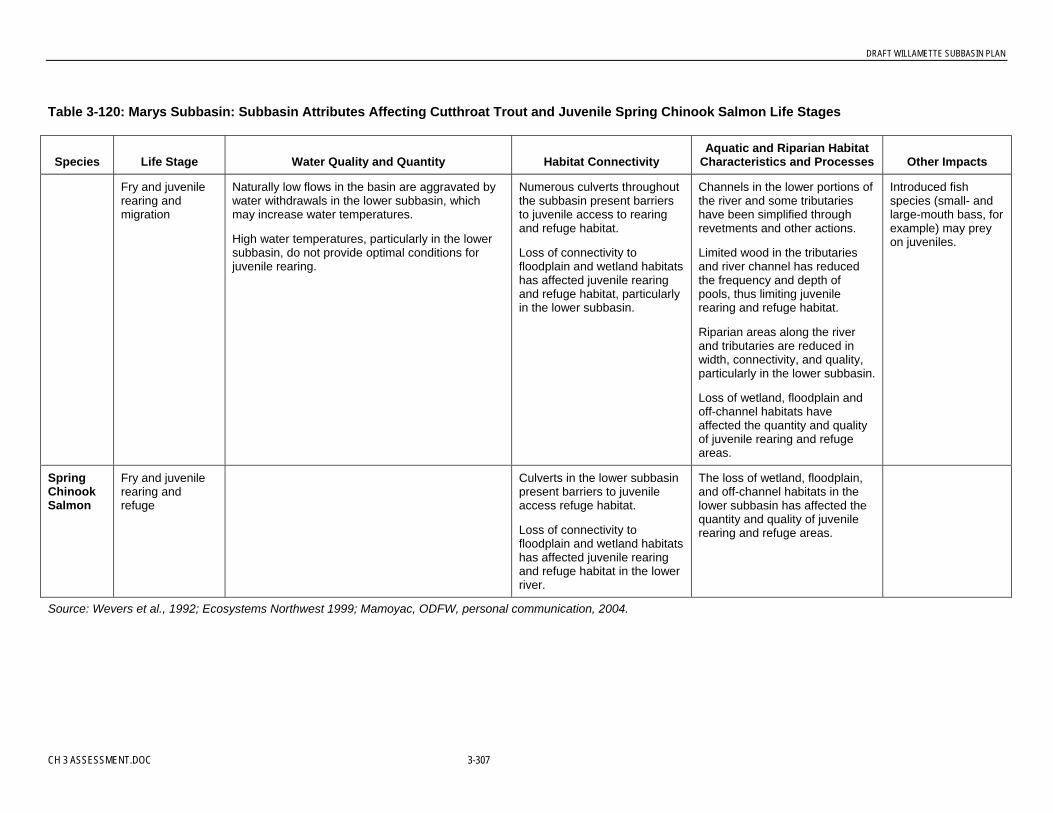
DRAFT WILLAMETTE SUBBASIN PLAN
CH 3 ASSESSMENT.DOC 3-307
Table 3-120: Marys Subbasin: Subbasin Attributes Affecting Cutthroat Trout and Juvenile Spring Chinook Salmon Life Stages
Species Life Stage Water Quality and Quantity Habitat ConnectivityAquatic and Riparian Habitat
Characteristics and Processes Other Impacts
Fry and juvenilerearing andmigration
Naturally low flows in the basin are aggravated bywater withdrawals in the lower subbasin, whichmay increase water temperatures.
High water temperatures, particularly in the lowersubbasin, do not provide optimal conditions forjuvenile rearing.
Numerous culverts throughoutthe subbasin present barriersto juvenile access to rearingand refuge habitat.
Loss of connectivity tofloodplain and wetland habitatshas affected juvenile rearingand refuge habitat, particularlyin the lower subbasin.
Channels in the lower portions ofthe river and some tributarieshave been simplified throughrevetments and other actions.
Limited wood in the tributariesand river channel has reducedthe frequency and depth ofpools, thus limiting juvenilerearing and refuge habitat.
Riparian areas along the riverand tributaries are reduced inwidth, connectivity, and quality,particularly in the lower subbasin.
Loss of wetland, floodplain andoff-channel habitats haveaffected the quantity and qualityof juvenile rearing and refugeareas.
Introduced fishspecies (small- andlarge-mouth bass, forexample) may preyon juveniles.
SpringChinookSalmon
Fry and juvenilerearing andrefuge
Culverts in the lower subbasinpresent barriers to juvenileaccess refuge habitat.
Loss of connectivity tofloodplain and wetland habitatshas affected juvenile rearingand refuge habitat in the lowerriver.
The loss of wetland, floodplain,and off-channel habitats in thelower subbasin has affected thequantity and quality of juvenilerearing and refuge areas.
Source: Wevers et al., 1992; Ecosystems Northwest 1999; Mamoyac, ODFW, personal communication, 2004.

DRAFT WILLAMETTE SUBBASIN PLAN
3-308 CH 3 ASSESSMENT.DOC
Table 3-121: Marys Subbasin: Subbasin Attributes Affecting Oregon Chub Life Stages
Species Life Stage Water Quality and Quantity Habitat ConnectivityAquatic and Riparian Habitat
Characteristics and Processes Other Impacts
Oregonchub
All Nutrient and toxic runoff from agricultural andcommercial forestry areas may be a problem in thelower subbasin. In particular, Oregon chubpopulations at Finley National Wildlife Refuge maybe declining as a result of poor water quality andlow dissolved oxygen in Gray Creek Swamp andDisplay Pond. Likely sources of nutrient enrichmentof these ponds are nearby forestry operations.
Loss of wetlands and floodplain habitats hasaffected water quality and quantity.
Numerous diversions andwater barriers may protectOregon chub from the influx ofexotic fish species; however,the natural dispersal of Oregonchub is also limited by thesestructures.
Loss of connectivity tofloodplain and wetland habitatshas affected the availability ofsuitable habitat.
Riparian areas along the riverand tributaries, especially in thelower subbasin, are reduced inwidth, connectivity, and quality.
Reed canary grass andHimalayan blackberry in theaquatic and riparian area limitthe growth of robust nativevegetation needed for habitat.
Channels in the lower portions ofthe river and some tributarieshave been simplified throughrevetments and other actions.
Presence of exoticfish in this systeminhibits Oregon chubrecolonization offormerly occupiedhabitat.
Source: Scheerer, ODFW, personal communication, 2004.

DRAFT WILLAMETTE SUBBASIN PLAN
CH 3 ASSESSMENT.DOC 3-309
Upper and Lower Subbasins. Relative to the lower subbasin, the forested upland portionsof the upper subbasin has aquatic habitat that is closer to the historical baseline, with thehighest proportion of functioning riparian areas, largest amounts of large wood in the riverand tributary channels, and higher quality aquatic habitats (Baker et al., 2002; EcosystemsNorthwest, 1999). Impacts to aquatic and riparian habitats have been greater in the lowerMarys Subbasin than in the upper subbasin. Historically, the lower subbasin wascharacterized by very complex and productive fish habitat because the largest proportion ofunconstrained river and stream channels were in the area where the Marys River flowedacross the flat Willamette Valley (Pacific Northwest Ecosystem Research Consortium, 2002).
Large Wood. Historical removal of large wood from the river and tributary streams, reduceddelivery and transport of wood through channels, and changes in riparian vegetation all haveinteracted to reduce the quantity and distribution of large wood. Mature riparian forests makeup a small proportion of the riparian areas in the lower subbasin (Ecosystems Northwest,1999; Pacific Northwest Ecosystem Research Consortium, 2002). Over time, a number ofpractices have reduced the quantity of large wood in the Marys River and tributary channels(Ecosystems Northwest, 1999). While riparian areas in the forested upper subbasin havegreater numbers of conifer trees than the lower subbasin does, historical riparian harvests andwood removal from streams have reduced large wood in these channels. Reduced large woodin the river and tributary channels limits the formation of pools, thus reducing hiding areasfor adult fish and restricting the quality and quantity of juvenile rearing habitat.
Water Quality Changes. Water quality has been modified throughout the subbasin. Watertemperatures exceed criteria in the Marys River and many of its tributaries. Naturally lowflows in the subbasin are aggravated by water withdrawals, which increase watertemperatures (Ecosystems Northwest, 1999). In general, water temperatures are lower in theforested upper subbasin than in the lower subbasin. High water temperatures in the lowersubbasin are aggravated by the loss of riparian cover, reduced wetland areas, channelsimplification, and increased impervious surfaces (Ecosystems Northwest, 1999). Toxicrunoff from urban and agricultural land uses may affect fish populations (Mamoyac, ODFW,personal communication, 2004).
Changes in Flow Regimes. There have been moderate impacts to the subbasin’s hydrologicregimes. Rock Creek Reservoir, which supplies water to the city of Corvallis, does notcontrol the river’s peak or low flows. Changes in land use have affected hydrologic regimesin the tributaries. Channelization of tributaries; modification of runoff patterns as a result ofagriculture, impervious surfaces, and urban/residential development; and loss of storagecapacity in floodplains and wetlands have accelerated runoff and increased peak flows(Mamoyac, ODFW, personal communication, 2004).
Fish Passage Barriers. There are no dams restricting fish passage on the mainstem of theMarys River. However, numerous road crossing culverts throughout the lower and uppersubbasin that block or limit fish passage. Limiting the fish passage above culverts restrictsthe amount of habitat available for juvenile spring Chinook rearing and all cutthroat trout lifestages. For example, there is restricted passage of fish into Oak Creek in the lower subbasin,which affects cutthroat trout and historical rearing and refuge habitat for juvenile springChinook salmon (Ecosystems Northwest, 1999).

DRAFT WILLAMETTE SUBBASIN PLAN
3-310 CH 3 ASSESSMENT.DOC
Appendix G shows specific fish passage barriers on the Marys River, based on May 2004data from ODFW; the information was compiled from existing ODFW databases.
Habitat Modification. Backwater habitats, including pool margins, side channels, andalcoves, have been reduced from historical levels. Actions to stabilize the lower river throughthe placement of riprap along banks (and other actions) and limited large wood in the channelhave interacted to reduce the quantity and quality of backwater habitats. Large portions of thelower Marys River (below Philomath) and sections of tributary streams have confinedchannels as a result of the placement of riprap and streamside roads (Ecosystems Northwest,1999). Backwater areas in the river and lower tributaries provide key habitats for adult andjuvenile cutthroat trout, juvenile spring Chinook salmon, and Oregon chub. These habitatsprovide fish with habitat for foraging and refuge from winter flood events.
Key Factors Limiting Fish Populations. The upper and lower portions of Marys Subbasinare characterized by different patterns of aquatic and riparian habitat, hydrologic regimes,water quality characteristics, and fish species distributions. For this reason, factors limitingpopulations for the focal fish species are assessed separately for the upper and lower portionsof the subbasin.
Limiting Factors in the Lower Marys Subbasin. In the lower Marys Subbasin, theproductivity, capacity, and diversity of cutthroat trout and juvenile spring Chinook salmonpopulations are limited by the following factors:
• Habitat Connectivity. Modification of river and tributary habitat through channel andbank confinement and reduced large wood in the channels has interacted to reducefloodplain connectivity and backwater habitats important for all cutthroat trout life stagesand juvenile Chinook salmon rearing and winter refuge.
• Habitat Modification. Modification of key aquatic habitats has affected all life stages.
• Large Wood. Changes in the delivery and transport of large wood in the river andtributaries has modified gravel deposition patterns, reduced the frequency and depth ofpools, and minimized hiding cover for adult and juvenile cutthroat trout and affectedjuvenile Chinook salmon rearing areas in the lower river.
• Water Temperature. Increased summertime water temperature regimes have affectedadult cutthroat trout populations, and limited the capacity of river and tributary streams tosupport juvenile fish.
• Fish Passage Barriers. Fish passage barriers at road crossings on tributary streams blockthe interchange between cutthroat trout populations, and limit adult and juvenile accessinto rearing and refuge habitat.
• Additional Factors. Other factors limiting cutthroat and juvenile Chinook populationsinclude competition with introduced fish, runoff of toxics from urban and agriculturalareas, and some unscreened water diversions.
Key limiting factors for Oregon chub in the lower Marys Subbasin are as follows:
• Habitat Diversity. Changes in hydrologic flow regimes have reduced the amount of off-channel habitat in side channels, sloughs, and other slow-moving water.
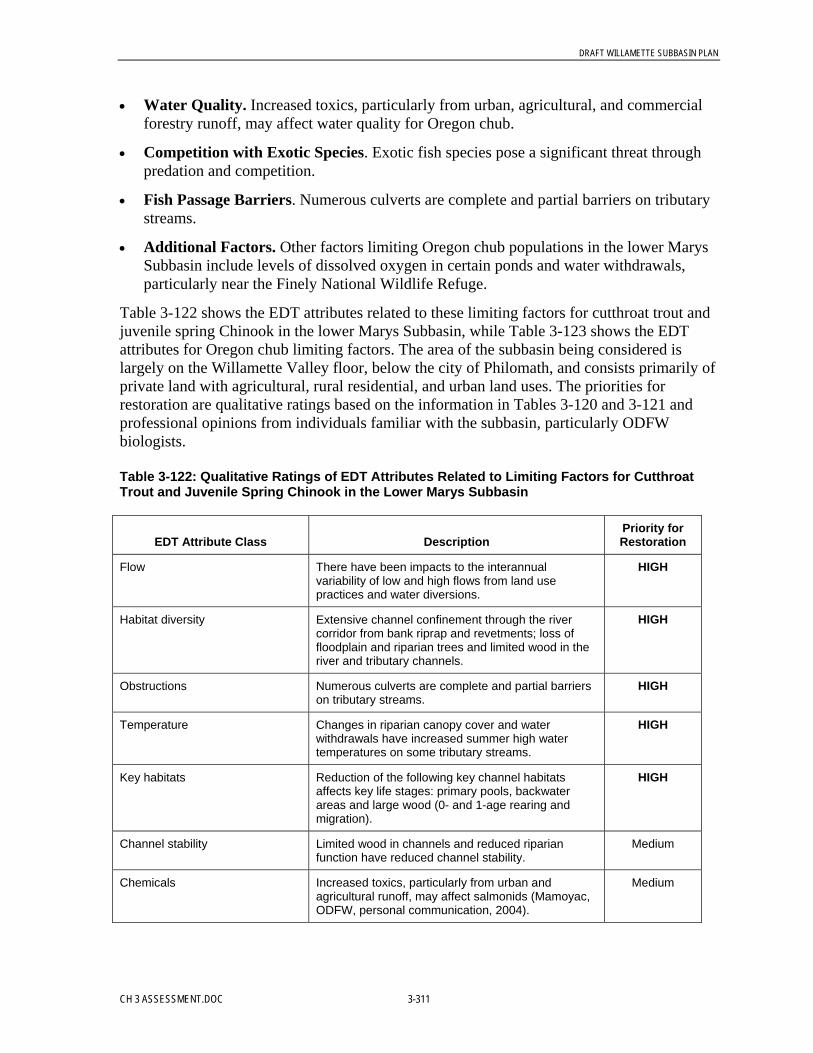
DRAFT WILLAMETTE SUBBASIN PLAN
CH 3 ASSESSMENT.DOC 3-311
• Water Quality. Increased toxics, particularly from urban, agricultural, and commercialforestry runoff, may affect water quality for Oregon chub.
• Competition with Exotic Species. Exotic fish species pose a significant threat throughpredation and competition.
• Fish Passage Barriers. Numerous culverts are complete and partial barriers on tributarystreams.
• Additional Factors. Other factors limiting Oregon chub populations in the lower MarysSubbasin include levels of dissolved oxygen in certain ponds and water withdrawals,particularly near the Finely National Wildlife Refuge.
Table 3-122 shows the EDT attributes related to these limiting factors for cutthroat trout andjuvenile spring Chinook in the lower Marys Subbasin, while Table 3-123 shows the EDTattributes for Oregon chub limiting factors. The area of the subbasin being considered islargely on the Willamette Valley floor, below the city of Philomath, and consists primarily ofprivate land with agricultural, rural residential, and urban land uses. The priorities forrestoration are qualitative ratings based on the information in Tables 3-120 and 3-121 andprofessional opinions from individuals familiar with the subbasin, particularly ODFWbiologists.
Table 3-122: Qualitative Ratings of EDT Attributes Related to Limiting Factors for CutthroatTrout and Juvenile Spring Chinook in the Lower Marys Subbasin
EDT Attribute Class DescriptionPriority forRestoration
Flow There have been impacts to the interannualvariability of low and high flows from land usepractices and water diversions.
HIGH
Habitat diversity Extensive channel confinement through the rivercorridor from bank riprap and revetments; loss offloodplain and riparian trees and limited wood in theriver and tributary channels.
HIGH
Obstructions Numerous culverts are complete and partial barrierson tributary streams.
HIGH
Temperature Changes in riparian canopy cover and waterwithdrawals have increased summer high watertemperatures on some tributary streams.
HIGH
Key habitats Reduction of the following key channel habitatsaffects key life stages: primary pools, backwaterareas and large wood (0- and 1-age rearing andmigration).
HIGH
Channel stability Limited wood in channels and reduced riparianfunction have reduced channel stability.
Medium
Chemicals Increased toxics, particularly from urban andagricultural runoff, may affect salmonids (Mamoyac,ODFW, personal communication, 2004).
Medium

DRAFT WILLAMETTE SUBBASIN PLAN
3-312 CH 3 ASSESSMENT.DOC
Table 3-122: Qualitative Ratings of EDT Attributes Related to Limiting Factors for CutthroatTrout and Juvenile Spring Chinook in the Lower Marys Subbasin
EDT Attribute Class DescriptionPriority forRestoration
Competition with other species Fish community richness is high and there iscompetition with introduced fish (Mamoyac, ODFW,personal communication, 2004).
Medium
Withdrawals Some problems from unscreened diversions(Mamoyac, ODFW, personal communication, 2004).
Medium
Competition with hatchery fish Competition with hatchery fish is not believed to besignificant (Mamoyac, ODFW, personalcommunication, 2004).
Low
Food Historically low salmon carcasses abundance. Low
Harassment Prespawning fish do not hold in the river channelswhere they are susceptible to harassment.
Low
Oxygen Oxygen levels are not known to be affecting focalspecies.
Low
Pathogens Pathogens are not thought to be limiting (Mamoyac,ODFW, personal communication, 2004).
Low
Sediment load Although there are periodic high turbidity levels,sediment deposition does not appear to be affectingspawning areas (Mamoyac, ODFW, personalcommunication, 2004).
Low
Table 3-123: Qualitative Ratings of EDT Attributes Related to Limiting Factors for OregonChub in the Lower Marys Subbasin
EDT Attribute Class DescriptionPriority forRestoration
Chemicals Increased toxics, particularly from urban, agricultural, andcommercial forestry runoff, may affect water quality forOregon chub (Scheerer, ODFW, personal communication,2004).
HIGH
Competition with otherspecies
Exotic fish species pose a significant threat throughpredation and competition (Scheerer, ODFW, personalcommunication, 2004).
HIGH
Habitat diversity Changes in hydrologic flow regimes have reduced theamount of off-channel habitat in side channels, sloughs, andother slow-moving water (Scheerer, ODFW, personalcommunication, 2004).
HIGH
Key habitats Reduction of the following key channel habitats affects all lifestages: backwater sloughs, channels, and other low- velocitywaterways (Scheerer, ODFW, personal communication,2004).
HIGH
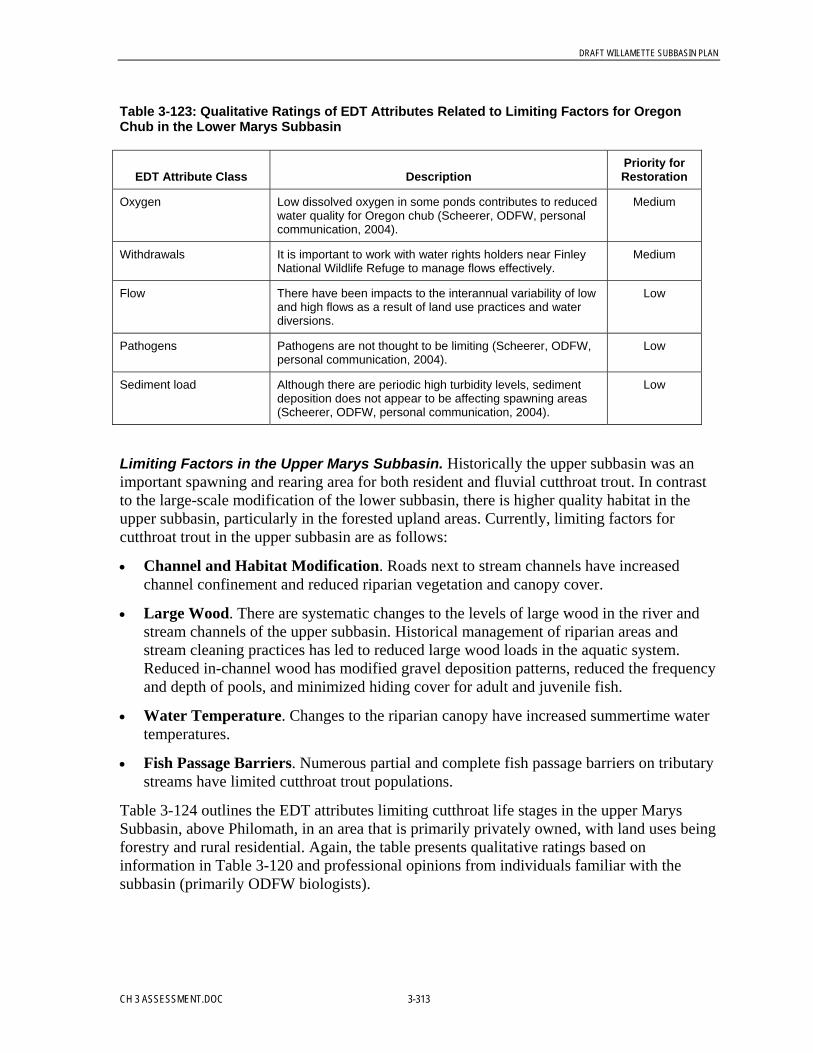
DRAFT WILLAMETTE SUBBASIN PLAN
CH 3 ASSESSMENT.DOC 3-313
Table 3-123: Qualitative Ratings of EDT Attributes Related to Limiting Factors for OregonChub in the Lower Marys Subbasin
EDT Attribute Class DescriptionPriority forRestoration
Oxygen Low dissolved oxygen in some ponds contributes to reducedwater quality for Oregon chub (Scheerer, ODFW, personalcommunication, 2004).
Medium
Withdrawals It is important to work with water rights holders near FinleyNational Wildlife Refuge to manage flows effectively.
Medium
Flow There have been impacts to the interannual variability of lowand high flows as a result of land use practices and waterdiversions.
Low
Pathogens Pathogens are not thought to be limiting (Scheerer, ODFW,personal communication, 2004).
Low
Sediment load Although there are periodic high turbidity levels, sedimentdeposition does not appear to be affecting spawning areas(Scheerer, ODFW, personal communication, 2004).
Low
Limiting Factors in the Upper Marys Subbasin. Historically the upper subbasin was animportant spawning and rearing area for both resident and fluvial cutthroat trout. In contrastto the large-scale modification of the lower subbasin, there is higher quality habitat in theupper subbasin, particularly in the forested upland areas. Currently, limiting factors forcutthroat trout in the upper subbasin are as follows:
• Channel and Habitat Modification. Roads next to stream channels have increasedchannel confinement and reduced riparian vegetation and canopy cover.
• Large Wood. There are systematic changes to the levels of large wood in the river andstream channels of the upper subbasin. Historical management of riparian areas andstream cleaning practices has led to reduced large wood loads in the aquatic system.Reduced in-channel wood has modified gravel deposition patterns, reduced the frequencyand depth of pools, and minimized hiding cover for adult and juvenile fish.
• Water Temperature. Changes to the riparian canopy have increased summertime watertemperatures.
• Fish Passage Barriers. Numerous partial and complete fish passage barriers on tributarystreams have limited cutthroat trout populations.
Table 3-124 outlines the EDT attributes limiting cutthroat life stages in the upper MarysSubbasin, above Philomath, in an area that is primarily privately owned, with land uses beingforestry and rural residential. Again, the table presents qualitative ratings based oninformation in Table 3-120 and professional opinions from individuals familiar with thesubbasin (primarily ODFW biologists).
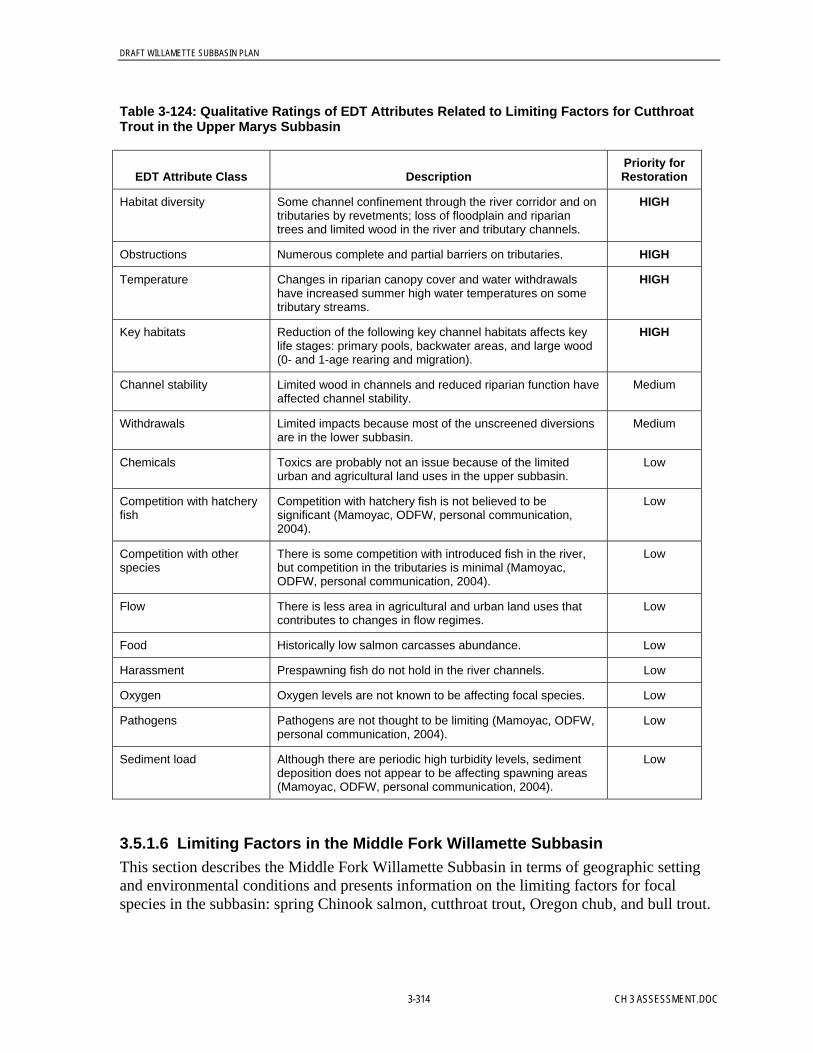
DRAFT WILLAMETTE SUBBASIN PLAN
3-314 CH 3 ASSESSMENT.DOC
Table 3-124: Qualitative Ratings of EDT Attributes Related to Limiting Factors for CutthroatTrout in the Upper Marys Subbasin
EDT Attribute Class DescriptionPriority forRestoration
Habitat diversity Some channel confinement through the river corridor and ontributaries by revetments; loss of floodplain and ripariantrees and limited wood in the river and tributary channels.
HIGH
Obstructions Numerous complete and partial barriers on tributaries. HIGH
Temperature Changes in riparian canopy cover and water withdrawalshave increased summer high water temperatures on sometributary streams.
HIGH
Key habitats Reduction of the following key channel habitats affects keylife stages: primary pools, backwater areas, and large wood(0- and 1-age rearing and migration).
HIGH
Channel stability Limited wood in channels and reduced riparian function haveaffected channel stability.
Medium
Withdrawals Limited impacts because most of the unscreened diversionsare in the lower subbasin.
Medium
Chemicals Toxics are probably not an issue because of the limitedurban and agricultural land uses in the upper subbasin.
Low
Competition with hatcheryfish
Competition with hatchery fish is not believed to besignificant (Mamoyac, ODFW, personal communication,2004).
Low
Competition with otherspecies
There is some competition with introduced fish in the river,but competition in the tributaries is minimal (Mamoyac,ODFW, personal communication, 2004).
Low
Flow There is less area in agricultural and urban land uses thatcontributes to changes in flow regimes.
Low
Food Historically low salmon carcasses abundance. Low
Harassment Prespawning fish do not hold in the river channels. Low
Oxygen Oxygen levels are not known to be affecting focal species. Low
Pathogens Pathogens are not thought to be limiting (Mamoyac, ODFW,personal communication, 2004).
Low
Sediment load Although there are periodic high turbidity levels, sedimentdeposition does not appear to be affecting spawning areas(Mamoyac, ODFW, personal communication, 2004).
Low
3.5.1.6 Limiting Factors in the Middle Fork Willamette SubbasinThis section describes the Middle Fork Willamette Subbasin in terms of geographic settingand environmental conditions and presents information on the limiting factors for focalspecies in the subbasin: spring Chinook salmon, cutthroat trout, Oregon chub, and bull trout.

DRAFT WILLAMETTE SUBBASIN PLAN
CH 3 ASSESSMENT.DOC 3-315
Focal species present:• Cutthroat trout• Spring Chinook salmon• Bull trout (upper subbasin only)• Oregon chub (lower subbasin only)
Geographic Setting. The Middle Fork Willamette Subbasin covers an area of approximately1,360 square miles on the western slope of the Cascade Mountains and the floor of theWillamette Valley. The river is 84 miles long and joins the Coast Fork Willamette River nearEugene to form the mainstem Willamette River. Approximately 75 percent of the land in thesubbasin is publicly owned and managed by federal agencies, including the U.S. ForestService’s Willamette National Forest, which manages most of the upper subbasin. TheEugene District of the BLM manages a smaller proportion of the lower subbasin belowDexter Dam. The headwaters of the Middle Fork Willamette River originate in the DiamondPeak and Waldo Lake Wilderness areas on the Willamette National Forest. The city ofOakridge is in the upper subbasin, and the lower subbasin includes portions of the cities ofSpringfield and Eugene.
The geology of the western Cascades characterizes the mountainous areas of the subbasin.This area has deeply weathered rocks, steep and highly dissected hill slopes, and significanterosion. Stream runoff patterns in the subbasin are dominated by the western Cascadegeology, with a rain-on-snow hydrology in the mid- to upper elevations and rain-dominatedflow patterns in the lower subbasin, which leads to rapid delivery of water to the streamnetwork. The High Cascades geology in the upper subbasin, which is characterized by deeplava deposits, contributes spring-feed flows to the system, particularly in some tributariesabove Hills Creek Reservoir. These spring-fed sources are not of sufficient volume tosignificantly influence flow patterns or water temperature regimes in the mainstem riverreaches below the dams. The headwater elevations are high enough to form a seasonalsnowpack, which influences summer stream flows and water temperatures.
The Dexter and Lookout Point Dam complex (approximately 8 miles above the confluencewith the Coast Fork) divides the subbasin, limiting upstream fish passage and greatlyinfluencing downstream hydrologic regimes, temperature patterns, sediment and bedloadtransport, and large wood delivery to the lower reaches. The North Fork Middle ForkWillamette River and Salt and Salmon creeks are major tributaries in the upper subbasin thathistorically supported anadromous fish populations. The upper Middle Fork WillametteRiver flows through a narrow, steep forested canyon. Hills Creek Dam on the upper MiddleFork Willamette River (approximately 36 miles above the confluence with the Coast Fork)further divides the upper subbasin. The river’s gradient decreases from 2.6 percent upstreamof Hills Creek Reservoir to approximately 0.5 percent between Hills Creek Dam and LookoutPont Reservoir.
Downstream of Dexter Dam, the Middle Fork Willamette River flows into the wide, alluvialWillamette Valley. Fall, Little Fall, and Lost creeks are major tributaries in the lowersubbasin. Fall Creek Dam (RM 7) limits fish access to upper Fall Creek and controlsdownstream flows and other processes. The lower portion of the river below the Dexter Damis low gradient (less than 0.2 percent) and flows through a relatively wide valley with anextensive floodplain. More than 60 percent of land in the lower subbasin is privately owned,

DRAFT WILLAMETTE SUBBASIN PLAN
3-316 CH 3 ASSESSMENT.DOC
primarily as industrial forestlands. The remainder of the lower river valley consists ofagricultural land and urban areas.
Environmental Conditions. Altered subbasin processes, modified riparian and aquatichabitat, and limited access to historical spawning and rearing areas in the Middle ForkWillamette Subbasin have affected the productivity, capacity, and diversity of cutthroat trout,bull trout, and spring Chinook populations. In addition, Oregon chub have lost habitat asbackwater and off-channel areas have disappeared as a result of changes in seasonal flowsassociated with the construction of dams throughout the basin, channelization of theWillamette River and its tributaries, removal of snags for river navigation, and agriculturalpractices. Table 3-125 summarizes changes in the subbasin’s environmental conditions andhow these changes have affected cutthroat trout, spring Chinook salmon, bull trout, andOregon chub life stages.
Dams. The U.S. Army Corps of Engineers dams have restricted access to the upper subbasinand changed downstream hydrologic processes, water quality, and processes that influencehabitat formation. The construction of Dexter and Lookout Point dams limited access to anestimated 80 percent of the historical production area for spring Chinook salmon andeliminated the interchange between the upper and lower subbasin cutthroat trout populations(U.S. Army Corps of Engineers, 2001). Relative to the lower subbasin, the upper subbasinabove the dams has aquatic habitat that is closer to the historical baseline, with the highestproportion of functioning riparian areas, the largest amounts of large wood in the river andtributary channels, and the highest quality spawning areas. The dams have altered the linksbetween the upper and lower subbasin, thus reducing the transport and delivery of largewood and substrate to downstream reaches. Because the dams capture material, delivery oflarge wood to the lower Middle Fork Willamette River is blocked from 90 percent of thesubbasin (U.S. Army Corps of Engineers, 2001). Changes in the abundance and distributionof gravels, small cobbles, and large wood (particularly in large jams) have reduced suitablespawning areas and limited areas for adult cutthroat trout and juvenile rearing habitat forspring Chinook salmon. The dams have also changed flow regimes and water temperaturepatterns. Compared to historical conditions, water temperatures in the river below the damare cooler in the summer and warmer in the fall and winter, which affects the upstreamdistribution of spring Chinook salmon adults, alters the timing of spawning, and affects thesurvival of eggs.
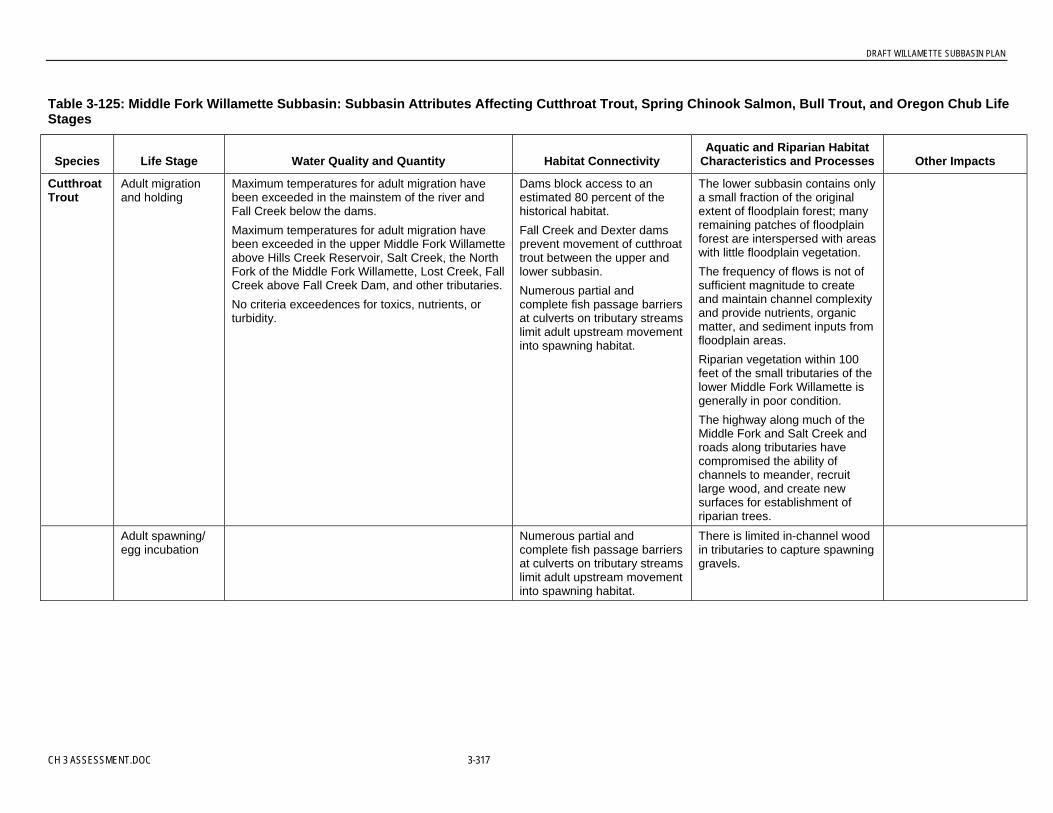
DRAFT WILLAMETTE SUBBASIN PLAN
CH 3 ASSESSMENT.DOC 3-317
Table 3-125: Middle Fork Willamette Subbasin: Subbasin Attributes Affecting Cutthroat Trout, Spring Chinook Salmon, Bull Trout, and Oregon Chub LifeStages
Species Life Stage Water Quality and Quantity Habitat ConnectivityAquatic and Riparian Habitat
Characteristics and Processes Other Impacts
CutthroatTrout
Adult migrationand holding
Maximum temperatures for adult migration havebeen exceeded in the mainstem of the river andFall Creek below the dams.Maximum temperatures for adult migration havebeen exceeded in the upper Middle Fork Willametteabove Hills Creek Reservoir, Salt Creek, the NorthFork of the Middle Fork Willamette, Lost Creek, FallCreek above Fall Creek Dam, and other tributaries.No criteria exceedences for toxics, nutrients, orturbidity.
Dams block access to anestimated 80 percent of thehistorical habitat.Fall Creek and Dexter damsprevent movement of cutthroattrout between the upper andlower subbasin.Numerous partial andcomplete fish passage barriersat culverts on tributary streamslimit adult upstream movementinto spawning habitat.
The lower subbasin contains onlya small fraction of the originalextent of floodplain forest; manyremaining patches of floodplainforest are interspersed with areaswith little floodplain vegetation.The frequency of flows is not ofsufficient magnitude to createand maintain channel complexityand provide nutrients, organicmatter, and sediment inputs fromfloodplain areas.Riparian vegetation within 100feet of the small tributaries of thelower Middle Fork Willamette isgenerally in poor condition.The highway along much of theMiddle Fork and Salt Creek androads along tributaries havecompromised the ability ofchannels to meander, recruitlarge wood, and create newsurfaces for establishment ofriparian trees.
Adult spawning/egg incubation
Numerous partial andcomplete fish passage barriersat culverts on tributary streamslimit adult upstream movementinto spawning habitat.
There is limited in-channel woodin tributaries to capture spawninggravels.
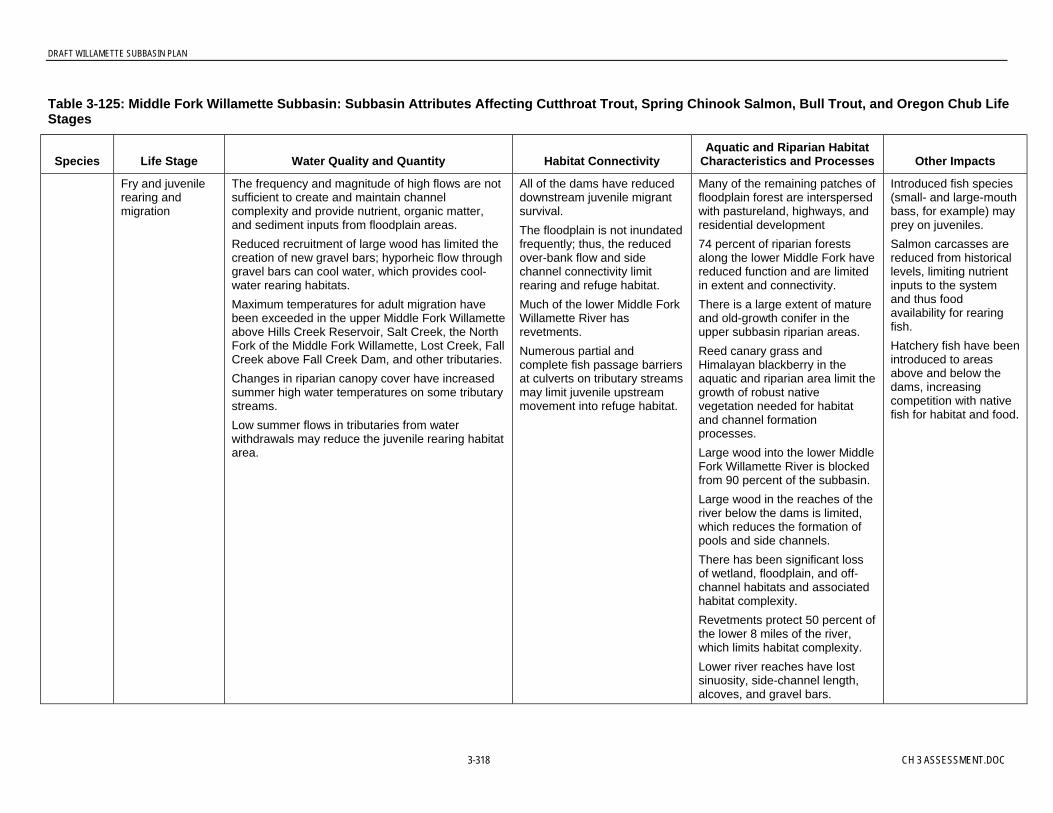
DRAFT WILLAMETTE SUBBASIN PLAN
3-318 CH 3 ASSESSMENT.DOC
Table 3-125: Middle Fork Willamette Subbasin: Subbasin Attributes Affecting Cutthroat Trout, Spring Chinook Salmon, Bull Trout, and Oregon Chub LifeStages
Species Life Stage Water Quality and Quantity Habitat ConnectivityAquatic and Riparian Habitat
Characteristics and Processes Other Impacts
Fry and juvenilerearing andmigration
The frequency and magnitude of high flows are notsufficient to create and maintain channelcomplexity and provide nutrient, organic matter,and sediment inputs from floodplain areas.Reduced recruitment of large wood has limited thecreation of new gravel bars; hyporheic flow throughgravel bars can cool water, which provides cool-water rearing habitats.Maximum temperatures for adult migration havebeen exceeded in the upper Middle Fork Willametteabove Hills Creek Reservoir, Salt Creek, the NorthFork of the Middle Fork Willamette, Lost Creek, FallCreek above Fall Creek Dam, and other tributaries.Changes in riparian canopy cover have increasedsummer high water temperatures on some tributarystreams.Low summer flows in tributaries from waterwithdrawals may reduce the juvenile rearing habitatarea.
All of the dams have reduceddownstream juvenile migrantsurvival.The floodplain is not inundatedfrequently; thus, the reducedover-bank flow and sidechannel connectivity limitrearing and refuge habitat.Much of the lower Middle ForkWillamette River hasrevetments.Numerous partial andcomplete fish passage barriersat culverts on tributary streamsmay limit juvenile upstreammovement into refuge habitat.
Many of the remaining patches offloodplain forest are interspersedwith pastureland, highways, andresidential development74 percent of riparian forestsalong the lower Middle Fork havereduced function and are limitedin extent and connectivity.There is a large extent of matureand old-growth conifer in theupper subbasin riparian areas.Reed canary grass andHimalayan blackberry in theaquatic and riparian area limit thegrowth of robust nativevegetation needed for habitatand channel formationprocesses.Large wood into the lower MiddleFork Willamette River is blockedfrom 90 percent of the subbasin.Large wood in the reaches of theriver below the dams is limited,which reduces the formation ofpools and side channels.There has been significant lossof wetland, floodplain, and off-channel habitats and associatedhabitat complexity.Revetments protect 50 percent ofthe lower 8 miles of the river,which limits habitat complexity.Lower river reaches have lostsinuosity, side-channel length,alcoves, and gravel bars.
Introduced fish species(small- and large-mouthbass, for example) mayprey on juveniles.Salmon carcasses arereduced from historicallevels, limiting nutrientinputs to the systemand thus foodavailability for rearingfish.Hatchery fish have beenintroduced to areasabove and below thedams, increasingcompetition with nativefish for habitat and food.
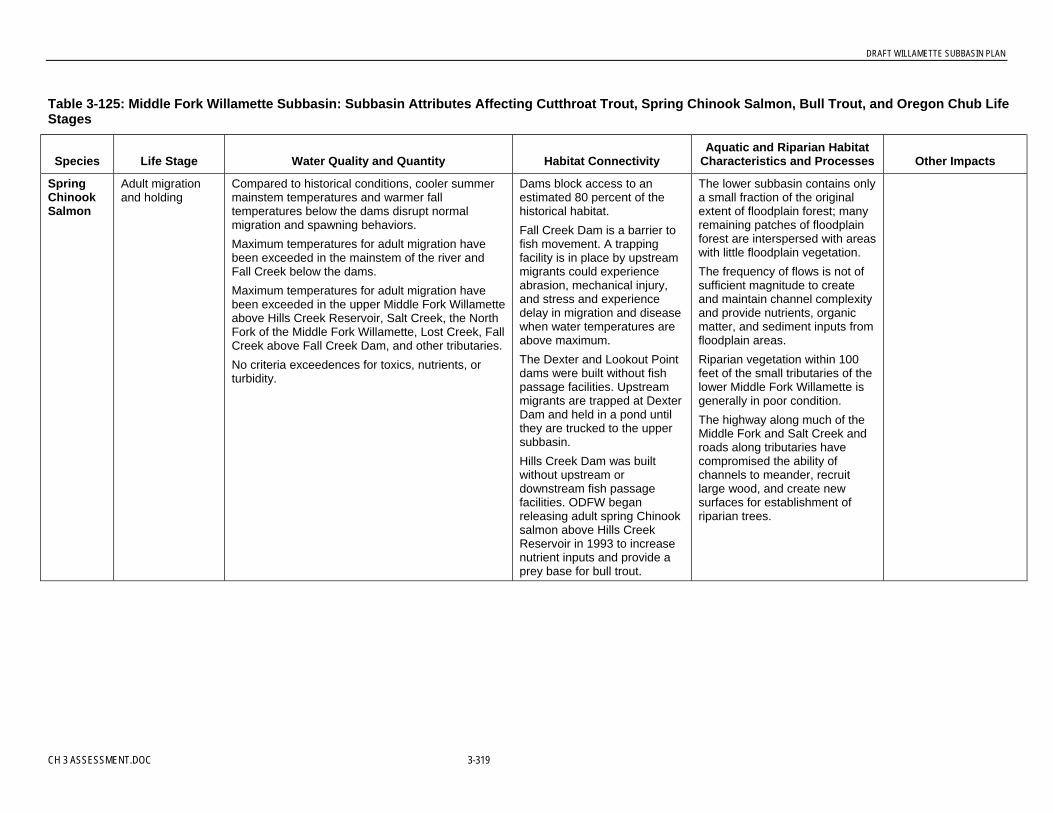
DRAFT WILLAMETTE SUBBASIN PLAN
CH 3 ASSESSMENT.DOC 3-319
Table 3-125: Middle Fork Willamette Subbasin: Subbasin Attributes Affecting Cutthroat Trout, Spring Chinook Salmon, Bull Trout, and Oregon Chub LifeStages
Species Life Stage Water Quality and Quantity Habitat ConnectivityAquatic and Riparian Habitat
Characteristics and Processes Other Impacts
SpringChinookSalmon
Adult migrationand holding
Compared to historical conditions, cooler summermainstem temperatures and warmer falltemperatures below the dams disrupt normalmigration and spawning behaviors.Maximum temperatures for adult migration havebeen exceeded in the mainstem of the river andFall Creek below the dams.Maximum temperatures for adult migration havebeen exceeded in the upper Middle Fork Willametteabove Hills Creek Reservoir, Salt Creek, the NorthFork of the Middle Fork Willamette, Lost Creek, FallCreek above Fall Creek Dam, and other tributaries.No criteria exceedences for toxics, nutrients, orturbidity.
Dams block access to anestimated 80 percent of thehistorical habitat.Fall Creek Dam is a barrier tofish movement. A trappingfacility is in place by upstreammigrants could experienceabrasion, mechanical injury,and stress and experiencedelay in migration and diseasewhen water temperatures areabove maximum.The Dexter and Lookout Pointdams were built without fishpassage facilities. Upstreammigrants are trapped at DexterDam and held in a pond untilthey are trucked to the uppersubbasin.Hills Creek Dam was builtwithout upstream ordownstream fish passagefacilities. ODFW beganreleasing adult spring Chinooksalmon above Hills CreekReservoir in 1993 to increasenutrient inputs and provide aprey base for bull trout.
The lower subbasin contains onlya small fraction of the originalextent of floodplain forest; manyremaining patches of floodplainforest are interspersed with areaswith little floodplain vegetation.The frequency of flows is not ofsufficient magnitude to createand maintain channel complexityand provide nutrients, organicmatter, and sediment inputs fromfloodplain areas.Riparian vegetation within 100feet of the small tributaries of thelower Middle Fork Willamette isgenerally in poor condition.The highway along much of theMiddle Fork and Salt Creek androads along tributaries havecompromised the ability ofchannels to meander, recruitlarge wood, and create newsurfaces for establishment ofriparian trees.
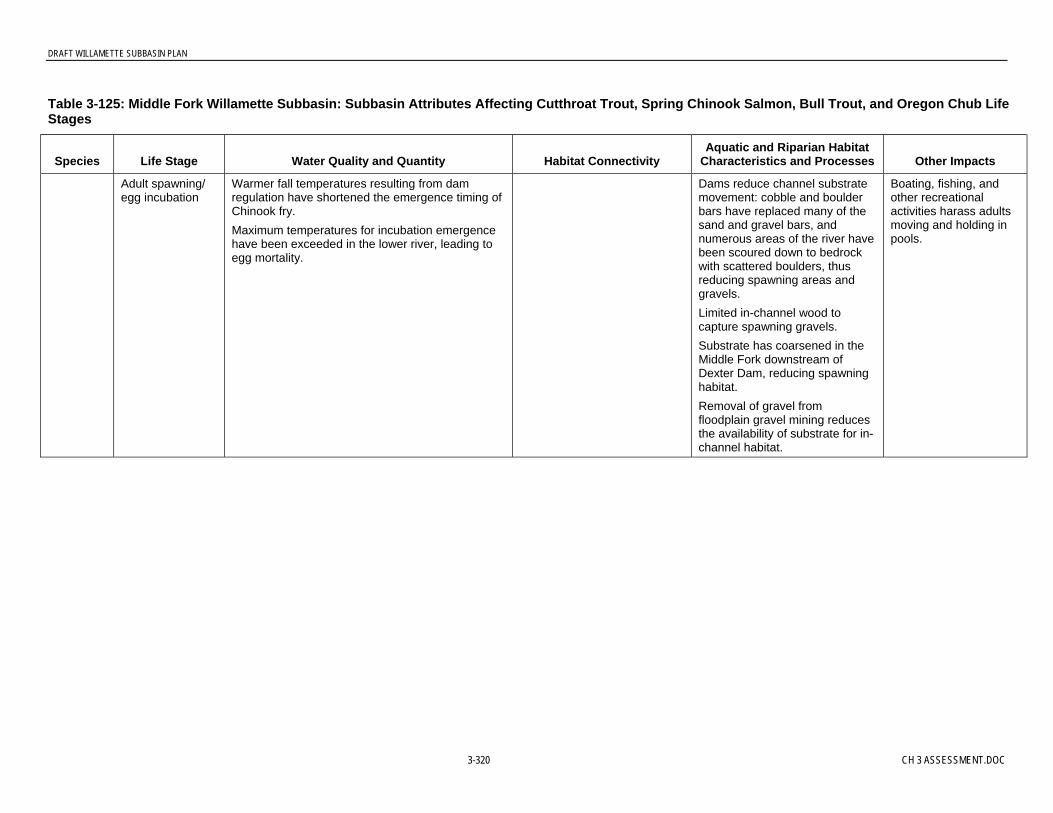
DRAFT WILLAMETTE SUBBASIN PLAN
3-320 CH 3 ASSESSMENT.DOC
Table 3-125: Middle Fork Willamette Subbasin: Subbasin Attributes Affecting Cutthroat Trout, Spring Chinook Salmon, Bull Trout, and Oregon Chub LifeStages
Species Life Stage Water Quality and Quantity Habitat ConnectivityAquatic and Riparian Habitat
Characteristics and Processes Other Impacts
Adult spawning/egg incubation
Warmer fall temperatures resulting from damregulation have shortened the emergence timing ofChinook fry.Maximum temperatures for incubation emergencehave been exceeded in the lower river, leading toegg mortality.
Dams reduce channel substratemovement: cobble and boulderbars have replaced many of thesand and gravel bars, andnumerous areas of the river havebeen scoured down to bedrockwith scattered boulders, thusreducing spawning areas andgravels.Limited in-channel wood tocapture spawning gravels.Substrate has coarsened in theMiddle Fork downstream ofDexter Dam, reducing spawninghabitat.Removal of gravel fromfloodplain gravel mining reducesthe availability of substrate for in-channel habitat.
Boating, fishing, andother recreationalactivities harass adultsmoving and holding inpools.
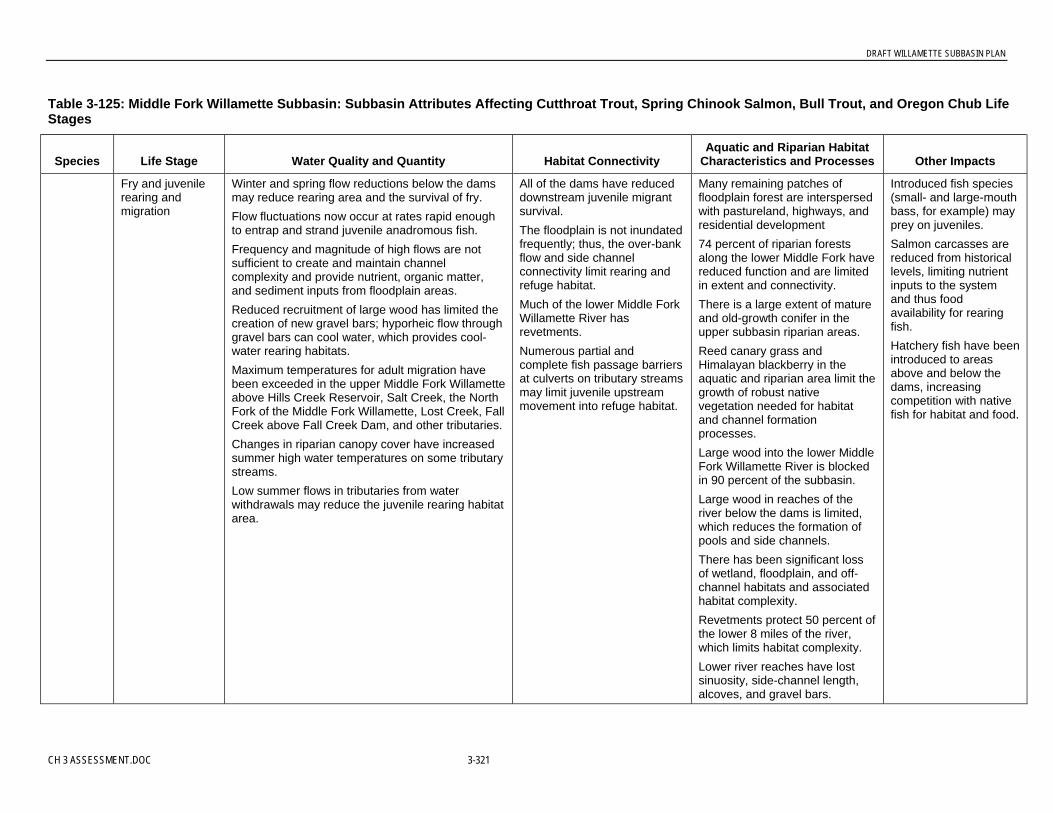
DRAFT WILLAMETTE SUBBASIN PLAN
CH 3 ASSESSMENT.DOC 3-321
Table 3-125: Middle Fork Willamette Subbasin: Subbasin Attributes Affecting Cutthroat Trout, Spring Chinook Salmon, Bull Trout, and Oregon Chub LifeStages
Species Life Stage Water Quality and Quantity Habitat ConnectivityAquatic and Riparian Habitat
Characteristics and Processes Other Impacts
Fry and juvenilerearing andmigration
Winter and spring flow reductions below the damsmay reduce rearing area and the survival of fry.Flow fluctuations now occur at rates rapid enoughto entrap and strand juvenile anadromous fish.Frequency and magnitude of high flows are notsufficient to create and maintain channelcomplexity and provide nutrient, organic matter,and sediment inputs from floodplain areas.Reduced recruitment of large wood has limited thecreation of new gravel bars; hyporheic flow throughgravel bars can cool water, which provides cool-water rearing habitats.Maximum temperatures for adult migration havebeen exceeded in the upper Middle Fork Willametteabove Hills Creek Reservoir, Salt Creek, the NorthFork of the Middle Fork Willamette, Lost Creek, FallCreek above Fall Creek Dam, and other tributaries.Changes in riparian canopy cover have increasedsummer high water temperatures on some tributarystreams.Low summer flows in tributaries from waterwithdrawals may reduce the juvenile rearing habitatarea.
All of the dams have reduceddownstream juvenile migrantsurvival.The floodplain is not inundatedfrequently; thus, the over-bankflow and side channelconnectivity limit rearing andrefuge habitat.Much of the lower Middle ForkWillamette River hasrevetments.Numerous partial andcomplete fish passage barriersat culverts on tributary streamsmay limit juvenile upstreammovement into refuge habitat.
Many remaining patches offloodplain forest are interspersedwith pastureland, highways, andresidential development74 percent of riparian forestsalong the lower Middle Fork havereduced function and are limitedin extent and connectivity.There is a large extent of matureand old-growth conifer in theupper subbasin riparian areas.Reed canary grass andHimalayan blackberry in theaquatic and riparian area limit thegrowth of robust nativevegetation needed for habitatand channel formationprocesses.Large wood into the lower MiddleFork Willamette River is blockedin 90 percent of the subbasin.Large wood in reaches of theriver below the dams is limited,which reduces the formation ofpools and side channels.There has been significant lossof wetland, floodplain, and off-channel habitats and associatedhabitat complexity.Revetments protect 50 percent ofthe lower 8 miles of the river,which limits habitat complexity.Lower river reaches have lostsinuosity, side-channel length,alcoves, and gravel bars.
Introduced fish species(small- and large-mouthbass, for example) mayprey on juveniles.Salmon carcasses arereduced from historicallevels, limiting nutrientinputs to the systemand thus foodavailability for rearingfish.Hatchery fish have beenintroduced to areasabove and below thedams, increasingcompetition with nativefish for habitat and food.

DRAFT WILLAMETTE SUBBASIN PLAN
3-322 CH 3 ASSESSMENT.DOC
Table 3-125: Middle Fork Willamette Subbasin: Subbasin Attributes Affecting Cutthroat Trout, Spring Chinook Salmon, Bull Trout, and Oregon Chub LifeStages
Species Life Stage Water Quality and Quantity Habitat ConnectivityAquatic and Riparian Habitat
Characteristics and Processes Other Impacts
Bull Trout Adult migrationand holding
Middle Fork Willamette below Hills Creek andDexter Dams: The frequency and magnitude ofhigh flows are not sufficient to create and maintainchannel complexity and provide nutrient, organicmatter, and sediment inputs from floodplain areas.
No documented affect from winter and spring flowreductions below Hills Creek and Dexter dams onmigrating bull trout; however, flow managementthat more closely approaches the naturalhydrograph would benefit bull trout.
Spring and summer releases from Hills Creek andDexter dams are cooler than inflow; winter releasesare warmer than inflow
DEQ’s 2002 CWA 303(d) database indicates thatthe Middle Fork Willamette above Hills CreekReservoir (Sand Prairie Campground) exceeds thetemperature standard for bull trout (50°F). The 7-day average of daily maximums ranged from 63°F(1964) to 72°F (1980). Water temperatures limitbull trout distribution.
DEQ’s 2002 CWA 303(d) database indicates thatthe Middle Fork Willamette below Dexter Damexceeds the temperature standard for bull trout(50°F). Water temperatures limit bull troutdistribution.
Upstream adult movement isconfined to entering DexterPonds Hatchery Facility fromJune through September atDexter Dam (RM 203).Complete barriers to upstreamadult movement are LookoutPoint Dam (RM 206) and HillsCreek Dam (RM 233).
No designed downstream fishpassage. All downstream fishpassage is through turbines orregulating outlets.
Timber harvesting has increasedsediment delivery to streams anddecreased large wood input,resulting in degraded aquatichabitat
Large wood does not meet USFStargets in most low-gradientupper Middle Fork tributaries,most of the North Fork MiddleFork, Salmon Creek, Hills Creek,and the mainstem Fall Creek
Large wood into the lower MiddleFork is blocked in 90 percent ofthe subbasin
U.S. Army Corps of Engineersreservoirs block sediment into thelower Middle Fork from 90percent of the Middle Forksubbasin
Construction of Fall Creek,Dexter, Lookout Point, and HillsCreek Reservoir have replaced40 miles of free-flowing stream inthe Middle Fork Willamette Basinwith reservoir habitat.
Boating and otherrecreational activitiesharass adults migratingand holding in pools.
Poaching of bull troutoccurs.
Bull trout captured andreleased during trout,steelhead, or salmonfisheries suffer anunknown level ofhooking mortality.
Reduction of springChinook salmonproduction aboveDexter, Lookout Point,and Hills Creek damshas decreased theavailability of a historicalprey base important forbull trout.
Hatchery rainbow trouthave been introduced toareas above and belowdams, potentiallycompeting with bull troutfor food and habitat.
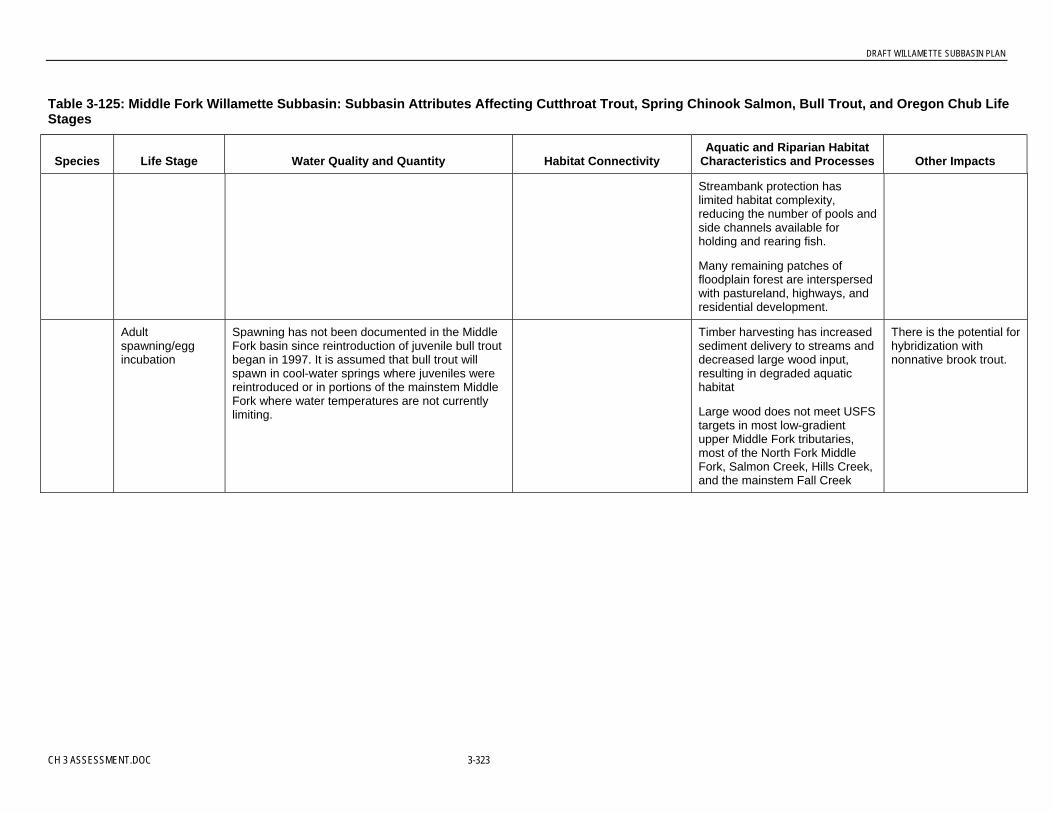
DRAFT WILLAMETTE SUBBASIN PLAN
CH 3 ASSESSMENT.DOC 3-323
Table 3-125: Middle Fork Willamette Subbasin: Subbasin Attributes Affecting Cutthroat Trout, Spring Chinook Salmon, Bull Trout, and Oregon Chub LifeStages
Species Life Stage Water Quality and Quantity Habitat ConnectivityAquatic and Riparian Habitat
Characteristics and Processes Other Impacts
Streambank protection haslimited habitat complexity,reducing the number of pools andside channels available forholding and rearing fish.
Many remaining patches offloodplain forest are interspersedwith pastureland, highways, andresidential development.
Adultspawning/eggincubation
Spawning has not been documented in the MiddleFork basin since reintroduction of juvenile bull troutbegan in 1997. It is assumed that bull trout willspawn in cool-water springs where juveniles werereintroduced or in portions of the mainstem MiddleFork where water temperatures are not currentlylimiting.
Timber harvesting has increasedsediment delivery to streams anddecreased large wood input,resulting in degraded aquatichabitat
Large wood does not meet USFStargets in most low-gradientupper Middle Fork tributaries,most of the North Fork MiddleFork, Salmon Creek, Hills Creek,and the mainstem Fall Creek
There is the potential forhybridization withnonnative brook trout.
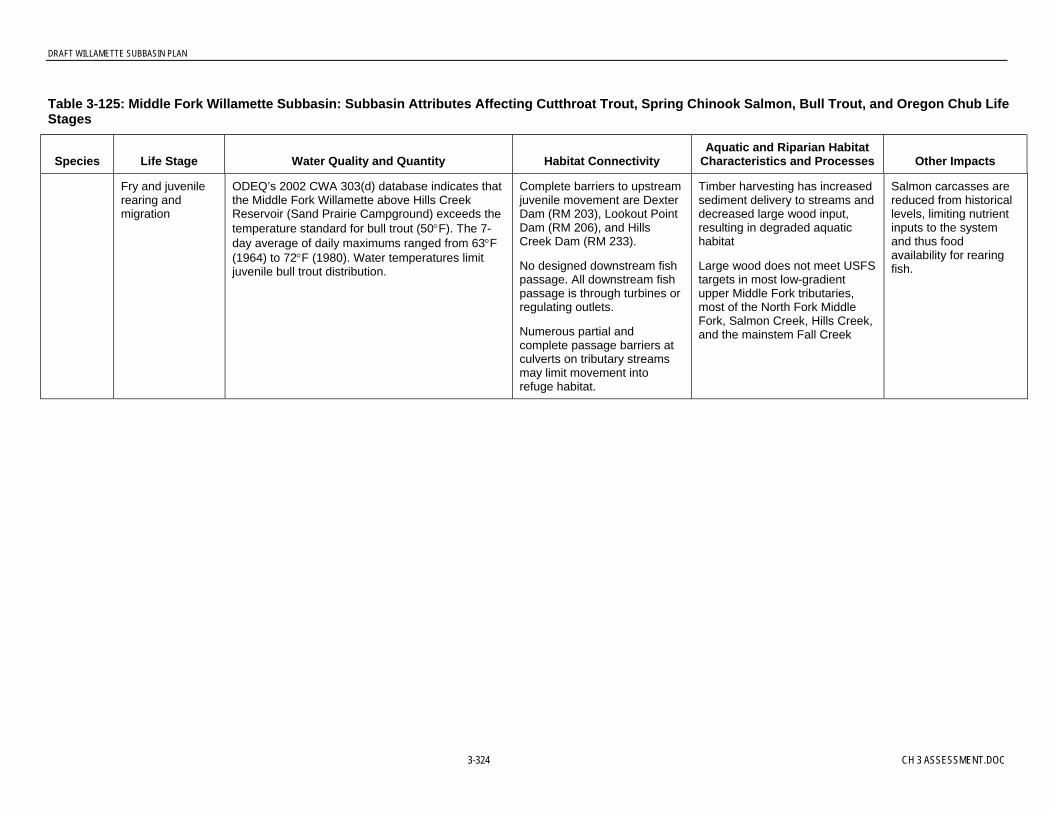
DRAFT WILLAMETTE SUBBASIN PLAN
3-324 CH 3 ASSESSMENT.DOC
Table 3-125: Middle Fork Willamette Subbasin: Subbasin Attributes Affecting Cutthroat Trout, Spring Chinook Salmon, Bull Trout, and Oregon Chub LifeStages
Species Life Stage Water Quality and Quantity Habitat ConnectivityAquatic and Riparian Habitat
Characteristics and Processes Other Impacts
Fry and juvenilerearing andmigration
ODEQ’s 2002 CWA 303(d) database indicates thatthe Middle Fork Willamette above Hills CreekReservoir (Sand Prairie Campground) exceeds thetemperature standard for bull trout (50°F). The 7-day average of daily maximums ranged from 63°F(1964) to 72°F (1980). Water temperatures limitjuvenile bull trout distribution.
Complete barriers to upstreamjuvenile movement are DexterDam (RM 203), Lookout PointDam (RM 206), and HillsCreek Dam (RM 233).
No designed downstream fishpassage. All downstream fishpassage is through turbines orregulating outlets.
Numerous partial andcomplete passage barriers atculverts on tributary streamsmay limit movement intorefuge habitat.
Timber harvesting has increasedsediment delivery to streams anddecreased large wood input,resulting in degraded aquatichabitat
Large wood does not meet USFStargets in most low-gradientupper Middle Fork tributaries,most of the North Fork MiddleFork, Salmon Creek, Hills Creek,and the mainstem Fall Creek
Salmon carcasses arereduced from historicallevels, limiting nutrientinputs to the systemand thus foodavailability for rearingfish.

DRAFT WILLAMETTE SUBBASIN PLAN
CH 3 ASSESSMENT.DOC 3-325
Table 3-125: Middle Fork Willamette Subbasin: Subbasin Attributes Affecting Cutthroat Trout, Spring Chinook Salmon, Bull Trout, and Oregon Chub LifeStages
Species Life Stage Water Quality and Quantity Habitat ConnectivityAquatic and Riparian Habitat
Characteristics and Processes Other Impacts
Oregonchub
All Logging practices in the upper watersheds of theMiddle Fork Willamette tributaries contributesediment to ponds that contain Oregon chub. Overtime, these ponds may fill in completely.Sedimentation taking place at East Fork MinnowCreek pond may be partially influenced by loggingin the watershed.
Logging practices in the upper watersheds of theMiddle Fork Willamette tributaries may, throughrunoff, contribute pesticides and herbicides toponds containing Oregon chub. Water quality canbe subsequently affected through increasednutrients and low dissolved oxygen.
Several Oregon chub populations that occur nearroadways may be subject to pollution from roadrunoff and chemical spills.
Numerous diversions andwater barriers may protectOregon chub from the influx ofexotic fish species; however,the natural dispersal of Oregonchub is also limited by thesestructures. For example, theDexter Reservoir alcoves allowpassage of exotic fish speciesbetween the reservoir and thealcoves, which contain Oregonchub.
The loss of connectivity tofloodplain and wetland habitatshas affected the availability ofsuitable habitat. Dams andother structures have changedriver hydrology and reducedthe amount of side-channelhabitat.
Frequency of flows is not ofsufficient magnitude to createand maintain channel complexityand provide nutrients, organicmatter, and sediment inputs fromfloodplain areas.
Many remaining patches offloodplain forest are interspersedwith pastureland, highways, andresidential development
There has been significant loss ofwetland, floodplain and off-channel habitats and associatedhabitat complexity.
Lower river reaches have lostsinuosity, side-channel length,alcoves, and gravel bars.
The presence of exoticfish in this systeminhibits Oregon chubrecolonization offormerly occupiedhabitat.
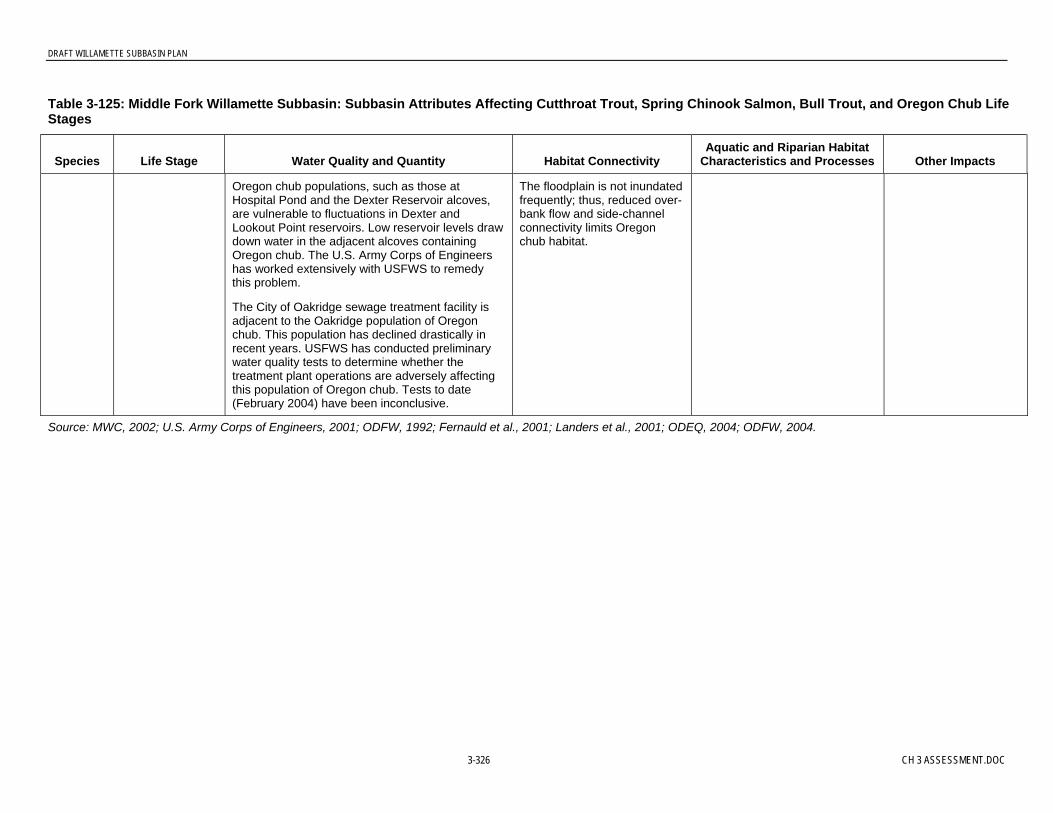
DRAFT WILLAMETTE SUBBASIN PLAN
3-326 CH 3 ASSESSMENT.DOC
Table 3-125: Middle Fork Willamette Subbasin: Subbasin Attributes Affecting Cutthroat Trout, Spring Chinook Salmon, Bull Trout, and Oregon Chub LifeStages
Species Life Stage Water Quality and Quantity Habitat ConnectivityAquatic and Riparian Habitat
Characteristics and Processes Other Impacts
Oregon chub populations, such as those atHospital Pond and the Dexter Reservoir alcoves,are vulnerable to fluctuations in Dexter andLookout Point reservoirs. Low reservoir levels drawdown water in the adjacent alcoves containingOregon chub. The U.S. Army Corps of Engineershas worked extensively with USFWS to remedythis problem.
The City of Oakridge sewage treatment facility isadjacent to the Oakridge population of Oregonchub. This population has declined drastically inrecent years. USFWS has conducted preliminarywater quality tests to determine whether thetreatment plant operations are adversely affectingthis population of Oregon chub. Tests to date(February 2004) have been inconclusive.
The floodplain is not inundatedfrequently; thus, reduced over-bank flow and side-channelconnectivity limits Oregonchub habitat.
Source: MWC, 2002; U.S. Army Corps of Engineers, 2001; ODFW, 1992; Fernauld et al., 2001; Landers et al., 2001; ODEQ, 2004; ODFW, 2004.
DRAFT WILLAMETTE SUBBASIN PLAN
CH 3 ASSESSMENT.DOC 3-327
Appendix G shows specific fish passage barriers on the Middle Fork, based on May 2004data from ODFW; the information was compiled from existing ODFW databases.
Large Wood. Historical removal of large wood from the river and tributary streams, reducedtransport of wood below the dams, and changes in riparian vegetation all have interacted toreduce the quantity and distribution of large wood in the river and tributaries. Approximately74 percent of the riparian forests along the lower Middle Fork have reduced functions,including delivery of large wood Limited wood in the river and tributary channels limits theformation of pools, thus reducing hiding areas for adult fish and restricting the quality andquantity of juvenile rearing habitat.
Habitat Connectivity. Backwater habitats, including pool margins, side channels, andalcoves, are reduced from historical levels. There has been significant loss of sinuosity, sidechannel length, and numbers of alcoves in the lower river reaches (Andrus and Walsh, 2002).More than 50 percent of the channel length of the lower Middle Fork Willamette River hasrevetments (U.S. Army Corps of Engineers, 2001). Actions to stabilize the lower riverthrough the placement of riprap along banks (and other actions) and limited large wood in thechannel have interacted to reduce the quantity and quality of backwater habitats. In addition,changes in the frequency and magnitude of high flow events below the dams have altered theformation of these complex habitats. Backwater areas in the river and lower tributariesprovide key habitats for adult and juvenile cutthroat tout and juvenile spring Chinook salmonand Oregon chub. These habitats provide fish with habitat for foraging and refuge from highflow events.
Key Factors Limiting Fish Populations. The U.S. Army Corps of Engineers dams dividethe Middle Fork Willamette Subbasin into upper and lower portions that are characterized bydifferent patterns of aquatic and riparian habitat, hydrologic regimes, water qualitycharacteristics, and fish species distributions. For this reason, factors limiting populations forthe focal fish species are assessed separately for the upper and lower subbasins.
Lower Middle Fork Willamette Subbasin. In the lower Middle Fork Willamette Subbasin,the population productivity, capacity, and diversity of cutthroat trout and spring Chinooksalmon, populations are limited by the following (no bull trout populations occur in the lowersubbasin):
• Habitat Connectivity. Modification of the river’s high flow regime as a result of damregulation, channel and bank confinement, and reduced large wood in the channels haveinteracted to reduce backwater habitats important for juvenile rearing and winter refuge.
• Habitat Modification. Modification of key aquatic habitats has affected all life stages.Limited spawning areas and reduced levels of gravels/small cobbles have reduced theareas available for spawning.
• Large Wood. Changes in the delivery and transport of large wood in the river andtributaries has modified gravel deposition patterns, reduced the frequency and depth ofpools, and minimized hiding cover for adult and juvenile fish.
• Water Temperature. Changes in high and low water temperature regimes have affectedadult salmonid spawning success and egg incubation and have limited the capacity ofriver and tributary streams to support juvenile fish.
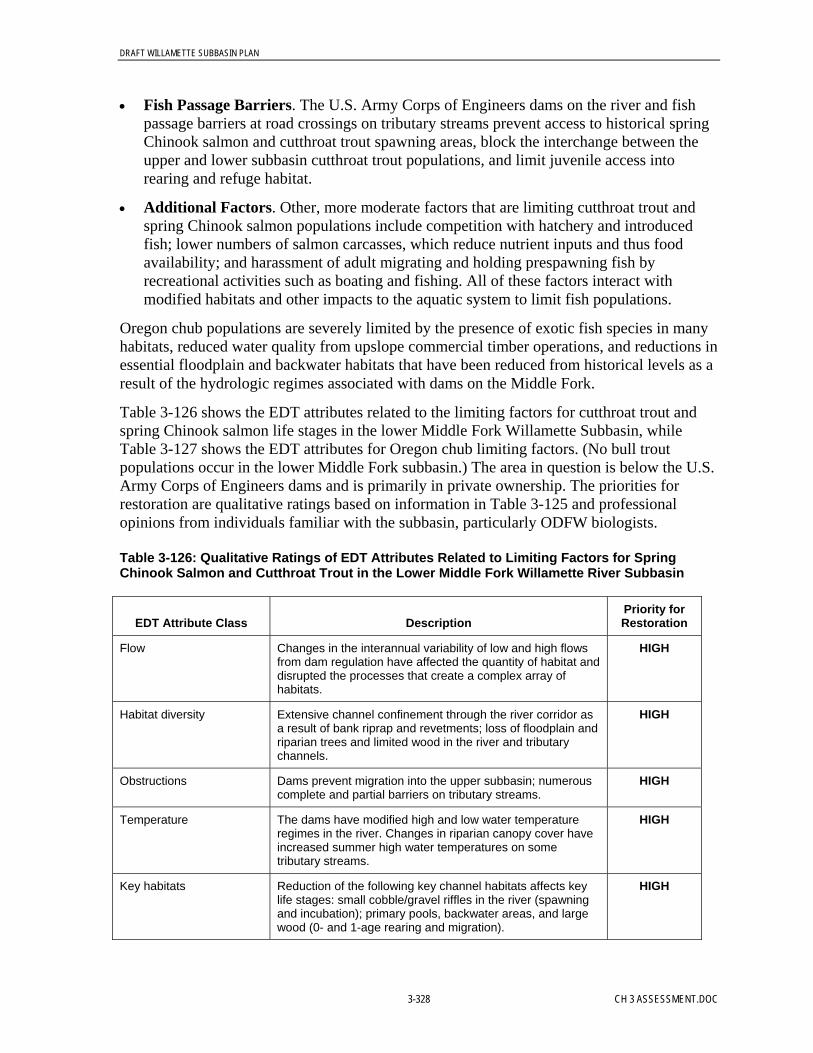
DRAFT WILLAMETTE SUBBASIN PLAN
3-328 CH 3 ASSESSMENT.DOC
• Fish Passage Barriers. The U.S. Army Corps of Engineers dams on the river and fishpassage barriers at road crossings on tributary streams prevent access to historical springChinook salmon and cutthroat trout spawning areas, block the interchange between theupper and lower subbasin cutthroat trout populations, and limit juvenile access intorearing and refuge habitat.
• Additional Factors. Other, more moderate factors that are limiting cutthroat trout andspring Chinook salmon populations include competition with hatchery and introducedfish; lower numbers of salmon carcasses, which reduce nutrient inputs and thus foodavailability; and harassment of adult migrating and holding prespawning fish byrecreational activities such as boating and fishing. All of these factors interact withmodified habitats and other impacts to the aquatic system to limit fish populations.
Oregon chub populations are severely limited by the presence of exotic fish species in manyhabitats, reduced water quality from upslope commercial timber operations, and reductions inessential floodplain and backwater habitats that have been reduced from historical levels as aresult of the hydrologic regimes associated with dams on the Middle Fork.
Table 3-126 shows the EDT attributes related to the limiting factors for cutthroat trout andspring Chinook salmon life stages in the lower Middle Fork Willamette Subbasin, whileTable 3-127 shows the EDT attributes for Oregon chub limiting factors. (No bull troutpopulations occur in the lower Middle Fork subbasin.) The area in question is below the U.S.Army Corps of Engineers dams and is primarily in private ownership. The priorities forrestoration are qualitative ratings based on information in Table 3-125 and professionalopinions from individuals familiar with the subbasin, particularly ODFW biologists.
Table 3-126: Qualitative Ratings of EDT Attributes Related to Limiting Factors for SpringChinook Salmon and Cutthroat Trout in the Lower Middle Fork Willamette River Subbasin
EDT Attribute Class DescriptionPriority forRestoration
Flow Changes in the interannual variability of low and high flowsfrom dam regulation have affected the quantity of habitat anddisrupted the processes that create a complex array ofhabitats.
HIGH
Habitat diversity Extensive channel confinement through the river corridor asa result of bank riprap and revetments; loss of floodplain andriparian trees and limited wood in the river and tributarychannels.
HIGH
Obstructions Dams prevent migration into the upper subbasin; numerouscomplete and partial barriers on tributary streams.
HIGH
Temperature The dams have modified high and low water temperatureregimes in the river. Changes in riparian canopy cover haveincreased summer high water temperatures on sometributary streams.
HIGH
Key habitats Reduction of the following key channel habitats affects keylife stages: small cobble/gravel riffles in the river (spawningand incubation); primary pools, backwater areas, and largewood (0- and 1-age rearing and migration).
HIGH

DRAFT WILLAMETTE SUBBASIN PLAN
CH 3 ASSESSMENT.DOC 3-329
Table 3-126: Qualitative Ratings of EDT Attributes Related to Limiting Factors for SpringChinook Salmon and Cutthroat Trout in the Lower Middle Fork Willamette River Subbasin
EDT Attribute Class DescriptionPriority forRestoration
Channel stability Limited wood in channels has reduced channel stability. Medium
Competition with hatcheryfish
Hatchery fish have been introduced to areas below thedams, thus increasing competition with native fish for habitatand food (Ziller, ODFW, personal communication, 2004).
Medium
Competition with otherspecies
Fish community richness is high in the lower river and thereis competition with introduced fish.
Medium
Food Salmon carcasses are reduced from historical levels, limitingnutrient inputs to the system and thus food availability forrearing fish.
Medium
Harassment Extensive recreational use of the lower river (boating andfishing) harasses migrating, holding, and spawning fish.
Medium
Pathogens Hatchery fish have been introduced to areas below thedams, increasing the potential for disease.
Medium
Withdrawals Unscreened diversions on some tributaries affect adult andjuvenile rearing habitat.
Medium
Chemicals No evidence of levels of toxics sufficient to affect salmonids. Low
Oxygen Oxygen levels are adequate to support all life stages. Low
Sediment load Although turbidity levels are periodically high, there does notappear to be increased sediment deposition.
Low
Table 3-127: Qualitative Ratings of EDT Attributes Related to Limiting Factors for OregonChub in the Lower Middle Fork Willamette River Subbasin
EDT Attribute Class DescriptionPriority forRestoration
Chemicals Oregon chub habitats are susceptible to reduced waterquality from commercial timber operations, sewagetreatment plants, and highway runoff.
HIGH
Competition with otherspecies
Exotic fish species pose a significant threat throughpredation and competition.
HIGH
Key habitats Reduction of the following key channel habitats affects all lifestages: backwater sloughs, channels, and other low-velocitywaterways.
HIGH
Habitat diversity Changes in hydrologic flow regimes have reduced theamount of off-channel habitat in side channels, sloughs, andother slow-moving water.
HIGH

DRAFT WILLAMETTE SUBBASIN PLAN
3-330 CH 3 ASSESSMENT.DOC
Table 3-127: Qualitative Ratings of EDT Attributes Related to Limiting Factors for OregonChub in the Lower Middle Fork Willamette River Subbasin
EDT Attribute Class DescriptionPriority forRestoration
Flow Changes in the interannual variability of low and high flowsfrom dam regulation have affected the quantity of habitat anddisrupted the processes that create a complex array ofhabitats.
Medium
Sediment load Sediment from logging activities in the upper watershed maybe contributing to filling in and reducing the amount ofhabitat.
Medium
Withdrawals Water levels in Dexter and Lookout Point reservoirs affectavailable habitat in side alcoves to the reservoirs.
Medium
Oxygen Low dissolved oxygen levels in some habitats maycontribute to reduced water quality.
Low
Pathogens Pathogens are not thought to be limiting. Low
Limiting Factors in the Upper Middle Fork Willamette Subbasin. Historically the uppersubbasin was an important spawning and juvenile rearing area for cutthroat trout, springChinook salmon, and bull trout. In contrast to the large-scale modification of the lowersubbasin, most of the impacts to habitat and water quality in the upper subbasin are localized.Currently, limiting factors for cutthroat, Chinook, and bull trout in the upper subbasin are asfollows:
• Channel and Habitat Modification. Roads next to stream channels have increasedchannel confinement and reduced riparian vegetation and canopy cover, but not to theextent as in the lower subbasin. A highway parallels the river for much its length andthere are numerous forest roads along tributary streams.
• Large Wood. There are systematic changes to the levels of large wood in the river andstream channels of the upper subbasin. Past management of riparian areas and streamcleaning practices have led to reduced large wood loads in the aquatic system. Reducedin-channel wood has modified gravel deposition patterns, reduced the frequency anddepth of pools, and minimized hiding cover for adult and juvenile fish.
• Additional Factors. Other, more moderate limiting factors include partial and completebarriers to fish passage on tributary streams, changes in water temperature regimes as aresult of reduced canopy cover, competition with hatchery introductions, and lowernumbers of salmon carcasses, which reduces nutrient inputs and thus food availability.
Table 3-128 shows the EDT attributes related to limiting factors for cutthroat trout, springChinook salmon, and bull trout life stages in the upper Middle Fork Willamette Subbasin, anarea that is primarily under U.S. Forest Service management. Again, the table presentsqualitative ratings based on information in Table 3-125 and professional opinions fromindividuals familiar with the subbasin, particularly ODFW biologists.

DRAFT WILLAMETTE SUBBASIN PLAN
CH 3 ASSESSMENT.DOC 3-331
Table 3-128: Qualitative Ratings of EDT Attributes Related to Limiting Factors for CutthroatTrout, Spring Chinook Salmon, and Bull Trout in the Upper Middle Fork Willamette RiverSubbasin
EDT Attribute Class DescriptionPriority forRestoration
Habitat diversity Moderate channel confinement through the river corridor asa result of bank riprap, the highway and secondary roads,and limited large wood has affected the quality of habitat.
HIGH
Key habitats Reduction of the following key channel habitats affects keylife stages: primary pools, backwater areas, and large wood.
HIGH
Channel stability In some areas, limited in-channel wood and reduced riparianfunction have destabilized channels.
Medium
Competition with hatcheryfish
Hatchery fish have been introduced to areas above thedams, increasing competition with native fish for habitat andfood.
Medium
Food Salmon carcasses are reduced from historical levels, limitingnutrient inputs to the system and thus food availability forrearing fish. Juvenile Chinook salmon were an importantprey item for bull trout.
Medium
Obstructions Some complete and partial barriers on tributary streams. Medium
Pathogens Hatchery fish have been introduced to areas above thedams, increasing the potential for disease.
Medium
Temperature Changes in riparian canopy cover have increased summerhigh water temperatures on some tributary streams inhabitedhistorically by bull trout.
Medium
Chemicals No evidence of levels of toxics sufficient to affect salmonids. Low
Competition with otherspecies
Very low number of introduced fish species present. Low
Flow There have not been significant changes in the interannualvariability of low and high flows.
Low
Harassment Moderate recreational use of the upper river (boating andfishing) harasses migrating, holding, and spawning fish.
Low
Oxygen Oxygen levels are adequate to support all life stages Low
Sediment load Although turbidity levels are periodically high, there does notappear to be increased sediment deposition.
Low
Withdrawals Minimal water withdrawals. Low
3.5.1.7 Limiting Factors in the Molalla/Pudding SubbasinThis section describes the Marys subbasin in terms of geographic setting and environmentalconditions and presents information on the limiting factors for focal species in the subbasin:winter steelhead, cutthroat trout, and spring Chinook.
DRAFT WILLAMETTE SUBBASIN PLAN
3-332 CH 3 ASSESSMENT.DOC
Focal species present:• Winter steelhead trout• Spring Chinook salmon• Cutthroat trout
Focal species present historically:• Oregon chub
Geographic Setting. The Molalla/Pudding Subbasin covers an area of approximately 900square miles. The Molalla River begins in the western slope of the Cascade Mountains, whilethe Pudding River’s headwaters begin in the low elevation Waldo Hills east of Salem. TheMolalla River is approximately 49 miles long and enters the Willamette River at RM 36; thePudding Rive is 62 miles long and enters the Molalla River at RM 0.75. Approximately 87percent of the land in the subbasin is privately owned. Agriculture and rural residentialdevelopment are the dominant land uses in the lower subbasin, with most of the developmentconcentrated in the Pudding drainage. There are numerous small communities and growingurban areas within the lower subbasin, including the cities of Canby, Silverton, Molalla; inaddition, portions of the cities of Salem and Woodburn are within the lower subbasin.Forestland uses predominate in the upper Molalla River drainage and on tributaries to thePudding River that drain the Cascade Range (Butte and Abiqua creeks, for example). TheSalem District of the BLM manages a block of land in the upper Molalla River, whichincludes the Table Rock Wilderness.
The Molalla River enters the floor of the Willamette Valley near the community of ShadyDell (RM 20). Major tributaries in the forested upper Molalla drainage include the NorthFork Molalla and Table Rock Creek. Milk and Woodcock creeks are major tributaries to thelower Molalla River. Almost the entire Pudding River drainage is on the floor of theWillamette Valley. Major tributaries in the primarily forested upper portions of the upperPudding River drainage include Abiqua, Butte, and Silver creeks. The Little Pudding Riverand Drift Creek drain into the lower Pudding River drainage in the Willamette Valley.
The Molalla/Pudding Subbasin has variable stream flow regimes. Stream runoff patterns inthe Molalla drainage are dominated by the western Cascade geology, with a rain-on-snowhydrology in the mid- to upper elevations and rain-dominated flow patterns in the riverleading to rapid delivery of water to the stream network. Snowmelt from the low-elevationwestern Cascades contributes to flows in the Molalla drainage but not in the quantities of thehigher Cascade drainages. The Pudding drainage begins at very low elevations with nosummer snowmelt to affect stream flows. Because the Pudding drainage is underlain withWillamette Valley alluvium, which has little water storage capacity, stream flows followseasonal rainfall patterns. The mainstem Pudding River has lower flows and higher watertemperatures than the Molalla River drainage. Butte, Abiqua and Silver creeks in the Puddingdrainage and the headwaters of the Molalla River are underlain with volcanic basalts, whichstore water, thus helping to maintain flows and cooler water temperatures in the summer andearly fall.
The headwaters and tributaries of the upper subbasin flow steeply off the Cascade Range,and the gradient rapidly decreases once the river enters the lower subbasin areas within theflat Willamette Valley. The lower 20 miles of the Molalla River has a gradient of 0.2 percent.

DRAFT WILLAMETTE SUBBASIN PLAN
CH 3 ASSESSMENT.DOC 3-333
Almost the entire Pudding River channel is within the flat Willamette Valley floor, with agradient of 0.04 percent for the first 50 miles.
Environmental Conditions. Altered subbasin processes, modified riparian and aquatichabitat, and limited access to historical spawning and rearing areas in the Molalla/PuddingSubbasin have affected the productivity, capacity, and diversity of winter steelhead, springChinook, and cutthroat population. Table 3-129 summarizes changes in the subbasin’senvironmental conditions and how these changes have affected cutthroat trout, springChinook salmon, and winter steelhead life stages.
Upper and Lower Subbasins. Relative to the lower Molalla/Pudding Subbasin, the uppersubbasin, which is primarily forested, has aquatic habitat that is closer to the historicalbaseline, with the highest proportion of functioning riparian areas, the largest amounts oflarge wood in the river and tributary channels, and higher quality aquatic habitats (Baker etal., 2002). Impacts to aquatic and riparian habitats have been greater in the lower subbasinthan in the upper subbasin. Historically, the lower subbasin was characterized by verycomplex and productive fish habitat because largest proportion of low gradient,unconstrained river and stream channels were in the area where the Molalla and Puddingrivers and tributaries flowed across the flat Willamette Valley (Pacific Northwest EcosystemResearch Consortium, 2002).
Large Wood. Historical removal of large wood from the river and tributary streams, reduceddelivery and transport of wood through channels, and changes in riparian vegetation all haveinteracted to reduce the quantity and distribution of large wood. Mature riparian forests makeup a small proportion of the riparian areas in the lower subbasin (Pacific NorthwestEcosystem Research Consortium, 2002). Over time, a number of practices (such as splashdams and stream cleaning) removed large wood from the Molalla and Pudding rivers andtributary channels. While riparian areas in the forested upper subbasin have greater numbersof conifer trees than the lower subbasin does, historical wood removal from streams andriparian harvest has reduced large wood in the channels. Reduced wood in the river andtributary channels limits the formation of pools, thus reducing hiding and feeding areas foradult fish and restricting the quality and quantity of juvenile rearing habitat. The loss of largewood and other structures that provide hiding cover has reduced the quality of adult springChinook salmon holding pools in the Molalla River (Stahl, ODFW, personal communication,2004).

DRAFT WILLAMETTE SUBBASIN PLAN
3-334 CH 3 ASSESSMENT.DOC
Table 3-129: Molalla/Pudding Subbasin: Subbasin Attributes Affecting Cutthroat Trout, Spring Chinook Salmon, and Winter Steelhead Life Stages
Species Life Stage Water Quality and Quantity Habitat ConnectivityAquatic and Riparian Habitat
Characteristics and Processes Other Impacts
CutthroatTrout
Adult migrationand holding
Naturally low flows in the lower Pudding drainageare aggravated by water withdrawals, whichincrease water temperatures.
High water temperatures are aggravated by loss ofriparian cover, reduced wetland areas, channelsimplification, and increased impervious surfaces,particularly in the Pudding drainage.
Channelization of tributaries; modification of runoffpatterns as a result of agriculture, impervioussurfaces, and urban/residential development; andloss of storage capacity in floodplains andwetlands—particularly in the Pudding drainage—have accelerated runoff and increased peak flows.
Nutrient and toxic runoff from agricultural andurban areas is an issue in the Pudding drainage.
Loss of wetlands and floodplain habitats hasaffected water quality and quantity (storage andtiming of peak and low flows).
The fish ladder at Silverton’swater diversion on AbiquaCreek has an inadequateentrance and is a partial fishpassage barrier.
Numerous culverts throughoutthe subbasin present barriersto adult refuge habitat.
There are unscreeneddiversions on the mainstemMolalla River near ShadyCove.
Labish Ditch is an unscreeneddiversion that provides aninterbasin connection betweenClaggett Creek and the LittlePudding River.
Limited wood in the tributariesand river channel has reducedthe frequency and depth of poolsand limited adult hiding cover.Limited large wood in channelsis particularly pronounced in thelower subbasin.
Riparian areas along the riverand tributaries, especially in thelower subbasin, are reduced inwidth, connectivity, and quality.
There is some high-qualityfloodplain forest remaining alongthe lower Pudding River.
Reed canary grass andHimalayan blackberry in theaquatic and riparian area limitthe growth of robust nativevegetation needed for habitatand channel formationprocesses.
The loss of wetland, floodplain,and off-channel habitats hasaffected the quantity and qualityof adult holding areas.
Stocked summersteelhead interactwith native fish.
Adultspawning/eggincubation
Numerous culverts throughoutthe subbasin present barriersto spawning habitat.
Limited wood in tributarystreams has reduced retention ofspawning gravels.
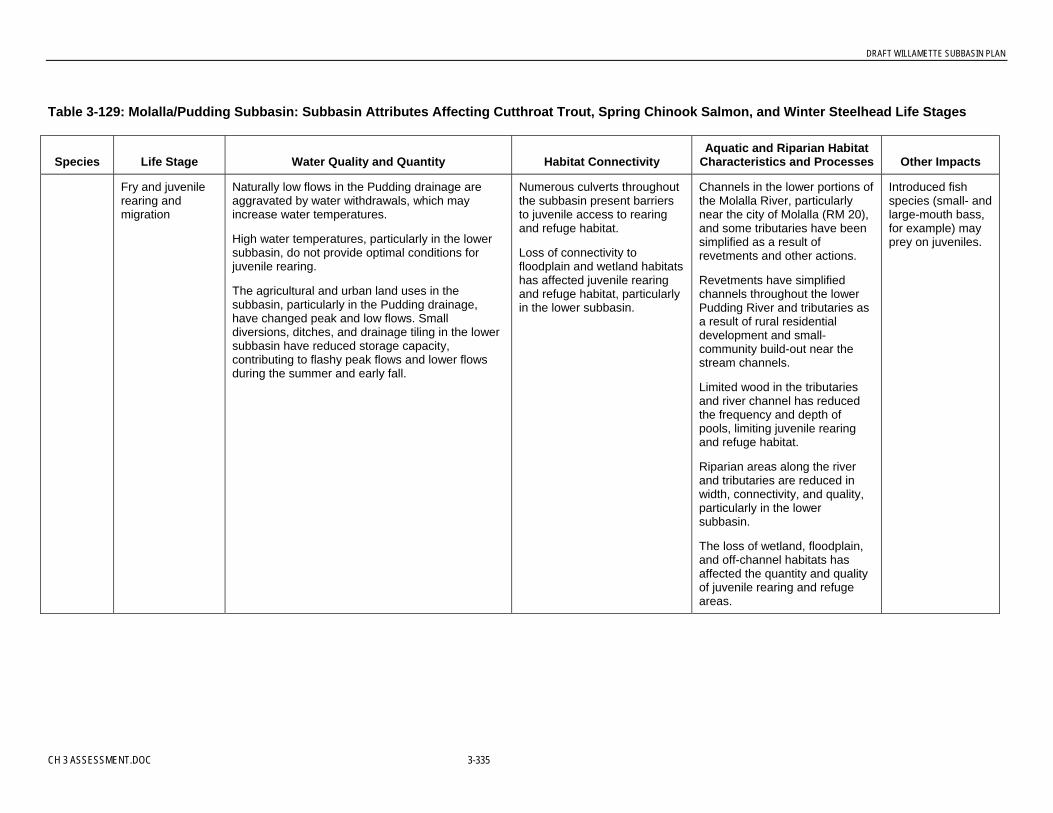
DRAFT WILLAMETTE SUBBASIN PLAN
CH 3 ASSESSMENT.DOC 3-335
Table 3-129: Molalla/Pudding Subbasin: Subbasin Attributes Affecting Cutthroat Trout, Spring Chinook Salmon, and Winter Steelhead Life Stages
Species Life Stage Water Quality and Quantity Habitat ConnectivityAquatic and Riparian Habitat
Characteristics and Processes Other Impacts
Fry and juvenilerearing andmigration
Naturally low flows in the Pudding drainage areaggravated by water withdrawals, which mayincrease water temperatures.
High water temperatures, particularly in the lowersubbasin, do not provide optimal conditions forjuvenile rearing.
The agricultural and urban land uses in thesubbasin, particularly in the Pudding drainage,have changed peak and low flows. Smalldiversions, ditches, and drainage tiling in the lowersubbasin have reduced storage capacity,contributing to flashy peak flows and lower flowsduring the summer and early fall.
Numerous culverts throughoutthe subbasin present barriersto juvenile access to rearingand refuge habitat.
Loss of connectivity tofloodplain and wetland habitatshas affected juvenile rearingand refuge habitat, particularlyin the lower subbasin.
Channels in the lower portions ofthe Molalla River, particularlynear the city of Molalla (RM 20),and some tributaries have beensimplified as a result ofrevetments and other actions.
Revetments have simplifiedchannels throughout the lowerPudding River and tributaries asa result of rural residentialdevelopment and small-community build-out near thestream channels.
Limited wood in the tributariesand river channel has reducedthe frequency and depth ofpools, limiting juvenile rearingand refuge habitat.
Riparian areas along the riverand tributaries are reduced inwidth, connectivity, and quality,particularly in the lowersubbasin.
The loss of wetland, floodplain,and off-channel habitats hasaffected the quantity and qualityof juvenile rearing and refugeareas.
Introduced fishspecies (small- andlarge-mouth bass,for example) mayprey on juveniles.

DRAFT WILLAMETTE SUBBASIN PLAN
3-336 CH 3 ASSESSMENT.DOC
Table 3-129: Molalla/Pudding Subbasin: Subbasin Attributes Affecting Cutthroat Trout, Spring Chinook Salmon, and Winter Steelhead Life Stages
Species Life Stage Water Quality and Quantity Habitat ConnectivityAquatic and Riparian Habitat
Characteristics and Processes Other Impacts
SpringChinookSalmon
Adult migrationand holding
Naturally low flows in the lower Pudding drainageare aggravated by water withdrawals, whichincrease water temperatures.
High water temperatures are aggravated by loss ofriparian cover, reduced wetland areas, channelsimplification, and increased impervious surfaces,particularly in the Pudding drainage.
Channelization of tributaries; modification of runoffpatterns as a result of agriculture, impervioussurfaces, and urban/residential development; andloss of storage capacity in floodplains andwetlands—particularly in the Pudding drainage—have accelerated runoff and increased peak flows.
Nutrient and toxic runoff from agricultural andurban areas is an issue in the Pudding drainage.
Loss of wetlands and floodplain habitats hasaffected water quality and quantity (storage andtiming of peak and low flows).
The fish ladder at Silverton’swater diversion on AbiquaCreek has an inadequateentrance and is a partial fishpassage barrier.
Limited wood in the tributariesand river channel has reducedthe frequency and depth of poolsand limited adult hiding cover.Limited large wood in channelsis particularly pronounced in thelower subbasin.
The loss of large wood and otherstructures that provide hidingcover has reduced the quality ofadult holding pools in the MolallaRiver.
Riparian areas along the riverand tributaries, especially in thelower subbasin, are reduced inwidth, connectivity, and quality.
There is some high-qualityfloodplain forest remaining alongthe lower Pudding River.
Reed canary grass andHimalayan blackberry in theaquatic and riparian area limitthe growth of robust nativevegetation needed for habitatand channel formationprocesses.
The loss of wetland, floodplainand off-channel habitats hasaffected the quantity and qualityof adult holding areas.
Stocked summersteelhead interactwith native fish.
Adultspawning/eggincubation
Limited wood in tributarystreams has reduced retention ofspawning gravels.

DRAFT WILLAMETTE SUBBASIN PLAN
CH 3 ASSESSMENT.DOC 3-337
Table 3-129: Molalla/Pudding Subbasin: Subbasin Attributes Affecting Cutthroat Trout, Spring Chinook Salmon, and Winter Steelhead Life Stages
Species Life Stage Water Quality and Quantity Habitat ConnectivityAquatic and Riparian Habitat
Characteristics and Processes Other Impacts
Fry and juvenilerearing andmigration
Naturally low flows in the Pudding drainage areaggravated by water withdrawals, which mayincrease water temperatures.
High water temperatures, particularly in the lowersubbasin, do not provide optimal conditions forjuvenile rearing.
The agricultural and urban land uses in thesubbasin, particularly in the Pudding drainage,have changed peak and low flows. Smalldiversions, ditches, and drainage tiling in the lowersubbasin have reduced storage capacity,contributing to flashy peak flows and lower flowsduring the summer and early fall.
Numerous culverts throughoutthe subbasin present barriersto juvenile access to rearingand refuge habitat.
Loss of connectivity tofloodplain and wetland habitatshas affected juvenile rearingand refuge habitat, particularlyin the lower subbasin.
Channels in the lower portions ofthe Molalla River, particularlynear the city of Molalla (RM 20),and some tributaries have beensimplified through revetmentsand other actions.
Revetments have simplifiedchannels throughout the lowerPudding River and tributaries asa result of rural residentialdevelopment and small-community build-out near thestream channels.
Limited wood in the tributariesand river channel has reducedthe frequency and depth ofpools, limiting juvenile rearingand refuge habitat.
Riparian areas along the riverand tributaries are reduced inwidth, connectivity, and quality,particularly in the lowersubbasin.
The loss of wetland, floodplain,and off-channel habitats hasaffected the quantity and qualityof juvenile rearing and refugeareas.
Introduced fishspecies (small- andlarge-mouth bass,for example) mayprey on juveniles.

DRAFT WILLAMETTE SUBBASIN PLAN
3-338 CH 3 ASSESSMENT.DOC
Table 3-129: Molalla/Pudding Subbasin: Subbasin Attributes Affecting Cutthroat Trout, Spring Chinook Salmon, and Winter Steelhead Life Stages
Species Life Stage Water Quality and Quantity Habitat ConnectivityAquatic and Riparian Habitat
Characteristics and Processes Other Impacts
WinterSteelheadTrout
Adult migrationand holding
Naturally low flows in the lower Pudding drainageare aggravated by water withdrawals, whichincrease water temperatures.
High water temperatures are aggravated by loss ofriparian cover, reduced wetland areas, channelsimplification, and increased impervious surfaces,particularly in the Pudding drainage.
Channelization of tributaries; modification of runoffpatterns as a result of agriculture, impervioussurfaces, and urban/residential development; andloss of storage capacity in floodplains andwetlands—particularly in the Pudding drainage—have accelerated runoff and increased peak flows.
Nutrient and toxic runoff from agricultural andurban areas is an issue in the Pudding drainage.
Loss of wetlands and floodplain habitats hasaffected water quality and quantity (storage andtiming of peak and low flows).
The fish ladder at Silverton’swater diversion on AbiquaCreek has an inadequateentrance and is a partial fishpassage barrier.
Numerous culverts throughoutthe subbasin present barriersto adult refuge habitat.
There are unscreeneddiversions on the mainstemMolalla River near ShadyCove.
Labish Ditch is an unscreeneddiversion that provides aninterbasin connection betweenClaggett Creek and the LittlePudding River.
Limited wood in the tributariesand river channel has reducedthe frequency and depth of poolsand limited adult hiding cover.Limited large wood in channelsis particularly pronounced in thelower subbasin.
Riparian areas along the riverand tributaries, especially in thelower subbasin, are reduced inwidth, connectivity, and quality.
There is some high-qualityfloodplain forest remaining alongthe lower Pudding River.
Reed canary grass andHimalayan blackberry in theaquatic and riparian area limitthe growth of robust nativevegetation needed for habitatand channel formationprocesses.
The loss of wetland, floodplain,and off-channel habitats hasaffected the quantity and qualityof adult holding areas.
Stocked summersteelhead interactwith native fish.
Adultspawning/eggincubation
Numerous culverts throughoutthe subbasin present barriersto spawning habitat.
Limited wood in tributarystreams has reduced retention ofspawning gravels.
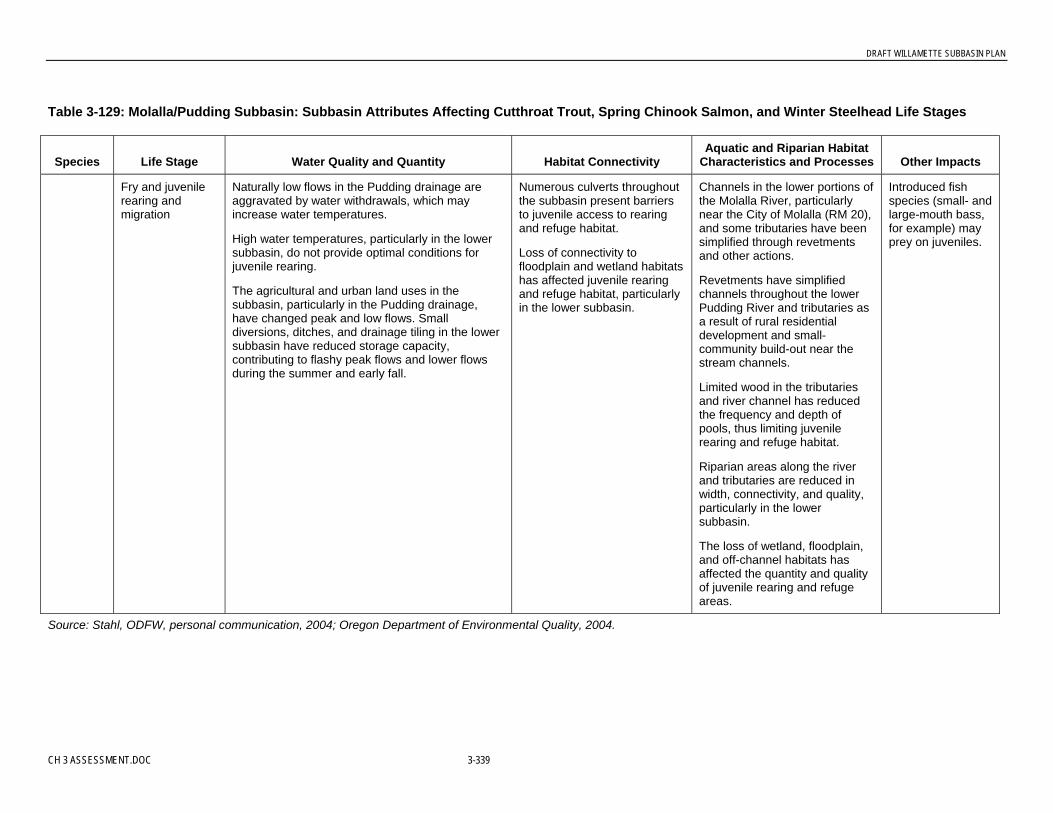
DRAFT WILLAMETTE SUBBASIN PLAN
CH 3 ASSESSMENT.DOC 3-339
Table 3-129: Molalla/Pudding Subbasin: Subbasin Attributes Affecting Cutthroat Trout, Spring Chinook Salmon, and Winter Steelhead Life Stages
Species Life Stage Water Quality and Quantity Habitat ConnectivityAquatic and Riparian Habitat
Characteristics and Processes Other Impacts
Fry and juvenilerearing andmigration
Naturally low flows in the Pudding drainage areaggravated by water withdrawals, which mayincrease water temperatures.
High water temperatures, particularly in the lowersubbasin, do not provide optimal conditions forjuvenile rearing.
The agricultural and urban land uses in thesubbasin, particularly in the Pudding drainage,have changed peak and low flows. Smalldiversions, ditches, and drainage tiling in the lowersubbasin have reduced storage capacity,contributing to flashy peak flows and lower flowsduring the summer and early fall.
Numerous culverts throughoutthe subbasin present barriersto juvenile access to rearingand refuge habitat.
Loss of connectivity tofloodplain and wetland habitatshas affected juvenile rearingand refuge habitat, particularlyin the lower subbasin.
Channels in the lower portions ofthe Molalla River, particularlynear the City of Molalla (RM 20),and some tributaries have beensimplified through revetmentsand other actions.
Revetments have simplifiedchannels throughout the lowerPudding River and tributaries asa result of rural residentialdevelopment and small-community build-out near thestream channels.
Limited wood in the tributariesand river channel has reducedthe frequency and depth ofpools, thus limiting juvenilerearing and refuge habitat.
Riparian areas along the riverand tributaries are reduced inwidth, connectivity, and quality,particularly in the lowersubbasin.
The loss of wetland, floodplain,and off-channel habitats hasaffected the quantity and qualityof juvenile rearing and refugeareas.
Introduced fishspecies (small- andlarge-mouth bass,for example) mayprey on juveniles.
Source: Stahl, ODFW, personal communication, 2004; Oregon Department of Environmental Quality, 2004.

DRAFT WILLAMETTE SUBBASIN PLAN
3-340 CH 3 ASSESSMENT.DOC
Water Quality Changes. Water quality has been modified throughout the subbasin,particularly in the Pudding River. The Pudding River’s low summertime flows contribute toconcentrating nonpoint-source runoff (toxics and nutrients) and aggravate naturally higherwater temperatures (Oregon Department of Environmental Quality, 2004). Watertemperatures exceed criteria throughout the Pudding drainage. Many of the tributaries,particularly in the lower subbasin, have elevated water temperatures (Oregon Department ofEnvironmental Quality, 2004). The Pudding River’s natural summertime low flows areaggravated by water withdrawals, which increase water temperatures. There are a number ofwater withdrawals in the subbasin, particularly in the Pudding drainage as a result ofagriculture and other land uses (Stahl, ODFW, personal communication, 2004). In general,water temperatures are lower in the forested portions of the upper subbasin tributaries (forexample, Butte, Silver, and Abiqua creeks) and the Molalla River. High water temperaturesin the lower subbasin are aggravated by loss of riparian cover, reduced wetland areas,channel simplification, and increased impervious surfaces.
Changes in Flow Regimes. Peak- and low-flow regimes have been modified, particularly inthe Pudding drainage. While the Silverton Reservoir, Silverton Creek, and other smallreservoirs in the subbasin do not exert strong controls on peak or low flows, changes in landuse have affected hydrologic regimes in the tributaries. Channelization of tributaries;modification of runoff patterns as a result of agriculture, impervious surfaces, andurban/residential development; and loss of storage capacity in floodplains and wetlands haveaccelerated runoff and increased peak flows (Stahl, ODFW, personal communication, 2004).There has been extensive loss of wetlands throughout the subbasin.
Fish Passage Barriers. Fish passage is restricted throughout the subbasin, in part by anumber of small dams on Butte, Abiqua, and Silver creeks. Many of these dams are ladderedfor fish passage, but the effectiveness of the fish ladders is unknown (Stahl, ODFW, personalcommunication, 2004). In addition, numerous culverts at road crossings throughout the lowerand upper subbasin block or limit fish passage (Stahl, ODFW, personal communication,2004). When fish passage above culverts is limited, the amount of habitat available forjuvenile spring Chinook rearing and all cutthroat trout life stages is restricted.
Appendix G shows specific fish passage barriers on the Mollala, based on May 2004 datafrom ODFW; the information was compiled from existing ODFW databases.
Habitat Connectivity. Backwater habitats, including pool margins, side channels, andalcoves, are reduced from historical levels. Actions to stabilize the lower river through theplacement of riprap along banks (and other actions) and limited large wood in the channelhave interacted to reduce the quantity and quality of backwater habitats. Large portions of thelower Pudding River and sections of tributary streams have confined channels as a result ofthe placement of riprap and actions that restrict channel movement (Stahl, ODFW, personalcommunication, 2004). Revetments, roads, and other structures constrain sections of thelower Molalla River. Backwater areas in the river and lower tributaries provide key habitatsfor adult and juvenile cutthroat trout and juvenile spring Chinook salmon. These habitatsprovide fish with habitat for foraging and refuge from winter flood events.
Key Factors Limiting Fish Populations. The upper and lower portions of theMolalla/Pudding Subbasin are characterized by different patterns of aquatic and riparianhabitat, hydrologic regimes, water quality characteristics, and fish species distributions. For

DRAFT WILLAMETTE SUBBASIN PLAN
CH 3 ASSESSMENT.DOC 3-341
this reason, factors limiting populations for the focal fish species are assessed separately forthe upper and lower subbasins.
Limiting Factors in the Lower Molalla/Pudding Subbasin. In the Lower Mollala/PuddingSubbasin, the productivity, capacity, and diversity of cutthroat trout, winter steelhead, andspring Chinook populations are limited by the following factors:
• Habitat Connectivity. Modification of the river’s high flow regime as a result of landuse changes, channel and bank confinement from riprap and other actions, and reducedlarge wood in the channels have interacted to reduce backwater habitats important forjuvenile rearing and winter refuge.
• Habitat Modification. Modifications in key aquatic habitats have affected all life stages.Limited spawning areas and reduced levels of gravels/small cobbles have reduced theareas available for spawning.
• Large Wood. Changes in the delivery and transport of large wood in the river andtributaries have modified gravel deposition patterns, reduced the frequency and depth ofpools, and minimized hiding cover for adult and juvenile fish.
• Water Temperature. Changes in high water temperature regimes can affect adultspawning success and limit the capacity of river and tributary streams to support juvenilefish. Water Withdrawals. Unscreened water withdrawals affect juvenile fish.
• Additional Factors: Other factors that are limiting cutthroat trout, spring Chinooksalmon, and winter steelhead populations include competition with hatchery andintroduced fish; lower numbers of salmon carcasses, which reduces nutrient inputs andthus affects food availability; and harassment of adult migrating and holding prespawningfish by recreational activities such as boating and fishing. All of these factors interactwith modified habitats and other impacts to the aquatic system to limit fish populations.
Table 3-130 shows the EDT attributes related to these limiting factors for cutthroat trout,spring Chinook salmon, and winter steelhead in the lower Molalla/Pudding Subbasin. Thearea in question includes portions of the Molalla drainage within the valley floor and theentire mainstem Pudding River and Valley tributaries—this is primarily in private ownership.The priorities for restoration are qualitative ratings based on the information in Table 3-129and professional opinions from individuals familiar with the subbasin, particularly ODFWbiologists.
Table 3-130: Qualitative Ratings of EDT Attributes for Winter Steelhead, Spring Chinook,and Cutthroat Trout in the Lower Molalla/Pudding Subbasin
EDT Attribute Class DescriptionPriority forRestoration
Channel stability Limited wood in channels and reduced riparianfunction have reduced channel stability.
HIGH
Flow There have been impacts to the interannual variabilityof low and high flows as a result of land use practicesand water diversions.
HIGH
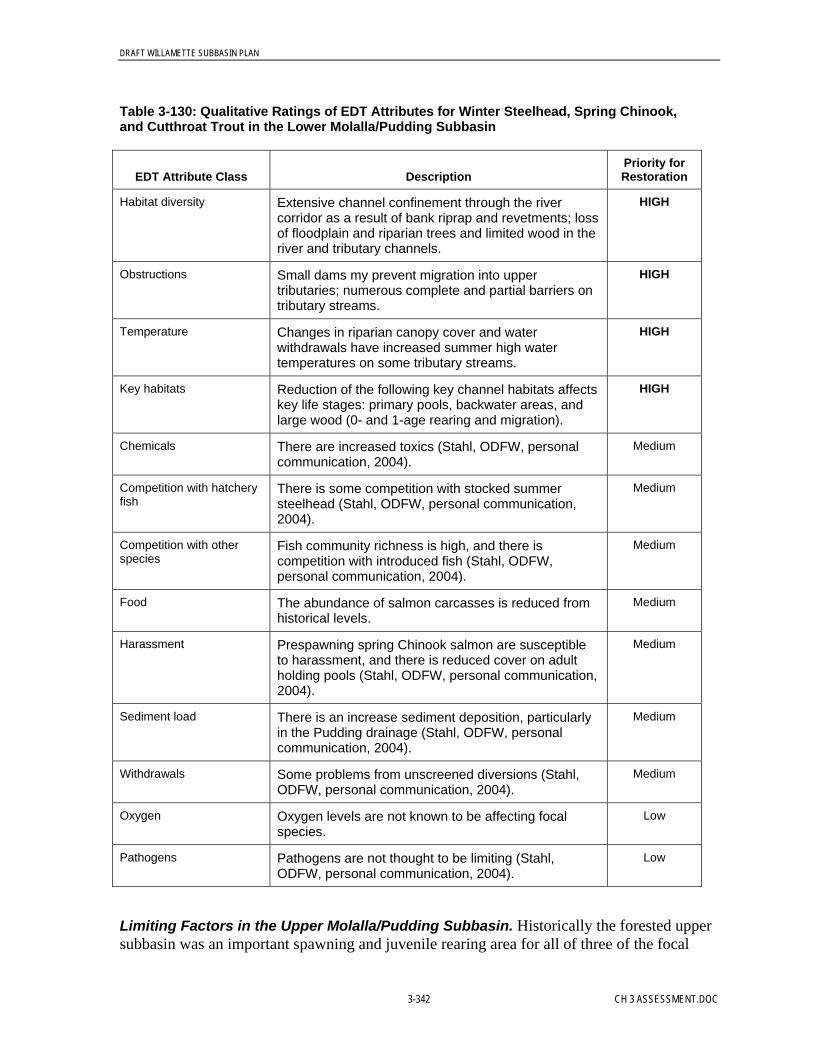
DRAFT WILLAMETTE SUBBASIN PLAN
3-342 CH 3 ASSESSMENT.DOC
Table 3-130: Qualitative Ratings of EDT Attributes for Winter Steelhead, Spring Chinook,and Cutthroat Trout in the Lower Molalla/Pudding Subbasin
EDT Attribute Class DescriptionPriority forRestoration
Habitat diversity Extensive channel confinement through the rivercorridor as a result of bank riprap and revetments; lossof floodplain and riparian trees and limited wood in theriver and tributary channels.
HIGH
Obstructions Small dams my prevent migration into uppertributaries; numerous complete and partial barriers ontributary streams.
HIGH
Temperature Changes in riparian canopy cover and waterwithdrawals have increased summer high watertemperatures on some tributary streams.
HIGH
Key habitats Reduction of the following key channel habitats affectskey life stages: primary pools, backwater areas, andlarge wood (0- and 1-age rearing and migration).
HIGH
Chemicals There are increased toxics (Stahl, ODFW, personalcommunication, 2004).
Medium
Competition with hatcheryfish
There is some competition with stocked summersteelhead (Stahl, ODFW, personal communication,2004).
Medium
Competition with otherspecies
Fish community richness is high, and there iscompetition with introduced fish (Stahl, ODFW,personal communication, 2004).
Medium
Food The abundance of salmon carcasses is reduced fromhistorical levels.
Medium
Harassment Prespawning spring Chinook salmon are susceptibleto harassment, and there is reduced cover on adultholding pools (Stahl, ODFW, personal communication,2004).
Medium
Sediment load There is an increase sediment deposition, particularlyin the Pudding drainage (Stahl, ODFW, personalcommunication, 2004).
Medium
Withdrawals Some problems from unscreened diversions (Stahl,ODFW, personal communication, 2004).
Medium
Oxygen Oxygen levels are not known to be affecting focalspecies.
Low
Pathogens Pathogens are not thought to be limiting (Stahl,ODFW, personal communication, 2004).
Low
Limiting Factors in the Upper Molalla/Pudding Subbasin. Historically the forested uppersubbasin was an important spawning and juvenile rearing area for all of three of the focal

DRAFT WILLAMETTE SUBBASIN PLAN
CH 3 ASSESSMENT.DOC 3-343
species. In contrast to the large-scale modification of the lower subbasin, most of the impactsto habitat and water quality in the upper subbasin, which is primarily forested, are localized.Currently, limiting factors for cutthroat, spring Chinook, and winter steelhead are as follows:
• Channel and Habitat Modification. Roads next to stream channels have increasedchannel confinement and reduced riparian vegetation and canopy cover, but not to theextent in the lower subbasin.
• Large Wood. There are systematic changes to the levels of large wood in the river andstream channels of the upper subbasin. Past management of riparian areas and streamcleaning practices have led reduced large wood loads in the aquatic system. Reduced in-channel wood has resulted in modified gravel deposition patterns, reduced the frequencyand depth of pools, and minimized hiding cover for adult and juvenile fish.
• Additional Factors. Other, more moderate limiting factors include partial and completebarriers to fish passage on tributary streams, changes in water temperature regimes as aresult of reduced canopy cover, competition with hatchery introductions, and lowernumbers of salmon carcasses, which reduces nutrient inputs and thus affects food.
Table 3-131 shows the EDT attributes related to limiting factors for spring Chinook, wintersteelhead, and cutthroat in the upper Molalla/Pudding Subbasin. This portion of the subbasinis predominately privately held land with forestry land uses, although BLM manages aportion of the upper Mollala River drainage. Again, the table present qualitative ratings basedon information in Table 3-129 and professional opinions from individuals familiar with thesubbasin, particularly ODFW biologists.
Table 3-131. Qualitative Ratings of EDT Attributes Related to Limiting Factors forCutthroat Trout, Winter Steelhead, and Spring Chinook in the Upper Molalla/PuddingSubbasin
EDT Attribute Class DescriptionPriority forRestoration
Habitat diversity Some channel confinement through the river corridor as aresult of revetments; loss of floodplain and riparian trees andlimited wood in the river and tributary channels.
HIGH
Obstructions Numerous complete and partial barriers on tributaries. HIGH
Key habitats Reduction of the following key channel habitats affects keylife stages: primary pools, backwater areas, and large wood(0- and 1-age rearing and migration).
HIGH
Channel stability Limited wood in channels and reduced riparian function haveaffected channel stability.
Medium
Competition with hatcheryfish
Competition with hatchery summer steelhead (Stahl, ODFW,personal communication, 2004).
Medium
Food Abundance of salmon carcasses is reduced from historicallevels.
Medium
Harassment Adult spring Chinook salmon hold in the river and are subjectto harassment; reduced hiding cover over holding pools(Stahl, ODFW, personal communication, 2004).
Medium

DRAFT WILLAMETTE SUBBASIN PLAN
3-344 CH 3 ASSESSMENT.DOC
Table 3-131. Qualitative Ratings of EDT Attributes Related to Limiting Factors forCutthroat Trout, Winter Steelhead, and Spring Chinook in the Upper Molalla/PuddingSubbasin
EDT Attribute Class DescriptionPriority forRestoration
Temperature Changes in riparian canopy cover have increased summerhigh water temperatures but not to the level of the lowersubbasin.
Medium
Chemicals Toxics are probably not an issue because of the limitedurban and agricultural land uses in the upper subbasin.
Low
Competition with otherspecies
There is some competition with introduced fish in the river,but competition in the tributaries is minimal (Stahl, ODFW,personal communication, 2004).
Low
Flow There is very little area in the upper subbasin in agriculturaland urban land uses that contribute to changes in flowregimes.
Low
Oxygen Oxygen levels are not known to be affecting focal species. Low
Pathogens Pathogens are not thought to be limiting (Stahl, ODFW,personal communication, 2004).
Low
Sediment load Although turbidity levels are periodically high, sedimentdeposition does not appear to be affecting spawning areas(Stahl, ODFW, personal communication, 2004).
Low
Withdrawals Limited impacts because most of the unscreened diversionsare in the lower subbasin.
Low
3.5.1.8 Limiting Factors in the North Santiam SubbasinThis section describes the North Santiam Subbasin in terms of geographic setting andenvironmental conditions and presents information on the limiting factors for focal species inthe subbasin: cutthroat trout, spring Chinook, winter steelhead, and Oregon chub.
Focal species present:• Cutthroat trout• Spring Chinook salmon• Winter steelhead trout• Oregon chub (lower subbasin only)
Focal species present historically:• Bull trout
Geographic Setting. The North Santiam Subbasin covers an area of approximately 730square miles on the western slope of the Cascade Mountains and the floor of the WillametteValley, including the small subbasin that drains to the 12-mile reach of the mainstemSantiam River. The North Santiam and mainstem Santiam rivers together are about 100 mileslong and enter the Willamette River at RM 108. Approximately 75 percent of the land in theNorth Santiam Subbasin is publicly owned and managed by federal or state agencies. TheWillamette National Forest manages most of the upper subbasin. The Salem District of the
DRAFT WILLAMETTE SUBBASIN PLAN
CH 3 ASSESSMENT.DOC 3-345
BLM manages a smaller proportion of the subbasin. The Oregon Department of Forestrymanages the 75-square-mile Santiam State Forest between Stayton and Detroit Dam. Theheadwaters of the North Santiam River originate in the Mount Jefferson Wilderness area ofthe Willamette National Forest.
The geology of the western Cascades characterizes the mountainous areas of the subbasin.This area has deeply weathered rocks; steep, highly dissected hill slopes; and significanterosion. Stream runoff patterns in the subbasin are dominated by the western Cascadegeology, with a rain-on-snow hydrology in the mid- to upper elevations and rain-dominatedflow patterns in the lower subbasin, which leads to rapid delivery of water to the streamnetwork. The High Cascades geology in the upper subbasin, which is characterized by deeplava flows and the Mount Jefferson volcano, contributes some spring-feed flows to thesystem, although not in sufficient volume to significantly influence downstream flow patternsor water temperature regimes.
Detroit and Big Cliff dams (RM 58) divide the subbasin, limiting upstream and downstreamfish passage and exerting strong control over downstream hydrologic regimes, temperaturepatterns, sediment and bedload transport, and large wood delivery to the lower reaches. TheBreitenbush River and Blowout Creek are major tributaries in the upper subbasin thatsupported anadromous fish populations. The upper North Santiam flows through a narrow,steep, forested canyon. Numerous ancient, deep-seated landslides have been mapped in theupper subbasin, and these features probably continue to contribute large amounts of sedimentto the North Santiam River (U.S. Army Corps of Engineers, 2001).
Downstream of Mehama (RM 37), the North Santiam River flows into the wide alluvialWillamette River Valley. The Little North Fork Santiam River is the major tributary in thelower subbasin. The lower 27 miles of the North Santiam is low gradient (less than 0.3percent) and flows through a relatively wide valley with an extensive floodplain. Below thispoint, the channel becomes sinuous; historically it was described by the U.S. Army Corps ofEngineers (1947) as “crooked and frequently divided by large islands.” More than 70 percentof land in the reach from Mehama to the mouth of the South Santiam River, including the 12-mile mainstem Santiam River, is used for agriculture. The remainder of the lower river valleyconsists of urban areas, coniferous forests, and mixed deciduous forests.
Environmental Conditions. Altered subbasin processes, modified riparian and aquatichabitat, and limited access to historical spawning and rearing areas in the North SantiamSubbasin have affected the productivity, capacity, and diversity of cutthroat trout, springChinook, and winter steelhead populations. Table 3-132 summarizes changes in thesubbasin’s environmental conditions and how these changes have affected cutthroat trout,spring Chinook salmon, and winter steelhead life stages.
Bull trout are no longer present in the North Santiam, although the USFWS recovery plancalls for reintroduction of bull trout as part of its draft recovery plan. Most of the sameenvironmental issues challenging cutthroat trout, spring Chinook, and winter steelhead alsoaffect bull trout (personal communication Greg Taylor, May 7, 2004). Because no bull troutpopulation currently exists, no specific environmental analysis is included in this subbasindescription.
DRAFT WILLAMETTE SUBBASIN PLAN
3-346 CH 3 ASSESSMENT.DOC
The amount and quality of habitat for Oregon chub in the North Santiam Subbasin has beenlimited by altered subbasin processes, modified riparian and aquatic habitat, and the presenceof exotic warm-water fish, and the Santiam River has been identified as a recovery subbasinin the Oregon chub Recovery Plan (U.S. Fish and Wildlife Service, 1998). Establishingsuccessful Oregon chub populations in the lower subbasin has been challenging becauseexotic fish species often have easy access to chub habitat in backwater sloughs and otherslow water habitats. Table 3-133 summarizes changes in the subbasin’s environmentalconditions and how these changes have affected Oregon chub life stages.
Dams. The U.S. Army Corps of Engineers dams have restricted fish access to the uppersubbasin and changed downstream hydrologic regimes, water quality, and processesinfluencing habitat formation. The dams block access to an estimated 71 percent of thehistorical production area for spring Chinook salmon, thus limiting access to historical wintersteelhead spawning and rearing areas and eliminating interchange between the upper andlower subbasin cutthroat trout populations (Oregon Department of Fish and Wildlife, 1992).Relative to the lower subbasin, the upper subbasin above the dams has aquatic habitat that iscloser to the historical baseline, with the highest proportion of functioning riparian areas, thelargest amounts of large wood in the river and tributary channels, and the highest qualityspawning areas. The dams have altered the links between the upper and lower subbasin,reducing the transport and delivery large wood and substrate to downstream reaches.Changes in the abundance and distribution of gravels, small cobbles, and large wood(particularly in large jams) have reduced suitable spawning areas and limited areas for adultcutthroat trout and juvenile rearing habitat for spring Chinook salmon and winter steelhead.
The dams also have changed flow regimes and water temperature patterns. Compared tohistorical conditions, water temperatures in the river below the dam are cooler in the summerand warmer in the fall and winter, which affects the upstream distribution of spring Chinooksalmon adults, alters the timing of spawning, and affects the period of egg incubation. Thechange in flow regimes also has altered the availability and quality of Oregon chub habitat inbackwater sloughs, floodplain ponds, and other slow-moving side channel habitat. Warmerwater temperatures encourage the persistence and dispersal of exotic predaceous fish species.

DRAFT WILLAMETTE SUBBASIN PLAN
CH 3 ASSESSMENT.DOC 3-347
Table 3-132: North Santiam Subbasin: Subbasin Attributes Affecting Cutthroat Trout, Spring Chinook Salmon, and Winter Steelhead Life Stages
Species Life Stage Water Quality and Quantity Habitat ConnectivityAquatic and Riparian Habitat
Characteristics and Processes Other Impacts
CutthroatTrout
Adult migrationand holding
Diversions (see habitat connectivity): Low summerflows in specific reaches may reduce adult passageto upstream spawning areas.
Maximum temperatures for adult migration havebeen exceeded in the mainstem Santiam River andin the North Santiam River up to RM 10.
Average daily temperatures of less than 52°Fduring May through late June delay the upstreammigration of adults.
Dissolved oxygen concentrations do not meetcriteria for salmonid spawning at RM 9.3 and RM11.2 in the mainstem Santiam River.
No criteria exceedences for toxics, nutrients, orturbidity.
Complete barriers to adultmovement: Detroit and Big Cliffdams (RM 58.1) and MintoDam (RM 60.9).
Partial barriers to adultmovement: upper BennettDam (RM 31.5) and lowerBennet Dam (RM 29).
Unscreened diversions (partialbarriers): SWCD power andirrigation canals and Salemditch; Sidney ditch (RM8).
Numerous partial andcomplete fish passage barriersat culverts on tributary streamsmay limit adult upstreammovement into foraging andrefuge habitat.
The lower subbasin containsonly 25 percent of the originalextent of floodplain forest; manyremaining patches of floodplainforest are interspersed withareas with little floodplainvegetation.
Reduced pool frequency, depth,and cover have affected thequality of adult habitat in theriver and tributaries.
Limited wood in the river andtributaries has affected thequality of pools and backwaterhabitats.
Moderate channel confinementin the upper subbasin throughthe river corridor as a result ofbank riprap along the highwayand secondary roads.

DRAFT WILLAMETTE SUBBASIN PLAN
3-348 CH 3 ASSESSMENT.DOC
Table 3-132: North Santiam Subbasin: Subbasin Attributes Affecting Cutthroat Trout, Spring Chinook Salmon, and Winter Steelhead Life Stages
Species Life Stage Water Quality and Quantity Habitat ConnectivityAquatic and Riparian Habitat
Characteristics and Processes Other Impacts
Adult spawning/egg incubation
Detroit and Big Cliff dams: Increased fall flows mayallow spawning in areas that will be dewateredduring active flood control operations.
Indirect evidence suggests that warmer falltemperatures resulting from dam regulation haveshortened the incubation and emergence timing ofChinook salmon fry.
Maximum temperatures for incubation emergencehave been exceeded in the lower North SantiamRiver and in the Santiam River.
Numerous partial andcomplete fish passage barriersat culverts on tributary streamslimit adult upstream movementinto spawning habitat.
Dams reduce channel substratemovement: cobble and boulderbars have replaced many of thesand and gravel bars, andnumerous areas of the riverhave been scoured down tobedrock with scattered boulders,thus reducing spawning areasand gravels.
Limited in-channel wood tocapture spawning gravels.
Removal of gravel fromfloodplain gravel mining reducesavailability of substrate for in-channel habitat.
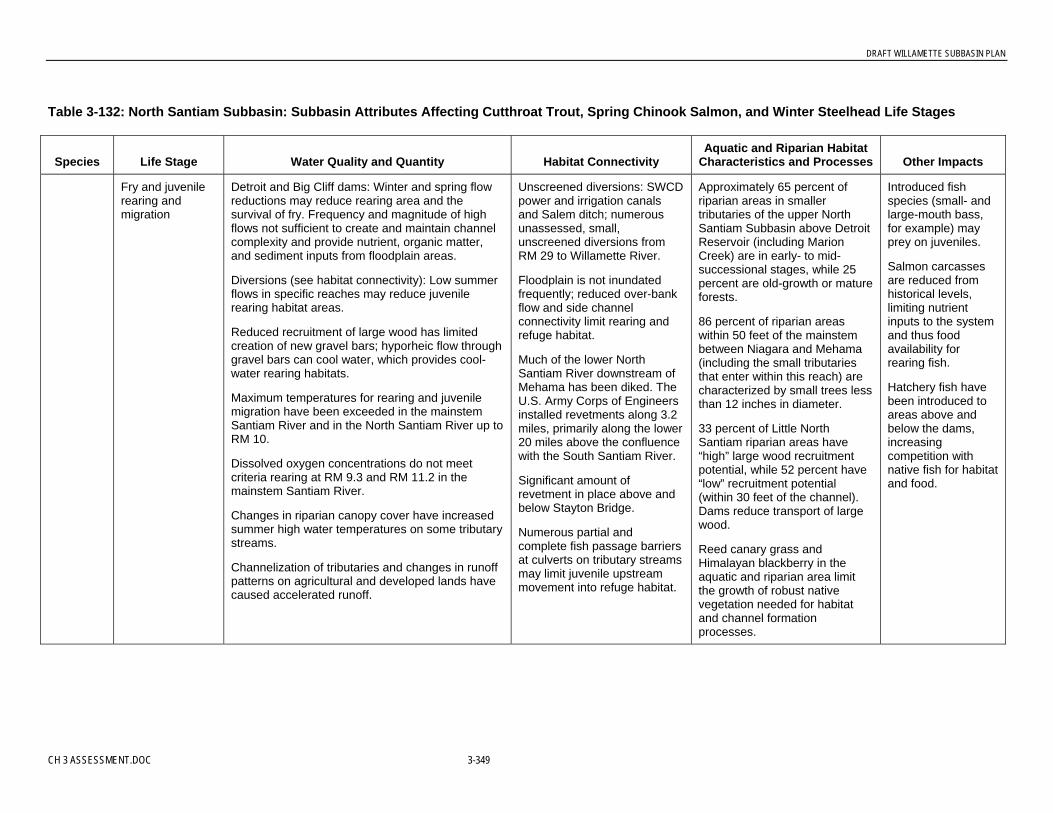
DRAFT WILLAMETTE SUBBASIN PLAN
CH 3 ASSESSMENT.DOC 3-349
Table 3-132: North Santiam Subbasin: Subbasin Attributes Affecting Cutthroat Trout, Spring Chinook Salmon, and Winter Steelhead Life Stages
Species Life Stage Water Quality and Quantity Habitat ConnectivityAquatic and Riparian Habitat
Characteristics and Processes Other Impacts
Fry and juvenilerearing andmigration
Detroit and Big Cliff dams: Winter and spring flowreductions may reduce rearing area and thesurvival of fry. Frequency and magnitude of highflows not sufficient to create and maintain channelcomplexity and provide nutrient, organic matter,and sediment inputs from floodplain areas.
Diversions (see habitat connectivity): Low summerflows in specific reaches may reduce juvenilerearing habitat areas.
Reduced recruitment of large wood has limitedcreation of new gravel bars; hyporheic flow throughgravel bars can cool water, which provides cool-water rearing habitats.
Maximum temperatures for rearing and juvenilemigration have been exceeded in the mainstemSantiam River and in the North Santiam River up toRM 10.
Dissolved oxygen concentrations do not meetcriteria rearing at RM 9.3 and RM 11.2 in themainstem Santiam River.
Changes in riparian canopy cover have increasedsummer high water temperatures on some tributarystreams.
Channelization of tributaries and changes in runoffpatterns on agricultural and developed lands havecaused accelerated runoff.
Unscreened diversions: SWCDpower and irrigation canalsand Salem ditch; numerousunassessed, small,unscreened diversions fromRM 29 to Willamette River.
Floodplain is not inundatedfrequently; reduced over-bankflow and side channelconnectivity limit rearing andrefuge habitat.
Much of the lower NorthSantiam River downstream ofMehama has been diked. TheU.S. Army Corps of Engineersinstalled revetments along 3.2miles, primarily along the lower20 miles above the confluencewith the South Santiam River.
Significant amount ofrevetment in place above andbelow Stayton Bridge.
Numerous partial andcomplete fish passage barriersat culverts on tributary streamsmay limit juvenile upstreammovement into refuge habitat.
Approximately 65 percent ofriparian areas in smallertributaries of the upper NorthSantiam Subbasin above DetroitReservoir (including MarionCreek) are in early- to mid-successional stages, while 25percent are old-growth or matureforests.
86 percent of riparian areaswithin 50 feet of the mainstembetween Niagara and Mehama(including the small tributariesthat enter within this reach) arecharacterized by small trees lessthan 12 inches in diameter.
33 percent of Little NorthSantiam riparian areas have“high” large wood recruitmentpotential, while 52 percent have“low” recruitment potential(within 30 feet of the channel).Dams reduce transport of largewood.
Reed canary grass andHimalayan blackberry in theaquatic and riparian area limitthe growth of robust nativevegetation needed for habitatand channel formationprocesses.
Introduced fishspecies (small- andlarge-mouth bass,for example) mayprey on juveniles.
Salmon carcassesare reduced fromhistorical levels,limiting nutrientinputs to the systemand thus foodavailability forrearing fish.
Hatchery fish havebeen introduced toareas above andbelow the dams,increasingcompetition withnative fish for habitatand food.

DRAFT WILLAMETTE SUBBASIN PLAN
3-350 CH 3 ASSESSMENT.DOC
Table 3-132: North Santiam Subbasin: Subbasin Attributes Affecting Cutthroat Trout, Spring Chinook Salmon, and Winter Steelhead Life Stages
Species Life Stage Water Quality and Quantity Habitat ConnectivityAquatic and Riparian Habitat
Characteristics and Processes Other Impacts
Reaches of the North SantiamRiver below Detroit and Big Cliffdams have limited large wood,thus reducing the formation ofpools and side channels.
There has been significant lossof wetland, floodplain, and off-channel habitats and associatedhabitat complexity, reducinghabitat quality.
SpringChinookSalmon
Adult migrationand holding
Diversions (see habitat connectivity): Low summerflows in specific reaches may reduce adult passageto upstream spawning areas.
Compared to historical conditions, cooler summermainstem temperatures and warmer falltemperatures below the dams disrupt normalmigration and spawning behaviors.
Maximum temperatures for adult migration havebeen exceeded in the mainstem Santiam River andin the North Santiam River up to RM 10.
Average daily temperatures of less than 52°Fduring May through late June delay the upstreammigration of adults.
Dissolved oxygen concentrations do not meetcriteria for salmonid spawning at RM 9.3 and RM11.2 in the mainstem Santiam River.
No criteria exceedences for toxics, nutrients, orturbidity.
Complete barriers to adultmovement: Detroit and Big Cliffdams (RM 58.1) and MintoDam (RM 60.9).
Dams block access to anestimated 71 percent of thehistorical habitat.
Partial barriers to adultmovement: upper BennettDam (RM 31.5) and lowerBennet Dam (RM 29).
Unscreened diversions (partialbarriers): SWCD power andirrigation canals and Salemditch; Sidney ditch (RM 8).
The lower subbasin containsonly 25 percent of original extentof floodplain forest; manyremaining patches of floodplainforest are interspersed withareas with little floodplainvegetation.
Moderate channel confinementin the upper subbasin throughthe river corridor as a result ofbank riprap along the highwayand secondary roads.
Extensiverecreational use ofthe lower river(boating and fishing)harasses migratingand holding fish.
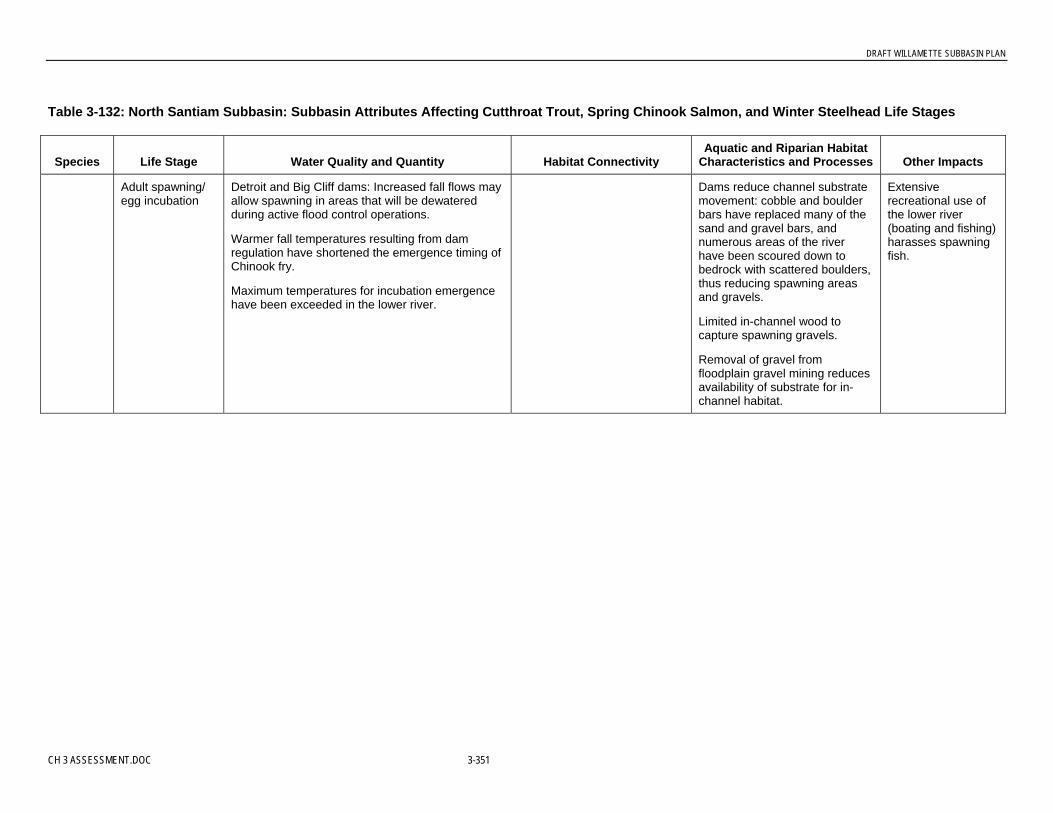
DRAFT WILLAMETTE SUBBASIN PLAN
CH 3 ASSESSMENT.DOC 3-351
Table 3-132: North Santiam Subbasin: Subbasin Attributes Affecting Cutthroat Trout, Spring Chinook Salmon, and Winter Steelhead Life Stages
Species Life Stage Water Quality and Quantity Habitat ConnectivityAquatic and Riparian Habitat
Characteristics and Processes Other Impacts
Adult spawning/egg incubation
Detroit and Big Cliff dams: Increased fall flows mayallow spawning in areas that will be dewateredduring active flood control operations.
Warmer fall temperatures resulting from damregulation have shortened the emergence timing ofChinook fry.
Maximum temperatures for incubation emergencehave been exceeded in the lower river.
Dams reduce channel substratemovement: cobble and boulderbars have replaced many of thesand and gravel bars, andnumerous areas of the riverhave been scoured down tobedrock with scattered boulders,thus reducing spawning areasand gravels.
Limited in-channel wood tocapture spawning gravels.
Removal of gravel fromfloodplain gravel mining reducesavailability of substrate for in-channel habitat.
Extensiverecreational use ofthe lower river(boating and fishing)harasses spawningfish.

DRAFT WILLAMETTE SUBBASIN PLAN
3-352 CH 3 ASSESSMENT.DOC
Table 3-132: North Santiam Subbasin: Subbasin Attributes Affecting Cutthroat Trout, Spring Chinook Salmon, and Winter Steelhead Life Stages
Species Life Stage Water Quality and Quantity Habitat ConnectivityAquatic and Riparian Habitat
Characteristics and Processes Other Impacts
Fry and juvenilerearing andmigration
Detroit and Big Cliff dams: Winter and spring flowreductions may reduce rearing area and thesurvival of fry. Frequency and magnitude of highflows not sufficient to create and maintain channelcomplexity and provide nutrient, organic matter,and sediment inputs from floodplain areas.
Diversions (see habitat connectivity): Low summerflows in specific reaches may reduce juvenilerearing habitat areas.
Reduced recruitment of large wood has limitedcreation of new gravel bars; hyporheic flow throughgravel bars can cool water, which provides cool-water rearing habitats.
Maximum temperatures for rearing and juvenilemigration have been exceeded in the mainstemSantiam River and in the North Santiam River up toRM 10.
Dissolved oxygen concentrations do not meetcriteria rearing at RM 9.3 and RM 11.2 in themainstem Santiam River.
Changes in riparian canopy cover have increasedsummer high water temperatures on some tributarystreams.
Channelization of tributaries and changes onagricultural and developed lands have causedaccelerated runoff.
Detroit Dam and Cliff Damjuvenile downstream passage(combined survival rates): 35percent to 42 percent. Moremonitoring is needed.
Unscreened diversions: SWCDpower and irrigation canalsand Salem ditch; numerousunassessed, small,unscreened diversions fromRM 29 to Willamette River.
Floodplain is not inundatedfrequently; reduced over-bankflow and side channelconnectivity limit rearing andrefuge habitat.
Much of the lower NorthSantiam River downstream ofMehama has been diked. TheU.S. Army Corps of Engineersinstalled revetments along 3.2miles, primarily along the lower20 miles above the confluencewith the South Santiam River.
Significant amount ofrevetment in place above andbelow Stayton Bridge.
Numerous partial andcomplete fish passage barriersat culverts on tributary streamsmay limit juvenile upstreammovement into refuge habitat.
Approximately 65 percent ofriparian areas in smallertributaries of the upper NorthSantiam Subbasin above DetroitReservoir (including MarionCreek) are in early- to mid-successional stages, while 25percent are old-growth or matureforests.
86 percent of riparian areaswithin 50 feet of the mainstembetween Niagara and Mehama(including the small tributariesthat enter within this reach) arecharacterized by small trees lessthan 12 inches in diameter.
33 percent of Little NorthSantiam riparian areas have“high” large wood recruitmentpotential, while 52 percent have“low” recruitment potential(within 30 feet of the channel).Dams reduce transport of largewood.
Reed canary grass andHimalayan blackberry in theaquatic and riparian area limitthe growth of robust nativevegetation needed for habitatand channel formationprocesses.
Reaches of the North SantiamRiver below Detroit and Big Cliffdams have limited large wood,thus reducing the formation ofpools and side channels.
Introduced fishspecies (small- andlarge-mouth bass,for example) mayprey on juveniles.
Salmon carcassesare reduced fromhistorical levels,limiting nutrientinputs to the systemand thus foodavailability forrearing fish.
Hatchery fish havebeen introduced toareas above andbelow the dams,increasingcompetition withnative fish for habitatand food.
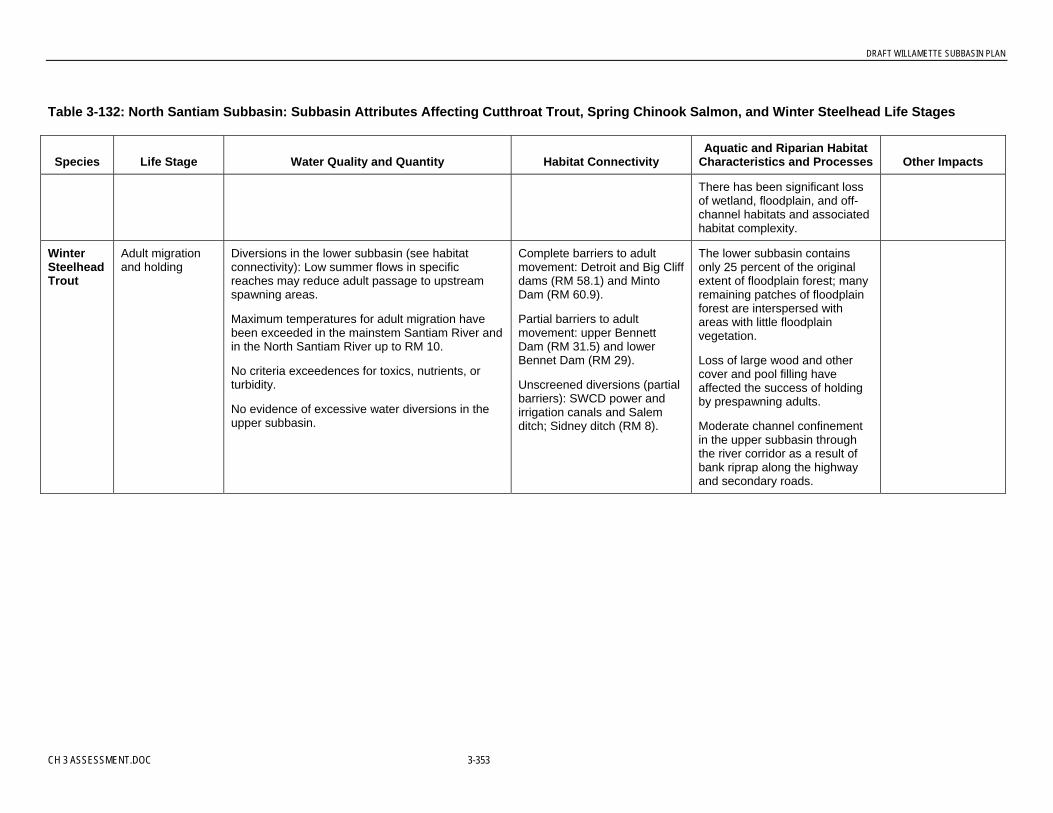
DRAFT WILLAMETTE SUBBASIN PLAN
CH 3 ASSESSMENT.DOC 3-353
Table 3-132: North Santiam Subbasin: Subbasin Attributes Affecting Cutthroat Trout, Spring Chinook Salmon, and Winter Steelhead Life Stages
Species Life Stage Water Quality and Quantity Habitat ConnectivityAquatic and Riparian Habitat
Characteristics and Processes Other Impacts
There has been significant lossof wetland, floodplain, and off-channel habitats and associatedhabitat complexity.
WinterSteelheadTrout
Adult migrationand holding
Diversions in the lower subbasin (see habitatconnectivity): Low summer flows in specificreaches may reduce adult passage to upstreamspawning areas.
Maximum temperatures for adult migration havebeen exceeded in the mainstem Santiam River andin the North Santiam River up to RM 10.
No criteria exceedences for toxics, nutrients, orturbidity.
No evidence of excessive water diversions in theupper subbasin.
Complete barriers to adultmovement: Detroit and Big Cliffdams (RM 58.1) and MintoDam (RM 60.9).
Partial barriers to adultmovement: upper BennettDam (RM 31.5) and lowerBennet Dam (RM 29).
Unscreened diversions (partialbarriers): SWCD power andirrigation canals and Salemditch; Sidney ditch (RM 8).
The lower subbasin containsonly 25 percent of the originalextent of floodplain forest; manyremaining patches of floodplainforest are interspersed withareas with little floodplainvegetation.
Loss of large wood and othercover and pool filling haveaffected the success of holdingby prespawning adults.
Moderate channel confinementin the upper subbasin throughthe river corridor as a result ofbank riprap along the highwayand secondary roads.
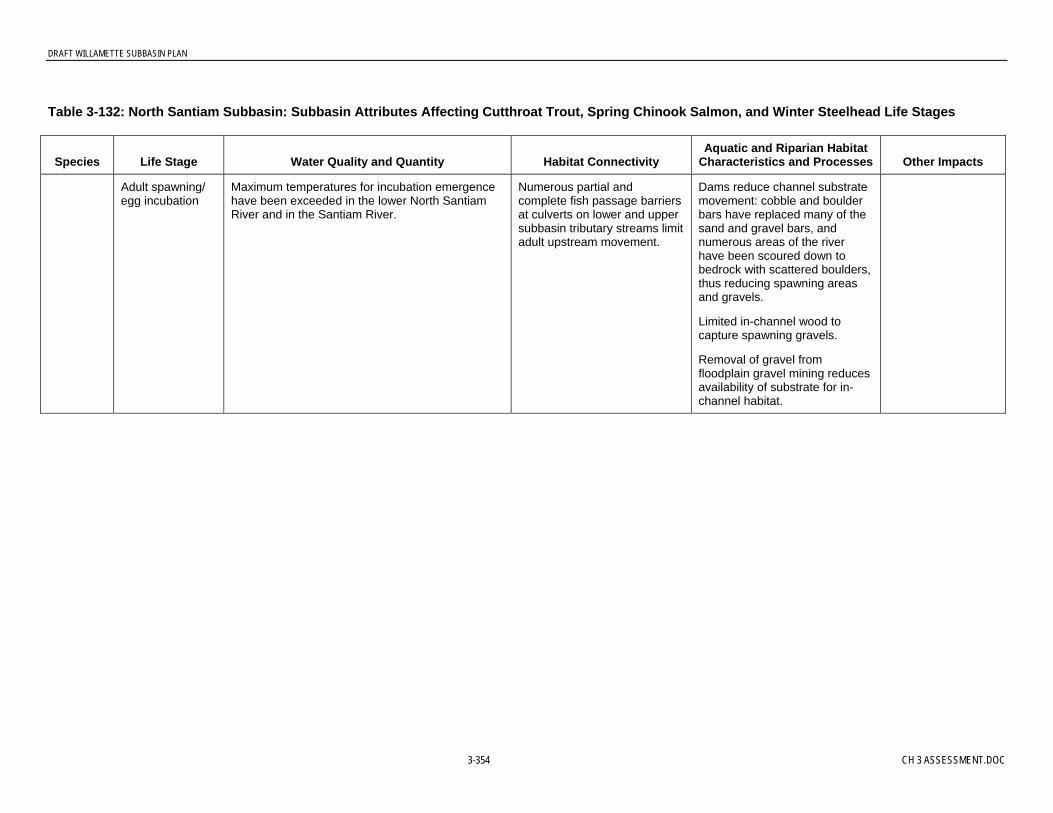
DRAFT WILLAMETTE SUBBASIN PLAN
3-354 CH 3 ASSESSMENT.DOC
Table 3-132: North Santiam Subbasin: Subbasin Attributes Affecting Cutthroat Trout, Spring Chinook Salmon, and Winter Steelhead Life Stages
Species Life Stage Water Quality and Quantity Habitat ConnectivityAquatic and Riparian Habitat
Characteristics and Processes Other Impacts
Adult spawning/egg incubation
Maximum temperatures for incubation emergencehave been exceeded in the lower North SantiamRiver and in the Santiam River.
Numerous partial andcomplete fish passage barriersat culverts on lower and uppersubbasin tributary streams limitadult upstream movement.
Dams reduce channel substratemovement: cobble and boulderbars have replaced many of thesand and gravel bars, andnumerous areas of the riverhave been scoured down tobedrock with scattered boulders,thus reducing spawning areasand gravels.
Limited in-channel wood tocapture spawning gravels.
Removal of gravel fromfloodplain gravel mining reducesavailability of substrate for in-channel habitat.

DRAFT WILLAMETTE SUBBASIN PLAN
CH 3 ASSESSMENT.DOC 3-355
Table 3-132: North Santiam Subbasin: Subbasin Attributes Affecting Cutthroat Trout, Spring Chinook Salmon, and Winter Steelhead Life Stages
Species Life Stage Water Quality and Quantity Habitat ConnectivityAquatic and Riparian Habitat
Characteristics and Processes Other Impacts
Fry and juvenilerearing andmigration
Detroit and Big Cliff dams: Winter and spring flowreductions may reduce rearing area and thesurvival of fry. Frequency and magnitude of highflows not sufficient to create and maintain channelcomplexity and provide nutrient, organic matter,and sediment inputs from floodplain areas.
Diversions (see habitat connectivity): Low summerflows in specific reaches may reduce juvenilerearing habitat areas.
Reduced recruitment of large wood has limitedcreation of new gravel bars; hyporheic flow throughgravel bars can cool water, which provides cool-water rearing habitats.
Maximum temperatures for rearing and juvenilemigration have been exceeded in the mainstemSantiam River and in the North Santiam River up toRM 10.
Dissolved oxygen concentrations do not meetcriteria rearing at RM 9.3 and RM 11.2 in themainstem Santiam River.
Changes in riparian canopy cover have increasedsummer high water temperatures on some tributarystreams.
Detroit Dam and Cliff Damjuvenile downstream passage(combined survival rates): 35percent to 42 percent.
Unscreened diversions: SWCDpower and irrigation canalsand Salem ditch; numerousunassessed, small,unscreened diversions fromRM 29 to Willamette River.
Floodplain is not inundatedfrequently; reduced over-bankflow and side channelconnectivity limit rearing andrefuge habitat.
Much of the lower NorthSantiam River downstream ofMehama has been diked. TheU.S. Army Corps of Engineersinstalled revetments along 3.2miles, primarily along the lower20 miles above the confluencewith the South Santiam River.
Numerous partial andcomplete fish passage barriersat culverts on upper and lowersubbasin tributary streams limitjuvenile upstream movementinto rearing and refuge habitat.
Large wood is lacking in mostsmall tributaries in the lowersubbasin; few meet the ODFWbenchmarks, limiting juvenilerearing and refuge habitat.
Approximately 65 percent ofriparian areas in smallertributaries of the upper NorthSantiam Subbasin above DetroitReservoir (including MarionCreek) are in early- to mid-successional stages, while 25percent are old-growth or matureforests.
86 percent of riparian areaswithin 50 feet of the mainstembetween Niagara and Mehama(including the small tributariesthat enter within this reach) arecharacterized by small trees lessthan 12 inches in diameter.
33 percent of Little NorthSantiam riparian areas have“high” large wood recruitmentpotential, while 52 percent have“low” recruitment potential(within 30 feet of the channel).Dams reduce transport of largewood.
Introduced fishspecies (small- andlarge-mouth bass,for example) mayprey on juveniles.
Salmon carcassesare reduced fromhistorical levels,limiting nutrientinputs to the systemand thus foodavailability forrearing fish.
Hatchery fish havebeen introduced toareas above andbelow the dams,increasingcompetition withnative fish for habitatand food.
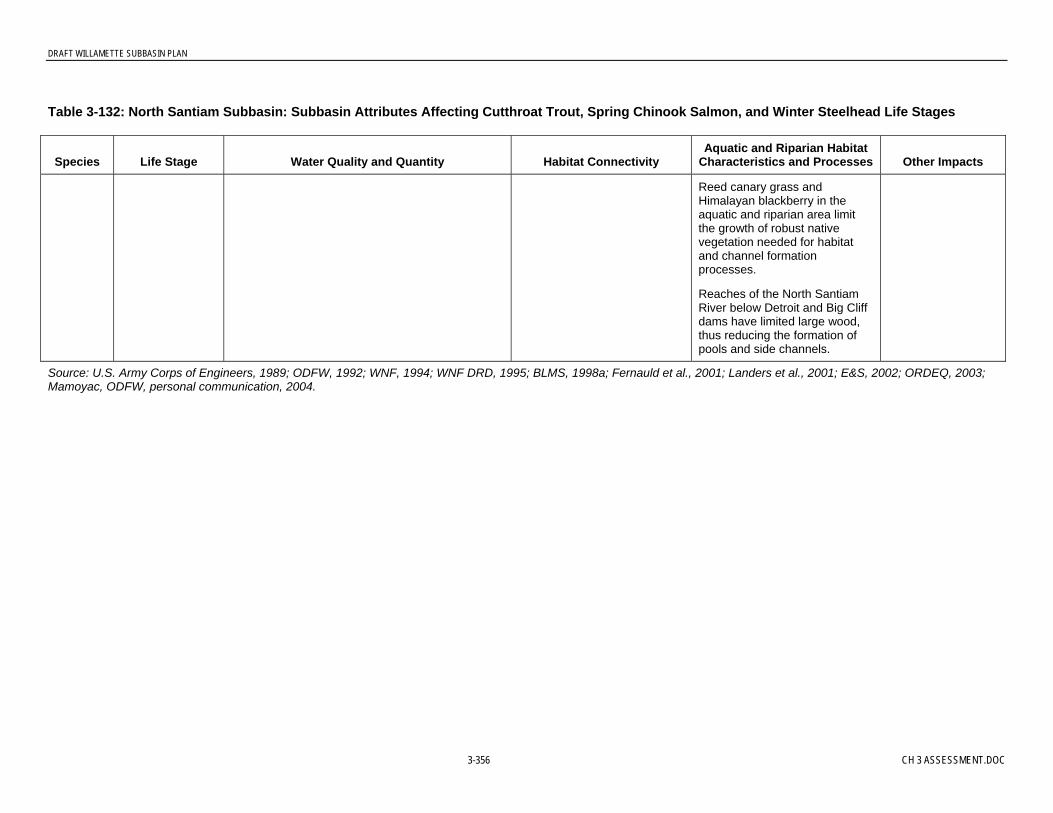
DRAFT WILLAMETTE SUBBASIN PLAN
3-356 CH 3 ASSESSMENT.DOC
Table 3-132: North Santiam Subbasin: Subbasin Attributes Affecting Cutthroat Trout, Spring Chinook Salmon, and Winter Steelhead Life Stages
Species Life Stage Water Quality and Quantity Habitat ConnectivityAquatic and Riparian Habitat
Characteristics and Processes Other Impacts
Reed canary grass andHimalayan blackberry in theaquatic and riparian area limitthe growth of robust nativevegetation needed for habitatand channel formationprocesses.
Reaches of the North SantiamRiver below Detroit and Big Cliffdams have limited large wood,thus reducing the formation ofpools and side channels.
Source: U.S. Army Corps of Engineers, 1989; ODFW, 1992; WNF, 1994; WNF DRD, 1995; BLMS, 1998a; Fernauld et al., 2001; Landers et al., 2001; E&S, 2002; ORDEQ, 2003;Mamoyac, ODFW, personal communication, 2004.

DRAFT WILLAMETTE SUBBASIN PLAN
CH 3 ASSESSMENT.DOC 3-357
Table 3-133: North Santiam Subbasin: Subbasin Attributes Affecting Oregon Chub
Species Life Stage Water Quality and Quantity Habitat ConnectivityAquatic and Riparian Habitat
Characteristics and Processes Other Impacts
Oregonchub
All Frequency and magnitude of high flows notsufficient to create and maintain channelcomplexity and provide nutrient, organic matter,and sediment inputs from floodplain areas.
A SWCD fish screen andwater diversion project inStayton in 2003 removed abackwater slough areapreviously used by Oregonchub.
The lower Santiam Subbasintends to interact with itsfloodplain relatively frequentlycompared to other basins thatcontain Oregon chubpopulations (the major damsare farther up the basincompared to other systems).While this is a benefit for thedispersal of Oregon chub andcolonization of new habitat, italso allows nonnativepredaceous fish to accessOregon chub habitats. Somesites in the Santiam, such asthe I-5 backwaters, havemanaged to maintain Oregonchub despite the presence ofexotics; however, exoticsremain a significant threat tothe long-term persistence ofOregon chub at these sites.
The lower subbasin containsonly 25 percent of original extentof floodplain forest; manyremaining patches of floodplainforest are interspersed withareas that have little floodplainvegetation.
Reed canary grass andHimalayan blackberry in theaquatic and riparian area limitthe growth of robust nativevegetation needed for habitatand channel formationprocesses.
There has been significant lossof wetland, floodplain, and off-channel habitats and associatedhabitat complexity, thus reducinghabitat quality.
Exotic warm-waterpredaceous fish area significant threat toOregon chubsurvival. Severalsites formerlyoccupied by Oregonchub have beenreduced tounsustainable levelsor eliminatedcompletely by exoticpredators (SantiamConservationEasement, GerenIsland North,Green’s Bridge, andStayton PublicWorks Pond).
Source: USFWS, 1998; ODFW, 2004.
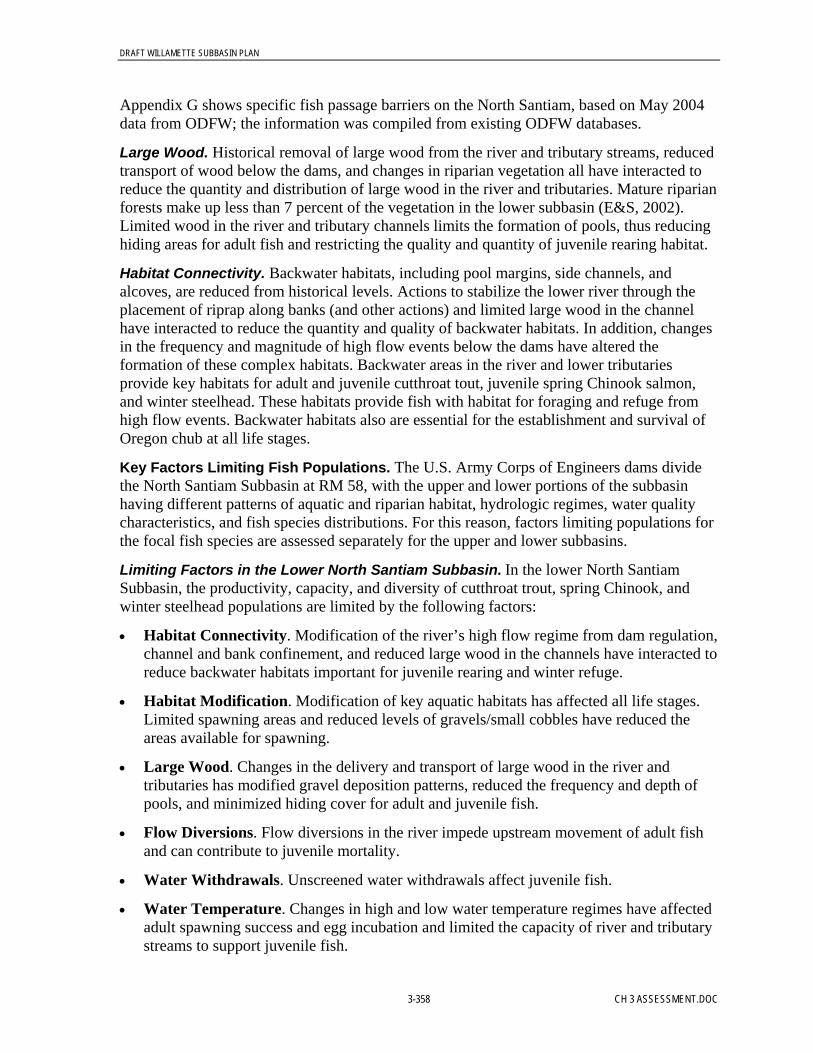
DRAFT WILLAMETTE SUBBASIN PLAN
3-358 CH 3 ASSESSMENT.DOC
Appendix G shows specific fish passage barriers on the North Santiam, based on May 2004data from ODFW; the information was compiled from existing ODFW databases.
Large Wood. Historical removal of large wood from the river and tributary streams, reducedtransport of wood below the dams, and changes in riparian vegetation all have interacted toreduce the quantity and distribution of large wood in the river and tributaries. Mature riparianforests make up less than 7 percent of the vegetation in the lower subbasin (E&S, 2002).Limited wood in the river and tributary channels limits the formation of pools, thus reducinghiding areas for adult fish and restricting the quality and quantity of juvenile rearing habitat.
Habitat Connectivity. Backwater habitats, including pool margins, side channels, andalcoves, are reduced from historical levels. Actions to stabilize the lower river through theplacement of riprap along banks (and other actions) and limited large wood in the channelhave interacted to reduce the quantity and quality of backwater habitats. In addition, changesin the frequency and magnitude of high flow events below the dams have altered theformation of these complex habitats. Backwater areas in the river and lower tributariesprovide key habitats for adult and juvenile cutthroat tout, juvenile spring Chinook salmon,and winter steelhead. These habitats provide fish with habitat for foraging and refuge fromhigh flow events. Backwater habitats also are essential for the establishment and survival ofOregon chub at all life stages.
Key Factors Limiting Fish Populations. The U.S. Army Corps of Engineers dams dividethe North Santiam Subbasin at RM 58, with the upper and lower portions of the subbasinhaving different patterns of aquatic and riparian habitat, hydrologic regimes, water qualitycharacteristics, and fish species distributions. For this reason, factors limiting populations forthe focal fish species are assessed separately for the upper and lower subbasins.
Limiting Factors in the Lower North Santiam Subbasin. In the lower North SantiamSubbasin, the productivity, capacity, and diversity of cutthroat trout, spring Chinook, andwinter steelhead populations are limited by the following factors:
• Habitat Connectivity. Modification of the river’s high flow regime from dam regulation,channel and bank confinement, and reduced large wood in the channels have interacted toreduce backwater habitats important for juvenile rearing and winter refuge.
• Habitat Modification. Modification of key aquatic habitats has affected all life stages.Limited spawning areas and reduced levels of gravels/small cobbles have reduced theareas available for spawning.
• Large Wood. Changes in the delivery and transport of large wood in the river andtributaries has modified gravel deposition patterns, reduced the frequency and depth ofpools, and minimized hiding cover for adult and juvenile fish.
• Flow Diversions. Flow diversions in the river impede upstream movement of adult fishand can contribute to juvenile mortality.
• Water Withdrawals. Unscreened water withdrawals affect juvenile fish.
• Water Temperature. Changes in high and low water temperature regimes have affectedadult spawning success and egg incubation and limited the capacity of river and tributarystreams to support juvenile fish.
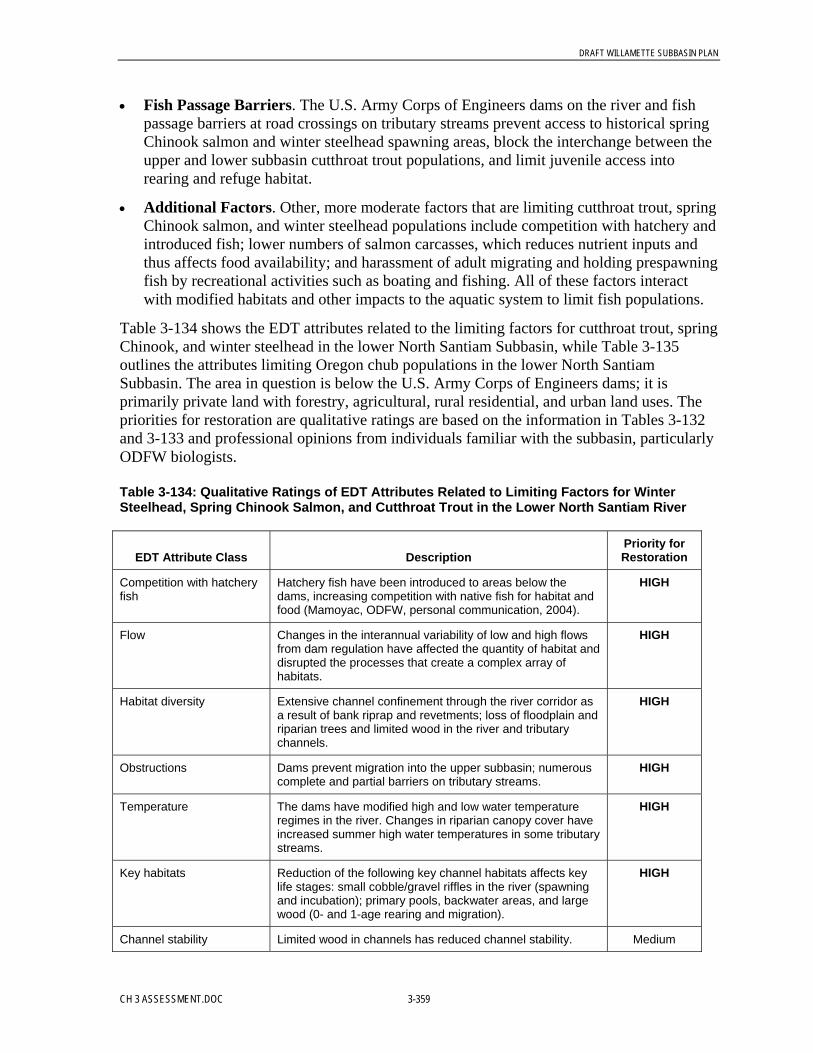
DRAFT WILLAMETTE SUBBASIN PLAN
CH 3 ASSESSMENT.DOC 3-359
• Fish Passage Barriers. The U.S. Army Corps of Engineers dams on the river and fishpassage barriers at road crossings on tributary streams prevent access to historical springChinook salmon and winter steelhead spawning areas, block the interchange between theupper and lower subbasin cutthroat trout populations, and limit juvenile access intorearing and refuge habitat.
• Additional Factors. Other, more moderate factors that are limiting cutthroat trout, springChinook salmon, and winter steelhead populations include competition with hatchery andintroduced fish; lower numbers of salmon carcasses, which reduces nutrient inputs andthus affects food availability; and harassment of adult migrating and holding prespawningfish by recreational activities such as boating and fishing. All of these factors interactwith modified habitats and other impacts to the aquatic system to limit fish populations.
Table 3-134 shows the EDT attributes related to the limiting factors for cutthroat trout, springChinook, and winter steelhead in the lower North Santiam Subbasin, while Table 3-135outlines the attributes limiting Oregon chub populations in the lower North SantiamSubbasin. The area in question is below the U.S. Army Corps of Engineers dams; it isprimarily private land with forestry, agricultural, rural residential, and urban land uses. Thepriorities for restoration are qualitative ratings are based on the information in Tables 3-132and 3-133 and professional opinions from individuals familiar with the subbasin, particularlyODFW biologists.
Table 3-134: Qualitative Ratings of EDT Attributes Related to Limiting Factors for WinterSteelhead, Spring Chinook Salmon, and Cutthroat Trout in the Lower North Santiam River
EDT Attribute Class DescriptionPriority forRestoration
Competition with hatcheryfish
Hatchery fish have been introduced to areas below thedams, increasing competition with native fish for habitat andfood (Mamoyac, ODFW, personal communication, 2004).
HIGH
Flow Changes in the interannual variability of low and high flowsfrom dam regulation have affected the quantity of habitat anddisrupted the processes that create a complex array ofhabitats.
HIGH
Habitat diversity Extensive channel confinement through the river corridor asa result of bank riprap and revetments; loss of floodplain andriparian trees and limited wood in the river and tributarychannels.
HIGH
Obstructions Dams prevent migration into the upper subbasin; numerouscomplete and partial barriers on tributary streams.
HIGH
Temperature The dams have modified high and low water temperatureregimes in the river. Changes in riparian canopy cover haveincreased summer high water temperatures in some tributarystreams.
HIGH
Key habitats Reduction of the following key channel habitats affects keylife stages: small cobble/gravel riffles in the river (spawningand incubation); primary pools, backwater areas, and largewood (0- and 1-age rearing and migration).
HIGH
Channel stability Limited wood in channels has reduced channel stability. Medium
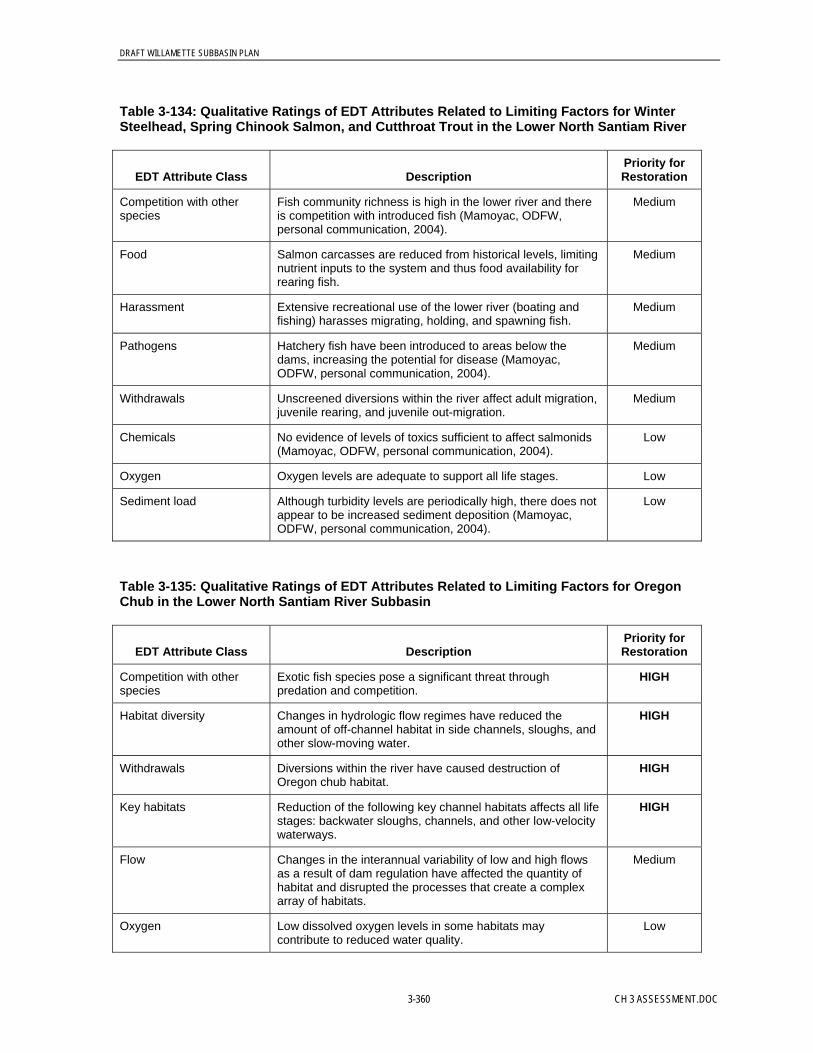
DRAFT WILLAMETTE SUBBASIN PLAN
3-360 CH 3 ASSESSMENT.DOC
Table 3-134: Qualitative Ratings of EDT Attributes Related to Limiting Factors for WinterSteelhead, Spring Chinook Salmon, and Cutthroat Trout in the Lower North Santiam River
EDT Attribute Class DescriptionPriority forRestoration
Competition with otherspecies
Fish community richness is high in the lower river and thereis competition with introduced fish (Mamoyac, ODFW,personal communication, 2004).
Medium
Food Salmon carcasses are reduced from historical levels, limitingnutrient inputs to the system and thus food availability forrearing fish.
Medium
Harassment Extensive recreational use of the lower river (boating andfishing) harasses migrating, holding, and spawning fish.
Medium
Pathogens Hatchery fish have been introduced to areas below thedams, increasing the potential for disease (Mamoyac,ODFW, personal communication, 2004).
Medium
Withdrawals Unscreened diversions within the river affect adult migration,juvenile rearing, and juvenile out-migration.
Medium
Chemicals No evidence of levels of toxics sufficient to affect salmonids(Mamoyac, ODFW, personal communication, 2004).
Low
Oxygen Oxygen levels are adequate to support all life stages. Low
Sediment load Although turbidity levels are periodically high, there does notappear to be increased sediment deposition (Mamoyac,ODFW, personal communication, 2004).
Low
Table 3-135: Qualitative Ratings of EDT Attributes Related to Limiting Factors for OregonChub in the Lower North Santiam River Subbasin
EDT Attribute Class DescriptionPriority forRestoration
Competition with otherspecies
Exotic fish species pose a significant threat throughpredation and competition.
HIGH
Habitat diversity Changes in hydrologic flow regimes have reduced theamount of off-channel habitat in side channels, sloughs, andother slow-moving water.
HIGH
Withdrawals Diversions within the river have caused destruction ofOregon chub habitat.
HIGH
Key habitats Reduction of the following key channel habitats affects all lifestages: backwater sloughs, channels, and other low-velocitywaterways.
HIGH
Flow Changes in the interannual variability of low and high flowsas a result of dam regulation have affected the quantity ofhabitat and disrupted the processes that create a complexarray of habitats.
Medium
Oxygen Low dissolved oxygen levels in some habitats maycontribute to reduced water quality.
Low
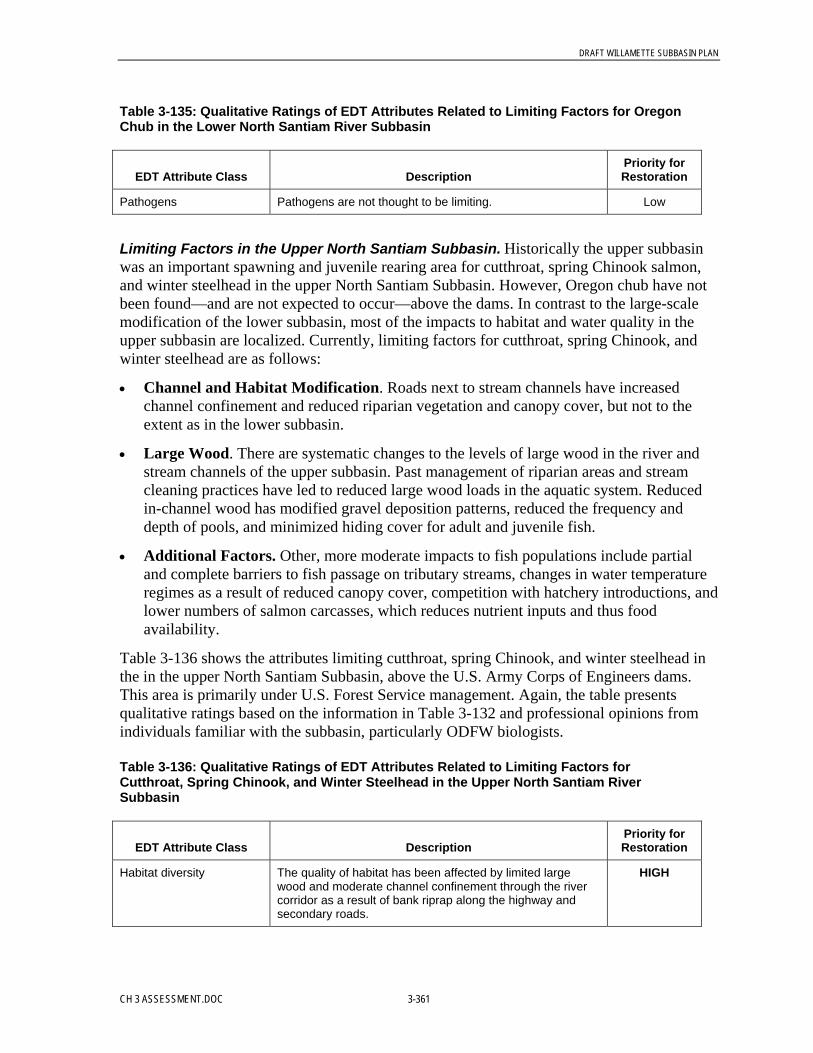
DRAFT WILLAMETTE SUBBASIN PLAN
CH 3 ASSESSMENT.DOC 3-361
Table 3-135: Qualitative Ratings of EDT Attributes Related to Limiting Factors for OregonChub in the Lower North Santiam River Subbasin
EDT Attribute Class DescriptionPriority forRestoration
Pathogens Pathogens are not thought to be limiting. Low
Limiting Factors in the Upper North Santiam Subbasin. Historically the upper subbasinwas an important spawning and juvenile rearing area for cutthroat, spring Chinook salmon,and winter steelhead in the upper North Santiam Subbasin. However, Oregon chub have notbeen found—and are not expected to occur—above the dams. In contrast to the large-scalemodification of the lower subbasin, most of the impacts to habitat and water quality in theupper subbasin are localized. Currently, limiting factors for cutthroat, spring Chinook, andwinter steelhead are as follows:
• Channel and Habitat Modification. Roads next to stream channels have increasedchannel confinement and reduced riparian vegetation and canopy cover, but not to theextent as in the lower subbasin.
• Large Wood. There are systematic changes to the levels of large wood in the river andstream channels of the upper subbasin. Past management of riparian areas and streamcleaning practices have led to reduced large wood loads in the aquatic system. Reducedin-channel wood has modified gravel deposition patterns, reduced the frequency anddepth of pools, and minimized hiding cover for adult and juvenile fish.
• Additional Factors. Other, more moderate impacts to fish populations include partialand complete barriers to fish passage on tributary streams, changes in water temperatureregimes as a result of reduced canopy cover, competition with hatchery introductions, andlower numbers of salmon carcasses, which reduces nutrient inputs and thus foodavailability.
Table 3-136 shows the attributes limiting cutthroat, spring Chinook, and winter steelhead inthe in the upper North Santiam Subbasin, above the U.S. Army Corps of Engineers dams.This area is primarily under U.S. Forest Service management. Again, the table presentsqualitative ratings based on the information in Table 3-132 and professional opinions fromindividuals familiar with the subbasin, particularly ODFW biologists.
Table 3-136: Qualitative Ratings of EDT Attributes Related to Limiting Factors forCutthroat, Spring Chinook, and Winter Steelhead in the Upper North Santiam RiverSubbasin
EDT Attribute Class DescriptionPriority forRestoration
Habitat diversity The quality of habitat has been affected by limited largewood and moderate channel confinement through the rivercorridor as a result of bank riprap along the highway andsecondary roads.
HIGH
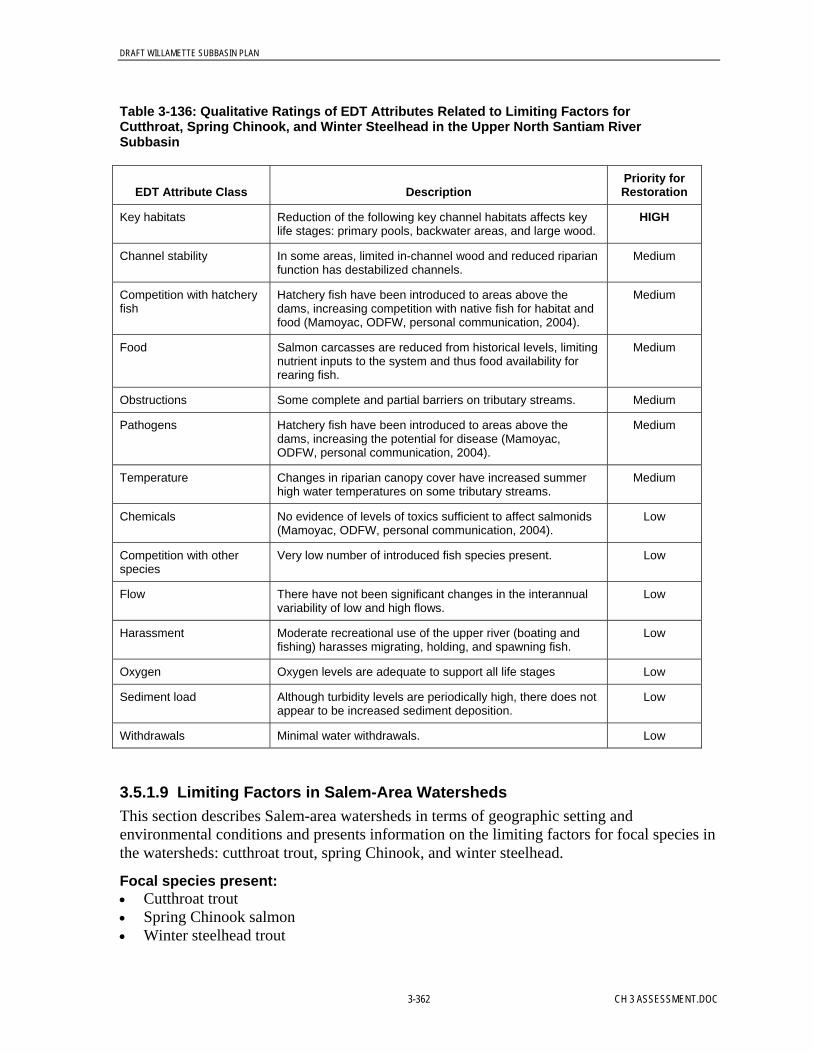
DRAFT WILLAMETTE SUBBASIN PLAN
3-362 CH 3 ASSESSMENT.DOC
Table 3-136: Qualitative Ratings of EDT Attributes Related to Limiting Factors forCutthroat, Spring Chinook, and Winter Steelhead in the Upper North Santiam RiverSubbasin
EDT Attribute Class DescriptionPriority forRestoration
Key habitats Reduction of the following key channel habitats affects keylife stages: primary pools, backwater areas, and large wood.
HIGH
Channel stability In some areas, limited in-channel wood and reduced riparianfunction has destabilized channels.
Medium
Competition with hatcheryfish
Hatchery fish have been introduced to areas above thedams, increasing competition with native fish for habitat andfood (Mamoyac, ODFW, personal communication, 2004).
Medium
Food Salmon carcasses are reduced from historical levels, limitingnutrient inputs to the system and thus food availability forrearing fish.
Medium
Obstructions Some complete and partial barriers on tributary streams. Medium
Pathogens Hatchery fish have been introduced to areas above thedams, increasing the potential for disease (Mamoyac,ODFW, personal communication, 2004).
Medium
Temperature Changes in riparian canopy cover have increased summerhigh water temperatures on some tributary streams.
Medium
Chemicals No evidence of levels of toxics sufficient to affect salmonids(Mamoyac, ODFW, personal communication, 2004).
Low
Competition with otherspecies
Very low number of introduced fish species present. Low
Flow There have not been significant changes in the interannualvariability of low and high flows.
Low
Harassment Moderate recreational use of the upper river (boating andfishing) harasses migrating, holding, and spawning fish.
Low
Oxygen Oxygen levels are adequate to support all life stages Low
Sediment load Although turbidity levels are periodically high, there does notappear to be increased sediment deposition.
Low
Withdrawals Minimal water withdrawals. Low
3.5.1.9 Limiting Factors in Salem-Area WatershedsThis section describes Salem-area watersheds in terms of geographic setting andenvironmental conditions and presents information on the limiting factors for focal species inthe watersheds: cutthroat trout, spring Chinook, and winter steelhead.
Focal species present:• Cutthroat trout• Spring Chinook salmon• Winter steelhead trout
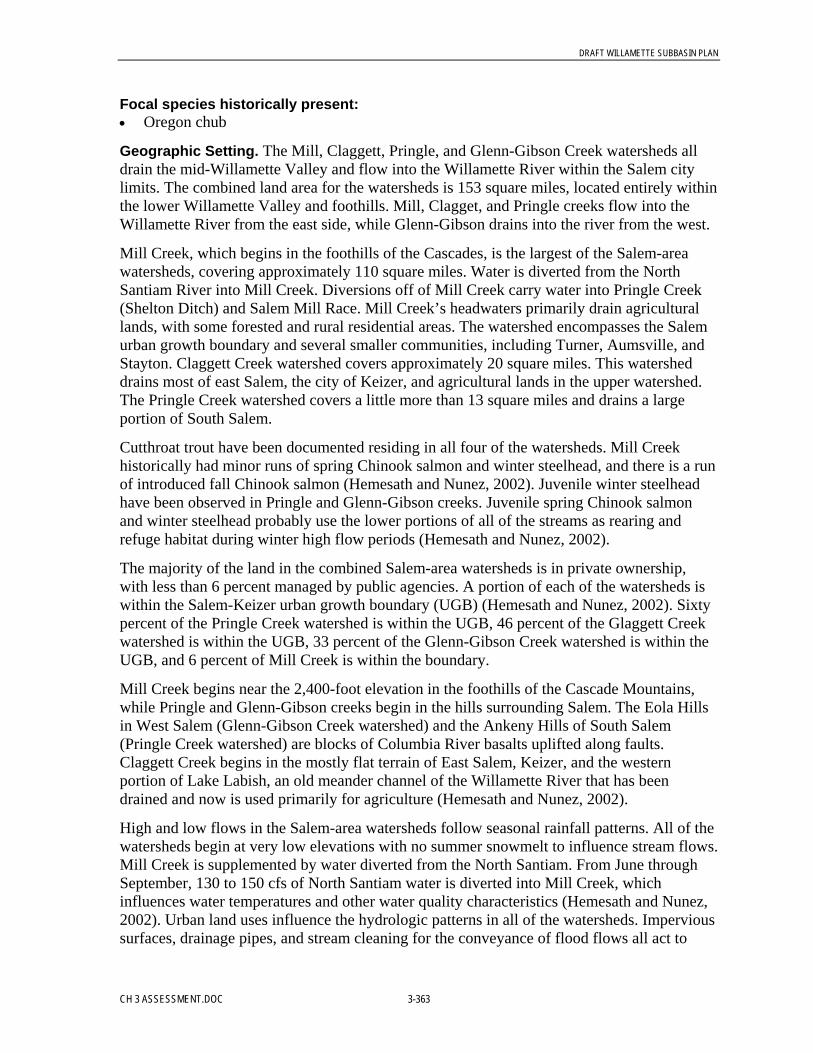
DRAFT WILLAMETTE SUBBASIN PLAN
CH 3 ASSESSMENT.DOC 3-363
Focal species historically present:• Oregon chub
Geographic Setting. The Mill, Claggett, Pringle, and Glenn-Gibson Creek watersheds alldrain the mid-Willamette Valley and flow into the Willamette River within the Salem citylimits. The combined land area for the watersheds is 153 square miles, located entirely withinthe lower Willamette Valley and foothills. Mill, Clagget, and Pringle creeks flow into theWillamette River from the east side, while Glenn-Gibson drains into the river from the west.
Mill Creek, which begins in the foothills of the Cascades, is the largest of the Salem-areawatersheds, covering approximately 110 square miles. Water is diverted from the NorthSantiam River into Mill Creek. Diversions off of Mill Creek carry water into Pringle Creek(Shelton Ditch) and Salem Mill Race. Mill Creek’s headwaters primarily drain agriculturallands, with some forested and rural residential areas. The watershed encompasses the Salemurban growth boundary and several smaller communities, including Turner, Aumsville, andStayton. Claggett Creek watershed covers approximately 20 square miles. This watersheddrains most of east Salem, the city of Keizer, and agricultural lands in the upper watershed.The Pringle Creek watershed covers a little more than 13 square miles and drains a largeportion of South Salem.
Cutthroat trout have been documented residing in all four of the watersheds. Mill Creekhistorically had minor runs of spring Chinook salmon and winter steelhead, and there is a runof introduced fall Chinook salmon (Hemesath and Nunez, 2002). Juvenile winter steelheadhave been observed in Pringle and Glenn-Gibson creeks. Juvenile spring Chinook salmonand winter steelhead probably use the lower portions of all of the streams as rearing andrefuge habitat during winter high flow periods (Hemesath and Nunez, 2002).
The majority of the land in the combined Salem-area watersheds is in private ownership,with less than 6 percent managed by public agencies. A portion of each of the watersheds iswithin the Salem-Keizer urban growth boundary (UGB) (Hemesath and Nunez, 2002). Sixtypercent of the Pringle Creek watershed is within the UGB, 46 percent of the Glaggett Creekwatershed is within the UGB, 33 percent of the Glenn-Gibson Creek watershed is within theUGB, and 6 percent of Mill Creek is within the boundary.
Mill Creek begins near the 2,400-foot elevation in the foothills of the Cascade Mountains,while Pringle and Glenn-Gibson creeks begin in the hills surrounding Salem. The Eola Hillsin West Salem (Glenn-Gibson Creek watershed) and the Ankeny Hills of South Salem(Pringle Creek watershed) are blocks of Columbia River basalts uplifted along faults.Claggett Creek begins in the mostly flat terrain of East Salem, Keizer, and the westernportion of Lake Labish, an old meander channel of the Willamette River that has beendrained and now is used primarily for agriculture (Hemesath and Nunez, 2002).
High and low flows in the Salem-area watersheds follow seasonal rainfall patterns. All of thewatersheds begin at very low elevations with no summer snowmelt to influence stream flows.Mill Creek is supplemented by water diverted from the North Santiam. From June throughSeptember, 130 to 150 cfs of North Santiam water is diverted into Mill Creek, whichinfluences water temperatures and other water quality characteristics (Hemesath and Nunez,2002). Urban land uses influence the hydrologic patterns in all of the watersheds. Impervioussurfaces, drainage pipes, and stream cleaning for the conveyance of flood flows all act to

DRAFT WILLAMETTE SUBBASIN PLAN
3-364 CH 3 ASSESSMENT.DOC
accelerate storm runoff and increase peak flows. Drainage off of impervious surfaces alsoaffects water quality by increasing summer water temperatures and contributing to thedelivery of toxics to waterways.
Environmental Conditions. Altered watershed processes, modified riparian and aquatichabitat, and limited access to portions of the streams have affected the productivity, capacity,and diversity of cutthroat trout, spring Chinook, and winter steelhead populations in theSalem-area watersheds. Table 3-137 summarizes changes in the watersheds’ environmentalconditions and how these affected have affected cutthroat trout, spring Chinook salmon, andwinter steelhead life stages.
Large Wood. Historical removal of large wood from the river and tributary streams, reduceddelivery and transport of wood through channels, and changes in riparian vegetation all haveinteracted to reduce the quantity and distribution of large wood. The City of Salem continuesto clean large wood and other debris out of streams to accelerate the conveyance offloodwaters (Hemesath and Nunez, 2002). Most of the riparian areas—particularly in theurban portions of the watersheds—are narrow and discontinuous with reduced numbers oftrees, which affects the delivery of wood and canopy cover levels (Hemesath and Nunez,2002).
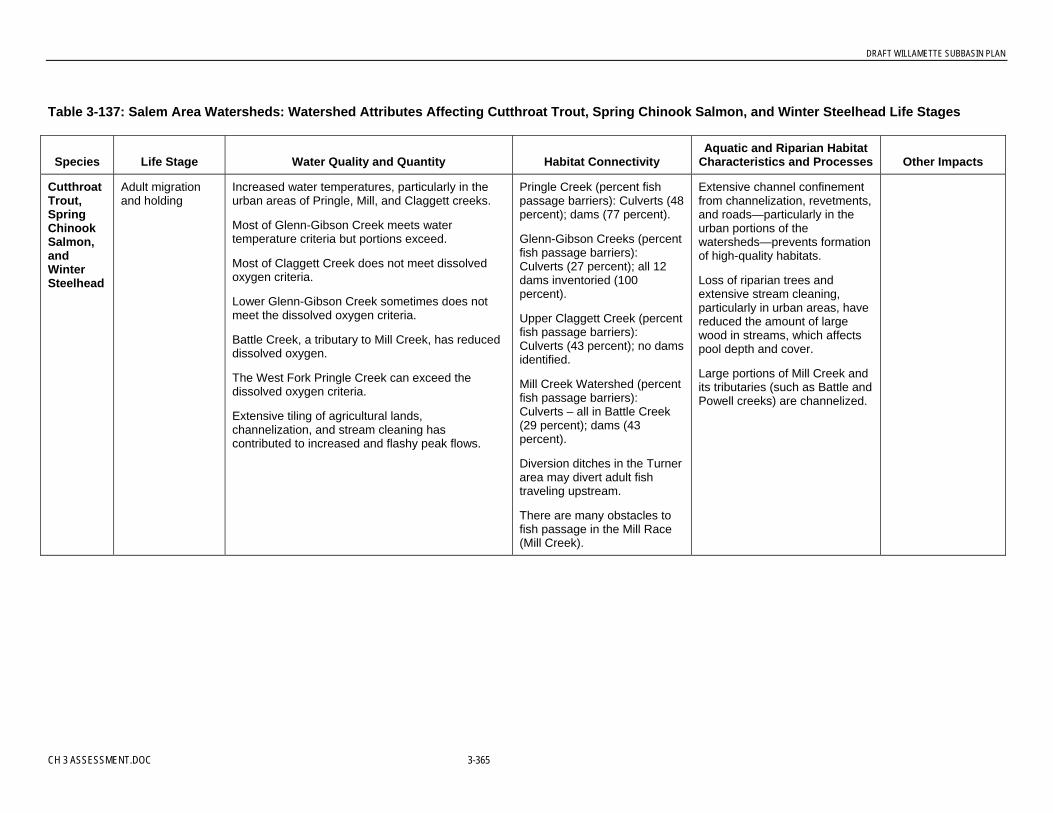
DRAFT WILLAMETTE SUBBASIN PLAN
CH 3 ASSESSMENT.DOC 3-365
Table 3-137: Salem Area Watersheds: Watershed Attributes Affecting Cutthroat Trout, Spring Chinook Salmon, and Winter Steelhead Life Stages
Species Life Stage Water Quality and Quantity Habitat ConnectivityAquatic and Riparian Habitat
Characteristics and Processes Other Impacts
CutthroatTrout,SpringChinookSalmon,andWinterSteelhead
Adult migrationand holding
Increased water temperatures, particularly in theurban areas of Pringle, Mill, and Claggett creeks.
Most of Glenn-Gibson Creek meets watertemperature criteria but portions exceed.
Most of Claggett Creek does not meet dissolvedoxygen criteria.
Lower Glenn-Gibson Creek sometimes does notmeet the dissolved oxygen criteria.
Battle Creek, a tributary to Mill Creek, has reduceddissolved oxygen.
The West Fork Pringle Creek can exceed thedissolved oxygen criteria.
Extensive tiling of agricultural lands,channelization, and stream cleaning hascontributed to increased and flashy peak flows.
Pringle Creek (percent fishpassage barriers): Culverts (48percent); dams (77 percent).
Glenn-Gibson Creeks (percentfish passage barriers):Culverts (27 percent); all 12dams inventoried (100percent).
Upper Claggett Creek (percentfish passage barriers):Culverts (43 percent); no damsidentified.
Mill Creek Watershed (percentfish passage barriers):Culverts – all in Battle Creek(29 percent); dams (43percent).
Diversion ditches in the Turnerarea may divert adult fishtraveling upstream.
There are many obstacles tofish passage in the Mill Race(Mill Creek).
Extensive channel confinementfrom channelization, revetments,and roads—particularly in theurban portions of thewatersheds—prevents formationof high-quality habitats.
Loss of riparian trees andextensive stream cleaning,particularly in urban areas, havereduced the amount of largewood in streams, which affectspool depth and cover.
Large portions of Mill Creek andits tributaries (such as Battle andPowell creeks) are channelized.

DRAFT WILLAMETTE SUBBASIN PLAN
3-366 CH 3 ASSESSMENT.DOC
Table 3-137: Salem Area Watersheds: Watershed Attributes Affecting Cutthroat Trout, Spring Chinook Salmon, and Winter Steelhead Life Stages
Species Life Stage Water Quality and Quantity Habitat ConnectivityAquatic and Riparian Habitat
Characteristics and Processes Other Impacts
Adult spawning /egg incubation
Increased peak flows from urbanization scourgravel, reducing spawning areas and affectingredds.
Elevated suspended sediment in the urban portionsof the watersheds may affect spawning success.
Impassable culverts and damslimit access into spawningareas.
High sediment loads reducesuitable spawning gravels.
Limited wood in most streamreaches to retain spawningsubstrate.
Large portions of Glenn andGibson creeks do not provideadequate spawning habitatbecause suitable gravels arelimited and water levels areshallow.

DRAFT WILLAMETTE SUBBASIN PLAN
CH 3 ASSESSMENT.DOC 3-367
Table 3-137: Salem Area Watersheds: Watershed Attributes Affecting Cutthroat Trout, Spring Chinook Salmon, and Winter Steelhead Life Stages
Species Life Stage Water Quality and Quantity Habitat ConnectivityAquatic and Riparian Habitat
Characteristics and Processes Other Impacts
Fry and juvenilerearing andmigration
Low summer flows from urbanization and loststorage capacity have increased summer watertemperatures.
Reduced shade on most of the urban portions ofthe streams has increased water temperatures.
In the classified stream reaches, the percent withminimal shade cover is as follows: Pringle Creek,52 percent; Glenn-Gibson, 25 percent; Claggett, 43percent; and Mill 16 percent.
Changes in riparian canopy cover have increasedsummer high water temperatures on some tributarystreams.
Channelization of tributaries and changes in runoffpatterns on agricultural and developed lands havecaused accelerated runoff.
Oil, lead, and other toxic substances have beennoted in the urban portions of the watersheds.
Draining of wetlands has contributed to loss ofwater storage capacity.
Most existing wetlands are small and isolated,particularly in the Claggett Creek watershed wherethere has been extensive wetland loss in the valleybottom.
Because of fish passagebarriers, juvenile fish cannotaccess upstream habitat toescape high watertemperatures or for refugefrom winter high flows.
Revetments andchannelization keepfloodplains from beinginundated frequently; reducedover-bank flow and side-channel connectivity limitrearing and refuge habitat.
Many irrigation diversions,particularly in Mill Creek, maynot be screened.
Low summer flows from loststorage capacity (for example,lost wetlands) and urbanizationhave reduced the amount ofhigh-quality habitat available torearing fish.
Accelerated flows and increasedpeak flows in urban areasreduce habitat quality during thewinter high flow periods.
Reduced deep pools and woodin stream channels limit juvenilerearing habitat.
During the summer and earlyfall, Claggett Creek has very lowflows and stagnant water.
Introduced fishspecies (small- andlarge-mouth bass)may prey onjuveniles.
Source: Hemesath and Nunez, 2002.

DRAFT WILLAMETTE SUBBASIN PLAN
3-368 CH 3 ASSESSMENT.DOC
Water Quality Changes. Water quality has been modified throughout the Salem-areawatersheds (Hemesath and Nunez, 2002). The urban portions the four watersheds haveparticularly poor water quality. Impervious streets and parking lots drain into streams,contributing oils, lead, and other toxics to the system. Reduced riparian canopy cover,particularly in the urban portions of the watersheds, contributes to increased watertemperatures, which often exceed water quality criteria. Summer and early fall watertemperatures are elevated. Claggett Creek is warm through its entire length. Glenn-Gibsonand Pringle creeks are warm in the lower reaches and cooler in the upper portions. Waterdiverted into Mill Creek from the North Santiam helps to maintain cooler water temperatures.Toxic spills in Pringle Creek (1996 and 2000) and Mill Creek (1989) resulted in fish kills(Hemesath and Nunez, 2002). Nutrient levels are high at a majority of the sites sampled inthe four watersheds, and numerous stream reaches have dissolved oxygen levels that arelower than the criteria. Increased sediment deposition has been noted in all of the watersheds,particularly in the urban areas.
Flow Regime and Channel Structure. Peak and low flow regimes have been modified,particularly in the urban areas. In the four watersheds, more than 450 miles of pipes andalmost 18 miles of culverts convey water underground (Hemesath and Nunez, 2002). Inaddition, there are more than 50 miles of open ditches. Loss of wetlands and extensivechannelization have disconnected the floodplain from the streams, reducing flood storagecapacity and summertime low flows. There is extensive use of drainage tiling in theagricultural portions of all four watersheds (Hemesath and Nunez, 2002). Claggett Creekdrains portions of Lake Labish, a drained lake and wetland area that is now largelyagricultural lands (Hemesath and Nunez, 2002). The peak runoff volume of Claggett Creek is100 percent higher than predicted, largely because of extensive tiling in the watershed(Hemesath and Nunez, 2002). Irrigation withdrawals occur in all four watersheds.
Fish Passage Barriers. Fish passage is restricted in all four watersheds by impassibleculverts and dams (Hemesath and Nunez, 2002). In Pringle Creek, 48 percent of the surveyedculverts and 77 percent of the dams were classified as fish passage barriers. All of the 12dams surveyed and 27 percent of the culverts in the Glenn-Gibson Creek watershed wereclassified as fish passage barriers. There are a number of barriers on Claggett Creek andBattle Creek, a tributary to Mill Creek. Water diversions and irrigation withdrawals alsoaffect fish passage. The area south of Turner on Mill Creek has a number of ditches that maydivert adult fish traveling upstream (Hemesath and Nunez, 2002). Other diversions in MillCreek and the Mill Race may have a need for fish screens.
Appendix G shows specific fish passage barriers in the Salem-area watersheds, based on May2004 data from ODFW; the information was compiled from existing ODFW databases.
Habitat Quality. Channelization, loss of large wood, increased peak flows, and reduced lowflows have degraded fish habitat quality in the four watersheds (Hemesath and Nunez, 2002).Many of the reaches within upper Pringle Creek and tributaries (such as Clark Creek) arechannelized and have poor aquatic habitat quality. Most stream reaches in the fourwatersheds have low amounts and reduced size of large wood, which reduces pool frequencyand depth and limits the retention of gravels. Large portions of Glenn and Gibson creeks donot provide adequate spawning habitat because suitable gravels are limited and water levelsare shallow (Hemesath and Nunez, 2002). During the summer and early fall, Claggett Creek

DRAFT WILLAMETTE SUBBASIN PLAN
CH 3 ASSESSMENT.DOC 3-369
has very low flows and stagnant water, which suggests poor habitat quality. Much of themainstem of lower Mill Creek has adequate fish habitat, but in the upper reaches the streamwidens, there is little cover, and instream habitat is poor. Large portions of Mill Creek and itstributaries (such as Battle and Powell creeks) are channelized (Hemesath and Nunez, 2002).
Key Factors Limiting Fish Populations. In the Salem-area watersheds, the productivity,capacity, and diversity of cutthroat trout, spring Chinook salmon, and winter steelheadpopulations are limited by the following factors:
• Habitat Connectivity. Channel and bank confinement through riprap (and other actions)and reduced large wood in the channels have interacted to limit backwater habitatsimportant for juvenile rearing and winter refuge.
• Habitat Modification. Modification of key aquatic habitats has affected all life stages.Limited spawning areas and reduced levels of gravels/small cobbles have reduced theareas available for spawning.
• Large Wood. Changes in the delivery and transport of large wood has modified graveldeposition patterns, reduced the frequency and depth of pools, and minimized hidingcover for adult and juvenile fish.
• High Flow Regimes. Increased peak flows from loss of wetlands, tiling of agriculturallands, and impervious surfaces in urban areas have scoured channels and changedprocesses that maintain complex stream habitats.
• Flow Diversions and Withdrawals. Flow diversions in the river impede upstreammovement of adult fish and can contribute to juvenile mortality. Unscreened waterwithdrawals impact juvenile fish.
• Water Quality. Water quality impacts, including increased temperature regimes andtoxic runoff, have affected the capacity of the streams to support adult and juvenile fish.
• Additional Factors. Other, more moderate that are limiting cutthroat trout, springChinook salmon, and winter steelhead populations include competition with hatchery andintroduced fish and predation from nonnative fish. All of these factors interact withmodified habitats and other impacts to the aquatic system to limit fish populations.
Table 3-138 shows the EDT attributes related to these limiting factors in the Mill, Claggett,Pringle, and Glenn-Gibson watersheds. The priorities for restoration are qualitative ratingsbased on information in Table 3-137.
Table 3-138: Qualitative Ratings of EDT Attributes Related to Limiting Factors for CutthroatTrout, Winter Steelhead, and Spring Chinook in the Salem-Area Watersheds: Mill, Claggett,Pringle, and Glenn-Gibson Creeks
EDT Attribute Class DescriptionPriority forRestoration
Channel stability Limited wood in channels has reduced channel stability. HIGH
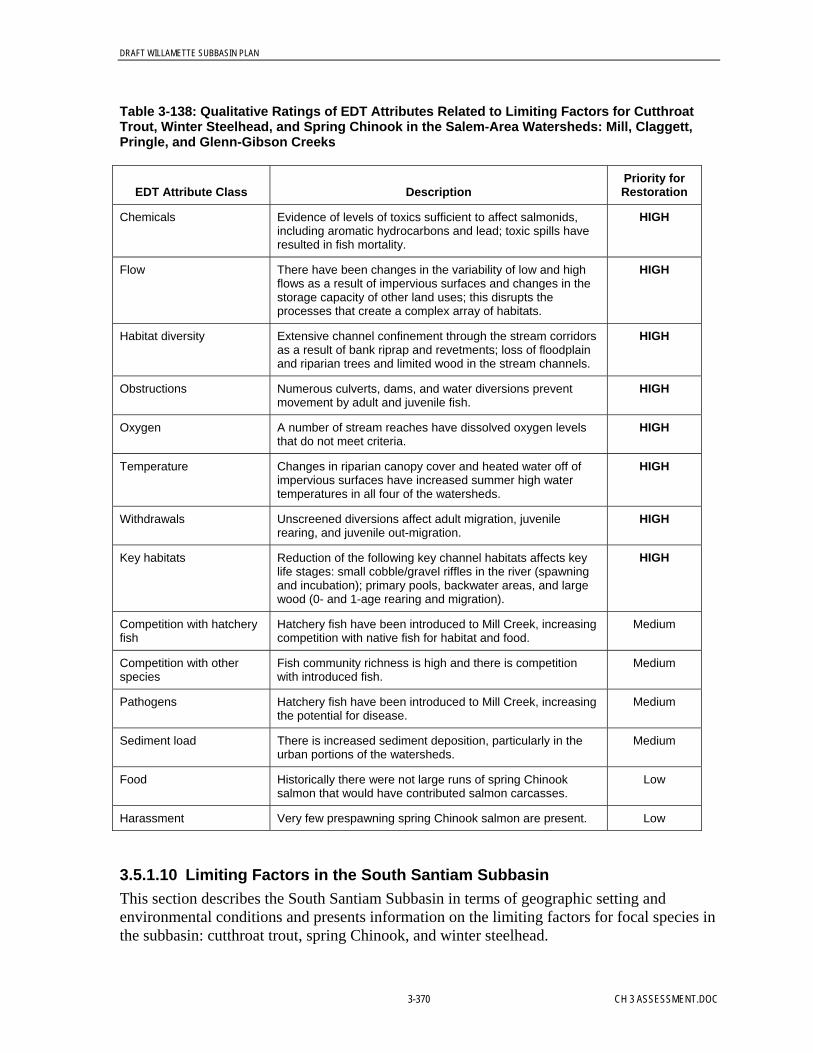
DRAFT WILLAMETTE SUBBASIN PLAN
3-370 CH 3 ASSESSMENT.DOC
Table 3-138: Qualitative Ratings of EDT Attributes Related to Limiting Factors for CutthroatTrout, Winter Steelhead, and Spring Chinook in the Salem-Area Watersheds: Mill, Claggett,Pringle, and Glenn-Gibson Creeks
EDT Attribute Class DescriptionPriority forRestoration
Chemicals Evidence of levels of toxics sufficient to affect salmonids,including aromatic hydrocarbons and lead; toxic spills haveresulted in fish mortality.
HIGH
Flow There have been changes in the variability of low and highflows as a result of impervious surfaces and changes in thestorage capacity of other land uses; this disrupts theprocesses that create a complex array of habitats.
HIGH
Habitat diversity Extensive channel confinement through the stream corridorsas a result of bank riprap and revetments; loss of floodplainand riparian trees and limited wood in the stream channels.
HIGH
Obstructions Numerous culverts, dams, and water diversions preventmovement by adult and juvenile fish.
HIGH
Oxygen A number of stream reaches have dissolved oxygen levelsthat do not meet criteria.
HIGH
Temperature Changes in riparian canopy cover and heated water off ofimpervious surfaces have increased summer high watertemperatures in all four of the watersheds.
HIGH
Withdrawals Unscreened diversions affect adult migration, juvenilerearing, and juvenile out-migration.
HIGH
Key habitats Reduction of the following key channel habitats affects keylife stages: small cobble/gravel riffles in the river (spawningand incubation); primary pools, backwater areas, and largewood (0- and 1-age rearing and migration).
HIGH
Competition with hatcheryfish
Hatchery fish have been introduced to Mill Creek, increasingcompetition with native fish for habitat and food.
Medium
Competition with otherspecies
Fish community richness is high and there is competitionwith introduced fish.
Medium
Pathogens Hatchery fish have been introduced to Mill Creek, increasingthe potential for disease.
Medium
Sediment load There is increased sediment deposition, particularly in theurban portions of the watersheds.
Medium
Food Historically there were not large runs of spring Chinooksalmon that would have contributed salmon carcasses.
Low
Harassment Very few prespawning spring Chinook salmon are present. Low
3.5.1.10 Limiting Factors in the South Santiam SubbasinThis section describes the South Santiam Subbasin in terms of geographic setting andenvironmental conditions and presents information on the limiting factors for focal species inthe subbasin: cutthroat trout, spring Chinook, and winter steelhead.

DRAFT WILLAMETTE SUBBASIN PLAN
CH 3 ASSESSMENT.DOC 3-371
Focal species present:• Winter steelhead trout• Spring Chinook salmon• Cutthroat trout• Oregon chub (lower subbasin only)
Focal species present historically:• Bull trout• Oregon chub
Geographic Setting. The South Santiam Subbasin covers an area of approximately1,000 square miles on the western slope of the Cascade Mountains and the floor of theWillamette Valley. The South Santiam River is about 68 miles long and enters the SantiamRiver at RM 12. Approximately 32 percent of the land in the South Santiam Subbasin ispublicly owned and managed by federal agencies. The Willamette National Forest manages54 percent of the upper subbasin above Foster Dam, while the Salem District of the BLMmanages a small portion of the lower subbasin. The Middle Santiam River, the largesttributary to the South Santiam River, flows through the Middle Santiam Wilderness. Most ofthe city of Lebanon is within the subbasin.
The geology of the western Cascades characterizes the mountainous areas of the uppersubbasin. This area has deeply weathered rocks and steep, highly dissected hill slopes. Largeportions of this landscape are prone to erosion and frequent landslides. Stream runoff patternsin the subbasin are dominated by the western Cascade geology, with a rain-on-snowhydrology in the mid- to upper elevations and rain-dominated flow patterns in the lowersubbasin, which leads to rapid delivery of water to the stream network.
Foster Dam on the South Santiam mainstem (RM 39) and Green Peter Dam on the MiddleSantiam River (RM 6) divide the South Santiam Subbasin, limiting upstream anddownstream fish passage and greatly influencing downstream hydrologic regimes,temperature patterns, sediment and bedload transport, and large wood delivery to the lowerreaches. Above Foster Dam the river flows though a steep, forested canyon with gradients ofmore than 0.4 percent. Quartzville and Canyon creeks are major tributaries in the uppersubbasin. The upper South Santiam flows through a narrow, steep forested canyon.Numerous ancient, deep-seated landslides have been mapped in the upper subbasin, and thesefeatures probably continue to contribute large amounts of sediment to the South SantiamRiver (U.S. Army Corps of Engineers, 2001).
In the lower subbasin downstream of Foster Dam, the South Santiam River flows into thewide alluvial Willamette River Valley. Wiley, Thomas, and Crabtree creeks are majortributaries in the lower subbasin. The lower 30 miles of the South Santiam is low gradient(less than 0.1 percent) and flows through a relatively wide valley with an extensivefloodplain. In 1947, the lower South Santiam River was described as very sinuous anddivided by large islands (U.S. Army Corps of Engineers, 2001). Most of the land in the lowersubbasin is in private ownership, primarily in agricultural, forestry, and rural residential landuses.
Environmental Conditions. Altered subbasin processes, modified riparian and aquatichabitat, and limited access to historical spawning and rearing areas in the South Santiam
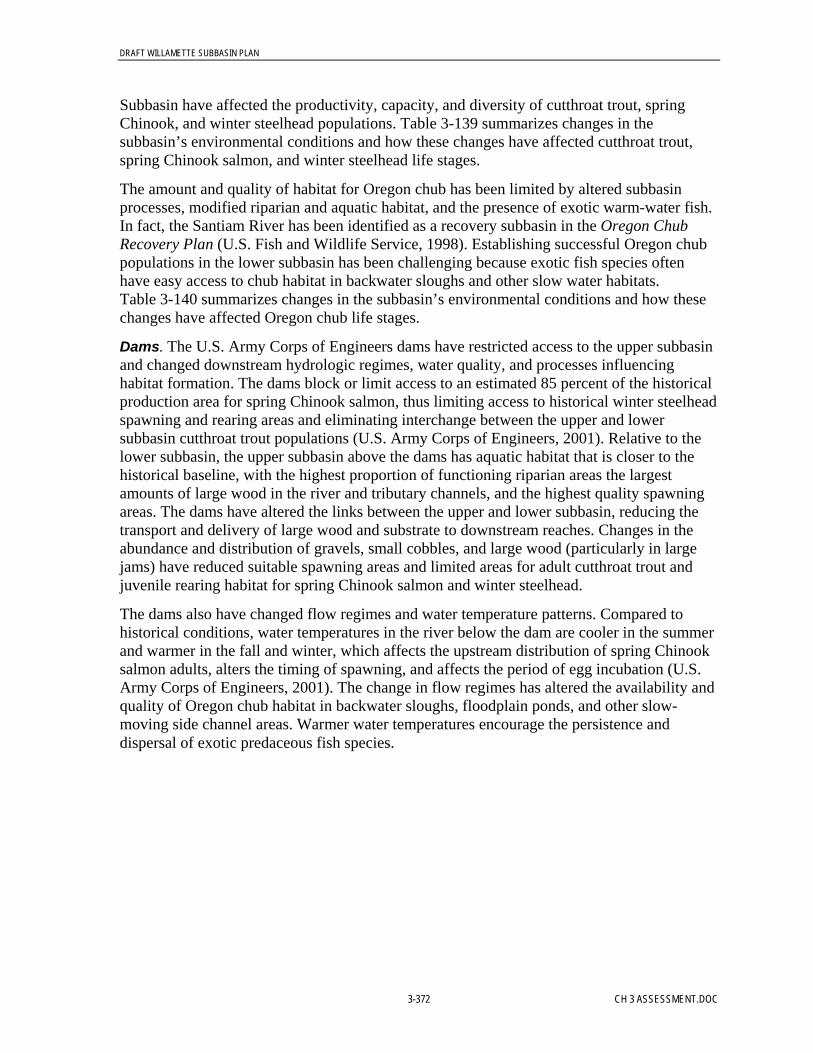
DRAFT WILLAMETTE SUBBASIN PLAN
3-372 CH 3 ASSESSMENT.DOC
Subbasin have affected the productivity, capacity, and diversity of cutthroat trout, springChinook, and winter steelhead populations. Table 3-139 summarizes changes in thesubbasin’s environmental conditions and how these changes have affected cutthroat trout,spring Chinook salmon, and winter steelhead life stages.
The amount and quality of habitat for Oregon chub has been limited by altered subbasinprocesses, modified riparian and aquatic habitat, and the presence of exotic warm-water fish.In fact, the Santiam River has been identified as a recovery subbasin in the Oregon ChubRecovery Plan (U.S. Fish and Wildlife Service, 1998). Establishing successful Oregon chubpopulations in the lower subbasin has been challenging because exotic fish species oftenhave easy access to chub habitat in backwater sloughs and other slow water habitats.Table 3-140 summarizes changes in the subbasin’s environmental conditions and how thesechanges have affected Oregon chub life stages.
Dams. The U.S. Army Corps of Engineers dams have restricted access to the upper subbasinand changed downstream hydrologic regimes, water quality, and processes influencinghabitat formation. The dams block or limit access to an estimated 85 percent of the historicalproduction area for spring Chinook salmon, thus limiting access to historical winter steelheadspawning and rearing areas and eliminating interchange between the upper and lowersubbasin cutthroat trout populations (U.S. Army Corps of Engineers, 2001). Relative to thelower subbasin, the upper subbasin above the dams has aquatic habitat that is closer to thehistorical baseline, with the highest proportion of functioning riparian areas the largestamounts of large wood in the river and tributary channels, and the highest quality spawningareas. The dams have altered the links between the upper and lower subbasin, reducing thetransport and delivery of large wood and substrate to downstream reaches. Changes in theabundance and distribution of gravels, small cobbles, and large wood (particularly in largejams) have reduced suitable spawning areas and limited areas for adult cutthroat trout andjuvenile rearing habitat for spring Chinook salmon and winter steelhead.
The dams also have changed flow regimes and water temperature patterns. Compared tohistorical conditions, water temperatures in the river below the dam are cooler in the summerand warmer in the fall and winter, which affects the upstream distribution of spring Chinooksalmon adults, alters the timing of spawning, and affects the period of egg incubation (U.S.Army Corps of Engineers, 2001). The change in flow regimes has altered the availability andquality of Oregon chub habitat in backwater sloughs, floodplain ponds, and other slow-moving side channel areas. Warmer water temperatures encourage the persistence anddispersal of exotic predaceous fish species.

DRAFT WILLAMETTE SUBBASIN PLAN
CH 3 ASSESSMENT.DOC 3-373
Table 3-139: South Santiam Subbasin: Subbasin Attributes Affecting Cutthroat Trout, Spring Chinook Salmon, and Winter Steelhead Life Stages
Species Life Stage Water Quality and Quantity Habitat ConnectivityAquatic and Riparian Habitat
Characteristics and Processes Other Impacts
CutthroatTrout
Adult migrationand holding
Flow reductions associated with diversions forirrigation, domestic, and industrial water usescontribute to low flow conditions in the river and itstributaries, particularly in late summer and earlyfall.
Operation of U.S. Army Corps of Engineersreservoirs reduced spring/summer temperatures inthe South Santiam River and increasedtemperatures during most of the rest of the year.
Water temperatures in the South Santiam Riverexceed water quality criteria for summer maximaadult migration (64°F) during most of the rest ofthe year.
Foster and Green Peter damsare complete barriers toupstream movement by adultcutthroat trout.
Numerous partial andcomplete fish passage barriersat culverts on tributary streamsmay limit adult upstreammovement into foraging andrefuge habitat.
The 8-foot-tall Lebanon Damat RM 21 diverts water into theunscreened Lebanon-Albanythis dam is equipped withseveral fish ladders that allowpassage of adult fish, but,because of the older,ineffective design of the fishladders, they probably causesome migration delay.
Some forests in the uppersubbasin are dominated byearly- to mid-successionalstages, but up to 39 percent ofthe Middle Santiam and 43percent of the Quartzvilledrainages contain late-successional forests.
Riparian areas in uppersubbasin tributaries aredominated by late-successionalvegetation on federal land andearly-successional vegetation onprivate lands.
Width and continuity of riparianareas are good along Thomasand Crabtree creeks in the lowerSouth Santiam Subbasin, butalmost all vegetation is less than80 years old.
Less than 30 percent of theriparian forest along themainstem South Santiam Riveris more than 100 feet wide.
Reaches of the South SantiamRiver below Green Peter andFoster dams are deprived oflarge wood.
There is inadequate recruitmentof large wood from riparianareas along the mainstem SouthSantiam and tributariesdownstream from Foster Dam.

DRAFT WILLAMETTE SUBBASIN PLAN
3-374 CH 3 ASSESSMENT.DOC
Table 3-139: South Santiam Subbasin: Subbasin Attributes Affecting Cutthroat Trout, Spring Chinook Salmon, and Winter Steelhead Life Stages
Species Life Stage Water Quality and Quantity Habitat ConnectivityAquatic and Riparian Habitat
Characteristics and Processes Other Impacts
Reduced pool frequency, depth,and cover have affected thequality of adult habitat in theriver and tributaries.
Limited wood in the river andtributaries has affected thequality of pools and backwaterhabitats.
Adult spawning/egg incubation
Numerous partial andcomplete fish passage barriersat culverts on tributary streamslimit adult upstream movementinto spawning habitat.
Dams reduce channel substratemovement: cobble and boulderbars have replaced many of thesand and gravel bars, andnumerous areas of the riverhave been scoured down tobedrock with scattered boulders,thus reducing spawning areasand gravels.
There is limited in-channel woodto capture spawning gravels.
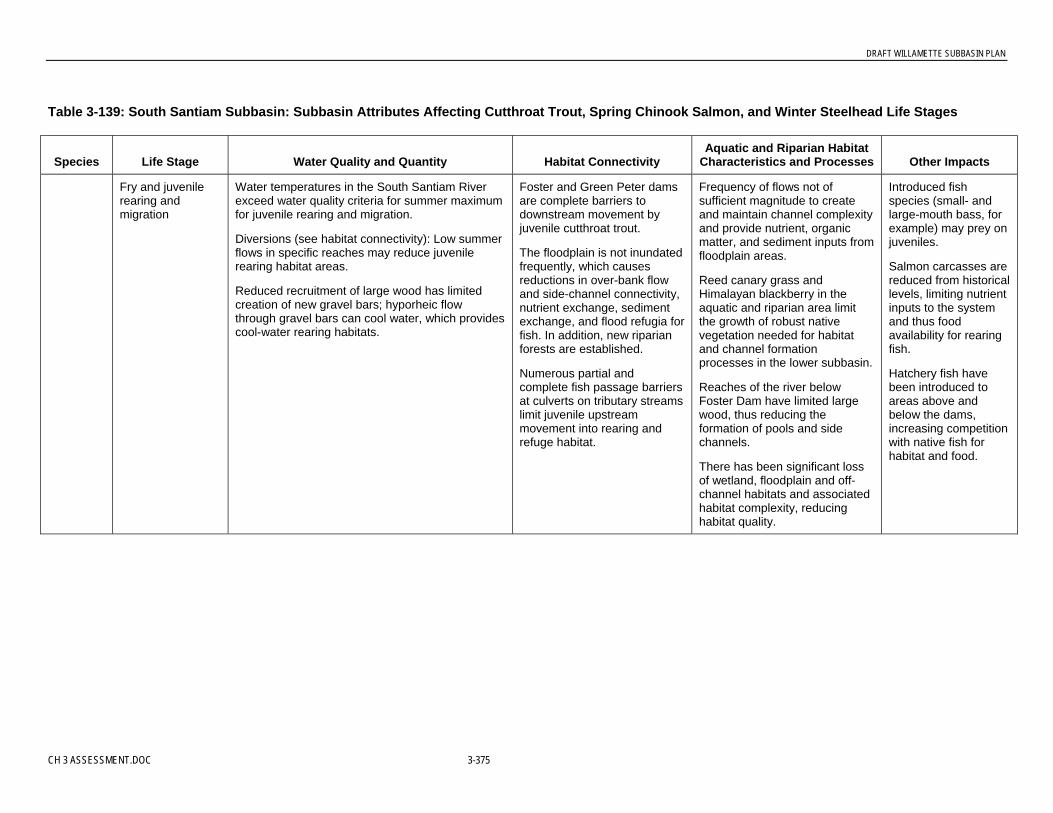
DRAFT WILLAMETTE SUBBASIN PLAN
CH 3 ASSESSMENT.DOC 3-375
Table 3-139: South Santiam Subbasin: Subbasin Attributes Affecting Cutthroat Trout, Spring Chinook Salmon, and Winter Steelhead Life Stages
Species Life Stage Water Quality and Quantity Habitat ConnectivityAquatic and Riparian Habitat
Characteristics and Processes Other Impacts
Fry and juvenilerearing andmigration
Water temperatures in the South Santiam Riverexceed water quality criteria for summer maximumfor juvenile rearing and migration.
Diversions (see habitat connectivity): Low summerflows in specific reaches may reduce juvenilerearing habitat areas.
Reduced recruitment of large wood has limitedcreation of new gravel bars; hyporheic flowthrough gravel bars can cool water, which providescool-water rearing habitats.
Foster and Green Peter damsare complete barriers todownstream movement byjuvenile cutthroat trout.
The floodplain is not inundatedfrequently, which causesreductions in over-bank flowand side-channel connectivity,nutrient exchange, sedimentexchange, and flood refugia forfish. In addition, new riparianforests are established.
Numerous partial andcomplete fish passage barriersat culverts on tributary streamslimit juvenile upstreammovement into rearing andrefuge habitat.
Frequency of flows not ofsufficient magnitude to createand maintain channel complexityand provide nutrient, organicmatter, and sediment inputs fromfloodplain areas.
Reed canary grass andHimalayan blackberry in theaquatic and riparian area limitthe growth of robust nativevegetation needed for habitatand channel formationprocesses in the lower subbasin.
Reaches of the river belowFoster Dam have limited largewood, thus reducing theformation of pools and sidechannels.
There has been significant lossof wetland, floodplain and off-channel habitats and associatedhabitat complexity, reducinghabitat quality.
Introduced fishspecies (small- andlarge-mouth bass, forexample) may prey onjuveniles.
Salmon carcasses arereduced from historicallevels, limiting nutrientinputs to the systemand thus foodavailability for rearingfish.
Hatchery fish havebeen introduced toareas above andbelow the dams,increasing competitionwith native fish forhabitat and food.
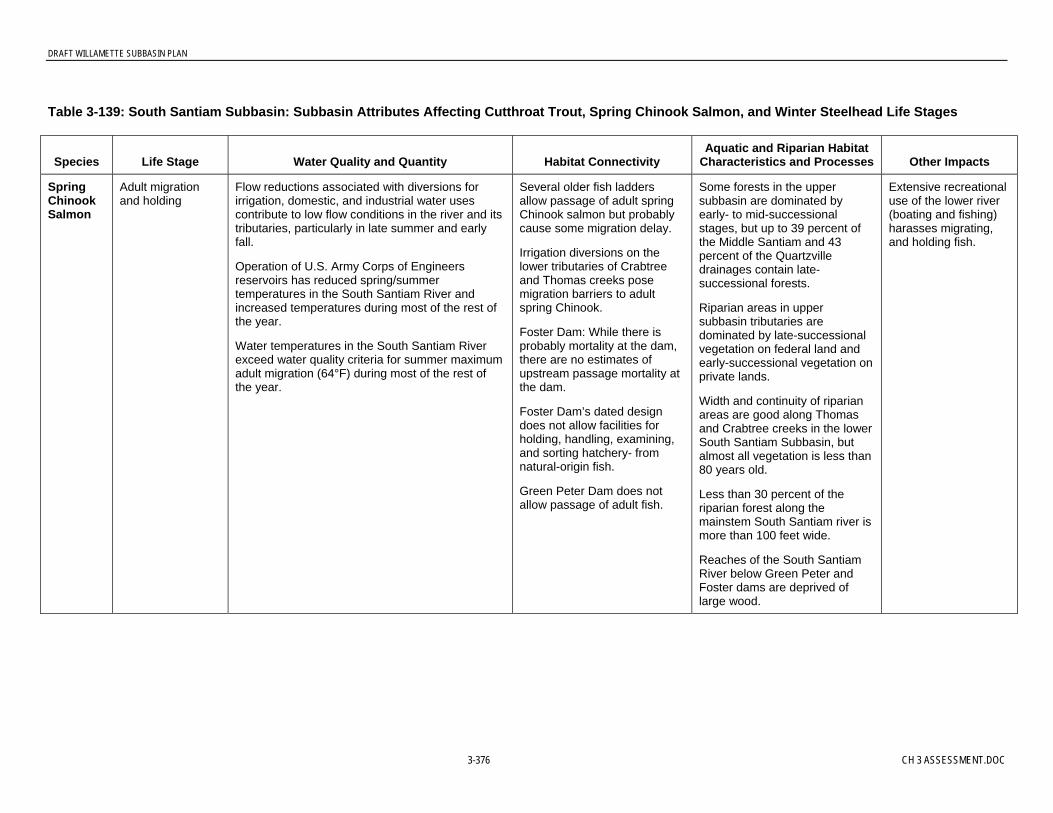
DRAFT WILLAMETTE SUBBASIN PLAN
3-376 CH 3 ASSESSMENT.DOC
Table 3-139: South Santiam Subbasin: Subbasin Attributes Affecting Cutthroat Trout, Spring Chinook Salmon, and Winter Steelhead Life Stages
Species Life Stage Water Quality and Quantity Habitat ConnectivityAquatic and Riparian Habitat
Characteristics and Processes Other Impacts
SpringChinookSalmon
Adult migrationand holding
Flow reductions associated with diversions forirrigation, domestic, and industrial water usescontribute to low flow conditions in the river and itstributaries, particularly in late summer and earlyfall.
Operation of U.S. Army Corps of Engineersreservoirs has reduced spring/summertemperatures in the South Santiam River andincreased temperatures during most of the rest ofthe year.
Water temperatures in the South Santiam Riverexceed water quality criteria for summer maximumadult migration (64°F) during most of the rest ofthe year.
Several older fish laddersallow passage of adult springChinook salmon but probablycause some migration delay.
Irrigation diversions on thelower tributaries of Crabtreeand Thomas creeks posemigration barriers to adultspring Chinook.
Foster Dam: While there isprobably mortality at the dam,there are no estimates ofupstream passage mortality atthe dam.
Foster Dam’s dated designdoes not allow facilities forholding, handling, examining,and sorting hatchery- fromnatural-origin fish.
Green Peter Dam does notallow passage of adult fish.
Some forests in the uppersubbasin are dominated byearly- to mid-successionalstages, but up to 39 percent ofthe Middle Santiam and 43percent of the Quartzvilledrainages contain late-successional forests.
Riparian areas in uppersubbasin tributaries aredominated by late-successionalvegetation on federal land andearly-successional vegetation onprivate lands.
Width and continuity of riparianareas are good along Thomasand Crabtree creeks in the lowerSouth Santiam Subbasin, butalmost all vegetation is less than80 years old.
Less than 30 percent of theriparian forest along themainstem South Santiam river ismore than 100 feet wide.
Reaches of the South SantiamRiver below Green Peter andFoster dams are deprived oflarge wood.
Extensive recreationaluse of the lower river(boating and fishing)harasses migrating,and holding fish.
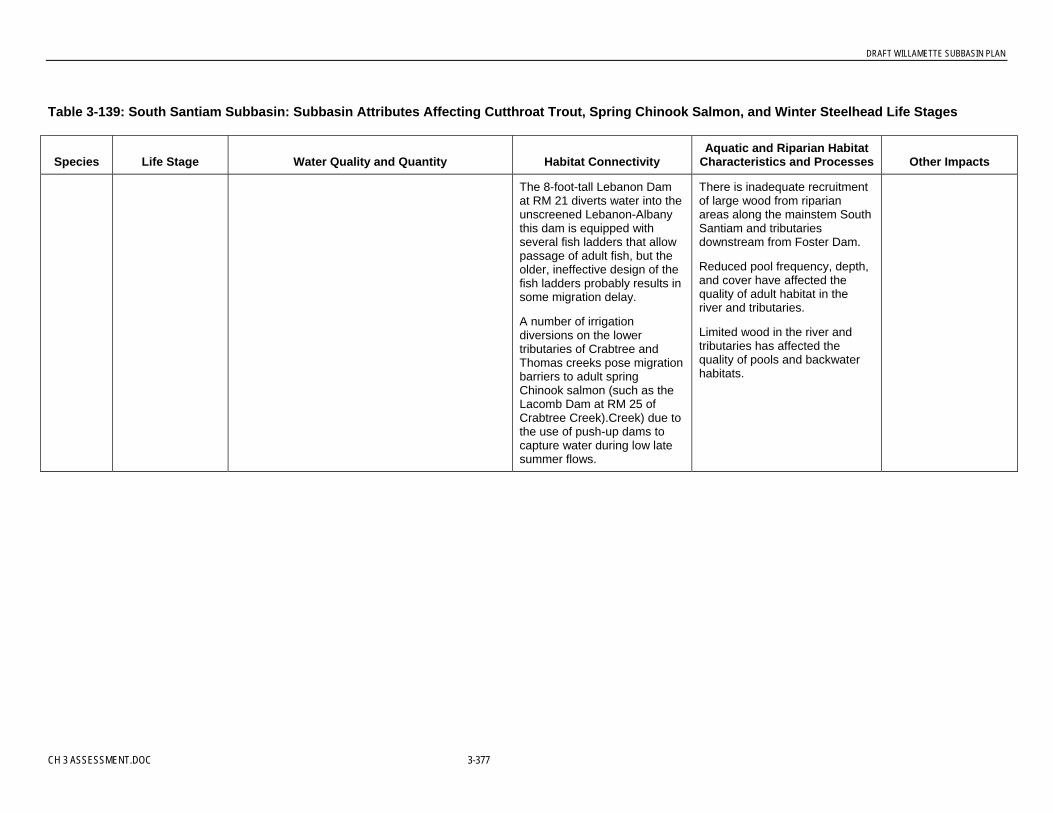
DRAFT WILLAMETTE SUBBASIN PLAN
CH 3 ASSESSMENT.DOC 3-377
Table 3-139: South Santiam Subbasin: Subbasin Attributes Affecting Cutthroat Trout, Spring Chinook Salmon, and Winter Steelhead Life Stages
Species Life Stage Water Quality and Quantity Habitat ConnectivityAquatic and Riparian Habitat
Characteristics and Processes Other Impacts
The 8-foot-tall Lebanon Damat RM 21 diverts water into theunscreened Lebanon-Albanythis dam is equipped withseveral fish ladders that allowpassage of adult fish, but theolder, ineffective design of thefish ladders probably results insome migration delay.
A number of irrigationdiversions on the lowertributaries of Crabtree andThomas creeks pose migrationbarriers to adult springChinook salmon (such as theLacomb Dam at RM 25 ofCrabtree Creek).Creek) due tothe use of push-up dams tocapture water during low latesummer flows.
There is inadequate recruitmentof large wood from riparianareas along the mainstem SouthSantiam and tributariesdownstream from Foster Dam.
Reduced pool frequency, depth,and cover have affected thequality of adult habitat in theriver and tributaries.
Limited wood in the river andtributaries has affected thequality of pools and backwaterhabitats.
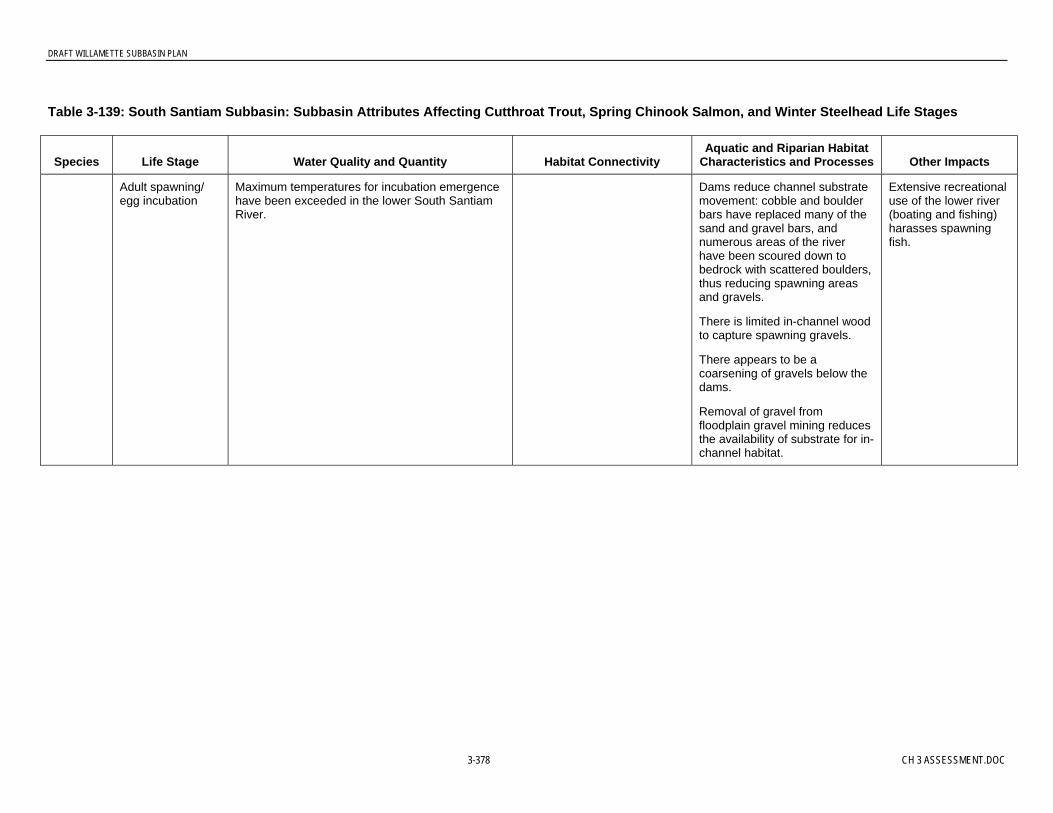
DRAFT WILLAMETTE SUBBASIN PLAN
3-378 CH 3 ASSESSMENT.DOC
Table 3-139: South Santiam Subbasin: Subbasin Attributes Affecting Cutthroat Trout, Spring Chinook Salmon, and Winter Steelhead Life Stages
Species Life Stage Water Quality and Quantity Habitat ConnectivityAquatic and Riparian Habitat
Characteristics and Processes Other Impacts
Adult spawning/egg incubation
Maximum temperatures for incubation emergencehave been exceeded in the lower South SantiamRiver.
Dams reduce channel substratemovement: cobble and boulderbars have replaced many of thesand and gravel bars, andnumerous areas of the riverhave been scoured down tobedrock with scattered boulders,thus reducing spawning areasand gravels.
There is limited in-channel woodto capture spawning gravels.
There appears to be acoarsening of gravels below thedams.
Removal of gravel fromfloodplain gravel mining reducesthe availability of substrate for in-channel habitat.
Extensive recreationaluse of the lower river(boating and fishing)harasses spawningfish.

DRAFT WILLAMETTE SUBBASIN PLAN
CH 3 ASSESSMENT.DOC 3-379
Table 3-139: South Santiam Subbasin: Subbasin Attributes Affecting Cutthroat Trout, Spring Chinook Salmon, and Winter Steelhead Life Stages
Species Life Stage Water Quality and Quantity Habitat ConnectivityAquatic and Riparian Habitat
Characteristics and Processes Other Impacts
Fry and juvenilerearing andmigration
Flow fluctuations blow Green Peter Dam nowoccur at rates rapid enough to entrap and strandjuvenile anadromous fish.
Water temperatures in the South Santiam Riverexceed water quality criteria for summermaximums for juvenile rearing and migration.
Diversions (see habitat connectivity): Low summerflows in specific reaches may reduce juvenilerearing habitat areas.
Reduced recruitment of large wood has limitedcreation of new gravel bars; hyporheic flowthrough gravel bars can cool water, which providescool-water rearing habitats.
Juveniles are entrained intothe unscreened Lebanon Dam(RM 21), which diverts waterinto the Lebanon-Albanypower canal for irrigation,hydropower, and municipaluse.
The floodplain is not inundatedfrequently, which results inreductions in over-bank flowand side-channel connectivity,nutrient exchange, sedimentexchange, and flood refugia forfish. In addition, new riparianforests are established.
Numerous partial andcomplete fish passage barriersat culverts on tributary streamslimit juvenile upstreammovement into rearing andrefuge habitat.
Frequency of flows not ofsufficient magnitude to createand maintain channel complexityand provide nutrient, organicmatter, and sediment inputs fromfloodplain areas.
Reed canary grass andHimalayan blackberry in theaquatic and riparian area limitthe growth of robust nativevegetation needed for habitatand channel formationprocesses in the lower subbasin.
Large wood in reaches of theriver below Foster Dam islimited, which reduces theformation of pools and sidechannels.
There has been significant lossof wetland, floodplain, and off-channel habitats and associatedhabitat complexity, whichreduces habitat quality.
Introduced fishspecies (small- andlarge-mouth bass, forexample) may prey onjuveniles.
Salmon carcasses arereduced from historicallevels, limiting nutrientinputs to the systemand thus foodavailability for rearingfish.
Hatchery fish havebeen introduced toareas above andbelow the dams,increasing competitionwith native fish forhabitat and food.

DRAFT WILLAMETTE SUBBASIN PLAN
3-380 CH 3 ASSESSMENT.DOC
Table 3-139: South Santiam Subbasin: Subbasin Attributes Affecting Cutthroat Trout, Spring Chinook Salmon, and Winter Steelhead Life Stages
Species Life Stage Water Quality and Quantity Habitat ConnectivityAquatic and Riparian Habitat
Characteristics and Processes Other Impacts
WinterSteelheadTrout
Adult migrationand holding
Flow reductions associated with diversions forirrigation, domestic, and industrial water usescontribute to low flow conditions in the river and itstributaries, particularly in late summer and earlyfall.
Operation of U.S. Army Corps of Engineersreservoirs has reduced spring/summertemperatures in the South Santiam River andincreased temperatures during most of the rest ofthe year.
Water temperatures in the South Santiam Riverexceed water quality criteria for summer maximaadult migration (64°F) during most of the rest ofthe year.
Several older fish laddersallow passage of adult springChinook salmon but probablycause some migration delay.
Irrigation diversions on thelower tributaries of Crabtreeand Thomas creeks posemigration barriers to adultspring Chinook.
Foster Dam: While there isprobably mortality at the dam,there are no estimates ofupstream passage mortality atthe dam.
Foster Dam’s dated designdoes not allow facilities forholding, handling, examining,and sorting hatchery- fromnatural-origin fish.
Green Peter Dam does notallow passage of adult fish.
The 8-foot-tall Lebanon Damat RM 21 diverts water into theunscreened Lebanon-Albanythis dam is equipped withseveral fish ladders that allowpassage of adult fish, but thefish ladders’ older, ineffectivedesign probably results insome migration delay.
Some forests in the uppersubbasin are dominated byearly- to mid-successionalstages, but up to 39 percent ofthe Middle Santiam and 43percent of the Quartzvilledrainages contain late-successional forests.
Riparian areas in uppersubbasin tributaries aredominated by late-successionalvegetation on federal land andearly-successional vegetation onprivate lands.
Width and continuity of riparianareas are good along Thomasand Crabtree creeks in the lowerSouth Santiam Subbasin, butalmost all vegetation is less than80 years old.
Less than 30 percent of theriparian forest along themainstem South Santiam Riveris more than 100 feet wide.
Reaches of the South SantiamRiver below Green Peter andFoster dams are deprived oflarge wood.
There is inadequate recruitmentof large wood from riparianareas along the mainstem SouthSantiam and tributariesdownstream from Foster Dam.
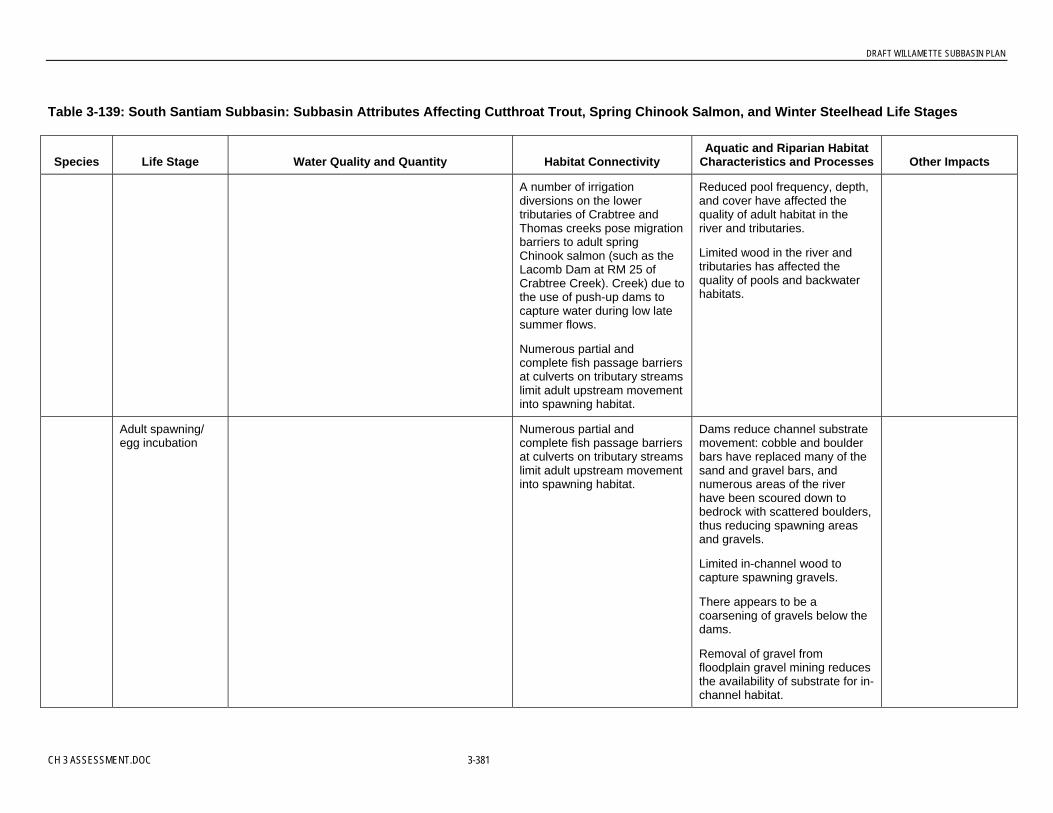
DRAFT WILLAMETTE SUBBASIN PLAN
CH 3 ASSESSMENT.DOC 3-381
Table 3-139: South Santiam Subbasin: Subbasin Attributes Affecting Cutthroat Trout, Spring Chinook Salmon, and Winter Steelhead Life Stages
Species Life Stage Water Quality and Quantity Habitat ConnectivityAquatic and Riparian Habitat
Characteristics and Processes Other Impacts
A number of irrigationdiversions on the lowertributaries of Crabtree andThomas creeks pose migrationbarriers to adult springChinook salmon (such as theLacomb Dam at RM 25 ofCrabtree Creek). Creek) due tothe use of push-up dams tocapture water during low latesummer flows.
Numerous partial andcomplete fish passage barriersat culverts on tributary streamslimit adult upstream movementinto spawning habitat.
Reduced pool frequency, depth,and cover have affected thequality of adult habitat in theriver and tributaries.
Limited wood in the river andtributaries has affected thequality of pools and backwaterhabitats.
Adult spawning/egg incubation
Numerous partial andcomplete fish passage barriersat culverts on tributary streamslimit adult upstream movementinto spawning habitat.
Dams reduce channel substratemovement: cobble and boulderbars have replaced many of thesand and gravel bars, andnumerous areas of the riverhave been scoured down tobedrock with scattered boulders,thus reducing spawning areasand gravels.
Limited in-channel wood tocapture spawning gravels.
There appears to be acoarsening of gravels below thedams.
Removal of gravel fromfloodplain gravel mining reducesthe availability of substrate for in-channel habitat.

DRAFT WILLAMETTE SUBBASIN PLAN
3-382 CH 3 ASSESSMENT.DOC
Table 3-139: South Santiam Subbasin: Subbasin Attributes Affecting Cutthroat Trout, Spring Chinook Salmon, and Winter Steelhead Life Stages
Species Life Stage Water Quality and Quantity Habitat ConnectivityAquatic and Riparian Habitat
Characteristics and Processes Other Impacts
Fry and juvenilerearing andmigration
Flow fluctuations blow Green Peter Dam nowoccur at rates rapid enough to entrap and strandjuvenile anadromous fish.
Water temperatures in the South Santiam Riverexceed water quality criteria for summer maximafor juvenile rearing and migration.
Diversions (see habitat connectivity): Low summerflows in specific reaches may reduce juvenilerearing habitat areas.
Reduced recruitment of large wood has limitedcreation of new gravel bars; hyporheic flowthrough gravel bars can cool water, which providescool-water rearing habitats.
Juveniles are entrained intothe unscreened Lebanon Dam(RM 21), which diverts waterinto the Lebanon-Albanypower canal for irrigation,hydropower, and municipaluse.
Floodplain is not inundatedfrequently, which reducesover-bank flow and side-channel connectivity, nutrientexchange, sedimentexchange, and flood refugia forfish. In addition, new riparianforests are established.
Numerous partial andcomplete fish passage barriersat culverts on tributary streamslimit juvenile upstreammovement into rearing andrefuge habitat.
Frequency of flows not ofsufficient magnitude to createand maintain channel complexityand provide nutrient, organicmatter, and sediment inputs fromfloodplain areas.
Reed canary grass andHimalayan blackberry in theaquatic and riparian area limitthe growth of robust nativevegetation needed for habitatand channel formationprocesses in the lower subbasin.
Large wood in reaches of theriver below Foster Dam islimited, which reduces theformation of pools and sidechannels.
There has been significant lossof wetland, floodplain, and off-channel habitats and associatedhabitat complexity, whichreduces habitat quality.
Introduced fishspecies (small- andlarge-mouth bass, forexample) may prey onjuveniles.
Salmon carcasses arereduced from historicallevels, limiting nutrientinputs to the systemand thus foodavailability for rearingfish.
Hatchery fish havebeen introduced toareas above andbelow the dams,increasing competitionwith native fish forhabitat and food.
Source: U.S. Army Corps of Engineers, 2001; Wevers et al., 1992; E&S, 2000; ORDEQ, 2003; Mamoyac, ODFW, personal communication, 2004.

DRAFT WILLAMETTE SUBBASIN PLAN
CH 3 ASSESSMENT.DOC 3-383
Table 3-140: South Santiam Subbasin: Subbasin Attributes Affecting Oregon Chub
Species Life Stage Water Quality and Quantity Habitat ConnectivityAquatic and Riparian Habitat
Characteristics and Processes Other Impacts
Oregonchub
All Low dissolved oxygen may be a contributingfactor in suppressed population numbers at FosterPullout Pond.
Frequency and magnitude of high flows are notsufficient to create and maintain channelcomplexity and provide nutrient, organic matter,and sediment inputs from floodplain areas.
The lower South SantiamSubbasin tends to interact withits floodplain relativelyfrequently compared to otherbasins that contain Oregonchub populations (the majordams are farther up the basincompared to other systems).While this is a benefit for thedispersal of Oregon chub andcolonization of new habitat, italso allows nonnativepredaceous fish to accessOregon chub habitats.
Reed canary grass andHimalayan blackberry in theaquatic and riparian area limitthe growth of robust nativevegetation needed for habitatand channel formationprocesses.
There has been significant lossof wetland, floodplain, and off-channel habitats and associatedhabitat complexity, reducinghabitat quality.
Exotic warm-waterpredaceous fish are asignificant threat toOregon chub survival.
Source: USFWS, 1998; ODFW, 2004.
DRAFT WILLAMETTE SUBBASIN PLAN
3-384 CH 3 ASSESSMENT.DOC
Fish Passage Barriers. While Green Peter and Foster Dams are equipped with fish passagefacilities, there are fish passage issues at both dams. The facility at Green Peter Dam is nolonger in use, effectively blocking all upstream access. The trap and haul facility at FosterDam is still in use, but there is no accurate measure of spring Chinook salmon or steelheadmortality (U.S. Army Corps of Engineers, 2001). The fishway and trap for upstreammigrating adults, while functional, is labor intensive and requires fish be transported abovethe dam to prevent fallback (Mamoyac, ODFW, personal communication, 2004). Thereappears to be fairly good survival at the dam for out-migrating juvenile steelhead andChinook salmon, although there is some mortality and injury.
In addition to the dams that block fish access to the upper subbasin, other dams, diversions,and road crossing culverts are obstacles to fish passage. Numerous culverts throughout thesubbasin act as partial or complete fish passage barriers (Mamoyac, ODFW, personalcommunication, 2004). In the lower subbasin, Lebanon Dam, which diverts water formunicipal and other uses, delays upstream passage of fish. The diversion associated with thisdam has not been screened and can entrain juveniles, although the City of Albany is workingon improvements to the diversion and fish ladder (Mamoyac, ODFW, personalcommunication, 2004). A number of irrigation diversions on the lower tributaries of Crabtreeand Thomas creeks pose migration barriers to adult spring Chinook salmon (such as theLacomb Dam at RM 25 of Crabtree Creek) as a result of the use of push-up dams to capturewater during low late summer flows (E&S 2000).
Appendix G shows specific fish passage barriers on the South Santiam, based on May 2004data from ODFW; the information was compiled from existing ODFW databases.
Water Quality Changes. Water quality has been modified throughout the subbasin, withmost of the impacts in the lower subbasin. Water temperatures exceed criteria in the SouthSantiam River and many of the tributaries. In general, water temperatures are lower in theforested upper subbasin. High water temperatures in the lower subbasin are aggravated byloss of riparian cover, reduced wetland areas, and channel simplification (E&S, 2000).Although landslides and erosion in the subbasin have contributed to pulses of turbidity,sedimentation levels do not appear to be affecting fish populations (U.S. Army Corps ofEngineers, 2001; Oregon Department of Environmental Quality, 2004). Toxic runoff doesnot appear to affect fish populations (Mamoyac, ODFW, personal communication, 2004).
Large Wood. Historical removal of large wood from the river and tributary streams, reducedtransport of wood below the dams, and changes in riparian vegetation all have interacted toreduce the quantity and distribution of large wood in the river and tributaries. Mature riparianforests make up a very small proportion of the floodplain and riparian vegetation along theriver and tributaries in the lower subbasin (E&S, 2000). There is a greater extent and moreconnectivity of riparian vegetation in the upper subbasin than in the lower, but levels ofmature and old-growth coniferous forests are reduced (U.S. Army Corps of Engineers, 2001).Foster and Green Peter dams block transport of large wood from 50 percent of the subbasin(U.S. Army Corps of Engineers, 2001). Limited wood in the river and tributary channelslimits the formation of pools, thus reducing hiding areas for adult fish and restricting thequality and quantity of juvenile rearing habitat.
Habitat Connectivity. Backwater habitats, including pool margins, side channels, andalcoves, are reduced from historical levels. Actions to stabilize the lower river through the

DRAFT WILLAMETTE SUBBASIN PLAN
CH 3 ASSESSMENT.DOC 3-385
placement of riprap along banks (and other actions) and limited large wood in the channelhave interacted to reduce the quantity and quality of backwater habitats. More than 35percent of the lower river’s channel is constrained by revetments (U.S. Army Corps ofEngineers, 2001). In addition, changes in the frequency and magnitude of high flow eventsbelow the dams have altered the formation of these complex habitats (U.S. Army Corps ofEngineers, 2001). Backwater areas in the river and lower tributaries provide key habitats foradult and juvenile cutthroat tout, juvenile spring Chinook salmon, and winter steelhead.These habitats provide fish with habitat for foraging and refuge from high flow events.Backwater habitats are essential for the establishment and survival if Oregon chub at all lifestages.
Key Factors Limiting Fish Populations. The U.S. Army Corps of Engineers dams dividethe South Santiam Subbasin, with the upper and lower portions of the subbasin beingcharacterized by different patterns of aquatic and riparian habitat, hydrologic regimes, waterquality characteristics, and fish species distributions. For this reason, factors limitingpopulations for the focal fish species are assessed separately for the upper and lowersubbasins.
Limiting Factors in the Lower South Santiam Subbasin. In the lower South Santiamsubbasin, the productivity, capacity, and diversity of cutthroat trout, winter steelhead, andspring Chinook populations are limited by the following factors:
• Habitat Connectivity. Modification of the river’s high flow regime from dam regulation,channel and bank confinement through riprap and other actions, and reduced large woodin the channels have interacted to reduce backwater habitats important for juvenilerearing and winter refuge.
• Habitat Modification. Modified key aquatic habitats have affected all life stages.Limited spawning areas and reduced levels of gravels / small cobbles have reduced theareas available for spawning.
• Large Wood. Changes in the delivery and transport of large wood in the river andtributaries has modified gravel deposition patterns, reduced the frequency and depth ofpools, and minimized hiding cover for adult and juvenile fish.
• Flow Diversions. Flow diversions in the river impede upstream movement of adult fishand can contribute to juvenile mortality.
• Withdrawals. Unscreened water withdrawals affect juvenile fish.
• Water Temperatures. Changes in high and low water temperature regimes have affectedadult spawning success, impacted egg incubation, and limited the capacity of river andtributary streams to support juvenile fish.
• Fish Passage Barriers. The U.S. Army Corps of Engineers dams on the river and fishpassage barriers at road crossings on tributary streams prevent access into historicalspring Chinook salmon and winter steelhead spawning areas, block the interchangebetween the upper and lower subbasin cutthroat trout populations, and limit juvenileaccess into rearing and refuge habitat.
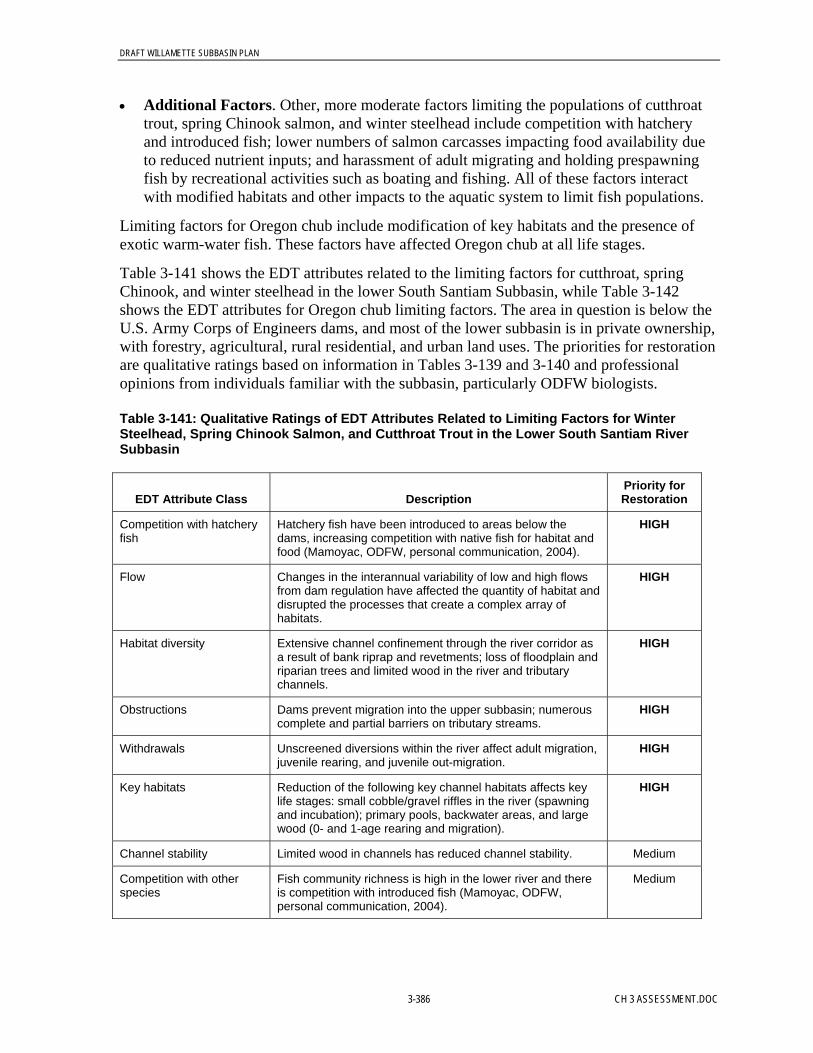
DRAFT WILLAMETTE SUBBASIN PLAN
3-386 CH 3 ASSESSMENT.DOC
• Additional Factors. Other, more moderate factors limiting the populations of cutthroattrout, spring Chinook salmon, and winter steelhead include competition with hatcheryand introduced fish; lower numbers of salmon carcasses impacting food availability dueto reduced nutrient inputs; and harassment of adult migrating and holding prespawningfish by recreational activities such as boating and fishing. All of these factors interactwith modified habitats and other impacts to the aquatic system to limit fish populations.
Limiting factors for Oregon chub include modification of key habitats and the presence ofexotic warm-water fish. These factors have affected Oregon chub at all life stages.
Table 3-141 shows the EDT attributes related to the limiting factors for cutthroat, springChinook, and winter steelhead in the lower South Santiam Subbasin, while Table 3-142shows the EDT attributes for Oregon chub limiting factors. The area in question is below theU.S. Army Corps of Engineers dams, and most of the lower subbasin is in private ownership,with forestry, agricultural, rural residential, and urban land uses. The priorities for restorationare qualitative ratings based on information in Tables 3-139 and 3-140 and professionalopinions from individuals familiar with the subbasin, particularly ODFW biologists.
Table 3-141: Qualitative Ratings of EDT Attributes Related to Limiting Factors for WinterSteelhead, Spring Chinook Salmon, and Cutthroat Trout in the Lower South Santiam RiverSubbasin
EDT Attribute Class DescriptionPriority forRestoration
Competition with hatcheryfish
Hatchery fish have been introduced to areas below thedams, increasing competition with native fish for habitat andfood (Mamoyac, ODFW, personal communication, 2004).
HIGH
Flow Changes in the interannual variability of low and high flowsfrom dam regulation have affected the quantity of habitat anddisrupted the processes that create a complex array ofhabitats.
HIGH
Habitat diversity Extensive channel confinement through the river corridor asa result of bank riprap and revetments; loss of floodplain andriparian trees and limited wood in the river and tributarychannels.
HIGH
Obstructions Dams prevent migration into the upper subbasin; numerouscomplete and partial barriers on tributary streams.
HIGH
Withdrawals Unscreened diversions within the river affect adult migration,juvenile rearing, and juvenile out-migration.
HIGH
Key habitats Reduction of the following key channel habitats affects keylife stages: small cobble/gravel riffles in the river (spawningand incubation); primary pools, backwater areas, and largewood (0- and 1-age rearing and migration).
HIGH
Channel stability Limited wood in channels has reduced channel stability. Medium
Competition with otherspecies
Fish community richness is high in the lower river and thereis competition with introduced fish (Mamoyac, ODFW,personal communication, 2004).
Medium
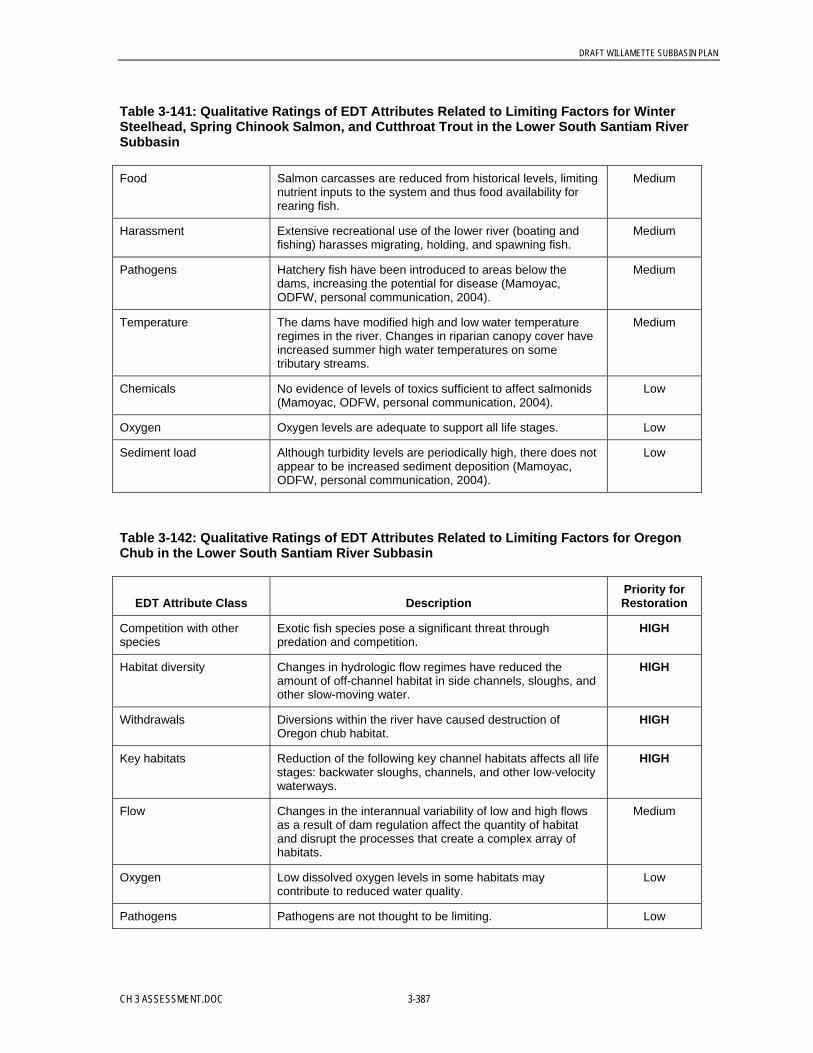
DRAFT WILLAMETTE SUBBASIN PLAN
CH 3 ASSESSMENT.DOC 3-387
Table 3-141: Qualitative Ratings of EDT Attributes Related to Limiting Factors for WinterSteelhead, Spring Chinook Salmon, and Cutthroat Trout in the Lower South Santiam RiverSubbasin
Food Salmon carcasses are reduced from historical levels, limitingnutrient inputs to the system and thus food availability forrearing fish.
Medium
Harassment Extensive recreational use of the lower river (boating andfishing) harasses migrating, holding, and spawning fish.
Medium
Pathogens Hatchery fish have been introduced to areas below thedams, increasing the potential for disease (Mamoyac,ODFW, personal communication, 2004).
Medium
Temperature The dams have modified high and low water temperatureregimes in the river. Changes in riparian canopy cover haveincreased summer high water temperatures on sometributary streams.
Medium
Chemicals No evidence of levels of toxics sufficient to affect salmonids(Mamoyac, ODFW, personal communication, 2004).
Low
Oxygen Oxygen levels are adequate to support all life stages. Low
Sediment load Although turbidity levels are periodically high, there does notappear to be increased sediment deposition (Mamoyac,ODFW, personal communication, 2004).
Low
Table 3-142: Qualitative Ratings of EDT Attributes Related to Limiting Factors for OregonChub in the Lower South Santiam River Subbasin
EDT Attribute Class DescriptionPriority forRestoration
Competition with otherspecies
Exotic fish species pose a significant threat throughpredation and competition.
HIGH
Habitat diversity Changes in hydrologic flow regimes have reduced theamount of off-channel habitat in side channels, sloughs, andother slow-moving water.
HIGH
Withdrawals Diversions within the river have caused destruction ofOregon chub habitat.
HIGH
Key habitats Reduction of the following key channel habitats affects all lifestages: backwater sloughs, channels, and other low-velocitywaterways.
HIGH
Flow Changes in the interannual variability of low and high flowsas a result of dam regulation affect the quantity of habitatand disrupt the processes that create a complex array ofhabitats.
Medium
Oxygen Low dissolved oxygen levels in some habitats maycontribute to reduced water quality.
Low
Pathogens Pathogens are not thought to be limiting. Low

DRAFT WILLAMETTE SUBBASIN PLAN
3-388 CH 3 ASSESSMENT.DOC
Limiting Factors in the Upper South Santiam Subbasin. Historically the upper subbasinwas an important spawning and juvenile rearing area for cutthroat trout, spring Chinook, andwinter steelhead, although Oregon chub have not been found—and are not expected tooccur—a above U.S. Army Corps of Engineers dams. In contrast to the large-scalemodification of the lower subbasin, most of the impacts to habitat and water quality in theupper subbasin are localized. Currently, limiting factors for cutthroat, spring Chinook, andwinter steelhead in the upper subbasin are as follows:
• Channel and Habitat Modification. Roads next to stream channels have increasedchannel confinement and reduced riparian vegetation and canopy cover, but not to theextent as in the lower subbasin.
• Large Wood. There are systematic changes to the levels of large wood in the river andstream channels of the upper subbasin. Past management of riparian areas and streamcleaning practices have led to reduced large wood loads in the aquatic system. Reducedin-channel wood has modified gravel deposition patterns, reduced the frequency anddepth of pools, and minimized hiding cover for adult and juvenile fish.
• Additional Factors. Other, more moderate factors limiting fish populations includepartial and complete barriers to fish passage on tributary streams, changes in watertemperature regimes from reduced canopy cover, competition with hatcheryintroductions, and lower numbers of salmon carcasses, which reduces nutrient inputs andthus food availability.
Table 3-143 shows the attributes limiting cutthroat, spring Chinook, and winter steelhead inthe upper South Santiam Subbasin, above the U.S. Army Corps of Engineers dams. This areais primarily under U.S. Forest Service management. Again, the table presents qualitativeratings based on the information in Table 3-139 and professional opinions from individualsfamiliar with the subbasin, particularly ODFW biologists.
Table 3-143: Qualitative Ratings of EDT Attributes Related to Limiting Factors for WinterSteelhead, Spring Chinook Salmon, and Cutthroat Trout Life Stages in the Upper SouthSantiam River Subbasin
EDT Attribute Class DescriptionPriority forRestoration
Habitat diversity The quality of habitat has been affected by limited largewood and moderate channel confinement through the rivercorridor as a result of bank riprap along the highway andsecondary roads.
HIGH
Key habitats Reduction of the following key channel habitats affects keylife stages: primary pools, backwater areas, and large wood.
HIGH
Channel stability In some areas limited in-channel wood and reduced riparianfunction has destabilized channels.
Medium
Competition with hatcheryfish
Hatchery fish have been introduced to areas above thedams, increasing competition with native fish for habitat andfood (Mamoyac, ODFW, personal communication, 2004).
Medium

DRAFT WILLAMETTE SUBBASIN PLAN
CH 3 ASSESSMENT.DOC 3-389
Table 3-143: Qualitative Ratings of EDT Attributes Related to Limiting Factors for WinterSteelhead, Spring Chinook Salmon, and Cutthroat Trout Life Stages in the Upper SouthSantiam River Subbasin
EDT Attribute Class DescriptionPriority forRestoration
Food Salmon carcasses are reduced from historical levels, limitingnutrient inputs to the system and thus food availability forrearing fish.
Medium
Obstructions Some complete and partial barriers on tributary streams. Medium
Pathogens Hatchery fish have been introduced to areas above thedams, increasing the potential for disease (Mamoyac,ODFW, personal communication, 2004).
Medium
Temperature Changes in riparian canopy cover have increased summerhigh water temperatures on some tributary streams.
Medium
Chemicals No evidence of levels of toxics sufficient to affect salmonids(Mamoyac, ODFW, personal communication, 2004).
Low
Competition with otherspecies
Very low number of introduced fish species present. Low
Flow There have not been significant changes in the interannualvariability of low and high flows.
Low
Harassment Moderate recreational use of the upper river (boating andfishing) harasses migrating, holding, and spawning fish.
Low
Oxygen Oxygen levels are adequate to support all life stages. Low
Sediment load Although turbidity levels are periodically high, there does notappear to be increased sediment deposition.
Low
Withdrawals Minimal water withdrawals. Low
3.5.1.11 Limiting Factors in the Tualatin SubbasinThis section describes the Tualatin Basin in terms of geographic setting and environmentalconditions and presents information on the limiting factors for focal species found in thesubbasin: cutthroat trout and spring Chinook.
Focal species present:• Cutthroat trout• Spring Chinook salmon (juvenile rearing and refuge; lower basin only)• Winter steelhead
Focal species present historically:• Oregon chub
Geographic Setting. The Tualatin Subbasin covers an area of 707 square miles on theeastern slope of the Coast Range and the floor of the Willamette Valley. The Tualatin Riveris approximately 80 miles long and enters the Willamette River at RM 29. Approximately 93percent of the land in the subbasin is privately owned. Most of the private lands are in
DRAFT WILLAMETTE SUBBASIN PLAN
3-390 CH 3 ASSESSMENT.DOC
forestry, agricultural, rural residential, and urban land uses. About half of the subbasin isforested (Murtagh et al., 1992). Urban lands cover a substantial portion of the lowersubbasin, including the cities of Forest Grove, Tigard, Lake Oswego, and West Linn and thesouthwest portion of Portland. The Salem District of the BLM and the Oregon Department ofForestry manage a small portion of the upper subbasin.
The Tualatin River, primarily in Gales Creek, has a small number of naturally spawningwinter steelhead. There is evidence that winter steelhead are native to the subbasin, but theyare not considered a self-sustaining population (Myers et al., 2003). In addition, juvenileChinook salmon have been observed using the lower portions of the river as rearing andwinter refuge habitat. Cutthroat trout exist in all of the subbasin’s streams, and historicallythere was a population that moved between the river and the Willamette River mainstem(Murtagh et al., 1992). Cutthroat trout and winter steelhead have similar habitatrequirements.
The Tualatin River’s headwaters are on the forested east side of the Coast Range. The river’sheadwaters flow through private industrial, state, and federal forestlands, small-acreagefarms, and rural residential areas until the river reaches the floor of the Willamette Valleynear Cherry Grove (RM 68). Major tributaries in the forested upper subbasin includeScoggins, Gales, and Dairy creeks. In the lower subbasin, the Tualatin River flows throughagricultural lands and scattered rural residential areas and near numerous small communitiesand cities. McKay, Rock, and Fanno creeks are major tributaries in the lower subbasin.
The Coast Range bedrock in the upper subbasin is composed predominantly of sedimentaryrocks with some volcanic formations. Most of the subbasin lies below 1,000 feet in elevation.The upper subbasin drains the Coast Range, but most of the river and the larger tributariesflow through the Willamette Valley’s recent alluvial deposits. The Coast Range sedimentaryrocks have lower groundwater storage capacity than is the case in the Cascade Mountains,and the streams within the Tualatin Subbasin have lower summertime flows and higher watertemperatures than do Cascade Range streams. The subbasin’s high flow runoff patterns aredominated by a rain-on-snow hydrology in the mid- to upper elevations and rain-dominatedflow patterns in the lower subbasin, which leads to rapid delivery of water to the streamnetwork. As a result of the subbasin’s low elevations and the Coast Range geology,summertime stream flows are not supplemented by snowmelt or numerous spring-fedsources.
The headwaters of the Tualatin River and tributaries of the upper subbasin flow steeply offthe Coast Range. After the river and tributaries enter the Willamette Valley the gradientdecreases and the river meanders through the alluvial deposits of the Willamette Valley.These low-gradient areas in the lower subbasin create reaches with slow-moving water thatare prone to high temperatures during the summer and early fall (Murtagh et al., 1992).
Environmental Conditions. Altered subbasin processes, modified riparian and aquatichabitat, and limited access to historical spawning and rearing areas in the Tualatin Subbasinhave affected the population productivity, capacity, and diversity of cutthroat trout andjuvenile spring Chinook salmon. Table 3-144 summarizes changes in the subbasin’senvironmental conditions and how these changes have affected cutthroat trout and juvenilespring Chinook salmon life stages.
DRAFT WILLAMETTE SUBBASIN PLAN
CH 3 ASSESSMENT.DOC 3-391
Upper and Lower Subbasins. Relative to the lower subbasin, the forested upland portionsof the upper subbasin have aquatic habitat that is closer to the historical baseline, with thehighest proportion of functioning riparian areas, largest amounts of large wood in the riverand tributary channels, and higher quality aquatic habitats (Baker et al., 2002; Murtagh et al.,1992). In the lower Tualatin Subbasin, with its extensive agricultural and urban land uses,impacts to aquatic and riparian habitats have been greater than in the forested upper subbasin.Historically, the lower subbasin was characterized by very complex and productive fishhabitat because largest proportion of unconstrained river and stream channels were in thearea where the Tualatin River flowed across the flat Willamette Valley (Pacific NorthwestEcosystem Research Consortium, 2002).
Large Wood. Historical removal of large wood from the river and tributary streams, reduceddelivery and transport of wood through channels, and changes in riparian vegetation all haveinteracted to reduce the quantity and distribution of large wood. Mature riparian forests makeup a small proportion of the riparian areas in the lower subbasin (Pacific NorthwestEcosystem Research Consortium, 2002). Most of the riparian areas in the lower subbasin arefragmented, have limited tree cover, or have been converted to other land uses (CleanWaterServices, 2004). Over time, a number of practices have reduced the quantity of large wood inthe Tualatin River and tributary channels throughout the subbasin (Murtagh et al., 1992).There is very little large wood in the channels, particularly in the form of large wood jams(Clean Water Services, 2004). While riparian areas in the forested upper subbasin havegreater numbers of conifer trees than the lower subbasin does, historical riparian harvests andwood removal from streams have reduced large wood in these channels. Reduced large woodin the river and tributary channels limits the formation of pools, thus reducing hiding areasfor adult fish and restricting the quality and quantity of juvenile rearing habitat.

DRAFT WILLAMETTE SUBBASIN PLAN
3-392 CH 3 ASSESSMENT.DOC
Table 3-144: Tualatin Subbasin: Subbasin Attributes Affecting Cutthroat Trout and Juvenile Spring Chinook Life Stages
Species Life Stage Water Quality and Quantity Habitat ConnectivityAquatic and Riparian Habitat
Characteristics and Processes Other Impacts
CutthroatTrout
Adult migrationand holding
Naturally low flows in the subbasin are aggravatedby water withdrawals, which increase watertemperatures.
High water temperatures are aggravated by loss ofriparian cover, reduced wetland areas, channelsimplification, and increased impervious surfaces.
Channelization of tributaries; modification of runoffpatterns as a result of agriculture, impervioussurfaces, and urban/residential development; andloss of storage capacity in floodplains and wetlandshave accelerated runoff and increased peak flows.
Nutrient and toxic runoff from agricultural andurban areas may be a problem.
Loss of wetlands and floodplain habitats hasaffected water quality and quantity (storage andtiming of peak and low flows).
The effects of low summer flows and high nutrientloads combine to create a poor environment for fishpassage and production.
Numerous culverts throughoutthe subbasin present barriersto adult refuge habitat.
Oregon Iron and Steel Dam onthe lower Tualatin River is apartial fish passage barrier(requires improvement of thefish ladder).
Henry Hagg Dam on ScogginsCreek is a fish passage barrier.
Limited wood in the tributariesand river channel has reducedthe frequency and depth of poolsand limited adult hiding cover.Limited large wood in channelsis particularly pronounced in thelower subbasin.
Riparian areas along the riverand tributaries, especially in thelower subbasin, are reduced inwidth, connectivity, and quality.
Reed canary grass andHimalayan blackberry in theaquatic and riparian area limitthe growth of robust nativevegetation needed for habitatand channel formationprocesses.
The loss of wetland, floodplain,and off-channel habitats hasaffected the quantity and qualityof adult holding areas.
Adultspawning/eggincubation
Numerous culverts throughoutthe subbasin present barriersto spawning habitat.
Limited wood in tributary streamshas reduced retention ofspawning gravels.

DRAFT WILLAMETTE SUBBASIN PLAN
CH 3 ASSESSMENT.DOC 3-393
Table 3-144: Tualatin Subbasin: Subbasin Attributes Affecting Cutthroat Trout and Juvenile Spring Chinook Life Stages
Species Life Stage Water Quality and Quantity Habitat ConnectivityAquatic and Riparian Habitat
Characteristics and Processes Other Impacts
Fry and juvenilerearing andmigration
Naturally low flows in the subbasin are aggravatedby water withdrawals, which may increase watertemperatures.
High water temperatures, particularly in the lowersubbasin, do not provide optimal conditions forjuvenile rearing.
Numerous culverts throughoutthe subbasin present barriersto juvenile access to rearingand refuge habitat.
The loss of connectivity tofloodplain and wetland habitatshas affected juvenile rearingand refuge habitat, particularlyin the lower subbasin.
Channels in the lower portions ofthe river and some tributarieshave been simplified throughrevetments and other actions.
Limited wood in the tributariesand river channel has reducedthe frequency and depth ofpools, thus limiting juvenilerearing and refuge habitat.
Riparian areas along the riverand tributaries are reduced inwidth, connectivity, and quality,particularly in the lowersubbasin.
The loss of wetland, floodplainand off-channel habitats hasaffected the quantity and qualityof juvenile rearing and refugeareas.
Introduced fishspecies (small- andlarge-mouth bass, forexample) may preyon juveniles.
SpringChinooksalmon
Fry and juvenilerearing andrefuge
Culverts in the lower subbasinpresent barriers to juvenileaccess refuge habitat.
Oregon Iron and Steel Dam onthe lower Tualatin River mayprevent juvenile fish fromaccessing rearing and refugehabitat.
The loss of wetland, floodplain,and off-channel habitats in thelower subbasin has affected thequantity and quality of juvenilerearing and refuge areas.
Source: Murtagh et al., 1992; Stahl, ODFW, personal communication, 2004; Clean Water Services, 2004.
DRAFT WILLAMETTE SUBBASIN PLAN
3-394 CH 3 ASSESSMENT.DOC
Water Quality Changes. Water quality has been modified throughout the subbasin, withmost of the dramatic impacts occurring in the lower subbasin. Water temperatures exceedcriteria in the Tualatin River and many of the tributaries. Naturally low flows in the subbasinare aggravated by water withdrawals, which increase water temperatures (Murtagh et al.,1992). In general, water temperatures are lower in the forested upper subbasin than in thelower subbasin. High water temperatures in the lower subbasin are aggravated by loss ofriparian cover, reduced wetland areas, channel simplification, and increased impervioussurfaces (Clean Water Services, 2004). Phosphorous and ammonia-nitrogen pollution hasbeen an ongoing issue in the subbasin. The effects of low summer flows and high nutrientloads combine to create a poor environment for fish passage and production (Murtagh et al.,1992). There is a TMDL process and other management practices in place to address excessphosphorous and nutrient loads (Oregon Department of Environmental Quality, 2004), buttoxic runoff from urban and agricultural land uses may affect fish populations (Stahl, ODFW,personal communication, 2004).
Changes in Flow Regimes. There have been extensive impacts to the subbasin’s hydrologicregimes. Changes in land use have affected hydrologic regimes in the tributaries.Channelization of tributaries; modification of runoff patterns as a result of agriculture,impervious surfaces, and urban/residential development; and loss of storage capacity infloodplains and wetlands have accelerated runoff and increased peak flows (Stahl, ODFW,personal communication, 2004). Consumptive uses from agricultural, industrial, and urbanuses throughout the subbasin seriously delete summertime low flows (Murtagh et al., 1992).
Fish Passage Barriers. Obstacles to fish passage are an issue throughout the subbasin. Ofthe several dams that limit upstream migration, Oregon Iron and Steel Dam on the lowerriver (RM 3.9) has the greatest impact on fish passage. This dam has a fish ladder but itseffectiveness appears to be limited (Stahl, ODFW, personal communication, 2004). Thelargest dam in the subbasin—on Scoggins Creek, forming Henry Hagg Lake—is notequipped for fish passage (Murtagh et al., 1992). The largest diversion in the system is theLake Oswego canal (RM 6.8), which is unscreened. There are also numerous unscreenedsmall diversions within the subbasin (Stahl, ODFW, personal communication, 2004). Inaddition to dams and diversions, numerous road crossing culverts in the lower and uppersubbasin block or limit fish passage. When fish passage above culverts is limited, the amountof habitat available for all cutthroat trout life stages is restricted.
Appendix G shows specific fish passage barriers on the Tualatin, based on May 2004 datafrom ODFW; the information was compiled from existing ODFW databases.
Habitat Connectivity. Backwater habitats, including pool margins, side channels, andalcoves, are reduced from historical levels. Actions to stabilize the lower river through theplacement of riprap along banks (and other actions) and limited large wood in the channelhave interacted to reduce the quantity and quality of backwater habitats. Large portions of thelower Tualatin River and sections of tributary streams have confined channels as a result ofriprapping, revetments, and roads along streams (Clean Water Services, 2004). Backwaterareas in the river and lower tributaries provide key habitats for adult and juvenile cutthroattout and juvenile spring Chinook salmon. These habitats provide fish with habitat forforaging and refuge from winter flood events.
DRAFT WILLAMETTE SUBBASIN PLAN
CH 3 ASSESSMENT.DOC 3-395
Key Factors Limiting Fish Populations. The upper and lower portions of the TualatinSubbasin are characterized by different patterns of aquatic and riparian habitat, hydrologicregimes, water quality characteristics, and fish species distributions. For this reason, factorslimiting populations for the focal fish species are assessed separately for the upper and lowersubbasins.
Limiting Factors in the Lower Tualatin Subbasin. In the lower Tualatin Subbasin, theproductivity, capacity, and diversity of cutthroat trout and juvenile Chinook salmonpopulations are limited by the following factors:
• Habitat Connectivity. Modification of river and tributary habitat through channel andbank confinement and reduced large wood in the channels have interacted to reducefloodplain connectivity and backwater habitats important for all cutthroat trout life stagesand juvenile Chinook salmon rearing and winter refuge.
• Habitat Modification. Modification of key aquatic habitats has affected all life stages.
• Large Wood. Changes in the delivery and transport of large wood in the river andtributaries has modified gravel deposition patterns, reduced the frequency and depth ofpools, and minimized hiding cover for adult and juvenile cutthroat trout and affectedjuvenile Chinook salmon rearing areas in the lower river.
• Water Temperature. Increased summertime water temperatures have affected adultcutthroat trout populations and limited the capacity of river and tributary streams tosupport juvenile fish.
• Fish Passage Barriers. Fish passage barriers at road crossings on tributary streams blockthe interchange between cutthroat trout populations and limit adult and juvenile accessinto rearing and refuge habitat.
• Additional Factors. Other factors limiting focal species include competition withintroduced fish, runoff of toxics from urban and agricultural areas, and some unscreenedwater diversions.
Table 3-145 shows the EDT attributes related to these limiting factors for cutthroat trout andspring Chinook in the lower Tualatin Subbasin, which is located largely on the WillametteValley floor and is held primarily in private ownership. The priorities for restoration arequalitative ratings based on the information in Table 3-144 and professional opinions fromindividuals familiar with the subbasin, particularly ODFW biologists.
Table 3-145: Qualitative Ratings of EDT Attributes Related to Limiting Factors forCutthroat Trout and Juvenile Spring Chinook in the lower Tualatin Subbasin
EDT Attribute Class DescriptionPriority forRestoration
Channel stability Limited wood in channels and reduced riparian function hasreduced channel stability.
HIGH
Flow There have been impacts to the interannual variability of lowand high flows as a result of land use practices and waterdiversions.
HIGH
DRAFT WILLAMETTE SUBBASIN PLAN
3-396 CH 3 ASSESSMENT.DOC
Table 3-145: Qualitative Ratings of EDT Attributes Related to Limiting Factors forCutthroat Trout and Juvenile Spring Chinook in the lower Tualatin Subbasin
EDT Attribute Class DescriptionPriority forRestoration
Habitat diversity Extensive channel confinement through the river corridor asa result of bank riprap and revetments; loss of floodplain andriparian trees and limited wood in the river and tributarychannels.
HIGH
Obstructions Dams on the river and Scoggins Creek prevent upstreamand downstream movement; numerous complete and partialbarriers on tributary streams.
HIGH
Temperature Changes in riparian canopy cover and water withdrawalshave increased summer high water temperatures on sometributary streams.
HIGH
Key habitats Reduction of the following key channel habitats affects keylife stages: primary pools, backwater areas, and large wood(0- and 1-age rearing and migration).
HIGH
Competition with otherspecies
Fish community richness is high and there is somecompetition with introduced fish (Stahl, ODFW, personalcommunication, 2004).
Medium
Chemicals There is little evidence that toxics are directly affectingsalmonids, although there are some high levels noted inmonitoring (see Table 1; Stahl, ODFW, personalcommunication, 2004).
Medium
Withdrawals Some problems from unscreened diversions (Stahl, ODFW,personal communication, 2004).
Medium
Competition with hatcheryfish
Competition with hatchery fish is not believed to besignificant (Stahl, ODFW, personal communication, 2004).
Low
Food Historically low salmon carcasses abundance. Low
Harassment Prespawning fish do not hold in the river channels. Low
Oxygen Oxygen levels are not known to be affecting focal species. Low
Pathogens Pathogens are not thought to be limiting (Stahl, ODFW,personal communication, 2004).
Low
Sediment load Although there are periodic high turbidity levels, sedimentdeposition does not appear to be affecting spawning areas(Stahl, ODFW, personal communication, 2004).
Low
Limiting Factors in the Upper Tualatin Subbasin. Historically the upper subbasin was animportant spawning and rearing area for both resident and fluvial cutthroat trout. In contrastto the large-scale modification of the lower subbasin, there is higher quality habitat in theupper subbasin, particularly in the forested upland areas. Currently, limiting factors forcutthroat trout in the upper subbasin are as follows:
• Channel and Habitat Modification. Roads next to stream channels have increasedchannel confinement and reduced riparian vegetation and canopy cover.
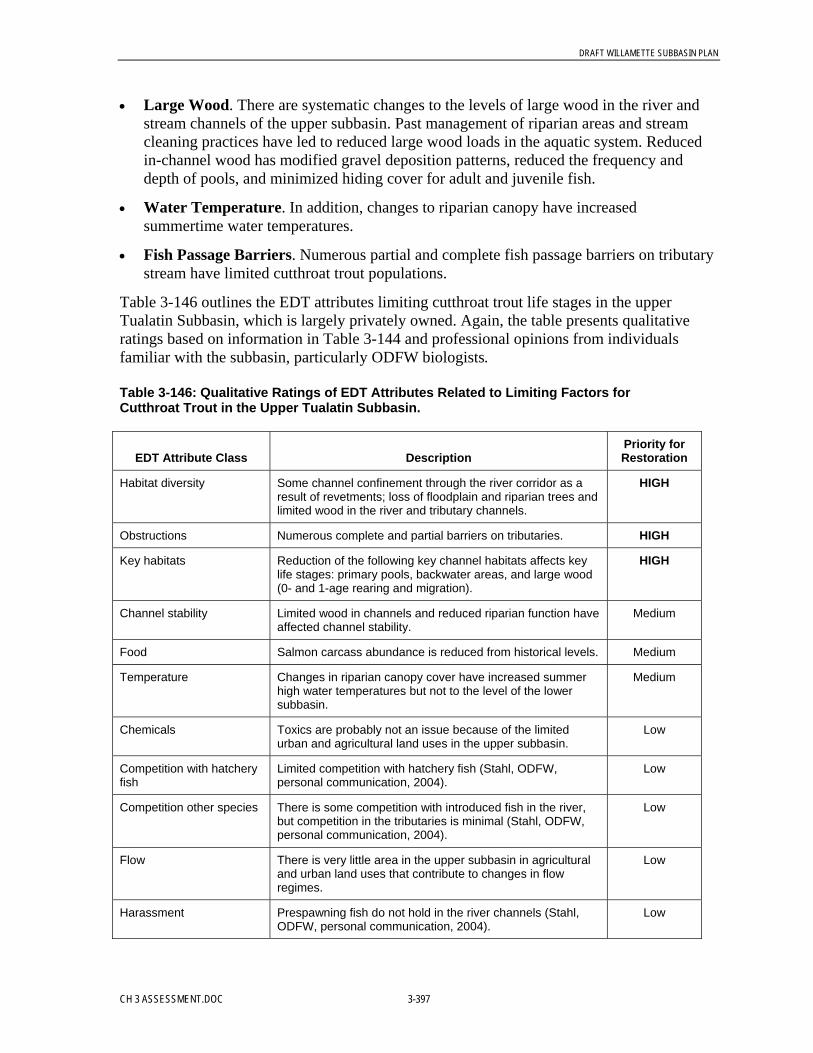
DRAFT WILLAMETTE SUBBASIN PLAN
CH 3 ASSESSMENT.DOC 3-397
• Large Wood. There are systematic changes to the levels of large wood in the river andstream channels of the upper subbasin. Past management of riparian areas and streamcleaning practices have led to reduced large wood loads in the aquatic system. Reducedin-channel wood has modified gravel deposition patterns, reduced the frequency anddepth of pools, and minimized hiding cover for adult and juvenile fish.
• Water Temperature. In addition, changes to riparian canopy have increasedsummertime water temperatures.
• Fish Passage Barriers. Numerous partial and complete fish passage barriers on tributarystream have limited cutthroat trout populations.
Table 3-146 outlines the EDT attributes limiting cutthroat trout life stages in the upperTualatin Subbasin, which is largely privately owned. Again, the table presents qualitativeratings based on information in Table 3-144 and professional opinions from individualsfamiliar with the subbasin, particularly ODFW biologists.
Table 3-146: Qualitative Ratings of EDT Attributes Related to Limiting Factors forCutthroat Trout in the Upper Tualatin Subbasin.
EDT Attribute Class DescriptionPriority forRestoration
Habitat diversity Some channel confinement through the river corridor as aresult of revetments; loss of floodplain and riparian trees andlimited wood in the river and tributary channels.
HIGH
Obstructions Numerous complete and partial barriers on tributaries. HIGH
Key habitats Reduction of the following key channel habitats affects keylife stages: primary pools, backwater areas, and large wood(0- and 1-age rearing and migration).
HIGH
Channel stability Limited wood in channels and reduced riparian function haveaffected channel stability.
Medium
Food Salmon carcass abundance is reduced from historical levels. Medium
Temperature Changes in riparian canopy cover have increased summerhigh water temperatures but not to the level of the lowersubbasin.
Medium
Chemicals Toxics are probably not an issue because of the limitedurban and agricultural land uses in the upper subbasin.
Low
Competition with hatcheryfish
Limited competition with hatchery fish (Stahl, ODFW,personal communication, 2004).
Low
Competition other species There is some competition with introduced fish in the river,but competition in the tributaries is minimal (Stahl, ODFW,personal communication, 2004).
Low
Flow There is very little area in the upper subbasin in agriculturaland urban land uses that contribute to changes in flowregimes.
Low
Harassment Prespawning fish do not hold in the river channels (Stahl,ODFW, personal communication, 2004).
Low
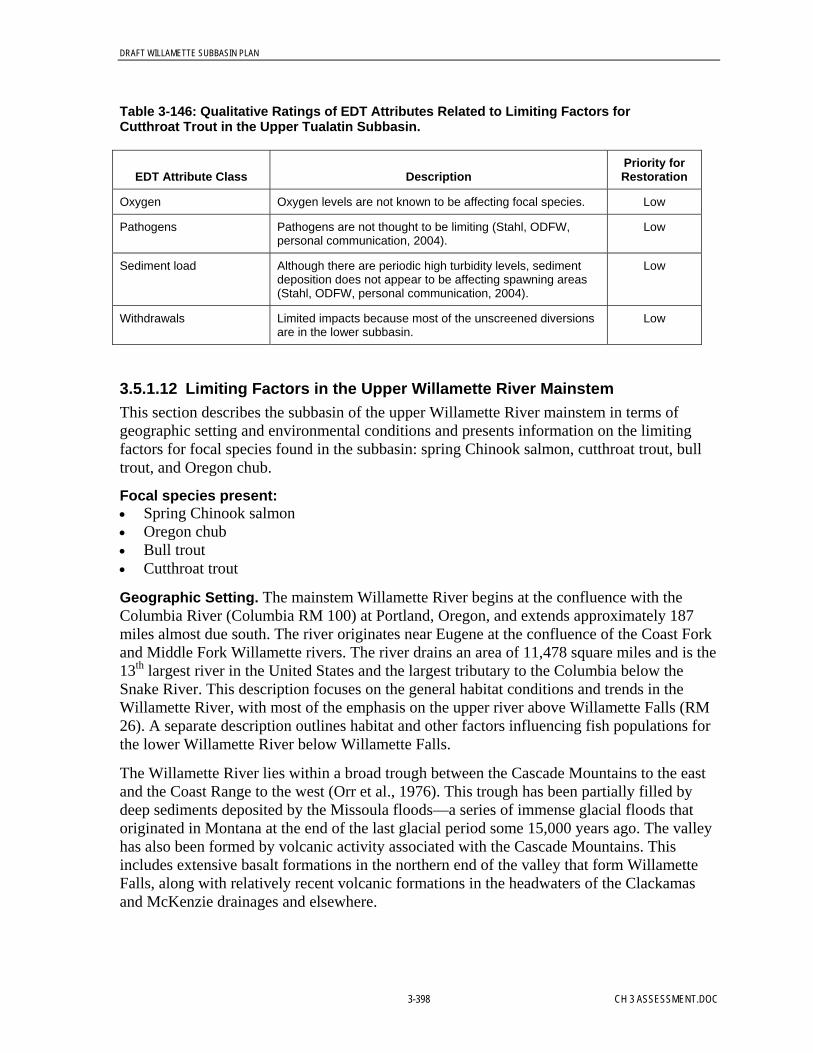
DRAFT WILLAMETTE SUBBASIN PLAN
3-398 CH 3 ASSESSMENT.DOC
Table 3-146: Qualitative Ratings of EDT Attributes Related to Limiting Factors forCutthroat Trout in the Upper Tualatin Subbasin.
EDT Attribute Class DescriptionPriority forRestoration
Oxygen Oxygen levels are not known to be affecting focal species. Low
Pathogens Pathogens are not thought to be limiting (Stahl, ODFW,personal communication, 2004).
Low
Sediment load Although there are periodic high turbidity levels, sedimentdeposition does not appear to be affecting spawning areas(Stahl, ODFW, personal communication, 2004).
Low
Withdrawals Limited impacts because most of the unscreened diversionsare in the lower subbasin.
Low
3.5.1.12 Limiting Factors in the Upper Willamette River MainstemThis section describes the subbasin of the upper Willamette River mainstem in terms ofgeographic setting and environmental conditions and presents information on the limitingfactors for focal species found in the subbasin: spring Chinook salmon, cutthroat trout, bulltrout, and Oregon chub.
Focal species present:• Spring Chinook salmon• Oregon chub• Bull trout• Cutthroat trout
Geographic Setting. The mainstem Willamette River begins at the confluence with theColumbia River (Columbia RM 100) at Portland, Oregon, and extends approximately 187miles almost due south. The river originates near Eugene at the confluence of the Coast Forkand Middle Fork Willamette rivers. The river drains an area of 11,478 square miles and is the13th largest river in the United States and the largest tributary to the Columbia below theSnake River. This description focuses on the general habitat conditions and trends in theWillamette River, with most of the emphasis on the upper river above Willamette Falls (RM26). A separate description outlines habitat and other factors influencing fish populations forthe lower Willamette River below Willamette Falls.
The Willamette River lies within a broad trough between the Cascade Mountains to the eastand the Coast Range to the west (Orr et al., 1976). This trough has been partially filled bydeep sediments deposited by the Missoula floods—a series of immense glacial floods thatoriginated in Montana at the end of the last glacial period some 15,000 years ago. The valleyhas also been formed by volcanic activity associated with the Cascade Mountains. Thisincludes extensive basalt formations in the northern end of the valley that form WillametteFalls, along with relatively recent volcanic formations in the headwaters of the Clackamasand McKenzie drainages and elsewhere.

DRAFT WILLAMETTE SUBBASIN PLAN
CH 3 ASSESSMENT.DOC 3-399
Land uses along the Upper Willamette River are a mix of agricultural, rural residential, andurban lands. In an analysis of land uses and land cover along the river (within 393 feet of theriver), Gregory et al (2002) found that agricultural lands occupy more than 30 percent of thearea along the Upper Willamette River, followed by developed land (nearly 10 percent of thearea). The Willamette River above Willamette Falls and its floodplain intersect withnumerous small and large communities, including five cities with populations of more than40,000 (PSU, 2003): Springfield (54,720), Eugene (143,910), Corvallis (52,950), Albany(43,600), and Salem (142,940).
In contrast to most of the tributaries that rise in the Cascade or Coast mountain ranges andbegin as very steep headwater streams, the Willamette River maintains a low gradientthroughout its length. Over its 263 miles, the river rises only 400 feet, for an overall gradientof 0.03 percent (Pacific Northwest Ecosystem Research Consortium, 2002). The channel ofthe meandering upper Willamette River has changed much more dramatically than thesimpler, tidally influenced channel below Willamette Falls. The upper Willamette River cutsthrough the deep deposits of gravels and sediments deposited on the valley floor by theMissoula Floods and major tributaries. Before development, most of the upper WillametteRiver, particularly in the section above Corvallis, meandered across the valley, creating ahighly braided channel with multiple side channels, alcoves, and oxbows (Pacific NorthwestEcosystem Research Consortium, 2002).
Average annual discharge of the Willamette River is 21,542 million gallons per day.Although the headwaters of many tributaries lie above elevations that accumulate the wintersnowpack, for the most part flow follows seasonal precipitation patterns. The Willamette’sdischarge peaks in December, and low flow usually occurs in August (Figure 3-34). Dams onthe major tributaries, including the Clackamas, Santiam and McKenzie rivers, largelyregulate flow in the Willamette River. Regulation has moderated winter flooding by causingwinter precipitation to be stored and then released later, which results in an increase insummer low flow (Figure3-34).
0
10,000
20,000
30,000
40,000
50,000
60,000
70,000
17-Aug 6-Oct 25-Nov 14-Jan 4-Mar 23-Apr 12-Jun 1-Aug 20-Sep 9-Nov
Pre-Dam (1909-1941)Post Dam (1942-2000)
Figure 3-34: Daily Average Flow in the Willamette River at Salem, Oregon

DRAFT WILLAMETTE SUBBASIN PLAN
3-400 CH 3 ASSESSMENT.DOC
Key Conclusions. Altered flow regimes, modified delivery and transport of large wood andsediment, and extensive changes to the riparian and aquatic habitat in the Willamette Riverhave affected the productivity, capacity, and diversity of the focal fish species populations.Unconstrained, low-elevation river and stream reaches in the Willamette Valley have thegreatest abundance and diversity of salmonid and other fish species, probably because of thegreater habitat diversity. The Willamette River, along with the lowland portions of itstributaries, is rich in species diversity. Historically, the Willamette River and other lowlandtributary reaches contained abundant slow water habitats – side channels, backwaters,alcoves, and sloughs – that contributed to species diversity (Pacific Northwest EcosystemResearch Consortium, 2002). The Willamette River contains 31 native fish species, whileonly 10 species occupy the headwater tributaries in the Cascade and Coast ranges (PacificNorthwest Ecosystem Research Consortium, 2002).
Since the mid-19th century, much of the Willamette River’s channel has been constrained andsimplified. Large portions of the river are now confined to a single broad channel. Channelarea and length, which are key measures of habitat complexity, have dramatically declined.Since 1850, it is estimated that diking, straightening, and channelization have led to thewetted area of the river declining by 22 percent and the total channel length of the WillametteRiver being reduced by about 26 percent (see Tables 3-147 and 3-148). The most dramaticchange in habitat complexity has been in the upper river. In the section of the river betweenHarrisburg and Eugene, for example, more than 60 percent of the channel length has beenlost (Pacific Northwest Ecosystem Research Consortium, 2002). Alcoves, side channels, andother slow-water habitats have also declined throughout the river (Tables 3-147 and 3-148).Islands within the river channel, which create shallow water edges and other aquatic habitats,have been reduced by more than 60 percent (Table 3-147).
Table 3-147: Percent Changes* in Channel Habitat Features from 1850 to 1995for the Willamette River from Portland to Eugene.
Channel Habitat Type
YearPrimarychannel
Sidechannel Alcoves Islands Total Area
1895 12.3 -0.9 0.3 -22.1 9.5
1932 4.7 -46.5 -14.7 -35.5 -0.9
1995 -13.3 -35.1 -55.6 -63.1 -22.3
* Changes are calculated using 1850 as the baseline (Pacific Northwest EcosystemResearch Consortium, 2002).
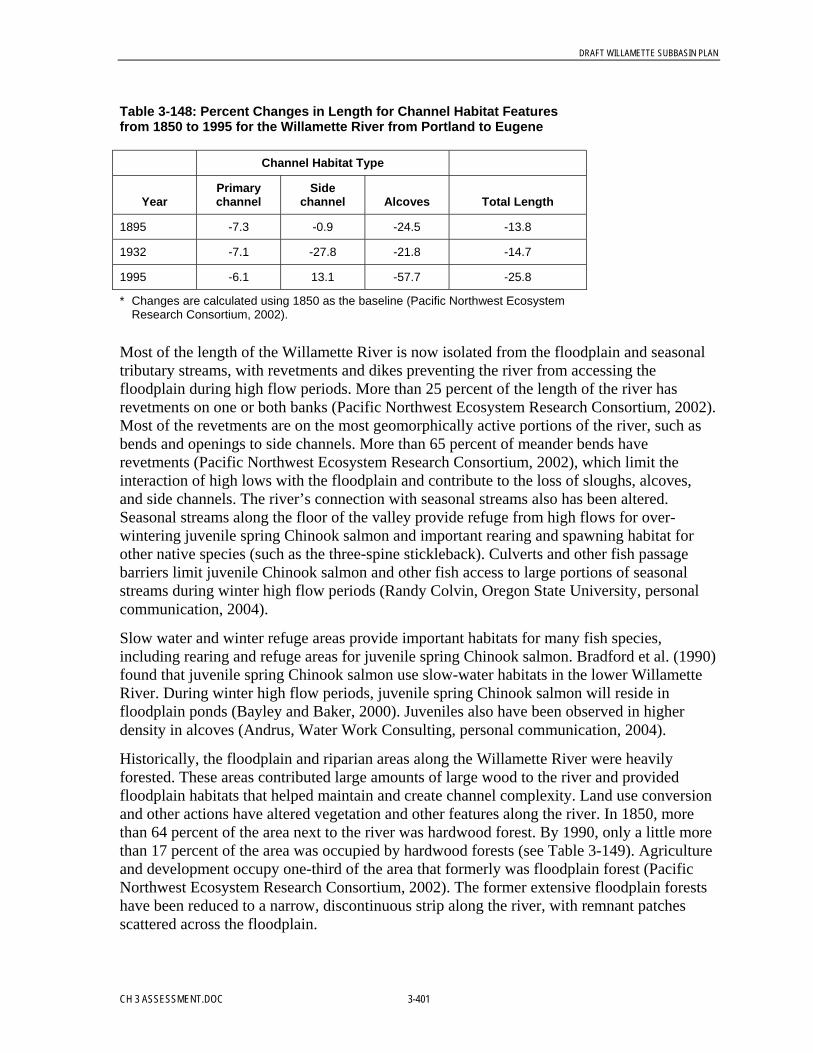
DRAFT WILLAMETTE SUBBASIN PLAN
CH 3 ASSESSMENT.DOC 3-401
Table 3-148: Percent Changes in Length for Channel Habitat Featuresfrom 1850 to 1995 for the Willamette River from Portland to Eugene
Channel Habitat Type
YearPrimarychannel
Sidechannel Alcoves Total Length
1895 -7.3 -0.9 -24.5 -13.8
1932 -7.1 -27.8 -21.8 -14.7
1995 -6.1 13.1 -57.7 -25.8
* Changes are calculated using 1850 as the baseline (Pacific Northwest EcosystemResearch Consortium, 2002).
Most of the length of the Willamette River is now isolated from the floodplain and seasonaltributary streams, with revetments and dikes preventing the river from accessing thefloodplain during high flow periods. More than 25 percent of the length of the river hasrevetments on one or both banks (Pacific Northwest Ecosystem Research Consortium, 2002).Most of the revetments are on the most geomorphically active portions of the river, such asbends and openings to side channels. More than 65 percent of meander bends haverevetments (Pacific Northwest Ecosystem Research Consortium, 2002), which limit theinteraction of high lows with the floodplain and contribute to the loss of sloughs, alcoves,and side channels. The river’s connection with seasonal streams also has been altered.Seasonal streams along the floor of the valley provide refuge from high flows for over-wintering juvenile spring Chinook salmon and important rearing and spawning habitat forother native species (such as the three-spine stickleback). Culverts and other fish passagebarriers limit juvenile Chinook salmon and other fish access to large portions of seasonalstreams during winter high flow periods (Randy Colvin, Oregon State University, personalcommunication, 2004).
Slow water and winter refuge areas provide important habitats for many fish species,including rearing and refuge areas for juvenile spring Chinook salmon. Bradford et al. (1990)found that juvenile spring Chinook salmon use slow-water habitats in the lower WillametteRiver. During winter high flow periods, juvenile spring Chinook salmon will reside infloodplain ponds (Bayley and Baker, 2000). Juveniles also have been observed in higherdensity in alcoves (Andrus, Water Work Consulting, personal communication, 2004).
Historically, the floodplain and riparian areas along the Willamette River were heavilyforested. These areas contributed large amounts of large wood to the river and providedfloodplain habitats that helped maintain and create channel complexity. Land use conversionand other actions have altered vegetation and other features along the river. In 1850, morethan 64 percent of the area next to the river was hardwood forest. By 1990, only a little morethan 17 percent of the area was occupied by hardwood forests (see Table 3-149). Agricultureand development occupy one-third of the area that formerly was floodplain forest (PacificNorthwest Ecosystem Research Consortium, 2002). The former extensive floodplain forestshave been reduced to a narrow, discontinuous strip along the river, with remnant patchesscattered across the floodplain.

DRAFT WILLAMETTE SUBBASIN PLAN
3-402 CH 3 ASSESSMENT.DOC
Table 3-149: Percent Composition of Land Use/Land Cover along the Willamette River* fromPortland to Eugene, 1850 to 1990
Total River Percent Composition as Percent of Length
Vegetation or Land Use Type Total
Year Devlp. Ag.Nat.
GrassNat.
ShrubHdwd.Forest
Mix.Forest
ConiferForest Wetlands km miles
1850 0.0 0.0 5.0 6.2 67.6 13.5 6.6 1.1 444.5 276.2
1895 12.8 20.8 0.3 0.0 34.8 26.6 0.7 0.0 479.3 297.8
1932 10.8 43.5 3.0 14.5 13.5 2.2 5.8 0.1 480.2 298.4
1990 16.4 29.5 0.6 8.9 17.4 18.2 1.5 3.6 421.5 261.9
*Within 393 feet of both sides of the channel.Devlp. = Developed urban or rural residential lands.Ag. = Agriculture.Nat. Grass = Natural grasslands, such as prairie.Nat. Shrub = Natural shrublands, such as willow thickets.Hdwd. Forest = Forests dominated by deciduous species (cottonwoods, alder, etc.).Mix. Forest = Forests with a mixture of hardwoods and conifersConifer Forest = Forests dominated by conifers.Source: Pacific Northwest Ecosystem Research Consortium, 2002.
Dams in the major tributaries have modified the flow regime and the transport of large woodand sediment into the Willamette River, and this has affected the processes that create andsustain habitats. The construction of the U.S. Army Corps of Engineers dams in the MiddleFork Willamette, McKenzie, Santiam, and other drainages has resulted in a dramaticreduction in the frequency and magnitude of high flow events (Table 3-150). The U.S. ArmyCorps of Engineers’s 13-reservoir Willamette Project controls runoff from 27 percent of theWillamette Basin (U.S. Army Corps of Engineers, 2000). Sustained high flows and sedimenttransport maintain and create habitats such as side channels and islands (Pacific NorthwestEcosystem Research Consortium, 2002). Changes in the flow regime and the transport oflarge wood and sediments have influenced the distribution and abundance of islands andgravel bars. For example, Dykaar and Wigington (2000) observed an 80 percent reduction ingravel bar and island area in the upper Willamette River between Harrisburg and Eugenebetween 1910 and 1988. The tributary dams effectively block the transport of wood into theWillamette River from large areas of the basin, much of it National Forest land with most ofthe remaining old-growth and mature conifer forests that could contribute large pieces ofwood (U.S. Army Corps of Engineers, 2000). Historically there were large amounts of woodand numerous logjams in the river. Between 1870 and 1950, 550 snags per kilometer wereremoved from the upper Willamette River above Albany (Sedell and Foggat, 1984).
Appendix X shows specific fish passage barriers on the upper Willamette, based on May2004 data from ODFW; the information was compiled from existing ODFW databases.
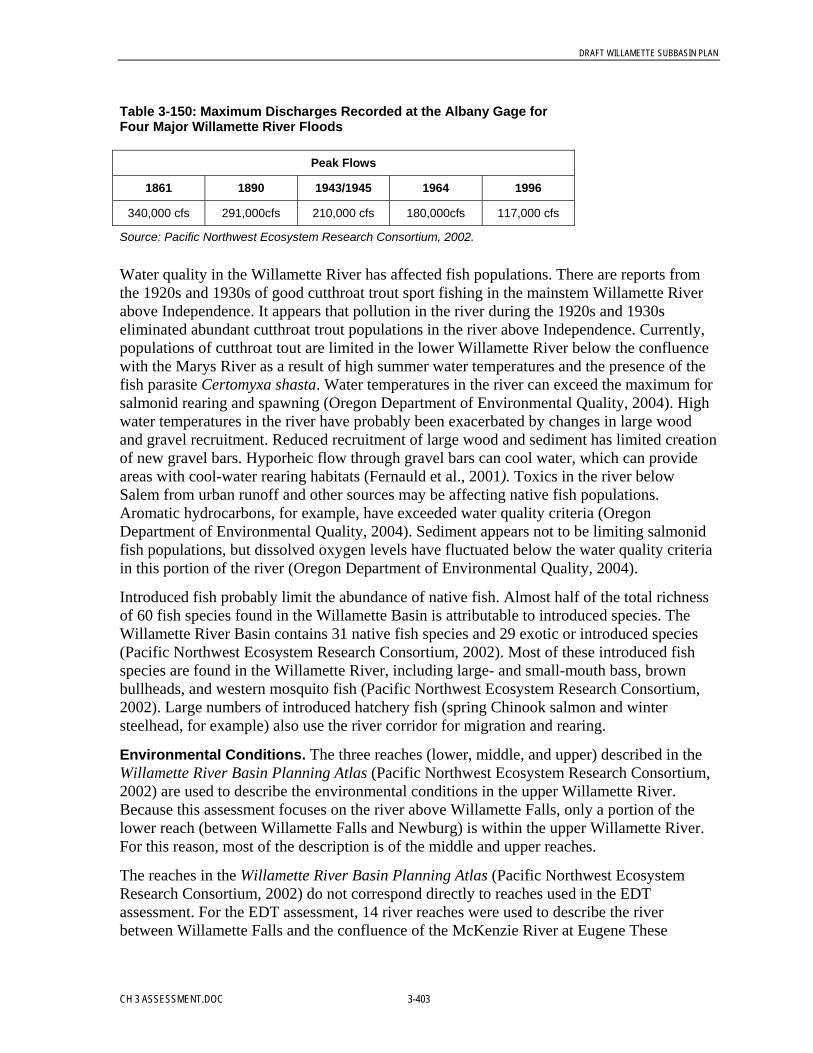
DRAFT WILLAMETTE SUBBASIN PLAN
CH 3 ASSESSMENT.DOC 3-403
Table 3-150: Maximum Discharges Recorded at the Albany Gage forFour Major Willamette River Floods
Peak Flows
1861 1890 1943/1945 1964 1996
340,000 cfs 291,000cfs 210,000 cfs 180,000cfs 117,000 cfs
Source: Pacific Northwest Ecosystem Research Consortium, 2002.
Water quality in the Willamette River has affected fish populations. There are reports fromthe 1920s and 1930s of good cutthroat trout sport fishing in the mainstem Willamette Riverabove Independence. It appears that pollution in the river during the 1920s and 1930seliminated abundant cutthroat trout populations in the river above Independence. Currently,populations of cutthroat tout are limited in the lower Willamette River below the confluencewith the Marys River as a result of high summer water temperatures and the presence of thefish parasite Certomyxa shasta. Water temperatures in the river can exceed the maximum forsalmonid rearing and spawning (Oregon Department of Environmental Quality, 2004). Highwater temperatures in the river have probably been exacerbated by changes in large woodand gravel recruitment. Reduced recruitment of large wood and sediment has limited creationof new gravel bars. Hyporheic flow through gravel bars can cool water, which can provideareas with cool-water rearing habitats (Fernauld et al., 2001). Toxics in the river belowSalem from urban runoff and other sources may be affecting native fish populations.Aromatic hydrocarbons, for example, have exceeded water quality criteria (OregonDepartment of Environmental Quality, 2004). Sediment appears not to be limiting salmonidfish populations, but dissolved oxygen levels have fluctuated below the water quality criteriain this portion of the river (Oregon Department of Environmental Quality, 2004).
Introduced fish probably limit the abundance of native fish. Almost half of the total richnessof 60 fish species found in the Willamette Basin is attributable to introduced species. TheWillamette River Basin contains 31 native fish species and 29 exotic or introduced species(Pacific Northwest Ecosystem Research Consortium, 2002). Most of these introduced fishspecies are found in the Willamette River, including large- and small-mouth bass, brownbullheads, and western mosquito fish (Pacific Northwest Ecosystem Research Consortium,2002). Large numbers of introduced hatchery fish (spring Chinook salmon and wintersteelhead, for example) also use the river corridor for migration and rearing.
Environmental Conditions. The three reaches (lower, middle, and upper) described in theWillamette River Basin Planning Atlas (Pacific Northwest Ecosystem Research Consortium,2002) are used to describe the environmental conditions in the upper Willamette River.Because this assessment focuses on the river above Willamette Falls, only a portion of thelower reach (between Willamette Falls and Newburg) is within the upper Willamette River.For this reason, most of the description is of the middle and upper reaches.
The reaches in the Willamette River Basin Planning Atlas (Pacific Northwest EcosystemResearch Consortium, 2002) do not correspond directly to reaches used in the EDTassessment. For the EDT assessment, 14 river reaches were used to describe the riverbetween Willamette Falls and the confluence of the McKenzie River at Eugene These

DRAFT WILLAMETTE SUBBASIN PLAN
3-404 CH 3 ASSESSMENT.DOC
reaches were defined on the basis of the confluence of major tributaries or other geographicfeatures, including major cities. The 14 river reaches were grouped into three geographicareas corresponding to an upper Willamette area (Eugene), a mid-Willamette area (Salem),and a lower Willamette area (Newberg). A fourth area, Portland, contained 26 additionalreaches and described the river from Willamette Falls to the Columbia River. Table 3-151lists the Willamette River Basin Planning Atlas (Pacific Northwest Ecosystem ResearchConsortium, 2002) reaches and the corresponding EDT reaches and geographic areas.
Table 3-151: Willamette River Basin Planning Atlas Reaches (Lower, Middle, and Upper)and the Corresponding EDT Assessment Reaches and Geographic Areas
Planning AtlasReach Description Corresponding EDT Reaches and Geographic Areas
Lower Columbia River toNewberg
WR1—WR26 (Lower Willamette Reaches to Willamette Falls)
WR27—WR29 (Newberg Geographic Area)
Middle Newberg to Albany WR30 (Newberg Geographic Area)
WR31—WR35 (Salem Geographic Area)
WR36 (Eugene Geographic Area)
Upper Albany to Eugene WR37—WR40 (Eugene Geographic Area)
Environmental Conditions in the Lower/Middle Reach. This section of the WillametteRiver encompasses a portion of the lower reach from the top of Willamette Falls and theentire middle reach from Newberg to Albany. Key tributaries that enter the river along thissection include the Tualatin, Yamhill, Pudding, Luckiamute, and Santiam rivers. In thisportion the river confined channel sections are interspersed broad floodplain areas. In theNewberg and Salem areas, hills comprised of Columbia River basalts uplifted along faultsconstrain the river and limit the development of a wide floodplain.
This section of the river has lost habitat complexity, although not to the degree of the upperreach. The total area of river, channel and island decreased by about 14 percent from 1850 to1995 (Table 3-152). The total length of the channel was largely unchanged (Table 3-153),although there were substantial losses of important slow-water habitats. Between 1850 and1995 there was a 33 percent change in the alcove area and more than a 15 percent change inside channel area.
Table 3-152: Percent Changes* in Channel Habitat Features from 1850 to 1995for the Middle Reach of the Willamette River from Newberg to Albany.
Channel Habitat Type
YearPrimarychannel
Sidechannel Alcoves Islands Total Area
1895 22.8 53.8 19.0 7.1 23.2
1932 8.3 -9.6 20.2 0.0 9.1
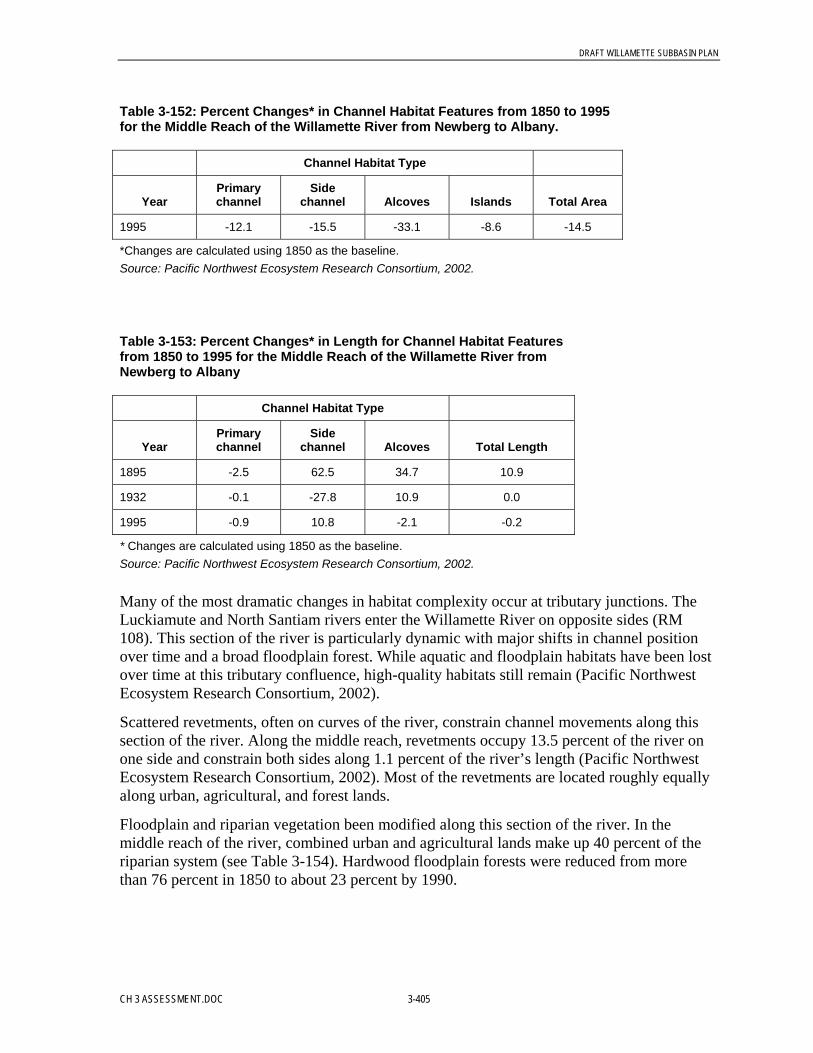
DRAFT WILLAMETTE SUBBASIN PLAN
CH 3 ASSESSMENT.DOC 3-405
Table 3-152: Percent Changes* in Channel Habitat Features from 1850 to 1995for the Middle Reach of the Willamette River from Newberg to Albany.
Channel Habitat Type
YearPrimarychannel
Sidechannel Alcoves Islands Total Area
1995 -12.1 -15.5 -33.1 -8.6 -14.5
*Changes are calculated using 1850 as the baseline.Source: Pacific Northwest Ecosystem Research Consortium, 2002.
Table 3-153: Percent Changes* in Length for Channel Habitat Featuresfrom 1850 to 1995 for the Middle Reach of the Willamette River fromNewberg to Albany
Channel Habitat Type
YearPrimarychannel
Sidechannel Alcoves Total Length
1895 -2.5 62.5 34.7 10.9
1932 -0.1 -27.8 10.9 0.0
1995 -0.9 10.8 -2.1 -0.2
* Changes are calculated using 1850 as the baseline.Source: Pacific Northwest Ecosystem Research Consortium, 2002.
Many of the most dramatic changes in habitat complexity occur at tributary junctions. TheLuckiamute and North Santiam rivers enter the Willamette River on opposite sides (RM108). This section of the river is particularly dynamic with major shifts in channel positionover time and a broad floodplain forest. While aquatic and floodplain habitats have been lostover time at this tributary confluence, high-quality habitats still remain (Pacific NorthwestEcosystem Research Consortium, 2002).
Scattered revetments, often on curves of the river, constrain channel movements along thissection of the river. Along the middle reach, revetments occupy 13.5 percent of the river onone side and constrain both sides along 1.1 percent of the river’s length (Pacific NorthwestEcosystem Research Consortium, 2002). Most of the revetments are located roughly equallyalong urban, agricultural, and forest lands.
Floodplain and riparian vegetation been modified along this section of the river. In themiddle reach of the river, combined urban and agricultural lands make up 40 percent of theriparian system (see Table 3-154). Hardwood floodplain forests were reduced from morethan 76 percent in 1850 to about 23 percent by 1990.
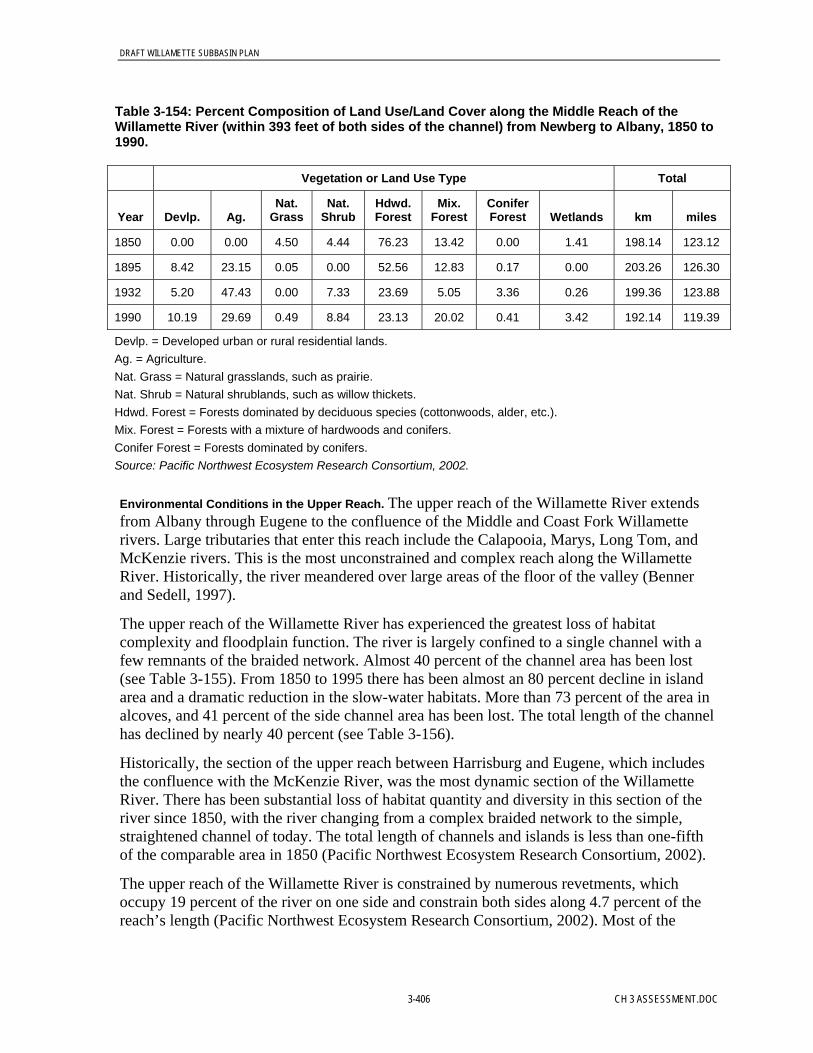
DRAFT WILLAMETTE SUBBASIN PLAN
3-406 CH 3 ASSESSMENT.DOC
Table 3-154: Percent Composition of Land Use/Land Cover along the Middle Reach of theWillamette River (within 393 feet of both sides of the channel) from Newberg to Albany, 1850 to1990.
Vegetation or Land Use Type Total
Year Devlp. Ag.Nat.
GrassNat.
ShrubHdwd.Forest
Mix.Forest
ConiferForest Wetlands km miles
1850 0.00 0.00 4.50 4.44 76.23 13.42 0.00 1.41 198.14 123.12
1895 8.42 23.15 0.05 0.00 52.56 12.83 0.17 0.00 203.26 126.30
1932 5.20 47.43 0.00 7.33 23.69 5.05 3.36 0.26 199.36 123.88
1990 10.19 29.69 0.49 8.84 23.13 20.02 0.41 3.42 192.14 119.39
Devlp. = Developed urban or rural residential lands.Ag. = Agriculture.Nat. Grass = Natural grasslands, such as prairie.Nat. Shrub = Natural shrublands, such as willow thickets.Hdwd. Forest = Forests dominated by deciduous species (cottonwoods, alder, etc.).Mix. Forest = Forests with a mixture of hardwoods and conifers.Conifer Forest = Forests dominated by conifers.Source: Pacific Northwest Ecosystem Research Consortium, 2002.
Environmental Conditions in the Upper Reach. The upper reach of the Willamette River extendsfrom Albany through Eugene to the confluence of the Middle and Coast Fork Willametterivers. Large tributaries that enter this reach include the Calapooia, Marys, Long Tom, andMcKenzie rivers. This is the most unconstrained and complex reach along the WillametteRiver. Historically, the river meandered over large areas of the floor of the valley (Bennerand Sedell, 1997).
The upper reach of the Willamette River has experienced the greatest loss of habitatcomplexity and floodplain function. The river is largely confined to a single channel with afew remnants of the braided network. Almost 40 percent of the channel area has been lost(see Table 3-155). From 1850 to 1995 there has been almost an 80 percent decline in islandarea and a dramatic reduction in the slow-water habitats. More than 73 percent of the area inalcoves, and 41 percent of the side channel area has been lost. The total length of the channelhas declined by nearly 40 percent (see Table 3-156).
Historically, the section of the upper reach between Harrisburg and Eugene, which includesthe confluence with the McKenzie River, was the most dynamic section of the WillametteRiver. There has been substantial loss of habitat quantity and diversity in this section of theriver since 1850, with the river changing from a complex braided network to the simple,straightened channel of today. The total length of channels and islands is less than one-fifthof the comparable area in 1850 (Pacific Northwest Ecosystem Research Consortium, 2002).
The upper reach of the Willamette River is constrained by numerous revetments, whichoccupy 19 percent of the river on one side and constrain both sides along 4.7 percent of thereach’s length (Pacific Northwest Ecosystem Research Consortium, 2002). Most of the
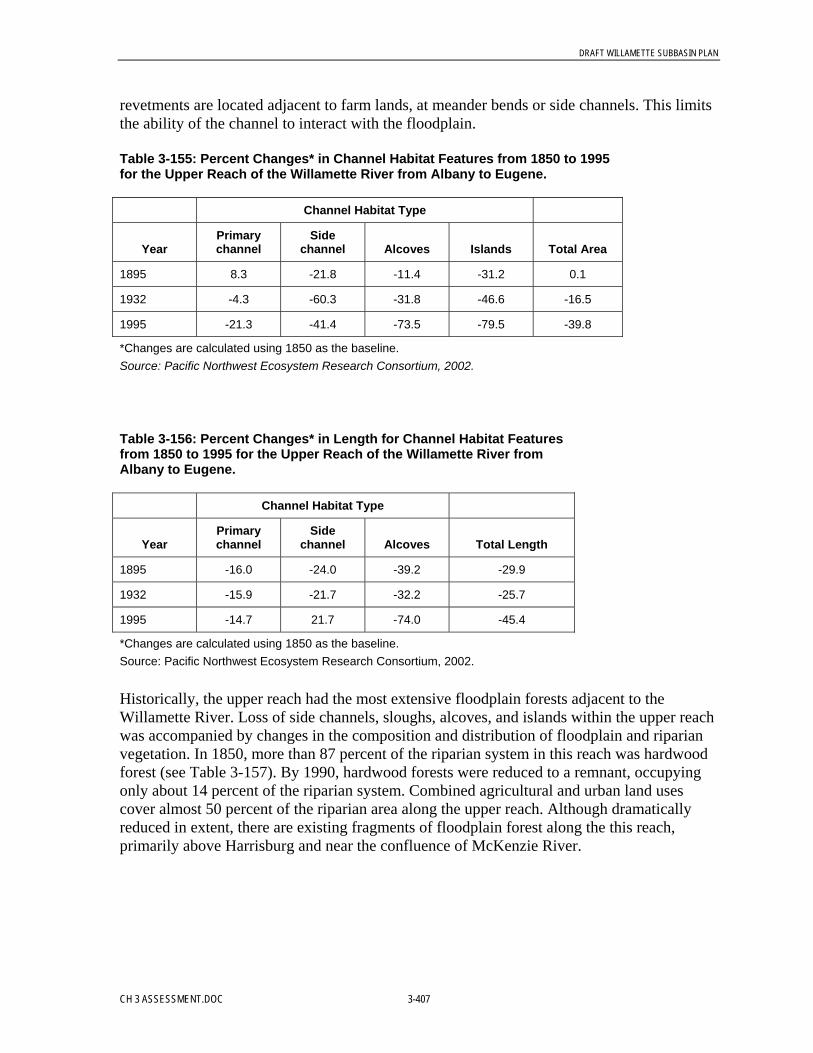
DRAFT WILLAMETTE SUBBASIN PLAN
CH 3 ASSESSMENT.DOC 3-407
revetments are located adjacent to farm lands, at meander bends or side channels. This limitsthe ability of the channel to interact with the floodplain.
Table 3-155: Percent Changes* in Channel Habitat Features from 1850 to 1995for the Upper Reach of the Willamette River from Albany to Eugene.
Channel Habitat Type
YearPrimarychannel
Sidechannel Alcoves Islands Total Area
1895 8.3 -21.8 -11.4 -31.2 0.1
1932 -4.3 -60.3 -31.8 -46.6 -16.5
1995 -21.3 -41.4 -73.5 -79.5 -39.8
*Changes are calculated using 1850 as the baseline.Source: Pacific Northwest Ecosystem Research Consortium, 2002.
Table 3-156: Percent Changes* in Length for Channel Habitat Featuresfrom 1850 to 1995 for the Upper Reach of the Willamette River fromAlbany to Eugene.
Channel Habitat Type
YearPrimarychannel
Sidechannel Alcoves Total Length
1895 -16.0 -24.0 -39.2 -29.9
1932 -15.9 -21.7 -32.2 -25.7
1995 -14.7 21.7 -74.0 -45.4
*Changes are calculated using 1850 as the baseline.Source: Pacific Northwest Ecosystem Research Consortium, 2002.
Historically, the upper reach had the most extensive floodplain forests adjacent to theWillamette River. Loss of side channels, sloughs, alcoves, and islands within the upper reachwas accompanied by changes in the composition and distribution of floodplain and riparianvegetation. In 1850, more than 87 percent of the riparian system in this reach was hardwoodforest (see Table 3-157). By 1990, hardwood forests were reduced to a remnant, occupyingonly about 14 percent of the riparian system. Combined agricultural and urban land usescover almost 50 percent of the riparian area along the upper reach. Although dramaticallyreduced in extent, there are existing fragments of floodplain forest along the this reach,primarily above Harrisburg and near the confluence of McKenzie River.
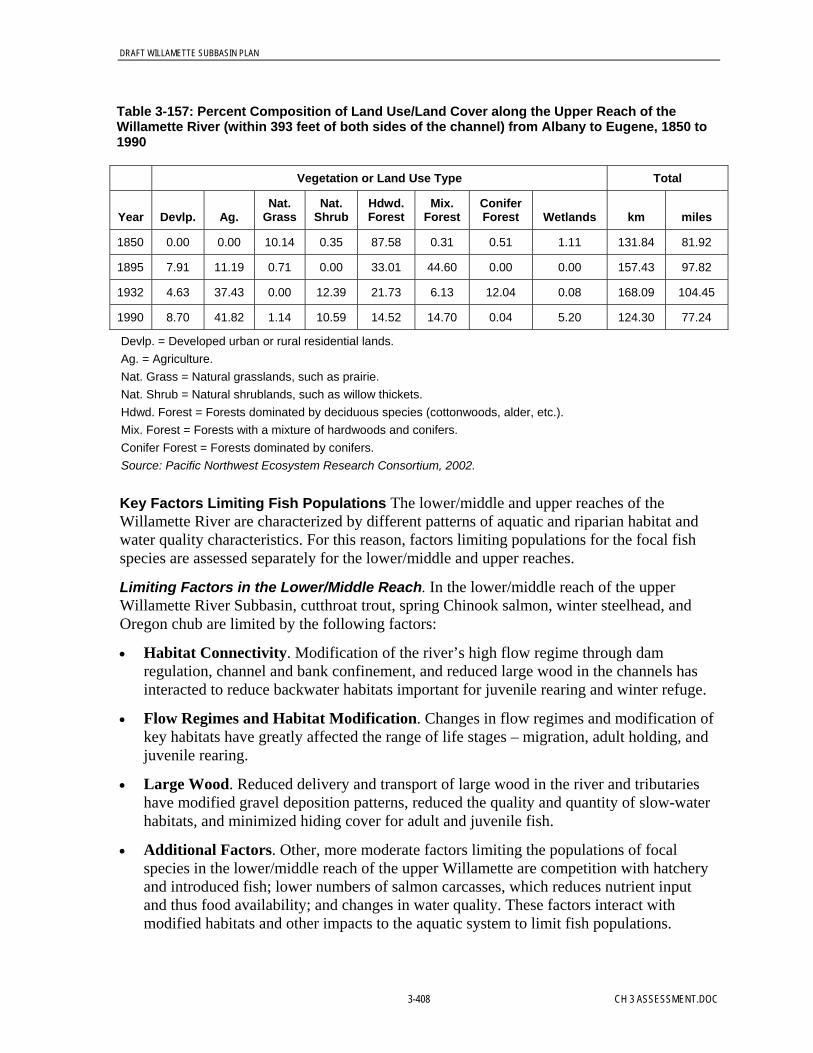
DRAFT WILLAMETTE SUBBASIN PLAN
3-408 CH 3 ASSESSMENT.DOC
Table 3-157: Percent Composition of Land Use/Land Cover along the Upper Reach of theWillamette River (within 393 feet of both sides of the channel) from Albany to Eugene, 1850 to1990
Vegetation or Land Use Type Total
Year Devlp. Ag.Nat.
GrassNat.
ShrubHdwd.Forest
Mix.Forest
ConiferForest Wetlands km miles
1850 0.00 0.00 10.14 0.35 87.58 0.31 0.51 1.11 131.84 81.92
1895 7.91 11.19 0.71 0.00 33.01 44.60 0.00 0.00 157.43 97.82
1932 4.63 37.43 0.00 12.39 21.73 6.13 12.04 0.08 168.09 104.45
1990 8.70 41.82 1.14 10.59 14.52 14.70 0.04 5.20 124.30 77.24
Devlp. = Developed urban or rural residential lands.Ag. = Agriculture.Nat. Grass = Natural grasslands, such as prairie.Nat. Shrub = Natural shrublands, such as willow thickets.Hdwd. Forest = Forests dominated by deciduous species (cottonwoods, alder, etc.).Mix. Forest = Forests with a mixture of hardwoods and conifers.Conifer Forest = Forests dominated by conifers.Source: Pacific Northwest Ecosystem Research Consortium, 2002.
Key Factors Limiting Fish Populations The lower/middle and upper reaches of theWillamette River are characterized by different patterns of aquatic and riparian habitat andwater quality characteristics. For this reason, factors limiting populations for the focal fishspecies are assessed separately for the lower/middle and upper reaches.
Limiting Factors in the Lower/Middle Reach. In the lower/middle reach of the upperWillamette River Subbasin, cutthroat trout, spring Chinook salmon, winter steelhead, andOregon chub are limited by the following factors:
• Habitat Connectivity. Modification of the river’s high flow regime through damregulation, channel and bank confinement, and reduced large wood in the channels hasinteracted to reduce backwater habitats important for juvenile rearing and winter refuge.
• Flow Regimes and Habitat Modification. Changes in flow regimes and modification ofkey habitats have greatly affected the range of life stages – migration, adult holding, andjuvenile rearing.
• Large Wood. Reduced delivery and transport of large wood in the river and tributarieshave modified gravel deposition patterns, reduced the quality and quantity of slow-waterhabitats, and minimized hiding cover for adult and juvenile fish.
• Additional Factors. Other, more moderate factors limiting the populations of focalspecies in the lower/middle reach of the upper Willamette are competition with hatcheryand introduced fish; lower numbers of salmon carcasses, which reduces nutrient inputand thus food availability; and changes in water quality. These factors interact withmodified habitats and other impacts to the aquatic system to limit fish populations.
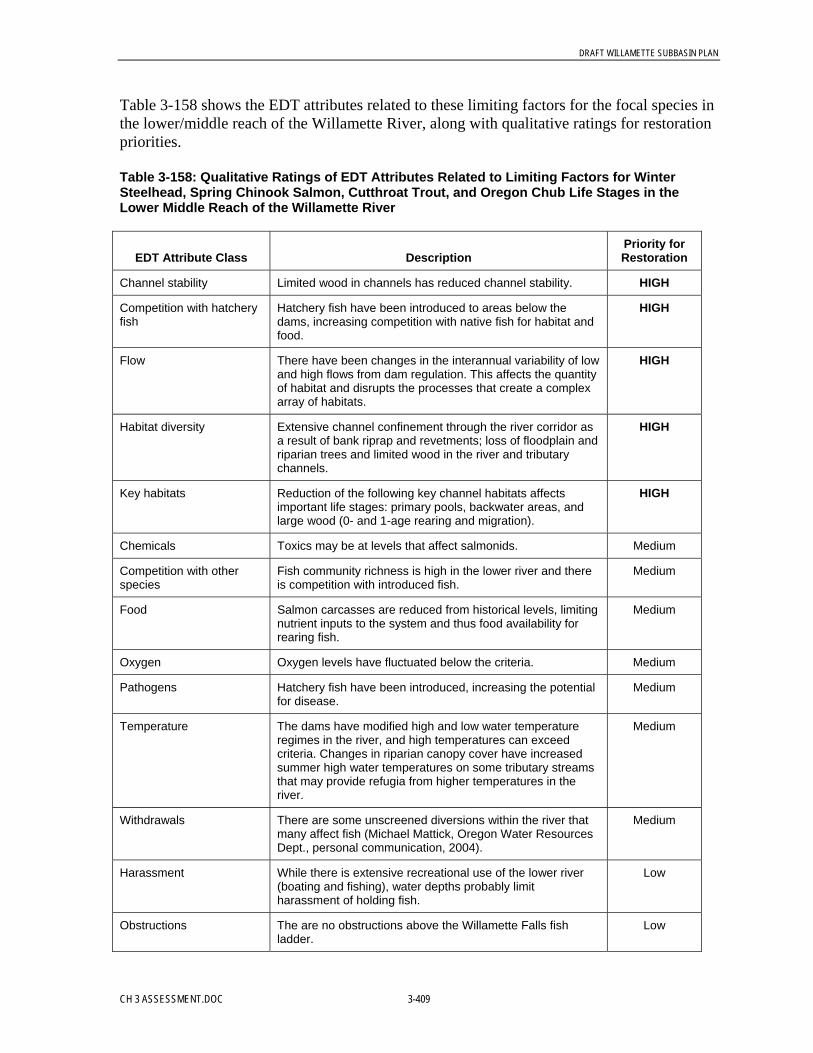
DRAFT WILLAMETTE SUBBASIN PLAN
CH 3 ASSESSMENT.DOC 3-409
Table 3-158 shows the EDT attributes related to these limiting factors for the focal species inthe lower/middle reach of the Willamette River, along with qualitative ratings for restorationpriorities.
Table 3-158: Qualitative Ratings of EDT Attributes Related to Limiting Factors for WinterSteelhead, Spring Chinook Salmon, Cutthroat Trout, and Oregon Chub Life Stages in theLower Middle Reach of the Willamette River
EDT Attribute Class DescriptionPriority forRestoration
Channel stability Limited wood in channels has reduced channel stability. HIGH
Competition with hatcheryfish
Hatchery fish have been introduced to areas below thedams, increasing competition with native fish for habitat andfood.
HIGH
Flow There have been changes in the interannual variability of lowand high flows from dam regulation. This affects the quantityof habitat and disrupts the processes that create a complexarray of habitats.
HIGH
Habitat diversity Extensive channel confinement through the river corridor asa result of bank riprap and revetments; loss of floodplain andriparian trees and limited wood in the river and tributarychannels.
HIGH
Key habitats Reduction of the following key channel habitats affectsimportant life stages: primary pools, backwater areas, andlarge wood (0- and 1-age rearing and migration).
HIGH
Chemicals Toxics may be at levels that affect salmonids. Medium
Competition with otherspecies
Fish community richness is high in the lower river and thereis competition with introduced fish.
Medium
Food Salmon carcasses are reduced from historical levels, limitingnutrient inputs to the system and thus food availability forrearing fish.
Medium
Oxygen Oxygen levels have fluctuated below the criteria. Medium
Pathogens Hatchery fish have been introduced, increasing the potentialfor disease.
Medium
Temperature The dams have modified high and low water temperatureregimes in the river, and high temperatures can exceedcriteria. Changes in riparian canopy cover have increasedsummer high water temperatures on some tributary streamsthat may provide refugia from higher temperatures in theriver.
Medium
Withdrawals There are some unscreened diversions within the river thatmany affect fish (Michael Mattick, Oregon Water ResourcesDept., personal communication, 2004).
Medium
Harassment While there is extensive recreational use of the lower river(boating and fishing), water depths probably limitharassment of holding fish.
Low
Obstructions The are no obstructions above the Willamette Falls fishladder.
Low
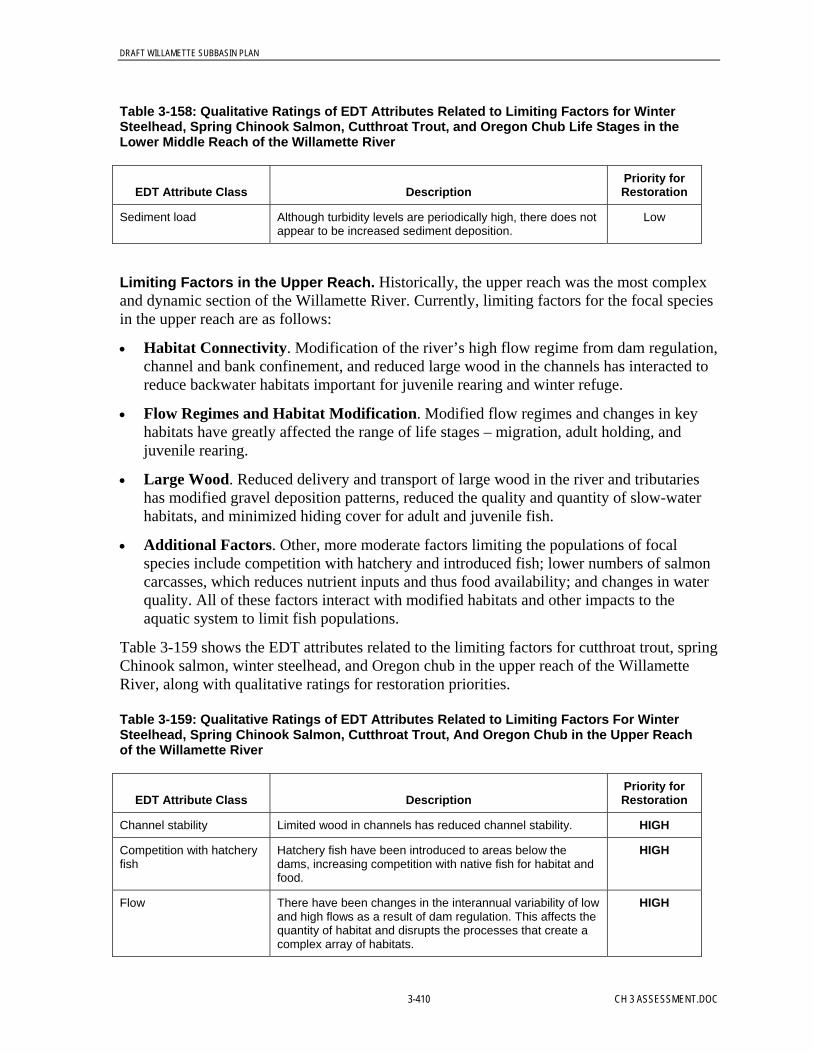
DRAFT WILLAMETTE SUBBASIN PLAN
3-410 CH 3 ASSESSMENT.DOC
Table 3-158: Qualitative Ratings of EDT Attributes Related to Limiting Factors for WinterSteelhead, Spring Chinook Salmon, Cutthroat Trout, and Oregon Chub Life Stages in theLower Middle Reach of the Willamette River
EDT Attribute Class DescriptionPriority forRestoration
Sediment load Although turbidity levels are periodically high, there does notappear to be increased sediment deposition.
Low
Limiting Factors in the Upper Reach. Historically, the upper reach was the most complexand dynamic section of the Willamette River. Currently, limiting factors for the focal speciesin the upper reach are as follows:
• Habitat Connectivity. Modification of the river’s high flow regime from dam regulation,channel and bank confinement, and reduced large wood in the channels has interacted toreduce backwater habitats important for juvenile rearing and winter refuge.
• Flow Regimes and Habitat Modification. Modified flow regimes and changes in keyhabitats have greatly affected the range of life stages – migration, adult holding, andjuvenile rearing.
• Large Wood. Reduced delivery and transport of large wood in the river and tributarieshas modified gravel deposition patterns, reduced the quality and quantity of slow-waterhabitats, and minimized hiding cover for adult and juvenile fish.
• Additional Factors. Other, more moderate factors limiting the populations of focalspecies include competition with hatchery and introduced fish; lower numbers of salmoncarcasses, which reduces nutrient inputs and thus food availability; and changes in waterquality. All of these factors interact with modified habitats and other impacts to theaquatic system to limit fish populations.
Table 3-159 shows the EDT attributes related to the limiting factors for cutthroat trout, springChinook salmon, winter steelhead, and Oregon chub in the upper reach of the WillametteRiver, along with qualitative ratings for restoration priorities.
Table 3-159: Qualitative Ratings of EDT Attributes Related to Limiting Factors For WinterSteelhead, Spring Chinook Salmon, Cutthroat Trout, And Oregon Chub in the Upper Reachof the Willamette River
EDT Attribute Class DescriptionPriority forRestoration
Channel stability Limited wood in channels has reduced channel stability. HIGH
Competition with hatcheryfish
Hatchery fish have been introduced to areas below thedams, increasing competition with native fish for habitat andfood.
HIGH
Flow There have been changes in the interannual variability of lowand high flows as a result of dam regulation. This affects thequantity of habitat and disrupts the processes that create acomplex array of habitats.
HIGH

DRAFT WILLAMETTE SUBBASIN PLAN
CH 3 ASSESSMENT.DOC 3-411
Table 3-159: Qualitative Ratings of EDT Attributes Related to Limiting Factors For WinterSteelhead, Spring Chinook Salmon, Cutthroat Trout, And Oregon Chub in the Upper Reachof the Willamette River
EDT Attribute Class DescriptionPriority forRestoration
Habitat diversity Extensive channel confinement through the river corridor asa result of bank riprap and revetments; loss of floodplain andriparian trees and limited wood in the river and tributarychannels.
HIGH
Key habitats Reduction of the following key channel habitats affectsimportant life stages: primary pools, backwater areas, andlarge wood (0- and 1-age rearing and migration).
HIGH
Competition with otherspecies
Fish community richness is high in the lower river and thereis competition with introduced fish.
Medium
Food Salmon carcasses are reduced from historical levels, limitingnutrient inputs to the system and thus food availability forrearing fish.
Medium
Oxygen Oxygen levels have fluctuated below the criteria. Medium
Pathogens Hatchery fish have been introduced, increasing the potentialfor disease.
Medium
Temperature The dams have modified high and low water temperatureregimes in the river, and high temperatures can exceedcriteria. Changes in riparian canopy cover have increasedsummer high water temperatures on some tributary streamsthat may provide refugia from higher temperatures in theriver.
Medium
Withdrawals There are some unscreened diversions within the river thatmany affect fish (Michael Mattick, Oregon Water ResourcesDept., personal communication, 2004).
Medium
Chemicals Toxics are probably not at levels that affect salmonids. Low
Harassment While there is extensive recreational use of the lower river(boating and fishing), water depths probably limitharassment of holding fish.
Low
Obstructions The are no obstructions above the Willamette Falls fishladder.
Low
Sediment load Although turbidity levels are periodically high, there does notappear to be increased sediment deposition.
Low
3.5.1.13 Yamhill SubbasinThis section describes the Yamhill Subbasin in terms of geographic setting andenvironmental conditions and presents information on the limiting factors for focal species inthe subbasin: cutthroat trout and spring Chinook.
Focal species present:• Cutthroat trout

DRAFT WILLAMETTE SUBBASIN PLAN
3-412 CH 3 ASSESSMENT.DOC
• Spring Chinook salmon (juvenile rearing and refuge)
Focal species present historically:• Oregon chub
Geographic Setting. The Yamhill Subbasin covers an area of approximately 919 squaremiles on the eastern slope of the Coast Range and the floor of the Willamette Valley. TheNorth and South Forks join to form the Yamhill River, which flows for 11 miles beforeentering the Willamette River at RM 55. Approximately 96 percent of the land in thesubbasin is privately owned. Most of the private lands are in forestry, agricultural, and ruralresidential land uses. Urban lands cover a very small portion of the subbasin, primarilywithin the city of McMinnville. The Salem District of the BLM and the Oregon Departmentof Forestry manage a small proportion of the forested upper subbasin.
The Yamhill River does not have spawning populations of native anadromous fish, butjuvenile Chinook salmon have been observed using the lower portions of the river as rearingand winter refuge habitat (Gary Galovich, ODFW, personal communication, 2003). Cutthroattrout exist in all of the subbasin’s streams, and historically there was a population that movedbetween the Yamhill River and the mainstem of the Willamette River (Wevers et al., 1992).Naturally spawning winter steelhead are present in the Yamhill Subbasin. It appears thatthese fish are strays or from introduced populations, and there is little evidence to suggestthat self-sustaining spawning aggregations of winter steelhead existed historically in theYamhill Subbasin (Myers et al., 2003). Cutthroat trout and winter steelhead have similarhabitat requirements.
The headwaters of the Yamhill River are on the east side of the Coast Range. Privateindustrial forestlands are the primary land use in the upper subbasin. As the North and SouthForks of the Yamhill River enter the Willamette Valley they flow past small-acreage farmsand rural residential areas. Major tributaries in the upper subbasin of the North Fork YamhillRiver include Haskins, Panther, and Turner Creeks. Mill, Willamina, and Deer Creeks areimportant upper subbasin tributaries to the South Fork. The lower South and North Forks, themainstem Yamhill River, and lower subbasin tributaries flow through agricultural lands andrural residential areas and near the city of McMinnville and numerous small communities,including Carlton, Laftette, Sheridan, Amity, and Dundee. Important tributaries in the lowersubbasin include Salt, Ash Swale, Palmer, and Chehalem creeks.
The Coast Range bedrock in the upper subbasin is composed predominantly of sedimentaryrocks with some volcanic formations. Most of the subbasin lies below 1,000 feet in elevation.The upper subbasin drains the Coast Range, but most of the Yamhill River, North and SouthForks, and larger tributaries flow through the Willamette Valley’s recent alluvial deposits.The Coast Range sedimentary rocks have lower groundwater storage capacity than is the casein the Cascade Mountains, and the streams within the Yamhill Subbasin have lowersummertime flows and higher water temperatures than do Cascade Range streams. Thesubbasin’s high flow runoff patterns are dominated by a rain-on-snow hydrology in the mid-to upper elevations and rain-dominated flow patterns in the lower subbasin, which leads torapid delivery of water to the stream network. As a result of the subbasin’s low elevationsand the Coast Range geology, summertime stream flows are not supplemented by snowmeltor numerous spring-fed sources.

DRAFT WILLAMETTE SUBBASIN PLAN
CH 3 ASSESSMENT.DOC 3-413
The headwaters and tributaries of the upper subbasin flow steeply off the Coast Range, andthe gradient rapidly decreases once the streams enter the lower subbasin areas within the flatWillamette Valley. For example, the lower 20 miles of the North Yamhill River, which flowsthrough the valley, has a gradient of nearly 0.1 percent, while the upper portions of the riverexceed 3.5 percent gradient (see Table 3-160). Historically, the lower Yamhill River channelwas very sinuous as it flowed through the old fluvial deposits of the Willamette Valley(YBC, 2001b).
Table 3-160: Percent Gradient for Major Segments of the North and South YamhillRiver
Subbasin Location River Mile (RM) Percent Gradient
North Yamhill 0 to 20 0.11
North Yamhill 20 to 32 3.44
South Yamhill 0 to 30 0.03
South Yamhill 30 to 60 0.22
Environmental Conditions. Altered subbasin processes, modified riparian and aquatichabitat, and limited access to historical spawning and rearing areas in the Yamhill Subbasinhave affected the productivity, capacity, and diversity of cutthroat tout and juvenile springChinook salmon populations in the Yamhill Subbasin. Table 3-161 summarizes changes inthe subbasin’s environmental conditions and how these changes have affected cutthroat troutand juvenile spring Chinook salmon.
Upper and Lower Subbasins. Relative to the lower subbasin, the forested upland portionsof the upper subbasin have aquatic habitat that is closer to the historical baseline, with thehighest proportion of functioning riparian areas, the largest amounts of large wood in theriver and tributary channels, and higher quality aquatic habitats (Baker et al., 2002; YBC,1999a, 1999b, 2000a, 2000b, 2001a, 2001b, 2001c, and 2002a). Impacts to aquatic andriparian habitats have been greater in the lower Yamhill Subbasin than in the upper subbasin.Historically, the lower subbasin was characterized by very complex and productive fishhabitat because the largest proportion of unconstrained river and stream channels were in thearea where the Yamhill River and the lower portions of the South and North Forks flowedacross the flat Willamette Valley (YBC, 1999a, 1999b, 2000a, 2000b, 2001a, 2001b, 2001c,and 2002).
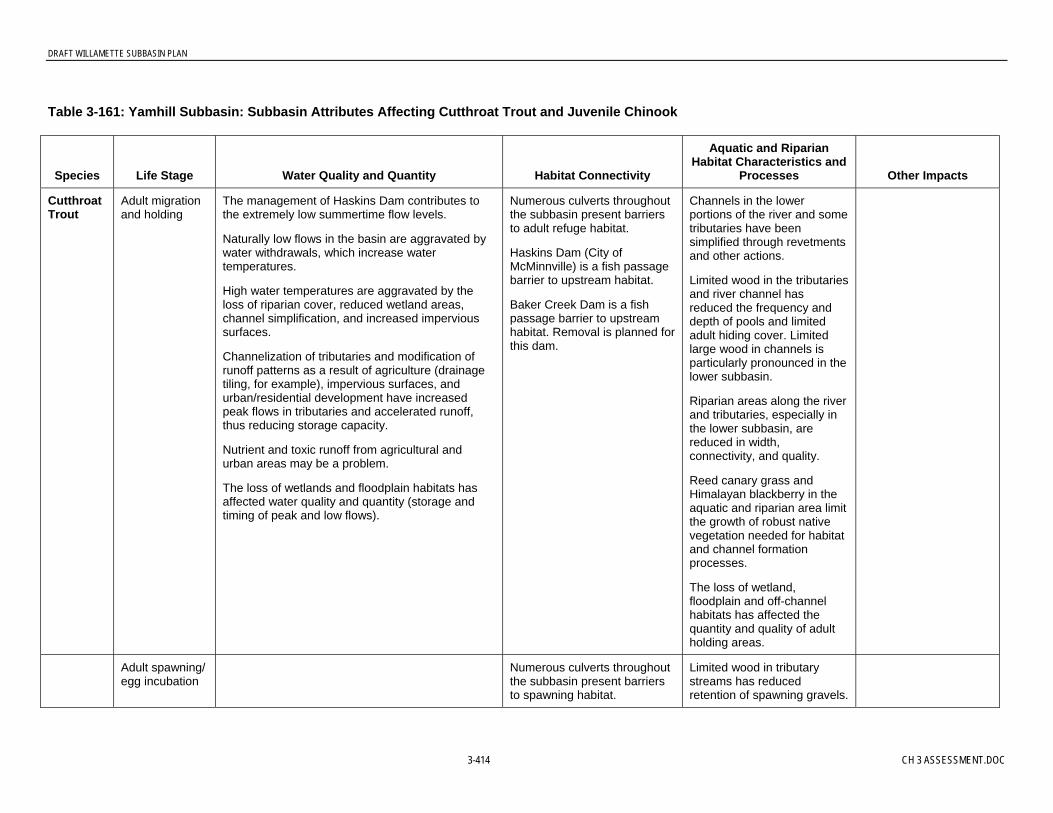
DRAFT WILLAMETTE SUBBASIN PLAN
3-414 CH 3 ASSESSMENT.DOC
Table 3-161: Yamhill Subbasin: Subbasin Attributes Affecting Cutthroat Trout and Juvenile Chinook
Species Life Stage Water Quality and Quantity Habitat Connectivity
Aquatic and RiparianHabitat Characteristics and
Processes Other Impacts
CutthroatTrout
Adult migrationand holding
The management of Haskins Dam contributes tothe extremely low summertime flow levels.
Naturally low flows in the basin are aggravated bywater withdrawals, which increase watertemperatures.
High water temperatures are aggravated by theloss of riparian cover, reduced wetland areas,channel simplification, and increased impervioussurfaces.
Channelization of tributaries and modification ofrunoff patterns as a result of agriculture (drainagetiling, for example), impervious surfaces, andurban/residential development have increasedpeak flows in tributaries and accelerated runoff,thus reducing storage capacity.
Nutrient and toxic runoff from agricultural andurban areas may be a problem.
The loss of wetlands and floodplain habitats hasaffected water quality and quantity (storage andtiming of peak and low flows).
Numerous culverts throughoutthe subbasin present barriersto adult refuge habitat.
Haskins Dam (City ofMcMinnville) is a fish passagebarrier to upstream habitat.
Baker Creek Dam is a fishpassage barrier to upstreamhabitat. Removal is planned forthis dam.
Channels in the lowerportions of the river and sometributaries have beensimplified through revetmentsand other actions.
Limited wood in the tributariesand river channel hasreduced the frequency anddepth of pools and limitedadult hiding cover. Limitedlarge wood in channels isparticularly pronounced in thelower subbasin.
Riparian areas along the riverand tributaries, especially inthe lower subbasin, arereduced in width,connectivity, and quality.
Reed canary grass andHimalayan blackberry in theaquatic and riparian area limitthe growth of robust nativevegetation needed for habitatand channel formationprocesses.
The loss of wetland,floodplain and off-channelhabitats has affected thequantity and quality of adultholding areas.
Adult spawning/egg incubation
Numerous culverts throughoutthe subbasin present barriersto spawning habitat.
Limited wood in tributarystreams has reducedretention of spawning gravels.

DRAFT WILLAMETTE SUBBASIN PLAN
CH 3 ASSESSMENT.DOC 3-415
Table 3-161: Yamhill Subbasin: Subbasin Attributes Affecting Cutthroat Trout and Juvenile Chinook
Species Life Stage Water Quality and Quantity Habitat Connectivity
Aquatic and RiparianHabitat Characteristics and
Processes Other Impacts
Fry and juvenilerearing andmigration
Naturally low flows in the basin are aggravated bywater withdrawals, which may increase watertemperatures.
High water temperatures, particularly in the riverand tributaries in the middle and lower portions ofthe subbasin, do not provide optimal conditions forjuvenile rearing.
Haskins Dam (City ofMcMinnville) is a barrier tojuvenile downstreammovement.
Numerous culverts throughoutthe subbasin present barriersto juvenile access to rearingand refuge habitat.
Loss of connectivity tofloodplain and wetland habitatshas affected juvenile rearingand refuge habitat, particularlyin the lower subbasin.
Unscreened diversions arepresent in the lower subbasin,especially in Salt Creek, AshSwale, and Palmer creeks.
Channels in the lowerportions of the river and sometributaries have beensimplified through revetmentsand other actions.
Limited wood in the tributariesand river channel hasreduced the frequency anddepth of pools, limitingjuvenile rearing and refugehabitat.
Riparian areas along the riverand tributaries are reduced inwidth, connectivity, andquality; there are limitedconifers along the middleportions of the river and mosttributary streams.
The loss of wetland,floodplain, and off-channelhabitats has affected thequantity and quality ofjuvenile rearing and refugeareas.
Introduced fish species(small- and large-mouthbass, for example) mayprey on juveniles.
SpringChinookSalmon
Fry and juvenilerearing andrefuge
Culverts in the lower subbasinpresent barriers to juvenileaccess to refuge habitat.
The loss of connectivity tofloodplain and wetland habitatshas affected juvenile rearingand refuge habitat in the lowerriver.
The loss of wetland,floodplain, and off-channelhabitats in the lower subbasinhave affected the quantityand quality of juvenile rearingand refuge areas.
Source: Wevers et al., 1992; Stahl, ODFW, personal communication, 2004; YBC, 1999a, 1999b, 2000a, 2000b, 2001a, 2001b, 2001c, and 2002.
DRAFT WILLAMETTE SUBBASIN PLAN
3-416 CH 3 ASSESSMENT.DOC
Large Wood. Historical removal of large wood from the river and tributary streams, reduceddelivery and transport of wood through channels, and changes in riparian vegetation all haveinteracted to reduce the quantity and distribution of large wood in the river and tributaries.Mature riparian forests make up a small proportion of the riparian areas in the lower subbasin(Pacific Northwest Ecosystem Research Consortium, 2002). Most of the riparian areas in thelower subbasin are fragmented, have limited tree cover, or are covered by other land usessuch as urban or residential (YBC, 1999a, 1999b, 2000a, 2000b, 2001a, 2001b, 2001c, and2002). For example, more than 15 percent of the riparian areas along the Lower YamhillRiver and tributaries are characterized as consisting of bush, grass, or no vegetation (YBC,2001c). Over time, a number of practices have reduced the quantity of large wood in theTualatin River and tributary channels throughout the subbasin (Wevers et al., 1992). Whileriparian areas in the forested upper subbasin have greater numbers of conifer trees than dolower subbasin areas, historical riparian harvests and wood removal from streams havereduced large wood in these channels (YBC, 1999a, 1999b, 2000a, 2000b, 2001a, 2001b,2001c, and 2002). Reduced large wood in the river and tributary channels limits theformation of pools, thus reducing hiding areas for adult fish and restricting the quality andquantity of juvenile rearing habitat.
Water Quality Changes. Water quality has been modified throughout the subbasin, andcurrently water temperatures exceed criteria in the Yamhill River and many of the tributaries.Naturally low flows in the subbasin are aggravated by water withdrawals, which increasewater temperatures (Stahl, ODFW, personal communication, 2004). In general, watertemperatures are lower in the forested upper subbasin than in the lower subbasin (YBC,1999a, 1999b, 2000a, 2000b, 2001a, 2001b, 2001c, and 2002). High water temperatures inthe lower subbasin are aggravated by loss of riparian cover, reduced wetland areas, channelsimplification, and increased impervious surfaces (YBC, 2001a). Phosphorous pollution hasbeen an ongoing issue in the subbasin. The effects of low summer flows and high nutrientloads can combine to create a poor environment for fish passage and production (Murtagh etal., 1992). There is a TMDL process and other management practices in place to addressexcess phosphorous loads (Oregon Department of Environmental Quality, 2004).
Changes in Flow Regimes. There have been extensive impacts to the subbasin’s hydrologicregimes. Changes in land use have affected hydrologic regimes in the tributaries.Channelization of tributaries; modification of runoff patterns as a result of agriculture,impervious surfaces, and urban/residential development; and loss of storage capacity infloodplains and wetlands have accelerated runoff and increased peak flows (Stahl, ODFW,personal communication, 2004). In up to 80 percent of the agricultural lands in the lowersubbasin, tiles are used to drain excess water (YBC, 2000a), and there has been a significantloss of wetlands in the subbasin as a result of ditching, draining, and tiling (YBC, 2002).Consumptive uses from agricultural, industrial, and urban uses throughout the subbasinseriously delete summertime low flows. Most of the larger tributaries in the subbasin arehave more water appropriations that exceed flows during the summer months (YBC, 1999a,1999b, 2000a, 2000b, 2001a, 2001b, 2001c, and 2002).
Fish Passage Barriers. Obstacles to fish passage are an issue throughout the subbasin.There are several dams that limit upstream migration (Stahl, ODFW, personalcommunication, 2004). Haskins Dam (City of McMinnville) is a fish passage barrier toupstream habitat, as is Baker Creek Dam; removal of Baker Creek Dam is planned. In
DRAFT WILLAMETTE SUBBASIN PLAN
CH 3 ASSESSMENT.DOC 3-417
addition, there are large numbers of road crossing culverts in the lower and upper subbasinthat block or limit fish passage (YBC, 1999a, 1999b, 2000a, 2000b, 2001a, 2001b, 2001c,and 2002). Limiting the fish passage above culverts restricts the amount of habitat availablefor all cutthroat trout life stages.
Appendix G shows specific fish passage barriers on the Yamhill, based on May 2004 datafrom ODFW; the information was compiled from existing ODFW databases.
Habitat Connectivity. Backwater habitats, including pool margins, side channels, andalcoves, are reduced from historical levels. Actions to stabilize the lower river through theplacement of riprap along banks (and other actions) and limited large wood in the channelhave interacted to reduce the quantity and quality of backwater habitats. Large portions of theYamhill River, North and South Forks, and sections of tributary streams have confinedchannels as a result of riprapped banks, revetments, and roads (YBC, 1999a, 1999b, 2000a,2000b, 2001a, 2001b, 2001c, and 2002). Backwater areas in the river and lower tributariesprovide key habitats for adult and juvenile cutthroat tout and juvenile spring Chinooksalmon. These habitats provide fish with habitat for foraging and refuge from winter floodevents.
Key Factors Limiting Fish Populations. The upper and lower portions of the YamhillSubbasin are characterized by different patterns of aquatic and riparian habitat, hydrologicregimes, water quality characteristics, and fish species distributions. For this reason, factorslimiting populations for the focal fish species are assessed separately for the upper and lowersubbasins.
Limiting Factors in the Lower Yamhill Subbasin. In the lower Yamhill Subbasin, theproductivity, capacity, and diversity of cutthroat trout and juvenile spring Chinook arelimited by the following factors:
• Habitat Connectivity. Modification of river and tributary habitat through channel andbank confinement and reduced large wood in the channels have interacted to reducefloodplain connectivity and backwater habitats important for all cutthroat trout life stagesand juvenile Chinook salmon rearing and winter refuge.
• Habitat Modification. Modification of key aquatic habitats has affected all life stages.
• Large Wood. Changes in the delivery and transport of large wood in the river andtributaries has modified gravel deposition patterns, reduced the frequency and depth ofpools, and minimized hiding cover for adult and juvenile cutthroat trout and affectedjuvenile Chinook salmon rearing areas in the lower river.
• Water Temperature. Increased summertime water temperature regimes have affectedadult cutthroat trout populations and limited the capacity of river and tributary streams tosupport juvenile fish.
• Fish Passage Barriers. Fish passage barriers at road crossings on tributary streams blockthe interchange between cutthroat trout populations and limit adult and juvenile accessinto rearing and refuge habitat.

DRAFT WILLAMETTE SUBBASIN PLAN
3-418 CH 3 ASSESSMENT.DOC
• Additional Factors. Other factors limiting the populations of focal species includecompetition with introduced fish, runoff of toxics from urban and agricultural areas, andsome unscreened water diversions.
Table 3-162 shows the EDT attributes related to these limiting factors for cutthroat trout andjuvenile spring Chinook salmon life stages in the lower Yamhill Subbasin. The area of thesubbasin being considered is largely on the Willamette Valley floor, where the majority ofthe land is privately owned, with agricultural, rural residential, and urban land uses. Thepriorities for restoration are qualitative ratings based on the information in Table 3-161 andprofessional opinions from individuals familiar with the subbasin, particularly ODFWbiologists.
Table 3-162: Qualitative Rating of EDT Attributes for Cutthroat Trout and Juvenile SpringChinook in the Lower Yamhill Subbasin
EDT Attribute Class DescriptionPriority forRestoration
Channel stability Limited wood in channels and reduced riparianfunction have reduced channel stability.
HIGH
Flow There have been impacts to the interannual variabilityof low and high flows as a result of land use practicesand water diversions.
HIGH
Habitat diversity Extensive channel confinement through the rivercorridor as a result of bank riprap and revetments; lossof floodplain and riparian trees and limited wood in theriver and tributary channels.
HIGH
Obstructions Dams on tributary streams prevent upstream anddownstream movement; numerous complete andpartial barriers on tributary streams.
HIGH
Temperature Changes in riparian canopy cover and waterwithdrawals have increased summer high watertemperatures on some tributary streams.
HIGH
Key habitats Reduction of the following key channel habitats affectskey life stages: primary pools, backwater areas, andlarge wood (0- and 1-age rearing and migration).
HIGH
Chemicals There is little evidence that toxics are affectingsalmonids, although there are some high levels notedin monitoring (see Table 3-161; Stahl, ODFW,personal communication, 2004).
Medium
Competition with otherspecies
Fish community richness is high and there is somecompetition with introduced fish (Stahl, ODFW,personal communication, 2004).
Medium
Withdrawals Some problems from unscreened diversions (Stahl,ODFW, personal communication, 2004).
Medium
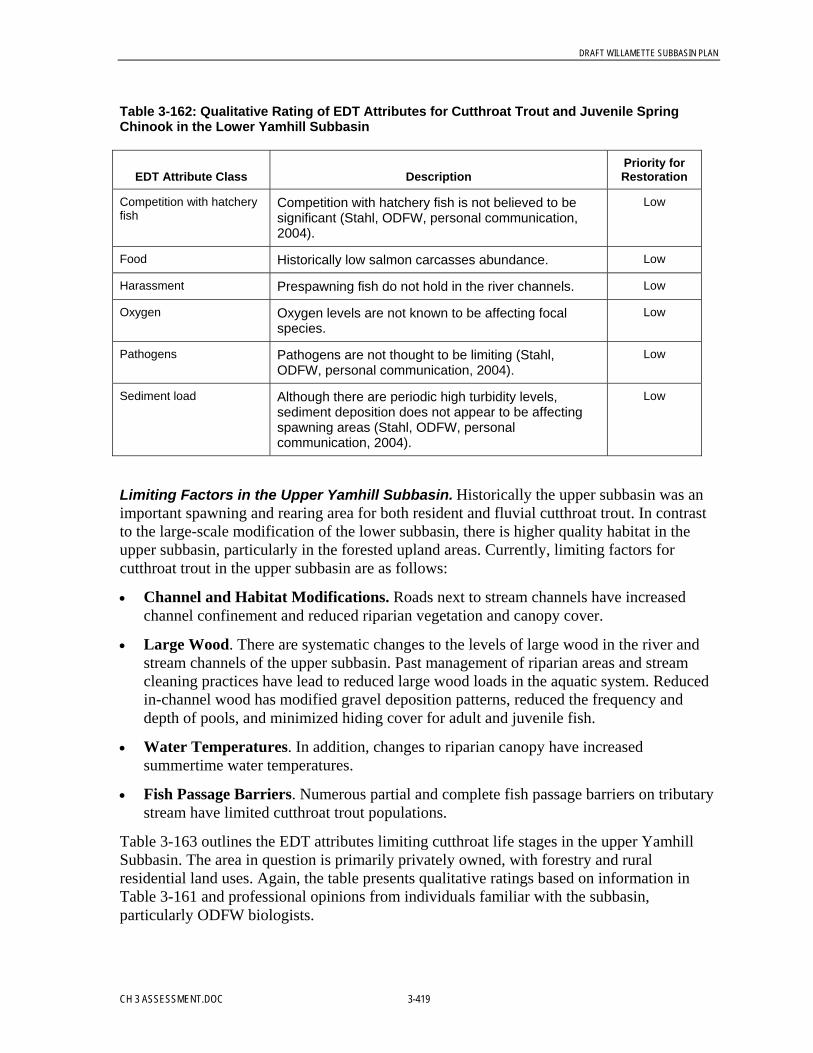
DRAFT WILLAMETTE SUBBASIN PLAN
CH 3 ASSESSMENT.DOC 3-419
Table 3-162: Qualitative Rating of EDT Attributes for Cutthroat Trout and Juvenile SpringChinook in the Lower Yamhill Subbasin
EDT Attribute Class DescriptionPriority forRestoration
Competition with hatcheryfish
Competition with hatchery fish is not believed to besignificant (Stahl, ODFW, personal communication,2004).
Low
Food Historically low salmon carcasses abundance. Low
Harassment Prespawning fish do not hold in the river channels. Low
Oxygen Oxygen levels are not known to be affecting focalspecies.
Low
Pathogens Pathogens are not thought to be limiting (Stahl,ODFW, personal communication, 2004).
Low
Sediment load Although there are periodic high turbidity levels,sediment deposition does not appear to be affectingspawning areas (Stahl, ODFW, personalcommunication, 2004).
Low
Limiting Factors in the Upper Yamhill Subbasin. Historically the upper subbasin was animportant spawning and rearing area for both resident and fluvial cutthroat trout. In contrastto the large-scale modification of the lower subbasin, there is higher quality habitat in theupper subbasin, particularly in the forested upland areas. Currently, limiting factors forcutthroat trout in the upper subbasin are as follows:
• Channel and Habitat Modifications. Roads next to stream channels have increasedchannel confinement and reduced riparian vegetation and canopy cover.
• Large Wood. There are systematic changes to the levels of large wood in the river andstream channels of the upper subbasin. Past management of riparian areas and streamcleaning practices have lead to reduced large wood loads in the aquatic system. Reducedin-channel wood has modified gravel deposition patterns, reduced the frequency anddepth of pools, and minimized hiding cover for adult and juvenile fish.
• Water Temperatures. In addition, changes to riparian canopy have increasedsummertime water temperatures.
• Fish Passage Barriers. Numerous partial and complete fish passage barriers on tributarystream have limited cutthroat trout populations.
Table 3-163 outlines the EDT attributes limiting cutthroat life stages in the upper YamhillSubbasin. The area in question is primarily privately owned, with forestry and ruralresidential land uses. Again, the table presents qualitative ratings based on information inTable 3-161 and professional opinions from individuals familiar with the subbasin,particularly ODFW biologists.

DRAFT WILLAMETTE SUBBASIN PLAN
3-420 CH 3 ASSESSMENT.DOC
Table 3-163: Qualitative Rating of EDT Attributes for Cutthroat Trout Life Stages in theUpper Yamhill Subbasin
EDT Attribute Class DescriptionPriority forRestoration
Habitat diversity Some channel confinement through the river corridor as aresult of revetments; loss of floodplain and riparian trees andlimited wood in the river and tributary channels.
HIGH
Obstructions Numerous complete and partial barriers on tributaries. HIGH
Temperature Changes in riparian canopy cover and water withdrawalshave increased summer high water temperatures on sometributary streams.
HIGH
Key habitats Reduction of the following key channel habitats affects keylife stages: primary pools, backwater areas, and large wood(0- and 1-age rearing and migration).
HIGH
Channel stability Limited wood in channels and reduced riparian function haveaffected channel stability.
Medium
Withdrawals Limited impacts because most of the unscreened diversionsare in the lower subbasin.
Medium
Chemicals Toxics are probably not an issue because of the limitedurban and agricultural land uses in the upper subbasin.
Low
Competition with hatcheryfish
Competition with hatchery fish is not believed to besignificant (Stahl, ODFW, personal communication, 2004).
Low
Competition with otherspecies
There is some competition with introduced fish in the river,but competition in the tributaries is minimal (Stahl, ODFW,personal communication, 2004).
Low
Flow There is less area in agricultural and urban land uses thatcontributes to changes in flow regimes.
Low
Food Historically low salmon carcasses abundance. Low
Harassment Prespawning fish do not hold in the river channels. Low
Oxygen Oxygen levels are not known to be affecting focal species. Low
Pathogens Pathogens are not thought to be limiting (Stahl, ODFW,personal communication, 2004).
Low
Sediment load Although there are periodic high turbidity levels, sedimentdeposition does not appear to be affecting spawning areas(Stahl, ODFW, personal communication, 2004).
Low
3.5.1.14 Limiting Factors in the Clackamas Subbasin (with EDT Analysis)This section describes the geographic setting of the Clackamas Subbasin and limiting factorsfor the focal species in the subbasin: Chinook and coho salmon and winter steelhead. Thelimiting factors were determined by using EDT to analyze habitat conditions on a reach-by-reach basis throughout the Clackamas Subbasin.
DRAFT WILLAMETTE SUBBASIN PLAN
CH 3 ASSESSMENT.DOC 3-421
Focal species present:• Chinook salmon• Coho salmon• Winter steelhead
Focal species for the assessment were chosen to characterize the environment and to capturehabitat issues of concern to managers. We chose three anadromous salmonid focal species:coho salmon (Oncorhynchus kisutch), Chinook salmon (O. tshawytscha) and winter steelhead(O. mykiss). These species are native to the system, although all are influenced by hatcheryreleases within the basin. We assume that robust, naturally spawning populations of thesespecies are consistent with the normative condition for the Clackamas and that constraints ontheir performance within the EDT reflect anthropogenic changes to the normative condition.
Populations were defined for each focal species (see Table 3-164). The term “population” inEDT does not necessarily imply a genetic connotation. EDT populations are regions within awatershed composed of reaches that are delineated from other areas because of managementinterest (including possible genetic concerns) and to contrast different areas of the watershed.EDT begins life history trajectories for each population from reaches within the defined area.This group of trajectories may traverse several geographic areas over the course of the lifehistory. For example, assessment results for the upper Clackamas coho population representtrajectories that began in reaches in the upper Clackamas and extended downstream throughthe middle and lower geographic areas in the Clackamas, the Willamette River, and so on tocomplete a life history.
Table 3-164: Focal Species and EDT Populations in the ClackamasRiver
Species Population
Chinook Clackamas Fall ChinookClackamas Spring Chinook
Coho Upper Clackamas CohoLower Clackamas Coho
Winter steelhead Upper Clackamas SteelheadLower Clackamas Steelhead
Chinook salmon in the Clackamas were divided into two populations on the basis ofdifferences in adult and juvenile behavior and distribution within the system (seeTable 3-164). Fall Chinook in the Clackamas spawn in the lower reaches of the mainstemand lower tributaries. They display an ocean-type life history and out-migrate as juveniles inthe spring and summer following emergence. Spring Chinook potentially use the entirewatershed, including the entire length of the mainstem and many tributaries. Spring Chinookdisplay a stream-type life history and remain as juveniles in the system for their first year andthen out-migrate in their second spring.
Coho and steelhead were divided into two populations for each species using the PGEmainstem dams as the point of demarcation (see Table 3-164). Both species are potentiallypresent in almost all reaches of the Clackamas and tributaries. They have both been heavily

DRAFT WILLAMETTE SUBBASIN PLAN
3-422 CH 3 ASSESSMENT.DOC
influenced by management actions, including hatchery programs that differ in the upper andlower sections of the river. For this reason and in order to contrast habitat conditions betweenthe upper and lower portions of the river, we delineated the two populations for each species.
The two coho populations were based on the biological characteristics of the Clackamasearly-run coho population. Managers have defined two coho populations in the Clackamasbased on differences in return timing, spawning area and origin (Cramer and Cramer, 1994).Native coho in the Clackamas River are the late-run coho that spawn mainly in the reachesbetween the PGE dams and Roaring River (Doug Cramer, personal communication). TheLower Columbia River Technical Review Team has designated this late-returning life historyas Type N coho (WLC-TRT, 2003b). They enter the river late and spawn as late as Februaryand March (Doug Cramer, personal communication). Early-run coho spawn throughout theriver but originate from hatchery outplants. These fish spawn in late fall and are designated atType S coho life history (WLC-TRT, 2003b). While the late-run coho probably originatedfrom native Clackamas River coho, their late spawning time may have been skewed byintense harvest pressure in the past years (Doug Cramer, personal communication). Becauseour intent was to characterize habitat conditions and not , at this time, to explore theimplications of habitat effects on coho life histories, we used the early returning, Type N lifehistory to characterize coho habitat in the Clackamas River.
Geographic Setting. The Clackamas River drains a watershed of 941 square miles and isthe fourth largest watershed within the Willamette Basin. The Clackamas enters theWillamette at RM 25.1 and is the largest watershed in the Willamette River belowWillamette Falls (RM 26.8). The river has several major tributaries, including Deep, Clearand Eagle creeks in the lower Clackamas and Collowash River and Oak Grove Fork in theupper basin (see Appendix X). The upper two-thirds of the watershed consists of relativelyhigh-gradient mountainous reaches, while the lower section drains a gentler topography. Theupper sections of the river are heavily forested, and much of the upper watershed is withinthe Mt. Hood National Forest. The lower portion of the watershed is more developed andbecomes increasingly urbanized toward the mouth of the river. The city of Estacada is thelargest city entirely within the watershed, although the Portland suburbs of Glastone, JohnsonCity, and Oregon City are located at the mouth of the river.
PGE operates dams on the mainstem not far above the city of Estacada at Clackamas RM 23.The PGE operation consists of River Mill Dam, Faraday Diversion Dam, and North ForkDam (see Appendix H for a map of the Clackamas Subbasin showing these dams). Thesedams operate as a complex, with the main reservoir located behind North Fork Dam.Migrating juvenile and adult fish are passed around these dams through a system of pipes andladders (Cramer and Cramer, 1994). PGE also operates a power production facility on theOak Grove Fork. Harriet Lake Dam diverts most of the stream flow from Oak Grove out ofthe watershed to Three Lynx Powerhouse near Frog Lake. Anadromous fish passage isblocked below Harriet Lake Dam by a natural waterfall at River Mile 3.8 (USFS, 1996).
The Clackamas River drains the lower east side of the Willamette Valley, which is a broad,north-south trending valley formed by the Coast Range to the west and the CascadeMountains to the east. The floor of the valley has been filled by alluvial deposits of theWillamette drainage and by deposits from Missoula Floods that occurred at the close of thelast glaciation (Orr and others, 1976). The Clackamas arises from the flanks of Mt. Hood in

DRAFT WILLAMETTE SUBBASIN PLAN
CH 3 ASSESSMENT.DOC 3-423
the Cascade Mountains in the High Cascades geological province (Orr and others, 1976).This consists of relatively young volcanic deposits that have not yet developed a completedrainage network (Grant, 1997). The rocks are highly porous, and much of the area’sprecipitation is absorbed within the bedrock. This water is released through springs thatmaintain relatively high summer flow in the Clackamas compared to other streams in theWillamette (Grant, 1997). As the river flows to the west, it drains the older Western Cascadesprovince. These volcanic rocks are less porous and have a well-developed drainage network.As a result, streamflow in the lower watershed largely tracks rainfall precipitation patterns(USFS, 1995), such that summer flow in the upper Clackamas basin is relatively highcompared to summer low flow in the lower basin (see Figure 3-35).
Clackamas River Average Daily Flow 1960-1970
0
1000
2000
3000
4000
5000
6000
7000
8000
9000
10000
1/11/19 2/6
2/243/13
3/314/18 5/6
5/246/11
6/297/17 8/4
8/22 9/99/27
10/1511/2
11/2012/8
12/26
Day
Flow
(cfs
) at E
stac
ada
0
200
400
600
800
1000
1200
1400
1600
Flow
(cfs
) at B
ig B
otto
m
Estacada (14210000)Big Bottom (14208000)
Figure 3-35: Flow in the Clackamas River in the Upper Watershed (Big Bottom) and LowerWatershed (Estacada)
Key Findings. Figure 3-36 displays the results of the EDT analysis for all the EDTgeographic areas in the Clackamas for all species and populations combined. The figureshows the effect of degrading conditions further (protection priority) and of restoringconditions (restoration priorities) in each geographic area on the equilibrium abundance ofeach of the six populations. Protection priorities describe how the Clackamas systemcurrently operates. Restoration priorities describe the potential of each area in terms of whatmight be possible with restoration. Table 3-165 shows the relative ranking of each EDTgeographic area with regard to overall protection and restoration potential for all sixpopulations combined.
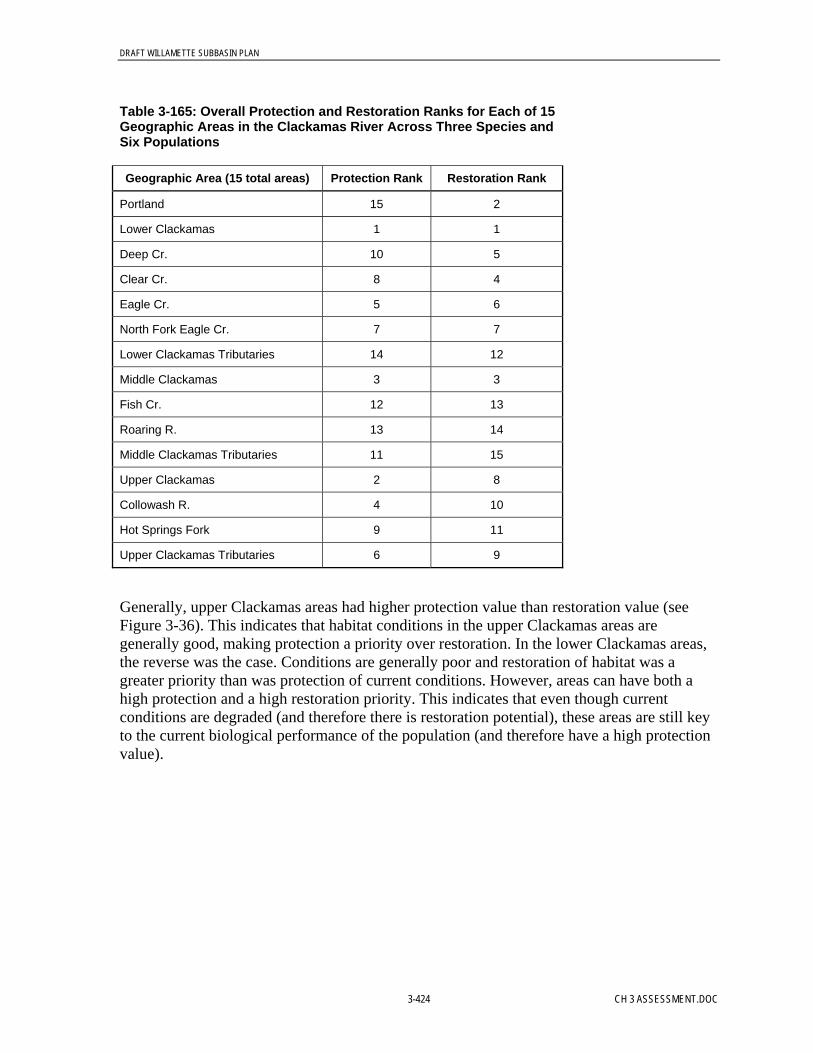
DRAFT WILLAMETTE SUBBASIN PLAN
3-424 CH 3 ASSESSMENT.DOC
Table 3-165: Overall Protection and Restoration Ranks for Each of 15Geographic Areas in the Clackamas River Across Three Species andSix Populations
Geographic Area (15 total areas) Protection Rank Restoration Rank
Portland 15 2
Lower Clackamas 1 1
Deep Cr. 10 5
Clear Cr. 8 4
Eagle Cr. 5 6
North Fork Eagle Cr. 7 7
Lower Clackamas Tributaries 14 12
Middle Clackamas 3 3
Fish Cr. 12 13
Roaring R. 13 14
Middle Clackamas Tributaries 11 15
Upper Clackamas 2 8
Collowash R. 4 10
Hot Springs Fork 9 11
Upper Clackamas Tributaries 6 9
Generally, upper Clackamas areas had higher protection value than restoration value (seeFigure 3-36). This indicates that habitat conditions in the upper Clackamas areas aregenerally good, making protection a priority over restoration. In the lower Clackamas areas,the reverse was the case. Conditions are generally poor and restoration of habitat was agreater priority than was protection of current conditions. However, areas can have both ahigh protection and a high restoration priority. This indicates that even though currentconditions are degraded (and therefore there is restoration potential), these areas are still keyto the current biological performance of the population (and therefore have a high protectionvalue).
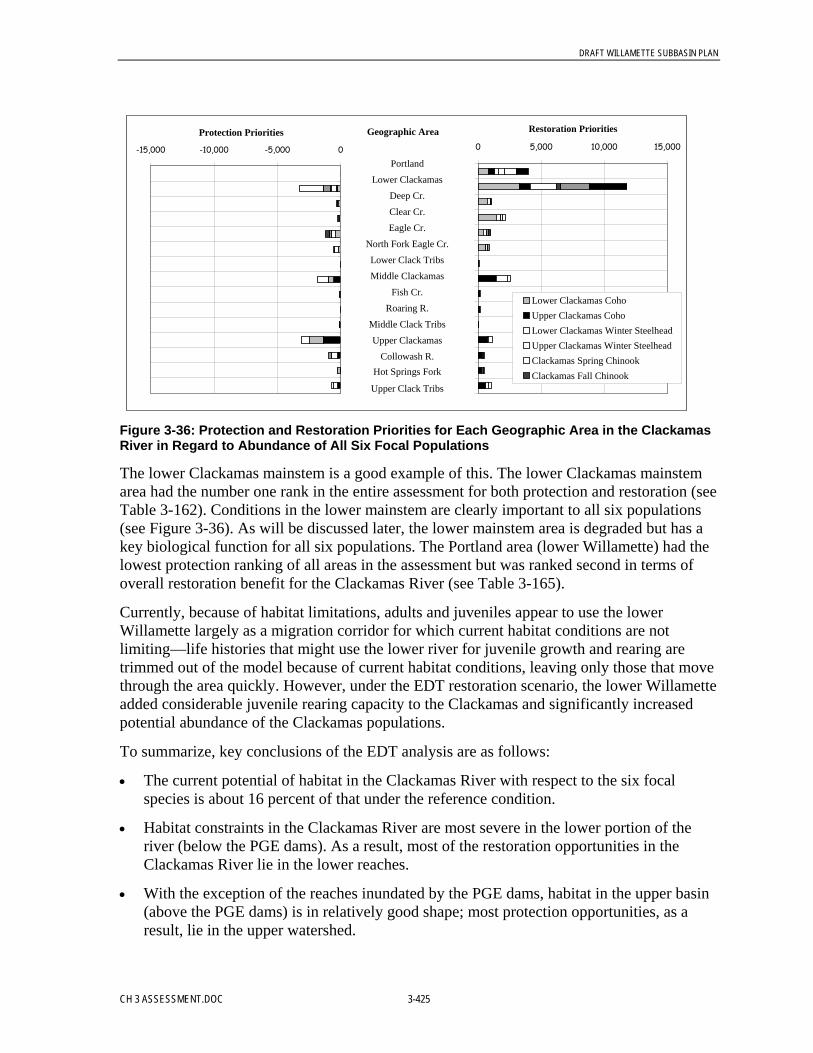
DRAFT WILLAMETTE SUBBASIN PLAN
CH 3 ASSESSMENT.DOC 3-425
PortlandLower Clackamas
Deep Cr.
Clear Cr.Eagle Cr.
North Fork Eagle Cr.Lower Clack TribsMiddle Clackamas
Fish Cr.Roaring R.
Middle Clack TribsUpper Clackamas
Collowash R.Hot Springs Fork
Upper Clack Tribs
Restoration Priorities
0 5,000 10,000 15,000
Lower Clackamas CohoUpper Clackamas CohoLower Clackamas Winter SteelheadUpper Clackamas Winter SteelheadClackamas Spring ChinookClackamas Fall Chinook
Protection Priorities
-15,000 -10,000 -5,000 0
Geographic Area
Figure 3-36: Protection and Restoration Priorities for Each Geographic Area in the ClackamasRiver in Regard to Abundance of All Six Focal Populations
The lower Clackamas mainstem is a good example of this. The lower Clackamas mainstemarea had the number one rank in the entire assessment for both protection and restoration (seeTable 3-162). Conditions in the lower mainstem are clearly important to all six populations(see Figure 3-36). As will be discussed later, the lower mainstem area is degraded but has akey biological function for all six populations. The Portland area (lower Willamette) had thelowest protection ranking of all areas in the assessment but was ranked second in terms ofoverall restoration benefit for the Clackamas River (see Table 3-165).
Currently, because of habitat limitations, adults and juveniles appear to use the lowerWillamette largely as a migration corridor for which current habitat conditions are notlimiting—life histories that might use the lower river for juvenile growth and rearing aretrimmed out of the model because of current habitat conditions, leaving only those that movethrough the area quickly. However, under the EDT restoration scenario, the lower Willametteadded considerable juvenile rearing capacity to the Clackamas and significantly increasedpotential abundance of the Clackamas populations.
To summarize, key conclusions of the EDT analysis are as follows:
• The current potential of habitat in the Clackamas River with respect to the six focalspecies is about 16 percent of that under the reference condition.
• Habitat constraints in the Clackamas River are most severe in the lower portion of theriver (below the PGE dams). As a result, most of the restoration opportunities in theClackamas River lie in the lower reaches.
• With the exception of the reaches inundated by the PGE dams, habitat in the upper basin(above the PGE dams) is in relatively good shape; most protection opportunities, as aresult, lie in the upper watershed.
DRAFT WILLAMETTE SUBBASIN PLAN
3-426 CH 3 ASSESSMENT.DOC
EDT Approach. EDT (Mobrand Biometrics, 2004) was the primary tool used to assesshabitat conditions in the Clackamas River with regard to three native salmonid fish species:coho salmon, Chinook salmon, and steelhead trout. EDT relates a reach-level environmentaldescription to the life stage and population performance of the focal species. The purpose ofthe assessment was threefold:
• To estimate the potential of the focal species in the Clackamas River given current habitatconditions
• To prioritize areas within the Clackamas in regard to their potential protection andrestoration value
• To identify specific factors constraining the current performance of the focal species inthe Clackamas River
The assessment was based on existing data sources, including habitat assessments fromUSFS, ODFW, the Clackamas River Basin Council, and others. Information was gatheredand reviewed by a technical team composed of technical representatives from ClackamasCounty, ODFW, PGE, and the basin council.
This assessment was conducted to determine the potential of habitat in the Clackamas Riverand lower Willamette River with respect to the three focal species. It is a guide to restoration,rather than a predictor of future events. The abundance of fish that actually return to theClackamas River is the result of many factors in addition to local habitat conditions. Thesebroader factors include conditions in the ocean, where the fish spend the majority of theirlives, and a host of anthropogenic factors, including harvest rates and hatchery practices. Fishpopulations are constantly being adjusted by natural selection to adapt to these nonhabitatfactors, in addition to the conditions in the Clackamas River. Over the last several decades,fish have been affected by dramatic changes in ocean climatic regimes, wide fluctuations inharvest, and changing hatchery policies. As a result, current populations may be “out ofsync” and still trying to adapt to their rapidly changing conditions and rebuilding from pastevents. For these reasons, this assessment should be used as a guide to habitat constraints andopportunities in the Clackamas River; expectations of benefits should be moderated by therealization of the complex environment that determines actual fish abundance and persistenceover time.
EDT was used to characterize the potential biological performance of the focal species undertwo scenarios: the current condition scenario and the restored reference condition scenario.The current condition scenario was based on empirical data and expert observations ofenvironmental conditions in the Clackamas River today. The restored reference conditionscenario provided a point of comparison. This is a representation of the Clackamas River in afully restored condition and is analogous to a presettlement condition that might have existedin the early 19th century. The intent, however, was not to recreate a specific historicalcondition but to describe the inherent potential of the system if it were unencumbered byanthropogenic modifications. The change in potential performance of the focal species in thecurrent condition relative to the idealized reference condition described the constraints on thesystem is due to anthropogenic factors. A third scenario, the degraded condition scenario, isautomatically generated from EDT by setting most environmental attributes to a fullydegraded condition. Conditions were assessed with respect to the focal species by comparing

DRAFT WILLAMETTE SUBBASIN PLAN
CH 3 ASSESSMENT.DOC 3-427
the current condition of the Clackamas at reach and larger scales to the degraded and restoredconditions.
Following the assessment of conditions, we used EDT to characterize a fourth condition,termed PFC, or properly functioning conditions. PFC is a set of attribute ratings in EDT thatdefine an environmental condition that is consistent with productive salmon populations inthe Pacific Northwest. The PFC condition lies between the current condition and the restoredreference condition. PFC conditions for EDT have been developed by an interagency teamorganized by the Washington Department of Fish and Wildlife and the Northwest IndianFisheries Commission. The use of the PFC scenario in this analysis is intended to illustrate anenvironmental condition that is likely to result in robust fish populations in the ClackamasRiver but that is still not equal to the historical potential of the river or the restored referencescenario. PFC is not, however, necessarily advocated by any group as a feasible or targetcondition for the Clackamas River.
The assessment of the Clackamas was organized hierarchically. At the finest scale,information was developed for stream reaches that described the physical and biologicalenvironment of the stream. A total of 215 stream reaches were described throughout theClackamas system (see Appendix I for reach-break maps). Reaches were defined by thetechnical team based on geomorphic and land use criteria. In some portions of the watershed,the team used reaches that had been defined for other stream surveys, especially thoseconducted in the watershed by the Oregon Department of Fish and Game as part of itsAquatic Inventory Project (Moore and others, 1997). Stream reaches for the EDT assessmentalso included 51 obstruction reaches. In EDT, an obstruction such as culvert or dam is treatedas a reach and hydrologically routed to other reaches. Each obstruction was rated by thetechnical committee as to its impediment to upstream or downstream movement of adult andjuvenile fish.
Reaches were grouped into 14 geographic areas (see Table 3-166) throughout the Clackamaswatershed. An additional area (the Portland area) added the Willamette River from the mouthof the Clackamas to the Columbia River. Geographic areas are groupings of stream reachesthat are used to summarize the detailed stream reach results. Areas corresponded to majortributaries or sections of the mainstem. Smaller tributaries were grouped into separate groups(see Table 3-166). Geographic areas were organized into three sections corresponding to themajor geomorphic divisions of the river. For this subbasin plan, information is presented atthe level of the geographic areas in Table 3-166. However, reach-level assessment ofconditions for each life stage in each reach are available from the EDT assessment.

DRAFT WILLAMETTE SUBBASIN PLAN
3-428 CH 3 ASSESSMENT.DOC
Table 3-166: Geographic Structure of EDT Assessment ofthe Clackamas River
Clackamas River EDT StructureSection Geographic Areas Included streams
Lower ClackamasLower Clack Tribs
Rock Cr.Richardson Cr.
Foster Cr.Goose Cr.Cow Cr.
Sieben Cr.ClearEagle
N. Fork EagleDeep
Tickle Cr.
Middle ClackamasMiddle Clack Tribs
N. Fork ClackamasS. Fork Clackamas
Sandstone Cr.Big Cr.
Whale Cr.Cripple Cr.
S. Fork Cripple Cr.Fish
Roaring
Upper ClackamasUpper Clackamas Tribs
Oak Grove ForkTag Cr.
Trout Cr.Pot Cr.
Wolf Cr.Kansas Cr.Pinhead Cr.
Last Cr.Lowe Cr.
Rhododendron Cr.Fawn Cr.
Hunter Cr.Cub Cr.
Berry Cr.Collawash
Hot Springs
Low
er C
lack
amas
Mid
dle
Cla
ckam
asU
pper
Cla
ckam
as
PGE Dam complex (RM 23 )
Oak Grove Fork (RM 49)
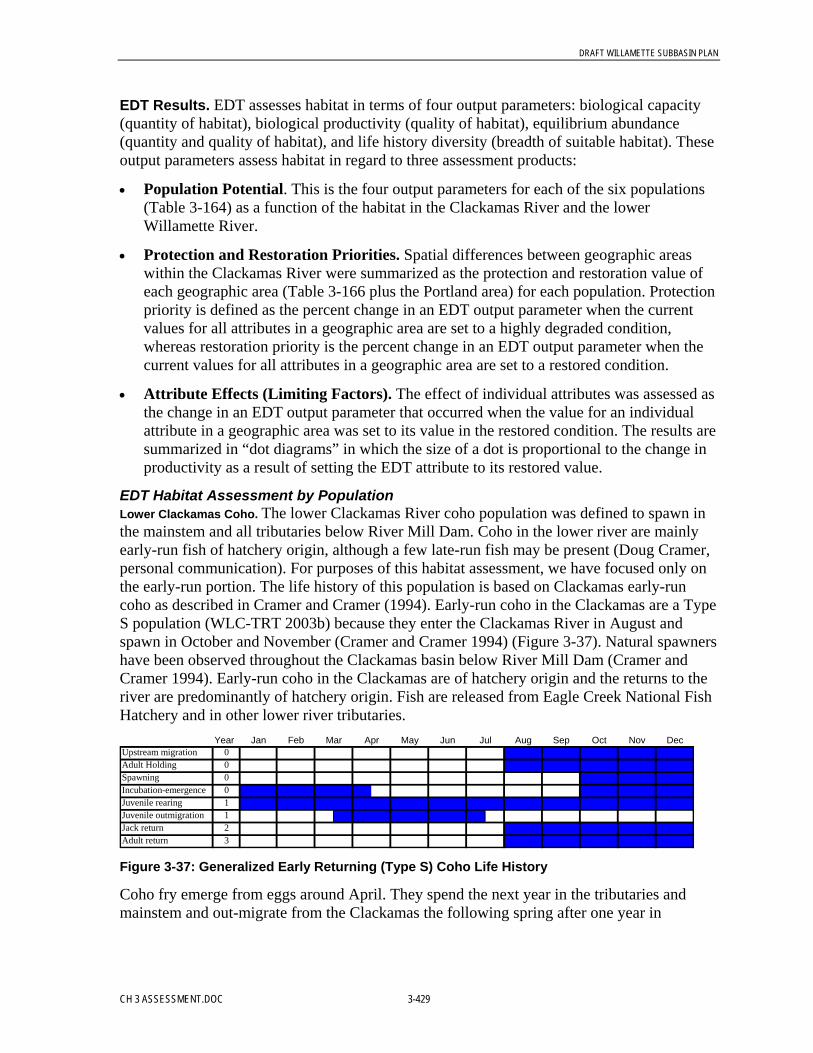
DRAFT WILLAMETTE SUBBASIN PLAN
CH 3 ASSESSMENT.DOC 3-429
EDT Results. EDT assesses habitat in terms of four output parameters: biological capacity(quantity of habitat), biological productivity (quality of habitat), equilibrium abundance(quantity and quality of habitat), and life history diversity (breadth of suitable habitat). Theseoutput parameters assess habitat in regard to three assessment products:
• Population Potential. This is the four output parameters for each of the six populations(Table 3-164) as a function of the habitat in the Clackamas River and the lowerWillamette River.
• Protection and Restoration Priorities. Spatial differences between geographic areaswithin the Clackamas River were summarized as the protection and restoration value ofeach geographic area (Table 3-166 plus the Portland area) for each population. Protectionpriority is defined as the percent change in an EDT output parameter when the currentvalues for all attributes in a geographic area are set to a highly degraded condition,whereas restoration priority is the percent change in an EDT output parameter when thecurrent values for all attributes in a geographic area are set to a restored condition.
• Attribute Effects (Limiting Factors). The effect of individual attributes was assessed asthe change in an EDT output parameter that occurred when the value for an individualattribute in a geographic area was set to its value in the restored condition. The results aresummarized in “dot diagrams” in which the size of a dot is proportional to the change inproductivity as a result of setting the EDT attribute to its restored value.
EDT Habitat Assessment by PopulationLower Clackamas Coho. The lower Clackamas River coho population was defined to spawn inthe mainstem and all tributaries below River Mill Dam. Coho in the lower river are mainlyearly-run fish of hatchery origin, although a few late-run fish may be present (Doug Cramer,personal communication). For purposes of this habitat assessment, we have focused only onthe early-run portion. The life history of this population is based on Clackamas early-runcoho as described in Cramer and Cramer (1994). Early-run coho in the Clackamas are a TypeS population (WLC-TRT 2003b) because they enter the Clackamas River in August andspawn in October and November (Cramer and Cramer 1994) (Figure 3-37). Natural spawnershave been observed throughout the Clackamas basin below River Mill Dam (Cramer andCramer 1994). Early-run coho in the Clackamas are of hatchery origin and the returns to theriver are predominantly of hatchery origin. Fish are released from Eagle Creek National FishHatchery and in other lower river tributaries.
YearUpstream migration 0Adult Holding 0Spawning 0Incubation-emergence 0Juvenile rearing 1Juvenile outmigration 1Jack return 2Adult return 3
Jan Feb Mar Apr May Jun Jul Aug Sep Oct Nov Dec
Figure 3-37: Generalized Early Returning (Type S) Coho Life History
Coho fry emerge from eggs around April. They spend the next year in the tributaries andmainstem and out-migrate from the Clackamas the following spring after one year in

DRAFT WILLAMETTE SUBBASIN PLAN
3-430 CH 3 ASSESSMENT.DOC
freshwater. Precocious males (jacks) return the next fall after less than 1 year in the ocean.The remaining adults spend one more year in the ocean to return to spawn as 3-year old fish.
Coho is not a federally listed species in the Willamette or lower Columbia River. No ESU isapplicable to this population and the Lower Columbia TRT has not designated populations.In its status review of lower Columbia River coho, NOAA Fisheries designated a singleClackamas River coho population (Myers and others, 1998). The lower river population usedin this assessment would be a part of the NOAA Fisheries population.
The most complete enumeration of returning salmon in the Clackamas River is the laddercount at North Fork Dam (Figure 3-38). While this count applies to coho that have passed thelower river reaches that apply to the lower Clackamas coho population, the trend in early-returning coho at North Fork provides an indication of the trend in abundance of thispopulation. No clear trend in the count in Figure 3-38 is evident, although counts since themid-1970s have are generally greater than the count in the previous decade. This is likely theresult of a decrease in commercial harvest rates over the period and precipitous drop inharvest in 1994 as a result of more restrictive harvest regulation. During the 1960s and 70s,harvest rates on were around 85 to 95 percent; after 1994, rates have been between 10 and 20percent (WLC-TRT, 2003b). Return of coho to at North Fork Dam since 1970 has averaged720 adults and has varied widely from a low of a 54 to a high of 2,196.
0
500
1,000
1,500
2,000
2,500
1965 1970 1975 1980 1985 1990 1995 2000
Adu
lts
Figure 3-38: Count of Adult Early Returning Coho at North Fork DamSource: StreamNet
For the lower Clackamas population specifically, the Oregon Department of Fish and Game(ODFW) estimated 2,402 natural spawners in the area below North Fork Dam in 2002. Asnoted above, early-run coho are released from Eagle Creek Hatchery; ODFW estimated that78 percent of the naturally spawning fish were of hatchery origin (WLC-TRT, 2003b).

DRAFT WILLAMETTE SUBBASIN PLAN
CH 3 ASSESSMENT.DOC 3-431
The habitat potential for coho in the lower Clackamas has been greatly reduced as a result ofhabitat modification relative to the EDT reference condition (Figure 3-39). Currentabundance potential is 91 percent less than the potential under the reference condition.Productivity, a measure of habitat quality, is reduced by 86 percent. With harvest, currentproductivity is estimated to be only 1.6 (Figure 3-39). Given the expected ranges of naturalenvironmental variation and events, it is questionable whether natural production of coho issustainable in the lower Clackamas River under the present habitat condition. In fact, muchof the observed current natural production of coho in the lower Clackamas River is ofhatchery origin (WLC-TRT 2003b). Potential coho life history diversity, as a function of thebreadth of suitable habitat conditions, has been reduced by more than half. This indicates aconsiderable narrowing of the area and time (within a year) for suitable coho habitat in thelower river.
Lower Clackamas CohoScenario Diversity index Productivity AbundanceCurrent without harvest 41% 1.8 704 Current with harvest 38% 1.6 492 Reference potential 99% 13.4 8,262
May 11, 2004
Abundance (spawners)
0
1,000
2,000
3,000
4,000
5,000
6,000
7,000
8,000
9,000
Productivity (return/spawner)
0.0
2.0
4.0
6.0
8.0
10.0
12.0
14.0
16.0
Current Potential
Diversity Index (% of potential)
0%
10%
20%
30%
40%
50%
60%
70%
80%
90%
100%
Figure 3-39: EDT Estimates of Habitat Potential in the Lower Clackamas River for CohoSalmonNumbers in graphs are without harvest.
All reaches used by this population had low protection value (Figure 3-40), indicating thatcurrent conditions are degraded and that coho potential is greatly restricted in the currenthabitat condition. Clear Creek has the greatest current habitat potential (therefore greatestprotection value), followed by Eagle and North Fork Eagle creeks. The pattern of protectionpriorities with respect to the diversity index also stressed the value of the tributary reaches.
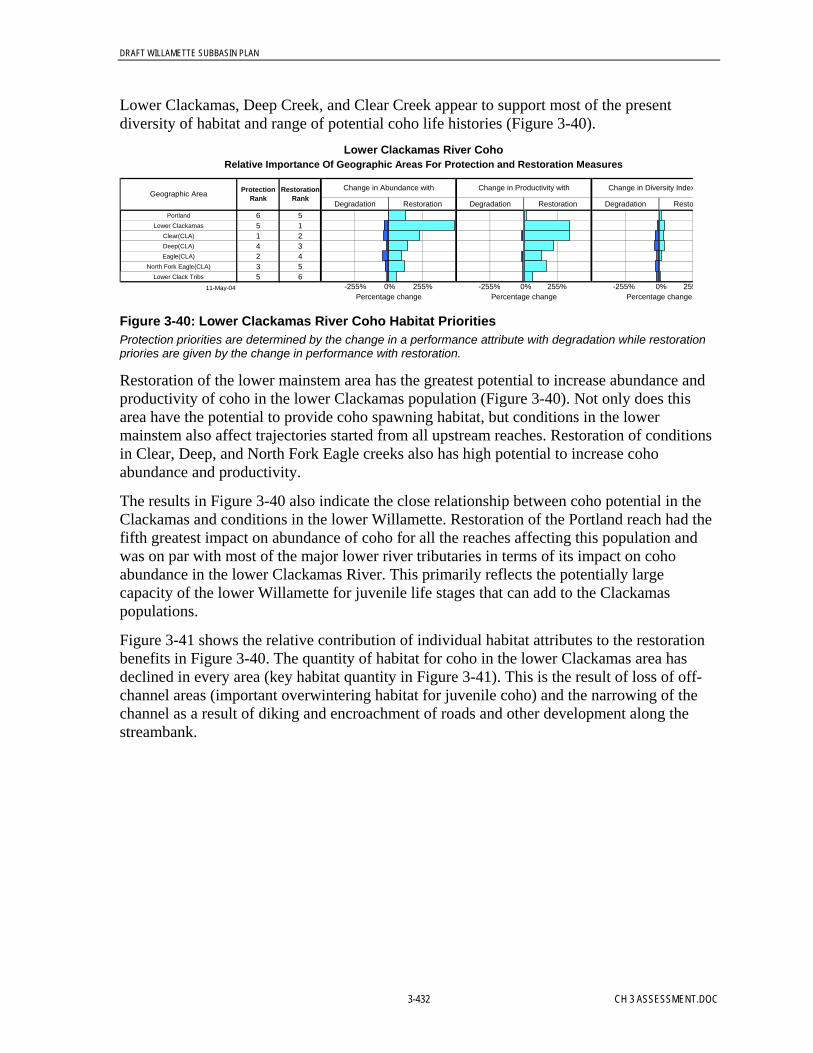
DRAFT WILLAMETTE SUBBASIN PLAN
3-432 CH 3 ASSESSMENT.DOC
Lower Clackamas, Deep Creek, and Clear Creek appear to support most of the presentdiversity of habitat and range of potential coho life histories (Figure 3-40).
Degradation Restoration Degradation Restoration Degradation RestoPortland 6 5
Lower Clackamas 5 1Clear(CLA) 1 2Deep(CLA) 4 3Eagle(CLA) 2 4
North Fork Eagle(CLA) 3 5Lower Clack Tribs 5 6
11-May-04Percentage change Percentage change Percentage change
Protection Rank
Restoration RankGeographic Area
Lower Clackamas River CohoRelative Importance Of Geographic Areas For Protection and Restoration Measures
Change in Abundance with Change in Productivity with Change in Diversity Index
-255% 0% 255% -255% 0% 255% -255% 0% 255
Figure 3-40: Lower Clackamas River Coho Habitat PrioritiesProtection priorities are determined by the change in a performance attribute with degradation while restorationpriories are given by the change in performance with restoration.
Restoration of the lower mainstem area has the greatest potential to increase abundance andproductivity of coho in the lower Clackamas population (Figure 3-40). Not only does thisarea have the potential to provide coho spawning habitat, but conditions in the lowermainstem also affect trajectories started from all upstream reaches. Restoration of conditionsin Clear, Deep, and North Fork Eagle creeks also has high potential to increase cohoabundance and productivity.
The results in Figure 3-40 also indicate the close relationship between coho potential in theClackamas and conditions in the lower Willamette. Restoration of the Portland reach had thefifth greatest impact on abundance of coho for all the reaches affecting this population andwas on par with most of the major lower river tributaries in terms of its impact on cohoabundance in the lower Clackamas River. This primarily reflects the potentially largecapacity of the lower Willamette for juvenile life stages that can add to the Clackamaspopulations.
Figure 3-41 shows the relative contribution of individual habitat attributes to the restorationbenefits in Figure 3-40. The quantity of habitat for coho in the lower Clackamas area hasdeclined in every area (key habitat quantity in Figure 3-41). This is the result of loss of off-channel areas (important overwintering habitat for juvenile coho) and the narrowing of thechannel as a result of diking and encroachment of roads and other development along thestreambank.

DRAFT WILLAMETTE SUBBASIN PLAN
CH 3 ASSESSMENT.DOC 3-433
Lower Clackamas River CohoProtection and Restoration Strategic Priority Summary
Attribute class priority for restoration
PortlandLower Clackamas
Clear(CLA)Deep(CLA)Eagle(CLA)
North Fork Eagle(CLA)Lower Clack Tribs
Key to strategic priority
High Medium Low Indirect or General
11-May-04
Cha
nnel
sta
bilit
y/la
ndsc
.1/
Che
mic
als
Com
petit
ion
(w/ h
atch
)
Com
petit
ion
(oth
er s
p)
Flow
Food
Hab
itat d
iver
sity
Sedi
men
t loa
d
Tem
pera
ture
With
draw
als
Har
assm
ent/p
oach
ing
Obs
truc
tions
Oxy
gen
Path
ogen
s
Geographic area priority
1/ "Channel stability" applies to freshwater areas; "channel landscape" applies to estuarine areas.
Key
hab
itat q
uant
ity
Geographic area
Prot
ectio
n be
nefit
Res
tora
tion
bene
fit
Pred
atio
n
Figure 3-41: Lower Clackamas River Coho Habitat Attribute PrioritiesThe change in productivity with restoration of an attribute is given by the size of the black dot, which isproportional to the overall restoration value given by the open circles to the left. A large black dot in an area withlittle overall restoration value (given by the size of the open circle) indicates little change in performance withrestoration of the attribute.
The quality of habitat in the lower Clackamas has declined primarily as a result of reducedhabitat diversity, increased sediment, and increased temperature in summer (Figure 3-41).Habitat diversity is a function of the decline in large woody debris and channel simplificationas a result of artificial confinement of the channel behind dikes. Summer water temperaturewas a limitation on summer rearing of coho in all areas of the lower Clackamas, especially inDeep Creek. Sediment was an important limiting factor in most areas in the lower Clackamasarea but especially in Deep Creek and the lower Clackamas mainstem, as well as in otherlower river tributaries.
Limiting factors for Clackamas coho in the lower Willamette (Portland) area were chemicals,habitat diversity, and loss of key habitat. The effect of chemicals reflects pollutants from avariety of local and upriver sources. The loss of habitat diversity and key habitat is a result ofthe overall channelization of the lower Willamette, the loss of wood and other structure, andelimination of much of the shallow water habitat (McConnaha 2003).
Obstructions (culverts) were key limitations in the tributaries. Obstructions were particularlyimportant in Deep Creek and Clear Creek. This assessment included nine culverts in DeepCreek and five culverts in Clear Creek. Obstructions were a lesser problem in Eagle Creek,including the North Fork of Eagle Creek. This system has three natural waterfalls that havebeen laddered and two artificial obstructions.
Lower Clackamas Steelhead. The lower Clackamas River steelhead population was defined forthis assessment to potentially spawn in all accessible reaches below River Mill Dam. This

DRAFT WILLAMETTE SUBBASIN PLAN
3-434 CH 3 ASSESSMENT.DOC
population displays the winter-run life history and is considered native to the ClackamasRiver (WLC-TRT 2003c).
Life history is based on the description of the Clackamas population provided by Hansen andothers (2001). In contrast to coho, steelhead have a complex life history with a variety ofpatterns existing in the same populations. Figure 3-42 depicts the general winter steelheadlife history. Winter steelhead return to the Clackamas in late fall. Spawning occurs throughthe first quarter of the year mainly into the spring. Fry emerge in the spring and summer.Juvenile steelhead rear from 1 to 4 years in the Clackamas, although the majority emigrateafter a 2-year rearing period (Hansen and others, 2001). Steelhead spend from 1 to 4 years inthe ocean. In the Clackamas, most return after 2 years (as 4-year-old fish) or 3 years (as 5-year-old fish) in the ocean (Hansen and others, 2001).Clackamas Winter Steelhead Life History
YearUpstream migration 0Adult Holding 0Spawning 0Incubation-emergence 0Juvenile rearing 1Juvenile rearing 2Juvenile outmigration 2Adult return 5% 3Adult return 65% 4Adult return 25% 5Adult Return 5% 6
Sep Oct Nov DecMay Jun Jul AugJan Feb Mar Apr
Figure 3-42: Generalized Life History of Winter Steelhead in the Clackamas River
Clackamas River winter steelhead are part of the Lower Columbia River steelhead ESU(Busby and others, 1996). Within this ESU the TRT has recognized the Clackamas Riverwinter steelhead population (WLC-TRT, 2003c). The lower Clackamas River steelheadpopulation used in this analysis is the portion of the TRT population below River Mill Dam.
The return of winter steelhead to the Clackamas River has been in a general decline for thepast several decades (Figure 3-43). Since 1970, the abundance at North Fork Dam asaveraged 1,479 steelhead but has varied from 4,439 in 1970 to a low of 189 in 1998.

DRAFT WILLAMETTE SUBBASIN PLAN
CH 3 ASSESSMENT.DOC 3-435
0
500
1,000
1,500
2,000
2,500
3,000
3,500
4,000
4,500
5,000
1950 1960 1970 1980 1990 2000
Adu
lts
Figure 3-43: Abundance of Winter Steelhead at North Fork DamSource: StreamNet
Current habitat potential for steelhead is significantly constrained in the lower ClackamasRiver relative to the EDT reference condition (Figure 3-44). Current abundance potential is86 percent less than the potential under the reference condition. Productivity, a measure ofhabitat quality, is reduced by 88 percent. Potential steelhead life history diversity, as afunction of the breadth of suitable habitat conditions in the lower Clackamas, has beenreduced by 54 percent.
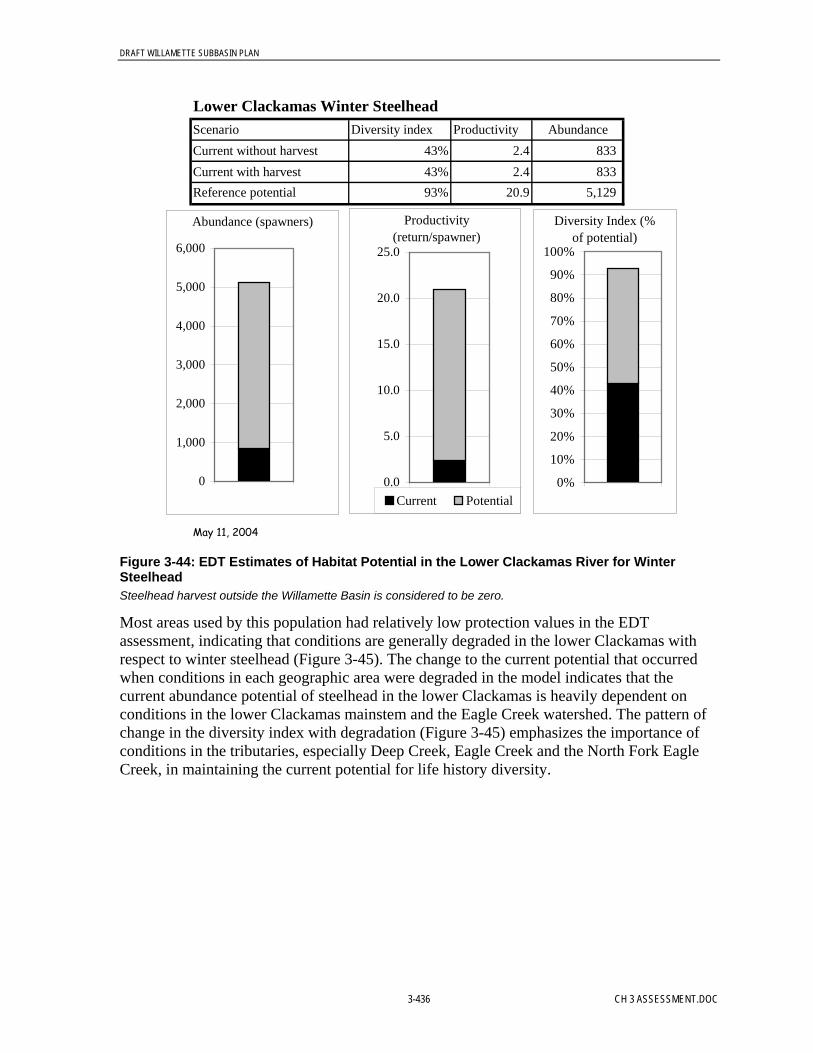
DRAFT WILLAMETTE SUBBASIN PLAN
3-436 CH 3 ASSESSMENT.DOC
Lower Clackamas Winter SteelheadScenario Diversity index Productivity AbundanceCurrent without harvest 43% 2.4 833 Current with harvest 43% 2.4 833 Reference potential 93% 20.9 5,129
May 11, 2004
Abundance (spawners)
0
1,000
2,000
3,000
4,000
5,000
6,000
Productivity (return/spawner)
0.0
5.0
10.0
15.0
20.0
25.0
Current Potential
Diversity Index (% of potential)
0%
10%
20%
30%
40%
50%
60%
70%
80%
90%
100%
Figure 3-44: EDT Estimates of Habitat Potential in the Lower Clackamas River for WinterSteelheadSteelhead harvest outside the Willamette Basin is considered to be zero.
Most areas used by this population had relatively low protection values in the EDTassessment, indicating that conditions are generally degraded in the lower Clackamas withrespect to winter steelhead (Figure 3-45). The change to the current potential that occurredwhen conditions in each geographic area were degraded in the model indicates that thecurrent abundance potential of steelhead in the lower Clackamas is heavily dependent onconditions in the lower Clackamas mainstem and the Eagle Creek watershed. The pattern ofchange in the diversity index with degradation (Figure 3-45) emphasizes the importance ofconditions in the tributaries, especially Deep Creek, Eagle Creek and the North Fork EagleCreek, in maintaining the current potential for life history diversity.
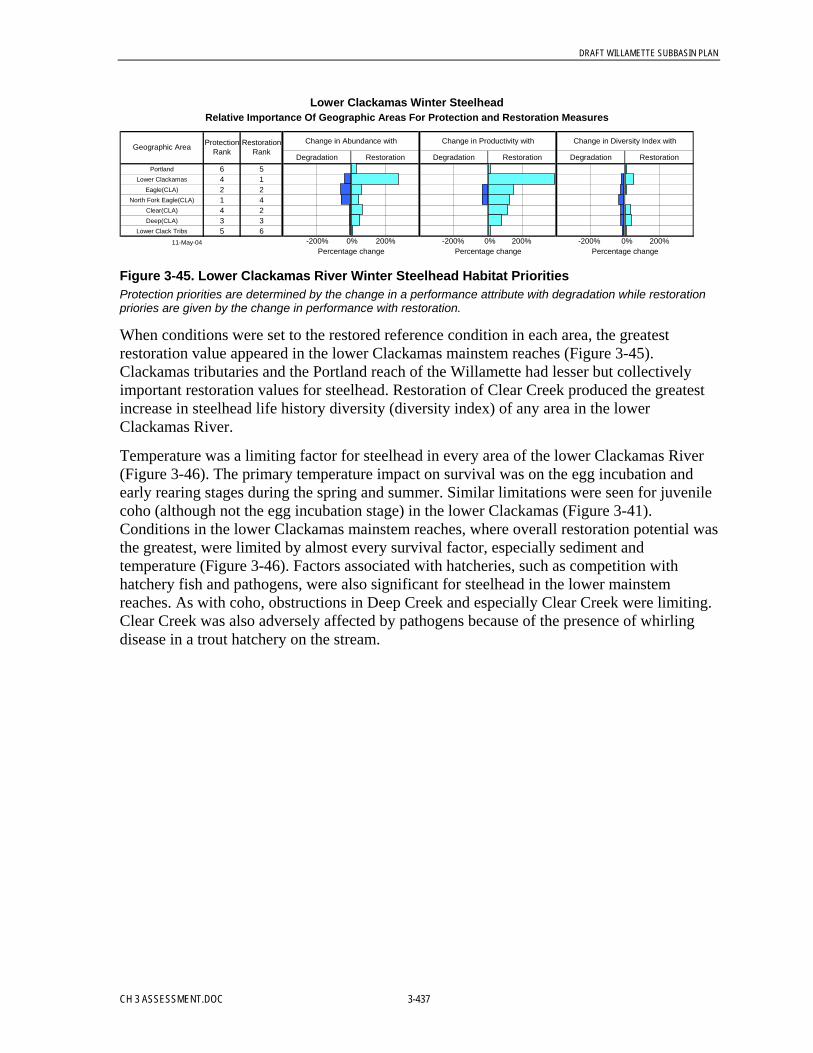
DRAFT WILLAMETTE SUBBASIN PLAN
CH 3 ASSESSMENT.DOC 3-437
Degradation Restoration Degradation Restoration Degradation RestorationPortland 6 5
Lower Clackamas 4 1Eagle(CLA) 2 2
North Fork Eagle(CLA) 1 4Clear(CLA) 4 2Deep(CLA) 3 3
Lower Clack Tribs 5 611-May-04
Percentage change Percentage change Percentage change
Protection Rank
Restoration RankGeographic Area
Lower Clackamas Winter SteelheadRelative Importance Of Geographic Areas For Protection and Restoration Measures
Change in Abundance with Change in Productivity with Change in Diversity Index with
-200% 0% 200% -200% 0% 200% -200% 0% 200%
Figure 3-45. Lower Clackamas River Winter Steelhead Habitat PrioritiesProtection priorities are determined by the change in a performance attribute with degradation while restorationpriories are given by the change in performance with restoration.
When conditions were set to the restored reference condition in each area, the greatestrestoration value appeared in the lower Clackamas mainstem reaches (Figure 3-45).Clackamas tributaries and the Portland reach of the Willamette had lesser but collectivelyimportant restoration values for steelhead. Restoration of Clear Creek produced the greatestincrease in steelhead life history diversity (diversity index) of any area in the lowerClackamas River.
Temperature was a limiting factor for steelhead in every area of the lower Clackamas River(Figure 3-46). The primary temperature impact on survival was on the egg incubation andearly rearing stages during the spring and summer. Similar limitations were seen for juvenilecoho (although not the egg incubation stage) in the lower Clackamas (Figure 3-41).Conditions in the lower Clackamas mainstem reaches, where overall restoration potential wasthe greatest, were limited by almost every survival factor, especially sediment andtemperature (Figure 3-46). Factors associated with hatcheries, such as competition withhatchery fish and pathogens, were also significant for steelhead in the lower mainstemreaches. As with coho, obstructions in Deep Creek and especially Clear Creek were limiting.Clear Creek was also adversely affected by pathogens because of the presence of whirlingdisease in a trout hatchery on the stream.

DRAFT WILLAMETTE SUBBASIN PLAN
3-438 CH 3 ASSESSMENT.DOC
Lower Clackamas River Winter SteelheadProtection and Restoration Strategic Priority Summary
Attribute class priority for restoration
PortlandLower Clackamas
Eagle(CLA)North Fork Eagle(CLA)
Clear(CLA)Deep(CLA)
Lower Clack Tribs
Key to strategic priority
High Medium Low Indirect or General
11-May-04
Cha
nnel
sta
bilit
y/la
ndsc
.1/
Che
mic
als
Com
petit
ion
(w/ h
atch
)
Com
petit
ion
(oth
er s
p)
Flow
Food
Hab
itat d
iver
sity
Sedi
men
t loa
d
Tem
pera
ture
With
draw
als
Har
assm
ent/p
oach
ing
Obs
truc
tions
Oxy
gen
Path
ogen
s
Geographic area priority
1/ "Channel stability" applies to freshwater areas; "channel landscape" applies to estuarine areas.
Key
hab
itat q
uant
ity
Geographic area
Prot
ectio
n be
nefit
Res
tora
tion
bene
fit
Pred
atio
n
Figure 3-46: Lower Clackamas River Steelhead Habitat Attribute PrioritiesThe change in productivity with restoration of an attribute is given by the size of the black dot, which isproportional to the overall restoration value given by the open circles to the left. A large black dot in an area withlittle overall restoration value (given by the size of the open circle) indicates little change in performance withrestoration of the attribute.
Lower Clackamas Fall Chinook. Fall Chinook in the Clackamas River are largely confined to themainstem below River Mill Dam and the lower reaches of the major tributaries in the lowerriver (Doug Cramer, PGE, personal communication). Historically they probably extended upthrough the Middle Clackamas reaches. Fall Chinook are native to the Clackamas River;however, the population was extirpated in the mid-1930s because of poor water quality in thelower Willamette. The run was reestablished from lower Columbia River hatchery stocks;however, stocking ceased in the early 1980s and the run is now supported by naturalproduction (WLC-TRT 2003a).
The population is part of the lower Columbia River fall Chinook group (Howell and others,1985) and is considered a tule life history. Columbia River tule fall Chinook are an importantcomponent of commercial harvest off Oregon, Washington, and southern British Columbia.Fall Chinook are released in large numbers from several lower Columbia River hatcheries tosupport these fisheries (Mobrand Biometrics, 2003), although fall Chinook in the Clackamasare natural spawners. In contrast to other salmonid species considered in this assessment, fallChinook spend a relatively short time in freshwater (Figure 3-47). Adults enter the river inAugust with peak returns in September. Spawning commences soon after entry to theClackamas in September and October. Chinook fry emerge in the spring. Juvenile fallChinook spend relatively little time in the Clackamas and begin moving downstream towardthe estuary during the spring and summer.
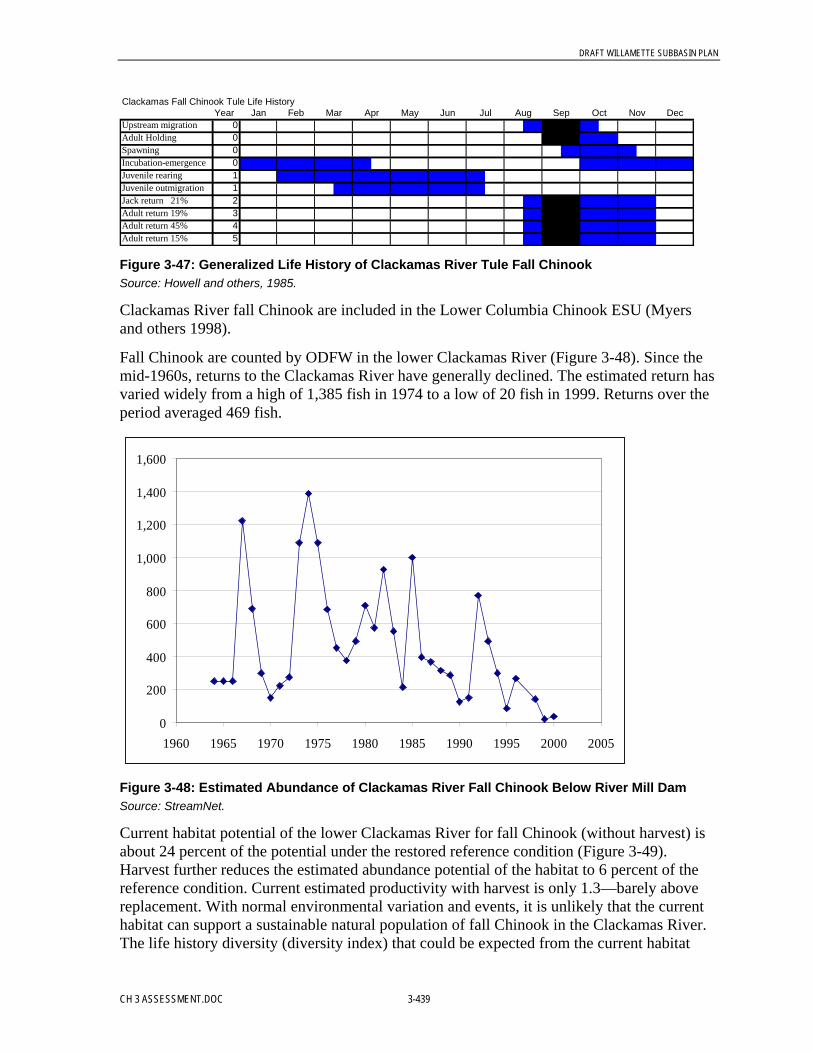
DRAFT WILLAMETTE SUBBASIN PLAN
CH 3 ASSESSMENT.DOC 3-439
Clackamas Fall Chinook Tule Life HistoryYear
Upstream migration 0Adult Holding 0Spawning 0Incubation-emergence 0Juvenile rearing 1Juvenile outmigration 1Jack return 21% 2Adult return 19% 3Adult return 45% 4Adult return 15% 5
Sep Oct Nov DecMay Jun Jul AugJan Feb Mar Apr
Figure 3-47: Generalized Life History of Clackamas River Tule Fall ChinookSource: Howell and others, 1985.
Clackamas River fall Chinook are included in the Lower Columbia Chinook ESU (Myersand others 1998).
Fall Chinook are counted by ODFW in the lower Clackamas River (Figure 3-48). Since themid-1960s, returns to the Clackamas River have generally declined. The estimated return hasvaried widely from a high of 1,385 fish in 1974 to a low of 20 fish in 1999. Returns over theperiod averaged 469 fish.
0
200
400
600
800
1,000
1,200
1,400
1,600
1960 1965 1970 1975 1980 1985 1990 1995 2000 2005
Figure 3-48: Estimated Abundance of Clackamas River Fall Chinook Below River Mill DamSource: StreamNet.
Current habitat potential of the lower Clackamas River for fall Chinook (without harvest) isabout 24 percent of the potential under the restored reference condition (Figure 3-49).Harvest further reduces the estimated abundance potential of the habitat to 6 percent of thereference condition. Current estimated productivity with harvest is only 1.3—barely abovereplacement. With normal environmental variation and events, it is unlikely that the currenthabitat can support a sustainable natural population of fall Chinook in the Clackamas River.The life history diversity (diversity index) that could be expected from the current habitat
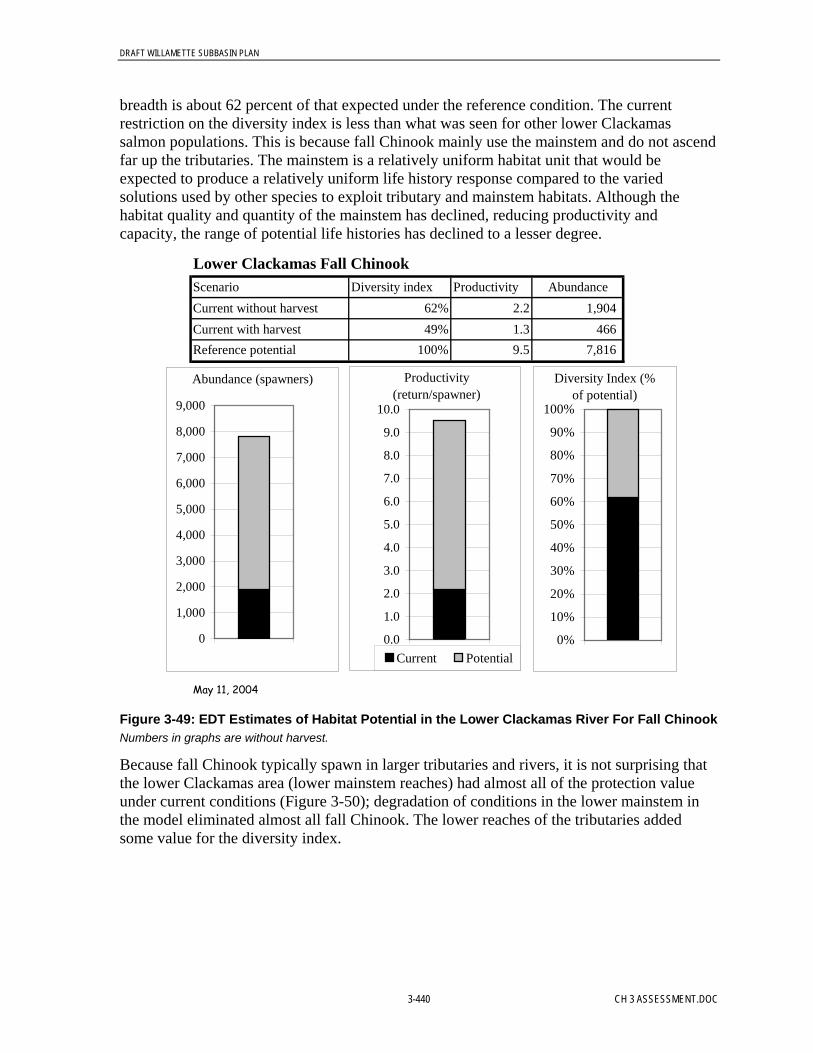
DRAFT WILLAMETTE SUBBASIN PLAN
3-440 CH 3 ASSESSMENT.DOC
breadth is about 62 percent of that expected under the reference condition. The currentrestriction on the diversity index is less than what was seen for other lower Clackamassalmon populations. This is because fall Chinook mainly use the mainstem and do not ascendfar up the tributaries. The mainstem is a relatively uniform habitat unit that would beexpected to produce a relatively uniform life history response compared to the variedsolutions used by other species to exploit tributary and mainstem habitats. Although thehabitat quality and quantity of the mainstem has declined, reducing productivity andcapacity, the range of potential life histories has declined to a lesser degree.
Lower Clackamas Fall ChinookScenario Diversity index Productivity AbundanceCurrent without harvest 62% 2.2 1,904 Current with harvest 49% 1.3 466 Reference potential 100% 9.5 7,816
May 11, 2004
Abundance (spawners)
0
1,000
2,000
3,000
4,000
5,000
6,000
7,000
8,000
9,000
Productivity (return/spawner)
0.0
1.0
2.0
3.0
4.0
5.0
6.0
7.0
8.0
9.0
10.0
Current Potential
Diversity Index (% of potential)
0%
10%
20%
30%
40%
50%
60%
70%
80%
90%
100%
Figure 3-49: EDT Estimates of Habitat Potential in the Lower Clackamas River For Fall ChinookNumbers in graphs are without harvest.
Because fall Chinook typically spawn in larger tributaries and rivers, it is not surprising thatthe lower Clackamas area (lower mainstem reaches) had almost all of the protection valueunder current conditions (Figure 3-50); degradation of conditions in the lower mainstem inthe model eliminated almost all fall Chinook. The lower reaches of the tributaries addedsome value for the diversity index.
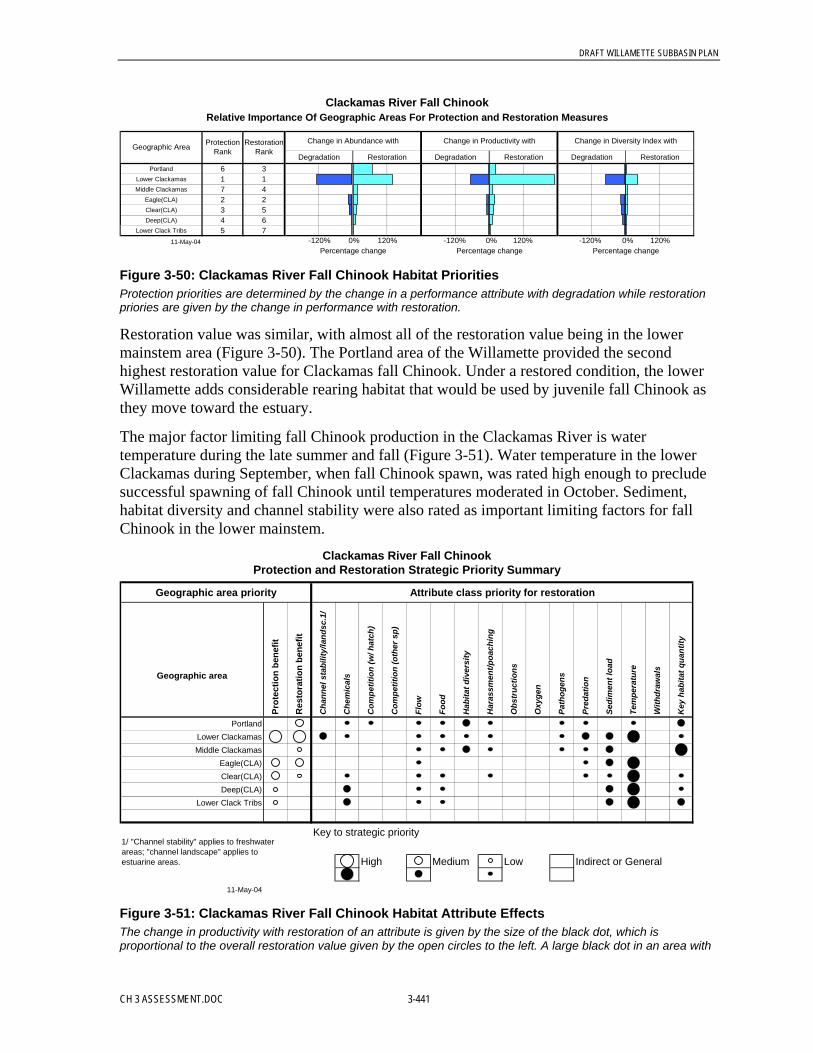
DRAFT WILLAMETTE SUBBASIN PLAN
CH 3 ASSESSMENT.DOC 3-441
Degradation Restoration Degradation Restoration Degradation RestorationPortland 6 3
Lower Clackamas 1 1Middle Clackamas 7 4
Eagle(CLA) 2 2Clear(CLA) 3 5Deep(CLA) 4 6
Lower Clack Tribs 5 711-May-04
Percentage change Percentage change Percentage change
Protection Rank
Restoration RankGeographic Area
Clackamas River Fall ChinookRelative Importance Of Geographic Areas For Protection and Restoration Measures
Change in Abundance with Change in Productivity with Change in Diversity Index with
-120% 0% 120% -120% 0% 120% -120% 0% 120%
Figure 3-50: Clackamas River Fall Chinook Habitat PrioritiesProtection priorities are determined by the change in a performance attribute with degradation while restorationpriories are given by the change in performance with restoration.
Restoration value was similar, with almost all of the restoration value being in the lowermainstem area (Figure 3-50). The Portland area of the Willamette provided the secondhighest restoration value for Clackamas fall Chinook. Under a restored condition, the lowerWillamette adds considerable rearing habitat that would be used by juvenile fall Chinook asthey move toward the estuary.
The major factor limiting fall Chinook production in the Clackamas River is watertemperature during the late summer and fall (Figure 3-51). Water temperature in the lowerClackamas during September, when fall Chinook spawn, was rated high enough to precludesuccessful spawning of fall Chinook until temperatures moderated in October. Sediment,habitat diversity and channel stability were also rated as important limiting factors for fallChinook in the lower mainstem.
Clackamas River Fall ChinookProtection and Restoration Strategic Priority Summary
Attribute class priority for restoration
PortlandLower ClackamasMiddle Clackamas
Eagle(CLA)Clear(CLA)Deep(CLA)
Lower Clack Tribs
Key to strategic priority
High Medium Low Indirect or General
11-May-04
Geographic area priority
1/ "Channel stability" applies to freshwater areas; "channel landscape" applies to estuarine areas.
Key
hab
itat q
uant
ityGeographic area
Prot
ectio
n be
nefit
Res
tora
tion
bene
fit
Pred
atio
n
With
draw
als
Har
assm
ent/p
oach
ing
Obs
truc
tions
Oxy
gen
Path
ogen
s
Cha
nnel
sta
bilit
y/la
ndsc
.1/
Che
mic
als
Com
petit
ion
(w/ h
atch
)
Com
petit
ion
(oth
er s
p)
Flow
Food
Hab
itat d
iver
sity
Sedi
men
t loa
d
Tem
pera
ture
Figure 3-51: Clackamas River Fall Chinook Habitat Attribute EffectsThe change in productivity with restoration of an attribute is given by the size of the black dot, which isproportional to the overall restoration value given by the open circles to the left. A large black dot in an area with
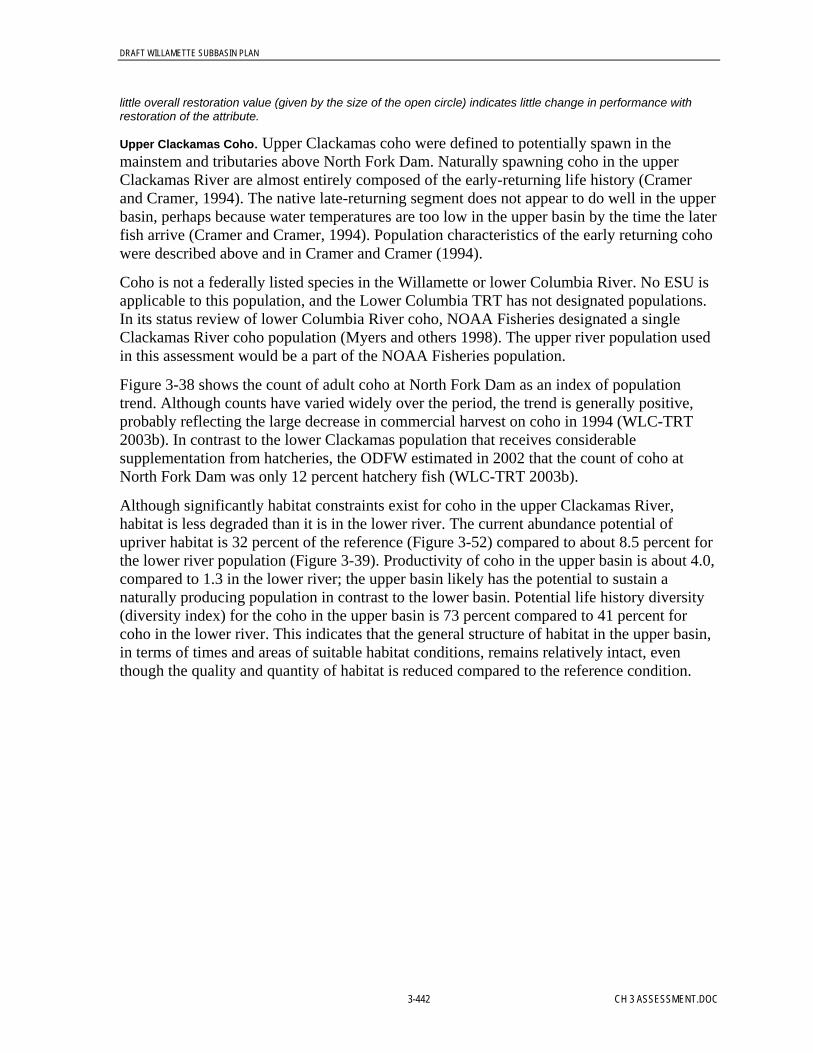
DRAFT WILLAMETTE SUBBASIN PLAN
3-442 CH 3 ASSESSMENT.DOC
little overall restoration value (given by the size of the open circle) indicates little change in performance withrestoration of the attribute.
Upper Clackamas Coho. Upper Clackamas coho were defined to potentially spawn in themainstem and tributaries above North Fork Dam. Naturally spawning coho in the upperClackamas River are almost entirely composed of the early-returning life history (Cramerand Cramer, 1994). The native late-returning segment does not appear to do well in the upperbasin, perhaps because water temperatures are too low in the upper basin by the time the laterfish arrive (Cramer and Cramer, 1994). Population characteristics of the early returning cohowere described above and in Cramer and Cramer (1994).
Coho is not a federally listed species in the Willamette or lower Columbia River. No ESU isapplicable to this population, and the Lower Columbia TRT has not designated populations.In its status review of lower Columbia River coho, NOAA Fisheries designated a singleClackamas River coho population (Myers and others 1998). The upper river population usedin this assessment would be a part of the NOAA Fisheries population.
Figure 3-38 shows the count of adult coho at North Fork Dam as an index of populationtrend. Although counts have varied widely over the period, the trend is generally positive,probably reflecting the large decrease in commercial harvest on coho in 1994 (WLC-TRT2003b). In contrast to the lower Clackamas population that receives considerablesupplementation from hatcheries, the ODFW estimated in 2002 that the count of coho atNorth Fork Dam was only 12 percent hatchery fish (WLC-TRT 2003b).
Although significantly habitat constraints exist for coho in the upper Clackamas River,habitat is less degraded than it is in the lower river. The current abundance potential ofupriver habitat is 32 percent of the reference (Figure 3-52) compared to about 8.5 percent forthe lower river population (Figure 3-39). Productivity of coho in the upper basin is about 4.0,compared to 1.3 in the lower river; the upper basin likely has the potential to sustain anaturally producing population in contrast to the lower basin. Potential life history diversity(diversity index) for the coho in the upper basin is 73 percent compared to 41 percent forcoho in the lower river. This indicates that the general structure of habitat in the upper basin,in terms of times and areas of suitable habitat conditions, remains relatively intact, eventhough the quality and quantity of habitat is reduced compared to the reference condition.
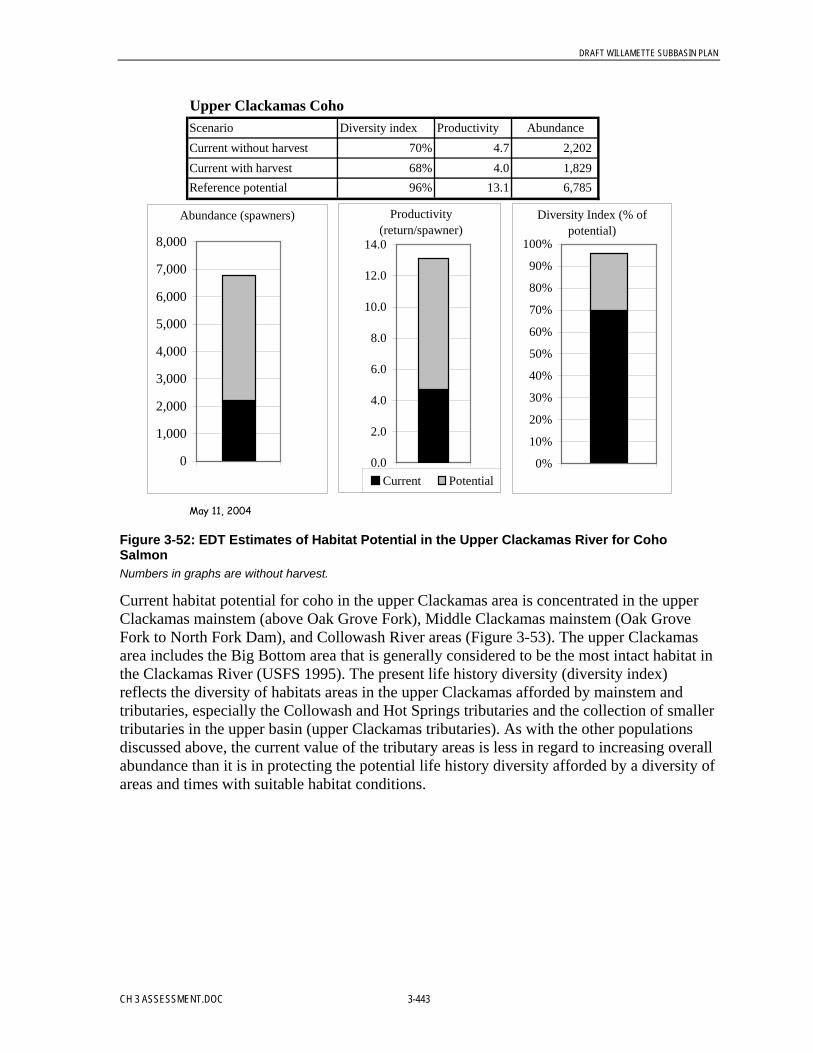
DRAFT WILLAMETTE SUBBASIN PLAN
CH 3 ASSESSMENT.DOC 3-443
Upper Clackamas CohoScenario Diversity index Productivity AbundanceCurrent without harvest 70% 4.7 2,202 Current with harvest 68% 4.0 1,829 Reference potential 96% 13.1 6,785
May 11, 2004
Abundance (spawners)
0
1,000
2,000
3,000
4,000
5,000
6,000
7,000
8,000
Productivity (return/spawner)
0.0
2.0
4.0
6.0
8.0
10.0
12.0
14.0
Current Potential
Diversity Index (% of potential)
0%
10%
20%
30%
40%
50%
60%
70%
80%
90%
100%
Figure 3-52: EDT Estimates of Habitat Potential in the Upper Clackamas River for CohoSalmonNumbers in graphs are without harvest.
Current habitat potential for coho in the upper Clackamas area is concentrated in the upperClackamas mainstem (above Oak Grove Fork), Middle Clackamas mainstem (Oak GroveFork to North Fork Dam), and Collowash River areas (Figure 3-53). The upper Clackamasarea includes the Big Bottom area that is generally considered to be the most intact habitat inthe Clackamas River (USFS 1995). The present life history diversity (diversity index)reflects the diversity of habitats areas in the upper Clackamas afforded by mainstem andtributaries, especially the Collowash and Hot Springs tributaries and the collection of smallertributaries in the upper basin (upper Clackamas tributaries). As with the other populationsdiscussed above, the current value of the tributary areas is less in regard to increasing overallabundance than it is in protecting the potential life history diversity afforded by a diversity ofareas and times with suitable habitat conditions.
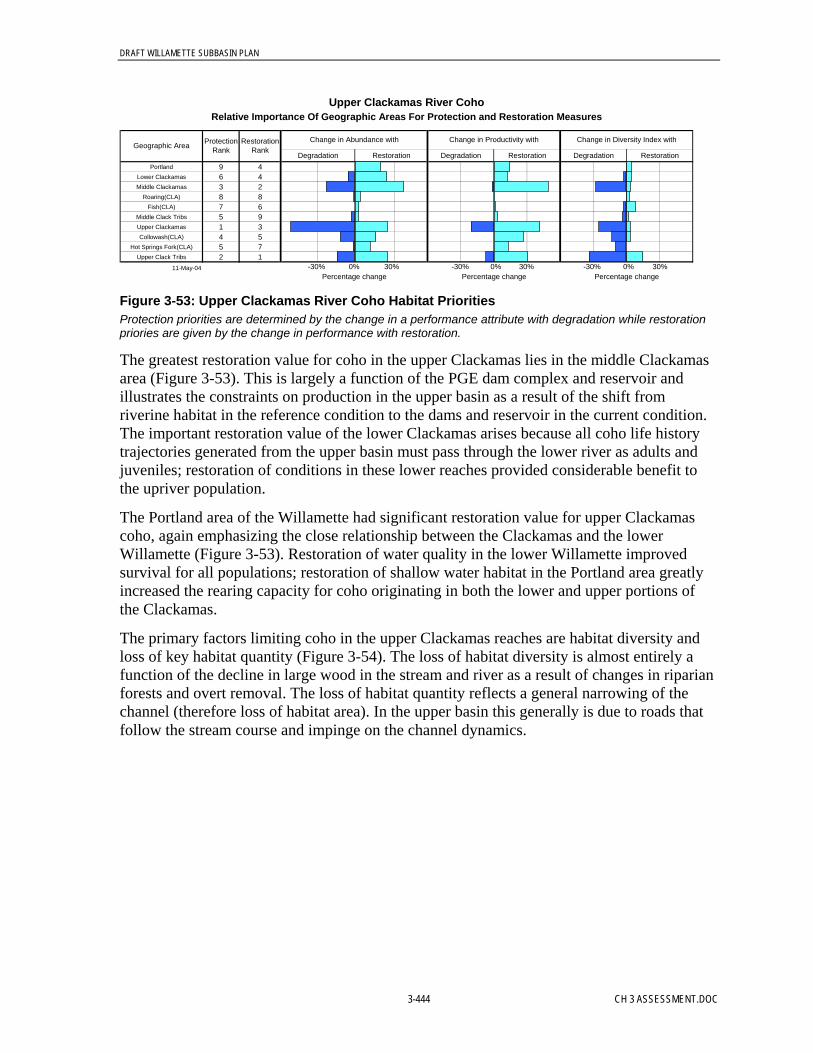
DRAFT WILLAMETTE SUBBASIN PLAN
3-444 CH 3 ASSESSMENT.DOC
Degradation Restoration Degradation Restoration Degradation RestorationPortland 9 4
Lower Clackamas 6 4Middle Clackamas 3 2
Roaring(CLA) 8 8Fish(CLA) 7 6
Middle Clack Tribs 5 9Upper Clackamas 1 3Collowash(CLA) 4 5
Hot Springs Fork(CLA) 5 7Upper Clack Tribs 2 1
11-May-04Percentage change Percentage change Percentage change
Protection Rank
Restoration RankGeographic Area
Upper Clackamas River CohoRelative Importance Of Geographic Areas For Protection and Restoration Measures
Change in Abundance with Change in Productivity with Change in Diversity Index with
-30% 0% 30% -30% 0% 30% -30% 0% 30%
Figure 3-53: Upper Clackamas River Coho Habitat PrioritiesProtection priorities are determined by the change in a performance attribute with degradation while restorationpriories are given by the change in performance with restoration.
The greatest restoration value for coho in the upper Clackamas lies in the middle Clackamasarea (Figure 3-53). This is largely a function of the PGE dam complex and reservoir andillustrates the constraints on production in the upper basin as a result of the shift fromriverine habitat in the reference condition to the dams and reservoir in the current condition.The important restoration value of the lower Clackamas arises because all coho life historytrajectories generated from the upper basin must pass through the lower river as adults andjuveniles; restoration of conditions in these lower reaches provided considerable benefit tothe upriver population.
The Portland area of the Willamette had significant restoration value for upper Clackamascoho, again emphasizing the close relationship between the Clackamas and the lowerWillamette (Figure 3-53). Restoration of water quality in the lower Willamette improvedsurvival for all populations; restoration of shallow water habitat in the Portland area greatlyincreased the rearing capacity for coho originating in both the lower and upper portions ofthe Clackamas.
The primary factors limiting coho in the upper Clackamas reaches are habitat diversity andloss of key habitat quantity (Figure 3-54). The loss of habitat diversity is almost entirely afunction of the decline in large wood in the stream and river as a result of changes in riparianforests and overt removal. The loss of habitat quantity reflects a general narrowing of thechannel (therefore loss of habitat area). In the upper basin this generally is due to roads thatfollow the stream course and impinge on the channel dynamics.

DRAFT WILLAMETTE SUBBASIN PLAN
CH 3 ASSESSMENT.DOC 3-445
Upper Clackamas River CohoProtection and Restoration Strategic Priority Summary
Attribute class priority for restoration
PortlandLower ClackamasMiddle Clackamas
Roaring(CLA)Fish(CLA)
Middle Clack TribsUpper Clackamas
Collowash(CLA)Hot Springs Fork(CLA)
Upper Clack Tribs
Key to strategic priority
High Medium Low Indirect or General
11-May-04
Geographic area priority
1/ "Channel stability" applies to freshwater areas; "channel landscape" applies to estuarine areas.
Key
hab
itat q
uant
ity
Geographic area
Prot
ectio
n be
nefit
Res
tora
tion
bene
fit
Pred
atio
n
With
draw
als
Har
assm
ent/p
oach
ing
Obs
truc
tions
Oxy
gen
Path
ogen
s
Cha
nnel
sta
bilit
y/la
ndsc
.1/
Che
mic
als
Com
petit
ion
(w/ h
atch
)
Com
petit
ion
(oth
er s
p)
Flow
Food
Hab
itat d
iver
sity
Sedi
men
t loa
d
Tem
pera
ture
Figure 3-54: Upper Clackamas River Coho Habitat Attribute EffectsThe change in productivity with restoration of an attribute is given by the size of the black dot, which isproportional to the overall restoration value given by the open circles to the left. A large black dot in an area withlittle overall restoration value (given by the size of the open circle) indicates little change in performance withrestoration of the attribute.
Habitat limitations in the lower Clackamas mainstem and the lower Willamette (Portland)area for upper river coho were similar to the limitations seen for lower river coho (Figure 3-54). Decline in habitat diversity, high summer water temperature, and decline in key habitatquantity were key factors in the lower Clackamas. In the Willamette, chemicals (pollutants),habitat diversity, and key habitat quantity limited production of upper river coho.
Obstructions (culverts) are key factors in the upper basin (Figure 3-54). Within this analysis,the smaller tributaries to the Clackamas (Upper Clack Tribs) had 11 culverts with varyingdegrees of passage. Obstructions were also important in the Collowash River and HotSprings Fork. In the middle Clackamas mainstem, obstructions showed up as a problem as aresult of the passage mortality at the three PGE dams.
Upper Clackamas Winter Steelhead. The upper Clackamas River steelhead population wasdefined for this assessment to potentially spawn in all accessible reaches above North ForkDam and is otherwise identical to the lower Clackamas steelhead population. This populationdisplays the winter-run life history and is considered native to the Clackamas River (WLC-TRT, 2003c). The life history is based on the description of the Clackamas populationprovided by Hansen and others (2001). Life history information is summarized above and inFigure 3-42.
DRAFT WILLAMETTE SUBBASIN PLAN
3-446 CH 3 ASSESSMENT.DOC
Clackamas River winter steelhead are part of the Lower Columbia River steelhead ESU(Busby and others, 1996). Within this ESU the TRT has recognized the Clackamas Riverwinter steelhead population (WLC-TRT, 2003c). The upper Clackamas River steelheadpopulation used in this assessment is the portion of the TRT population above North ForkDam.
Figure 3-43 shows the count of steelhead at North Fork Dam as an index of population trend.Counts have varied widely but, overall, the return of steelhead to the upper basin shows adeclining trend over the period. ODFW estimated that about 52 percent of the recentsteelhead returns at North Fork Dam were of “wild” origin (WLC-TRT, 2003b).
Population potential of winter steelhead in the upper Clackamas River is limited at thepresent time by habitat constraints (Figure 3-55). Abundance potential of steelhead in theupper Clackamas River under the current habitat condition is about 52 percent of thepotential under the reference habitat condition. However, this is better than the condition ofhabitat in the lower basin, where current potential for steelhead is only 16 percent of thepotential under the reference condition (Figure 3-44). Potential productivity of steelheadunder the present habitat configuration is a relatively healthy value of 8.7 returns/spawner.Although the habitat quality and quantity have declined and reduced the abundance potentialfor steelhead, the structure of the habitat (the places and times within a year where suitableconditions exist for steelhead) appears relatively intact in the upper basin. Winter steelhead inthe upper Clackamas had the highest diversity index of any population in this assessment;current diversity was only 10 percent less than the diversity under the reference condition(Figure 3-55).

DRAFT WILLAMETTE SUBBASIN PLAN
CH 3 ASSESSMENT.DOC 3-447
Upper Clackamas Winter SteelheadScenario Diversity index Productivity AbundanceCurrent without harvest 90% 8.7 2,693 Current with harvest 90% 8.7 2,693 Reference potential 100% 20.6 5,208
May 11, 2004
Abundance (spawners)
0
1,000
2,000
3,000
4,000
5,000
6,000
Productivity (return/spawner)
0.0
5.0
10.0
15.0
20.0
25.0
Current Potential
Diversity Index (% of potential)
0%
10%
20%
30%
40%
50%
60%
70%
80%
90%
100%
Figure 3-55: EDT Estimates of Habitat Potential in the Upper Clackamas River for WinterSteelheadSteelhead harvest outside the Willamette Basin is considered to be zero.
The pattern of protection priorities in Figure 3-56 indicate that much of the current potentialfor steelhead in the upper Clackamas River is in the upper mainstem, middle mainstem, andCollowash River. As with other populations considered so far, the existing breadth ofsuitable habitat conditions indexed by the diversity index depends greatly on tributaries,especially the collection of upper Clackamas tributaries (Figure 3-56).

DRAFT WILLAMETTE SUBBASIN PLAN
3-448 CH 3 ASSESSMENT.DOC
Degradation Restoration Degradation Restoration Degradation RestorationPortland 8 3
Lower Clackamas 5 5Middle Clackamas 3 1
Fish(CLA) 5 7Roaring(CLA) 7 8
Middle Clack Tribs 6 7Upper Clackamas 1 4Collowash(CLA) 2 5
Hot Springs Fork(CLA) 4 6Upper Clack Tribs 2 2
11-May-04Percentage change Percentage change Percentage change
Protection Rank
Restoration RankGeographic Area
Upper Clackamas River Winter SteelheadRelative Importance Of Geographic Areas For Protection and Restoration Measures
Change in Abundance with Change in Productivity with Change in Diversity Index with
-20% 0% 20% -20% 0% 20% -20% 0% 20%
Figure 3-56: Upper Clackamas River Winter Steelhead Habitat PrioritiesProtection priorities are determined by the change in a performance attribute with degradation while restorationpriories are given by the change in performance with restoration.
Restoration priorities for steelhead in the upper Clackamas (Figure 3-56) indicate thatabundance is currently limited largely by conditions in the middle Clackamas mainstem, thelower Clackamas mainstem, and the lower Willamette (Portland). The upper Clackamasmainstem and all tributaries had relatively low restoration values, indicting that conditionsare generally good for steelhead in these areas. In the middle Clackamas, which had thehighest restoration value, the high restoration priority reflects the effect of the PGE dams andreservoirs. Restoration of the lower Willamette added considerable capacity to allpopulations in the Clackamas, including upper river steelhead. The restoration priority for thelower Clackamas is because all steelhead trajectories generated from the upper basin had topass through the lower Clackamas during the juvenile and adult life stages.
Overall, habitat conditions for steelhead in the upper Clackamas appear to be good. Themajor constraint in the upper mainstem area in this assessment was some loss of habitatquantity, probably as a result of a narrowing of the channel from road building next to thechannel, and a small loss of habitat diversity resulting from a decline in large wood(Figure 3-57). These problems were present in the tributaries as well; however, the biggestlimitation in the upper basin tributaries was obstructions (Figure 3-57). Although these sameobstructions were problems for coho, they were an even greater impediment to the movementof steelhead into potentially productive habitat.

DRAFT WILLAMETTE SUBBASIN PLAN
CH 3 ASSESSMENT.DOC 3-449
Upper Clackamas River Winter SteelheadProtection and Restoration Strategic Priority Summary
Attribute class priority for restoration
PortlandLower ClackamasMiddle Clackamas
Fish(CLA)Roaring(CLA)
Middle Clack TribsUpper Clackamas
Collowash(CLA)Hot Springs Fork(CLA)
Upper Clack Tribs
Key to strategic priority
High Medium Low Indirect or General
11-May-04
Geographic area priority
1/ "Channel stability" applies to freshwater areas; "channel landscape" applies to estuarine areas.
Key
hab
itat q
uant
ity
Geographic area
Prot
ectio
n be
nefit
Res
tora
tion
bene
fit
Pred
atio
n
With
draw
als
Har
assm
ent/p
oach
ing
Obs
truc
tions
Oxy
gen
Path
ogen
s
Cha
nnel
sta
bilit
y/la
ndsc
.1/
Che
mic
als
Com
petit
ion
(w/ h
atch
)
Com
petit
ion
(oth
er s
p)
Flow
Food
Hab
itat d
iver
sity
Sedi
men
t loa
d
Tem
pera
ture
Figure 3-57: Upper Clackamas River Steelhead Habitat Attribute EffectsThe change in productivity with restoration of an attribute is given by the size of the black dot, which isproportional to the overall restoration value given by the open circles to the left. A large black dot in an area withlittle overall restoration value (given by the size of the open circle) indicates little change in performance withrestoration of the attribute.
Most of the habitat constraints on steelhead in the upper basin occur downstream in themiddle and lower mainstem reaches and the lower Willamette. The problems in these areashave been discussed previously in connection with other populations. The major constraint inthe middle Clackamas have to do with the PGE dams and reservoirs and the loss of spawninghabitat and passage mortality at the dams. In the lower Clackamas, channel straightening,confinement, and loss of habitat complexity limit steelhead and coho. Constraints in thelower Willamette include chemicals (pollutants) and loss of shallow water habitat.
Upper Clackamas Spring Chinook. The Clackamas River spring Chinook population was definedto spawn in reaches throughout the Clackamas Subbasin. This spring Chinook populationwas modeled with a stream-type life history, meaning that after emergence in their firstspring, juveniles spend an entire year in freshwater and out-migrate from the Clackamas intheir second spring. Life history characteristics for this assessment were based on Howell andothers (Howell and others, 1985). Adults enter in the early spring and hold in deep pools overthe summer before moving to spawning areas in the fall (Figure 3-58). After emergence thenext spring, the juveniles rear for a year generally tributaries and margins of the mainstem.They have a pronounced spring out-migration as 1-year-olds. Most adults return to theClackamas after 3 or 4 years in the ocean (Figure 3-58).

DRAFT WILLAMETTE SUBBASIN PLAN
3-450 CH 3 ASSESSMENT.DOC
Clackamas Spring Chinook Life HistoryYear
Upstream migration 0Adult Holding 0Spawning 0Incubation-emergence 0Juvenile rearing 1Juvenile outmigration 1Jack return 1.7% 2Adult return 2.2% 3Adult return 46.9% 4Adult return 47.8% 5Adult return 1.4% 6
Sep Oct Nov DecMay Jun Jul AugJan Feb Mar Apr
Figure 3-58: Generalized Spring Chinook Life History in the Clackamas River
Clackamas spring Chinook are part of the Upper Willamette River spring Chinook ESU(Myers and others, 1998).
Estimated return of spring Chinook to the Clackamas River is shown in Figure 3-59. Returnsof spring Chinook have increased in the Clackamas River since the mid-1970s. Since thattime, returns have ranged from to a low of 900 in 1975 to a high of 9,700 in 2001. Return ofspring Chinook to the Clackamas River since the mid-1970s has averaged 4,691 fish.
0
2,000
4,000
6,000
8,000
10,000
12,000
1940 1950 1960 1970 1980 1990 2000 2010
Figure 3-59: Estimated Return of Spring Chinook to the Clackamas RiverSource: StreamNet.
The overall potential of habitat in the Clackamas River for spring Chinook has been greatlyreduced relative to the restored reference condition. Current abundance potential is about23 percent of the potential under the reference condition (Figure 3-60). Overall productivityas a function of habitat has been reduced by about 7 percent relative to the reference butremains about 3.5 returns/spawner even with harvest. On the other hand, the habitat retainsabout 80 percent of the potential life history diversity. This is higher than for most otherpopulations in this assessment and reflects the heavy use of the mainstem by spring Chinook

DRAFT WILLAMETTE SUBBASIN PLAN
CH 3 ASSESSMENT.DOC 3-451
(especially the upper mainstem reaches), with less use of the diversity of habitats in thetributaries.
Upper Clackamas Spring ChinookScenario Diversity index Productivity AbundanceCurrent without harvest 76% 4.7 2,434 Current with harvest 73% 3.5 1,620 Reference potential 96% 17.9 10,716
May 11, 2004
Abundance (spawners)
0
2,000
4,000
6,000
8,000
10,000
12,000
Productivity (return/spawner)
0.0
2.0
4.0
6.0
8.0
10.0
12.0
14.0
16.0
18.0
20.0
Current Potential
Diversity Index (% of potential)
0%
10%
20%
30%
40%
50%
60%
70%
80%
90%
100%
Figure 3-60. EDT Estimates of Habitat Potential in the Clackamas River for Spring ChinookGraphs show figures without harvest.
Current habitat potential for spring Chinook in the Clackamas is mainly in the mainstemareas, especially the middle Clackamas area (reaches from above North Fork Reservoir toOak Grove) and the upper Clackamas (Figure 3-61). Similarly, most of the protection valuefor the diversity index under the current habitat condition was in the middle and uppermainstem reaches of the Clackamas.
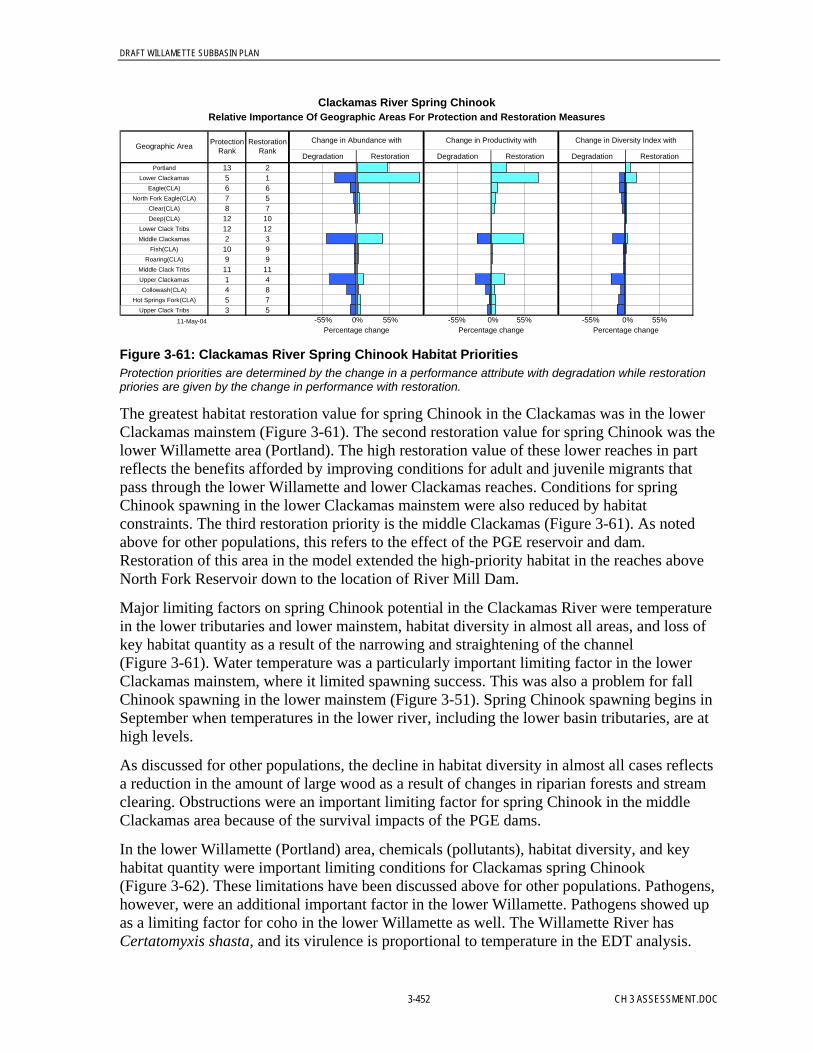
DRAFT WILLAMETTE SUBBASIN PLAN
3-452 CH 3 ASSESSMENT.DOC
Degradation Restoration Degradation Restoration Degradation RestorationPortland 13 2
Lower Clackamas 5 1Eagle(CLA) 6 6
North Fork Eagle(CLA) 7 5Clear(CLA) 8 7Deep(CLA) 12 10
Lower Clack Tribs 12 12Middle Clackamas 2 3
Fish(CLA) 10 9Roaring(CLA) 9 9
Middle Clack Tribs 11 11Upper Clackamas 1 4Collowash(CLA) 4 8
Hot Springs Fork(CLA) 5 7Upper Clack Tribs 3 5
11-May-04Percentage change Percentage change Percentage change
Protection Rank
Restoration RankGeographic Area
Clackamas River Spring ChinookRelative Importance Of Geographic Areas For Protection and Restoration Measures
Change in Abundance with Change in Productivity with Change in Diversity Index with
-55% 0% 55% -55% 0% 55% -55% 0% 55%
Figure 3-61: Clackamas River Spring Chinook Habitat PrioritiesProtection priorities are determined by the change in a performance attribute with degradation while restorationpriories are given by the change in performance with restoration.
The greatest habitat restoration value for spring Chinook in the Clackamas was in the lowerClackamas mainstem (Figure 3-61). The second restoration value for spring Chinook was thelower Willamette area (Portland). The high restoration value of these lower reaches in partreflects the benefits afforded by improving conditions for adult and juvenile migrants thatpass through the lower Willamette and lower Clackamas reaches. Conditions for springChinook spawning in the lower Clackamas mainstem were also reduced by habitatconstraints. The third restoration priority is the middle Clackamas (Figure 3-61). As notedabove for other populations, this refers to the effect of the PGE reservoir and dam.Restoration of this area in the model extended the high-priority habitat in the reaches aboveNorth Fork Reservoir down to the location of River Mill Dam.
Major limiting factors on spring Chinook potential in the Clackamas River were temperaturein the lower tributaries and lower mainstem, habitat diversity in almost all areas, and loss ofkey habitat quantity as a result of the narrowing and straightening of the channel(Figure 3-61). Water temperature was a particularly important limiting factor in the lowerClackamas mainstem, where it limited spawning success. This was also a problem for fallChinook spawning in the lower mainstem (Figure 3-51). Spring Chinook spawning begins inSeptember when temperatures in the lower river, including the lower basin tributaries, are athigh levels.
As discussed for other populations, the decline in habitat diversity in almost all cases reflectsa reduction in the amount of large wood as a result of changes in riparian forests and streamclearing. Obstructions were an important limiting factor for spring Chinook in the middleClackamas area because of the survival impacts of the PGE dams.
In the lower Willamette (Portland) area, chemicals (pollutants), habitat diversity, and keyhabitat quantity were important limiting conditions for Clackamas spring Chinook(Figure 3-62). These limitations have been discussed above for other populations. Pathogens,however, were an additional important factor in the lower Willamette. Pathogens showed upas a limiting factor for coho in the lower Willamette as well. The Willamette River hasCertatomyxis shasta, and its virulence is proportional to temperature in the EDT analysis.
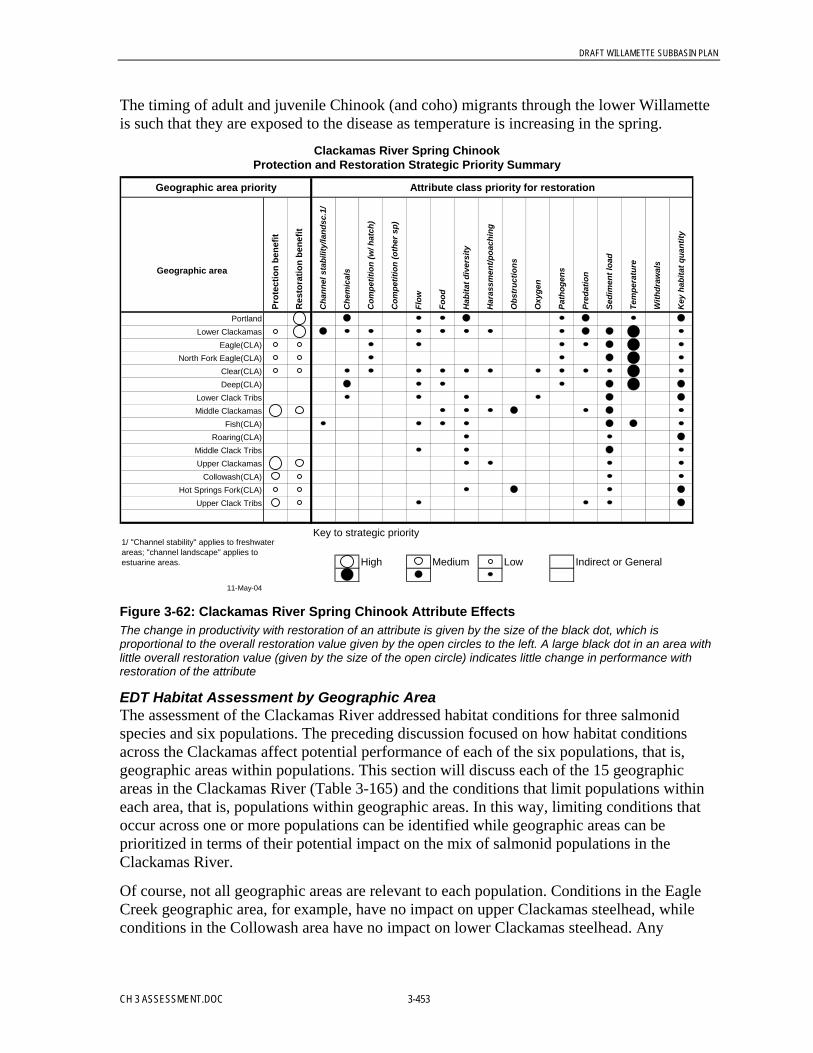
DRAFT WILLAMETTE SUBBASIN PLAN
CH 3 ASSESSMENT.DOC 3-453
The timing of adult and juvenile Chinook (and coho) migrants through the lower Willametteis such that they are exposed to the disease as temperature is increasing in the spring.
Clackamas River Spring ChinookProtection and Restoration Strategic Priority Summary
Attribute class priority for restoration
PortlandLower Clackamas
Eagle(CLA)North Fork Eagle(CLA)
Clear(CLA)Deep(CLA)
Lower Clack TribsMiddle Clackamas
Fish(CLA)Roaring(CLA)
Middle Clack TribsUpper Clackamas
Collowash(CLA)Hot Springs Fork(CLA)
Upper Clack Tribs
Key to strategic priority
High Medium Low Indirect or General
11-May-04
Geographic area priority
1/ "Channel stability" applies to freshwater areas; "channel landscape" applies to estuarine areas.
Key
hab
itat q
uant
ity
Geographic areaPr
otec
tion
bene
fit
Res
tora
tion
bene
fit
Pred
atio
n
With
draw
als
Har
assm
ent/p
oach
ing
Obs
truc
tions
Oxy
gen
Path
ogen
s
Cha
nnel
sta
bilit
y/la
ndsc
.1/
Che
mic
als
Com
petit
ion
(w/ h
atch
)
Com
petit
ion
(oth
er s
p)
Flow
Food
Hab
itat d
iver
sity
Sedi
men
t loa
d
Tem
pera
ture
Figure 3-62: Clackamas River Spring Chinook Attribute EffectsThe change in productivity with restoration of an attribute is given by the size of the black dot, which isproportional to the overall restoration value given by the open circles to the left. A large black dot in an area withlittle overall restoration value (given by the size of the open circle) indicates little change in performance withrestoration of the attribute
EDT Habitat Assessment by Geographic AreaThe assessment of the Clackamas River addressed habitat conditions for three salmonidspecies and six populations. The preceding discussion focused on how habitat conditionsacross the Clackamas affect potential performance of each of the six populations, that is,geographic areas within populations. This section will discuss each of the 15 geographicareas in the Clackamas River (Table 3-165) and the conditions that limit populations withineach area, that is, populations within geographic areas. In this way, limiting conditions thatoccur across one or more populations can be identified while geographic areas can beprioritized in terms of their potential impact on the mix of salmonid populations in theClackamas River.
Of course, not all geographic areas are relevant to each population. Conditions in the EagleCreek geographic area, for example, have no impact on upper Clackamas steelhead, whileconditions in the Collowash area have no impact on lower Clackamas steelhead. Any

DRAFT WILLAMETTE SUBBASIN PLAN
3-454 CH 3 ASSESSMENT.DOC
geographic area can affect up to six populations, depending on how anadromous salmonidsuse the Clackamas River within the EDT assessment.
This brings up an important caveat: this study assessed only the effect of conditions within areach on fish survival and capacity within that reach. It did not deal with causes ofconditions. While some habitat limitations are proximal, meaning that they originate at alocal level, others are systemic and are the result of cumulative conditions throughout thewatershed. Large wood and channel form are examples of proximal limiting factors(although arguments can be made that these are influenced by the accumulation of upriverconditions as well). Flow, sediment, and temperature are examples of systemic problems thatare perceived by fish at a local level (and would be identified in this assessment) but developas a result of the accumulation of conditions upstream. For example, temperature is animportant limiting factor in the lower Clackamas area, but conditions in the lower Clackamasarea have only a minor impact on the summer water temperature. Instead, water temperaturein the lower Clackamas is the result of decreased riparian forests in the tributaries andmainstem, ponding of water behind dams, and other upriver factors.
The point is that, even though many of the smaller tributaries were ranked low in terms oftheir overall contribution to abundance of the focal species, these areas may be the source ororigin of conditions that are identified as limiting factors in larger downstream areas. Inaddition, the discussion above for each population noted that these smaller streams can makeimportant contributions to the life history diversity of the population even if they do notcontribute greatly to abundance. Restoration of lower ranked areas may be entirelyappropriate as solutions to problems limiting fish production in higher ranked areas and toincrease diversity.
Limiting Factors in Portland: Lower WillametteOverall Protection Rank: 15Overall Restoration Rank: 2
Conditions in the lower Willamette River affect the performance of all six populations in theClackamas River. This assessment showed that conditions in the lower Willamette cancontribute significantly to the potential biological performance of fish in the ClackamasRiver. In fact, it is apparent that the Clackamas River and the lower Willamette River form acontiguous habitat unit. This expanded view of the Clackamas can form a useful focus forrestoration and management of coho, Chinook, and steelhead in the Clackamas River.
Current conditions in the Portland (lower Willamette) area are degraded, and the area hadalmost no protection value for the six Clackamas populations. The assessment found thatsalmon and steelhead used the area almost entirely as a migration corridor. This is consistentwith studies of fish use of the lower Willamette River that found that most juvenilesalmonids move through the area in less than two weeks (Friesen and others, 2002).However, restoration of conditions in the lower Willamette illustrated the potential of thearea to contribute to tributary populations such as those from the Clackamas. For all sixpopulations combined, the Portland area was the second-ranked restoration priority. ThePortland area had a moderate overall restoration ranking and relatively high rankings forClackamas spring Chinook (restoration rank 2 out of 13), fall Chinook (restoration rank 3 outof 7), and upper Clackamas steelhead (restoration rank 3 out of 8).

DRAFT WILLAMETTE SUBBASIN PLAN
CH 3 ASSESSMENT.DOC 3-455
Limiting environmental attributes in the Portland area included chemical pollutants, loss ofhabitat diversity, pathogens, predation (the result of large numbers of introduced fishspecies), and loss of key habitat (Figure 3-63). The lower Willamette River has a host ofwater pollutant problems from local and upriver sources. Loss of habitat diversity and thequantity of key habitat types are the result of channelization and dredging of the lower riverthat has eliminated much of the shallow water habitat that would provide rearing habitat forjuvenile life stages (McConnaha 2003). Harassment from boating and other encroachment ofhuman activities on salmonids is pervasive within an urbanized area. Predation is suggestedas a limiting factor because of the presence of numerous nonnative fish species in the lowerWillamette River (Farr and Ward 1993). The limiting effect of pathogens reflects thepresence of large numbers of hatchery fish in the lower Willamette and endemic C. shasta (afish pathogen).
Geographic Area: Portland (Lower Willamette)
Lower Coho 6 5 6Upper Coho 9 4 9
Lower Steelhead 6 5 6Upper Steelhead 8 3 8
Fall Chinook 6 3 7Spring Chinook 13 2 13
Average Area Rank 8.0 3.7 8.2
Population
Survival Factor Priority for RestorationArea Rank
With
draw
als
Key
hab
itat q
uant
ity
Out
of
Path
ogen
s
Pred
atio
n
Sedi
men
t loa
d
Tem
pera
ture
Hab
itat d
iver
sity
Har
assm
ent/p
oach
ing
Obs
truc
tions
Oxy
gen
Com
petit
ion
(w/ h
atch
)
Com
petit
ion
(oth
er sp
)
Flo
w
Foo
d
Prot
ectio
n R
ank
Res
tora
tion
Ran
k
Cha
nnel
stab
ility
/land
sc.1
/
Che
mic
als
Figure 3-63: Protection and Restoration Rankings for the Portland (Lower Willamette) Areaand Restoration Effects of Survival Attributes on Six Populations from the Clackamas River
Limiting Factors in the Lower Clackamas RiverProtection Priority: 1Restoration Priority: 1
The lower Clackamas River mainstem influences performance of all six populations. With allsix populations combined, the lower Clackamas was the number-one ranked area in theClackamas River for both protection and restoration (Figure 3-36). Conditions are relativelydegraded, and protection ranks for all populations except fall Chinook were low. Becausethis area has virtually all potential spawning habitat in the Clackamas for fall Chinook, it wasthe number one protection priority for this population, despite the current habitat limitations.All six populations use the lower Clackamas to varying degrees and would benefit fromimproved conditions in this area; as a result, the lower Clackamas area had the top restorationrating for four of the six populations. Upper river coho and steelhead used the lower rivermainly for migration, so restoration was a lesser priority for these populations.

DRAFT WILLAMETTE SUBBASIN PLAN
3-456 CH 3 ASSESSMENT.DOC
Limiting factors include predation (resulting from the large number of introduced fish speciespresent), sediment (for those populations that potentially use the lower river for spawning),and degraded channel stability (Figure 3-64). The latter factor is the result of diking andchannelization of the lower river and the restricted connection between the river and thefloodplain. Narrowing of the channel between dikes also has decreased key habitat quantityin the lower Clackamas area (Figure 3-64). Temperature was a major limiting factor for bothChinook populations that commence spawning in September, when water temperatures areextremely high. Chemical pollutants and hatchery impacts (competition with hatchery fishand pathogens) were also important limiting factors in the lower Clackamas. Changes in thesediment patterns and storage are also affecting fish populations. The river channel in thefirst two miles below the River Mill dams is coarsening and downcutting, which affects thequality and quantify of spawning habitats. Sediments, nutrients, and toxins also flow in thelower river from urbanizing tributaries, such as Deep, Rock and Richardson creeks.
Geographic Area: Lower Clackamas
Lower Coho 5 1 6Upper Coho 6 4 9
Lower Steelhead 4 1 6Upper Steelhead 5 5 8
Fall Chinook 1 1 7Spring Chinook 5 1 13
Average Area Rank 4.3 2.2 8.2
Prot
ectio
n R
ank
Res
tora
tion
Ran
k
Cha
nnel
stab
ility
/land
sc.1
/
Che
mic
als
Com
petit
ion
(w/ h
atch
)
Com
petit
ion
(oth
er sp
)
Flo
w
Foo
d
Hab
itat d
iver
sity
Har
assm
ent/p
oach
ing
Obs
truc
tions
Oxy
gen
Population
Survival Factor Priority for RestorationArea Rank
With
draw
als
Key
hab
itat q
uant
ity
Out
of
Path
ogen
s
Pred
atio
n
Sedi
men
t loa
d
Tem
pera
ture
Figure 3-64: Protection and Restoration Rankings for the Lower Clackamas Area andRestoration Effects of Survival Attributes on Six Populations from the Clackamas River
Limiting Factors in Deep CreekOverall Protection Priority: 10Overall Restoration Priority: 5
In the context of the Clackamas River as a whole and for all six populations, Deep Creekreceived a moderately low protection rank (10 of 15) but a moderately high restoration rank(5 of 15). The Deep Creek watershed provides valuable habitat for four of the six populationsbut especially for lower Clackamas coho, lower Clackamas steelhead, and spring Chinook(Figure 3-65).
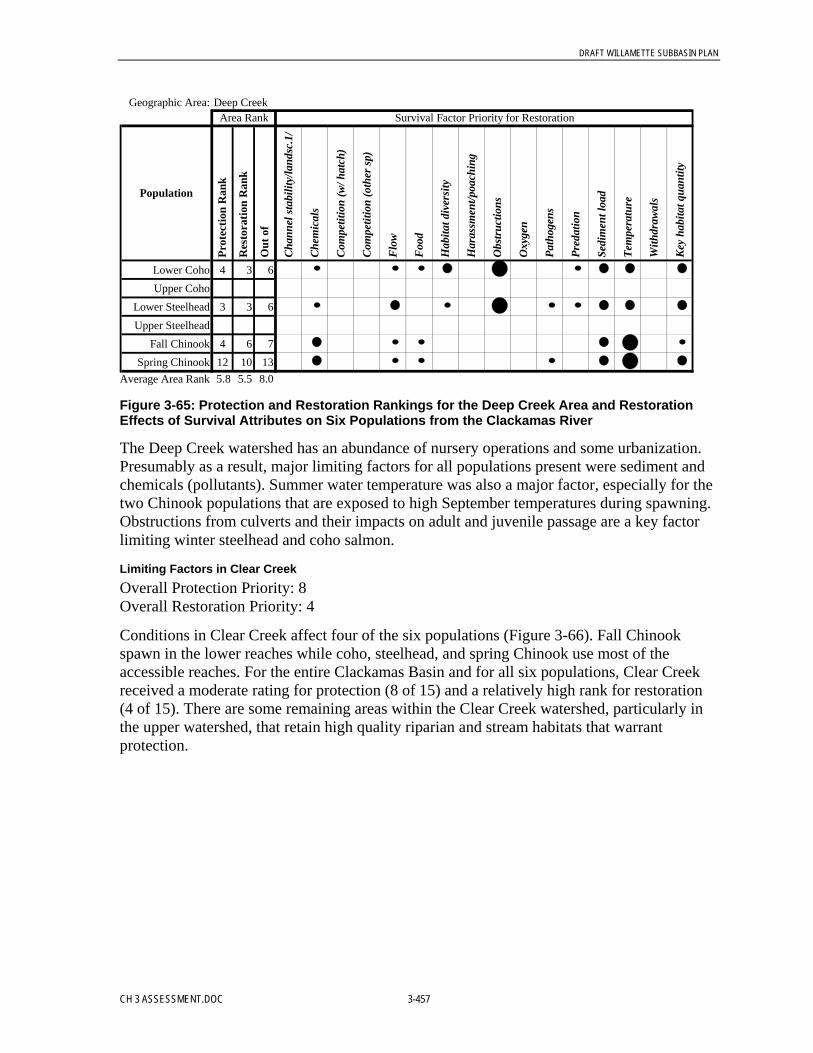
DRAFT WILLAMETTE SUBBASIN PLAN
CH 3 ASSESSMENT.DOC 3-457
Geographic Area: Deep Creek
Lower Coho 4 3 6Upper Coho
Lower Steelhead 3 3 6Upper Steelhead
Fall Chinook 4 6 7Spring Chinook 12 10 13
Average Area Rank 5.8 5.5 8.0
Prot
ectio
n R
ank
Res
tora
tion
Ran
k
Cha
nnel
stab
ility
/land
sc.1
/
Che
mic
als
Com
petit
ion
(w/ h
atch
)
Com
petit
ion
(oth
er sp
)
Flo
w
Foo
d
Hab
itat d
iver
sity
Har
assm
ent/p
oach
ing
Obs
truc
tions
Oxy
gen
Population
Survival Factor Priority for RestorationArea Rank
With
draw
als
Key
hab
itat q
uant
ity
Out
of
Path
ogen
s
Pred
atio
n
Sedi
men
t loa
d
Tem
pera
ture
Figure 3-65: Protection and Restoration Rankings for the Deep Creek Area and RestorationEffects of Survival Attributes on Six Populations from the Clackamas River
The Deep Creek watershed has an abundance of nursery operations and some urbanization.Presumably as a result, major limiting factors for all populations present were sediment andchemicals (pollutants). Summer water temperature was also a major factor, especially for thetwo Chinook populations that are exposed to high September temperatures during spawning.Obstructions from culverts and their impacts on adult and juvenile passage are a key factorlimiting winter steelhead and coho salmon.
Limiting Factors in Clear CreekOverall Protection Priority: 8Overall Restoration Priority: 4
Conditions in Clear Creek affect four of the six populations (Figure 3-66). Fall Chinookspawn in the lower reaches while coho, steelhead, and spring Chinook use most of theaccessible reaches. For the entire Clackamas Basin and for all six populations, Clear Creekreceived a moderate rating for protection (8 of 15) and a relatively high rank for restoration(4 of 15). There are some remaining areas within the Clear Creek watershed, particularly inthe upper watershed, that retain high quality riparian and stream habitats that warrantprotection.
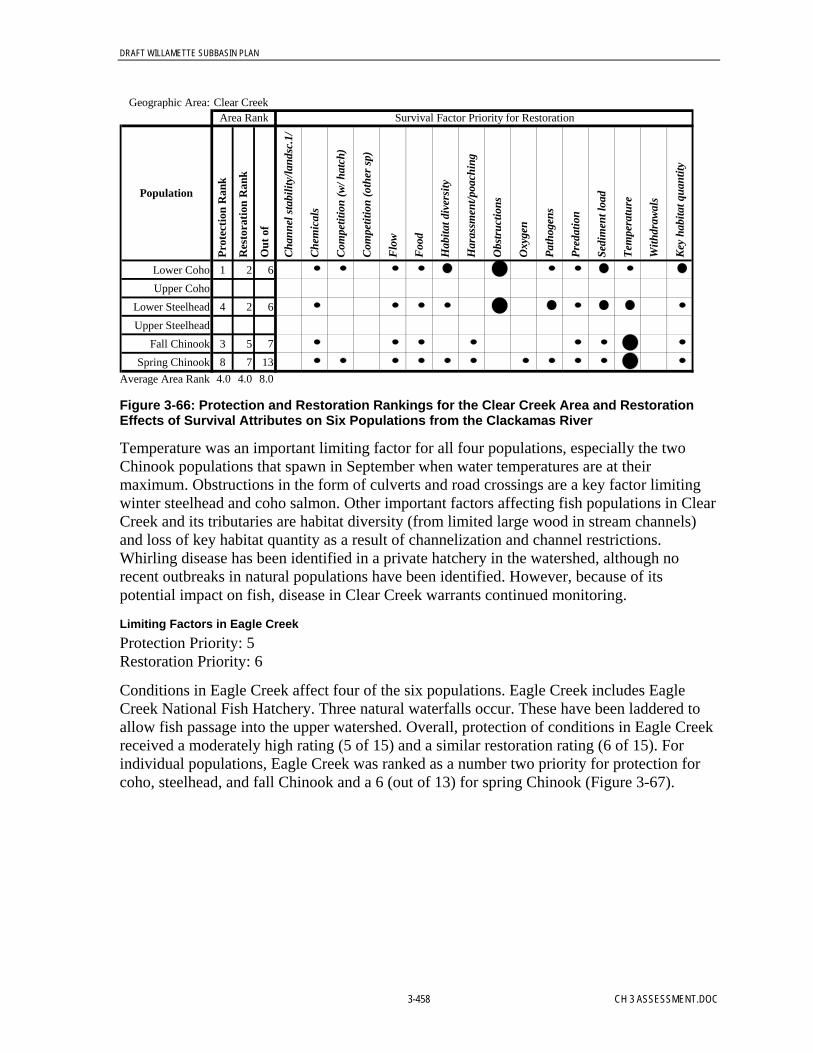
DRAFT WILLAMETTE SUBBASIN PLAN
3-458 CH 3 ASSESSMENT.DOC
Geographic Area: Clear Creek
Lower Coho 1 2 6Upper Coho
Lower Steelhead 4 2 6Upper Steelhead
Fall Chinook 3 5 7Spring Chinook 8 7 13
Average Area Rank 4.0 4.0 8.0
Prot
ectio
n R
ank
Res
tora
tion
Ran
k
Cha
nnel
stab
ility
/land
sc.1
/
Che
mic
als
Com
petit
ion
(w/ h
atch
)
Com
petit
ion
(oth
er sp
)
Flo
w
Foo
d
Hab
itat d
iver
sity
Har
assm
ent/p
oach
ing
Obs
truc
tions
Oxy
gen
Population
Survival Factor Priority for RestorationArea Rank
With
draw
als
Key
hab
itat q
uant
ity
Out
of
Path
ogen
s
Pred
atio
n
Sedi
men
t loa
d
Tem
pera
ture
Figure 3-66: Protection and Restoration Rankings for the Clear Creek Area and RestorationEffects of Survival Attributes on Six Populations from the Clackamas River
Temperature was an important limiting factor for all four populations, especially the twoChinook populations that spawn in September when water temperatures are at theirmaximum. Obstructions in the form of culverts and road crossings are a key factor limitingwinter steelhead and coho salmon. Other important factors affecting fish populations in ClearCreek and its tributaries are habitat diversity (from limited large wood in stream channels)and loss of key habitat quantity as a result of channelization and channel restrictions.Whirling disease has been identified in a private hatchery in the watershed, although norecent outbreaks in natural populations have been identified. However, because of itspotential impact on fish, disease in Clear Creek warrants continued monitoring.
Limiting Factors in Eagle CreekProtection Priority: 5Restoration Priority: 6
Conditions in Eagle Creek affect four of the six populations. Eagle Creek includes EagleCreek National Fish Hatchery. Three natural waterfalls occur. These have been laddered toallow fish passage into the upper watershed. Overall, protection of conditions in Eagle Creekreceived a moderately high rating (5 of 15) and a similar restoration rating (6 of 15). Forindividual populations, Eagle Creek was ranked as a number two priority for protection forcoho, steelhead, and fall Chinook and a 6 (out of 13) for spring Chinook (Figure 3-67).

DRAFT WILLAMETTE SUBBASIN PLAN
CH 3 ASSESSMENT.DOC 3-459
Geographic Area: Eagle Creek
Lower Coho 2 4 6Upper Coho
Lower Steelhead 2 2 6Upper Steelhead
Fall Chinook 2 2 7Spring Chinook 6 6 13
Average Area Rank 3.0 3.5 8.0
Prot
ectio
n R
ank
Res
tora
tion
Ran
k
Cha
nnel
stab
ility
/land
sc.1
/
Che
mic
als
Com
petit
ion
(w/ h
atch
)
Com
petit
ion
(oth
er sp
)
Flo
w
Foo
d
Hab
itat d
iver
sity
Har
assm
ent/p
oach
ing
Obs
truc
tions
Oxy
gen
Population
Survival Factor Priority for RestorationArea Rank
With
draw
als
Key
hab
itat q
uant
ity
Out
of
Path
ogen
s
Pred
atio
n
Sedi
men
t loa
d
Tem
pera
ture
Figure 3-67: Protection and Restoration Rankings for the Eagle Creek Area and RestorationEffects of Survival Attributes on Six Populations from the Clackamas River
High water temperature and sediment were the major limiting factors in Eagle Creek.Obstructions were a lesser problem in Eagle Creek compared to the other lower rivertributaries. This system has three natural waterfalls that have been laddered and two artificialobstructions.
Limiting Factors in North Fork Eagle CreekProtection Priority: 7Restoration Priority: 7
Conditions in North Fork Eagle Creek affected three of the six populations (Figure 3-67).Overall, this area received a moderate rank for both protection and restoration (7 of 15).However, North Fork Eagle Creek was ranked number one for protection in regard to lowerClackamas winter steelhead, although it received only moderate rankings for the otherpopulations (Figure 3-68).

DRAFT WILLAMETTE SUBBASIN PLAN
3-460 CH 3 ASSESSMENT.DOC
Geographic Area: North Fork Eagle Creek
Lower Coho 3 5 6Upper Coho
Lower Steelhead 1 4 6Upper Steelhead
Fall ChinookSpring Chinook 7 5 13
Average Area Rank 3.7 4.7 8.3
Prot
ectio
n R
ank
Res
tora
tion
Ran
k
Cha
nnel
stab
ility
/land
sc.1
/
Che
mic
als
Com
petit
ion
(w/ h
atch
)
Com
petit
ion
(oth
er sp
)
Flo
w
Foo
d
Hab
itat d
iver
sity
Har
assm
ent/p
oach
ing
Obs
truc
tions
Oxy
gen
Population
Survival Factor Priority for RestorationArea Rank
With
draw
als
Key
hab
itat q
uant
ity
Out
of
Path
ogen
s
Pred
atio
n
Sedi
men
t loa
d
Tem
pera
ture
Figure 3-68: Protection and Restoration Rankings for the North Fork Eagle Creek Area andRestoration Effects of Survival Attributes on Six Populations from the Clackamas River
Limiting factors in North Fork Eagle Creek are similar to those in other lower watershedtributaries. High water temperature was a key factor for spring Chinook, while increased finesediment has affected spawning success of all three populations. Coho and steelhead—species that would use the upper reaches of the stream—are affected by obstructions fromculverts and road crossings.
Limiting Factors in Lower Clackamas TributariesOverall Protection Priority: 14Overall Restoration Priority: 12
The collection of small streams making up the Lower Clackamas tributary area includesRock, Richardson, Foster, Goose, Cow and Sieben creeks. Overall, this area received lowrankings for both protection (14 of 15) and restoration (12 of 15). Conditions in thesetributaries directly affect four of the six populations but also received low protection andrestoration rankings for each of the populations (Figure 3-69).
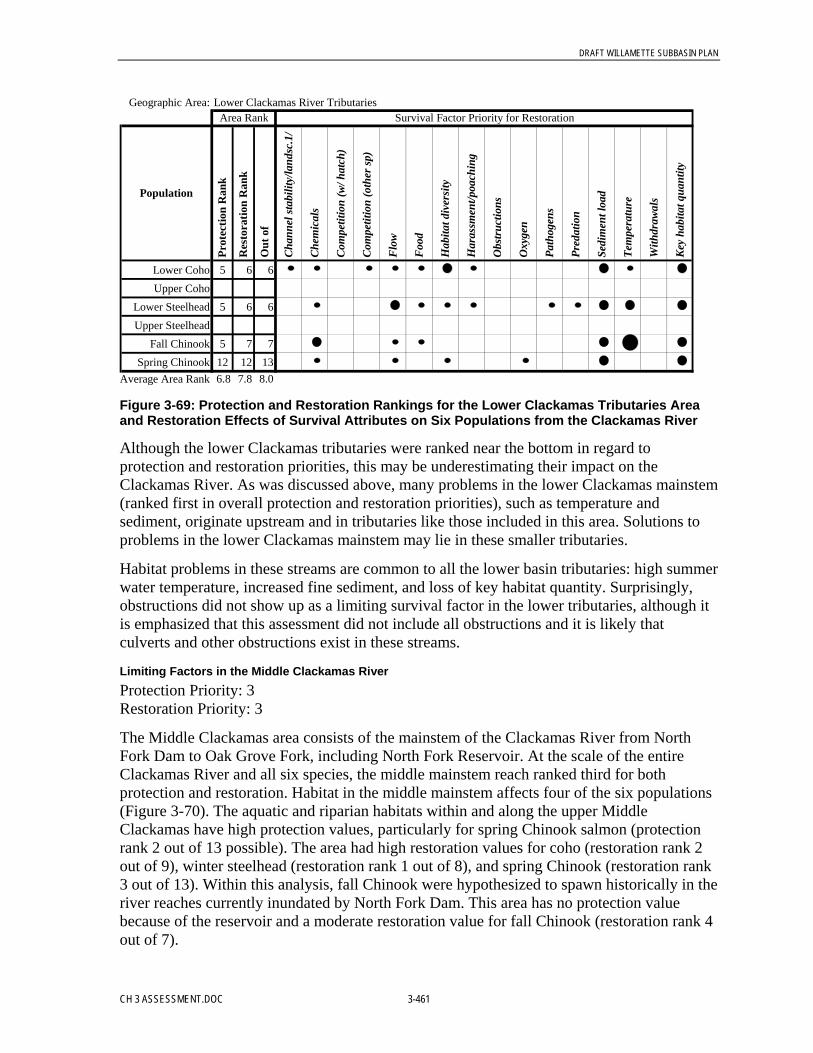
DRAFT WILLAMETTE SUBBASIN PLAN
CH 3 ASSESSMENT.DOC 3-461
Geographic Area: Lower Clackamas River Tributaries
Lower Coho 5 6 6Upper Coho
Lower Steelhead 5 6 6Upper Steelhead
Fall Chinook 5 7 7Spring Chinook 12 12 13
Average Area Rank 6.8 7.8 8.0
Population
Survival Factor Priority for RestorationArea Rank
With
draw
als
Key
hab
itat q
uant
ity
Out
of
Path
ogen
s
Pred
atio
n
Sedi
men
t loa
d
Tem
pera
ture
Hab
itat d
iver
sity
Har
assm
ent/p
oach
ing
Obs
truc
tions
Oxy
gen
Com
petit
ion
(w/ h
atch
)
Com
petit
ion
(oth
er sp
)
Flo
w
Foo
d
Prot
ectio
n R
ank
Res
tora
tion
Ran
k
Cha
nnel
stab
ility
/land
sc.1
/
Che
mic
als
Figure 3-69: Protection and Restoration Rankings for the Lower Clackamas Tributaries Areaand Restoration Effects of Survival Attributes on Six Populations from the Clackamas River
Although the lower Clackamas tributaries were ranked near the bottom in regard toprotection and restoration priorities, this may be underestimating their impact on theClackamas River. As was discussed above, many problems in the lower Clackamas mainstem(ranked first in overall protection and restoration priorities), such as temperature andsediment, originate upstream and in tributaries like those included in this area. Solutions toproblems in the lower Clackamas mainstem may lie in these smaller tributaries.
Habitat problems in these streams are common to all the lower basin tributaries: high summerwater temperature, increased fine sediment, and loss of key habitat quantity. Surprisingly,obstructions did not show up as a limiting survival factor in the lower tributaries, although itis emphasized that this assessment did not include all obstructions and it is likely thatculverts and other obstructions exist in these streams.
Limiting Factors in the Middle Clackamas RiverProtection Priority: 3Restoration Priority: 3
The Middle Clackamas area consists of the mainstem of the Clackamas River from NorthFork Dam to Oak Grove Fork, including North Fork Reservoir. At the scale of the entireClackamas River and all six species, the middle mainstem reach ranked third for bothprotection and restoration. Habitat in the middle mainstem affects four of the six populations(Figure 3-70). The aquatic and riparian habitats within and along the upper MiddleClackamas have high protection values, particularly for spring Chinook salmon (protectionrank 2 out of 13 possible). The area had high restoration values for coho (restoration rank 2out of 9), winter steelhead (restoration rank 1 out of 8), and spring Chinook (restoration rank3 out of 13). Within this analysis, fall Chinook were hypothesized to spawn historically in theriver reaches currently inundated by North Fork Dam. This area has no protection valuebecause of the reservoir and a moderate restoration value for fall Chinook (restoration rank 4out of 7).

DRAFT WILLAMETTE SUBBASIN PLAN
3-462 CH 3 ASSESSMENT.DOC
Geographic Area: Middle Clackamas
Lower CohoUpper Coho 3 2 9
Lower SteelheadUpper Steelhead 3 1 8
Fall Chinook 7 4 7Spring Chinook 2 3 13
Average Area Rank 3.8 2.5 9.3
Prot
ectio
n R
ank
Res
tora
tion
Ran
k
Cha
nnel
stab
ility
/land
sc.1
/
Che
mic
als
Com
petit
ion
(w/ h
atch
)
Com
petit
ion
(oth
er sp
)
Flo
w
Foo
d
Hab
itat d
iver
sity
Har
assm
ent/p
oach
ing
Obs
truc
tions
Oxy
gen
Population
Survival Factor Priority for RestorationArea Rank
With
draw
als
Key
hab
itat q
uant
ity
Out
of
Path
ogen
s
Pred
atio
n
Sedi
men
t loa
d
Tem
pera
ture
Figure 3-70: Protection and Restoration Rankings for the Middle Clackamas Area andRestoration Effects of Survival Attributes on Six Populations from the Clackamas River
Key factors limiting fish populations in the middle Clackamas River are loss of habitatdiversity, increased fine sediment, and loss of key habitat quantity. Most of the loss of habitatdiversity is the result of reductions in large wood in the river, channel confinement fromroads and other actions, impacts to riparian areas, and loss of spawning habitat within theNorth Fork Reservoir. Forest Service Road 46, which parallels large sections of the river,prevents river meandering and restricts the channel, all of which increases channel velocitiesand scour and minimize complex, slow-water habitats such as side channels. The river cannotmeander through the road and cannot access historical side-channels and other floodplainhabitats.
There are also issues with low flows below the Oak Grove Reservoir to Three Lynx Creek. Inaddition, the highway narrows the channel, resulting in a decline in the quantity of habitat.North Fork Reservoir eliminated all spawning habitat in the lower portion of this area.However, it also greatly increased the amount of potential rearing habitat for juvenilesalmonid life stages. It is unclear how much spawning habitat was lost as a result of thereservoir because the dams inundated a fairly steep, confined canyon area that may haveprovided limited spawning potential. The three-dam complex operated by PGE that forms thedownstream boundary of this area also forms obstructions and decreases survival of adult andjuvenile migrants.
Limiting Factors in Fish CreekProtection Priority: 12Restoration Priority: 13
Fish Creek is a tributary entering the Clackamas River at about RM 41.5. The creek has alow overall protection priority (12 of 15) and restoration priority (13 of 15). Three of the sixpopulations are potentially directly affected by conditions in Fish Creek. The area alsoreceived a low ranking for protection and restoration for coho, Chinook, and steelhead.

DRAFT WILLAMETTE SUBBASIN PLAN
CH 3 ASSESSMENT.DOC 3-463
Restoration priorities include sediment, temperature, and habitat diversity (Figure 3-71).These factors can be largely traced to logging and road-building activities in the watershed.There has been extensive harvest and associated road-building activity in the Fish CreekWatershed. Over the past several decades, the Forest Service has pursued extensive road,riparian, and in-channel restoration actions. Increased water temperatures and sedimentdeposition are key factors affecting winter steelhead survival.
Geographic Area: Fish Creek
Lower CohoUpper Coho 7 6 9
Lower SteelheadUpper Steelhead 5 7 8
Fall ChinookSpring Chinook 10 9 13
Average Area Rank 7.3 7.3 10.0
Prot
ectio
n R
ank
Res
tora
tion
Ran
k
Cha
nnel
stab
ility
/land
sc.1
/
Che
mic
als
Com
petit
ion
(w/ h
atch
)
Com
petit
ion
(oth
er sp
)
Flo
w
Foo
d
Hab
itat d
iver
sity
Har
assm
ent/p
oach
ing
Obs
truc
tions
Oxy
gen
Population
Survival Factor Priority for RestorationArea Rank
With
draw
als
Key
hab
itat q
uant
ity
Out
of
Path
ogen
s
Pred
atio
n
Sedi
men
t loa
d
Tem
pera
ture
Figure 3-71: Protection and Restoration Rankings for the Fish Creek Area and RestorationEffects of Survival Attributes on Six Populations from the Clackamas River
Limiting Factors in Roaring RiverProtection Priority: 13Restoration Priority: 14
Roaring River enters the middle Clackamas River at about RM 44. Much of the watershed isinaccessible to anadromous fish because of a natural barrier about 3 miles from the mouth.The accessible portion of the river is a narrow, steep-sided gorge. The Roaring River areareceived nearly the lowest protection (13 of 15) and restoration (14 of 15) rankings in theClackamas River across all six populations. Conditions in the Roaring River affect three ofthe six populations. The area received low rankings for protection and restoration for thethree individual populations (Figure 3-72).
The low rankings for Roaring River are due to the fact that the accessible length of thestream is quite short (about 3 miles); also, the accessible portion is a high-gradient, naturallyconfined canyon. The area does have decreased habitat diversity (lack of large wood) andincreased levels of fine sediment (Figure 3-72).
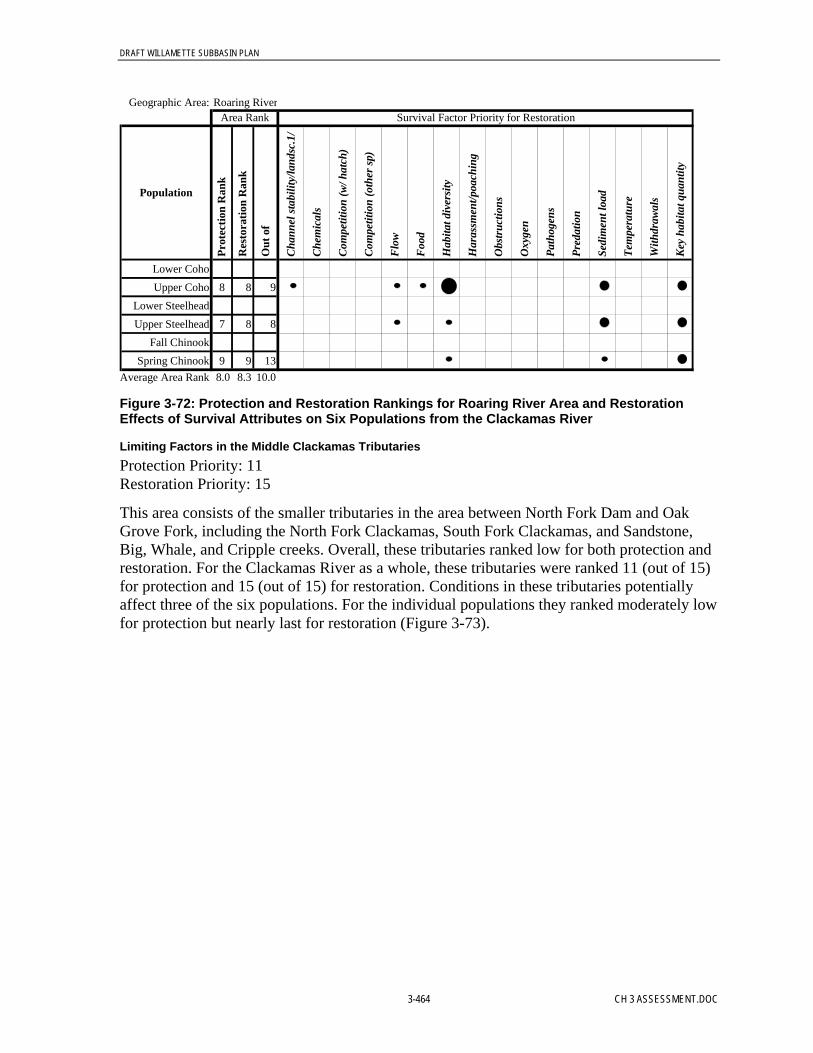
DRAFT WILLAMETTE SUBBASIN PLAN
3-464 CH 3 ASSESSMENT.DOC
Geographic Area: Roaring River
Lower CohoUpper Coho 8 8 9
Lower SteelheadUpper Steelhead 7 8 8
Fall ChinookSpring Chinook 9 9 13
Average Area Rank 8.0 8.3 10.0
Prot
ectio
n R
ank
Res
tora
tion
Ran
k
Cha
nnel
stab
ility
/land
sc.1
/
Che
mic
als
Com
petit
ion
(w/ h
atch
)
Com
petit
ion
(oth
er sp
)
Flo
w
Foo
d
Hab
itat d
iver
sity
Har
assm
ent/p
oach
ing
Obs
truc
tions
Oxy
gen
Population
Survival Factor Priority for RestorationArea Rank
With
draw
als
Key
hab
itat q
uant
ity
Out
of
Path
ogen
s
Pred
atio
n
Sedi
men
t loa
d
Tem
pera
ture
Figure 3-72: Protection and Restoration Rankings for Roaring River Area and RestorationEffects of Survival Attributes on Six Populations from the Clackamas River
Limiting Factors in the Middle Clackamas TributariesProtection Priority: 11Restoration Priority: 15
This area consists of the smaller tributaries in the area between North Fork Dam and OakGrove Fork, including the North Fork Clackamas, South Fork Clackamas, and Sandstone,Big, Whale, and Cripple creeks. Overall, these tributaries ranked low for both protection andrestoration. For the Clackamas River as a whole, these tributaries were ranked 11 (out of 15)for protection and 15 (out of 15) for restoration. Conditions in these tributaries potentiallyaffect three of the six populations. For the individual populations they ranked moderately lowfor protection but nearly last for restoration (Figure 3-73).

DRAFT WILLAMETTE SUBBASIN PLAN
CH 3 ASSESSMENT.DOC 3-465
Geographic Area: Middle Clackamas Tributaries
Lower CohoUpper Coho 5 9 9
Lower SteelheadUpper Steelhead 6 7 8
Fall ChinookSpring Chinook 11 11 13
Average Area Rank 7.3 9.0 10.0
Prot
ectio
n R
ank
Res
tora
tion
Ran
k
Cha
nnel
stab
ility
/land
sc.1
/
Che
mic
als
Com
petit
ion
(w/ h
atch
)
Com
petit
ion
(oth
er sp
)
Flo
w
Foo
d
Hab
itat d
iver
sity
Har
assm
ent/p
oach
ing
Obs
truc
tions
Oxy
gen
Population
Survival Factor Priority for RestorationArea Rank
With
draw
als
Key
hab
itat q
uant
ity
Out
of
Path
ogen
s
Pred
atio
n
Sedi
men
t loa
d
Tem
pera
ture
Figure 3-73: Protection and Restoration Rankings for the Middle Clackamas Tributaries Areaand Restoration Effects of Survival Attributes on Six Populations from the Clackamas River
Increased fine sediment was a limiting factor for all species. Most of these tributaries arewithin watersheds that have recent or active logging and associated road building.Obstructions that limit fish movement are an important limiting factor for steelhead in thesetributaries. Sediment, habitat diversity, and key habitat quantity are also degraded, all ofwhich reflect logging and road building in the watersheds.
Limiting Factors in the Upper Clackamas RiverOverall Protection Priority: 2Overall Restoration Priority: 8
The Upper Clackamas River area is the mainstem of the Clackamas River from Oak GroveFork to headwaters. This portion of the river is a key spawning and rearing area for the UpperClackamas coho salmon and winter steelhead populations, and it provides important habitatfor spring Chinook salmon as well. The area includes the Big Bottom, which is generallyconsidered the highest quality coho salmon habitat in the Clackamas River Subbasin.
Conditions in the upper Clackamas mainstem are generally good to excellent. The arearanked number two for protection priority for the whole of the Clackamas River across all sixpopulations. The upper mainstem had a moderate overall rank for restoration (8 of 15). Thearea benefits three of the six populations and received the number one rank for protection foreach population (Figure 3-74). Restoration priority was moderately high for coho (3 of 9) andspring Chinook (4 of 13) and moderate for steelhead (4 of 8).
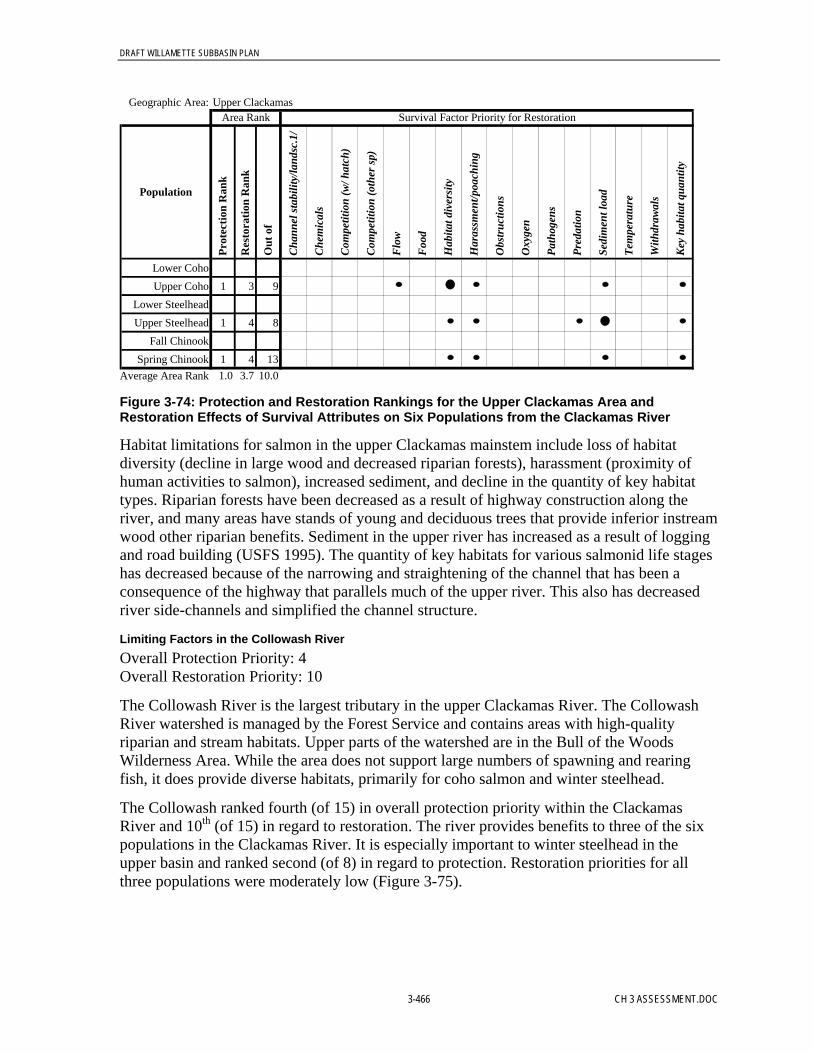
DRAFT WILLAMETTE SUBBASIN PLAN
3-466 CH 3 ASSESSMENT.DOC
Geographic Area: Upper Clackamas
Lower CohoUpper Coho 1 3 9
Lower SteelheadUpper Steelhead 1 4 8
Fall ChinookSpring Chinook 1 4 13
Average Area Rank 1.0 3.7 10.0
Prot
ectio
n R
ank
Res
tora
tion
Ran
k
Cha
nnel
stab
ility
/land
sc.1
/
Che
mic
als
Com
petit
ion
(w/ h
atch
)
Com
petit
ion
(oth
er sp
)
Flo
w
Foo
d
Hab
itat d
iver
sity
Har
assm
ent/p
oach
ing
Obs
truc
tions
Oxy
gen
Population
Survival Factor Priority for RestorationArea Rank
With
draw
als
Key
hab
itat q
uant
ity
Out
of
Path
ogen
s
Pred
atio
n
Sedi
men
t loa
d
Tem
pera
ture
Figure 3-74: Protection and Restoration Rankings for the Upper Clackamas Area andRestoration Effects of Survival Attributes on Six Populations from the Clackamas River
Habitat limitations for salmon in the upper Clackamas mainstem include loss of habitatdiversity (decline in large wood and decreased riparian forests), harassment (proximity ofhuman activities to salmon), increased sediment, and decline in the quantity of key habitattypes. Riparian forests have been decreased as a result of highway construction along theriver, and many areas have stands of young and deciduous trees that provide inferior instreamwood other riparian benefits. Sediment in the upper river has increased as a result of loggingand road building (USFS 1995). The quantity of key habitats for various salmonid life stageshas decreased because of the narrowing and straightening of the channel that has been aconsequence of the highway that parallels much of the upper river. This also has decreasedriver side-channels and simplified the channel structure.
Limiting Factors in the Collowash RiverOverall Protection Priority: 4Overall Restoration Priority: 10
The Collowash River is the largest tributary in the upper Clackamas River. The CollowashRiver watershed is managed by the Forest Service and contains areas with high-qualityriparian and stream habitats. Upper parts of the watershed are in the Bull of the WoodsWilderness Area. While the area does not support large numbers of spawning and rearingfish, it does provide diverse habitats, primarily for coho salmon and winter steelhead.
The Collowash ranked fourth (of 15) in overall protection priority within the ClackamasRiver and 10th (of 15) in regard to restoration. The river provides benefits to three of the sixpopulations in the Clackamas River. It is especially important to winter steelhead in theupper basin and ranked second (of 8) in regard to protection. Restoration priorities for allthree populations were moderately low (Figure 3-75).

DRAFT WILLAMETTE SUBBASIN PLAN
CH 3 ASSESSMENT.DOC 3-467
Geographic Area: Collowash River
Lower CohoUpper Coho 4 5 9
Lower SteelheadUpper Steelhead 2 5 8
Fall ChinookSpring Chinook 4 8 13
Average Area Rank 3.3 6.0 10.0
Prot
ectio
n R
ank
Res
tora
tion
Ran
k
Cha
nnel
stab
ility
/land
sc.1
/
Che
mic
als
Com
petit
ion
(w/ h
atch
)
Com
petit
ion
(oth
er sp
)
Flo
w
Foo
d
Hab
itat d
iver
sity
Har
assm
ent/p
oach
ing
Obs
truc
tions
Oxy
gen
Population
Survival Factor Priority for RestorationArea Rank
With
draw
als
Key
hab
itat q
uant
ity
Out
of
Path
ogen
s
Pred
atio
n
Sedi
men
t loa
d
Tem
pera
ture
Figure 3-75: Protection and Restoration Rankings for the Collowash River Area andRestoration Effects of Survival Attributes on Six Populations from the Clackamas River
The potential of the habitat in the Collowash is limited primarily by obstructions, which areculverts under logging and other roads (Figure 3-75). There is some increase in sediment as aresult of roads and logging. In addition, roads and logging have narrowed the channel inplaces and decreased the quantity of key habitat. Habitat diversity has decreased, with theprimary impact on juvenile rearing for coho salmon. This is the result of some decrease inriparian forest and a decline in large wood deliver to the stream.
Limiting Factors in Hot Springs ForkOverall Protection Priority: 9Overall Restoration Priority: 11
Hot Springs Fork is the largest tributary to the Collowash River. The lower part of thewatershed is in the Mt. Hood National Forest while the upper portion is in the Bull of theWoods Wilderness area.
Although habitat in the Hot Springs Fork is of high quality, the stream has only moderateprotection and restoration rankings for the Clackamas River as a whole. Conditions in theHot Spring Fork potentially affect three of the six populations. The stream received amoderately low protection ranking for upriver coho (5 of 9) and a low ranking for restoration(7 of 9). The Hot Springs Fork has a relatively high gradient (3 percent) and is more suited tosteelhead than coho. However, rankings for steelhead and spring Chinook were alsomoderately low (Figure 3-76). Overall, the Hot Springs ranked low in this assessmentbecause of (1) its relatively small size and resulting low biological capacity and (2) itsextreme upriver location and the resulting effects of all the habitat constraints below itsconfluence with the Collowash River.

DRAFT WILLAMETTE SUBBASIN PLAN
3-468 CH 3 ASSESSMENT.DOC
Geographic Area: Hot Springs Fork
Lower CohoUpper Coho 5 7 9
Lower SteelheadUpper Steelhead 4 6 8
Fall ChinookSpring Chinook 5 7 13
Average Area Rank 4.7 6.7 10.0
Prot
ectio
n R
ank
Res
tora
tion
Ran
k
Cha
nnel
stab
ility
/land
sc.1
/
Che
mic
als
Com
petit
ion
(w/ h
atch
)
Com
petit
ion
(oth
er sp
)
Flo
w
Foo
d
Hab
itat d
iver
sity
Har
assm
ent/p
oach
ing
Obs
truc
tions
Oxy
gen
Population
Survival Factor Priority for RestorationArea Rank
With
draw
als
Key
hab
itat q
uant
ity
Out
of
Path
ogen
s
Pred
atio
n
Sedi
men
t loa
d
Tem
pera
ture
Figure 3-76: Protection and Restoration Rankings for the Hot Springs Fork Area andRestoration Effects of Survival Attributes on Six Populations from the Clackamas River
Habitat constraints in the Hot Springs Fork were obstructions, habitat diversity, sediment,and key habitat quantity (Figure 3-76). Obstructions (culverts and road crossings) were a keylimiting factor for winter steelhead that would use the upper reaches with better access. Lessrobust riparian forests and lack of large wood have decreased habitat diversity. Sedimentreflects some logging and road building in the watershed, while the stream has narrowedsomewhat, resulting in a loss of the quantity of key habitats.
Limiting Factors in Upper Clackamas TributariesProtection Priority: 6Restoration Priority: 9
This area consists of smaller tributaries in the Clackamas River above Oak Grove Fork,including Tag, Trout, Pot, Wolf, Kansas, Pinhead, Last, Lowe Rhododendron, Fawn, Hunter,Cub and Berry creeks. This portion of the Clackamas Subbasin is managed by the ForestService and contains areas with high-quality riparian and stream habitats. While the area doesnot support large numbers of spawning and rearing fish, it does provide diverse habitats,primarily for coho salmon and winter steelhead.
The upper Clackamas tributaries had moderate overall restoration and protection rankings forthe entire Clackamas River. The streams potentially affect three of the six populations.Relative to the small tributaries in the middle and lower Clackamas, the upper Clackamastributaries were ranked high for the three relevant populations (Figure 3-77). For uprivercoho, the tributaries were ranked number two (of 9) for protection and were ranked numberone for restoration. For upriver winter steelhead, the tributaries were ranked number 2 (of 8)for both protection and restoration.
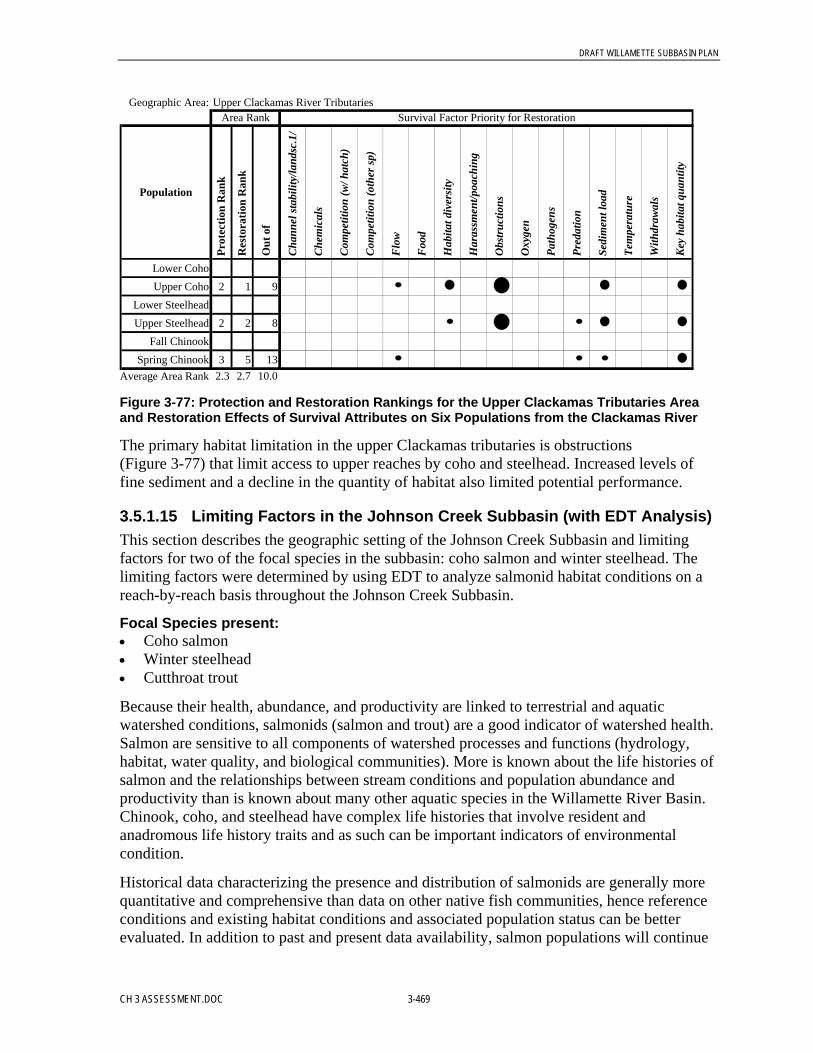
DRAFT WILLAMETTE SUBBASIN PLAN
CH 3 ASSESSMENT.DOC 3-469
Geographic Area: Upper Clackamas River Tributaries
Lower CohoUpper Coho 2 1 9
Lower SteelheadUpper Steelhead 2 2 8
Fall ChinookSpring Chinook 3 5 13
Average Area Rank 2.3 2.7 10.0
Prot
ectio
n R
ank
Res
tora
tion
Ran
k
Cha
nnel
stab
ility
/land
sc.1
/
Che
mic
als
Com
petit
ion
(w/ h
atch
)
Com
petit
ion
(oth
er sp
)
Flo
w
Foo
d
Hab
itat d
iver
sity
Har
assm
ent/p
oach
ing
Obs
truc
tions
Oxy
gen
Population
Survival Factor Priority for RestorationArea Rank
With
draw
als
Key
hab
itat q
uant
ity
Out
of
Path
ogen
s
Pred
atio
n
Sedi
men
t loa
d
Tem
pera
ture
Figure 3-77: Protection and Restoration Rankings for the Upper Clackamas Tributaries Areaand Restoration Effects of Survival Attributes on Six Populations from the Clackamas River
The primary habitat limitation in the upper Clackamas tributaries is obstructions(Figure 3-77) that limit access to upper reaches by coho and steelhead. Increased levels offine sediment and a decline in the quantity of habitat also limited potential performance.
3.5.1.15 Limiting Factors in the Johnson Creek Subbasin (with EDT Analysis)This section describes the geographic setting of the Johnson Creek Subbasin and limitingfactors for two of the focal species in the subbasin: coho salmon and winter steelhead. Thelimiting factors were determined by using EDT to analyze salmonid habitat conditions on areach-by-reach basis throughout the Johnson Creek Subbasin.
Focal Species present:• Coho salmon• Winter steelhead• Cutthroat trout
Because their health, abundance, and productivity are linked to terrestrial and aquaticwatershed conditions, salmonids (salmon and trout) are a good indicator of watershed health.Salmon are sensitive to all components of watershed processes and functions (hydrology,habitat, water quality, and biological communities). More is known about the life histories ofsalmon and the relationships between stream conditions and population abundance andproductivity than is known about many other aquatic species in the Willamette River Basin.Chinook, coho, and steelhead have complex life histories that involve resident andanadromous life history traits and as such can be important indicators of environmentalcondition.
Historical data characterizing the presence and distribution of salmonids are generally morequantitative and comprehensive than data on other native fish communities, hence referenceconditions and existing habitat conditions and associated population status can be betterevaluated. In addition to past and present data availability, salmon populations will continue
DRAFT WILLAMETTE SUBBASIN PLAN
3-470 CH 3 ASSESSMENT.DOC
to be evaluated in the near and long-term future, as a result of federal Endangered SpeciesAct listings. However, the ability to acquire biological data in the future is critical inevaluating trends in habitat condition and thus is needed to effectively informdecisionmaking and to evaluate the success of implemented actions. For these reasons, other,non-ESA-listed native fish communities, such as rainbow, cutthroat, and sculpin, may in thefuture play an important role in helping to evaluate habitat conditions.
For now, Johnson Creek coho and steelhead were chosen as focal species to be evaluatedusing EDT. Both are native to Johnson Creek and experience freshwater conditions thataffect other native fish communities in the subbasin. Cutthroat trout, rainbow trout, andPacific lamprey are likewise considered important species in the Johnson Subbasin, but thesespecies were not evaluated in EDT. Neither resident fish population dynamics nor or lampreylife history strategies have been substantively defined in EDT; thus, they were not evaluatedusing this tool.
Johnson Creek CohoPopulation Description. The Johnson Subbasin coho population was defined to spawn and rearthroughout the entire mainstem Johnson Creek and its tributaries. No natural fish barrierswere identified. Life history of this population is based on similar populations in the lowerWillamette River, most prominently the Clackamas River and Tryon Creek populations.Coho return as 3-year-age adults and 2-year-age jacks. Lower Willamette coho are an early-run population, reaching Willamette Falls from late August through early November. Peakmigrations occur from middle to late September, following periods of considerable rainfall,and peak spawning generally occurs soon afterwards, from September through December.Fry emerge from mid-January through April, yielding a 4-month emergence period. While asmall proportion of fry emigrate during the first year, most fingerling smolts emigrate duringthe second spring, beginning in March and extending through mid-July.
Relationship to ESU or Other Population Designations. The Johnson Creek coho population is partof the Lower Columbia River coho ESU, which were listed on the state ESA in July 1999.This population was previously considered for federal listing. On July 25, 1995, NMFSdetermined that the listing was unwarranted; however, the population remains a “candidate”for listing on the federal ESA. The Willamette River Basin, up to Willamette Falls andincluding the Clackamas River, contains major spawning and rearing habitat for thispopulation.
Historical Abundance and Present Status. Willamette Basin coho are believed to be native only tosubbasins below Willamette Falls—notably, the Clackamas River Basin, Johnson Creek(Fulton, 1970), and Tryon Creek (WMSWCD, 2003d)—and were reported occupyingtributaries to Multnomah Channel from 1951 to 1959 (Willis et al, 1960). Notably, the lowerWillamette River Basin provided the third most important spawning grounds for coho salmonthroughout the entire Columbia River basin (Fulton, 1970).
In Johnson Creek, adults migrated through and occupied lower, middle, and upper areas ofthe watershed; however, the best spawning habitat was believed to be in the upper watershed(Fulton, 1970).
Presently, Johnson Creek’s biological communities have been greatly reduced from historicalconditions. Many native fish populations, including salmon, have declined significantly.

DRAFT WILLAMETTE SUBBASIN PLAN
CH 3 ASSESSMENT.DOC 3-471
Biotic integrity is severely impaired basinwide (ODFW, 2002); however, native fishcommunities continue to populate and dominate fish community structure in the basin:redside shiners, reticulate sculpin, and speckled dace.
Observations of adult and juvenile coho in lower Johnson Creek and Crystal Springs suggestswithin population recruitment and production and/or use by other Willamette Basinpopulations.
Johnson Creek Winter SteelheadPopulation Description. The Johnson Creek winter steelhead population was defined to spawnin mainstem Johnson Creek and its tributaries. No natural fish barriers were identified. Thelife history of this population is based on other lower Willamette winter steelheadpopulations, notably the Clackamas and Tryon Creek populations. Both are believed to be alate-run population returning to freshwater to spawn during their fifth and sixth years. Native,late-run winter steelhead entered the Willamette River from October through May (Dimmick,1945), with spawning beginning in March and peaking in April through May. Juvenilesteelhead generally spend 2 years in freshwater before smolting, with peak emigrationbeginning early April and extending through early June. Larger steelhead generally emigratesooner than their smaller cohorts (ODFW, 2000).
Relationship to ESU or Other Population Designations. Johnson Creek winter steelhead are part ofthe Lower Willamette River ESU and are believed to be most closely associated withpopulations below Willamette Falls: Clackamas River and Tryon Creek.
Historical Abundance and Present Status. Small wild winter steelhead runs have populatedJohnson Creek since the 1950s (ODFW, 2000). Prior to the mid-1960s, key spawning andrearing habitat was believed to be located in the lower portion of Johnson Creek basin. Sincethen, winter steelhead are believed to have extended their distribution up to the middlesection of the basin (Fulton, 1970).
Johnson Creek’s biological communities have been greatly reduced from historicalconditions. Many native fish populations, including salmon, have declined significantly.Biotic integrity is severely impaired basinwide (ODFW, 2002); however, native fishcommunities continue to populate and dominate the basin: redside shiners, reticulate sculpinand speckled dace. Large-scale suckers are notably abundant in the lower reach.Observations of adult and juvenile steelhead/rainbow in lower Johnson Creek and CrystalSprings suggests within-population recruitment and production and/or use by otherWillamette Basin populations.
Geographic Setting. Johnson Creek is a third-order stream draining a watershed ofapproximately 54 square miles. The stream is 24-miles long and includes eight namedtributaries. It is a low-gradient stream that drops some 660 feet over its 24-mile course for anaverage mainstem gradient of 0.5 percent. A number of volcanic vents and domes – such asthe Boring Lava Domes – influence the topography of the Johnson Creek watershed.Elevations range from high point of 1,129 feet at the Boring Hills to near sea level at theconfluence. The topography of the watershed consists of a moderate-gradient upper segment(0.6 percent gradient), a flat middle segment (0.2 percent), and a moderate-gradient lowersegment (0.8 percent). Terrain on the north side of the watershed is typically less steep than

DRAFT WILLAMETTE SUBBASIN PLAN
3-472 CH 3 ASSESSMENT.DOC
on the southern side. Hillslopes typically range between 1 and 25 percent, although Mt. Scotthas hillslopes as high as 50 percent.
Surficial geology in the Johnson Creek watershed is based on two major formations. Most ofupper Johnson Creek watershed is characterized by Troutdale Gravel, a Miocene formationof Columbia River deposits characterized by rounded cobbles and gravel (Orr and others,1976). In the middle and lower portions of the basin, Willamette Silt overlies the TroutdaleFormation. This consists of unconsolidated silts deposited by the Missoula Floods in the latePleistocene.
Soils in the northern portion of the watershed are of low to moderate erodibility and aregenerally more porous, with moderate to high permeability; however, this is also whereimpervious surfaces predominate. Soils in the southern portion of the watershed aremoderately erodible. They are largely clay, and therefore have low porosity. Soils areprimarily Multnomah and Latourell-Urban Land Complex (Type B hydrologic group) orCascade Silt Loam (Type C hydrologic group). Type B comprises 71 percent of thewatershed, while Type C comprises 21 percent.
Key Findings. For the Johnson Creek coho salmon population, the current potential is about6 percent of that under the reference habitat conditions, while steelhead populations are about4 percent of that under the reference habitat conditions. The percent change is a measure ofthe overall degradation of habitat conditions in the Johnson Creek watershed, primarily as aresult of anthropogenic changes throughout the watershed and in the lower Willamette River.
Present habitat conditions in the Johnson Creek Subbasin are symptomatic of both impairedwatershed processes and discrete actions that have occurred in the subbasin. For example,lining the creek with Works Progress Administration (WPA) tiles significantly altered naturalhydraulic processes throughout the middle and lower portions of Johnson Creek. Tilesconstrain creek flows into the main channel, reduce floodplain and riparian connectivity, andhydrologically disconnect historical floodplain wetlands from mainstem flows. This hasresulted in a creek that is highly channelized and—where natural bank form is present—eroded. In addition, urbanization throughout the watershed has altered hydrologic regimesdraining the subbasin; storm flows are more frequent and of higher velocities than they werehistorically. The cumulative effect has been a reduction in habitat diversity, high sedimentloading, a loss of key habitats, and impaired fish passage basinwide. Table 3-167 summarizeskey habitat attributes limiting Johnson Creek steelhead and coho populations.
Table 3-167: Summary of Key Problems in Johnson Creek
Habitat Attribute Symptomatic Habitat Features
Habitat complexity Lack of large wood, large and medium-sized substrate, overhanging vegetation, andstream bank diversity (for example, undercut banks).
Simplified and hardened channel morphology (WPA lining).
Shorter stream length with fewer meanders.
Key Habitats Lack of high-quality riffles, deep pools, side channels, secondary channels, and off-channel and backwater habitats critical for spawning and rearing.
Fine Sediment High sediment loads smother spawning habitats (riffle gravels) and subsequent egg

DRAFT WILLAMETTE SUBBASIN PLAN
CH 3 ASSESSMENT.DOC 3-473
Table 3-167: Summary of Key Problems in Johnson Creek
Habitat Attribute Symptomatic Habitat Featuresincubation environment and fill pools, thus reducing the quality of depth refugia.
High silt cover reduces areas for macroinvertebrate production and subsequent foodsources.
Indirect effects of prolonged suspended sediments on native fish communities includereduced feeding, avoidance reactions, and delayed (or ceased) migrations.
Riparian and FloodplainCondition
Lack of native conifers and hardwoods as source wood limit the longevity and functionof wood in the creek.
Lack of overhanging vegetation along streambanks destabilizes the creek andminimizes potential protective cover to fish and wildlife.
Lack of mature native trees and shrubs increases the potential for elevated watertemperatures in the summer and limits the amount and type of future sources ofwoody debris.
Flow Low summer flows increase potential for elevated water temperatures and reducepotential habitat function (for example, depth refugia).
High storm flows in fall, winter, and spring.
Stream Temperature Elevated summer temperatures stress fish communities, resulting in lethal andsublethal effects.
Stream Connectivity Artificial obstructions impair juvenile migrations in Middle Johnson Creek, CrystalSprings Creek, and Kelley Creek.
Artificial obstructions at key tributary confluences limit adult and juvenile movement.
Chemical Contamination Chronic and acute chemical toxicity may result in lethal and/or sublethal effects toaquatic communities, including macroinvertebrate production.
EDT ApproachInformation Sources. Wherever possible, existing data were used to rate EDT attributes,and the use of expert opinion in rating attributes was minimized. Flow attributes were ratedusing USGS gauges and hydrology models. Habitat attributes were rated using an ODFWhabitat survey (ODFW, 2000). Water quality attributes were rated using City of PortlandBureau of Environmental Services monitoring data and USGS water quality investigations(Edwards, 1994). Biological attributes were rated using a Portland State University study ofmacroinvertebrates (Pan et al., 2001) and a collection of technical studies on Johnson Creek(Johnson Creek Corridor Committee, 1994).
The purpose of the EDT assessment of the Willamette River below Willamette Falls was toevaluate the affect of the lower Willamette River on Johnson Creek coho and steelheadpopulation productivity. One limitation in the EDT analysis of the lower Willamette Riverthat should be addressed in future work is the need to include additional habitat types andspecies rules to account for the complexity of the large river environment. EDT is based onthe existing scientific literature regarding salmonid-habitat relationships. The great bulk ofthat literature focuses on “wadeable” streams. Large-river habitats used by salmon have notbeen extensively studied not only because of the difficulties in studying these environments,but also because large rivers are often viewed as simple migration corridors, rather than
DRAFT WILLAMETTE SUBBASIN PLAN
3-474 CH 3 ASSESSMENT.DOC
complex spawning and rearing areas. Habitat types developed for smaller streams areinadequate to evaluate the habitat functions provided in large-river habitats. The complexityof the alluviating Willamette environment represents considerable habitat complexity andshould be included in future EDT analyses.
Scenario Development. Three scenarios were described to evaluate coho and steelheadproductivity in Johnson Creek Subbasin. The first describes the current conditions based onexisting empirical and expert knowledge regarding hydrology, water quality, physicalhabitat, and biological communities in Johnson Creek. The second scenario describes areference or template condition. This reference condition defines fully restored conditions inJohnson Creek, its tributaries, and the lower Willamette River, as they relate to salmonid lifehistory, spawning, and rearing. The third scenario describes a fully degraded condition forthe subbasin. Placing the current condition between the two “bookends” (that is, thereference condition and the fully degraded condition) allows evaluation of each populationand its reliance on basinwide protection and restoration measures (such as reducingsedimentation) and measures at specific areas (fish passage improvements, for example).
Reach Structure and Geographic Areas. Mainstem Johnson Creek, Kelley Creek, andCrystal Springs Creek were evaluated using EDT, and six smaller tributaries were evaluatedfor their cumulative importance in providing important habitat functions. The lowerWillamette River (from Willamette Falls downstream to the confluence with the ColumbiaRiver) also was evaluated for its effect on life-history diversity and juvenile rearing ofJohnson Creek salmon populations.
Stream reaches in the Johnson Creek Subbasin are coincident with those of the ODFWAquatic Inventory Project. Generally reaches are defined by functional characteristics such astributary confluences, changes in valley form and channel form, major changes in vegetation,and/or changes in land-use ownership (Moore et. al., 1997). In addition to these landscapeattributes, unique channel forms such as culverts and fish barriers were identified as uniquereaches so that each could be rated as to its potential impact on coho and steelheadproductivity. Table 3-168 shows the number of stream reaches per watershed in the JohnsonCreek Subbasin.
Table 3-168: Number of Stream Reaches in the Johnson Creek Subbasin
Subbasin NameTotal Number of Stream
Reaches EvaluatedNumber of Grouped Stream
Reaches
Johnson Creek (mainstem) 23 3
Crystal Springs Creek 4
Kelley Creek 2 (mainstem)3 tributaries
1
Johnson Creek Tributaries 6 1
Lower Willamette Mainstem 5 1
Mainstem Johnson Creek was further grouped into three geographic areas that reflectwatershed function and land-use. Kelley and Crystal Springs creeks were evaluated as

DRAFT WILLAMETTE SUBBASIN PLAN
CH 3 ASSESSMENT.DOC 3-475
individual subwatersheds draining the Johnson Creek Subbasin. Additional small tributarieswere evaluated as an entire habitat function, and the lower Willamette mainstem wasevaluated as an entire mainstem reach affecting salmonid productivity in the Johnson CreekSubbasin.
Lower Willamette River. The lower Willamette River reach includes five distinct river segments.From upstream to downstream they are Sellwood, Ross Island, Downtown, Harbor, andIndustrial.
Lower Johnson. Lower Johnson Creek begins at the Willamette confluence and extendsupstream to SE 82nd (5.56 river miles). Crystal Springs Creek enters mainstem JohnsonCreek near the downstream segment of the reach, and Errol Creek enters the mainstem justupstream of Tideman Johnson Park. Critical habitat features include the confluence ofJohnson Creek and the Willamette River.
Middle Johnson. Middle Johnson Creek begins at SE 82nd and extends upstream to theSpringwater Corridor bridge (trail), just upstream of Main City Park in Gresham (9.72 rivermiles). Veterans, Wahoo, Kelley, and Butler creeks enter the mainstem Johnson through thisreach.
Upper Johnson. Upper Johnson Creek begins at the Springwater Corridor bridge (trail), justupstream of Main City Park in Gresham and extends upstream through the headwaters (8.7river miles). Surface water draining agricultural lands provide source flows to JohnsonCreek. Hogan and McDonald creeks enter mainstem Johnson in this reach.
Kelley Creek. Kelley Creek enters Middle Johnson Creek and extends upstream to the northside of Kelley Creek Farms. The Kelley Creek subwatershed drains Mitchell, Clatsop, andChurch creeks.
Crystal Springs Creek. Crystal Springs reach begins at the confluence of Kelley and Johnsoncreeks and extends upstream to Reed College Lake.
Johnson Tributaries. Six tributaries were included in Johnson Creek Tributaries: Errol,Veterans, Wahoo, Butler, Hogan, and McDonald creeks.
EDT Results. EDT was used to assesses habitat in terms of four population outputparameters:
1. Biological capacity (quantity of habitat)2. Biological productivity (quality of habitat)3. Equilibrium abundance (quantity and quality of habitat)4. Life history diversity (breadth of suitable habitat)
Capacity and productivity are parameters of a Beverton-Holt production function; abundanceis calculated from this relationship. Life history diversity is listed as a Diversity Index that isthe percentage of viable trajectories sustainable under the current condition relative to thereference condition.
Population potential provides an assessment of the “size” and quality of the Johnson Creekcoho salmon population. Figure 3-78 compares the estimated current abundance potential tothe abundance potential of the habitat under the reference or template condition. Note that

DRAFT WILLAMETTE SUBBASIN PLAN
3-476 CH 3 ASSESSMENT.DOC
this is an index of habitat potential and that the actual abundance of fish observed in JohnsonCreek will vary greatly from year to year as a result of factors within and outside thesubbasin, especially variation in ocean conditions.
For the Johnson Creek coho salmon population, the current potential is about 6 percent ofthat under the reference habitat conditions. The percent change is a measure of the overalldegradation of habitat conditions in the Johnson Creek watershed, primarily as a result ofanthropogenic changes throughout the watershed and in the lower Willamette River.
Abundance
0
500
1,000
1,500
2,000
2,500
3,000
3,500
4,000
4,500
Johnson Coho 030404
Abu
ndan
ce
Figure 3-78: Estimated Coho Abundance Potential as a Function ofHabitat in the Current and Reference Conditions for the Johnson CreekCoho Population
Figure 3-79 provides an assessment of the “size” and quality of the Johnson Creek steelheadpopulation. For the Johnson Creek steelhead salmon population, the current potential is about4 percent of that under the reference habitat conditions.
Abundance
0
50
100
150
200
250
300
350
400
Johnson SH 030404
Abu
ndan
ce
Figure 3-79: Estimated Steelhead Abundance Potential as a Function ofHabitat in the Current and Reference Conditions for the Johnson CreekSteelhead Population
Geographic Area Habitat Priorities for Protection and Restoration. The results of theEDT reach analysis were aggregated to provide an estimate of the changes in the abundance,
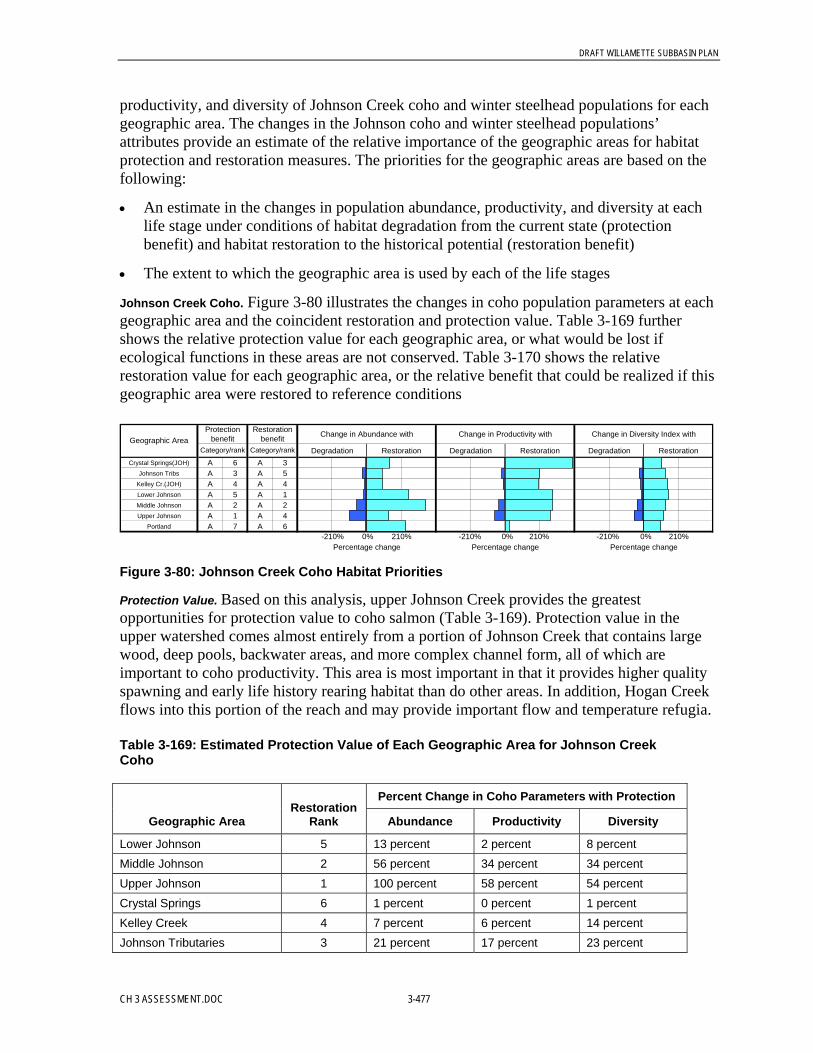
DRAFT WILLAMETTE SUBBASIN PLAN
CH 3 ASSESSMENT.DOC 3-477
productivity, and diversity of Johnson Creek coho and winter steelhead populations for eachgeographic area. The changes in the Johnson coho and winter steelhead populations’attributes provide an estimate of the relative importance of the geographic areas for habitatprotection and restoration measures. The priorities for the geographic areas are based on thefollowing:
• An estimate in the changes in population abundance, productivity, and diversity at eachlife stage under conditions of habitat degradation from the current state (protectionbenefit) and habitat restoration to the historical potential (restoration benefit)
• The extent to which the geographic area is used by each of the life stages
Johnson Creek Coho. Figure 3-80 illustrates the changes in coho population parameters at eachgeographic area and the coincident restoration and protection value. Table 3-169 furthershows the relative protection value for each geographic area, or what would be lost ifecological functions in these areas are not conserved. Table 3-170 shows the relativerestoration value for each geographic area, or the relative benefit that could be realized if thisgeographic area were restored to reference conditions
Degradation Restoration Degradation Restoration Degradation RestorationCrystal Springs(JOH) A 6 A 3
Johnson Tribs A 3 A 5Kelley Cr.(JOH) A 4 A 4Lower Johnson A 5 A 1Middle Johnson A 2 A 2Upper Johnson A 1 A 4
Portland A 7 A 6
Percentage change Percentage change Percentage change
Category/rank Category/rankGeographic Area
Change in Abundance with Change in Productivity with Change in Diversity Index withProtection benefit
Restoration benefit
-210% 0% 210% -210% 0% 210% -210% 0% 210%
Figure 3-80: Johnson Creek Coho Habitat Priorities
Protection Value. Based on this analysis, upper Johnson Creek provides the greatestopportunities for protection value to coho salmon (Table 3-169). Protection value in theupper watershed comes almost entirely from a portion of Johnson Creek that contains largewood, deep pools, backwater areas, and more complex channel form, all of which areimportant to coho productivity. This area is most important in that it provides higher qualityspawning and early life history rearing habitat than do other areas. In addition, Hogan Creekflows into this portion of the reach and may provide important flow and temperature refugia.
Table 3-169: Estimated Protection Value of Each Geographic Area for Johnson CreekCoho
Percent Change in Coho Parameters with Protection
Geographic AreaRestoration
Rank Abundance Productivity Diversity
Lower Johnson 5 13 percent 2 percent 8 percentMiddle Johnson 2 56 percent 34 percent 34 percentUpper Johnson 1 100 percent 58 percent 54 percentCrystal Springs 6 1 percent 0 percent 1 percentKelley Creek 4 7 percent 6 percent 14 percentJohnson Tributaries 3 21 percent 17 percent 23 percent
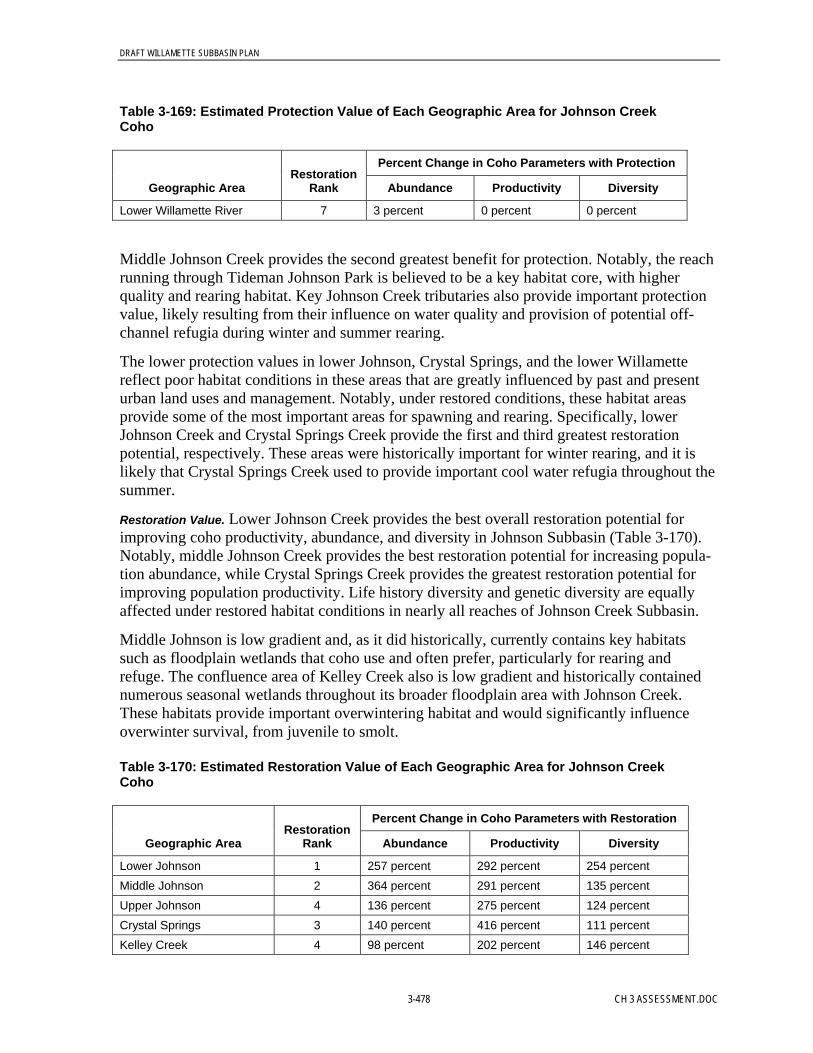
DRAFT WILLAMETTE SUBBASIN PLAN
3-478 CH 3 ASSESSMENT.DOC
Table 3-169: Estimated Protection Value of Each Geographic Area for Johnson CreekCoho
Percent Change in Coho Parameters with Protection
Geographic AreaRestoration
Rank Abundance Productivity Diversity
Lower Willamette River 7 3 percent 0 percent 0 percent
Middle Johnson Creek provides the second greatest benefit for protection. Notably, the reachrunning through Tideman Johnson Park is believed to be a key habitat core, with higherquality and rearing habitat. Key Johnson Creek tributaries also provide important protectionvalue, likely resulting from their influence on water quality and provision of potential off-channel refugia during winter and summer rearing.
The lower protection values in lower Johnson, Crystal Springs, and the lower Willamettereflect poor habitat conditions in these areas that are greatly influenced by past and presenturban land uses and management. Notably, under restored conditions, these habitat areasprovide some of the most important areas for spawning and rearing. Specifically, lowerJohnson Creek and Crystal Springs Creek provide the first and third greatest restorationpotential, respectively. These areas were historically important for winter rearing, and it islikely that Crystal Springs Creek used to provide important cool water refugia throughout thesummer.
Restoration Value. Lower Johnson Creek provides the best overall restoration potential forimproving coho productivity, abundance, and diversity in Johnson Subbasin (Table 3-170).Notably, middle Johnson Creek provides the best restoration potential for increasing popula-tion abundance, while Crystal Springs Creek provides the greatest restoration potential forimproving population productivity. Life history diversity and genetic diversity are equallyaffected under restored habitat conditions in nearly all reaches of Johnson Creek Subbasin.
Middle Johnson is low gradient and, as it did historically, currently contains key habitatssuch as floodplain wetlands that coho use and often prefer, particularly for rearing andrefuge. The confluence area of Kelley Creek also is low gradient and historically containednumerous seasonal wetlands throughout its broader floodplain area with Johnson Creek.These habitats provide important overwintering habitat and would significantly influenceoverwinter survival, from juvenile to smolt.
Table 3-170: Estimated Restoration Value of Each Geographic Area for Johnson CreekCoho
Percent Change in Coho Parameters with Restoration
Geographic AreaRestoration
Rank Abundance Productivity Diversity
Lower Johnson 1 257 percent 292 percent 254 percentMiddle Johnson 2 364 percent 291 percent 135 percentUpper Johnson 4 136 percent 275 percent 124 percentCrystal Springs 3 140 percent 416 percent 111 percentKelley Creek 4 98 percent 202 percent 146 percent

DRAFT WILLAMETTE SUBBASIN PLAN
CH 3 ASSESSMENT.DOC 3-479
Table 3-170: Estimated Restoration Value of Each Geographic Area for Johnson CreekCoho
Percent Change in Coho Parameters with Restoration
Geographic AreaRestoration
Rank Abundance Productivity Diversity
Johnson Tributaries 5 94 percent 212 percent 131 percentLower Willamette River 6 240 percent 23 percent 105 percent
Johnson Creek Steelhead. Figure 3-81 illustrates the changes in steelhead populationparameters at each geographic area and the coincident restoration and protection value.Table 3-171 further shows the relative protection value for each geographic area, or whatwould be lost if ecological functions in these areas are not conserved. Table 3-172 shows therelative restoration value for each geographic area, or the relative benefit that could berealized if this geographic area were restored to reference conditions.
Degradation Restoration Degradation Restoration Degradation RestorationCrystal Springs(JOH) A 6 A 4
Johnson Tribs A 2 A 6Kelley Cr.(JOH) A 5 A 3Lower Johnson A 3 A 1Middle Johnson A 4 A 2Upper Johnson A 1 A 5
Portland A 7 A 7
Percentage change Percentage change Percentage change
Category/rank Category/rankGeographic Area
Change in Abundance with Change in Productivity with Change in Diversity Index withProtection benefit
Restoration benefit
-280% 0% 280% -280% 0% 280% -280% 0% 280%
Figure 3-81: Johnson Creek Steelhead Habitat Priorities
Protection Value. Based on this analysis, upper Johnson Creek provides the greatestopportunities for protection value to steelhead (Table 3-171). Protection value in the upperwatershed comes almost entirely from a portion of Johnson Creek (Reach 16) that containslarge wood, deep pools, complex channel forms, and good substrate composition, all ofwhich provide important spawning and rearing areas. In addition, Hogan Creek flows intothis portion of the reach and may provide important flow and temperature refugia, and thisportion of the creek has good shade cover. Notably, Reach 16 (which bounds the downstreamend of upper Johnson Creek) contains the greatest refuge potential and is the most naturaland least disturbed area in mainstem Johnson Creek (ODFW, 2000).
Table 3-171: Estimated Protection Value of Each Geographic Area for Johnson CreekSteelhead
Percent Change in Steelhead Parameters with Protection
Geographic AreaProtection
Rank Abundance Productivity Diversity
Lower Johnson 3 36 percent 5 percent 4 percentMiddle Johnson 4 19 percent 3 percent 6 percentUpper Johnson 1 100 percent 92 percent 83 percentCrystal Springs 6 0 percent 0 percent 0 percentKelley Creek 5 4 percent 2 percent 13 percentJohnson Tributaries 2 8 percent 7 percent 13 percent
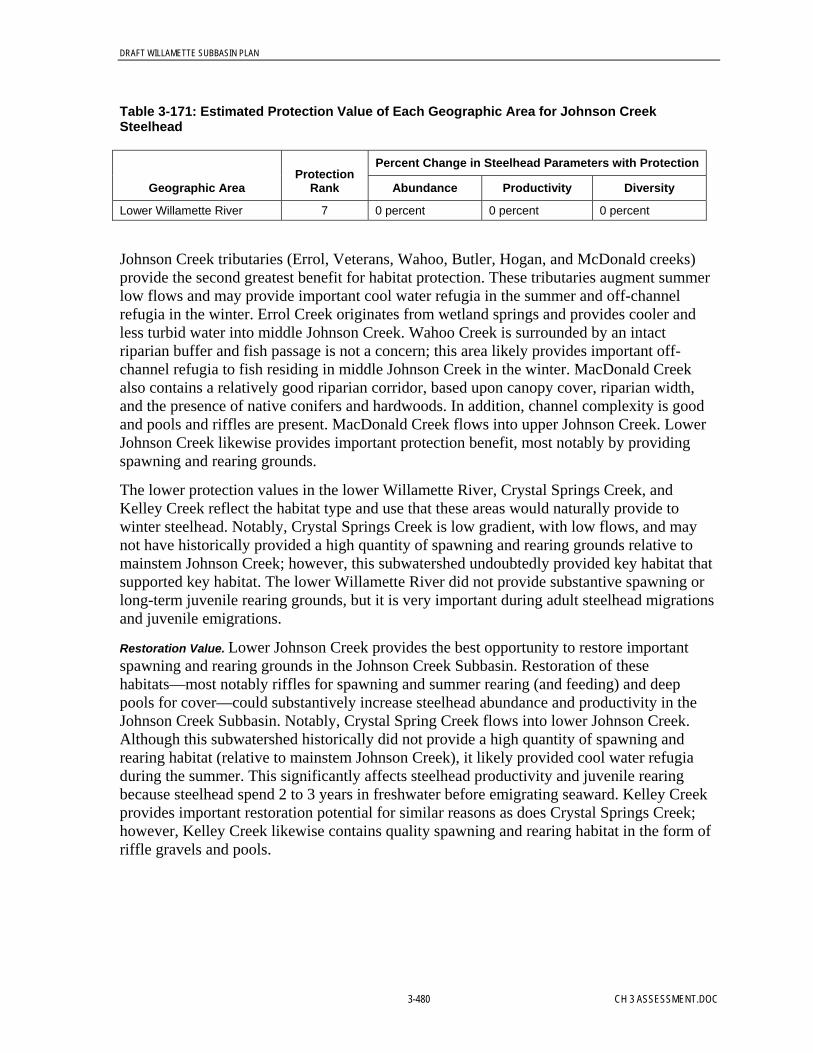
DRAFT WILLAMETTE SUBBASIN PLAN
3-480 CH 3 ASSESSMENT.DOC
Table 3-171: Estimated Protection Value of Each Geographic Area for Johnson CreekSteelhead
Percent Change in Steelhead Parameters with Protection
Geographic AreaProtection
Rank Abundance Productivity Diversity
Lower Willamette River 7 0 percent 0 percent 0 percent
Johnson Creek tributaries (Errol, Veterans, Wahoo, Butler, Hogan, and McDonald creeks)provide the second greatest benefit for habitat protection. These tributaries augment summerlow flows and may provide important cool water refugia in the summer and off-channelrefugia in the winter. Errol Creek originates from wetland springs and provides cooler andless turbid water into middle Johnson Creek. Wahoo Creek is surrounded by an intactriparian buffer and fish passage is not a concern; this area likely provides important off-channel refugia to fish residing in middle Johnson Creek in the winter. MacDonald Creekalso contains a relatively good riparian corridor, based upon canopy cover, riparian width,and the presence of native conifers and hardwoods. In addition, channel complexity is goodand pools and riffles are present. MacDonald Creek flows into upper Johnson Creek. LowerJohnson Creek likewise provides important protection benefit, most notably by providingspawning and rearing grounds.
The lower protection values in the lower Willamette River, Crystal Springs Creek, andKelley Creek reflect the habitat type and use that these areas would naturally provide towinter steelhead. Notably, Crystal Springs Creek is low gradient, with low flows, and maynot have historically provided a high quantity of spawning and rearing grounds relative tomainstem Johnson Creek; however, this subwatershed undoubtedly provided key habitat thatsupported key habitat. The lower Willamette River did not provide substantive spawning orlong-term juvenile rearing grounds, but it is very important during adult steelhead migrationsand juvenile emigrations.
Restoration Value. Lower Johnson Creek provides the best opportunity to restore importantspawning and rearing grounds in the Johnson Creek Subbasin. Restoration of thesehabitats—most notably riffles for spawning and summer rearing (and feeding) and deeppools for cover—could substantively increase steelhead abundance and productivity in theJohnson Creek Subbasin. Notably, Crystal Spring Creek flows into lower Johnson Creek.Although this subwatershed historically did not provide a high quantity of spawning andrearing habitat (relative to mainstem Johnson Creek), it likely provided cool water refugiaduring the summer. This significantly affects steelhead productivity and juvenile rearingbecause steelhead spend 2 to 3 years in freshwater before emigrating seaward. Kelley Creekprovides important restoration potential for similar reasons as does Crystal Springs Creek;however, Kelley Creek likewise contains quality spawning and rearing habitat in the form ofriffle gravels and pools.
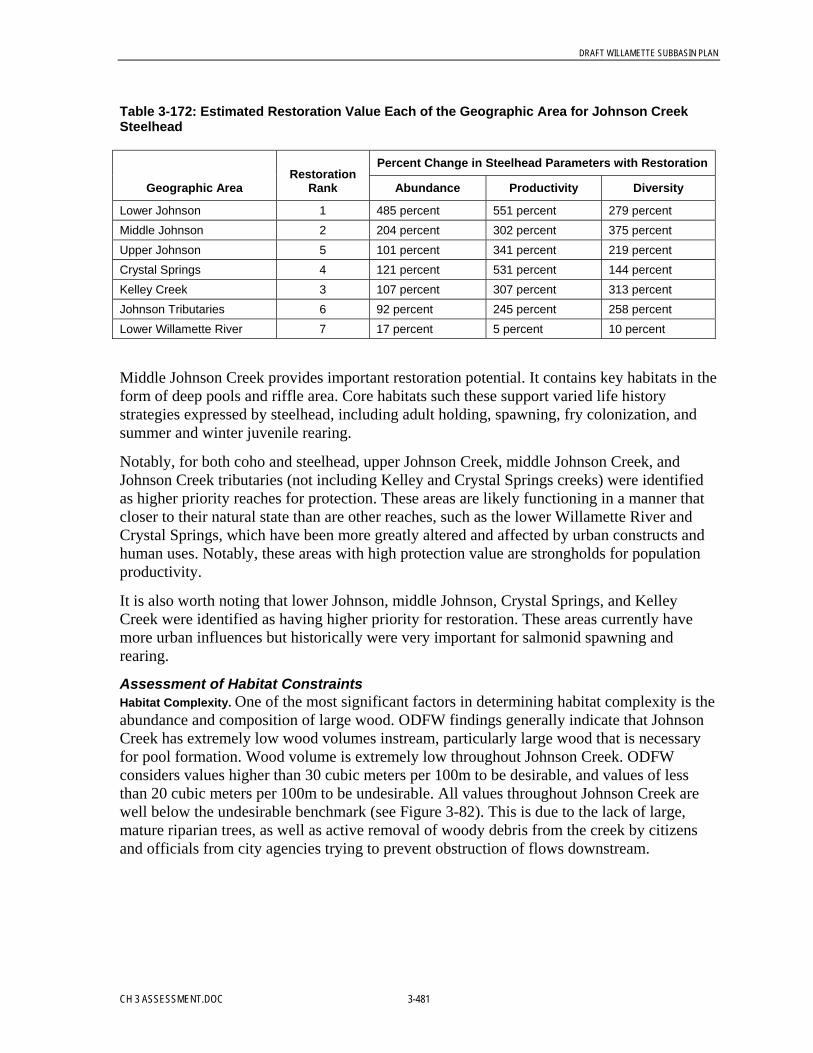
DRAFT WILLAMETTE SUBBASIN PLAN
CH 3 ASSESSMENT.DOC 3-481
Table 3-172: Estimated Restoration Value Each of the Geographic Area for Johnson CreekSteelhead
Percent Change in Steelhead Parameters with Restoration
Geographic AreaRestoration
Rank Abundance Productivity Diversity
Lower Johnson 1 485 percent 551 percent 279 percentMiddle Johnson 2 204 percent 302 percent 375 percentUpper Johnson 5 101 percent 341 percent 219 percentCrystal Springs 4 121 percent 531 percent 144 percentKelley Creek 3 107 percent 307 percent 313 percentJohnson Tributaries 6 92 percent 245 percent 258 percentLower Willamette River 7 17 percent 5 percent 10 percent
Middle Johnson Creek provides important restoration potential. It contains key habitats in theform of deep pools and riffle area. Core habitats such these support varied life historystrategies expressed by steelhead, including adult holding, spawning, fry colonization, andsummer and winter juvenile rearing.
Notably, for both coho and steelhead, upper Johnson Creek, middle Johnson Creek, andJohnson Creek tributaries (not including Kelley and Crystal Springs creeks) were identifiedas higher priority reaches for protection. These areas are likely functioning in a manner thatcloser to their natural state than are other reaches, such as the lower Willamette River andCrystal Springs, which have been more greatly altered and affected by urban constructs andhuman uses. Notably, these areas with high protection value are strongholds for populationproductivity.
It is also worth noting that lower Johnson, middle Johnson, Crystal Springs, and KelleyCreek were identified as having higher priority for restoration. These areas currently havemore urban influences but historically were very important for salmonid spawning andrearing.
Assessment of Habitat ConstraintsHabitat Complexity. One of the most significant factors in determining habitat complexity is theabundance and composition of large wood. ODFW findings generally indicate that JohnsonCreek has extremely low wood volumes instream, particularly large wood that is necessaryfor pool formation. Wood volume is extremely low throughout Johnson Creek. ODFWconsiders values higher than 30 cubic meters per 100m to be desirable, and values of lessthan 20 cubic meters per 100m to be undesirable. All values throughout Johnson Creek arewell below the undesirable benchmark (see Figure 3-82). This is due to the lack of large,mature riparian trees, as well as active removal of woody debris from the creek by citizensand officials from city agencies trying to prevent obstruction of flows downstream.
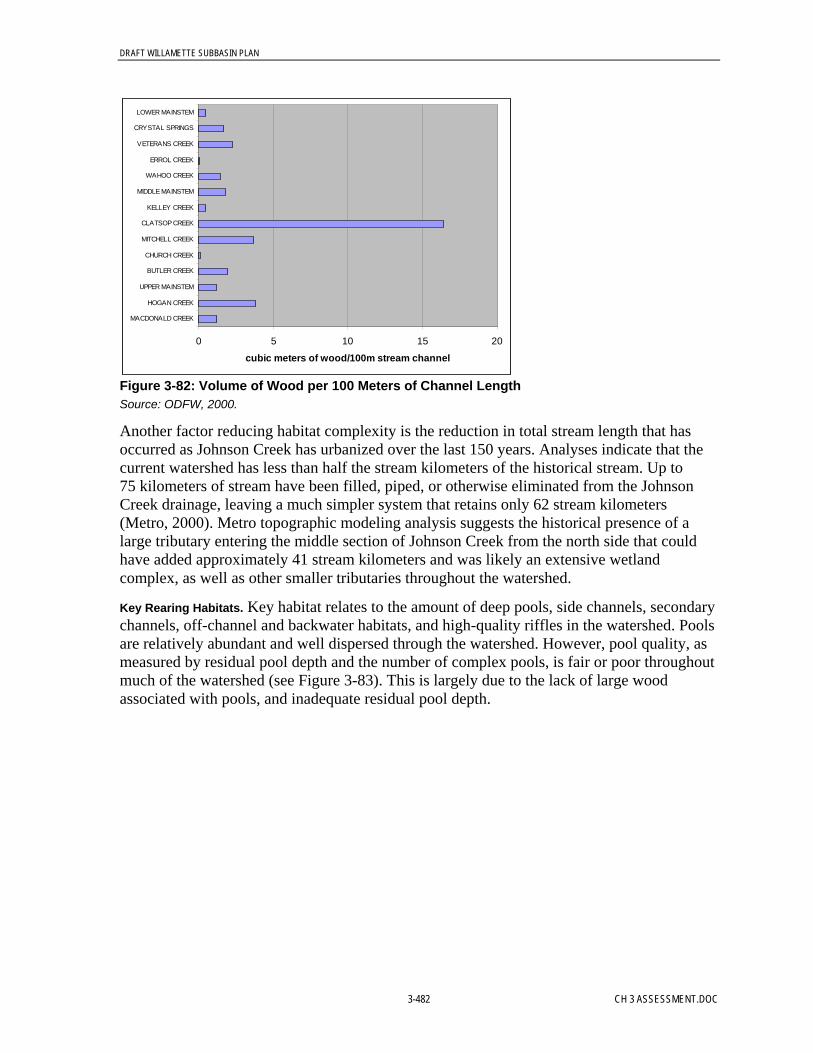
DRAFT WILLAMETTE SUBBASIN PLAN
3-482 CH 3 ASSESSMENT.DOC
0 5 10 15 20
MACDONALD CREEK
HOGAN CREEK
UPPER MAINSTEM
BUTLER CREEK
CHURCH CREEK
MITCHELL CREEK
CLATSOP CREEK
KELLEY CREEK
MIDDLE MAINSTEM
WAHOO CREEK
ERROL CREEK
VETERANS CREEK
CRYSTAL SPRINGS
LOWER MAINSTEM
cubic meters of wood/100m stream channel
Figure 3-82: Volume of Wood per 100 Meters of Channel LengthSource: ODFW, 2000.
Another factor reducing habitat complexity is the reduction in total stream length that hasoccurred as Johnson Creek has urbanized over the last 150 years. Analyses indicate that thecurrent watershed has less than half the stream kilometers of the historical stream. Up to75 kilometers of stream have been filled, piped, or otherwise eliminated from the JohnsonCreek drainage, leaving a much simpler system that retains only 62 stream kilometers(Metro, 2000). Metro topographic modeling analysis suggests the historical presence of alarge tributary entering the middle section of Johnson Creek from the north side that couldhave added approximately 41 stream kilometers and was likely an extensive wetlandcomplex, as well as other smaller tributaries throughout the watershed.
Key Rearing Habitats. Key habitat relates to the amount of deep pools, side channels, secondarychannels, off-channel and backwater habitats, and high-quality riffles in the watershed. Poolsare relatively abundant and well dispersed through the watershed. However, pool quality, asmeasured by residual pool depth and the number of complex pools, is fair or poor throughoutmuch of the watershed (see Figure 3-83). This is largely due to the lack of large woodassociated with pools, and inadequate residual pool depth.
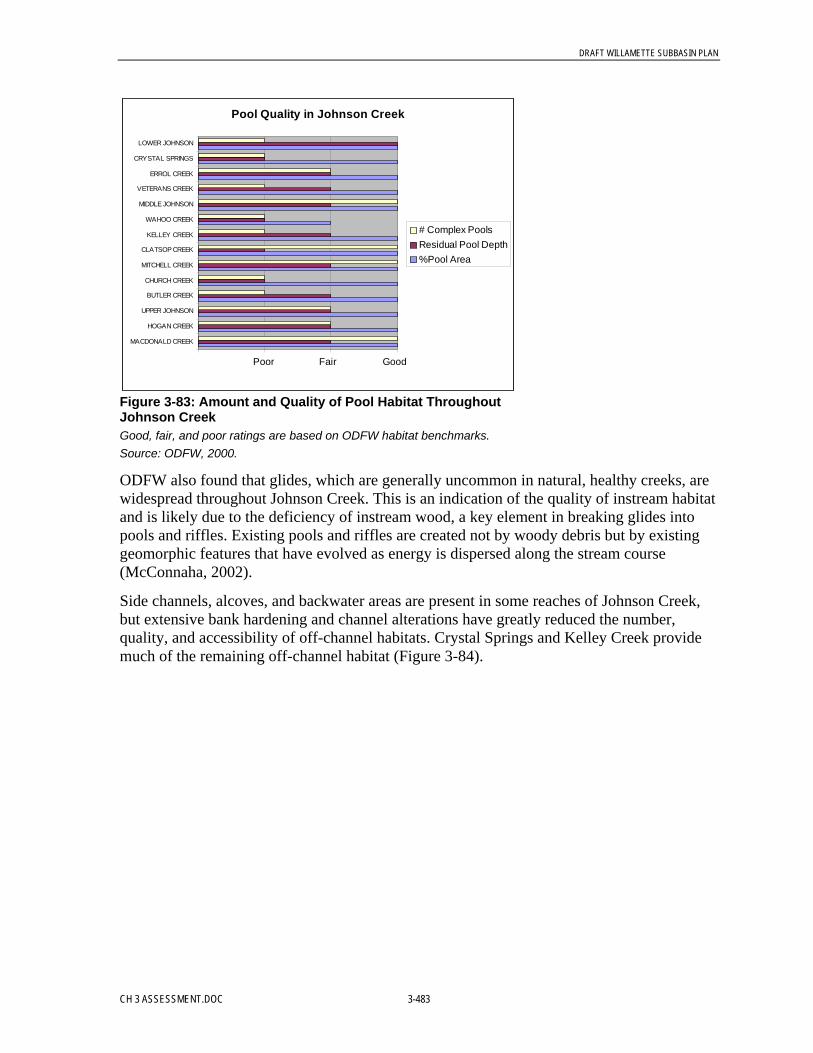
DRAFT WILLAMETTE SUBBASIN PLAN
CH 3 ASSESSMENT.DOC 3-483
Pool Quality in Johnson Creek
MACDONALD CREEK
HOGAN CREEK
UPPER JOHNSON
BUTLER CREEK
CHURCH CREEK
MITCHELL CREEK
CLATSOP CREEK
KELLEY CREEK
WAHOO CREEK
MIDDLE JOHNSON
VETERANS CREEK
ERROL CREEK
CRYSTAL SPRINGS
LOWER JOHNSON
# Complex PoolsResidual Pool Depth%Pool Area
Fair GoodPoor
Figure 3-83: Amount and Quality of Pool Habitat ThroughoutJohnson CreekGood, fair, and poor ratings are based on ODFW habitat benchmarks.Source: ODFW, 2000.
ODFW also found that glides, which are generally uncommon in natural, healthy creeks, arewidespread throughout Johnson Creek. This is an indication of the quality of instream habitatand is likely due to the deficiency of instream wood, a key element in breaking glides intopools and riffles. Existing pools and riffles are created not by woody debris but by existinggeomorphic features that have evolved as energy is dispersed along the stream course(McConnaha, 2002).
Side channels, alcoves, and backwater areas are present in some reaches of Johnson Creek,but extensive bank hardening and channel alterations have greatly reduced the number,quality, and accessibility of off-channel habitats. Crystal Springs and Kelley Creek providemuch of the remaining off-channel habitat (Figure 3-84).

DRAFT WILLAMETTE SUBBASIN PLAN
3-484 CH 3 ASSESSMENT.DOC
Percentage of Subwatershed that is Off-Channel Habitat
0.00% 5.00% 10.00% 15.00% 20.00% 25.00% 30.00%
MACDONALD CREEK
HOGAN CREEK
UPPER MAINSTEM
BUTLER CREEK
CHURCH CREEK
MITCHELL CREEK
CLATSOP CREEK
KELLEY CREEK
MIDDLE MAINSTEM
WAHOO CREEK
ERROL CREEK
VETERANS CREEK
CRYSTAL SPRINGS
LOWER MAINSTEM
Total Amount of Off-Channel Habitat in Each Subwatershed
0 5000 10000 15000 20000
MACDONALD CREEK
HOGAN CREEK
UPPER MAINSTEM
BUTLER CREEK
CHURCH CREEK
MITCHELL CREEK
CLATSOP CREEK
KELLEY CREEK
MIDDLE MAINSTEM
WAHOO CREEK
ERROL CREEK
VETERANS CREEK
CRYSTAL SPRINGS
LOWER MAINSTEM
square meters of off-channel habitat
Figure 3-84: Percentage of Each Subwatershed That Is Off-Channel Habitat (Right) and TotalAmount of Off-Channel Habitat That Each Subwatershed Provides (Left)Crystal Springs and Kelley Creek provide much of the off-channel habitat in Johnson Creek.Source: ODFW, 2000
Riffles make up 18 percent of the overall habitat throughout Johnson Creek and itstributaries, an amount that is moderately low for fish-bearing streams. Spawning and rearinggrounds may be a limiting factor affecting population abundance and species diversity.However, riffle quality (substrate composition and proportion of fine sediments) is moderateto poor. Most of the tributaries have at least 50 percent riffle habitats with more than35 percent gravel composition (see Figure 3-85)—considered optimal for fish-bearinghabitat—while the mainstem has less than 50 percent meeting this benchmark. However, theproportion of substrate and gravels covered or embedded with fine sediments and organics ishigh basinwide, as described below.
0% 20% 40% 60% 80% 100%
MACDONALD CREEKHOGAN CREEK
UPPER MAINSTEMBUTLER CREEKCHURCH CREEK
MITCHELL CREEKCLATSOP CREEK
KELLEY CREEKMIDDLE MAINSTEM
WAHOO CREEKERROL CREEK
VETERANS CREEKCRYSTAL SPRINGSLOWER MAINSTEM
Percent Gravels in Johnson Creek Riffles
% Area w/ Gravel>=35% >=15 and <35% <15%
Figure 3-85: Percentage of Riffle Area in Johnson Creek Where GravelIs Below 35 PercentSource: ODFW, 2000.
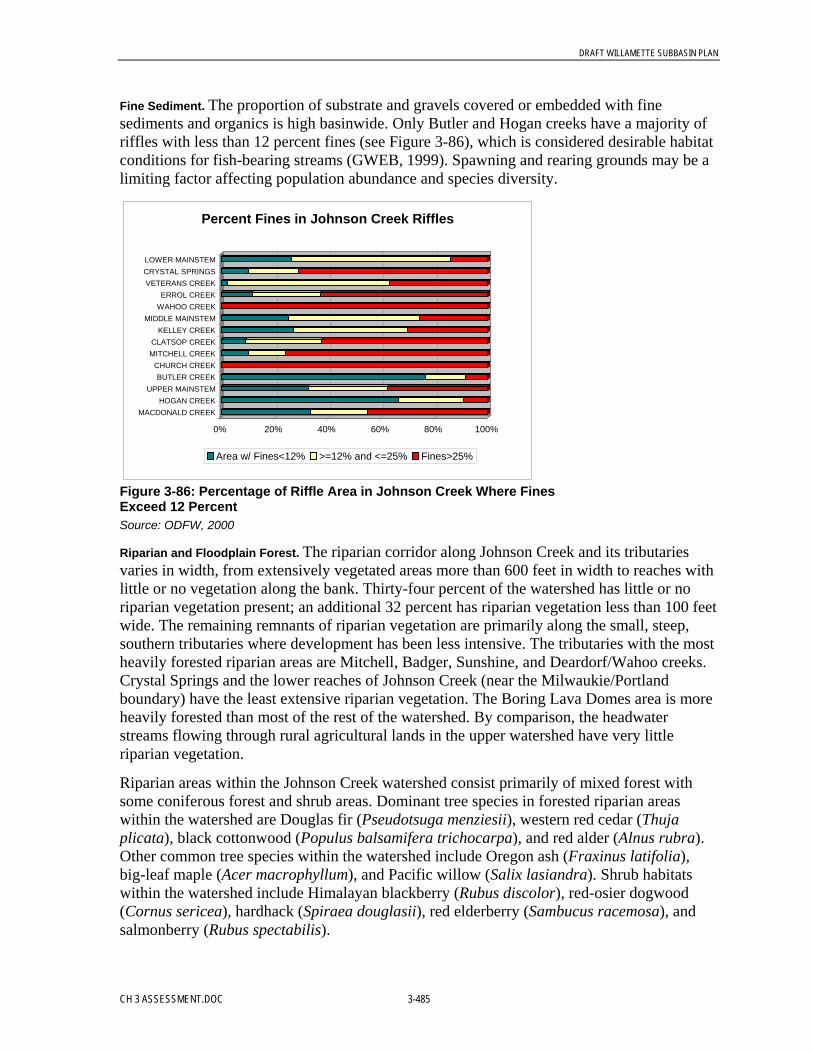
DRAFT WILLAMETTE SUBBASIN PLAN
CH 3 ASSESSMENT.DOC 3-485
Fine Sediment. The proportion of substrate and gravels covered or embedded with finesediments and organics is high basinwide. Only Butler and Hogan creeks have a majority ofriffles with less than 12 percent fines (see Figure 3-86), which is considered desirable habitatconditions for fish-bearing streams (GWEB, 1999). Spawning and rearing grounds may be alimiting factor affecting population abundance and species diversity.
0% 20% 40% 60% 80% 100%
MACDONALD CREEKHOGAN CREEK
UPPER MAINSTEMBUTLER CREEK
CHURCH CREEKMITCHELL CREEKCLATSOP CREEK
KELLEY CREEKMIDDLE MAINSTEM
WAHOO CREEKERROL CREEK
VETERANS CREEKCRYSTAL SPRINGSLOWER MAINSTEM
Percent Fines in Johnson Creek Riffles
Area w/ Fines<12% >=12% and <=25% Fines>25%
Figure 3-86: Percentage of Riffle Area in Johnson Creek Where FinesExceed 12 PercentSource: ODFW, 2000
Riparian and Floodplain Forest. The riparian corridor along Johnson Creek and its tributariesvaries in width, from extensively vegetated areas more than 600 feet in width to reaches withlittle or no vegetation along the bank. Thirty-four percent of the watershed has little or noriparian vegetation present; an additional 32 percent has riparian vegetation less than 100 feetwide. The remaining remnants of riparian vegetation are primarily along the small, steep,southern tributaries where development has been less intensive. The tributaries with the mostheavily forested riparian areas are Mitchell, Badger, Sunshine, and Deardorf/Wahoo creeks.Crystal Springs and the lower reaches of Johnson Creek (near the Milwaukie/Portlandboundary) have the least extensive riparian vegetation. The Boring Lava Domes area is moreheavily forested than most of the rest of the watershed. By comparison, the headwaterstreams flowing through rural agricultural lands in the upper watershed have very littleriparian vegetation.
Riparian areas within the Johnson Creek watershed consist primarily of mixed forest withsome coniferous forest and shrub areas. Dominant tree species in forested riparian areaswithin the watershed are Douglas fir (Pseudotsuga menziesii), western red cedar (Thujaplicata), black cottonwood (Populus balsamifera trichocarpa), and red alder (Alnus rubra).Other common tree species within the watershed include Oregon ash (Fraxinus latifolia),big-leaf maple (Acer macrophyllum), and Pacific willow (Salix lasiandra). Shrub habitatswithin the watershed include Himalayan blackberry (Rubus discolor), red-osier dogwood(Cornus sericea), hardhack (Spiraea douglasii), red elderberry (Sambucus racemosa), andsalmonberry (Rubus spectabilis).

DRAFT WILLAMETTE SUBBASIN PLAN
3-486 CH 3 ASSESSMENT.DOC
Flow. Seasonal patterns of flow in Johnson Creek reflect patterns of rainfall. High flows occurin December, January, and February in response to abundant rainfall and high amounts ofrunoff as soils become saturated through the rainy season. Summer low flows in July,August, and September reflect groundwater contributions to stream flow throughout thewatershed.
High Flow Regime. Statistical evaluation of flow since 1940 indicates some increase in theflashiness of peak flows over the period of record. While increases in absolute peak flows arenot evident, the amount of rainfall needed to produce a peak flow has decreased over time(Clark, 1999). Currently approximately 23 percent of the watershed is covered by impervioussurfaces, which may be a key reason why high flows have become flashier.
Significant impacts on peak flows in Johnson Creek also appear to be affected by alterationsin the stream channel and floodplain that have diminished the ability of the creek andfloodplain to accommodate flood flows. Because of channel alterations, the historicalfloodplain of Johnson Creek is minimally accessible or inaccessible to creek waters throughmuch of its length. The lack of floodplain access means that flood flows cannot spread outand slow down on the floodplain; instead they are directed and concentrated into the mainchannel, increasing scour and degrading instream habitat.
Low Flow Regime. Flow monitoring in Johnson Creek indicates that low flow conditions inJohnson Creek may adversely affect aquatic life. ODFW has set minimum flow targets toprotect salmonids in Johnson Creek (Meross, 2000). Flows in the middle and upperwatershed frequently do not meet those minimum flows, particularly in spring and summermonths (see Figure 3-87). Below Crystal Springs, which provides consistent and abundantgroundwater flows, minimum instream flows are typically met.
Percentage of Average Daily Flows that do not meet Instream Targets
0
20
40
60
80
100
Jan
Feb Mar AprMay Ju
n Jul
AugSep
tOct
Nov Dec
Perc
enta
ge MilportSycamoreRegnor
Figure 3-87: Percentage of the Average Daily Flow at the Milport,Sycamore, and Regnor Gauges That Do Not Meet ODFW Flow TargetsSource: USGS flow gauge data.
Stream Temperature. Numerous investigations of temperature in Johnson Creek over the yearshave consistently indicated that elevated temperatures are a problem throughout thewatershed. Temperatures throughout Johnson Creek exceed water quality standards duringthe summer months (see Figure 3-88). Temperatures begin to exceed the spawning andincubation standard in April, although data are lacking to determine whether eggs and fry are
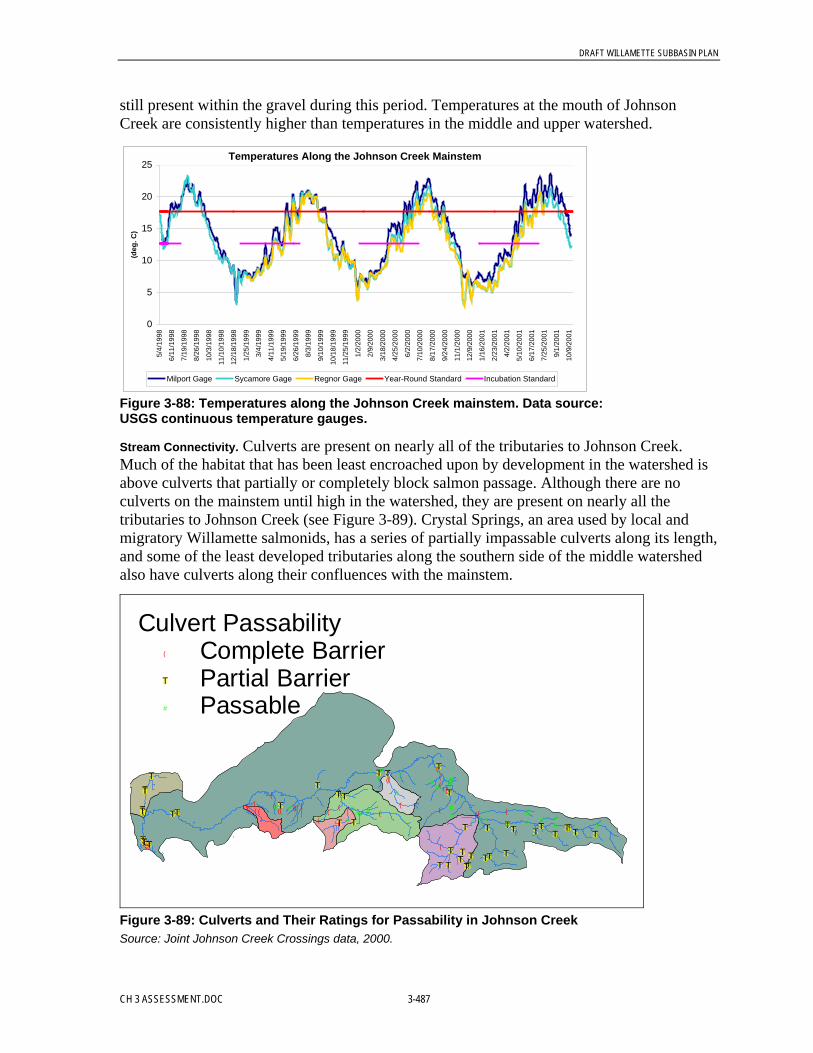
DRAFT WILLAMETTE SUBBASIN PLAN
CH 3 ASSESSMENT.DOC 3-487
still present within the gravel during this period. Temperatures at the mouth of JohnsonCreek are consistently higher than temperatures in the middle and upper watershed.
Temperatures Along the Johnson Creek Mainstem
0
5
10
15
20
255/
4/19
98
6/11
/199
8
7/19
/199
8
8/26
/199
8
10/3
/199
8
11/1
0/19
98
12/1
8/19
98
1/25
/199
9
3/4/
1999
4/11
/199
9
5/19
/199
9
6/26
/199
9
8/3/
1999
9/10
/199
9
10/1
8/19
99
11/2
5/19
99
1/2/
2000
2/9/
2000
3/18
/200
0
4/25
/200
0
6/2/
2000
7/10
/200
0
8/17
/200
0
9/24
/200
0
11/1
/200
0
12/9
/200
0
1/16
/200
1
2/23
/200
1
4/2/
2001
5/10
/200
1
6/17
/200
1
7/25
/200
1
9/1/
2001
10/9
/200
1
(deg
. C)
Milport Gage Sycamore Gage Regnor Gage Year-Round Standard Incubation Standard
Figure 3-88: Temperatures along the Johnson Creek mainstem. Data source:USGS continuous temperature gauges.
Stream Connectivity. Culverts are present on nearly all of the tributaries to Johnson Creek.Much of the habitat that has been least encroached upon by development in the watershed isabove culverts that partially or completely block salmon passage. Although there are noculverts on the mainstem until high in the watershed, they are present on nearly all thetributaries to Johnson Creek (see Figure 3-89). Crystal Springs, an area used by local andmigratory Willamette salmonids, has a series of partially impassable culverts along its length,and some of the least developed tributaries along the southern side of the middle watershedalso have culverts along their confluences with the mainstem.
$T
(
$T$T
$T$T$T
$T$T($T
$T$T$T $T $T
$T $T
$T
$T$T$T
$T $T$T
$T
$T($T
(
#(
( # #$T
# ($T
#
$T$T($T(((($T($T(
####
#
( #( ##
#(
#( ##(#
###(
##
##
###
(
(# #
$T
$T
$T$T$T
$T$T ((( ( ((
( ($T(
$T# ((( #$T((
(
$T
($T
#(
####
Culvert Passability( Complete Barrier$T Partial Barrier# Passable
Figure 3-89: Culverts and Their Ratings for Passability in Johnson CreekSource: Joint Johnson Creek Crossings data, 2000.
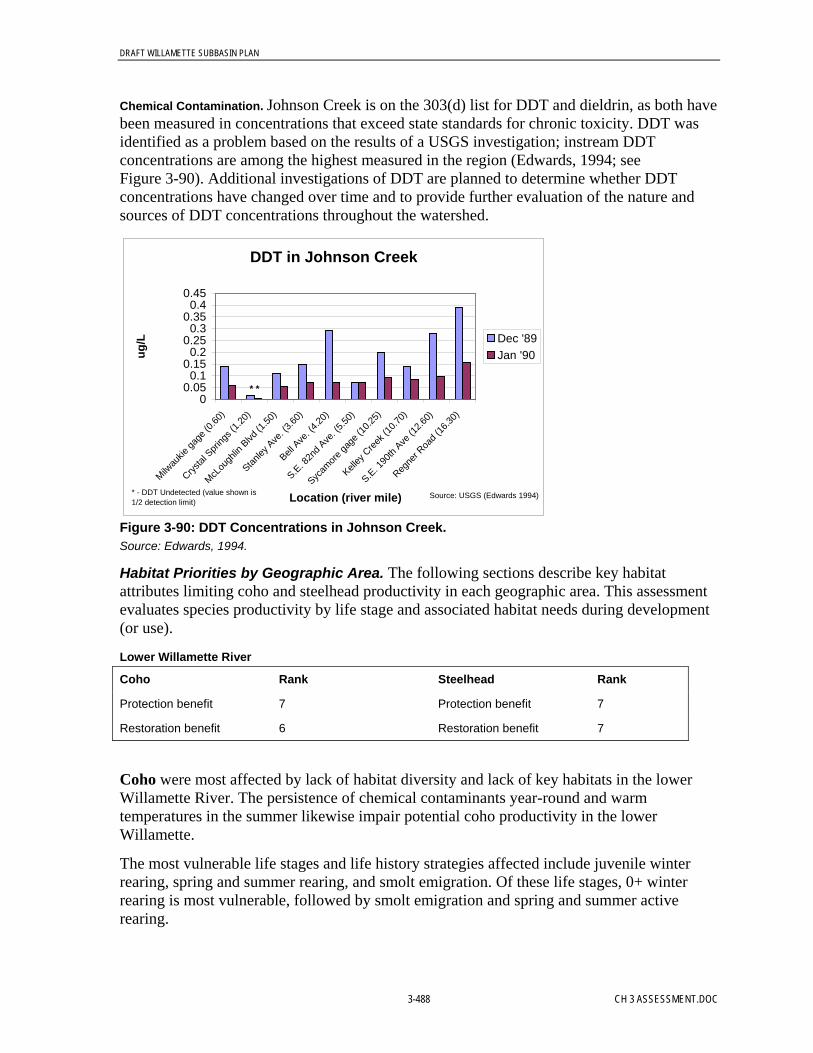
DRAFT WILLAMETTE SUBBASIN PLAN
3-488 CH 3 ASSESSMENT.DOC
Chemical Contamination. Johnson Creek is on the 303(d) list for DDT and dieldrin, as both havebeen measured in concentrations that exceed state standards for chronic toxicity. DDT wasidentified as a problem based on the results of a USGS investigation; instream DDTconcentrations are among the highest measured in the region (Edwards, 1994; seeFigure 3-90). Additional investigations of DDT are planned to determine whether DDTconcentrations have changed over time and to provide further evaluation of the nature andsources of DDT concentrations throughout the watershed.
DDT in Johnson Creek
00.05
0.10.15
0.20.25
0.30.35
0.40.45
Milwau
kie ga
ge (0
.60)
Crystal
Spring
s (1.2
0)
McLou
ghlin
Blvd
(1.50
)
Stanley
Ave. (3
.60)
Bell A
ve. (4
.20)
S.E. 8
2nd A
ve. (5
.50)
Sycam
ore ga
ge (1
0.25)
Kelley
Cree
k (10
.70)
S.E. 1
90th
Ave (1
2.60)
Regne
r Roa
d (16
.30)
Location (river mile)
ug/L Dec '89
Jan '90
* *
* - DDT Undetected (value shown is 1/2 detection limit)
Source: USGS (Edwards 1994)
Figure 3-90: DDT Concentrations in Johnson Creek.Source: Edwards, 1994.
Habitat Priorities by Geographic Area. The following sections describe key habitatattributes limiting coho and steelhead productivity in each geographic area. This assessmentevaluates species productivity by life stage and associated habitat needs during development(or use).
Lower Willamette River
Coho Rank Steelhead Rank
Protection benefit 7 Protection benefit 7
Restoration benefit 6 Restoration benefit 7
Coho were most affected by lack of habitat diversity and lack of key habitats in the lowerWillamette River. The persistence of chemical contaminants year-round and warmtemperatures in the summer likewise impair potential coho productivity in the lowerWillamette.
The most vulnerable life stages and life history strategies affected include juvenile winterrearing, spring and summer rearing, and smolt emigration. Of these life stages, 0+ winterrearing is most vulnerable, followed by smolt emigration and spring and summer activerearing.

DRAFT WILLAMETTE SUBBASIN PLAN
CH 3 ASSESSMENT.DOC 3-489
Juvenile Rearing (winter). Lack of shallow, low-velocity shoreline habitats (key habitats) andlack of complex shoreline structure and cover such as overhanging vegetation, large wood,and large substratum (habitat diversity) most prominently affect overwintering rearing andrefuge habitat in the lower Willamette River. The lack of these critical overwintering habitatsposes the greatest risk to successful coho production. The presence of chemicals, particularlythose in close to shoreline and alcove areas, pose a potential risk to coho throughout thewinter.
Active Rearing. As for juvenile overwintering, coho rely on shallow, slack-water habitats withcomplex shoreline structure and protective cover during the spring to rear and feed. Theseoff-channel, shoreline, and alcove habitats provide areas where coho can feed and grow asthey physiologically mature and smolt. Without these habitats, juvenile coho may move intothe lower Columbia River at a smaller size, before they are physiologically ready to rear insaltwater environs. As result, juveniles may be more vulnerable to predators and may be at adisadvantage for surviving in the ocean.
Smolt Emigration. During emigration, coho smolts are most prominently affected by chemicalcontaminants and lack of key habitats. Although off-channel or marginal shoreline habitatsremain important, once juvenile coho begin emigrating, moving out of the overwinteringhabitats and actively moving through the lower mainstem channel, they become less relianton key habitat areas, thus becoming more sensitive to other environmental conditions thataffect there ability to move downstream. In the lower Willamette, chemical contaminationposes a great risk to coho as they emigrate seaward to the lower Columbia estuary.
Steelhead were most affected by chemicals and lack of key habitats in the lower WillametteRiver. The most vulnerable life stages and life history strategies affected include smoltemigration and prespawning adult migrations.
Smolt Emigration. Steelhead migrants are most prominently affected by chemical contaminantsand lack of key habitats to temporarily rear and reside. As with coho, alcoves, tributaryconfluences, and off-channel areas are important to juvenile steelhead as they head seawardinto the lower Columbia River. These areas are most prominently used for temporary refugeduring storm flows and for temporary rearing. In addition to these areas, chemicalcontamination in the lower Willamette River prominently affects Johnson Creek steelheadproductivity. As steelhead become less reliant on key habitat areas, they become moresensitive to environmental conditions that affect their ability to move downstream. In thelower Willamette, chemical contamination poses a critical risk to steelhead as they emigrateseaward from March through June.
Prespawning Adult. Adult steelhead enter the lower Willamette River from late fall throughspring and are most prominently affected by lack of key holding areas, such as deeper pools,and chemical contamination.
Lower Johnson Creek
Coho Rank Steelhead Rank
Protection benefit 5 Protection benefit 3
Restoration benefit 1 Restoration benefit 1

DRAFT WILLAMETTE SUBBASIN PLAN
3-490 CH 3 ASSESSMENT.DOC
Coho were most affected by lack of habitat diversity and lack of key habitats. High sedimentloading during storm flows, warm stream temperatures in the summer, and poor channelstability likewise impair potential coho productivity in lower Johnson Creek.
Most vulnerable life stages and life history strategies (for example, habitat preferences)affected include egg incubation, fry colonization, and juvenile rearing (winter and summer).Of these life stages young-of-the-year juvenile rearing and egg incubation are mostvulnerable, followed by winter rearing and fry colonization.
Egg Incubation. Poor channel stability and high sediment loads most prominently affect eggincubation and subsequent egg-to-fry survival. High storm flows through fall, winter, andspring erode unprotected banks along Johnson Creek, while WPA-lined creek portionsprevent high flows from accessing the floodplain. This results in increased bed scour,increased bank erosion, and high sediment loading throughout the lower reach.
Fry Colonization. Fry colonization is most prominently influenced by lack of habitat diversity,lack of large wood, and lack of key habitats such as off-channel ponds, floodplain wetlands,and instream shallow-water habitats. In addition, lack of aquatic insects as food sourceadversely affects fry-to-juvenile survival.
Juvenile Rearing (Summer and Winter). Lack of large wood and large substratum (habitatdiversity), lack of key habitats such as deep pools and riffles, and high stream temperaturemost prominently affect juvenile production through the summer. Lack of aquatic insectslikewise limits coho productivity in lower Johnson Creek during active, summer rearing.
Lack of off-channel and slack-water habitats and instream structure (large wood, overhang-ing vegetation) are primary limiting factors affecting juvenile coho during winter rearing.Notably, the lack of critical overwintering habitats likely poses the greatest risk to successfulcoho production. Slack-water environs are most important during winter rearing and arecritically important as high flow refugia during peak and prolonged high flows, which havealso been identified as a key limiting factor in lower Johnson Creek.
Steelhead were most affected by lack of habitat diversity and key habitats and high sedimentloading during early life history rearing. Warm stream temperatures in the summer and fishpassage obstructions, most notably at Tideman Johnson Park and at tributary confluenceareas, likewise impair potential steelhead productivity in lower Johnson Creek.
The most vulnerable life stages and life history strategies (for example, habitat preferences)most prominently affected include egg incubation and juvenile rearing (winter and summer).Of these life stages, egg incubation and juvenile spring/summer (active) rearing are mostvulnerable, followed by winter (inactive) rearing.
Egg Incubation. Poor channel stability and high sediment loads most prominently affect eggincubation and subsequent egg-to-fry survival. High storm flows through fall, winter, andspring erode unprotected banks along Johnson Creek, while WPA-lined creek portionsprevent high flows from accessing the floodplain. This results in increased bed scour,increased bank erosion, and high sediment loading throughout the lower reach. Elevatedstream temperatures potentially adversely affect incubation beds. Effects on egg incubationare most prominently noted in the middle and upper reaches of lower Johnson Creek.

DRAFT WILLAMETTE SUBBASIN PLAN
CH 3 ASSESSMENT.DOC 3-491
Juvenile Rearing (Summer and Winter). The lack of large wood and large substratum (habitatdiversity), low summer flows coincident with high stream temperature, and lack of primaryfood sources most prominently affect juvenile production through the summer in lowerJohnson Creek. Notably, these habitat attributes affect both 0+ and 1+ age steelhead and arecommon throughout the lower reach; however, young-of-the-year steelhead are morevulnerable to habitat limitations compared to older aged juveniles that are likely to be morecompetitive for food and space.
Lack of instream structure such as large wood and overhanging vegetation primarily limitssteelhead productivity (and survival) through the winter. Complex habitat forms provideimportant high flow refugia and protective cover during higher storm flows. Lack of thesetypes of important habitats likely results in fish being swept downstream.
Middle Johnson Creek
Coho Rank Steelhead Rank
Protection benefit 2 Protection benefit 4
Restoration benefit 2 Restoration benefit 2
Coho were most affected by lack of habitat diversity and lack of key habitats. High sedimentloading during storm flows, warm stream temperatures in the summer, and poor channelstability likewise impair potential coho productivity in middle Johnson Creek.
The most vulnerable life stages and life history strategies (for example, habitat preferences)most prominently affected include egg incubation, fry colonization, and juvenile rearing(winter and summer). Of these life stages, egg incubation and young-of-the-year juvenilerearing are most vulnerable, followed by winter rearing and fry colonization.
Egg Incubation. Poor channel stability and high sediment loads most prominently affect eggincubation and subsequent egg-to-fry survival. High storm flows through fall, winter, andspring erode unprotected banks in middle Johnson Creek, while WPA-lined creek portionsprevent high flows from accessing the floodplain. This results in increased bed scour,increased bank erosion, and high sediment loading in this reach and in downstream reaches.
Fry Colonization. Fry colonization is most prominently influenced by lack of habitat diversity,lack of large wood, and lack of key habitats such as off-channel ponds, floodplain wetlands,and instream shallow-water habitats. In addition, poor channel stability and high peak flowsaffect the ability of fry to colonize, seek refuge, and thrive in middle Johnson Creek.
Juvenile Rearing (Summer and Winter). Lack of large wood and large substratum (habitatdiversity), lack of key habitats such as deep pools and riffles, and high stream temperaturemost prominently affect juvenile production potential through the summer. In addition, foodsources are lacking and low summer flows limit coho productivity during active, summerrearing.
Lack of off-channel and slack-water habitats and instream structure (large wood, overhang-ing vegetation) are primary limiting factors affecting juvenile survival and productivitythrough the winter. Notably, the lack of critical overwintering habitats likely poses thegreatest risk in the upper portion of middle Johnson Creek (Reach 14 and Reach 15).

DRAFT WILLAMETTE SUBBASIN PLAN
3-492 CH 3 ASSESSMENT.DOC
Steelhead were most affected by high sediment loading, lack of habitat diversity, and lack ofkey habitats. Most vulnerable life stages and life history strategies (for example, habitatpreferences) affected include egg incubation and juvenile rearing (winter and summer). Ofthese life stages, juvenile spring/summer (active) rearing and winter (inactive) rearing aremost vulnerable, followed by egg incubation.
Egg Incubation. Lack of key habitats such as high-quality riffle beds with low embedded finessignificantly impair the egg incubation environment and subsequent egg-to-fry survival. Highsilt loads atop riffle beds result in low dissolved oxygen concentration reaching the eggs,which subsequently affects embryonic development, fry maturation, and total egg-to-frysurvival.
Juvenile Rearing (Summer and Winter). Lack of large wood and large substratum (habitatdiversity), low summer flows coincident with high stream temperature, and lack of primaryfood sources most prominently affect juvenile production through the summer in middleJohnson Creek. Notably, these habitat attributes affect both 0+ and 1+ age steelhead and arecommon limitations throughout the middle reach.
Lack of instream structure such as large wood and overhanging vegetation, along with highflows, primarily limit steelhead productivity (and survival) through the winter. Complexhabitat forms provide important high flow refugia and protective cover during high stormflows, and the lack of these habitat niches results in fish being swept downstream.
Upper Johnson Creek
Coho Rank Steelhead Rank
Protection benefit 1 Protection benefit 1
Restoration benefit 4 Restoration benefit 5
Coho were most affected by lack of habitat diversity and lack of key habitats. High sedimentloading during storm flows and poor channel stability likewise impair potential cohoproductivity in upper Johnson Creek.
The most vulnerable life stages and life history strategies (for example, habitat preferences)most prominently affected include egg incubation, fry colonization, and juvenile rearing(winter and summer). Of these life stages, egg incubation and young-of-the-year juvenile(active) rearing are most vulnerable, followed by fry colonization and inactive winter rearing.
Egg Incubation. Poor channel stability and high sediment loads most prominently affect eggincubation and subsequent egg-to-fry survival. High storm flows through fall, winter, andspring erode unstable channel banks in upper Johnson Creek. This results in increased bankscour and high sediment loading in this reach and in subsequent downstream reaches.
Fry Colonization. Fry colonization is most prominently influenced by lack of habitat diversity(for example, instream structure such as wood) and lack of key habitats, such as off-channelwetlands and instream shallow water habitats. In addition, high peak flows affect the abilityof fry to colonize, seek refuge (instream as well as off-channel), and—ultimately—persist.
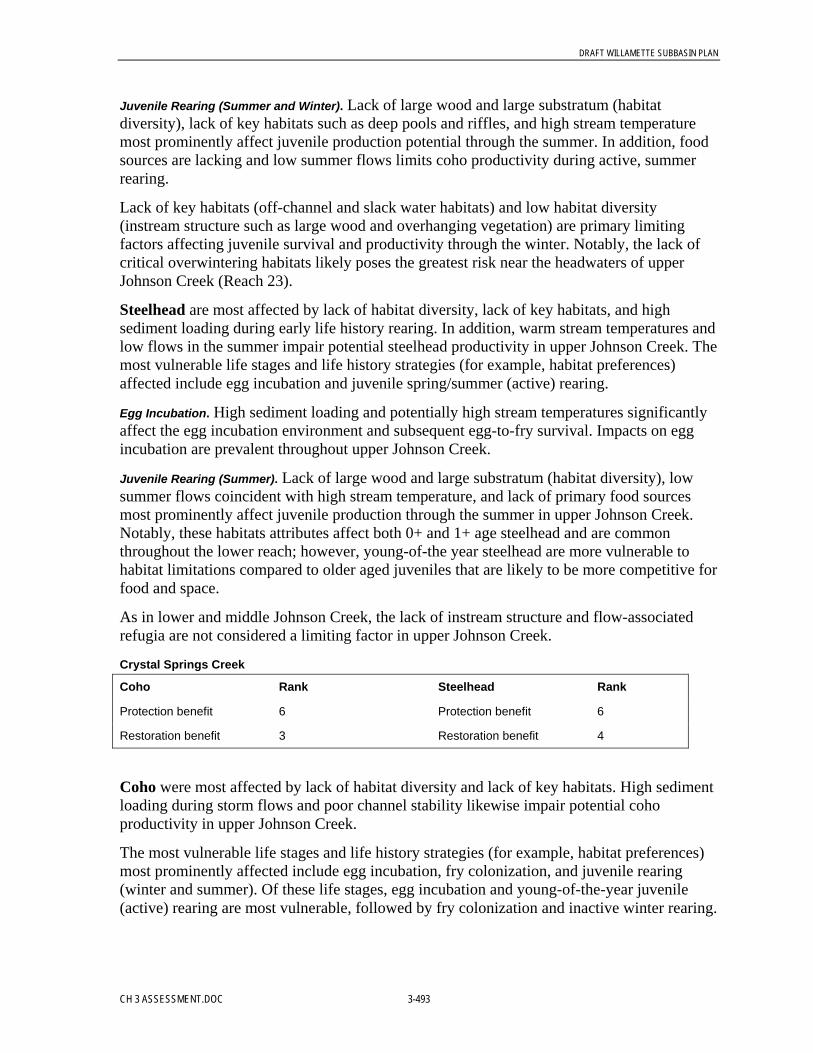
DRAFT WILLAMETTE SUBBASIN PLAN
CH 3 ASSESSMENT.DOC 3-493
Juvenile Rearing (Summer and Winter). Lack of large wood and large substratum (habitatdiversity), lack of key habitats such as deep pools and riffles, and high stream temperaturemost prominently affect juvenile production potential through the summer. In addition, foodsources are lacking and low summer flows limits coho productivity during active, summerrearing.
Lack of key habitats (off-channel and slack water habitats) and low habitat diversity(instream structure such as large wood and overhanging vegetation) are primary limitingfactors affecting juvenile survival and productivity through the winter. Notably, the lack ofcritical overwintering habitats likely poses the greatest risk near the headwaters of upperJohnson Creek (Reach 23).
Steelhead are most affected by lack of habitat diversity, lack of key habitats, and highsediment loading during early life history rearing. In addition, warm stream temperatures andlow flows in the summer impair potential steelhead productivity in upper Johnson Creek. Themost vulnerable life stages and life history strategies (for example, habitat preferences)affected include egg incubation and juvenile spring/summer (active) rearing.
Egg Incubation. High sediment loading and potentially high stream temperatures significantlyaffect the egg incubation environment and subsequent egg-to-fry survival. Impacts on eggincubation are prevalent throughout upper Johnson Creek.
Juvenile Rearing (Summer). Lack of large wood and large substratum (habitat diversity), lowsummer flows coincident with high stream temperature, and lack of primary food sourcesmost prominently affect juvenile production through the summer in upper Johnson Creek.Notably, these habitats attributes affect both 0+ and 1+ age steelhead and are commonthroughout the lower reach; however, young-of-the year steelhead are more vulnerable tohabitat limitations compared to older aged juveniles that are likely to be more competitive forfood and space.
As in lower and middle Johnson Creek, the lack of instream structure and flow-associatedrefugia are not considered a limiting factor in upper Johnson Creek.
Crystal Springs Creek
Coho Rank Steelhead Rank
Protection benefit 6 Protection benefit 6
Restoration benefit 3 Restoration benefit 4
Coho were most affected by lack of habitat diversity and lack of key habitats. High sedimentloading during storm flows and poor channel stability likewise impair potential cohoproductivity in upper Johnson Creek.
The most vulnerable life stages and life history strategies (for example, habitat preferences)most prominently affected include egg incubation, fry colonization, and juvenile rearing(winter and summer). Of these life stages, egg incubation and young-of-the-year juvenile(active) rearing are most vulnerable, followed by fry colonization and inactive winter rearing.
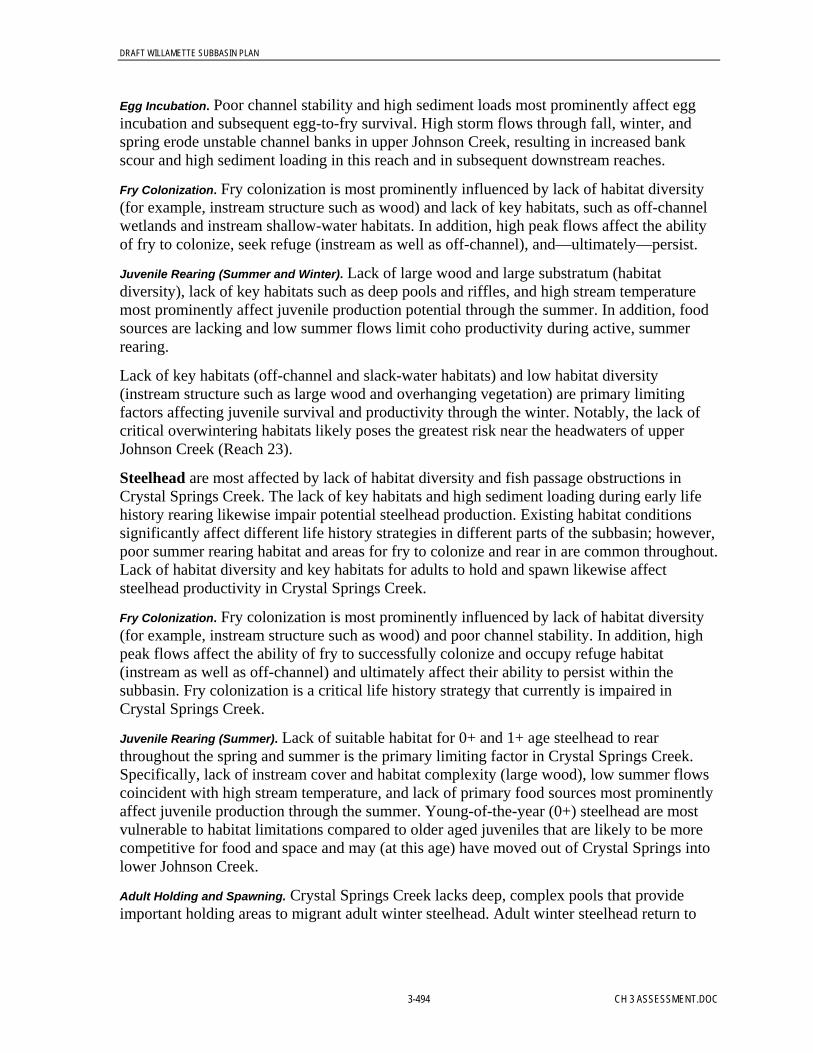
DRAFT WILLAMETTE SUBBASIN PLAN
3-494 CH 3 ASSESSMENT.DOC
Egg Incubation. Poor channel stability and high sediment loads most prominently affect eggincubation and subsequent egg-to-fry survival. High storm flows through fall, winter, andspring erode unstable channel banks in upper Johnson Creek, resulting in increased bankscour and high sediment loading in this reach and in subsequent downstream reaches.
Fry Colonization. Fry colonization is most prominently influenced by lack of habitat diversity(for example, instream structure such as wood) and lack of key habitats, such as off-channelwetlands and instream shallow-water habitats. In addition, high peak flows affect the abilityof fry to colonize, seek refuge (instream as well as off-channel), and—ultimately—persist.
Juvenile Rearing (Summer and Winter). Lack of large wood and large substratum (habitatdiversity), lack of key habitats such as deep pools and riffles, and high stream temperaturemost prominently affect juvenile production potential through the summer. In addition, foodsources are lacking and low summer flows limit coho productivity during active, summerrearing.
Lack of key habitats (off-channel and slack-water habitats) and low habitat diversity(instream structure such as large wood and overhanging vegetation) are primary limitingfactors affecting juvenile survival and productivity through the winter. Notably, the lack ofcritical overwintering habitats likely poses the greatest risk near the headwaters of upperJohnson Creek (Reach 23).
Steelhead are most affected by lack of habitat diversity and fish passage obstructions inCrystal Springs Creek. The lack of key habitats and high sediment loading during early lifehistory rearing likewise impair potential steelhead production. Existing habitat conditionssignificantly affect different life history strategies in different parts of the subbasin; however,poor summer rearing habitat and areas for fry to colonize and rear in are common throughout.Lack of habitat diversity and key habitats for adults to hold and spawn likewise affectsteelhead productivity in Crystal Springs Creek.
Fry Colonization. Fry colonization is most prominently influenced by lack of habitat diversity(for example, instream structure such as wood) and poor channel stability. In addition, highpeak flows affect the ability of fry to successfully colonize and occupy refuge habitat(instream as well as off-channel) and ultimately affect their ability to persist within thesubbasin. Fry colonization is a critical life history strategy that currently is impaired inCrystal Springs Creek.
Juvenile Rearing (Summer). Lack of suitable habitat for 0+ and 1+ age steelhead to rearthroughout the spring and summer is the primary limiting factor in Crystal Springs Creek.Specifically, lack of instream cover and habitat complexity (large wood), low summer flowscoincident with high stream temperature, and lack of primary food sources most prominentlyaffect juvenile production through the summer. Young-of-the-year (0+) steelhead are mostvulnerable to habitat limitations compared to older aged juveniles that are likely to be morecompetitive for food and space and may (at this age) have moved out of Crystal Springs intolower Johnson Creek.
Adult Holding and Spawning. Crystal Springs Creek lacks deep, complex pools that provideimportant holding areas to migrant adult winter steelhead. Adult winter steelhead return to
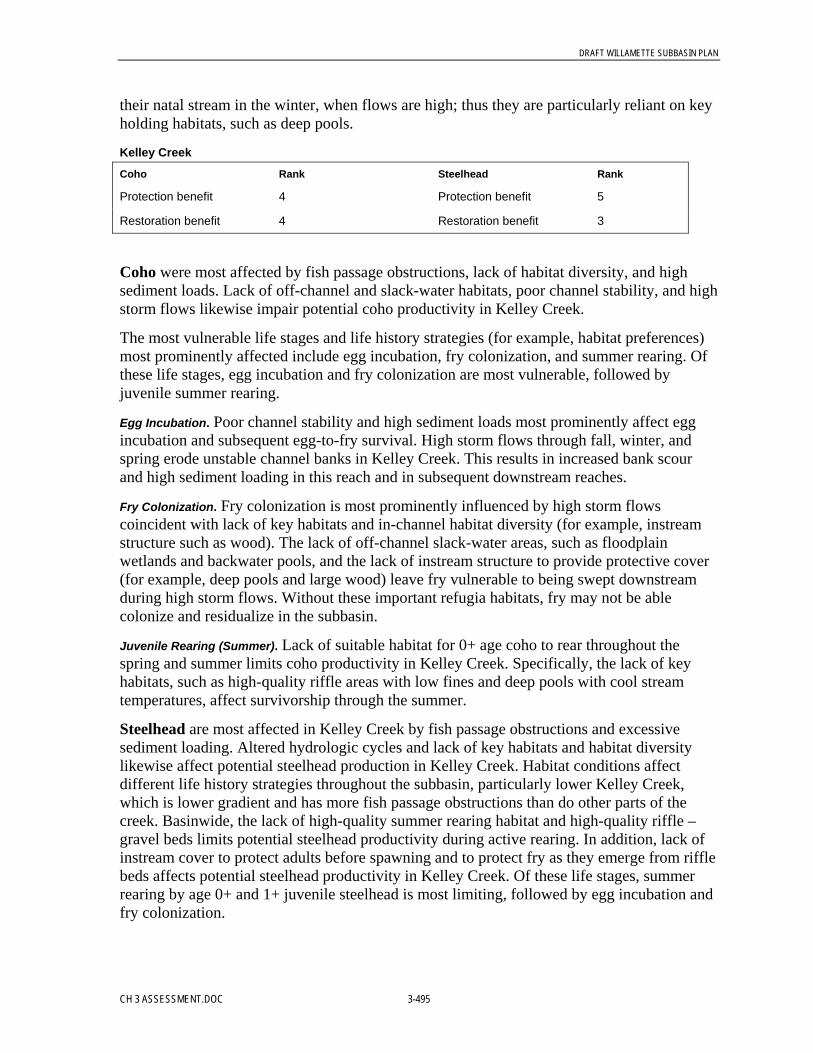
DRAFT WILLAMETTE SUBBASIN PLAN
CH 3 ASSESSMENT.DOC 3-495
their natal stream in the winter, when flows are high; thus they are particularly reliant on keyholding habitats, such as deep pools.
Kelley Creek
Coho Rank Steelhead Rank
Protection benefit 4 Protection benefit 5
Restoration benefit 4 Restoration benefit 3
Coho were most affected by fish passage obstructions, lack of habitat diversity, and highsediment loads. Lack of off-channel and slack-water habitats, poor channel stability, and highstorm flows likewise impair potential coho productivity in Kelley Creek.
The most vulnerable life stages and life history strategies (for example, habitat preferences)most prominently affected include egg incubation, fry colonization, and summer rearing. Ofthese life stages, egg incubation and fry colonization are most vulnerable, followed byjuvenile summer rearing.
Egg Incubation. Poor channel stability and high sediment loads most prominently affect eggincubation and subsequent egg-to-fry survival. High storm flows through fall, winter, andspring erode unstable channel banks in Kelley Creek. This results in increased bank scourand high sediment loading in this reach and in subsequent downstream reaches.
Fry Colonization. Fry colonization is most prominently influenced by high storm flowscoincident with lack of key habitats and in-channel habitat diversity (for example, instreamstructure such as wood). The lack of off-channel slack-water areas, such as floodplainwetlands and backwater pools, and the lack of instream structure to provide protective cover(for example, deep pools and large wood) leave fry vulnerable to being swept downstreamduring high storm flows. Without these important refugia habitats, fry may not be ablecolonize and residualize in the subbasin.
Juvenile Rearing (Summer). Lack of suitable habitat for 0+ age coho to rear throughout thespring and summer limits coho productivity in Kelley Creek. Specifically, the lack of keyhabitats, such as high-quality riffle areas with low fines and deep pools with cool streamtemperatures, affect survivorship through the summer.
Steelhead are most affected in Kelley Creek by fish passage obstructions and excessivesediment loading. Altered hydrologic cycles and lack of key habitats and habitat diversitylikewise affect potential steelhead production in Kelley Creek. Habitat conditions affectdifferent life history strategies throughout the subbasin, particularly lower Kelley Creek,which is lower gradient and has more fish passage obstructions than do other parts of thecreek. Basinwide, the lack of high-quality summer rearing habitat and high-quality riffle –gravel beds limits potential steelhead productivity during active rearing. In addition, lack ofinstream cover to protect adults before spawning and to protect fry as they emerge from rifflebeds affects potential steelhead productivity in Kelley Creek. Of these life stages, summerrearing by age 0+ and 1+ juvenile steelhead is most limiting, followed by egg incubation andfry colonization.

DRAFT WILLAMETTE SUBBASIN PLAN
3-496 CH 3 ASSESSMENT.DOC
Egg Incubation. High sediment loading most prominently impairs the egg incubationenvironment and subsequent egg-to-fry survival. High sedimentation atop riffle beds cansmother eggs, reducing dissolved oxygen concentrations to eggs and ultimatelycompromising egg-to-fry survival. High sediment loads throughout the winter are affected byhigh stream flows that bring sediment in from the surrounding uplands, and by high erosiveflows that scour the stream channel, sending bank materials instream. In addition, the lack ofkey riffle areas affects total egg incubation area and ultimately limits the potentialproductivity of steelhead originating from Kelley Creek.
Fry Colonization. Fry colonization is most prominently influenced by lack of habitat diversity(for example, instream structure such as wood) and poor channel stability. These conditionsare exacerbated by high winter and spring flows that erode streambanks and send frydownstream from natal rearing grounds.
Juvenile Rearing (Summer). Lack of suitable habitat for 0+ and 1+ age steelhead to rearthroughout the spring and summer is the primary limiting factor affecting steelheadproductivity in Kelley Creek. More specifically, lack of instream cover (large wood) and keyrearing habitats such as riffles and deep pools affect steelhead productivity throughout thespring and summer. In addition, low summer flows and lack of primary food sources affectjuvenile production. Young-of-the-year (0+) steelhead are most vulnerable to habitatlimitations compared to older aged juveniles that are likely to be more competitive for foodand space and may (at this age) have moved out of Kelley Creek into middle and lowerJohnson Creek.
Johnson Creek Tributaries
Coho Rank Steelhead Rank
Protection benefit 3 Protection benefit 2
Restoration benefit 5 Restoration benefit 6
Clatsop, Mitchell, Butler, Hogan, and MacDonald creeks were evaluated for their contribu-tion to potential steelhead productivity in the Johnson Creek Subbasin. The combination ofhabitat value that these tributaries provide is significant. For both coho and steelhead, theseareas rank relatively high for protecting existing habitat condition and functions.
Fish passage obstructions are a key limiting factor in all creeks except MacDonald Creek,which does not have a barrier to fish passage. All others have human constructs very near theconfluence: Mitchell Creek at RM 0.20, Clatsop Creek at RM 0.12, Butler Creek at RM 0.0and again at RM 0.34, and Hogan Creek at RM 0.21. These barriers affect both adult andjuvenile fish passage. Notably, MacDonald Creek is free flowing for at least 3.0 river miles,with no fish passage barriers.
Coho. If these creeks were passable year-round to adult and juvenile coho, high winter flowsand low summer flows, high sedimentation, and lack of instream cover and key habitatswould most prominently limit coho productivity in the five tributaries evaluated. Of thesedifferent life stages affected, the egg incubation environment is most vulnerable, followed byjuvenile rearing and the ability of fry to colonize and hold through the spring.
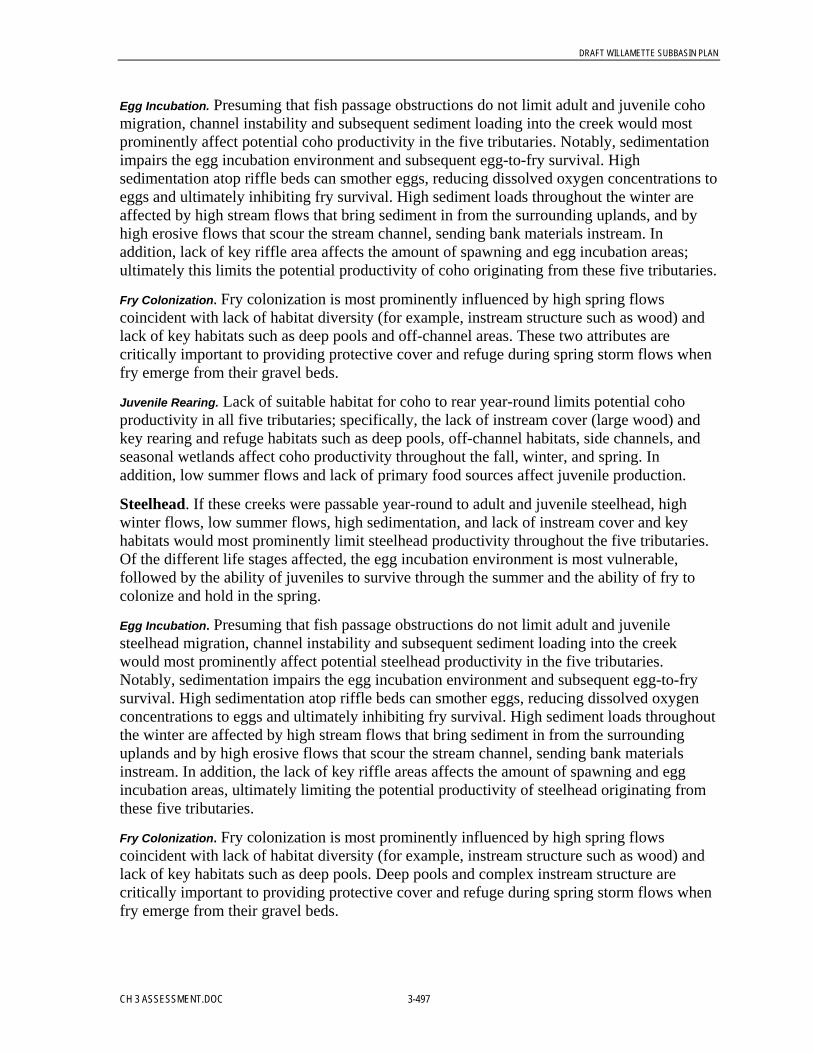
DRAFT WILLAMETTE SUBBASIN PLAN
CH 3 ASSESSMENT.DOC 3-497
Egg Incubation. Presuming that fish passage obstructions do not limit adult and juvenile cohomigration, channel instability and subsequent sediment loading into the creek would mostprominently affect potential coho productivity in the five tributaries. Notably, sedimentationimpairs the egg incubation environment and subsequent egg-to-fry survival. Highsedimentation atop riffle beds can smother eggs, reducing dissolved oxygen concentrations toeggs and ultimately inhibiting fry survival. High sediment loads throughout the winter areaffected by high stream flows that bring sediment in from the surrounding uplands, and byhigh erosive flows that scour the stream channel, sending bank materials instream. Inaddition, lack of key riffle area affects the amount of spawning and egg incubation areas;ultimately this limits the potential productivity of coho originating from these five tributaries.
Fry Colonization. Fry colonization is most prominently influenced by high spring flowscoincident with lack of habitat diversity (for example, instream structure such as wood) andlack of key habitats such as deep pools and off-channel areas. These two attributes arecritically important to providing protective cover and refuge during spring storm flows whenfry emerge from their gravel beds.
Juvenile Rearing. Lack of suitable habitat for coho to rear year-round limits potential cohoproductivity in all five tributaries; specifically, the lack of instream cover (large wood) andkey rearing and refuge habitats such as deep pools, off-channel habitats, side channels, andseasonal wetlands affect coho productivity throughout the fall, winter, and spring. Inaddition, low summer flows and lack of primary food sources affect juvenile production.
Steelhead. If these creeks were passable year-round to adult and juvenile steelhead, highwinter flows, low summer flows, high sedimentation, and lack of instream cover and keyhabitats would most prominently limit steelhead productivity throughout the five tributaries.Of the different life stages affected, the egg incubation environment is most vulnerable,followed by the ability of juveniles to survive through the summer and the ability of fry tocolonize and hold in the spring.
Egg Incubation. Presuming that fish passage obstructions do not limit adult and juvenilesteelhead migration, channel instability and subsequent sediment loading into the creekwould most prominently affect potential steelhead productivity in the five tributaries.Notably, sedimentation impairs the egg incubation environment and subsequent egg-to-frysurvival. High sedimentation atop riffle beds can smother eggs, reducing dissolved oxygenconcentrations to eggs and ultimately inhibiting fry survival. High sediment loads throughoutthe winter are affected by high stream flows that bring sediment in from the surroundinguplands and by high erosive flows that scour the stream channel, sending bank materialsinstream. In addition, the lack of key riffle areas affects the amount of spawning and eggincubation areas, ultimately limiting the potential productivity of steelhead originating fromthese five tributaries.
Fry Colonization. Fry colonization is most prominently influenced by high spring flowscoincident with lack of habitat diversity (for example, instream structure such as wood) andlack of key habitats such as deep pools. Deep pools and complex instream structure arecritically important to providing protective cover and refuge during spring storm flows whenfry emerge from their gravel beds.
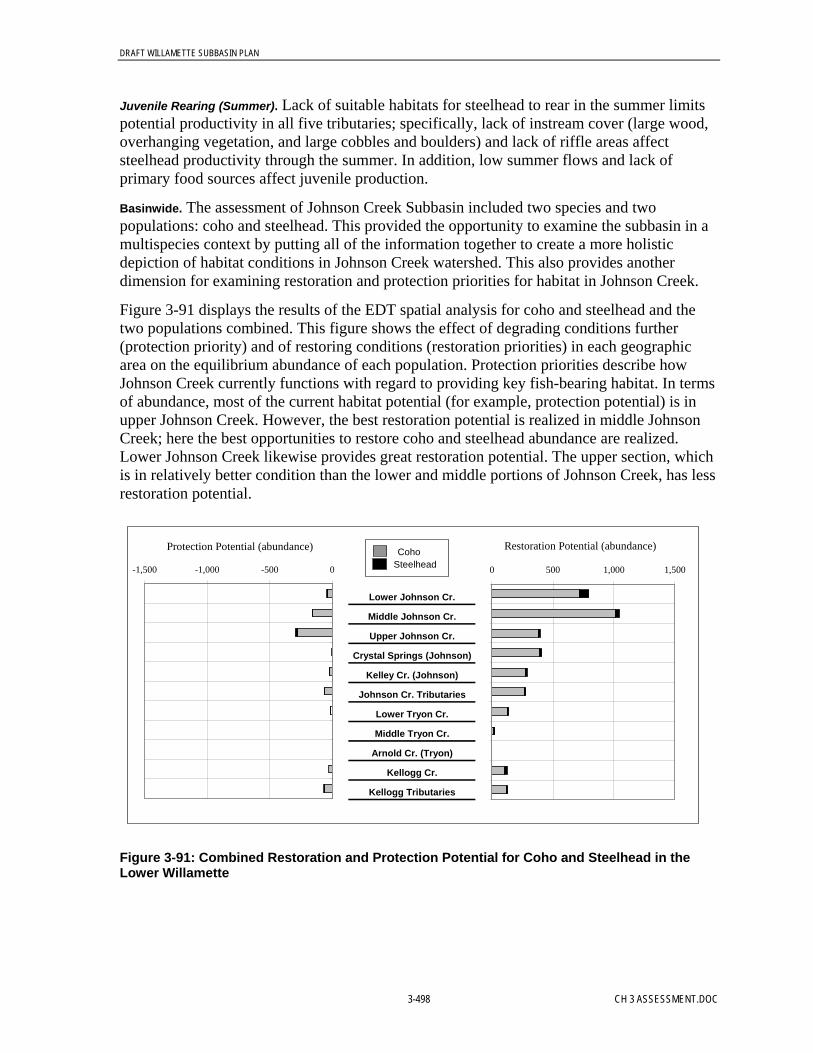
DRAFT WILLAMETTE SUBBASIN PLAN
3-498 CH 3 ASSESSMENT.DOC
Juvenile Rearing (Summer). Lack of suitable habitats for steelhead to rear in the summer limitspotential productivity in all five tributaries; specifically, lack of instream cover (large wood,overhanging vegetation, and large cobbles and boulders) and lack of riffle areas affectsteelhead productivity through the summer. In addition, low summer flows and lack ofprimary food sources affect juvenile production.
Basinwide. The assessment of Johnson Creek Subbasin included two species and twopopulations: coho and steelhead. This provided the opportunity to examine the subbasin in amultispecies context by putting all of the information together to create a more holisticdepiction of habitat conditions in Johnson Creek watershed. This also provides anotherdimension for examining restoration and protection priorities for habitat in Johnson Creek.
Figure 3-91 displays the results of the EDT spatial analysis for coho and steelhead and thetwo populations combined. This figure shows the effect of degrading conditions further(protection priority) and of restoring conditions (restoration priorities) in each geographicarea on the equilibrium abundance of each population. Protection priorities describe howJohnson Creek currently functions with regard to providing key fish-bearing habitat. In termsof abundance, most of the current habitat potential (for example, protection potential) is inupper Johnson Creek. However, the best restoration potential is realized in middle JohnsonCreek; here the best opportunities to restore coho and steelhead abundance are realized.Lower Johnson Creek likewise provides great restoration potential. The upper section, whichis in relatively better condition than the lower and middle portions of Johnson Creek, has lessrestoration potential.
Lower Johnson Cr.
Middle Johnson Cr.
Upper Johnson Cr.
Crystal Springs (Johnson)
Kelley Cr. (Johnson)
Johnson Cr. Tributaries
Lower Tryon Cr.
Middle Tryon Cr.
Arnold Cr. (Tryon)
Kellogg Cr.
Kellogg Tributaries
Restoration Potential (abundance)
0 500 1,000 1,500
Protection Potential (abundance)
-1,500 -1,000 -500 0
CohoSteelhead
Figure 3-91: Combined Restoration and Protection Potential for Coho and Steelhead in theLower Willamette
DRAFT WILLAMETTE SUBBASIN PLAN
CH 3 ASSESSMENT.DOC 3-499
3.5.1.16 Limiting Factors in the Lower Willamette River Mainstem (with EDTAnalysis)
This section describes the Lower Willamette River in terms of geographic setting andenvironmental conditions and presents information on limiting factors for the focal species inthe river: cutthroat trout, winter steelhead, spring Chinook, and coho. The limiting factors forthese species were determined by using EDT to analyze habitat conditions on a reach-by-reach basis.
Focal Species present:• Cutthroat trout• Winter steelhead• Spring Chinook• Coho salmon
Geographic Setting. The lower Willamette River is distinctly different from the middle andupper portions of the river, above Willamette Falls. Much of the upper portion is set within awide valley floor where, historically, the river was composed of braided, meanderingchannels with extensive floodplains, side channels, islands, and off-channel habitats. As theWillamette approaches Willamette Falls, the landforms begin to constrain the channel andthe course of the river is more typically confined to a single channel with narrow floodplains.Just below Willamette Falls the river is naturally incised deep into steep bedrock walls thatstrongly confine the narrow channel through this reach. The floodplain is very narrow ornearly nonexistent, and the river reaches some of its greatest natural depths (more than100 feet) through this section.
As the Willamette approaches Portland, landform constraints become less severe, the channelwidens, and conditions become increasingly influenced by the Columbia River. Historicallythe reduced landform constraints allowed the formation of floodplains and off-channelhabitats through Portland, with large off-channel lakes such as Guilds, Doane, and Ramsey.Although floodplain widths in the lower Willamette were never as extensive as those in themiddle and upper basin, their location at this dynamic transitional zone between the twomajor river systems and the scarcity of off-channel habitat for some distance upstreamsuggests that the ecological importance of these floodplains was high. In particular, theColumbia Slough and Sauvie Island formed a large floodplain wetland complex at themerging of the two rivers that provided extensive, high-quality habitat for large numbers andtypes of biota at this ecological crossroads.
It is also important to acknowledge that the Columbia River has always had a strong impacton conditions in the lower Willamette. The Missoula Floods more than 10,000 years agoscoured many of the morphological features that still define the structure of the channelthrough this section, and the hydrology of the lower Willamette is strongly influenced byflows coming from the upper Columbia Basin and the tidal effects transmitted up the lowerColumbia from the coast.
Regional Geology. The dominant geological formation of the region is Columbia Riverbasalt, which originated in lava flows from the eastern Columbia Basin. Underlying this isthe Scappoose Formation—sandstone and shale deposited when the region was ancient oceanbottom 22 million years ago. These formations were subjected to volcanism and tectonic
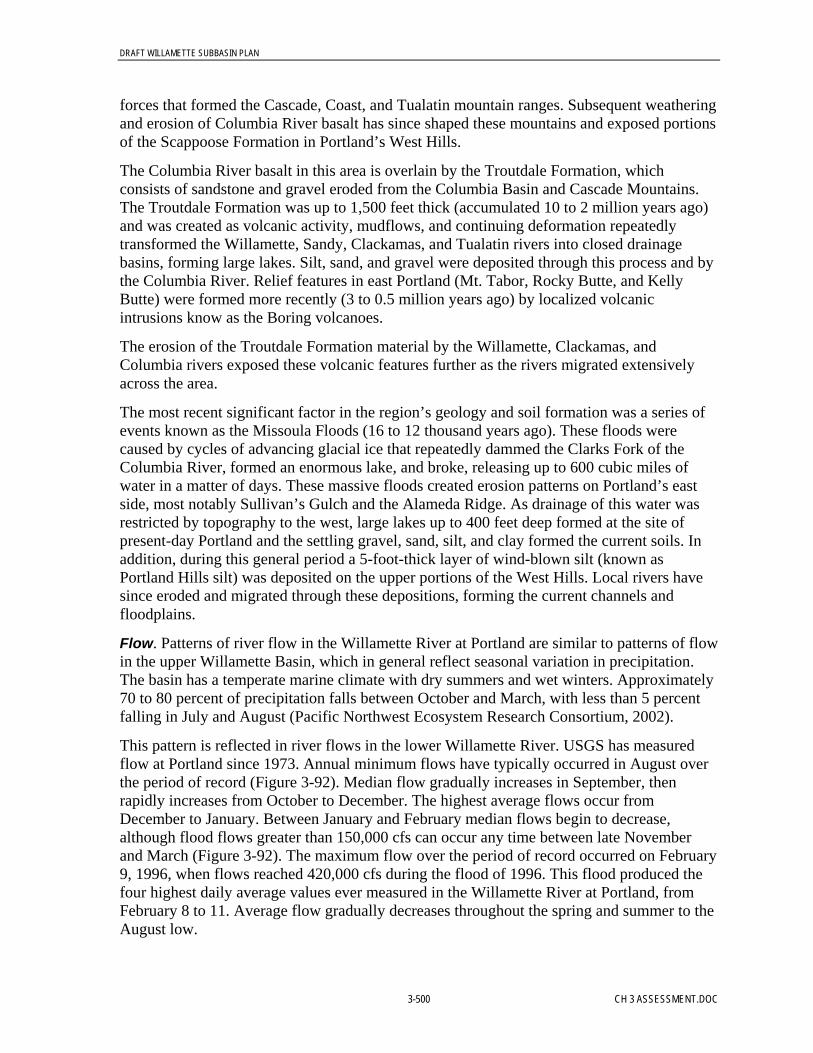
DRAFT WILLAMETTE SUBBASIN PLAN
3-500 CH 3 ASSESSMENT.DOC
forces that formed the Cascade, Coast, and Tualatin mountain ranges. Subsequent weatheringand erosion of Columbia River basalt has since shaped these mountains and exposed portionsof the Scappoose Formation in Portland’s West Hills.
The Columbia River basalt in this area is overlain by the Troutdale Formation, whichconsists of sandstone and gravel eroded from the Columbia Basin and Cascade Mountains.The Troutdale Formation was up to 1,500 feet thick (accumulated 10 to 2 million years ago)and was created as volcanic activity, mudflows, and continuing deformation repeatedlytransformed the Willamette, Sandy, Clackamas, and Tualatin rivers into closed drainagebasins, forming large lakes. Silt, sand, and gravel were deposited through this process and bythe Columbia River. Relief features in east Portland (Mt. Tabor, Rocky Butte, and KellyButte) were formed more recently (3 to 0.5 million years ago) by localized volcanicintrusions know as the Boring volcanoes.
The erosion of the Troutdale Formation material by the Willamette, Clackamas, andColumbia rivers exposed these volcanic features further as the rivers migrated extensivelyacross the area.
The most recent significant factor in the region’s geology and soil formation was a series ofevents known as the Missoula Floods (16 to 12 thousand years ago). These floods werecaused by cycles of advancing glacial ice that repeatedly dammed the Clarks Fork of theColumbia River, formed an enormous lake, and broke, releasing up to 600 cubic miles ofwater in a matter of days. These massive floods created erosion patterns on Portland’s eastside, most notably Sullivan’s Gulch and the Alameda Ridge. As drainage of this water wasrestricted by topography to the west, large lakes up to 400 feet deep formed at the site ofpresent-day Portland and the settling gravel, sand, silt, and clay formed the current soils. Inaddition, during this general period a 5-foot-thick layer of wind-blown silt (known asPortland Hills silt) was deposited on the upper portions of the West Hills. Local rivers havesince eroded and migrated through these depositions, forming the current channels andfloodplains.
Flow. Patterns of river flow in the Willamette River at Portland are similar to patterns of flowin the upper Willamette Basin, which in general reflect seasonal variation in precipitation.The basin has a temperate marine climate with dry summers and wet winters. Approximately70 to 80 percent of precipitation falls between October and March, with less than 5 percentfalling in July and August (Pacific Northwest Ecosystem Research Consortium, 2002).
This pattern is reflected in river flows in the lower Willamette River. USGS has measuredflow at Portland since 1973. Annual minimum flows have typically occurred in August overthe period of record (Figure 3-92). Median flow gradually increases in September, thenrapidly increases from October to December. The highest average flows occur fromDecember to January. Between January and February median flows begin to decrease,although flood flows greater than 150,000 cfs can occur any time between late Novemberand March (Figure 3-92). The maximum flow over the period of record occurred on February9, 1996, when flows reached 420,000 cfs during the flood of 1996. This flood produced thefour highest daily average values ever measured in the Willamette River at Portland, fromFebruary 8 to 11. Average flow gradually decreases throughout the spring and summer to theAugust low.
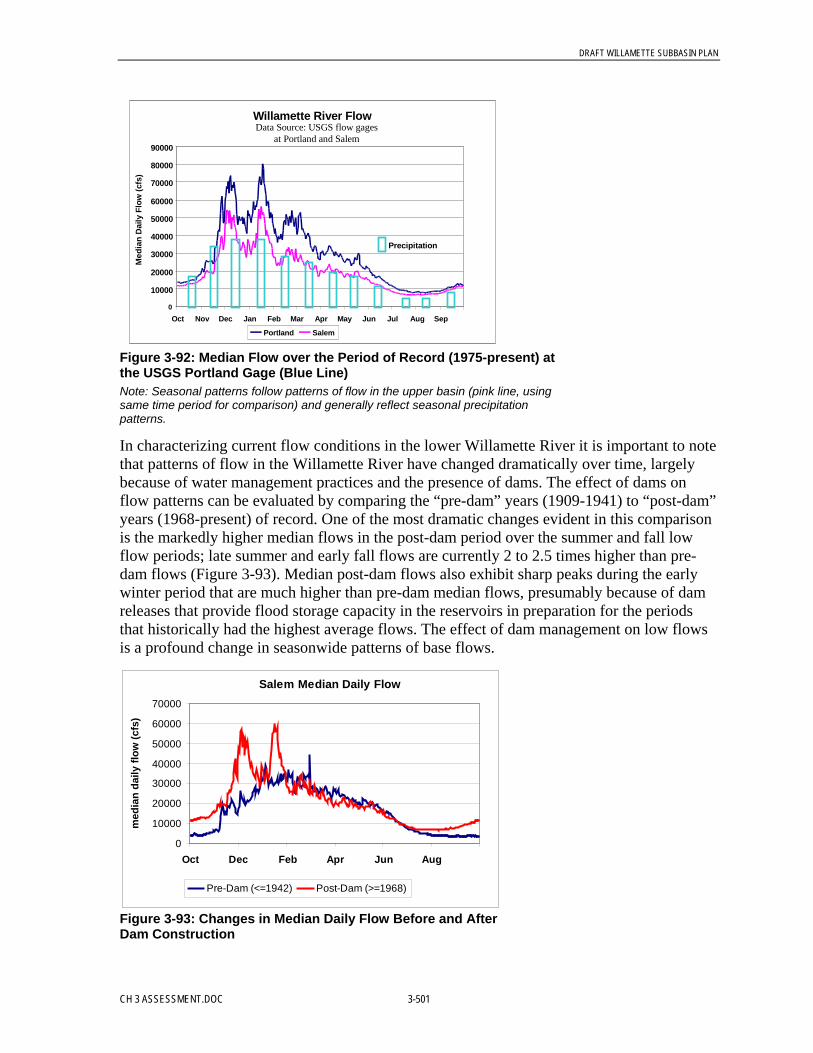
DRAFT WILLAMETTE SUBBASIN PLAN
CH 3 ASSESSMENT.DOC 3-501
Willamette River Flow
0
10000
20000
30000
40000
50000
60000
70000
80000
90000
Oct Nov Dec Jan Feb Mar Apr May Jun Jul Aug Sep
Med
ian
Dai
ly F
low
(cfs
)
Portland Salem
Precipitation
Data Source: USGS flow gages at Portland and Salem
Figure 3-92: Median Flow over the Period of Record (1975-present) atthe USGS Portland Gage (Blue Line)Note: Seasonal patterns follow patterns of flow in the upper basin (pink line, usingsame time period for comparison) and generally reflect seasonal precipitationpatterns.
In characterizing current flow conditions in the lower Willamette River it is important to notethat patterns of flow in the Willamette River have changed dramatically over time, largelybecause of water management practices and the presence of dams. The effect of dams onflow patterns can be evaluated by comparing the “pre-dam” years (1909-1941) to “post-dam”years (1968-present) of record. One of the most dramatic changes evident in this comparisonis the markedly higher median flows in the post-dam period over the summer and fall lowflow periods; late summer and early fall flows are currently 2 to 2.5 times higher than pre-dam flows (Figure 3-93). Median post-dam flows also exhibit sharp peaks during the earlywinter period that are much higher than pre-dam median flows, presumably because of damreleases that provide flood storage capacity in the reservoirs in preparation for the periodsthat historically had the highest average flows. The effect of dam management on low flowsis a profound change in seasonwide patterns of base flows.
Salem Median Daily Flow
0
10000
20000
30000
40000
50000
60000
70000
Oct Dec Feb Apr Jun Aug
med
ian
daily
flow
(cfs
)
Pre-Dam (<=1942) Post-Dam (>=1968)
Figure 3-93: Changes in Median Daily Flow Before and AfterDam Construction
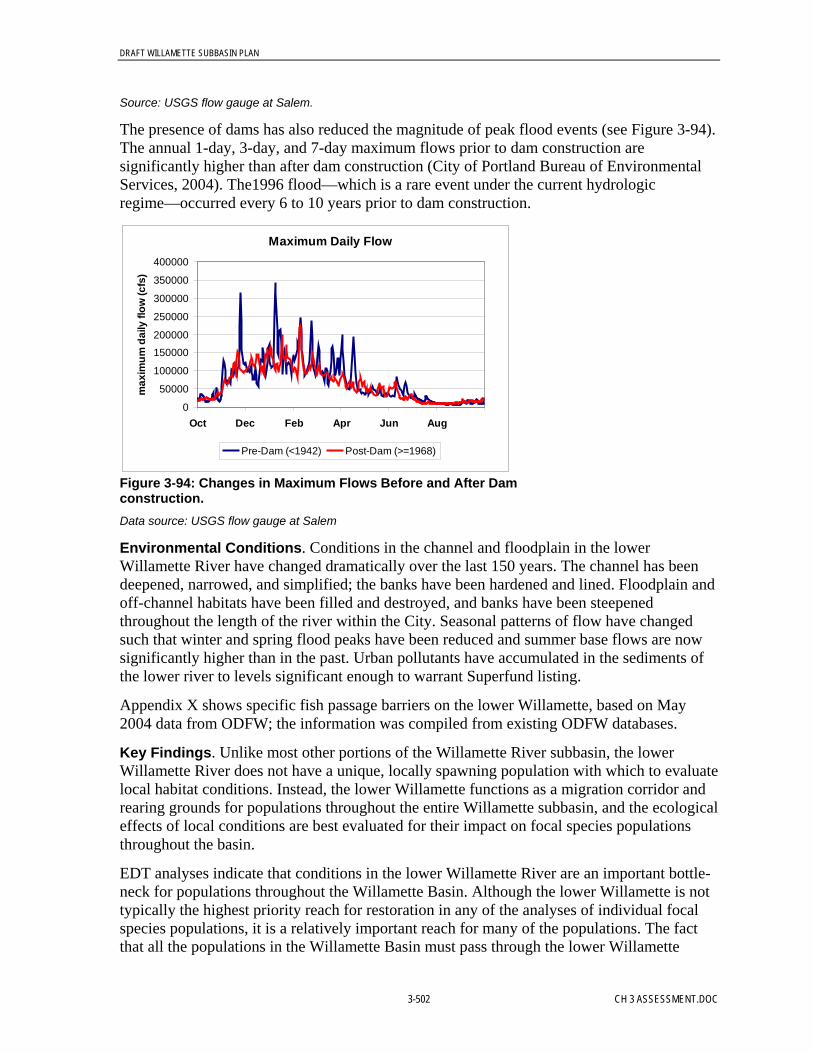
DRAFT WILLAMETTE SUBBASIN PLAN
3-502 CH 3 ASSESSMENT.DOC
Source: USGS flow gauge at Salem.
The presence of dams has also reduced the magnitude of peak flood events (see Figure 3-94).The annual 1-day, 3-day, and 7-day maximum flows prior to dam construction aresignificantly higher than after dam construction (City of Portland Bureau of EnvironmentalServices, 2004). The1996 flood—which is a rare event under the current hydrologicregime—occurred every 6 to 10 years prior to dam construction.
Maximum Daily Flow
0
50000
100000
150000
200000
250000
300000
350000
400000
Oct Dec Feb Apr Jun Aug
max
imum
dai
ly fl
ow (c
fs)
Pre-Dam (<1942) Post-Dam (>=1968)
Figure 3-94: Changes in Maximum Flows Before and After Damconstruction.Data source: USGS flow gauge at Salem
Environmental Conditions. Conditions in the channel and floodplain in the lowerWillamette River have changed dramatically over the last 150 years. The channel has beendeepened, narrowed, and simplified; the banks have been hardened and lined. Floodplain andoff-channel habitats have been filled and destroyed, and banks have been steepenedthroughout the length of the river within the City. Seasonal patterns of flow have changedsuch that winter and spring flood peaks have been reduced and summer base flows are nowsignificantly higher than in the past. Urban pollutants have accumulated in the sediments ofthe lower river to levels significant enough to warrant Superfund listing.
Appendix X shows specific fish passage barriers on the lower Willamette, based on May2004 data from ODFW; the information was compiled from existing ODFW databases.
Key Findings. Unlike most other portions of the Willamette River subbasin, the lowerWillamette River does not have a unique, locally spawning population with which to evaluatelocal habitat conditions. Instead, the lower Willamette functions as a migration corridor andrearing grounds for populations throughout the entire Willamette subbasin, and the ecologicaleffects of local conditions are best evaluated for their impact on focal species populationsthroughout the basin.
EDT analyses indicate that conditions in the lower Willamette River are an important bottle-neck for populations throughout the Willamette Basin. Although the lower Willamette is nottypically the highest priority reach for restoration in any of the analyses of individual focalspecies populations, it is a relatively important reach for many of the populations. The factthat all the populations in the Willamette Basin must pass through the lower Willamette
DRAFT WILLAMETTE SUBBASIN PLAN
CH 3 ASSESSMENT.DOC 3-503
River makes the lower Willamette’s cumulative effect on the basin’s populations a highpriority.
The key limiting factors that arise from evaluation of these populations are habitat diversity,key habitat quantity, and chemicals. Throughout the lower Willamette through Portland, thechannel has been deepened, narrowed and simplified; the banks have been hardened andlined. Floodplain and off-channel habitats have been filled and destroyed, and banks havebeen steepened. A long history of urban and industrial uses has elevated levels ofcontaminants in the sediments along this section.
EDT Analysis of Limiting Factors. The lower Willamette is one of the areas in theWillamette Basin to have undergone a detailed, reach-by-reach EDT analysis of its habitatconditions with respect to the focal species populations in this plan: cutthroat trout, springChinook salmon, winter steelhead, and coho. Appendix J presents a detailed description ofthe EDT analysis, including information sources, habitat attributes assessed, and hypothesesregarding restoration and protection strategies. The following subsection summarizes theinformation in the appendix.
EDT Approach. The EDT analysis was based on existing information, GIS analysis,observation, and expert opinion regarding flow, habitat, water quality, and biologicalattributes of the lower Willamette River. Three scenarios were part of the analysis: currentconditions, a reference or template condition that defined a fully restored condition, and afully degraded condition.
• The EDT assessment of the lower Willamette River was organized hierarchically into 23stream reaches and four geographic areas, as follow:
• North Segment. The north segment begins at the confluence of the Columbia andWillamette rivers and extends upstream (south) 6 miles to the St. Johns Bridge. A portionof the Multnomah Channel, which runs along the south edge of Sauvie Island and joinsthe Columbia farther downstream, is included in this river segment. Land uses along thisreach are predominantly industrial, with a large expanse of port facilities. There is someimportant open space along this segment (Kelley Point Park and Harborton Wetlands, forexample). Other critical habitat features along this segment include the MultnomahChannel, the Columbia Slough, Miller and Doane creeks, and the Willamette-Columbiaconfluence.
• Industrial Segment. The industrial segment extends from the St. Johns Bridge to theSteel Bridge and encompasses most of Portland’s working harbor. Industrial land usesdominate this segment also. Nearly all of the historical tributaries draining to this reachhave been piped underground. Remaining key habitat features include Willamette Parkand the Swan Island beach.
• Downtown Segment. The downtown segment extends from the Steel Bridge to the RossIsland Bridge. Land uses in this reach are a mix of commercial, industrial, and high-density residential. The few streams that historically discharged to this reach all havebeen piped underground, and the few remaining habitat features are limited and smallscale (Eastbank Crescent beach, for example).
DRAFT WILLAMETTE SUBBASIN PLAN
3-504 CH 3 ASSESSMENT.DOC
• South Segment. The south segment extends from the Ross Island Bridge to the UrbanServices Boundary south of the Sellwood Bridge. This segment has considerable openspace, as well as commercial and industrial land uses. The reach has lost some historicaltributaries, but Stephens Creek provides high-quality tributary confluence habitat andRoss Island, Oaks Bottom, and Willamette Park provide important habitat features.
EDT Results. Because populations of the focal species do not spawn locally within the lowerWillamette River, the impacts of conditions in this section on focal species populations areevaluated through the series of population analyses conducted through the Willamette Basin.The McKenzie River, Clackamas River, Johnson Creek, and Tryon Creek sections of thisplan provide information on the impact of conditions in the lower Willamette on thesepopulations.
EDT analysis indicates that the key limiting factors in the lower Willamette are habitatdiversity, key habitat quantity, and chemicals. These are described in more detail below.
Habitat Diversity. Changes in the channel have decreased habitat diversity throughout thecourse of the lower river through Portland. Loss of shallow-water habitat, lack of wood, bankhardening and reconfiguration, and loss of off-channel habitats are some of the factors thathave reduced habitat diversity. These conditions affect the migratory and rearing stages ofChinook, coho, and steelhead that use the lower river.
Historically, the Willamette River in the Portland area had an extensive and interconnectedsystem of active channels, open slack waters, emergent wetlands, riparian forest, andadjacent upland forests on hill slopes and Missoula Flood terraces. Prior to settlement, theriver was embedded in the regional forest network and intricately connected to the Columbiafloodplains. Areas along the riverbank probably were difficult to distinguish from thesurrounding green, forested environment.
Significant dredging, diking, and channeling of the mainstem Willamette has altered many ofthese historical conditions. The mainstem has been narrowed and deepened, and off-channelhabitat has been virtually eliminated. The river’s banks have been hardened, which precludesimportant naturally caused channel changes and minimizes the interaction between the riverand riparian and floodplain vegetation. Habitat has been simplified and large tracts ofriparian vegetation have been cleared. As a result of these actions, significant amounts ofshallow water, floodplain, and off-channel habitats have been lost.
The lower Willamette River historically had a number of large, off-channel lakes thatprovided high-quality rearing and refuge areas (Guilds, Kitteredge, Doane, and Ramseylakes, for example). Over time, floodplain fill, vegetation removal, bank alterations, andchannel clearing destroyed floodplain, off-channel, and riverine habitats and altered theirphysical structure. For example, Guilds Lake and Ramsey Lake were filled to provide landfor downtown and port development, while Doane Lake was reduced in size and itsconnection to the river severed. Eighty-nine percent of the historical off-channel area wasdestroyed. These losses have been most extensive in the north and industrial sections of thelower Willamette, which historically had the highest amount of off-channel habitat (seeFigure 3-95). The south segment is the only segment that retains a percentage of its formeroff-channel habitat, because of the presence of Ross Island.
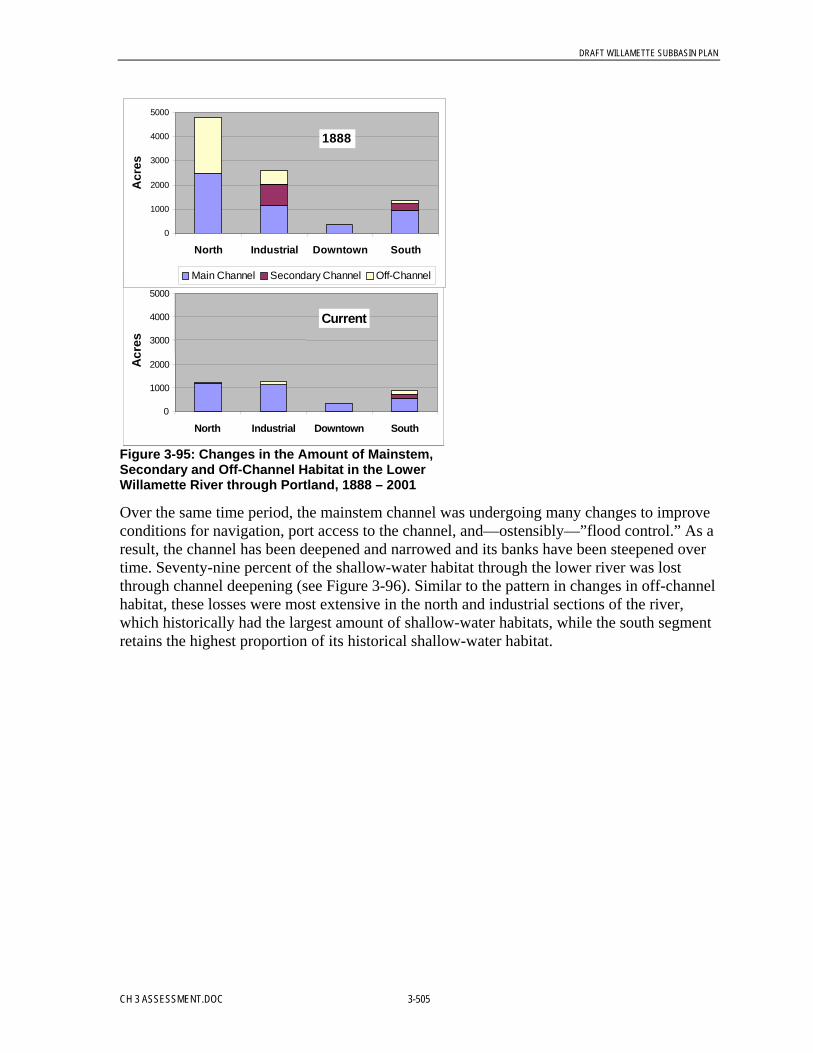
DRAFT WILLAMETTE SUBBASIN PLAN
CH 3 ASSESSMENT.DOC 3-505
0
1000
2000
3000
4000
5000
North Industrial Downtown South
Acr
es
Current
0
1000
2000
3000
4000
5000
North Industrial Downtown South
Acr
es
Current
0
1000
2000
3000
4000
5000
North Industrial Downtown South
Acr
es
Current
0
1000
2000
3000
4000
5000
North Industrial Downtown South
Acr
es
Main Channel Secondary Channel Off-Channel
1888
Figure 3-95: Changes in the Amount of Mainstem,Secondary and Off-Channel Habitat in the LowerWillamette River through Portland, 1888 – 2001
Over the same time period, the mainstem channel was undergoing many changes to improveconditions for navigation, port access to the channel, and—ostensibly—”flood control.” As aresult, the channel has been deepened and narrowed and its banks have been steepened overtime. Seventy-nine percent of the shallow-water habitat through the lower river was lostthrough channel deepening (see Figure 3-96). Similar to the pattern in changes in off-channelhabitat, these losses were most extensive in the north and industrial sections of the river,which historically had the largest amount of shallow-water habitats, while the south segmentretains the highest proportion of its historical shallow-water habitat.
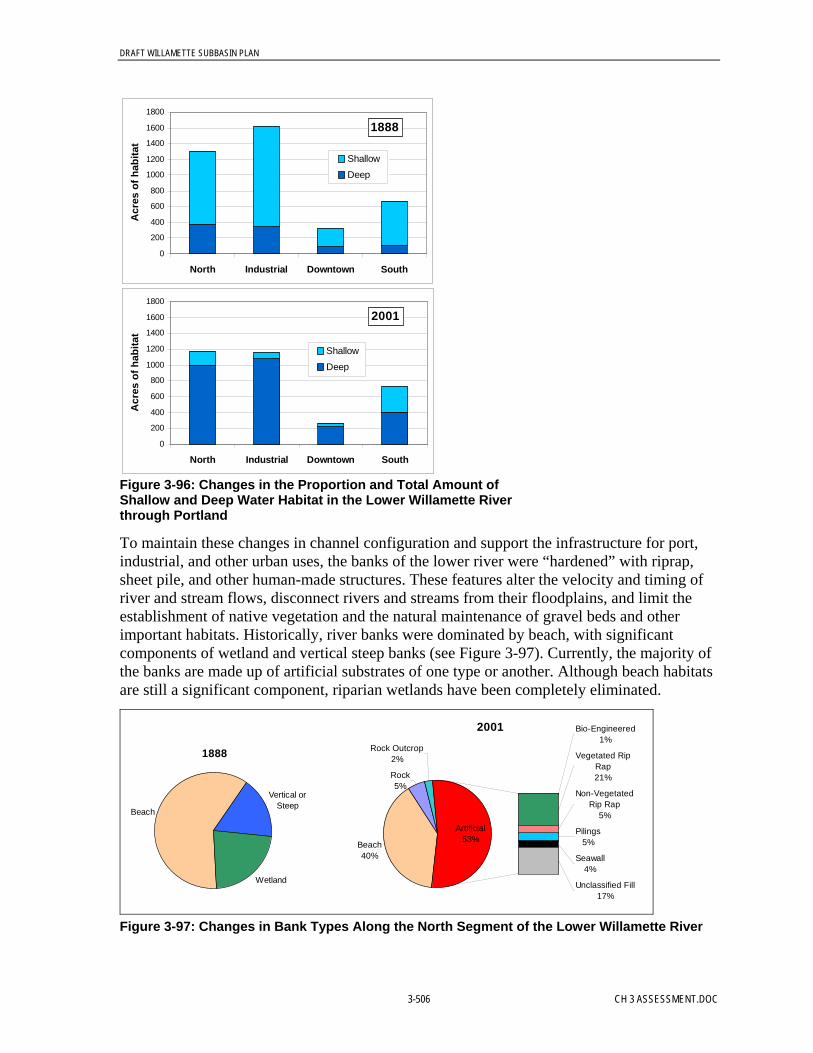
DRAFT WILLAMETTE SUBBASIN PLAN
3-506 CH 3 ASSESSMENT.DOC
0
200
400
600
800
1000
1200
1400
1600
1800
North Industrial Downtown South
Acr
es o
f hab
itat
Shallow
Deep
1888
0
200
400
600
800
1000
1200
1400
1600
1800
North Industrial Downtown South
Acr
es o
f hab
itat
Shallow
Deep
2001
Figure 3-96: Changes in the Proportion and Total Amount ofShallow and Deep Water Habitat in the Lower Willamette Riverthrough Portland
To maintain these changes in channel configuration and support the infrastructure for port,industrial, and other urban uses, the banks of the lower river were “hardened” with riprap,sheet pile, and other human-made structures. These features alter the velocity and timing ofriver and stream flows, disconnect rivers and streams from their floodplains, and limit theestablishment of native vegetation and the natural maintenance of gravel beds and otherimportant habitats. Historically, river banks were dominated by beach, with significantcomponents of wetland and vertical steep banks (see Figure 3-97). Currently, the majority ofthe banks are made up of artificial substrates of one type or another. Although beach habitatsare still a significant component, riparian wetlands have been completely eliminated.
2001
Beach40%
Rock5%
Rock Outcrop2% Vegetated Rip
Rap21%
Non-Vegetated Rip Rap
5%
Pilings5%
Unclassified Fill17%
Artificial53%
Seawall4%
Bio-Engineered1%
1888
Beach
Vertical or Steep
Wetland
Figure 3-97: Changes in Bank Types Along the North Segment of the Lower Willamette River

DRAFT WILLAMETTE SUBBASIN PLAN
CH 3 ASSESSMENT.DOC 3-507
There is no historical information on the amount of wood in the lower Willamette, and therehave not been any quantitative surveys to assess current levels. It is likely that current levelsof wood are dramatically lower than historical levels. The mouths of large rivers oftenaccumulated huge debris jams. These jams have been cleared to support river navigation, andthe channels and banks have continued to be cleared over time to protect urban infrastructureand maintain navigation.
Key Habitat Quantity. While habitat diversity refers to the quality of habitat available, it is clearthat the quantity of habitat available for key life history stages also is limiting. Lack of off-channel habitat, low levels of wood and shallow-water habitat, and lack of channel and bankcomplexity all result in insufficient amounts of key habitat available for migration andrearing stages of Chinook, coho, and steelhead using the lower river.
Chemical Contamination. Because of the level of pollution in lower Willamette River sediments,the Portland Harbor was added to the federal Superfund cleanup list in December 2000. ThePortland Harbor Superfund site currently covers a 5.7-mile section of the Willamette Riverfrom the upstream end of Sauvie Island (RM 3.5) and Swan Island (RM 9.2); the northern2.5 miles of the site are in the north segment of the EDT study area, and the southern3.2 miles of the site are in the industrial segment of the EDT study area. Pollutants intro-duced through industrial discharges, toxics carried by stormwater, and other sources havecontributed to elevated levels of many urban pollutants. Preliminary assessments indicate thatDDT, polychlorinated biphenyls (PCBs), polycyclic aromatic hydrocarbons (PAHs), andheavy metals are some of the key risk drivers in lower Willamette River sediment. Moreextensive analyses of patterns of chemical contamination are described in Weston (1998).
The Oregon 303(d) list divides the Willamette River into segments, including one that coversRM 0 to RM 24.8. The current 303(d) listings for that river segment are summarized inTable 3-173.
Table 3-173: 303(d)-Listed Water Quality Parameters for the Lower Willamette River
Parameter Season(s)SampleMatrix
YearListed Notes
Fecal Coliform Winter/ spring/ fall Water column 1998
Dieldrin All Fish tissue 2002
DDT All Fish tissueWater column
2002
DDE All Fish tissue 2002
PAHs All Water column 2002
Biological Criteria Not specified Water column 1998 Listing based on skeletal deformities injuvenile squawfish.
Mercury All Fish tissue 1998
Aldrin All Fish tissue 2002
Temperature Summer Water column 1998
PCBs All Fish tissue 2002
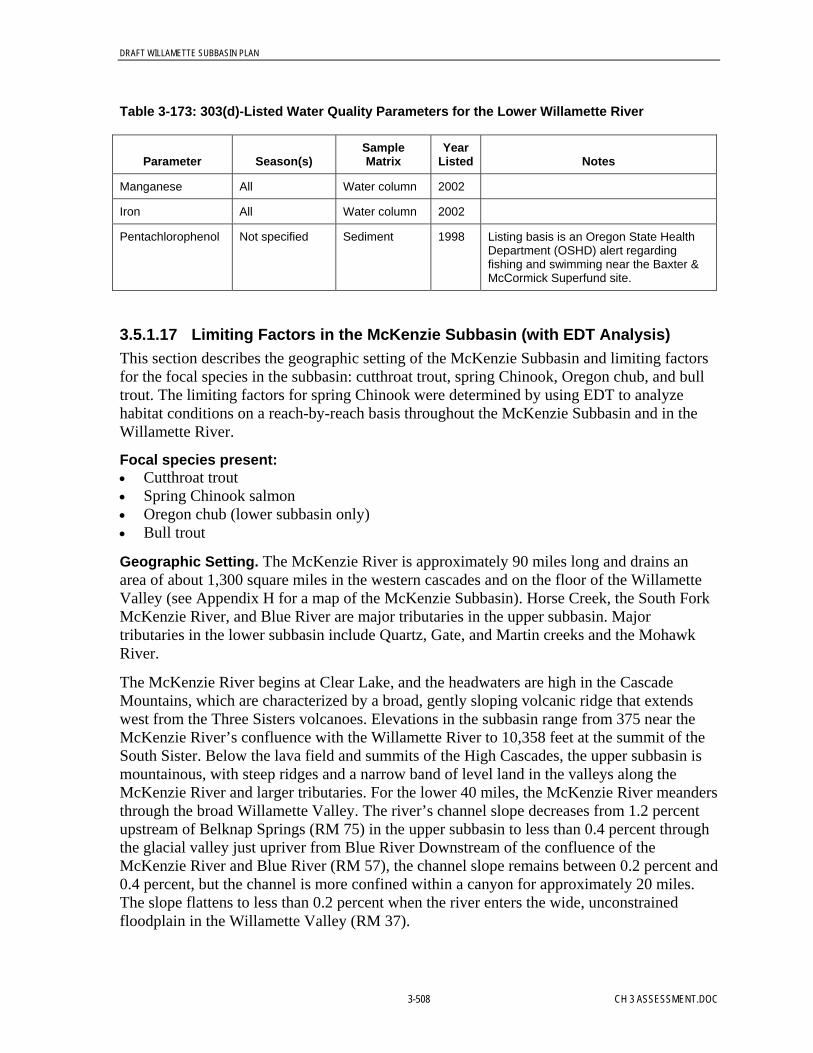
DRAFT WILLAMETTE SUBBASIN PLAN
3-508 CH 3 ASSESSMENT.DOC
Table 3-173: 303(d)-Listed Water Quality Parameters for the Lower Willamette River
Parameter Season(s)SampleMatrix
YearListed Notes
Manganese All Water column 2002
Iron All Water column 2002
Pentachlorophenol Not specified Sediment 1998 Listing basis is an Oregon State HealthDepartment (OSHD) alert regardingfishing and swimming near the Baxter &McCormick Superfund site.
3.5.1.17 Limiting Factors in the McKenzie Subbasin (with EDT Analysis)This section describes the geographic setting of the McKenzie Subbasin and limiting factorsfor the focal species in the subbasin: cutthroat trout, spring Chinook, Oregon chub, and bulltrout. The limiting factors for spring Chinook were determined by using EDT to analyzehabitat conditions on a reach-by-reach basis throughout the McKenzie Subbasin and in theWillamette River.
Focal species present:• Cutthroat trout• Spring Chinook salmon• Oregon chub (lower subbasin only)• Bull trout
Geographic Setting. The McKenzie River is approximately 90 miles long and drains anarea of about 1,300 square miles in the western cascades and on the floor of the WillametteValley (see Appendix H for a map of the McKenzie Subbasin). Horse Creek, the South ForkMcKenzie River, and Blue River are major tributaries in the upper subbasin. Majortributaries in the lower subbasin include Quartz, Gate, and Martin creeks and the MohawkRiver.
The McKenzie River begins at Clear Lake, and the headwaters are high in the CascadeMountains, which are characterized by a broad, gently sloping volcanic ridge that extendswest from the Three Sisters volcanoes. Elevations in the subbasin range from 375 near theMcKenzie River’s confluence with the Willamette River to 10,358 feet at the summit of theSouth Sister. Below the lava field and summits of the High Cascades, the upper subbasin ismountainous, with steep ridges and a narrow band of level land in the valleys along theMcKenzie River and larger tributaries. For the lower 40 miles, the McKenzie River meandersthrough the broad Willamette Valley. The river’s channel slope decreases from 1.2 percentupstream of Belknap Springs (RM 75) in the upper subbasin to less than 0.4 percent throughthe glacial valley just upriver from Blue River Downstream of the confluence of theMcKenzie River and Blue River (RM 57), the channel slope remains between 0.2 percent and0.4 percent, but the channel is more confined within a canyon for approximately 20 miles.The slope flattens to less than 0.2 percent when the river enters the wide, unconstrainedfloodplain in the Willamette Valley (RM 37).
DRAFT WILLAMETTE SUBBASIN PLAN
CH 3 ASSESSMENT.DOC 3-509
The federal government manages approximately 70 percent of the land in the McKenzieSubbasin. The Willamette National Forest manages 99 percent of the upper McKenzieSubbasin (above Quartz Creek, RM 54), while the BLM manages tracts in the middleportions of the subbasin and the Mohawk Subbasin. The lower McKenzie Subbasin isprimarily in private ownership and includes portions of the urban growth boundaries ofEugene and Springfield. Springfield is the largest town in the subbasin (populationapproximately 52,000; PSU, 1998). Many other small communities and rural residential areasare located along the McKenzie River within the Mohawk River Valley; these include thetowns of Vida, McKenzie Bridge, and Marcola. Almost the entire floodplain of the lowerMcKenzie Subbasin is privately owned, primarily as agricultural or residential lands (MWC,1996). The subbasin is heavily used for recreation and is one of the most popular rivers forfishing and boating in Oregon (U.S. Army Corps of Engineers, 2000).
The McKenzie River’s peak and low flow runoff patterns are controlled by the uppersubbasin’s High Cascades geology. Vast areas of porous lava in the headwaters of the riverstore water in deep groundwater systems that are released through relatively constant-flowingsprings. These springs and other groundwater sources in the upper subbasin provide most ofthe river’s volume. Because the river is dominated by these groundwater sources of flow, theMcKenzie River exhibits more consistent summer flows, lower water temperatures, andhigher water quality than do rivers in neighboring basins. In contrast to the groundwaterdominated flow in the river’s mainstem and key tributaries (for example, Horse Creek andthe South Fork), the hydrologic regime of tributaries in the lower portions of the subbasinand the Mohawk Subbasin is controlled by snow melt and rain-on-snow events, which resultsin quick flood responses, lower summer flows, and higher water temperatures.
The headwaters of both Horse Creek and the South Fork McKenzie River originate in theThree Sisters Wilderness area and are dominated by mature and old-growth conifers. Inlower portions of the subbasin, younger conifers and deciduous trees make up much of theriparian vegetation along tributaries. Along most portions of the lower river, the extent offloodplain vegetation is restricted to a narrow band. While there are some large areas withfloodplain forests, most of the remaining patches are interspersed with agricultural lands,highways, and urban and residential development.
Key Findings. For the McKenzie River spring Chinook salmon population, the currentpotential is about 18 percent of that under the reference habitat conditions. This change in thespring Chinook salmon population is a measure of the overall degradation of conditions inthe McKenzie Subbasin, primarily as a result of anthropogenic changes to habitat andwatershed processes in the McKenzie River, the South Fork McKenzie River, largerspawning tributaries, and the lower Willamette River. Major factors contributing to thedecline in spring Chinook salmon populations are changes in riparian conditions, modifiedflow regimes, obstructions to fish passage, and impacts to the amount and quality of aquatichabitat.
Dams. The subbasin’s U.S. Army Corps of Engineers and Eugene Water & Electric Board(EWEB) dams have restricted access to historical spawning areas in the upper McKenzieRiver, Blue River, and the South Fork. These dams have also altered downstream hydrologicprocesses, water quality, and habitat formation, in part by trapping sediment and large woodfrom headwaters.

DRAFT WILLAMETTE SUBBASIN PLAN
3-510 CH 3 ASSESSMENT.DOC
Appendix X shows specific fish passage barriers on the McKenzie, based on May 2004 datafrom ODFW; the information was compiled from existing ODFW databases.
Large Wood. Trail Bridge Dam in the Upper McKenzie River (RM 82) and, to a greaterextent, Cougar Dam on the South Fork McKenzie River and Blue River Dam on the BlueRiver, intercept large wood and sediment from 35 percent of the McKenzie’s headwaters.Historical removal of large wood from the river and tributary streams, reduced transport ofwood below the dams, and changes in riparian vegetation all have interacted to reduce thequantity and distribution of large wood in the river and tributaries.
Water Temperature. Release patterns from Blue River and Cougar dams have changed theriver’s water temperature regime from historical conditions, such that cooler water releasedduring the late spring and summer impedes the upstream migration of spring Chinook salmonand warmer fall and winter temperatures accelerate egg incubation and fry emergence.Improvements to the water release facilities at Cougar Dam are expected to improve watertemperature conditions in the South Fork McKenzie River and enhance spring Chinooksurvival. In addition to modifying the river’s flow patterns from the dams, flow diversions atEWEB’s Leaburg and Walterville projects have altered summertime habitat by reducing flowfor a number of reaches along the lower river.
Channel Modification. Much of the lower McKenzie River has been simplified andchannelized. Flood control operations at the Cougar and Blue River dams have reduced themagnitude and frequency of peak flows. Reductions in the peak flows that historicallymaintained the dynamic river channel, in combination with reduced delivery of large wood inthe channel, has resulted in fewer side channels and other backwater features in the lowerriver. The mainstem McKenzie below the Deerhorn Park (RM 32) has lost most of its islandsand side channels. In addition, the river’s channel substrate appears to have coarseneddownstream of EWEB and U.S. Army Corps of Engineers projects, which may be affectingthe availability of spawning gravel in the McKenzie River.
Limiting Factors for Cutthroat Trout. All cutthroat trout in the McKenzie Subbasin spawnin the smaller tributaries. McKenzie cutthroat trout exhibit three life history patterns (Howellet al., 1988):
• Isolated Resident: Populations above impassible barriers that have very restrictedmovement through their life cycle.
• Resident: Populations that reside below barriers and will move upstream anddownstream and into smaller tributaries for spawning.
• Fluvial: Juveniles rear in the small to mid-sized tributaries, move down into theMcKenzie or upper Willamette River to mature, and return to smaller tributaries tospawn.
Cutthroat trout are found throughout the McKenzie Subbasin, including in areas aboveTamolitch Falls and in small, high-gradient tributaries above the distribution of rainbowtrout. During the late spring and summer, cutthroat trout are more numerous than rainbowtrout in the lower McKenzie River mainstem up to Hayden Bridge (RM 11.4). This lowerMcKenzie population of fluvial cutthroat trout declines in the fall and winter as fish moveinto lower McKenzie and Mohawk Watershed tributaries (Howell et al., 1988).

DRAFT WILLAMETTE SUBBASIN PLAN
CH 3 ASSESSMENT.DOC 3-511
Cutthroat trout in the McKenzie Subbasin face similar challenges as they do in othersubbasins in the Willamette Valley: loss of connectivity between habitats as a result ofimpassible dams, culverts, and other obstructions; modifications in habitat-forming processthat create and sustain complex pools, cover, and other habitats; reduced key habitats fromchannelization and wood removal; and increased water temperatures from reduced ripariancover and water withdrawals. Table 3-174 summarizes how changes in the subbasin’senvironmental conditions have affected all life stages of cutthroat trout.

DRAFT WILLAMETTE SUBBASIN PLAN
3-512 CH 3 ASSESSMENT.DOC
Table 3-174: McKenzie Subbasin: Subbasin Attributes Affecting Cutthroat Trout Life Stages
Species Life Stage Water Quality and Quantity Habitat ConnectivityAquatic and Riparian Habitat
Characteristics and Processes Other Impacts
CutthroatTrout
All lifestages
Low flows in the basin areaggravated by waterwithdrawals, which increasewater temperatures.
High water temperatures,particularly in the Mohawk Riverand tributaries in the middle andlower portions of the watershed,are aggravated by loss ofriparian cover, reduced wetlandareas, and channel simplification.
Numerous culverts throughout thewatershed present barriers to adultmovement and juvenile access torearing and refuge habitat.
Cougar Dam, Blue River Dam, andthe dams associated with theCarmen-Smith project restrictmovement within the river channeland isolate populations.
Channels in the lower portions of theriver and some tributaries have beensimplified by revetments and otheractions.
Limited wood in the tributaries andriver channel has reduced thefrequency and depth of pools andlimited adult hiding cover and thequality of juvenile rearing and refugehabitats.
Riparian areas along the river andtributaries are reduced in width,connectivity, and quality; there arelimited conifers along the middleportions of the river and mosttributary streams.
Reed canary grass and Himalayanblackberry in the aquatic and riparianarea limit the growth of robust nativevegetation needed for habitat andchannel formation processes.
The loss of wetland, floodplain, andoff-channel habitats has affected thequantity and quality of adult holdingareas and refuge habitats.
Limited wood in tributary streams hasreduced retention of spawninggravels.
Introduced fishspecies (small- andlarge-mouth bass,for example) mayprey on juveniles.
DRAFT WILLAMETTE SUBBASIN PLAN
CH 3 ASSESSMENT.DOC 3-513
Table 3-175 shows EDT attributes related to the limiting factors for all life stages of cutthroattrout in the lower McKenzie Subbasin, while Table 3-176 shows attributes for the uppersubbasin. The priorities are based on information in Table 3-174 and professional opinionsfrom individuals familiar with the subbasin.
Table 3-175: Qualitative Ratings of EDT attributes Related to Limiting Factors for CutthroatTrout in the Lower McKenzie River Subbasin
EDT Attribute Class DescriptionPriority forRestoration
Flow Changes in the interannual variability of low and high flowsfrom dam regulation have affected the quantity of habitat anddisrupted the processes that create a complex array ofhabitats.
HIGH
Habitat diversity Extensive channel confinement through the river corridor asa result of bank riprap and revetments; loss of floodplain andriparian trees and limited wood in the river and tributarychannels.
HIGH
Obstructions Dams prevent upstream and downstream movement andisolate populations; numerous complete and partial barrierson tributary streams.
HIGH
Temperature Changes in riparian canopy cover have increased summerhigh water temperatures on some tributary streams.
HIGH
Key habitats Reduction of the following key channel habitats affects keylife stages: small cobble/gravel riffles in the river (spawningand incubation); primary pools, backwater areas, and largewood (0- and 1-age rearing and migration).
HIGH
Channel stability Limited wood in channels has reduced channel stability. Medium
Competition w/hatch. Hatchery fish have been introduced to some areas below thedams, increasing competition with native fish for habitat andfood.
Medium
Withdrawals Water withdrawals and diversions within the river affect adultmigration, juvenile rearing, and juvenile movement.
Medium
Chemicals No evidence of levels of toxics sufficient to affect salmonids. Low
Competition w/sp. Very low number of fish species present. Low
Food Salmon carcasses are reduced from historical levels, limitingnutrient inputs to the system and thus food availability forrearing fish.
Low
Harassment Harassment is not an issue for adult cutthroat trout. Low
Oxygen Oxygen levels are adequate to support all life stages Low
Pathogens Hatchery fish have been introduced to areas below thedams, increasing competition with native fish for habitat andfood.
Low
Sediment load Although turbidity levels are periodically high, there does notappear to be increased sediment deposition.
Low

DRAFT WILLAMETTE SUBBASIN PLAN
3-514 CH 3 ASSESSMENT.DOC
Table 3-176: Qualitative Ratings of EDT Attributes Related to Limiting Factors for CutthroatTrout in the McKenzie River Subbasin
EDT Attribute Class DescriptionPriority forRestoration
Habitat diversity Moderate channel confinement through the river corridor asa result of bank riprap along the highway and secondaryroads. Limited large wood has affected the quality of habitat.
HIGH
Key habitats Reduction of the following key channel habitats affects keylife stages: primary pools, backwater areas, and large wood.
HIGH
Competition w/hatch. Hatchery fish have been introduced to areas above thedams, increasing competition with native fish for habitat andfood.
Medium
Channel stability In some areas, limited in-channel wood has destabilizedchannels.
Medium
Obstructions Some complete and partial barriers on tributary streams. Medium
Temperature Changes in riparian canopy cover have increased summerhigh water temperatures on some tributary streams.
Medium
Chemicals No evidence of levels of toxics sufficient to affect salmonids. Low
Competition w/sp. Very low number of fish species present. Low
Flow There have not been significant changes in the interannualvariability of low and high flows.
Low
Food Salmon carcasses are reduced from historical levels, limitingnutrient inputs to the system and food availability for rearingfish.
Low
Harassment Harassment is not an issue for adult cutthroat trout . Low
Oxygen Oxygen levels are adequate to support all life stages. Low
Pathogens Hatchery fish have been introduced to areas above thedams, increasing competition with native fish for habitat andfood.
Low
Sediment load Although turbidity levels are periodically high, there does notappear to be increased sediment deposition.
Low
Withdrawals Minimal water withdrawals. Low
Limiting Factors for Oregon Chub. Oregon chub were found in the McKenzie Riverhistorically; one record exists for chub near Eugene in 1899. Currently, there are two naturaland one introduced populations in this subbasin, two of which are in the Mohawk River.Oregon chub were introduced to Russell Pond (in the Mohawk near Marcola) in 2001 andwere first documented in Shetzline Pond (in the Mohawk near Marcola) and Big Island (inthe McKenzie River near Springfield) in 2002 (Paul Scheerer, ODFW, personalcommunication, 2004). These populations were discovered after the Oregon Chub RecoveryPlan (U.S. Fish and Wildlife Service, 1998) was developed, so the McKenzie Subbasin wasnot factored into the recovery strategy at that time. However, since these new populationswere discovered, the McKenzie Subbasin has received considerable attention and has been

DRAFT WILLAMETTE SUBBASIN PLAN
CH 3 ASSESSMENT.DOC 3-515
included in recovery planning for Oregon chub. To date, Oregon chub have not beendocumented in the upper McKenzie subbasin.
Oregon chub face similar challenges in the McKenzie subbasin as in the other subbasins ofthe Willamette Valley: habitat loss as a result of changes in seasonal flows associated withthe construction of dams throughout the basin; channelization of the river and its tributaries;removal of snags for river navigation; the proliferation of nonnative fish and amphibians;accidental chemical spills; runoff from herbicide or pesticide application on farms,timberlands, or along roadways, railways, and power line rights-of-way; desiccation ofhabitats; unauthorized water withdrawals, diversions, or fill and removal activities; andsedimentation resulting from timber harvesting in the watershed. Table 3-177 summarizeshow changes in the subbasin’s environmental conditions have affected all life stages ofOregon chub.
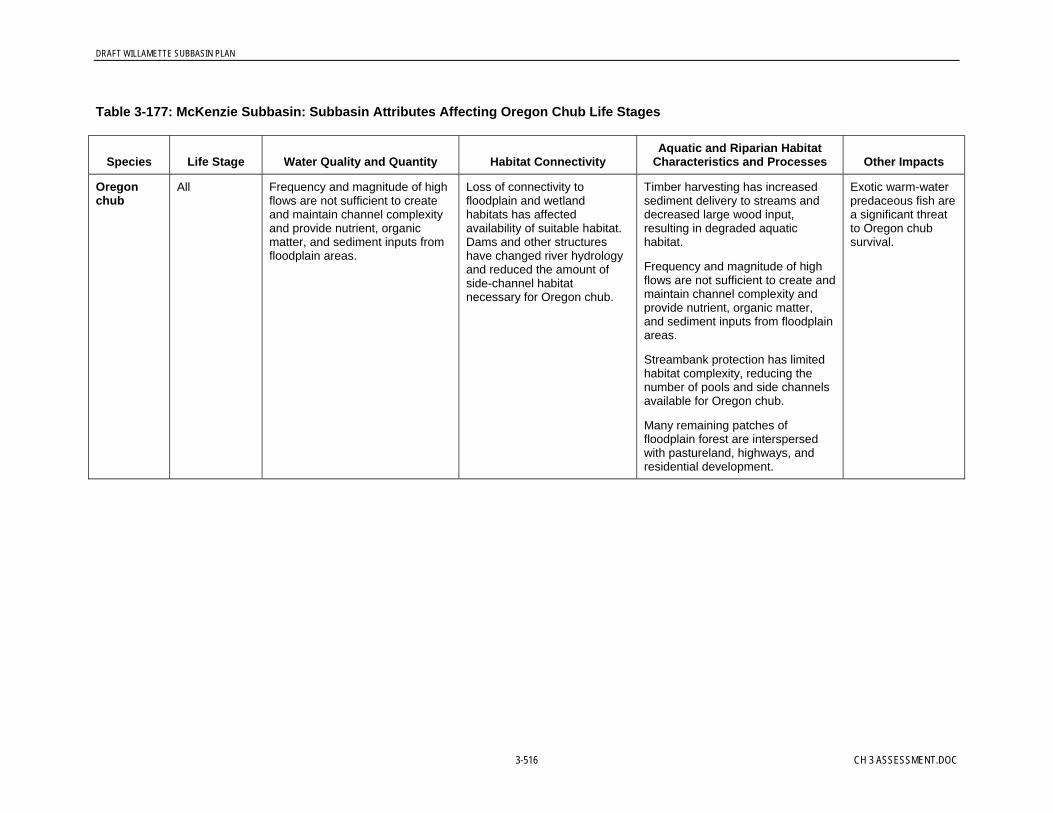
DRAFT WILLAMETTE SUBBASIN PLAN
3-516 CH 3 ASSESSMENT.DOC
Table 3-177: McKenzie Subbasin: Subbasin Attributes Affecting Oregon Chub Life Stages
Species Life Stage Water Quality and Quantity Habitat ConnectivityAquatic and Riparian Habitat
Characteristics and Processes Other Impacts
Oregonchub
All Frequency and magnitude of highflows are not sufficient to createand maintain channel complexityand provide nutrient, organicmatter, and sediment inputs fromfloodplain areas.
Loss of connectivity tofloodplain and wetlandhabitats has affectedavailability of suitable habitat.Dams and other structureshave changed river hydrologyand reduced the amount ofside-channel habitatnecessary for Oregon chub.
Timber harvesting has increasedsediment delivery to streams anddecreased large wood input,resulting in degraded aquatichabitat.
Frequency and magnitude of highflows are not sufficient to create andmaintain channel complexity andprovide nutrient, organic matter,and sediment inputs from floodplainareas.
Streambank protection has limitedhabitat complexity, reducing thenumber of pools and side channelsavailable for Oregon chub.
Many remaining patches offloodplain forest are interspersedwith pastureland, highways, andresidential development.
Exotic warm-waterpredaceous fish area significant threatto Oregon chubsurvival.

DRAFT WILLAMETTE SUBBASIN PLAN
CH 3 ASSESSMENT.DOC 3-517
Table 3-178 shows the EDT attributes related to the limiting factors for Oregon chub in thelower McKenzie Subbasin. The priorities for restoration are based on the information inTable-177 and professional opinions from individuals familiar with the Subbasin, particularlyODFW biologists.
Table 3-178: Qualitative Ratings of EDT Attributes Related to Limiting Factors for Oregonin the Lower McKenzie
EDT Attribute Class DescriptionPriority forRestoration
Competition with otherspecies
Exotic fish species pose a significant threat throughpredation and competition.
HIGH
Habitat diversity Changes in hydrologic flow regimes have reduced theamount of off-channel habitat in side channels, sloughs, andother slow-moving water.
HIGH
Key habitats Reduction of the following key channel habitats affects all lifestages: backwater sloughs, channels, and other low-velocitywaterways.
HIGH
Flow Changes in the interannual variability of low and high flowsas a result of dam regulation affect the quantity of habitatand disrupt the processes that create a complex array ofhabitats.
Medium
Withdrawals Unauthorized withdrawals have the potential to disrupt flowsand reduce the amount and quality of habitat.
Medium
Chemicals Oregon chub habitats are susceptible to reduced waterquality from commercial timber operations, agricultural,residential, and highway runoff.
Low
Oxygen Oxygen levels are not known to be affecting Oregon chub inthis subbasin.
Low
Pathogens Pathogens are not thought to be limiting. Low
Sediment load Although turbidity levels are periodically high, sedimentdeposition does not appear to be affecting known Oregonchub populations.
Low
Limiting Factors for Bull Trout. There are currently three populations of bull trout in theMcKenzie Subbasin, found in the following locations:
• The mainstem McKenzie River and tributaries up to Trail Bridge Dam• The McKenzie River and tributaries from Trail Bridge Dam up to Tamolitch Falls
The South Fork McKenzie River above Cougar Dam.
These populations were formed artificially in the early 1960s when dam constructionfragmented the original McKenzie population.
Of these, the population inhabiting the mainstem is the largest and most secure. Andersonand Olallie creeks are key spawning and juvenile rearing areas and are relatively protected byU.S. Forest Service land management direction. Anderson Creek may be at carrying capacity

DRAFT WILLAMETTE SUBBASIN PLAN
3-518 CH 3 ASSESSMENT.DOC
for rearing juvenile bull trout, based on the number of adults spawning and the number ofboth fry and juvenile bull trout migrating from the creek. Opening upstream passage for adultbull trout under Highway 126 on Olallie Creek in 1995 may have doubled the area availablefor rearing juvenile bull trout. This area had been inaccessible to bull trout since the highwaywas constructed in the early 1960s. This population is still vulnerable to incidental harvest inrecreational fisheries; however, it is expected that the mainstem McKenzie population willcontinue to slowly increase in the foreseeable future.
Bull trout inhabiting the mainstem McKenzie above Trailbridge Reservoir are probablyseverely limited by a lack of juvenile rearing habitat, and their population is reduced becauseof angling, even though angling regulations requiring the release of bull trout in theWillamette Basin were adopted in 1990. Reestablishing bull trout spawning in SweetwaterCreek has increased juvenile rearing area for this population; however, the success of thisintroduction effort is still uncertain. Brook trout are well established in Trail BridgeReservoir and the watershed above the reservoir, and competition and hybridization betweenbrook trout and bull trout are a limiting factor for this population. It is unlikely thateliminating or even reducing brook trout is feasible. Little data exist on the number of bulltrout passing downstream through Trailbridge Dam; however, it is likely that fish passage atTrailbridge Dam will need to be established to maintain this population.
Angling has probably limited the number of older fish in the South Fork McKenziepopulation. Regulations requiring the release of bull trout have generally been accepted,although some harvest still occurs as a result of misidentification and illegal taking. Thepopularity of this river for angling was due in part to the release of legal-sized rainbow trout,easy access, and numerous campsites. Beginning in 1997, legal-sized rainbow trout were nolonger stocked in the South Fork McKenzie above Cougar Reservoir, so as to reduceincidental angling mortality on bull trout. Recent intensive monitoring of the local populationof bull trout in the South Fork McKenzie by ODFW, in association with the U.S. ArmyCorps of Engineers’ Cougar Dam Water Temperature Control Project, has shown asignificant number of bull trout passing downstream of Cougar Dam. To maintain thispopulation, it will be essential that fish passage at Cougar Dam be restored.
All bull trout in the McKenzie Subbasin are sensitive to habitat alteration from roadconstruction and timber harvesting, loss of juvenile spring Chinook as a food source,mortality from angling, loss of migration corridors because of man-made obstructions, andcompetition with nonnative brook trout. Table 3-179 summarizes how changes in theMcKenzie Subbasin’s environmental conditions have affected all life stages of bull trout.
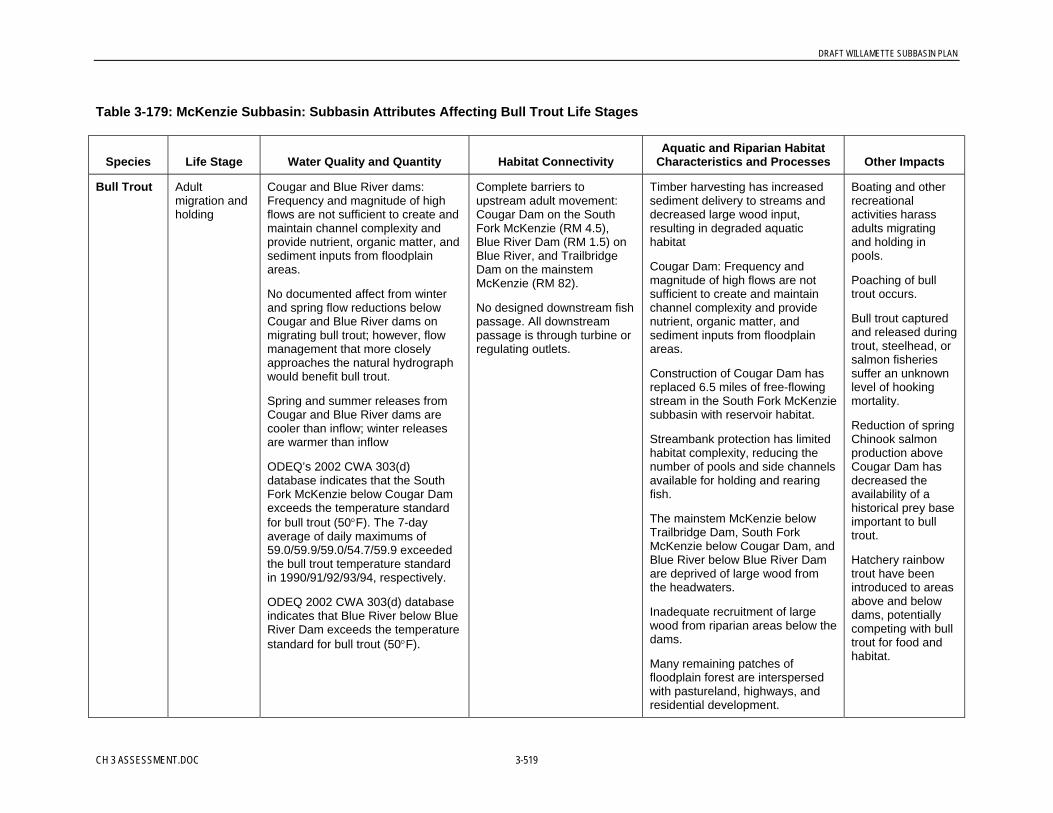
DRAFT WILLAMETTE SUBBASIN PLAN
CH 3 ASSESSMENT.DOC 3-519
Table 3-179: McKenzie Subbasin: Subbasin Attributes Affecting Bull Trout Life Stages
Species Life Stage Water Quality and Quantity Habitat ConnectivityAquatic and Riparian Habitat
Characteristics and Processes Other Impacts
Bull Trout Adultmigration andholding
Cougar and Blue River dams:Frequency and magnitude of highflows are not sufficient to create andmaintain channel complexity andprovide nutrient, organic matter, andsediment inputs from floodplainareas.
No documented affect from winterand spring flow reductions belowCougar and Blue River dams onmigrating bull trout; however, flowmanagement that more closelyapproaches the natural hydrographwould benefit bull trout.
Spring and summer releases fromCougar and Blue River dams arecooler than inflow; winter releasesare warmer than inflow
ODEQ’s 2002 CWA 303(d)database indicates that the SouthFork McKenzie below Cougar Damexceeds the temperature standardfor bull trout (50°F). The 7-dayaverage of daily maximums of59.0/59.9/59.0/54.7/59.9 exceededthe bull trout temperature standardin 1990/91/92/93/94, respectively.
ODEQ 2002 CWA 303(d) databaseindicates that Blue River below BlueRiver Dam exceeds the temperaturestandard for bull trout (50°F).
Complete barriers toupstream adult movement:Cougar Dam on the SouthFork McKenzie (RM 4.5),Blue River Dam (RM 1.5) onBlue River, and TrailbridgeDam on the mainstemMcKenzie (RM 82).
No designed downstream fishpassage. All downstreampassage is through turbine orregulating outlets.
Timber harvesting has increasedsediment delivery to streams anddecreased large wood input,resulting in degraded aquatichabitat
Cougar Dam: Frequency andmagnitude of high flows are notsufficient to create and maintainchannel complexity and providenutrient, organic matter, andsediment inputs from floodplainareas.
Construction of Cougar Dam hasreplaced 6.5 miles of free-flowingstream in the South Fork McKenziesubbasin with reservoir habitat.
Streambank protection has limitedhabitat complexity, reducing thenumber of pools and side channelsavailable for holding and rearingfish.
The mainstem McKenzie belowTrailbridge Dam, South ForkMcKenzie below Cougar Dam, andBlue River below Blue River Damare deprived of large wood fromthe headwaters.
Inadequate recruitment of largewood from riparian areas below thedams.
Many remaining patches offloodplain forest are interspersedwith pastureland, highways, andresidential development.
Boating and otherrecreationalactivities harassadults migratingand holding inpools.
Poaching of bulltrout occurs.
Bull trout capturedand released duringtrout, steelhead, orsalmon fisheriessuffer an unknownlevel of hookingmortality.
Reduction of springChinook salmonproduction aboveCougar Dam hasdecreased theavailability of ahistorical prey baseimportant to bulltrout.
Hatchery rainbowtrout have beenintroduced to areasabove and belowdams, potentiallycompeting with bulltrout for food andhabitat.

DRAFT WILLAMETTE SUBBASIN PLAN
3-520 CH 3 ASSESSMENT.DOC
Table 3-179: McKenzie Subbasin: Subbasin Attributes Affecting Bull Trout Life Stages
Species Life Stage Water Quality and Quantity Habitat ConnectivityAquatic and Riparian Habitat
Characteristics and Processes Other Impacts
Adultspawning/eggincubation
Complete barriers toupstream adult movement:Cougar Dam on the SouthFork McKenzie (RM 4.5),Blue River Dam (RM 1.5) onBlue River, and TrailbridgeDam on the mainstemMcKenzie (RM 82).
No designed downstream fishpassage. All downstreampassage is through turbine orregulating outlets.
Numerous partial andcomplete passage barriers atculverts on tributary streamsmay limit movement intorefuge habitat.
Timber harvesting has increasedsediment delivery to streams anddecreased large wood input,resulting in degraded aquatichabitat
Hybridization withnonnative brooktrout.
Fry andjuvenilerearing andmigration
ODEQ 2002 CWA 303(d) databaseindicates that the South ForkMcKenzie below Cougar Damexceeds the temperature standardfor bull trout (50°F). The 7-dayaverage of daily maximums of59.0/59.9/59.0/54.7/59.9 exceededthe bull trout temperature standardin 1990/91/92/93/94, respectively.
ODEQ 2002 CWA 303(d) databaseindicates that Blue River below BlueRiver Dam exceeds the temperaturestandard for bull trout (50°F).
Complete barriers toupstream juvenile movement:Cougar Dam on the SouthFork McKenzie (RM 4.5),Blue River Dam (RM 1.5) onBlue River, and TrailbridgeDam on the mainstemMcKenzie (RM 82).
No designed downstream fishpassage. All downstreampassage is through turbine orregulating outlets.
Numerous partial andcomplete passage barriers atculverts on tributary streamsmay limit movement intorefuge habitat.
Timber harvesting has increasedsediment delivery to streams anddecreased large wood input,resulting in degraded aquatichabitat
Streambank protection has limitedhabitat complexity, reducing thenumber of pools and side channelsavailable for holding and rearingfish.
Salmon carcassesare reduced fromhistorical levels,limiting nutrientinputs to thesystem and thusfood availability forrearing fish.

DRAFT WILLAMETTE SUBBASIN PLAN
CH 3 ASSESSMENT.DOC 3-521
Table 3-180 shows the EDT attributes related to the limiting factors for bull trout in the lowerMcKenzie Subbasin, while Table 3-181 shows the attributes for limiting factors in the uppersubbasin. The priorities for restoration are qualitative ratings based on the information inTable 3-179 and professional opinions from individuals familiar with the subbasin,particularly ODFW biologists.
Table 3-180: Qualitative Ratings of EDT Attributes Related to Limiting Factors for BullTrout in the Lower McKenzie
EDT Attribute Class DescriptionPriority forRestoration
Flow There have been impacts to the interannual variability of lowand high flows from land use practices and water diversions(see Table 3).
HIGH
Habitat diversity Extensive channel confinement through the river corridor asa result of bank riprap and revetments; loss of floodplain andriparian trees and limited wood in the river and tributarychannels (see Table 3).
HIGH
Obstructions Numerous culverts are complete and partial barriers ontributary streams (see Table 3).
HIGH
Temperature Changes in riparian canopy cover and water withdrawalshave increased summer high water temperatures on sometributary streams (see Table 3).
HIGH
Key habitats Reduction of the following key channel habitats affects keylife stages: primary pools, backwater areas, and large wood(0- and 1-age rearing and migration) (see Table 3).
HIGH
Channel stability Limited wood in channels and reduced riparian function havereduced channel stability (see Table 3).
Medium
Chemicals Increased toxics, particularly from urban and agriculturalrunoff, may affect salmonids (Mamoyac, ODFW, personalcommunication, 2004).
Medium
Competition with otherspecies
Fish community richness is high and there is competitionwith introduced fish (Mamoyac, ODFW, personalcommunication, 2004).
Medium
Withdrawals Some problems from unscreened diversions (Mamoyac,ODFW, personal communication, 2004).
Medium
Competition with hatcheryfish
Competition with hatchery fish is not believed to besignificant (Mamoyac, ODFW, personal communication,2004).
Low
Food Historically low salmon carcasses abundance. Low
Harassment Prespawning fish do not hold in the river channels. Low
Oxygen Oxygen levels are not known to be affecting bull trout. Low
Pathogens Pathogens are not thought to be limiting (Mamoyac, ODFW,personal communication, 2004).
Low
Sediment load Although turbidity levels are periodically high, sedimentdeposition does not appear to be affecting spawning areas(Mamoyac, ODFW, personal communication, 2004).
Low
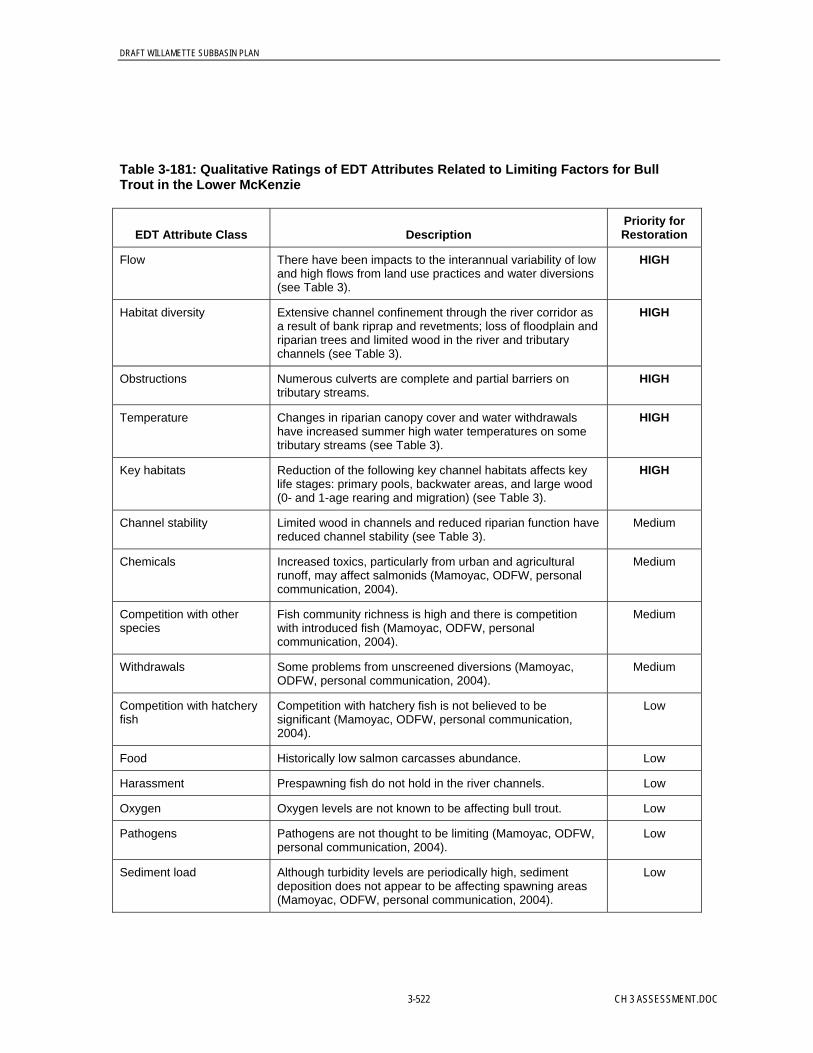
DRAFT WILLAMETTE SUBBASIN PLAN
3-522 CH 3 ASSESSMENT.DOC
Table 3-181: Qualitative Ratings of EDT Attributes Related to Limiting Factors for BullTrout in the Lower McKenzie
EDT Attribute Class DescriptionPriority forRestoration
Flow There have been impacts to the interannual variability of lowand high flows from land use practices and water diversions(see Table 3).
HIGH
Habitat diversity Extensive channel confinement through the river corridor asa result of bank riprap and revetments; loss of floodplain andriparian trees and limited wood in the river and tributarychannels (see Table 3).
HIGH
Obstructions Numerous culverts are complete and partial barriers ontributary streams.
HIGH
Temperature Changes in riparian canopy cover and water withdrawalshave increased summer high water temperatures on sometributary streams (see Table 3).
HIGH
Key habitats Reduction of the following key channel habitats affects keylife stages: primary pools, backwater areas, and large wood(0- and 1-age rearing and migration) (see Table 3).
HIGH
Channel stability Limited wood in channels and reduced riparian function havereduced channel stability (see Table 3).
Medium
Chemicals Increased toxics, particularly from urban and agriculturalrunoff, may affect salmonids (Mamoyac, ODFW, personalcommunication, 2004).
Medium
Competition with otherspecies
Fish community richness is high and there is competitionwith introduced fish (Mamoyac, ODFW, personalcommunication, 2004).
Medium
Withdrawals Some problems from unscreened diversions (Mamoyac,ODFW, personal communication, 2004).
Medium
Competition with hatcheryfish
Competition with hatchery fish is not believed to besignificant (Mamoyac, ODFW, personal communication,2004).
Low
Food Historically low salmon carcasses abundance. Low
Harassment Prespawning fish do not hold in the river channels. Low
Oxygen Oxygen levels are not known to be affecting bull trout. Low
Pathogens Pathogens are not thought to be limiting (Mamoyac, ODFW,personal communication, 2004).
Low
Sediment load Although turbidity levels are periodically high, sedimentdeposition does not appear to be affecting spawning areas(Mamoyac, ODFW, personal communication, 2004).
Low

DRAFT WILLAMETTE SUBBASIN PLAN
CH 3 ASSESSMENT.DOC 3-523
Limiting Factors for Spring Chinook. The McKenzie Subbasin is one of the few in theWillamette Basin to have undergone a detailed, reach-by-reach EDT analysis of its habitatconditions with respect to the population potential, capacity, productivity, abundance, anddiversity of one of the focal species of this plan: spring Chinook salmon. The other focalspecies in the McKenzie—cutthroat, winter steelhead, bull trout, and Oregon chub—have notyet been analyzed using EDT.
Appendix K presents a detailed description of the EDT analysis, including informationsources, assumptions, methodology, and limitations; results for specific geographic areas,including protection and restoration benefit rankings; and hypotheses regarding restorationand protection strategies The following subsection summarizes the information in theappendix.
EDT Approach. The EDT analysis was based on existing information on current andhistorical conditions in the McKenzie Subbasin and the upper Willamette River, fromEugene to Willamette Falls. These conditions included riparian and aquatic habitat, waterquality, hydrologic regime, fish passage, and biological characteristics. For the upperWillamette reaches, the EDT-calculated survival rate of juvenile spring Chinook wascalibrated using ODFW estimates of survival for wild yearling spring Chinook for the years1999 to 2001; this provided initial insights into the effect of Willamette River conditions onspring Chinook potential in the McKenzie River.
Three scenarios were part of the EDT analysis:
• Current conditions, based on existing empirical and expert knowledge regarding physicaland biological conditions in the McKenzie Subbasin. This scenario was described by theMcKenzie Watershed Council technical team.
• A reference or template condition that defined a fully restored condition for theMcKenzie River, its tributaries, and the downstream reaches of the Willamette River.This scenario also was described by the McKenzie Watershed Council technical team.
• A fully degraded condition for the system. This scenario is contained within the EDTmodel.
The EDT assessment of the McKenzie Subbasin and Willamette River was organizedhierarchically into 276 stream reaches and 11 geographic areas, as shown in Table 3-182 (seealso Appendix I).
Table 3-182: McKenzie Subbasin EDT Geographic Areas
Section Geographic Area Description
Upper McKenzie River The mainstem upstream of Quartz Creek (RM 54) to the end ofhistorical salmon spawning habitat
Upper McKenzie RiverTributaries
Horse Creek, Lost Creek, and other tributaries that have historicalChinook salmon spawning at Tamolitch Falls (RM 85)
McKenzieSubbasin
South Fork McKenzieRiver
The South Fork and larger tributaries (French Pete, Roaring Riverand others)

DRAFT WILLAMETTE SUBBASIN PLAN
3-524 CH 3 ASSESSMENT.DOC
Table 3-182: McKenzie Subbasin EDT Geographic Areas
Section Geographic Area Description
Blue River Blue River and key tributaries
Lower McKenzie River The mainstem from the Willamette River to Quartz Creek
Lower McKenzie RiverTributaries
Larger tributaries (Cedar, Gate, and Martin and others) up to andincluding Quartz Creek
Mohawk Subbasin Mohawk River, Mill Creek, and other larger tributaries
Eugene From the confluence with the McKenzie River to the confluencewith the Santiam and Luckiamute rivers
Salem Mainstem from the confluence with the Santiam/LuckiamuteRivers to the confluence with the Yamhill River
Newberg Mainstem from the confluence with the Yamhill River to WillametteFalls
Willamette River
Portland Willamette Falls to the confluence with the Columbia River
EDT Results. EDT assesses habitat in terms of four output parameters:
• Biological capacity (quantity of habitat)• Biological productivity (quality of habitat)• Equilibrium abundance (quantity and quality of habitat)• Life history diversity (breadth of suitable habitat)
Parameters for McKenzie spring Chinook salmon population are provided in Table 3-183.Capacity and productivity are parameters of a Beverton-Holt production function; abundanceis calculated from this relationship. Life history diversity is listed as a diversity index that isthe percentage of viable trajectories sustainable under the current condition relative to thereference condition.
Table 3-183: Capacity, Productivity, Abundance, and Diversity of McKenzie River Spring ChinookSalmon, Estimated as a Function of Habitat
Scenario Capacity Productivity1 Abundance2 Diversity Index3
Current with harvest 18,914 8.3 16,648 68%
Reference (template condition) 95,179 29.3 91,929 97%
1 Productivity is the density independent survival rate in a Beverton-Holt production function measured as return /spawner.
2 Abundance is the equilibrium abundance in a Beverton-Holt production function.3 Diversity index is the percentage of sustainable life history trajectories in the current condition relative to the
reference condition.
Figure 3-98 compares the estimated current abundance potential to the abundance potentialof the habitat under the reference or template condition. Population potential provides anassessment of the “size” and quality of the McKenzie River spring Chinook salmon
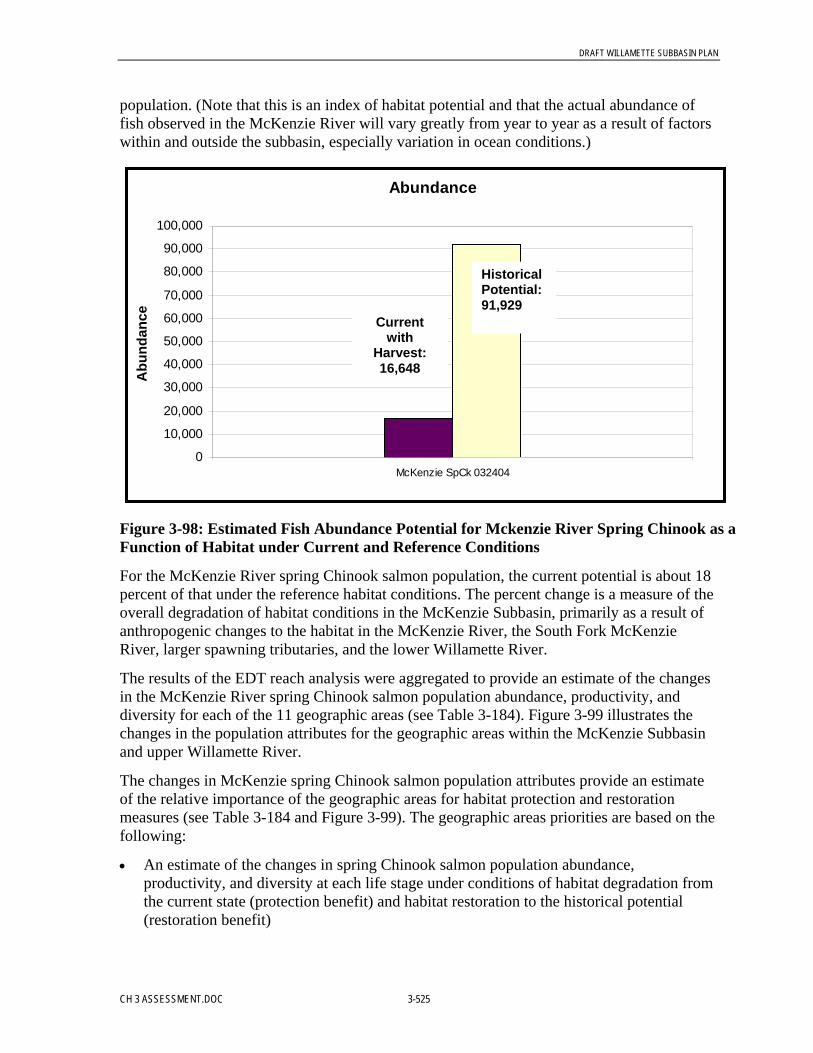
DRAFT WILLAMETTE SUBBASIN PLAN
CH 3 ASSESSMENT.DOC 3-525
population. (Note that this is an index of habitat potential and that the actual abundance offish observed in the McKenzie River will vary greatly from year to year as a result of factorswithin and outside the subbasin, especially variation in ocean conditions.)
Abundance
0
10,000
20,000
30,000
40,000
50,000
60,000
70,000
80,000
90,000
100,000
McKenzie SpCk 032404
Abu
ndan
ce
Figure 3-98: Estimated Fish Abundance Potential for Mckenzie River Spring Chinook as aFunction of Habitat under Current and Reference Conditions
For the McKenzie River spring Chinook salmon population, the current potential is about 18percent of that under the reference habitat conditions. The percent change is a measure of theoverall degradation of habitat conditions in the McKenzie Subbasin, primarily as a result ofanthropogenic changes to the habitat in the McKenzie River, the South Fork McKenzieRiver, larger spawning tributaries, and the lower Willamette River.
The results of the EDT reach analysis were aggregated to provide an estimate of the changesin the McKenzie River spring Chinook salmon population abundance, productivity, anddiversity for each of the 11 geographic areas (see Table 3-184). Figure 3-99 illustrates thechanges in the population attributes for the geographic areas within the McKenzie Subbasinand upper Willamette River.
The changes in McKenzie spring Chinook salmon population attributes provide an estimateof the relative importance of the geographic areas for habitat protection and restorationmeasures (see Table 3-184 and Figure 3-99). The geographic areas priorities are based on thefollowing:
• An estimate of the changes in spring Chinook salmon population abundance,productivity, and diversity at each life stage under conditions of habitat degradation fromthe current state (protection benefit) and habitat restoration to the historical potential(restoration benefit)
Currentwith
Harvest:16,648
HistoricalPotential:91,929

DRAFT WILLAMETTE SUBBASIN PLAN
3-526 CH 3 ASSESSMENT.DOC
• The extent to which the geographic area is used by each of the life stages
Table 3-184: Estimated Changes in Population Parameters for McKenzie River Spring Chinook, byGeographic Area
Percent Change in Parameter with Restoration
Geographic AreaRestoration
Rank Abundance Productivity Diversity
Lower McKenzie River 1 86% 52% 1%
South Fork McKenzie R. Subbasin 1 20% 13% 15%
Upper McKenzie River 2 22% 19% 3%
Willamette River, Eugene Reach 3 14% 9% 1%
Willamette River, Portland Reach 4 12% 11% 0%
Blue River Subbasin 5 5% 1% 8%
Willamette River, Salem Reach 6 8% 6% 0%
Upper McKenzie River Tributaries 7 7% 8% 0%
Mohawk River Subbasin 8 1% 0% 7%
Willamette River, Newberg Reach 9 6% 5% 0%
Lower McKenzie River Tributaries 10 1% 1% 0%

DRAFT WILLAMETTE SUBBASIN PLAN
CH 3 ASSESSMENT.DOC 3-527
Figure 3-99: Relative Importance of Geographic Areas for Protection and Restoration Measures for McKenzie River Spring Chinook
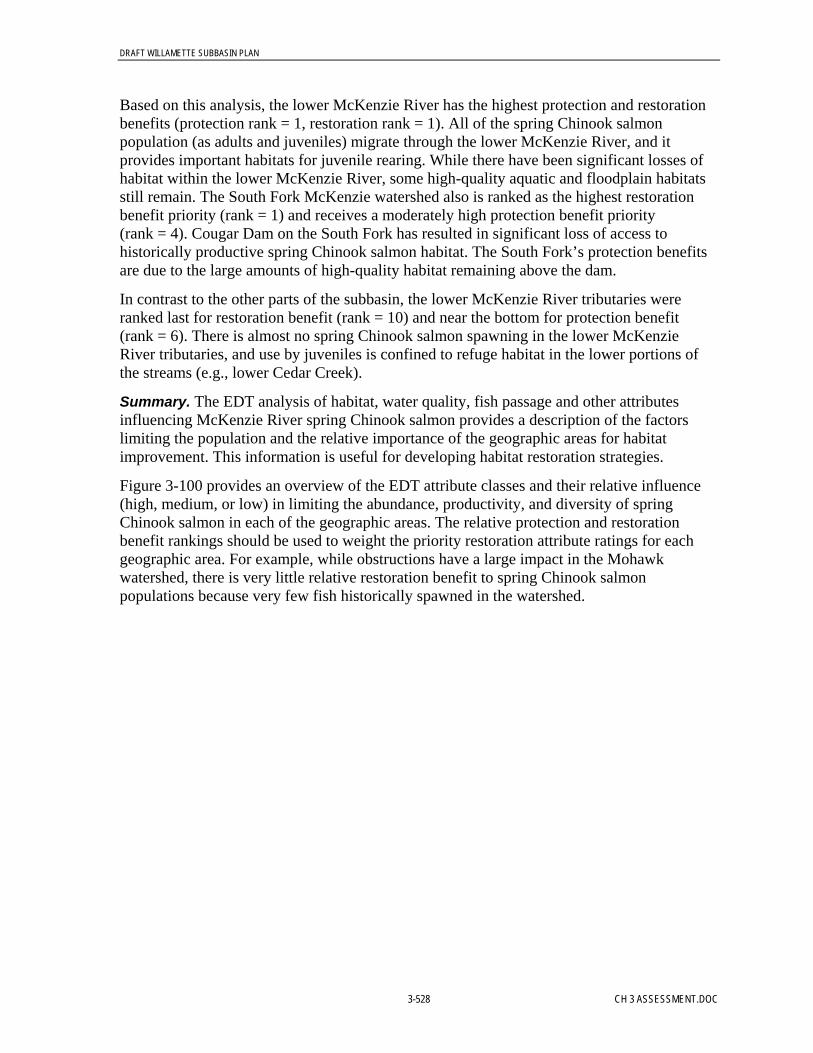
DRAFT WILLAMETTE SUBBASIN PLAN
3-528 CH 3 ASSESSMENT.DOC
Based on this analysis, the lower McKenzie River has the highest protection and restorationbenefits (protection rank = 1, restoration rank = 1). All of the spring Chinook salmonpopulation (as adults and juveniles) migrate through the lower McKenzie River, and itprovides important habitats for juvenile rearing. While there have been significant losses ofhabitat within the lower McKenzie River, some high-quality aquatic and floodplain habitatsstill remain. The South Fork McKenzie watershed also is ranked as the highest restorationbenefit priority (rank = 1) and receives a moderately high protection benefit priority(rank = 4). Cougar Dam on the South Fork has resulted in significant loss of access tohistorically productive spring Chinook salmon habitat. The South Fork’s protection benefitsare due to the large amounts of high-quality habitat remaining above the dam.
In contrast to the other parts of the subbasin, the lower McKenzie River tributaries wereranked last for restoration benefit (rank = 10) and near the bottom for protection benefit(rank = 6). There is almost no spring Chinook salmon spawning in the lower McKenzieRiver tributaries, and use by juveniles is confined to refuge habitat in the lower portions ofthe streams (e.g., lower Cedar Creek).
Summary. The EDT analysis of habitat, water quality, fish passage and other attributesinfluencing McKenzie River spring Chinook salmon provides a description of the factorslimiting the population and the relative importance of the geographic areas for habitatimprovement. This information is useful for developing habitat restoration strategies.
Figure 3-100 provides an overview of the EDT attribute classes and their relative influence(high, medium, or low) in limiting the abundance, productivity, and diversity of springChinook salmon in each of the geographic areas. The relative protection and restorationbenefit rankings should be used to weight the priority restoration attribute ratings for eachgeographic area. For example, while obstructions have a large impact in the Mohawkwatershed, there is very little relative restoration benefit to spring Chinook salmonpopulations because very few fish historically spawned in the watershed.
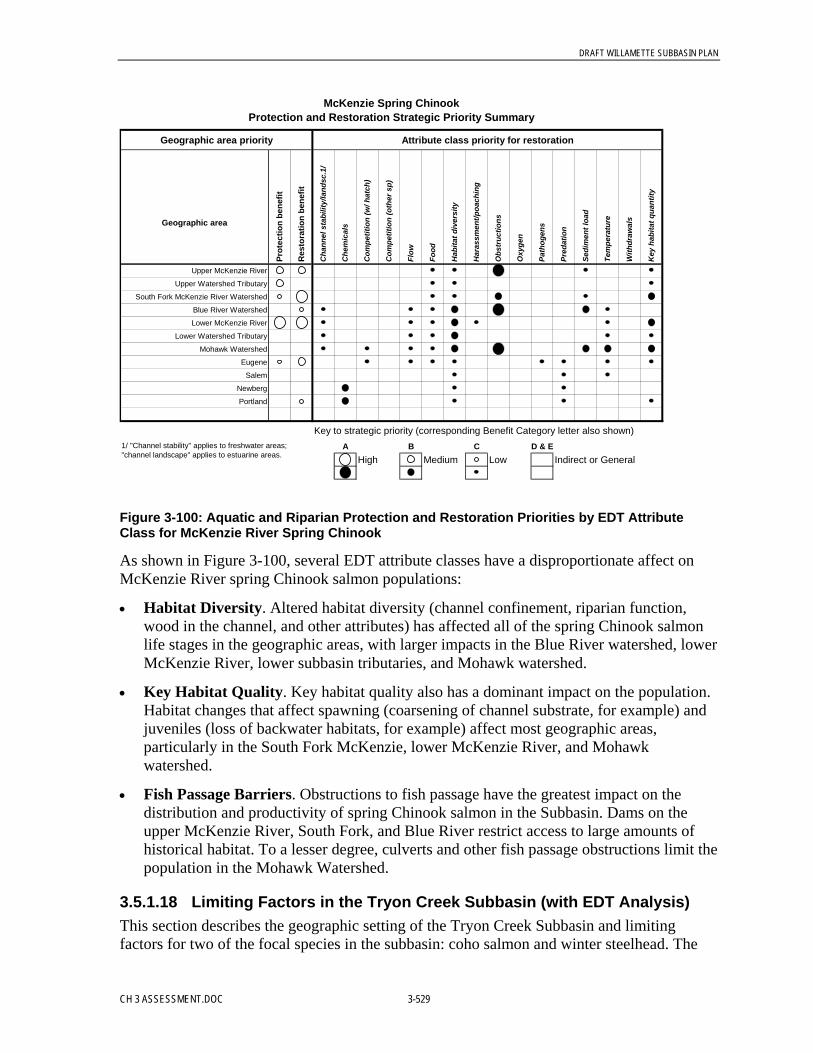
DRAFT WILLAMETTE SUBBASIN PLAN
CH 3 ASSESSMENT.DOC 3-529
McKenzie Spring ChinookProtection and Restoration Strategic Priority Summary
Attribute class priority for restoration
Upper McKenzie River
Upper Watershed Tributary
South Fork McKenzie River Watershed
Blue River Watershed
Lower McKenzie River
Lower Watershed Tributary
Mohawk Watershed
Eugene
Salem
Newberg
Portland
Key to strategic priority (corresponding Benefit Category letter also shown)A B C D & E
High Medium Low Indirect or General
Geographic area priority
1/ "Channel stability" applies to freshwater areas; "channel landscape" applies to estuarine areas.
Key
hab
itat q
uant
ity
Geographic area
Prot
ectio
n be
nefit
Res
tora
tion
bene
fit
Pred
atio
n
With
draw
als
Har
assm
ent/p
oach
ing
Obs
truc
tions
Oxy
gen
Path
ogen
s
Cha
nnel
sta
bilit
y/la
ndsc
.1/
Che
mic
als
Com
petit
ion
(w/ h
atch
)
Com
petit
ion
(oth
er s
p)
Flow
Food
Hab
itat d
iver
sity
Sedi
men
t loa
d
Tem
pera
ture
Figure 3-100: Aquatic and Riparian Protection and Restoration Priorities by EDT AttributeClass for McKenzie River Spring Chinook
As shown in Figure 3-100, several EDT attribute classes have a disproportionate affect onMcKenzie River spring Chinook salmon populations:
• Habitat Diversity. Altered habitat diversity (channel confinement, riparian function,wood in the channel, and other attributes) has affected all of the spring Chinook salmonlife stages in the geographic areas, with larger impacts in the Blue River watershed, lowerMcKenzie River, lower subbasin tributaries, and Mohawk watershed.
• Key Habitat Quality. Key habitat quality also has a dominant impact on the population.Habitat changes that affect spawning (coarsening of channel substrate, for example) andjuveniles (loss of backwater habitats, for example) affect most geographic areas,particularly in the South Fork McKenzie, lower McKenzie River, and Mohawkwatershed.
• Fish Passage Barriers. Obstructions to fish passage have the greatest impact on thedistribution and productivity of spring Chinook salmon in the Subbasin. Dams on theupper McKenzie River, South Fork, and Blue River restrict access to large amounts ofhistorical habitat. To a lesser degree, culverts and other fish passage obstructions limit thepopulation in the Mohawk Watershed.
3.5.1.18 Limiting Factors in the Tryon Creek Subbasin (with EDT Analysis)This section describes the geographic setting of the Tryon Creek Subbasin and limitingfactors for two of the focal species in the subbasin: coho salmon and winter steelhead. The
DRAFT WILLAMETTE SUBBASIN PLAN
3-530 CH 3 ASSESSMENT.DOC
limiting factors were determined by using EDT to analyze habitat conditions on a reach-by-reach basis throughout the Tryon Creek Subbasin.
Focal species present:• Coho salmon• Winter steelhead• Cutthroat trout
Because their health, abundance and productivity are linked to terrestrial and aquaticwatershed conditions, salmonids (salmon and trout) are a good indicator of watershed health.Salmon are sensitive to all components of watershed processes and functions (hydrology,habitat, water quality and biological communities). More is known about the life histories ofsalmon and the relationships between stream conditions and population abundance andproductivity than is known about many other aquatic species in the Willamette River basin.Anadromous fish such as coho and steelhead have complex life histories that involve residentand anadromous traits. These unique life history strategies inform local freshwater habitatcondition, as well as marine influenced rearing conditions.
In addition, historical data characterizing salmonid presence and distribution is generallymore quantitative and comprehensive than other native fish communities, hence referenceconditions and existing habitat conditions and associated population status can be betterevaluated. In addition to past and present data availability, salmon populations will continueto be evaluated in the near and long-term future, as a result of federal ESA listings. However,the ability to acquire biological data in the future is critical in evaluating trends in habitatcondition and thus is needed to effectively inform decision-making and to evaluate thesuccess of implemented actions. For these reasons we perceive that other non-ESA listednative fish communities, such as rainbow, cutthroat and sculpin may in the future play animportant role in helping to evaluate habitat conditions.
For now, Tryon Creek winter steelhead and coho were chosen as focal species to beevaluated using EDT. Both are native to Tryon Creek and experience freshwater conditionsaffecting other native fish communities in the subbasin. Cutthroat trout and rainbow trout arelikewise considered important species in Tryon Creek Subbasin, however, non-ocean-goingspecies are not presently defined (e.g. fish rules) in EDT; hence they were not evaluatedusing this tool.
Tryon Creek Winter SteelheadPopulation Description. The Tryon Creek Subbasin winter steelhead population was defined tospawn in mainstem Tryon Creek up to Marshall Cascade, a natural fish barrier at rivermile3.3. The life history of this population is based on other lower Willamette winter steelheadpopulations, notably the Clackamas and the Tualatin River populations. Both are believed tobe a late-run population returning to freshwater to spawn during their fifth and sixth year.Native, late-run winter steelhead entered the Willamette River from October through May(Dimmick 1945), with spawning beginning in March and peaking in April through May.Juvenile steelhead generally spend two years in freshwater before smolting, with peakemigration beginning early April and extending through early June. Larger steelheadgenerally emigrate sooner than their smaller cohorts (ODFW 2000).
DRAFT WILLAMETTE SUBBASIN PLAN
CH 3 ASSESSMENT.DOC 3-531
Relationship to ESU or Other Population Designations. Tryon Creek Subbasin winter steelhead arepart of the Lower Willamette River ESU and are believed to be most closely associated withpopulations below Willamette Falls: Clackamas River and Johnson Creek.
Historical Abundance and Present Status. Winter steelhead populated Tryon Creek basin(WMSWCD 2003(d)). The upstream extent of their anadromy is not known; however basedon channel geomorphology and valley hillslope, they likely spawned up to (and perhapsbeyond) Marshall Cascades on mainstem Tryon Creek and perhaps up to Arnold Falls onArnold Creek (RM 0.4).
Presently, the biotic integrity of Tryon Creek has been greatly reduced from historicalconditions. Many native species of fish, wildlife and plants are extinct or are greatly reducedin number. Anadromous coho, steelhead and cutthroat have significantly declined indistribution, productivity and abundance. However, steelhead and rainbow trout continue tospawn and rear throughout the subbasin. Although HWY 43 significantly impedes adultmigrations in the winter, it does not completely block steelhead anadromy. Steelhead aremost abundant (and largest) in the spring and least abundant (and smallest) in the summer,indicating spring smolt emigration and anadromous population recruitment (ODFW 2003).
Tryon Creek CohoPopulation Description. The Tryon Creek Subbasin coho population was defined to spawn andrear in mainstem Tryon Creek up to the Marshall Cascade on Tryon Creek (RM 3.3);however, habitat above the confluence of Arnold Creek (RM 2.6) likely did not providesubstantive coho spawning and rearing grounds. Life history of this population is based onsimilar populations in the lower Willamette River: Clackamas River and Johnson Creekpopulations. Coho returned as 3-year age adults and 2-year age jacks. Lower Willamettecoho are an early run population, reaching Willamette Falls from late August through earlyNovember. Peak migrations occur from middle to late September, following periods ofconsiderable rainfall, and peak spawning generally occurs soon afterwards from Septemberthrough December. Fry emerge from mid-January through April, yielding a four-monthemergence period. While a small proportion of fry emigrate during the first year, mostfingerling smolts emigrate during the second spring, beginning in March and extendingthrough mid-July.
Relationship to ESU or Other Population Designations. Lower Columbia River coho salmon werelisted on the state ESA in July 1999. This population was previously considered for federallisting. On July 25, 1995, NMFS determined that the listing was unwarranted; however, thepopulation remains a “candidate” for listing on the federal ESA. Lower Columbia River cohoare listed as endangered under the state ESA. The Willamette River basin, up to WillametteFalls including the Clackamas, contains major spawning and rearing habitat for thispopulation.
Historical Abundance and Present Status. Willamette Basin coho are believed to be native only tosubbasins below Willamette Falls, notably, the Clackamas River basin, Johnson Creek(Fulton 1970) and Tryon Creek (WMSWCD 2003d), and were reported occupying tributariesto Multnomah Channel from 1951 to 1959 (Willis et al., 1960). Notably, the lowerWillamette River basin provided the third most important spawning grounds for cohosalmon, throughout the entire Columbia River basin (Fulton 1970).
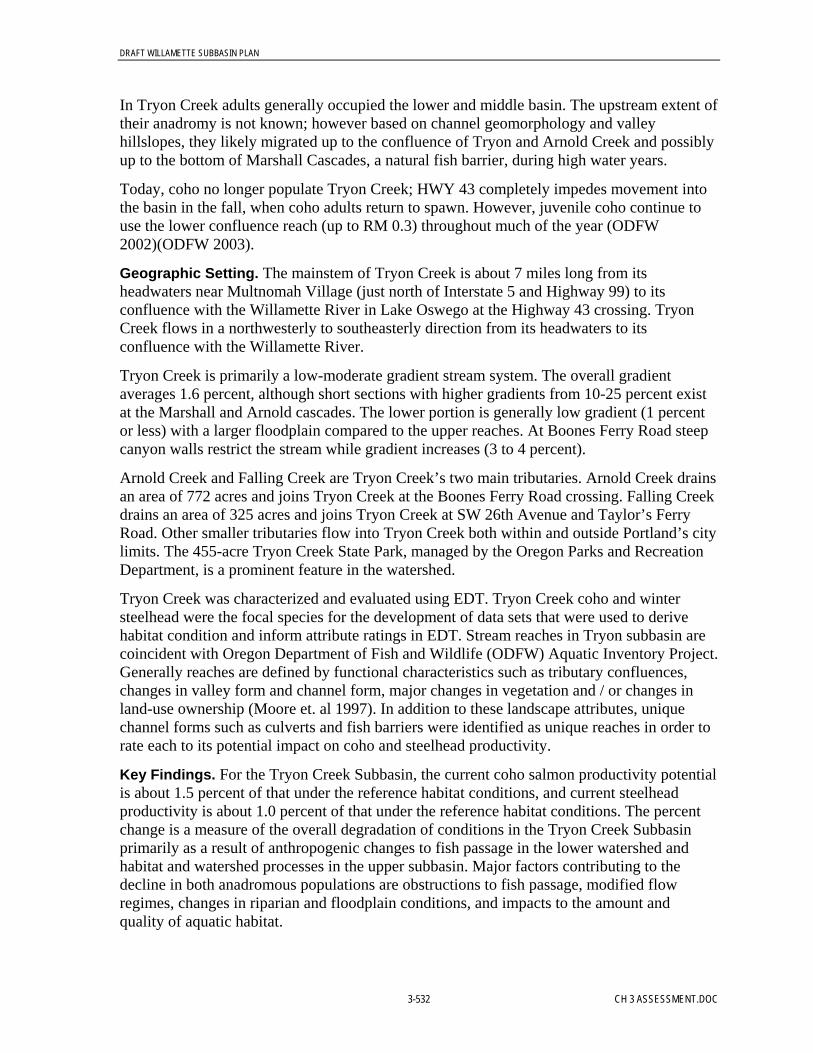
DRAFT WILLAMETTE SUBBASIN PLAN
3-532 CH 3 ASSESSMENT.DOC
In Tryon Creek adults generally occupied the lower and middle basin. The upstream extent oftheir anadromy is not known; however based on channel geomorphology and valleyhillslopes, they likely migrated up to the confluence of Tryon and Arnold Creek and possiblyup to the bottom of Marshall Cascades, a natural fish barrier, during high water years.
Today, coho no longer populate Tryon Creek; HWY 43 completely impedes movement intothe basin in the fall, when coho adults return to spawn. However, juvenile coho continue touse the lower confluence reach (up to RM 0.3) throughout much of the year (ODFW2002)(ODFW 2003).
Geographic Setting. The mainstem of Tryon Creek is about 7 miles long from itsheadwaters near Multnomah Village (just north of Interstate 5 and Highway 99) to itsconfluence with the Willamette River in Lake Oswego at the Highway 43 crossing. TryonCreek flows in a northwesterly to southeasterly direction from its headwaters to itsconfluence with the Willamette River.
Tryon Creek is primarily a low-moderate gradient stream system. The overall gradientaverages 1.6 percent, although short sections with higher gradients from 10-25 percent existat the Marshall and Arnold cascades. The lower portion is generally low gradient (1 percentor less) with a larger floodplain compared to the upper reaches. At Boones Ferry Road steepcanyon walls restrict the stream while gradient increases (3 to 4 percent).
Arnold Creek and Falling Creek are Tryon Creek’s two main tributaries. Arnold Creek drainsan area of 772 acres and joins Tryon Creek at the Boones Ferry Road crossing. Falling Creekdrains an area of 325 acres and joins Tryon Creek at SW 26th Avenue and Taylor’s FerryRoad. Other smaller tributaries flow into Tryon Creek both within and outside Portland’s citylimits. The 455-acre Tryon Creek State Park, managed by the Oregon Parks and RecreationDepartment, is a prominent feature in the watershed.
Tryon Creek was characterized and evaluated using EDT. Tryon Creek coho and wintersteelhead were the focal species for the development of data sets that were used to derivehabitat condition and inform attribute ratings in EDT. Stream reaches in Tryon subbasin arecoincident with Oregon Department of Fish and Wildlife (ODFW) Aquatic Inventory Project.Generally reaches are defined by functional characteristics such as tributary confluences,changes in valley form and channel form, major changes in vegetation and / or changes inland-use ownership (Moore et. al 1997). In addition to these landscape attributes, uniquechannel forms such as culverts and fish barriers were identified as unique reaches in order torate each to its potential impact on coho and steelhead productivity.
Key Findings. For the Tryon Creek Subbasin, the current coho salmon productivity potentialis about 1.5 percent of that under the reference habitat conditions, and current steelheadproductivity is about 1.0 percent of that under the reference habitat conditions. The percentchange is a measure of the overall degradation of conditions in the Tryon Creek Subbasinprimarily as a result of anthropogenic changes to fish passage in the lower watershed andhabitat and watershed processes in the upper subbasin. Major factors contributing to thedecline in both anadromous populations are obstructions to fish passage, modified flowregimes, changes in riparian and floodplain conditions, and impacts to the amount andquality of aquatic habitat.

DRAFT WILLAMETTE SUBBASIN PLAN
CH 3 ASSESSMENT.DOC 3-533
Present habitat condition in Tryon Creek Subbasin is symptomatic of watershed processes aswell as discrete actions that have occurred in the basin. For example, construction of HWY43 and the culvert running under it has significantly impaired fish passage to middle andupper Tryon Creek. Deforestation of middle Tryon Creek in the 1940s sets the currentvegetative template in the creek, riparian and floodplain area, and the uplands. Urbanizationin the upper watershed has altered the hydrologic regime throughout the entire drainage area.These altered hydrologic regimes have functionally disconnected the creek from its riparianand floodplain area. Table 3-185 summarizes the key attributes limiting Tryon Creeksteelhead and coho populations.
Table 3-185: Summary of Key Problems in Tryon Creek
Environmental Attribute Symptomatic Habitat Features
Stream Connectivity HWY 43 significantly blocks anadromous fish from accessing middle TryonCreek
Boones Ferry Rd. completely blocks anadromous and resident fish fromaccessing upper Tryon Creek.
Habitat complexity Lacking large wood; large and medium sized substrate; overhanging vegetation;undercut banks and terraced banks
Shorter stream length with fewer meanders and simplified channel morphology(channelization).
Key habitats Lack of high quality riffles, deep pools, side channels, secondary channels, off-channel and backwater habitats.
Riparian and Floodplain forest Second growth, even-aged deciduous riparian and floodplain forests in middleTryon Creek do not provide large wood pieces and substantive volume of woodydebris.
Lack of native conifers as source woody debris will limit the longevity andfunction of wood forms in the creek.
Lack of overhanging vegetation along the stream banks destabilizes the creek,and minimizes potential protective cover to fish and wildlife.
Lack of mature native trees and shrubs in upper Tryon Creek contribute toincreased stream temperatures in the summer.
Fine Sediment High sediment loads smother spawning habitats (riffle gravels) and fill pools.
Sediment associated pollutants prevalent throughout the basin.
High silt cover reduces areas for macroinvertebrate production.
Hydrologic Regime Surface runoff originating from the upper watershed alters the hydrologic regimethroughout the Willamette Basin.
Stream Temperature Elevated summer temperatures stress fish communities resulting in lethal andsublethal effects.
Chemical Contamination Chronic and acute chemical toxicity results in lethal and / or sublethal effects toaquatic communities, including macroinvertebrate production.
The data on which this summary of conditions is based are described in greater detail later inthis section, under “Assessment of Habitat Constraints on Population Potential.”

DRAFT WILLAMETTE SUBBASIN PLAN
3-534 CH 3 ASSESSMENT.DOC
EDT ApproachInformation Sources. Tryon Creek EDT analysis was based primarily upon a watershedcharacterization assessment by the City of Portland. The watershed characterizationsummarized information from existing data sources, such as the ODFW’s Aquatic InventoryProgram habitat surveys, to describe current conditions in Tryon Creek Subbasin. EDThabitat attribute ratings were based on knowledge of historical and current conditions thatdescribe hydrologic regimes, physical habitat, water quality and biological communitiesnative to the subbasin. The content of the watershed characterization was previously vettedthrough a City of Portland, Tryon and Fanno Creek Watershed Advisory Team, whichinclude members from Clean Water Services, Neighborhood Associations, Oregon StateParks, and other City Bureaus.
The purpose of the EDT assessment of the Willamette River below Willamette Falls was toallow detailed analysis of the lower Willamette River as it influences Tryon Creek coho andsteelhead productivity.
One limitations in the EDT analysis of the lower Willamette River that should be addressedin future work is the need to include additional habitat types and species rules to account forthe complexity of the large river environment. EDT is based on the existing scientificliterature regarding salmonid-habitat relationships. The great bulk of that literature focuseson “wadeable” streams. Large river habitats used by salmon have not been extensivelystudied not only because of the difficulties in studying these environments but also becauselarge rivers are often viewed as simple migration corridors rather than complex spawning andrearing areas. Habitat types developed for smaller streams are inadequate to evaluate thehabitat functions provided in large river habitats. The complexity of the alluviatingWillamette environment represent considerable habitat complexity and should be included infuture EDT analysis.
Scenario Development. Three scenarios were described to evaluate coho and steelheadproductivity in Tryon Creek Subbasin. The first describes the current conditions weredescribed based on existing empirical and expert knowledge regarding hydrology, waterquality, physical habitat and biological communities in Tryon Creek. The second scenariodescribes a reference or template condition. This reference condition defines fully restoredconditions in Tryon Creek, it’s tributaries, and the lower Willamette River, as it relates tosalmonid life history, and spawning and rearing. The third scenario describes a fullydegraded condition for the subbasin. Placing the current condition between the two“bookends” (e.g., reference condition and fully degraded condition) allows us to evaluateeach population and its reliance on protection and restoration measures basinwide (e.g.,sedimentation) and at specific areas (e.g., fish passage improvements).
Reach Structure and Geographic Areas. Mainstem Tryon Creek was broken into 11stream reaches, five culvert reaches and one natural barrier (Marshall Cascades). ArnoldCreek and Falling Creek were also characterized and evaluated using EDT. Arnold Creekwas broken into seven stream reaches, five culverts and one natural barrier (Arnold Falls);and Falling Creek was broken into three stream reaches and two culverts. Mainstem Tryon,Arnold and Falling Creek were further grouped into three geographic areas that reflectwatershed function, and land-use (e.g., upper subbasin in urban land-use and middle subbasinin Tryon Creek State Natural Area).

DRAFT WILLAMETTE SUBBASIN PLAN
CH 3 ASSESSMENT.DOC 3-535
Lower Willamette River. The lower Willamette River reach includes four distinct riversegments. From upstream to downstream these river segments are the North Segment,Industrial Segment, Downtown Segment, and South Segment. Refer to Section 3.5.1.18 foradditional details describing habitat conditions and functions in the lower Willamette Riversubbasin.
Lower Tryon Creek. The lower reach extends from the confluence of Tryon Creek and theWillamette River upstream to the west side of Boones Ferry Rd. culvert, which is coincidentwith the confluence of Arnold and Tryon creeks (RM 0.00 – 2.68). Stream gradient isgenerally low, averaging 2.3 percent. HWY 43 crosses the creek at RM 0.24. Below theculvert, habitat functions primarily as off-channel habitat to the Willamette River. Land usein this confluence area is predominately residential. The remainder of lower Tryon Creek ismostly protected with Tryon Creek State Natural Area. Key tributaries include Nettle Creek,Red Fox Creek, Palatine Hill Creek, Park Creek and Arnold Creek (at the upstream extent).Note, hillsides were logged (predominately clear cut) approximately 40-60 years ago. Theforest stand is characteristic of second-growth, even-aged forest stand, and is dominated bylarge maples, alders and native firs. The area is relatively undisturbed with a few exceptions:1) A sewer pipe runs along the valley bottom; and 2) Recreational trails used by hikers,equestrians and mountain bikers parallel and cross the creek.
Middle Tryon Creek. The middle reach begins at the confluence of Arnold and Tryon Creek andextends upstream to Marshall Cascade. Mature second growth forests surround the lowerportion of this reach, with some low-density residential use in the uplands. The remainder ofmiddle Tryon (including Falling Creek) is predominately enclosed in residential land-use,with several small city parks. Key tributaries include Arnold, Burlingame and Quail creeks;however, several other (unnamed) tributaries enter the mainstem and may provide importantoff-channel and cool water refugia.
EDT Results. EDT was used to assesses habitat in terms of four population outputparameters:
1. Biological capacity (quantity of habitat)2. Biological productivity (quality of habitat)3. Equilibrium abundance (quantity and quality of habitat)4. Life history diversity (breadth of suitable habitat)
Capacity and productivity are parameters of a Beverton-Holt production function; abundanceis calculated from this relationship. Life history diversity is listed as a Diversity Index that isthe percentage of viable trajectories sustainable under the current condition relative to thereference condition.
Estimated Population Potential. The following figures compare the estimated currentabundance, productivity and life history diversity potential to similar reference or templatepotential based upon habitat conditions. Indices of habitat potential (and its influence on fishabundance) do not represent actual fish abundance, productivity or diversity as measured orobserved in Tryon Creek. Actual abundance, productivity or diversity is not known in TryonCreek, but presumably varies from year to year as a result of factors within and outside thesubbasin, notably, changes in ocean conditions.

DRAFT WILLAMETTE SUBBASIN PLAN
3-536 CH 3 ASSESSMENT.DOC
The percent change in population potential is a measure of the overall degradation of habitatconditions in the Tryon Creek Subbasin primarily as a result of anthropogenic changes to thehabitat in Tryon Creek and in the lower Willamette River.
Current winter steelhead abundance is estimated to be only 1.0 percent of referencepopulation size (Figure 3-101). Current productivity is likewise low at about 3.0 percent(Figure 3-102) of the reference conditions, and life history diversity is only 7.5 percent(Figure 3-103) of the reference condition.
Abundance
0
10
20
30
40
50
60
70
80
90
100
Tryon Winter SH
Abu
ndan
ce
Figure 3-101: Estimated Fish Abundance Potential as a Function of Habitat in the Current andReference Conditions for Tryon Creek Subbasin Winter Steelhead Population

DRAFT WILLAMETTE SUBBASIN PLAN
CH 3 ASSESSMENT.DOC 3-537
Productivity
0.0
5.0
10.0
15.0
20.0
25.0
30.0
35.0
Tryon Winter SH
Prod
uctiv
ity
Figure 3-102: Estimated Fish Productivity Potential as a Function Of Habitat in the Current andReference Conditions for Tryon Creek Subbasin Winter Steelhead Population
Life history diversity
0%
20%
40%
60%
80%
100%
Tryon Winter SH
Div
ersi
ty In
dex
Figure 3-103. Estimated Species Diversity Potential as a Function of Habitat in the Current andReference Conditions for Tryon Creek Subbasin Winter Steelhead Population
Coho abundance is extremely low in Tryon Creek Subbasin, estimated at only 1.5 percent ofreference (or historical) numbers (Figure 3-104). In addition, coho productivity is only atabout 3.5 percent of its reference potential (Figure 3-105); however, life history diversity isestimated at about 20 percent the reference potential (Figure 3-106).
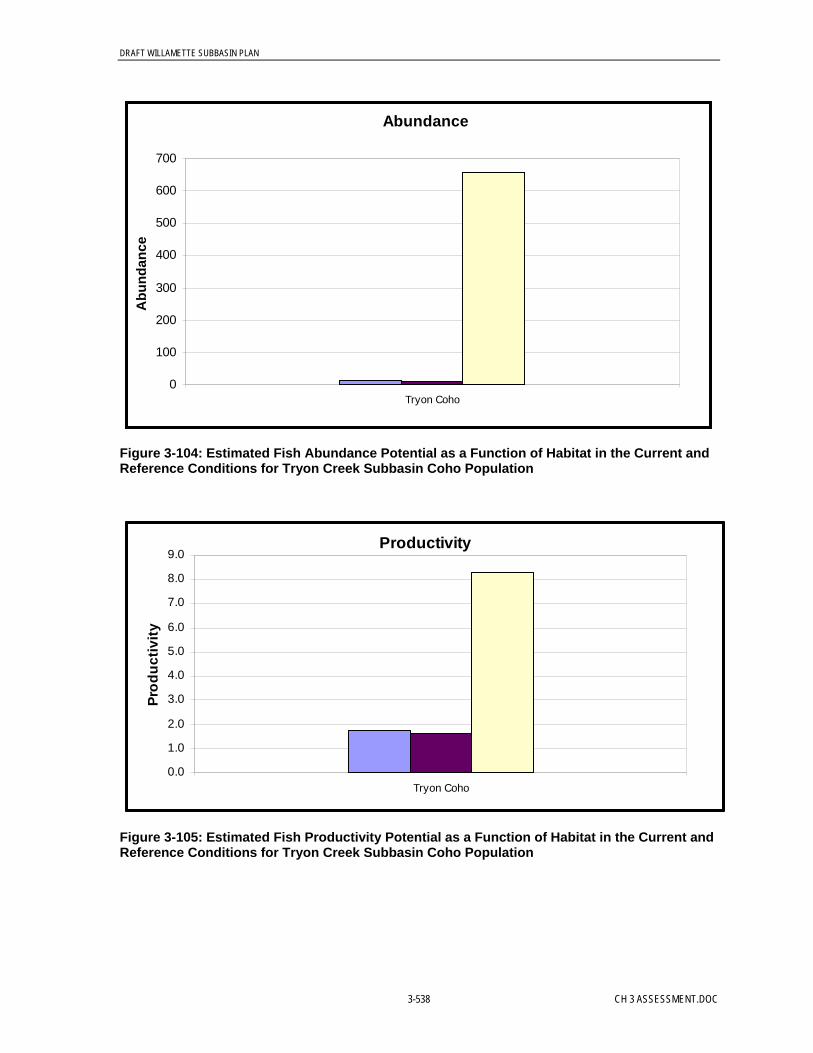
DRAFT WILLAMETTE SUBBASIN PLAN
3-538 CH 3 ASSESSMENT.DOC
Abundance
0
100
200
300
400
500
600
700
Tryon Coho
Abu
ndan
ce
Figure 3-104: Estimated Fish Abundance Potential as a Function of Habitat in the Current andReference Conditions for Tryon Creek Subbasin Coho Population
Productivity
0.0
1.0
2.0
3.0
4.0
5.0
6.0
7.0
8.0
9.0
Tryon Coho
Prod
uctiv
ity
Figure 3-105: Estimated Fish Productivity Potential as a Function of Habitat in the Current andReference Conditions for Tryon Creek Subbasin Coho Population

DRAFT WILLAMETTE SUBBASIN PLAN
CH 3 ASSESSMENT.DOC 3-539
Life history diversity
0%
20%
40%
60%
80%
100%
Tryon Coho
Div
ersi
ty In
dex
Figure 3-106: Estimated Species Diversity Potential as a Function of Habitat in the Current andReference Conditions for Tryon Creek Subbasin Coho Population
Geographic Area Habitat Priorities for Protection and Restoration. The results of theEDT reach analysis were aggregated to provide an estimate of the changes in the TryonCreek coho and winter steelhead population abundance, productivity, and diversity for eachgeographic area. The changes in the Tryon coho and winter steelhead populations’ attributesprovide an estimate of the relative importance of the geographic areas for habitat protectionand restoration measures. The geographic areas priorities are based on (1) an estimate in thechanges in population abundance, productivity, and diversity at each life stage underconditions of habitat degradation from the current state (protection benefit) and habitatrestoration to the historical potential (restoration benefit) and (2) the extent to which thegeographic area is used by each of the life stages. Figure 3-107 shows the relative restorationvalue for each geographic area, or the relative benefit that could be realized if the geographicarea was restored to reference conditions. Table 3-186 also illustrates the changes in cohopopulation attributes for the geographic areas within Tryon Creek Subbasin and the lowerWillamette River.
Table 3-186: Estimated Restoration Value of Each of Geographic Area for Tryon Creek Coho
Percent Change in Coho Parameterswith Restoration
Geographic AreaRestoration
Rank Abundance Productivity Diversity
Lower Tryon 1 1,150 percent 495 percent 576 percent
Middle Tryon 3 149 percent 106 percent 241 percent
Arnold Cr 4 0 percent 0 percent 0 percent
Lower Willamette River 2 425 percent 11 percent 300 percent

DRAFT WILLAMETTE SUBBASIN PLAN
3-540 CH 3 ASSESSMENT.DOC
Degradation Restoration Degradation Restoration Degradation RestorationArnold Cr(TRY) A 2 A 4
Lower Tryon A 1 A 1Middle Tryon A 2 A 3
Portland A 2 A 2
Percentage change Percentage change Percentage change
Category/rank Category/rankGeographic Area
Change in Abundance with Change in Productivity with Change in Diversity Index withProtection benefit
Restoration benefit
-575% 0% 575% -575% 0% 575% -575% 0% 575%
Figure 3-107: Relative Importance of the EDT Analysis Geographic Areas for Protection and Restoration Measures for the Tryon CreekCoho Salmon
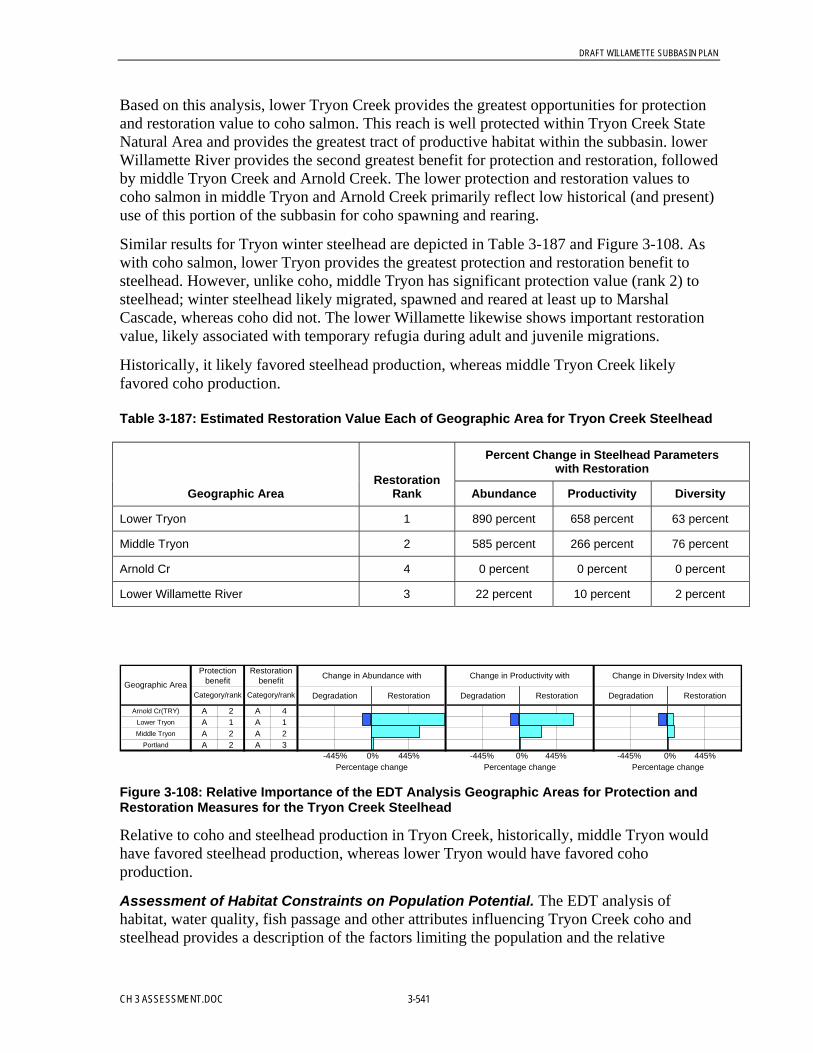
DRAFT WILLAMETTE SUBBASIN PLAN
CH 3 ASSESSMENT.DOC 3-541
Based on this analysis, lower Tryon Creek provides the greatest opportunities for protectionand restoration value to coho salmon. This reach is well protected within Tryon Creek StateNatural Area and provides the greatest tract of productive habitat within the subbasin. lowerWillamette River provides the second greatest benefit for protection and restoration, followedby middle Tryon Creek and Arnold Creek. The lower protection and restoration values tocoho salmon in middle Tryon and Arnold Creek primarily reflect low historical (and present)use of this portion of the subbasin for coho spawning and rearing.
Similar results for Tryon winter steelhead are depicted in Table 3-187 and Figure 3-108. Aswith coho salmon, lower Tryon provides the greatest protection and restoration benefit tosteelhead. However, unlike coho, middle Tryon has significant protection value (rank 2) tosteelhead; winter steelhead likely migrated, spawned and reared at least up to MarshalCascade, whereas coho did not. The lower Willamette likewise shows important restorationvalue, likely associated with temporary refugia during adult and juvenile migrations.
Historically, it likely favored steelhead production, whereas middle Tryon Creek likelyfavored coho production.
Table 3-187: Estimated Restoration Value Each of Geographic Area for Tryon Creek Steelhead
Percent Change in Steelhead Parameterswith Restoration
Geographic AreaRestoration
Rank Abundance Productivity Diversity
Lower Tryon 1 890 percent 658 percent 63 percent
Middle Tryon 2 585 percent 266 percent 76 percent
Arnold Cr 4 0 percent 0 percent 0 percent
Lower Willamette River 3 22 percent 10 percent 2 percent
Degradation Restoration Degradation Restoration Degradation Restoration
Arnold Cr(TRY) A 2 A 4Lower Tryon A 1 A 1Middle Tryon A 2 A 2
Portland A 2 A 3
Percentage change Percentage change Percentage change
Category/rank Category/rankGeographic Area
Change in Abundance with Change in Productivity with Change in Diversity Index withProtection benefit
Restoration benefit
-445% 0% 445% -445% 0% 445% -445% 0% 445%
Figure 3-108: Relative Importance of the EDT Analysis Geographic Areas for Protection andRestoration Measures for the Tryon Creek Steelhead
Relative to coho and steelhead production in Tryon Creek, historically, middle Tryon wouldhave favored steelhead production, whereas lower Tryon would have favored cohoproduction.
Assessment of Habitat Constraints on Population Potential. The EDT analysis ofhabitat, water quality, fish passage and other attributes influencing Tryon Creek coho andsteelhead provides a description of the factors limiting the population and the relative
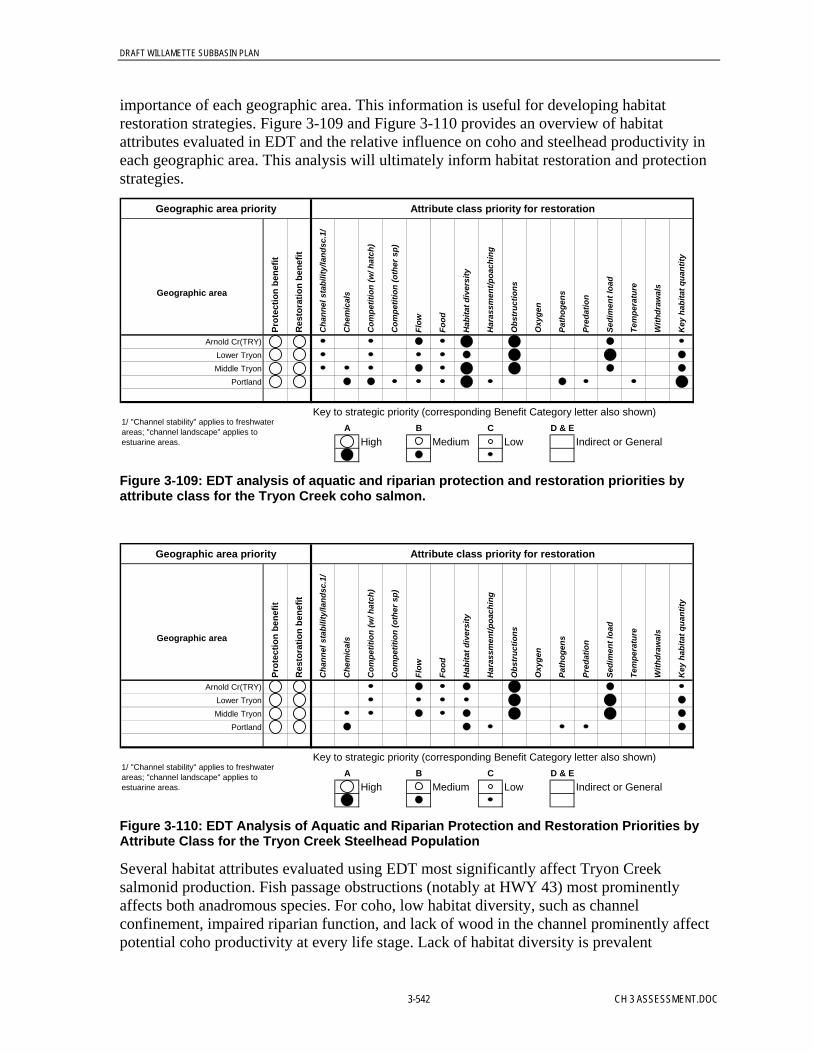
DRAFT WILLAMETTE SUBBASIN PLAN
3-542 CH 3 ASSESSMENT.DOC
importance of each geographic area. This information is useful for developing habitatrestoration strategies. Figure 3-109 and Figure 3-110 provides an overview of habitatattributes evaluated in EDT and the relative influence on coho and steelhead productivity ineach geographic area. This analysis will ultimately inform habitat restoration and protectionstrategies.
Attribute class priority for restoration
Arnold Cr(TRY)Lower TryonMiddle Tryon
Portland
Key to strategic priority (corresponding Benefit Category letter also shown)A B C D & E
High Medium Low Indirect or General
Cha
nnel
sta
bilit
y/la
ndsc
.1/
Che
mic
als
Com
petit
ion
(w/ h
atch
)
Com
petit
ion
(oth
er s
p)
Flow
Food
Hab
itat d
iver
sity
Sedi
men
t loa
d
Tem
pera
ture
With
draw
als
Har
assm
ent/p
oach
ing
Obs
truc
tions
Oxy
gen
Path
ogen
s
Geographic area priority
1/ "Channel stability" applies to freshwater areas; "channel landscape" applies to estuarine areas.
Key
hab
itat q
uant
ity
Geographic area
Prot
ectio
n be
nefit
Res
tora
tion
bene
fit
Pred
atio
n
Figure 3-109: EDT analysis of aquatic and riparian protection and restoration priorities byattribute class for the Tryon Creek coho salmon.
Attribute class priority for restoration
Arnold Cr(TRY)Lower TryonMiddle Tryon
Portland
Key to strategic priority (corresponding Benefit Category letter also shown)A B C D & E
High Medium Low Indirect or General
Cha
nnel
sta
bilit
y/la
ndsc
.1/
Che
mic
als
Com
petit
ion
(w/ h
atch
)
Com
petit
ion
(oth
er s
p)
Flow
Food
Hab
itat d
iver
sity
Sedi
men
t loa
d
Tem
pera
ture
With
draw
als
Har
assm
ent/p
oach
ing
Obs
truc
tions
Oxy
gen
Path
ogen
sGeographic area priority
1/ "Channel stability" applies to freshwater areas; "channel landscape" applies to estuarine areas.
Key
hab
itat q
uant
ity
Geographic area
Prot
ectio
n be
nefit
Res
tora
tion
bene
fit
Pred
atio
n
Figure 3-110: EDT Analysis of Aquatic and Riparian Protection and Restoration Priorities byAttribute Class for the Tryon Creek Steelhead Population
Several habitat attributes evaluated using EDT most significantly affect Tryon Creeksalmonid production. Fish passage obstructions (notably at HWY 43) most prominentlyaffects both anadromous species. For coho, low habitat diversity, such as channelconfinement, impaired riparian function, and lack of wood in the channel prominently affectpotential coho productivity at every life stage. Lack of habitat diversity is prevalent
DRAFT WILLAMETTE SUBBASIN PLAN
CH 3 ASSESSMENT.DOC 3-543
throughout Tryon Creek Subbasin and the lower Willamette River and significantly affectscoho productivity during early life history rearing. Lack of key habitats, such as off-channelrearing areas and slack water habitats are also lacking and could prominently affect potentialcoho production in lower and middle Tryon Creek, and the lower Willamette River.
Sediment loads in Tryon Creek most prominently affect steelhead production. This isassociated with its adverse impact on spawning gravels, egg incubation environment, andsummer rearing habitat. In addition, lack of key habitats prominently affects steelheadproductivity in Tryon Creek and the lower Willamette River. In Tryon Creek these habitatsare likely associated with lack of high quality spawning and rearing grounds, which areinfluenced by the amount of fine sediment loading overlaying these habitats, as well as theavailable amount of these habitats.
Fish Passage Obstructions. Obstruction to fish passage (at HWY 43) have the greatest impacton the distribution and productivity of both species in the Subbasin. This culvert severelylimits anadromous fish from accessing spawning and rearing habitat in the subbasin. Theculvert is a concrete box culvert, which has been retrofitted with baffles to improve passagefor anadromous adults, yet it remains a partial barrier, particularly for fall spawning cohosalmon. During this time flows are not high enough to allow access into the culvert (e.g., thejump height into the culvert remains too high) and passage through the long, baffled culvertis very inhospitable. Winter steelhead return to spawn in late winter – early spring whenflows are higher, providing more advantageous opportunities for passage, however, passagelikely remains impaired.
Although this culvert is most significant because of its proximity to the confluence and itsimpassability, other fish passage barriers exist and are a major factor limiting biologicalpotential in the subbasin (Figure 3-111). For example, the culvert at Boones Ferry Rd. isimpassable, precluding access to all of Arnold Creek and middle and upper Tryon Creek.

DRAFT WILLAMETTE SUBBASIN PLAN
3-544 CH 3 ASSESSMENT.DOC
%U
#S
#S
#S
#S#S
#S#S
#S
#S#S
#S#S
#S
#S#S
#S#S#S
%U
%U%U
%U%U %U%U
%U%U
%U%U
%U%U
%U%U
%U
%U
%U%U
%U
%U%U%U
%U
%U
%U%U
%U
%U
#S
Culvert PassabilityComplete Barrier#S
Partial Barrier#SPassable#S
Not Rated%U
Sub-Watershed Boundaries
Figure 3-111: Culverts and Their Passability in Tryon Creek
Marshall Cascade and Arnold Cascades are the only documented natural barriers. Othernatural (and man-made) channel forms (steps) may seasonally impede fish movement, butare not known to block fish passage year-round.
Habitat Complexity. Instream habitat conditions range from marginal to optimal (optimal onlyin a few areas), with most of the marginal habitat within the more heavily urbanized upperwatershed. Highest quality instream and upland habitats are located within Tryon Creek StateNatural Area (lower Tryon). Stream complexity and habitat quality have been greatlyreduced by significant channelization, downcutting, lack of wood, lack of floodplainconnectivity, underground piping of tributaries and bank erosion, particularly in the upperwatershed.
One of the most significant factors determining habitat complexity is the abundance andcomposition of large wood. The National Riparian Services Team (NRST) (WMSWCD,2003b) characterizes Tryon Creek as a wood dependent system, meaning that it developed inconjunction with a large conifer forest stand. The wood provided by larger conifer tree boleshistorically trapped sediment and formed floodplains, retaining flood flows and promotingrich, diverse riparian vegetation. They likewise concluded that “large wood material is themost important attribute in this stream type and the processes associated with it are the mostimportant to the function of the watershed”. Large woody material is lacking basin-wide(ODFW 2001), (WMSWCD, 2003a), (WMSWCD, 2003b) (WMSWCD 2003d). Woodabundance is low upstream of Boones Ferry Rd., wood volume is low basin wide and keypieces are rare (ODFW 2001). In addition, most tributaries of Tryon Creek (excluding IronMt. Creek) lack enough wood to effectively store sediments and retain water. The NRST(WMSWCD 2003b) noted that upland and riparian vegetation is generally less than 60-yearsold and too young to contribute significant amounts of large woody material that is needed torebuild floodplain and channel structure. Notably, wood pieces are indicative of riparian
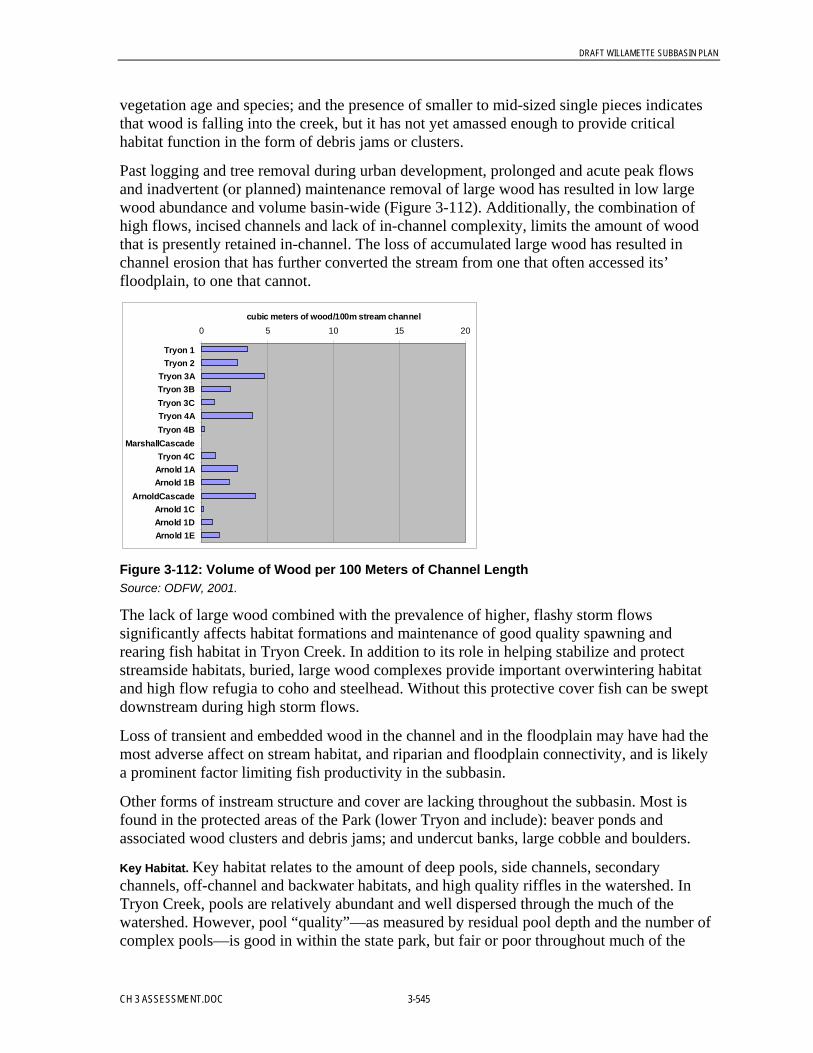
DRAFT WILLAMETTE SUBBASIN PLAN
CH 3 ASSESSMENT.DOC 3-545
vegetation age and species; and the presence of smaller to mid-sized single pieces indicatesthat wood is falling into the creek, but it has not yet amassed enough to provide criticalhabitat function in the form of debris jams or clusters.
Past logging and tree removal during urban development, prolonged and acute peak flowsand inadvertent (or planned) maintenance removal of large wood has resulted in low largewood abundance and volume basin-wide (Figure 3-112). Additionally, the combination ofhigh flows, incised channels and lack of in-channel complexity, limits the amount of woodthat is presently retained in-channel. The loss of accumulated large wood has resulted inchannel erosion that has further converted the stream from one that often accessed its’floodplain, to one that cannot.
0 5 10 15 20
Tryon 1Tryon 2
Tryon 3ATryon 3BTryon 3CTryon 4ATryon 4B
MarshallCascadeTryon 4C
Arnold 1AArnold 1B
ArnoldCascadeArnold 1CArnold 1DArnold 1E
cubic meters of wood/100m stream channel
Figure 3-112: Volume of Wood per 100 Meters of Channel LengthSource: ODFW, 2001.
The lack of large wood combined with the prevalence of higher, flashy storm flowssignificantly affects habitat formations and maintenance of good quality spawning andrearing fish habitat in Tryon Creek. In addition to its role in helping stabilize and protectstreamside habitats, buried, large wood complexes provide important overwintering habitatand high flow refugia to coho and steelhead. Without this protective cover fish can be sweptdownstream during high storm flows.
Loss of transient and embedded wood in the channel and in the floodplain may have had themost adverse affect on stream habitat, and riparian and floodplain connectivity, and is likelya prominent factor limiting fish productivity in the subbasin.
Other forms of instream structure and cover are lacking throughout the subbasin. Most isfound in the protected areas of the Park (lower Tryon and include): beaver ponds andassociated wood clusters and debris jams; and undercut banks, large cobble and boulders.
Key Habitat. Key habitat relates to the amount of deep pools, side channels, secondarychannels, off-channel and backwater habitats, and high quality riffles in the watershed. InTryon Creek, pools are relatively abundant and well dispersed through the much of thewatershed. However, pool “quality”—as measured by residual pool depth and the number ofcomplex pools—is good in within the state park, but fair or poor throughout much of the
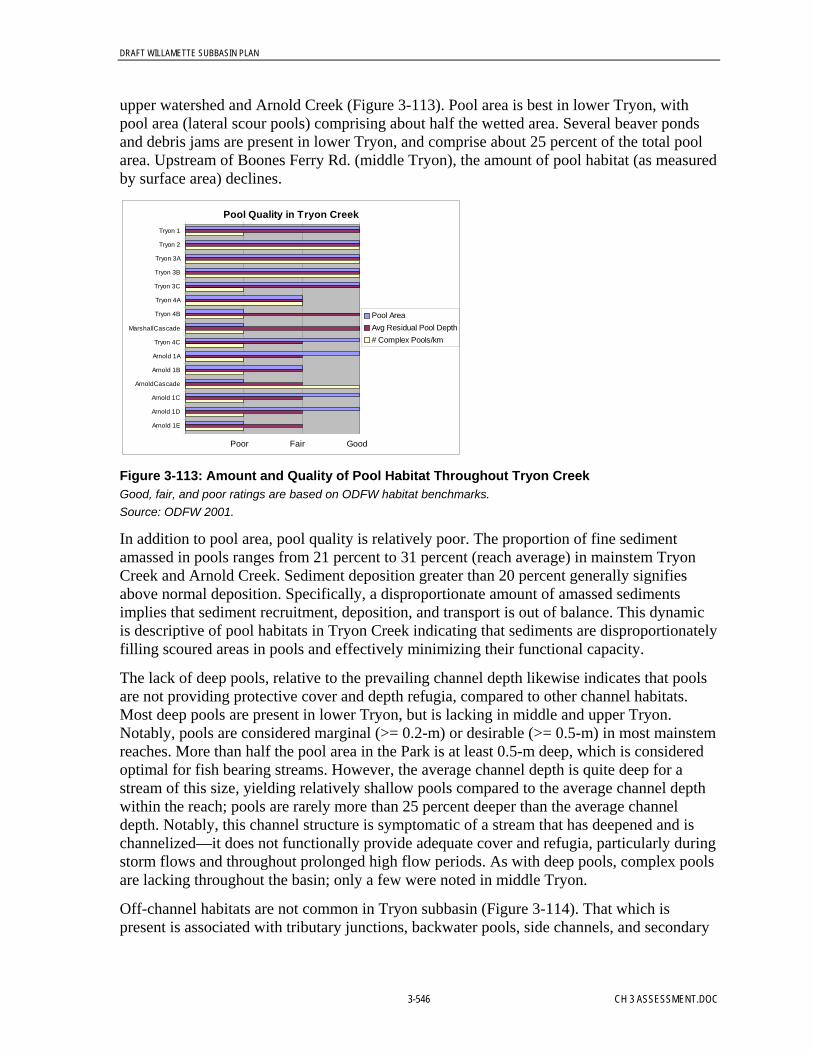
DRAFT WILLAMETTE SUBBASIN PLAN
3-546 CH 3 ASSESSMENT.DOC
upper watershed and Arnold Creek (Figure 3-113). Pool area is best in lower Tryon, withpool area (lateral scour pools) comprising about half the wetted area. Several beaver pondsand debris jams are present in lower Tryon, and comprise about 25 percent of the total poolarea. Upstream of Boones Ferry Rd. (middle Tryon), the amount of pool habitat (as measuredby surface area) declines.
Pool Quality in Tryon CreekTryon 1
Tryon 2
Tryon 3A
Tryon 3B
Tryon 3C
Tryon 4A
Tryon 4B
MarshallCascade
Tryon 4C
Arnold 1A
Arnold 1B
ArnoldCascade
Arnold 1C
Arnold 1D
Arnold 1E
Pool AreaAvg Residual Pool Depth# Complex Pools/km
Fair GoodPoor
Figure 3-113: Amount and Quality of Pool Habitat Throughout Tryon CreekGood, fair, and poor ratings are based on ODFW habitat benchmarks.Source: ODFW 2001.
In addition to pool area, pool quality is relatively poor. The proportion of fine sedimentamassed in pools ranges from 21 percent to 31 percent (reach average) in mainstem TryonCreek and Arnold Creek. Sediment deposition greater than 20 percent generally signifiesabove normal deposition. Specifically, a disproportionate amount of amassed sedimentsimplies that sediment recruitment, deposition, and transport is out of balance. This dynamicis descriptive of pool habitats in Tryon Creek indicating that sediments are disproportionatelyfilling scoured areas in pools and effectively minimizing their functional capacity.
The lack of deep pools, relative to the prevailing channel depth likewise indicates that poolsare not providing protective cover and depth refugia, compared to other channel habitats.Most deep pools are present in lower Tryon, but is lacking in middle and upper Tryon.Notably, pools are considered marginal (>= 0.2-m) or desirable (>= 0.5-m) in most mainstemreaches. More than half the pool area in the Park is at least 0.5-m deep, which is consideredoptimal for fish bearing streams. However, the average channel depth is quite deep for astream of this size, yielding relatively shallow pools compared to the average channel depthwithin the reach; pools are rarely more than 25 percent deeper than the average channeldepth. Notably, this channel structure is symptomatic of a stream that has deepened and ischannelized—it does not functionally provide adequate cover and refugia, particularly duringstorm flows and throughout prolonged high flow periods. As with deep pools, complex poolsare lacking throughout the basin; only a few were noted in middle Tryon.
Off-channel habitats are not common in Tryon subbasin (Figure 3-114). That which ispresent is associated with tributary junctions, backwater pools, side channels, and secondary

DRAFT WILLAMETTE SUBBASIN PLAN
CH 3 ASSESSMENT.DOC 3-547
channels. Notably, the lower confluence area of Tryon Creek functions as off-channel habitatto the Willamette River and is used year round by Willamette Basin salmonids.
Square Meters of Off-Channel Area
0 20 40 60 80 100 120 140
Tryon 1
Tryon 2
Tryon 3A
Tryon 3B
Tryon 3C
Tryon 4A
Tryon 4B
MarshallCascade
Tryon 4C
Arnold 1A
Arnold 1B
ArnoldCascade
Arnold 1C
Arnold 1D
Arnold 1E
Amount Off-ChannelArea
Figure 3-114: Amount of Off-Channel Habitat Through Tryon CreekSource: ODFW, 2001.
Riffles comprise 17 percent to 29 percent of the wetted habitat in mainstem Tryon Creek,which is generally low for fish bearing streams. However, riffle quality (substratecomposition and proportion of fine sediments) is moderately good. Nearly all reaches have atleast half the riffle substratum comprised with 35 percent or more gravel, which is generallyconsidered optimal for fish bearing habitat (Figure 3-115). However, the quality of this rifflehabitat, as determined by the proportion of substrate covered or embedded with finesediments and organics, is marginally high basinwide, as described in the Fine Sedimentsection below. Because riffle quantity is relatively low and because riffle quality may becompromised (due to high sediment loading), spawning and rearing grounds may be alimiting factor affecting population abundance and species diversity.
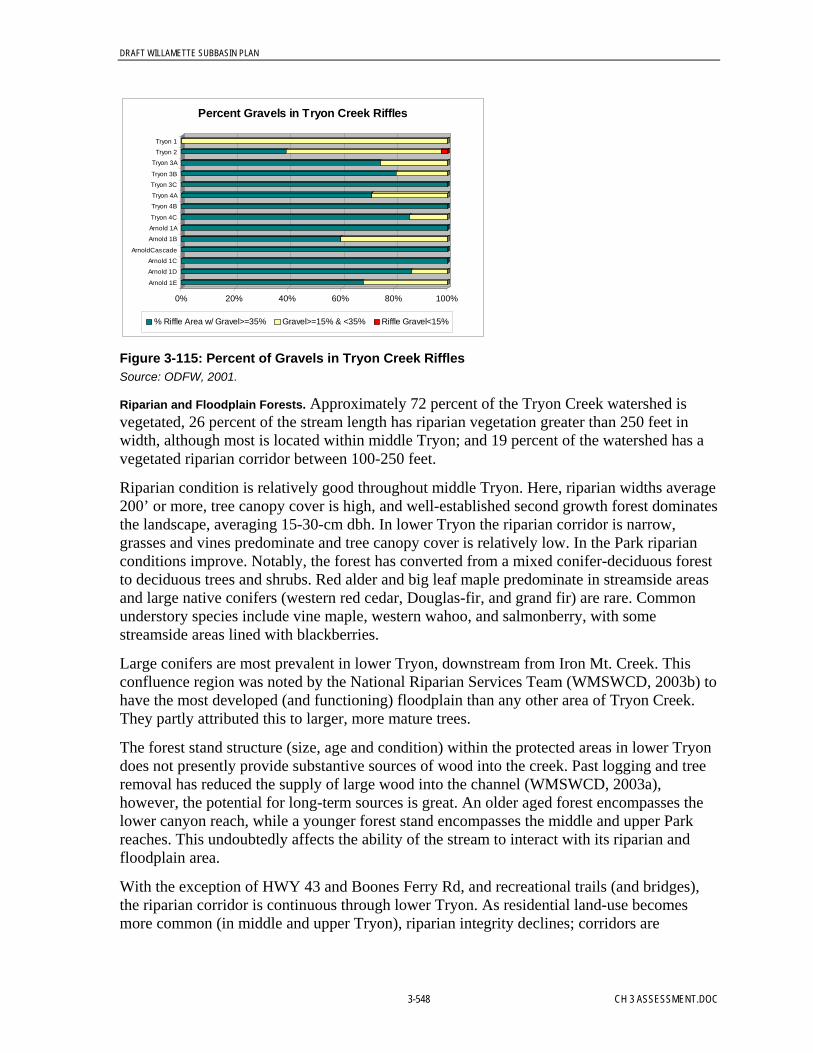
DRAFT WILLAMETTE SUBBASIN PLAN
3-548 CH 3 ASSESSMENT.DOC
0% 20% 40% 60% 80% 100%
Tryon 1Tryon 2
Tryon 3A
Tryon 3BTryon 3C
Tryon 4ATryon 4B
Tryon 4CArnold 1A
Arnold 1B
ArnoldCascadeArnold 1CArnold 1D
Arnold 1E
Percent Gravels in Tryon Creek Riffles
% Riffle Area w/ Gravel>=35% Gravel>=15% & <35% Riffle Gravel<15%
Figure 3-115: Percent of Gravels in Tryon Creek RifflesSource: ODFW, 2001.
Riparian and Floodplain Forests. Approximately 72 percent of the Tryon Creek watershed isvegetated, 26 percent of the stream length has riparian vegetation greater than 250 feet inwidth, although most is located within middle Tryon; and 19 percent of the watershed has avegetated riparian corridor between 100-250 feet.
Riparian condition is relatively good throughout middle Tryon. Here, riparian widths average200’ or more, tree canopy cover is high, and well-established second growth forest dominatesthe landscape, averaging 15-30-cm dbh. In lower Tryon the riparian corridor is narrow,grasses and vines predominate and tree canopy cover is relatively low. In the Park riparianconditions improve. Notably, the forest has converted from a mixed conifer-deciduous forestto deciduous trees and shrubs. Red alder and big leaf maple predominate in streamside areasand large native conifers (western red cedar, Douglas-fir, and grand fir) are rare. Commonunderstory species include vine maple, western wahoo, and salmonberry, with somestreamside areas lined with blackberries.
Large conifers are most prevalent in lower Tryon, downstream from Iron Mt. Creek. Thisconfluence region was noted by the National Riparian Services Team (WMSWCD, 2003b) tohave the most developed (and functioning) floodplain than any other area of Tryon Creek.They partly attributed this to larger, more mature trees.
The forest stand structure (size, age and condition) within the protected areas in lower Tryondoes not presently provide substantive sources of wood into the creek. Past logging and treeremoval has reduced the supply of large wood into the channel (WMSWCD, 2003a),however, the potential for long-term sources is great. An older aged forest encompasses thelower canyon reach, while a younger forest stand encompasses the middle and upper Parkreaches. This undoubtedly affects the ability of the stream to interact with its riparian andfloodplain area.
With the exception of HWY 43 and Boones Ferry Rd, and recreational trails (and bridges),the riparian corridor is continuous through lower Tryon. As residential land-use becomesmore common (in middle and upper Tryon), riparian integrity declines; corridors are
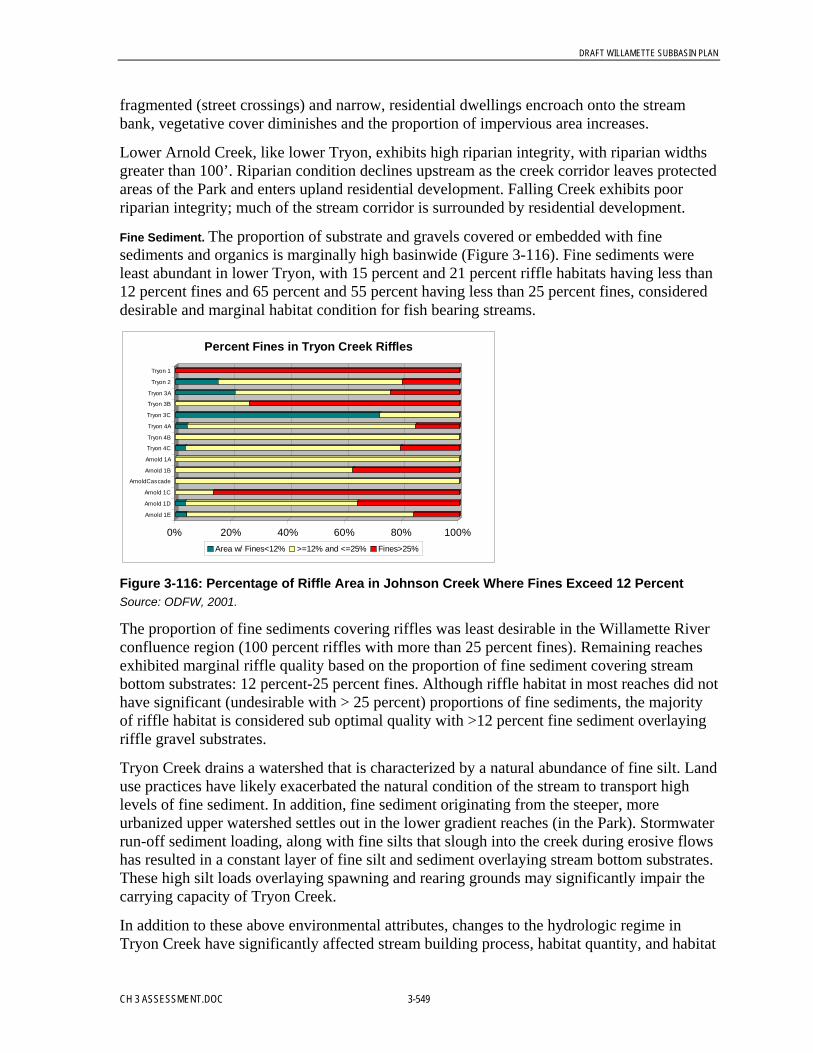
DRAFT WILLAMETTE SUBBASIN PLAN
CH 3 ASSESSMENT.DOC 3-549
fragmented (street crossings) and narrow, residential dwellings encroach onto the streambank, vegetative cover diminishes and the proportion of impervious area increases.
Lower Arnold Creek, like lower Tryon, exhibits high riparian integrity, with riparian widthsgreater than 100’. Riparian condition declines upstream as the creek corridor leaves protectedareas of the Park and enters upland residential development. Falling Creek exhibits poorriparian integrity; much of the stream corridor is surrounded by residential development.
Fine Sediment. The proportion of substrate and gravels covered or embedded with finesediments and organics is marginally high basinwide (Figure 3-116). Fine sediments wereleast abundant in lower Tryon, with 15 percent and 21 percent riffle habitats having less than12 percent fines and 65 percent and 55 percent having less than 25 percent fines, considereddesirable and marginal habitat condition for fish bearing streams.
0% 20% 40% 60% 80% 100%
Tryon 1
Tryon 2
Tryon 3A
Tryon 3B
Tryon 3C
Tryon 4A
Tryon 4B
Tryon 4C
Arnold 1A
Arnold 1B
ArnoldCascade
Arnold 1C
Arnold 1D
Arnold 1E
Percent Fines in Tryon Creek Riffles
Area w/ Fines<12% >=12% and <=25% Fines>25%
Figure 3-116: Percentage of Riffle Area in Johnson Creek Where Fines Exceed 12 PercentSource: ODFW, 2001.
The proportion of fine sediments covering riffles was least desirable in the Willamette Riverconfluence region (100 percent riffles with more than 25 percent fines). Remaining reachesexhibited marginal riffle quality based on the proportion of fine sediment covering streambottom substrates: 12 percent-25 percent fines. Although riffle habitat in most reaches did nothave significant (undesirable with > 25 percent) proportions of fine sediments, the majorityof riffle habitat is considered sub optimal quality with >12 percent fine sediment overlayingriffle gravel substrates.
Tryon Creek drains a watershed that is characterized by a natural abundance of fine silt. Landuse practices have likely exacerbated the natural condition of the stream to transport highlevels of fine sediment. In addition, fine sediment originating from the steeper, moreurbanized upper watershed settles out in the lower gradient reaches (in the Park). Stormwaterrun-off sediment loading, along with fine silts that slough into the creek during erosive flowshas resulted in a constant layer of fine silt and sediment overlaying stream bottom substrates.These high silt loads overlaying spawning and rearing grounds may significantly impair thecarrying capacity of Tryon Creek.
In addition to these above environmental attributes, changes to the hydrologic regime inTryon Creek have significantly affected stream building process, habitat quantity, and habitat
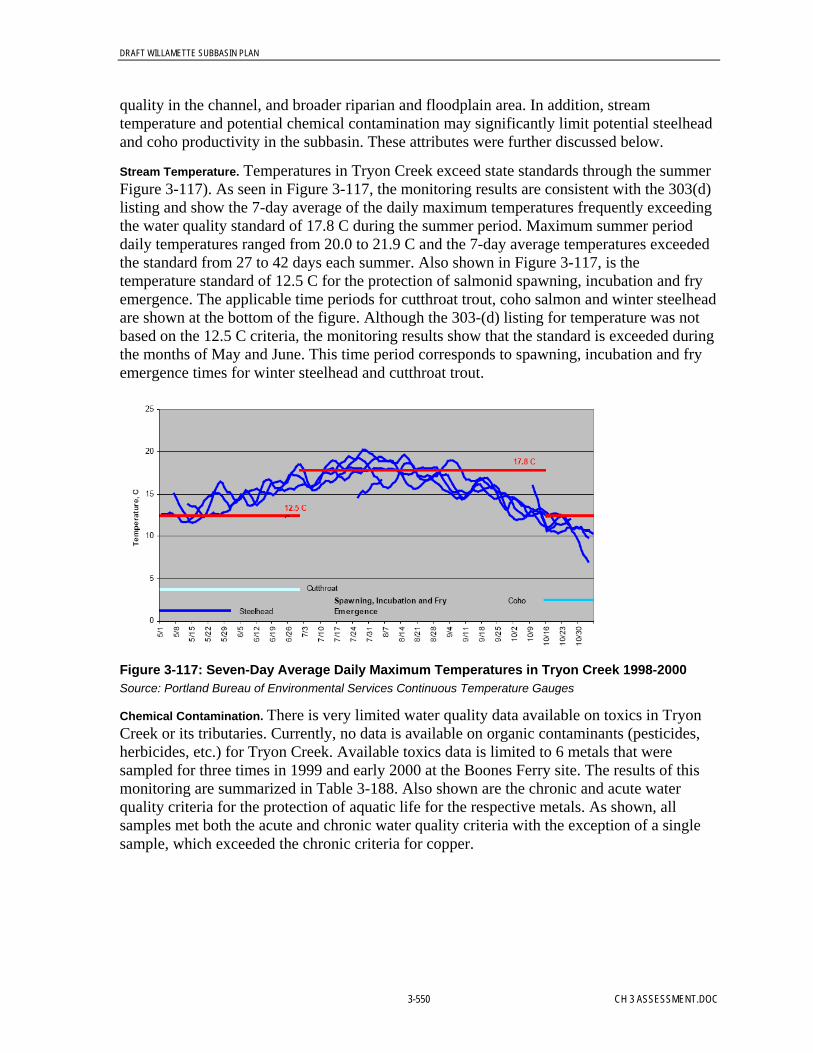
DRAFT WILLAMETTE SUBBASIN PLAN
3-550 CH 3 ASSESSMENT.DOC
quality in the channel, and broader riparian and floodplain area. In addition, streamtemperature and potential chemical contamination may significantly limit potential steelheadand coho productivity in the subbasin. These attributes were further discussed below.
Stream Temperature. Temperatures in Tryon Creek exceed state standards through the summerFigure 3-117). As seen in Figure 3-117, the monitoring results are consistent with the 303(d)listing and show the 7-day average of the daily maximum temperatures frequently exceedingthe water quality standard of 17.8 C during the summer period. Maximum summer perioddaily temperatures ranged from 20.0 to 21.9 C and the 7-day average temperatures exceededthe standard from 27 to 42 days each summer. Also shown in Figure 3-117, is thetemperature standard of 12.5 C for the protection of salmonid spawning, incubation and fryemergence. The applicable time periods for cutthroat trout, coho salmon and winter steelheadare shown at the bottom of the figure. Although the 303-(d) listing for temperature was notbased on the 12.5 C criteria, the monitoring results show that the standard is exceeded duringthe months of May and June. This time period corresponds to spawning, incubation and fryemergence times for winter steelhead and cutthroat trout.
Figure 3-117: Seven-Day Average Daily Maximum Temperatures in Tryon Creek 1998-2000Source: Portland Bureau of Environmental Services Continuous Temperature Gauges
Chemical Contamination. There is very limited water quality data available on toxics in TryonCreek or its tributaries. Currently, no data is available on organic contaminants (pesticides,herbicides, etc.) for Tryon Creek. Available toxics data is limited to 6 metals that weresampled for three times in 1999 and early 2000 at the Boones Ferry site. The results of thismonitoring are summarized in Table 3-188. Also shown are the chronic and acute waterquality criteria for the protection of aquatic life for the respective metals. As shown, allsamples met both the acute and chronic water quality criteria with the exception of a singlesample, which exceeded the chronic criteria for copper.
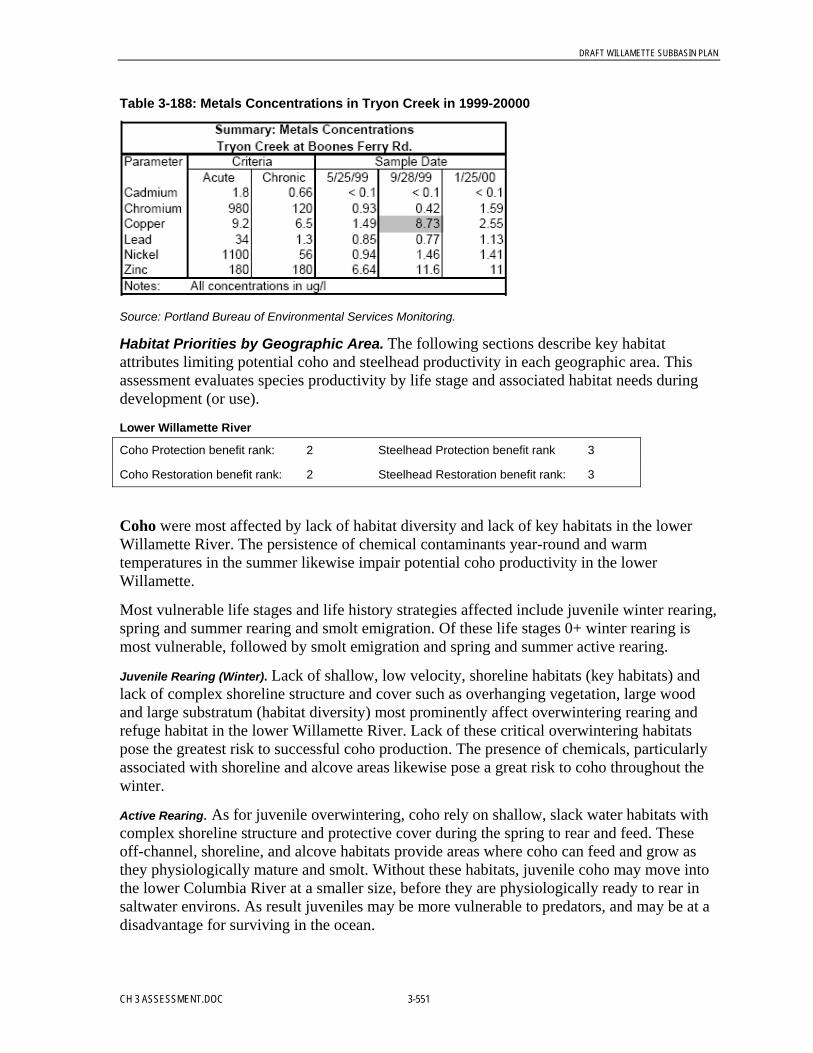
DRAFT WILLAMETTE SUBBASIN PLAN
CH 3 ASSESSMENT.DOC 3-551
Table 3-188: Metals Concentrations in Tryon Creek in 1999-20000
Source: Portland Bureau of Environmental Services Monitoring.
Habitat Priorities by Geographic Area. The following sections describe key habitatattributes limiting potential coho and steelhead productivity in each geographic area. Thisassessment evaluates species productivity by life stage and associated habitat needs duringdevelopment (or use).
Lower Willamette River
Coho Protection benefit rank: 2 Steelhead Protection benefit rank 3
Coho Restoration benefit rank: 2 Steelhead Restoration benefit rank: 3
Coho were most affected by lack of habitat diversity and lack of key habitats in the lowerWillamette River. The persistence of chemical contaminants year-round and warmtemperatures in the summer likewise impair potential coho productivity in the lowerWillamette.
Most vulnerable life stages and life history strategies affected include juvenile winter rearing,spring and summer rearing and smolt emigration. Of these life stages 0+ winter rearing ismost vulnerable, followed by smolt emigration and spring and summer active rearing.
Juvenile Rearing (Winter). Lack of shallow, low velocity, shoreline habitats (key habitats) andlack of complex shoreline structure and cover such as overhanging vegetation, large woodand large substratum (habitat diversity) most prominently affect overwintering rearing andrefuge habitat in the lower Willamette River. Lack of these critical overwintering habitatspose the greatest risk to successful coho production. The presence of chemicals, particularlyassociated with shoreline and alcove areas likewise pose a great risk to coho throughout thewinter.
Active Rearing. As for juvenile overwintering, coho rely on shallow, slack water habitats withcomplex shoreline structure and protective cover during the spring to rear and feed. Theseoff-channel, shoreline, and alcove habitats provide areas where coho can feed and grow asthey physiologically mature and smolt. Without these habitats, juvenile coho may move intothe lower Columbia River at a smaller size, before they are physiologically ready to rear insaltwater environs. As result juveniles may be more vulnerable to predators, and may be at adisadvantage for surviving in the ocean.

DRAFT WILLAMETTE SUBBASIN PLAN
3-552 CH 3 ASSESSMENT.DOC
Smolt Emigration. During emigration, coho smolts are most prominently affected by chemicalcontaminants and lack of key habitats. Although off-channel or marginal shoreline habitatsremain important, once juvenile coho begin emigrating, moving out of the overwinteringhabitats and actively moving through the lower mainstem channel, they become less relianton key habitat areas, thus becoming more sensitive to other environmental conditions thataffect there ability to move downstream. In the lower Willamette, chemical contaminationposes a great risk to coho as they emigrate seaward to the lower Columbia estuary.
Steelhead were most affected by chemicals and lack of key habitats in the lower WillametteRiver. Most vulnerable life stages and life history strategies affected include smoltemigration and prespawning adult migrations.
Smolt Emigration. Steelhead migrants are most prominently affected by chemical contaminantsand lack of key habitats to temporarily rear and reside. As for coho, alcoves, tributaryconfluences and off-channel areas are important to juvenile steelhead as they head seawardinto the lower Columbia River. These areas are most prominently used for temporary refugeduring storm flows and for temporary rearing. In addition to these areas, chemicalcontamination in the lower Willamette River prominently affects Johnson Creek steelheadproductivity. As steelhead become less reliant on key habitat areas, they become moresensitive to environmental conditions that affect their ability to move downstream. In thelower Willamette, chemical contamination poses a critical risk to steelhead as they emigrateseaward from March through June.
Prespawning Adult. Adult steelhead enter the lower Willamette River from late fall throughspring and are most prominently affected by lack of key holding areas, such as deeper pools,and chemical contamination.
Lower Tryon Creek
Coho Protection benefit rank: 1 Steelhead Protection benefit rank 1
Coho Restoration benefit rank: 1 Steelhead Restoration benefit rank: 1
The confluence area of lower Tryon Creek functions as off-channel rearing and refugehabitat to lower Willamette and upper Willamette Basin coho, Chinook and steelhead year-round. The habitat value that these types of environs provide are critically important duringearly and juvenile life history rearing by Willamette basin salmonids; and key habitatpriorities to enhance functional value provided by these areas are described in the lowerWillamette River piece.
Coho were most affected by lack of habitat diversity, poor channel stability, lack of food,high peak flows in the winter and low flows in the summer and sediment loading. Thecombination of minimal off-channel habitat and high flows likely pose the greatest risk tosuccessful coho production. Slack water habitats are most important during winter rearingand are likewise critically important as high flow refugia during peak and prolonged winterflows.
Most vulnerable life stages and life history strategies (e.g., habitat preferences) in middleTryon Creek include egg incubation, fry colonization, and juvenile rearing (winter andsummer). As stated previously, habitat evaluations in Tryon Creek presume that adults can
DRAFT WILLAMETTE SUBBASIN PLAN
CH 3 ASSESSMENT.DOC 3-553
pass HWY 43—adult holding and spawning were not considered limiting factors to cohoproduction
Egg Incubation and Fry Colonization. Poor channel stability and high sediment loads mostprominently affect egg incubation. Chemical contamination and lack of key habitat, such asstable riffle beds, likewise affect egg-to-fry survival. Winter flows and its affect on bed scourmay be a potential concern in the reach immediately below Boones Ferry Rd.
Fry colonization is most prominently influenced by lack of habitat diversity, high springflows and associated channel instability. Lack of aquatic insects for feeding, and poor waterquality (chemical contamination and temperature) likewise adversely affect fry to juvenilesurvival.
Juvenile Rearing (Summer and Winter). Lack of deep pools (habitat diversity), lack of aquaticinsects (for source food) and low summer flows (and stream temperature) most prominentlyaffect juvenile production through the summer. In addition, chemical contamination remainsa concern through the summer; and competition with other species could be a concern.
Lack of off-channel, and slack water habitats is the primary limiting factor for coho duringwinter rearing. Other significant influences on overwintering survival include channelstability and food. Peak flows and associated water quality (chemical contamination and highsediment loads) are likewise considered important attributes affecting juvenile survival (andrearing) through the winter.
Steelhead were affected most by flow, sediment and lack of habitat diversity. Low summerflows, and high winter flows combined with few off-channel areas, deep pools, and instreamstructure are likely prominent factors. In addition, high sedimentation in the winter andsummer can smother eggs and inhibit macroinvertebrate production. Channel stability andchemical contamination are likewise key attributes affecting potential steelhead production.
Most vulnerable life stages and life history strategies (e.g., habitat preferences) in middleTryon Creek include egg incubation and juvenile rearing (winter and summer).
Egg Incubation. High sediment loading during from late winter through early spring mostprominently affect egg incubation. Chemical contamination and channel instability, such asunstable riffle beds, likewise affect egg-to-fry survival.
Juvenile Rearing (Summer and Winter). Low summer flow is the primary limiting factor affectingage 0+ and age 1+ productivity. Elevated stream temperature also affects summer rearing,particularly in the middle and upper portion of middle Tryon Creek, where stream gradientsteepens. Lack of deep pools with logs and woody debris, and exposed riffle beds (habitatdiversity) along with associated low aquatic insect production significantly affect steelheadproductivity.
Lack of deep pools and large wood (habitat diversity), high flow refugia in the form of side-channels, terraced banks, and off-channel habitats (habitat diversity), high sediment loads,high peak winter flows, and channel instability impair steelhead productivity.
DRAFT WILLAMETTE SUBBASIN PLAN
3-554 CH 3 ASSESSMENT.DOC
Middle Tryon Creek
Coho Protection benefit rank: 3 Steelhead Protection benefit rank 2
Coho Restoration benefit rank: 3 Steelhead Restoration benefit rank: 2
Coho were most affected by lack of habitat diversity, poor channel stability, lack of food,high peak flows in the winter and low flows in the summer and sediment loading. Theabsence of off-channel habitat, combined with high stream velocity would significantly limitcoho production in this reach. Slack water habitats are most important during winter rearingand are likewise critically important as high flow refugia during peak and prolonged winterflows.
Note, historically upper Tryon Creek likely did not provide high quality coho rearing habitat.This reach is moderately steep and bound by steeper valley walls. Areas of low gradient,slack water likely existed, however, much of the coho production likely occurred in lowerTryon Creek.
Most vulnerable life stages and life history strategies (e.g., habitat preferences) in upperTryon Creek include egg incubation and juvenile rearing (winter and summer).
Egg Incubation. Poor channel stability and high sediment loads most prominently affect eggincubation. Chemical contamination and lack of key habitat, such as stable riffle beds,likewise affect egg-to-fry survival.
Juvenile Rearing (Summer and Winter). Lack of deep pools and protective cover (habitatdiversity), lack of aquatic insects (for source food) and low summer flows (and streamtemperature) most prominently affect juvenile production through the summer. In addition,channel instability and chemical contamination remains a concern through the summer.
Lack of off-channel, and slack water habitats (key habitat) and diverse habitats (e.g., deeppools, beaver dams, and channel morphology) (habitat diversity) are the primary limitingfactors for coho during winter rearing. Other significant influences on overwintering survivalinclude channel instability and lack of food. Peak flows and associated water quality(chemical contamination and high sediment loads) are likewise considered importantattributes affecting juvenile survival (and rearing) through the winter.
Steelhead were affected most by flow, sediment and lack of habitat diversity. Low summerflows, and high winter flows combined with few off-channel areas, deep pools, and instreamstructure are likely prominent factors. In addition, high sedimentation in the winter andsummer can smother eggs and inhibit macroinvertebrate production. Channel instability andchemical contamination are likewise key attributes affecting potential steelhead production inthis upper, urbanized reach.
Most vulnerable life stages and life history strategies (e.g., habitat preferences) affected inupper Tryon Creek include egg incubation and juvenile rearing (winter and summer).
Egg Incubation. High sedimentation of riffle habitat most prominently affect egg-to-frysurvival (e.g., smothering and suffocation). High peak flows through the winter and spring,channel instability and chemical contamination likewise affect egg-to-fry survival.

DRAFT WILLAMETTE SUBBASIN PLAN
CH 3 ASSESSMENT.DOC 3-555
Juvenile Rearing (Summer and Winter). Lack of deep pools (habitat diversity), lack of aquaticinsects (for source food) and low summer flows (and stream temperature) most prominentlyaffect juvenile production through the summer. In addition, chemical contamination remainsa concern through the summer; and competition with other species could be a concern.
Lack of deep pools and off-channel refugia (key habitats) is the primary limiting factor forsteelhead during winter rearing. Other significant influences on overwintering survivalinclude lack of large wood to provide protective cover, channel stability and lack of food.Peak flows and associated water quality (chemical contamination and high sediment loads)are likewise considered important attributes affecting potential survival through the winter.
Basinwide. The assessment of Tryon Creek subbasin included two species and twopopulations: coho and steelhead. This provided the opportunity to examine the subbasin in amulti-species context by putting all of the information together to create a more holisticdepiction of habitat conditions in Tryon Creek watershed. This also provides anotherdimension for examining restoration and protection priorities for habitat in Tryon Creek.
Figure 3-118 displays the results of the EDT spatial analysis for coho and steelhead and thetwo populations combined. This figure shows the effect of degrading conditions further(protection priority) and of restoring conditions (restoration priorities) in each geographicarea on the equilibrium abundance of each population. Protection priorities describe howTryon Creek currently functions, with regards to providing key fish bearing habitat. In termsof abundance, most of the current habitat potential (e.g., protection potential) is in lowerTryon Creek. Interestingly, the best restoration potential for both species is likewise realizedin lower Tryon Creek. Although restoration (and protection) of middle Tryon Creek wouldundoubtedly improve habitat conditions in both middle and lower Tryon, this reach did notlikely support substantive coho rearing. Under normative hydrologic regimes, steelheadwould have likely thrived in this upper reach.
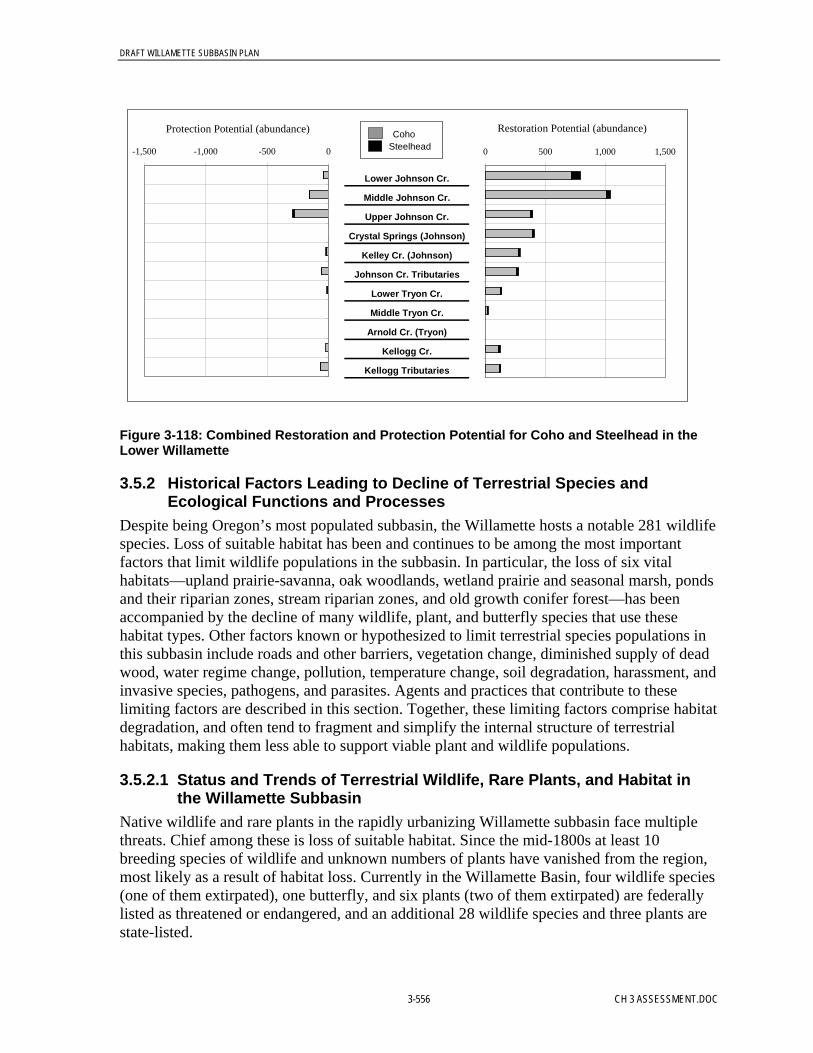
DRAFT WILLAMETTE SUBBASIN PLAN
3-556 CH 3 ASSESSMENT.DOC
Lower Johnson Cr.
Middle Johnson Cr.
Upper Johnson Cr.
Crystal Springs (Johnson)
Kelley Cr. (Johnson)
Johnson Cr. Tributaries
Lower Tryon Cr.
Middle Tryon Cr.
Arnold Cr. (Tryon)
Kellogg Cr.
Kellogg Tributaries
Restoration Potential (abundance)
0 500 1,000 1,500
Protection Potential (abundance)
-1,500 -1,000 -500 0
CohoSteelhead
Figure 3-118: Combined Restoration and Protection Potential for Coho and Steelhead in theLower Willamette
3.5.2 Historical Factors Leading to Decline of Terrestrial Species andEcological Functions and Processes
Despite being Oregon’s most populated subbasin, the Willamette hosts a notable 281 wildlifespecies. Loss of suitable habitat has been and continues to be among the most importantfactors that limit wildlife populations in the subbasin. In particular, the loss of six vitalhabitats—upland prairie-savanna, oak woodlands, wetland prairie and seasonal marsh, pondsand their riparian zones, stream riparian zones, and old growth conifer forest—has beenaccompanied by the decline of many wildlife, plant, and butterfly species that use thesehabitat types. Other factors known or hypothesized to limit terrestrial species populations inthis subbasin include roads and other barriers, vegetation change, diminished supply of deadwood, water regime change, pollution, temperature change, soil degradation, harassment, andinvasive species, pathogens, and parasites. Agents and practices that contribute to theselimiting factors are described in this section. Together, these limiting factors comprise habitatdegradation, and often tend to fragment and simplify the internal structure of terrestrialhabitats, making them less able to support viable plant and wildlife populations.
3.5.2.1 Status and Trends of Terrestrial Wildlife, Rare Plants, and Habitat inthe Willamette Subbasin
Native wildlife and rare plants in the rapidly urbanizing Willamette subbasin face multiplethreats. Chief among these is loss of suitable habitat. Since the mid-1800s at least 10breeding species of wildlife and unknown numbers of plants have vanished from the region,most likely as a result of habitat loss. Currently in the Willamette Basin, four wildlife species(one of them extirpated), one butterfly, and six plants (two of them extirpated) are federallylisted as threatened or endangered, and an additional 28 wildlife species and three plants arestate-listed.
DRAFT WILLAMETTE SUBBASIN PLAN
CH 3 ASSESSMENT.DOC 3-557
Quantitative trends data are available only for breeding bird species and a few non-birdspecies. For those nesting bird species for which breeding bird survey trends data arestatistically significant, 12 native species declined and two increased in lowlands of theregion during the periods 1968 to 2003 or 1980 to 2003, the longest periods for which dataare available. Less definitively, trends can be surmised from known changes in the extent ofdifferent habitat types. For this, computer application of species-habitat models to currentand mid-1800s land cover maps suggests that 75 percent of the subbasin’s 281 nativebreeding wildlife species now have less extensive areas of suitable habitat than they didhistorically. Most native wildlife species have lost more than 12 percent of the area (andsome have lost all the area) that likely provided habitat in the mid-1800s.
Except for a few listed species, no reliable predictions are available of future viability ofspecies populations. The multi-partner Willamette “Alternative Futures” project (Baker et al.,2004; Hulse et al., 2004) inferred the future status of species by projecting and mappingfuture land cover under various scenarios of conservation and development. Theseinvestigators found that no plausible future scenario could completely restore wildlife to mid-1800s conditions. The project projected that 172 wildlife species (62 percent of the subbasintotal) would lose habitat as a consequence of the most plausible “development” scenario forthe Willamette subbasin, whereas under the most plausible “conservation” scenario only 82wildlife species (29 percent of the total) might still lose habitat. The impacts of developmentor conservation on rare plants were not assessed.
Habitats important to wildlife and rare plants that have decreased the most within theWillamette Basin include oak woodland, upland prairie, savanna, wetland prairie, seasonalmarsh, ponds and their riparian zones, streams/rivers and their riparian zones, and old-growthconifer forest. These are termed focal habitats in this plan. All Willamette Basin wildlife andplant species that are listed under the Endangered Species Act and all sensitive species listedby ODFW depend heavily on one or more of these focal habitats.
3.5.2.2 Factors Known or Hypothesized To Be Limiting Within the WillametteBasin
Wildlife limiting factors were identified by reference to several information sources andconsultations with experts. For listed species, the published recovery plans and federal listingnotices were a primary source. For Partners in Flight species, the regional conservationstrategy documents were used. For other species, standard references such as Marshall et al.(2003), Verts and Carraway (1998), and NatureServe (the information base of the statenatural heritage programs) were consulted first. Subsequently, scientific papers on PacificNorthwest populations of individual species were reviewed when available. Limiting factorsfor each of the focal habitats were identified partly through review of key regionaldocuments, such as Hulse et al. (2002), Floberg et al. (2004), and Altman (1999, 2000). Fromknowledge of species life histories and associations with particular focal habitats, additionallimiting factors for individual species were then identified. Subbasin vegetation changeestimates also were used to gauge the relative importance of habitat loss as a possiblelimiting factor for each species. Finally, for each focal species a list of “managementactivities” associated with its primary habitats was generated from the IBIS database, andwas scanned to check for important limiting factors that might have been overlooked by othersources.
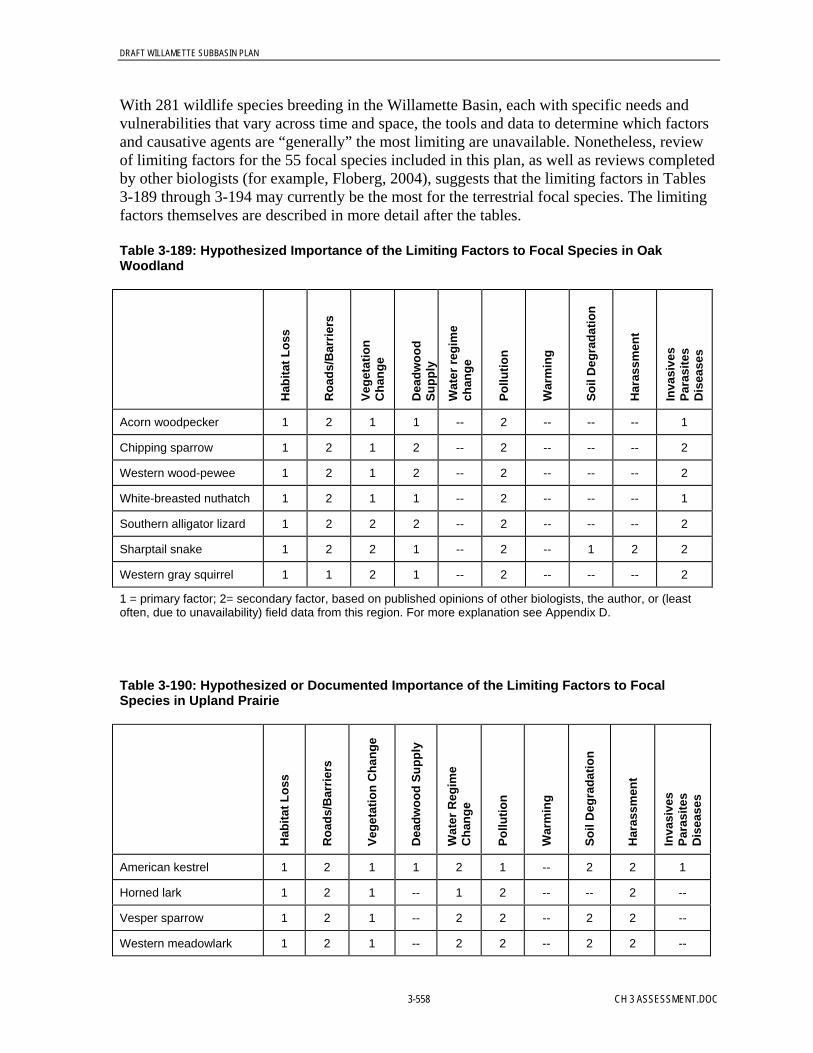
DRAFT WILLAMETTE SUBBASIN PLAN
3-558 CH 3 ASSESSMENT.DOC
With 281 wildlife species breeding in the Willamette Basin, each with specific needs andvulnerabilities that vary across time and space, the tools and data to determine which factorsand causative agents are “generally” the most limiting are unavailable. Nonetheless, reviewof limiting factors for the 55 focal species included in this plan, as well as reviews completedby other biologists (for example, Floberg, 2004), suggests that the limiting factors in Tables3-189 through 3-194 may currently be the most for the terrestrial focal species. The limitingfactors themselves are described in more detail after the tables.
Table 3-189: Hypothesized Importance of the Limiting Factors to Focal Species in OakWoodland
Hab
itat L
oss
Roa
ds/B
arrie
rs
Vege
tatio
nC
hang
e
Dea
dwoo
dSu
pply
Wat
er re
gim
ech
ange
Pollu
tion
War
min
g
Soil
Deg
rada
tion
Har
assm
ent
Inva
sive
sPa
rasi
tes
Dis
ease
s
Acorn woodpecker 1 2 1 1 -- 2 -- -- -- 1
Chipping sparrow 1 2 1 2 -- 2 -- -- -- 2
Western wood-pewee 1 2 1 2 -- 2 -- -- -- 2
White-breasted nuthatch 1 2 1 1 -- 2 -- -- -- 1
Southern alligator lizard 1 2 2 2 -- 2 -- -- -- 2
Sharptail snake 1 2 2 1 -- 2 -- 1 2 2
Western gray squirrel 1 1 2 1 -- 2 -- -- -- 2
1 = primary factor; 2= secondary factor, based on published opinions of other biologists, the author, or (leastoften, due to unavailability) field data from this region. For more explanation see Appendix D.
Table 3-190: Hypothesized or Documented Importance of the Limiting Factors to FocalSpecies in Upland Prairie
Hab
itat L
oss
Roa
ds/B
arrie
rs
Vege
tatio
n C
hang
e
Dea
dwoo
d Su
pply
Wat
er R
egim
eC
hang
e
Pollu
tion
War
min
g
Soil
Deg
rada
tion
Har
assm
ent
Inva
sive
sPa
rasi
tes
Dis
ease
s
American kestrel 1 2 1 1 2 1 -- 2 2 1
Horned lark 1 2 1 -- 1 2 -- -- 2 --
Vesper sparrow 1 2 1 -- 2 2 -- 2 2 --
Western meadowlark 1 2 1 -- 2 2 -- 2 2 --
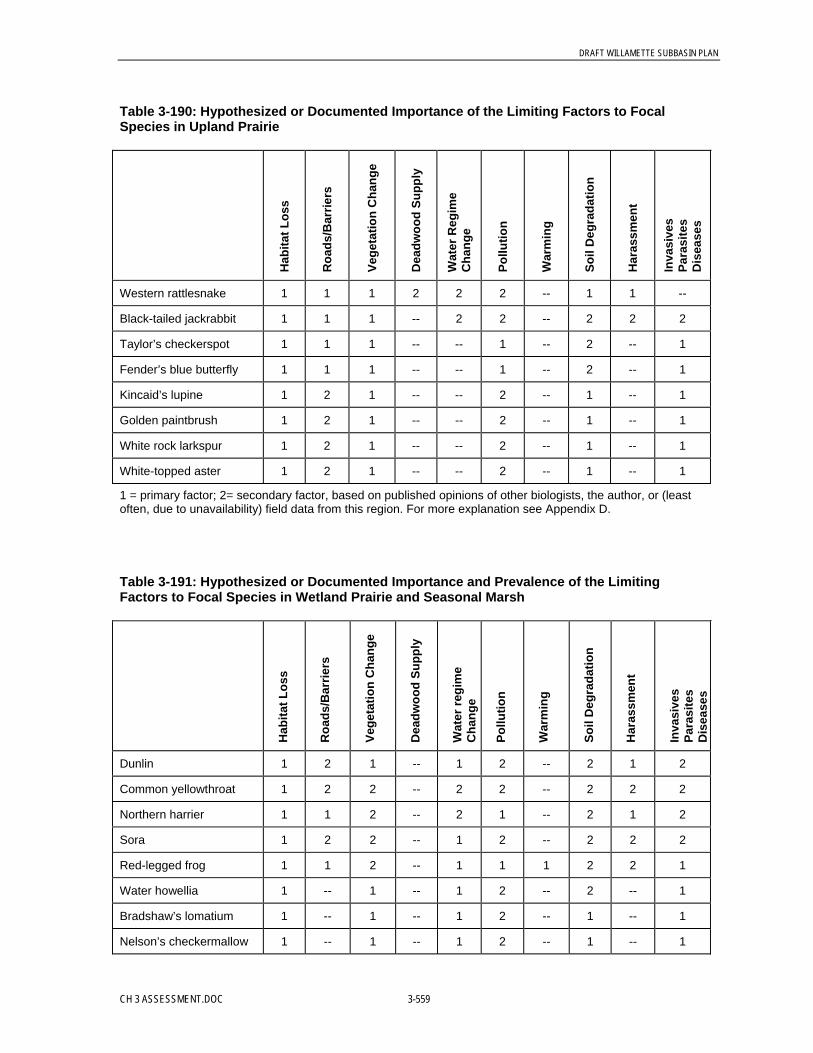
DRAFT WILLAMETTE SUBBASIN PLAN
CH 3 ASSESSMENT.DOC 3-559
Table 3-190: Hypothesized or Documented Importance of the Limiting Factors to FocalSpecies in Upland Prairie
Hab
itat L
oss
Roa
ds/B
arrie
rs
Vege
tatio
n C
hang
e
Dea
dwoo
d Su
pply
Wat
er R
egim
eC
hang
e
Pollu
tion
War
min
g
Soil
Deg
rada
tion
Har
assm
ent
Inva
sive
sPa
rasi
tes
Dis
ease
s
Western rattlesnake 1 1 1 2 2 2 -- 1 1 --
Black-tailed jackrabbit 1 1 1 -- 2 2 -- 2 2 2
Taylor’s checkerspot 1 1 1 -- -- 1 -- 2 -- 1
Fender’s blue butterfly 1 1 1 -- -- 1 -- 2 -- 1
Kincaid’s lupine 1 2 1 -- -- 2 -- 1 -- 1
Golden paintbrush 1 2 1 -- -- 2 -- 1 -- 1
White rock larkspur 1 2 1 -- -- 2 -- 1 -- 1
White-topped aster 1 2 1 -- -- 2 -- 1 -- 1
1 = primary factor; 2= secondary factor, based on published opinions of other biologists, the author, or (leastoften, due to unavailability) field data from this region. For more explanation see Appendix D.
Table 3-191: Hypothesized or Documented Importance and Prevalence of the LimitingFactors to Focal Species in Wetland Prairie and Seasonal Marsh
Hab
itat L
oss
Roa
ds/B
arrie
rs
Vege
tatio
n C
hang
e
Dea
dwoo
d Su
pply
Wat
er re
gim
eC
hang
e
Pollu
tion
War
min
g
Soil
Deg
rada
tion
Har
assm
ent
Inva
sive
sPa
rasi
tes
Dis
ease
s
Dunlin 1 2 1 -- 1 2 -- 2 1 2
Common yellowthroat 1 2 2 -- 2 2 -- 2 2 2
Northern harrier 1 1 2 -- 2 1 -- 2 1 2
Sora 1 2 2 -- 1 2 -- 2 2 2
Red-legged frog 1 1 2 -- 1 1 1 2 2 1
Water howellia 1 -- 1 -- 1 2 -- 2 -- 1
Bradshaw’s lomatium 1 -- 1 -- 1 2 -- 1 -- 1
Nelson’s checkermallow 1 -- 1 -- 1 2 -- 1 -- 1
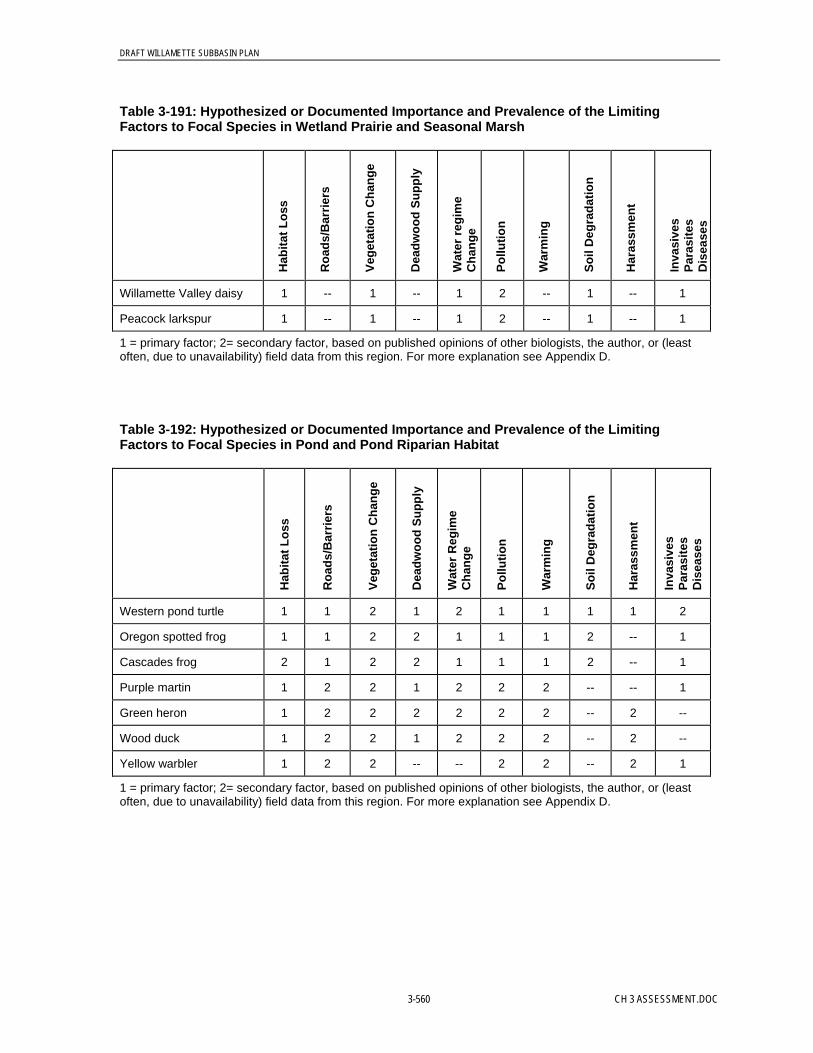
DRAFT WILLAMETTE SUBBASIN PLAN
3-560 CH 3 ASSESSMENT.DOC
Table 3-191: Hypothesized or Documented Importance and Prevalence of the LimitingFactors to Focal Species in Wetland Prairie and Seasonal Marsh
Hab
itat L
oss
Roa
ds/B
arrie
rs
Vege
tatio
n C
hang
e
Dea
dwoo
d Su
pply
Wat
er re
gim
eC
hang
e
Pollu
tion
War
min
g
Soil
Deg
rada
tion
Har
assm
ent
Inva
sive
sPa
rasi
tes
Dis
ease
s
Willamette Valley daisy 1 -- 1 -- 1 2 -- 1 -- 1
Peacock larkspur 1 -- 1 -- 1 2 -- 1 -- 1
1 = primary factor; 2= secondary factor, based on published opinions of other biologists, the author, or (leastoften, due to unavailability) field data from this region. For more explanation see Appendix D.
Table 3-192: Hypothesized or Documented Importance and Prevalence of the LimitingFactors to Focal Species in Pond and Pond Riparian Habitat
Hab
itat L
oss
Roa
ds/B
arrie
rs
Vege
tatio
n C
hang
e
Dea
dwoo
d Su
pply
Wat
er R
egim
eC
hang
e
Pollu
tion
War
min
g
Soil
Deg
rada
tion
Har
assm
ent
Inva
sive
sPa
rasi
tes
Dis
ease
s
Western pond turtle 1 1 2 1 2 1 1 1 1 2
Oregon spotted frog 1 1 2 2 1 1 1 2 -- 1
Cascades frog 2 1 2 2 1 1 1 2 -- 1
Purple martin 1 2 2 1 2 2 2 -- -- 1
Green heron 1 2 2 2 2 2 2 -- 2 --
Wood duck 1 2 2 1 2 2 2 -- 2 --
Yellow warbler 1 2 2 -- -- 2 2 -- 2 1
1 = primary factor; 2= secondary factor, based on published opinions of other biologists, the author, or (leastoften, due to unavailability) field data from this region. For more explanation see Appendix D.
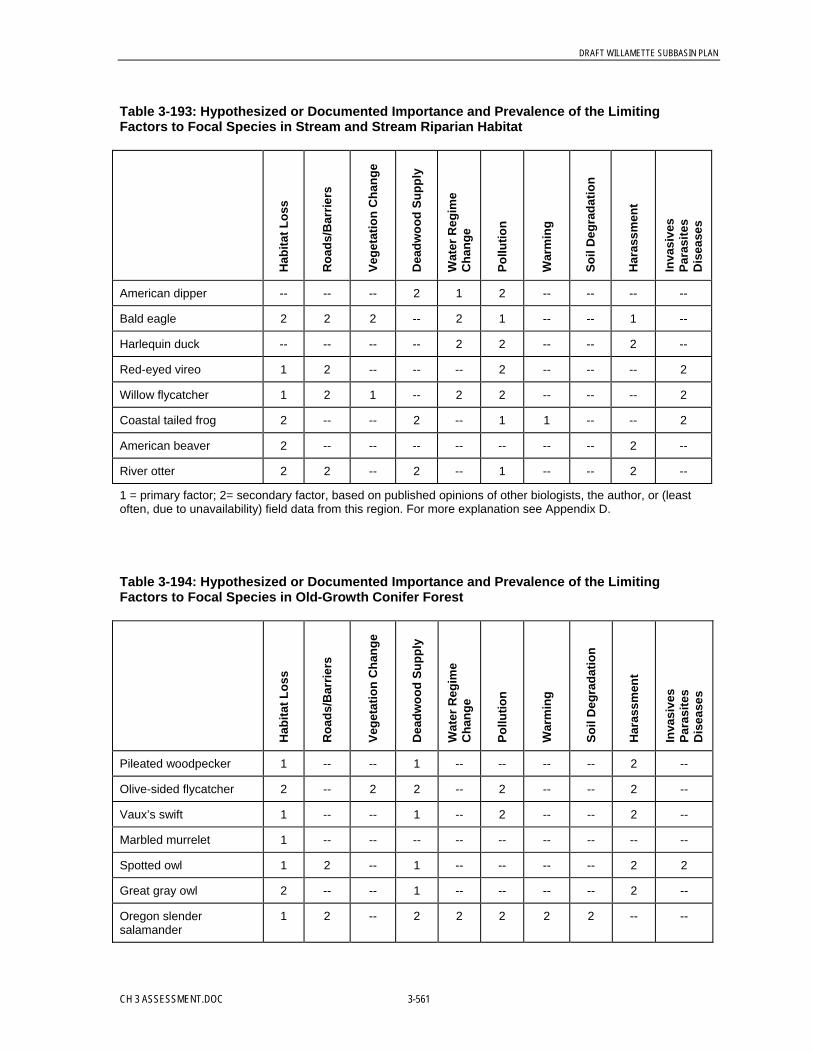
DRAFT WILLAMETTE SUBBASIN PLAN
CH 3 ASSESSMENT.DOC 3-561
Table 3-193: Hypothesized or Documented Importance and Prevalence of the LimitingFactors to Focal Species in Stream and Stream Riparian Habitat
Hab
itat L
oss
Roa
ds/B
arrie
rs
Vege
tatio
n C
hang
e
Dea
dwoo
d Su
pply
Wat
er R
egim
eC
hang
e
Pollu
tion
War
min
g
Soil
Deg
rada
tion
Har
assm
ent
Inva
sive
sPa
rasi
tes
Dis
ease
s
American dipper -- -- -- 2 1 2 -- -- -- --
Bald eagle 2 2 2 -- 2 1 -- -- 1 --
Harlequin duck -- -- -- -- 2 2 -- -- 2 --
Red-eyed vireo 1 2 -- -- -- 2 -- -- -- 2
Willow flycatcher 1 2 1 -- 2 2 -- -- -- 2
Coastal tailed frog 2 -- -- 2 -- 1 1 -- -- 2
American beaver 2 -- -- -- -- -- -- -- 2 --
River otter 2 2 -- 2 -- 1 -- -- 2 --
1 = primary factor; 2= secondary factor, based on published opinions of other biologists, the author, or (leastoften, due to unavailability) field data from this region. For more explanation see Appendix D.
Table 3-194: Hypothesized or Documented Importance and Prevalence of the LimitingFactors to Focal Species in Old-Growth Conifer Forest
Hab
itat L
oss
Roa
ds/B
arrie
rs
Vege
tatio
n C
hang
e
Dea
dwoo
d Su
pply
Wat
er R
egim
eC
hang
e
Pollu
tion
War
min
g
Soil
Deg
rada
tion
Har
assm
ent
Inva
sive
sPa
rasi
tes
Dis
ease
s
Pileated woodpecker 1 -- -- 1 -- -- -- -- 2 --
Olive-sided flycatcher 2 -- 2 2 -- 2 -- -- 2 --
Vaux’s swift 1 -- -- 1 -- 2 -- -- 2 --
Marbled murrelet 1 -- -- -- -- -- -- -- -- --
Spotted owl 1 2 -- 1 -- -- -- -- 2 2
Great gray owl 2 -- -- 1 -- -- -- -- 2 --
Oregon slendersalamander
1 2 -- 2 2 2 2 2 -- --
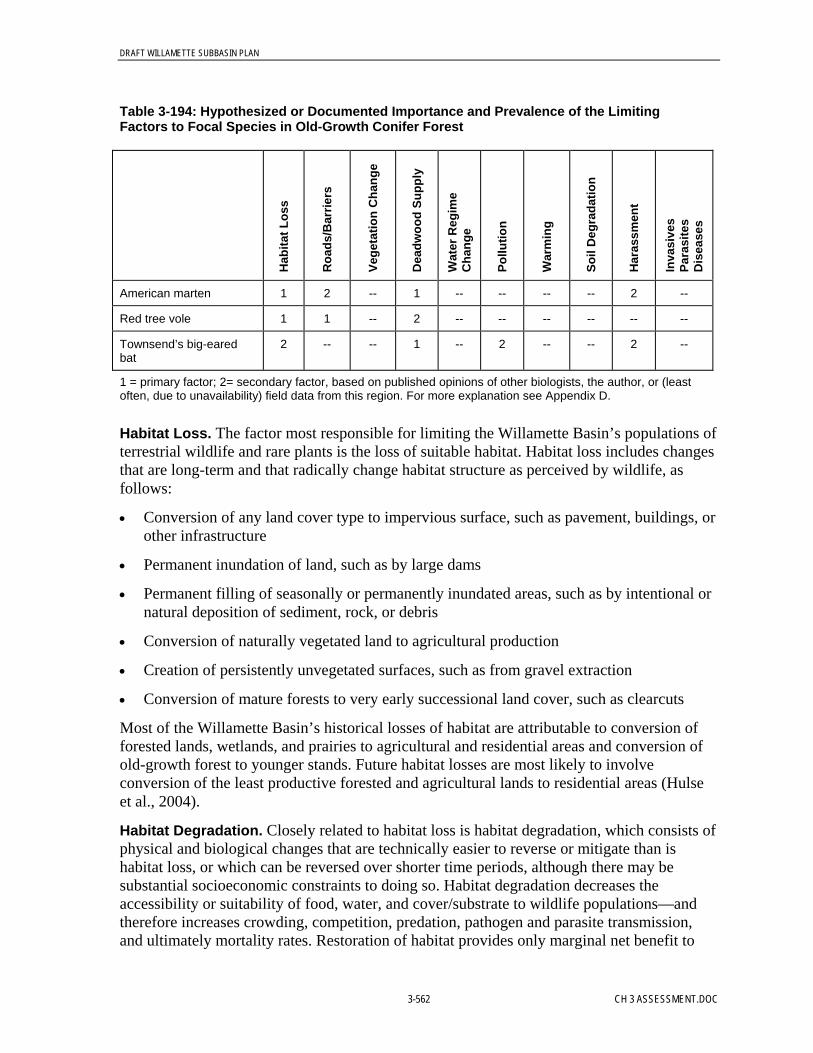
DRAFT WILLAMETTE SUBBASIN PLAN
3-562 CH 3 ASSESSMENT.DOC
Table 3-194: Hypothesized or Documented Importance and Prevalence of the LimitingFactors to Focal Species in Old-Growth Conifer Forest
Hab
itat L
oss
Roa
ds/B
arrie
rs
Vege
tatio
n C
hang
e
Dea
dwoo
d Su
pply
Wat
er R
egim
eC
hang
e
Pollu
tion
War
min
g
Soil
Deg
rada
tion
Har
assm
ent
Inva
sive
sPa
rasi
tes
Dis
ease
s
American marten 1 2 -- 1 -- -- -- -- 2 --
Red tree vole 1 1 -- 2 -- -- -- -- -- --
Townsend’s big-earedbat
2 -- -- 1 -- 2 -- -- 2 --
1 = primary factor; 2= secondary factor, based on published opinions of other biologists, the author, or (leastoften, due to unavailability) field data from this region. For more explanation see Appendix D.
Habitat Loss. The factor most responsible for limiting the Willamette Basin’s populations ofterrestrial wildlife and rare plants is the loss of suitable habitat. Habitat loss includes changesthat are long-term and that radically change habitat structure as perceived by wildlife, asfollows:
• Conversion of any land cover type to impervious surface, such as pavement, buildings, orother infrastructure
• Permanent inundation of land, such as by large dams
• Permanent filling of seasonally or permanently inundated areas, such as by intentional ornatural deposition of sediment, rock, or debris
• Conversion of naturally vegetated land to agricultural production
• Creation of persistently unvegetated surfaces, such as from gravel extraction
• Conversion of mature forests to very early successional land cover, such as clearcuts
Most of the Willamette Basin’s historical losses of habitat are attributable to conversion offorested lands, wetlands, and prairies to agricultural and residential areas and conversion ofold-growth forest to younger stands. Future habitat losses are most likely to involveconversion of the least productive forested and agricultural lands to residential areas (Hulseet al., 2004).
Habitat Degradation. Closely related to habitat loss is habitat degradation, which consists ofphysical and biological changes that are technically easier to reverse or mitigate than ishabitat loss, or which can be reversed over shorter time periods, although there may besubstantial socioeconomic constraints to doing so. Habitat degradation decreases theaccessibility or suitability of food, water, and cover/substrate to wildlife populations—andtherefore increases crowding, competition, predation, pathogen and parasite transmission,and ultimately mortality rates. Restoration of habitat provides only marginal net benefit to

DRAFT WILLAMETTE SUBBASIN PLAN
CH 3 ASSESSMENT.DOC 3-563
populations of terrestrial wildlife and rare plants if losses from a host of degrading factors areallowed to continue unimpeded. In the Willamette Basin, as elsewhere, degradation of habitatfor native wildlife and rare plants most often involves the following:
• Roads and other barriers• Vegetation change• Diminished supply of dead wood• Water regime change• Pollution• Temperature change• Soil degradation• Harassment• Invasive species, pathogens, and parasites
Barriers. This includes all structures or terrains that kill or interfere with movement/dispersalof plants and/or wildlife. It includes roads (and vehicles), other paved surfaces, wind turbinetowers, picture windows, and some types of communication towers, powerlines andtransmission poles, fences, and unvegetated or very steep terrain. It includes factors that aredirectly lethal (collisions) as well as those that fragment otherwise suitable habitat and thusexpose traveling animals to greater predation risk (for example, paved surfaces). The threatto wildlife posed by all of these structures has been well documented elsewhere, but therelative severity and extent of threat they individually pose in the Willamette Basin isunknown. Residential and industrial development is the largest source of physical barriers towildlife movement. Roads occur throughout such development, but heavily trafficked roadspose the greatest hazard and are mostly concentrated near urban areas. Roads are probablymost important as a limiting factor to amphibians and reptiles. The extent of future roadconstruction will depend largely on the types of development that are proposed. By 2050, thetotal area of new roads within the subbasin’s developable rural areas is anticipated to increaseby 2376 acres (if development is clustered) or 5072 acres (if not clustered) (Payne, 2002).
Vegetation Change. This consists of changes in vegetative structural and species diversity,and in percent cover of live foliage and woody material. Vegetation change can be inducedby fire, disease, insect damage, wind, ice storms, grazing of saplings, flood events, alterationof natural hydrologic regimes, soil compaction, and intentional removal or planting ofvegetation by humans. Herbaceous (for example, prairie) vegetation is maintained by fire,other natural disturbances, soil health, high water table levels or grazing that limit woodycover establishment, and some types of human activities that reduce shading from trees andshrubs. Absence of contiguous tree canopy, especially at strategic locations, is the mostprominent form of habitat fragmentation that is detrimental to some species, althoughevidence of fragmentation effects is much weaker in western U.S. forests than in easternforests.
Vegetation is directly important for cover, nesting substrate, and support of food resources ofwildlife. By providing shade and buffering wind, vegetation also moderates the microclimatenear the ground that is important to many small mammals. Vegetation shields some speciesfrom the view of aerial predators, decreasing risks of dispersal to other habitat patches.However, there is no such thing as “generally good wildlife cover.” Each species respondsdifferently, with some prairie species avoiding all shaded areas. For such species, areas with

DRAFT WILLAMETTE SUBBASIN PLAN
3-564 CH 3 ASSESSMENT.DOC
tree canopy actually have the potential to fragment their habitat. Thus, habitat connectivitymust be evaluated carefully and with regard to the particular species of interest. The absenceof a woody canopy is of greatest concern in parts of the subbasin where tree canopy coverwas previously the most extensive, such as along rivers and streams and in the mountains.The least amount of residual tree canopy remains in the lowlands, yet for centuries much ofthis area existed as open prairie, which allowed wildlife and plants adapted to open areas tocolonize. Vegetation succession poses the greatest threat to wildlife and rare plants of uplandprairies, oak woodlands, and wetland prairies (possibly in that order of priority). Additionalinformation on this limiting factor is presented in Appendix D.
Diminished Supply of Dead Wood. Wildlife species are often limited by the supply andlack of diversity of standing (snag) or downed dead wood of various sizes. A fewwoodpecker species excavate cavities in snags, which are then used as nesting, roosting,and/or hibernation sites by dozens of other species. The presence of dense soil leaf litter (dufflayer) also is important to some species, such as hibernating turtles. Soil organic matter alsohelps maintain soil invertebrate communities and biogeochemical processes crucial tosustaining productive habitat for rare plants and wildlife. A supply of dead wood is sustainedby forest management than favors multi-aged stands at multiple spatial scales. Snagavailability can increase as a result of disease, fire, flood events, wind or ice storms, waterlevel changes, and climate change. A scarcity of dead wood is most limiting to wildlifewhere forest has been converted, at multiple scales, to other land cover types or to a nearlysingle-aged stand. Dead wood scarcities also arise where river regulation has largelyeliminated sporadic tree mortality through flooding and channel migration. During much ofthe fall, winter, and spring, there is hardly a rural neighborhood in the region where the sightof burning “yard waste” is absent. Often this “waste” consists of downed limbs and otherdead wood highly valued by wildlife and crucial to healthy forest soils. Dead wood isremoved to reduce hazards to buildings from wildland fires, as well as for firewood and aspart of general fuel reduction programs, forestry operations, and homeowner landscaping.
Water Regime Change. Even with implementation of aggressive water conservationprograms, major water shortages are anticipated in the Willamette Basin before the year 2050(Baker et al., 2004; Dole and Niemi, 2004). Drought and flood, low and high water, can bothhelp and hurt wildlife and rare plant populations. And it is not only the severity of extremeevents, but the frequency, duration, and variability of water on the landscape that imposesconsequences. Increased water provides habitat space and feeding opportunities foramphibians and waterbirds while decreasing these elements for some other species. Surfacewater is essential as a drinking source for many wildlife species. Water levels alter plantcover and successional processes and the availability and type of soil invertebrates.Precipitation and runoff regimes can be altered by global climate change, pavement, landconversion, and water control infrastructure (dams, ditches, and tile drains). When waterregimes consequently depart far outside the range to which plants and wildlife species areadapted, populations suffer. Altered water regimes are perhaps most limiting to wildlife andrare plants where naturally hydric soils have been paved, drained, or otherwise altered, andwhere dams have inundated areas that historically were not wetlands or lakes. Constructionof dams on the upper Willamette permanently removed habitat for many forest species butcreated habitat for some waterbirds. Agricultural operations also have a potentially greateffect on water availability and thus wildlife habitat. Crops differ with regard to their need

DRAFT WILLAMETTE SUBBASIN PLAN
CH 3 ASSESSMENT.DOC 3-565
for irrigation, and thus have potentially different offsite impacts, both on low flows instreams and on water table levels in adjoining wetlands. Row crops and landscape nurseriestend to have higher water demands than land used for grass seed, hay, Christmas trees, hops,orchards, vineyards, or pasture.
Pollution. In extreme concentrations many substances, both natural and manufactured, canadversely affect wildlife and plants. These include but are not limited to some synthetichydrocarbons, heavy metals, and radiation. Some originate from local sources, while othersare carried long distances (even from Asia) in aerosols or attached to airborne dust. Localsources include agricultural, mining, road maintenance, and forestry activities, as well asindustrial effluent and stormwater runoff. Natural sources of toxic substances are sometimeslocally common in the Willamette Basin and can be mobilized or immobilized by some typesof land conversion or alteration (for example, mercury from abandoned mines near DorenaReservoir) as well as by extreme weather events. Toxic effects on wildlife are observeddirectly only rarely, but sublethal effects (such as reduced fertility, increased vulnerability topredation, reduced disease-resistance, and increased metabolic demands as a result of havingto search farther and longer for invertebrate foods) could be widespread and devastating topopulations, while going largely unnoticed (Sparling et al., 2000).
Some pesticides used commonly in the Willamette Basin persist for months or longer afterapplication (Field et al., 2003), and the Willamette Basin is a major contributor to problemswith these substances in the Columbia River (McCarthy and Gale, 2001). There aresignificant differences among crop types in the amount, frequency, timing, persistence, andtoxicity of pesticides (primarily herbicides and fungicides) used, and thus their relative risksto specific native plants and wildlife. Considerable data are available concerning pollution ofsurface and groundwater in the Willamette Basin, and much progress has been made inreducing the most toxic substances in the valley’s rivers and lakes. Nevertheless, very fewmeasurements have been made of exposure levels of most terrestrial wildlife species to thesecontaminants, such as indicted by contaminant levels in eggs and tissues. Moreover,sublethal effects on native wildlife of the majority of contaminants are unknown, and thenumber of new and virtually untested compounds in the environment is growing daily, in theform of pharmaceuticals, nanotechnology “buckyballs,” and growth hormones.
Exposure of wildlife to pollutants is presumably greater near urban and industrial areas, butthere are many exceptions. High Cascade lakes, for example, are exposed to elevated levelsof ultraviolet radiation, as a result of the thinning of the earth’s protective ozone layer, andsome evidence suggests that several frog species may be adversely affected by this radiation(Blaustein et al., 1994b and1998). Also of concern are nitrate fertilizers from suburbanlawns, golf courses, and crop fields. These fertilizers are known to contaminate groundwaterin parts of the subbasin and have been shown to be toxic to larvae of some Willamette frogspecies at routine exposure levels (Hatch et al., 2001; Marco et al., 2001), and even at levelsconsidered safe for human drinking. Thus, nonpoint source control programs are as essentialto wildlife as to fish.
Warming temperatures are potentially an outcome of globally changing climate, and partly aresult of regional and local changes in land cover, such as the “heat sink” effect of urbanenvironments. At a finer scale, the magnitude, seasonality, and variability of temperaturescan change as a result of removing the forest canopy and altering the distribution of water on
DRAFT WILLAMETTE SUBBASIN PLAN
3-566 CH 3 ASSESSMENT.DOC
the landscape. Changes in air and water temperatures can have subtle but profound effects onwildlife. Warming temperatures can eliminate perennial snow packs in the Cascades, thusreducing or eliminating late-summer streamflow and depriving wildlife and vegetation ofcritical moisture. Diminished soil moisture and drought-killed trees then increase the risk offurther habitat loss from wildfire. In contrast, reservoir regulation has brought generallycooler temperatures to some waterways downriver of reservoirs. Some evidence indicatesthat the composition and distribution of the Willamette Basin’s fauna might be shifting in amanner that suggests that progressive warming is occurring, but definitive proof is so farlacking.
Soil Degradation. Soil degradation consists mainly of soil compaction (that is, a reductionin space between soil particles), which is most often the result of the herding of livestock in aconfined area or off-road vehicles employed for farming, forestry, or recreation. Compactionis of particular concern with respect to rare plants and burrowing mammals. Burrows areeasily crushed and, although they are readily recreated, chronic travel over the same area maycompact the soil to a point where it becomes unsuitable for burrowing. Soil compaction andassociated traffic also kill vegetation directly and may limit the ability of natural seed banksto germinate and/or survive until they can develop sufficient root systems. By reducing thepore space in soils, compaction can reduce habitat space for soil invertebrate communitiesand sensitive plants upon which wildlife populations depend. Wet, clayey soils that typifymuch of the Willamette Valley are the most vulnerable to compaction, especially when theylack organic material. Compaction usually is a localized problem, concentrated mainly indeveloped areas, heavily grazed areas, and plowed lands.
Harassment. Harassment of wildlife includes the detrimental exposure of wildlife to thepresence of humans, to loud noise and scents of humans, or to those of pets closelyassociated with humans, at greater-than-normal frequencies. Harassment need not beintentional. It also includes legal and illegal harvest of wildlife and is commonly associatedwith recreation and other outdoor activities. The simple presence of humans has been welldocumented to potentially increase physiological stress in wild mammals and birds. In someinstances this results in increased metabolic demands and can cause some species to have tosearch longer for food, thus exposing them to greater risk from predators and adverseweather. Nests temporarily unattended by a parent that is moving away from approachinghumans may be quickly predated or parasitized.
The point at which human presence becomes harassment is uncertain. Thresholds forinducing harassment (that is, the frequency, intensity, duration, distance, and type of humanpresence) are not well defined and depend partly on the species. Some species appear toadapt well to human presence while others do so slowly or not at all. At one extreme, a singleintrusion into a cave harboring colonial bats during a critical period may cause the bats tocompletely abandon the site. At the other extreme, chipmunks at campgrounds often becomeso accustomed to humans that they feed directly out of the human hand. Most large birds andmammals flee when humans on foot approach within a few hundred feet, while smaller birdsand mammals seem unaffected until humans are within a few feet.
Harassment depends not only on the species, but on timing. Many species are especiallysensitive during the nesting season (mostly late spring and summer) and when they areroosting or congregating. Waterfowl are sensitive during their annual plumage molt. The

DRAFT WILLAMETTE SUBBASIN PLAN
CH 3 ASSESSMENT.DOC 3-567
willingness of an animal to leave a habitat patch completely may depend partly on theavailability of refuges of suitable habitat nearby. The severity of harassment is generallyproportional to the local population density of humans. Although extensive trail networks areimportant to fostering public understanding of wildlife, the routing of trails near sensitivefeatures such as heron rookeries, bat caves, and turtle basking sites has the potential toexacerbate harassment of wildlife.
Invasive Species, Pathogens, and Parasites. These are organisms—especially ones notnative to the Willamette subbasin—that do the following
• Spread rapidly
• Are unusually efficient competitors with or predators of native species
• Drastically modify habitat structure in ways that reduce native species diversity andabundance.
• Some combination of the above
Invasive plant species are one of the most widespread and serious threats to native plantpopulations in all of the focal habitat types, except perhaps old-growth conifer forest.Invasive species increase competition or predation on native species not adapted tocoexisting with the invader, thus reducing population viability. Nonnative species tend to beless frequent and/or less invasive where natural drainage, thermal, fire, and nutrient regimeshave not been widely altered, where native predators have not been decimated, and whereaccess by humans and other dispersal agents is minimal.
Invasive species are most detrimental to wildlife when they physically alter habitat structurein a manner that eliminates or severely reduces particular habitat types. Unfortunately theeffects of invasive plants on wildlife have seldom been studied, but anecdotal observationsby local naturalists and scientists suggest both positive and negative effects. Probably themost prevalent invasive plants in the Willamette Basin are Himalayan blackberry, Scotchbroom, reed canary grass, and English ivy. Some relatively recent additions of significantconcern are Japanese knotweed and false-brome. Some of the better-known invasive wildlifespecies are nutria, European starling, and bullfrog.
Diseases and parasites also are a major factor limiting plants and wildlife. For example,deformities noted among native frogs in the Willamette subbasin have been linkedcircumstantially to parasites known as flukes. Although flukes have always parasitized frogsand caused a limited incidence of deformities, evidence is mounting that some additionalfactor—perhaps nitrate pollution—has indirectly caused an expansion of fluke populationsand thus has possibly increased the incidence of frog deformities. The extent of deformitiesin Willamette frogs is unknown. Pathogenic fungi also may be affecting amphibians(Blaustein et al., 1994a). In addition, two diseases—sudden oak death, which largely affectsoaks, and West Nile virus, which affects birds and people—are poised to invade theWillamette Basin. When they do, the damage to vegetation and wildlife could becatastrophic, judging from what has happened elsewhere in the United States.
DRAFT WILLAMETTE SUBBASIN PLAN
3-568 CH 3 ASSESSMENT.DOC
3.5.2.3 Limiting Factors Outside the SubbasinIn general, most mammals, amphibians, reptiles, and rare plant species are not strongly anddirectly affected by factors outside the Willamette Basin. This is because, with the exceptionof a few large predators and scavengers, the seasonal and annual movements of mammals,amphibians, reptiles, and rare plants are constrained to areas entirely within the basin. Thus,external factors most likely to affect these groups are ones that occur over broad regions,such as global warming, the spread of invasive species, and long-distance movement ofairborne contaminants and food sources (such as fish). In contrast, many bird species migrateor forage beyond the Willamette Basin and thus can be limited more strongly by factorselsewhere. However, sound information is lacking with regard to which species are beinglimited by which particular external factors, and whether factors beyond the WillametteBasin are more limiting than those within.
3.6 Synthesis and InterpretationThe Willamette Basin is a big and complex place. It is home for than 70 percent of Oregon'spopulation and encompasses 12 percent of the total area of Oregon, including 11,500 squaremiles, 10 counties, 100 cities, 26 watershed councils, and 272 native fish and wildlifespecies. There was a lot of ground to cover in this subbasin plan. The landscape of theWillamette Basin has changed considerably in the last 100 years. Native habitats have beenmodified or converted to other land uses. Citizens have made use of the productive soils andmild climate of the Willamette Basin for a variety of agriculture and forest product, makingthe basin an important component of Oregon’s economy. Modifications to the WillametteRiver system have enabled cities and towns throughout the basin to develop, grow, and thrivein close proximity to the 13th largest river in the U.S., with relative security and insulationfrom the effects of seasonal flooding that once changed the landscape regularly. More than 2million people live within 20 miles of the banks of the Willamette River.
With the positives have come some negatives. About one-third of the species in the basin arelisted as threatened, endangered, or species of concern by state and federal fish and wildlifemanagement agencies.
Much of the native habitat on which these species depend to complete important life historystages in the Willamette are no longer available, no longer accessible, or heavily degraded.With changes to the landscape have also come significant changes to the natural processesthat form and maintain habitats. Construction of 13 major flood control dams, large-scaleremoval of snags for navigation, channelization and revetments, and the drainage of wetlandsto increase the land available for agriculture have reduced the channel length and complexityof the Willamette River (PNERC, 2002; Sedell and Froggatt, 1984; Benner and Sedell,1997). Flooding of the river valley was common in the winter and spring prior to theconstruction of the dams (1941-1969). On average, 14 floods above bankfull occurred eachdecade from about 1884 through 1969 (Corps of Engineers, 1970). What was considered a10-year flood event prior to construction of the dams is now considered a 100-year floodevent (Benner and Sedell, 1997). Channelization of rivers and streams and flow managementby dams restricts or eliminates interactions between the river and its floodplain (Gabriel,1993). These interactions are essential to the formation and maintenance of key habitats on

DRAFT WILLAMETTE SUBBASIN PLAN
CH 3 ASSESSMENT.DOC 3-569
which fish and wildlife depend (Bayley, 1991; Osmundson and Burnham, 1998; Modde etal., 2001, Scheerer, personal communication, 2004).
The abundance, diversity, and distribution of many native fish and wildlife species in theWillamette Basin are diminished from historical estimates. While cycles of abundance haveoccurred, particularly among anadromous salmonids, overall trends for focal species in thisassessment are declining. The declining trends of focal species correspond with reducedaccess, quantity, and quality of native habitats and ecosystem functions (PNERC, 2002;USACE, 2002; Altman, 1997).
The data and tools to directly link biological performance of focal species in the WillametteBasin with specific habitat modifications are inadequately developed. Analysis of existingdata, however, shows consistency in the sequence of observed declines in biologicalperformance and the loss and degradation of habitats and habitat-forming processes. Basedon the current state of knowledge about species and habitat relationships, the biologicalperformance of focal species currently being observed and reported by fish and wildlifebiologists is consistent with what would be expected (see Section 3.2.2). Review and analysisof species status and habitat conditions and current understandings of the relationshipsbetween biological performance and the key habitats and habitat diversity on which speciesdepend affirm that the Willamette Basin presents significant challenges. As importantly, thebasin also presents significant opportunities for habitat conservation and restorationefficiency.
Our assessment and analysis of existing conditions and data show that no one factor issingularly responsible for the decline in natural abundance, productivity, and diversity of fishand wildlife in the Willamette Basin. Rather, a combination of consequences derived fromlandscape-level conversion of native habitats to other uses and development of infrastructureto control and store water have disrupted ecosystem processes, functions, and dynamics.These changes have:
• Reduced the quantity of accessible habitat• Reduced physical connectivity between habitats and habitat-forming processes• Degraded the quality of the habitat that remains• Decreased the functional ability of the ecosystem to form and maintain habitats
Together, these changes have had effects on the life stages of aquatic and terrestrial speciesthat occur within the basin. It is important to keep in mind that a significant portion of the lifehistories of anadromous fish occur outside of the Willamette Basin. Much more needs to beknown about these out-of-subbasin effects to associate habitat with total species abundance.
3.6.1 Subbasin-Wide Working Hypotheses
3.6.1.1 Aquatic HypothesisWorking Hypothesis #1: Restoration of natural processes functions and dynamics in theWillamette Basin will improve the quantity, quality, and diversity of key habitats essentialfor the full range of life stages that occur within the basin.
Evidence. The natural processes, functions, and dynamics on which aquatic species in theWillamette Basin depend to form and maintain key habitats have been disrupted (PNERC,

DRAFT WILLAMETTE SUBBASIN PLAN
3-570 CH 3 ASSESSMENT.DOC
2002; Sedell and Froggatt, 1984; Benner and Sedell, 1997; Bayley, 1991; Osmundson andBurnham, 1998; Modde et al., 2001; 2004; Altman, 1997). Modifications that disrupt thesenatural processes have also had significant effects on water temperature patterns andextremes and eliminated access to historical habitat (USACE, 2000). Reductions in thefunctional capacity of ecosystems have negatively affected the abundance, diversity, andquality of essential habitats for key life history stages of all aquatic focal species (Chapter 3).
While the specific causes, severity, and acuteness of habitat quantity, quality, and diversity ofaquatic habitat degradation vary by geographic location, the linked attributes of key habitatand habitat diversity emerged as high priorities for restoration in every subbasin of theWillamette (see Table 3-195). Each salmonid life stage occupies and depends on differentkey habitats with distinct features (Hawkins and others, 1993). Oregon chub rely on many ofthe same lowland off-channel key habitat structural conditions important for salmonids (U.S.Fish and Wildlife Service, 1998). Key habitat refers to the quantity of the distinct habitattypes needed for each life stage. Habitat diversity refers to the diversity of these key habitats.The quantity of the diverse key habitats needed to complete each life stage determines thecapacity of a river system. A simple example: fish spawn and eggs incubate on gravel,juveniles rear and take refuge in riffles, shallow pools, and ponds, and adults hold in deeppools in larger reaches. To be successful, salmonids in particular need a string of suitable,connected habitats of adequate quality and quantity at times appropriate to each life stage(Independent Scientific Group, 2000).
Key habitats are formed and maintained by the dispersal of large wood and sediments andother structural components resulting from the natural interaction between flow and thestructural components of a river channel and interactions between a river and its floodplain(Beechie and Sibley, 1997; Naiman and others, 1992, Washington Forest Practices Board,1995). Large wood is a primary structural component influencing the formation of keyhabitat types and habitat diversity in the Willamette. The availability and recruitment of largewood has been reduced in every subbasin in the Willamette. Channel stability is the attributein this analysis that captures large wood availability and it ranks as medium to high as arestoration priority in every subbasin (Table 3-195). Wood in the stream channel capturesgravel, contributes to constant changes and sinuosity of river channels, provides cover forjuvenile and adult fish, and enhances the productivity of aquatic insect populations (Bilbyand Ward, 1998).
Reductions in large wood in rivers and streams throughout the Willamette Basin is a majorcontributor to reduced key habitats and habitat diversity (see Section 3.5.1). The extent andvegetative composition of riparian forests in the Willamette is reduced from historical levels(PNERC, 2002). Changes in riparian extent and composition have reduced the quantity andquality of wood available. Larger (older), coniferous trees provide longer-lasting benefits tostream habitat compared to younger, deciduous trees (Bilby and Ward, 1998). The reductionin riparian extent and subsequent availability of wood to rivers and streams in the WillametteBasin is exacerbated by:
• Decreased recruitment potential caused by reduced connectivity between rivers andstreams and their floodplains as a result of flow regime changes and bank hardening andchannelization activities

DRAFT WILLAMETTE SUBBASIN PLAN
CH 3 ASSESSMENT.DOC 3-571
Table 3-195: Management Unit Attributes
LOWER WATERSHED ATTRIBUTES AND RATINGS FOR NON-EDT TREATED AREAS
ChannelStability Chemicals
Competitionwith Hatchery
Fish
Competitionwith Introduced
Species Flow FoodHabitat
Diversity Harassment Obstructions Oxygen PathogensSediment
Load Temperature WithdrawalsKey
Habitats
Calapooia Medium Low Medium Medium High Medium High High High Low Medium Low High Medium High
Coast Fork Medium Low Medium Medium High Medium High Medium High Medium Medium Low High Low High
Long Tom Medium Medium Low Medium High Low High Low High Medium Low Low High Medium High
Luckiamute/Rickreall High Low Low Medium High Low High Low High Low Low Low High Medium High
Marys Medium Medium Low Medium High Low High Low High Low Low Low High Medium High
McKenzie High Low Medium Medium High Medium High Medium High Low Low Low High Medium High
Middle Fork Medium Low Medium Medium High Medium High Medium High Low Medium Low High Medium High
Molalla/ Pudding High Medium Medium Medium High Medium High Medium High Low Low Medium High Medium High
N. Santiam Medium Low High Medium High Medium High Medium High Low Medium Low High Medium High
S. Santiam Medium Low High Medium High Medium High Medium High Low Medium Low Medium High High
Tualatin High Medium Low Medium High Low High Low High Low Low Low High Medium High
Yamhill High Medium Low Medium High Low High Low High Low Low Low High Medium High
Willamette Mainstem High Medium High Medium High Medium High Low Low Medium Medium Low Medium Medium High
Salem Area Tributaries High High Medium Medium High Low High Low High High Medium Medium High High High
UPPER WATERSHED ATTRIBUTES AND RATINGS FOR NON-EDT TREATED AREAS
ChannelStability Chemicals
Competitionwith Hatchery
Fish
Competitionwith Introduced
Species Flow FoodHabitat
Diversity Harassment Obstructions Oxygen PathogensSediment
Load Temperature WithdrawalsKey
Habitats
Calapooia Medium Low Medium Low Low Medium High High Medium Low Medium Low Medium Low High
Coast Fork Medium Low Medium Low Low Medium High Low Medium Low Medium Low Medium Low High
Long Tom Medium Medium Low Medium Medium Low High Low High Medium Low Low High Medium High
Luckiamute/Rickreall Medium Low Low Low Low Low High Low Medium Low Low Low High Medium High
Marys Medium Low Low Low Low Low High Low High Low Low Low High Medium High
Middle Fork Medium Low Medium Low Low Medium High Low Medium Low Medium Low Medium Low High
Molalla/ Pudding Medium Low Medium Low Low Medium High Medium High Low Low Low Medium Low High
N. Santiam Medium Low Medium Low Low Medium High Low Medium Low Medium Low Medium Low High
S. Santiam Medium Low Medium Low Low Medium High Low Medium Low Medium Low Medium Low High
Tualatin Medium Low Low Low Low Medium High Low High Low Low Low Medium Low High
Yamhill Medium Low Low Low Low Low High Low High Low Low Low High Medium High
Willamette Mainstem High Low High Medium High Medium High Low Low Medium Medium Low Medium Medium High

DRAFT WILLAMETTE SUBBASIN PLAN
3-572 CH 3 ASSESSMENT.DOC

DRAFT WILLAMETTE SUBBASIN PLAN
CH 3 ASSESSMENT.DOC 3-573
• Reduced downstream movement of wood caused by dams and other structures
• Removal of wood for navigation
Key habitats and habitat diversity are integrally linked to water regimes, channel form andstructure, and habitat connectivity. Implementation of restoration actions must be informedby an understanding of natural hierarchies and processes. To be successful over time,restoration efforts should seek to improve the processes that form and maintain key habitatsand habitat diversity (see Section 3.2.2). Restoration efforts should be logically sequencedand consider the systemic, interdependent nature of naturally functioning systems.
3.6.1.2 Aquatic and Terrestrial Hypotheses That OverlapWorking Hypothesis #2: Restoration of normative water regimes will improve the ability ofthe natural system to form and maintain quantity, quality, and diversity of key habitatcomponents.
Evidence. The “water regime” of a stream, lake, pond, or wetland describes the magnitude,frequency, duration, and seasonal pattern of inundation or drought, as well as the rate atwhich water flows through it. Restoration of normative water regimes, particularly flowvolumes, ranks as a high priority in the lowlands of every subbasin in the Willamette(Table 3-195). Stanford and others (1996) emphasize the primary importance of flow in thehealth of large rivers and regard it as one of the most pervasive effects on large rivers acrossthe globe. Poff and others (1997) consider flow a “master variable” that regulates theecological integrity of river ecosystems.
Water regime dynamics affect nearly every aspect of ecosystem functioning, includinghabitat formation and maintenance, the flow of energy and materials, temperature, the fateand transport of contaminants, and the composition of biological communities (Ziemer andLisle, 2001). Both aquatic and terrestrial species have evolved to maximize their fitnessunder normative water regimes. When water regimes consequently depart far outside therange to which fish, plants, and wildlife species are adapted, populations suffer.(Precipitation and runoff regimes can be altered by global climate change, pavement, landconversion, and water control infrastructure such as dams, ditches, and tile drains.)
Water regimes potentially limit wildlife species by influencing aquatic foods, floodplainvegetation, and access to aquatic or terrestrial habitats and foods. Increased water provideshabitat space and feeding opportunities for fish, amphibians, and waterbirds while decreasingthese elements for some terrestrial species. Surface water is essential as a drinking source formany wildlife species. Water levels alter plant cover and successional processes, andavailability and type of soil invertebrates. For example, riparian cottonwood habitat isimportant to many wildlife species in the Willamette Subbasin, and the germination andsurvival of seedling cottonwoods is intimately tied to water regimes (timing, drawdown rate,depth), both directly and at least hypothetically, in association with the effects of waterregime on vegetation (such as Himalayan blackberry) that can exclude young cottonwoodsthrough shading.
Increasing flows and water levels, by altering physical access, have the potential to introducepredatory fish into otherwise-isolated floodplain pools and cut-off channels, with sometimesdetrimental effects on native amphibians (see Section 3.4 for further discussion). Increased
DRAFT WILLAMETTE SUBBASIN PLAN
3-574 CH 3 ASSESSMENT.DOC
flows and water levels also can isolate terrestrial habitat patches that were accessible towildlife (and predators) when water levels were lower, with consequent benefits for somespecies and adverse effects for others (Hallock & Hallock, 1993; Jobin & Picman, 1997).
At least 74 native wildlife species feed on fish, either directly or indirectly (Table 3-103 inSection 3.4). Thus, they are potentially affected whenever fish are affected by changes inwater regimes. An additional 31 native wildlife species that breed in the Willamette Subbasinand are not fish-associated are potentially influenced by water regimes because they usewater or aquatic plants as their primary substrate (e.g., dabbling ducks). Yet another 55breeding wildlife species find habitat in riparian areas to be generally more suitable thanhabitat in uplands (Adamus, 2001b), perhaps as a result of greater opportunities to forage onemerging aquatic insects or to generally greater habitat structural diversity. Including anadditional 24 native riparian- or water-associated species that occur regularly in the subbasinonly during winter or migration (and were not counted previously as fish-feeders), a total of184 wildlife species are vulnerable to the effects of altered water regimes and degradation ofriparian areas in the Willamette Subbasin. Restoration of normative water regimes could thusbenefit at least 57 percent of the subbasin’s wildlife.
Natural Factors Influencing Water Regimes. Water regimes in streams, lakes, andwetlands are the direct result of the balance between water inputs and outputs. Climate,geology, and topography affect the delivery of this water to the habitat. Precipitationdetermines the amount of water (inches per year) delivered to a watershed. Temperature,along with precipitation patterns and geology, determines the schedule of delivery of thiswater to the stream within a year and the resulting flow characteristics. Long-termprecipitation and climate patterns establish water regimes among years. In snow-meltsystems, precipitation may peak with snowfall in winter but delivery of that water to thestream is delayed until warmer weather in spring. In rainfall-dominated systems, waterregimes in streams and other water bodies closely follow precipitation patterns. Geologyaffects delivery of water through soil characteristics, topography, and subsurface waterstorage (Ziemer and Lisle, 2001). These natural factors are important to water regimes in theWillamette Basin. In snow-melt systems such as the Middle Fork, McKenzie, North andSouth Santiam, and Clackamas, precipitation may peak with snowfall in winter but deliveryof that water to the stream is delayed until warmer weather in spring. Inrainfall-dominated systems like Coast Range tributaries and lower elevation Cascadetributaries, water regimes closely follow precipitation patterns. Subsurface storage of waterin aquifers or near-surface soils is the primary contributor to summer water availability inmany water bodies and determines the annual low flow. The amount of storage is a functionof precipitation and geological characteristics of the watershed (Grant, 1997). In spring-fedwater bodies such as many of those at higher elevation in the Cascades, this delivery ofgroundwater is extreme and water regimes of streams and wetlands can significantly differfrom precipitation patterns (Grant, 1997). Cascade tributaries have more subsurface storagecapacity than Coast Range tributaries (PNERC, 2002).
Table 3-196 illustrates flow regimes for some of the major tributaries in the WillametteBasin. The difference between the ratio of discharge from the highest month to the lowestmonth illustrate the effect subsurface storage can have on summer base flow.
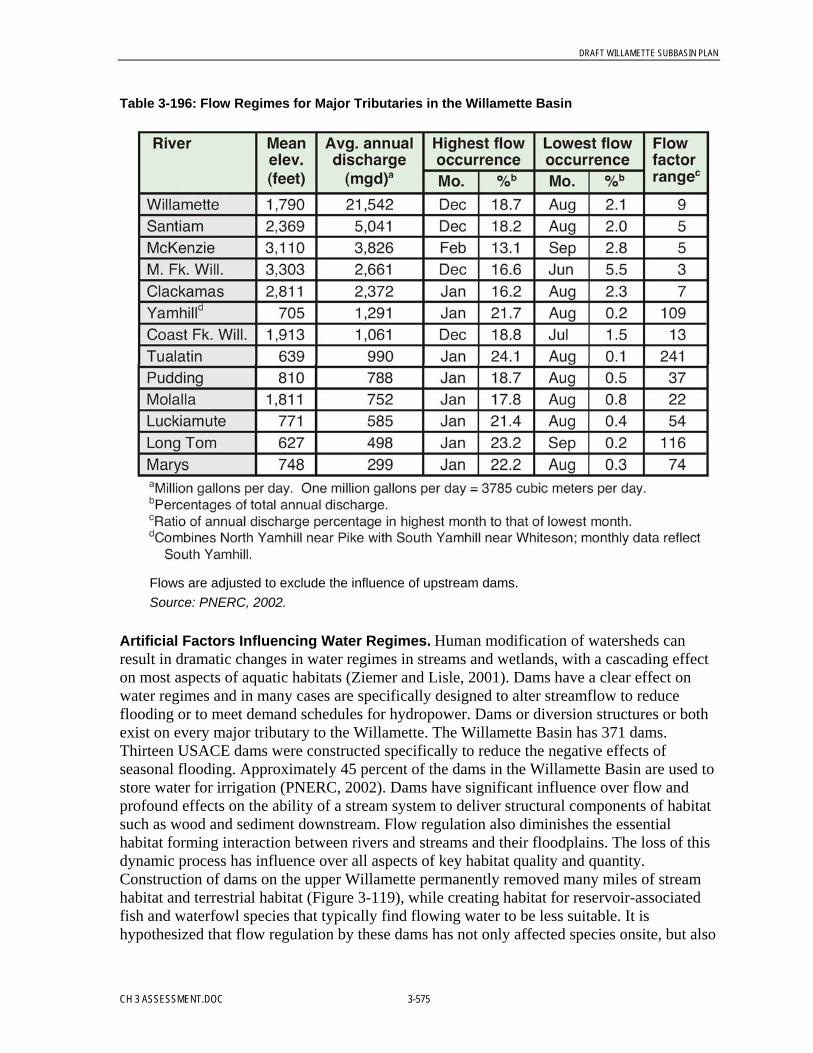
DRAFT WILLAMETTE SUBBASIN PLAN
CH 3 ASSESSMENT.DOC 3-575
Table 3-196: Flow Regimes for Major Tributaries in the Willamette Basin
Flows are adjusted to exclude the influence of upstream dams.Source: PNERC, 2002.
Artificial Factors Influencing Water Regimes. Human modification of watersheds canresult in dramatic changes in water regimes in streams and wetlands, with a cascading effecton most aspects of aquatic habitats (Ziemer and Lisle, 2001). Dams have a clear effect onwater regimes and in many cases are specifically designed to alter streamflow to reduceflooding or to meet demand schedules for hydropower. Dams or diversion structures or bothexist on every major tributary to the Willamette. The Willamette Basin has 371 dams.Thirteen USACE dams were constructed specifically to reduce the negative effects ofseasonal flooding. Approximately 45 percent of the dams in the Willamette Basin are used tostore water for irrigation (PNERC, 2002). Dams have significant influence over flow andprofound effects on the ability of a stream system to deliver structural components of habitatsuch as wood and sediment downstream. Flow regulation also diminishes the essentialhabitat forming interaction between rivers and streams and their floodplains. The loss of thisdynamic process has influence over all aspects of key habitat quality and quantity.Construction of dams on the upper Willamette permanently removed many miles of streamhabitat and terrestrial habitat (Figure 3-119), while creating habitat for reservoir-associatedfish and waterfowl species that typically find flowing water to be less suitable. It ishypothesized that flow regulation by these dams has not only affected species onsite, but also

DRAFT WILLAMETTE SUBBASIN PLAN
3-576 CH 3 ASSESSMENT.DOC
floodplain and in-channel habitat and species many miles downriver. Such changes arehypothesized to be the result of diminished base flows, higher or longer-duration low flows,altered seasonality of flow, cooler mean temperatures, and possibly other watercharacteristics.
Figure 3-119: Spring Chinook Salmon Habitat Blocked By Major Willamette DamsSource: Cramer et al., 1996.
The most obvious factor resulting in loss of water to streams is the withdrawal of streamflowfor irrigation or human consumption. Water withdrawals are an important factor affectingkey habitat quantity and quality. Low levels of rainfall during the summer months in theWillamette Basin result in naturally low streamflows and higher demand for scarce water forirrigation and human and industrial consumption. In 1995, 77 percent of the total
DRAFT WILLAMETTE SUBBASIN PLAN
CH 3 ASSESSMENT.DOC 3-577
withdrawals in the Willamette Basin were derived from surface flow and 23 percent fromgroundwater. Approximately 49 percent of the water withdrawals are for irrigation;15 percent for domestic use; 13 percent for industrial use; and 19.5 percent for commercialuse (Hulse et al., 2002).
Less obvious than dams and withdrawals is the effect of land use practices on water regimes.This is often because of increases in overland flow and channel modifications which lead toreductions in subsurface storage (Ziemer and Lisle, 2001). In small urban watersheds, a fewresearchers have documented a negative association of stream ecological condition with theincreasing amount of watershed imperviousness, an association that is partly the result of theeffect of impervious surfaces on watershed hydrology, specifically changes to overland flowand baseflow (Booth, 1991; Schueler, 1994; May and others, 1997). The end result is anincrease in “flashiness,” where streamflow responds quickly to rainfall and then quicklydrops back as the precipitation is transferred downstream. Downcutting of stream channelsowing to grazing or other practices also can disconnect stream channels from subsurfacestorage, leading to reductions in summer flow (Hicks and others, 1991).
Agricultural operations also have a potentially significant effect on water availability andthus fish and wildlife habitat. Both agricultural and urban development can affect the waterregime in remaining wetlands and streams through installation of ditches and subsurfacedrainage tile intended to make managed lands more productive or buildable.
Where Do Altered Water Regimes Limit Salmonid Fish and Wildlife? The effects oflandscape level modification on natural water régimes in the Willamette are cumulative andmost acute in the lowlands. Acute, local flow problems occur with irrigation or otherwithdrawals. Altered water regimes are hypothesized to be most limiting to wildlife and rareplants where naturally hydric soils have been paved, drained, or otherwise altered, and wheredams have inundated areas that historically were not wetlands or lakes.
Working Hypothesis #3: Reduced channel confinement in the lowland areas of theWillamette Basin will improve interactions between rivers and streams and their floodplains,enabling natural processes, functions, and dynamics responsible for the formation andmaintenance of channel complexity and habitat diversity to occur.
Evidence. Channel form describes the physical form of the channel and the connectionbetween the stream and its floodplain and valley. As such, it is one component of overallchannel complexity. Channel form develops as a response to the dissipation of hydraulicenergy of a stream and the underlying geology (Leopold and others, 1964). This energydissipation affects the sinuosity of the channel, development of multiple channels and off-channel areas, as well as bed load mobility. As energy dissipates, the dynamic, naturally-occurring shift in location of meandering channels temporarily removes vegetation and resetsvegetative succession. All of these factors help drive the development of a range of habitattypes, diversity of energy regimes (fast water vs. slow water), food levels for fish andwildlife (productivity of aquatic insect communities) and, for salmonid fishes, spawningsuccess as affected by bed movement and scour (Montgomery and others, 1996). Unlessnaturally constrained by valley form (canyon reaches, for example), natural stream channelstypically grade into terrestrial areas through secondary channels, oxbows, and wetlands thathave permanent or season connections to the main stream channel (Montgomery and

DRAFT WILLAMETTE SUBBASIN PLAN
3-578 CH 3 ASSESSMENT.DOC
Buffington, 1998). These wetlands and oxbows provide diverse habitat for many species,including waterfowl and amphibians (Galat et al., 1998).
Other components of channel form complexity that are important to wildlife include erodingbanks and gravel bars. In the Willamette Subbasin, the vertical, eroding banks that occuralong short reaches of larger-order channels are required or preferred by belted kingfisher,northern rough-winged swallow, and several mammals which create burrows. Gravel bars areused for roosting and feeding by shorebirds and waterfowl, and for nesting by killdeer and (atleast formerly) by common nighthawk. Gravel bars might provide relative isolation frommammals that prey on nests. Along some segments of the Willamette River, the area ofunvegetated gravel bars has diminished, possibly as a consequence of vegetative successionrelated to water withdrawals and flow regulation (Gutowsky, 2000).
Natural Processes Contributing to Maintenance of Channel Form. In a natural setting,creation and maintenance of channel form is a dynamic ongoing process of destruction andformation. (Montgomery and Buffington, 1998). Flow quantities and patterns result inseasonal flooding that create and maintains channels, gravel bars, and floodplain wetlands.Flooding recharges aquifers and contributes to subsurface inflow to the stream duringsummer (Stanford and Ward, 1993). Geologic forces create valley form and naturalconfinement, set the susceptibility of stream banks to erosion, and determine the nature of thestream bedload (gravel, sand, and other sediment transported by the stream). Riparianvegetation potentially stabilizes stream banks while downed trees can affect the path andsinuosity of the stream channel (Gregory and others, 1991). Beaver impoundments can alterchannel processes and riparian structure, usually locally and for limited periods of time.Effects on other wildlife are typically positive (Grover and Baldassare, 1995; Perkins, 2000).
Artificial Factors Affecting Channel Form. Human activities and structures limit oreliminate much of the dynamic process that results in channel form (Bolton and Shellberg,2001). The connection between the stream and the floodplain is often severed by dikes toreduce flooding and increase the quantity of useable land. Dams potentially alter the naturalwater regimes needed to maintain channel form, thus degrading wildlife habitat in someinstances (Nilsson and Dynesius, 1994, Johnson et al., 1996). Dikes constructed to protectproperty in floodplains sever the connection between the stream and the floodplain. Dredgingto produce a single deep channel not only reduces habitat diversity within the floodplain, butcan, under some geologic conditions, produce high levels of scour and streambed mobility.Stream water withdrawals and conversion of land to impervious surfaces can alter flows andincrease flashiness, sometimes resulting in increased channel downcutting. Conversely,overloading of channels with sediment runoff as a result of erosion following vegetationremoval in some cases can accelerate channel degradation (raising of elevation of the channelbottom), which also alters channel form. Removal of riparian forests also eliminates largewood that in many instances helps maintain natural variability in channel form. Urbanstreams are often heavily riprapped or even confined within concrete channels, obviouslyaltering channel form.
Where Is Channel Form Typically Limiting? Channel form can be altered by humanfactors across a variety of landscapes. Typically, however, channel form is most altered andlimiting in lowland areas. The floodplain is usually widest in lower reaches of streams. Theseareas are often diked to allow development and agriculture and to limit flooding. In lowlands,
DRAFT WILLAMETTE SUBBASIN PLAN
CH 3 ASSESSMENT.DOC 3-579
many other human activities have reduced the diversity of habitat types available to wildlife.Channel form in upper stream reaches can be altered by road building. Data on whichparticular Willamette locations have suffered the most biological effects from altered channelform are generally not available, except in some instances for salmonid habitat. Mapsshowing approximate channel alignments during different periods are available for some ofthe subbasin’s rivers and can be compared to identify locations where channel location, andmost likely channel form as well, has been altered the most.
Working Hypothesis #4: Improving access to historical habitat will improve the abundance,diversity, and quality of habitat available to aquatic species.
Evidence. Elements of aquatic habitat affect the survival and capacity of different life stages.However, to be successful, these life stages must be connected to form a complete life historyfrom spawning of one generation to spawning of their progeny. Suitable habitat patches mustbe linked across time and space to enable each life stage to survive and move to the nextstage (Independent Scientific Group, 2000). Within EDT, one measure of connectivity is theevaluation of life history trajectories. A successful life history trajectory is the habitatpathway along the stream and across months that results in an overall productivity greaterthan 1.0. Pathways with high quality habitat for one life stage but lacking habitat for anotherwill be unsuccessful and discarded by the model. Similarly, many wildlife species usedifferent habitat types during different life stages or for different functions. For example,early life stages of many amphibians are aquatic while adults are terrestrial. If quality ofeither aquatic or terrestrial habitats is impaired, or if their connectivity is interrupted by roadsor other barriers, populations may decline.
An obvious impediment to connectivity is the presence of natural and artificial obstructionsto the upstream and downstream movement of adult and juvenile life stages of aquaticanimals. Natural obstructions include waterfalls, landslides, extreme low flow conditions,and (rarely) log jams. Beavers construct dams on small tributaries and side channels that mayseasonally block fish passage. Obstructions are not always bad. In some cases, naturalobstructions have enabled species to persist that would be eliminated through competition(Trotter, 1997), as is sometimes the case with Oregon cub and several frogs whose eggs andtadpoles are vulnerable to fish predation. For fish, artificial obstructions include culverts,diversions, and dams. For some wildlife species, obstructions include roads, other impervioussurfaces, very wide channels, or extensive patches of highly unsuitable land cover (e.g.,snowfields, burned cropland). These artificially shrink the size of the subbasin or homeranges of individuals and separate species and populations. The effect of barriers on fish andwildlife movement is often seasonal and variable by life stage. For fish and possibly for someaquatic wildlife species, culverts may be passable at moderate and high flows but “perched”and impassible at low flow. Obstruction may be impassible to upstream movement ofjuveniles but may still be passable to adults moving upstream. Dams and diversions oftenhave screens, ladders, or other provisions for passing adult and juvenile fish with varyingsuccess.
Dams that block or impede fish passage also create reservoirs that inundate terrestrialhabitats. Blockage of anadromous salmonids by dams eliminates an important food sourcefor terrestrial species and halts the delivery of marine nutrients (from consumption of adultcarcasses) to the watershed above the dam. Dams and ponds created by beaver form
DRAFT WILLAMETTE SUBBASIN PLAN
3-580 CH 3 ASSESSMENT.DOC
important summer rearing habitat for juvenile salmonids and also diversify wildlife habitat,with consequent benefits to many species (Grover and Baldassare, 1995; Perkins, 2000).These dams are usually seasonally passable to adult fish to allow spawning above the pondswhile juveniles leave the ponds at high flow.
Artificial Factors Affecting Obstructions. Dams occur on every mainstem tributary to theWillamette River. A total of 371 dams in the Willamette Basin are used for irrigation,municipal water use, and flood control (PNERC, 2002). Major dams in the Willamette Basinblock access to upstream habitat. Culverts installed to allow road crossings at tributaries havealso created numerous fish passage barriers.
Major habitat blockages resulted from Big Cliff Dam (built in 1952) on the North SantiamRiver and from Green Peter Dam (built in 1967) on the South Santiam River. These dams,along with Dexter Dam, Dorena Dam, and Cougar Dam, were identified by NMFS as theupper limit of steelhead distribution for critical habitat designation (64 FR 5750).
Beginning 40 years ago, all Willamette Project dams (except Foster) completely blocked fishmigration, either because no passage facilities were provided, or those provided did not work.Upper Willamette spring Chinook and winter steelhead are no longer found above thesedams.
Fragmentation and isolation of bull trout populations have created a patchwork of remnantpopulations in the Columbia River basin (63 FR 31674). Barriers caused by the WillametteProject dams prevent bull trout from freely migrating between winter refuge areas andsummer foraging areas, and prevent gene flow among the isolated populations.Fragmentation and isolation of fish populations resulting from dam operation have also beenobserved for resident cutthroat trout in the Long Tom River.
Oregon chub have also been affected by dams. Opportunities for migration may be limited toextreme flooding events; however, no data exist on either population structure or potentialdispersal among populations. Dispersal (successful colonization) and genetic exchangeamong populations have likely been reduced substantially post-dams. In terms of daminfluences, the Dexter/Lookout Point, Fall Creek, and Hills Creek projects appear to have thehighest potential to affect Oregon chub populations. The Foster/Green Peter, BigCliff/Detroit reservoirs have a moderate influence (USFWS, 1998a).
Where Are Obstructions Typically Limiting? There are 371 dams in the Willamette Basin.USACE dams and hydroelectric dams on Cascade tributaries and the Coast Fork and LongTom River block access to significant portions of upland habitat. Obstruction is ranked as ahigh restoration priority in the lowlands of the basin. In lower elevation areas, irrigationdiversions impede or block passage (see fish passage barrier maps in Appendix G). On largerrivers, hydroelectric dams are common. While most of these dams have facilities to passjuvenile and adult fish, they continue to impede passage to some degree. Other dams havebeen built on the Columbia and Snake rivers without passage facilities, resulting insignificant reduction in the range of available habitat (Dauble and others, 2003).
Working Hypothesis #5: Temperature ranges and patterns approaching more normativeconditions will improve aquatic habitat quality.
DRAFT WILLAMETTE SUBBASIN PLAN
CH 3 ASSESSMENT.DOC 3-581
Evidence. Water temperature is a major issue for the lowland areas throughout theWillamette, especially rivers and streams regulated by dams (see Section 3.for a discussionof water quality in the Willamette Basin). The water quality in the Willamette Basin isaffected by the effect of both high and low water temperature during important life historystages for salmonids. Temperature is a primary environmental factor affecting the physiologyof all stream organisms (McCullough and others, 2001). Fish and invertebrates are cold-blooded and so their metabolic rates and functions are related to water temperature.Salmonids have a limited temperature range for metabolic functions, and temperaturesoutside this range lead to decreased performance and death. Water temperature also affectsthe growth and development of life stages such as developing eggs (Beer and Anderson,2001). In addition to having a direct physiological effect on salmonids and other aquaticspecies, temperature affects other survival attributes as well, such as rates of predation anddisease virulence. Increases in water temperature generally favor nonnative species to thedetriment of native species, which is a primary factor affecting Oregon chub.
Connection to Terrestrial Habitat. Water temperature has only limited connection withmost terrestrial species, except for species such as amphibians, which have a closeconnection to aquatic environments (Roni, 2002). However, factors contributing to watertemperature such as climate, shading, and riparian conditions affect habitat conditions forfloodplain terrestrial species in addition to aquatic habitats.
Natural Components Affecting Temperature. Water temperature is determined by thermalinput to the stream. High temperature tends to increase downstream as temperature inputsaccumulate. Thermal input is determined by a number of factors, including air temperature,exposure, aspect, shading, and inputs such as springs (Welch and others, 1998). Naturaltemperatures in Willamette streams are not necessarily always ideal for salmonids. Summerwater temperatures may be inherently high as a result of climate and exposure in some areas.Similarly, winter temperatures may be quite low. However, for streams having nativesalmonid species, historical life history strategies, productivities, and abundance reflect theseinherent environmental limitations.
Artificial Components Affecting Temperature. Many human actions in watershedsexacerbate natural temperature extremes and can modify seasonal temperature patterns(Coutant, 1999). Elimination or reduction of riparian forests decrease shade and expose thestream to direct solar warming. Dams increase surface area and decrease turnover of water,resulting in temperature increases. However, reservoirs can become stratified with respect totemperature and can decrease downstream water temperature if output from the dam is takenfrom the cold deep water layer. Land uses that lead to downcutting of stream channels andelimination of wetlands can decrease the inflow of cooler subsurface water that oftenprovides important refuge areas from high summer water temperatures.
Where Is Temperature Typically Limiting for Salmonids? Because temperature is acumulative problem and summer water temperature usually increases downstream,temperature problems in the Willamette are greatest in the lower reaches of watersheds andin the mainstem. However, it is important to emphasize that the sources of downstreamtemperature problems are usually upstream.

DRAFT WILLAMETTE SUBBASIN PLAN
3-582 CH 3 ASSESSMENT.DOC
3.6.1.3 Terrestrial HypothesesWorking Hypothesis #6: Conservation or restoration of the six focal habitat types — uplandprairie-savanna, oak woodlands, wetland prairie and seasonal marsh, ponds and their riparianzones, streams/rivers and their riparian zones, and old growth conifer forest—will improvethe quantity and quality of available habitats on which focal terrestrial species depend.
EvidenceAll Willamette wildlife and plant species listed under the federal Endangered Species Act,and all sensitive species listed by the Oregon Department of Fish and Wildlife, dependstrongly on one or more of these focal habitats. Relationships of individual species to each ofthese habitat types are described not only in Section 3.4 and Appendix D of this report, butalso in several regional databases and habitat models, including those of IBIS, the PNW-ERC, and the ORNHIC. These secondary sources cite the primary literature that documentsthe importance of these particular habitats to the focal terrestrial species. In addition, severalprevious analyses have singled out these particular habitats as being of greatest overallimportance to biodiversity in the Willamette Subbasin: Willamette Restoration Strategy(ODFW; Nov. 2000 draft); Ecoregional Assessment (TNC; Floberg et al., 2004);Conservation Strategy for Landbirds in Lowlands and Valleys of Western Oregon andWashington (Altman, 2000); Joint Venture Implementation Plan: Willamette Valley (Roth etal., 2002); Alternative Futures Assessment (PNERC, 2002); Payne, 2002).
Willamette Subbasin plant and wildlife species are affected by both habitat loss and habitatdegradation. Habitat loss includes changes that are long-term and that radically changehabitat structure as perceived by wildlife, such as:
• Conversion of any land cover type to impervious surface, e.g., pavement, buildings, otherinfrastructure
• Permanent inundation of land, e.g., by large dams
• Permanent filling of seasonally or permanently inundated areas, e.g., by intentional ornatural deposition of sediment, rock, or debris
• Conversion of naturally vegetated land to monocultural agricultural cover
• Creation of persistently unvegetated surfaces, e.g., from gravel extraction
Habitat degradation is closely related and consists of physical and biological changes that aretechnically easier than habitat loss to reverse or mitigate, or which can be reversed overshorter time periods, although there may be substantial socioeconomic constraints to doingso. Habitat degradation decreases the accessibility or suitability of food, water, andcover/substrate to wildlife populations, therefore increasing crowding, competition,predation, pathogen and parasite transmission, and ultimately, mortality rates. Restoration ofdegraded habitat provides only marginal net benefit to populations of terrestrial wildlife andrare plants if habitat losses continue unimpeded. In the Willamette Subbasin, as elsewhere,degradation of habitat for native wildlife and rare plants most often involves, in no particularorder:
• Roads and other barriers• Vegetation change

DRAFT WILLAMETTE SUBBASIN PLAN
CH 3 ASSESSMENT.DOC 3-583
• Diminished supply of dead wood• Water regime change• Pollution• Temperature change• Soil degradation• Harassment• Invasive species, pathogens, and parasites
From a spatial perspective, loss and degradation of habitat results in fragmentation of theremaining habitat. That is, there is:
• Increased distance between patches of remaining accessible habitat, e.g., decreasedconnectivity
• Increased simplification of habitat, i.e., fewer habitat types and structures at multiplescales
Natural Factors Contributing to Habitat Loss and Degradation. Natural events candegrade habitat for some wildlife species and enhance it for others. Examples are forest fires,major floods, drought, landslides, insect and disease infestations, wind, ice storms, grazingby wild herbivores, and natural vegetative succession. With the exception of regionwidecatastrophic change to natural habitats, such as the Missoula Flood at the end of the last IceAge, periodic habitat loss and degradation did not result in significant species loss. That isbecause:
• Such events were localized and occurred in a pattern largely dispersed in space and time
• Remaining natural areas within and beyond the subbasin provided temporary refuge forspecies capable of fleeing such events as well as a source of recolonizers followingcessation of disturbance
• Escape and recolonization corridors were physically better-connected than is currentlytrue.
Artificial Factors Contributing to Habitat Loss and Degradation. Artificial causes ofhabitat loss and degradation result largely from land conversion and management activities(see Appendix D for a detailed discussion of the approach used to identify and weightspecific categories of change and degradation). Artificial factors can degrade habitat forsome wildlife species and enhance it for others. Conversion of presettlement habitat haslikely resulted in a net decline or disappearance of approximately 165 wildlife species, orabout 59 percent of the total terrestrial fauna (White et al. 2002, Payne 2002). Becausecredible quantitative data are lacking on historical populations of all wildlife species, theseconclusions are based on comparison of current with historical vegetation and application ofpeer-reviewed species-vegetation association models to each vegetation type. Limitations ofthis procedure are summarized in Table 2 of Appendix D.
The relative contributions of the various habitat degradation factors to wildlife populationchanges are unmeasured for most species, and likely depend on the species, location in thesubbasin, and other factors discussed under the individual focal species in Section 3.2.4.5.
DRAFT WILLAMETTE SUBBASIN PLAN
3-584 CH 3 ASSESSMENT.DOC
Multiple studies have concluded that conservation and restoration of native habitats have thepotential to stabilize or improve trends of terrestrial species in the Willamette Basin (White etal. 2002; Payne 2002; Polasky et al., personal communication).
Conclusions from White et al. (2002) Analysis. Of several future scenarios examined inthe Pacific Northwest Ecosystem Research Consortium’s Willamette Basin Planning Atlas(PNERC 2002), the conservation scenario was projected to provide the most benefits towildlife (31 percent gain compared to present), followed by the Plan Trend scenario(10 percent loss). A loosening of land use laws and other effects envisioned by theDevelopment scenario resulted in 39 percent more species losing habitat than gaining habitat.Outcomes for each species are shown Table 50 of Appendix D. The conservation scenariowas developed based on the following assumptions (for example) for the year 2050:
• To accommodate development, 54,000 acres (rather than 129,000) are added to UGBs.
• About half the new housing adjacent to the 1990 rural residential areas is in clustereddevelopments (9.3 dwellings per acre vs. 6.2).
• Urban areas contain 94 percent of the population instead of 87 percent.
• All streams contain some wooded riparian habitat, and this occupies at least 100 feet onboth sides of all streams crossing private land and 300 feet on both sides of streams onpublic land.
• Average clearcut size on public timberlands declines from 30 to 10 acres, and averagesbetween 5.6 and 13 acres on private timberlands.
Conclusions from Application of PATCH Model. Computer simulations suggested thatapplication of the same habitat conservation scenarios developed in the PNERCConservation 2050 scenario could increase the populations of 14 of the 17 species whosepopulations were modeled.
Conclusions from Payne’s (2002) Analysis. This investigator studied rural residentialdevelopment patterns. Her models assumed restoration would be required as mitigation forall cluster developments within less productive areas of the subbasin. If such a policy wereadopted, Payne’s spatial analysis indicated it could result in restoration of 84,819 acres ofhabitat, specifically: 38,146 acres of oak savanna, 29,218 acres of conifer forest, 8,319 acresof upland prairie, 3,184 acres of wetland prairie, 2,394 acres of wetland, 2,340 acres ofmixed forest, and 1,229 acres of riparian forest.
Preliminary Conclusions from Polasky et al. (pers. comm.) Analysis. The optimumsolution of this simulation, using a hypothetical Willamette Valley landscape, indicated thatperhaps 96 percent of the habitat suitability for the 97 terrestrial wildlife species examinedcould be maintained with (at most) a 7 percent economic loss to agricultural or forest useobjectives. Residential development objectives were not examined. The researchersdetermined the optimum case to be one in which:
• The parcel presettlement vegetation had been 37 percent conifer forest, 26 percent prairieand other non-forest, 25 percent oak woodland and other deciduous forests, and12 percent shrubland;

DRAFT WILLAMETTE SUBBASIN PLAN
CH 3 ASSESSMENT.DOC 3-585
• Parcels whose most valuable activity is agriculture occupied 28 percent of the landscapewith a mean per acre value of $3743 and standard deviation of 3762;
• Parcels whose most valuable activity is forestry occupied 72 percent of the landscape,with a mean per acre value of $3933 and standard deviation of 485
Taken together, the above four studies demonstrate the value for wildlife with modest habitatrestoration proposals. At the same time they caution that restoration — unless undertakenmuch more extensively — cannot hope to (1) create a net benefit for wildlife if habitatdestruction continues unabated, and (2) replace a significant fraction of the habitat losses thathave occurred historically.
Where Does Habitat Loss and Fragmentation Limit Terrestrial Species? Habitat lossand fragmentation limit terrestrial species throughout the Willamette Basin. Habitat loss anddegradation due to conversion has been most extensive in the lowlands (PNERC 2002).
3.6.2 Opportunities
3.6.2.1 Habitat for High-Priority ProtectionPlace a near-term priority on conserving remaining aquatic and terrestrial focal and keyhabitats in lowlands where habitat loss has been the greatest (PNERC 2002, WRI 2001).Anticipated population increases and urban expansion make conservation of existing habitatsin the lowlands critically important. Conservation of key habitats with intact ecosystemdynamics, processes, and functions is much less expensive and more effective thanrestoration.
3.6.2.2 Habitat to Reestablish AccessRestore connectivity to historical habitats and among existing habitats. Restore connectivityto historical aquatic and terrestrial habitats by targeting restoration in areas that will link highquality key habitats in both the aquatic and terrestrial environment. Prioritize connectivityrestoration activities to the highest quality habitats and the areas that have the potential toincrease patch sizes of terrestrial habitats. Prioritize fish passage efforts at dams whereimprovements open up the greatest extent of high quality habitat. USACE dams have blockedaccess to large portions of historical habitat in the Willamette Basin (see evidence forWorking Hypothesis #4). Restoring access to these historical habitats will increase the totalsystem capacity by an average of 35 percent for salmon and steelhead.
3.6.2.3 Habitat for RestorationAquatic and Terrestrial. Restore river and floodplain interactions in appropriate areas tocreate and maintain aquatic and terrestrial habitats and improve water quality. The dynamicinteractions between a river and its floodplain are essential to the creation and maintenanceof riparian and aquatic habitat features. Natural flow regimes and periodic flooding are amechanism of energy and nutrient exchange between terrestrial and aquatic environmentsthat has been severely disrupted through water flow management and streambank hardening.Simplification of river and stream channels decreases floodplain interactions. The complexinteractions of a river system with its floodplain need to be protected where they currentlyexist and restored where the combination of ecological potential and willing landownersoccurs.
DRAFT WILLAMETTE SUBBASIN PLAN
3-586 CH 3 ASSESSMENT.DOC
Restore linear integrity and species composition to lowland riparian areas. Riparianvegetation closest to rivers and streams has the greatest functional potential (PNERC 2002).While wide riparian habitat is important and serves a range of critical functions, the highestpriority should be given to restoring riparian vegetation immediately adjacent to rivers andstreams. Riparian areas provide essential habitat for many terrestrial wildlife species and areessential for the maintenance and creation of aquatic habitat. All natural riparian vegetation isbeneficial. Forested riparian areas provide a greater range of benefits than non-forested areasand should be given conservation priority.
Aquatic. Restore channel complexity in the lowlands throughout the Willamette Basin. Akey finding of this assessment is the importance of considering the Willamette Basin as asystem of connected habitats. EDT analysis in the Clackamas and McKenzie subbasinsindicate the highest restoration values are in the lowlands. That is not so surprising. Whatwas surprising was the high restoration value of the lower Willamette for Clackamas Riverpopulations of anadromous fish species.
The analysis reveled that the Clackamas River and the lower Willamette River form acontiguous habitat unit. Current conditions in the Portland (lower Willamette) area aredegraded from historical conditions. The lower Willamette mainstem has been largelyconverted from shallow-water habitats to deep water with virtually no large wood. Theassessment found that salmon and steelhead currently use the area almost entirely as amigration corridor, and not for rearing. This is consistent with studies of fish use of the lowerWillamette River that found most juvenile salmonids move through the area in less than twoweeks (Friesen and others 2002). EDT analysis has shown that restoration of the complexnetwork of shallow water habitats in the lower Willamette has the potential to contributesignificantly as rearing habitat for tributary spawning populations such as those from theClackamas. For all six populations combined, the Portland area had the second highest rankfor restoration value.
It is important to keep in mind that the Willamette is a constrained natural system in whichvalues for naturally functioning conditions must be considered within the context of theinfrastructure that keeps the many people who live, work, and contribute to a thrivingeconomy safe. While restoration of shallow water habitat in many portions of the lowerWillamette is unlikely due to infrastructure development and economic and socialconstraints, this result highlights the value of considering an expanded view of therelationship between rearing habitats in lower elevation tributaries and the mainstemWillamette and total system capacity.
Terrestrial. Successful conservation planning necessitates a realistic and strategic approachthat considers the needs of landowners while identifying the most biologically importantplaces for investment. Without such an approach, there is a risk that scarce conservationresources will be expended on restoration projects or land acquisition that produce limitedbenefit to biodiversity. Faced with the reality that society will be unable to protect or restoreall habitat required to sustain every species, efforts to identify good investments forconservation and restoration have been made.
Two major projects have used a systematic approach to prioritize particular areas of theWillamette Subbasin for wildlife habitat protection or restoration. These are the AlternativeFutures project conducted by the Pacific Northwest Ecosystem Research Consortium (ERC),
DRAFT WILLAMETTE SUBBASIN PLAN
CH 3 ASSESSMENT.DOC 3-587
which identified “Conservation and Restoration Opportunity Areas” (CROAs)15, and theWillamette Valley – Puget Trough – Georgia Basin (WPG) Ecoregional Assessment,coordinated by The Nature Conservancy (TNC), which identified “Priority ConservationAreas” (PCAs).
Willamette Valley-Puget Trough-Georgia Basin (WPG) Ecoregional Assessment(Floberg et al. 2004). This 4-year effort involved over 100 experts from Oregon andWashington. It did not cover the entire Willamette Subbasin, just the portion that comprisesthe Willamette Valley and adjoining foothills. Priority Conservation Areas are sites ofbiological significance warranting conservation attention. TNC’s portfolio of PCAs isselected by analyzing several layers of data, including the status, spatial distribution andecological condition of species, natural communities and major habitat types (e.g.,conservation targets). The delineation of PCAs also reflects the likelihood that each PCA willbe able to meet minimum population or area goals set for individual conservation targets.TNC determines the number of occurrences or amount of area (representation goals) neededto ensure the survival of species or viability of habitats at the ecoregional and subecoregional(section, e.g., Willamette Valley) level. A computer algorithm selects the best combination ofconservation areas based on the concentration and condition of targets, degree to which targetrepresentation goals are met and landscapes where the fewest impediments to successfulconservation exist. Results of the computer model are independently peer-reviewed andrefinements are made to the assessment to produce a final portfolio of PCAs. By design, theassessment did not address salmon. TNC ranked the biological value and the severity andurgency of threats of each PCA to further prioritize conservation investment at each site inthe Willamette Valley. TNC considers this portfolio of PCAs “a first approximation of themost important places for conserving native species and ecosystems” in the WillametteValley, Washington’s Puget Trough, and British Columbia’s Georgia Basin. The final list ofPCAs includes a small percentage of the total Willamette Subbasin, almost entirely onprivate land. It does not include every location for every listed or sensitive species. Theassessment does not address higher-elevation portions of the subbasin because these areasoccur outside of ecoregional boundaries used by TNC.
Willamette River Basin Planning Atlas (Hulse et al. 2002, Hulse et al. 2004, Baker et al.2004). For this project, a team of planners and scientists applied the same wildlife modelsused in this report (Adamus et al. 2000) to maps they constructed of Willamette Basin landuse and land cover circa 1851 (“pre-settlement”) and 1990 (present). They then developedmaps of three alternative ”futures” circa 2050, based on plausible changes in societalpriorities for land management. The purpose was to evaluate net changes in species richnessfrom past practices and provide a scientifically sound tool for evaluating the future ecologicalramifications of contemporary policies and actions. The PNW-ERC (EC90) land cover mapwas used as the reference point. Subsequently, a graduate student (Susan Payne) created arefined “CC90” map of present-day land cover and applied it to predict the net effects onwildlife (basinwide) of cluster development vs. conventional development. Specific locationsfor restoration or conservation within the subbasin were not identified or prioritized. Also,recently a consortium of university scientists used a version of the EC90 layer and simplified 15 These were further differentiated as “Tier 1” and “Tier 2” areas. Tier 1 habitats are assumed to be managed for the purposeof achieving a naturally functioning landscape. Tier 2 habitats are habitats of comparatively lower habitat suitability (e.g.,orchard, vineyard) set within a mosaic of more important habitats and assumed to be managed for sustainable production ofgoods and services compatible with more-limited conservation of habitat on site.

DRAFT WILLAMETTE SUBBASIN PLAN
3-588 CH 3 ASSESSMENT.DOC
wildlife models to run scenarios involving alternative forest management practices in theCoast Range portion of the subbasin, and described likely net effects of each on speciesrichness (Radosevich et al. 2004).
A key assessment activity of this subbasin plan was to identify the degree to which thepriority areas from these two sources overlap (see the overlay in Appendix R).
• Approximately 60 percent of the area identified by The Nature Conservancy EcoregionalAssessment lies within the areas identified by the Consortium as Conservation andRestoration Opportunities. Conversely, approximately 13 percent of the area identified bythe Consortium was identified by The Nature Conservancy (Table 3-197). The latterpercentage is smaller mainly because The Nature Conservancy’s Priority ConservationAreas were identified over a smaller region than were the Consortium’s OpportunityAreas.
Table 3-197: Summary: Percent of ERC-identified Conservation and RestorationOpportunity Areas Included within TNC-identified Priority Conservation Areas
Feature
AcresIdentifiedas PCA
Total Acres inSubbasin
Percent of FeatureIdentified as PCA
tier 1 oak 35210 55144 64
tier 1 prairie 24294 37870 64
tier 1 floodplain forest 39551 57638 69
tier 1 upland forest 4701 766765 1
tier 1 mid-elev forest 25930 53289 49
tier 1 forest rip prot zones 7630 496958 2
tier 1 wetlands 35661 87714 41
Willamette R. restored channels 39448 94846 42
SUBTOTAL Tier 1 (212,425) (1,650,224) (13)
tier 2 forests 42923 71388 60
tier 2 oak and prairie 11014 21450 51
tier 2 riparian protection zones 44443 743164 6
tier 2 wetland protection zones 15528 62563 25
SUBTOTAL Tier 2 (113,907) (898,565) (13)
Note: The PNW-ERC defined Tier 1 habitats as priority habitats managed for the purpose ofachieving a naturally functioning landscape. Tier 2 habitats are habitats of comparatively lowerhabitat suitability (e.g., orchard, vineyard) set within a mosaic of more important habitats andmanaged for sustainable production of goods and services compatible with limited habitatconservation. Table compiled by Chris Robbins, Oregon Chapter of The Nature Conservancy.
• Overlap between PCAs and Tier-1 CROAs is greatest with regard to floodplain forest,oak woodland, and upland prairie. It is least with regard to upland forest and upland
DRAFT WILLAMETTE SUBBASIN PLAN
CH 3 ASSESSMENT.DOC 3-589
forest riparian areas (Table 3-197). This is largely due to the lowland ecoregionalconstraint of the TNC project. The degree of overlap between each PCA and CROA isdepicted in Table 3 of Appendix D. This should be used in planning for conservation orrestoration of specific sites.
Taken together, the PCAs and CROAs identified by previous projects appear to reasonablyrepresent the best remaining habitat for the widest variety of species in the WillametteSubbasin
This report also examined the conservation effectiveness if only the Nature Conservancy’sPriority Conservation Areas and public lands already protected from development areconserved or restored. Time and other constraints allowed quantified analysis of this questiononly with regard to the PCAs, not the CROAs or additional areas that might be prioritized forfish conservation and aquatic habitat restoration. It should be understood that the TNC andERC assessments were never intended to capture all known occurrences or habitat of everyspecies inhabiting the subbasin. In fact, the TNC assessment intentionally did not include anumber of known occurrences of rare species within the boundaries of its PCAs where thoseoccurrences were considered unlikely to be sustainable due to small local population size ofthe species, proximity to urban areas, and other factors. Nonetheless, this report examined theefficacy of the PCAs and public lands in order to identify explicitly the species andwatersheds covered least-well by these areas, so future conservation and restoration activitiescan be extended to those when warranted. The analysis was based on two considerations:
1. To what degree are actual occurrences of EOR species being missed? Which species andwatersheds have the highest incidence of omissions?
To answer this, the EOR (element-of-occurrence records) database maintained by theOregon Natural Heritage Information Center (ORNHIC) was queried. “EOR species” areones tracked by ORNHIC because of their scarcity or vulnerability, and are within thescope of this report. It includes all federally-listed plant and wildlife species and somestate-listed species. In the Willamette Subbasin a total of 35 are relevant to this terrestrialanalysis. They include 9 amphibians, 3 reptiles, 14 birds, 4 mammals, 4 plants, and 1butterfly. Caution is advised in interpreting results based on EOR data because the totalnumber of records from the Willamette Subbasin in the EOR database, and consequentlythe number captured by the PCAs and public lands, depends largely on the extent ofprevious survey efforts for the species and the degree to which biologists contribute theirobservations of rare species to the ORNHIC, for many years now the official repositoryfor such information in Oregon. Thus, the number of EORs is not necessarily a reliableindicator of a species’ relative abundance or extent of its habitat.
To answer this, the ERC species models were applied to ERC’s “EC90” land cover layerusing GIS, then ORNHIC species occurrence data were added where habitat did notpredict occurrence, and final lists were generated of wildlife species both within andoutside of the PCAs and public lands in each watershed. These lists were compared, andspecies that were predicted to occur only outside of the PCA+public land area werehighlighted by watershed.
The analysis showed that known occurrence of only one species – pallid bat – would fallcompletely outside of public lands and PCAs. That secretive species has been
DRAFT WILLAMETTE SUBBASIN PLAN
3-590 CH 3 ASSESSMENT.DOC
documented at only one location in the subbasin. Species with the smallest percentage oftheir documented breeding occurrences inside the combined area of the PCAs and thepublic lands are: mountain quail, Nelson’s checkermallow, horned lark, western pondturtle, and vesper sparrow. These results suggest that special efforts should be made toenhance habitat for these species on private lands, and/or to extend PCA boundaries toinclude known locations. Among species, the median percentage of records incorporatedwithin the PCA+public area is 70 percent, indicating the PCAs as drawn are fairlyeffective in capturing the EORs.
2. To what degree is possibly-suitable habitat of the 289 terrestrial species (and especiallythe 51 focal species) being missed? Which species and watersheds have the highestincidence of apparent omissions?
Among the 104 watersheds that have PCAs, 92 watersheds have one or more EORs, for atotal of 348 EORs. Of these EORs, half (49.7 percent) are from private lands notidentified as PCAs. Based on exclusion of EORs, the watersheds where the need may begreatest to either enhance habitat on private land or extend PCA boundaries to includeknown locations are: 170900030302 (Brownsville), 170900030101 (W. Eugene; JunctionCity), 170900050601 (Jefferson; Lyons; Bear Branch), and 170900060103 (Waterloo;Sweet Home; McDowell Cr.). Efficacy in capturing the EORs was correlated somewhatwith the proportion of the watershed comprised of PCAs and public lands.
Considering the subbasin as a whole, the results show that the combination of PCAs pluspublic lands would include at least some amount of habitat for all wildlife and rare plantspecies. Taking a watershed-by-watershed approach, the results show that of theWillamette watersheds in which PCAs were identified, they would be adequate (whencombined with public lands) to protect habitat of all species in the majority (53 percent)of watersheds.
A third question examined for this report is:
If conservation actions focus mainly on a limited set of focal species, which other speciesare most and least likely to benefit?
The selection of 55 species (17 percent of the total) as “focal’ was intentionally not basedsolely on their anticipated ability to serve either as “indicator” species (i.e., species mostclosely associated with the habitat type under which they are grouped) or “umbrella” species(i.e., species whose habitat requirements are broad enough to include those of many otherspecies). Nonetheless, a need was identified to at least measure how well protection ofhabitat just for the focal species might address the requirements of other terrestrial wildlifespecies. This is important because:
• Restoration and preservation proposals are easier to support when it can be demonstratedthat benefits will accrue to more than just a few target species whose habitat preferencesoverlap closely, i.e., inclusion of one species will “sweep” others;
• By identifying which species have the least overlap in their habitat preferences, one canidentify which species need attention over-and-beyond that given to a particular targetspecies. This allows for greatest efficiency in restoring or preserving complementaryareas.

DRAFT WILLAMETTE SUBBASIN PLAN
CH 3 ASSESSMENT.DOC 3-591
Determining the potential for overlap among any two species requires consideration of threeprimary factors:
1. the habitat types each associates with the most2. the habitat structural conditions each associates with the most; and3. overlap in the geographic/ elevation ranges of the species.
There is no “short answer” to the question posed above. Depending on species beingcompared, the maximum correlation between non-focal species and any focal species ranged0.23 to 1.00 (median = 0.81) for habitat type and 0 to 1 (median = 0.76) for habitat structure.These relatively large and positive median correlations suggest a high likelihood thatcollectively speaking, protecting or restoring habitat for the focal species will tend to benefitmany non-focal species as well.
A fourth question considered by this effort is:
If conservation actions focus mainly on just six focal habitat types and their associatedspecies, which additional habitats are most necessary to address needs of other species?
Largely by conducting a “sweep” analysis of the attribute data for species associated with thesix focal habitats, we determined that protection or restoration of several additional habitattypes will be required to adequately protect habitat for several other species. Table 30 ofAppendix D shows species for which none of the six focal habitats provides ideally (or insome cases, any) suitable habitat.
The analysis conducted for this report shows there is great opportunity for conservation in theWillamette Basin for both terrestrial and aquatic habitats. Discussion in Section 5 of thisreport describes practical approaches to applying strategy to the opportunities in theWillamette.