northern territory economy quick facts - september quarter ... · web viewkey energy commodities...
TRANSCRIPT
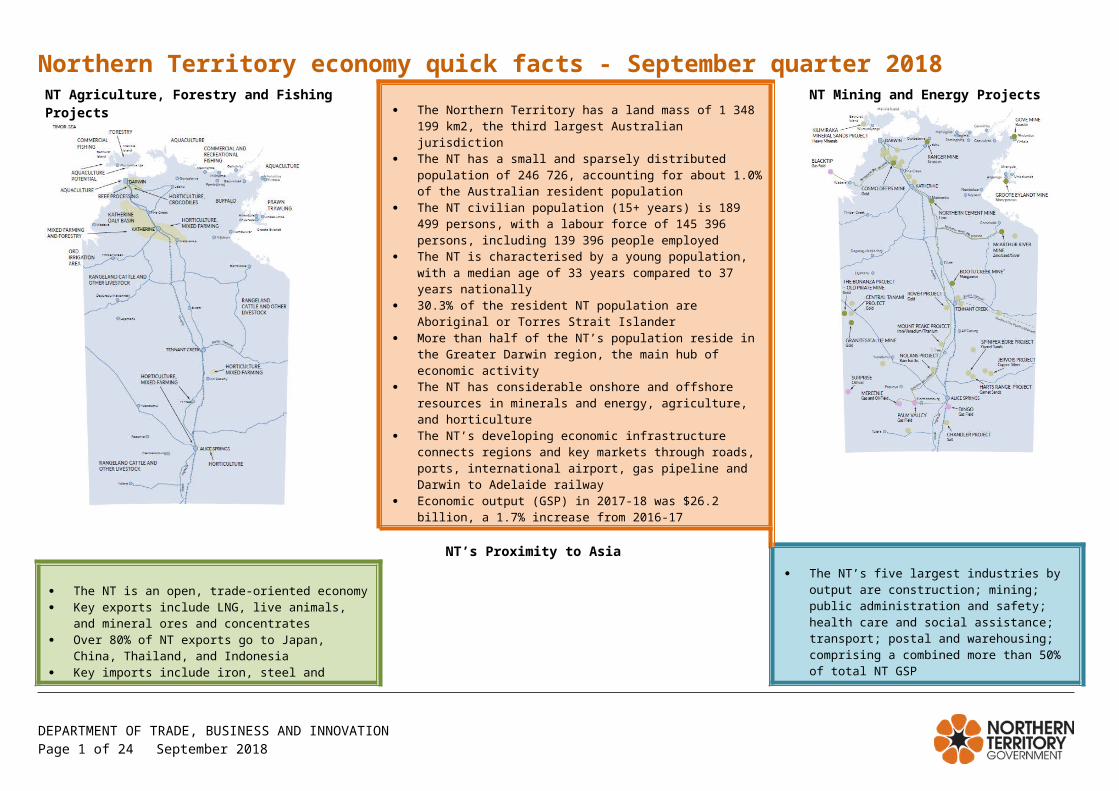
Northern Territory economy quick facts - September quarter 2018NT Agriculture, Forestry and Fishing Projects
The Northern Territory has a land mass of 1 348 199 km2, the third largest Australian jurisdiction
The NT has a small and sparsely distributed population of 246 726, accounting for about 1.0% of the Australian resident population
The NT civilian population (15+ years) is 189 499 persons, with a labour force of 145 396 persons, including 139 396 people employed
The NT is characterised by a young population, with a median age of 33 years compared to 37 years nationally
30.3% of the resident NT population are Aboriginal or Torres Strait Islander
More than half of the NT’s population reside in the Greater Darwin region, the main hub of economic activity
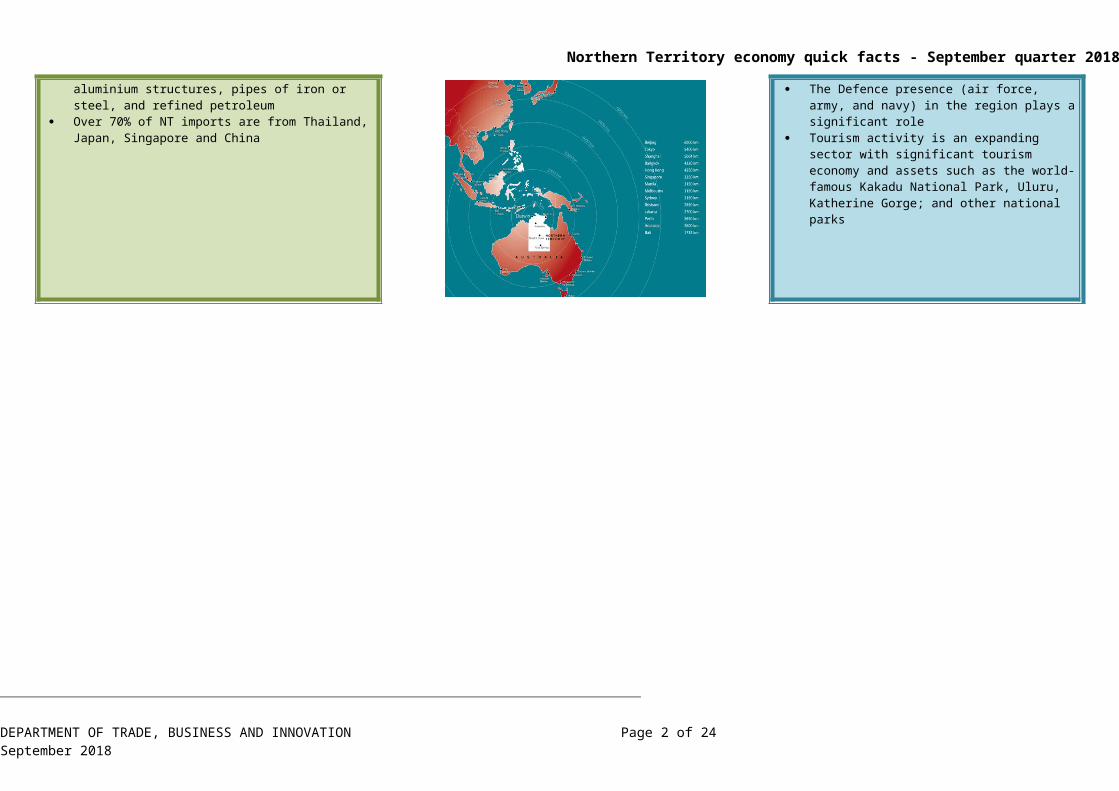
The NT has considerable onshore and offshore resources in minerals and energy, agriculture, and horticulture
The NT’s developing economic infrastructure connects regions and key markets through roads, ports, international airport, gas pipeline and Darwin to Adelaide railway
Economic output (GSP) in 2017-18 was $26.2 billion, a 1.7% increase from 2016-17
NT Mining and Energy Projects
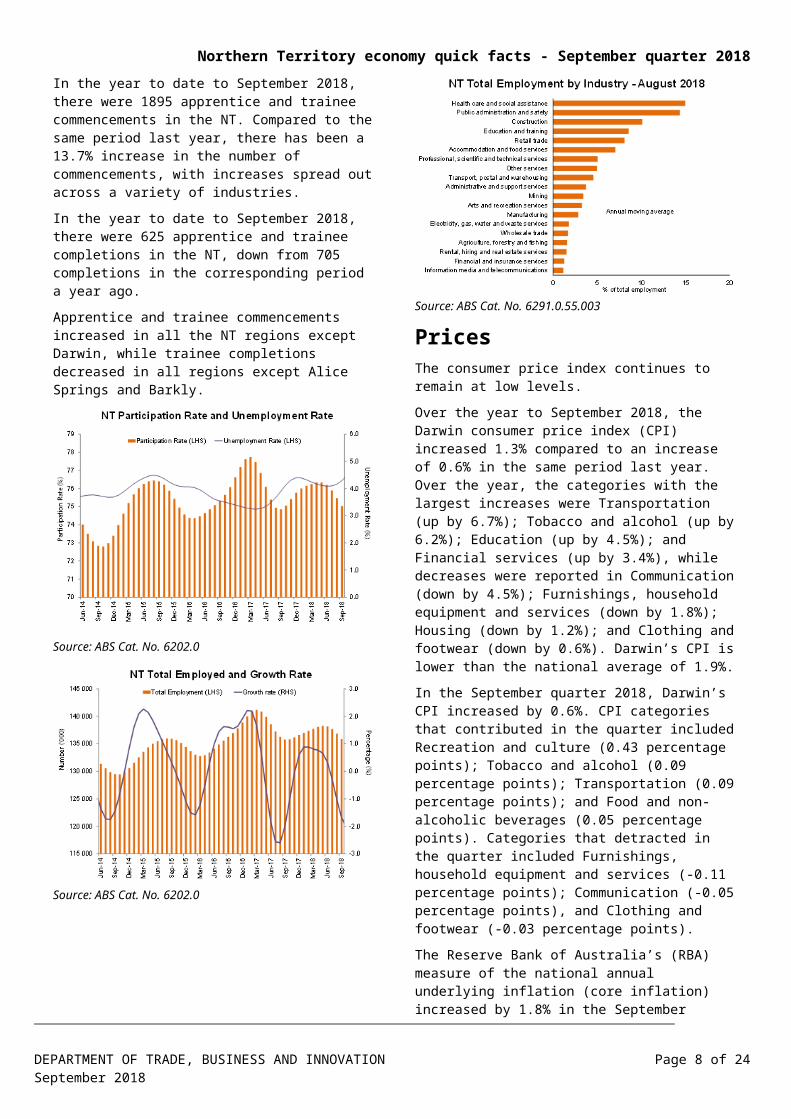
NT’s Proximity to Asia
The NT’s five largest industries by output are construction; mining; public administration and safety; health care and social assistance; transport; postal and warehousing; comprising a combined more than 50% of total NT GSP
The Defence presence (air force, army, and navy) in the region plays a significant role
Tourism activity is an expanding sector with significant tourism economy and assets such as the world-famous Kakadu National Park, Uluru, Katherine Gorge; and other national parks
The NT is an open, trade-oriented economy Key exports include LNG, live animals, and mineral ores
and concentrates Over 80% of NT exports go to Japan, China, Thailand,
and Indonesia Key imports include iron, steel and aluminium
structures, pipes of iron or steel, and refined petroleum Over 70% of NT imports are from Thailand, Japan,
Singapore and China
DEPARTMENT OF TRADE, BUSINESS AND INNOVATIONPage 1 of 17 September 2018
Northern Territory economy quick facts - September quarter 2018
Regional fast facts
DEPARTMENT OF TRADE, BUSINESS AND INNOVATION Page 2 of 17September 2018

Northern Territory economy quick facts - September quarter 2018Please read in outline view for best navigational experience.
Introduction
Source: ABS Cat. No. 5220.0
The Territory’s economy, while relatively small compared to other Australian jurisdictions, is vibrant and has an abundance of mineral and energy resources. Its close proximity to Asia, the fastest growing region of the global economy, and a renewed focus of developing northern Australia, provide many potential business opportunities for Territory businesses.
Gross state product (GSP)The NT’s 10-year average annual economic (GSP) growth rate (2007-08 to 2017-18) was 3.4%. In
2017-18, NT GSP (inflation adjusted) increased by 1.7% to $26.2 billion, driven by growth in household and government consumption, and exports. In 2017-18, total investment in the NT was valued at $10.0 billion, a decrease of 12.8% compared to 2016 17.
Private investment is the largest component of total investment, about 85% ($8.5 billion). Private investment decreased by 15.0% over 2017 18. This decrease was largely driven by a 17.3% fall in non dwelling construction activities (business investment). In the NT economy, large projects have a considerable impact on investment and generate high levels of economic growth. But these also generate large fluctuations in investment and economic growth.
Private business investment, the key driver of investment, comprised about 91% of the total private investment and 77% of the total investment in 2017-18.
Nationally, Gross Domestic Product (GDP) increased by 2.8% in 2017-18. NT GSP accounts for 1.4% of Australian GDP.
Source: ABS Cat. No. 5220.0, Deloitte Access Economics, Commonwealth and NT Treasuries
NT economic growth is estimated to grow at a faster pace (2.9%) in 2018-19 and by 4.3% in 2019-20 (NT Mid-Year Report 2018-19). This is largely due to a significant increase in LNG exports during the export and operational phase of the Ichthys LNG plant, following the construction phase. Deloitte Access Economics (DAE) forecasts growth in the NT economy of 2.3% in 2018-19 and 3.3% in 2019-20. National GDP is estimated to grow by 2.75% in 2018 19 (Australian Government MYEFO 2018).
NT State Final Demand (SFD), total domestic expenditure within the local economy, was $28.2 billion (trend and inflation adjusted) in the year to September 2018. For the same period in the previous year SFD was $30.7 billion. Consumption (public and private consumption), the largest component of SFD, comprised 68.8% of domestic demand in the year to September 2018.
Source: ABS Cat. No. 5220.0 & NT Treasury and Finance
NT SFD component
Proportion of SFD in the year to the September quarter
2018 2017 Annual change
Private consumption
40.4% 36.1% Increase
Public 28.8% 25.3% Increase
DEPARTMENT OF TRADE, BUSINESS AND INNOVATION Page 3 of 17September 2018

Northern Territory economy quick facts - September quarter 2018
NT SFD component
Proportion of SFD in the year to the September quarter
consumption
Private investment 25.2% 33.8% Decrease
Public investment 5.7% 4.9% Decrease
International tradeIn the year to September 2018, the value of NT goods exports increased by 15.5% to $6.1 billion and goods imports increased by 17.6% to $1.9 billion, resulting in a trade surplus of $4.2 billion.
Recent changes in classification of confidential items in international trade has resulted in feedstock gas imports and LNG exports being classified into this category.
The NT contributed about 1.9% of Australia’s goods exports, and around 0.6% of imports in the year to September 2018.
A significant proportion of imports to the NT come from other Australian jurisdictions and is treated as the balancing item in the GSP accounts.
Major NT imports from overseas are iron, steel and aluminium structures, pipes of iron or steel, and refined petroleum.
The NT’s major exports to overseas are LNG, live animals, and mineral ores and concentrates.
The majority of NT exports are destined for North and South East Asia (Japan and China are key export partners) while the main import partners are Thailand, Japan, Singapore, and China.
PopulationAs at June 2018, the NT’s resident population was 247 281, a decrease of 0.1 percent in annual terms. Natural increase and net overseas migration added to the population while net interstate migration detracted from population growth. NT population has moderated over the past three years, and is expected to decrease by 0.7% in 2018 before increasing by 0.6% in 2019 (NT Mid-Year Report 2018-19).
The population of Australia in June 2018 was 24 992 369 people and reached 25 000 000 in August 2018.The NT population comprised 1.0% of the national population.
The estimated resident Aboriginal and Torres Strait Islander population of the NT in June 2016 was 74 509 persons, comprising around 30.3% of the NT resident population. Around 49.9% of the Indigenous population were females. Nationally, the Indigenous population accounts for 3.3% of the total population.
The NT population is relatively young (median age of 33 years compared to 37 years nationally) with a higher male-to-female sex ratio 107.5 males per 100 females compared to 97.4 males per 100 females nationally.
In the September quarter 2018, the civilian population (15+ years) of the NT was 189 286 persons, about 77.0% of the total population. Nationally, the civilian population was 81.0% of the population.
Around 59.6% of the NT population is located in the Greater Darwin area (Darwin City, Darwin suburbs, Litchfield and Palmerston) with Central Australia (Alice Springs region) accounting for a further 16.1% and the Katherine region accounting for 8.5% of the total population.
Source: ABS Cat. No. 3101.0
Source: ABS Cat No. 3101.0
DEPARTMENT OF TRADE, BUSINESS AND INNOVATION Page 4 of 17September 2018

Northern Territory economy quick facts - September quarter 2018
Source: ABS Cat No. 3218.0
DEPARTMENT OF TRADE, BUSINESS AND INNOVATION Page 5 of 17September 2018

Northern Territory economy quick facts - September quarter 2018
Labour marketThe NT labour market is characterised by a relatively skilled labour force with a high level of labour participation and low unemployment. There are however, regional differences in the labour market characteristics.
The NT unemployment rate averaged 4.3% (trend) in the September quarter 2018, and is the second lowest unemployment rate among all Australian jurisdictions. Nationally, the unemployment rate averaged 5.3% over the same period. In the June quarter 2018, regional statistics show the unemployment rate increased in all NT regions. The Daly-Tiwi-West Arnhem region had the highest unemployment rate in the NT at 9.3%, while Greater Darwin reported the lowest unemployment rate at 4.0%. It should be noted that many NT regions consist of a small population base, which can result in volatility in labour data.
In the September quarter 2018, of the civilian population of 189 286, 75.1% (142 103) are in the labour force, out of which 135 830 were employed.
The NT underemployment rate (an additional measure of labour underutilisation) was the lowest of the jurisdictions at 4.1% of total employed persons in the September quarter 2018, compared to 8.4% nationally, signifying that there are more employed people in the NT working their desired number of hours. The NT underemployment rate has been trending up over the past six months.
In the September quarter 2018, the average NT labour force participation rate (LFPR) was 75.0%, and continues to be the highest of the jurisdictions. The national average LFPR was 65.6% in the same period.
Non-resident labour (including fly-in-fly-out workers) is an important component of the NT labour market statistics. Although difficult to measure, Census 2016 estimated it to be about 8700 workers in June 2016. Similarly, members of the Australian Defence Force are also not included in the labour force statistics, but Australian Defence Force data estimated it to be about 4702 permanent defence force personnel as at June 2017 (Department of Treasury and Finance).
In the September quarter 2018, the average NT resident employment decreased by 1.7% from the previous three months. In the year to September 2018, NT resident employment decreased by 1.2%, the lowest rate of growth of all jurisdictions. Nationally, employment grew by 2.8% in the same period.
Employment in the NT is forecast to fall by 0.5% in 2018-19 (NT Mid-Year Report 2018-19) and remains below the forecast national employment growth rate of 3.0%. DAE’s (September 2018) NT employment forecast for the same period is an increase of 1.5%.
In the year to September 2018, the number of youth employed (aged 15-24 years) in the NT decreased by
9.7% to 17 700 persons. At the national level, youth employment increased by 3.3% to 1 923 200 persons.
NT employment by industry sector data (annual moving average at August 2018) shows that Health care and social assistance remains the largest employer employing about 14.9% of the total employed, overtaking Public administration and safety.
Other large industry employers include Public administration and safety (14.4%), Construction (10.1%), Education and training (8.6%), and Retail trade (8.1%). The Mining industry on the other hand employs around 3.4% of the NT workforce.
In the year to August 2018, Agriculture, forestry and fishing had the largest employment growth, followed by Arts and recreation services, and Communication services.
In the year to date to September 2018, there were 1895 apprentice and trainee commencements in the NT. Compared to the same period last year, there has been a 13.7% increase in the number of commencements, with increases spread out across a variety of industries.
In the year to date to September 2018, there were 625 apprentice and trainee completions in the NT, down from 705 completions in the corresponding period a year ago.
Apprentice and trainee commencements increased in all the NT regions except Darwin, while trainee completions decreased in all regions except Alice Springs and Barkly.
Source: ABS Cat. No. 6202.0
DEPARTMENT OF TRADE, BUSINESS AND INNOVATION Page 6 of 17September 2018

Northern Territory economy quick facts - September quarter 2018
Source: ABS Cat. No. 6202.0
Source: ABS Cat. No. 6291.0.55.003
PricesThe consumer price index continues to remain at low levels.
Over the year to September 2018, the Darwin consumer price index (CPI) increased 1.3% compared to an increase of 0.6% in the same period last year. Over the year, the categories with the largest increases were Transportation (up by 6.7%); Tobacco and alcohol (up by 6.2%); Education (up by 4.5%); and Financial services (up by 3.4%), while decreases were reported in Communication (down by 4.5%); Furnishings, household equipment and services (down by 1.8%); Housing (down by 1.2%); and Clothing and footwear (down by 0.6%). Darwin’s CPI is lower than the national average of 1.9%.
In the September quarter 2018, Darwin’s CPI increased by 0.6%. CPI categories that contributed in the quarter included Recreation and culture (0.43 percentage points); Tobacco and alcohol (0.09 percentage points); Transportation (0.09 percentage points); and Food and non-alcoholic beverages (0.05 percentage points). Categories that detracted in the quarter included Furnishings, household equipment and services (-0.11 percentage points); Communication (-0.05 percentage points), and Clothing and footwear (-0.03 percentage points).
The Reserve Bank of Australia’s (RBA) measure of the national annual underlying inflation (core inflation) increased by 1.8% in the September quarter 2018 compared to the September quarter 2017, lower than the RBA’s target inflation range of 2-3%.
Source: ABS Cat. No. 6401.0
Source: ABS Cat. No. 6401.0
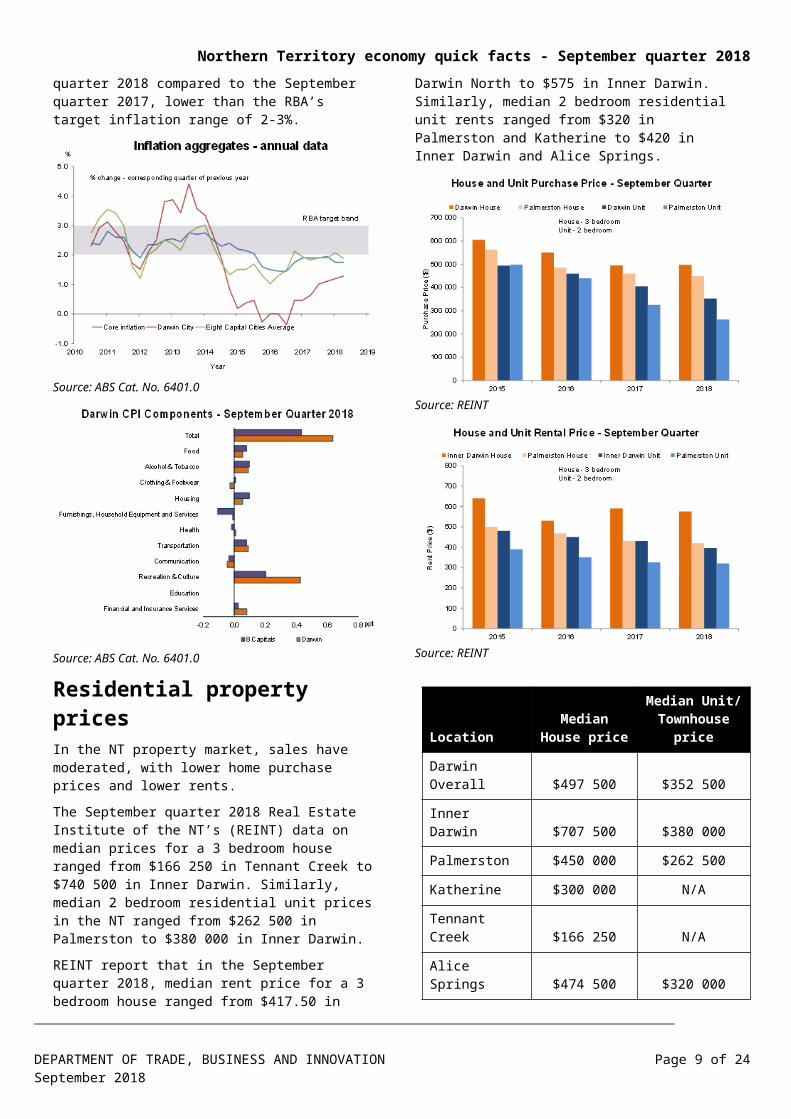
Residential property pricesIn the NT property market, sales have moderated, with lower home purchase prices and lower rents.
The September quarter 2018 Real Estate Institute of the NT’s (REINT) data on median prices for a 3 bedroom house ranged from $166 250 in Tennant Creek to $740 500 in Inner Darwin. Similarly, median 2 bedroom residential unit prices in the NT ranged from $262 500 in Palmerston to $380 000 in Inner Darwin.
REINT report that in the September quarter 2018, median rent price for a 3 bedroom house ranged from $417.50 in Darwin North to $575 in Inner Darwin. Similarly, median 2 bedroom residential unit rents ranged from $320 in Palmerston and Katherine to $420 in Inner Darwin and Alice Springs.
DEPARTMENT OF TRADE, BUSINESS AND INNOVATION Page 7 of 17September 2018
Northern Territory economy quick facts - September quarter 2018
Source: REINT
Source: REINT
LocationMedian House
price
Median Unit/ Townhouse
price
Darwin Overall $497 500 $352 500
Inner Darwin $707 500 $380 000
Palmerston $450 000 $262 500
Katherine $300 000 N/A
Tennant Creek $166 250 N/A
Alice Springs $474 500 $320 000
The property price index (PPI - established house price and attached house price) produced by ABS for Australian capital cities, show that for the June quarter 2018, Darwin PPI decreased by 0.9%, while nationally the PPI decreased by 0.7%.
IncomeThe average weekly earnings and wage price index measure different but related concepts. Average weekly earnings captures the current average value of wages and salaries paid to employees. Wage price index measures changes in wages and salaries paid by employees for a unit of labour where the quality and quantity of labour are not considered and is designed to measure inflationary pressures on wages and salaries.
Average weekly earnings have steadily increased over time, however, the rate of growth has fluctuated. In annual terms the average weekly full time adult earnings (AWFTE) in the NT increased by 0.6% in the six month period to May 2018 to $1817, compared to the national weekly earnings of $1653. The NT has the third highest AWFTE among Australian jurisdictions, behind ACT ($1848) and WA ($1824).
Over the year, the AWFTE for males in the NT increased by 2.6% to $2067 and for females it increased by 3.9% to $1521. A substantial difference between male and female wage levels exists - both in the NT and at the national level.
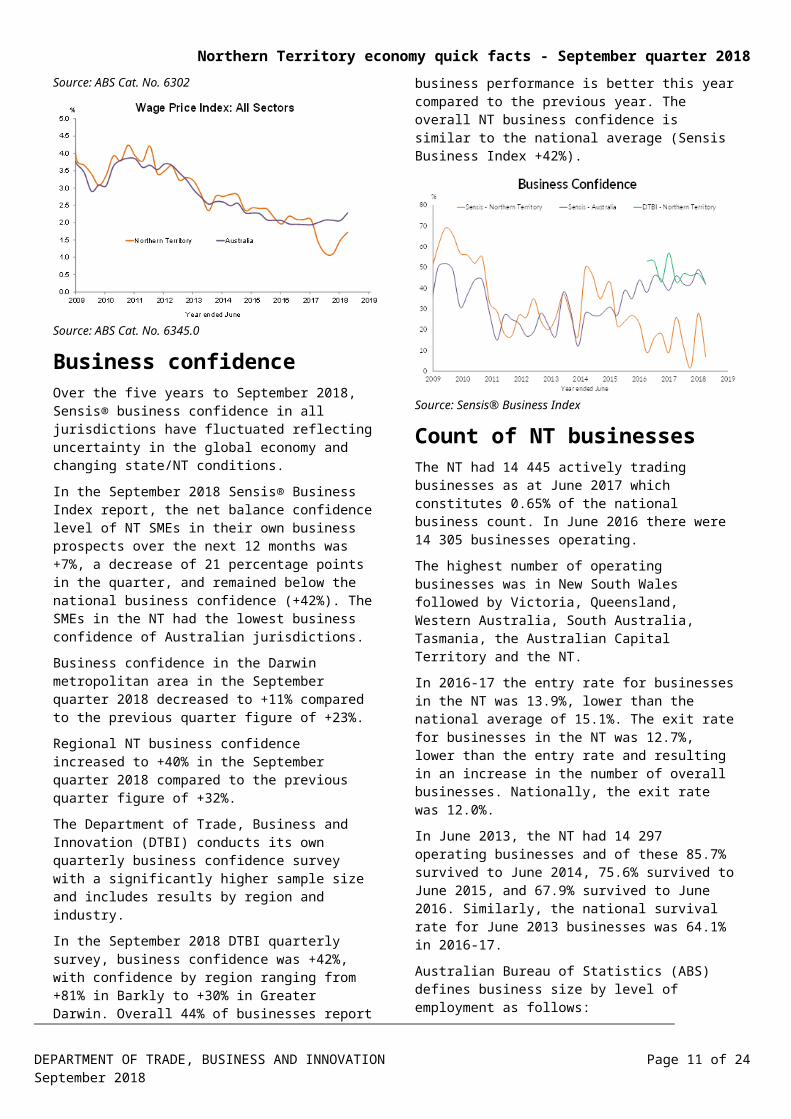
In annual terms to September 2018, the growth in the WPI, increased by 1.7% in the NT. Nationally, the growth in the WPI was 2.3% in the same period.
Source: ABS Cat. No. 6302
Source: ABS Cat. No. 6345.0
DEPARTMENT OF TRADE, BUSINESS AND INNOVATION Page 8 of 17September 2018
Northern Territory economy quick facts - September quarter 2018
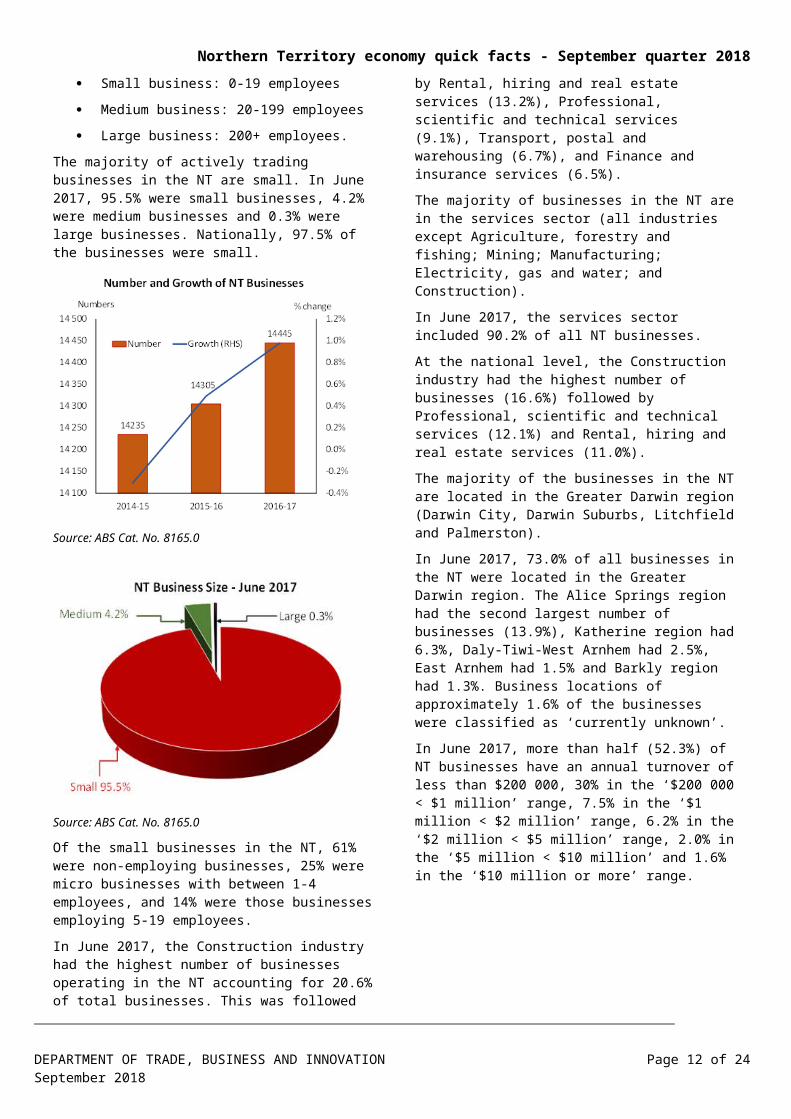
Business confidenceOver the five years to September 2018, Sensis® business confidence in all jurisdictions have fluctuated reflecting uncertainty in the global economy and changing state/NT conditions.
In the September 2018 Sensis® Business Index report, the net balance confidence level of NT SMEs in their own business prospects over the next 12 months was +7%, a decrease of 21 percentage points in the quarter, and remained below the national business confidence (+42%). The SMEs in the NT had the lowest business confidence of Australian jurisdictions.
Business confidence in the Darwin metropolitan area in the September quarter 2018 decreased to +11% compared to the previous quarter figure of +23%.
Regional NT business confidence increased to +40% in the September quarter 2018 compared to the previous quarter figure of +32%.
The Department of Trade, Business and Innovation (DTBI) conducts its own quarterly business confidence survey with a significantly higher sample size and includes results by region and industry.
In the September 2018 DTBI quarterly survey, business confidence was +42%, with confidence by region ranging from +81% in Barkly to +30% in Greater Darwin. Overall 44% of businesses report business performance is better this year compared to the previous year. The overall NT business confidence is similar to the national average (Sensis Business Index +42%).
Source: Sensis® Business Index
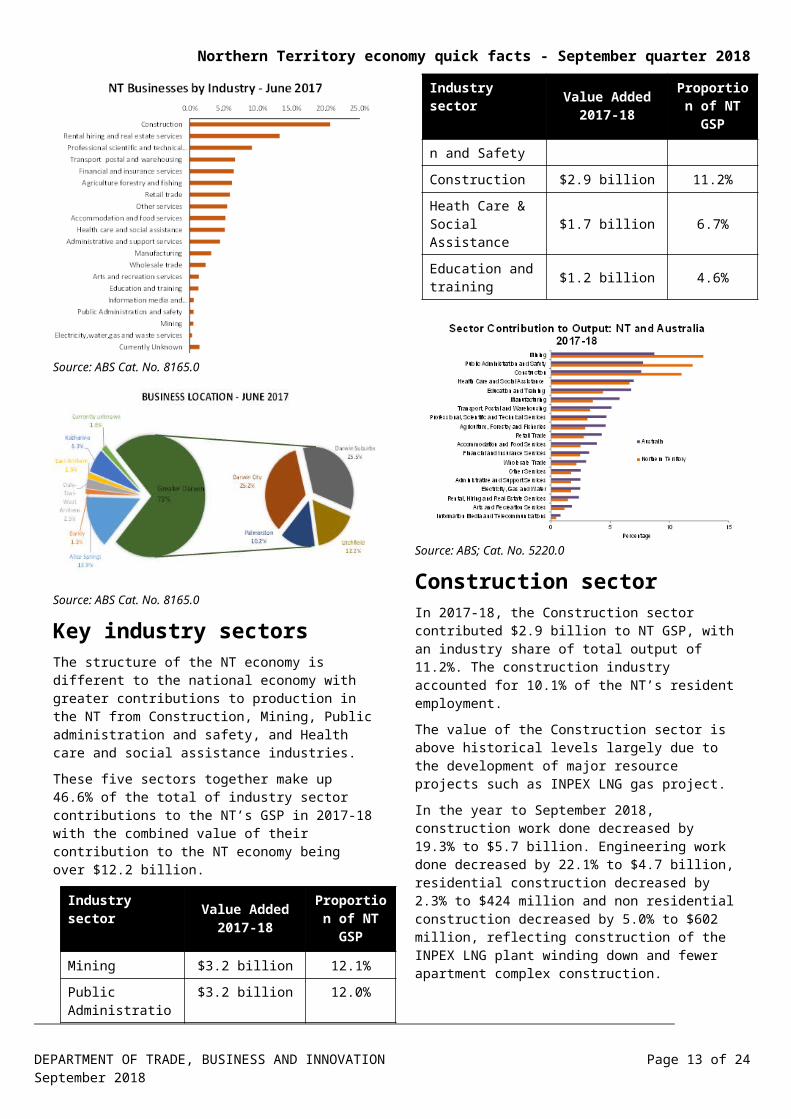
Count of NT businessesThe NT had 14 445 actively trading businesses as at June 2017 which constitutes 0.65% of the national business count. In June 2016 there were 14 305 businesses operating.
The highest number of operating businesses was in New South Wales followed by Victoria, Queensland, Western Australia, South Australia, Tasmania, the Australian Capital Territory and the NT.
In 2016-17 the entry rate for businesses in the NT was 13.9%, lower than the national average of 15.1%. The exit rate for businesses in the NT was 12.7%, lower than the entry rate and resulting in an increase in the number of overall businesses. Nationally, the exit rate was 12.0%.
In June 2013, the NT had 14 297 operating businesses and of these 85.7% survived to June 2014, 75.6% survived to June 2015, and 67.9% survived to June 2016. Similarly, the national survival rate for June 2013 businesses was 64.1% in 2016-17.
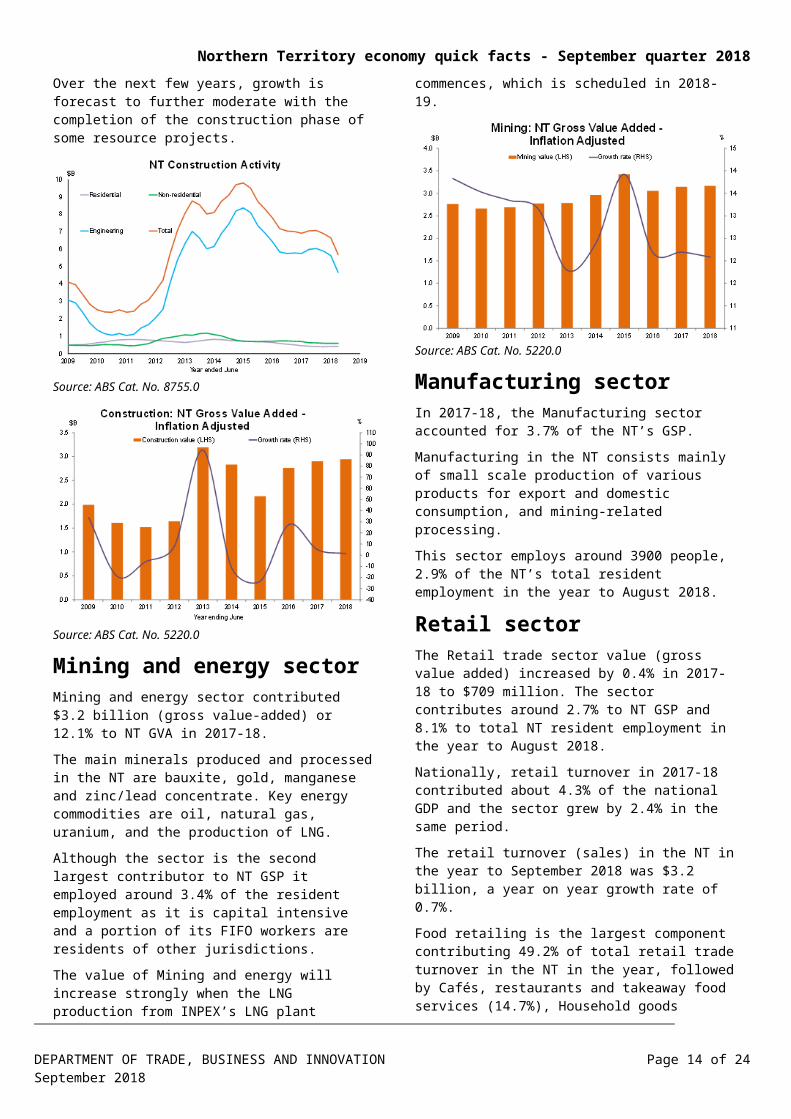
Australian Bureau of Statistics (ABS) defines business size by level of employment as follows:
Small business: 0-19 employees
Medium business: 20-199 employees
Large business: 200+ employees.
The majority of actively trading businesses in the NT are small. In June 2017, 95.5% were small businesses, 4.2% were medium businesses and 0.3% were large businesses. Nationally, 97.5% of the businesses were small.
Source: ABS Cat. No. 8165.0
Source: ABS Cat. No. 8165.0
DEPARTMENT OF TRADE, BUSINESS AND INNOVATION Page 9 of 17September 2018

Northern Territory economy quick facts - September quarter 2018
Of the small businesses in the NT, 61% were non-employing businesses, 25% were micro businesses with between 1-4 employees, and 14% were those businesses employing 5-19 employees.
In June 2017, the Construction industry had the highest number of businesses operating in the NT accounting for 20.6% of total businesses. This was followed by Rental, hiring and real estate services (13.2%), Professional, scientific and technical services (9.1%), Transport, postal and warehousing (6.7%), and Finance and insurance services (6.5%).
The majority of businesses in the NT are in the services sector (all industries except Agriculture, forestry and fishing; Mining; Manufacturing; Electricity, gas and water; and Construction).
In June 2017, the services sector included 90.2% of all NT businesses.
At the national level, the Construction industry had the highest number of businesses (16.6%) followed by Professional, scientific and technical services (12.1%) and Rental, hiring and real estate services (11.0%).
The majority of the businesses in the NT are located in the Greater Darwin region (Darwin City, Darwin Suburbs, Litchfield and Palmerston).
In June 2017, 73.0% of all businesses in the NT were located in the Greater Darwin region. The Alice Springs region had the second largest number of businesses (13.9%), Katherine region had 6.3%, Daly-Tiwi-West Arnhem had 2.5%, East Arnhem had 1.5% and Barkly region had 1.3%. Business locations of approximately 1.6% of the businesses were classified as ‘currently unknown’.
In June 2017, more than half (52.3%) of NT businesses have an annual turnover of less than $200 000, 30% in the ‘$200 000 < $1 million’ range, 7.5% in the ‘$1 million < $2 million’ range, 6.2% in the ‘$2 million < $5 million’ range, 2.0% in the ‘$5 million < $10 million’ and 1.6% in the ‘$10 million or more’ range.
Source: ABS Cat. No. 8165.0
Source: ABS Cat. No. 8165.0
Key industry sectorsThe structure of the NT economy is different to the national economy with greater contributions to production in the NT from Construction, Mining, Public administration and safety, and Health care and social assistance industries.
These five sectors together make up 46.6% of the total of industry sector contributions to the NT’s GSP in 2017-18 with the combined value of their contribution to the NT economy being over $12.2 billion.
Industry sector Value Added 2017-18
Proportion of NT GSP
Mining $3.2 billion 12.1%
Public Administration and Safety
$3.2 billion 12.0%
Construction $2.9 billion 11.2%
Heath Care & Social Assistance $1.7 billion 6.7%
Education and training $1.2 billion 4.6%
Source: ABS; Cat. No. 5220.0
DEPARTMENT OF TRADE, BUSINESS AND INNOVATION Page 10 of 17September 2018
Northern Territory economy quick facts - September quarter 2018
Construction sectorIn 2017-18, the Construction sector contributed $2.9 billion to NT GSP, with an industry share of total output of 11.2%. The construction industry accounted for 10.1% of the NT’s resident employment.
The value of the Construction sector is above historical levels largely due to the development of major resource projects such as INPEX LNG gas project.
In the year to September 2018, construction work done decreased by 19.3% to $5.7 billion. Engineering work done decreased by 22.1% to $4.7 billion, residential construction decreased by 2.3% to $424 million and non residential construction decreased by 5.0% to $602 million, reflecting construction of the INPEX LNG plant winding down and fewer apartment complex construction.
Over the next few years, growth is forecast to further moderate with the completion of the construction phase of some resource projects.
Source: ABS Cat. No. 8755.0
Source: ABS Cat. No. 5220.0
Mining and energy sectorMining and energy sector contributed $3.2 billion (gross value-added) or 12.1% to NT GVA in 2017-18.
The main minerals produced and processed in the NT are bauxite, gold, manganese and zinc/lead
concentrate. Key energy commodities are oil, natural gas, uranium, and the production of LNG.
Although the sector is the second largest contributor to NT GSP it employed around 3.4% of the resident employment as it is capital intensive and a portion of its FIFO workers are residents of other jurisdictions.
The value of Mining and energy will increase strongly when the LNG production from INPEX’s LNG plant commences, which is scheduled in 2018-19.
Source: ABS Cat. No. 5220.0
Manufacturing sectorIn 2017-18, the Manufacturing sector accounted for 3.7% of the NT’s GSP.
Manufacturing in the NT consists mainly of small scale production of various products for export and domestic consumption, and mining-related processing.
This sector employs around 3900 people, 2.9% of the NT’s total resident employment in the year to August 2018.
Retail sectorThe Retail trade sector value (gross value added) increased by 0.4% in 2017-18 to $709 million. The sector contributes around 2.7% to NT GSP and 8.1% to total NT resident employment in the year to August 2018.
Nationally, retail turnover in 2017-18 contributed about 4.3% of the national GDP and the sector grew by 2.4% in the same period.
The retail turnover (sales) in the NT in the year to September 2018 was $3.2 billion, a year on year growth rate of 0.7%.
Food retailing is the largest component contributing 49.2% of total retail trade turnover in the NT in the year, followed by Cafés, restaurants and takeaway food services (14.7%), Household goods retailing (14.6%), and Clothing, footwear and personal accessories (5.5%).
The growth in NT retail turnover is expected to be subdued in the short term, largely reflecting softening population growth in the NT.
DEPARTMENT OF TRADE, BUSINESS AND INNOVATION Page 11 of 17September 2018
Northern Territory economy quick facts - September quarter 2018
The Wholesale trade sector contributed $556 million or about 2.1% of the NT GSP.
Source: ABS Cat. No. 5220.0
Agriculture, forestry and fishing (rural industries)Key agricultural commodities include livestock, horticulture produce and fisheries.
The key livestock commodities of the NT include cattle, buffaloes and crocodiles. In the horticultural sector the main commodities include fruit (mangos, melons, bananas and pineapples), Asian vegetables, and plant nursery products. The fishing sector includes commercial, recreational and traditional indigenous fishing. The commercial fishing sector includes wild catch fish (such as barramundi, snapper, and shark), crustaceans (mainly prawns and mud crabs) and aquaculture (pearls). Forestry includes sandalwood and African Mahogany production.
Agriculture, fishing and forestry contributed $735 million (inflation adjusted), about 2.8% to the value of NT GSP in 2017-18.
Cattle production is the largest component of agricultural, forestry and fishing. The key markets for NT cattle are interstate markets (for further growing or slaughter) and live exports overseas (mainly Indonesia). The estimated gross value of cattle production is expected to moderate as demand from Asian markets continues to decline, partly due to higher Australian beef prices.
Horticultural production continues to recover from a downturn due to banana freckle and the cucumber green mottle mosaic virus outbreak affecting melon production. The horticultural products are mainly destined for interstate markets.
Fisheries production in the NT has strong potential in the coming years with the expansion of aquaculture production, e.g. Seafarms’ $1.45 billion Sea Dragon Project.
Source: ABS Cat. No. 5220.0
Source: NT Primary Industries and Fisheries
TourismThe Tourism sector is distributed across a number of Australian and New Zealand Standard Industrial Classification (ANZSIC) industry sectors. The largest industry sectors that directly contribute to tourism gross value added (GVA) in the NT include Accommodation and food services; Transport, postal and warehousing, and Recreation and culture.
In 2017-18, visitor expenditure in the NT was $2.144 billion (Tourism NT).
In 2017-18, the NT had 1 712 000 domestic and international visitors, a decrease of 11.0% compared to the corresponding period a year ago.
Over the next five years, Tourism Research Australia forecast visitor nights in the NT by domestic travellers to increase at an average annual rate of 2.6% while international visitor nights is forecast to increase at an average annual rate of 5.8% over the same period.
Tourism directly employs around 6.7% of the NT employment.
DEPARTMENT OF TRADE, BUSINESS AND INNOVATION Page 12 of 17September 2018
Northern Territory economy quick facts - September quarter 2018
Source: Tourism Research Australia, 2014-15
Goods-producing and service-producing sectorsIn categorising goods and services, dwelling growth is excluded.
The GVA of goods-producing sectors (Agriculture, forestry and fishing, Mining, Manufacturing, Electricity, gas and water, Construction) was $8.2 billion in 2017 18, about 36.6% of all industries.
Service producing sectors’ output (“things you cannot drop on your foot”) was valued at $12.05 billion, contributing 63.4% of NT GSP (ownership of dwellings is excluded from the service-producing sectors).
Business services (those industries that provide non distribution services to other companies) have grown strongly since 2011 and contributed $2.4 billion (9.0%) of NT GSP in 2017-18. Since 2011 business services have grown, on average, by 3.8%. There are however, variations in growth in individual business service sectors.
Source: ABS Cat. No. 5220.0
DEPARTMENT OF TRADE, BUSINESS AND INNOVATION Page 13 of 17September 2018
Northern Territory economy quick facts - September quarter 2018
Investment projects – major project statusProject Company Location Type Under
constructionFID Resource Indicative cost
estimate
Darwin LNG Backfill ConocoPhillips Darwin Brownfield - Backfill
No 2019 LNG To be announced
Northcrest Halikos Darwin New project Yes Yes Land development $300 million
TNG – Metals Processing
TNG Limited Darwin – East Arm
New project No To be announced
Metals Processing - Producing 3 Products Titanium Dioxide; Vanadium Pentoxide and Pig Iron
541 (Stage 1)
Mount Peake TNG Limited 235 kilometres northwest of Alice Springs
New project No To be announced
Production of magnetite concentrate
$207 million (Stage 1)
Nolans Project Arafura Resources 135 kilometres north northwest of Alice Springs
New project No 2018-19 Rare earths and phosphoric acid
$850 million
Mount Todd Vista Gold 56 kilometres northwest of Katherine
Redevelopment No 2018-19 Gold $1 billion
Ammaroo Phosphate
Verdant Minerals 180km South East of Tennant Creek
New project No 2018-19 Phosphate To be confirmed
Jervois Base Metals Project
KGL Resources 270km east north east of Alice Springs
New project No 2018-19 Copper/lead and zinc $216 million
Shell Prelude FLNG Shell Browse Basin New project Yes Yes LNG $12 billion or more
Wonarah Avenira Limited 260 kilometres east of Tennant Creek
New project No To be announced
Superphosphoric acid To be announced
Chandler Salt Mine Tellus Holdings Alice Springs New project No To be announced
Salt (Out)Waste/Record (In)
$676 million
Project Sea Dragon Seafarms Group Gunn Point New project No To be announced
Prawns larvae for Legune
Project Sea Dragon Seafarms Group Bynoe New project No 2018-19 Broodstock for Gunn Point $2.1 billion
DEPARTMENT OF TRADE, BUSINESS AND INNOVATION Page 14 of 17September 2018

Northern Territory economy quick facts - September quarter 2018
Project Company Location Type Under construction
FID Resource Indicative cost estimate
Project Sea Dragon Seafarms Group Legune Station – NT/WA border
New project No 2018-19 Prawns
Bonaparte Gas Project
Neptune Petrel/Tern/Frigate Gas Field (Offshore)
New project No No LNG To be announced
Darwin LNG expansion
ConocoPhillips Darwin Expansion No No LNG To be announced
Bladin Point LNG Expansion (Trains 3-6)
INPEX Holdings Bladin Point Expansion No No LNG To be announced
Source: Bureau of Resources and Energy Economics (BREE), NT ICN and NT Department of, Trade, Business and Innovation
Future major projects – major project statusProject Company Location Type Under
constructionFID Resource Indicative cost
estimate
Bonaparte Gas Project
Neptune Petrel/Tern/Frigate Gas Field (Offshore)
New project No No LNG To be announced
Darwin LNG expansion
ConocoPhillips Darwin Expansion No No LNG To be announced
Bladin Point LNG Expansion (Trains 3-6)
INPEX Holdings Bladin Point Expansion No No LNG To be announced
Source: Bureau of Resources and Energy Economics (BREE), NT ICN and NT Department of, Trade, Business and Innovation
DEPARTMENT OF TRADE, BUSINESS AND INNOVATION Page 15 of 17September 2018

Northern Territory economy quick facts - September quarter 2018
Investment projects – facilitated investment projectsProject Company Location Type Under
constructionFID Resource Indicative cost
estimate
Ichthys LNG Inpex Holdings/ Total Darwin New project Yes Yes LNG $34 billion
Westin Hotel Landbridge Darwin New project No Yes Other – hotel $200 million
Northern Gas Pipeline
Jemena Tennant Creek – Mount Isa
New project Yes Yes Gas pipeline $800 million
Darwin Water Theme Park
To be announced Darwin New projects No No Other – Theme Park $50 million or more
Darwin Shiplift PMA Darwin New project No No Infrastructure $100 million or more
Seniors Lifestyle Accommodation
TBD Darwin rural New project No No Other To be announced
Seniors Lifestyle Accommodation
TBD Darwin New project No No Other To be announced
Seniors Lifestyle Accommodation
TBD Alice Springs New project No No Other To be announced
Future projects – facilitated investment projectsProject Company Location Type Under
constructionFID Resource Indicative cost
estimate
Mount Isa – Tennant Creek Railway
To be announced Mount Isa – Tennant Creek
New project No No Infrastructure $3 billion - $4 billion
Ord Stage 3 To be announced WA-NT border Expansion No No Infrastructure To be announced
Alice Springs Tourism Commercial
To be announced Alice Springs New project No No Other To be announced
DEPARTMENT OF TRADE, BUSINESS AND INNOVATION Page 16 of 17September 2018

Northern Territory economy quick facts - September quarter 2018
Regional labour markets, population and income
Region1 Labour forceJun Qtr 2018
UnemploymentJun Qtr 2018
Unemployment rate (%)
Jun Qtr 2018
Population2016-17
Median weekly
household income 2016
($)1
Greater Darwin 87,611 3,151 4.0 146,612 2,1832
Darwin city 19,327 509 2.7 28,067 2,320
Darwin suburbs 33,490 1,397 5.0 57,102 2,075
Litchfield 15,667 330 2.3 25,037 2,219
Palmerston 19,127 915 5.8 36,406 2,199
Alice Springs 23,982 959 5.6 39,548 1,715
Barkly 3,001 220 8.2 6,203 1,366
Daly-Tiwi-West Arnhem 8,357 677 9.3 18,152 1,134
East Arnhem 6,776 402 5.4 14,748 1,944
Katherine 11,586 552 6.4 20,842 1,485
Source: ABS Cat. No. 3218.0, 5673.0.55.003, and Department of Employment, Census 2016 on Population and Housing 1. Statistical Area Level 3 (SA3)2. Greater Capital City Statistical Area (GCCSA)
Data sources
Australian Bureau of Statistics, catalogue numbers 3101.0, 6202.0, 6220.0, 6291.0.55.003, 6302.0, 6345.0, 6354.0Department of Social Services (Australian Government)Department of Trade, Business and Innovation – Business Confidence Survey
Enquiries
Strategic Policy and Research, Department of Trade, Business and InnovationEmail: [email protected]
Disclaimer
The Northern Territory of Australia gives no warranty of assurance, and makes no representation as to the accuracy of any information or advice contained in this publication, or that it is suitable for your intended use. You should not rely upon information in this publication for the purpose of making any serious business or investment decisions without obtaining independent, professional advice in relation to your particular situation.
DEPARTMENT OF TRADE, BUSINESS AND INNOVATION Page 17 of 17September 2018