north south rail link context review - welcome to massdot€¦ · this document identifies the...
TRANSCRIPT

NORTH SOUTH RAIL LINK FEASIBILITY
REASSESSMENT
Context Review Technical Memorandum
January 18, 2018

1 Purpose of Document and Summary
This document identifies the major changes in the North South Rail Link’s (NSRL) context since
the Draft Environmental Impact Report (DEIR) was completed in 2003. It examines changes in
engineering, technology, development, demographics and ridership that could have an effect on
the NSRL’s feasibility, and lays out Design Criteria, Study Objectives and Guiding Principles to
shape the development of new alternatives and service plans for the NSRL.
The reassessment of the major components of the 2003 NSRL DEIR has revealed the following
significant changes:
Advances in tunneling technology since 2003 mean that Tunnel Boring Machines (TBMs)
are now able to bore larger tunnel diameters and reduce the extent of mitigation needed to
building foundations to avoid settlement damage
FRA-compliant locomotives and electric multiple units are considered necessary for use
across the network
Modern signaling systems can allow for a greater number of trains to travel through the
tunnel (subject to constraints on the rest of the commuter rail network)
Flood resilience is an increased concern for NSRL portals and stations, and should be
incorporated into any proposed design
Significant development along the proposed NSRL alignment since 2003 has resulted in
some conflicts which will need to be mitigated
Commuter rail ridership has declined since 2009, and the most recent figures (National
Transit Database from 2015) are only half of what was projected in the DEIR
Population and employment in the region, while growing, are also progressing slower than
DEIR forecasts

Full-page maps and figures are included at the end of the memo, as well as a list of definitions.
The technical memo is organized as follows:
Section 2 – Summary of Previous Studies
Section 3 – Technology and Regulatory Environment
Section 4 – Engineering Assumptions
Section 5 – Design Criteria
Section 6 – Tunnel Portal Locations
Section 7 – New Development Along the NSRL Corridor
Section 8 – Amtrak and MBTA Commuter Rail Ridership Trends
Section 9 – Demographic Trends
Section 10 – Desired End State
Section 11 – Conclusion
Appendix 1 – Dual-Mode Locomotive Report
Appendix 2 – Proposed Design Criteria Document
Appendix 3 – List of Definitions
Appendix 4 – Methodology – Demographics
Appendix 5 – Project Principles and Objectives
Appendix 6 – Figures and Maps, Part I
Appendix 7 – Figures and Maps, Part II

2 Summary of Previous Studies
While a rail tunnel between North and South Stations had been considered since 1909, the modern
concept of the NSRL was first introduced in 1972 as part of the Boston Transportation Planning
Review’s Central Artery Report. This masterplan proposed a two-track rail tunnel alongside the
Central Artery road tunnel, but the rail connection was eventually eliminated in order to secure
federal funding for the highway component of the larger project.
In 1993, the Secretary of the Massachusetts Executive Office of Transportation and Construction
(EOTC) convened the Central Artery Rail Link task force to study the feasibility of the rail tunnel
using the Central Artery alignment. In its final report, the task force recommended the construction
of the rail tunnel with first two tracks, and then four in a further phase, and three downtown stations
(North Station, South Station and State Street).
A number of studies developed by organizations outside of state government followed, proposing
that a more thorough examination of engineering and environmental impact be conducted. To
satisfy these requests for further study, the Massachusetts Bay Transportation Authority (MBTA),
FTA, the Massachusetts Highway Department, Amtrak and EOTC partnered on a Major
Investment Study/Draft Environmental Impact Report (MIS/DEIR), released in June of 2003. The
study identified a No-Build scenario as well as a Build Alternative with multiple variants,
accounting for different numbers of tracks, locations of south portals, number of stations, and
alignment of the southern section of tunnel. The following variants were evaluated for financial
feasibility, effectiveness, and equity measures:
Two-Track (Back Bay portal) / Two-Station
Two-Track (Back Bay portal) / Three-Station
Two-Track (South Bay portal) / Two-Station
Two-Track (South Bay portal) / Three-Station
Four-Track / Two-Station
Four-Track / Three-Station
The context (planning, environmental and engineering) the DEIR established provides the base
case against which this reassessment is being conducted. Other documents reviewed for this
feasibility reassessment include:
1996 Schematic Design Report (Technical Report #3)
1997 Operations Study (Technical Report #5)
1997 Economic Briefing Paper (Technical Report #8)
Other 1995-1997 Technical Memoranda
Materials from the Central Artery Rail Link Task Force process
Constructability Peer Review Report
The reassessment also takes account of contemporaneous planning and policy documents such as
the MBTA’s Focus40 planning process, the MBTA 2017–2021 Capital Investment Plan, the

Metropolitan Area Planning Council’s (MAPC) Metro Future (30-year plan), the Boston Region
Metropolitan Planning Organization’s Long-Range Transportation Plan, and Go Boston 2030.
3 Technology and Regulatory Environment
This section examines changes in technology or regulation that could affect the construction and
design of the NSRL. These various changes are discussed in more detail below.
3.1 Tunneling methods
3.1.1 TBM diameter
The majority of the tunnels would be constructed using Tunnel Boring Machines (TBMs), which
have developed in both capability and technology over the last four decades. At the time the 1997
NSRL Technical Report No.3: Schematic Design Report was prepared, the Constructability Peer
Review Committee report noted that “a tunnel boring machine of 41-foot diameter has not yet been
constructed to date”. While this was not strictly true, as maximum TBM diameters had reached
46’-6” by 1997, it was certainly the case that TBMs of this diameter were relatively new
technology at the time. Since then, progressively larger TBM diameters have been used, up to the
current maximum of 57’-6” in soft ground (both for the SR-99 Alaskan Way Tunnel in Seattle and
the Tuen Mun to Chep Lak Kok connection in Hong Kong), and up to a maximum of 51’-3” in
rock (Italian Motorway Pass A1). The maximum diameter of hard rock TBMs has lagged behind
soft ground due to the higher forces required to excavate rock tunnels. However, as shown in
Figure 3.1, a 41’-0” diameter TBM would now be well within the range of common practice for
both soil and rock tunnels.
3.1.2 TBM tunneling below groundwater pressure
TBM technology has also improved the ability to excavate tunnels under high groundwater
pressures. As shown in Figure 3.2, tunnels have been excavated under steadily increasing external
water pressures over the last several decades up to a current maximum of 14 bar (203 psi;
equivalent to around 430ft of water depth). This is significantly in excess of what would be
required for construction of the NSRL tunnels.
3.1.3 TBM settlement control
The amount of settlement that is caused by TBM tunneling has steadily reduced over the last two
decades, due to the increased sophistication of TBM control systems and rapid development of
chemical conditioners to control the excavated material. This method of control has been
demonstrated on multiple projects, including:
Central Subway, San Francisco, where two new tunnels were excavated in soft ground 11
feet below and perpendicular to the existing BART tunnels, with minimum settlement and
no interruption to train service.
Crossrail, London, where in a location that became known as the "Eye of the Needle", the
new tunnel was excavated over existing Northern line tunnels and under an escalator
tunnel, with less than three feet of clearance above and 1.5 feet below, with no damage to
existing tunnels.

This increased level of control is likely to reduce the extent of mitigation needed to building
foundations to avoid settlement damage. This is discussed in Section 4 in more detail.
When the DEIR was prepared, one critical aspect that may not have been fully taken into account
was that TBM technology is not very good at dealing with ‘mixed face’ locations where the ground
changes from soil to rock. This is due to the large difference in the strength and stiffness of the
ground between the soil and rock. Without mitigation measures, there is a tendency to over-
excavate the overlying soil, leading to surface settlement, and in the worst case, the development
of sinkholes. This issue has been documented in a number of technical papers, including Shirlaw,
J.N. and Boone, S. Australian Tunnelling Conference 2005 - The risk of very large settlements due
to EPB tunnelling. The problem can be avoided using ground improvement such as grouting to
increase the strength and stiffness of the soil, but this requires access from the surface.
Sometimes, excavations for station structures can be located at these interfaces, and the TBM does
not have to pass through this mix of soil and rock. Understanding where the interface locations
occur along the alignment are important so that it can be verified that there is suitable access for
ground improvement or so that station structures can be appropriately positioned. A preliminary
evaluation of the elevation of the top of rock along the NSRL Dorchester Avenue alignment has
been conducted and is shown in Figure 3.3. This shows that there are two locations where the
alignment enters mixed face conditions along the TBM tunnel alignment. At the beginning of the
TBM drives from the north portal, the tunnel would start in a mixed face condition which would
continue for around 700 feet. This would best be mitigated by a combination of lowering the
alignment by five to ten feet, extending the length of cut-and-cover, and/or by ground treatment.
Just north of South Station there is a 1000- to 1500-foot length of mixed face tunneling, which
would be best avoided by lowering the alignment by approximately 15 feet over this section.
3.2 Vehicles
The previous study recommended the use of dual-mode locomotives allowing electric operations
within the tunnel and any other electrified areas and diesel mode where electrification is not
available. This would allow the existing MBTA coach fleet to be utilized through the tunnel.
3.2.1 Dual-mode locomotives
A detailed memorandum has been prepared on the experience, applicability and cost of dual-mode
locomotives (including fire and life-safety requirements) and this has been attached as an
appendix.
The 2003 study recommended the use of dual-mode locomotives, allowing electric operations
within the tunnel and any other electrified areas, and diesel mode where electrification is not
available. This would allow the existing MBTA coach fleet to be utilized through the tunnel.
Recent examples of dual-mode locomotives (specifically in North America, the ALP-45DP) have
shown that they can offer performance in diesel and electric mode similar to that of single-mode
diesel locomotives and electric locomotives, respectively. While capital costs can generally be
expected to be greater for a dual-mode locomotive than for an equivalent diesel locomotive, dual-
mode locomotives generally have maintenance costs comparable to single-mode diesel
locomotives and significantly lower operating costs when operating in electric mode than when
operating in diesel mode (see Table 5).
In terms of operations, some current dual-mode locomotives can change modes (between diesel
operation and electric operation) while in motion, while others must be stopped to complete the
change. Stationary mode changes, when required, typically take less than two minutes to complete
and can be completed during station stops — the mode change itself can have little impact on
overall run time.
In the near future, dual-mode locomotives may be unnecessary — fully electric battery vehicles,
supplemented with some sections of electrified territory, will likely be available and viable.
Batteries and ultracapacitors, which have begun to be tested by railroads in North America and
worldwide, have potential to lower the emissions of rail systems. While still in the early stages,
these technologies are expected to continue to improve considerably in the coming years, bringing
down prices and improving their economic feasibility.
Battery technology has been examined for use in freight locomotives to reduce diesel fuel
consumption. One study forecasts “up to a 25 percent reduction in diesel fuel consumption and
[greenhouse gases]…and zero exhaust emissions for a significant portion of operations in and
around railyards while in lower power settings.”20 However, current battery technologies lack the
energy density to fully power freight interstate line-haul locomotives over long distances and under
extreme duty cycles.
Given that limitation, battery tender railcars appear to be a promising technology in the mid-term.
These cars could be placed in trainsets immediately behind a locomotive to power it through
environmentally sensitive areas. In addition to having zero onboard emissions, the battery-tender-
car concept would also have the specific advantage of being compatible with existing electric
locomotives.
Battery component costs are forecast to decrease by two-thirds between 2012 and 2030, which is
expected to minimize the differences in cost between conventional diesel locomotives and near-
zero or zero-emission locomotives. However, battery tender technology remains in the conceptual
stage, and additional research will be needed to assess its feasibility for the NSRL project.
3.2.2 Rail vehicle static end strength
"49 CFR 238.203 - Static end strength" is the section of the federal regulations relating to static
end strength (or buff strength, as it is generally referred to). This requires all passenger equipment
to resist a static end load of 800,000 pounds without permanent deformation of the body structure.
These requirements are unchanged since introduced in 1999.
Although waivers are available under certain circumstances to use rolling stock designed with
crash energy management, these typically require temporal separation from freight trains, which
is not implementable on the local network. Therefore, FRA-compliant locomotives and electric
multiple units are considered necessary for use across the network.
The FRA has circulated a notice of proposed rulemaking (NPRM) to amend its regulations for
passenger equipment safety standards (docket no. 4910-06-P). This would establish alternative

crashworthiness and occupant protection performance requirements to those currently specified
for Tier I passenger trainsets.
The FRA published a report in 2011 – Technical Criteria and Procedures for Evaluating the
Crashworthiness and Occupant Protection Performance of Alternatively Designed Passenger Rail
Equipment for Use in Tier I Service – which established guidance for evaluation of waivers to the
existing crashworthiness standards. This alternative criterion would be codified into the FRA
regulations if adopted, removing the need for waivers, but not changing the undermining
requirements for Tier I crashworthiness.
3.3 Fire and life-safety requirements
The National Fire Protection Association (NFPA) 130 guidance for fixed guideway transit and
passenger rail systems has changed in numerous relevant areas since the 2003 DEIR, including:
Technical revisions to the egress requirements and calculations for stations;
[Expanded] Use of escalators in the means of egress;
Power supply to tunnel ventilation systems;
Elevators to be counted as contributing to the means of egress in stations;
Technical revisions relating to escalators, doors, gates, and turnstile-type fare equipment;
Enclosed stations are now required to be equipped with a fire alarm system, and enclosed
stations and trainways (tunnels) are now required to be equipped with an emergency
communication system; and
Guidance on establishing noise levels in order to maintain a minimum level of speech
intelligibility through the emergency communication system.
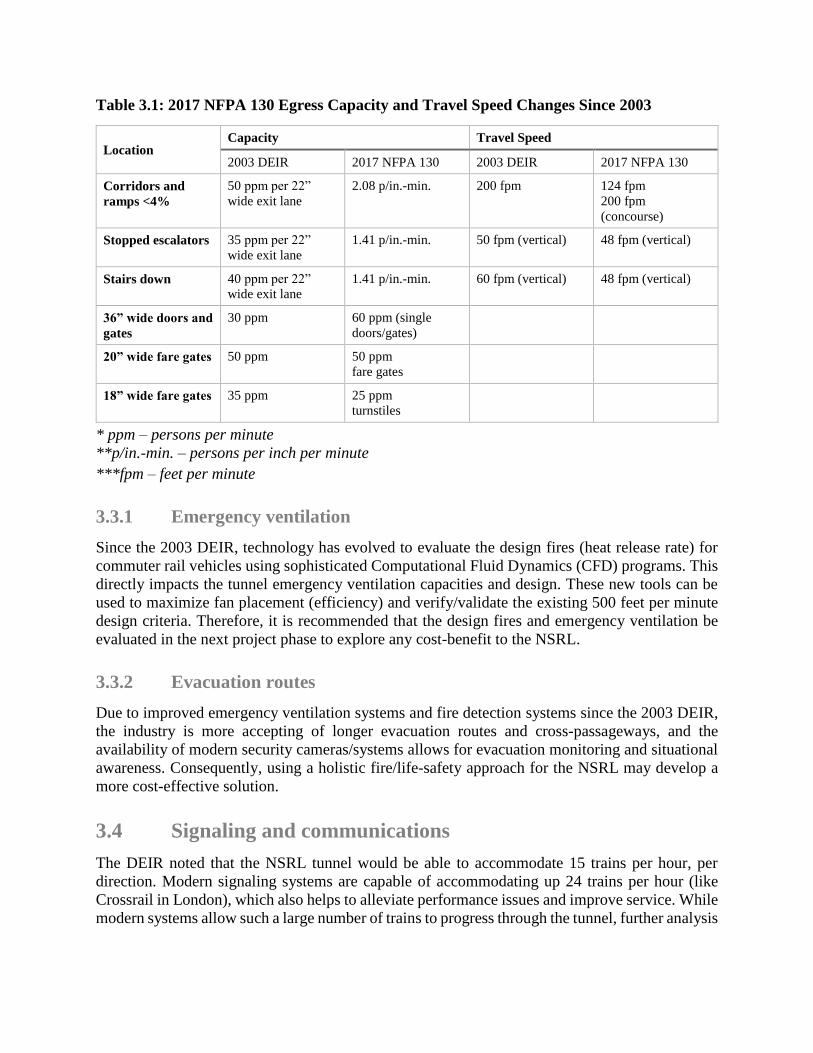
Table 3.1: 2017 NFPA 130 Egress Capacity and Travel Speed Changes Since 2003
Location Capacity Travel Speed
2003 DEIR 2017 NFPA 130 2003 DEIR 2017 NFPA 130
Corridors and
ramps <4%
50 ppm per 22”
wide exit lane
2.08 p/in.-min. 200 fpm 124 fpm
200 fpm
(concourse)
Stopped escalators 35 ppm per 22”
wide exit lane
1.41 p/in.-min. 50 fpm (vertical) 48 fpm (vertical)
Stairs down 40 ppm per 22”
wide exit lane
1.41 p/in.-min. 60 fpm (vertical) 48 fpm (vertical)
36” wide doors and
gates
30 ppm 60 ppm (single
doors/gates)
20” wide fare gates 50 ppm 50 ppm
fare gates
18” wide fare gates 35 ppm 25 ppm
turnstiles
* ppm – persons per minute
**p/in.-min. – persons per inch per minute
***fpm – feet per minute
3.3.1 Emergency ventilation
Since the 2003 DEIR, technology has evolved to evaluate the design fires (heat release rate) for
commuter rail vehicles using sophisticated Computational Fluid Dynamics (CFD) programs. This
directly impacts the tunnel emergency ventilation capacities and design. These new tools can be
used to maximize fan placement (efficiency) and verify/validate the existing 500 feet per minute
design criteria. Therefore, it is recommended that the design fires and emergency ventilation be
evaluated in the next project phase to explore any cost-benefit to the NSRL.
3.3.2 Evacuation routes
Due to improved emergency ventilation systems and fire detection systems since the 2003 DEIR,
the industry is more accepting of longer evacuation routes and cross-passageways, and the
availability of modern security cameras/systems allows for evacuation monitoring and situational
awareness. Consequently, using a holistic fire/life-safety approach for the NSRL may develop a
more cost-effective solution.
3.4 Signaling and communications
The DEIR noted that the NSRL tunnel would be able to accommodate 15 trains per hour, per
direction. Modern signaling systems are capable of accommodating up 24 trains per hour (like
Crossrail in London), which also helps to alleviate performance issues and improve service. While
modern systems allow such a large number of trains to progress through the tunnel, further analysis
on other constraints on the commuter rail network still needs to be completed before a baseline
can be established for this reassessment.
A major change to the regulatory environment since the previous study was published in 2003 is
the introduction of the Rail Safety Improvement Act of 2008 (RSIA). Among other things, this
mandated that Positive Train Control (PTC) be implemented across a significant portion of the
nation's rail industry by December 31, 2015 (subsequently extended to December 2018 with the
potential for further extensions to December 2020 under certain circumstances). While the
previous study assumed a modern signaling system for the new infrastructure, this legislation
additionally requires improvements to the existing network.
The MBTA response to this initiative resulted in the award of a contract to deliver a complete PTC
system on the entire commuter rail network. The contract includes design, integration, installation,
testing, commissioning, training, and warranty. The current schedule requires hardware
installation by December 2018, and a fully operating system in place by December 2020.
PTC systems must be designed to prevent
Train-to-train collisions;
Overspeed derailments;
Incursion into an established work zone; and
Movement through a main line switch in the improper position.
Other functions are applicable within the requirements as specific conditions warrant. The PTC
installation is likely to be complete before NSRL construction begins, and so will not have a
significant impact on the project.
3.5 Traction power and catenary systems
It was previously assumed that the tracks in the tunnel would be electrified using an overhead
catenary system (OCS), with the OCS treated as an extension of the electrification carried out
under the Northeast Corridor Improvement Project. The electrification under the 2003 NSRL
project concept would expand from the Back Bay portal to the Regional Transportation Center in
Woburn.
Rigid bar catenary systems could be used to minimize the height required for the OCS and reduce
the tunnel diameter. The clearance between the catenary and the tunnel roof can be as low as
400mm (1’4”). There is limited experience with such systems for extended sections of track both
nationally and globally, so the long term reliability and maintenance implications are not well-
understood.
Such systems claim maximum track speeds of up to 180mph (300kph) with a supply of 25,000
volts AC power.
3.6 Platform screen doors
The majority of new underground rail systems currently in construction utilize platform screen
doors. These have a number of advantages, including improving the ventilation and climate control
of the station (in both operational and emergency conditions), allowing for narrower platforms,
reducing the risk of accidents, improving security by limiting access to the tracks, preventing litter
on the tracks, and improving the overall ambience of the station.
The main disadvantage of platform screen doors is that all rolling stock in use needs to have the
same door locations and spacing. If construction of the tunnel is tied to procurement of new
multiple units or other specific rolling stock, then platform screen doors may be appropriate.

4 Engineering Assumptions
This section reviews engineering assumptions built into the original concept design, including
assessments of the NSRL design concepts.
4.1 Tunnel diameters
The tunnel internal diameters used for the DEIR were 26 feet for a single-track tunnel (29 feet
external), and 38 feet for a twin-track tunnel (41 feet external). Technical Report 3, Section 3.4.1
states that these diameters were developed as follows:
MBTA minimum clearances for new construction on the Northeast Corridor (NEC)
8’-6” side clearance
19’-6” vertical clearance, extending 7’-0” either side of the centerline
2’-6” for catenary wire and supports
For this feasibility reassessment study, MBTA provided details of the train envelope used to
procure and qualify the revenue equipment which operates in the MBTA commuter rail
environment. This information is shown in Figure 4.1. This provides a slightly smaller train
envelope that that described above, with a side clearance of just under six feet, and a vertical
clearance of just under 16 feet. As described in Section 3.5, rigid catenaries are also likely to allow
a small reduction in the space allocated for catenary wires and supports.
The DEIR tunnel diameters have also been compared with those developed to construction bid-
level design for the Access to the Region’s Core Trans Hudson Express (THE) tunnels, completed
in 2010. These tunnels would have also formed part of the NEC, conveying Amtrak trains and
double-height New Jersey Transit trains, which have a very similar train envelope to the MBTA
rolling stock. As shown in Figure 4.2, the single-track THE tunnels were designed to be 24’-6”
internal diameter, which included an allowance for supplemental internal ventilation ducts for the
long tunnels under the Hudson River (unlikely to be needed for NSRL). Based on this comparison,
it can be concluded that the diameters included for the single-track tunnels in the DEIR are
adequate, and probably slightly generous. The THE project did not include twin-track tunnels, but
an arrangement has been developed in Figure 4.2 using the single-track tunnel design. This resulted
in an internal diameter of 38’-0”, which is the same as the DEIR design. The arrangement in Figure
4.2 includes an internal wall to provide separation between the two tracks for ventilation and
fire/life safety purposes, which does not appear to have been included in the DEIR configuration.
It would appear that the tunnel diameters used in the DEIR are still adequate, and that there is
potential for a reduction in the diameter of the single-track tunnels.
4.2 Potential underpinning requirements
Where the proposed NSRL excavations for tunnels and stations are under or adjacent to existing
structures, underpinning may be required. Tables 4.1 and 4.2 identify the surface structures and
infrastructure elements identified as potentially impacted. The extent of modifications needed will
range from nothing to underpinning or full replacement (from the DEIR Technical Report 3, 3-6

to 3-8). Most of these properties were identified in the DEIR but there are a few additional
properties from new construction.
The advances in TBM settlement control described in Section 3 mean that it is likely that less
intrusive mitigation work, such as underpinning, would be needed now, compared with twenty
years ago.
Table 4.1: Potentially Impacted Structures – Identified in DEIR
Structure / Infrastructure element Modifications needed
Tremont Street Overpass Impact depends on portal alignment
Shawmut Avenue, Washington Street, Harrison
Avenue Overpasses
Full reconstruction
Herald Street Street to be placed on deck
I-93 and ramps in the South Bay Interchange Limited impacts
I-90 and ramps (Massachusetts Turnpike) Underpinning on Central Artery/Tunnel (CA/T)
The Broadway Bridge Potential settlement impacts on bridge
South Station Transportation Center Significant underpinning to construct station on CA/T
alignment
The South Station Headhouse Significant underpinning to construct station on CA/T
alignment
U.S. Post Office Significant underpinning to construct station on CA/T
alignment (unless demolished)
Stone and Webster Building (Summer Street) Potential settlement impacts
Federal Reserve Bank Building Significant underpinning to construct CA/T alignment
Fort Point Channel Seawall Potential rebuild of seawall
Summer Street Bridge Potential settlement impacts on bridge
Congress Street Bridge Potential settlement impacts on bridge
MBTA Red Line Tunnel Potential settlement impacts
MBTA Transitway Tunnel (Silver Line) Limited impacts
Russia Wharf Building (Atlantic Wharf) Potential settlement impacts
Central Artery/Tunnel (CA/T) Project Significant underpinning to construct stations; limited
tunneling impacts
CA/T Project Vent Building No. 3
(InterContinental Hotel)
Limited impacts
Boston Electric Company (BECO) Property
(Atlantic Avenue)
TBM may encounter piles
Harbor Plaza Building (Old Sheraton Hotel) Potential settlement of bell caissons
New Northern Avenue Bridge (Moakley
Bridge)
Limited impacts
J. Hook Lobster Company Further research required to evaluate impact
Coast Guard Building Further research required to evaluate impact

Structure / Infrastructure element Modifications needed
Rowes Wharf Limited impacts
Orange Line/ Green Line SuperStation (North
Station)
Limited impacts
TD Boston Garden/ North Station Limited impacts
CA/T (I-93) Charles River Crossing (Zakim
Bridge)
Potential settlement impacts on bridge
CA/T (I-93) Ramps North of the Charles River Underpinning required
Storrow Drive Bridge over the Charles River Limited impacts
The Charles River Dam No impact
Boston Sand and Gravel Assessed as design progresses
Orange Line Vent Building Limited impacts
MBTA Bascule Bridges Further research required to evaluate impact
Gilmore Bridge Further research required to evaluate impact
Sites near Station Elements Further research required to evaluate impact
New construction has resulted in some additional buildings above the alignment, as described in
Table 4.2:
Table 4.2: Potential Additional Impacted Structures Since DEIR
Structure / Infrastructure element Modifications needed
Beverly St area, Parcel 1B (MTA) Bullfinch
Triangle (The Merano)
Potential settlement impacts on building, more research
required to determine building foundations
110 Beverly St Potential settlement impacts on building, more research
required to determine building foundations
101 Canal St Limited impacts
One Canal St Potential settlement impacts on building, more research
required to determine building foundations
InterContinental Boston, 510 Atlantic Ave Potential settlement impacts on building, more research
required to determine building foundations (Opened in 2006,
it is included in this report because it was not completed by
the time of the previous report)
110-112 Broad Street (The Boulevard) Potential settlement impacts on building, more research
required to determine building foundations
Atlantic Wharf, 280 Congress St Limited impacts (Opened in 2011, construction began in
2007/2008, it is included in this report because it was not
completed by the time of the previous report)
Lovejoy Wharf, 100 Lovejoy Wharf Limited impacts
Boston Garden Expansion, 80 Causeway Street
(Hub on Causeway)
More research required to determine building foundations
4.3 Flood protection options
After Hurricane Sandy in 2012 and accompanying growing awareness of extreme weather and
future climate change risks in the Boston area, the MBTA recognizes the need to incorporate
resilience in infrastructure design. Boston is a coastal city requiring attention to 100- and 500-year
floods (each with a 1% and 0.2% annual chance of occurring, respectively). The South Bay Portals
(Dorchester Branch and Old Colony Lines) are both currently within the 500-year floodplain
according to FEMA’s current flood maps. As sea level rises, the coastal floodplains will expand,
as evidenced by the Boston Harbor Flood Risk Model (BH-FRM), which was developed by the
Woods Hole Group and in use by the City of Boston, City of Cambridge, MassDOT’s Highway
Division, and the MBTA. The Back Bay and North Portals will be in flood zones by no later than
the 2070s.
Flood protection for the impacted portals of the NSRL can be provided by either setting the
elevation of all entrances into the tunnel system (portals, station entrances, vent shafts, etc.) above
the predicted flood elevation, or by providing flood doors at the entrances. Figures 4.3 and 4.4
show the FEMA flood maps for the CA/T, North Station and South Station areas. With ongoing
sea level rise, and the more significant storm surges from extreme weather events, it would be
typical to design to at least the 1 in 500-year levels, as projected through at least the 2070s. Based
on these criteria, flooding of the NSRL can be avoided by providing flood prevention measures as
shown in Table 4.3. It should be noted that in the “boat” sections of the portals, anti-buoyancy
measures such as tension piles or additional structural weight may be needed to avoid flotation in
the event of high water levels outside the structure.
The stations along the proposed route also require flood resilience consideration. South Station is
not currently in a floodplain, but as sea level increases, Dorchester Avenue is projected to be in
the 1-year floodplain by the 2070s. One possible way to resist flooding is to raise the station
entrances by having passengers go up a few stairs or a short ramp before going down into the
station. Similar measures are also suggested at the proposed Central and North Stations, because
these stations fall near the 100-year floodplain (but not directly in it). Table 4.3 shows the flood
prevention requirements proposed for each station and portal.

Table 4.3: Flood Protection Measures
Portal Within flood plain? Resiliency measures to avoid flooding
Back Bay Portal 10-year by 2070s By 2070s, 500-year flood depths at street level could
exceed 10 feet. Portal protection (flood gate) would
prevent any tunnel flooding.
South Bay: Dorchester Portal 1-year by 2070s 500-year flood depth by 2070s up to 2.5 ft. in
vicinity of both South Bay Portals. Portal protection
(flood gate) would prevent any tunnel flooding. South Bay: Old Colony Portal 1-year by 2070s
North Portal: Eastern Portal 20-year by 2030s
1-year by 2070s
500-year flood depth by 2070s up to 4 ft. Portal
protection (flood gate over entrance) would prevent
any tunnel flooding
North Portal: Western Portal 10-year by 2070s 500-year flood depth by 2070s up to 2.5 ft. Portal
protection (flood gate over entrance) would prevent
any tunnel flooding
Station
South Station 100-year by 2070s By 2070s, 100-year flood depth could be 1 ft.
500-year flood depth projected to be 2 ft. Flood-
proofing first floor of building (including sealing all
walls and installing flood gates at doors) is an option.
Central Station Currently in 100-year Current 500-year flood depth is 1.5 ft. Flood depth
projected to be over 10 ft. by 2070s. Flood-proofing
station entrance(s) is an option.
North Station 10-year by 2070s By 2070s, 500-year flood depth is projected to be 3
ft. More frequent flooding could be 1-2 ft. Flood-
proofing first floor of building (including sealing all
walls and installing flood gates at doors) is an option.
4.4 Mined station construction
While South Station is planned to be constructed as a cut-and-cover station, the North and Central
Stations are required to be mined, due to the lack of surface access. Various options were
considered for the mined North and Central four-platform stations in the DEIR (see Figure 4.5).
The preferred option consisted of a station with a 160-foot-wide span formed within an enclosure
of interlocking small-diameter tunnels. The reference for this project was the Mount Baker tunnel
in Washington, which is a near-circular tunnel with a span of 65 feet. The proposed NSRL stations
were shown with an oval single vault with a much larger span. This approach would be without
precedent and is considered unlikely to be practical. The two- or three-vault options are considered
possible, although the structure would require significant structural columns between each of the
vaults. The option with mined tunnels between the tunnel bores would lead to an unattractive
station configuration with extensive columns and is not recommended.
An alternative for station construction that does not appear to have been considered in the original
analysis is the “binocular” tunnel configuration. In this arrangement, which has been used on
London’s Crossrail project, smaller tunnel diameters can be used by having separate tunnels for
each platform as well as a central concourse. A typical configuration is shown in Figure 4.6. This
is an ideal method for construction in soft ground where large spans are not possible. Evaluation
of the likely ground conditions has identified that the North Station is primarily in soil, while the
Central Station is in rock, although with very shallow cover (see Figures 4.7 and 4.8).
For the two-platform station option, either a single cavern or a binocular tunnel configuration
would be possible. If a third platform is needed to allow sufficient dwell time for Amtrak trains
while still providing enough capacity for a high-frequency commuter service, some combination
of these two arrangements would be needed.
4.5 As-built design of Central Artery project
A 3-D model is being built that incorporates the as-built design of the Central Artery Project. This
will be analyzed separately for the purpose of updating the Schematic Design Report for this
feasibility reassessment of the NSRL.

5 Design Criteria
Recommended design criteria for the NSRL assessment have been provided as a separate
document for agreement with MBTA (included as an appendix to this document). Amtrak and
MBTA design criteria and the previous study parameters were all reviewed, and a set of criteria
proposed for use on the project. In most cases, reasonably conservative values were specified for
preferred values, with a design exception process identified for conditions where preferred values
cannot be met. To justify the use of exceptions, further analysis and documentation is required,
including impacts to construction, operations, cost and schedule implications, etc.
Grades are the key area in which values have been identified in excess of MBTA and Amtrak
preferred values. The proposed design criteria set out a preferred maximum grade of 2%, with an
exception limit of 3%. This builds on work carried out in previous studies and allows a deep tunnel
with portals at Back Bay and North Point. These values have been discussed and agreed with the
MBTA as suitable for the NSRL project.

6 New Development at Tunnel Portal Locations
This section examines the current feasibility, ownership and required size of all proposed tunnel
portals and construction laydown areas for the NSRL project.
6.1 North portals
The Fitchburg Line portal and the Lowell Line portal would be constructed adjacent to the existing
rail lines and yard. The previous design called for a laydown area at North Point, now unavailable
due to development of the site. Recent and planned developments in the area include:
NorthPoint Development. The NorthPoint infill development site occupies 45 acres in a triangle
bounded by the Gilmore Bridge to the east, the O'Brien Highway to the south, and the MBTA
commuter rail yard and maintenance facility to the north. Its 20 planned development parcels and
11 acres of open space are directly adjacent to tracks leading out of North Station.
Twenty|20. Opened in 2015, Twenty|20 is a 21-story residential tower directly west of the
Gilmore Bridge and adjacent to the larger NorthPoint site, with several lower floors offering retail
and extending farther north (towards the MBTA tracks) than the tower footprint.
Green Line Extension. The Green Line Extension (GLX) project extends the Green Line light
rail from its Lechmere terminus in Cambridge to Somerville and Medford. Its two branches would
use existing MBTA commuter rail rights-of-way, following the Lowell Line to Medford and the
Fitchburg Line to Somerville. The proposed maintenance facility is adjacent to the existing MBTA
commuter rail maintenance facility site.
6.2 South portals
6.2.1 Back Bay
The DEIR recommended excavating below Herald Street to allow additional space for the portal(s)
in addition to the existing five tracks. The five tracks would be relocated and reconfigured to allow
the appropriate disposition of NSRL tracks and connections.
Information on utilities was not gathered as part of the previous work and should be reviewed to
confirm feasibility.
Portal constructability is a concern at this location, especially based on the experience of the Green
Line Extension and construction access adjacent to operating commuter rail rights-of-way. This
may require limited to extensive commuter rail service curtailments.
Recent and planned developments in the vicinity include:
321 Harrison Ave. This eight-story office building has been under construction since March 2017
at the intersection of Herald St and Harrison Ave. Herald St parallels the tracks out of South
Station.
300 Harrison Ave. The Ink Block residential complex opened in 2015, occupies the former
Boston Herald headquarters property, and is located across Harrison Ave, directly south of Herald
St and the surface tracks leading into South Station. The development occupies the block bordered
by Harrison Ave, Herald St, Albany St, and Traveler St. The two tallest buildings are five and
eight stories, respectively, and are approximately 60 feet south of the surface tracks, though not at
grade; all city streets in the vicinity are elevated above the tracks and I-90 travel lanes.
6.2.2 South portals
The South portals would both be constructed in existing railway lands with limited easements
required during construction, in particular for TBM removal. Some track reconfiguration would
be required for each alternative.
The Widett Circle Layover Facility proposed as part of the South Station Expansion Project would
require some track relocations in the vicinity.

7 New Development Along the NSRL Corridor
Since the completion of the Central Artery project, substantial development has occurred along its
alignment and in the surrounding neighborhoods. This section examines the feasibility of the
original design concept from a land use standpoint, noting all new construction since the DEIR
was completed in 2003 and its potential impact on the constructability and operation of the NSRL.
7.1 Methodology
7.1.1 Data sources
The following data sources were used in this analysis:
MassBuilds.com data – A comprehensive dataset that provides an inventory of completed,
current and future building projects in Massachusetts. The MassBuilds development
database, administered by MAPC, has been collecting data on constructed and planned
developments throughout the greater Boston area dating back to 2010.
http://www.massbuilds.com/
2003 Rail Alignment – Digitized from Figure 2.5-1 from the 2003 DEIR for the NSRL
project.
Buildings data from the City of Boston (dated 2011) – Contains building outlines, as well
as information including ground and building elevations.
http://bostonopendata-
boston.opendata.arcgis.com/datasets/492746f09dde475285b01ae7fc95950e_1
LiDAR data from the MassGIS database (dating from 2013-2014)
http://www.mass.gov/anf/research-and-tech/it-serv-and-support/application-serv/office-
of-geographic-information-massgis/datalayers/lidar.html
7.1.2 Analysis
Two subsets of the MassBuilds.com data were created – one for all projects built between 2000
and 2017, and one for all future projects dated 2018 onwards. Of these, only projects that fell
within 200 feet from the 2003 rail alignment were kept for further analysis. The data was then
cross-referenced with the City of Boston Buildings Data. The ground elevation and building height
was obtained from this dataset for all projects that were built by 2011. For all projects built after
2011 and for all future projects, the ground height was obtained by cross-referencing with the
MassGIS LiDAR dataset. Building heights for these properties could only be obtained where it
had been noted in the description of the property.

7.2 Background
There has been substantial development along the surface of the Central Artery since 2000. Several
large projects have been completed in the last two decades, while others are in the planning phases
(and anticipated to be executed in the next twenty years). This review of projects determines
whether there are any impacts from new or planned construction that would affect the NSRL
design concept presented in the 2003 DEIR.
Projects that fall within 200 feet of the DEIR alignments were plotted in Figure 7.1 (properties
constructed or renovated between 2000 and 2017) and Figure 7.2 (planned developments). In
addition, a series of historical satellite images of Boston (Figures 7.3 to 7.8) were reviewed to
provide further information on the developments and identify any other locations where
construction occurred that was not included in the MassBuilds database.
The information is summarized in Figures 7.9 to 7.17, which also show the proposed alignments
from the DEIR.
7.3 Overview of development impacts on the DEIR alignment
Development that has occurred since the preparation of the DEIR is described below, using the
same numbering and lettering system as shown in Figures 7.13 to 7.17:
1. Beverly St area, Parcel 1B (MTA) Bullfinch Triangle (The Merano) (west of alignment):
This steel-framed building is currently under construction. The parking garage will be on
the second floor. Additional information is needed to confirm the basement details and the
type and size of the foundations. Since the development is above the Central Artery/Tunnel
(CA/T), the building foundations may cause a direct obstruction to the proposed tunnels,
and ground improvement work may be required to limit settlement impacts to the property.
2. 110 Beverly St, Boston (west of alignment): This is a newly constructed, luxury apartment
building, The Victor by Windsor, constructed above the I-93 CA/T structure. The property
has underground parking. Further research is needed to confirm the basement details,
interaction with the CA/T structure, and the type of foundations used. Since the
development is adjacent to the west side of the alignment and partially above it, the building
foundations may cause a direct obstruction to the proposed tunnels, and ground
improvement work may be required to limit settlement impacts to the property.
3. 101 Canal St, Boston (west of alignment): This is a new luxury apartment building, Avenir
Apartments. There is no known parking on site, but additional research is needed to
confirm this. This building has a height of 119 feet. Additional research is needed to
determine the size and type of the foundations. Since the development is offset from the
alignment by approximately 100 feet, the building foundations will not cause a direct
obstruction to the proposed tunnels, but ground improvement work may be required to limit
settlement impacts to the property.
4. One Canal St (west of alignment): This is a new luxury apartment building that includes
underground parking, completed in 2016. The new foundation will be near or adjacent to
the CA/T and DEIR alignment. Additional research is required to learn about the type and
size of the foundations. Since the development is adjacent to the west side of the alignment

and partially above it, the building foundations may cause a direct obstruction to the
proposed tunnels, and ground improvement work may be required to limit settlement
impacts to the property.
5. 400 Atlantic Ave, Boston (east of alignment): This building was completed in 1890, and is
12 stories. The work on the building since 2000 is believed to have been a modernization.
No new foundation work is likely but additional research will need to be done to determine
the type and size of the foundations. Since the development is outside the northern reaches
of the CA/T, and the foundations of the building predate the tunnel, the building
foundations will likely not cause a direct obstruction to the proposed NSRL tunnels.
Ground improvement work may be required to limit settlement impacts to the property.
6. 169-175 Purchase St, Boston (west of alignment): This construction appears to be the
retrofitting of a preexisting structure. This would imply no new foundations have been
added at this site. Since the development is offset from the alignment by approximately 45
feet, the building foundations will not cause a direct obstruction to the proposed tunnels,
but ground improvement work may be required to limit settlement impacts to the property.
7. Independence Wharf, 470 Atlantic Ave, Boston (east of alignment): This building, along
the Boston Harborwalk, was built in 1927 and modernized in 2001. The building has
parking but additional research needs to be done to determine the location and size of the
garage as well as the type of foundations used. However, these are not likely to have
changed during the building modernization. This building has a height of 184 feet. The
development is above the alignment for approximately 80 feet, but the building was built
before the CA/T, so the building foundations will likely not cause a direct obstruction to
the proposed tunnels. Ground improvement work may be required to limit settlement
impacts to the property. This property is included because of changes made to it after the
previous report and to ensure that all impacted properties are mentioned.
8. InterContinental Boston, 510 Atlantic Ave, Boston (east of alignment): This luxury hotel
and condominium building opened in 2006 along the Harborwalk. The hotel has parking,
but additional research needs to be done to learn the location of the parking garage and the
type and size of the foundations. This building has a height of 253 feet. Since the
approximately front 70 feet of development is above the northbound CA/T, and the
building was built in 2006, the building foundations may cause a direct obstruction to the
proposed tunnels. Ground improvement work may be required to limit settlement impacts
to the property.
9. 110-112 Broad Street, Boston (west of alignment): This building is currently under
construction. It is a concrete structure with a single-story 35-space below-ground parking
garage, and will be 120 feet tall. Additional information is needed to determine the
foundation size and type. Since the development is offset from the alignment by
approximately 25 feet, the building foundations will not cause a direct obstruction to the
proposed tunnels, but ground improvement work may be required to limit settlement
impacts to the property.
10. Atlantic Wharf (formerly Russia Wharf), 280 Congress St, Boston (east of alignment): The
new Silver Line tunnels were constructed under the historic Russia Wharf building and
completed in 2004. The building is supported by timber piles. The new Atlantic Wharf

building, added to the site in 2011, is 456 feet tall. More research is needed to determine
the foundation size and type. Since the new development is offset from the alignment by
approximately 100 feet, the building foundations will not cause a direct obstruction to the
proposed tunnels, but ground improvement work may be required to limit settlement
impacts to the property. The preexisting Russia Wharf buildings were completed before
the CA/T and the foundations will have no impact.
11. Lovejoy Wharf, 100 Lovejoy Wharf (east of alignment): Opening during the summer of
2017, this new luxury condominium building is along the Charles River near North Station.
Since the development is offset from the alignment by approximately 45 feet, the building
foundations will not cause a direct obstruction to the proposed tunnels, but ground
improvement work may be required to limit settlement impacts to the property.
12. Boston Garden Expansion, 80 Causeway Street (west of alignment): This is currently under
construction. Phase 1 includes a four-story underground parking garage and a nine-story
building. Slurry walls, about 60 feet deep, support the excavation, and deep foundation
elements will support the above structure. This location conflicts with a proposed DEIR
station ancillary structure.
In Figure 7.2, blue stars denote properties where construction is anticipated to begin after 2018.
While these do not currently pose an obstruction to the DEIR alignment, there is potential for them
to limit alignment options in the future. Details of the proposed developments are in the following
table:
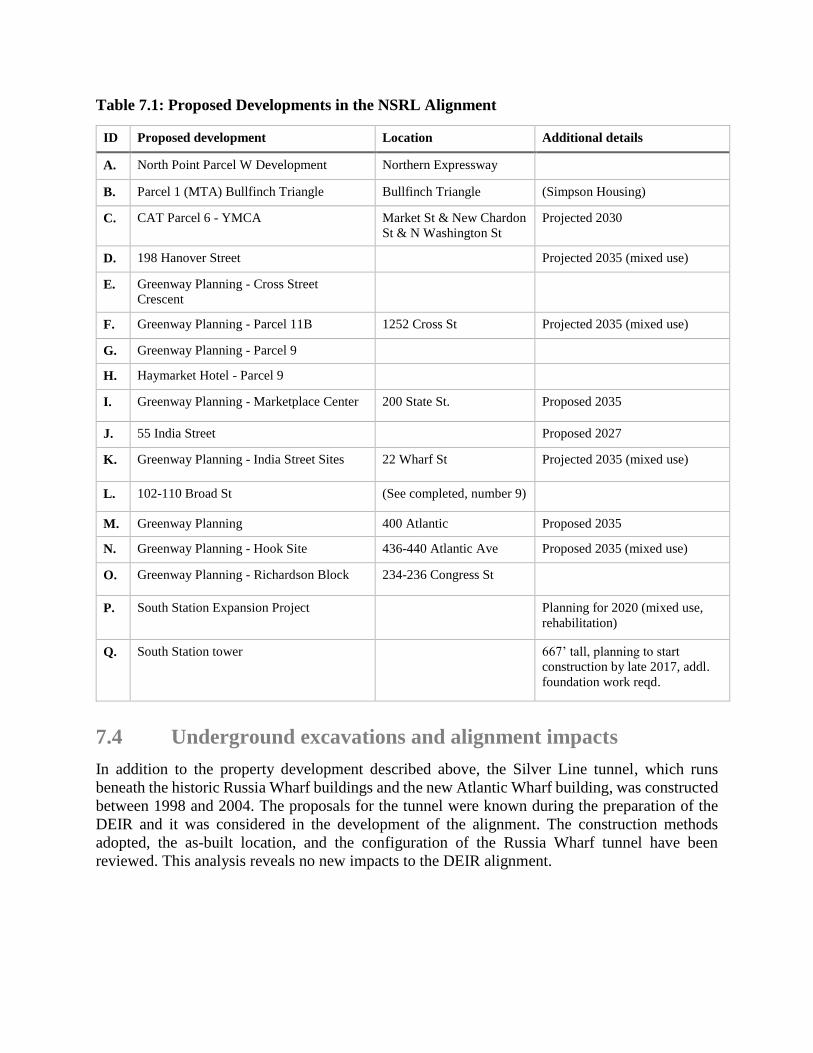
Table 7.1: Proposed Developments in the NSRL Alignment
ID Proposed development Location Additional details
A. North Point Parcel W Development Northern Expressway
B. Parcel 1 (MTA) Bullfinch Triangle Bullfinch Triangle (Simpson Housing)
C. CAT Parcel 6 - YMCA Market St & New Chardon
St & N Washington St
Projected 2030
D. 198 Hanover Street Projected 2035 (mixed use)
E. Greenway Planning - Cross Street
Crescent
F. Greenway Planning - Parcel 11B 1252 Cross St Projected 2035 (mixed use)
G. Greenway Planning - Parcel 9
H. Haymarket Hotel - Parcel 9
I. Greenway Planning - Marketplace Center 200 State St. Proposed 2035
J. 55 India Street Proposed 2027
K. Greenway Planning - India Street Sites 22 Wharf St Projected 2035 (mixed use)
L. 102-110 Broad St (See completed, number 9)
M. Greenway Planning 400 Atlantic Proposed 2035
N. Greenway Planning - Hook Site 436-440 Atlantic Ave Proposed 2035 (mixed use)
O. Greenway Planning - Richardson Block 234-236 Congress St
P. South Station Expansion Project Planning for 2020 (mixed use,
rehabilitation)
Q. South Station tower 667’ tall, planning to start
construction by late 2017, addl.
foundation work reqd.
7.4 Underground excavations and alignment impacts
In addition to the property development described above, the Silver Line tunnel, which runs
beneath the historic Russia Wharf buildings and the new Atlantic Wharf building, was constructed
between 1998 and 2004. The proposals for the tunnel were known during the preparation of the
DEIR and it was considered in the development of the alignment. The construction methods
adopted, the as-built location, and the configuration of the Russia Wharf tunnel have been
reviewed. This analysis reveals no new impacts to the DEIR alignment.
8 Amtrak and MBTA Commuter Ridership Trends
This section compares commuter rail and Amtrak ridership growth with projections from the 2003
DEIR, and speculates on some of the reasons this might be different from projected figures.
8.1 Ridership
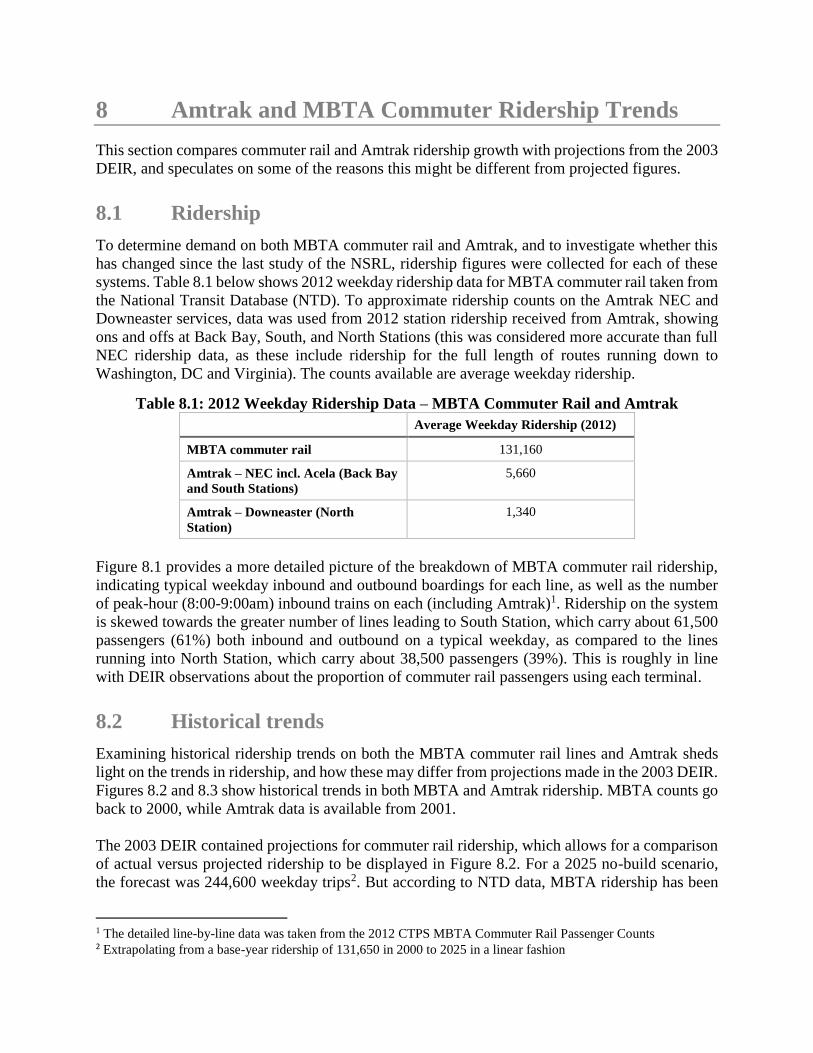
To determine demand on both MBTA commuter rail and Amtrak, and to investigate whether this
has changed since the last study of the NSRL, ridership figures were collected for each of these
systems. Table 8.1 below shows 2012 weekday ridership data for MBTA commuter rail taken from
the National Transit Database (NTD). To approximate ridership counts on the Amtrak NEC and
Downeaster services, data was used from 2012 station ridership received from Amtrak, showing
ons and offs at Back Bay, South, and North Stations (this was considered more accurate than full
NEC ridership data, as these include ridership for the full length of routes running down to
Washington, DC and Virginia). The counts available are average weekday ridership.
Table 8.1: 2012 Weekday Ridership Data – MBTA Commuter Rail and Amtrak
Average Weekday Ridership (2012)
MBTA commuter rail 131,160
Amtrak – NEC incl. Acela (Back Bay
and South Stations)
5,660
Amtrak – Downeaster (North
Station)
1,340
Figure 8.1 provides a more detailed picture of the breakdown of MBTA commuter rail ridership,
indicating typical weekday inbound and outbound boardings for each line, as well as the number
of peak-hour (8:00-9:00am) inbound trains on each (including Amtrak)1. Ridership on the system
is skewed towards the greater number of lines leading to South Station, which carry about 61,500
passengers (61%) both inbound and outbound on a typical weekday, as compared to the lines
running into North Station, which carry about 38,500 passengers (39%). This is roughly in line
with DEIR observations about the proportion of commuter rail passengers using each terminal.
8.2 Historical trends
Examining historical ridership trends on both the MBTA commuter rail lines and Amtrak sheds
light on the trends in ridership, and how these may differ from projections made in the 2003 DEIR.
Figures 8.2 and 8.3 show historical trends in both MBTA and Amtrak ridership. MBTA counts go
back to 2000, while Amtrak data is available from 2001.
The 2003 DEIR contained projections for commuter rail ridership, which allows for a comparison
of actual versus projected ridership to be displayed in Figure 8.2. For a 2025 no-build scenario,
the forecast was 244,600 weekday trips2. But according to NTD data, MBTA ridership has been
1 The detailed line-by-line data was taken from the 2012 CTPS MBTA Commuter Rail Passenger Counts 2 Extrapolating from a base-year ridership of 131,650 in 2000 to 2025 in a linear fashion
declining since 2009 (when ridership was at a high of almost 147,000) by approximately 15%
overall. Data through 2015, the last year NTD has made publically available, show that current
commuter rail ridership is not keeping pace with the 2003 DEIR projections (see Figure 8.2).
Figure 8.3 shows historical average weekday ridership counts for Amtrak only at Back Bay, South
and North Stations, used as proxies for NEC (incl. Acela) and Downeaster ridership, as explained
above. Amtrak average weekday ridership figures, as opposed to commuter rail ridership, show
steady growth at all Boston stations from 2001-2016. Amtrak ridership more than doubled over
this period.
No ridership projections are provided for Amtrak in the DEIR, but another way to compare
historical projections to the current situation lies in the number of Amtrak scheduled trips between
Boston and New York. The DEIR used a 2002 baseline of 35 daily Northeast Corridor trains. The
DEIR then estimated 52 trains a day (26 in each direction) would operate between Boston and
New York in the 2025 no-build operations scenario.
The 2017 Amtrak schedule shows 19 Amtrak trains arriving at South Station and 20 trains
departing every day, for a total of 39 daily trains. Amtrak’s NEC Future planning process, currently
undergoing environmental review, projects nearly a doubling of today’s trains, which would then
exceed DEIR projections from 2003 (these changes are not anticipated to be implemented until the
middle of this century). This analysis also seems to indicate that DEIR projections were more
optimistic than the current situation in 2017.
8.3 Qualifications
A number of factors may have had an impact on observed commuter rail ridership not keeping up
with projections. Possible explanations include four fare increases since 2003 (factoring in
inflation, commuter rail fares went up by more than 50% since 2003), lower gas prices from 2008
to 2010 and then since 2014, the impacts of severe weather in the winter of 2015 and the movement
of more people into the urban core. In addition to this, the difficulty of accurately forecasting into
the future is readily acknowledged amongst the planning community.
Generally, reliability and service frequency are seen as the key factors for maintaining transit
ridership. The MBTA’s reliability issues from severe weather, the increase in fares, and no
significant increase in service would have all contributed to the difference between DEIR
projections and today’s ridership.
9 Demographic Trends
This section examines changes to demographic and land use patterns since the DEIR was
completed in 2003. It explores shifts in both population and employment throughout the region,
comparing trends in MBTA’s Core service area to Gateway Cities and suburban areas (designated
as the ‘Other MBTA service area’), as defined in the MBTA’s Focus40 planning exercise, defined
in an appendix to this document and illustrated in Figure 9.1. It also aims to better understand
travel markets through a review of auto ownership rates and Transit-Oriented Development (TOD)
in the region. Data sources and methodology are detailed in an appendix to this document.
9.1 Summary of key findings
Comparison to the 2003 DEIR has yielded the following key findings:
Population growth rates in the study area are slightly lower than DEIR projections, as were
those for employment
The Core service area accounted for a little under half of population growth and a little
under a third of employment growth within the study area since 2003
The large number of municipalities included in the Other MBTA service area saw the
greatest gains in population and employment growth in the study area, indicating that
growth was not concentrated in one area over this time.
The Gateway Cities increased the number of jobs by 14% since 2003, making them the
fastest-growing part of the study area in terms of employment, but they had a smaller share
of the total population growth
Auto ownership has changed very little in the study area since 2000, with a very slight
decrease in the average vehicles per household in the Core service area and a very slight
increase in the Gateway Cities, the suburban areas included in the Other MBTA service
area, and the study area as a whole
TOD has accounted for 9,627 new housing units and 6.5 million square feet of commercial
floor area within a half-mile of commuter rail stations (either completed or under
construction since 2010)
o Future projects (expected to be constructed prior to 2035) within a half-mile of
commuter rail stations account for an additional 11,923 housing units and 14.2
million square feet of commercial space
o Of the total number of projects (completed, under construction and future) around
MBTA commuter rail stations, those around South Station accounted for 18% of
housing units and 27% of commercial square footage, those around North Station
accounted for 10% of housing units and 9% of commercial square footage, and
those around Back Bay accounted for 8% of housing units and 10% of commercial
square footage.

9.2 Population and employment changes
9.2.1 Population
The population has grown in the study area examined in the 2003 DEIR, from 4.3 million in 2000
to 4.6 million in 2016. The DEIR, drawing from MAPC forecasts, indicated an increase in
population of 15% between 1995 and 2025, an annual growth rate of about 0.5% a year. The actual
percentage increase from the 16 years from 2000 to 2016 was approximately 6% (0.4% growth
per year). Figure 9.2 shows population change in the study area by percent, with the MBTA
commuter rail lines overlaid on the map. Figure 9.3 shows population change in the study area by
absolute numbers. These show that some of the fastest-growing areas in the region (relative to their
size in 2003) are towards the edges of the study area, and in some cases inaccessible by commuter
rail lines. Areas that are shrinking the fastest include North Shore communities and some
municipalities outside of the Core service area. A few areas saw a very large percentage increase
in population (detailed in the tables below) but not a significant numerical increase.
The inverse was true of the urban core, which did not have large percent increases in population
but saw large amounts of new people over this time (for example, Boston gained twice as many
new people from 2000-16 than the TOTAL of the ten highest-ranked areas for percent population
increase). Other areas with large population gains included municipalities clustered along the New
Hampshire border near Haverhill and those just south of the Kingston/Plymouth line terminus.
Table 9.1 below shows the fastest-growing municipalities in the region (relative to their population
in 2000). These were concentrated in the Other MBTA service area and beyond. Wrentham is the
only municipality to be ranked for both numerical and percent growth. Of the municipalities in the
table below, only Middleborough is directly on an MBTA commuter rail line.
Table 9.1: Ten Highest-ranked Municipalities - Percent Population Increase, 2000-16
Ranking Municipality Geography Percent population
increase, 2000-16
Numerical population
increase, 2000-16
1 Wrentham Other MBTA service area 126% 6,109
2 Upton Other MBTA service area 44% 2,508
3 Berlin No Focus40 designation 33% 797
4 Uxbridge No Focus40 designation 28% 3,091
5 Northbridge Other MBTA service area 25% 3,242
6 Middleborough Other MBTA service area 23% 4,550
7 Raynham Other MBTA service area 22% 2,551
8 Middleton Other MBTA service area 22% 1,672
9 Millville No Focus40 designation 20% 550
10 Bolton No Focus40 designation3 20% 834
TOTAL 25,904
3 Municipalities that fell within the study area for the reassessment but did not have Focus 40 designations
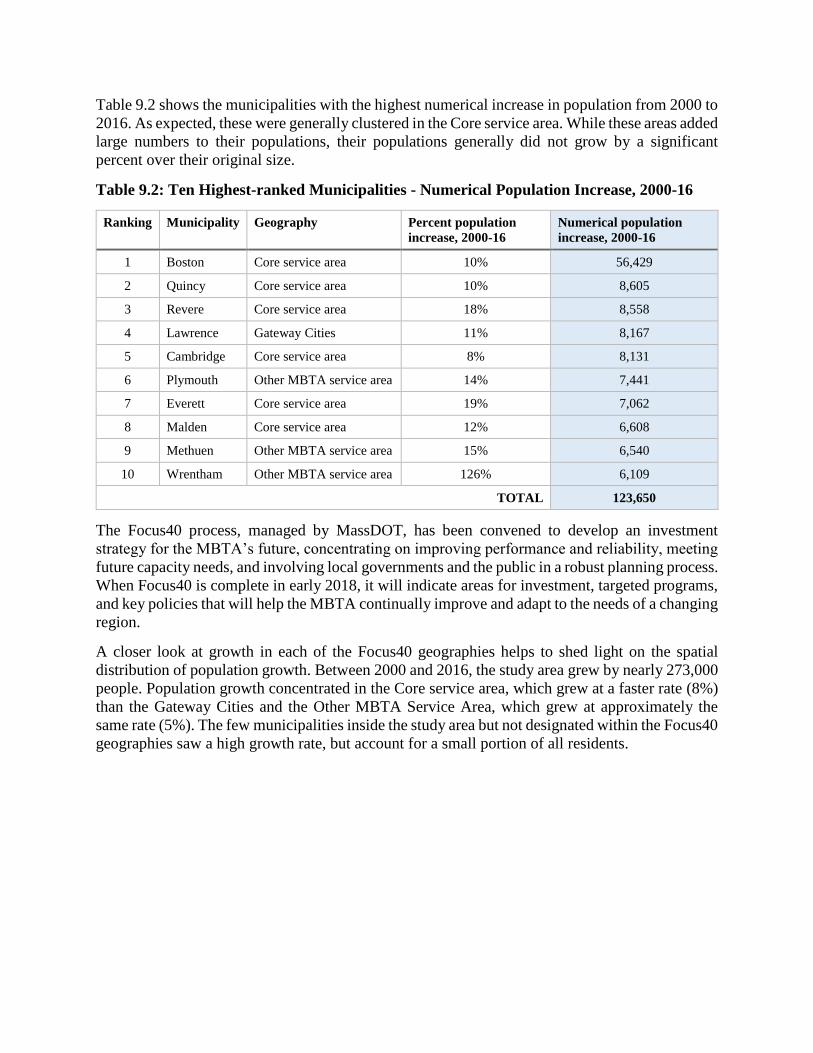
Table 9.2 shows the municipalities with the highest numerical increase in population from 2000 to
2016. As expected, these were generally clustered in the Core service area. While these areas added
large numbers to their populations, their populations generally did not grow by a significant
percent over their original size.
Table 9.2: Ten Highest-ranked Municipalities - Numerical Population Increase, 2000-16
Ranking Municipality Geography Percent population
increase, 2000-16
Numerical population
increase, 2000-16
1 Boston Core service area 10% 56,429
2 Quincy Core service area 10% 8,605
3 Revere Core service area 18% 8,558
4 Lawrence Gateway Cities 11% 8,167
5 Cambridge Core service area 8% 8,131
6 Plymouth Other MBTA service area 14% 7,441
7 Everett Core service area 19% 7,062
8 Malden Core service area 12% 6,608
9 Methuen Other MBTA service area 15% 6,540
10 Wrentham Other MBTA service area 126% 6,109
TOTAL 123,650
The Focus40 process, managed by MassDOT, has been convened to develop an investment
strategy for the MBTA’s future, concentrating on improving performance and reliability, meeting
future capacity needs, and involving local governments and the public in a robust planning process.
When Focus40 is complete in early 2018, it will indicate areas for investment, targeted programs,
and key policies that will help the MBTA continually improve and adapt to the needs of a changing
region.
A closer look at growth in each of the Focus40 geographies helps to shed light on the spatial
distribution of population growth. Between 2000 and 2016, the study area grew by nearly 273,000
people. Population growth concentrated in the Core service area, which grew at a faster rate (8%)
than the Gateway Cities and the Other MBTA Service Area, which grew at approximately the
same rate (5%). The few municipalities inside the study area but not designated within the Focus40
geographies saw a high growth rate, but account for a small portion of all residents.

Table 9.3 – Population Change by Focus40 Geography, 2000-16
Geography Population (2000) Population (2016) Numerical
change in
population
Percent
change in
population
Share of
study area
population
growth
Core service
area 1,433,672 1,548,925 115,253 8% 42%
Gateway
Cities 526,850 551,032 24,182 5% 9%
Other MBTA
service area 2,222,430 2,344,157 121,727 5% 44%
No Focus40
designation 124,849 137,536 12,687 10% 5%
TOTAL 4,307,801 4,581,650 273,849 6% 100%
9.2.2 Employment
Employment has also grown in the study area since the last time this was evaluated for the NSRL
project, from 2.3 million in 2000 to 2.5 million in 2016. The DEIR, drawing from MAPC forecasts,
indicated an increase in employment of 31% between 1995 and 2025, an annual rate of just under
1% a year. In fact, the study are has seen an approximate 8% increase in jobs over the 16 years
between 2000 and 2016 (approximately 0.5% per year), falling below DEIR projections.
Figure 9.4 shows employment change in the study area by percent, with the MBTA commuter rail
lines overlaid on the map. Figure 9.5 shows employment change in the study area by numerical
values. These show that some of the corridors served by commuter rail lost jobs over the period
from 2000 – 2016. However, some of the fastest-growing areas (including a few outliers described
below) are also served by commuter rail, perhaps indicating new markets for rail travel to work
outside the core. In terms of numbers of jobs gained, Boston and the Core service area still
represent the largest share, with other pockets of growth throughout the region, including in
Gateway Cities.
The fastest-growing municipalities in the region (relative to their number of jobs in 2000) were
nearly all in the outer areas of the region (with the exception of Winthrop in the Core service area),
detailed in Table 9.4 below. Harvard and Woburn are the only municipalities to be ranked for both
numerical and percent growth.
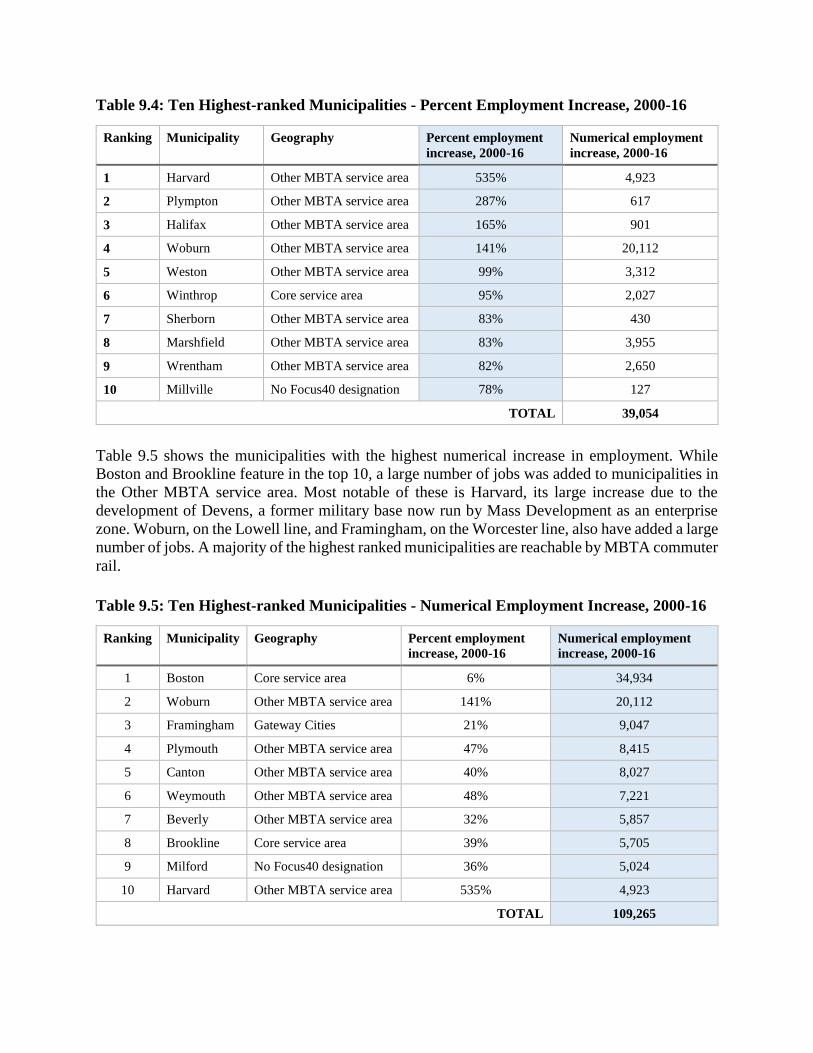
Table 9.4: Ten Highest-ranked Municipalities - Percent Employment Increase, 2000-16
Ranking Municipality Geography Percent employment
increase, 2000-16
Numerical employment
increase, 2000-16
1 Harvard Other MBTA service area 535% 4,923
2 Plympton Other MBTA service area 287% 617
3 Halifax Other MBTA service area 165% 901
4 Woburn Other MBTA service area 141% 20,112
5 Weston Other MBTA service area 99% 3,312
6 Winthrop Core service area 95% 2,027
7 Sherborn Other MBTA service area 83% 430
8 Marshfield Other MBTA service area 83% 3,955
9 Wrentham Other MBTA service area 82% 2,650
10 Millville No Focus40 designation 78% 127
TOTAL 39,054
Table 9.5 shows the municipalities with the highest numerical increase in employment. While
Boston and Brookline feature in the top 10, a large number of jobs was added to municipalities in
the Other MBTA service area. Most notable of these is Harvard, its large increase due to the
development of Devens, a former military base now run by Mass Development as an enterprise
zone. Woburn, on the Lowell line, and Framingham, on the Worcester line, also have added a large
number of jobs. A majority of the highest ranked municipalities are reachable by MBTA commuter
rail.
Table 9.5: Ten Highest-ranked Municipalities - Numerical Employment Increase, 2000-16
Ranking Municipality Geography Percent employment
increase, 2000-16
Numerical employment
increase, 2000-16
1 Boston Core service area 6% 34,934
2 Woburn Other MBTA service area 141% 20,112
3 Framingham Gateway Cities 21% 9,047
4 Plymouth Other MBTA service area 47% 8,415
5 Canton Other MBTA service area 40% 8,027
6 Weymouth Other MBTA service area 48% 7,221
7 Beverly Other MBTA service area 32% 5,857
8 Brookline Core service area 39% 5,705
9 Milford No Focus40 designation 36% 5,024
10 Harvard Other MBTA service area 535% 4,923
TOTAL 109,265
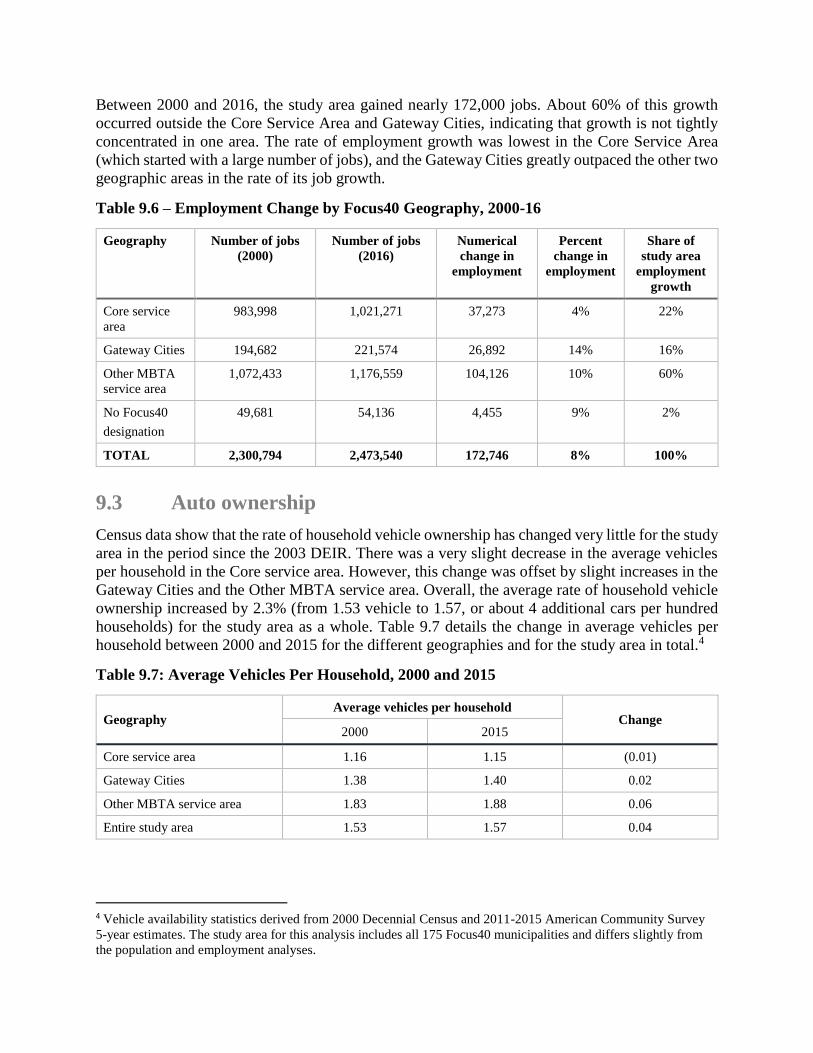
Between 2000 and 2016, the study area gained nearly 172,000 jobs. About 60% of this growth
occurred outside the Core Service Area and Gateway Cities, indicating that growth is not tightly
concentrated in one area. The rate of employment growth was lowest in the Core Service Area
(which started with a large number of jobs), and the Gateway Cities greatly outpaced the other two
geographic areas in the rate of its job growth.
Table 9.6 – Employment Change by Focus40 Geography, 2000-16
Geography Number of jobs
(2000)
Number of jobs
(2016)
Numerical
change in
employment
Percent
change in
employment
Share of
study area
employment
growth
Core service
area
983,998 1,021,271 37,273 4% 22%
Gateway Cities 194,682 221,574 26,892 14% 16%
Other MBTA
service area
1,072,433 1,176,559 104,126 10% 60%
No Focus40
designation
49,681 54,136 4,455 9% 2%
TOTAL 2,300,794 2,473,540 172,746 8% 100%
9.3 Auto ownership
Census data show that the rate of household vehicle ownership has changed very little for the study
area in the period since the 2003 DEIR. There was a very slight decrease in the average vehicles
per household in the Core service area. However, this change was offset by slight increases in the
Gateway Cities and the Other MBTA service area. Overall, the average rate of household vehicle
ownership increased by 2.3% (from 1.53 vehicle to 1.57, or about 4 additional cars per hundred
households) for the study area as a whole. Table 9.7 details the change in average vehicles per
household between 2000 and 2015 for the different geographies and for the study area in total.4
Table 9.7: Average Vehicles Per Household, 2000 and 2015
Geography Average vehicles per household
Change 2000 2015
Core service area 1.16 1.15 (0.01)
Gateway Cities 1.38 1.40 0.02
Other MBTA service area 1.83 1.88 0.06
Entire study area 1.53 1.57 0.04
4 Vehicle availability statistics derived from 2000 Decennial Census and 2011-2015 American Community Survey
5-year estimates. The study area for this analysis includes all 175 Focus40 municipalities and differs slightly from
the population and employment analyses.

The proportion of zero-vehicle households throughout the study area did not change significantly
over the period; however, the proportion of households with access to one or two cars deceased
slightly, while those with access to 3 or 4 (or more) cars increased slightly. It is unlikely that this
trend will have a major impact on travel throughout the study area. Figure 9.6 shows the geographic
distribution of auto ownership in 2015.
9.4 Transit-oriented development
MAPC data was also utilized to determine the growth of TOD along commuter rail lines. The data
provided was obtained from MassBuilds in May of 2017 and contains information on the number
of residential units and commercial square footage in various stages of development within a half-
mile distance of 187 individual MBTA stations.
These data show the following information for projects within a half mile of a commuter rail
station:
9,627 new housing units were either completed or under construction since 2010
6.5 million square feet of new commercial space were either completed or under
construction since 2010.
The MAPC data also contains information on future projects, categorized as either planned or
projected. These projects are generally expected to be constructed prior to 2035, with a maximum
completion date of 2042. Projects in the planning stages within a half-mile of commuter rail
stations accounted for:
An additional 11,923 housing units
An additional 14.2 million square feet of commercial space
Longer-term projects designated as projected are planned to account for:
9,909 housing units
12.0 million square feet of commercial space
Of the total number of projects (completed, under construction and future) around MBTA
commuter rail stations:
Those around South Station accounted for 18% of housing units and 27% of commercial
square footage
Those around North Station accounted for 10% of housing units and 9% of commercial
square footage
Those around Back Bay accounted for 8% of housing units and 10% of commercial square
footage.

Table 9.8 shows the development data for walksheds around commuter rail station, stratified by
MBTA’s Focus40 geographic typology. The data show that most of the recent and anticipated
development around commuter rail stations has occurred or will occur in the Core service area. Of
the recently completed TOD in the region, nearly half was located in the Core service area, while
the 148 towns comprising the Other MBTA service area accounted for 35% and 40% of residential
and commercial development, respectively. In the 10 Gateway Cities identified by MBTA, fewer
than 1,000 new housing units and less than 1 million square feet of new commercial area have
been completed since 2010.
The vast majority of future housing and commercial development intensity – categorized as under
construction, planned, or projected – is slated to be sited around stations near the Core service area.
While additional TOD is projected for the Gateway Cities and the suburban towns and areas in the
Other MBTA service area, developments in active planning stages are expected to add only modest
growth around stations in these geographies.
Table 9.8: Recent and Anticipated Residential and Commercial Development within 1/2
Mile of Commuter Rail Stations
Focus40
Geography
Completed after 2010 Under construction Planned Projected
Housing
units
Commercial
space (sq.ft.)
Housing
snits
Commercial
space (sq.ft.)
Housing
units
Commercial
space (sq.ft.)
Housing
units
Commercial
space (sq.ft.)
Gateway
Cities
979 630,061 0 0 421 74,500 1,577 750,000
Core service
area
3,124 2,331,311 3,214 1,539,028 9,689 13,952,805 6,170 8,543,130
Other
MBTA
service area
2,200 2,010,401 110 8,000 1,813 199,285 2,162 2,787,080
TOTAL 6,303 4,971,773 3,324 1,547,028 11,923 14,226,590 9,909 12,080,210

10 Desired End State
MassDOT developed both Study Objectives and Guiding Principles to shape this evaluation of the
NSRL concept.
The Study Objectives outline the goals of this NSRL analysis - what the study will deliver and
why it is of value to MassDOT.
The Guiding Principles are divided into primary principles that address the major problems the
NSRL is intended to solve, and secondary principles – additional problems the NSRL can help
address, but not the primary motivation for advancing the project concept. The primary principles
will form the framework for creating the service plans for the different service alternatives, and
will be the standards by which these alternatives will be evaluated. The secondary principles will
help MassDOT to decide whether to prioritize the NSRL investment after this project assessment
is completed.
These documents were presented to MassDOT separately and are available as an appendix to this
document.
The Study Objectives in the DEIR aimed to determine service levels, operating and capital costs
for a no-build and several build alternatives, as well as assessing the operational impact of build
options. For this review of the NSRL concept, the Study Objectives generally fit with these
objectives, with the addition of being centered around an update and reassessment of the conditions
in the DEIR, with the purpose of enabling MassDOT to make a decision on whether to prioritize
this project for investment.
The Guiding Principles in the DEIR aimed to reduce operating and capital costs, alleviate
congestion at North and South Stations, provide better access to maintenance facilities and create
more capacity on the system by through-running trains. The Guiding Principles in the new NSRL
assessment are influenced by the MBTA’s Focus40 outcomes (currently under development and
intended to guide long-term investment in the system) and seek to prioritize service plans that
adhere to these outcomes. Like the DEIR principles, these also seek to relieve congestion and
increase capacity on the commuter rail network, with the added goals of reducing congestion on
the MBTA rapid transit lines and improving transit accessibility to employment. Additional
principles that were added in this iteration include reducing emissions from the commuter rail
network (through electrification) and allowing the development of new urban core parcels by
reducing the physical footprint of rail layover facilities.
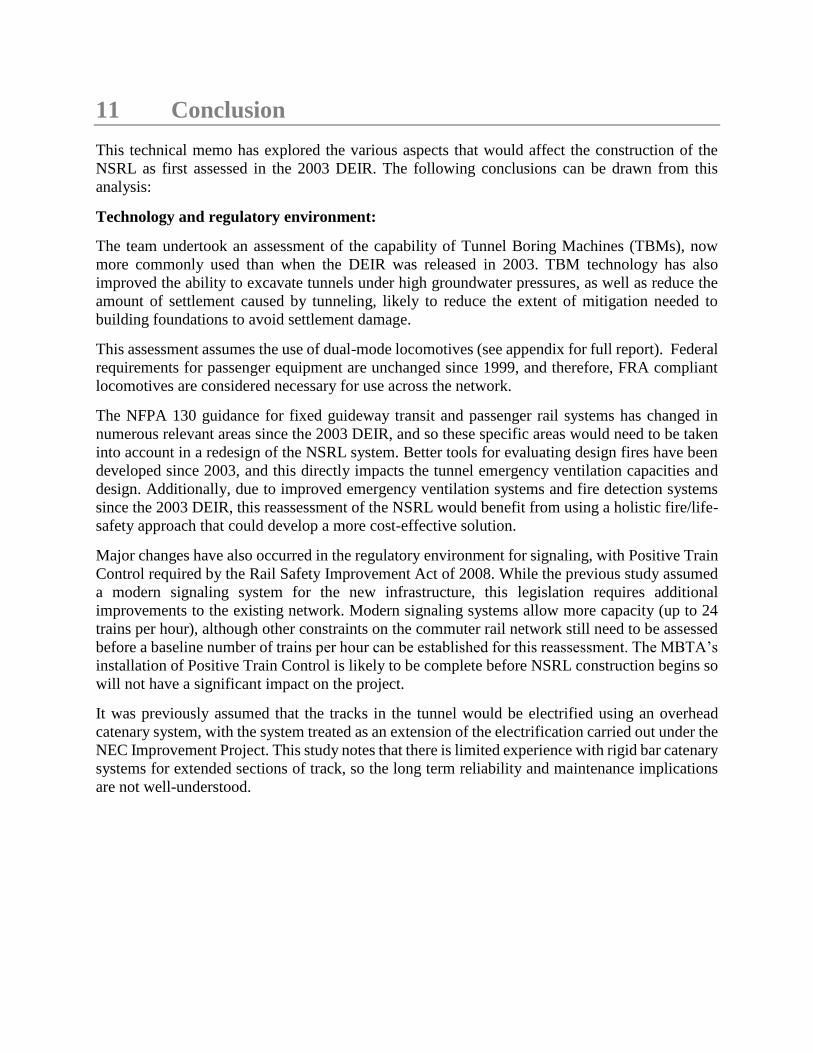
11 Conclusion
This technical memo has explored the various aspects that would affect the construction of the
NSRL as first assessed in the 2003 DEIR. The following conclusions can be drawn from this
analysis:
Technology and regulatory environment:
The team undertook an assessment of the capability of Tunnel Boring Machines (TBMs), now
more commonly used than when the DEIR was released in 2003. TBM technology has also
improved the ability to excavate tunnels under high groundwater pressures, as well as reduce the
amount of settlement caused by tunneling, likely to reduce the extent of mitigation needed to
building foundations to avoid settlement damage.
This assessment assumes the use of dual-mode locomotives (see appendix for full report). Federal
requirements for passenger equipment are unchanged since 1999, and therefore, FRA compliant
locomotives are considered necessary for use across the network.
The NFPA 130 guidance for fixed guideway transit and passenger rail systems has changed in
numerous relevant areas since the 2003 DEIR, and so these specific areas would need to be taken
into account in a redesign of the NSRL system. Better tools for evaluating design fires have been
developed since 2003, and this directly impacts the tunnel emergency ventilation capacities and
design. Additionally, due to improved emergency ventilation systems and fire detection systems
since the 2003 DEIR, this reassessment of the NSRL would benefit from using a holistic fire/life-
safety approach that could develop a more cost-effective solution.
Major changes have also occurred in the regulatory environment for signaling, with Positive Train
Control required by the Rail Safety Improvement Act of 2008. While the previous study assumed
a modern signaling system for the new infrastructure, this legislation requires additional
improvements to the existing network. Modern signaling systems allow more capacity (up to 24
trains per hour), although other constraints on the commuter rail network still need to be assessed
before a baseline number of trains per hour can be established for this reassessment. The MBTA’s
installation of Positive Train Control is likely to be complete before NSRL construction begins so
will not have a significant impact on the project.
It was previously assumed that the tracks in the tunnel would be electrified using an overhead
catenary system, with the system treated as an extension of the electrification carried out under the
NEC Improvement Project. This study notes that there is limited experience with rigid bar catenary
systems for extended sections of track, so the long term reliability and maintenance implications
are not well-understood.
Engineering assumptions:
This assessment deems that the tunnel diameters used in the DEIR are still adequate, and that there
is potential for a reduction in the diameter of the single-track tunnels, based on MBTA criteria for
the train envelope used to procure and qualify commuter rail revenue equipment. Where the
proposed NSRL excavations for tunnels and stations are under or adjacent to existing structures,
this assessment agrees that underpinning may be required. The extent of modifications needed
range from doing nothing to underpinning or full replacement. Most of the affected properties were
identified in the DEIR, but there are a few additional properties from new construction since 2003.
Resilience to storms has become more important in infrastructure design in recent years, and so
this assessment determines that flood protection be provided for 500-year storms. Flood protection
for the impacted portals of the NSRL can be provided by either setting the elevation of all entrances
into the tunnel system (portals, station entrances, vent shafts etc.) above the predicted flood
elevation, or by providing flood doors at the entrances. The South portals (Dorchester branch and
Old Colony lines) are both currently within the 500-year floodplain, and the Back Bay and North
portals will be in flood zones by no later than the 2070s.
Station construction is proposed to differ from the DEIR approach, which proposed an oval single
vault with a large span. This assessment considers this approach unlikely to be practical, and also
does not recommend two- or three-vault options. While these are considered possible, the structure
would require significant structural columns between each of the vaults, leading to an unattractive
station configuration. Instead, this assessment proposed a “binocular” tunnel configuration, using
separate tunnels for each platform as well as a central concourse and allowing smaller tunnel
diameters. For a two-platform station option, either a single cavern or a binocular tunnel
configuration would be possible. If three platforms are required, some combination of these two
arrangements would be needed.
Design criteria:
Recommended design criteria for this assessment have been provided to MassDOT after reviewing
Amtrak and MBTA design criteria and the previous study parameters. In most cases, reasonably
conservative values were specified for preferred values, with a design exception process. Values
here and for grades are reasonably consistent with work carried out in previous studies, and have
been discussed and agreed with the MBTA as suitable for the NSRL project. This document is
attached to this technical memo as an appendix.
Tunnel portal locations:
Tunnel portal locations proposed in the DEIR have been reviewed, taking into account new
development and other changes that would necessitate altering their design. The design of the
North portals will need to be reconsidered because of redevelopment of the NorthPoint site. For
the portal at Back Bay, it was recommended that information be gathered on utilities to confirm
feasibility. Additionally, construction and support of a highway cap development here could
restrict portal options, even within the existing right-of-way. For the South portals at South Station,
it was assessed that they both would be constructed in existing railway lands with limited
easements required during construction, in particular for TBM removal, and that some track
reconfiguration would be required for each alternative.
New development along the NSRL corridor:
A considerable amount of development has occurred along the surface of the Central Artery since
2000. Large projects that have been completed in the last two decades in the path of the proposed
NSRL alignment were assessed. For some of these, building foundations may cause a direct
obstruction to the proposed tunnels, and for most of the new construction, ground improvement
work may be required to limit settlement impacts to the property. For major construction
anticipated to begin after 2018, there may be potential impacts on alignment options in the future
(although this is not currently the case).
The Silver Line tunnel, which runs beneath the historic Russia Wharf buildings and the new
Atlantic Wharf building, was constructed between 1998 and 2004 but its proposals were
considered in preparation of the DEIR. The construction methods adopted, the as-built location,
and the configuration of the Russia Wharf tunnel have been reviewed and no new impacts to the
DEIR alignment have been identified.
Amtrak and MBTA commuter rail ridership trends:
Observations show that ridership on the MBTA commuter rail system is still skewed towards the
lines leading to South Station (61% of all passengers, compared to 39% at North Station), which
is in line with observations from the DEIR.
While direct comparison to DEIR ridership projections can be difficult due to changes in
methodology since 2000 and the difficulty of collecting commuter rail ridership data, some
patterns were observed. While Amtrak ridership into both North and South Stations has grown
steadily since 2001, MBTA commuter rail ridership started to decline in 2009 and has declined
approximately 15% between then and 2015. So although Amtrak has basically grown in line with
projections (and is expected to expand dramatically in this century under the NEC planning
process), MBTA ridership has fallen short of optimistic projections in the DEIR by about half.
Demographic trends:
Current demographic data shows that while both population and employment increased in the
study area between 2000 and 2016, the area is not growing quite as fast as the DEIR projected it
would. Geographically, employment growth was distributed throughout the study area, with a large
rate of change in the Gateway Cities. Sixty percent of employment growth since 2003 occurred in
the Other MBTA service area, indicating that growth is not tightly concentrated in one area. The
Other MBTA service area also saw large absolute growth in both population and employment,
while the smaller, more concentrated Core MBTA service area accounted for a larger proportion
of population growth in the study area (42%) than jobs (22%).
A study of transit-oriented development shows that 9,627 new housing units and 6.5 million square
feet of new commercial space were either completed or under construction within a half-mile of a
commuter rail station since 2010. Nearly half of this was located in the Core service area, the Other
MBTA service area accounted for 35% and 40% of residential and commercial development,
respectively, and fewer than 1,000 new housing units and less than 1 million square feet of
commercial area are located in the Gateway Cities. The vast majority of currently planned future
housing and commercial development around commuter rail stations is slated to be sited in the
Core MBTA service area.

Desired end state:
The Guiding Principles and Study Objectives for this assessment are largely in line with those
developed for the DEIR, with the added influence of the Focus40 outcomes. These will influence
the development of service plans for the NSRL alternatives, and will help MassDOT make
decisions on future investment once the NSRL study is completed.

A1 DUAL-MODE LOCOMOTIVE REPORT

NORTH SOUTH RAIL LINK REASSESSMENT
Dual-Mode Locomotives Technical Memorandum
October 12, 2017
2
1 Purpose of Document
This memo augments the “Context Review Technical Memorandum” prepared for the North South
Rail Link (NSRL) assessment and specifically identifies issues and opportunities related to the use of
dual-mode locomotives (also called dual-power locomotives or electro-diesel locomotives) in the
context of the NSRL project.
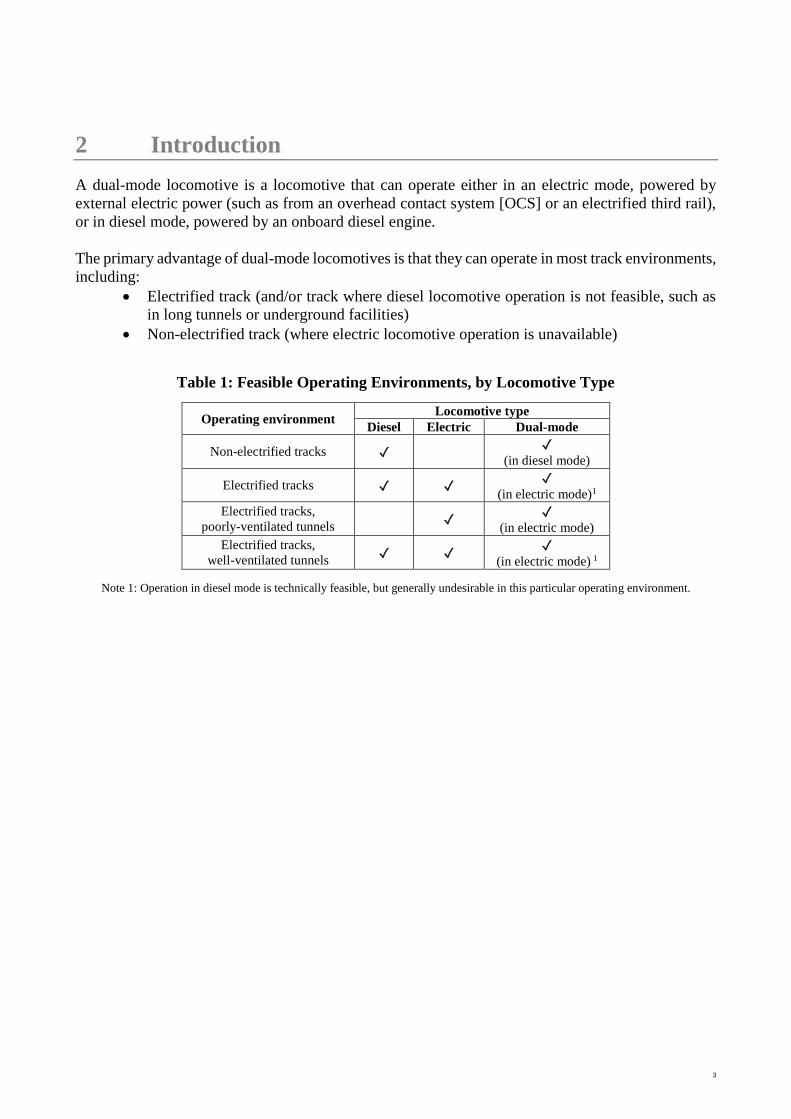
3
2 Introduction
A dual-mode locomotive is a locomotive that can operate either in an electric mode, powered by
external electric power (such as from an overhead contact system [OCS] or an electrified third rail),
or in diesel mode, powered by an onboard diesel engine.
The primary advantage of dual-mode locomotives is that they can operate in most track environments,
including:
Electrified track (and/or track where diesel locomotive operation is not feasible, such as
in long tunnels or underground facilities)
Non-electrified track (where electric locomotive operation is unavailable)
Table 1: Feasible Operating Environments, by Locomotive Type
Operating environment Locomotive type
Diesel Electric Dual-mode
Non-electrified tracks ✓ ✓
(in diesel mode)
Electrified tracks ✓ ✓ ✓
(in electric mode)1
Electrified tracks,
poorly-ventilated tunnels ✓
✓
(in electric mode)
Electrified tracks,
well-ventilated tunnels ✓ ✓
✓
(in electric mode) 1
Note 1: Operation in diesel mode is technically feasible, but generally undesirable in this particular operating environment.
4
3 Advantages and Disadvantages
3.1 Performance
Recent examples of dual-mode locomotives (specifically in North America, the ALP-45DP) have
shown that dual-mode locomotives can offer performance in diesel and electric mode similar to that
of single-mode diesel locomotives and electric locomotives, respectively.
An assessment by NJ Transit concluded that Bombardier ALP-45DP dual-mode locomotives, when
operating in diesel mode, provide acceleration greater than provided by its existing diesel locomotives
and, when operating in electric mode, provide acceleration comparable to its existing electric
locomotives.1
Similarly, an assessment by Toronto Metrolinx concluded that Bombardier ALP-45DP dual-mode
locomotives could provide approximately the same power and acceleration as their current diesel
locomotives (MPI MP40PH-3C locomotives) when operating in diesel mode and 1.8 times the power
of their current diesel locomotives when operating in electric mode.2
3.2 Operations
3.2.1 One-seat rides
A key benefit of dual-mode locomotives is the ability to provide “one-seat rides” to passengers.
Without the benefit of dual-mode locomotives, certain routes would have to be operated as separate
routes (thereby requiring a transfer for passengers) or with separate locomotive fleets.
3.2.2 Mode change procedure
Some current dual-mode locomotives can change modes (between diesel operation and electric
operation) while in motion, while others must be stopped to complete the change. Stationary mode
changes, when required, typically take less than two minutes to complete. If required mode changes
can be completed during station stops, the mode change itself can have little impact on overall run
time.
New Jersey Transit’s ALP-45DP locomotives currently only change modes while stationary, and the
mode change generally takes 100 seconds to complete.3 Eventually, mode changes are expected to be
possible while in motion.
Both Genesis P32AC-DM and EMD DM30AC locomotives are able to change modes while in
motion.
1 “NJ Transit ALP45DP Project Status.” NJ Transit, March 2009. 2 “Rolling Stock Technology Assessment.” Metrolinx, December 2010. 3 “The ALP-45 Dual Power Locomotive.” Hooley, Martin, and Roy, 2011.

5
3.3 Costs
3.3.1 Locomotive capital costs
A recent study compared locomotive capital costs by technology, including dual-mode locomotives
(see Table 2 below). The EPA sets “tiered” standards for locomotive emissions. A higher-numbered
tier (e.g., Tier 4) requires lower emissions than lower-numbered tiers.) Capital costs can generally be
expected to be greater for a dual-mode locomotive than for an equivalent diesel locomotive. (Note
that “diesel-electric” refers to a typical diesel locomotive, not a dual-mode locomotive.)
Table 2: Estimated Locomotive Capital Costs, by Technology4
Type of
operation
Tier 2
dual-mode
Tier 4
diesel-electric
Estimated Tier 4
dual-mode
Passenger ~$9 M $6 M $12 M
Freight n/a $3 M $6 M
The costs of the New Jersey Transit’s Bombardier ALP-45DP can be compared with the capital cost
of MBTA’s most-recently acquired MPI HSP46 locomotives (see Table 3 below).
Table 3: Locomotive Capital Costs
Locomotive Purchase
year Locomotives
Average
unit cost
(2017 dollars)
Bombardier ALP-45DP dual-mode 2008 26 $13.5 M
Bombardier ALP-45DP dual-mode 2010 9 $9.8 M
MPI HSP46 diesel-electric 2010 20 $6.4 M
MPI HSP46 diesel-electric 2012 20 $6.7 M
3.3.2 Operating and maintenance costs
Dual-mode locomotives generally have maintenance costs comparable to single-mode diesel
locomotives. However, dual-mode locomotives have significantly lower operating costs when
operating in electric mode than when operating in diesel mode (see Table 4 below).
Table 4: Locomotive Operating and Maintenance Costs, by Type5
Item
Cost per
locomotive-mile
(2017 dollars)
Cost per
locomotive mile,
compared to diesel
operations
Diesel propulsion $8.12 - 78%
Electric propulsion $1.80
Diesel locomotive
maintenance $5.66
0% Diesel/electric
dual-mode maintenance $5.66
4 “Technology Assessment: Freight Locomotives.” California Air Resources Board, November 2016. Costs adjusted to
2017 dollars. 5 West of Hudson Regional Transit Access Study Alternatives Analysis Phase I Screening Report Appendix D- Capital
Cost and O&M Costs – Methodology and Estimates. Metro-North Railroad, May 2012. Costs adjusted to 2017 dollars.
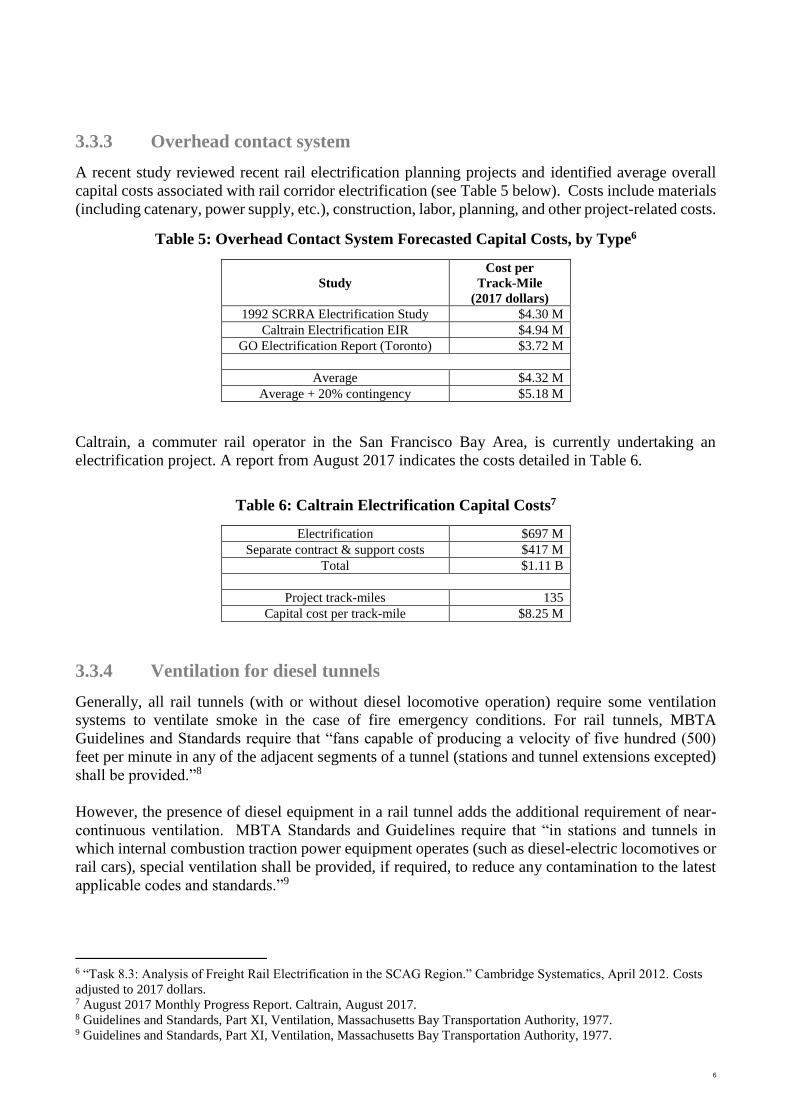
6
3.3.3 Overhead contact system
A recent study reviewed recent rail electrification planning projects and identified average overall
capital costs associated with rail corridor electrification (see Table 5 below). Costs include materials
(including catenary, power supply, etc.), construction, labor, planning, and other project-related costs.
Table 5: Overhead Contact System Forecasted Capital Costs, by Type6
Study
Cost per
Track-Mile
(2017 dollars)
1992 SCRRA Electrification Study $4.30 M
Caltrain Electrification EIR $4.94 M
GO Electrification Report (Toronto) $3.72 M
Average $4.32 M
Average + 20% contingency $5.18 M
Caltrain, a commuter rail operator in the San Francisco Bay Area, is currently undertaking an
electrification project. A report from August 2017 indicates the costs detailed in Table 6.
Table 6: Caltrain Electrification Capital Costs7
Electrification $697 M
Separate contract & support costs $417 M
Total $1.11 B
Project track-miles 135
Capital cost per track-mile $8.25 M
3.3.4 Ventilation for diesel tunnels
Generally, all rail tunnels (with or without diesel locomotive operation) require some ventilation
systems to ventilate smoke in the case of fire emergency conditions. For rail tunnels, MBTA
Guidelines and Standards require that “fans capable of producing a velocity of five hundred (500)
feet per minute in any of the adjacent segments of a tunnel (stations and tunnel extensions excepted)
shall be provided.”8
However, the presence of diesel equipment in a rail tunnel adds the additional requirement of near-
continuous ventilation. MBTA Standards and Guidelines require that “in stations and tunnels in
which internal combustion traction power equipment operates (such as diesel-electric locomotives or
rail cars), special ventilation shall be provided, if required, to reduce any contamination to the latest
applicable codes and standards.”9
6 “Task 8.3: Analysis of Freight Rail Electrification in the SCAG Region.” Cambridge Systematics, April 2012. Costs
adjusted to 2017 dollars. 7 August 2017 Monthly Progress Report. Caltrain, August 2017. 8 Guidelines and Standards, Part XI, Ventilation, Massachusetts Bay Transportation Authority, 1977. 9 Guidelines and Standards, Part XI, Ventilation, Massachusetts Bay Transportation Authority, 1977.
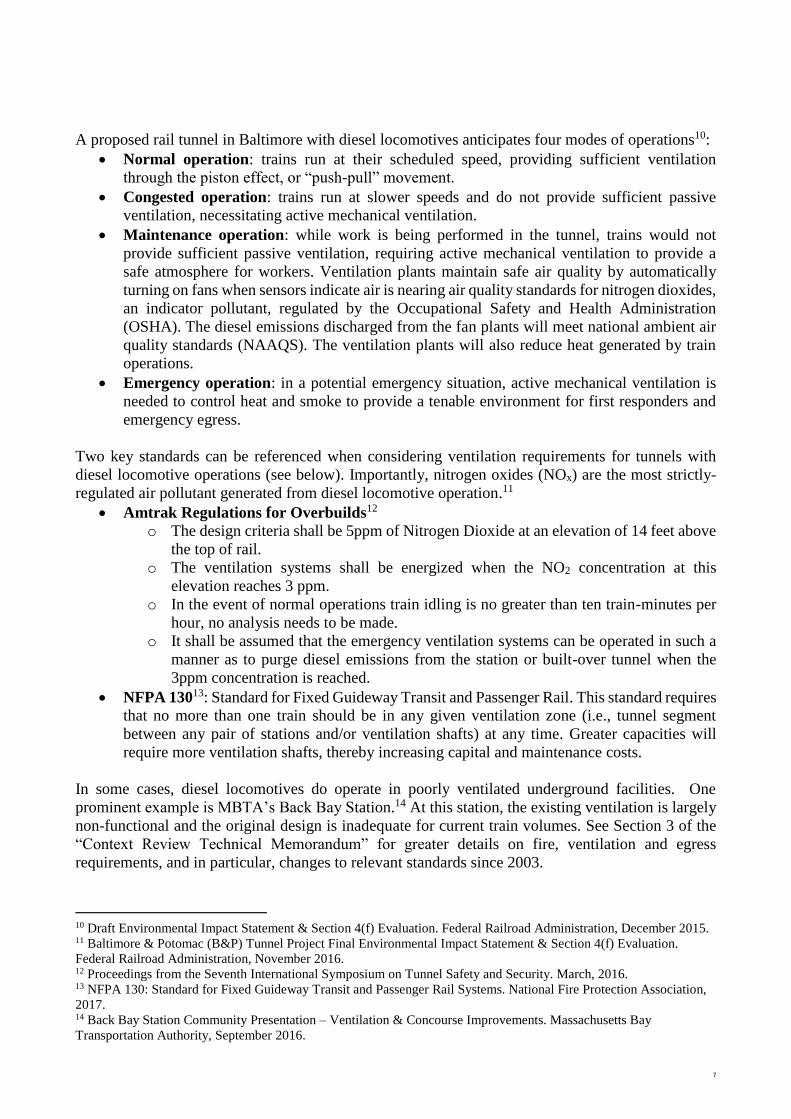
7
A proposed rail tunnel in Baltimore with diesel locomotives anticipates four modes of operations10:
Normal operation: trains run at their scheduled speed, providing sufficient ventilation
through the piston effect, or “push-pull” movement.
Congested operation: trains run at slower speeds and do not provide sufficient passive
ventilation, necessitating active mechanical ventilation.
Maintenance operation: while work is being performed in the tunnel, trains would not
provide sufficient passive ventilation, requiring active mechanical ventilation to provide a
safe atmosphere for workers. Ventilation plants maintain safe air quality by automatically
turning on fans when sensors indicate air is nearing air quality standards for nitrogen dioxides,
an indicator pollutant, regulated by the Occupational Safety and Health Administration
(OSHA). The diesel emissions discharged from the fan plants will meet national ambient air
quality standards (NAAQS). The ventilation plants will also reduce heat generated by train
operations.
Emergency operation: in a potential emergency situation, active mechanical ventilation is
needed to control heat and smoke to provide a tenable environment for first responders and
emergency egress.
Two key standards can be referenced when considering ventilation requirements for tunnels with
diesel locomotive operations (see below). Importantly, nitrogen oxides (NOx) are the most strictly-
regulated air pollutant generated from diesel locomotive operation.11
Amtrak Regulations for Overbuilds12
o The design criteria shall be 5ppm of Nitrogen Dioxide at an elevation of 14 feet above
the top of rail.
o The ventilation systems shall be energized when the NO2 concentration at this
elevation reaches 3 ppm.
o In the event of normal operations train idling is no greater than ten train-minutes per
hour, no analysis needs to be made.
o It shall be assumed that the emergency ventilation systems can be operated in such a
manner as to purge diesel emissions from the station or built-over tunnel when the
3ppm concentration is reached.
NFPA 13013: Standard for Fixed Guideway Transit and Passenger Rail. This standard requires
that no more than one train should be in any given ventilation zone (i.e., tunnel segment
between any pair of stations and/or ventilation shafts) at any time. Greater capacities will
require more ventilation shafts, thereby increasing capital and maintenance costs.
In some cases, diesel locomotives do operate in poorly ventilated underground facilities. One
prominent example is MBTA’s Back Bay Station.14 At this station, the existing ventilation is largely
non-functional and the original design is inadequate for current train volumes. See Section 3 of the
“Context Review Technical Memorandum” for greater details on fire, ventilation and egress
requirements, and in particular, changes to relevant standards since 2003.
10 Draft Environmental Impact Statement & Section 4(f) Evaluation. Federal Railroad Administration, December 2015. 11 Baltimore & Potomac (B&P) Tunnel Project Final Environmental Impact Statement & Section 4(f) Evaluation.
Federal Railroad Administration, November 2016. 12 Proceedings from the Seventh International Symposium on Tunnel Safety and Security. March, 2016. 13 NFPA 130: Standard for Fixed Guideway Transit and Passenger Rail Systems. National Fire Protection Association,
2017. 14 Back Bay Station Community Presentation – Ventilation & Concourse Improvements. Massachusetts Bay
Transportation Authority, September 2016.

8
4 Precedents in North America
Today in North America, dual-mode locomotives only operate in four general corridors:
Three corridors to/from underground rail stations in New York City (Pennsylvania Station
[Penn Station] and Grand Central Terminal)
o New Jersey Transit services to Penn Station
o Amtrak and MTA Metro-North Railroad services to Penn Station and Grand Central
Station, respectively
o Long Island Rail Road services to Penn Station
Réseau de transport métropolitain (AMT) commuter rail in the Greater Montreal region.
4.1 New York area
Generally, on rail corridors to/from New York City, electrified track infrastructure exists in various
forms within the immediate vicinity of the city. In this region, dual-mode locomotives operate in
electric mode. Farther away from the city, however, these corridors generally lack electrified track
infrastructure and dual-mode locomotives accordingly operate in diesel mode.
Electrified track infrastructure in the New York region includes:
Overhead contact system (OCS) / catenary
“Over-running” electrified third rail (i.e., locomotive electrical “shoes” ride upon an
electrified third rail)
“Under-running” electrified third rail (i.e., locomotive electrical “shoes” ride beneath an
electrified third rail)
Source: Next Generation Equipment Committee Figure 1: Track Electrification in New York Area

9
4.1.1 New Jersey Transit Bombardier ALP-45DP
New Jersey Transit, New Jersey’s public transportation corporation, currently operates 35
Bombardier ALP-45DP (Dual Power) dual-mode locomotives. The first of these locomotives began
operation in 2011. These locomotives predominantly operate in diesel mode except in the North River
Tunnels and New York Penn Station, where they operate in electric mode, powered by AC overhead
catenary.
Source: Bombardier Transportation
Figure 2: Bombardier ALP-45DP Locomotive
Penn Station in Manhattan is the eastern terminus for the New Jersey Transit rail system (see
Figure 3 below). In 1903, New York state law prohibited the operation of steam and diesel
locomotives in the Park Avenue Tunnel; the law had since been expanded to apply to other New York
City rail tunnels (including the North River Tunnels, through which New Jersey Transit trains
operate).15
These dual-mode locomotives were key to achieving a longtime goal of New Jersey Transit: one-seat
rides from non-electrified portions of its network to New York Penn Station.16 Prior to the arrival of
the ALP-45DP locomotives, passengers who began trips on non-electrified lines had to transfer to
electrified trains at Newark Penn Station or Secaucus Junction.
15 “Standardized Technical Specification- PRIIA Dual Mode (DC 3rd Rail) Passenger Locomotive- Requirements
Document.” Amtrak, 2015. 16 “The ALP-45 Dual Power Locomotive.” Hooley, Martin, and Roy, 2011.

10
Source: New Jersey Transit, 2017
Figure 3: New Jersey Transit Service
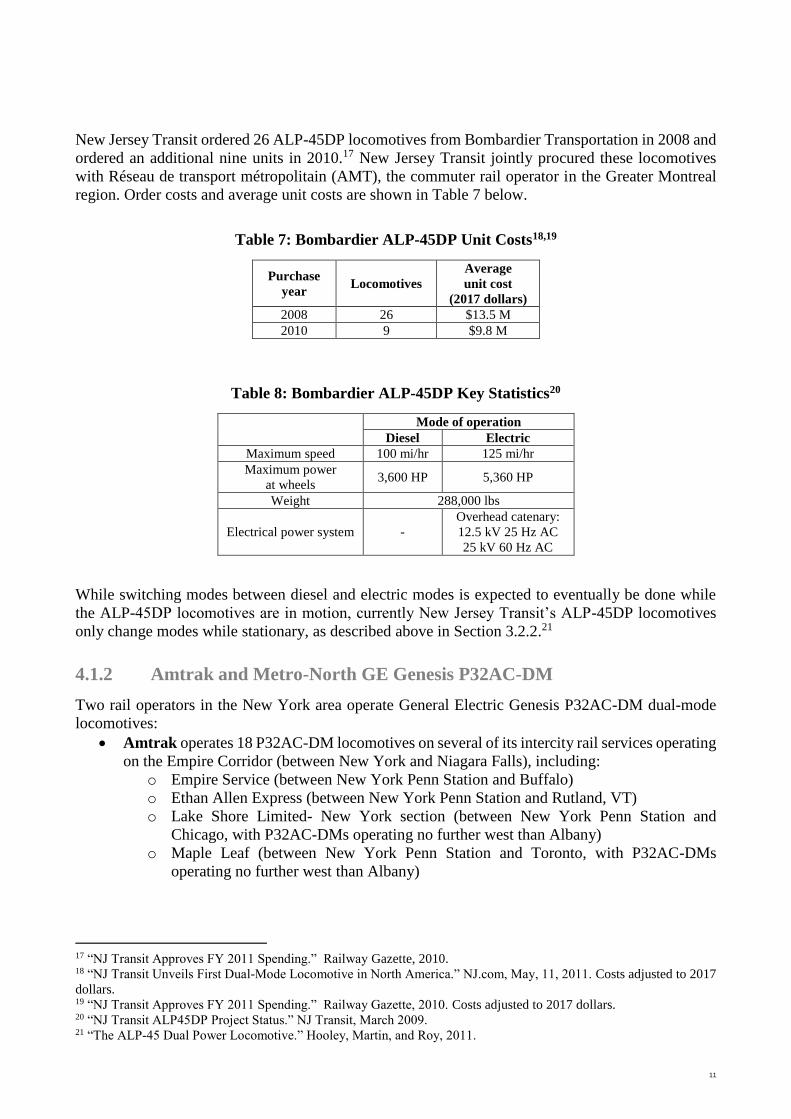
11
New Jersey Transit ordered 26 ALP-45DP locomotives from Bombardier Transportation in 2008 and
ordered an additional nine units in 2010.17 New Jersey Transit jointly procured these locomotives
with Réseau de transport métropolitain (AMT), the commuter rail operator in the Greater Montreal
region. Order costs and average unit costs are shown in Table 7 below.
Table 7: Bombardier ALP-45DP Unit Costs18,19
Purchase
year Locomotives
Average
unit cost
(2017 dollars)
2008 26 $13.5 M
2010 9 $9.8 M
Table 8: Bombardier ALP-45DP Key Statistics20
Mode of operation
Diesel Electric
Maximum speed 100 mi/hr 125 mi/hr
Maximum power
at wheels 3,600 HP 5,360 HP
Weight 288,000 lbs
Electrical power system -
Overhead catenary:
12.5 kV 25 Hz AC
25 kV 60 Hz AC
While switching modes between diesel and electric modes is expected to eventually be done while
the ALP-45DP locomotives are in motion, currently New Jersey Transit’s ALP-45DP locomotives
only change modes while stationary, as described above in Section 3.2.2.21
4.1.2 Amtrak and Metro-North GE Genesis P32AC-DM
Two rail operators in the New York area operate General Electric Genesis P32AC-DM dual-mode
locomotives:
Amtrak operates 18 P32AC-DM locomotives on several of its intercity rail services operating
on the Empire Corridor (between New York and Niagara Falls), including:
o Empire Service (between New York Penn Station and Buffalo)
o Ethan Allen Express (between New York Penn Station and Rutland, VT)
o Lake Shore Limited- New York section (between New York Penn Station and
Chicago, with P32AC-DMs operating no further west than Albany)
o Maple Leaf (between New York Penn Station and Toronto, with P32AC-DMs
operating no further west than Albany)
17 “NJ Transit Approves FY 2011 Spending.” Railway Gazette, 2010. 18 “NJ Transit Unveils First Dual-Mode Locomotive in North America.” NJ.com, May, 11, 2011. Costs adjusted to 2017
dollars. 19 “NJ Transit Approves FY 2011 Spending.” Railway Gazette, 2010. Costs adjusted to 2017 dollars. 20 “NJ Transit ALP45DP Project Status.” NJ Transit, March 2009. 21 “The ALP-45 Dual Power Locomotive.” Hooley, Martin, and Roy, 2011.

12
MTA Metro-North Railroad (a service of the Metropolitan Transportation Authority
[MTA]) operates 31 P32AC-DM locomotives, on all of its routes that serve New York Grand
Central Terminal.
These locomotives primarily operate in diesel mode except when approaching Penn Station or the
Park Avenue Tunnel and Grand Central Terminal, where they operate in electric mode, powered by
a 650-V DC electrified third rail. Amtrak’s P32AC-DM locomotives use retractable shoes to contact
the “over-running” third rail to access Penn Station. Metro-North’s P32AC-DM locomotives use
fixed shoes to contact the “under-running” third rail to access Grand Central Terminal.
Importantly, both Amtrak and Metro-North P32AC-DM locomotives do not have thermal ratings to
operate continuously in electric mode; their use is limited to approximately ten minutes of electric
operation near and in the New York electrified tunnels.22 P32AC-DM locomotives are relatively
weak in electric mode, owing to moderate voltage third-rail shoes.
Source: Wikipedia User Bebo2good1
Figure 4: GE P32AC-DM Locomotive
Amtrak services on the Empire Corridor terminate at New York Penn Station and several Metro-
North routes terminate at Grand Central Terminal. Services to Grand Central Terminal also pass
through the Park Avenue Tunnel to access the station.
22 “Rolling Stock Technology Assessment.” Metrolinx, December 2010.

13
Source: Metropolitan Transportation Authority 2017
Figure 5: Metro-North Service to New York Grand Central Terminal

14
Both Amtrak and Metro-North placed their P32AC-DMs into operation between 1995 and 1998.
Table 9: GE P32AC-DM Key Statistics 23
Mode of operation
Diesel Electric
Maximum speed 110 mi/hr 60 mi/hr
Maximum power
at wheels 3,200 HP -
Weight 274,400 lbs
Electrical power system - Third rail:
600 V DC
4.1.3 Long Island Rail Road EMD DM30AC
The Long Island Rail Road (LIRR, a service of the MTA) currently operates 21 EMD DM30AC dual-
mode locomotives.
The locomotives primarily operate direct service on LIRR’s non-electrified lines in eastern Long
Island (including the Port Jefferson, Oyster Bay, and Montauk branches), on the western electrified
main lines, through the East River tunnels, and into New York Penn Station.
Source: Adam E. Moreira
Figure 6: EMD DM30AC Locomotive
23 “Amtrak Genesis Series 2.” General Electric Transportation, 2006.
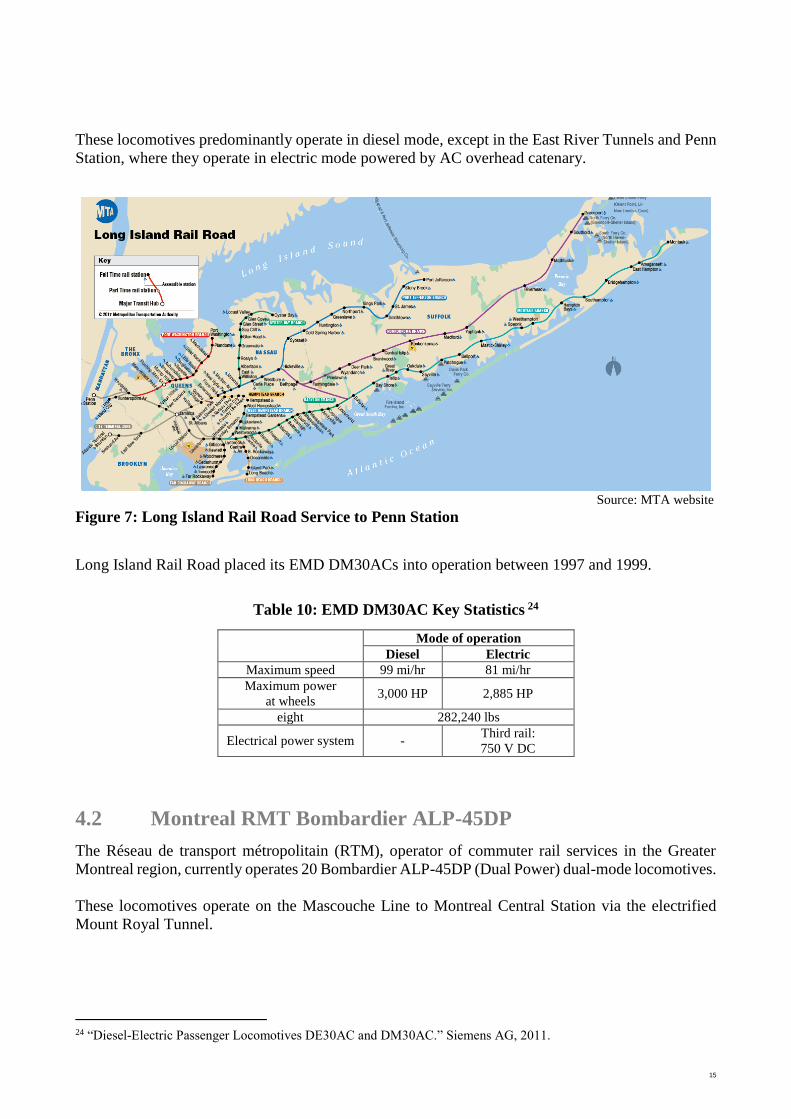
15
These locomotives predominantly operate in diesel mode, except in the East River Tunnels and Penn
Station, where they operate in electric mode powered by AC overhead catenary.
Source: MTA website
Figure 7: Long Island Rail Road Service to Penn Station
Long Island Rail Road placed its EMD DM30ACs into operation between 1997 and 1999.
Table 10: EMD DM30AC Key Statistics 24
Mode of operation
Diesel Electric
Maximum speed 99 mi/hr 81 mi/hr
Maximum power
at wheels 3,000 HP 2,885 HP
eight 282,240 lbs
Electrical power system - Third rail:
750 V DC
4.2 Montreal RMT Bombardier ALP-45DP
The Réseau de transport métropolitain (RTM), operator of commuter rail services in the Greater
Montreal region, currently operates 20 Bombardier ALP-45DP (Dual Power) dual-mode locomotives.
These locomotives operate on the Mascouche Line to Montreal Central Station via the electrified
Mount Royal Tunnel.
24 “Diesel-Electric Passenger Locomotives DE30AC and DM30AC.” Siemens AG, 2011.

16
Source: Wikipedia User Mtlfiredude
Figure 8: Bombardier ALP-45DP Locomotive
Source: AMT, 2010
Figure 9: RTM Mascouche Line
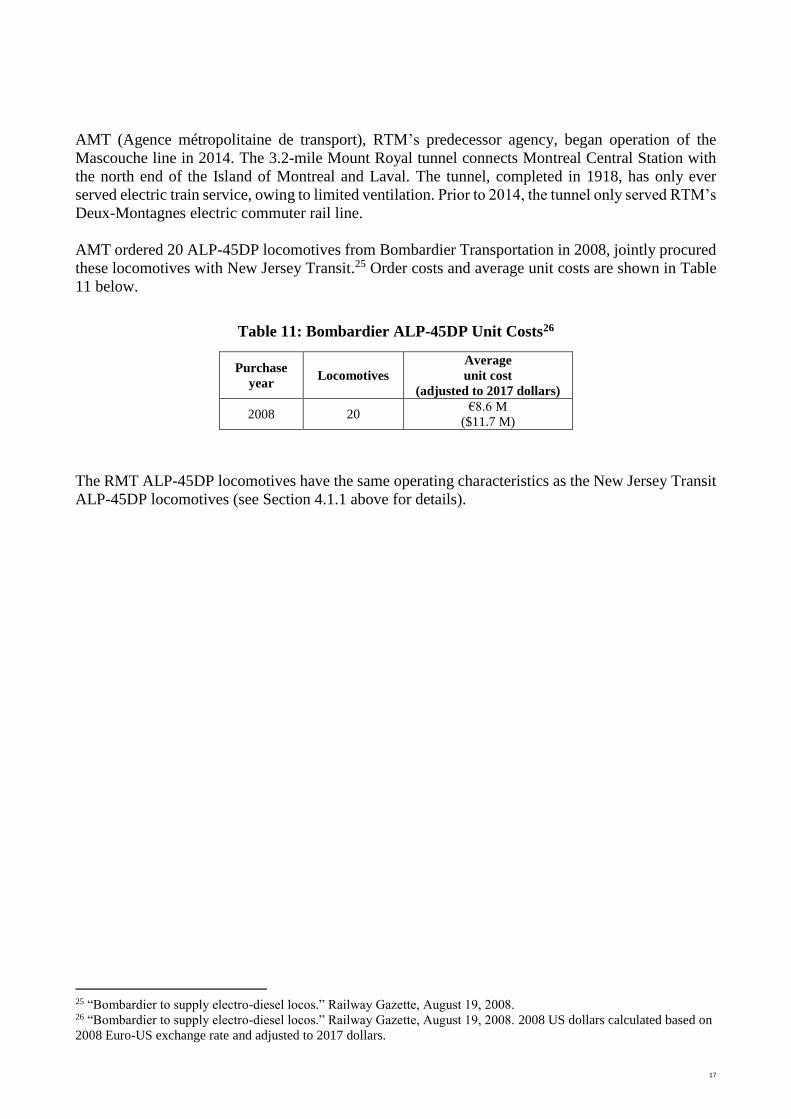
17
AMT (Agence métropolitaine de transport), RTM’s predecessor agency, began operation of the
Mascouche line in 2014. The 3.2-mile Mount Royal tunnel connects Montreal Central Station with
the north end of the Island of Montreal and Laval. The tunnel, completed in 1918, has only ever
served electric train service, owing to limited ventilation. Prior to 2014, the tunnel only served RTM’s
Deux-Montagnes electric commuter rail line.
AMT ordered 20 ALP-45DP locomotives from Bombardier Transportation in 2008, jointly procured
these locomotives with New Jersey Transit.25 Order costs and average unit costs are shown in Table
11 below.
Table 11: Bombardier ALP-45DP Unit Costs26
Purchase
year Locomotives
Average
unit cost
(adjusted to 2017 dollars)
2008 20 €8.6 M
($11.7 M)
The RMT ALP-45DP locomotives have the same operating characteristics as the New Jersey Transit
ALP-45DP locomotives (see Section 4.1.1 above for details).
25 “Bombardier to supply electro-diesel locos.” Railway Gazette, August 19, 2008. 26 “Bombardier to supply electro-diesel locos.” Railway Gazette, August 19, 2008. 2008 US dollars calculated based on
2008 Euro-US exchange rate and adjusted to 2017 dollars.
18
5 Fire and Life-Safety
NFPA 130 includes the following discussion about the potential use of onboard fire suppression in
Annex G.
5.1 Onboard fire suppression system
Onboard fire suppression systems (e.g., mist systems), while relatively new in the passenger rail and
fixed guideway industry, have been successfully used on a number of passenger rail and diesel
powered light rail systems outside of the United States.
The applications for this type of system can range from protection of diesel engine compartments to
the interior of passenger rail vehicles. The use of a fire suppression system could:
save lives in the incident vehicle during a fire condition;
minimize damage to the train, tunnel, and the station which it has entered;
reduce or eliminate potential use of station sprinklers;
reduce or eliminate the need for down-stands;
significantly reduce the impact of designing for fire emergencies on station architecture;
reduce tunnel ventilation capacities by approximately 40 percent;
reduce the number and/or diameter of emergency ventilation fans at each end of each station
and within the tunnels, thus reducing structure sizes;
decrease shaft airflow cross section areas by approximately 40 percent; and
decrease tunnel ventilation shaft portal areas that correspond to the required fan
sizes/velocities
When considering the addition of a fire suppression system, several design challenges should be
met by the rail vehicle manufacturer. These challenges include:
type of extinguishing medium used, which all must be approved,
size and number of medium canisters and where on the vehicle to place them for easy access
for maintenance;
resultant increased energy consumption caused by the increase in weight of the suppression
system;
maintenance intervals;
cost of the system;
testing and commissioning of the system; and
cost and difficulties associated with retrofitting vehicles
It is recommended that the potential use of an onboard fire suppression system be evaluated in the
next project phase to explore its feasibility and cost-benefit to the NSRL.

19
6 Battery Technology in Trains
Batteries and ultracapacitors have begun to be tested by railroads in North America and worldwide.
These technologies are widely expected to continue to improve considerably in the coming years,
bringing down prices and improving their economic feasibility.
6.1 Precedents in streetcars and trams
Catenary-free tram systems have seen increased development in recent years.
Catenary-free trams systems fall into two categories27:
Systems based on on-board energy storage devices (including onboard batteries or
supercapacitors)
Systems based on continuous power source from the track bed (including third rail or
inductive energy transfer devices)
Examples of catenary-free technology include:
Nice Tramway, Nice, France28: Line 1 opened in 2007 with a railcar fleet equipped with
onboard nickel metal hydride batteries to power railcars through two public plazas (Place
Masséna and Place Garibaldi). In these locations, overhead catenary systems were rejected
due to anticipated negative visual impacts.
Nanjing Hexi Tram, Nanjing, China29- The Hexi tram opened in 2014, with six vehicles
operating over 90 percent of the line without overhead catenary systems.
Source: Wikipedia user Myrabella
Figure 10: Nice Tramway, France
27 Catenary-free trams: Technology and recent developments. Global Mass Transit Report, 2014. 28 Nice Tramway, France. Railway-technology.com, 2014. 29 Bombardier’s Battery Powered Tram Sets Range Record. Bombardier, November 2015.

20
6.2 Precedents in mainline railroad operations
In 2007, GE unveiled a prototype hybrid road locomotive based on its Tier 2 locomotive platform.30
Onboard sodium nickel chloride batteries store energy dissipated during braking; this stored energy
can reduce fuel consumption by 15 percent and emissions by 50 percent.
Under GE’s concept, a Tier 4 locomotive could be retrofitted with similar batteries for cross-country
operation and continuously alternate between battery and diesel operation. For example, fully-
charged batteries could fully power such a locomotive for 30 miles, after which point the locomotive
would revert to Tier 4 diesel-electric operation. At 70 miles of diesel-electric operation, the batteries
would be fully charged, and the locomotive would resume battery operation, and so on.
6.3 Future projections
Battery technology has been examined for use in freight locomotives to reduce diesel fuel
consumption.31 One study forecasts that “future advances in battery technology could allow freight
interstate line haul locomotives to achieve up to a 25 percent reduction in diesel fuel consumption
and GHGs [greenhouse gases]. Further, these batteries may ultimately allow interstate line haul
locomotives to achieve zero exhaust emissions for a significant portion of operations in and around
railyards while in lower power settings.”
In the same study as above, three battery technology options were considered.32
All-battery, or near-all-battery, powered switch (yard) locomotives
On-board battery augmented freight interstate line haul locomotives (see also Section 6.2
above)
Battery tenders (railcars) to fully power freight interstate line haul locomotives over local to
regional distances
To date, several railroads have adopted battery-powered locomotives for use as lower-power switch
locomotives for yard operations.33 Examples include the Railpower (RP) Green Goat Battery-Hybrid
Switch Locomotive and the Norfolk Southern (NS) All-Battery Powered Switch (Yard) Locomotive.
However, current battery technologies lack the energy density to fully power freight interstate line
haul locomotives over long distances and under extreme duty cycles. Given that limitation, battery
tender cars appear to be a promising technology in the mid-term. These cars could be placed in
trainsets immediately behind a locomotive to power it through environmentally-sensitive areas.34 In
addition to having zero onboard emissions, the battery tender car concept would also have the specific
advantage of being compatible with existing electric locomotives.
30 “Task 8.3: Analysis of Freight Rail Electrification in the SCAG Region.” Cambridge Systematics, April 2012. 31 “Technology Assessment: Freight Locomotives.” California Air Resources Board, November 2016. 32 “Technology Assessment: Freight Locomotives.” California Air Resources Board, November 2016. 33 “Technology Assessment: Freight Locomotives.” California Air Resources Board, November 2016. 34 “Task 8.3: Analysis of Freight Rail Electrification in the SCAG Region.” Cambridge Systematics, April 2012.
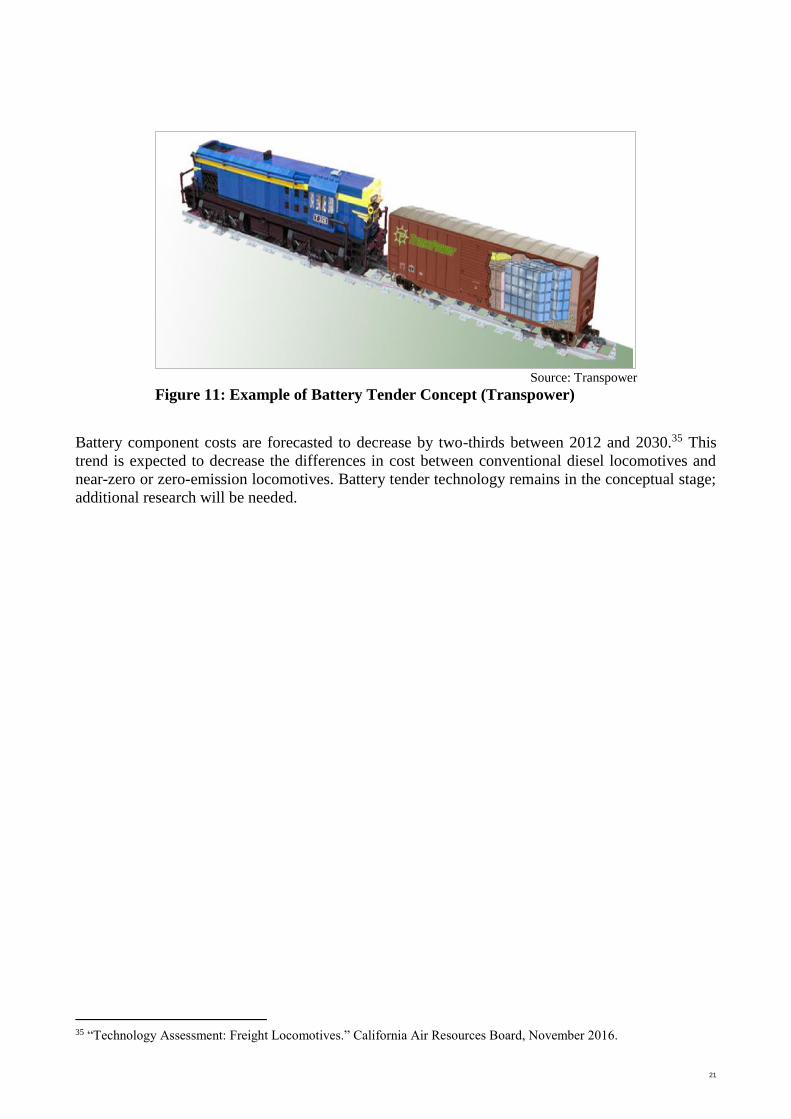
21
Source: Transpower
Figure 11: Example of Battery Tender Concept (Transpower)
Battery component costs are forecasted to decrease by two-thirds between 2012 and 2030.35 This
trend is expected to decrease the differences in cost between conventional diesel locomotives and
near-zero or zero-emission locomotives. Battery tender technology remains in the conceptual stage;
additional research will be needed.
35 “Technology Assessment: Freight Locomotives.” California Air Resources Board, November 2016.

A2 PROPOSED DESIGN CRITERIA DOCUMENT

BOSTON NORTH-SOUTH RAIL LINK DESIGN CRITERIA <-- SOURCES (HIDDEN)
MBTA COMMUTER RAIL AMTRAK 1996 SCHEMATIC DESIGN SSX PROJECT (Draft)
HORIZONTAL ALIGNMENT
Minimum Radius
Preferred See Figure 3.1 - 1,146' (5° curvature) - 1150'
Absolute 522' (11° curvature) - 717' (8° curvature) 459' (12° 30' curvature) 720'
In Stations 1,433' (4° curvature) - 5,730' (1° curvature) - 5750'
Spiral Transitions Required
L = 1.63*Eu*Vmax
(L in ft,
Eu in inches,
Vmax in mi/hr)
RequiredRequired on main line
approachesRequired
Minimum Curve Length (not incl. spirals) 100' 100' or 3x speed in mi/hr - 100' or 3x speed in mi/hr 100' or 3x speed in mi/hr
Minimum Tangent Length between Curves/Spirals
100'
(exceptions possible
where design speed
<= 50 mi/hr)
100' or 3x speed in mi/hr - 100' or 3x speed in mi/hr 100' or 3x speed in mi/hr
Minimum Actual Superelevation 1"
1/2"
(except curves less than 0°-
15’ curvature)
- 1" 1"
Maximum Actual Superelevation -
Absolute 6" 5.5" 6" 6" 6"
Desirable where freight trains operate or trains
regularly stop4" - - -
Desirable in stations 3" - - -
Maximum Unbalanced Superelevation
Preferred 1.5" - 1.5" 1.5" 1.5"
Absolute 2.75" 4" 2.75" 2.75" 2.75"
Turnouts
Mainline crossovers and junctions No. 20
No. 32.75 (speeds <= 80
mi/hr)
No. 20 (speeds <= 45
mi/hr)
(Advanced tech. turnouts)
- - No. 20
Mainline crossovers and junctions with insufficient
room or design speed <= 30 mi/hrNo. 15
No. 15 (speeds <=30 mi/hr)
No. 10 (speeds <= 15
mi/hr)
(Advanced tech. turnouts)
- -
No. 15
No. 10 (speeds <= 15
mi/hr)
Sidetrack connections to main line, yard leads, and
yard tracksNo. 10 - - - No. 10
Within yards (exceptional) No. 8 - - - No. 8

MBTA COMMUTER RAIL AMTRAK 1996 SCHEMATIC DESIGN SSX PROJECT (Draft)
VERTICAL ALIGNMENT
Maximum Grade
Preferred 0.7% - 2% 0.7% 2%
Absolute 1.5%1.5%
2.5 % (max compensated)
3% (tangent),
reduced on curves1.5% 3%
In Stations, Preferred 0.5% 0% 0.5% 0.5% (in terminal area) 0.50%
In Stations, Absolute 0.75% - 1%0.75% (in terminal area)
2.0% (in station)1%
Turnouts and special trackwork 3% - 3% - 3%
Minimum Length of Constant Grade
Preferred 200' - - - 200'
Absolute 75' - - - 75'
Compensation of grade for curvature1° horizontal curve =
0.04% vertical grade
1° horizontal curve =
0.04% vertical grade-
Preferred - 1° horizontal
curve =
0.04% vertical grade
Minimum - no
compensation
Maximum Rate of Vertical Grade Change
Preferred
0.05% per 100 ft (sags)
0.10% per 100 ft (crests)
(AREA critieria in 1996)
0.4% per 100 ft 0.5% per 100 ft - 0.5% per 100 ft
Absolute 0.8% per 100 ft (sags) - 1% per 100 ft - 1% per 100 ft
Maximum Lateral Force
Preferred - - 0.02 g -
Absolute - - 0.05 g -
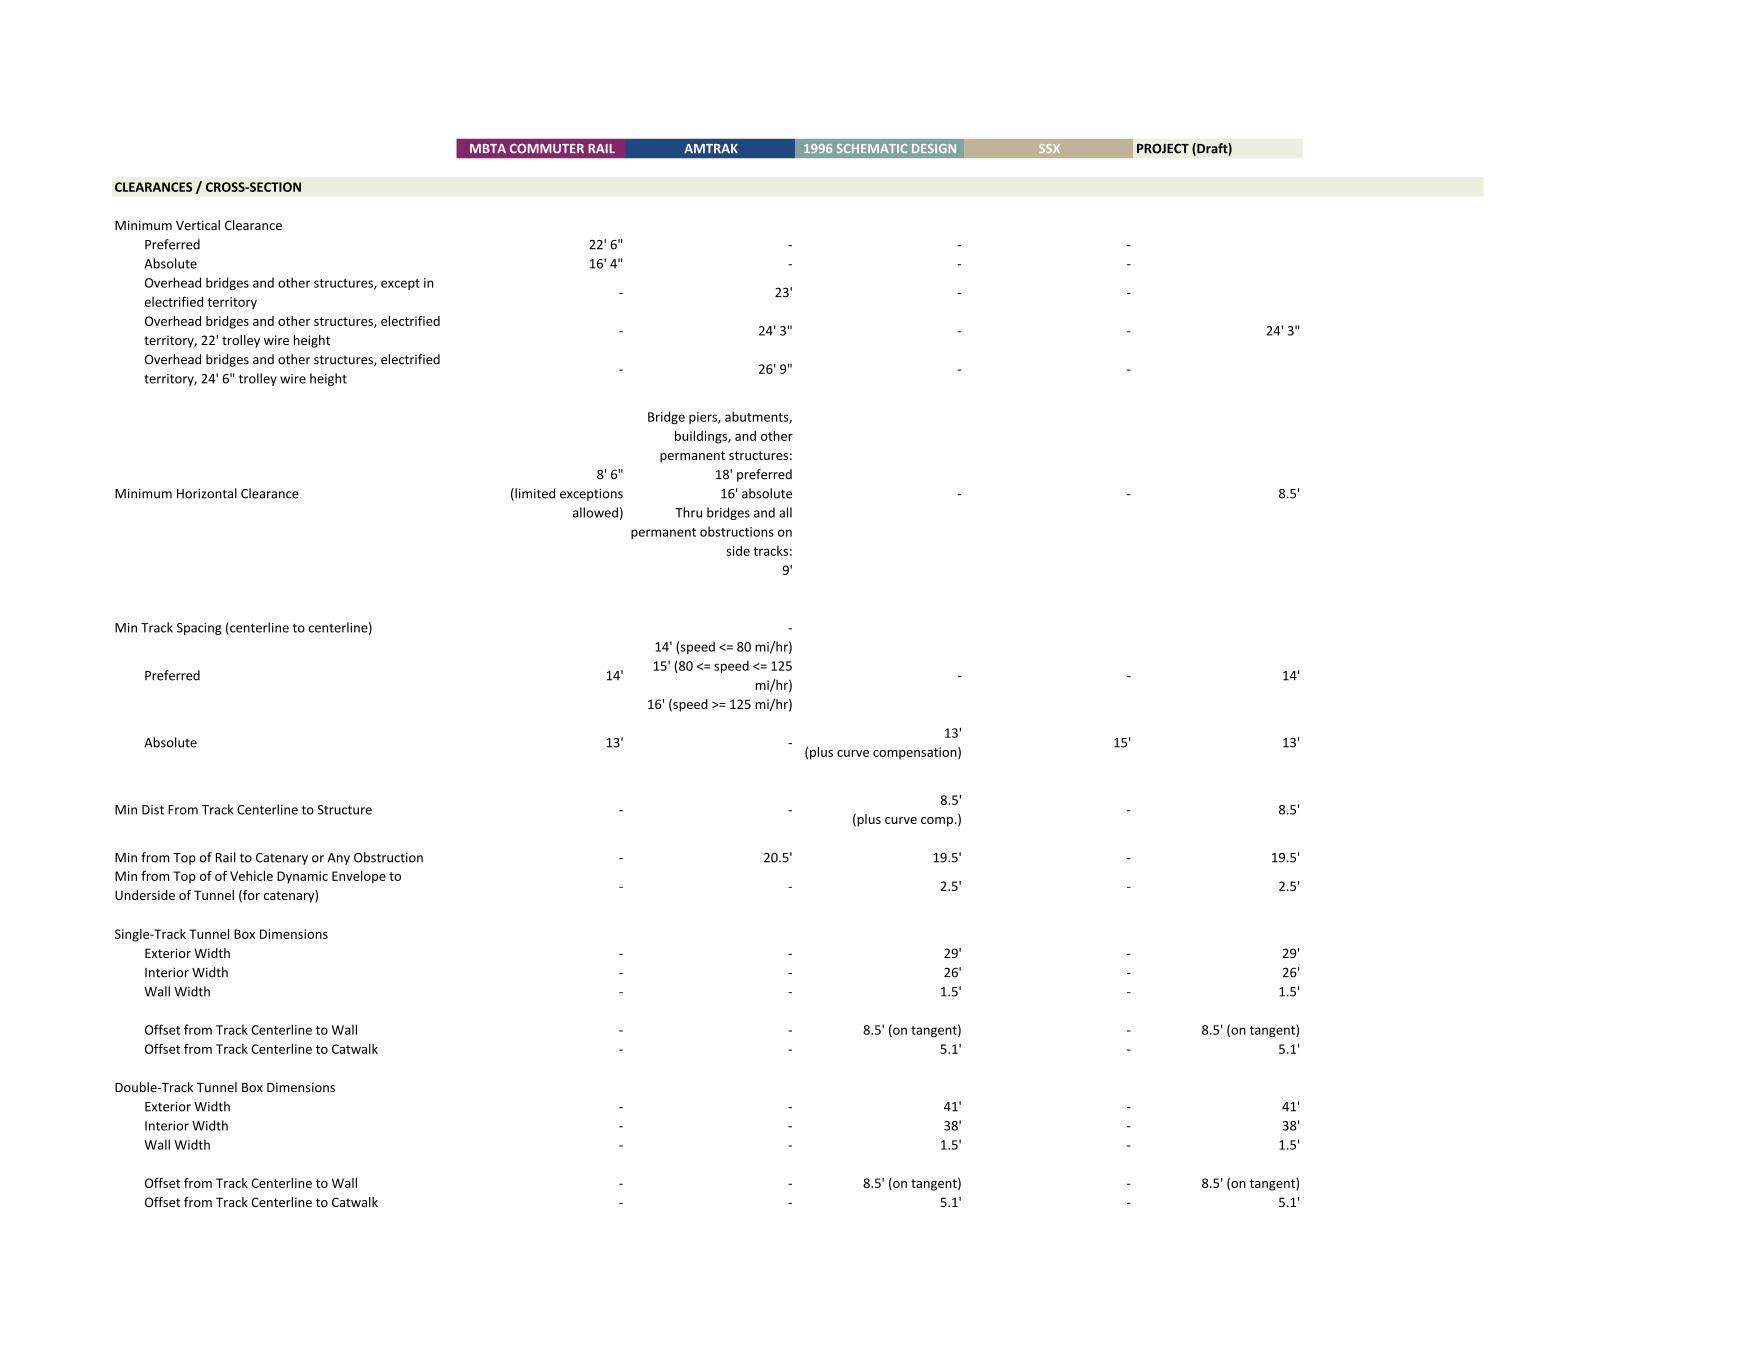
MBTA COMMUTER RAIL AMTRAK 1996 SCHEMATIC DESIGN SSX PROJECT (Draft)
CLEARANCES / CROSS-SECTION
Minimum Vertical Clearance
Preferred 22' 6" - - -
Absolute 16' 4" - - -
Overhead bridges and other structures, except in
electrified territory- 23' - -
Overhead bridges and other structures, electrified
territory, 22' trolley wire height- 24' 3" - - 24' 3"
Overhead bridges and other structures, electrified
territory, 24' 6" trolley wire height- 26' 9" - -
Minimum Horizontal Clearance
8' 6"
(limited exceptions
allowed)
Bridge piers, abutments,
buildings, and other
permanent structures:
18' preferred
16' absolute
Thru bridges and all
permanent obstructions on
side tracks:
9'
- - 8.5'
Min Track Spacing (centerline to centerline) -
Preferred 14'
14' (speed <= 80 mi/hr)
15' (80 <= speed <= 125
mi/hr)
16' (speed >= 125 mi/hr)
- - 14'
Absolute 13' -13'
(plus curve compensation)15' 13'
Min Dist From Track Centerline to Structure - -8.5'
(plus curve comp.)- 8.5'
Min from Top of Rail to Catenary or Any Obstruction - 20.5' 19.5' - 19.5'
- - 2.5' - 2.5'
Single-Track Tunnel Box Dimensions
Exterior Width - - 29' - 29'
Interior Width - - 26' - 26'
Wall Width - - 1.5' - 1.5'
Offset from Track Centerline to Wall - - 8.5' (on tangent) - 8.5' (on tangent)
Offset from Track Centerline to Catwalk - - 5.1' - 5.1'
Double-Track Tunnel Box Dimensions
Exterior Width - - 41' - 41'
Interior Width - - 38' - 38'
Wall Width - - 1.5' - 1.5'
Offset from Track Centerline to Wall - - 8.5' (on tangent) - 8.5' (on tangent)
Offset from Track Centerline to Catwalk - - 5.1' - 5.1'
Min from Top of of Vehicle Dynamic Envelope to
Underside of Tunnel (for catenary)
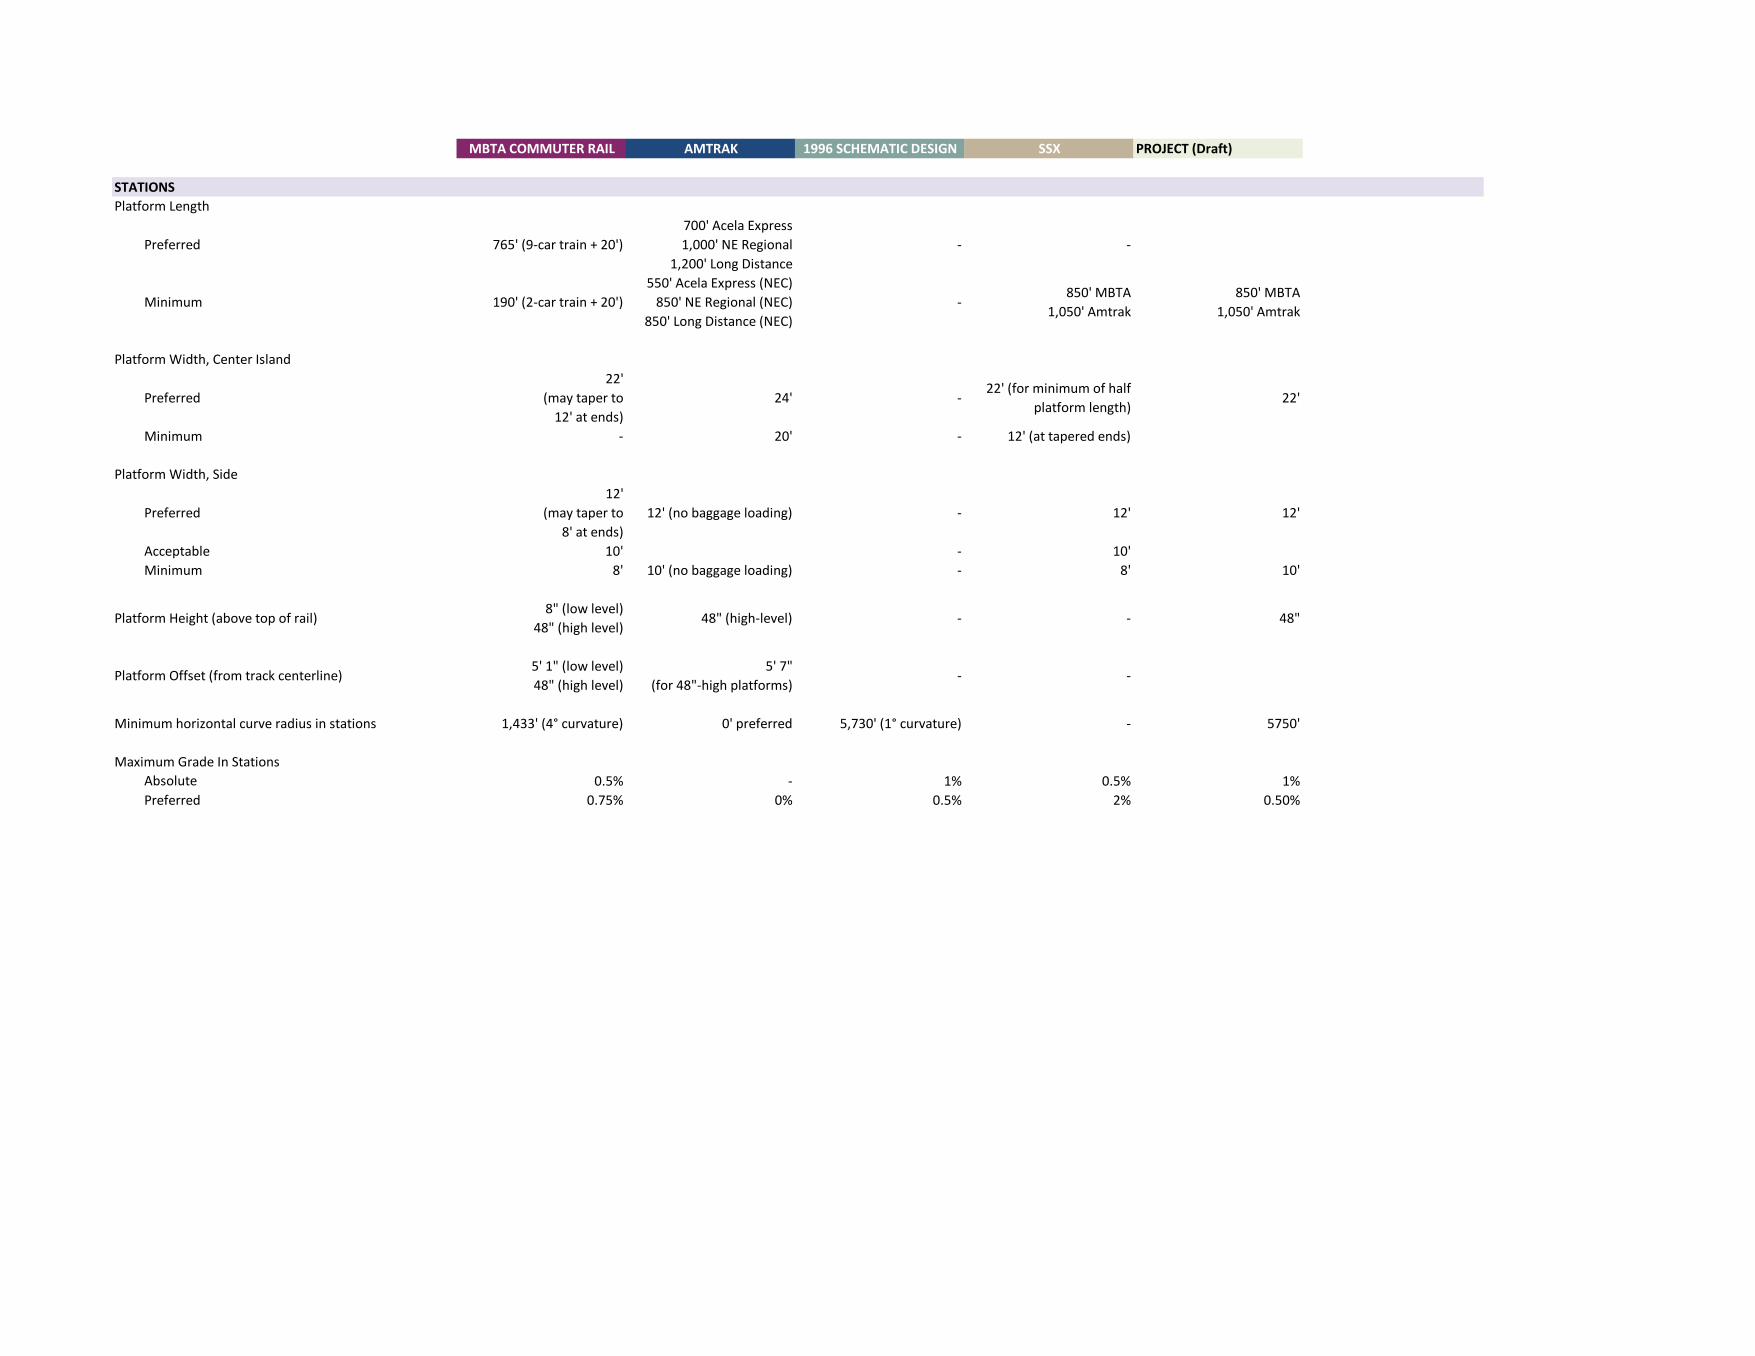
MBTA COMMUTER RAIL AMTRAK 1996 SCHEMATIC DESIGN SSX PROJECT (Draft)
STATIONS
Platform Length
Preferred 765' (9-car train + 20')
700' Acela Express
1,000' NE Regional
1,200' Long Distance
- -
Minimum 190' (2-car train + 20')
550' Acela Express (NEC)
850' NE Regional (NEC)
850' Long Distance (NEC)
-850' MBTA
1,050' Amtrak
850' MBTA
1,050' Amtrak
Platform Width, Center Island
Preferred
22'
(may taper to
12' at ends)
24' -22' (for minimum of half
platform length)22'
Minimum - 20' - 12' (at tapered ends)
Platform Width, Side
Preferred
12'
(may taper to
8' at ends)
12' (no baggage loading) - 12' 12'
Acceptable 10' - 10'
Minimum 8' 10' (no baggage loading) - 8' 10'
Platform Height (above top of rail)8" (low level)
48" (high level)48" (high-level) - - 48"
Platform Offset (from track centerline)5' 1" (low level)
48" (high level)
5' 7"
(for 48"-high platforms)- -
Minimum horizontal curve radius in stations 1,433' (4° curvature) 0' preferred 5,730' (1° curvature) - 5750'
Maximum Grade In Stations
Absolute 0.5% - 1% 0.5% 1%
Preferred 0.75% 0% 0.5% 2% 0.50%
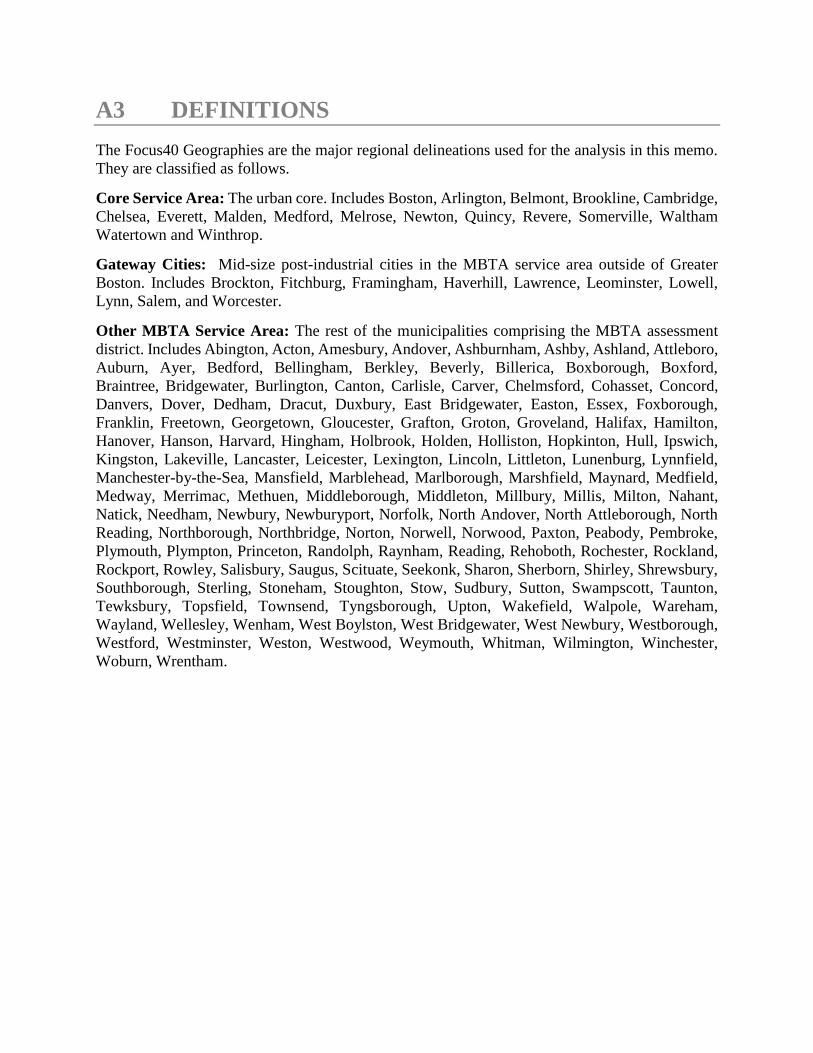
A3 DEFINITIONS
The Focus40 Geographies are the major regional delineations used for the analysis in this memo.
They are classified as follows.
Core Service Area: The urban core. Includes Boston, Arlington, Belmont, Brookline, Cambridge,
Chelsea, Everett, Malden, Medford, Melrose, Newton, Quincy, Revere, Somerville, Waltham
Watertown and Winthrop.
Gateway Cities: Mid-size post-industrial cities in the MBTA service area outside of Greater
Boston. Includes Brockton, Fitchburg, Framingham, Haverhill, Lawrence, Leominster, Lowell,
Lynn, Salem, and Worcester.
Other MBTA Service Area: The rest of the municipalities comprising the MBTA assessment
district. Includes Abington, Acton, Amesbury, Andover, Ashburnham, Ashby, Ashland, Attleboro,
Auburn, Ayer, Bedford, Bellingham, Berkley, Beverly, Billerica, Boxborough, Boxford,
Braintree, Bridgewater, Burlington, Canton, Carlisle, Carver, Chelmsford, Cohasset, Concord,
Danvers, Dover, Dedham, Dracut, Duxbury, East Bridgewater, Easton, Essex, Foxborough,
Franklin, Freetown, Georgetown, Gloucester, Grafton, Groton, Groveland, Halifax, Hamilton,
Hanover, Hanson, Harvard, Hingham, Holbrook, Holden, Holliston, Hopkinton, Hull, Ipswich,
Kingston, Lakeville, Lancaster, Leicester, Lexington, Lincoln, Littleton, Lunenburg, Lynnfield,
Manchester-by-the-Sea, Mansfield, Marblehead, Marlborough, Marshfield, Maynard, Medfield,
Medway, Merrimac, Methuen, Middleborough, Middleton, Millbury, Millis, Milton, Nahant,
Natick, Needham, Newbury, Newburyport, Norfolk, North Andover, North Attleborough, North
Reading, Northborough, Northbridge, Norton, Norwell, Norwood, Paxton, Peabody, Pembroke,
Plymouth, Plympton, Princeton, Randolph, Raynham, Reading, Rehoboth, Rochester, Rockland,
Rockport, Rowley, Salisbury, Saugus, Scituate, Seekonk, Sharon, Sherborn, Shirley, Shrewsbury,
Southborough, Sterling, Stoneham, Stoughton, Stow, Sudbury, Sutton, Swampscott, Taunton,
Tewksbury, Topsfield, Townsend, Tyngsborough, Upton, Wakefield, Walpole, Wareham,
Wayland, Wellesley, Wenham, West Boylston, West Bridgewater, West Newbury, Westborough,
Westford, Westminster, Weston, Westwood, Weymouth, Whitman, Wilmington, Winchester,
Woburn, Wrentham.

A4 METHODOLOGY – DEMOGRAPHICS
A4.1 Data Sources
For the purposes of this analysis, the 2000 population and employment data used for the 2003
DEIR were compared to 2016 figures provided by the Central Transportation Planning Staff
(CTPS) of the MAPC. These datasets were linked at the municipality level, as this was the common
shared attribute between the two. Forecasts from the DEIR were taken from MAPC projections
between 1995 and 2025.
2000 household auto ownership rates were not available in the original dataset used in the 2003
DEIR analysis, so these were collected from the US Census. For a more consistent comparison,
these were analyzed relative to 2015 American Community Survey (ACS) data with the same
parameters.
TOD data were collected from the MassBuilds database administered by MAPC (described earlier
in Section 7).
A4.2 Analysis
Change in population and employment from 2000 to 2016 were calculated at the municipal level,
as well as for the three major geographies: the Core MBTA service area, Gateway Cities and the
suburban areas that make up the Other MBTA service area.
Auto ownership data (calculated as average vehicles per household) were analyzed for both 2000
and 2015, taking account of how these data have changed in the region during this period. This
information was obtained at the County Subdivision level from the 2000 Decennial Census and
2011-2015 American Community Survey 5-year Estimates.
The TOD analysis was conducted by querying an MAPC database created in May of 2017 that
displays housing units and commercial square footage within a half-mile walkshed of a transit
station. This measurement is commonly used in planning as a boundary within which TOD is
evaluated. The commuter rail stations were identified and development data within a half-mile of
their locations were analyzed.
A4.3 Constraints/Limitations
While CTPS data for 2016 (and projections for 2040) is available at the more fine-grained Traffic
Analysis Zone (TAZ) level (used for regional travel demand modeling), the 2000 data that was
utilized in the DEIR is only available at the municipality level. This necessitated the aggregation
of 2016 TAZs to match the municipalities included in the 2000 study area. Boundaries for these
municipalities were found to be fairly consistent between 2000 and 2016.

The 2016 and 2040 TAZs also cover a wider area than the 2000 data. This meant that some of the
suburban areas and three Gateway Cities (Fitchburg, Leominster and Worcester) could not be
included in the direct comparison of 2000 to 2016 data. However, the joined datasets cover a large
enough service area for the commuter rail to be generally representative of population and
employment trends between the publication of the DEIR and today.
Because information on auto ownership in the region was not available in the original 2000 dataset,
data for 2000 and 2015 needed to be collected separately from the US Census and ACS databases.
These two time points are very reasonably close to the 2000-to-2016 data utilized for the rest of
this analysis, and so were deemed suitable.
TOD data were provided by MAPC as a summary of the MassBuilds database. TOD is understood
to mean any development occurring within a half-mile walkshed of a transit station, including all
rail and bus rapid transit stations. For the purposes of this review, only development around
commuter rail stations was considered. The data contain information on the aggregate intensity of
development (number of residential units or square footage of commercial space) for each station,
but not for individual development projects. In addition to completed development and
development under construction, this data contains information for projects that are planned or
projected to be completed in the future, based on input from various stakeholders. Planned projects
have entered into some phase of the land use planning process, while projected developments are
expected to begin the planning process at some (undetermined) point in the future. The summary
of this data should be understood to represent new development, and not a net change in housing
or commercial development with respect to any year.

A5 PROJECT PRINCIPLES AND OBJECTIVES
A5.1 NSRL Study Objectives
The MassDOT North-South Rail Link Study considers the technical feasibility, constructability
and cost of connecting the MBTA rail lines terminating in South Station with those rail lines
terminating in North Station. These stations are about one mile distant.
The objectives of the MassDOT North-South Rail Link Study are:
1. Reassess prior work that analyzed the North South Rail Link and conduct and summarize
the necessary technical and financial analysis.
2. Consider the current technical viability of the previous alignments and consider potential
alternative alignments.
3. Consider the impacts and benefits of improved tunnel technology and tunnel construction
experience on the NSRL project compared to the previous study.
4. Consider the implications of any changes to the regulatory environment compared to the
previous study.
5. Identify NSRL project costs (design, construction, management) and project risks.
6. Assess NSRL project costs and benefits compared to alternative MBTA rail capacity and
expansion projects (identified and under consideration) that assume the absence of NSRL.
7. Consider overall project benefits (i.e., ridership increases, service reliability improvements,
economic development) and quantify the benefits at a level appropriate to this stage in the
project development process.
8. Deliver definitive information to MassDOT that enables decisions on whether to proceed
with additional planning and design of a NSRL, including whether the project right-of-way
should be protected indefinitely, acknowledging that in its absence new development along
the possible route may further complicate such a connection in the future.
A5.2 NSRL Guiding Principles
This document summarizes the identified rationale for and desired “end-state” resulting from the
North South Rail Link Project, and sets out the goals that define these. The Problem Statement
provides detail on the regional context within which this project is proposed, highlighting the
inadequacies in the system. The Guiding Principles are the framework for creating the service
plans for the different service alternatives, and they are the standards by which these alternatives
will be evaluated.
The North-South Rail Link Project proposes connecting the MBTA rail lines terminating in South
Station with those rail lines terminating in North Station through a downtown Boston tunnel.
Problem Statement: The MBTA’s commuter rail network is a divided system, with South
Station-destined trains serving the Back Bay and the commercial core of downtown Boston, while
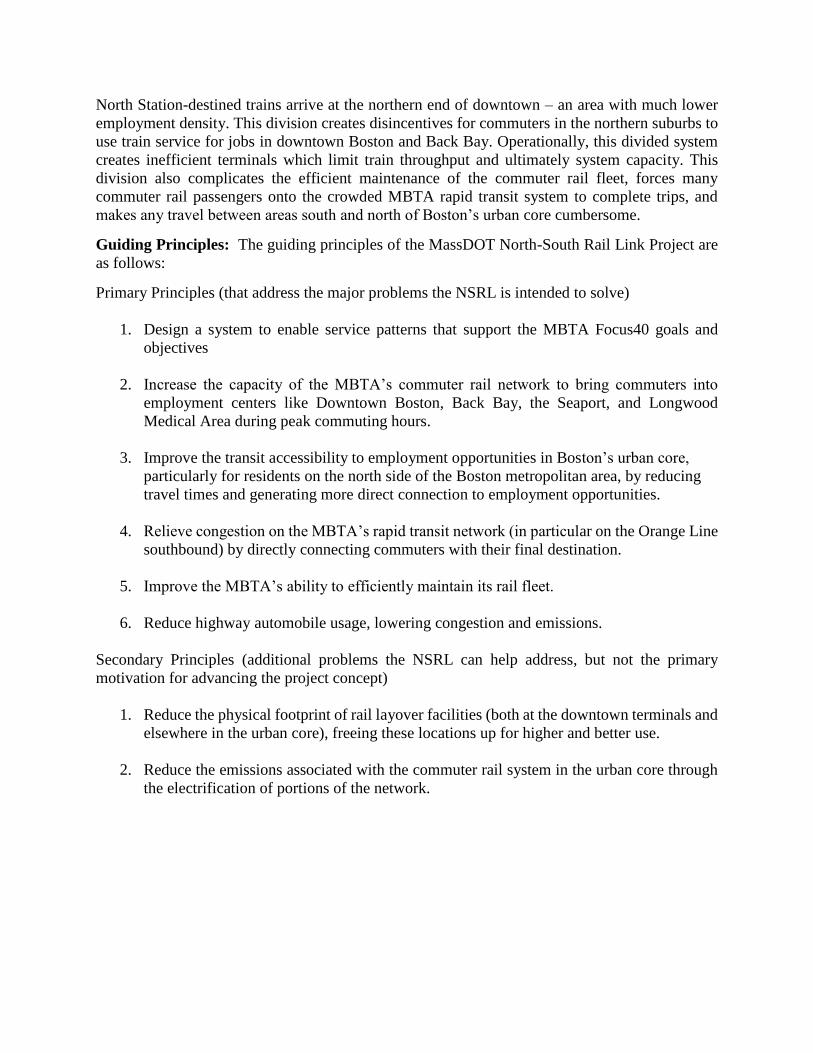
North Station-destined trains arrive at the northern end of downtown – an area with much lower
employment density. This division creates disincentives for commuters in the northern suburbs to
use train service for jobs in downtown Boston and Back Bay. Operationally, this divided system
creates inefficient terminals which limit train throughput and ultimately system capacity. This
division also complicates the efficient maintenance of the commuter rail fleet, forces many
commuter rail passengers onto the crowded MBTA rapid transit system to complete trips, and
makes any travel between areas south and north of Boston’s urban core cumbersome.
Guiding Principles: The guiding principles of the MassDOT North-South Rail Link Project are
as follows:
Primary Principles (that address the major problems the NSRL is intended to solve)
1. Design a system to enable service patterns that support the MBTA Focus40 goals and
objectives
2. Increase the capacity of the MBTA’s commuter rail network to bring commuters into
employment centers like Downtown Boston, Back Bay, the Seaport, and Longwood
Medical Area during peak commuting hours.
3. Improve the transit accessibility to employment opportunities in Boston’s urban core,
particularly for residents on the north side of the Boston metropolitan area, by reducing
travel times and generating more direct connection to employment opportunities.
4. Relieve congestion on the MBTA’s rapid transit network (in particular on the Orange Line
southbound) by directly connecting commuters with their final destination.
5. Improve the MBTA’s ability to efficiently maintain its rail fleet.
6. Reduce highway automobile usage, lowering congestion and emissions.
Secondary Principles (additional problems the NSRL can help address, but not the primary
motivation for advancing the project concept)
1. Reduce the physical footprint of rail layover facilities (both at the downtown terminals and
elsewhere in the urban core), freeing these locations up for higher and better use.
2. Reduce the emissions associated with the commuter rail system in the urban core through
the electrification of portions of the network.