north northamptonshire strategic housing market ... 08 07 nn shma update technical...north...
TRANSCRIPT
North Northamptonshire Strategic Housing Market Assessment Update
Final Technical Report
August 2012
www.housingvision.co.uk

North Northamptonshire Strategic Housing Market Assessment Update Final Technical Report Housing Vision (HV)
Project Director: Dr Richard Turkington
Director The Housing Vision Consultancy 59 Stocks Lane Newland Malvern Worcs. WR13 5AZ 01886 833118 (phone) 01886 830102 (phone/fax) 07714 106386 (mobile) [email protected] www.housingvision.co.uk
Date: 7th August 2012
Contents Page 1.0 Introduction 4 2.0 What key influences and drivers are at work in
the housing market? 10
3.0 What choices do consumers have in the
housing market? 83
4.0 What is the current pattern of need and demand
for affordable housing? 123
5.0 What is the projected requirement for housing? 135
APPENDICES A Gross household incomes by ward in East
Northants, mean and lower quartile 151

1. Introduction 1.1 Context and approach 1.1 The final National Planning Policy Framework issued in March 2012,
establishes at paragraph 159 that Local Planning Authorities should have a clear understanding of housing requirements in their area and should prepare a Strategic Housing Market Assessment to identify the scale and mix of housing and the range of tenures that the local population is likely to require over the plan period which:
• meets household and population projections, taking into account migration and demographic change;
• addresses the need for all types of housing, including affordable housing and the needs of different groups in the community;
• and caters for all types of housing demand. 1.3 The context for this Update is the review by the North Northamptonshire
Joint Planning Unit (JPU) North of the Northamptonshire Joint Core Strategy (JCS) which covers the North Northamptonshire Housing Market area (the administrative areas of Corby Borough Council, Kettering Borough Council, East Northamptonshire Council and Wellingborough Borough Council).
1.4 A minimum housing requirement will be established in the JCS against
which 5 year housing land supply requirements will be assessed. It is important to ensure that this approach is based on a robust evidence base identifying housing need and demand within the HMA area.
1.5 The required evidence base is provided by this Update to the North
Northamptonshire Strategic Housing Market Assessment completed in 2007 for the period 2011 -2031. More specifically, it provides a brief refresh of the SHMA to ensure that it is up-to-date and satisfies the Paragraph 159 requirements of the draft Planning Policy Framework.
1.6 In accordance with government guidance on Housing Market Assessment,
the approach adopted makes maximum use of existing and available demographic, social and housing data to identify the dynamics of the local housing market; the ‘choices’ available to local people; the imbalances between need, demand and supply which constrain those choices and the projected future requirement for housing. The following table summarises the Core Outputs required and associated Key Questions which guide the structure of the report.
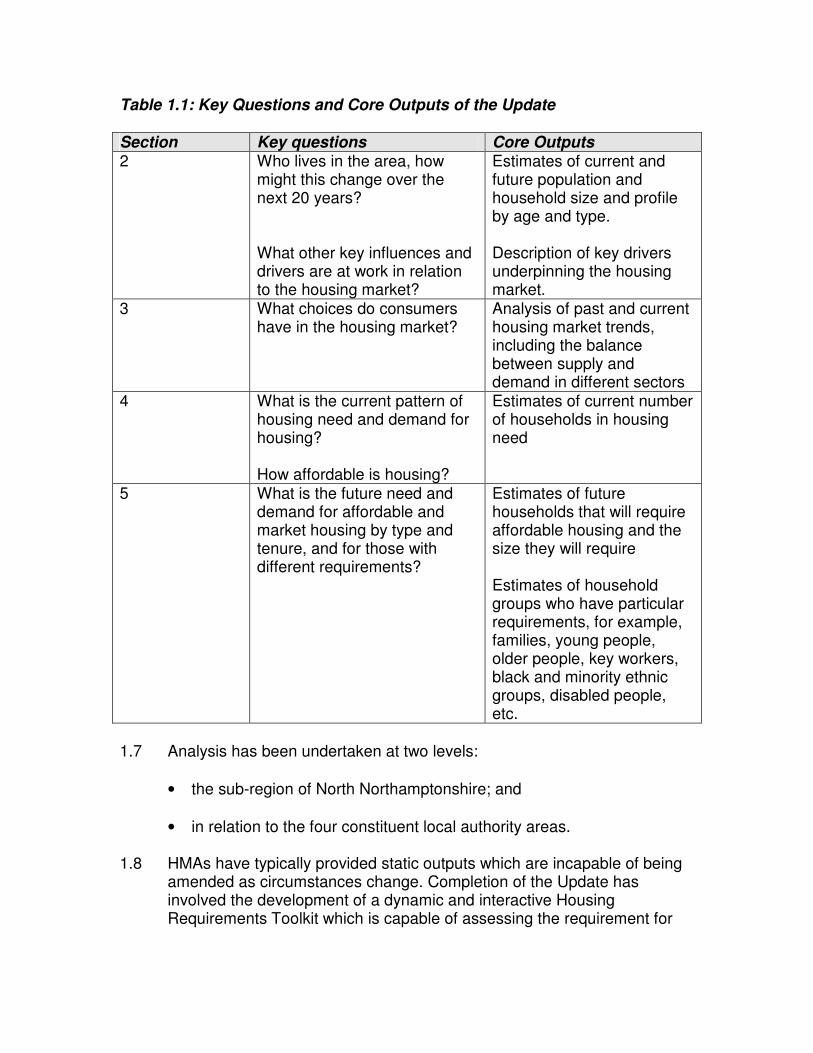
Table 1.1: Key Questions and Core Outputs of the Update Section Key questions Core Outputs 2 Who lives in the area, how
might this change over the next 20 years? What other key influences and drivers are at work in relation to the housing market?
Estimates of current and future population and household size and profile by age and type. Description of key drivers underpinning the housing market.
3 What choices do consumers have in the housing market?
Analysis of past and current housing market trends, including the balance between supply and demand in different sectors
4 What is the current pattern of housing need and demand for housing? How affordable is housing?
Estimates of current number of households in housing need
5 What is the future need and demand for affordable and market housing by type and tenure, and for those with different requirements?
Estimates of future households that will require affordable housing and the size they will require Estimates of household groups who have particular requirements, for example, families, young people, older people, key workers, black and minority ethnic groups, disabled people, etc.
1.7 Analysis has been undertaken at two levels:
• the sub-region of North Northamptonshire; and
• in relation to the four constituent local authority areas. 1.8 HMAs have typically provided static outputs which are incapable of being
amended as circumstances change. Completion of the Update has involved the development of a dynamic and interactive Housing Requirements Toolkit which is capable of assessing the requirement for
housing arising from household growth, including from older households. The application of the Toolkit is fully described in Section 5.
1.2 Data sources 1.9 The approach to the Update places primary reliance on secondary data
sources which are capable of continual updating, enabling monitoring of housing markets by housing and planning officers. The many data sources used are listed below accompanied by appropriate weblinks as follows:
• 2001 Census data, available through the NOMIS website at: https://www.nomisweb.co.uk/Default.asp
• ONS mid-year population estimates 2010 including components of population change, available through the ONS website at:
http://www.ons.gov.uk/ons/publications/re-reference-
tables.html?edition=tcm%3A77-231847
• ONS 2010-based subnational population projections, available through the ONS website at:
http://www.ons.gov.uk/ons/publications/re-reference-
tables.html?edition=tcm%3A77-246448
• Annual Population Survey for 2008 (commuting) and 2011 (occupational groups), available through the NOMIS website at:
https://www.nomisweb.co.uk/articles/554.aspx
• English Indices of Multiple Deprivation 2010, available through the CLG website at:
http://www.communities.gov.uk/publications/corporate/statistics/indices
2010
• Annual Survey of Hours and Earnings (ASHE) providing mean and median incomes form full and part-time work by local authority area, available through the NOMIS website at:
https://www.nomisweb.co.uk/Default.asp
• CACI PayCheck Profile data for gross household incomes by district and postcode. This is commissioned commercial data available by direct approach to CACI at:

http://www.caci.co.uk/
• Patient Register Data Service (PRDS), the National Health Service Central Register (NHSCR) and Higher Education Statistics Agency (HESA), available through the ONS website at:
http://www.ons.gov.uk/ons/publications/re-reference-tables.html?edition=tcm%3A77-218545
• Labour Force Survey (LFS) 2001, available through the Business Information and Skills (BIS) website at:
http://www.education.gov.uk/rsgateway/DB/VOL/v000303/index.shtml
• Land Registry property price post-coded data, available through the Land registry website at:
http://epsiplatform.eu/content/uk-land-registry-releases-data-free-
charge
• Valuation Office Agency (VOA) data on private rents, available through the VOA website at:
http://www.voa.gov.uk/corporate/statisticalReleases/120126_PrivateRe
ntalMarket.html
• Private rental data provided through the websites rightmove.co.uk and findaproperty.com, available at:
http://www.findaproperty.com/search-tools/ and http://www.yourrightmove.co.uk/
• Housing Strategy Statistical Appendix (HSSA) data for 2010-11 on affordable lettings, sales and completions, available through the CLG website at:
http://www.communities.gov.uk/publications/corporate/statistics/lahousi
ng201011
• COntinuous REcording of lettings and sales of social housing in England (CORE) data on affordable lettings and sales; available through the CORE website at:

https://core.communities.gov.uk/
• Affordable housing stock, applications and lettings data.
• Housing and planning data provided by constituent local authorities. 1.10 Please note that where percentages have been rounded this is indicated
in the text, and where applied, cumulative totals may slightly exceed or fall below 100%.
1.3 A note on boundaries 1.11 Data is collected and collated according to a range of boundaries which
seldom conform with each other. The requirement is to achieve the best fit possible and the boundaries used in this Study are summarised in the table below.
Table 1.2: boundaries used in the SHMA Update
Boundary Data Source Population profile, internal migration, travel to work and housing stock profile data
ONS
Household profile, deprivation and affordable lettings, sales and completions data
CLG
Incomes data CACI Property price data Land Registry Private rental data VOA, rightmove and
findaproperty.com
District Council areas
Affordable housing stock, applications and lettings data
Constituent local authorities
Incomes data
CACI
Constituent postcodes
Property price data Land Registry
1.12 Map 1.1 below identifies the constituent local authority areas.

9

10
2. What key influences and drivers are at work in the housing market?
2.1 Introduction 2.1 This section reviews the key drivers underpinning the housing market
which were identified by the 2007 SHMA, and progresses from an overview of key social indicators to a review demographic and especially household projections and the factors underpinning them including international, and especially internal migration; and commuting patterns.
2.2 Who lives in the area now? Population 2.2 The following table provides mid-year population estimates by age
bands provided, further detail of projected trends is provided in Table 2.6.
Table 2.1: mid-year population estimates by age bands, 2010, 000s
0 to 4 years
5 to 14 years
15 to 44 years
45 to 64 years
65 plus years All Ages Area
No. % No. % No. % No. % No. % No. %
Corby 4.3 7.7 6.8 12.2 21.6 38.7 14.7 26.3 8.5 15.2 55.8 100.0
East Northants. 5.2 6.1 10.9 12.8 31.3 36.7 23.8 27.9 14.1 16.5 85.3 100.0
Kettering 6.2 6.8 11 12.1 34.7 38.3 24.1 26.6 14.7 16.2 90.6 100.0
Wellingborough 4.9 6.5 9.1 12.0 28.8 38.0 20.5 27.1 12.5 16.5 75.7 100.0
North Northants. 20.6 6.7 37.8 12.3 116.4 37.9 83.1 27.0 49.8 16.2 307.4 100.0
East Midlands - 5.9 - 11.1 - 39.5 - 26.3 - 17.1 - 100.0
England and Wales - 6.2 - 11.3 - 40.5 - 25.4 - 16.6 - 100.0
(Source: ONS Mid-year Population Estimates, 2010, Table 9 Local Authority Quinary, ONS website) Key findings:
• The distribution of population by age band is remarkably similar for all local authorities although with a slight emphasis towards a younger population in Corby.
Ethnicity 2.3 The following table uses experimental data to estimate population by
ethnicity.

11
Table 2.2: ethnic origin, 2009
White Mixed
Asian or Asian British
Black or Black British
Chinese or
Other All
Groups Area No % No % No % No % No % No %
Corby 52.2 94.6 0.7 1.3 1.2 2.2 0.6 1.1 0.7 1.3 55.2 100.0
East Northants. 79.8 93.9 1.2 1.4 2.0 2.4 1.1 1.3 0.8 0.9 85.0 100.0
Kettering 84.4 93.7 1.2 1.3 2.7 3.0 1.0 1.1 0.8 0.9 90.1 100.0
Wellingborough 66.3 87.6 1.6 2.1 4.0 5.3 2.4 3.2 1.2 1.6 75.7 100.0
North Northants. 282.7 92.4 4.7 1.5 9.9 3.2 5.1 1.7 3.5 1.1 306.0 100.0
East Midlands 4,010.8 90.1 71.6 1.6 238.3 5.4 71.2 1.6 59.1 1.3 4,451.2 100.0
England and Wales - 87.9 - 1.8 - 5.9 - 2.8 - 1.6 - 100.0
(Source: ONS Experimental Population Estimates Mid-2009, ONS Website)
Key findings:
• The area is estimated to have a non-White population of less than 8%, ranging from over 12% in Wellingborough – which has the largest Asian/Asian British and Black/Black British populations, to just over 5% in Corby.
2.4 The following table reviews Occupation Groups and is drawn from the
June 2011 Annual Population Survey.

12
Employment Table 2.3: Occupation Groups for 16 to 74 year olds, June 2011
Corby East Northants Kettering Wellingborough North Northants East
Midlands
England and
Wales
Occupation groups No % No % No % No % No % % %
Managers and Senior Officials 1,400* 5.0 8,100 18.4 6,800 14.6 6,000 15.1 22,300 14.1 15.0 15.9
Professional Occupations 2,800* 9.7 4,700 10.6 6,300 13.6 1,900* 4.7 15,700 9.9 12.2 14.1
Associate Professional and Technical Operations 2,500* 8.7 6,800 15.5 6,000 13.0 3,600 9.0 18,900 11.9 13.4 14.9
Administrative and Secretarial Occupations 2,400* 8.4 3,900 9.0 1,500* 3.2 2,500* 6.3 10,300 6.5 10.0 10.7
Skilled Trades Occupations 2,300* 7.9 4,800 11.0 4,700 10.1 6,600 16.6 18,400 11.6 11.2 10.1
Personal Service Occupations 3,000* 10.4 3,800 8.7 2,400* 5.2 6,600 16.7 15,800 10.0 9.0 8.8
Sales and Customer Services Occupations 1,100* 3.8 2,400* 5.4 3500* 7.6 2,300* 5.8 9,300 5.9 7.3 7.3
Process, Plant and Machines Operatives 5,,300 18.7 4,800 10.8 4,800 10.4 5,200 13.1 20,100 12.7 8.4 6.5
Elementary Occupations 7,,800 27.3 4,300 9.8 10,300 22.3 5,000 12.7 27,400 17.3 13.2 11.3
Total 28,600 100 44,000 100 46,300 100 39,600 100 158,200 100 100 100
(Source: Annual Population Survey, NOMIS website)
Note: * Small sample sizes
Key findings:
• Compared with North Northants as a whole:
o Corby has a smaller proportion of managers and senior officials and higher proportions of process, plant and machine operatives and elementary occupations;
o Wellingborough has a smaller proportion of professional occupations and higher proportions of skilled trades and personal service occupations; and
o Kettering has a smaller proportion of personal service occupations.

13
Income 2.5 The following table profiles the proportion of households receiving
gross incomes by income bands. Incomes are for all household ad from all sources including social security benefits. This data has been applied in the Housing Requirements Toolkit.
Table 2.4: gross household income patterns, percentages, June 2012 Income band Corby East
Northants. Kettering W/borough
£0 - £5k 3.06 2.23 2.52 2.91
£5 - 10k 12.65 10.1 11.01 12.01
£10 - 15k 12.54 10.9 11.45 12.08
£15 – 20k 10.38 9.52 9.85 10.1
£20 – 25k 8.4 8.08 8.28 8.35
£25 - 30k 7.46 7.35 7.46 7.41
£30 – 35k 6.69 6.8 6.83 6.71
£35 - 40k 6.44 6.72 6.69 6.53
£40 - 45k 5.69 6.02 5.93 5.73
£45 - 50k 4.58 4.95 4.83 4.61
£50 - 55k 4.15 4.68 4.52 4.32
£55 – 60k 3.33 3.81 3.64 3.46
£60 - 65k 2.78 3.2 3.02 2.86
£65 - 70k 2.09 2.48 2.31 2.16
£70 - 75k 1.9 2.35 2.17 2.03
£75 - 80k 1.45 1.88 1.71 1.6
£80 - 85k 1.12 1.48 1.34 1.26
£85 - 90k 0.82 1.07 0.95 0.88
£90 - 95k 0.77 1.01 0.88 0.82
£95 - £100k 0.64 0.83 0.73 0.68
£100-120k 1.64 2.25 1.96 1.8
£120-140k 0.76 1.15 0.99 0.9
£140-160k 0.41 0.62 0.51 0.46
£160-180k 0.16 0.32 0.25 0.22
£180-200k 0.08 0.16 0.12 0.1
£200k + 0.02 0.06 0.04 0.03
Mean income £34,136 £38,564 £36,732 £35,338
Median income £26,998 £31,341 £29,617 £28,071
Lower quartile £13,706 £15,931 £15,010 £14,173
(Source: CACI commissioned data)
The following key findings and trends are identifiable:
• East Northants has the highest mean, median and lower quartile incomes and Corby the lowest. However, there are wide variations by ward in East Northants (see Appendix A).
• Income levels and income distributions by proportion of households are most clearly seen in the following chart, especially the peaks at £10-15k at the lower end of the income distribution and at £100-120k at the upper end.

14
Chart 2.1: percentage of households by gross income band, May 2012
0
5
10
15
20
25
30
35
40
45
50
£0 -
£5k
£5 -
10k
£10
- 15k
£15
– 20k
£20
– 25k
£25
- 30k
£30
– 35k
£35
- 40k
£40
- 45k
£45
- 50k
£50
- 55k
£55
– 60k
£60
- 65k
£65
- 70k
£70
- 75k
£75
- 80k
£80
- 85k
£85
- 90k
£90
- 95k
£95
- £10
0k£1
00-1
20k
£120
-140
k£1
40-1
60k
£160
-180
k£1
80-2
00k
£200
k +
Corby East Northants. Kettering W/borough
(Source: CACI commissioned data)
15
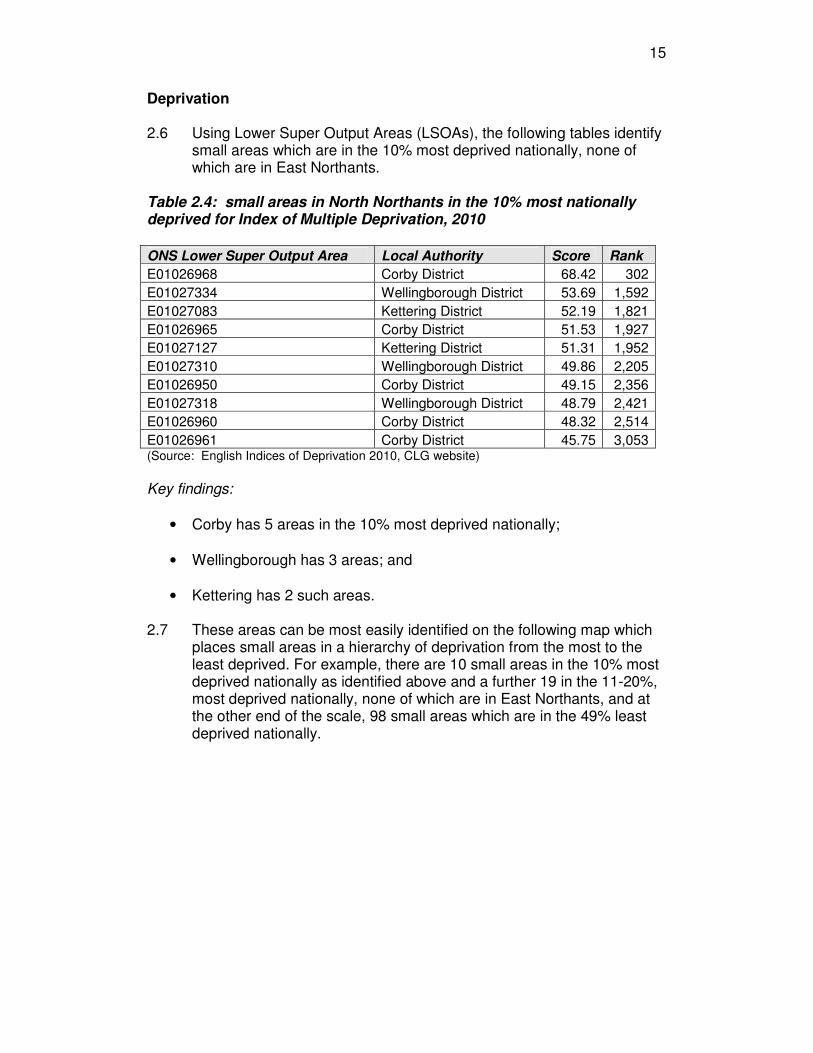
Deprivation 2.6 Using Lower Super Output Areas (LSOAs), the following tables identify
small areas which are in the 10% most deprived nationally, none of which are in East Northants.
Table 2.4: small areas in North Northants in the 10% most nationally deprived for Index of Multiple Deprivation, 2010
ONS Lower Super Output Area Local Authority Score Rank
E01026968 Corby District 68.42 302
E01027334 Wellingborough District 53.69 1,592
E01027083 Kettering District 52.19 1,821
E01026965 Corby District 51.53 1,927
E01027127 Kettering District 51.31 1,952
E01027310 Wellingborough District 49.86 2,205
E01026950 Corby District 49.15 2,356
E01027318 Wellingborough District 48.79 2,421
E01026960 Corby District 48.32 2,514
E01026961 Corby District 45.75 3,053 (Source: English Indices of Deprivation 2010, CLG website) Key findings:
• Corby has 5 areas in the 10% most deprived nationally;
• Wellingborough has 3 areas; and
• Kettering has 2 such areas. 2.7 These areas can be most easily identified on the following map which
places small areas in a hierarchy of deprivation from the most to the least deprived. For example, there are 10 small areas in the 10% most deprived nationally as identified above and a further 19 in the 11-20%, most deprived nationally, none of which are in East Northants, and at the other end of the scale, 98 small areas which are in the 49% least deprived nationally.

16
17
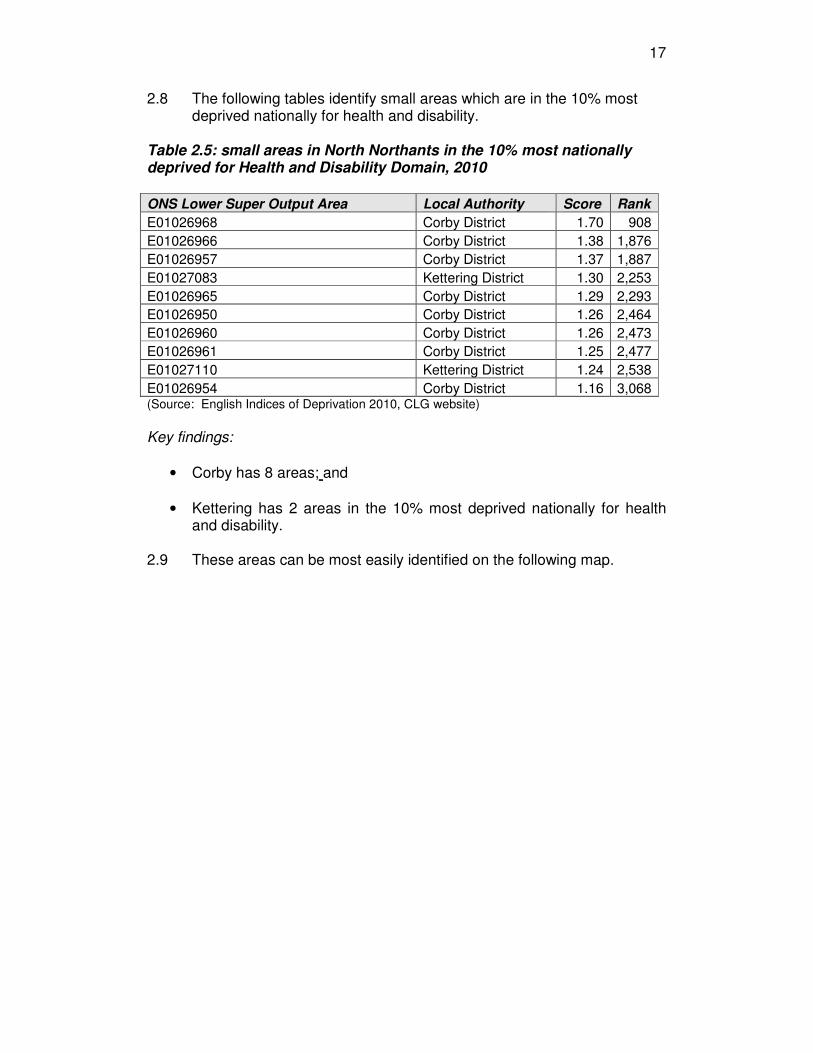
2.8 The following tables identify small areas which are in the 10% most deprived nationally for health and disability.
Table 2.5: small areas in North Northants in the 10% most nationally deprived for Health and Disability Domain, 2010
ONS Lower Super Output Area Local Authority Score Rank
E01026968 Corby District 1.70 908
E01026966 Corby District 1.38 1,876
E01026957 Corby District 1.37 1,887
E01027083 Kettering District 1.30 2,253
E01026965 Corby District 1.29 2,293
E01026950 Corby District 1.26 2,464
E01026960 Corby District 1.26 2,473
E01026961 Corby District 1.25 2,477
E01027110 Kettering District 1.24 2,538
E01026954 Corby District 1.16 3,068 (Source: English Indices of Deprivation 2010, CLG website) Key findings:
• Corby has 8 areas; and
• Kettering has 2 areas in the 10% most deprived nationally for health and disability.
2.9 These areas can be most easily identified on the following map.

18

19
2.3 Population and household change 2.10 This section considers how the area’s population might change over
the 20 years from 2011-2031, and uses demographic data provided by Edge Analytics to estimate the future number of households, broken down by age and type. Edge Analytics are specialists in demographic modelling and population forecasting. Two scenarios have been modelled, ‘Natural Change’ and ‘Migration-led Recalibrated’. ‘Natural Change’ is underpinned by the relationship between births and deaths whereas Migration-led Recalibrated’ uses revised population constraints to derive assumptions about future fertility, mortality and migration. These revised population constraints are based on alternative estimates of immigration for 2001-2009, for each area. Future migration assumptions are based on the latest five years of historical evidence 2004/5 – 2008/9 which includes the peak of the market plus the first year of the economic recession. Data has been provided for different household types and which have been applied in toolkit modelling. However, to aid understanding, these have been reduced to 7 types conforming with different housing requirements as follows:
• One person
• Couple/+1 or more adults no children
• Couple/+ 1 or more adults 1-2 children
• Couple/+ 1 or more adults 3+ children
• Lone parent/+ 1 or more adults 1-2 children
• Lone parent/+ 1 or more adults 3+ children
• Other households 2.11 Household projections are underpinned by projected changes in
population, and the following table and chart use the most recent 2010-based ONS data to project changes in the area’s population by age, and which clearly identify the real and proportionate increases in the youngest and oldest age groups.
Table 2.6: projected change in the population of North Northamptonshire by age band, 2011-2031
Age band 2011 2016 2021 2026 2031 2011-2031
0-14 59.2 64.7 69.7 71.3 70.9 +19.76%
15-24 36.0 33.9 33.8 37.0 41.0 +13.88%
25-34 35.9 41.3 43.5 41.7 41.2 +14.77%
35-44 46.2 42.6 44.5 50.0 52.2 +12.98%
45-54 45.4 50.4 48.6 45.4 47.5 +4.63%
55-64 39.6 40.0 45.6 50.3 48.8 +23.23%
65-74 28.5 35.1 36.7 37.3 43.1 +51.22%
75-84 16.3 18.3 22.8 28.3 29.7 +82.2%
85+ 6.8 7.8 9.0 11.2 14.8 +117.65%

20
Totals 313.9 334.1 354.2 372.5 389.2 +23.99%
(Source: ONS Subnational Population Projections 2010, ONS website)
Key findings:
• There is projected growth of almost 24% in the area’s population between 2011 and 2031;
• Growth is below average for all age groups under 65 but substantially in excess of the average for those aged 65-74 (+51%); 75-84 (+82%) and 85+ (+118%).
• Overall, those aged 65+ are projected to increase from 51,600 in 2011 to 87,600 in 2031, a growth of almost 70% (69.77%).
• Such an increase will have a profound effect on housing requirements creating both need and demand for such specialised provision as designated, sheltered and extra-care housing, and the potential for large scale downsizing from under-occupied homes.

21
Chart 2.2: projected change in the population of North Northamptonshire by age band, 2011-2031
0.0 50.0 100.0 150.0 200.0 250.0 300.0 350.0 400.0 450.0
2011
2016
2021
2026
2031
0-14 15-24 25-34 35-44 45-54 55-64 65-74 75-84 85+
(Source: ONS Subnational Population Projections 2010, ONS website)

22
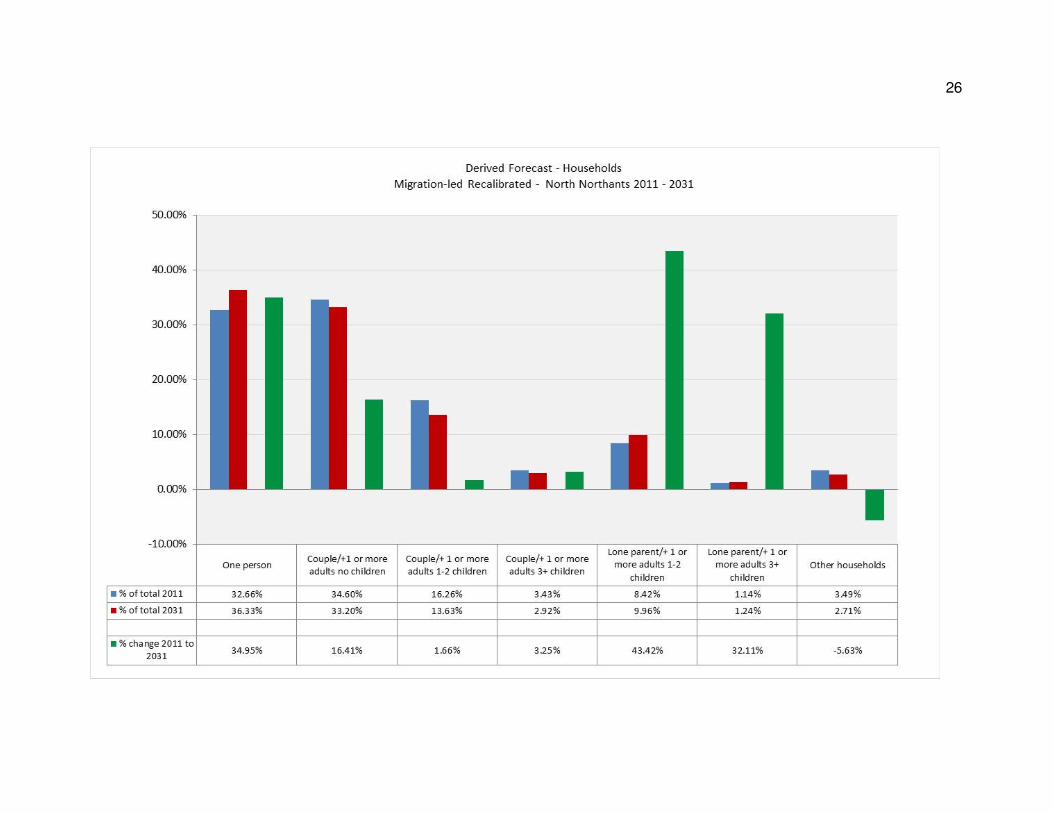
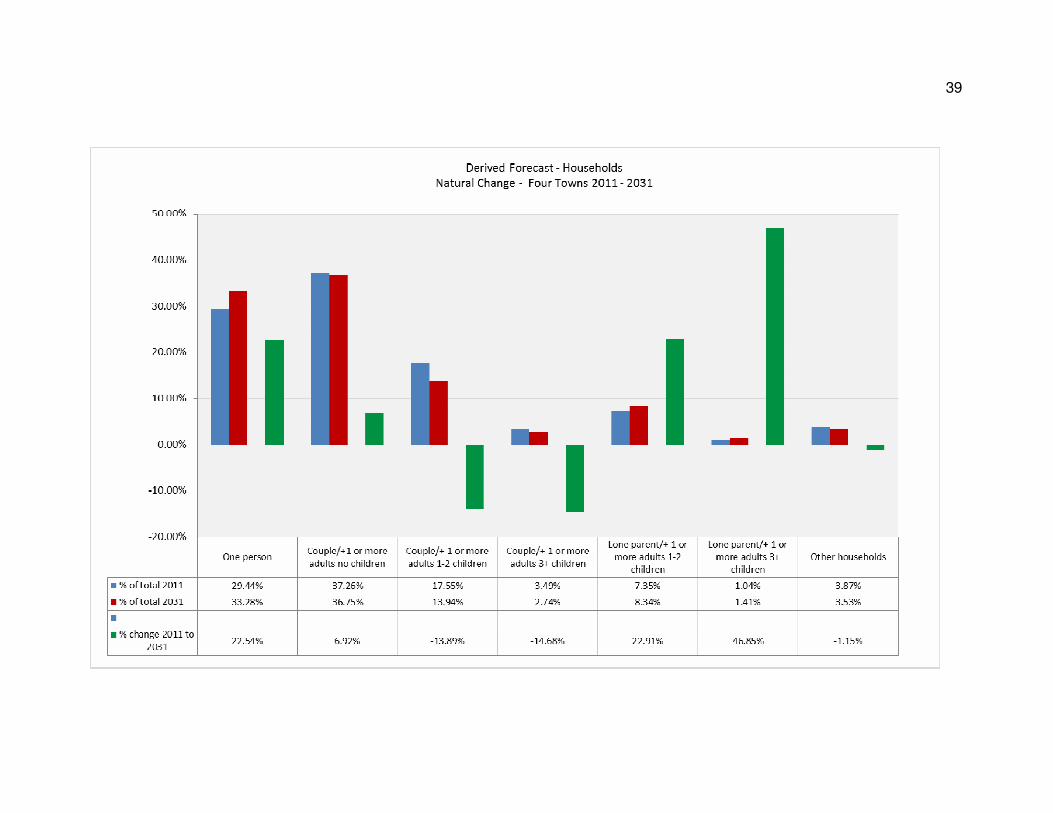
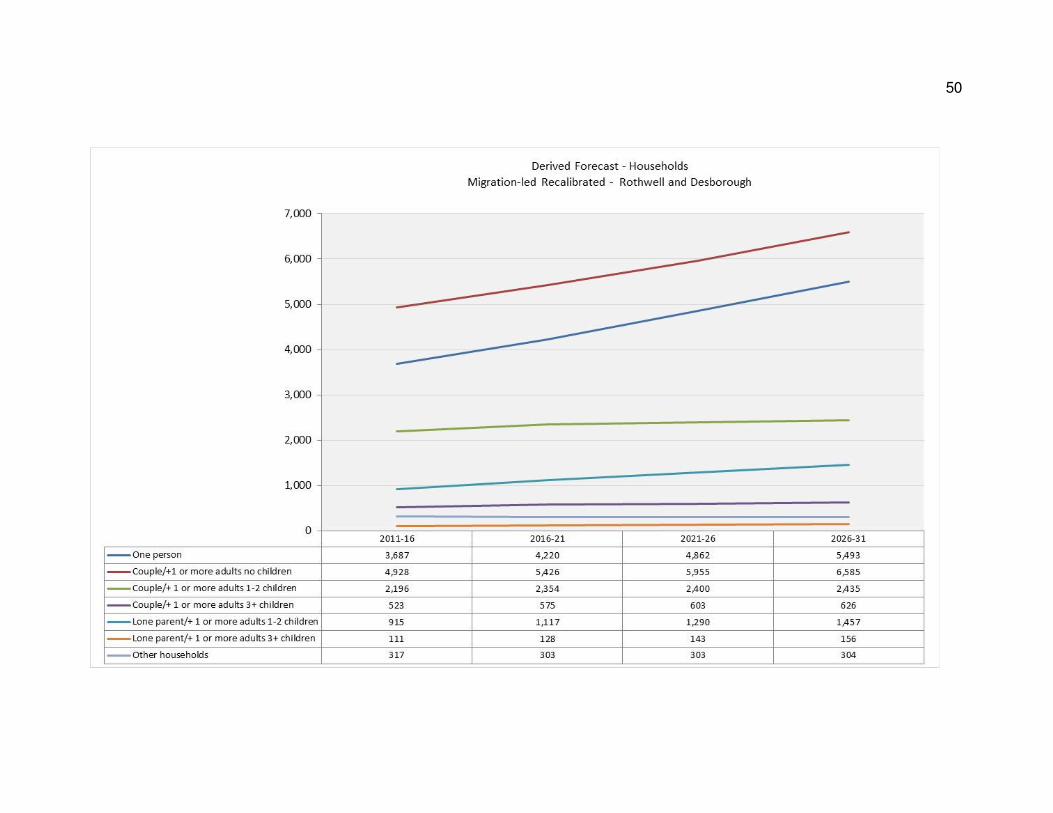
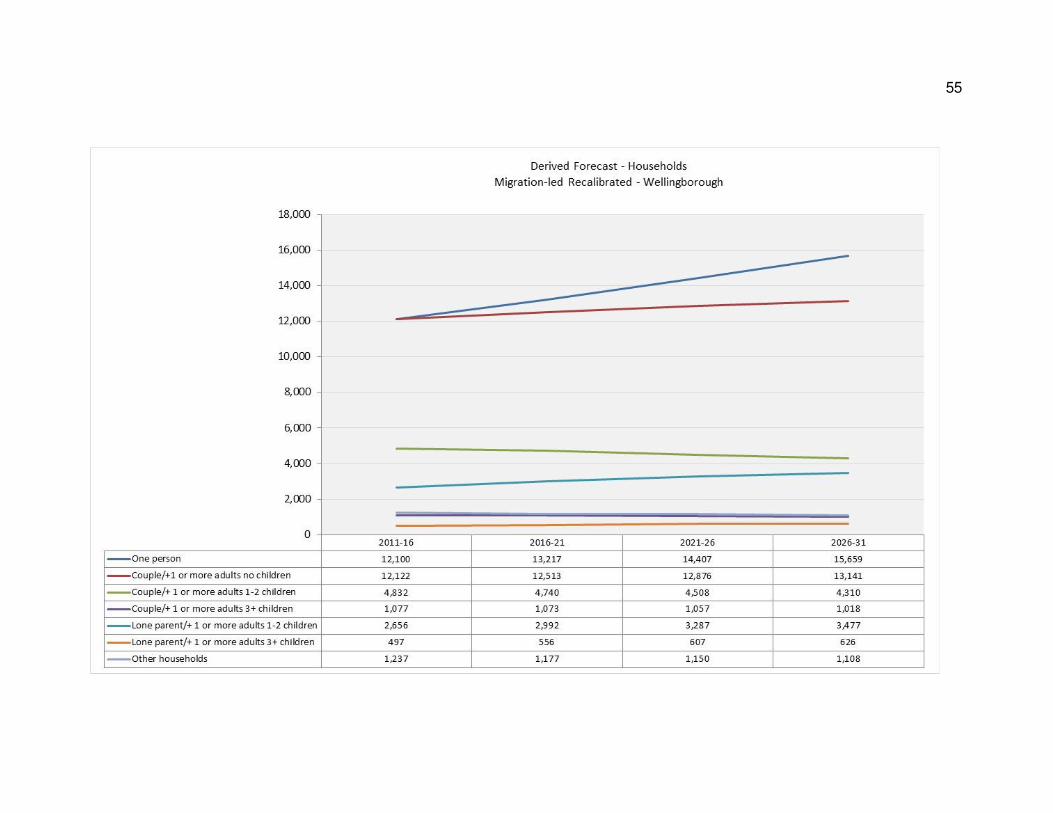
2.12 Household projections data has been expressed for both the Natural Change then the Migration-led Recalibrated scenarios for the North Northants area as a whole and then for each local authority area. For each scenario, a graph and table are provided identifying the numeric impact of projected changes over 20 years from 2011 then a bar chart and table identifying the proportionate change in the number of households of different types. Comments are provided identifying the impact of Natural Change then for the Migration-led Recalibrated scenario with comparisons identified as appropriate.

23

24
-20.00%
-10.00%
0.00%
10.00%
20.00%
30.00%
40.00%
50.00%
% of tota l 2011 32.97% 35.34% 15.66% 3.30% 8.11% 1.06% 3.57%
% of tota l 2031 37.51% 34.08% 12.30% 2.64% 9.37% 1.21% 2.89%
% change 2011 to 2031 23.63% 4.79% -14.64% -12.85% 25.61% 24.10% -11.82%
One personCoupl e/+1 or more
adults no chi ldren
Couple/+ 1 or more
adul ts 1-2 chi ldren
Couple/+ 1 or more
a dults 3+ chi ldren
Lone parent/+ 1 or
more a dul ts 1-2
chi ldren
Lone parent/+ 1 or
more adults 3+
chi ldren
Other househol ds
Derived Forecast - Households
Natural Change - North Northants 2011 - 2031

25
26

27
Key findings for the period 2011-2031 Natural Change
• One person households: growth of almost 25%
• Couple/+1 or more adults no children households: 5% growth
• Couple/+ 1 or more adults 1-2 children households: 15% decline
• Couple/+ 1 or more adults 3+ children households: 13% decline
• Lone parent/+ 1 or more adults 1-2 children households: over 25% growth
• Lone parent/+ 1 or more adults 3+ children households: almost 25% growth
• Other households: 12% decline Migration-led Recalibrated
• One person households: growth of almost 35% (10% increase on Natural Change)
• Couple/+1 or more adults no children households: over 16% growth (11% increase)
• Couple/+ 1 or more adults 1-2 children households: almost 2% growth (17% increase)
• Couple/+ 1 or more adults 3+ children households: over 3% growth (16% increase)
• Lone parent/+ 1 or more adults 1-2 children households: over 43% growth (18% increase)
• Lone parent/+ 1 or more adults 3+ children households: over 32% growth (7% increase)
• Other households: almost 6% decline (6% increase)

28

29
-30.00%
-20.00%
-10.00%
0.00%
10.00%
20.00%
30.00%
40.00%
50.00%
% of tota l 2011 36.45% 27.78% 15.93% 2.80% 12.19% 1.19% 3.66%
% of tota l 2031 41.48% 24.09% 13.79% 2.16% 14.70% 1.15% 2.64%
% change 2011 to 2031 23.81% -5.68% -5.81% -16.09% 31.20% 4.97% -21.57%
One personCouple/+1 or more
adults no chi ldren
Couple/+ 1 or more
adults 1-2 chi ldren
Couple/+ 1 or more
adults 3+ chi ldren
Lone parent/+ 1 or
more adults 1-2
chi ldren
Lone parent/+ 1 or
more adults 3+
chi ldren
Other households
Derived Forecast - Households
Natural Change - Corby 2011 - 2031

30

31

32
Key findings for the period 2011-2031 Natural Change
• One person households: growth of almost 24%
• Couple/+1 or more adults no children households: 6% decline
• Couple/+ 1 or more adults 1-2 children households: 6% decline
• Couple/+ 1 or more adults 3+ children households: 16% decline
• Lone parent/+ 1 or more adults 1-2 children households: over 30% growth
• Lone parent/+ 1 or more adults 3+ children households: 5% growth
• Other households: 22% decline Migration-led Recalibrated
• One person households: growth of over 42% (18% increase on Natural Change)
• Couple/+1 or more adults no children households: almost 9% growth (15% increase)
• Couple/+ 1 or more adults 1-2 children households: almost 22% growth (28% increase)
• Couple/+ 1 or more adults 3+ children households: 6% growth (22% increase)
• Lone parent/+ 1 or more adults 1-2 children households: over 57% growth (27% increase)
• Lone parent/+ 1 or more adults 3+ children households: almost 26% growth (21% increase)
• Other households: 14% decline (8% increase)

33

34
-20.00%
0.00%
20.00%
40.00%
60.00%
80.00%
100.00%
120.00%
% of tota l 2011 29.28% 41.90% 16.17% 3.15% 5.41% 0.68% 3.41%
% of tota l 2031 34.47% 38.98% 13.37% 2.89% 6.30% 1.25% 2.75%
% change 2011 to 2031 28.10% 1.26% -10.03% -0.15% 26.63% 99.29% -12.07%
One personCouple/+1 or more
adults no chi ldren
Couple/+ 1 or more
adul ts 1-2 chi ldren
Couple/+ 1 or more
adul ts 3+ chi ldren
Lone parent/+ 1 or
more adults 1-2
chi ldren
Lone parent/+ 1 or
more adults 3+
chi ldren
Other hous eholds
Derived Forecast - Households
Natural Change - East Northants 2011 - 2031

35

36

37
Key findings for the period 2011-2031 Natural Change
• One person households: 28% growth;
• Couple/+1 or more adults no children households: 1% decline;
• Couple/+ 1 or more adults 1-2 children households: 10% decline
• Couple/+ 1 or more adults 3+ children households: stability
• Lone parent/+ 1 or more adults 1-2 children households: 27% growth
• Lone parent/+ 1 or more adults 3+ children households: almost 100% growth
• Other households: 12% decline Migration-led Recalibrated
• One person households: growth of over 37% (9% increase on Natural Change)
• Couple/+1 or more adults no children households: over 19% growth (20% increase)
• Couple/+ 1 or more adults 1-2 children households: almost 3.5% decline (13.5% increase)
• Couple/+ 1 or more adults 3+ children households: 1.25% decline (1.25% decline)
• Lone parent/+ 1 or more adults 1-2 children households: over 41% growth (14% increase)
• Lone parent/+ 1 or more adults 3+ children households: over 60% growth (40% decline)
• Other households: over 4% growth (16% increase)

38
39

40

41
42
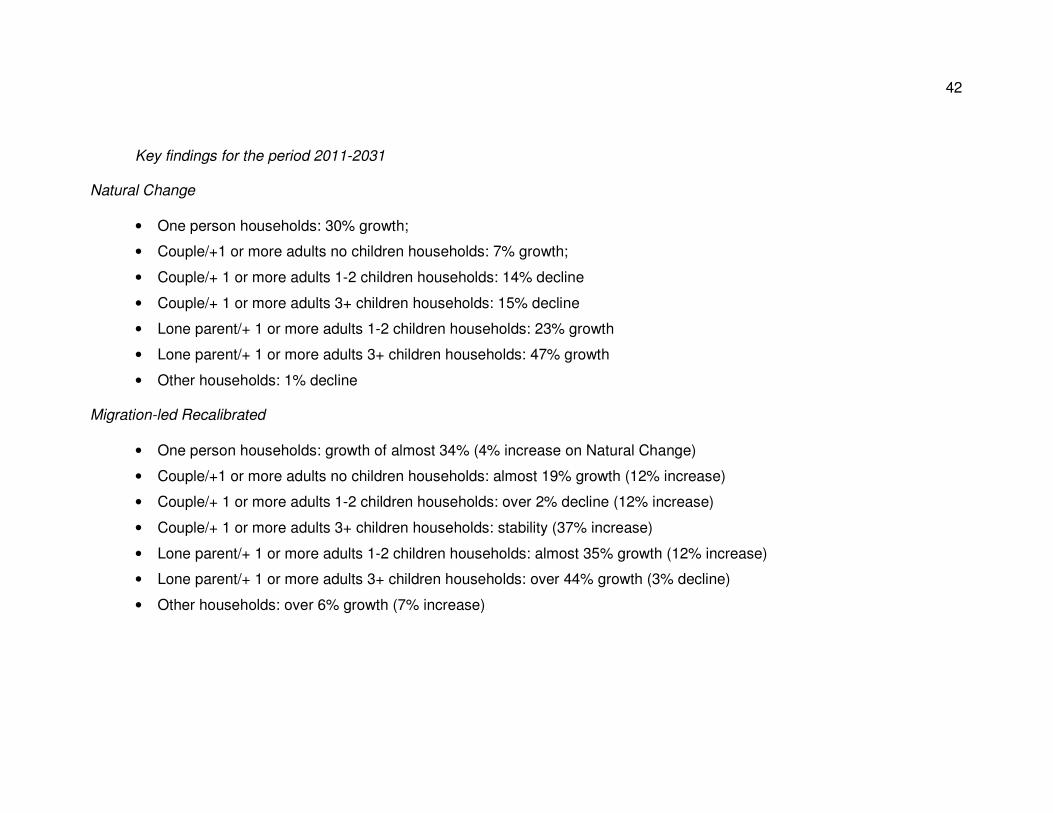
Key findings for the period 2011-2031 Natural Change
• One person households: 30% growth;
• Couple/+1 or more adults no children households: 7% growth;
• Couple/+ 1 or more adults 1-2 children households: 14% decline
• Couple/+ 1 or more adults 3+ children households: 15% decline
• Lone parent/+ 1 or more adults 1-2 children households: 23% growth
• Lone parent/+ 1 or more adults 3+ children households: 47% growth
• Other households: 1% decline Migration-led Recalibrated
• One person households: growth of almost 34% (4% increase on Natural Change)
• Couple/+1 or more adults no children households: almost 19% growth (12% increase)
• Couple/+ 1 or more adults 1-2 children households: over 2% decline (12% increase)
• Couple/+ 1 or more adults 3+ children households: stability (37% increase)
• Lone parent/+ 1 or more adults 1-2 children households: almost 35% growth (12% increase)
• Lone parent/+ 1 or more adults 3+ children households: over 44% growth (3% decline)
• Other households: over 6% growth (7% increase)

43

44
-30.00%
-20.00%
-10.00%
0.00%
10.00%
20.00%
30.00%
40.00%
% of tota l 2011 33.03% 35.59% 15.70% 3.70% 7.53% 0.88% 3.57%
% of tota l 2031 36.54% 36.19% 11.93% 3.03% 8.58% 0.85% 2.88%
% change 2011 to 2031 19.99% 10.29% -17.62% -11.12% 23.68% 3.96% -12.65%
One personCouple/+1 or more
adults no chi ldren
Couple/+ 1 or more
adults 1-2 chi ldren
Couple/+ 1 or more
adults 3+ chi ldren
Lone parent/+ 1 or
more adults 1-2
chi ldren
Lone parent/+ 1 or
more adults 3+
chi ldren
Other households
Derived Forecast - Households
Natural Change - Kettering 2011 - 2031

45

46

47
Key findings for the period 2011-2031 Natural Change
• One person households: 20% growth;
• Couple/+1 or more adults no children households: 10% growth;
• Couple/+ 1 or more adults 1-2 children households: 18% decline
• Couple/+ 1 or more adults 3+ children households: 11% decline
• Lone parent/+ 1 or more adults 1-2 children households: 24% growth
• Lone parent/+ 1 or more adults 3+ children households: 4% growth
• Other households: 13% decline Migration-led Recalibrated
• One person households: growth of over 29% (9% increase on Natural Change)
• Couple/+1 or more adults no children households: almost 19% growth (9% increase)
• Couple/+ 1 or more adults 1-2 children households: over 3% decline (15% increase)
• Couple/+ 1 or more adults 3+ children households: over 6% growth (17% increase)
• Lone parent/+ 1 or more adults 1-2 children households: almost 38% growth (14% increase)
• Lone parent/+ 1 or more adults 3+ children households: over 25% growth (19% increase)
• Other households: over 8% decline (5% increase)

48

49
50

51

52
Key findings for the period 2011-2031 Migration-led Recalibrated
• One person households: growth of almost 49% (25% increase on Natural Change – see below)
• Couple/+1 or more adults no children households: almost 34% growth (26% increase)
• Couple/+ 1 or more adults 1-2 children households: almost 11% growth (32% increase)
• Couple/+ 1 or more adults 3+ children households: almost 20% growth (35% increase)
• Lone parent/+ 1 or more adults 1-2 children households: over 59% growth (33% increase)
• Lone parent/+ 1 or more adults 3+ children households: almost 41% growth (38% increase)
• Other households: over 4% decline (14% increase) Natural Change (for charts see Appendix X)
• One person households: 24% growth;
• Couple/+1 or more adults no children households: 8% growth;
• Couple/+ 1 or more adults 1-2 children households: 21% decline
• Couple/+ 1 or more adults 3+ children households: 15% decline
• Lone parent/+ 1 or more adults 1-2 children households: 26% growth
• Lone parent/+ 1 or more adults 3+ children households: 3% growth
• Other households: 18% decline.

53

54
55

56

57
Key findings for the period 2011-2031 Migration-led Recalibrated
• One person households: growth of over 29% (3% increase on Natural Change – see below)
• Couple/+1 or more adults no children households: over 8% growth (3% increase)
• Couple/+ 1 or more adults 1-2 children households: almost 11% decline (8% increase)
• Couple/+ 1 or more adults 3+ children households: almost 6% decline (9% increase)
• Lone parent/+ 1 or more adults 1-2 children households: almost 31% growth (8% increase)
• Lone parent/+ 1 or more adults 3+ children households: over 26% growth (no change)
• Other households: over 10% decline (1% increase) Natural Change (for charts see Appendix X)
• One person households: 26% growth;
• Couple/+1 or more adults no children households: 5% growth;
• Couple/+ 1 or more adults 1-2 children households: 19% decline
• Couple/+ 1 or more adults 3+ children households: 15% decline
• Lone parent/+ 1 or more adults 1-2 children households: 23% growth
• Lone parent/+ 1 or more adults 3+ children households: 26% growth
• Other households: 11% decline
58
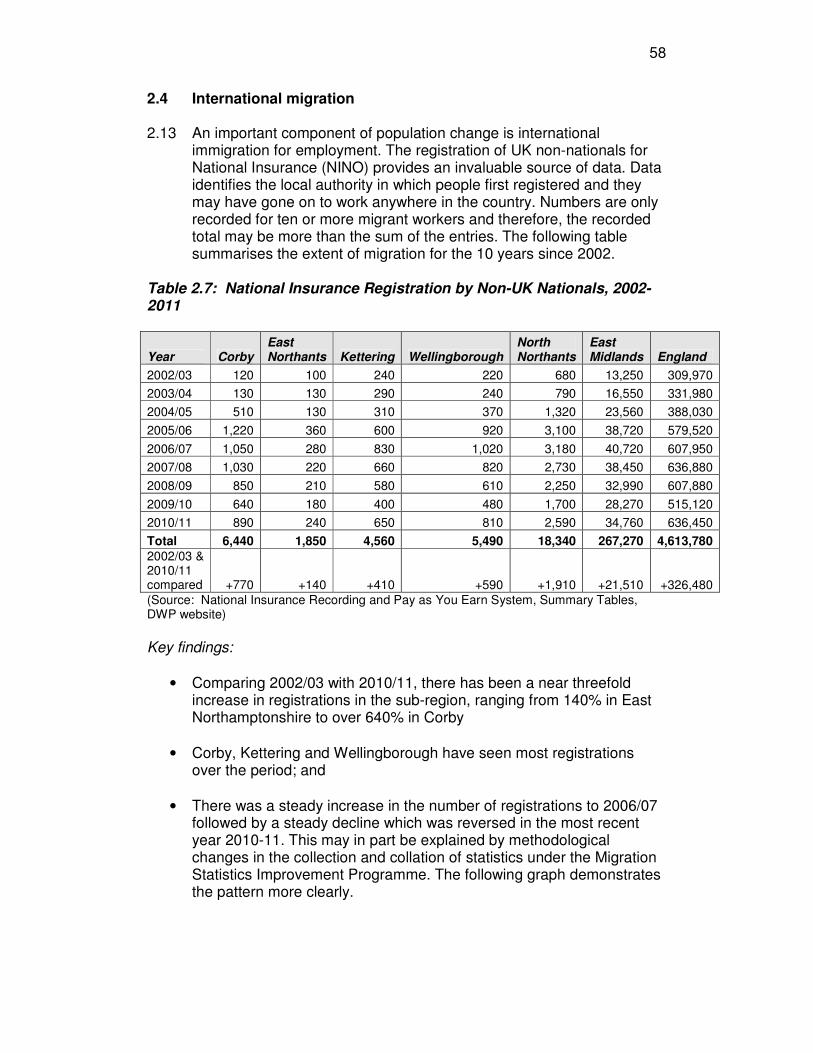
2.4 International migration 2.13 An important component of population change is international
immigration for employment. The registration of UK non-nationals for National Insurance (NINO) provides an invaluable source of data. Data identifies the local authority in which people first registered and they may have gone on to work anywhere in the country. Numbers are only recorded for ten or more migrant workers and therefore, the recorded total may be more than the sum of the entries. The following table summarises the extent of migration for the 10 years since 2002.
Table 2.7: National Insurance Registration by Non-UK Nationals, 2002-2011
Year Corby East Northants Kettering Wellingborough
North Northants
East Midlands England
2002/03 120 100 240 220 680 13,250 309,970
2003/04 130 130 290 240 790 16,550 331,980
2004/05 510 130 310 370 1,320 23,560 388,030
2005/06 1,220 360 600 920 3,100 38,720 579,520
2006/07 1,050 280 830 1,020 3,180 40,720 607,950
2007/08 1,030 220 660 820 2,730 38,450 636,880
2008/09 850 210 580 610 2,250 32,990 607,880
2009/10 640 180 400 480 1,700 28,270 515,120
2010/11 890 240 650 810 2,590 34,760 636,450
Total 6,440 1,850 4,560 5,490 18,340 267,270 4,613,780
2002/03 & 2010/11 compared +770 +140 +410 +590 +1,910 +21,510 +326,480
(Source: National Insurance Recording and Pay as You Earn System, Summary Tables, DWP website) Key findings:
• Comparing 2002/03 with 2010/11, there has been a near threefold increase in registrations in the sub-region, ranging from 140% in East Northamptonshire to over 640% in Corby
• Corby, Kettering and Wellingborough have seen most registrations over the period; and
• There was a steady increase in the number of registrations to 2006/07 followed by a steady decline which was reversed in the most recent year 2010-11. This may in part be explained by methodological changes in the collection and collation of statistics under the Migration Statistics Improvement Programme. The following graph demonstrates the pattern more clearly.

59
National Insurance Registrations by Non UK Nationals by Year
0
500
1,000
1,500
2,000
2,500
3,000
3,500
2002/03 2003/04 2004/05 2005/06 2006/07 2007/08 2008/09 2009/10 2010/2011
Nu
mb
er
of
Re
gis
tra
tio
ns
Corby
East Northants
Kettering
Wellingborough
North Northants

60
2.14 The following table identifies the main countries from which people have migrated.
Table 2.8: NINO Registrations of 500 people or more in North Northants. from 1st January 2002 to September 2011
Total Poland Slovak Rep
Rep of Latvia
India Hungary Rep of Lithuania
Romania
Area
(000s) 000s) (000s) 000s) (000s) 000s) 000s) 000s)
Corby 6.96 2.65 0.84 0.74 0.09 0.4 0.33 0.32
East Northants
1.95 0.41 0.08 0.04 0.15 0.11 0.04 0.11
Kettering 4.86 1.49 0.46 0.09 0.41 0.15 0.23 0.06
Wellingborough 5.86 2.67 0.18 0.47 0.42 0.26 0.14 0.09
North Northants
19.63 7.22 1.56 1.34 1.07 0.92 0.74 0.58
(Source: DWP Tabulation Tool, DWP website)
Key findings:
• 6 of 8 the central/east European countries which acceded to the EU in 2004 are featured, and account for almost two thirds of those registering between 2002 and 2011; the only other country from which 500 or more people migrated was India.
2.15 A new data source available from ONS concerns Indicative Immigration
Estimates for Short Term Migrants (workers and students) and data is available for the three years to June 2010.
Table 2.9: immigration estimates for short term migrants, 2007-2010 Area 2007/08 2008/09 2009/10 Totals
Corby 122 47 81 250
East Northamptonshire 28 21 21 70
Kettering 73 25 49 147
Wellingborough 92 26 58 176
Totals 315 119 209 643 (Source: National Insurance Recording and Pay as You Earn System, Summary Tables, DWP website) Key findings:
• A total of 643 short term migrants have been allocated to the sub-region, with the largest number in Corby.

61
2.5 Internal migration 2.16 Internal migration refers to population movement within England and
Wales. Movement between North Northamptonshire, regions and local authority areas can be monitored using NHS patient registration data. Such data is reliant on people registering with a GP and those groups who are recognised to register at lower rates include students, especially male students and young men, but conversely, families and older people are more likely to register. Please note that figures are rounded to the nearest 10 or 100 by NHSCR and therefore, totals may vary from the sum. The following table provides a starting point for understanding patterns of internal migration by examining the movement of people into North Northants. by region for the most recent year to June 2010.
Table 2.10: internal migration into North Northants from regions for the year ending June 2010
Origin Number of In-migrants
Those Moving within North Northants.
In-migrants Excluding those Moving within North Northants.
North East 150 150
North West 380 380
Yorkshire and The Humber 500 500
East Midlands 6,740 3,360 3,380
West Midlands 620 620
East 2,290 2,290
London 860 860
South East 1,260 1,260
South West 450 450
Wales 180 180
(Source: Estimates from NHS Patient Registration with GPs data, ONS website)
Key findings:
• Not surprisingly, most movement is from within North Northants and the East Midlands but this is followed by the East region then the south east. It is interesting to note that even when London and the South East are combined (2,140 people), this is still less than migration from the East region. These patterns are more clearly seen on the following map.

62
2.17 The following table reviews the movement of people out of North
Northants. by region for the most recent year to June 2010.

63
Table 2.11: internal migration out of North Northants to regions for the year ending June 2010
Destination Number Out Migrants
Those Moving within North Northants.
Out Migrants Excluding those Moving within North Northants.
North East 180 180
North West 420 420
Yorkshire and The Humber 580 580
East Midlands 6,410 3,360 3,050
West Midlands 700 700
East 1,830 1,830
London 730 730
South East 1,200 1,200
South West 620 620
Wales 230 230
(Source: Estimates from NHS Patient Registration with GPs data, ONS website)
Key findings:
• Not surprisingly, most movement out is within North Northants and the East Midlands and this is followed by the East region then the south east. It is interesting to note that when London and the South East are combined (1,930 people), this is almost the same as migration to the East region. These patterns are more clearly seen on the following map.

64

65
2.18 The following table and map identify the net effect of regional migration patterns.
Table 2.12: net migration into and out of North Northants from/to regions for the two years ending June 2010
Regions In 2009 In 2010 Out 2009 Out 2010 Net Migration
East 2,190 2,290 1,750 1,830 +900
London 1,000 860 720 730 +410
South East 1,300 1,260 1,130 1,200 +230
East Midlands 3,000 3,380 3,170 3,050 +160
North West 480 380 450 420 -10
North East 190 150 180 180 -20
Yorkshire and The Humber 460 500 510 580 -130
West Midlands 670 620 730 700 -140
South West 400 450 600 620 -370 (Source: Internal Migration Statistics, Office for National Statistics) Note: Excludes LAs within North Northants
Key findings:
• The strongest gains were from the East then the London regions; the main losses were to the south west region, a favourite location for retirement.

66

67
2.19 The following table turns to the local authority level and focuses on the
net effect of internal migration into and out of North Northants and constituent local authority areas for the 3 years June 2007-10.
Table 2.13: in and outmigration by district, June 2007-June2010
2007-08 2008-09 2009-10
Persons (000s) Persons (000s) Persons (000s) Local Authority In Out Balance In Out Balance In Out Balance
Corby 2.4 2.1 +0.3 2.4 2.1 +0.3 2.2 2.0 +0.3
East Northants. 4.7 4.2 +0.5 4.1 4.0 +0.1 4.3 4.1 +0.2
Kettering 4.3 3.5 +0.8 3.8 3.5 +0.3 3.9 3.6 +0.3
Wellingborough 3.5 3.5 +0.0 3.2 3.5 -0.3 3.2 3.5 -0.3
North Northants 14.9 13.3 +1.6 13.5 13.1 +0.4 13.6 13.2 +0.4
East Midlands 117.1 110.9 +6.2 112.2 109.5 +2.7 114.2 106.9 +7.2
(Source: Estimates from NHS Patient Registration with GPs data, ONS website)
Key findings:
• North Northants gained 1,600 people in 2007-08 but this fell to 400 in each of the following years, an overall gain of 2,400 people.
• The effect for constituent local authorities was net gains over 3 years of:
o 900 people in Corby; o 800 people in East Northants.; o 1,400 people in Kettering;
• but a loss of:
o 600 people in Wellingborough. 2.20 Data on internal migration by age enables limited profiling of the types
of people and households moving in and out of North Northants for example, those aged 0-15 can be associated with parents aged 25-44 to indicate families with children; those aged 16-24 will include students and those aged 65+ are pensioner households. The following table summarises patterns for the 3 years 2007-10.
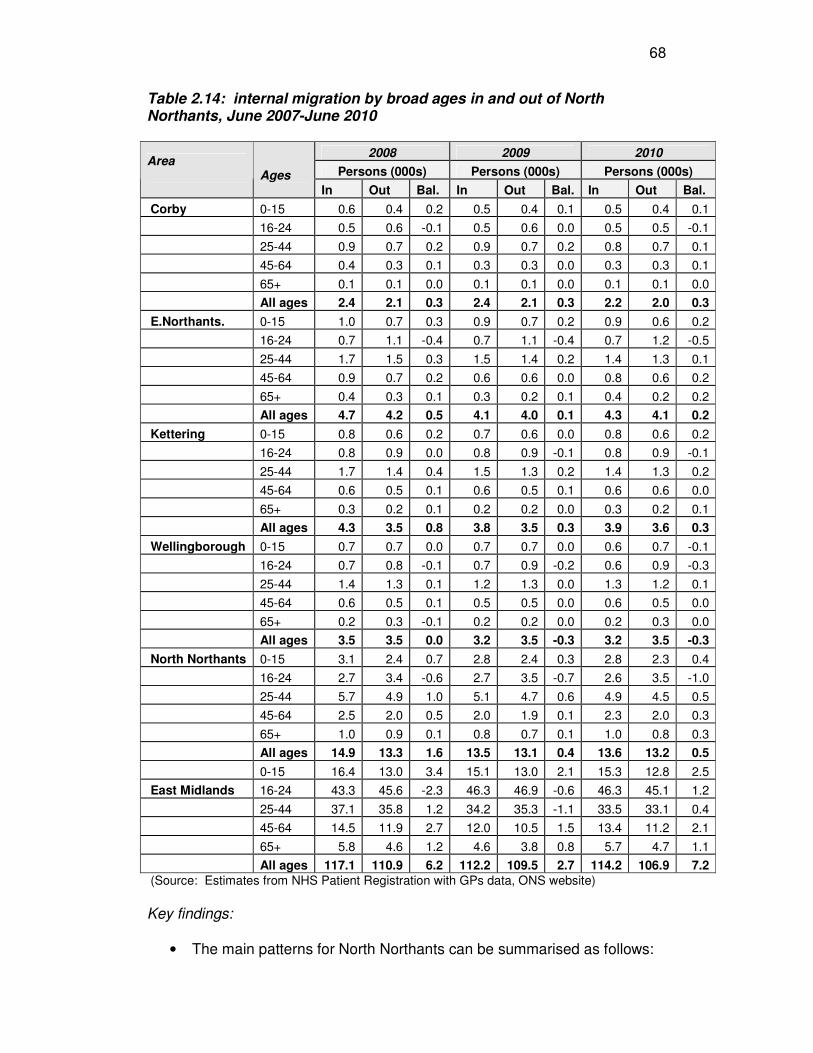
68
Table 2.14: internal migration by broad ages in and out of North Northants, June 2007-June 2010
2008 2009 2010
Persons (000s) Persons (000s) Persons (000s) Area
Ages In Out Bal. In Out Bal. In Out Bal.
Corby 0-15 0.6 0.4 0.2 0.5 0.4 0.1 0.5 0.4 0.1
16-24 0.5 0.6 -0.1 0.5 0.6 0.0 0.5 0.5 -0.1
25-44 0.9 0.7 0.2 0.9 0.7 0.2 0.8 0.7 0.1
45-64 0.4 0.3 0.1 0.3 0.3 0.0 0.3 0.3 0.1
65+ 0.1 0.1 0.0 0.1 0.1 0.0 0.1 0.1 0.0
All ages 2.4 2.1 0.3 2.4 2.1 0.3 2.2 2.0 0.3
E.Northants. 0-15 1.0 0.7 0.3 0.9 0.7 0.2 0.9 0.6 0.2
16-24 0.7 1.1 -0.4 0.7 1.1 -0.4 0.7 1.2 -0.5
25-44 1.7 1.5 0.3 1.5 1.4 0.2 1.4 1.3 0.1
45-64 0.9 0.7 0.2 0.6 0.6 0.0 0.8 0.6 0.2
65+ 0.4 0.3 0.1 0.3 0.2 0.1 0.4 0.2 0.2
All ages 4.7 4.2 0.5 4.1 4.0 0.1 4.3 4.1 0.2
Kettering 0-15 0.8 0.6 0.2 0.7 0.6 0.0 0.8 0.6 0.2
16-24 0.8 0.9 0.0 0.8 0.9 -0.1 0.8 0.9 -0.1
25-44 1.7 1.4 0.4 1.5 1.3 0.2 1.4 1.3 0.2
45-64 0.6 0.5 0.1 0.6 0.5 0.1 0.6 0.6 0.0
65+ 0.3 0.2 0.1 0.2 0.2 0.0 0.3 0.2 0.1
All ages 4.3 3.5 0.8 3.8 3.5 0.3 3.9 3.6 0.3
Wellingborough 0-15 0.7 0.7 0.0 0.7 0.7 0.0 0.6 0.7 -0.1
16-24 0.7 0.8 -0.1 0.7 0.9 -0.2 0.6 0.9 -0.3
25-44 1.4 1.3 0.1 1.2 1.3 0.0 1.3 1.2 0.1
45-64 0.6 0.5 0.1 0.5 0.5 0.0 0.6 0.5 0.0
65+ 0.2 0.3 -0.1 0.2 0.2 0.0 0.2 0.3 0.0
All ages 3.5 3.5 0.0 3.2 3.5 -0.3 3.2 3.5 -0.3
North Northants 0-15 3.1 2.4 0.7 2.8 2.4 0.3 2.8 2.3 0.4
16-24 2.7 3.4 -0.6 2.7 3.5 -0.7 2.6 3.5 -1.0
25-44 5.7 4.9 1.0 5.1 4.7 0.6 4.9 4.5 0.5
45-64 2.5 2.0 0.5 2.0 1.9 0.1 2.3 2.0 0.3
65+ 1.0 0.9 0.1 0.8 0.7 0.1 1.0 0.8 0.3
All ages 14.9 13.3 1.6 13.5 13.1 0.4 13.6 13.2 0.5
0-15 16.4 13.0 3.4 15.1 13.0 2.1 15.3 12.8 2.5
East Midlands 16-24 43.3 45.6 -2.3 46.3 46.9 -0.6 46.3 45.1 1.2
25-44 37.1 35.8 1.2 34.2 35.3 -1.1 33.5 33.1 0.4
45-64 14.5 11.9 2.7 12.0 10.5 1.5 13.4 11.2 2.1
65+ 5.8 4.6 1.2 4.6 3.8 0.8 5.7 4.7 1.1
All ages 117.1 110.9 6.2 112.2 109.5 2.7 114.2 106.9 7.2
(Source: Estimates from NHS Patient Registration with GPs data, ONS website) Key findings:
• The main patterns for North Northants can be summarised as follows:
69
o a gain of 1,400 people aged 0-15 and 2,100 aged 25-44
suggests that families with children are being attracted to the area;
o a loss of 2,300 people aged 16-25 suggests that more students and those of first working age are leaving the area; and
o gains of 900 in those aged 45-64 and 500 in those aged 65+ indicates that the area is also proving attractive to older age groups.
• For Corby, East Northants and Kettering, the same patterns are evident though Kettering made only very small gains in the older age groups.
• Wellingborough is the exception with only a small gain in those aged 25-44 (+200); small losses in other age groups and half the total loss accounted for by those aged 16-25.
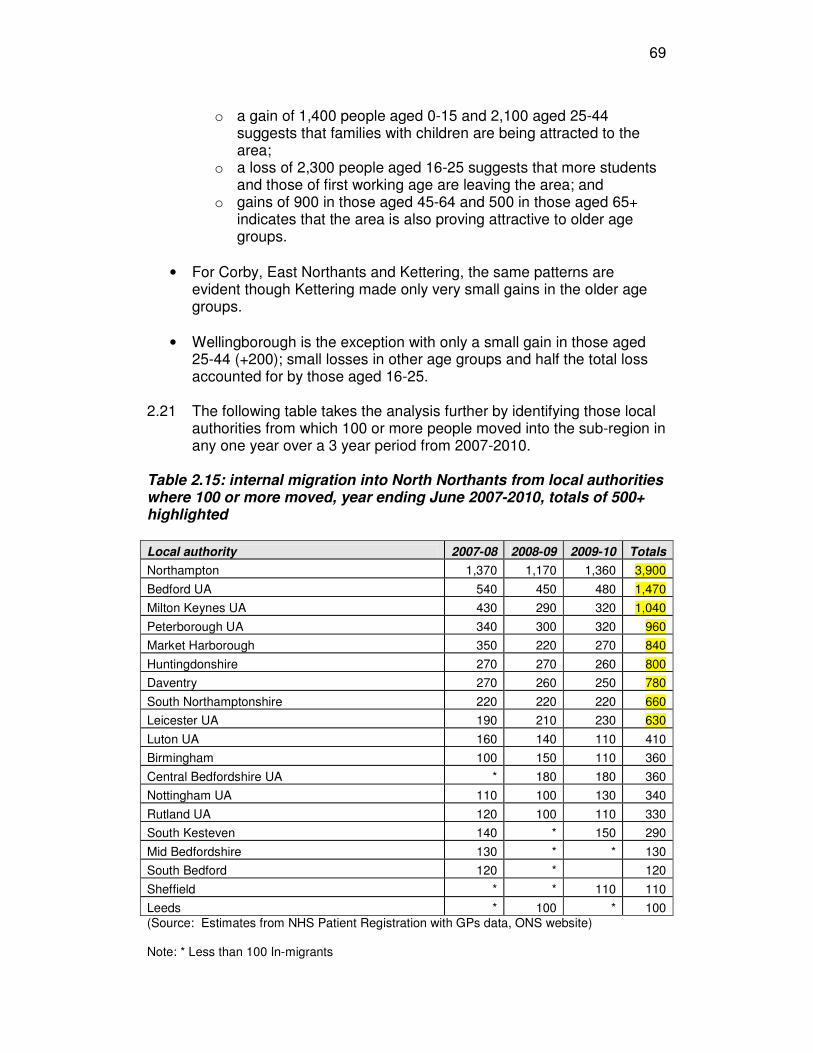
2.21 The following table takes the analysis further by identifying those local
authorities from which 100 or more people moved into the sub-region in any one year over a 3 year period from 2007-2010.
Table 2.15: internal migration into North Northants from local authorities where 100 or more moved, year ending June 2007-2010, totals of 500+ highlighted
Local authority 2007-08 2008-09 2009-10 Totals
Northampton 1,370 1,170 1,360 3,900
Bedford UA 540 450 480 1,470
Milton Keynes UA 430 290 320 1,040
Peterborough UA 340 300 320 960
Market Harborough 350 220 270 840
Huntingdonshire 270 270 260 800
Daventry 270 260 250 780
South Northamptonshire 220 220 220 660
Leicester UA 190 210 230 630
Luton UA 160 140 110 410
Birmingham 100 150 110 360
Central Bedfordshire UA * 180 180 360
Nottingham UA 110 100 130 340
Rutland UA 120 100 110 330
South Kesteven 140 * 150 290
Mid Bedfordshire 130 * * 130
South Bedford 120 * 120
Sheffield * * 110 110
Leeds * 100 * 100
(Source: Estimates from NHS Patient Registration with GPs data, ONS website) Note: * Less than 100 In-migrants

70
Key findings:
• Northampton provided the largest number of migrants into North Northants followed by Bedford, Milton Keynes, Peterborough, Market Harborough, Huntingdonshire, Daventry, South Northants. and Leicester. These patterns are most clearly seen on the following map which focuses on the larger flows of 200 or more people.
Please note: this data is also available for each local authority area.

71

72
2.22 The following table takes the analysis further by identifying those local authorities from which 100 or more people moved into the sub-region in any one year over a 3 year period from 2007-2010.
Table 2.16: internal migration out of North Northants into local authorities where 100 or more moved, 2007-2010, totals of 500+ highlighted
Local Authority 2007-08 2008-09 2009-10 Totals
Northampton 1,030 1,060 1,030 3,120
Bedford UA 390 310 380 1,080
Daventry 280 270 220 770
Market Harborough 220 270 240 730
Milton Keynes UA 250 240 240 730
Peterborough UA 210 200 220 630
Huntingdonshire 230 220 160 610
South Northamptonshire 210 180 190 580
Leicester UA 190 200 170 560
Nottingham UA 160 180 180 520
Birmingham 120 170 160 450
Rutland UA 140 160 140 440
South Kesteven 130 160 150 440
Sheffield 130 120 150 400
Leeds 120 100 140 360
Central Bedfordshire UA * 110 110 220
Coventry * 100 100 200
Cornwall UA * * 100 100
Source: Estimates from NHS Patient Registration with GPs data, ONS website * Less than 100 Out Migrants Key findings:
• Northampton attracted the largest number of migrants out of North Northants followed by Bedford, Daventry, Market Harborough, Milton Keynes and Peterborough. These patterns are most clearly seen on the following map which focuses on the larger flows of 200 or more people.
Please note: this data is also available for each local authority area.

73

74
2.23 The following table examines the net effect of movement in and out of the sub-region from 2007-2010 for the local authorities identified above. Table 2.17: net effect of internal migration in and out of North Northants into 2007-2010 by main local authority areas, totals of 150+/- highlighted
Local Authority In Out Net effect
Northampton 3,900 Northampton 3,120 +780
Bedford UA 1,470 Bedford UA 1,080 +390
Peterborough UA 960 Peterborough UA 630 +330
Milton Keynes UA 1,040 Milton Keynes UA 730 +310
Luton UA 410 Luton UA 150 +260
Huntingdonshire 800 Huntingdonshire 610 +190
Central Bedfordshire UA 360 Central Bedfordshire UA 220 +140
Market Harborough 840 Market Harborough 730 +110
South Northamptonshire 660 South Northamptonshire 580 +80
Leicester UA 630 Leicester UA 560 +70
Daventry 780 Daventry 770 +10
Birmingham 360 Birmingham 450 -90
Rutland UA 330 Rutland UA 440 -110
South Kesteven 290 South Kesteven 440 -150
Nottingham UA 340 Nottingham UA 520 -180
Leeds 100 Leeds 360 -260
Sheffield 110 Sheffield 400 -290
(Source: Estimates from NHS Patient Registration with GPs data, ONS website) Note: * Less than 100 Out Migrants Key findings:
• The main patterns for North Northants can be summarised as follows:
o Strong net gains from Northampton, Bedford, Peterborough, Milton Keynes, Luton and Huntingdonshire;
o A near equal exchange of population with Daventry; and o Clear net losses of people to Sheffield, Leeds, Nottingham and
South Kesteven. 2.24 The following map highlights net migration of 100 or more people for
the 2 years to June 2010.

75

76
2.6 Commuting/travel to work 2.25 Benchmarks for identifying a housing market catchment area are that
either 75% of people live and work within a defined boundary (known as the ‘live: work’ or ‘Travel to Work Area’) or that 75% of home moves take place within a defined boundary. Catchment areas can be noticeably different according to home moves compared with travel to work. For example, migration patterns are often more extensive from higher cost housing areas whose households have greater equity and vice versa. Consequently, the ‘live: work’ is a useful indicator of housing market.
2.26 Analysis of commuting patterns was at the time of completion of the
report mainly dependent on 2001 Census data and will need updating once the results of the 2011 Census are available. The following table summarises the extent of commuting in and out of North Northamptonshire in 2001.
Table 2.18: travel into and out of North Northamptonshire to work, 2001
Local Authority Corby East
Northants. Kettering Wellingborough North
Northants.
Travel in 4,202 3,666 3,832 5,769 17,469
Travel out 2,483 11,882 8,725 10,761 32,003
Net effect 1,719 -8,216 -4,893 -4,992 -14,534
(Source: Table 107 UK Travel Flows, 2001 Census, NOMIS website) Key findings:
• In 2001, 14,500 more people travelled to work outside the area than travelled in; and
• This pattern was consistent for all local authorities except Corby where the reverse was the case and more people travelled in than out.
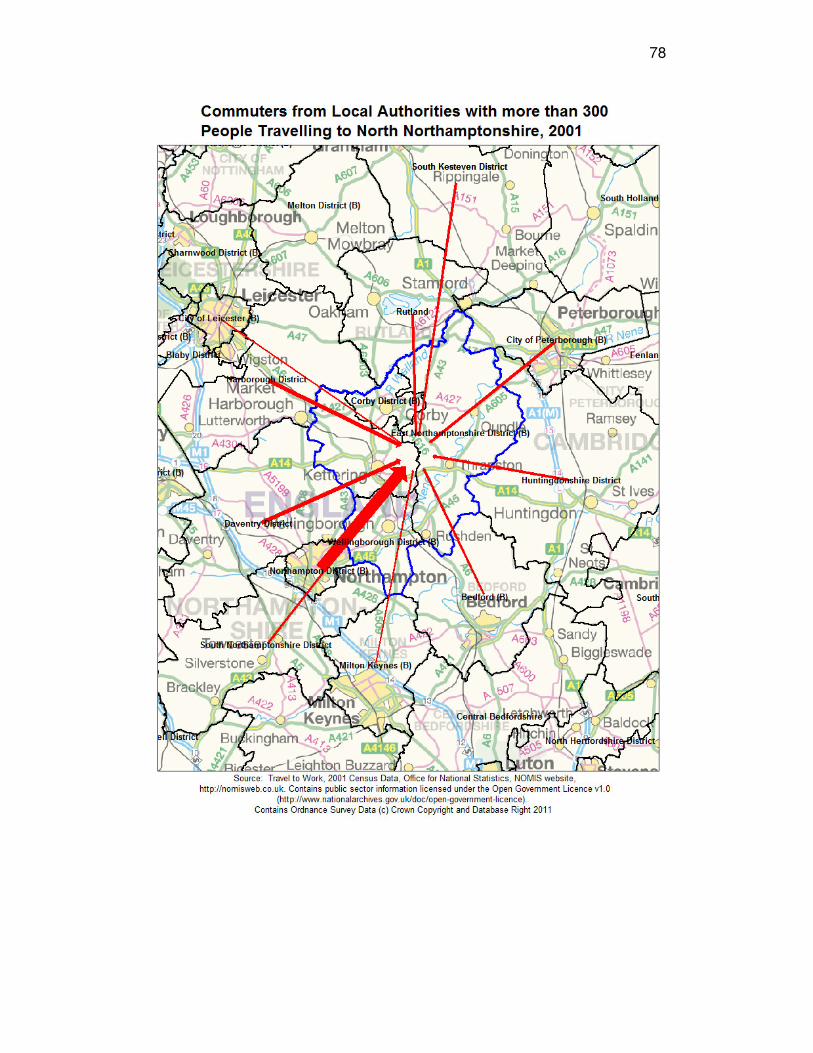
2.27 The following table and map address the question, ‘where do people
work who live in North Northamptonshire’? and identify the principal flows. The 75% level is equivalent to 13,100 people.
Table 2.19: travel into work in North Northamptonshire from local authorities where 300 or more travel, 2001, 75% level identified
Local Authority Corby East
Northants. Kettering Wellingborough North
Northants.
Northampton 466 588 1,000 2,505 4,559
Market Harborough 613 73 597 131 1,414
Daventry 178 120 438 527 1,263
Peterborough 260 579 107 58 1,004
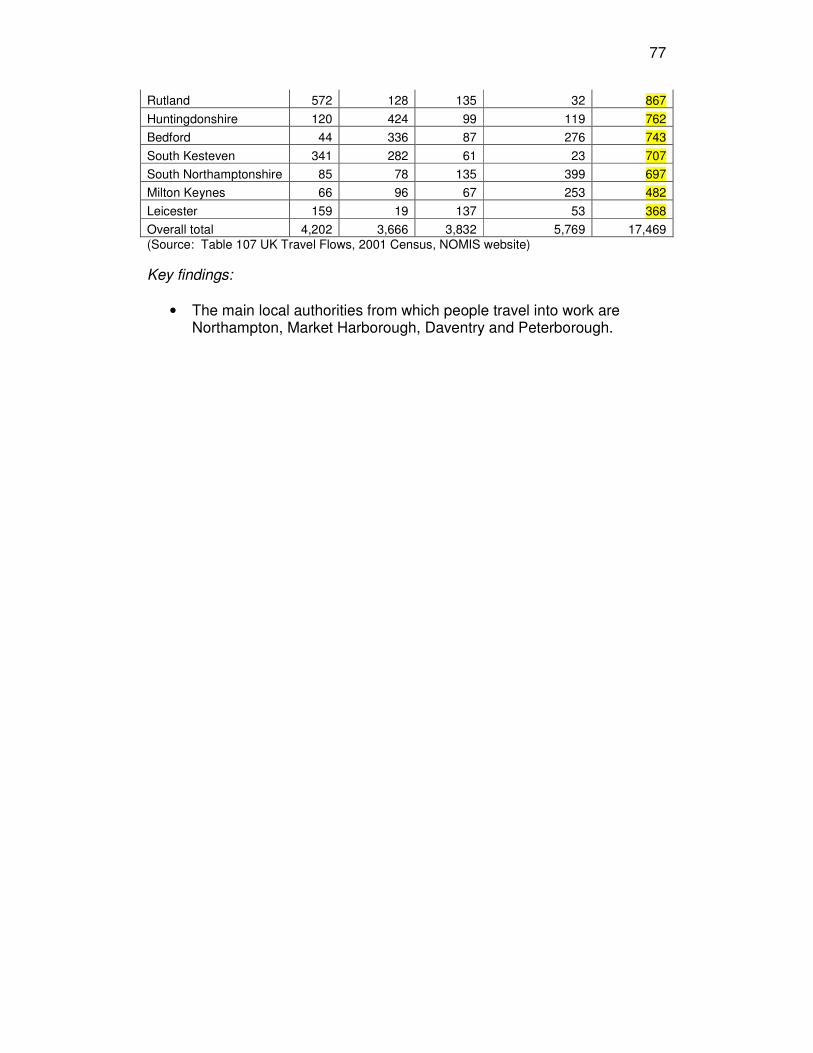
77
Rutland 572 128 135 32 867
Huntingdonshire 120 424 99 119 762
Bedford 44 336 87 276 743
South Kesteven 341 282 61 23 707
South Northamptonshire 85 78 135 399 697
Milton Keynes 66 96 67 253 482
Leicester 159 19 137 53 368
Overall total 4,202 3,666 3,832 5,769 17,469
(Source: Table 107 UK Travel Flows, 2001 Census, NOMIS website)
Key findings:
• The main local authorities from which people travel into work are Northampton, Market Harborough, Daventry and Peterborough.
78
79
2.28 The following table and map address the question, ‘where do people work who live in North Northamptonshire? and identify the principal flows. The 75% level is equivalent to 24,000 people. Table 2.20: travel out to work from North Northamptonshire to local authorities where 300 or more travel out, 2001, 75% level identified
Local Authority Corby East
Northants. Kettering Wellingborough North
Northants.
Northampton 833 2,992 3,378 5,925 12,295
Bedford 45 2,010 213 617 2,840
Milton Keynes 93 706 323 1,071 2,100
Peterborough 129 1,546 227 100 1,873
Daventry 115 349 582 441 1,372
Huntingdonshire 44 908 195 95 1,198
Market Harborough 184 79 1,026 68 1,173
South Northamptonshire 95 187 222 324 733
Westminster 34 163 152 146 461
Central Bedfordshire 16 220 59 146 425
Leicester 95 76 283 63 422
Luton 10 145 47 136 328
South Kesteven 21 280 21 3 304
Overall total 2,483 11,882 8,725 10,761 32,003
(Source: Table 107 UK Travel Flows, 2001 Census, NOMIS website) Key findings:
• There is a slightly different pattern for travelling out compared with travelling in. The main local authorities to which people travel to work include Northampton and Peterborough, Bedford is a principal destination but Market Harborough is not. The only local authority which is not adjacent is the London Borough of Westminster.
2.29 The final two tables compare commuting data from the 2001 Labour
Force Survey with data from the 2008 Annual Population Survey. Such comparisons must be treated with confidence as both rely on limited sample surveys but they identify:
• an increase in people both living and working in Corby; and
• a decrease significant at the 5% level, of commuting from Kettering to Corby.

80

81
Table 2.21: place of residence commuter flows: where do workers live? (commuters in), 2001 and 2008
Corby East Northamptonshire Kettering Wellingborough
Workplace 2001 2008
Change Significant at 5% level 2001 2008
Change Significant at 5% level 2001 2008
Change Significant at 5% level 2001 2008
Change Significant at 5% level
Residence % % % % % % % %
Corby 59.0 73.2 No 0.0 0.0 n/a 3.4 5.8 No 0.0 0.0 n/a
East Northamptonshire 3.4 4.9 No 66.3 68.3 No 0.0 3.7 n/a 9.6 10.9 No
Kettering 20.0 7.6 Yes 8.6 8.9 No 72.8 67.7 No 8.6 8.3 No
Wellingborough 0.0 0.0 n/a 8.6 5.8 No 6.3 8.8 No 65.8 61.9 No
Peterborough 1.2 2.1 No 2.6 1.6 No 0.0 0.0 n/a 0.0 0.0 n/a
Rutland 3.0 1.8 No 0.0 0.0 n/a 0.0 0.0 n/a 0.0 0.0 n/a
Northampton 0.0 0.0 n/a 0 0 n/a 0.0 0 n/a 4.9 8.7 No
(Source: 2001 Labour Force Survey and 2008 Annual Population Survey, APS Commuter Flow, Neighbourhood Statistics Website) Note: Some data shows a commuting linkage but estimates are not reliable

82
Table 2.22: workplace commuter flows: where do residents work? (commuters out), 2001 and 2008
Corby East Northamptonshire Kettering Wellingborough
Residence 2001 2008
Change Significant at 5% level 2001 2008
Change Significant at 5% level 2001 2008
Change Significant at 5% level 2001 2008
Change Significant at 5% level
Workplace % % % % % % % %
Corby 81.1 77.1 No 2.4 3.3 No 12.8 5.1 Yes 0.0 0.0 n/a
East Northamptonshire 0.0 0.0 n/a 43.3 40.9 No 5.0 5.3 No 5.9 4.0 No
Kettering 5.8 7.6 n/a 0.0 3.1 n/a 58.2 56.7 No 5.9 8.5 No
Wellingborough 0.0 0.0 n/a 9.2 8.7 No 7.3 6.6 No 66.0 56.7 No
Peterborough 0.0 0.0 n/a 0.0 0.0 n/a 0.0 0.0 n/a 0.0 0.0 n/a
Rutland 0.0 0.0 n/a 0.0 0.0 n/a 0.0 0.0 n/a 0.0 0.0 n/a
Northampton 0.0 0.0 n/a 6.3 9.0 No 5.9 8.1 No 12.0 8.7 No
Milton Keynes 0.0 0.0 n/a 0.0 3.7 n/a 0.0 0.0 n/a 4.3 6.7 No
North Hertfordshire 0.0 0.0 n/a 0.0 5.7 n/a 0.0 0.0 n/a 0.0 3.7 n/a
Leicester 0.0 0.0 n/a 0.0 0.0 n/a 0.0 2.8 n/a 0.0 0.0 n/a
Bedford 0.0 0.0 n/a 5.1 7.2 No 0.0 0.0 n/a 0.0 0 n/a
(Source: 2001 Labour Force Survey and 2008 Annual Population Survey, APS Commuter Flow, Neighbourhood Statistics Website) Note: Some data shows a commuting linkage but estimates are not reliable

83
3.0 What choices do consumers have in the housing market? A
profile of housing stock and supply 3.1 Introduction 3.1 This section reviews patterns and trends in the housing market across
the area as the basis for understanding the balance between supply and demand and the future requirement for housing. A distinction is made between housing stock - the number of dwellings - and housing supply - the number of dwellings available annually to rent or purchase due to turnover from the existing stock and new supply from construction, conversions and bringing empty homes back into use.
3.2 Setting the baseline: patterns and trends in the housing stock Property type 3.2 An authoritative and up-to-date breakdown of the dwelling stock by
type will need to be added once 2011 Census data is released. The following table summarises the baseline position by accommodation type in 2001 and the sub-section closes with a detailed estimate of stock by tenure. Table 3.24 provides a detailed estimate of the current position.

84
Table 3.1: accommodation type, 2001
Corby E.Northants. Wellingborough Kettering N. Northants E.Midlands England
Property Type No % No % No % No % No % % %
Whole house or bungalow: Detached 3,958 17.4 11,546 35.4 10,424 29.2 8,108 26.1 34,036 27.9 32.2 22.5
Whole house or bungalow: Semi-detached 8,362 36.8 11,162 34.2 12,697 35.6 10,715 34.5 42,936 35.2 36.3 31.6
Whole house or bungalow: Terraced (including end terrace) 7,495 33.0 7,377 22.6 9,078 25.4 9,054 29.2 33,004 27.1 21.3 25.8
Flat; maisonette or apartment: Purpose Built block of flats or tenement 2,507 11.0 1,819 5.6 2,676 7.5 2,304 7.4 9,306 7.6 7.2 14.0
Flat; maisonette or apartment: Part of a converted or shared house (including bed-sits) 211 0.9 274 0.8 468 1.3 457 1.5 1,410 1.2 1.7 4.6
Flat; maisonette or apartment: In commercial building 135 0.6 293 0.9 270 0.8 202 0.7 900 0.7 0.9 1.1
Caravan or other mobile/temporary structure 42 0.2 138 0.4 59 0.2 178 0.6 417 0.3 0.4 0.4
Total Dwellings 22,710 100.0 32,609 100.0 35,672 100.0 31,018 100.0 122,009 100.0 100.0 100.0
(Source: KS16 2001 Census)
Key findings:
• Compared with the national pattern, the main differences are the higher proportions of detached and semi-detached houses and the lower proportions of flats. These difference are less marked when compared with the regional pattern; and
• Corby has the most distinctive housing profile with below average proportions of detached houses and above average proportions of terraced houses.

85
Tenure 3.3 The following table summarises the baseline position in 2001 and is followed by the current estimate. Table 3.2: tenure type, 2001
Corby E.Northants. Wellingborough Kettering N. Northants E. Midlands England
Tenure No % No % No % No % No % % %
Owner occupied: Owns outright 4,597 20.9 9,030 28.9 8,172 27.2 10,079 29.3 31,878 27.1 30.8 29.2
Owner occupied: with a mortgage or loan 9,132 41.5 14,699 47.0 13,307 44.2 16,313 47.4 53,451 45.4 40.8 38.9
Owner occupied: shared ownership 73 0.3 1,425 4.6 255 0.8 84 0.2 497 0.4 0.6 0.7
Rented from: a local authority 6,127 27.8 0 0 4,885 16.2 3,726 10.8 16,078 13.7 13.8 13.2
Rented from: Housing Association 696 3.2 3,127 10.0 1,004 3.3 964 2.8 5,791 4.9 3.7 6.1
Rented from: Private landlord or letting agency 747 3.4 1,948 6.2 1,565 5.2 2,204 6.4 6,464 5.5 7.3 8.8
Rented from: Other 641 2.9 1,015 3.2 894 3.0 1,072 3.1 3,622 3.1 3.0 3.2
All Households 22,013 100.0 31,244 100.0 30,082 100.0 34,442 100.0 117,781 100.0 100.0 100.0
(Source: KS18 2001 Census) Note: Although recorded as such, there were no local authority homes in East Northants at the time of the 2001 Census and need. This is a common inaccuracy arising from former local authority tenants continuing to record themselves as local authority tenants and these figures have been added to the housing association total.
Key findings:

86
• Compared with the national pattern, the main difference is the lower proportion of private rented housing. This difference is less marked when compared with the regional pattern; and
• Corby has the most distinctive housing profile with below average proportions of home ownership and private renting and above average proportions of social renting.

87
3.4 The following table summarises the estimated position by tenure at 2011 but owner occupation and private renting are not separated.
Table 3.3: tenure at 2011
Local authority
Housing association
Other Public Sector
Owner Occupied &
Private Rented Total
Area No. % No. % No. % No. % No. %
Corby 4,808 18.4 809 3.1 0 0.0 20,490 78.5 26,100 100.0
East Northants. 0 0.0 4,933 13.4 10 0.0 31,770 86.5 36,710 100.0
Kettering 3,812 9.4 1,593 3.9 5 0.0 35,110 86.6 40,520 100.0
Wellingborough 12 0.0 5,848 17.6 0 0.0 27,390 82.4 33,250 100.0
North Northants 8,632 6.3 13,183 9.7 15 0.0 114,760 84.0 136,580 100.0
East Midlands - 9.5 - 6.4 0.2 - 83.8 - 100.0
England - 7.9 - 9.9 0.3 - 82.0 - 100.0
(Source: Table 100, Dwelling Stock by District, CLG website)
Key findings
• As the owner occupied and private rented totals are not disaggregated, it is difficult to compare this breakdown with that of 2001 above, other than to identify a fall in the proportion of social housing from 18.5-16% of the stock total. A further and more detailed estimate of stock by tenure is provided at Table 3.24 below.

88
Number of rooms and bedrooms
3.5 A key indicator when profiling the supply of housing is the number of bedrooms. Whilst this data will be available from the 2011 Census, only the number of habitable rooms was recorded in 2001, i.e. excluding bathrooms, toilets, halls or landings. The following table summarises the baseline position by number of rooms in 2001.
Table 3.4: number of rooms
Corby E.Northants. Kettering Wellingborough N. Northants E.Midlands England
Rooms No % No % No % No % No % % %
1 room 127 0.6 64 0.2 176 0.6 106 0.3 473 0.4 0.4 0.9
2 rooms 503 2.3 336 1.1 581 1.9 463 1.3 1,883 1.6 1.6 2.5
3 rooms 1,705 7.7 1,453 4.7 1,987 6.6 2,023 5.9 7,168 6.1 6.5 9.2
4 rooms 3,631 16.5 5,086 16.3 4,955 16.5 6,550 19.0 20,222 17.2 18.1 20.0
5 rooms 7,656 34.8 8,861 28.4 9,524 31.7 10,093 29.3 36,134 30.7 30.2 27.1
6 rooms 5,244 23.8 6,805 21.8 6,582 21.9 7,515 21.8 26,146 22.2 22.3 20.5
7 rooms 1,825 8.3 3,519 11.3 2,873 9.6 3,573 10.4 11,790 10.0 9.7 9.2
8 or more rooms 1,322 6.0 5,120 16.4 3,404 11.3 4,119 12.0 13,965 11.9 11.3 10.6
All Occupied Household Spaces 22,013 100.0 31,244 100.0 30,082 100.0 34,442 100.0 117,781 100.0 100.0 100.0
(Source: UV57 2001 Census)
89
Key findings:
• The number of rooms was close to the regional average but, when compared with the national pattern, there are fewer homes with a smaller number of rooms and a larger proportion with more rooms.
3.6 The following table estimates the number of properties by bed size based on the assumption that:
• 1-2 rooms are 1 bed;
• 3-4 rooms are 2 bed;
• 5 rooms are 3 bed;
• 6-7 rooms are 4 bed, and,
• 8+ rooms are 5+ bed.
Table 3.5: number of bedrooms
Corby E.Northants. Kettering Wellingborough N. Northants E.Midlands England
Rooms No % No % No % No % No % % %
1 bed 630 2.9 400 1.3 757 2.5 569 1.6 2,356 2.0 2.0 3.4
2 bed 5,336 24.2 6,539 21.0 6,942 23.1 8,573 24.9 27,390 23.3 24.6 29.2
3 bed 7,656 34.8 8,861 28.4 9,524 31.7 10,093 29.3 36,134 30.7 30.2 27.1
4 bed 7,069 32.1 10,324 33.1 9,455 31.5 11,088 32.2 37,936 32.2 32.0 29.7
5 bed or more 1,322 6.0 5,120 16.4 3,404 11.3 4,119 12.0 13,965 11.9 11.3 10.6
All occupied spaces 22,013 100 31,244 100 30,082 100 34,442 100 117,781 100 100 100
(Source: UV57 2001 Census)

90
Key findings:
• Whilst there will be wide variations at ward level, this table confirms that, when compared with the national pattern, there are fewer smaller and more larger homes across the area.
• The main differences by district from regional or national averages are:
o In Corby, the larger proportion of 3 bed and smaller proportion of 5 bed homes or larger; and o In East Northants, the smaller proportion of 1 bed and larger proportion of 5 bed properties;
Dwellings by Council Tax band 3.7 The following table summarises dwellings by Council Tax band in 2011. It must be remembered that as the property values
on which these bandings have been based have not been updated since 1st April 1991 and may no longer be a valid indication of relative market values.
Table 3.6: dwellings by Council Tax band, 2011
Corby East Northants. Kettering Wellingborough North
Northants East Mids
England & Wales
Band No % No % No % No % No % % %
A 13,650 52.2 9,136 24.6 12,940 31.2 10,384 31.3 46,110 33.4 37.7 24.3
B 5,625 21.5 10,131 27.2 11,487 27.7 9,473 28.5 36,716 26.6 22.5 19.7
C 3,026 11.6 5,922 15.9 7,781 18.8 6,509 19.6 23,238 16.8 18.0 21.8
D 2,367 9.1 4,783 12.9 4,609 11.1 3,559 10.7 15,318 11.1 10.7 15.4
E 1,052 4.0 3,536 9.5 2,751 6.6 2,079 6.3 9,418 6.8 6.3 9.7
F 251 1.0 2,226 6.0 1,244 3.0 761 2.3 4,482 3.2 3.0 5.2
G 142 0.5 1,328 3.6 635 1.5 416 1.3 2,521 1.8 1.7 3.5

91
H 18 0.1 133 0.4 51 0.1 38 0.1 240 0.2 0.2 0.6
I 0 0.0 0 0.0 0 0.0 0 0.0 0 0.0 0.0 0.0
Total 26,131 100.0 37,195 100.0 41,498 100.0 33,219 100.0 138,043 100.0 100.0 100.0
(Source: Dwellings by Council Tax Band, Neighbourhood Statistics website) Key findings:
• This confirms that, when compared with the national pattern, there are more lower value and less higher value homes.

92
Underoccupation and overcrowding 3.8 The Occupancy Rating provides a measure of both under-occupancy
and overcrowding and is based on the concept of the Room Requirement which is calculated as follows:
• a one-person household is assumed to require three rooms (two common rooms and a bedroom); and
• where there are two or more residents, it is assumed that they require a minimum of two common rooms plus one bedroom for:
• each couple (as determined by the relationship question)
• each lone parent
• any other person aged 16 or over
• each pair aged 10 to 15 of the same sex
• each pair formed from a remaining person aged 10 to 15 with a child aged under 10 of the same sex
• each pair of children aged under 10 remaining
• each remaining person (either aged 10 to 15 or under 10). 3.9 The Occupancy Rating relates the actual number of rooms in a
property to the number of rooms ‘required’ by the members of that household (based on an assessment of the relationship between household members, their ages and gender) and provides the following outcomes which are used here as proxy indicators of under-occupation and overcrowding:
• An occupancy rating of +2 or more suggests there are 2 or more rooms more than are 'required' according to the definition, i.e. there is under-occupation; and
• An occupancy rating of -1 suggests there is one less room than is 'required' according to the definition, i.e. there is overcrowding.
3.10 The following table summarises the level of under-occupation and
overcrowding for all households and, in view of its greater incidence among older people, highlights households including one or more pensioners.
Table 3.7: under-occupation and overcrowding, 2001
Indicator Corby East Northants Kettering W/borough
North Northants.
Occupancy rating +2 all households: no. 10,673 19,143 19,403 16,340 65,559 Occupancy rating +2 all households: % 48.48 61.28 56.33 54.32 55.10 Occupancy rating +2 pensioner 3,656 5,615 5,955 5,166 20,392

93
households: no. Occupancy rating +2 pensioner households: % 56.77 61.98 58.11 57.16 58.51 Occupancy rating -1 all households: no. 1,377 862 1,295 1,547 5,081 Occupancy rating -1 all households: % 6.26 2.76 3.76 5.14 4.48 (Source: Table UV59, 2001 Census)
Key findings
• An average of 55% of all households are underoccupying and 59% of pensioner households. The highest rates are in East Northants. and the lowest in Corby.
• An average of almost 5% of all households are overcrowded, the highest rate is in Corby.
Trends in residential completions 3.8 This section reviews trends in residential completions in general, by
sector and bedsize. The following table summarises trends between 2006 and 2011.
Table 3.7: all residential completions, 2006-2011 Area 2006/07 2007/08 2008/09 2009/10 2010/11 Total % Corby 573 457 476 372 585 2,463 30.5 East Northants 504 536 170 211 217 1,638 20.3
Kettering 572 685 422 395 473 2,547 31.6 Wellingborough 392 474 295 151 110 1,422 17.6 North Northants 2,041 2,152 1,363 1,129 1,385 8,070 100% (Source: North Northants JPU and local authority data)
Key findings:
• Over 8,000 properties have been completed since 2006-07, almost one third each in Corby and Kettering with the lowest proportion in Wellingborough.
Completions by bedsize 3.9 The following table summarises trends in all housing completions by
bedsize between 2006 and 2011 for East Northants and Wellingborough.

94
Table 3.8: all residential completions by bedsize, 2006-2011
Year Corby East Northants Kettering Wellingborough Total no.
Total %
1 bed
2006/07 - 20 - 22 42
2007/08 - 55 - 46 101
2008/09 - 58 - 13 71
2009/10 - NK - 40 40
2010/11 - 7 - 15 22
Totals 140 - 136 276 12.48
2 bed
2006/07 - 108 - 74 182
2007/08 - 217 - 99 316
2008/09 - 48 - 14 62
2009/10 - NK - 64 64
2010/11 - 19 - 81 100
Totals 392 - 332 724 32.75 3 bed
2006/07 - 167 - 17 184
2007/08 - 220 - 14 234
2008/09 - 46 - 8 54
2009/10 - NK - 22 22
2010/11 - 65 - 19 84
Totals 498 - 80 578 26.14
4 bed
2006/07 - 177 - 2 179
2007/08 - 198 - 4 202
2008/09 - 60 - 0 60
2009/10 - NK - 0 0
2010/11 - 42 - 0 42
Totals 477 - 6 483 21.85
5 bed
2006/07 - 0 - 0 0
2007/08 - 0 - 0 0
2008/09 - 0 - 0 0
2009/10 - NK - 0 0
2010/11 - 0 - 1 1
Totals 0 - 1 1 0.05
All housing
2006/07 - 472 - 115 587
2007/08 - 690 - 163 853
2008/09 - 212 - 35 247
2009/10 - 149 - 126 275
2010/11 - 133 - 116 249
Sub-totals - 1.656 - 555 2,211
Overall total 2,463 1.656 2,547 555 7,221
Overall % 34.11 22.93 35.27 7.69 100% 100% (Source: North Northants JPU and local authority data)
95
Key findings:
• The very limited data available must be recognised and, based on data from East Northants and Wellingborough only, it provides only an indication of trends across North Northants
• Of 2,211 completions between 2006 and 2011 for which bedsize data is available:
o 13% were 1 bed; o 33% were 2 bed; o 26% were 3 bed; and o 22% were 4 bed or larger.
• This suggests almost equal emphasis is being placed on 1-2 and 3-4 bed homes, whilst household change implies a growing requirement for smaller homes.
Completions by tenure 3.10 The following table summarises trends in all and affordable housing
completions between 2006 and 2011. Table 3.9: all and affordable residential completions, 2006-2011
Area Type 2006/ 07
2007/ 08
2008/ 09
2009/ 10
2010/ 11
Total No.
Total %
All 573 457 476 372 585 2,463 - Corby Afford. 0 0 114 69 103 286 11.61
All 504 536 170 211 217 1,638 - East Northants Afford. 42 128 25 120 78 393 23.99
All 572 685 422 395 473 2,547 - Kettering Afford. 212 116 288 160 202 958 37.61
All 392 474 295 151 110 1,422 - Wellingborough Afford. 68 171 46 119 130 534 37.55
All 2,041 2,152 1,363 1,129 1,385 8,070 -
Afford. 322 415 453 468 513 2,171 26.90 North Northants
% of total 15.78 19.28 33.24 41.45 37.04 26.90
(Source: North Northants JPU and local authority data)
Key findings:
• Of over 8,000 completions since 2006-07, 26.9% have been affordable ranging from 38% in Kettering and Wellingborough to 24% in East Northants. and 12% in Corby. The higher delivery in later years is indicative of the volume of 100% affordable grant-funded schemes.
Affordable housing completions

96
3.11 The following table summarises trends in affordable housing completions between 2006 and 2012.
Table 3.10: affordable residential completions, 2006-2011
Year Tenure Corby East Northants Kettering Wellingborough
North Northants
2006/07 Social 0 10 91 23 124
2007/08 Social 0 66 66 113 245
2008/09 Social 42 5 145 39 231
2009/10 Social 51 109 96 66 322
2010/11 Social 95 56 156 85 392
Totals Social 188 246 554 326 1,314
2006/07 Intermediate 0 32 121 32 185
2007/08 Intermediate 0 62 50 58 170
2008/09 Intermediate 72 4 98 33 207
2009/10 Intermediate 18 11 64 53 146
2010/11 Intermediate 8 22 46 45 121
Totals Intermediate 98 131 379 221 829
2006/07 All affordable 0 42 212 68 322
2007/08 All affordable 0 128 116 171 415
2008/09 All affordable 114 9 243 72 438
2009/10 All affordable 69 120 160 119 468
2010/11 All affordable 103 78 220 130 531
Totals All affordable 286 377 951 560 2,174
2011/12 All affordable 138 51 87 58 334 (Source: North Northants JPU and local authority data)
Kettering data includes Intermediate and ‘other’.
Key findings:
• 60% of affordable completions were social rented and one third intermediate housing including intermediate rent and shared ownership.
3.3 The private rented sector 3.12 The following section uses current data to profile the private rented
sector and uses a range of data sources:
• The property websites ‘rightmove’ and ‘findaproperty’;
• The Valuation Office Agency database; and
• Interviews with lettings agents.

97
3.13 The following table profiles the average number of private rented properties available for letting by type for February - May 2012, details of property type was not available for all properties advertised.
Table 3.11: the supply of private rented sector properties by type, February - May 2012 Type of accommodation Corby
East Northants Kettering Wellingborough
Total. No.
Total %
Flats/apartments 37 57 106 65 265 31.7 Terraced 59 29 85 45 218 26.1 Detached 31 56 54 25 166 19.9
Semi-detached 36 30 54 44 164 19.6 Bungalows 2 4 10 7 23 2.8
Sub-total 165 176 309 186 836 100% Sub-total % 19.7 21.1 37.0 22.3 Total advertised 178 178 321 183 860
(Source: rightmove.co.uk)
Key findings
• An average of 860 properties were advertised in February - May 2012, more than a third of the total in Kettering and almost exactly the same proportions in the 3 other local authority areas;
• The main property types advertised were flats and terraced houses though one fifth were detached houses.
3.14 The following table profiles the average monthly rentals of properties
available by type for February – May 2012. Table 3.12: private rented sector, average monthly rentals by property type and bedsize, February - May 2012, rounded to £5 Type of accommodation Corby
East Northants Kettering Wellingborough
North Northants.
Studio flats - - - £330 -
1 bed flats £380 £420 £390 £380 £395 2 bed flats £455 £470 £480 £480 £470
3 bed flats - - £515 £500 £510 1 bed houses £350 - £480 £400 £410
2 bed houses £490 £535 £545 £520 £525 3 bed houses £600 £625 £640 £600 £615 4 bed houses £775 £940 £870 £845 £860
5 bed houses £1,065 £1,130 £1,120 £1,100 £1,105 (Source: findaproperty.com and East Northants DC)
Key findings
• Average monthly rents by bedsize were as follows:

98
o No rentals were recorded for single rooms; o Only Wellingborough offered studio bed flats at £330; o £395 for a 1 bed property ranging from £380 in Corby and
Wellingborough to £420 in East Northants; o £410 for a 2 bed property ranging from £490 in Corby to £545 in
Kettering; o £615 for a 3 bed property ranging from £600 in Corby and
Wellingborough to £640 in Kettering; o £860 for a 4 bed property ranging from £775 in Corby to £940 in
East Northants; o £1,105 for a 5 bed property ranging from £1,065 in Corby to
£1,130 in East Northants. 3.15 The Valuation Office Agency (VOA) database holds lettings information
collected as part of the VOA’s responsibility to administer the rent officer functions related to Housing Benefit (Local Housing Allowance and Local Reference Rents) on behalf of the Department for Work and Pensions (DWP). The following table provides a range of monthly rental indicators for properties assessed in 2011.
Table 3.13: the number, average, lower quartile, median and upper quartile market rents collected by the VOA, 2011
Area Number of rents
Average rent
Lower Quartile rent
Median rent
Upper Quartile rent
Corby 879 £515 £450 £495 £550
East Northamptonshire 1,523 £586 £450 £550 £650
Kettering 1,890 £523 £425 £495 £575
Wellingborough 1,218 £529 £425 £515 £595
North Northants. 5,510 £538 £438 £514 £593 (Source: VOA 12.11)
Key findings
• Based on over 5,500 decisions in 2011, the average rent was £538 ranging from £515 in Corby to £586 in East Northants.
3.16 The following table provides more detailed information concerning average rents by bedsize for properties assessed in 2011.

99
Table 3.14: the number of market rents and averages by property type and bedsize, VOA, 2011
Area Rooms Average rent Studio
Average rent 1 bed
Average rent 2 bed
Average rent 3 bed
Average rent 4 bed+
Average rent All
Average rent
Corby 40 £357 - - 63 £395 298 £471 385 £537 91 £720 879 £515
East Northants. - - 12 £354 215 £385 578 £505 523 £620 191 £988 1,523 £586
Kettering 71 £288 13 £343 258 £377 779 £476 604 £583 165 £866 1,890 £523
Wellingborough 20 £305 10 £301 190 £396 463 £487 452 £577 83 £891 1,218 £529
N.Northants. no. 131 £317 35 £333 726 £388 2,118 £485 1,964 £579 530 £866 5,510 £538
N.Northants. % 2.38 - 0.64 - 13.18 - 38.44 - 35.64 - 9.62 - 100% -
(Source: VOA 12.11)
Key findings
• 2 bed properties or smaller made up 55% of properties on which a determination was made, though studios and rooms made up only 3%;
• 26% were 3 bed and 10% 4 bed.
• Average rents by bedsize were as follows:
o £317 for a room ranging from £288 in Kettering to £357 in Corby, with no supply in East Northants; o £333 for a studio ranging from £301 in Wellingborough to £354 in East Northants. with no supply in Corby; o £388 for a 1 bed property ranging from £377 in Kettering to £395 in Corby; o £485 for a 2 bed property ranging from £471 in Corby to £505 in East Northants; o £579 for a 3 bed property ranging from £537 in Corby to £620 in East Northants; o £866 for a 4 bed property ranging from £720 in Corby to £988 in East Northants.

100
Calculating the size of the private rented and owner occupied sectors 3.17 No data is available to identify the size of the private rented sector at
local authority level. The English Housing Survey 2010-2011 provides a national benchmark, estimating that private rented properties make up 16.52% of all dwellings. The Labour Force Survey 2007-08 includes a widely used estimate of the size of the private rented sector at regional level. For the East Midlands region this was 12%, but this is now several years out of date.
3.18 The following methodology has been applied to estimate the size of the
private rented sector in North Northamptonshire. This includes a range of assumptions which have been applied conservatively and therefore, the outcome is likely to be an underestimate.
Stage 1: the number of private rented properties currently available 3.19 The property website rightmove.com enables bespoke maps to be
created and the number of rented properties identified within a defined boundary. Maps have been created for each local authority and this calculation made at 16th February and 16th May 2012. Although widely used, not all rented properties will be advertised through this website and supply will vary throughout the year.
Stage 2: the turnover of private rented properties available 3.20 There are a number of possible indicators of this but the most recent is
from findaproperty.com’s Market Bulletin for the third quarter of 2011 which states:
‘The average rental property spends 45 days on the market’. 3.20 This is equivalent to a property turning over 8 times per annum (365/8).
Whilst not all properties will turn over so quickly, a lower turnover rate is likely to compensate for any undercount in the number of properties advertised.
Stage 3: the turnover of private rented properties per annum 3.21 This has been calculated on the basis of the turnover of tenants. The
English Housing Survey 2010-11 estimated that 35% of private renters had lived in their property for less than one year. Most tenancies are 6 months shorthold and a single property may have been rented twice in one year. It has been assumed therefore that 30% of the private rented stock turns over per annum and a multiplier of 3.3 has been applied here (100/30)
The following table summarises the outcome expressed in terms of:
1. the estimated size of the private rented sector;

101
2. the proportionate increase since 2001 3. the private rented sector as a proportion of the estimated total and
of private sector stocks at 2011; and 4. the estimated size of the home ownership stock (all private sector
less estimated private rented stock).

102
Table 3.15: estimating the size of the private rented and owner occupied sectors, February and March 2012
Area Properties available
Implied per annum (x 8)
Total PR (x 3.3)
PR 2001
PR as % of total stock 2001
% increase since 2001
Total housing stock 2011
PR as % of total housing stock 2011
Total private stock 2011
PR as % of total private stock 2011
O/O as % of total stock 2001
Total O/O 2011
O/O as % of total stock 2011
Corby 178 1,424 4,699 747 3.4 629.08 26,100 18.0 20,490 22.93 62.7 15,791 60.5
E.Northants. 178 1,424 4,699 1,948 6.2 241.23 36,710 12.8 31,770 14.79 76.2 27,071 73.7
Kettering 321 2,568 8,474 1,565 5.2 541.50 40,520 20.9 35,110 24.14 72.2 26,636 65.7
Wellingborough 183 1,464 4,831 2,204 6.4 219.20 33,250 14.5 27,390 17.64 76.9 22,559 67.9
N.Northants. 860 6,880 22,704 6,464 5.5% 351.24 136,580 16.6% 114,760 19.78 72.9 92,056 67.4%
(Source: Housing Vision estimate)
Key findings
• It is estimated that the private rented stock has grown three and a half times since 2001 and now constitutes almost 17% of all housing – compared with 5.5% in 2001 – and 20% of the market sector. This is due to a coincidence of factors including the introduction of ‘Assured Shorthold’ tenancies; the growth of the ‘buy to let’ market in the 10 years from the late 1990s and the more recent problems in accessing home ownership, especially for first time buyers;
• The largest proportionate growth has been in Corby (over 6 times growth) and Kettering (over 5 times growth);
• Private rented housing ranges from 13% of all stock in East Northants (6.2% in 2001) to almost 21% in Kettering (5.2% in 2001); and
• Owner occupied has fallen substantially as a proportion of the total stock, from 73% in 2001 to 67% in 2011, and is now 61% in Corby – a fall of 2% since 2001; 74% in East Northants. – a fall of over 3%; 66% in Kettering – a fall of over 5% and 68% in Wellingborough – a fall of 9%. This is attributable to the growth of private renting especially the ‘buy to let’ purchase of new and existing homes.

103
3.4 The home ownership sector 3.22 In the previous sub-section, the owner occupied sector was estimated
to constitute 92,056 properties in North Northants. This section uses Land Registry data and Interviews with estate agents to profile the home ownership sector. The following table summarises the number of sales and average property prices between 2004 and 2011.
104
Table 3.16: the volume of sales and average property prices by year, 2004-June 2011
Corby East Northamptonshire Kettering Wellingborough North Northants East Midlands
Year No. Average Price No.
Average Price No.
Average Price No.
Average Price No.
Average Price No.
Average Price
2004 1,409 £111,578 2,406 £160,581 2,597 £141,613 1,877 £134,791 8,289 £140,468 99,862 £143,970
2005 1,262 £122,465 2,133 £170,022 2,326 £148,486 1,654 £147,576 7,375 £150,058 85,261 £152,575
2006 1,728 £131,707 2,674 £175,449 3,028 £152,379 2,023 £149,422 9,453 £154,493 105,487 £158,772
2007 1,633 £144,417 2,366 £185,653 2,602 £161,431 1,951 £159,462 8,552 £164,434 97,460 £167,656
2008 684 £142,471 1,065 £185,097 1,210 £158,298 876 £155,608 3,835 £162,303 48,144 £162,473
2009 644 £125,816 1,082 £174,823 1,173 £150,915 766 £156,419 3,665 £154,713 50,458 £157,381
2010 642 £130,336 1,069 £187,675 1,078 £155,240 847 £157,781 3,636 £160,971 48,831 £164,797
2011 (Jan-June) 420 £126,525 765 £187,423 764 £152,821 528 £157,491 2,477 £160,044 18,567 * £156,408
(Source: Land Registry Reports, Housing Intelligence for the East Midlands Website) Note: * East Midlands data to September 2011
Key findings
• The number of transactions has fallen dramatically from almost 9,500 in 2006 to under 4,000 in 2010;
• Since 2010-11, the highest average prices have been in East Northants. and lowest in Corby; and
• Average prices peaked in 2007 and have since fallen by almost 3%. The greatest fall has been in Corby (12.4%) and the lowest in Wellingborough (2.2%) but East Northants has bucked the trend with a 1% increase.

105
3.23 The following table summarises the number of sales and average price by property type by local authority area between January 2010 and September 2011.
Table 3.17: average property price by type of dwelling by local authority area, January 2010 to September 2011
Corby East Northamptonshire Kettering Wellingborough North Northants Type No. %
Ave. Price No. %
Ave. Price No. %
Ave. Price No. %
Ave. Price No. %
Ave. Price
Flats and Apartments 61 5.8 £73,767 74 4.5 £98,897 76 4.6 £85,744 81 6.3 £92,898 292 5.2 £88,560
Terraced 340 32.6 £102,609 389 23.5 £127,536 478 29.1 £106,158 346 26.8 £108,275 1,553 27.6 £111,207
Semi- Detached 351 33.6 £119,045 549 33.2 £151,795 588 35.8 £137,267 474 36.8 £138,567 1,962 34.8 £138,386
Detached 292 28.0 £190,599 642 38.8 £264,887 502 30.5 £227,477 388 30.1 £236,207 1,824 32.4 £236,598
All sales 1,044 100.0 £131,060 1,654 100.0 £187,705 1,644 100.0 £153,386 1,289 100.0 £156,956 5,631 100.0 £160,144
Total stock & Turnover rate 15,791 6.61 - 27,071 6.11 - 26,636 6.17 - 22,559 5.71 - 92,056 6.12 -
(Source: Land Registry)
Key findings
• Detached and semi-detached properties made up almost 70% of the total, terraced houses 28% and flats and apartments only 5%;
• The average turnover rate was 6.12%, varying from 5.71% in Wellingborough to 6.61% in Corby; and
• Average prices by property type were as follows:
o £89k for a flat/apartment ranging from £74k in Corby to £99k in East Northants; o £111k for a terraced house ranging from £103k in Corby to £128k in East Northants; o £138k for a semi-detached property ranging from £119k in Corby to £152k in East Northants;

106
o £237k for a detached property ranging from £191k in Corby to £265k in East Northants;
• Getting on the housing ladder in East Northants is likely to be especially difficult as there are proportionately less sales off flats and terraced houses.
3.24 The following maps identify the spectrum of average prices for properties sold between January 2010 and September 2011
and enable lower and higher prices hot spots to be identified.

107

108

109

110

111

112
3.5 The intermediate housing sector 3.25 The intermediate housing sector consists of market housing provided
at a discount to enable access to home ownership or market housing. Several schemes are currently available, previous schemes have been variants of shared ownership or have provided sub-market rental such as Intermediate Rental.
‘HomeBuy’ schemes for home owners
3.26 HomeBuy schemes aimed at helping people buy new homes and are
only open to households who earn £60,000 a year or less and who can’t afford to buy a home in their area. Loans are only available to first-time buyers or applicants renting from a council or housing association. There are three types of HomeBuy schemes for home owners:
• ‘shared ownership’: enabling applicants to buy a share in their home and pay rent on the remaining share; and
• ‘equity loan’: providing a loan towards the home’s purchase price which incurs no fees for five years. A mortgage and deposit must meet up to 70% of the purchase price with the remainder provided by the government and the housebuilder as an equity loan.
• The NewBuy scheme: this is aimed at raising the deposit to buy a new-build home costing no more than £500,000 enabling access to a mortgage of up to 95 per cent of the purchase price. There is no cap on income.
‘HomeBuy’ schemes for tenants
3.27 There are three types of Social HomeBuy schemes for tenants:
• The Right to Buy scheme allows council tenants in England to purchase their home at a discount of up to £75,000 dependent on location and length of tenancy.
• The Right to Acquire scheme allows housing association tenants in England to purchase their home at a discount of up to £9-16,000 dependent on location.
• Social HomeBuy enables council and housing association tenants to purchase their home on shared ownership terms at a discount of between £9,000 and £16,000 depending on the location. The amount of discount received will be in proportion to the share of the
113
property bought. The tenant can then purchase further shares in the home and staircase up to a 100 per cent ownership of the home.
Shared ownership for older people 3.28 This scheme is only for people aged 55 or over and works in the same
way as the shared ownership scheme. Applicants can only buy up to 75 per cent of their home but once they do so, they don’t have to pay rent on the remaining share.
Affordable Home Ownership for people with disabilities
3.29 Home Ownership for People with Long Term Disabilities (HOLD) is a
tailored product for purchasers whose specific needs are not met by the standard HomeBuy products. The scheme enables eligible applicants to select a home on the open market, which is then purchased by a housing association and sold to the applicant on a shared ownership basis with rent paid on the remaining share. Applicants can only apply for HOLD if the homes in the other HomeBuy schemes don’t meet your needs, for example, a ground floor property is required.
3.30 The following table uses HSSA data which is the most continuous
source available to summarise trends in affordable housing completions between 2001 and 2011. This timescale has been used to enable current Intermediate totals to be derived.

114
Table 3.18: shared ownership and intermediate rent completions, 2001-2011
Area 2001 /02
2002 /03
2003/ 04
2004/ 05
2005 /06
2006/ 07
2007/ 08
2008/ 09
2009/ 10
2010 /11 Total %
Shared ownership Corby 0 0 0 0 0 0 0 0 6 0 6 0.9
East Northants 1 0 1 12 8 32 62 3 7 22 148 22.1
Kettering 0 0 11 33 66 121 51 39 0 2 323 48.1 Wellingborough 5 5 2 5 19 32 58 26 42 0 194 28.9
North Northants 6 5 14 50 93 185 171 68 55 24 671 100.0%
Intermediate rent Corby 0 0 0 0 0 0 0 13 12 0 25 31.6
East Northants 0 0 0 0 0 0 0 1 0 0 1 1.3
Kettering 0 0 0 0 0 0 0 35 0 0 35 44.3 Wellingborough 0 0 0 0 0 0 0 7 11 0 18 22.8
North Northants 0 0 0 0 0 0 0 56 23 0 79 100% (Source: HSSA Returns)
Key findings:
• 671 shared ownership and 79 intermediate rent completions were recorded between 2001 and 2011, a total of 750 which consisted of 31 in Corby, 149 in East Northants., 358 in Kettering and 212 in Wellingborough;
• When combined with totals at the 2001 Census (see Table 3.2), this implies a total of 1,247 intermediate properties in North Northants, consisting of 104 in Corby, 234 in East Northants., 613 in Kettering and 296 in Wellingborough

115
3.6 The social housing sector
3.31 This section uses recent and current data provide a profile of the supply of affordable housing, principally of social rented homes. The following table identifies the all social rented stock owned by property type and bedsize.
Table 3.19: total number of social rented properties by type and bed size, January 2012
Type & bedsize Corby
East Northants Kettering Wellingborough
North Northants. No.
North Northants %
Bedsit/ studio 190 39 36 149 414
Bedsit (sheltered) - 36 0 0 36
Sub-total 190 75 36 149 450 2.00 1 bed Bungalow 316 349 7 304 976 Sheltered - 183 0 0 183 Flat 784 504 1,513 1,225 4,026 Maisonette 7 4 0 22 33 House 6 12 39 24 81 Sub-total 1,113 1,052 1,559 1,575 5,299 23.53 2 bed Bungalow 180 566 312 136 1,194 Sheltered - 37 0 0 37 Flat 609 508 902 540 2,559 Maisonette 88 1 0 2 91 House 887 763 943 912 3,505 Sub-total 1,764 1,875 2,157 1,590 7,386 32.80 3 bed Bungalow 50 23 8 6 87 Flat 56 3 52 14 125 Maisonette 139 21 0 2 162 House 2,245 1,927 1,544 2,503 8,219 Sub-total 2,490 1,974 1,604 2,525 8,593 38.16 4 bed Bungalow 0 0 0 1 1 Flat 9 0 0 0 9
Maisonette 10 0 0 0 10 House 285 74 155 101 615 Sub-total 304 74 155 102 635 2.82 5 bed Bungalow 0 0 0 1 1 House 45 0 2 3 50 Sub-total 45 0 2 4 51 0.27
Extra care 0 41 0 0 41 Hostel 3 0 0 43 46 Unknown 0 9 0 0 9 Sub-total 3 9 0 43 96 0.43

116
Total no. 5,909 5,100 5,513 5,988 22,510 100.00 Total % 26.25 22.66 24.49 26.60 100.00 (Source: local authority data)
Key findings
• The table identifies a total of 22,510 social rented properties across the area, almost equally distributed between the 4 authorities;
• The largest proportion of properties was 3 bed, followed by 2 and one bed. Only 2% were bedsits and 3% 4 bed or larger.
3.32 One of the factors affecting the supply of social rented housing has
been Right to Buy sales but, as the following table identifies, these have declined markedly since 2005 when the discounts available were reduced.
Table 3.20: Right to Buy sales, April 2006 – January 2012
Year Corby East Northants Kettering Wellingborough
North Northants.
2006/07 62 7 30 - 99 2007/08 52 2 22 - 76 2008/09 13 1 5 20 39
2009/10 4 6 9 13 32 2010/11 15 1 9 7 32 2011/12 (part) 9 1 - 13 23 Total no. 155 18 75 53 301 Total % (Source: local authority data)
Key findings
• A total of 305 properties have been sold since 2006/07, over half of which were in Corby and only 6% in East Northants.
3.33 The following table identifies the number of social rented properties
advertised/available by type, bed size and lettings type/priority in 2010/11.
Table 3.21: social rented properties available for letting by type and bed size, 2010-2011
Type & bedsize Corby EN Kett. WB
NN. no. of properties available
NN. % of properties available
NN. total stock
NN. turnover
Bedsit/ 32 2 9 0 414
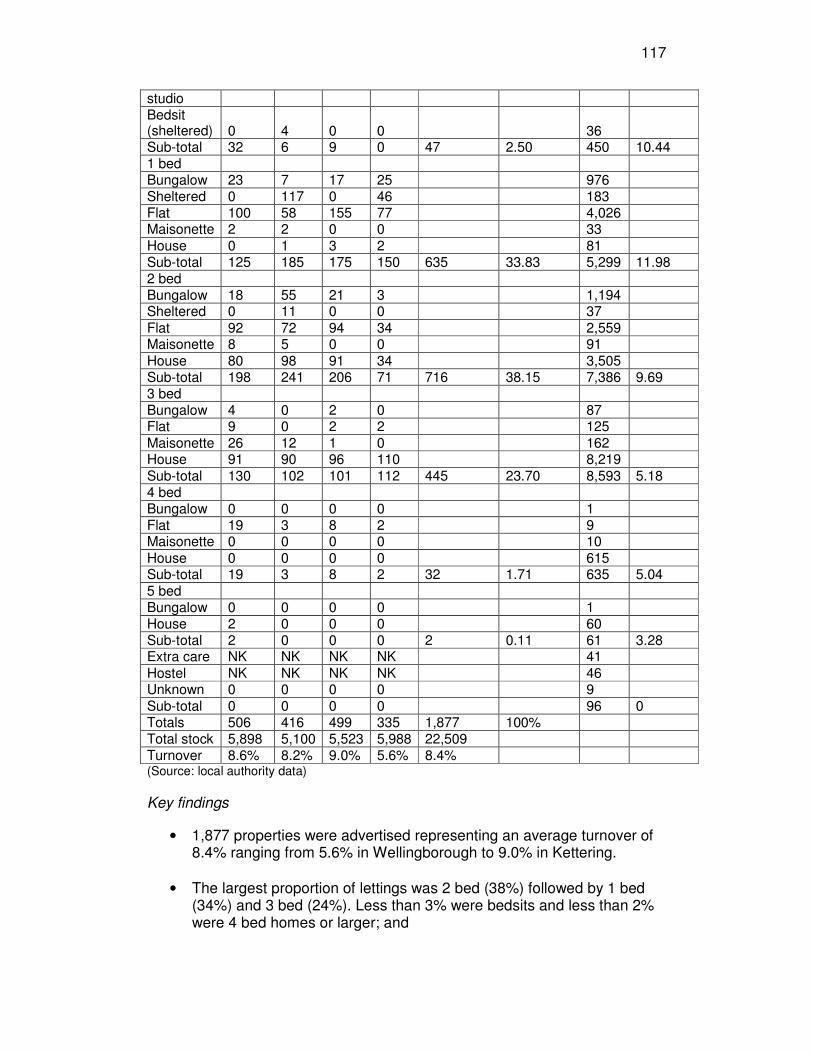
117
studio Bedsit (sheltered) 0 4 0 0
36
Sub-total 32 6 9 0 47 2.50 450 10.44 1 bed Bungalow 23 7 17 25 976 Sheltered 0 117 0 46 183 Flat 100 58 155 77 4,026 Maisonette 2 2 0 0 33
House 0 1 3 2 81 Sub-total 125 185 175 150 635 33.83 5,299 11.98 2 bed Bungalow 18 55 21 3 1,194 Sheltered 0 11 0 0 37
Flat 92 72 94 34 2,559 Maisonette 8 5 0 0 91
House 80 98 91 34 3,505 Sub-total 198 241 206 71 716 38.15 7,386 9.69 3 bed Bungalow 4 0 2 0 87 Flat 9 0 2 2 125
Maisonette 26 12 1 0 162 House 91 90 96 110 8,219
Sub-total 130 102 101 112 445 23.70 8,593 5.18 4 bed Bungalow 0 0 0 0 1 Flat 19 3 8 2 9 Maisonette 0 0 0 0 10
House 0 0 0 0 615 Sub-total 19 3 8 2 32 1.71 635 5.04
5 bed Bungalow 0 0 0 0 1 House 2 0 0 0 60 Sub-total 2 0 0 0 2 0.11 61 3.28 Extra care NK NK NK NK 41
Hostel NK NK NK NK 46 Unknown 0 0 0 0 9
Sub-total 0 0 0 0 96 0 Totals 506 416 499 335 1,877 100% Total stock 5,898 5,100 5,523 5,988 22,509 Turnover 8.6% 8.2% 9.0% 5.6% 8.4% (Source: local authority data)
Key findings
• 1,877 properties were advertised representing an average turnover of 8.4% ranging from 5.6% in Wellingborough to 9.0% in Kettering.
• The largest proportion of lettings was 2 bed (38%) followed by 1 bed (34%) and 3 bed (24%). Less than 3% were bedsits and less than 2% were 4 bed homes or larger; and

118
• Turnover by bedsize ranged from almost 12% for 1 bed properties and 10% for bedsits and 2 bed properties to 5% for 3 and 4 bed and 3% for 5 bed properties. It is clear that those renting larger family homes stay put thus limiting supply through turnover.
3.34 The following table identifies the average rents charged for social rented properties in 2011-12. Table 3.22: social rents by type and bed size, 2011-12, rounded to 5p Type & bedsize
Corby
East Northants. Kettering Wellingborough
Bedsit/ studio 55.10 - 55.80 - Bedsit (sheltered) - - - - 1 bed - - - - Bungalow 62.50 - 67.10 - Flat 62.25 76.25 63.05 68.25 Maisonette 62.50 - - - Sheltered - - - - House 63.60 79.20 60.05 78.35 2 bed Bungalow 69.65 - 75.05 - Flat 68.70 87.30 72.30 74.25 Maisonette 68.70 - - - Sheltered - - - House 70.00 89.45 71.80 77.25 3 bed Bungalow 75.60 - 85.35 - Flat 74.50 - 78.30 - Maisonette 74.30 - 78.00 - House 75.30 95.45 80.00 83.20 4 bed Bungalow - - - Flat - - 78.30 - Maisonette 79.80 - 78.00 - House 80.50 - 87.80 86.60 5 bed Bungalow - - - - House 82.30 - 103.05 94.40 Extra care - - - - Hostel - - - - (Source: local authority data)
Key findings
• There is wide variation in rents across the area with the highest rents in East Northants. and the lowest in Corby, variations include:
o £62.25 for a 1 bed flat in Corby and £76.25 in East Northants; o £68.70 for a 2 bed flat in Corby and £87.30 in East Northants;
and

119
o £75.30 for a 3 bed house in Corby and £95.45 in East Northants.
3.35 The following table identifies the average rents charged for social
rented properties in 2012-13. Table 3.23: social rents by type and bed size, 2012-13, rounded to 5p Type & bedsize
Corby
East Northants. Kettering Wellingborough
Bedsit/ studio 55.45 - 60.30 - Bedsit (sheltered) - - - - 1 bed 62.50 -
Bungalow 62.00 - 72.90 - Flat 62.50 76.25 67.95 70.40 Maisonette - - - -
Sheltered - - - - House - - 65.30 72.20
2 bed Bungalow 69.65 - 81.30 -
Flat 68.70 87.30 77.50 79.30 Maisonette 68.70 - - - Sheltered - - - -
House 70.15 89.45 77.75 82.60 3 bed
Bungalow 75.60 - 90.70 - Flat 74.50 - 83.95 -
Maisonette 74.60 - 83.90 - House 75.50 95.45 86.40 89.15 4 bed
Bungalow - - - House 80.50 - 94.40 -
5 bed - Bungalow - - - 92.70 House 82.50 - 109.48
Extra care - - - - Hostel - - - 101.25 (Source: local authority data)
Key findings
• There continues to be wide variation in rents across the area with the highest rents in East Northants. and the lowest in Corby, variations include.
3.7 Housing stock and supply: current profile 3.37 The following table summarises changes to the stock totals for the
North Northamptonshire area for the 10 years from 2002-2011.

120
Table 3.23: changes to the total housing stock, 2002 to 2011
Area 2002 2011 Net change % change
Corby 22,610 26,151 3,541 15.7
East Northamptonshire 33,230 37,232 4,002 12.0
Kettering 36,615 41,473 4,858 13.3
Wellingborough 30,656 33,228 2,572 8.4
North Northants 123,111 138,084 14,973 12.2
East Midlands 1,807,226 1,971,164 163,938 9.1
England 21,475,563 22,971,520 1,495,957 7.0 (Source: HSSA Returns, CLG website) Key findings:
• Stock totals are estimated to have increased by over 12% across the area, ranging from just over 8% in Wellingborough to over 16% in Corby. In all cases, this exceeds the national growth rate and, with the exception of Wellingborough, exceeds the regional average.

121
3.38 The following table summarises the estimated current position by tenure. The table uses CLG estimates - which do not disaggregate market housing - and data for private renting and owner occupation derived as indicated at 3.3 above and HSSA data for Intermediate Housing at 3.18 above.
Table 3.24: estimated tenure breakdown at 2011-12
Local authority
Housing association
Other Public Sector
Owner Occupied Intermediate Private rented Total
Area No % No % No % No % No % No % No %
Corby 4,808 18.4 809 3.1 0 0.0 15,687 60.9 104 0.40 4,699 18.0 26,107 100.0
E.Northants. 0 0.0 4,933 13.4 10 0.0 26,837 73.10 234 0.64 4,699 12.8 36,713 100.0
Kettering 3,812 9.4 1,593 3.9 5 0.0 26,023 64.22 613 1.51 8,474 20.9 40,520 100.0
Wellingborough 12 0.0 5,848 17.6 0 0.0 22,263 66.96 296 0.89 4,831 14.5 33,250 100.0
N.Northants. 8,632 6.3 13,183 9.7 15 0.0 90,809 66.48% 1,247 0.91 22,704 16.6% 136,590 100.0
East Midlands - 9.5 - 6.4 - 0.2 - NK - NK - NK - 100.0
England - 7.9 - 9.9 - 0.3 - NK - NK - NK - 100.0
(Source: CLG Live Table 100, Dwelling Stock by District and Housing Vision estimates)
Key findings
• The owner occupied sector is now estimated to constitute two thirds of all dwellings, a decline from 73% in 2001;
• The private rented sector has trebled in proportion from 5.5% in 2001 to 16.6% in 2012;
• The social sector has declined from almost 19% to 16% and is very close to the regional (15.9%) and national (17.8%) averages; and
• The intermediate sector has grown from 0.7% to 0.9%.

122
3.39 The final table of this chapter summarises the current annual supply of housing through turnover by sector as follows.
Table 3.25: the current annual supply of housing through turnover in North Northants.
Area Social rent Private rent Intermediate Owner occupied Total
Corby 506 1,424 5 1,044 2,979
East Northants 416 1,242 12 1,654 3,324
Kettering 446 2,568 31 1,644 4,689
Wellingborough 335 1.464 15 1,289 3,103
Total supply 1,703 6,880 63 5,631 14,277
% of total supply 11.93% 48.19% 0.44% 39.44% 100%
Annual turnover 7.6% 30.0% 5.0% 6.12% -
% of stock 16.00% 16.6% 0.91% 66.48% 100% (Source: HSSA and Housing Vision estimates) Key findings:
• The social sector provides 12% of available homes although it represents 16% of total stock.
• The private rented sector is estimated to play the main role in the supply of housing, currently providing in the region of 48% of available properties, although it constitutes only 17% of all housing stock
• The home ownership sector provides over 39% of housing supply although it represents 67% of total stock; and
• The intermediate sector has a very marginal role providing less than 0.5% of available supply and 0.9% of total stock.

123
4. What is the current pattern of need and demand for affordable housing?
4.1 Introduction
4.1 This section reviews evidence of need and demand with particular emphasis on the need for affordable housing including social rented and intermediate housing.
4.2 The level of need for affordable housing
4.2 Corby, Kettering and Wellingborough participate in the Keyways choice based lettings scheme and East Northamptonshire in the Homes Direct Scheme. However, they have joined schemes at different times and different information systems are used. Corby, Kettering and Wellingborough share the same system of priority banding but East Northants. has its own system. This section opens with a profile of the total number of applicants registered for social housing by priority needs group; to enable comparisons to be made between authorities, ‘Priority Card’ and Band 1 applicants have been combined for East Northants. In view of recent reviews, care must be taken in accepting waiting lists as indicative of all housing need.
Table 4.1: applicants for social housing, January 2012
Band Corby East Northants Kettering Wellingborough
Total no.
Total %
A/Priority Card/1 7 56 34 83 180 1.92 B/2 322 122 865 840 2,149 22.93 C/3 256 683 580 540 2,059 21.97 D/4 2,577 347 908 1,154 4,986 53.19
Total no. 3,162 1,208 2,387 2,617 9,374 -
Total % 33.73 12.89 25.46 27.92 - 100%
(Source: local authority data) Note: East Northants has 20 Priority card and 36 Band 1 applicants.
Key findings:
• There are currently almost 9,400 registered applicants, 34% of whom are resident in Corby, 28% in Wellingborough, 25% in Kettering and 13% in East Northants.
• Over half of applicants are in the lowest priority band D/4. Almost 2% in the highest priority (A/Priority Card/1) and 23% in the second highest priority (B/2) bands, a total of 2,329 applicants.

124
4.3 The following table profiles applicants registered for social housing by age, data for East Northants is recorded using different age categories.
Table 4.2: primary applicants by oldest applicant, January 2012
Band Age Corby Kettering W/borough Sub-total
East Northants
East Northants
A U. 18 0 0 10 10 16-20 6
B U. 18 5 2 23 30 16-20 C U. 18 1 2 7 10 16-20 70
D U. 18 47 8 19 74 16-20 7 Total 53 12 59 124
A 18-24 2 9 24 35 21-40 22
B 18-24 47 191 176 414 21-40 36
C 18-24 37 78 81 196 21-40 311
D 18-24 576 196 245 1017 21-40 86
Total 662 474 526 1,662
A 25-44 3 15 43 61 41-60 14
B 25-44 121 344 374 839 41-60 29
C 25-44 78 229 226 533 41-60 165
D 25-44 1,033 381 533 1,947 41-60 122
Total 1,235 969 1,176 3,380
A 45-59 7 7 5 19
B 45-59 63 159 147 369
C 45-59 45 128 107 280
D 45-59 454 168 207 829
Total 569 462 466 1,497
A 60-74 0 2 0 2 61-70 8
B 60-74 54 103 72 229 61-70 29
C 60-74 61 92 71 224 61-70 83
D 60-74 317 105 117 539 61-70 81
Total 432 302 260 994
A 75+ 0 0 1 1 71+ 6 B 75+ 32 64 48 144 71+ 21
C 75+ 34 52 48 134 71+ 54 D 75+ 150 41 33 224 71+ 51 Total 216 157 130 503

125
All 3,167 2,376 2,617 8,160 (Source: local authority data)
Key findings:
• For Corby, Kettering and Wellingborough:
o those under 18% made up 1.5% of all applicants; o 18-24 20% o 25-44 41% o 45-59 18% o 60-74 12%; and o 75+ 6%.
4.4 The following table profiles applicants registered for social housing by
employment status where this is known. Table 4.3: primary applicants by employment status, January 2012
Band Corby EN Kett WB
North Northants No.
North Northants. %
A/ E. Northants Priority Card & 1
Employed (full time) 0 2 1 11 14 7.6
Employed (part time) 0 3 2 24 29 15.7 Incapacity benefit 2 0 6 19 27 14.6
Maternity benefit 0 0 6 3 9 4.9 Self-employed 0 0 6 2 8 4.3 Sickness benefit 2 12 5 5 24 13.0 Pensioner 0 23 2 1 26 14.1 Unemployed/training/ not seeking work 1 0 15 32 48 25.9 Sub-total 5 40 43 97 185 100% B/2 Employed (full time) 45 4 104 150 303 16.4
Employed (part time) 30 5 70 69 174 9.4 Incapacity benefit 26 12 78 47 163 8.8 Maternity benefit 9 0 7 9 25 1.4 Self-employed 3 0 15 14 32 1.7 Sickness benefit 13 0 42 30 85 4.6 Pensioner 64 35 112 81 292 15.8 Unemployed/training/ not seeking work 99 42 321 310 772 41.8 Sub-total 289 98 749 710 1,846 100%
C/3 Employed (full time) 33 10 82 79 204 12.5 Employed (part time) 28 5 60 64 157 9.6 Incapacity benefit 35 18 66 50 169 10.4 Maternity benefit 4 0 6 1 11 0.7 Self-employed 2 0 15 11 28 1.7 Sickness benefit 6 0 36 21 63 3.9

126
Pensioner 62 89 91 84 326 20.0 Unemployed/training/ not seeking work 145 201 173 155 674 41.3 Sub-total 315 323 529 465 1,632 100% D/4 Employed (full time) 780 1 200 364 1345 30.6 Employed (part time) 267 3 116 116 502 11.4 Incapacity benefit 87 9 30 36 162 3.7 Maternity benefit 21 0 11 8 40 0.9
Self-employed 43 0 55 27 125 2.8 Sickness benefit 53 0 101 18 172 3.9 Pensioner 297 80 95 80 552 12.6 Unemployed/training/ not seeking work 717 88 340 354 1,499 34.1 Sub-total 2,265 181 948 1,003 4,397 100% (Source: local authority data)
Key findings:
• There are similar patterns in terms of employment status between the priority bands:
o 9 and 16% of applicants in part-time work; o between 5 and 10% receiving incapacity benefit; o between 1 and 5% receiving maternity benefit; o between 2 and 4% self-employed; o between 14 and 20% pensioners; and o between 26 and 42% unemployed.
• with the exception of:
o A larger proportion of sickness benefit claimants in Bands A/1 (13%); and
o A larger proportion of people in full-time employment in Bands D/4 (31%).
4.5 The following table identifies the pattern of households accepted as
homeless and in Priority Need since 2001-02.

127
Table 4.4: homeless accepted and in Priority Need
Area 2001-02 2002-03 2003-04 2004-05 2005-06 2006-07 2007-8 2008-09 2009-10 2010-11 2011-12 (04-09)
Corby 60 58 44 50 51 49 36 34 32 33 17
East Northants 42 43 81 83 91 78 102 65 55 53 29
Kettering 112 103 141 103 121 159 128 141 82 76 31
Wellingborough 34 80 90 200 168 162 176 147 108 143 79
Totals 248 284 356 436 431 448 442 387 277 305 156 (Source: Compact Report Table 3.9, HSSA Returns 2006 & 2007, CLG website and local authorities 2008 onwards)
Key findings:
• From a peak of 448 households in 2006-07, acceptances fell steadily but the trend reversed in 2010-11.

128
The need for specialised housing 4.6 The following table profiles requiring special accommodation. Table 4.5: applicants requiring special accommodation, January 2012 Type of accommodation
Corby East Northants
Kettering Wellingborough North Northants.
Extra Care NK NK 60 NK 55 Sheltered/ supported housing
169 NK 220 151 530
Wheelchair user NK NK 64 NK 63 4 or more bedrooms
NK NK 98 NK 98
Ground floor 202 NK NK 45 247
Other special requirement
NK NK 114 NK 110
Totals 371 27 556 196 1,130 (Source: local authority data)
Key findings:
• The data available is patchy but implies a minimum of 1,130 households requiring special accommodation across North Northants. with the main needs of sheltered/supported housing and a ground floor property associated with disability/old age
Who wants what type of housing?
4.7 This section considers the extent of demand and for which types of
property. The following table identifies the number of bids by property type and bed size for 2010/11.

129
Table 4.6: ratio of bids to lettings for social rented properties by type and bed size, 2010-2011
Corby
East Northants
Kettering
Wellingborough
Type & bedsize Lettings Bids Ratio Lettings
Ave. no. of bids Lettings Bids Ratio Lettings Bids Ratio
Bedsit/ studio 32 495 15.5 2 1 8 431 53.9 0 74 -
Bedsit (sheltered) 0 - 4 No demand 0 - 0 - -
Sub-total 32 495 15.5 6 1 8 431 53.9 0 74 - 1 bed Bungalow 23 918 39.9 7 5 17 864 50.8 25 1,313 52.5 Sheltered 0 - 117 2 0 - 46 - Flat 100 3,115 31.2 58 12 122 6,428 52.7 77 5,332 69.2 Maisonette 2 80 40.0 2 11 0 - 0 251 House 0 - 1 11 3 442 147.3 2 266 133.0 Sub-total 125 4,113 32.9 185 41 142 7,734 54.5 150 7,162 47.7 2 bed Bungalow 18 1,332 74.0 55 11 21 1,327 63.2 3 756 252.0 Sheltered 0 - 11 21 0 - 0 - Flat 92 5,276 57.3 72 21 82 6,292 76.7 34 5,069 149.1 Maisonette 8 443 55.4 5 26 1 - 0 19 House 80 3,751 46.9 98 20 87 5,729 65.9 34 2,625 77.2 Sub-total 198 10,802 54.6 241 99 191 13,348 69.9 71 8,469 119.3 3 bed Bungalow 4 106 26.5 0 - 2 102 51.0 0 1 Flat 9 83 9.2 0 - 0 35 2 30 15.0 Maisonette 26 237 9.1 12 2 1 28 28.0 0 43 House 91 2,827 31.1 90 13 96 5,013 52.2 110 4,318 39.3

130
Sub-total 130 3,253 25.0 102 15 99 5,178 52.3 112 4,392 39.2 4 bed
Bungalow 0 0 - 0 - 0 - Flat 19 22 1.2 3 - 6 - 2 - Maisonette 0 0 0 0
House 0 439 0 4 0 169 0 162 Sub-total 19 461 24.3 3 ? 6 169 28.2 2 162 81.0
5 bed Bungalow 0 0 - 0 - 0 -
House 2 13 6.5 0 - 0 - 0 11 Sub-total 2 0.0 0 0 0 Extra care - - - - - - - - - - -
Hostel - - - - - - - - - - - Unknown - - - - - - - - - - -
Sub-total - - - - - - - - - - - Totals 506 19,137 37.8 416 22.9 446 26,860 60.2 335 20,270 60.5 (Source: local authority data)
Key findings
• There are both patterns and variations in the ratio of number of bids to number of lettings as follows:
o An overall average of close to 60 bids for each letting in Kettering and Wellingborough. o In relation to 1 bed properties, a range of 33:1 in Corby to 55:1 in Kettering o In relation to 2 bed properties, a range of 55:1 in Corby to 119:1 in Wellingborough o In relation to 3 bed properties, a range of 15:1 in East Northants to 52:1 in Kettering o In relation to 4 bed properties, a range of 24:1 in Corby to 81:1 in Wellingborough.

131
Who is being housed in the social rented sector? 4.8 This section considers who is being housed in the social rented sector
in the area. The first dimension considered is the type of households being housed and then their net weekly incomes.
Table 4.7: lettings by type of household, April 2010-March 2011
Household type Corby
East Northants Kettering
Welling- borough
North Northants. total
North Northants. %
Single adult 31 74 172 162 439 39.9 Multi-adult (no children) - typically couples 18 21 48 30 117 10.6
Multi-adult (+ children) - families 33 21 74 49 177 16.1 Lone parent 41 43 106 98 288 26.2 Older people 11 4 33 30 78 7.1 Average 134 163 433 369 1,099
100%
(Source: Core)
Key findings:
• The accuracy of this data is subject to the satisfactory completion of returns to CoRE, and that for Corby and East Northants may be incomplete as the lettings recorded here are substantially lower that in Table 4.6;
• The largest single group currently being housed is single people (40%) followed by lone parents (26%);
• Other families (multi-adult with children) make up 16% of the total and couples (multi-adult - no children) 16%;
• Older people make up only 7% of those being housed. 4.9 The following table reviews net weekly income by type of households. This may be all or partly from benefits/pensions but not including child benefit, housing benefit, council tax benefit or interest from savings.

132
Table 4.8: lettings by household type by net average weekly income, April 2010-March 2011
Household type Corby East Northants Kettering
Welling- borough
North Northants. average
Single adult 121.03 89.66 114.05 124.86 112.40 Multi-adult (no children) - typically couples 239.13 274.60 272.25 224.76 252.69 Multi-adult (+ children) – families 307.00 400.20 347.08 327.17 345.36 Lone parents 217.01 178.14 223.67 224.76 210.90 Older people 214.55 228.40 154.18 207.53 201.17 Average 219.79 180.24 201.31 193.07 198.60 (Source: Core)
Key findings:
• The accuracy of this data is subject to the satisfactory completion of returns to CORE;
• In East Northants, the average net weekly incomes of single people were very low but were high for families; and
• In Kettering, the average net weekly incomes of older people were very low, largely due to the incomes of those accessing local authority homes. It is not clear why this should be the case.
Who is being housed in the intermediate housing sector? 4.10 This section considers who is being housed in the intermediate housing
sector in the area. The first dimension considered is the type of households being housed and then their net weekly incomes.
Table 4.9: sales by type of household, April 2008-April 2011
Household type Corby
East Northants Kettering
Welling- borough
North Northants. No.
North Northants. &
Older people 1 1 4 1 7 4.7
Single adult 6 20 39 27 92 43.4 Multi-adult (no children) - typically couples 4 17 20 16 57 26.9
Lone parents 3 5 7 6 21 9.9 Multi-adult 4 13 9 9 35 11.8

133
(+ children) – families
Average 18 56 79 59 212 100% (Source: Core)
Key findings:
• The largest single group currently being housed is single people (43%) followed by couples (multi-adult - no children) (27%);
• Two parent families (multi-adult with children) make up 12% of the total and lone parents 10%;
• Older people make up only 5% of those being housed in this way. 4.11 The following table reviews net weekly income by type of households. This may be all or partly from benefits/pensions but not including child benefit, housing benefit, council tax benefit or interest from savings. Table 4.10: shared ownership sales by gross annual income of Person 1, April 2008-April 2011
Income band Corby
East Northants Kettering
Welling- borough
North Northants. total
North Northants. %
Under £7.5k 0 1 2 2 5 2.5 £7.5-9,999 0 2 1 1 4 2.0 £10-13,999 5 17 11 5 38 19.1 £14-17,999 7 12 22 21 62 31.2 £18-21,999 1 14 12 10 37 18.6 £22-29,999 4 8 17 15 44 22.1 £30-39,999 1 1 2 3 7 3.5 £40k+ 0 1 0 1 2 1.0 Totals 18 56 67 58 199 100% (Source: Core)
Key findings:
• 50% of first purchasers earned £10-17,999 and 41% £18-29,999.
4.12 The following table reviews sales by previous tenure... Table 4.11: sales by previous tenure, April 2008-April 2011
Previous tenure Corby
East Northants Kettering
Welling- borough
North Northants. No.
North Northants. %
Social rented 0 3 5 5 13 6.1 Private rented 8 21 33 19 81 38.0 Tied home/renting with job 2 1 0 1 4 1.9

134
Owning/buying 4 2 5 8 19 8.9 Family/friends 4 28 36 25 93 43.7 Temporary 0 0 0 0 0 0.0 Other 0 2 0 1 3 1.4 18 57 79 59 213 100% (Source: Core)
Key findings:
• 44% of purchasers were previously living with family or friends and almost 40% were renting privately; and
• only 6% were previously renting from a local authority or housing association.
135
5. What is the projected requirement for housing? 5.1 Introduction 5.1 The operation of housing markets is like a complex version of ‘musical
chairs’ as people move between homes and sectors within the limits of the supply available. This process can be likened to a ‘zero sum’ game whereby a home becoming available through a household dissolving or moving home is matched by a home taken elsewhere by a forming or moving household. However, it is rare for housing markets to be in perfect balance such that all moves are internal to the market and static supply meets fixed demand. In the real world, populations change and increase; people move in and out of areas - not always in balance; some areas may be more or less popular and the ‘fit’ between people’s requirements and the housing available may be poor, homes may be too large or too small, or just too expensive.
5.2 These are the dynamics against which future housing requirements are
determined. All households have to fit around the housing available, but where projections indicate that numbers are set to grow, additional provision needs to be planned for on the basis of household type, size, age and income, all of which will shape their requirements.
5.3 This Update adopts a new approach to determining those
requirements. It moves away from static or scenario-based analyses by applying an interactive Housing Requirements Toolkit to identify the requirements of new or additional households and enable them to be constantly modelled and monitored. The structure of the Toolkit is explained below, and guidance on its application is available through a separate User Manual, the key principles are as follows:
1. the Toolkit is flexible, dynamic and interactive;
2. it applies local data for household projections, incomes and housing costs to identify the basic housing requirements of households, i.e., the bedrooms required by size and composition of household; it does not assume the provision of ‘spare’ bedrooms. This is not to advocate the minimal provision of bedrooms and the provision of additional bedrooms can be modelled as preferred;
3. the Toolkit allows any housing backlog from any sector to be included and its reduction to be modelled over any policy period;
4. it estimates levels of under-occupation in older (65+) households and projects potential requirements for specialised housing for this age group for all older and projected additional older households.
5.2 The structure of the toolkit 5.4 The toolkit consists of 4 sections, each of which represents a stage in
assessing the housing required to meet household growth as follows:

136
• Household projections: for any two years, this identifies the number of households by type and age, and changes between the start and finish years chosen in terms of absolute and proportionate change.
• Housing supply: this enables constant monitoring of the local housing stock and housing supply as the context for understanding future housing requirements.
• Housing costs: this determines the cost of housing of different types, bedsizes and tenures, and applies an affordability threshold to determine the proportion of households who are able to afford housing by tenure.
• Housing requirements: this combines household projections with cost and affordability data to identify the housing requirements arising from new or additional households by bed size and tenure. There is also the facility to assess the impact of a backlog in the requirement for affordable housing and of previous under-supply in any tenure. Separate consideration is given to the special housing requirements of all and additional older households in the context of the extent of under-occupation.
5.5 The toolkit is based on two types of data, fixed and variable.
• The fixed data will be constant until it is re-issued, for example, household projections and CACI incomes data although both the household projections and household incomes can be varied by +/- 50% using sliders within the Toolkit.
• The variable data can be input and changed by the user at any time and includes the start and finish years for projections, housing costs, housing supply; bedsize by household type, any affordable housing backlog and estimated levels of under-occupation in 65+ households.
5.6 The following sections explain the stages in assessing the housing
requirements of new or additional households 5.3 Households projections 5.7 Household projections are trend-based and take account of a number
of factors all of which lead to a growth in numbers:
• ‘natural change’: underpinned by the relationship between births and deaths, and which results in the formation of new households and the ending of existing ones;

137
• changes affecting existing households: for example relationship breakdown and movements through the life cycle; and finally
• in and out migration: and the relationship between them. 5.8 However, it is important to emphasise that other trends may in the
future have the effect of reducing the projected number of households. These include:
• growth in multi-generational or other shared households through economic necessity or to provide care and support for those in need; and
• growth in forms of communal or collaborative living among older people also to provide care and support.
5.9 All household projection methodologies take account of these factors in
identifying the impact of household change. For this Update, Edge Analytics have provided a series of scenario-based household projections for the period 2011-2031. The scenario applied is ‘Migration led re-calibrated’ in which migration assumptions are based on historical evidence 2004/5 – 2008/9, which takes in the peak of the market plus first year of recession. As with CLG projections, those provided by Edge Analytics are based on the following 17 household types.
1. One person male
2. One person female
3. Other households
4. Couple no children
5. Couple 1 child
6. Lone parent 1 child
7. Couple 2 children
8. Couple and 1 or more adults no children
9. Lone parent 2 children
10. Couple and 1 or more adults 1 child
11. Lone parent 1 or more adults 1 child
12. Couple 3+ children
13. Couple and 1 or more adults 2 children
14. Lone parent 3+ children
15. Lone parent 1 or more adults 2 children
16. Couple and 1 or more adults 3+ children
17. Lone parent 1 or more adults 3+ children
5.10 Many of these are very minor, and to make the process more
manageable, we have reduced these to 7 which match their bedsize/person requirements as set out in the following table. Where

138
there are 2 or more children in a household, the bedroom requirement will be determined according to their age and sex. It is not possible to predict these with accuracy and therefore the minimum bedroom requirement has been assumed in all cases.
Table 5.1: derived household types and associated minimum bedsize Household type Bedsize Persons Derived household types Minimum
bedsize One person male 0/1 1 One person 1 One person female
0/1 1
Other households 0/1 1 Couple no children
1 2 Couple no children 1
Couple 1 child 2 3 Couple/lone parent and 1 child 2 Lone parent 1 child
2 2
Couple 2 children 2/3 4 Couple/lone parent and 2 children/couple and 1 or more adults no children
2
Couple and 1 or more adults no children
2/3 3/4
Lone parent 2 children
2/3 3/4
Couple and 1 or more adults 1 child
3 4/5 Couple/lone parent and 1 or more adults and 1 child
3
Lone parent and 1 or more adults 1 child
3 3/4
Couple 3+ children
3/4 5/6 Couple/lone parent and 3+ children/ couple/lone parent and 1 or more adults and 2 children
3
Couple and 1 or more adults and 2 children
3/4 5/6 3
Lone parent and 3+ children
3/4 4/5
Lone parent 1 or more adults 2 children
3/4 4/5
Couple and 1 or more adults 3+ children
4/5 6/7 Couple/lone parent and 1 or more adults 3+ children
4
Lone parent 1 or more adults 3+ children
4/5 5/6
(Source: Housing Vision)

139
5.11 As a result of this exercise, the 7 derived household types applied in projecting housing requirements are:
• One person
• Couple no children
• Couple/lone parent and 1 child
• Couple/lone parent and 2 children/couple and 1 or more adults no children
• Couple/lone parent and 1 or more adults and 1 child
• Couple/lone parent and 3+ children/ couple/lone parent and 1 or more adults and 2 children
• Couple/lone parent and 1 or more adults 3+ children 5.12 A final table on the Households page identifies whether there is growth
(red) or decline (green) in any household type. 5.13 The outcome in terms of projected growth in households by type and
age for the period is set out in detail in Section 2.3 of the Report. 5.4 Housing supply 5.14 This is the second section of the Toolkit and deals with the housing
stock and housing supply. This page identifies the profile of the housing stock by bedsize and tenure and enables this to be continuously updated through stock gains and losses.
5.15 Supply information provides a context for understanding the type of
housing becoming available for all households, including additional households. The annual supply of housing can be modelled by applying a turnover rate, which will vary over time according to supply: demand issues; financial and economic considerations. Due to uncertainty over these factors, it is not possible to project stock turnover with precision but set out below is a list of possible approaches for determining turnover rates:
• For the home ownership sector, turnover can be based on the number of properties recorded as sold by the Land Registry in the previous 12 months as a proportion of all owner occupied homes;
• For the shared ownership/equity sector, the home ownership turnover rate can be applied, or recognising the relatively low levels of staircasing to full ownership, a slightly lower rate can be applied;
• For the private rented sector, the turnover rate applied is based on the estimate in the English Housing Survey 2010-11 that 35% of private renters had lived in their property for less than one year. As most tenancies are 6 months shorthold and a single property may have been rented twice in one year, this figure has been reduced to 30% then cross-checked with the views of lettings agents.
• For the social rented sector, turnover is based on the number of lettings in the previous 12 months as a proportion of all stock.

140
5.5 Housing costs 5.16 The third section of the Toolkit provides detailed and interactive
modelling of the cost and affordability of housing of all types and bedsizes in all tenures. Furthermore, using CACI PayCheck profile data, enables an assessment of the income required to afford housing of different types, and the proportion of households who are able to do so.
5.17 The default setting is the affordability of 2 bed houses as this is
especially relevant to meeting the typical requirements of additional households, the majority of which are small, and can be considered an ‘average’ housing type. However, figures can be entered for any target housing type in the column labelled Affordability.
5.18 All tenures have been included in this Assessment in terms of a
hierarchy of affordability. Affordable Rent has been treated as a full cost market product though access to Housing Benefit may make it more accessible to lower income groups. Private rent has been separately identified as it now constitutes a major element of housing supply, though in terms of new housing required, this is likely to be provided by the home ownership sector then transferred to the private rental sector.
5.19 The outcome of this housing cost and affordability modelling is the
identification of the cumulative proportion of households who can afford each tenure, for example in Wellingborough:
• 34.96% can only afford social rented housing
5.20 Therefore the affordable housing requirement is 35% rounded
• 2.13% can afford full cost Affordable Rented housing as can all those above the relevant income level
• 8.35% can afford shared ownership/equity loan housing as can all those above the relevant income level
5.21 Therefore the intermediate housing requirement is 10% rounded
• 4.69% can afford private rented housing as can all those above the relevant income level
• 49.87% can afford full cost home ownership.
5.22 Therefore the full cost market housing requirement is 55% rounded. 5.23 The following table lists the outcome for all 4 districts.
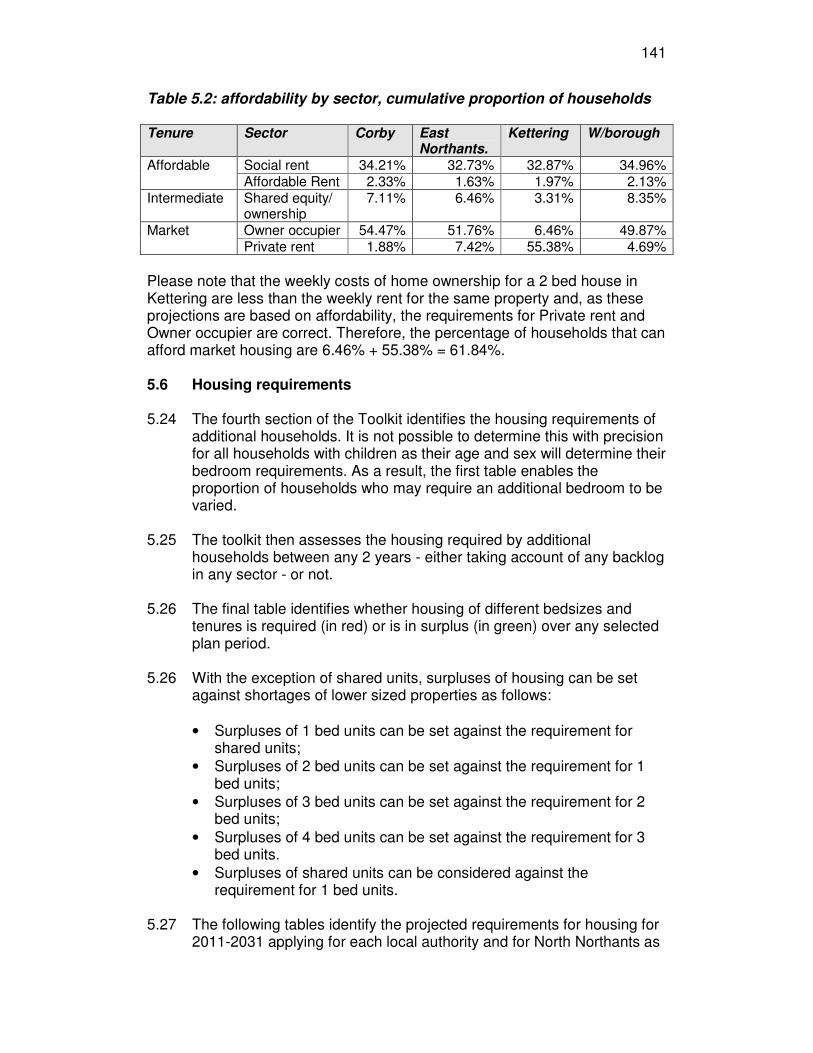
141
Table 5.2: affordability by sector, cumulative proportion of households Tenure Sector Corby East
Northants. Kettering W/borough
Social rent 34.21% 32.73% 32.87% 34.96% Affordable Affordable Rent 2.33% 1.63% 1.97% 2.13%
Intermediate Shared equity/ ownership
7.11% 6.46% 3.31% 8.35%
Owner occupier 54.47% 51.76% 6.46% 49.87% Market Private rent 1.88% 7.42% 55.38% 4.69%
Please note that the weekly costs of home ownership for a 2 bed house in Kettering are less than the weekly rent for the same property and, as these projections are based on affordability, the requirements for Private rent and Owner occupier are correct. Therefore, the percentage of households that can afford market housing are 6.46% + 55.38% = 61.84%. 5.6 Housing requirements
5.24 The fourth section of the Toolkit identifies the housing requirements of
additional households. It is not possible to determine this with precision for all households with children as their age and sex will determine their bedroom requirements. As a result, the first table enables the proportion of households who may require an additional bedroom to be varied.
5.25 The toolkit then assesses the housing required by additional
households between any 2 years - either taking account of any backlog in any sector - or not.
5.26 The final table identifies whether housing of different bedsizes and
tenures is required (in red) or is in surplus (in green) over any selected plan period.
5.26 With the exception of shared units, surpluses of housing can be set
against shortages of lower sized properties as follows:
• Surpluses of 1 bed units can be set against the requirement for shared units;
• Surpluses of 2 bed units can be set against the requirement for 1 bed units;
• Surpluses of 3 bed units can be set against the requirement for 2 bed units;
• Surpluses of 4 bed units can be set against the requirement for 3 bed units.
• Surpluses of shared units can be considered against the requirement for 1 bed units.
5.27 The following tables identify the projected requirements for housing for
2011-2031 applying for each local authority and for North Northants as

142
a whole, Natural Change then Migration-led Recalibrated household projections. The first set of tables are not adjusted for a backlog in the requirement for affordable housing and the second set show the effect of adding such a backlog. The affordable housing backlog has been estimated on the basis of those households which have no permanent home of their own, i.e., they are recorded on housing registers as ‘living with family/friends/other; of no fixed abode; in supported housing'. The bedroom requirements of such applicants have been determined from housing registers and they have been added to the Social Rent sub-sector of the Affordable Tenure
Set 1: requirements not adjusted for affordable housing backlog, July 2012 Table 5.3a: projected housing requirements for Corby 2011-2031, not adjusted for backlog or household bedsize, Natural Change
Tenure Sector Shared 1 bed
2 bed
3 bed
4+ bed
Totals
Social Rent -124 487 656 22 -85 956 34.21% Affordable
Affordable Rent 0 29 40 1 -5 65 2.33%
Intermediate Shared Ownership
-24 101 135 4 -17 199 7.11%
Private Rent 0 24 32 1 -4 53 1.88% Market
Owner Occupier -191 773 1,041 35 -134 1524 54.47%
Totals -339 1414 1904 63 -245 2797 100.0%
Table 5.3b: projected housing requirements for Corby 2011-2031, not adjusted for backlog or household bedsize, Migration-led Recalibrated
Tenure Sector Shared 1 bed
2 bed
3 bed
4+ bed
Totals
Social Rent -91 2,286 889 441 71 3,596 34.20% Affordable
Affordable Rent 0 138 54 27 4 222 2.12%
Intermediate Shared Ownership
-18 472 184 91 15 743 7.11%
Private Rent 0 111 43 21 3 180 1.72% Market
Owner Occupier -141 3,626 1,411 700 112 5,709 54.63%
Totals -250 6,633 2,581 1,281 205 10,450 100.0%
Table 5.4a: projected housing requirements for East Northants 2011-2031, not adjusted for backlog or household bedsize, Natural Change
Tenure Sector Shared 1
bed 2
bed 3
bed 4+
bed Totals
Social Rent -13 876 966 -476 -32 1321 32.73% Affordable
Affordable Rent 0 43 48 -23 -2 66 1.63%
Intermediate Shared Ownership
-2 173 190 -94 -6 261 6.46%
Private Rent 0 197 217 -107 -7 300 7.42% Market
Owner Occupier -22 1,387 1,528 -753 -51 2089 51.76%
Totals -37 2676 2949 -1453 -98 4037 100.00%

143
Table 5.4b: projected housing requirements for East Northants 2011-2031, not adjusted for backlog or household bedsize, Migration-led Recalibrated
Tenure Sector Shared 1
bed 2
bed 3
bed 4+
bed Totals
Social Rent 55 3,277 457 -378 61 3,471 32.77% Affordable
Affordable Rent 0 162 23 -19 3 168 1.59%
Intermediate Shared Ownership
10 646 90 -75 12 684 6.46%
Private Rent 0 736 102 -85 14 767 7.24% Market
Owner Occupier 94 5,187 723 -599 97 5,501 51.94%
Totals 159 10.008 1,394 -1,156
186 10,592 100.0%
Table 5.5a: projected housing requirements for Kettering 2011-2031, not adjusted for backlog or household bedsize, Natural Change
Tenure Sector Shared 1
bed 2
bed 3
bed 4+
bed Totals
Social Rent -99 1,972 144 -521 95 1591 32.87% Affordable
Affordable Rent 0 199 15 -52 -10 152 1.97%
Intermediate Shared Ownership
-9 118 9 -31 -6 81 3.31%
Private Rent 0 3,323 243 -877 -161 2528 55.38% Market
Owner occupier -175 388 28 -102 -19 120 6.46%
Totals -283 6000 439 -1583 -101 4472 100.00%
5.28 Please note that the weekly costs of home ownership for a 2 bed house in Kettering are less than the weekly rent for the same property and, as these projections are based on affordability, the requirements for Private rent and Owner occupier are correct. Therefore, the percentage of households that can afford market housing are 6.46% + 55.38% = 61.84%.
Table 5.5b: projected housing requirements for Kettering 2011-2031, not adjusted for backlog or household bedsize, Migration-led Recalibrated
Tenure Sector Shared 1
bed 2
bed 3
bed 4+
bed Totals
Social Rent -55 3,891 588 -66 123 4,480 32.85% Affordable
Affordable Rent -5 392 59 -7 12 452 3.31%
Intermediate Shared Ownership
0 233 35 -4 7 272 1.99%
Private Rent -98 6,556 990 -111 207 7,543 55.31% Market
Owner Occupier 0 765 116 -13 24 892 6.54%
Totals -159 11,837 1,788 -201 373 13,639 100.0%
5.29 As above, the weekly costs of home ownership for a 2 bed house in
Kettering are less than the weekly rent for the same property therefore the requirements for Private rent and Owner occupier are correct. The percentage of households that can afford market housing are 6.54% + 55.31% = 61.85%.

144
Table 5.6a: projected housing requirements for Wellingborough 2011-2031, not adjusted for backlog or household bedsize, Natural Change
Tenure Sector Shared 1
bed 2
bed 3
bed 4+
bed Totals
Social Rent -84 1,971 45 -427 -48 1457 34.96% Affordable
Affordable Rent 0 114 3 -25 -3 89 2.13%
Intermediate Shared Ownership
-19 469 11 -102 -11 348 8.35%
Private Rent 0 250 6 -54 -6 196 4.69% Market
Owner Occupier -124 2,816 64 -610 -69 2077 49.87%
Totals -227 5620 129 -1218 -137 4167 100.0%
Table 5.6b: projected housing requirements for Wellingborough 2011-2031, not adjusted for backlog or household bedsize, Migration-led Recalibrated
Tenure Tenure Shared 1
bed 2
bed 3
bed 4+
bed Totals
Social Rent -77 2,377 167 -238 17 2,247 35.01% Affordable
Affordable Rent -17 566 40 -57 4 536 8.35%
Intermediate Shared Ownership
0 137 10 -14 1 134 2.09%
Private Rent 0 301 21 -30 2 294 4.59% Market
Owner Occupier -114 3,396 239 -340 25 3,207 49.97%
Totals -208 6,778 477 -678 50 6,418 100.0%
Table 5.7a: projected housing requirements for North Northants 2011-2031, not adjusted for backlog or household bedsize, Natural Change
Tenure Sector Shared 1
bed 2
bed 3
bed 4+
bed Totals
Social Rent -320 5306 1811 -1402 -70 5325 34.41% Affordable
Affordable Rent 0 385 106 -99 -20 372 2.40%
Intermediate Shared Ownership
-54 861 345 -223 -40 889 5.75%
Private Rent 0 3794 498 -1037 -178 3077 19.89% Market
Owner occupier -512 5364 2661 -1430 -273 5810 37.55%
Totals -886 15710 5421 -4191 -581 15473 100.%
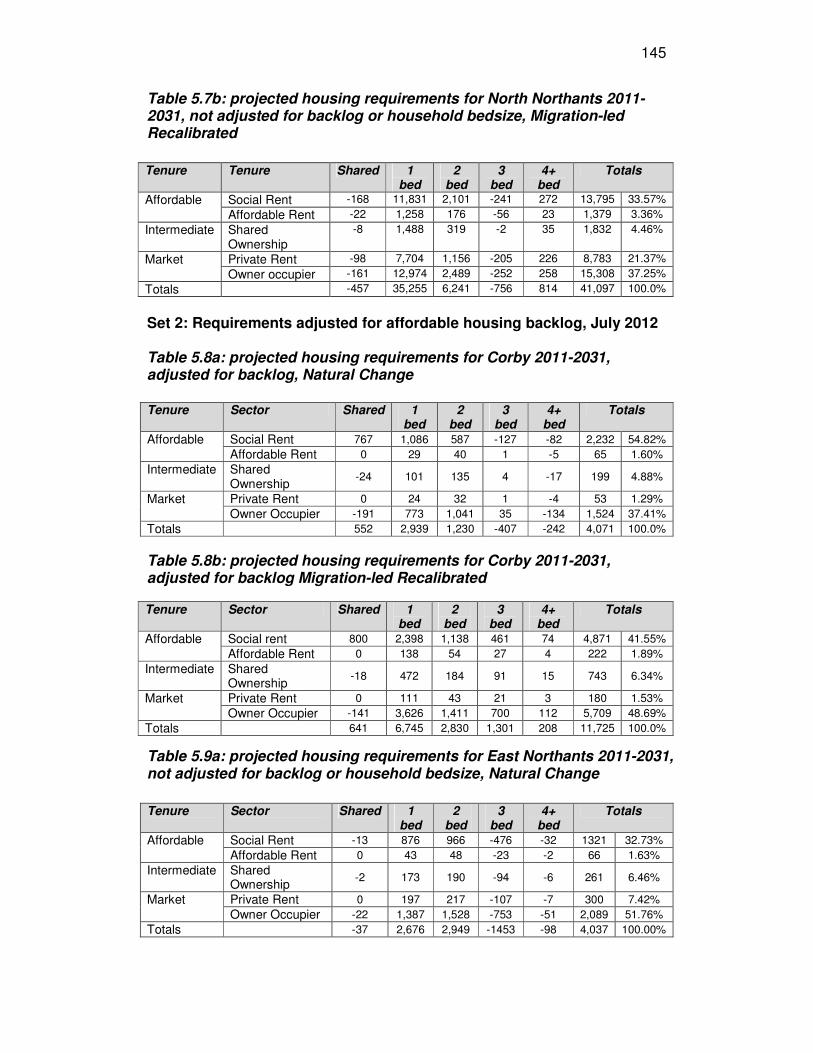
145
Table 5.7b: projected housing requirements for North Northants 2011-2031, not adjusted for backlog or household bedsize, Migration-led Recalibrated
Tenure Tenure Shared 1
bed 2
bed 3
bed 4+
bed Totals
Social Rent -168 11,831 2,101 -241 272 13,795 33.57% Affordable
Affordable Rent -22 1,258 176 -56 23 1,379 3.36%
Intermediate Shared Ownership
-8 1,488 319 -2 35 1,832 4.46%
Private Rent -98 7,704 1,156 -205 226 8,783 21.37% Market
Owner occupier -161 12,974 2,489 -252 258 15,308 37.25%
Totals -457 35,255 6,241 -756 814 41,097 100.0%
Set 2: Requirements adjusted for affordable housing backlog, July 2012 Table 5.8a: projected housing requirements for Corby 2011-2031, adjusted for backlog, Natural Change
Tenure Sector Shared 1 bed
2 bed
3 bed
4+ bed
Totals
Social Rent 767 1,086 587 -127 -82 2,232 54.82% Affordable
Affordable Rent 0 29 40 1 -5 65 1.60%
Intermediate Shared Ownership
-24 101 135 4 -17 199 4.88%
Private Rent 0 24 32 1 -4 53 1.29% Market
Owner Occupier -191 773 1,041 35 -134 1,524 37.41%
Totals 552 2,939 1,230 -407 -242 4,071 100.0%
Table 5.8b: projected housing requirements for Corby 2011-2031, adjusted for backlog Migration-led Recalibrated
Tenure Sector Shared 1 bed
2 bed
3 bed
4+ bed
Totals
Social rent 800 2,398 1,138 461 74 4,871 41.55% Affordable
Affordable Rent 0 138 54 27 4 222 1.89%
Intermediate Shared Ownership
-18 472 184 91 15 743 6.34%
Private Rent 0 111 43 21 3 180 1.53% Market
Owner Occupier -141 3,626 1,411 700 112 5,709 48.69%
Totals 641 6,745 2,830 1,301 208 11,725 100.0%
Table 5.9a: projected housing requirements for East Northants 2011-2031, not adjusted for backlog or household bedsize, Natural Change
Tenure Sector Shared 1
bed 2
bed 3
bed 4+
bed Totals
Social Rent -13 876 966 -476 -32 1321 32.73% Affordable
Affordable Rent 0 43 48 -23 -2 66 1.63%
Intermediate Shared Ownership
-2 173 190 -94 -6 261 6.46%
Private Rent 0 197 217 -107 -7 300 7.42% Market
Owner Occupier -22 1,387 1,528 -753 -51 2,089 51.76%
Totals -37 2,676 2,949 -1453 -98 4,037 100.00%

146
Table 5.9b: projected housing requirements for East Northants 2011-2031, adjusted for backlog, Migration-led Recalibrated
Tenure Sector Shared 1 bed 2
bed 3
bed 4+
bed Totals
Social Rent 55 3,277 457 -378 61 3,471 32.77% Affordable
Affordable Rent 0 162 23 -19 3 168 1.59%
Intermediate Shared Ownership
10 646 90 -75 12 684 6.46%
Private Rent 0 736 102 -85 14 767 7.24% Market
Owner Occupier 94 5,187 723 -599 97 5,501 51.94%
Totals 159 10,008 1,394 -
1,156 186 10,592 100.0%
Table 5.10a: projected housing requirements for Kettering 2011-2031, adjusted for backlog, Natural Change
Tenure Sector Shared 1
bed 2
bed 3
bed 4+
bed Totals
Social Rent 638 2,052 424 -489 -90 2,536 46.82% Affordable
Affordable Rent -9 199 15 -52 -10 142 1.66%
Intermediate Shared Ownership
0 118 9 -31 -6 90 2.62%
Private Rent -175 3,323 243 -877 -161 2,354 5.45% Market
Owner Occupier -0 388 28 -102 -19 295 43.45%
Totals 454 6,080 719 -
1,152 -285 5,417 100.00%
Table 5.10b: projected housing requirements for Kettering 2011-2031, adjusted for backlog, Migration-led Recalibrated
Tenure Sector Shared 1
bed 2
bed 3
bed 4+
bed Totals
Social Rent 682 3,971 868 -34 128 5614 38.00% Affordable
Affordable Rent -5 392 59 -7 12 452 1.84%
Intermediate Shared Ownership
0 233 35 -4 7 272 3.06%
Private Rent -98 6,556 990 -111 207 7,543 6.03% Market
Owner Occupier 0 765 116 -13 24 892 51.06%
Totals 578 11,197 2,068 -169 378 14,773 100.0%
Table 5.11a: projected housing requirements for Wellingborough 2011-2031, adjusted for backlog, Natural Change
Tenure Sector Shared 1
bed 2
bed 3
bed 4+
bed Totals
Social Rent 607 2,074 304 -394 -43 2,547 48.46% Affordable
Affordable Rent 0 114 3 -25 -3 89 1.69%
Intermediate Shared Ownership
-19 469 11 -102 -11 348 6.62%
Private Rent 0 250 6 -54 -6 196 3.71% Market
Owner Occupier -124 2,816 64 -610 -69 2,077 39.52%
Totals 463 5,723 387 -1,185 -132 5,256 100.0%

147
Table 5.12b: projected housing requirements for Wellingborough 2011-2031, adjusted for backlog, Migration-led Recalibrated
Tenure Tenure Shared 1
bed 2
bed 3
bed 4+
bed Totals
Social Rent 614 2,480 426 -205 22 3,338 44.45% Affordable
Affordable Rent -17 566 40 -57 4 536 1.78%
Intermediate Shared Ownership
0 137 10 -14 1 134 7.14%
Private Rent 0 301 21 -30 2 294 3.92% Market
Owner Occupier -114 3,396 239 -340 25 3,207 42.71%
Totals 483 6,881 736 -645 55 7,509 100.0%
Table 5.13a: projected housing requirements for North Northants 2011-2031, adjusted for backlog, Natural Change
Tenure Sector Shared 1
bed 2
bed 3
bed 4+
bed Totals
Social Rent -320 5306 1811 -1402 -70 5325 34.41% Affordable
Affordable Rent 0 385 106 -99 -20 372 2.40%
Intermediate Shared Ownership
-54 861 345 -223 -40 889 5.75%
Private Rent 0 3794 498 -1037 -178 3077 19.89% Market
Owner Occupier -512 5364 2661 -1430 -273 5810 37.55%
Totals -886 15710 5421 -4191 -581 15473 100.%
Table 5.13b: projected housing requirements for North Northants 2011-2031, adjusted for backlog, Migration-led Recalibrated
Tenure Tenure Shared 1
bed 2
bed 3
bed 4+
bed Totals
Social Rent -168 11,831 2,101 -241 272 13,795 33.57% Affordable
Affordable Rent -22 1,258 176 -56 23 1,379 3.36%
Intermediate Shared Ownership
-8 1,488 319 -2 35 1,832 4.46%
Private Rent -98 7,704 1,156 -205 226 8,783 21.37% Market
Owner Occupier -161 12,974 2,489 -252 258 15,308 37.25%
Totals -457 35,255 6,241 -756 814 41,097 100.0%
5.7 The housing requirements of older households 5.30 Not all household growth will be from new households, this is
especially the case for older households who have progressed through the life cycle, and who constitute the majority of projected net growth. Most will be currently housed, and typically in 3 bed homes. The proportion of households in this situation has been modelled on the basis of those pensioner households who have 2 or more bedrooms not in use which, at the time of the 2001 Census was for example, 57% for Wellingborough. Therefore, for each additional older household not downsizing to a 2 bed home, a minimum of a 3 bed house will be required to replace it. Estimates have been provided in the tables above of the number of underoccupying pensioner households for the
148
whole population of the area and for additional households. These are not mutually exclusive, the latter is a sub-set of the former.
5.31 In view of the significance of the projected growth in older households,
the Toolkit enables projections to be made of the numbers of pensioner households requiring designated, sheltered or extra-care housing. Following extensive research undertaken by Housing Vision with the social care specialists HGO, these have been calculated using the following methodology:
• Stage 1: Needs Groups established within the wider older person’s population;
• Stage 2: Need adjusted according to local conditions;
• Stage 3: housing options linked to Needs Groups;
• Stage 4: estimate of the proportion within each Needs Group that in any one year is likely to want to make use of these different options; and
• Stage 5: the need for housing translated into the number of units of service required.
5.32 The requirement for 3 types of specialised housing has been
determined:
• Designated: housing, such as private sector retirement apartments, which includes the following features:
• fully adapted accommodation;
• integrated alarm with staff response when required;
• facilitation of mutual support; and
• opportunities for social activities.
• Sheltered or Supported: as Designated Housing above but providing personal support to residents as required;
• Extra Care: housing which crosses the boundary between high-level support needs and high-level care needs, with a larger proportion in the latter category.
5.33 Output figures for specialised housing for older people have been
provided for the whole population of the area and for additional households, these are not mutually exclusive, the latter is a sub-set of the former.
5.34 The following tables summarise the outcome in terms of the number of
underoccupying pensioner household and the specialised housing required for the whole population of the area and for additional households.

149
Table 5.14: projected specialised housing requirements of older households for Corby, 2011-2031
65+ Households 65+ totals
Under-occupying (56.77%)
Designated Sheltered Extra Care
2011 5,827 3,308 367 175 320 2031 8,899 5,052 560 267 489
Additional Households
3,072 1,744 193 92 169
Table 5.15: projected specialised housing requirements of older households for East Northants 2011-2031
65+ Households 65+ totals
Under-occupying (61.98%)
Designated Sheltered Extra Care
2011 9,388 5,818 590 282 516
2031 16,284 10,093 1,024 489 896 Additional Households
6,897 4,274 434 207 379
Table 5.16: projected specialised housing requirements of older households for Kettering, 2011-2031
65+ Households 65+ totals
Under-occupying (58.11%)
Designated Sheltered Extra Care
2011 10,018 5,822 630 301 551 2031 16,417 9,540 1,033 493 903 Additional Households
6,399 3,718 402 192 352
Table 5.17: projected specialised housing requirements of older households for Wellingborough, 2011-2031
65+ Households 65+ totals
Under-occupying
(56.77%
Designated Sheltered Extra Care
2011 9,001 5,145 566 270 495
2031 14,352 8,204 903 431 789 Additional Households
5,351 3,058 337 161 294

150
Table 5.18: projected specialised housing requirements of older households for North Northants, 2011-2031
65+ Households 65+ totals
Under-occupying (58.41%)
Designated Sheltered Extra Care
2011 34,234 20,093 2,153 1,028 1,882 2031 55,952 32,889 3,520 1,680 3,077
Additional Households
21,719 12,794 1,366 652 1,194

151
Appendix A: gross household incomes by ward in East Northants, mean and lower quartile
Ward Mean Lower quartile
Barnwell £44,927 £22,923
Fineshade £38,169 £18,261
Higham Ferrers Chicele £34,868 £16,428
Higham Ferrers Lancaster £40,289 £19,862
Irthlingborough JP £38,249 £18,872
Irthlingborough Waterloo £35,158 £17,043
KingsForest £42,247 £21,138
Lower Nene £48,026 £24,686
Lyveden £45,627 £22,598
Oundle £40,513 £19,882
Prebendal £43,809 £21,963
Raunds Saxon £38,851 £19,112
Raunds Windmill £33,875 £16,090
Rushden Bates £41,420 £20,637
Rushden Hayden £28,976 £13,078
Rushden Spencer £39,151 £19,203
Rushden Sartoris £43,716 £21,738
Rushden Pemberton £33,262 £15,489
Stanwick £45,028 £23,034
Thrapston Lakes £41,171 £20,590
Thrapston Market £45,831 £23,317
Woodford £41,250 £20,458 (Source: CACI commissioned data)