non-revenue water reduction - an international...
TRANSCRIPT

Non-Revenue Water Reduction -an International Update
Roland Liemberger

2
Topics of the Presentation:
S choosing the right performance indicatorS outsourcing of NRW reduction – the Selangor
(Malaysia) exampleS brief notes on the IWA leakage conference in
Cyprus

3
Around the globe one and the same problem ...

4
too much precious water
is lostis lost

5
great engineers since ever wanted great engineers since ever wanted to build huge schemes .....to build huge schemes .....

6
... and politicians always enjoy opening ceremonies!

7

8
9
that's why we have a major problem:
NRWNRW(Non(Non--Revenue Water)Revenue Water)
10
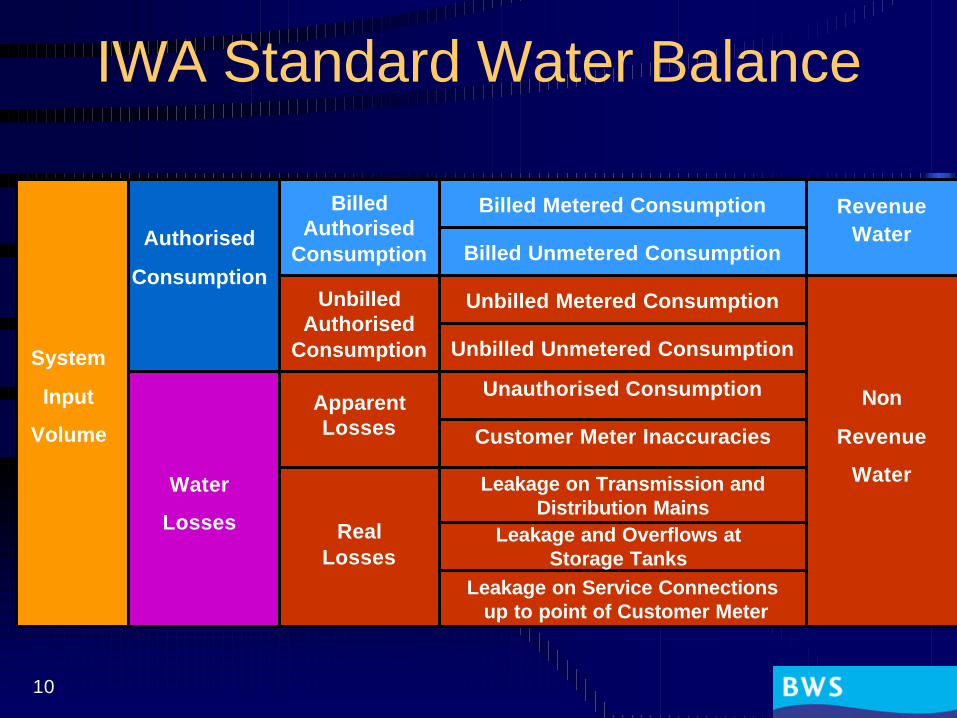
IWA Standard Water Balance
System
Input
Volume
Authorised
Consumption
RevenueWater
Non
Revenue
Water
BilledAuthorised
Consumption
UnbilledAuthorised
Consumption
ApparentLosses
RealLosses
Water
Losses
Billed Metered Consumption
Unbilled Unmetered Consumption
Unauthorised Consumption
Customer Meter Inaccuracies
Leakage on Transmission andDistribution Mains
Billed Unmetered Consumption
Unbilled Metered Consumption
Leakage on Service Connectionsup to point of Customer Meter
Leakage and Overflows at Storage Tanks

11
Traditional PIs for Real Losses
S per property per day
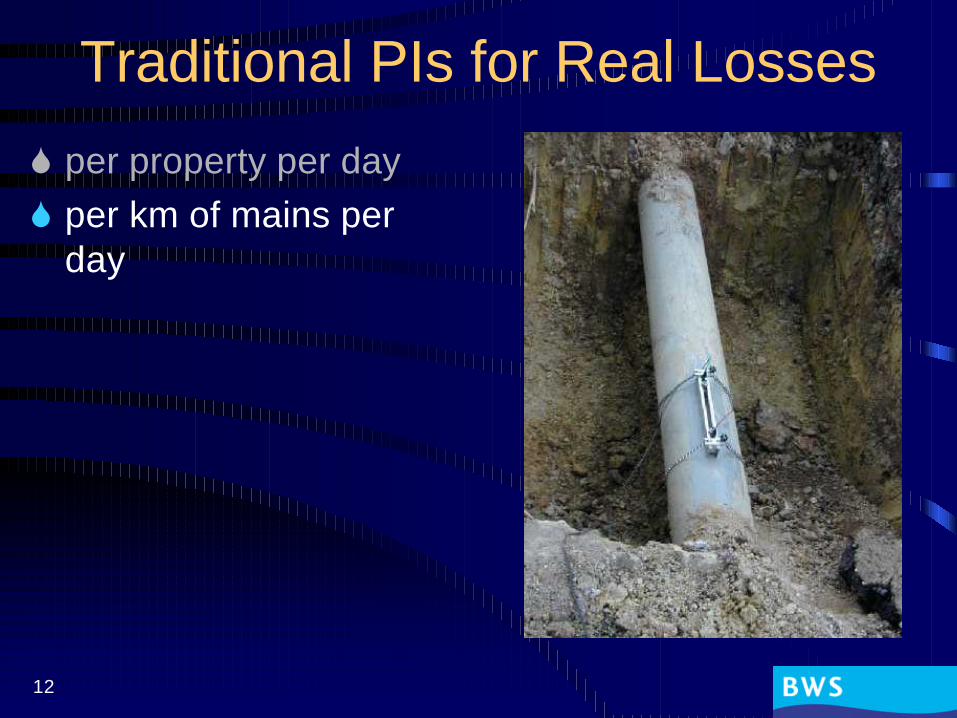
12
Traditional PIs for Real Losses
S per property per dayS per km of mains per
day

13
Traditional PIs for Real Losses
S per property per dayS per km of mains per
dayS per service connection
per day
14
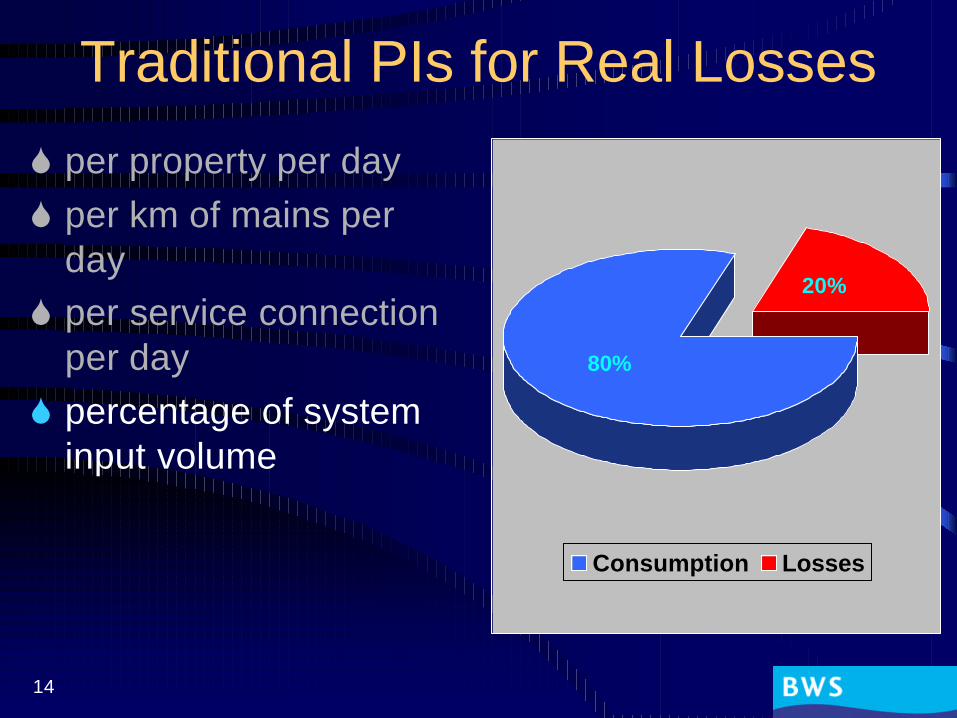
Traditional PIs for Real Losses
S per property per dayS per km of mains per
dayS per service connection
per dayS percentage of system
input volume
80%
20%
Consumption Losses

15
Real Losses as % of System Input
VIENNA(Austria)
8.5 %
16
Real Losses as % of System Input
LEMESOS(Cyprus)
12.5 %
17
Real Losses as % of System Input
DUSHANBE(Tajikistan)
16.2 %
18
Real Losses as % of System Input
BRISTOL(UK)
16.8 %

19
Real Losses as % of System Input
PHILADELPHIA(USA)
25.8 %
20
Real Losses as % of System Input
MAKKAH(Saudi Arabia)
31.6 %

21
The Infrastructure Leakage Index
S a better IndicatorS describes the quality of infrastructure
managementS is the ratio of Current Annual Real Losses to
Unavoidable Annual Real LosesILI = CARL / UARLS being a ratio, it has no units

22
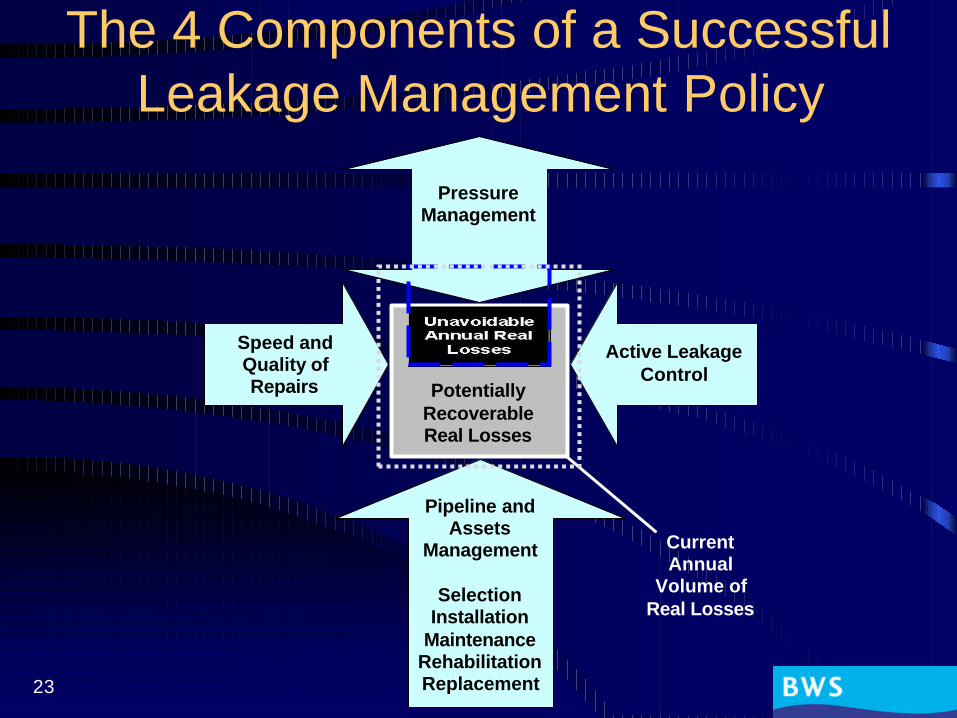
The 4 Components of a Successful Leakage Management Policy
Current Annual
Volume ofReal Losses
Pressure Management
Speed and Quality of Repairs
Pipeline and Assets
Management
SelectionInstallation
MaintenanceRehabilitationReplacement
Active Leakage Control
Potentially RecoverableReal Losses
Unavoidable Annual Real
Losses
23
The 4 Components of a Successful Leakage Management Policy
Speed and Quality of Repairs
Active Leakage Control
Pipeline and Assets
Management
SelectionInstallation
MaintenanceRehabilitationReplacement
Pressure Management
Current Annual
Volume ofReal Losses
Potentially RecoverableReal Losses

24
Unavoidable Annual Real
Losses
Current Annual Volume of Real Losses
Economic Level of Leakage
ILI and the Economic Level of Leakage (ELL)
Economically RecoverableReal Losses
25
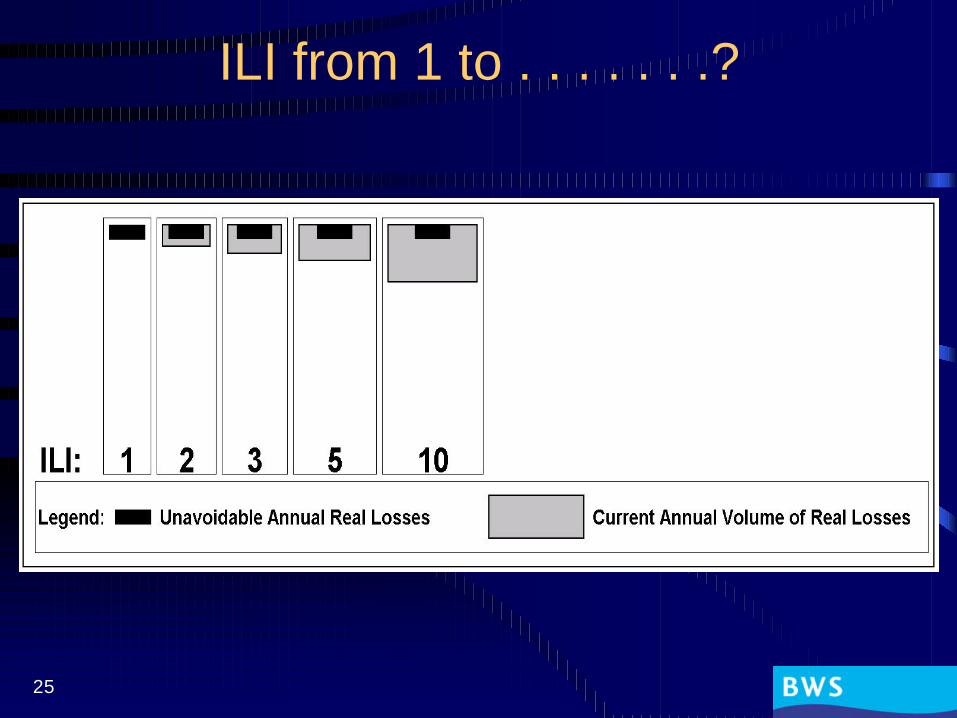
ILI from 1 to . . . . . . .?

26
ILI from 1 to . . . . . . .?
27
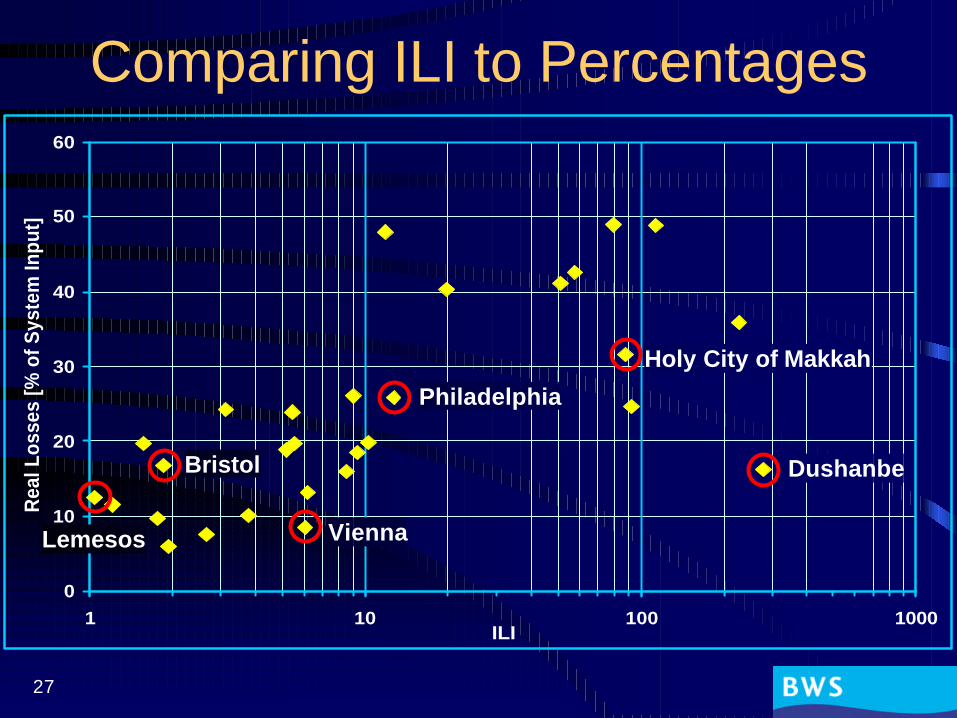
Comparing ILI to Percentages
0
10
20
30
40
50
60
1 10 100 1000ILI
Rea
l Los
ses
[% o
f Sys
tem
Inpu
t]
ViennaLemesos
Dushanbe
Philadelphia
Holy City of Makkah
Bristol
28
What's the problem?
SNRW Reduction is 'not a nice job'SDifficult to do for a public company (limited
funds, limited manpower, limited options to motivate staff)SCould be outsourced very efficientlySUtility would supervise/monitor the contractor

29
The Solution:
Performance BasedNRW Reduction Contracts

30
Performance BasedNRW Reduction Contracts
An all-inclusive contract with contract payments directly related to target
achievement, where the contractor has to reduce NRW in an
agreed area by an agreed unit rate per volume NRW reduced
(e.g. m3/d).
31
From Theory to Practice
NRW Reduction Project in Selangor, Malaysia
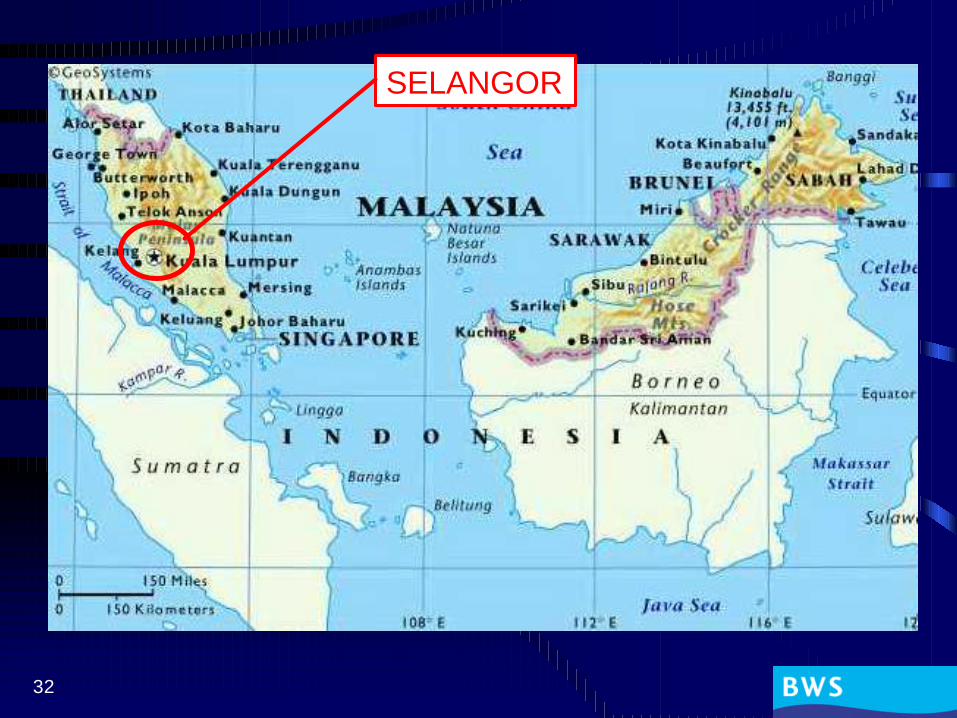
32
SELANGOR
33
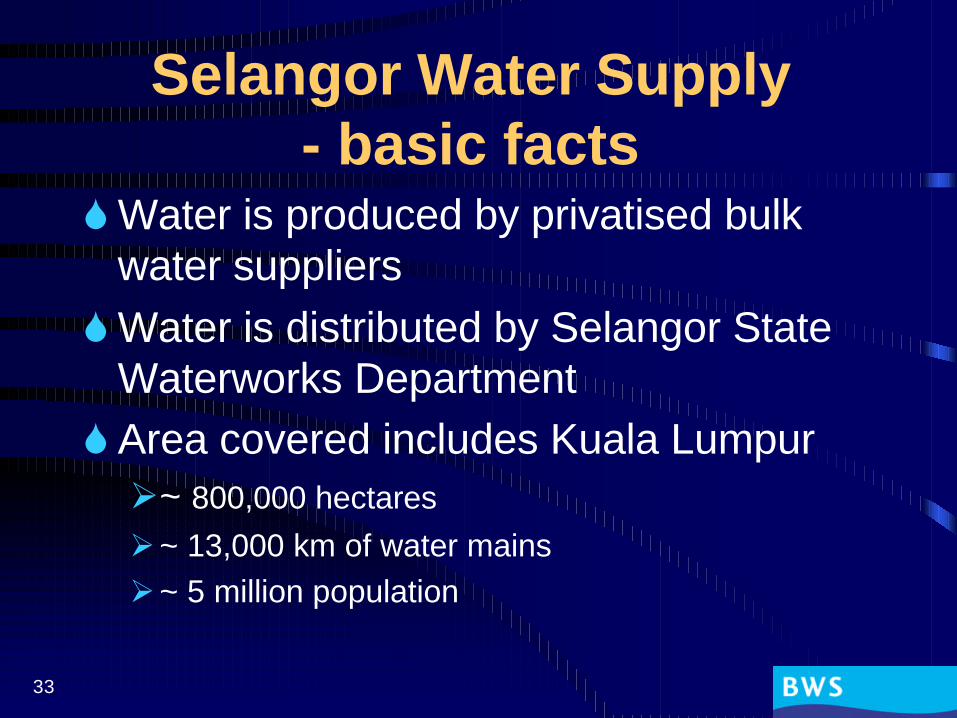
Selangor Water Supply- basic facts
SWater is produced by privatised bulk water suppliersSWater is distributed by Selangor State
Waterworks Department SArea covered includes Kuala LumpurØ~ 800,000 hectaresØ~ 13,000 km of water mainsØ~ 5 million population
34
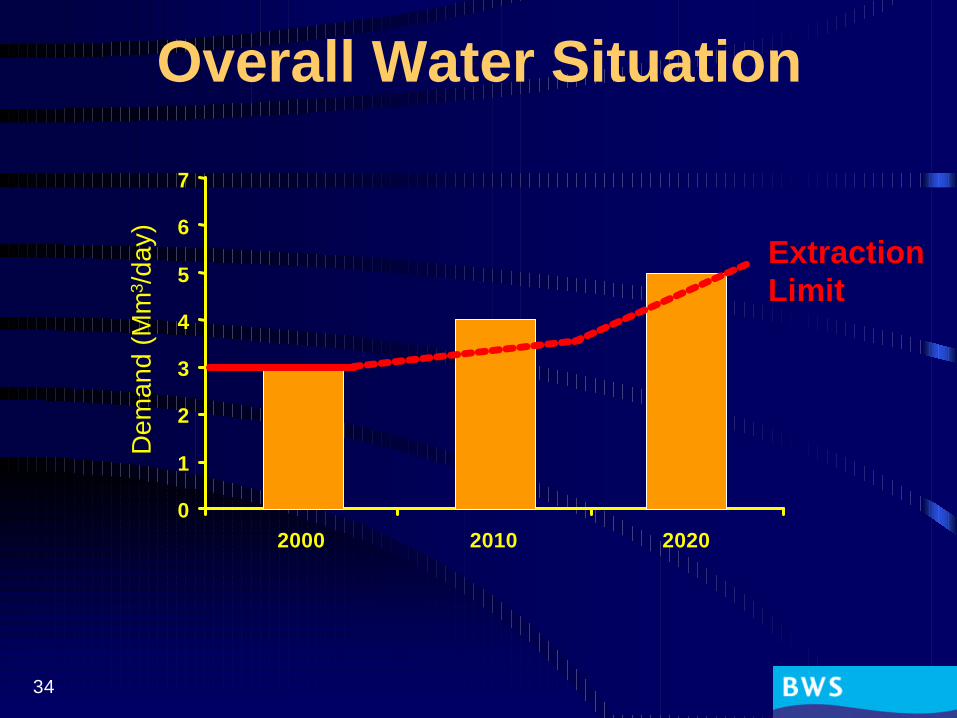
Overall Water Situation
2000 2010 20200
1
2
3
4
5
6
7
Dem
and
(Mm
3 /da
y) ExtractionLimit

35
NRW Situation in Selangor
S NRW ~ 40% of Total SupplyS ~ 280 million cubic metres per yearS ~ 821 litres per connection per dayS if reduced by 50%: enough to supply an extra
1.8 million people
36
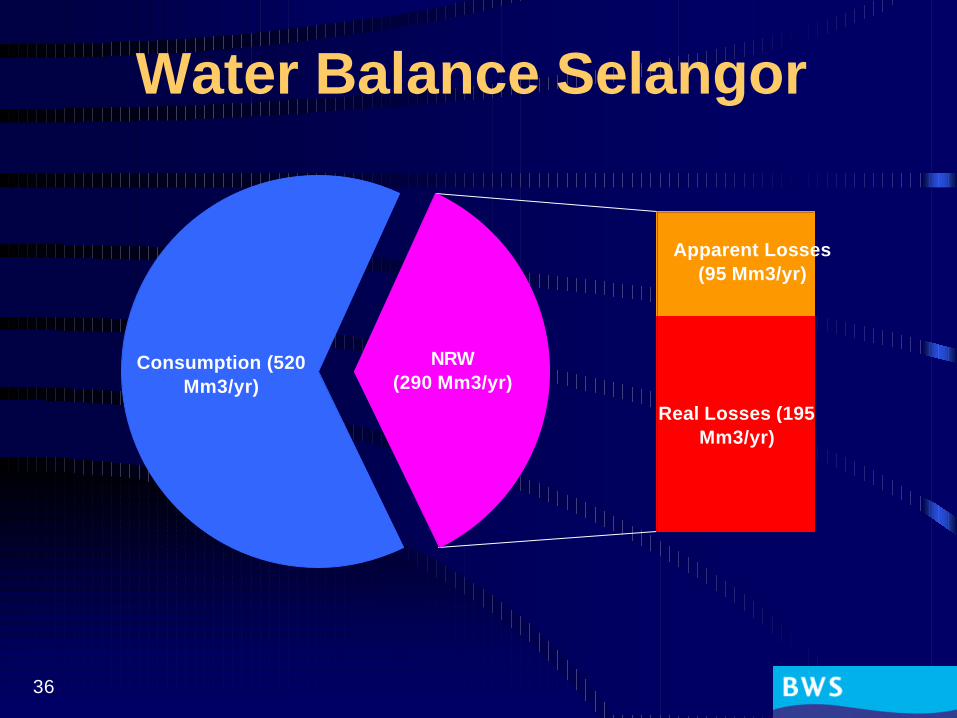
Water Balance Selangor
Real Losses (195 Mm3/yr)
Consumption (520 Mm3/yr)
NRW(290 Mm3/yr)
Apparent Losses (95 Mm3/yr)
37
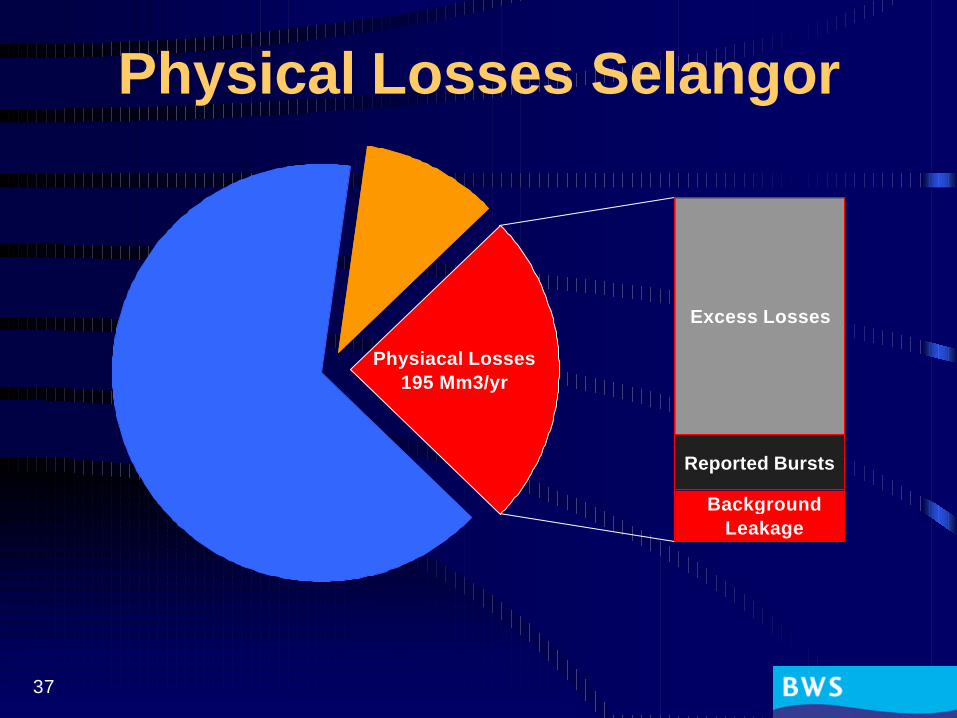
Physical Losses Selangor
Excess Losses
Physiacal Losses195 Mm3/yr
Background Leakage
Reported Bursts
38
Selangor NRW Reduction Contract
SA Performance Target Based NRW Reduction Contract in 2 PhasesSPhase 1 09/98 – 03/00 “Pilot Project”SPhase 2 commenced April 2000 “State-
wide Project” (9 years)
39
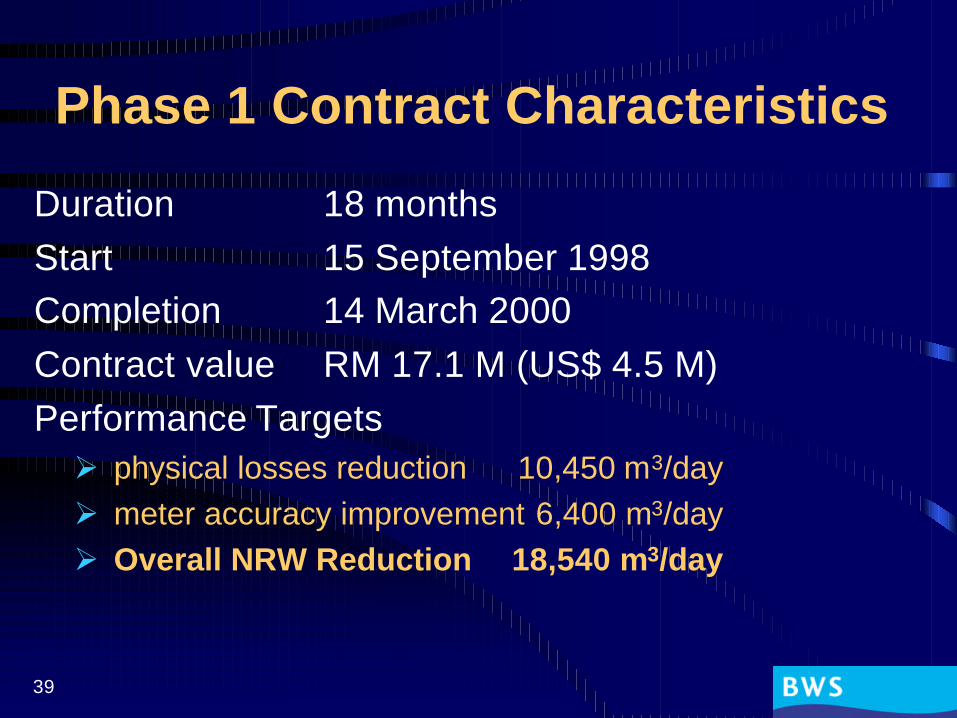
Phase 1 Contract Characteristics
Duration 18 monthsStart 15 September 1998Completion 14 March 2000Contract value RM 17.1 M (US$ 4.5 M)Performance TargetsØ physical losses reduction 10,450 m3/dayØ meter accuracy improvement 6,400 m3/dayØ Overall NRW Reduction 18,540 m3/day

40
The contract price includes
SPlanning, engineering, leak detection, construction supervisionSRepair materials, meters, equipmentSAll required civil, repair and installation works
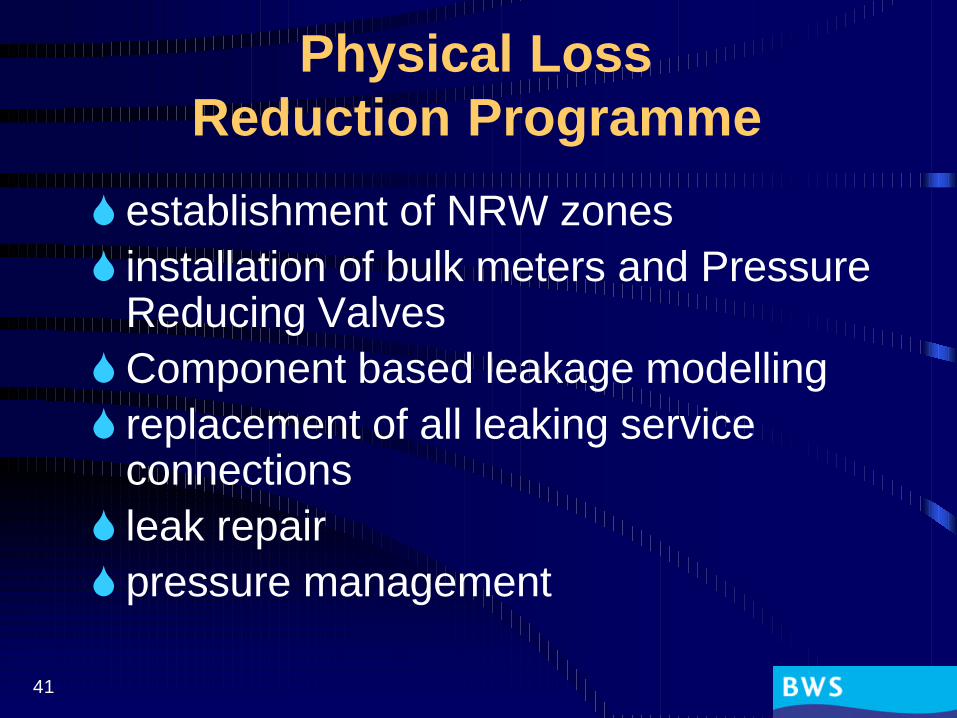
41
Physical LossReduction Programme
S establishment of NRW zonesS installation of bulk meters and Pressure
Reducing ValvesSComponent based leakage modellingS replacement of all leaking service
connectionsS leak repairS pressure management

42
Example from Selangor:
0
10
20
30
40
50
6000
:00
02:0
0
04:0
0
06:0
0
08:0
0
10:0
0
12:0
0
14:0
0
16:0
0
18:0
0
20:0
0
22:0
0
Flo
w R
ate
(l/s
)
0
5
10
15
20
25
30
Pre
ssu
re (m
)

43
Inflow, pressure and leakage
0
10
20
30
40
50
6000
:00
02:0
0
04:0
0
06:0
0
08:0
0
10:0
0
12:0
0
14:0
0
16:0
0
18:0
0
20:0
0
22:0
0
Flo
w R
ate
(l/s
)
0
5
10
15
20
25
30
Pre
ssu
re (m
)

44
Leakage components
0
10
20
30
40
50
6000
:00
02:0
0
04:0
0
06:0
0
08:0
0
10:0
0
12:0
0
14:0
0
16:0
0
18:0
0
20:0
0
22:0
0
Flo
w R
ate
(l/s
)
0
5
10
15
20
25
30
Pre
ssu
re (m
)

45
After leak repair
0
10
20
30
40
50
6000
:00
02:0
0
04:0
0
06:0
0
08:0
0
10:0
0
12:0
0
14:0
0
16:0
0
18:0
0
20:0
0
22:0
0
Flo
w R
ate
(l/s
)
0
5
10
15
20
25
30
Pre
ssu
re (m
)

46
Consumption - before and after
0
5
10
15
20
25
3000
:00
02:0
0
04:0
0
06:0
0
08:0
0
10:0
0
12:0
0
14:0
0
16:0
0
18:0
0
20:0
0
22:0
0
Flo
w R
ate
(l/s
)
47
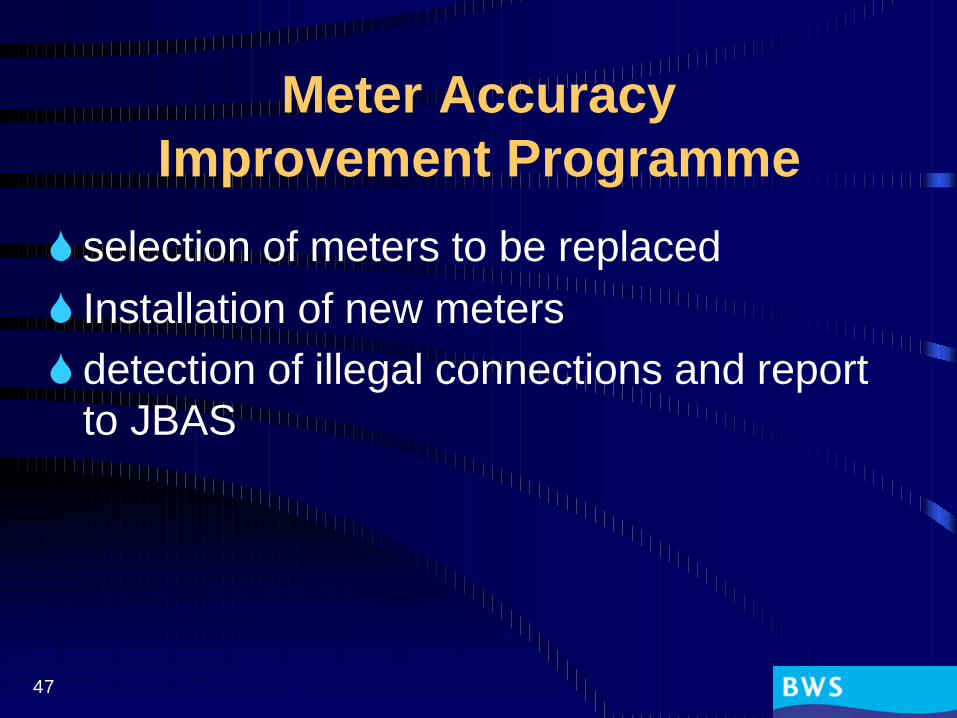
Meter AccuracyImprovement Programme
S selection of meters to be replacedS Installation of new metersS detection of illegal connections and report
to JBAS

48
Monitoring
S Flow and pressure measurements PRIOR to any activitiesSMeasurements to be repeated AFTER
completionSMeter records of replaced meters compared
with a three month reading of new meters
49
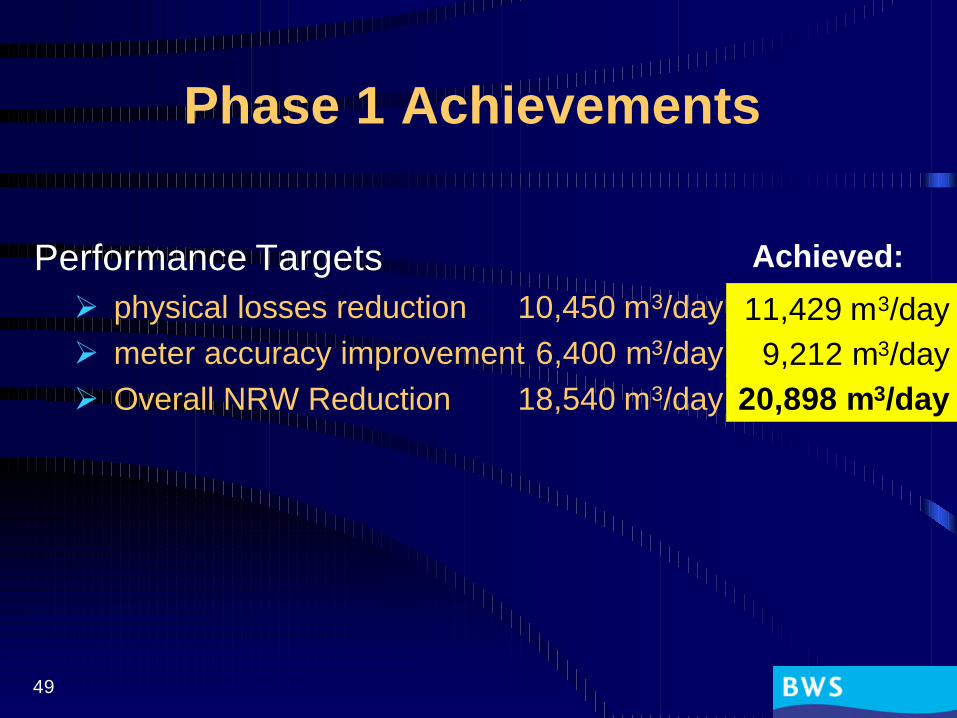
Phase 1 Achievements
Performance TargetsØ physical losses reduction 10,450 m3/dayØ meter accuracy improvement 6,400 m3/dayØ Overall NRW Reduction 18,540 m3/day
Achieved:
11,429 m3/day9,212 m3/day
20,898 m3/day

50
Phase 2 Contract Characteristics
Duration 9 yearsStart April 2000Completion April 2009Contract value RM 398 M (US$ 105 M)Performance TargetsØ reduce physical losses by minimum 97,500 m3/dayØ improve meter accuracy by minimum 81,450 m3/dayØ Overall NRW Reduction 198,900 m3/day
51
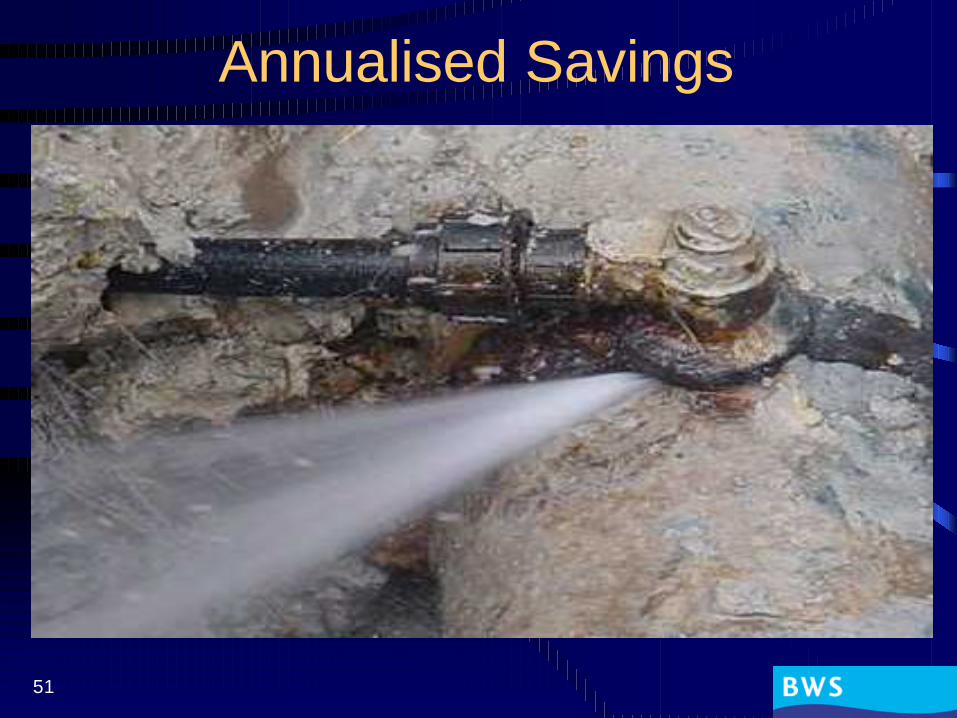
Annualised Savings
52
IWA Leakage ConferenceCyprus, Nov. 2002
S 3-day specialised conferenceS attracted participants from 27 countriesS has facilitated new advances and concepts to
stretch the current thinking on Øreal and apparent losses evaluation and Østrategic solutions

53
Most interesting topics (I):
SComponent based apparent loss modelling (Julian Thornton, WSO)S Latest findings from North America (AwwaRF
study) (Paul Fanner, WSO)S Introducing DMAs in North America (Ken
Brothers, Halifax Regional Water Commission)SNew Water Balance Software, 'Aqualibre'
www.aqualibre.info
54
Most interesting topics (II):
S Tactical planning of leakage reduction (Alex Rizzo, Malta Water Services Corporation)SPractical experience in applying the ILI (Allan
Lambert)SWater loss reduction in Italy and GreeceSPressure Reduction in South Africa (Ronnie
McKenzie, WRP)
55
IWA Water Loss TaskforceS ~ 40 Members from around the worldSChair: Ken Brothers, Halifax Regional Water
Commission (Canada)S Teams were formed to do further research:Ø Real Water Losses (including ILI/ ELL ) (Leader: Paul Fanner, USA)Ø Apparent Losses (Leader: Alex Rizzo, Malta)Ø PI and International benchmarking (Leader: Ronnie McKenzie, SA)Ø Leak Detection Practices (Leader: Richard Pilcher, UK)Ø District Metered Areas (Leader: John Morrison, UK)Ø Pressure Management Team (Leader: Julian Thornton, USA)
SNext important IWA Leakage Event: World Water Congress 2004, Marrakech (Morocco)
56
The Way Forward ??
S is it likely that politicians and media (and the Bank?) will stop using percentages???S a new indicator is needed whichØis simple, ideally using percentagesØtakes ECONOMICS into account
SENE – the Economic Network Efficiency
57
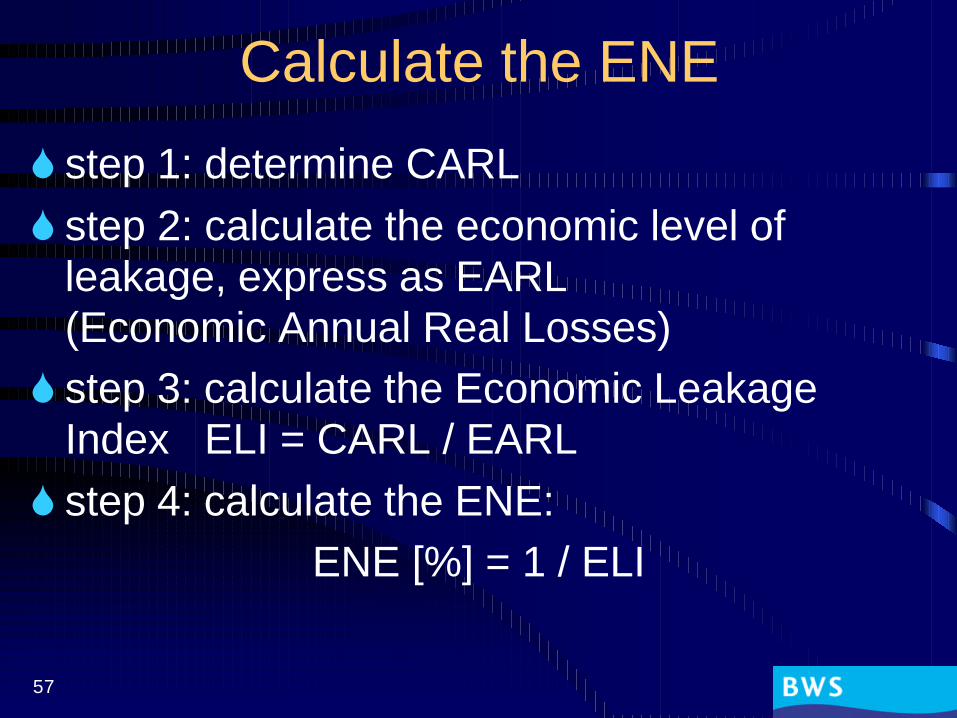
Calculate the ENE
S step 1: determine CARLS step 2: calculate the economic level of
leakage, express as EARL (Economic Annual Real Losses)S step 3: calculate the Economic Leakage
Index ELI = CARL / EARLS step 4: calculate the ENE:
ENE [%] = 1 / ELI

58
Economic Network Efficiency

59
Thank you.
www.waterlosses.com