nitrogen and carbon dynamics in grassland soils and plants
TRANSCRIPT

Nitrogen and carbon dynamics in grassland soils and
plants after application of digestate
Meike Andruschkewitsch geb. Benzenberg
Doctoral thesis
University of Kassel
Department of Grassland Science and Renewable Plant Resources
Holle, November 2014

This work has been accepted by the Faculty of Organic Agricultural Sciences of the
University of Kassel as a thesis for acquiring the academic degree of Doktor der
Naturwissenschaften (Dr. rer. nat.).
1. Supervisor: Prof. Dr. Michael Wachendorf (University of Kassel)
2. Supervisor: Prof. Dr. Rainer Georg Jörgensen (University of Kassel)
Defence day: 11th March 2015
Eidesstattliche Erklärung
Hiermit versichere ich, dass ich die vorliegende Dissertation selbständig, ohne unerlaubte
Hilfe Dritter angefertigt und andere als die in der Dissertation angegebenen Hilfsmittel nicht
benutzt habe. Alle Stellen, die wörtlich oder sinngemäß aus veröffentlichten oder
unveröffentlichten Schriften entnommen sind, habe ich als solche kenntlich gemacht. Dritte
waren an der inhaltlich-materiellen Erstellung der Dissertation nicht beteiligt; insbesondere
habe ich hierfür nicht die Hilfe eines Promotionsberaters in Anspruch genommen. Kein Teil
dieser Arbeit ist in einem anderen Promotions- oder Habilitationsverfahren verwendet
worden.
Witzenhausen, den 17. November 2014
Meike Andruschkewitsch

I
Preface
I submit this thesis to the Faculty of Organic Agricultural Sciences of the University of Kassel
to fulfil the requirements for the degree Doktor der Naturwissenschaften (Dr. rer. nat.). This
dissertation is based on three articles of mine as first author, which are published by or
submitted to international peer reviewed journals. The articles are included in chapter 3, 4 and
5. A general introduction is given in chapter 1. Research objectives are included in chapter 2.
In chapter 6, the entire thesis is summarized and general conclusions are drawn.
First of all, I would like to thank my supervisor Prof. Dr. Michael Wachendorf for guiding
and supporting me over the years. I have always found an open door, with wise and scientific-
based advice and suggestions behind. I am also indebted to Prof. Dr. R. G. Joergensen for his
willingness to act as second supervisor, likewise Prof. Dr. B. Ludwig and Prof. Dr. J.
Isselstein who agreed to join the examination committee.
I would also like to thank the scientific staff of the Departments of Grassland Science and
Renewable Plant Resources and Soil Biology and Plant Nutrition, especially Dr. Christine
Wachendorf, for mentoring and helping me with experience and wisdom. Also my thanks go
to Dr. Thomas Fricke, Dr. André Sradnick and Dr. Eike Rommelfanger.
Thanks to the skilled technical staff of the departments, in particular Andrea Gerke, Gabi
Dormann and Julia Sondermann, for contributing substantially to the work sections in the
glasshouse, field and laboratory.
A big thank goes to all of my PhD colleagues, who have fulfilled my time at the university of
Kassel with great collegiality, a lot of humor and scientific advice, when ever it was
necessary. Thanks a lot for that. My special thanks go to my office colleagues Lutz Bühle and
Frank Hensgen as well as to Miriam Ehret, Björn Reddersen and Stefanie Wentzel.
I will always be grateful to my parents for sponsoring my initial university career and for their
everlasting support, without the doctorate would not have been possible.
I want to thank my son Max, who gave me extra motivation for the last few meters and last
but not least my loved husband Rouven. Thank you for being friend, critical reviewer and the
man for all seasons.
Holle, November 2014
Meike Andruschkewitsch
II
List of publications
Chapter 3: Andruschkewitsch M., Wachendorf C., Wachendorf M. (2013): Effects of
digestates from different biogas production systems on above- and
belowground grass growth and the nitrogen status of the plant-soil-system.
Grassland Science, 59, 183-195.
Chapter 4: Andruschkewitsch M., Wachendorf C., Sradnick A., Hensgen F., Joergensen
R.G., Wachendorf M. (2014): Soil substrate utilization pattern and relation of
functional evenness of plant groups and soil microbial community in five low
mountain NATURA 2000. Plant and Soil, 383, 275-289.
Chapter 5: Andruschkewitsch M., Wachendorf C., Buehle L., Joergensen R.G.,
Wachendorf M. Shifts of plant functional groups and soil microbial catabolic
diversity due to management changes in temperate extensive grasslands.
Applied Soil Ecology, submitted.
III
Table of contents
Preface...................................................................................................................................................... I
List of publications..................................................................................................................................II
Table of contents ................................................................................................................................... III
List of tables........................................................................................................................................... V
List of figures ......................................................................................................................................VIII
List of abbreviations.............................................................................................................................. XI
1 General introduction ............................................................................................................................ 1
2 Research objectives.............................................................................................................................. 6
3 Effects of digestates from different biogas production systems on above- and belowground grass
growth and the nitrogen status of the plant-soil-system.......................................................................... 8
3.1 Introduction.................................................................................................................................. 8
3.2 Material and Methods ................................................................................................................ 10
3.2.1 Experimental setup ............................................................................................................ 10
3.2.2 Soil and fertilizer characteristics........................................................................................ 11
3.2.3 Fertilizer application, sampling and measurement methods.............................................. 13
3.2.4 Statistical analysis.............................................................................................................. 14
3.3 Results and Discussion............................................................................................................... 15
3.3.1 Plant DM yield................................................................................................................... 15
3.3.2 Plant N status ..................................................................................................................... 18
3.3.3 Soil microbial biomass N (MBN)...................................................................................... 20
3.3.4 Soil N status....................................................................................................................... 21
3.3.5 Mineral N use efficiency (NUEmin) ................................................................................. 22
3.4 Conclusions................................................................................................................................ 25
4 Soil substrate utilization pattern and relation of functional evenness of plant groups and soil
microbial community in five low mountain NATURA 2000 grasslands.............................................. 27
4.1 Introduction................................................................................................................................ 27
4.2 Materials and methods ............................................................................................................... 30
4.2.1 Study sites.......................................................................................................................... 30
4.2.2 Estimation of plant functional group composition and plant sampling ............................. 32
4.2.3 Plant functional group evenness ........................................................................................ 33
4.2.4 Soil sampling and soil chemical analyses.......................................................................... 33

IV
4.2.5 Soil microbial substrate utilization pattern and evenness .................................................. 33
4.2.6 Statistical analyses ............................................................................................................. 34
4.3 Results........................................................................................................................................ 35
4.3.1 Basal respiration and substrate utilization patterns............................................................ 35
4.3.2 Plant functional group and soil microbial functional evenness ......................................... 39
4.3.3 Multiple stepwise regressions on soil microbial functional evenness ............................... 40
4.4 Discussion .................................................................................................................................. 42
4.4.1 Substrate utilization patterns of soil microbial community ............................................... 42
4.4.2 Evenness of plant functional groups and soil microbial substrate utilization pattern........ 43
4.5 Conclusions................................................................................................................................ 45
5 Shifts of plant functional groups and soil microbial catabolic diversity due to management changes
in temperate extensive grasslands of a lower mountain range .............................................................. 47
5.1 Introduction................................................................................................................................ 47
5.2 Material and Methods ................................................................................................................ 50
5.2.1 Study sites.......................................................................................................................... 50
5.2.2 Experimental setup and sampling ...................................................................................... 50
5.2.3 Soil microbial substrate utilization pattern ........................................................................ 53
5.2.4 Statistical analyses ............................................................................................................. 54
5.3 Results........................................................................................................................................ 55
5.3.1 Aboveground plant dry matter yield, functional group composition and diversity ........... 55
5.3.2 Soil chemical parameters, substrate utilization pattern and functional diversity............... 58
5.4 Discussion .................................................................................................................................. 64
5.4.1 Response of aboveground plant parameters to applied treatments .................................... 64
5.4.2 Response of microbial and abiotic soil parameters to applied treatments ......................... 65
5.5 Conclusions................................................................................................................................ 67
6 Synthesis and general conclusions..................................................................................................... 69
7 References.......................................................................................................................................... 72

V
List of tables
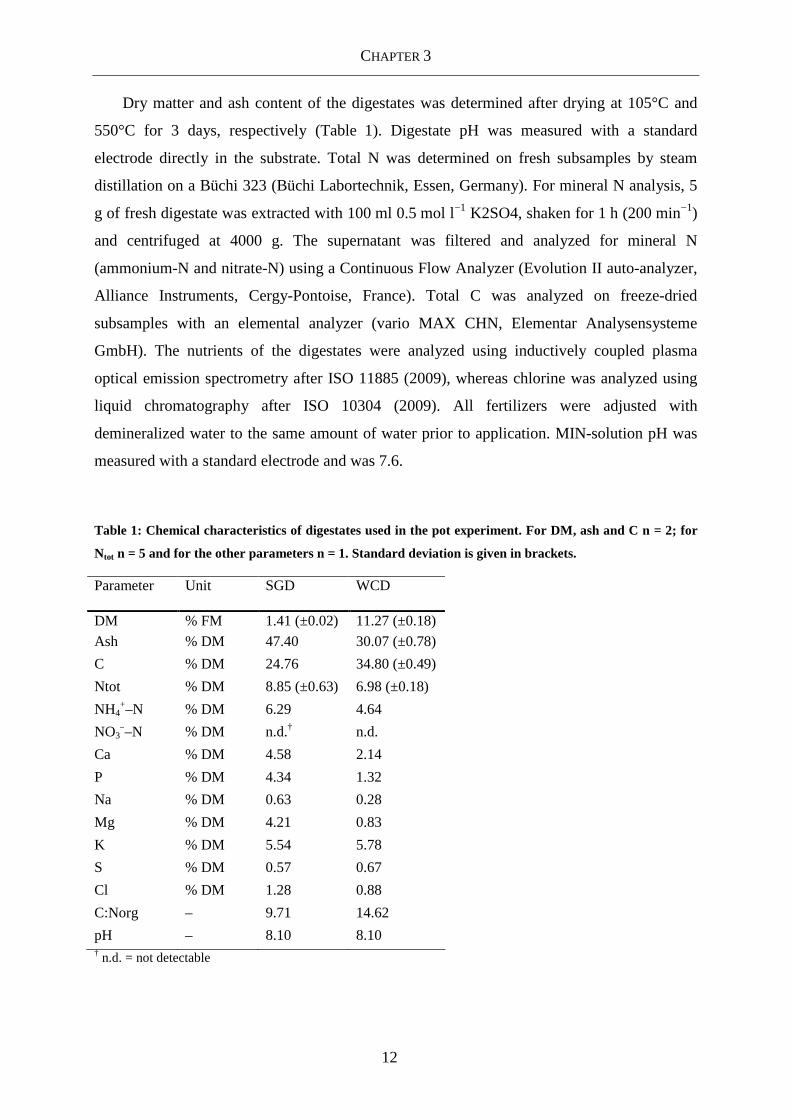
Table 1: Chemical characteristics of digestates used in the pot experiment. For DM, ash and C
n = 2; for Ntot n = 5 and for the other parameters n = 1. Standard deviation is given
in brackets.............................................................................................................. 12
Table 2: Applied amounts of fertilizer mineral and total nitrogen (Nmin, Ntot, respectively) and
carbon (Corg) (g m-2). ............................................................................................. 14
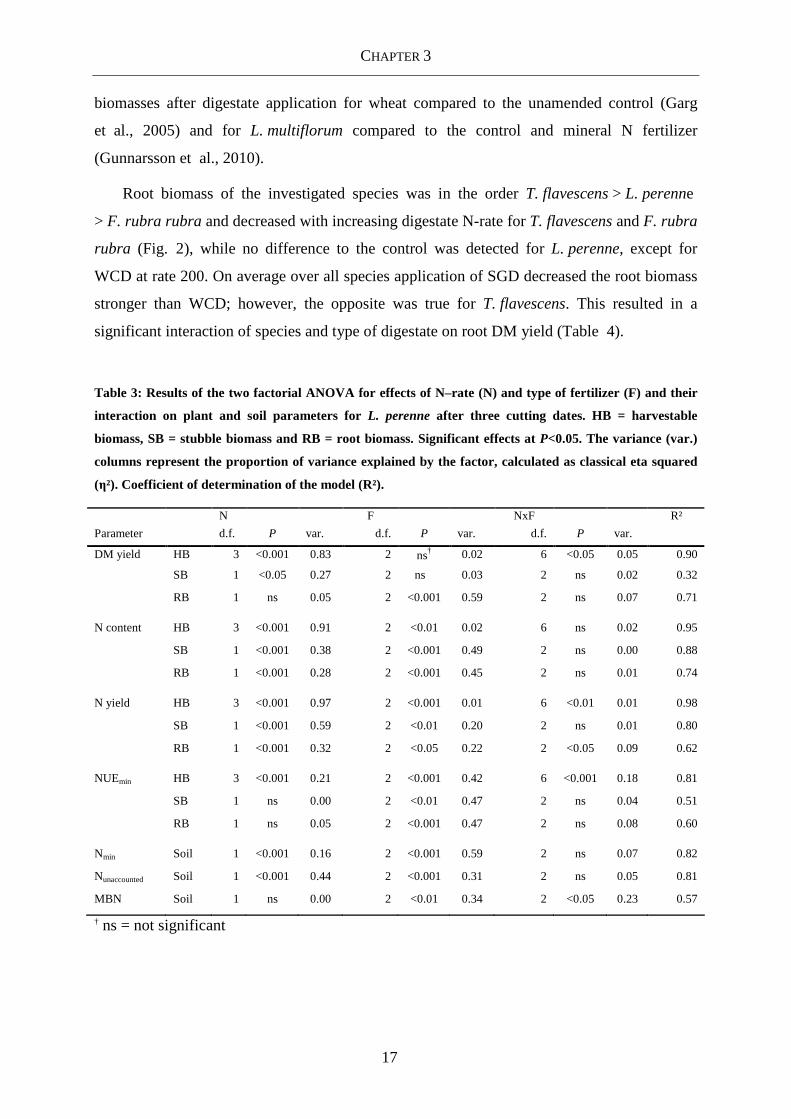
Table 3: Results of the two factorial ANOVA for effects of N–rate (N) and type of fertilizer
(F) and their interaction on plant and soil parameters for L. perenne after three
cutting dates. HB = harvestable biomass, SB = stubble biomass and RB = root
biomass. Significant effects at P<0.05. The variance (var.) columns represent the
proportion of variance explained by the factor, calculated as classical eta squared
(η²). Coefficient of determination of the model (R²).............................................17
Table 4: Results of the three factorial ANOVA for effects of N–rate (N), type of digestate (D),
species (S) (L. perenne, F. rubra rubra and T. flavescens) and their interactions on
plant and soil parameter after three cutting dates. HB = harvestable biomass, SB =
stubble biomass and RB = root biomass. Significant effects at P<0.05. The
variance (var.) columns represent the proportion of variance explained by the
factor, calculated as classical eta squared (η²). Coefficient of determination of the
model (R²). ............................................................................................................ 24
Table 5: Botanical characteristics and annual DM yields of the study sites. Arithmetic means
and standard deviations of the means (n=3). ......................................................... 31
Table 6: Soil characterization of the study sites from 0-10 cm depth. Arithmetic means and
standard deviations of the means, n=3. For texture parameters n=1..................... 32
Table 7: Pearson correlation coefficient between substrate utilization of individual substrates
and the discriminating canonical discriminate functions of the sites and of the
sampling dates to soil and plant parameters (n=313). Substrates are sorted by the
values of DF1 site discrimination. Pearson correlation coefficients r>50 are
written in bold. Substrate groups are abbreviated as follows carbohydrates CH,
carboxylic acids CA, amino acids AA and phenolic acid PA. .............................. 38

VI
Table 8: Coefficients of determination and parameter estimates for the multiple stepwise
regressions of Esoil and the soil and plant parameters (n=15) for each of the three
sampling dates. Beta coefficients (ß) are the standardized values of the parameter
estimates and indicate the relative importance in the model................................. 41
Table 9: Botanical characteristics and nutrient inputs of the H+N treatment at the study sites.
Arithmetic means and standard deviations of the means in brackets; H-N = harvest
without nutrient return (n=3), H+N = harvest with nutrient return via digestate
(n=3) and M = mulching (n=1). ............................................................................ 52
Table 10: Plant functional proportion of the DM yield and evenness index of plant functional
group diversity of the sites (I-V) for the treatments averaged over the sampling
dates. Standard deviations of the means are given in brackets; H-N = harvest
without nutrient return, H+N = harvest with nutrient return and M =mowing and
spreading chopped biomass. Summary of multilevel linear model analyses with
the treatments H–N and H+N................................................................................ 57
Table 11: Basal respiration and soil pH of the study sites from 0-10 cm depth for the three
treatments and averaged over the sampling dates. Arithmetic means and standard
deviations of the means; H-N = harvest without nutrient return, H+N = harvest
with nutrient return and M = mulching. Summary of ANOVA results with the
factors site (I-V), treatment (H–N and H+N) and sampling date (0, 14 and 56 days
after digestate application) and their interactions.................................................. 58
Table 12: Soil parameters SOC, TN and C/N assessed at sampling date 56 days after digestate
application from 0-10 cm depth for the three treatments. Arithmetic means and
standard deviations of the means; H-N = harvest without nutrient return, H+N =
harvest with nutrient return and M = mulching. Summary of ANOVA results with
the factors site (I-V), treatment (H–N and H+N) and sampling date (0, 14 and 56
days after digestate application) and their interactions. ........................................ 59
Table 13: Summary of MANOVA results for unstandardized substrate induced respiration
pattern (µg CO2-C g-1 h-1) of the 17 substrates with the factors site (I-V), treatment
(H-N and H+N) and sampling date (0, 14 and 56 days after digestate application)
and their interactions. ............................................................................................ 61

VII
Table 14: Discriminant function analysis of the substrate induced respiration pattern by the
treatments H-N and H+N separately for each grassland site (I-V) and sampling
dates (0, 14 and 56 days after digestate application)............................................. 61

VIII
List of figures
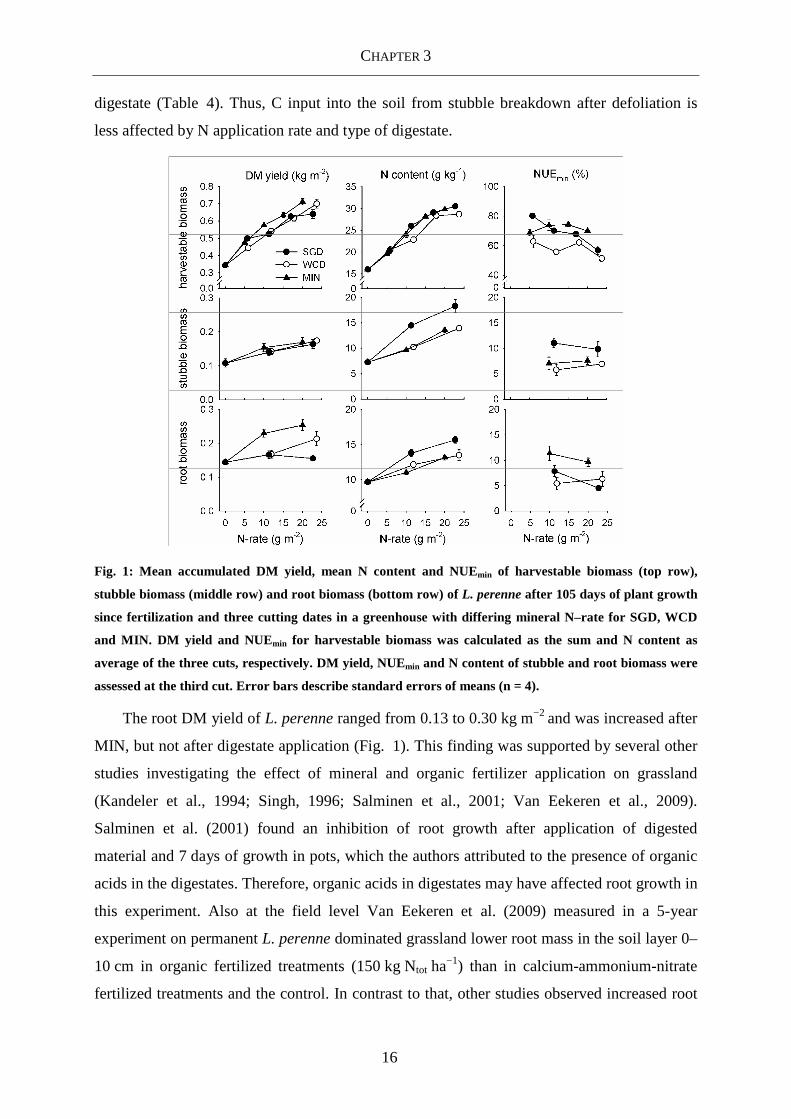
Fig. 1: Mean accumulated DM yield, mean N content and NUEmin of harvestable biomass (top
row), stubble biomass (middle row) and root biomass (bottom row) of L. perenne
after 105 days of plant growth since fertilization and three cutting dates in a
greenhouse with differing mineral N–rate for SGD, WCD and MIN. DM yield and
NUEmin for harvestable biomass was calculated as the sum and N content as
average of the three cuts, respectively. DM yield, NUEmin and N content of
stubble and root biomass were assessed at the third cut. Error bars describe
standard errors of means (n = 4)............................................................................ 16
Fig. 2: Mean DM yield, N content and NUEmin of harvestable biomass (top row), stubble
biomass (middle row) and root biomass (bottom row) of F. rubra rubra and T.
flavescens after 105 days of plant growth since fertilization and three cutting dates
in a greenhouse with differing mineral N–rate for SGD and WCD. DM yield and
NUEmin for harvestable biomass was calculated as the sum and N content as
average of the three cuts, respectively. DM yield, NUEmin and N content of
stubble and root biomass were assessed at the third cut. Error bars describe
standard errors of means (n = 3)............................................................................ 18
Fig. 3: Mean N yield of different plant fractions of L. perenne, T. flavescens and F. rubra
rubra grown in the greenhouse, mean soil Nmin and Nunaccounted, 105 days after a
nonrecurring application of SGD, WCD and MIN for the application rates 0, 10
and 20 g NH4+–N m–2. Harvestable biomass as the sum of the three cutting dates.
...............................................................................................................................19
Fig. 4: Boxplots of soil MBN under L. perenne (n = 4), T. flavescens (n = 3) and F. rubra
rubra (n = 3), 105 days after a nonrecurring application of SGD, WCD and MIN
(0, 10 and 20 g NH4+–N m–2). Bold lines represent median, boxes indicate
quartiles, and whiskers show minimum and maximum, n.a. = not applied. ......... 20
Fig. 5: Basal respiration rate (H2O) and individual standardized substrate respirations as
proportion of the total standardized substrate induced respiration and the substrate
group sums (n=5) for the five grassland sites over the sampling period. The
dashed line indicates the overall mean of the proportionate substrate respiration.
Error bars indicate standard deviations of the means............................................ 36

IX
Fig. 6: Discrimination function analysis (DFA) of catabolic response of soil communities to17
C-substrates for five different grassland sites (I-V, for detailed information see
table 5 and 6) run for a) site discrimination n=312 and b) sampling date
discrimination n=312. Significant Pearson correlation coefficients of soil and
plant parameter with the first two DFs are indicated and the direction of the
relation is visualised by the arrows. ...................................................................... 37
Fig. 7: Evenness indices of a) plant functional groups and b) soil substrate utilization patterns
of the sites (I-V) for the three sampling dates. Statistics of a) are given in the text.
For b) lower case letters indicate significant differences between the sites at the
same sampling, upper case letters indicate significant differences between the
sampling dates for each site (Tukey-test, P<0.05). Error bars indicate standard
deviations of the means (n=3). .............................................................................. 39
Fig. 8: Linear regressions for Eplant and Esoil for the three different sampling dates (n=15;
n=15; n=15). .......................................................................................................... 40
Fig. 9: Predictions of Esoil at the three different sampling dates for a) soil parameters and b)
the plant functional groups legumes and graminoids and DM yield identified from
the multiple stepwise regression models stated in table 4 (n=15) (forbs were
excluded from the models due to a strong negative inter-correlation with the
graminoids). For each parameter presented all the other variables in the model
were set to their mean value. ................................................................................. 41
Fig. 10: DM yields of five grassland sites and their means after harvest without nutrient return
(H-N), harvest with nutrient return (H+N) and mulching (M). ANOVA results of
the DM yields with the factors grassland site (I-V) and treatment (H-N and H+N).
Mulching (M) was not statistically evaluated. Error bars indicate standard
deviations of the means. ........................................................................................ 56
Fig. 11: Basal respiration rate (H2O) and individual standardized substrate utilization as
proportion of the total standardized substrate utilization and the substrate group
sums for the five grassland sites depending on the treatment summarized for the
entire sampling period. The dashed line indicates the overall mean of the
proportional substrate respiration. Error bars indicate standard deviations of the
means; H-N = harvest without nutrient return, H+N = harvest with nutrient return
and M = mulching. ................................................................................................ 60

X
Fig. 12: Pearson correlation coefficient between substrate utilization of individual substrates
and the significant discriminating canonical discriminate function (DF) 1 of the
treatments (H-N and H+N) identified by discriminant function analyses (DFAs;
see table 14). Negative correlation coefficients are associated with higher
substrate utilization for H-N, positive correlations with higher substrate utilization
for H+N. Asterisks indicate significant correlation............................................... 62
Fig. 13: The evenness indices of soil microbial functional diversity (Esoil) of five grassland
sites depending on treatment and sampling date and the mean values over all sites.
Error bars indicate standard deviations of the means. High evenness values
indicate little variation in catabolism of substrates, whereas low evenness values
indicate large variation in catabolism of substrates. Asterisks indicate significant
differences between harvest without nutrient return (H-N) and harvest with
nutrient return (H+N) within one sampling date identified by simple effects
ANOVAs. Mulching (M, dashed line) was not statistically evaluated. ................ 63

XI
List of abbreviations
a.s.l.: Above sea level
AA: Amino acid
ANOVA: Analysis of variance
ATP: Adenosine triphosphate
C: Carbon
C:Norg: Carbon to organic nitrogen ratio
C:Ntot: Carbon to total nitrogen ratio
CA: Carboxylic acid
CH: Carbohydrate
CLPP: Community level physiological profile
Corg: Organic carbon
DF: Discriminant function
DFA: Discriminant function analysis
DM: Dry matter
DON: Dissolved organic nitrogen
Eplant: Evenness of plant functional groups
Esoil: Evenness of soil microbial substrate utilization pattern
EU: European Union
FM: Fresh matter
H+N: Harvesting with nutrient application
H-N: Harvesting without nutrient application
IFBB: Integrated generation of solid fuel and biogas from biomass
M: Mulching
MBN: Soil microbial nitrogen

XII
MIN: Mineral N fertilizer
N: Nitrogen
Nmin: Mineral nitrogen
Ntot: Total nitrogen
NUEmin: Mineral nitrogen use efficiency
PA: Phenolic acid
SCI: Sites of Community Importance
SGD: Digestate from grass silage
SIR: Substrate induced respiration
SOC: Soil organic matter
SOM: Soil organic matter
TN: Total nitrogen
WCD: Whole crop digestate
WHC: Water holding capacity
WRB: World Reference Base for Soil Resources
η²: Classical eta squared

1 GENERAL INTRODUCTION
1
1 General introduction
This thesis is part of the project "PROGRASS - Securing the conservation of NATURA
grassland habitats with a distributed bioenergy production" (www.prograss.eu). The focus of
the project is placed on extensively managed conservation grassland habitats which are
incorporated in the NATURA 2000 program. These sites have been nominated by the
Member States of the European Union as "Sites of Community Importance" (SCI).
In many regions of European countries grassland ecosystems characterize the landscape
setting and provide an important contribution to fodder production, soil and water protection
and conservation of biodiversity (Schläpfer et al., 1999; Schüpbach et al., 2004; Wrage
et al., 2011). Beside these economic and environmental based ecosystem services, grassland
areas also offer non-material, cultural services for human society through recreational
opportunities and aesthetic experiences (Hopkins, 2009; Lindemann-Matthies et al., 2010).
Once, the agricultural grassland management was generally of low intensity, resulting in
habitats in which high biodiversity and biomass production were able to co-exist (Hopkins,
2009). Since the mid 20th century, extension and number of these semi-natural, species-rich
grassland areas in Europe declined steadily. (Isselstein et al., 2005; Poschlod et al., 2005;
Rösch et al., 2009; Beilin et al., 2014). This decrease is caused by the increasing conversion
of extensively managed “semi-improved” grassland into intensively managed “improved”
grassland accompanied by higher nitrogen fertilizer rates, stocking rates and defoliation
frequency (Isselstein et al., 2005). Furthermore, grassland areas are threatened by ploughing
up to arable land, afforestation and abandonment due to low profitability and increasing
irrelevance of green fodder in animal husbandry (Isselstein et al., 2005; Poschlod et al.,
2005; Rösch et al., 2009). The report by the Grasslands Trust (King, 2010) highlighted that
Europe’s semi-natural grasslands are still continuing to decline in extent and quality because
there is no coherent regulatory and support framework for protection at EU level.
To counteract this ever-increasing loss of species-rich conservation grassland, the
PROGRASS project has the main target to deliver a holistic and sustainable approach for
obtaining this grassland ecosystems based on a regular, agricultural extensive management
and bioenergetic utilization of grassland biomass. To prevent or repress the degradation and
loss of these areas a continuous implementation of the traditional management under which
the characteristic plant species composition was established is essential (Ellenberg and
Leuschner, 2010; Drobnik et al., 2011). Typical traditional managements practices of such
1 GENERAL INTRODUCTION
2
low yield grasslands were grazing by low stocking rates or mowing with a low cutting
frequency, partially accompanied by a low manure application rate (Isselstein et al., 2005).
Thereby, the first cutting of meadow grassland was often conducted late, which resulted in
low crude protein and high crude fibre concentration (White et al., 2004; De Cauwer et al.,
2005). This in turn leads to a low nutritional value for animal production (Elsässer, 2003).
Therefore, without compensation payments, the traditional management of conservation
grassland is usually not profitable (Strijker, 2005). But the regular removal of biomass
accompanied by delayed first date of utilization is essential to maintain the biodiverse
grassland community. It prevents the invasion of undesirable species and provides a sufficient
time period for seed production and reproduction of the characteristic flora and fauna
(Ellenberg and Leuschner, 2010). It should be noted that for hay meadow conservation, a
permanent grazing with livestock having low requirements of forage quality (e.g. sheep and
goats) would not be expedient due to the incompatibility of hoof trampling with many
grassland species (Ellenberg and Leuschner, 2010).
As an alternative to animal feeding, the grassland biomass can be used for bioenergy
production. However, despite high energy prices and subsidies for bioenergy, conventional
methods of bioenergy generation do not achieve an efficient utilization of grass silage or hay
(Rösch et al., 2009). The particular problems of using biomass from extensive managed
grasslands are mainly their high mineral contents, physiological age and heterogeneity. A
thermal utilization of hay is restricted by high mineral contents and nitrogen oxide emission
(Prochnow et al. 2009b), which lead to higher efforts in combustion technology and
treatments of exhaust gases (Elsässer, 2003). The biogas production from grass silage is
restricted by low methane yields (Prochnow et al., 2009a) caused by low protein and high
fibre contents. Therefore, Wachendorf et al. (2009) suggest a concept for energy production
of heterogeneous and senescent plant biomass within the PROGRASS project, in order to
provide a profitable bioenergy utilization of biodiverse semi-natural grasslands. The
“integrated generation of solid fuel and biogas from biomass” (IFBB) technique overcomes
the restrictions for energy production by generating two material pathways. After hydro-
thermal conditioning at 40°C, grass silage is separated with a screw press into a less digestible
and lignin-rich solid fraction used as solid fuel for combustion (Hensgen et al., 2012; Richter
et al., 2009; Wachendorf et al., 2009), and into an easily digestible liquid fraction used for
biogas production (Richter et al., 2010, 2011). A nutrient rich biogas residue remains from

1 GENERAL INTRODUCTION
3
the anaerobic digestion, which is hereinafter referred to as digestate. Digestate application can
serve to recycle the nutrients removed by the harvest to the grassland.
However, in terms of a closed nutrient cycle a nutrient recirculation in form of fertilizer
application to conservation grasslands, e.g. NATURA 2000 grasslands, poses problems for
nature conservation reasons. This is because of the strong relation of the nutrient status of a
grassland site and its species composition (Ellenberg and Leuschner, 2010). Semi-natural
grasslands often occur on infertile soils and their characteristic plant community composition
is sensitive to nutrient application (Čámská and Skálová, 2012). In order to ensure the desired
low nutrient status of biodiverse conservation grasslands, it is restricted or completely
prohibited by law to add nutrients by fertilizer application. Nevertheless, semi-natural
grassland ecosystems include a wide range of different habitats varying in pedologic and
climatic site conditions. Therefore the application rates for nitrogen which are tolerated by the
plant community vary from 4 to 60 kg N ha-1 a-1 (Briemle, 1997; Kirkham et al., 2008;
Čámská and Skálová, 2012; Samuil et al., 2013). The maintenance of some central European
Arrhenatherion meadows may even require an additional and regular application of nutrients
(Čámská and Skálová, 2012). The N amount returned to the grassland with the digestate
produced by the IFBB technique is only 19 to 60% of the N removed with the harvested
biomass. This is due to the fact that the N is partly transferred into the liquid phase for biogas
production (Hensgen et al., 2012) and to the fact that the N yields from these grasslands are
moderate to low. Therefore, the suggested IFBB concept seems to be a suitable approach to
maintain nutrient cycles and the plant community structure.
Furthermore, the IFBB digestate is a new product, which differs in its physical and
chemical properties from digestates from conventional biogas production systems originated
from the whole crop (whole crop digestates: WCDs). During the IFBB process main parts of
the fibrous components are reduced prior to the digestion process due to hydrothermal
condition and mechanical separation. By screw press separation, up to 80% of the carbon in
the original material can be transferred with the coarse particles (>1.5 mm) to the solid
fraction (Bühle, 2008). Correspondingly, the liquid fraction shows reduced dry matter (DM)
and carbon (C) contents. In general, dry matter content of the raw material is decomposed
during digestion processes and 7% dry matter content is a typical value for WCDs (Mokry
and Kluge, 2009). The IFBB digestate however shows values of about 2% dry matter content
resulting in improved rheological properties. This, in turn, may lead to a more accurate and
homogeneous application on the grassland, better runoff from the plant surface and faster

1 GENERAL INTRODUCTION
4
infiltration into the soil. Thereby, the improved rheological properties contribute to reduced
ammonia emission risks after digestate application (Gericke et al., 2007; Weiland, 2010) and
may reduce emission of volatile, odorous organic substances (Linke et al., 2006). In general
digestates provide an enhanced proportion of mineral N and lowered C:Ntot ratio in
comparison to its raw material, which leads to an increased short–term N availability to plants
(Merz and Trösch, 1989; Gutser et al., 2005; De Boer, 2008; Tambone et al., 2010). This
effect is likely to be further enhanced due to separation processes (Elsässer et al., 1995). To
date, several experiments have been conducted to investigate the effect of digestate
application on plants, highlighting a positive effect on yield production and N uptake (Garg
et al., 2005; De Boer, 2008; Möller et al., 2008; Terhoeven–Urselmans et al., 2009;
Gunnarsson et al., 2010). However, so far no study investigated the interaction of different
types of digestate (separated and un-separated), different N application rates and the growth
of different grassland species.
The soil microbial community as a major driver of most grassland ecosystem functions is
directly affected by digestate application. According to current knowledge, digestates increase
soil microbial biomass and activity after application on bare and planted soils (Ernst et al.,
2008; Odlare et al., 2008; Terhoeven–Urselmans et al., 2009; Bachmann et al., 2011).
Arthurson (2009) reviewed that the amount of metabolically active microorganisms increase
after digestate application compared to unfertilized soils due to the input of mineral nutrients
and organic material. In particular, the quantity and quality of carbon added to the soil with
digestates affect the microbial soil community metabolism (Ernst et al., 2008). The N
metabolism of soil microorganism was found to be affected by digestate application. Peters
and Jensen (2011) found in an incubation experiment a significant negative correlation
between net N mineralization and C:Norg ratio of solid fractions from animal slurry separation.
Furthermore, soil microorganisms may compete with plants for N (Bardgett et al., 1999;
Geisseler et al., 2010) and the N immobilization process is likewise related to the amount and
decomposability of C for the microorganisms (Geisseler et al., 2010), and thus may be
influenced by digestate composition. Therefore, it might be expected that, because of its
reduced C content, the IFBB digestate differs in the effects on soil microbial organisms and
their functioning compared to the C richer conventional whole crop digestates.
Beside the direct digestate effects, soil microbial community might be indirectly
influenced by changes in plant mediated C dynamics (Bardgett et al., 1999; Dijkstra et al.,
2006; Millard and Singh, 2010). Increased plant biomass after digestate application is likely

1 GENERAL INTRODUCTION
5
to influence the soil microbial community considerably by increasing the supply of plant C to
the soil with litter, root biomass and root exudation. The root exudates of young seedlings,
exuding about 30-40% of their fixed carbon as root exudates, are identified as high quality
nutrient source for microorganisms (Whipps, 1990). Furthermore, digestate application
induced changes in plant composition and plant species dominance are likely to exert strong
selective pressure on the soil microbial community through plant-specific differences in
pattern of the root exudation into the rhizosphere (Badri and Vivanco, 2009). The
aboveground diversity of plant species and plant functional groups (e.g. graminoids, forbs,
legumes) was thereby identified as important factor governing the soil microbial diversity
(Loranger-Merciris et al., 2006; Millard and Singh, 2010) and the ecosystem functions
performed by the microbial community (Zak et al., 2003). Beside the species diversity of soil
microbial community its functional diversity represents a part of the overall microbial
diversity in soil, but with more practical and ecological relevance (Zak et al., 1994).
However, the microbial functional diversity includes a vast range of soil microbial activities
including nutrient transformation, decomposition, suppressing and modification of soil
physical processes (Giller et al., 1997; Wardle et al., 1999), which are hard to measure in
their full extent. A subset of the microbial functional diversity can be characterized by
measurement of the decomposition functions performed by heterotrophic microorgansims. An
in-situ approach to measuring this, is the examination of the ability of the microbial
community to utilize a number of different C substrates (Campbell et al., 1997; Degens and
Harris, 1997). Generally, it is suggested that a functional diverse microbial community is
more resistant to stress or disturbance (Degens et al., 2001). In consideration of the supposed
mutual influence of plants and soil microbial community, it is important to increase the
knowledge of the effects of digestates on both ecosystem components to assess the
consequences of digestate application for the ecosystem services. For example a digestate
induced reduction in phytodiversity might result in a reduced functional capacity of the soil
microbial community.

2 RESEARCH OBJECTIVES
6
2 Research objectives
A better understanding of the digestate effects on plant community, soil microbial
community as well as nutrient and carbon dynamics is crucial for a sustainable grassland
management and the prevention of species and functional diversity loss. The IFBB digestate
represents a new type of organic fertilizer, which differs in its composition from conventional
digestates originating from whole crop digestion. So far, no information is available on its
effects after application on grassland ecosystems. Therefore, the aim of this thesis is to fill
gaps in the understanding of the effects of the IFBB digestate on grassland plants and soil
microbial community, taking into account the mutual influence of both of these biotic
ecosystem components. Two experimental studies were carried out that culminated in three
scientific manuscripts.
In the first study (Chapter 3), the short-term (intra-seasonal) effects of the IFBB
digestate on the growth of different grass species, plant N uptake and the N status of the plant-
soil-system including soil microorganisms were investigated for the first time in a 5-month
pot experiment under controlled conditions in a greenhouse. To assess the fertilizer value of
the IFBB digestate, two additional fertilizer types were included in the study as comparative
variants: a conventional whole crop digestate (WCD) and a mineral N fertilizer (MIN). The
first study was focussed on nitrogen because of its considerable importance for plant and soil
microorganisms and to understand how the variation in IFBB digestate composition, resulting
from the separation process, influences the N dynamic to prevent losses to the environment
and to ensure an efficient N use in grassland management.
The second study took place under natural conditions at five different German NATURA
2000 grasslands (meadows) and addressed firstly (Chapter 4) the general relationship of soil
microbial substrate metabolism and the plant community (plant functional groups:
graminoides, forbs and legumes) and secondly (Chapter 5) the long-term effects of three
years of IFBB digestate application on plant functional groups, plant functional group
diversity, soil microbial substrate metabolism and catabolic diversity of the grassland
systems. The overall aim of the study was to assess the consequences of IFBB-concept
implementation on extensive grasslands compared to traditional management (mowing and
harvesting) and mulching. The purpose of the scientific manuscript described in Chapter 4
was to investigate the above- and belowground interaction under undisturbed conditions

2 RESEARCH OBJECTIVES
7
(without digestate application) initially, to serve as a base for the coming investigations of
digestate effects on the five NATURA 2000 grasslands in Chapter 5.
The specific objectives of the studies were:
(i) to investigate the suitability of the IFBB digestate as a fertilizer and to examine
digestate effects on grass species and soil microbial community, especially focussing on
nitrogen dynamic in the plant-soil system (Chapter 3). It was expected that, because of
its lower DM and C content, the IFBB digestate has different effects on plant growth
and soil microbial organisms compared to a conventional whole crop digestate.
(ii) to investigate the relationship between plant community and functionality of soil
microbial community of extensively managed meadows, taking into account temporal
variations during the vegetation period and abiotic soil conditions (Chapter 4). Plant
community was represented by three plant functional groups: graminoides, forbs and
legumes. The soil microbial functional diversity was determined by the catabolic
response to different carbon substrates.
(iii) to investigate the suitability of IFBB-concept implementation as grassland conservation
measure for meadows and possible associated effects of IFBB digestate application on
plant and soil microbial community as well as soil microbial catabolic substrate
utilization (Chapter 5). As comparative meadow conservation measure a control variant
without digestate application and a mulch variant (mowing without biomass removal)
was implemented in the study.

CHAPTER 3
8
3 Effects of digestates from different biogas production systems
on above- and belowground grass growth and the nitrogen
status of the plant-soil-system
Abstract Biogas production from residual biomass (e.g. from extensively managed
grassland) can help securing ecosystem services of such vegetation and may contribute to
energy production from renewable resources. Proper management of fermentation residues is
a major challenge within the technical concepts recently suggested for the conversion of this
biomass. A 5-month pot experiment was conducted to investigate the effects of digestates
from separated grass silage (liquid fraction) (SGD), produced within the innovative integrated
generation of solid fuel and biogas from biomass (IFBB) system and from conventional whole
crop digestion (WCD) on grass growth, N uptake and N immobilization. Digestates and a
mineral N fertilizer (MIN) as comparative variant were applied at N-rates from 0 up to
20 g Nm−2 based on fertilizer mineral N to three different grass species (Lolium perenne,
Trisetum flavescens and Festuca rubra subsp. rubra). Digestate application increased
harvestable biomass constantly with increasing N-rate for L. perenne, but not for Trisetum
flavescens and F. rubra subsp. rubra. Type of digestate caused species-specific differences in
plant growth, as F. rubra rubra and L. perenne showed higher dry matter (DM) yields of
harvestable and root biomass for WCD and T. flavescens for SGD application. However, for
both digestates, reduced root biomasses were observed compared to the control. The mineral
nitrogen use efficiency (NUEmin) was over all species 22% higher for harvestable and 33% for
stubble biomass after application of SGD compared to WCD, due to greater N uptake related
to lower gaseous N losses and favourable mineralization properties. N immobilization
measured by soil microbial biomass N (MBN) was influenced by grass species but not by
type of digestate or application rate. The lack of effect of digestate application on MBN was
attributed to the compensation of the digestate C input by the reduced root biomass
production.
3.1 Introduction
The anaerobic digestion process leaves a nutrient-rich fermentation residue (hereafter
referred to as digestate), which is usable as organic fertilizer in agriculture. In order to realize
the European goal of renewable energy sources covering 20% of the European energy
demands by the year 2020 and keeping the competition between food and energy production

CHAPTER 3
9
from biomass as small as possible, it will be necessary to also use bio waste and landscape
conservation material (e.g. municipal green cut, extensive grassland biomass) for bio energy
production (Zah et al., 2007). However, such materials are associated with undesirable
characteristics for biogas production (e.g. high lignification) (Prochnow et al., 2009a).
To overcome these restrictions, a concept for energy production from heterogeneous and
senescent plant biomass was suggested by Wachendorf et al. (2009). Within this integrated
generation of solid fuel and biogas from biomass (IFBB) system the grass silage is separated
with a screw press prior to anaerobic digestion into a less digestible and lignin-rich solid
fraction used as solid fuel for combustion (Richter et al., 2009; Wachendorf et al., 2009;
Hensgen et al., 2012) and an easily digestible liquid fraction used for biogas production
(Richter et al., 2010, 2011). By screw press separation up to 80% C of the original material
can be transferred with the coarse particles (>1.5 mm) to the solid fraction (Bühle, 2008) and
the liquid fraction shows reduced dry matter (DM), carbon (C) contents and C:Ntot ratios.
Therefore, digestates from separated grass silage (liquid fraction) (SGDs) vary in their
physical and chemical composition from conventional whole crop digestates (WCDs) in
which the plant material is fermented without being separated previously.
Liquid fractions are also produced in the separation of digestates from whole crop
digestion following the digestion process, which is a common method to improve fertilizer
properties (Möller and Müller, 2012) further to digestion. The enhanced proportion of mineral
N and lowered C:Ntot ratio of digestates, in comparison to its raw material, leads to an
increased short-term N availability to plants (Merz and Trösch, 1989; Gutser et al., 2005;
De Boer, 2008; Tambone et al., 2010). This effect is likely to be further enhanced due to
digestate separation (Elsässer et al., 1995). To date, several experiments have been conducted
to investigate the effect of digestate application on plants, highlighting a positive effect on
yield production and N uptake (Garg et al., 2005; De Boer, 2008; Möller et al., 2008;
Terhoeven–Urselmans et al., 2009; Gunnarsson et al., 2010). So far, however, none of these
studies investigated the interaction of different types of digestate (separated and unseparated),
N application rates and plant species.
N-mineralization processes of digestate organic bound N in soil and thus the supply of
mineral N for the plant are influenced by digestate composition (e.g. DM content, particle size
distribution, C content, NH4+–N content, C:N ratio of the organic matter (C:Norg)) and soil
parameters (e.g. soil type, pH value, temperature and water content) (Merz and Trösch, 1989;
Gutser et al., 2005; Fangueiro et al., 2010). For example, Peters and Jensen (2011) found a

CHAPTER 3
10
strong negative correlation between net N mineralization and C:Norg ratio of solid fractions
from animal slurry separation in an incubation experiment. Furthermore, soil microorganisms
may compete with plants for soil N (Bardgett et al., 1999; Geisseler et al., 2010) and the
nitrogen immobilization process is likewise related to the amount and decomposability of C
for the microorganisms (Geisseler et al., 2010), and may thus be influenced by digestate
composition. According to the current knowledge, digestates increase soil microbial biomass
and activity in planted and bare soils (Ernst et al., 2008; Odlare et al., 2008; Terhoeven–
Urselmans et al., 2009; Bachmann et al., 2011) indicating an overall positive effect on the
soil microbial community.
Given the rapidly increasing number of biogas plants and amounts of digestates
produced, it is important to understand how the variation in digestate composition, resulting
from the separation process, influences plant growth, soil microbial biomass and N dynamic
to prevent losses to the environment and to ensure an efficient N use in grassland
management. Consequently, an experiment was conducted to investigate the effects of an
untreated conventional whole crop digestate and a digestate from separated grass silage
(liquid fraction) generated within the IFBB system at different N application rates on the
above- and belowground grass growth of different grass species, plant N uptake and on the
N status of the plant-soil-system including soil microorganisms.
3.2 Material and Methods
3.2.1 Experimental setup
A 5-month pot experiment with standardized Kick-Brauckmann pots (diameter 21 cm,
surface area 346 cm², height 25.5 cm) and a fully randomized design was conducted. The pots
were filled with on average 8.9 kg soil DM with a bulk density of 1.15 g cm−3 and a
gravimetric water content of 11%. Perennial ryegrass (Lolium perenne L., cv. Aberavon), a
major grass species of intensively managed grassland, was sown and three types of fertilizer
were applied once: a digestate from separated grass silage (liquid fraction) (SGD), a digestate
from whole crop digestion (WCD) and calcium ammonium nitrate as mineral N fertilizer
(MIN) at five N-rates based on the mineral N content: 0, 5, 10, 15 and 20 (g m−2) with four
replications. Creeping red fescue (Festuca rubra subsp. rubra L., cv. Condor) and yellow
oatgrass (Trisetum flavescens (L.) P.B., cv. Trisett 51) frequently occur in unimproved
grasslands of most of the European mountain areas, for which the IFBB system was
developed. Therefore, simultaneously to L. perenne these species were sown and the two
CHAPTER 3
11
types of digestate SGD and WCD were applied once at three N-rates based on the mineral
N content: 0, 10, and 20 (g m−2) with three replications. The application rates were performed
with equal amounts of mineral N in order to exclude the fertilizer short-term effect produced
by different mineral N amounts in the digestates. For all grass species the harvestable biomass
was assessed at three consecutive cutting dates. Stubble biomass and root biomass were
assessed at the third cut for the N-rates 0, 10 and 20. Seeds were sown manually on the soil
surface at a rate of 0.42 g per pot for L. perenne and at a rate of 0.28 g per pot for F. rubra
rubra and T. flavescens, equivalent to 120 kg ha−1 and 80 kg ha−1. The pots were watered
biweekly up to 80% of maximum water holding capacity. The position of the pots in the
greenhouse was changed weekly. The average temperature in the greenhouse during the
experiment was 20.3°C (±4.5), with the average temperature at day and night-time being
22.9°C (±4.2) and 17.7°C (±3.1), respectively.
3.2.2 Soil and fertilizer characteristics
The soil for the pot experiment was an arable soil (Cambisol) from a field near
Witzenhausen, Germany, which is used for grass seed cultivation and was collected from
5-20 cm depth. The top 5 cm was previously removed by a tractor bucket, to minimize
remaining plant material in the soil. The soil was sieved at 5 mm by a drum sieve (Scheppach
rs 400, rpm 45) and had the following characteristics: particle size distribution: 74% sand,
19.5% silt, 6.6% clay; pH (CaCl2): 6.1; P: 7 mg 100 g−1 soil (CAL); K: 19 mg 100 g−1 soil
(CAL); Mg 9 mg 100 g−1 soil (CaCl2). The nutrients P, K and Mg were analyzed according to
Hoffmann (1991). Organic C and Ntot were determined on dried subsamples (60°C) with an
elemental analyzer (vario MAX CHN, Elementar Analysensysteme GmbH, Hanau, Germany)
and were 9.06 g kg−1 and 0.76 g kg−1, respectively.
The WCD originated from a continuously stirred reactor, which was fed with 47% maize
silage, 28% cow dung, 9% grass silage, 9% poultry dung and 7% barley groats. The SGD
originated from the IFBB-demonstration plant, which was run with the liquid fraction of grass
silage from semi-natural grassland, separated by screw press (perforation of 1.5 mm), and a
rest amount (<5%) of separated digestate (pork manure, maize silage), used as inoculum.
WCD and SGD were homogenized with a masher (MF-MFAP 2000, Dynamic, Kehl,
Germany, rpm 3000–9000) prior to application and analyzing. Calcium-ammonium-nitrate
was used as mineral N fertilizer (MIN).
CHAPTER 3
12
Dry matter and ash content of the digestates was determined after drying at 105°C and
550°C for 3 days, respectively (Table 1). Digestate pH was measured with a standard
electrode directly in the substrate. Total N was determined on fresh subsamples by steam
distillation on a Büchi 323 (Büchi Labortechnik, Essen, Germany). For mineral N analysis, 5
g of fresh digestate was extracted with 100 ml 0.5 mol l−1 K2SO4, shaken for 1 h (200 min−1)
and centrifuged at 4000 g. The supernatant was filtered and analyzed for mineral N
(ammonium-N and nitrate-N) using a Continuous Flow Analyzer (Evolution II auto-analyzer,
Alliance Instruments, Cergy-Pontoise, France). Total C was analyzed on freeze-dried
subsamples with an elemental analyzer (vario MAX CHN, Elementar Analysensysteme
GmbH). The nutrients of the digestates were analyzed using inductively coupled plasma
optical emission spectrometry after ISO 11885 (2009), whereas chlorine was analyzed using
liquid chromatography after ISO 10304 (2009). All fertilizers were adjusted with
demineralized water to the same amount of water prior to application. MIN-solution pH was
measured with a standard electrode and was 7.6.
Table 1: Chemical characteristics of digestates used in the pot experiment. For DM, ash and C n = 2; for
Ntot n = 5 and for the other parameters n = 1. Standard deviation is given in brackets.
Parameter Unit SGD WCD
DM % FM 1.41 (±0.02) 11.27 (±0.18)
Ash % DM 47.40 30.07 (±0.78)
C % DM 24.76 34.80 (±0.49)
Ntot % DM 8.85 (±0.63) 6.98 (±0.18)
NH4+–N % DM 6.29 4.64
NO3––N % DM n.d.† n.d.
Ca % DM 4.58 2.14
P % DM 4.34 1.32
Na % DM 0.63 0.28
Mg % DM 4.21 0.83
K % DM 5.54 5.78
S % DM 0.57 0.67
Cl % DM 1.28 0.88
C:Norg – 9.71 14.62
pH – 8.10 8.10 † n.d. = not detectable

CHAPTER 3
13
3.2.3 Fertilizer application, sampling and measurement methods
After 40 days of growth and two initial cuts to initiate tillering and reduce the growth of
weeds, the fertilizers were applied once to the soil surface. Due to the heterogeneity of
digestates, the variation of the mineral N-rates ranged between ± 13% and 19% and was on
average ± 16% of the target application rate (Table 2). The cutting dates were 68, 103 and
145 days after sowing. Harvestable biomass was cut at 3 cm height and stubble biomass was
separated from the root biomass by cutting exactly at the growth centre. At the final harvest
date, root samples were separated from soil samples by collecting with tweezers and washing
over sieves (1 mm) with water. Soil samples were sieved (2 mm) and were partly used
directly to determine Nmin content while the rest was stored at 4°C for further measurements.
Dry matter yield (DM) of plant fractions (harvestable biomass, stubble biomass and root
biomass) was measured after drying for 3 days at 60°C. Total C and total N were analyzed
using an elemental analyzer (vario MAX CHN, Elementar Analysensysteme GmbH).
The apparent mineral nitrogen use efficiency (NUEmin) refers to the mineral N part in the
fertilizer. It was calculated according to the difference method based on Gunnarsson et al.
(2010):
100xFN
PFN PFN(%)NUE edunfertilizfertilized
min
−= (Equ. 1)
where PFNfertilized = amount of N taken up by the fertilized plant fraction,
PFNunfertilized = amount of N taken up by the unfertilized plant fraction, FN = amount of
mineral N applied with fertilizer. This method is based on the assumption that the N supply
by fertilizer does not affect the mineralization of soil organic matter.
For soil Nmin estimation, 100 g fresh soil was extracted with 400 ml CaCl2 within 2 days after
sampling. Ammonium-N and nitrate-N in the extracts were measured with a continuous flow
analyzer (Evolution II auto–analyzer, Alliance Instruments). The net mineral N amount,
which was not recovered (Nunaccounted) in the fertilized plant-soil-systems after the third cutting
date was calculated as:
FN)PN(Nmin)PN(Nmin)m(gN edunfertilizedunfertilizfertilizedfertilized2
dunaccounte ++−+=− (Equ. 2)
where Nminfertilized = mineral N in fertilized soil, Nminunfertilized = mineral N in unfertilized
soil, PNfertilized = N taken up by the fertilized plant (total harvestable, stubble and root
biomass), PNunfertilized = N taken up by the unfertilized plant. The calculated net Nunaccounted
indicates net N loss via immobilization and gaseous N emissions (negative values) or net N

CHAPTER 3
14
surplus via mineralization (positive values). This equation is based on the assumption, that
plant uptake of dissolved organic N (DON) is negligible compared to plant uptake of mineral
N.
For the microbial biomass N (MBN) estimation, first a pre-extraction of the soil was
made to minimize the soil Nmin content (Widmer et al., 1989). Briefly, 25 g fresh soil was
pre-extracted with 70 mL 0.05 mol l−1 K2SO4 by 30 min horizontal shaking at 200 rpm and
centrifuging at 2000 g. Then MBN was estimated by fumigation-extraction from two portions
equivalent to 10 g of the pre-extracted soil. One portion was fumigated for 24 h at room
temperature with chloroform. The soil portions were extracted with 40 ml 0.5 mol l−1 K2SO4
by horizontal shaking for 30 min and filtering. Extractable Ntot was measured after
combustion at 850°C using a Dimatec 100 automatic analyzer (Dimatec, Essen, Germany).
Microbial biomass N (MBN) was calculated as:
EN
1-
k
EN)kg(mgMBN = (Equ. 3)
where EN = total N extracted from fumigated soil – total N extracted from non-fumigated soil
and kEN = 0.54 (Joergensen and Mueller, 1996).
Table 2: Applied amounts of fertilizer mineral and total nitrogen (Nmin, Ntot, respectively) and carbon
(Corg) (g m-2).
SGD WCD MIN
N-rate Nmin Ntot Corg Nmin Ntot Corg Nmin Ntot Corg
5 5.7 8.0 22.4 5.9 8.9 44.2 5.0 5.0 0
10 11.3 16.0 44.7 11.9 17.9 89.5 10.0 10.0 0
15 17.0 24.0 67.1 17.8 26.8 133.7 15.0 15.0 0
20 22.7 31.9 89.5 23.7 35.7 177.9 20.0 20.0 0
MIN, mineral N fertilizer; SGD, separated grass silage digestate; WCD, whole crop digestate.
3.2.4 Statistical analysis
To reveal the effects of the digestates, the mineral N fertilizer and N-rate on the plant and
soil parameters for L. perenne analyses of variance (ANOVAs) with a two factorial design
were conducted with type of fertilizer (SGD, WCD, MIN) and N-rate (5, 10, 15, 20 for
harvestable biomass and 10, 20 for stubble biomass and root biomass) as factors. To reveal

CHAPTER 3
15
the effects of the digestates, N-rate and grass species on plant and soil parameters, ANOVAs
with a three factorial design were conducted with type of digestate (SGD, WCD), N-rate (10,
20) and species (L. perenne, F. rubra rubra and T. flavescens) as factors. Effect sizes were
determined by the classical eta squared (η²), which is defined as the proportion of variation
attributable to each factor. Contrasts were defined to examine performance of main factors in
specific comparisons. In order to assess the effect of N-rates in comparison with the control,
contrasts were conducted. The statistical analyses were performed using R 2.14.1
(R Development Core Team, 2011). Level of significance was set to 0.05.
3.3 Results and Discussion
3.3.1 Plant DM yield
Dry matter yield of the harvestable biomass of L. perenne was mainly influenced by
fertilizer N-rate (Table 3) and increased from 0.32 in the unfertilized control up to
0.76 kg m−2 of the highest N-rate applied (Fig. 1). On average no difference was found
between MIN and the digestates. These results are in line with results from a pot experiment
of Gunnarsson et al. (2010), in which no significant differences in the aboveground biomass
of L. multiflorum were measured after digestate and mineral N fertilizer application based on
the NH4+–N content. DM yields of the harvestable biomass of T. flavescens and F. rubra
rubra ranged from 0.21 to 0.51 and from 0.29 to 0.52 kg m−2, respectively (Fig. 2). Lolium
perenne, which is cultivated in intensively managed grassland with high N application rates,
produced increasing DM yields with increasing digestate N-rate up to the highest rate, while
the increase in DM yield was less pronounced for T. flavescens and a decrease was observed
for F. rubra rubra, which are both species cultivated in extensively managed grassland with
lower N application rates. Consequently, the grass species explained most of the variation of
harvestable biomass (Table 4) after digestate application and the average DM yield was in the
order L. perenne > T. flavescens > F. rubra rubra. Despite the strong grass species effect,
however, the type of digestate influenced the DM yield, as F. rubra rubra and L. perenne
showed higher values for WCD and T. flavescens for SGD. Probably, the hairy species
T. flavescens was more affected by aboveground tissue injury due to the poorer flow
properties of WCD (e.g. larger particle sizes), which also may have affected the root growth
of T. flavescens (see below).
Al though harvestable biomass increased with increasing N-rate, DM yield of stubble
biomass of the grass species only changed slightly (Fig. 1, 2) and was not affected by type of
CHAPTER 3
16
digestate (Table 4). Thus, C input into the soil from stubble breakdown after defoliation is
less affected by N application rate and type of digestate.
Fig. 1: Mean accumulated DM yield, mean N content and NUEmin of harvestable biomass (top row),
stubble biomass (middle row) and root biomass (bottom row) of L. perenne after 105 days of plant growth
since fertilization and three cutting dates in a greenhouse with differing mineral N–rate for SGD, WCD
and MIN. DM yield and NUEmin for harvestable biomass was calculated as the sum and N content as
average of the three cuts, respectively. DM yield, NUEmin and N content of stubble and root biomass were
assessed at the third cut. Error bars describe standard errors of means (n = 4).
The root DM yield of L. perenne ranged from 0.13 to 0.30 kg m−2 and was increased after
MIN, but not after digestate application (Fig. 1). This finding was supported by several other
studies investigating the effect of mineral and organic fertilizer application on grassland
(Kandeler et al., 1994; Singh, 1996; Salminen et al., 2001; Van Eekeren et al., 2009).
Salminen et al. (2001) found an inhibition of root growth after application of digested
material and 7 days of growth in pots, which the authors attributed to the presence of organic
acids in the digestates. Therefore, organic acids in digestates may have affected root growth in
this experiment. Also at the field level Van Eekeren et al. (2009) measured in a 5-year
experiment on permanent L. perenne dominated grassland lower root mass in the soil layer 0–
10 cm in organic fertilized treatments (150 kg Ntot ha−1) than in calcium-ammonium-nitrate
fertilized treatments and the control. In contrast to that, other studies observed increased root
CHAPTER 3
17
biomasses after digestate application for wheat compared to the unamended control (Garg
et al., 2005) and for L. multiflorum compared to the control and mineral N fertilizer
(Gunnarsson et al., 2010).
Root biomass of the investigated species was in the order T. flavescens > L. perenne
> F. rubra rubra and decreased with increasing digestate N-rate for T. flavescens and F. rubra
rubra (Fig. 2), while no difference to the control was detected for L. perenne, except for
WCD at rate 200. On average over all species application of SGD decreased the root biomass
stronger than WCD; however, the opposite was true for T. flavescens. This resulted in a
significant interaction of species and type of digestate on root DM yield (Table 4).
Table 3: Results of the two factorial ANOVA for effects of N–rate (N) and type of fertilizer (F) and their
interaction on plant and soil parameters for L. perenne after three cutting dates. HB = harvestable
biomass, SB = stubble biomass and RB = root biomass. Significant effects at P<0.05. The variance (var.)
columns represent the proportion of variance explained by the factor, calculated as classical eta squared
(η²). Coefficient of determination of the model (R²).
N F NxF R²
Parameter d.f. P var. d.f. P var. d.f. P var.
DM yield HB 3 <0.001 0.83 2 ns† 0.02 6 <0.05 0.05 0.90
SB 1 <0.05 0.27 2 ns 0.03 2 ns 0.02 0.32
RB 1 ns 0.05 2 <0.001 0.59 2 ns 0.07 0.71
N content HB 3 <0.001 0.91 2 <0.01 0.02 6 ns 0.02 0.95
SB 1 <0.001 0.38 2 <0.001 0.49 2 ns 0.00 0.88
RB 1 <0.001 0.28 2 <0.001 0.45 2 ns 0.01 0.74
N yield HB 3 <0.001 0.97 2 <0.001 0.01 6 <0.01 0.01 0.98
SB 1 <0.001 0.59 2 <0.01 0.20 2 ns 0.01 0.80
RB 1 <0.001 0.32 2 <0.05 0.22 2 <0.05 0.09 0.62
NUEmin HB 3 <0.001 0.21 2 <0.001 0.42 6 <0.001 0.18 0.81
SB 1 ns 0.00 2 <0.01 0.47 2 ns 0.04 0.51
RB 1 ns 0.05 2 <0.001 0.47 2 ns 0.08 0.60
Nmin Soil 1 <0.001 0.16 2 <0.001 0.59 2 ns 0.07 0.82
Nunaccounted Soil 1 <0.001 0.44 2 <0.001 0.31 2 ns 0.05 0.81
MBN Soil 1 ns 0.00 2 <0.01 0.34 2 <0.05 0.23 0.57
† ns = not significant

CHAPTER 3
18
Fig. 2: Mean DM yield, N content and NUEmin of harvestable biomass (top row), stubble biomass (middle
row) and root biomass (bottom row) of F. rubra rubra and T. flavescens after 105 days of plant growth
since fertilization and three cutting dates in a greenhouse with differing mineral N–rate for SGD and
WCD. DM yield and NUEmin for harvestable biomass was calculated as the sum and N content as
average of the three cuts, respectively. DM yield, NUEmin and N content of stubble and root biomass were
assessed at the third cut. Error bars describe standard errors of means (n = 3).
3.3.2 Plant N status
The N contents and N yields of L. perenne were mainly influenced by fertilizer N-rate
(Table 3) and increased with increasing N-rate for all plant fractions (Fig. 1). For harvestable
biomass, the N contents and N yields ranged from 15.6 up to 31.7 g kg−1 DM and from 5.05
up to 19.9 g N m−2 (Fig. 1, 3), respectively. On average, SGD showed the highest N contents
and N yields for all plant fractions. Differences were significant for the N content of stubble
biomass, N content of root biomass and N yield of stubble biomass only. The N yield of root
biomass showed on average significantly higher values for MIN (Fig. 3), which is consistent
with the higher DM yield of root biomass in the MIN treatment.
Considering all investigated species, N content and N yield of all plant fractions was
mainly affected by N-rate and grass species and to a lesser extent by the applied type of
digestate (Table 4). The N contents (Fig. 1, 2) and N yields (Fig. 3) increased with
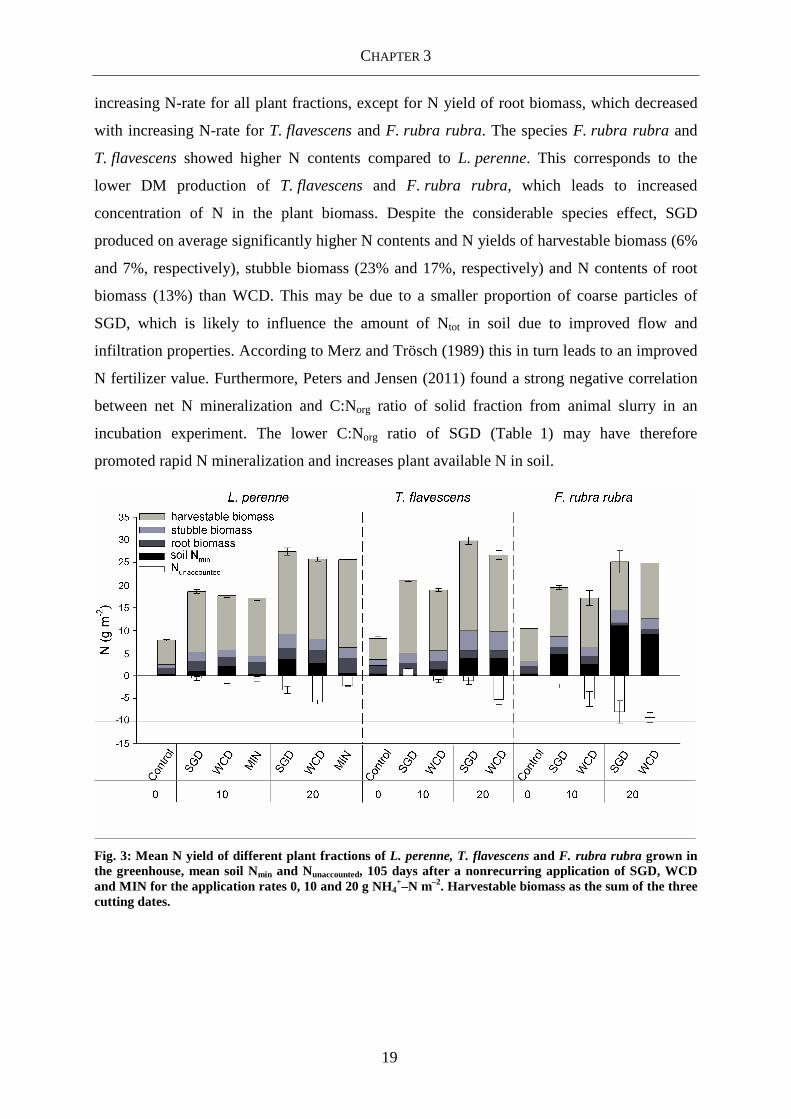
CHAPTER 3
19
increasing N-rate for all plant fractions, except for N yield of root biomass, which decreased
with increasing N-rate for T. flavescens and F. rubra rubra. The species F. rubra rubra and
T. flavescens showed higher N contents compared to L. perenne. This corresponds to the
lower DM production of T. flavescens and F. rubra rubra, which leads to increased
concentration of N in the plant biomass. Despite the considerable species effect, SGD
produced on average significantly higher N contents and N yields of harvestable biomass (6%
and 7%, respectively), stubble biomass (23% and 17%, respectively) and N contents of root
biomass (13%) than WCD. This may be due to a smaller proportion of coarse particles of
SGD, which is likely to influence the amount of Ntot in soil due to improved flow and
infiltration properties. According to Merz and Trösch (1989) this in turn leads to an improved
N fertilizer value. Furthermore, Peters and Jensen (2011) found a strong negative correlation
between net N mineralization and C:Norg ratio of solid fraction from animal slurry in an
incubation experiment. The lower C:Norg ratio of SGD (Table 1) may have therefore
promoted rapid N mineralization and increases plant available N in soil.
Fig. 3: Mean N yield of different plant fractions of L. perenne, T. flavescens and F. rubra rubra grown in the greenhouse, mean soil Nmin and Nunaccounted, 105 days after a nonrecurring application of SGD, WCD and MIN for the application rates 0, 10 and 20 g NH4
+–N m–2. Harvestable biomass as the sum of the three cutting dates.
CHAPTER 3
20
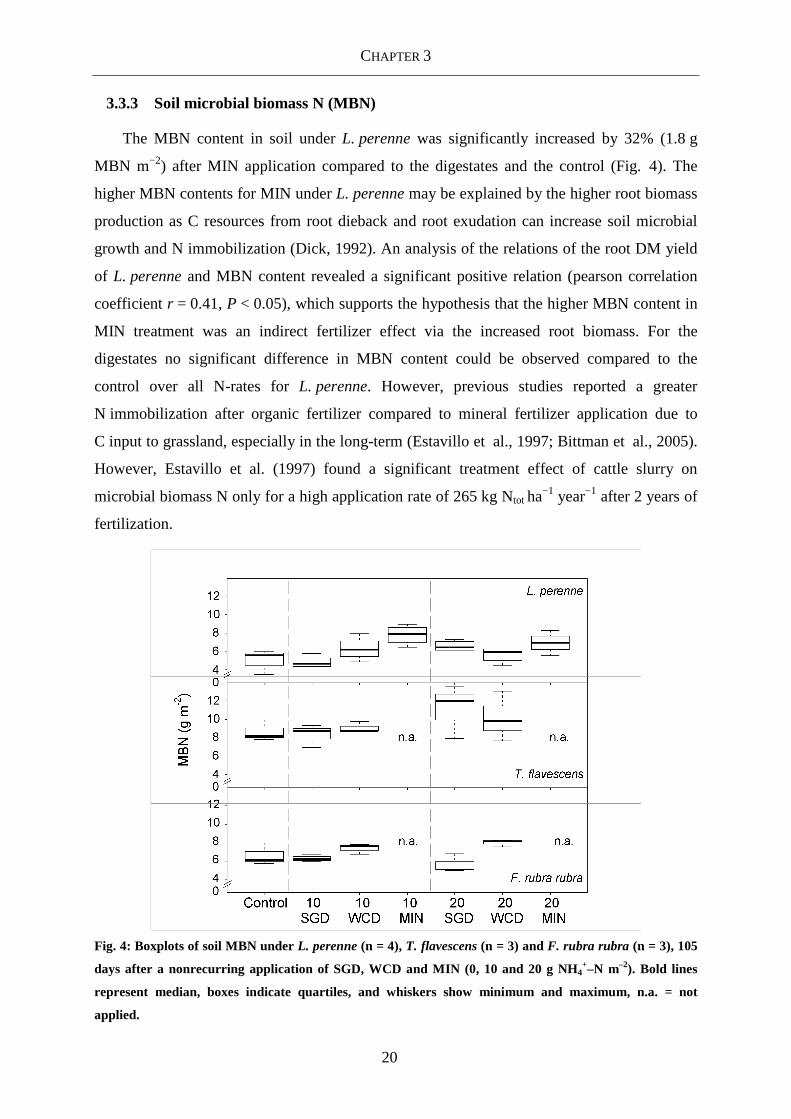
3.3.3 Soil microbial biomass N (MBN)
The MBN content in soil under L. perenne was significantly increased by 32% (1.8 g
MBN m−2) after MIN application compared to the digestates and the control (Fig. 4). The
higher MBN contents for MIN under L. perenne may be explained by the higher root biomass
production as C resources from root dieback and root exudation can increase soil microbial
growth and N immobilization (Dick, 1992). An analysis of the relations of the root DM yield
of L. perenne and MBN content revealed a significant positive relation (pearson correlation
coefficient r = 0.41, P < 0.05), which supports the hypothesis that the higher MBN content in
MIN treatment was an indirect fertilizer effect via the increased root biomass. For the
digestates no significant difference in MBN content could be observed compared to the
control over all N-rates for L. perenne. However, previous studies reported a greater
N immobilization after organic fertilizer compared to mineral fertilizer application due to
C input to grassland, especially in the long-term (Estavillo et al., 1997; Bittman et al., 2005).
However, Estavillo et al. (1997) found a significant treatment effect of cattle slurry on
microbial biomass N only for a high application rate of 265 kg Ntot ha−1 year−1 after 2 years of
fertilization.
Fig. 4: Boxplots of soil MBN under L. perenne (n = 4), T. flavescens (n = 3) and F. rubra rubra (n = 3), 105
days after a nonrecurring application of SGD, WCD and MIN (0, 10 and 20 g NH4+–N m–2). Bold lines
represent median, boxes indicate quartiles, and whiskers show minimum and maximum, n.a. = not
applied.

CHAPTER 3
21
Differences were found for MBN among the individual grass species, while no response
to the type of digestate or the N-rate was detectable (Table 4). A significantly higher MBN
content was detected under T. flavescens in the fertilized treatments as well as in the control
compared to F. rubra rubra and L. perenne. This is in line with Bardgett et al. (1999), who
found that N addition to grassland did not alter the microbial biomass or activity in consistent
way but was largely regulated by the planted grass species. Grass species are known to differ
in root growth, quality and quantity of root exudates (Bardgett et al., 1999; Bezemer et al.,
2006; Eviner et al., 2006) and may thereby influence the soil microbial biomass more than
digestate application. However, although highest MBN was measured under the species that
produced the highest root biomasses (T. flavescens), no significant relation could be found for
MBN and root DM yield after regression analysis. The lack of effect of the digestate
application on MBN could be due to lower root development especially for the grass species
T. flavescens and F. rubra rubra, where the C input with the digestates was compensated by
decreasing root biomass with increasing digestate application rate. This assumption is
supported by a field experiment of Terhoeven-Urselmans et al. (2009) in which digestate
application at a rate of 66 kg Ntot ha−1 led to significantly higher contents of soil ATP, that is,
microbial biomass, in an unplanted fallow treatment compared to the unplanted and
unfertilized control, while no significant increase for the same soil planted with barley could
be detected, as the planted control showed similar soil ATP contents as the amended soil.
3.3.4 Soil N status
Soil Nmin content under L. perenne increased with increasing digestate N-rate (Fig. 3).
The highest mean Nmin content at N-rate 10 was detected for WCD (2.1 g Nmin m−2) and at N-
rate 20 for SGD (3.7 g Nmin m−2), while MIN was lowest at all N-rates with 0.5 g Nmin m
−2.
Contrasts revealed lower soil Nmin contents for MIN compared to the digestates, which is in
accordance with the result from Gunnarsson et al. (2010) of lower soil Nmin after inorganic
fertilizer application compared to digestate application on L. multiflorum. Over all grass
species, soil Nmin increased with increasing N-rate from 0.1 up to 14.4 g Nmin m−2 and was
strongly affected by the grass species (Table 4), which was mainly due to the higher Nmin
values (up to 14.4 g m−2) under F. rubra rubra, caused by low N uptakes (Fig. 3). The values
for T. flavescens and L. perenne were similar in range from 0.3 up to 5.4 g m−2.
The calculated net Nunaccounted was negative for all types of fertilizer and N-rates (Fig. 3),
except for T. flavescens at N-rate 10 for SGD, indicating an overall net N loss via
CHAPTER 3
22
immobilization in microbial biomass and/or emission from the plant-soil-system via NH3 and
N2O emissions (Eqn 2), since leaching losses can be excluded in this experiment. For
L. perenne contrasts revealed on average higher N losses for WCD (−4.0 g N m−2) compared
to MIN (−1.5 g N m−2) and SGD (−1.8 g N m−2). For the digestates, gaseous N losses are
more likely than N immobilization, because no increase in soil MBN content could be
detected for the digestates compared to the control, except for L. perenne at N-rate 20 SGD.
Af ter application of MIN a significant increase in MBN content was detected, which may
have contributed to the net N loss of MIN treatment. The N loss increased over all species
with increasing N-rate (Fig. 3) and were on average significantly higher for WCD
(−4.7 g N m−2) than for SGD (−2.2 g N m−2), although the grass species again explained most
of the variation with the highest N losses for F. rubra rubra (Table 4).
3.3.5 Mineral N use efficiency (NUEmin)
The NUEmin, which was used in the present study as an indicator for the plant availability
of mineral N in the applied fertilizers, was different for the types of digestate and MIN. After
MIN application the NUEmin of harvestable biomass of L. perenne was on average 72% and
showed a slight optimum curve with the highest values for N-rate 10 and 15, indicating a
constant fertilizer N utilization (Fig. 1). Contrasts revealed a lower NUEmin for WCD in
comparison to SGD (−16%) and MIN (−19%). The NUEmin for stubble biomass and root
biomass of L. perenne was affected by type of fertilizer (Table 4). While for stubble biomass
SGD showed on average significantly higher values than MIN (42%) and WCD (63%), for
root biomass MIN showed significantly higher values than SGD (69%) and WCD (78%).
In contrast to the results of the mineral applicated soils, the NUEmin after application of
the digestates decreased for harvestable biomass of the investigated grass species with
increasing digestate N-rate (Fig. 1, 2). This can be explained by the gaseous N losses,
measured as negative net Nunaccounted, especially at high N-rates. This assumption is supported
by an experiment of Sowers et al. (1994), in which a low NUE was detected for winter wheat
due to excessive N losses after application of 140 kg N ha−1 as N fertilizer. Overall, the
NUEmin was mainly influenced by the grass species (Table 4), pronounced in the order
T. flavescens > L. perenne > F. rubra rubra. In general the NUEmin depends on the N yield of
the control (see Eqn 1). Thus, the difference in the control contributed to the difference in
NUEmin between T. flavescens and F. rubra rubra (Fig. 2). The latter is known to grow
sufficiently under low N conditions (Gastal et al., 2010). However, on average over all grass

CHAPTER 3
23
species SGD showed significantly higher NUEmin values than WCD for harvestable and
stubble biomass (22% and 33%, respectively), which might be caused by lower gaseous N
losses in addition to the same reasons as for the improved plant N content and N yield
observed of SGD compared to WCD. An indication of an additional N mineralization in SGD
treatment is the positive net Nunaccounted value for T. flavescens at N–rate 10 (Fig. 3) and the
NUEmin of harvestable biomass of L. perenne (Fig. 1) at N–rate 5, which was higher in SGD
compared to MIN treatment, while the N loss of SGD and N immobilization in soil microbial
biomass in MIN treatment was similar at 2 g m−2.

CHAPTER 3
24
Table 4: Results of the three factorial ANOVA for effects of N–rate (N), type of digestate (D), species (S) (L. perenne, F. rubra rubra and T. flavescens) and their interactions on
plant and soil parameter after three cutting dates. HB = harvestable biomass, SB = stubble biomass and RB = root biomass. Significant effects at P<0.05. The variance (var.)
columns represent the proportion of variance explained by the factor, calculated as classical eta squared (η²). Coefficient of determination of the model (R²).
N D S NxD NxS DxS NxDxS Parameter d.f. P var. d.f. P var. d.f P var. d.f P var. d.f. P var. d.f. P var. d.f P var. R²
DM yield HB 1 <0.01 0.04 1 ns† 0.01 2 <0.001 0.68 1 ns 0.01 2 <0.001 0.12 2 <0.01 0.05 2 ns 0.00 0.91
SB 1 <0.05 0.08 1 ns 0.01 2 <0.001 0.40 1 ns 0.02 2 <0.05 0.10 2 ns 0.00 2 ns 0.04 0.66
RB 1 <0.001 0.14 1 ns 0.01 2 <0.001 0.37 2 <0.05 0.05 2 <0.001 0.19 2 <0.05 0.05 2 ns 0.02 0.82
N content HB 1 <0.001 0.40 1 <0.001 0.02 2 <0.001 0.48 1 ns 0.00 2 <0.001 0.03 2 ns 0.00 2 <0.01 0.02 0.96
SB 1 <0.001 0.33 1 <0.001 0.13 2 <0.001 0.35 1 <0.01 0.02 2 <0.01 0.04 2 ns 0.01 2 <0.01 0.04 0.93
RB 1 <0.001 0.32 1 <0.001 0.16 2 <0.001 0.27 1 <0.05 0.03 2 <0.05 0.05 2 ns 0.01 2 ns 0.02 0.86
N yield HB 1 <0.001 0.28 1 <0.05 0.02 2 <0.001 0.47 1 ns 0.00 2 <0.001 0.09 2 <0.01 0.04 2 ns 0.00 0.91
SB 1 <0.001 0.44 1 <0.01 0.06 2 <0.001 0.23 1 ns 0.00 2 <0.01 0.09 2 ns 0.03 2 ns 0.01 0.85
RB 1 ns 0.03 1 ns 0.00 2 <0.001 0.45 1 <0.05 0.04 1 <0.001 0.19 2 ns 0.04 1 ns 0.01 0.76
NUEmin HB 1 <0.001 0.08 1 <0.001 0.04 2 <0.001 0.75 1 ns 0.01 2 <0.01 0.03 2 <0.01 0.04 2 ns 0.00 0.94
SB 1 ns 0.01 1 <0.01 0.18 2 ns 0.09 1 ns 0.00 2 <0.001 0.26 2 ns 0.05 2 ns 0.02 0.62
RB 1 <0.001 0.14 1 ns 0.01 2 <0.001 0.50 1 <0.05 0.05 2 ns 0.19 2 ns 0.04 2 ns 0.01 0.78
Nmin Soil 1 <0.001 0.30 1 ns 0.00 2 <0.001 0.40 1 ns 0.01 2 <0.01 0.09 2 ns 0.03 2 ns 0.01 0.83
Nunaccounted Soil 1 <0.001 0.31 1 <0.001 0.14 2 <0.001 0.31 1 ns 0.00 2 ns 0.01 2 ns 0.01 2 ns 0.01 0.80
MBN Soil 1 ns 0.03 1 ns 0.01 2 <0.001 0.57 1 ns 0.02 2 ns 0.03 2 ns 0.03 2 ns 0.03 0.74
† ns = not significant

CHAPTER 3
25
3.4 Conclusions
Overall the digestate from separated grass silage (SGD), produced within the integrated
generation of solid fuel and biogas from biomass (IFBB) system, and from whole crop
digestion (WCD) increased harvestable biomass. This indicates both digestates as valuable
fertilizers in grassland management. However, the results also suggest that an increase in
aboveground and belowground biomass with increasing digestate application rate can be
expected to be higher for species cultivated at grassland systems with high N status
(L. perenne) and to be modest or even negative for species cultivated at grassland systems
with lower N status (T. flavescens and F. rubra rubra). Furthermore, SGD and WCD caused
species-specific yield effects, which might lead to a shift of species composition in grassland.
The relevance of type of digestate (SGD/WCD) on the N accumulation in the plant
biomass was clearly supported by the finding, that over all species SGD showed a higher
NUEmin of harvestable and stubble biomass attributed to higher plant N uptake, lower gaseous
N losses and higher N mineralization compared to WCD. Hence, SGD is suitable as a short-
term N fertilizer, which provides the plant with N similar to a mineral N fertilizer. The
consequent higher N content of the plant residues (stubble and roots) fertilized with SGD
results in favourable litter properties for mineralization processes in soil. However,
considering the N status of the plant-soil-system against the background of the two energetic
conversion techniques, IFBB-system and whole crop digestion, and closed nutrient cycles, it
has to be mentioned that during the IFBB separation process 31% of N harvested with the
plant biomass are transferred into the liquid phase (Hensgen et al., 2012), which may be
returned to the grassland with the digestate. This is in contrast to the whole crop digestion,
where the N would be almost entirely returned to the grassland system. With the high mineral
N utilization of SGD, observed especially at low N application rates, N accumulation in the
grassland system is not likely to occur, even when taking into account possible N inputs
through atmospheric deposition and leguminous N-fixation. This is of advantage for
extensively managed and species-rich grassland, which is generally characterized by low N
status and its species composition is of high sensibility to N input.
The N immobilization in microbial biomass, measured as MBN, was highly affected by
grass species and not by the different C inputs with the types of digestate or application rates.
Presumably, the digestate C input was compensated by reduced root biomass. These findings
indicate that due to the presence of plants, direct effects of digestate application on soil

CHAPTER 3
26
microbial biomass and N mineralization-immobilization processes could possibly be masked
and become undetectable. However, considerably more research is necessary, especially at the
field scale, to provide knowledge about the long-term effects of application of digestates
varying in their physical and chemical properties on natural grassland, because shifts in plant
composition occur delayed. Further, in terms of the N dynamic of the grassland system an
accumulation of Norg in soil and mineralization in subsequent years of application should be
considered, which can be expected to be higher for WCD compared to SGD.

CHAPTER 4
27
4 Soil substrate utilization pattern and relation of functional
evenness of plant groups and soil microbial community in five
low mountain NATURA 2000 grasslands
Abstract
Background and Aims Species rich, semi-natural grassland systems provide several ecosystem
functions. The goal was to assess how aboveground composition and evenness affects soil
substrate utilization pattern and soil microbial functional evenness.
Methods At five German NATURA 2000 grassland sites, the interactions of plant functional
groups (graminoids, forbs and legumes) and belowground microbial functional evenness were
investigated in relation to soil properties and sampling date. Functional evenness of soil
microorganisms was measured with high spatial resolution by community level physiological
profiling (CLPP) using multi-SIR (substrate-induced respiration) at three sampling dates
during the vegetation period. Evenness indices were used to compare plant functional group
diversity and soil microbial functional diversity.
Results All sites differed in the consistently high soil microbial functional evenness, which
was strongly predicted by soil pH, but not by plant functional groups or aboveground plant
dry matter production. However, soil microbial functional evenness was particularly
decreased by an increasing legume proportion and showed seasonal changes, probably driven
by shifts in resource availability and soil water content.
Conclusions Our results suggest that changes in soil chemical properties or in a single key
plant functional group may have stronger effects on soil microbial functional evenness than
changes in plant functional group evenness.
4.1 Introduction
European semi-natural grassland systems are of high species richness and provide several
ecosystem functions such as carbon sequestration, nutrient cycling and biodiversity
preservation (Wrage et al., 2011). Despite their ecological and socio-economic relevance,
these ecosystems are threatened by plant diversity loss caused by agricultural intensification
or abandonment (Poschlod et al., 2005). The plant community directly and indirectly
interacts with soil microorganisms, thereby affecting the ecosystem processes mediated by the
soil community (Van der Heijden et al., 1998; Millard and Singh, 2010). Nevertheless,

CHAPTER 4
28
linkages between aboveground plant diversity and soil functions are poorly understood
(Loreau et al., 2001), especially under natural and undisturbed conditions. In general, high
plant and soil diversity is expected to be associated with high ecosystem complexity, which
allows for the provision of ecosystem functions and resilience against disturbances (Schläpfer
et al., 1999; Fonesca and Ganade, 2001; Wittebolle et al., 2009).
Soil microbial functional diversity, i.e. the ability of the microorganism to metabolize
a set of organic compounds, is suggested to be more relevant to soil functions than microbial
community composition (Zak et al., 1994) and has been frequently analyzed by community
level physiological profiling (CLPP) (Liu et al., 2008; Zhang et al., 2011; Sradnick et al.,
2013). Previous studies indicated a positive relationship between biomass, activity and
functional diversity of the soil microbial community and plant diversity (Zak et al., 2003; Liu
et al., 2008), but this was rather due to a higher substrate availability mediated by higher
plant productivity associated with plant diversity than a direct plant diversity effect per se.
The quantity and quality of root exudates vary between plant species and plant life forms such
as annuals and perennials (Hertenberger et al., 2002; Marschner et al., 2004; Brimecombe
et al., 2007). Plant functional groups (e.g. graminoids, herbaceous plants, legumes) differ in
their root exudates (Meier et al., 2008) and chemistry of litter (e.g. C/N ratio of plant tissue)
and therefore in resource quality for decomposers (Dijkstra et al., 2006; De Deyn et al.,
2008). Consequently, changes in plant community composition may alter activity and
structure of soil microbial communities (Johnson et al., 2008; Malchair et al., 2010) and
thereby ecosystem functions. For example, N mineralization was related to variations in plant
productivity, root N concentration and labile C production of plant species and plant
functional groups (Dijkstra et al., 2006). Although, several studies pointed to the importance
of plant species diversity and single plant species to the soil microbial community
(Eisenhauer et al., 2010; Eisenhauer et al., 2011), others indicate that plant functional groups
are main factors influencing soil microbial communities of terrestrial ecosystems
(García-Palacios et al., 2011). However, incongruent results were reported as some studies
observed a positive relationship of plant functional group richness and soil microbial
functional diversity (Stephan et al., 2000), whereas others found no relation (Habekost et al.,
2008; Marshall et al., 2011; Zhang et al., 2011).
Plant effects on soil microbial communities are difficult to analyze, as soil factors like
pH, SOC content and moisture availability influence soil microbial community and can
therefore overlay plant mediated effects (Hertenberger et al., 2002; Marschner et al., 2004;

CHAPTER 4
29
Bezemer et al., 2006). Harrison and Bardgett (2010) found that abiotic factors like soil type
and concentrations of inorganic N and dissolved organic nitrogen were much more important
drivers of soil microbial properties than the presence of various plant species. Also temporal
dynamics in quantity and quality of plant resources (root exudates and litter) are known to
influence soil microorganisms during plant development (Brimecombe et al., 2007), which
reduces the validity of conclusions drawn from a single measurement. Habekost et al. (2008)
reported seasonal variations in grassland soil microbial community structure, substrate
induced respiration and amount of phospholipids fatty acids with higher values in spring
compared to late summer.
In the present study, substrate utilization pattern of soil microbial community was
measured with high spatial resolution by (CLPP) using multi-SIR (substrate-induced
respiration) of five different NATURA 2000 grassland sites at multiple sampling dates during
the vegetation season. The functional diversity of soil microbial community was described by
the evenness index, which was found to be a key factor of ecosystem stability on the species
level by Wittebolle et al. (2009) examining microbial communities. The higher the evenness,
the higher is the ecosystem stability to disturbance (Wittebolle et al., 2009). Further we
decided using evenness to describe soil microbial diversity for a better comparability with
other studies dealing with the substrate utilization approach, as most of them conventionally
use the evenness to describe soil catabolic diversity (Bardgett et al., 1999; Degens et al.,
2000; Degens et al., 2001; Campbell et al., 2003; Graham and Haynes et al., 2005;
Romaniuk et al., 2011; Andersen et al., 2013; Brackin et al., 2013). Although it is generally
accepted that diversity is composed of two components (richness and evenness), Degens
et al. (2000) recommend using catabolic evenness because it is impractical to measure the
immense richness of microbial catabolic functions in soils.
Plant functional group composition (graminoids, forbs, legumes) was examined and plant
functional group diversity was calculated by the evenness index with the same high spatial
resolution as microbial functional diversity. We used the plant functional group evenness
based on the group proportion to the aboveground dry matter (DM) yield, rather than the
usually used plant functional group richness (García-Palacios et al., 2011; Marshall et al.,
2011; Zhang et al., 2011; Khalsa et al., 2012). As the richness does not provide information
about the yield and relative distribution of the groups, the evenness index provides more
relevant information for soil-plant interactions by giving the equitability of functional group
yields. We hypothesized (1) that in different grassland systems soil microbial utilization
CHAPTER 4
30
patterns are influenced by plant functional group composition and aboveground plant biomass
production as well as by abiotic soil characteristics. We further hypothesized (2) that the
higher the plant functional group evenness, the more diverse would be the substrate input to
the soil resulting in a more functionally diverse soil microbial community. And we
hypothesized (3) that soil utilization pattern and microbial functional diversity are depending
on the stage of the vegetation period based on differences in resource supply for the microbial
community.
4.2 Materials and methods
4.2.1 Study sites
The experimental sites were part of the EU-project PROGRASS (www.prograss.eu) and
were located at the lower mountain region Vogelsberg, Germany. Five experimental sites
(I-V, see Tables 5 and 6) were chosen to represent typical grassland vegetation of the region
and to display the large diversity of semi-natural grasslands. Site I and II represented Lowland
hay meadows with a moderate water and nutrient availability, whereas site I represented a
transitional stage to the habitat Mountain hay meadow as our sites lay on the upper altitude
level of lowland grassland areas. Site III and IV were typical representatives of semi-natural
grasslands of higher mountain altitudes, representing a Mountain hay meadow and a
transitional stage of Mountain hay meadow to species-rich Nardus grasslands, respectively.
Site V represented a wet type of semi-natural grassland (Molinia meadow) dominated by
Juncus acutiflorus. The previous agricultural management of the grassland sites was mowing
once to twice per year for hay production without fertilizer application. At the beginning of
the PROGRASS project in 2009 at each experimental site, 3 paired plots were established.
The paired plots consisted of one harvest treatment without nutrient return (H-N) and one
with nutrient return via biogas digestate application (H+N, not considered in this study), each
10 ×10 m. Harvests took place two times annually (July and August), except for the
species-rich Nardus grassland (site IV), where harvest took place once per year (August)
because of its low biomass production. Harvest frequency and time was chosen according to
the usual located harvesting regime. Annual DM yield measurement of the plots was carried
out by mowing 5 m2 with a finger-bar mower at a height of 5 cm and subsequent drying the
fresh biomass at 105 °C for 3 days.

CHAPTER 4
31
Table 5: Botanical characteristics and annual DM yields of the study sites. Arithmetic means and standard deviations of the means (n=3).
Plant species Plant functional groups
Site NATURA 2000 habitat type
Coordinates Altitude m a.s.l.
DM yields t ha-1 a-1
Total numbera
Dominant speciesa
Composition
% DMb Species numbera
I Lowland hay meadow (6510)
50° 35' 27.351" N
9° 12' 27.432" E
570 4.7 (0.3) 43 (1.0) Festuca rubra, Trifolium pratense, Plantago lanceolata, Holcus lanatus
Graminoids
Forbs
Legumes
65.8 (15.7)
24.7 (12.5)
9.4 (8.6)
14 (1.5)
24 (2.7)
5 (1.2)
II Lowland hay meadow (6510)
50° 35' 22.1022" N
9° 20' 40.794" E
420 4.2 (0.0) 44 (2.3) Festuca rubra, Agrostis capillaries, Plantago lanceolata, Trifolium pratense
Graminoids
Forbs
Legumes
64.3 (18.8)
29.0 (17.4)
6.7 (6.0)
14 (2.5)
25 (0.6)
5 (1.5)
III Mountain hay meadow (6520)
50° 28' 41.0082" N
9° 15' 20.6706" E
580 4.2 (0.6) 48 (4.4) Festuca rubra, Sanguisorba officinalis, Agrostis capillaris, Plantago lanceolata
Graminoids
Forbs
Legumes
62.9 (21.0)
35.7 (20.4)
1.4 (2.1)
17 (2.1)
27 (2.6)
4 (0.6)
IV Species-rich Nardus grasslands (6230)
50° 33' 49.9134" N
9° 15' 45.1476" E
580 3.2 (0.2) 37 (2.9) Festuca rubra, Agrostis capillaries, Nardus stricta, Plantago lanceolata
Graminoids
Forbs
Legumes
95.4 (4.2)
2.4 (3.2)
2.2 (3.3)
18 (1.5)
13 (3.1)
6 (1.2)
V Molinia meadow (6410)
50° 33' 55.8684" N
9° 18' 9.7092" E
500 4.8 (1.3) 42 (1.5) Juncus acutiflorus, Festuca rubra, Holcus lanatus, Valeriana dioica
Graminoids
Forbs
Legumes
74.6 (24.0)
23.7 (23.3)
1.6 (2.9)
17 (1.7)
23 (2.1)
2 (0.0) a Data collected in June and July 2011 as described by Hensgen et al. 2012, mosses are excluded b Mean values for the subplots and three sampling dates in 2012

CHAPTER 4
32
The local climate can be characterized as temperate with average temperature (1961-1990)
varying with the altitude of the weather station, 8.0 °C (454 m asl) to 6.7 °C, (606 m asl). The
average annual precipitation was between 923 and 1211 mm, respectively (PIK, 2009). Soil
types were classified according to WRB (IUSS, 2007) and were mainly Cambisols (site I, III
and IV), from volcanic bedrock, or Stagnosols (site II and V) (Hensgen et al., 2012)
Table 6: Soil characterization of the study sites from 0-10 cm depth. Arithmetic means and standard
deviations of the means, n=3. For texture parameters n=1.
Site SOC Total
N C/N pH WHC
Water contenta
Sandb Siltb Clayb
mg g-1 mg g-1 CaCl2 % DM % WHC % % %
I 44.5 (5.6)
4.5 (0.6)
10.2 (0.2)
5.2 (0.1)
115 (4.8)
57.4 (3.2)
17 57 26
II 42.0 (5.5)
4.2 (0.6)
10.5 (0.2)
4.3 (0.0)
101 (6.4)
66.5 (3.2)
8 69 23
III 59.4 (2.7)
5.6 (0.2)
10.7 (0.2)
4.9 (0.1)
120 (6.5)
61.3 (2.7)
8 65 27
IV 65.4 (3.2)
5.4 (0.3)
12.0 (0.3)
4.3 (0.1)
113 (12.5)
69.1 (2.4)
8 72 20
V 47.9 (9.3)
4.4 (0.9)
10.8 (0.4)
4.6 (0.1)
117 (19.1)
56.5 (4.0)
5 70 25
a Means for the three sampling dates b Hensgen et al. 2012
4.2.2 Estimation of plant functional group composition and plant sampling
At each plot 7 subplots (rings having a diameter of 20 cm) were marked along a transect
(14.1 m) and soil sampling and plant functional group determination were performed at three
sampling dates in 2012. Two sampling dates were set at the beginning of the vegetation
period of the Vogelsberg region in the first week of May (2 to 3 May 2012) and the third
week of May (18 May), because during that period root growth and exudation rates are
considered to be high (Brimecombe et al., 2007). One sampling date was set at the vegetation
climax in first week of July (3 to 4 July). Data from plots without digestate application (H-N)
are presented.
In May, plant functional group composition was measured at each subplot by estimating
visually the DM yields of three plant functional groups (graminoids including sedges and
rushes, forbs and legumes) in compliance with proceeding outlined by Davies et al. (1993).
In July, plant functional group composition was measured at each subplot by cutting at five

CHAPTER 4
33
cm height, fractionation and drying at 105 °C for 3 days. Estimation of DM yields of plant
functional groups was conducted always by the same person and the accuracy of estimation
was checked based on dried subsamples in July (Pearson correlation coefficient r = 0.95).
4.2.3 Plant functional group evenness
To describe the plant functional group diversity, the Shannon evenness index (Eplant) was
calculated by the formula Eplant = -∑(pi ln(pi)) / ln(k), where pi was the DM proportion of the
plant functional group of the total DM yield and k the number of functional groups. The
evenness index ranges from 0 (no functional diversity) to 1 (all occurring functional groups
have the same proportion to the DM yield).
4.2.4 Soil sampling and soil chemical analyses
Soil sampling was performed within the 7 subplots with a soil corer (diameter 2 cm) in
0-10 cm depth. The experimental layout resulted in 315 soil samples (7 sampling replicates
per plot, 3 plots per site, 5 sites and 3 sampling dates). Soils were sieved <2 mm and stored at
4°C. Some of samples of site IV and most samples of site V, which were too wet, were
carefully dried before sieving at room temperature. Previous investigations revealed a
homogenous pH and C/N distribution in the top soil layers of the sites. Consequently soil pH
(CaCl2), soil organic C (SOC) and total N (analyzed with an elemental analyzer Vario MAX
CHN, Elementar, Hanau, Germany oven dried samples (60°C)) were measured on composite
samples of the seven subplots taken in July.
4.2.5 Soil microbial substrate utilization pattern and evenness
Substrate utilization patterns were determined according to the multi-SIR approach using
MicroRespTM method after Campbell et al. (2003) for each of the 7 replicates per plot
(subplot). Into each 1.1 ml deep-well microtitre plate (Nunc, Thermo electron LED,
Langenselbold, Germany), soil was placed volumetrically by a filling-device (MicroRespTM)
as described in Campbell et al. (2003). The water content was adjusted to 50-70% of the water
holding capacity (WHC) with demineralised water. Before measurement the samples were
pre-incubated for 7 days at 25°C in the dark and seedlings germinated during incubation were
removed.
The carbon substrate utilization patterns were determined by applying four carbohydrates
(D-glucose, D-fructose, D-trehalose, L-arabinose), four carboxylic acids (α-ketoglutaric acid,
citric acid, malic acid, oxalic acid), eight amino acids (arginine, D-glucosamine, DL-aspartic

CHAPTER 4
34
acid, L-alanine, L-glutamine, L-leucine, lysine, γ-aminobutyric acid) and one phenolic acid
(protocatechuic acid). These substrates were chosen according to their ecological relevance,
as most of them are reported as rhizosphere carbon sources (Campbell et al., 1997). The
substrates glucosamine, trehalose and α-ketoglutaric acid were identified as key
discriminators in studies comparing different ecosystems or management treatments
(Campbell et al., 1997; Stevenson et al., 2004; Lalor et al., 2007; Romaniuk et al., 2011).
The basal respiration was determined by adding demineralised water. The analysis was started
with 22 mg g-1 soil water of each substrate in aqueous solutions. Because of low solubility,
6 mg g-1 soil water of L-leucine and L-glutamine and 2 mg g-1 of protocatechuic acid and
aspartic acid were applied. For determining the CO2 emission a power function was used
resulting from a calibration of five different soils according to Sradnick et al. (2013):
µl CO2 = 63 x (0.1 + ABS)3, r = 0.98
where ABS is the difference in absorption (572 nm) of T1 and T0. The incubation time was
4 h. To describe the soil microbial functional diversity, the Shannon evenness index (ESoil),
was calculated by the formula Esoil = -∑(pi ln(pi)) / ln(k), where pi was the proportion of the
individual substrate respiration to the total substrate respiration and k the number of substrates
according to Zak et al. (1994).
4.2.6 Statistical analyses
The respiration rates of the C substrates were standardized by dividing the single
substrate respiration by the mean of the 17 substrates to receive a relative measure of its
contribution to the mean substrate utilization pattern of the substrates selected in this study.
Multivariate outliers of the substrate utilization patterns were removed from the dataset
according to Field et al. (2012). To identify site effects on plant functional group evenness
we conducted repeated measure with multilevel linear approach followed by orthogonal
contrasts, as described by Field et al. (2012), on the pooled data of the seven subplots per plot
(arithmetic mean). To identify site and sampling date effects on soil functional evenness,
analyses of variance (ANOVA) were conducted with pooled data of the seven subplots per
plot and in case of interactions a simple effect analyses was conducted followed by
Tukey-tests. Significance level was set at P<0.05.

CHAPTER 4
35
Further multiple stepwise regressions were performed to test for the effect of plant and
soil parameter on Esoil with the pooled values of the seven subplots per plot. The parameters
DM proportion of the individual plant functional groups, site DM yield, soil pH, C/N ratio
and water content were included in the preliminary model. Multi-collinearity was tested
according to Field et al. (2012) and forbs were excluded from the analyses because parameters
associated with forbs were highly correlated with graminoids. Graminoids were kept in the
analyses, as they are the dominating plant functional group in grasslands. Further SOC and
total N were strongly correlated (Pearson correlation coefficient r = -0.96) and therefore their
ratio (C/N) was used instead. Quadratic terms of the parameters were included in the starting
model and model reduction was stopped when all parameters were significant at least at the
10% significance level. Model development followed the statistical model selection methods
described by Draper and Smith (1998) and obeyed the rules of hierarchy and marginality
(Nelder and Lane, 1995). Beta values (ß) are the standardized values of the parameter
estimates and were used to indicate the relative importance in the model.
To investigate the effects of site and sampling date on the substrate utilization patterns,
discriminant function analyses (DFAs) were conducted on the unstandardized and unpooled
data set with Statistica. DFAs had to run with unpooled data because of a larger sample size
required for multivariate analyses. To describe the discrimination, the substrate specific
respiration was correlated to the canonical scores of the significant discriminant functions
(DFs). Pearson correlation coefficients were used to express the significance. Further the
canonical scores of the Dfs were correlated to the plant and soil parameters to identify their
participation to the discrimination. Relation of the evenness indices of plant functional groups
and carbon utilization patterns were tested with simple linear regression models on the pooled
data set.
4.3 Results
4.3.1 Basal respiration and substrate utilization patterns
The application of C substrates always led to a higher respiration in comparison with the
basal respiration. A positive Pearson correlation (r = 0.40) was observed for the SOC content
and basal respiration. The contribution of substrate groups to the mean substrate induced
respiration was in the order carboxylic acids > carbohydrates > protocatechuic acid > amino

CHAPTER 4
36
acids (Fig. 5). Discriminant function analyses (Wilks Lamda: 0.015, approx. F = 32.7,
P < 0.001) identified 4 discriminant functions (DFs) by which the substrate utilization
patterns of all of the sites could be separated significantly from each other. DF1 and DF2
together explained 90% of the variance of the sites (Fig. 6a). The substrate utilization
patterns from site I and III were identified by DF1 to be distinct from those from site IV and
V mainly due to greater utilization of the amino acids aspartic acid, arginine and alanine and
lower utilization of two carboxylic acids oxalic and malic acid (Fig. 6a, Table 7). DF2
separated site II from the other sites mainly by having a higher utilization of the carboxylic
acids citric acid and α-ketoglutaric acid. DF4 significantly differed site IV from site V (data
not shown).
Fig. 5: Basal respiration rate (H2O) and individual standardized substrate respirations as proportion of
the total standardized substrate induced respiration and the substrate group sums (n=5) for the five
grassland sites over the sampling period. The dashed line indicates the overall mean of the proportionate
substrate respiration. Error bars indicate standard deviations of the means.
Correlation analysis revealed stronger relations for the soil parameters and the DFs than
for the plant parameters (Fig. 6a). Key discriminatory substrates of DF1 of the site
discrimination correlated strongest to pH, whereas discriminatory substrates of DF2 were
strongest correlated with the soil C/N ratio (Table 7). This indicates that soil pH and soil C/N
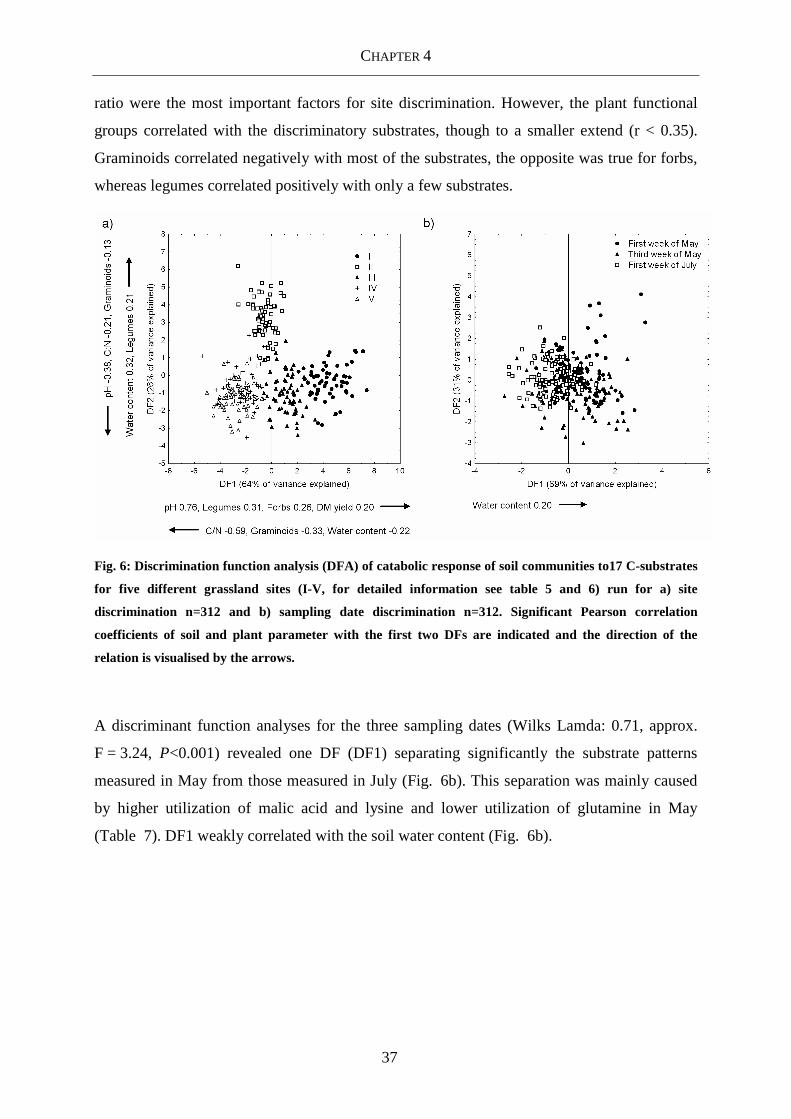
CHAPTER 4
37
ratio were the most important factors for site discrimination. However, the plant functional
groups correlated with the discriminatory substrates, though to a smaller extend (r < 0.35).
Graminoids correlated negatively with most of the substrates, the opposite was true for forbs,
whereas legumes correlated positively with only a few substrates.
Fig. 6: Discrimination function analysis (DFA) of catabolic response of soil communities to17 C-substrates
for five different grassland sites (I-V, for detailed information see table 5 and 6) run for a) site
discrimination n=312 and b) sampling date discrimination n=312. Significant Pearson correlation
coefficients of soil and plant parameter with the first two DFs are indicated and the direction of the
relation is visualised by the arrows.
A discriminant function analyses for the three sampling dates (Wilks Lamda: 0.71, approx.
F = 3.24, P<0.001) revealed one DF (DF1) separating significantly the substrate patterns
measured in May from those measured in July (Fig. 6b). This separation was mainly caused
by higher utilization of malic acid and lysine and lower utilization of glutamine in May
(Table 7). DF1 weakly correlated with the soil water content (Fig. 6b).

CHAPTER 4
38
Table 7: Pearson correlation coefficient between substrate utilization of individual substrates and the discriminating canonical discriminate functions of the sites and of the sampling dates to soil and plant parameters (n=313). Substrates are sorted by the values of DF1 site discrimination. Pearson correlation coefficients r>50 are written in bold. Substrate groups are abbreviated as follows carbohydrates CH, carboxylic acids CA, amino acids AA and phenolic acid PA.
Site discrimination
Sampling date discrimination
Plant functional group composition
Substrates Substrate groups
DF1 DF2
DF1
Water content
% WHC
pH C/N Graminoids
% DM
Forbs
% DM
Legumes
% DM
DM yield
t ha-1 a-1
DL-aspartic a. AA 0.71*** -0.23*** 0.05 -0.06 0.65*** -0.47*** -0.32*** 0.28*** 0.21*** 0.23*** Arginine AA 0.68*** 0.09 0.19*** 0.07 0.51*** -0.49*** -0.29*** 0.23*** 0.25*** 0.22***
L-alanine AA 0.62*** -0.24*** 0.21*** -0.06 0.58*** -0.40*** -0.31*** 0.29*** 0.16** 0.22***
D-fructose CH 0.62*** -0.17** 0.14* 0.08 0.57*** -0.42*** -0.26*** 0.25*** 0.09 0.27***
L-glutamine AA 0.58*** -0.08 -0.15** -0.02 0.52*** -0.44*** -0.28*** 0.27*** 0.10 0.21***
Protocatechuic a. PA 0.51*** -0.24*** 0.00 0.08 0.49*** -0.30*** -0.19*** 0.17** 0.12* 0.19***
D-glucose CH 0.47*** -0.14* 0.26*** 0.22*** 0.42*** -0.27*** -0.13* 0.13* 0.05 0.21***
α-ketoglutaric CA 0.45*** 0.58*** 0.24*** 0.26*** 0.07 -0.31*** -0.23*** 0.17** 0.24*** -0.09
L-arabinose CH 0.43*** -0.26*** 0.03 0.05 0.44*** -0.29*** -0.24*** 0.24*** 0.06 0.17**
γ-aminobutyric a. AA 0.40*** -0.16** 0.10 0.05 0.37*** -0.28*** -0.28*** 0.28*** 0.09 0.13*
L-leucine AA 0.31*** -0.32*** 0.20*** 0.02 0.35*** -0.17** -0.24*** 0.25*** 0.03 0.14*
Citric a. CA 0.28*** 0.68*** 0.19*** 0.27*** -0.05 -0.36*** -0.30*** 0.26*** 0.22*** -0.05
D-glucosamine AA 0.28*** -0.21*** 0.26*** 0.13* 0.27*** -0.15** -0.20*** 0.19** 0.08 0.07
D-trehalose CH 0.25*** -0.26*** 0.17** 0.15** 0.33*** -0.21*** -0.18** 0.19*** 0.00 0.20***
Lysine AA 0.16** -0.25*** 0.31*** 0.11 0.21*** -0.09 -0.19*** 0.20*** 0.02 0.06
Malic a. CA -0.17** 0.20*** 0.35*** 0.49*** -0.18** 0.03 0.08 -0.07 -0.04 0.03
Oxalic a. CA -0.25*** 0.41*** 0.03 0.35*** -0.33*** -0.01 -0.17** 0.17** 0.05 -0.06
P < 0.05; ** P < 0.01, ***P < 0.001
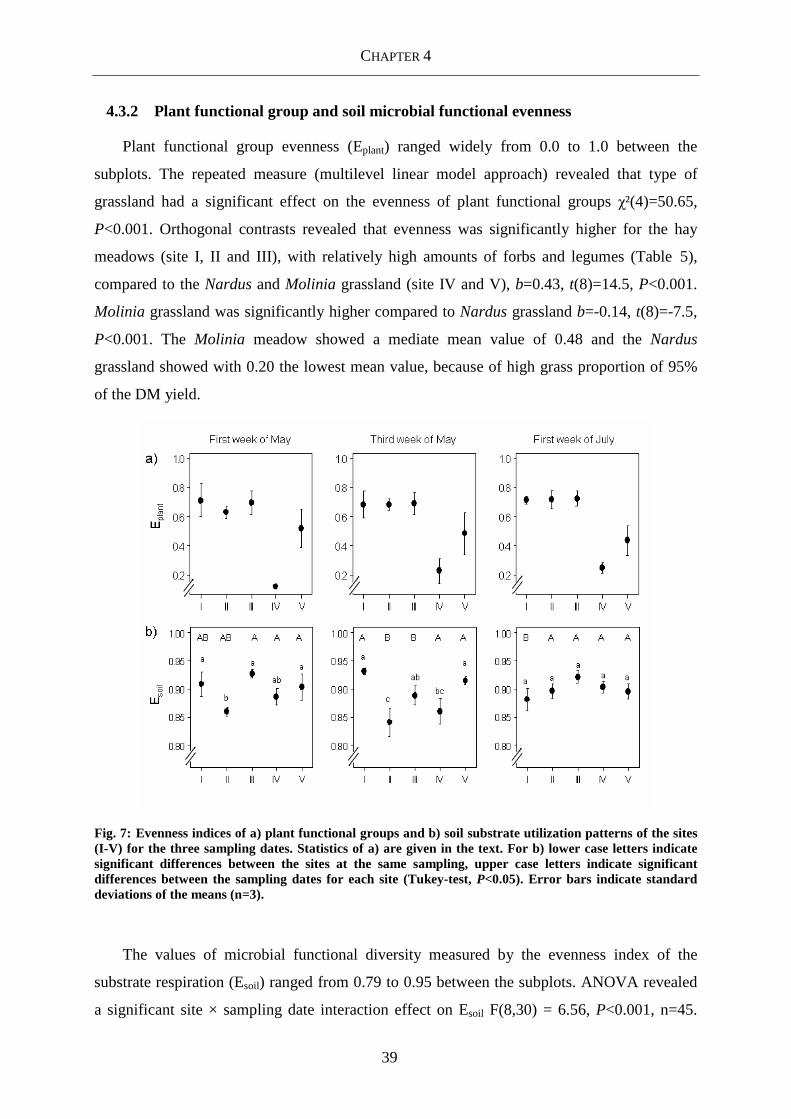
CHAPTER 4
39
4.3.2 Plant functional group and soil microbial functional evenness
Plant functional group evenness (Eplant) ranged widely from 0.0 to 1.0 between the
subplots. The repeated measure (multilevel linear model approach) revealed that type of
grassland had a significant effect on the evenness of plant functional groups χ²(4)=50.65,
P<0.001. Orthogonal contrasts revealed that evenness was significantly higher for the hay
meadows (site I, II and III), with relatively high amounts of forbs and legumes (Table 5),
compared to the Nardus and Molinia grassland (site IV and V), b=0.43, t(8)=14.5, P<0.001.
Molinia grassland was significantly higher compared to Nardus grassland b=-0.14, t(8)=-7.5,
P<0.001. The Molinia meadow showed a mediate mean value of 0.48 and the Nardus
grassland showed with 0.20 the lowest mean value, because of high grass proportion of 95%
of the DM yield.
Fig. 7: Evenness indices of a) plant functional groups and b) soil substrate utilization patterns of the sites (I-V) for the three sampling dates. Statistics of a) are given in the text. For b) lower case letters indicate significant differences between the sites at the same sampling, upper case letters indicate significant differences between the sampling dates for each site (Tukey-test, P<0.05). Error bars indicate standard deviations of the means (n=3).
The values of microbial functional diversity measured by the evenness index of the
substrate respiration (Esoil) ranged from 0.79 to 0.95 between the subplots. ANOVA revealed
a significant site × sampling date interaction effect on Esoil F(8,30) = 6.56, P<0.001, n=45.

CHAPTER 4
40
This indicates that the sampling date effects on Esoil differed between the grassland sites.
Simple effect analyses and Tukey tests revealed a decrease of Esoil for site II (not significant)
and III (significant) from first week of May to third week of May and an increase again to the
first week of July (Fig. 7). At site I Esoil decreased from May to July. No significant sampling
date effect was found for site IV and V. At no sampling date, a significant linear regression
analyses of Eplant and Esoil could be detected (Fig. 8).
Fig. 8: Linear regressions for Eplant and Esoil for the three different sampling dates (n=15; n=15; n=15).
4.3.3 Multiple stepwise regressions on soil microbial functional evenness
The results of the multiple stepwise regression models, which tested the effects of soil and
plant parameters on Esoil, are presented in table 8. In May soil parameters contributed more to
the models than plant parameters, whereas in July the plant parameter legumes and DM yield
were identified as important drivers of Esoil. The models achieved high coefficients of
determination (R² = 0.68-0.92). The water content was found to have quadratic effects on Esoil
in May, which was mainly negatively expressed for the measured range (Fig. 9). Increasing
soil pH and soil C/N ratio increased Esoil in May. However, a linear Pearson correlation
indicated no relation of SOC and Esoil. At each sampling date an increasing proportion of
legumes decreased Esoil. Similarly an increasing proportion of graminoids decreased Esoil at
the third week of May. As a consequence of the negative correlation of graminoids and forbs,
an increasing forb proportion leads to an increase of Esoil. The total DM yield production was
found to affect the Esoil in the form of an extremely low optimum curve in July (Table 8).

CHAPTER 4
41
Table 8: Coefficients of determination and parameter estimates for the multiple stepwise regressions of
Esoil and the soil and plant parameters (n=15) for each of the three sampling dates. Beta coefficients (ß) are
the standardized values of the parameter estimates and indicate the relative importance in the model.
Unit First week of May Third week of May First week of July R² 0.87 0.92 0.68 R² adj. 0.79 0.85 0.59 P 0.001 0.002 0.005 dfa 9 7 11 Estimates P ß Estimates P ß Estimates
P ß
Intercept 1.555 9.996 0.776 Water content % WHC -0.028 . -6.17 -0.078 * -12.55 - - pH 0.058 ** 0.73 -2.924 * -27.07 - - C/N - - 0.025 . 0.46 - - Graminoids % DM - - -0.002 ** -0.82 - - Legumes % DM -0.011 ** -1.93 -0.004 * -0.45 -0.005*** -0.88 DM yield t ha-1 a-1 - - - - 0.072 * 3.66 Water content^2 % WHC 0.000 . 6.03 0.001 * 12.02 - - pH^2 - - 0.319 * 27.74 - - Leg^2 0.001 ** 1.67 - - - - DM yield^2 t ha-1 a-1 - - - - -0.009 * -3.95 ‘.’ P < 0.1; * P < 0.05; ** P < 0.01, ***P < 0.001 a Degrees of freedom
Fig. 9: Predictions of Esoil at the three different sampling dates for a) soil parameters and b) the plant
functional groups legumes and graminoids and DM yield identified from the multiple stepwise regression
models stated in table 8 (n=15) (forbs were excluded from the models due to a strong negative inter-
correlation with the graminoids). For each parameter presented all the other variables in the model were
set to their mean value.

CHAPTER 4
42
4.4 Discussion
4.4.1 Substrate utilization patterns of soil microbial community
All five NATURA 2000 grassland sites differed in their substrate utilization patterns
based on the discrimination function analysis, however species-rich Nardus grassland (site
IV) and Molinia meadow (site V) showed marginal differences. Despite the small gradient in
soil pH the utilization of the substrates most responsible for site discrimination was most
strongly associated to soil pH and to a lesser extent to the plant functional group proportions
and site DM production. This is in accordance to previous studies which revealed that even
within a small range soil pH can substantially influence the carbon utilization pattern of
grassland soils (Degens et al., 2001; Grayston et al., 2004). Corresponding with our results
Sradnick et al. (2013) reported a higher utilization of key discriminating substrates mainly
amino acids and carbohydrates with increased pH in an arable soil (pH 6-7). Considering
recent studies of Brackin et al. (2013) and Stevenson et al. (2004) it is probable that pH is
also the main factor discriminating substrate utilization pattern of different ecosystems with
high distinctions in plant community composition. They demonstrated that grassland and
arable soils have a relatively higher response to easily metabolised high-energy substrates
(carbohydrates and amino acids), whereas more acidic forest soils responded to a larger extent
to less energy-rich carboxylic acids. By comparing three semi-natural Irish grasslands,
Liliensiek et al. (2012) found that pH strongly affected the microbial community, but within
each soil, plant species composition was the main influencing factor. However, we could not
detect strong correlations between individual plant functional groups and the ability of the soil
microorganism to use specific substrates within sites (data not shown). Rather, the intensity
and direction of the correlations was highly dependent on sampling date. Meier et al. (2008)
found under alpine meadow communities higher fluxes of phenolic components into the soil
from woody herb roots (Acomastylis rossii) than for grass roots (Deschampsia caespitose).
Corresponding to that DF1 of site discrimination was associated with protocatechuic acid
utilization and separated forb rich sites (I and III) from sites with lower forb proportion (IV)
(Fig. 6a). However, only a weak positive across site correlation of protocatechuic acid and
forb proportion could be observed in this study (Table 7). Although the range of measured
soil parameters was low, our data suggest that the aboveground plant functional group
composition of species-diverse low mountain grasslands is marginal responsible for the
substrate utilization pattern of soil microbial communities compared to soil parameters.
CHAPTER 4
43
Despite temporal complexity, some general conclusions can be drawn from the entire
dataset. In accordance with previous studies (Buyer and Drinkwater, 1997; Grayston et al.,
2001; Papatheodorou et al., 2012) substrate utilization patterns were found to depend on the
sampling date, with dates in May significantly differing from dates in July. This
discrimination was mainly caused by the higher utilization of the substrates lysine and malic
acid, whereas the latter is known to favour the growth of rhizobacteria when released from
plant roots (Rudrappa et al., 2008). This suggests that soil microbial community was altered
by plant life cycle from the beginning to the climax of the vegetation period, reflecting
possible changes in substrate availability due to a shift in quantity and quality of root exudates
(Brimecomp et al., 2007). For example an experiment under controlled conditions revealed
direct effects of plant age on composition of root exudates and root released substrates
correlated with the functional capacity of the rhizosphere microorganism to metabolize these
compounds (Chaparro et al., 2013). The sampling date discrimination was weakly associated
with differences in soil water content (Fig. 6b), whereas samples in July were on average
drier than in May (data not shown).
4.4.2 Evenness of plant functional groups and soil microbial substrate utilization
pattern
The aboveground functional evenness significantly differed between the sites, with
highest values for the meadow sites (I, II and III). Overall all sites, the soil microbial catabolic
evenness showed high values as previously shown by other field studies on permanent
grasslands in Europe and East Africa (Graham and Haynes, 2005; Murugan et al., 2014).
This further supports the growing body of evidence that soils under diverse semi-natural
grassland are in general of high microbial functional diversity and, as previously found, more
diverse than agricultural and forest soils (Degens et al., 2001; Graham and Haynes, 2005;
Murugan et al., 2014). Also recent findings of seasonal dependency of the soil microbial
functional diversity described by evenness index (Andersen et al., 2013) could be confirmed
in this study.
We found no significant relationship between Eplant and Esoil during the entire sampling
period. Based on previous studies (Johnson et al., 2008; Meier et al., 2008; Malchair et al.,
2010) we hypothesized that a high evenness of the chosen plant functional groups
(graminoids, forbs, legumes) would increase the evenness of substrate utilization pattern by
providing a more heterogeneous resource pattern for the soil microbial community. Possibly,

CHAPTER 4
44
focussing on other aboveground diversity measurements like diversity indices including the
species level (Eisenhauer et al., 2010; Eisenhauer et al., 2011) or plant functional traits
(De Deyn et al., 2008) might have more power in assessing plant and soil diversity relations
by supplying a broader range of information. However, Esoil was influenced by discrete plant
functional group abundance. For example, an increase in graminoids, and in particular
legumes, decreased Esoil. Hedlund (2002) and Habekost et al. (2008) found that the presence
of legumes has a discriminating influence by increasing gram negative bacteria and
decreasing fungal biomass, which might therefore have a negative effect on the catabolic
diversity.
The hypotheses that plant biomass production and soil microbial functional diversity are
positively related is frequently postulated as a consequence of better nutrient supply for plants
mediated by diverse microbial communities (Van der Heijden et al., 1998; Eisenhauer et al.,
2012). In addition, high plant biomass production influences carbon-limited microbes by
increasing resource exudation (Zak et al., 2003; Liu et al., 2008). However, this assumption
could not be confirmed in this study. Even aboveground plant DM yield explained most
variation of Esoil in July (Table 8), the relationship followed rather a weak optimum curve
than a linear function. The aboveground DM yield of the investigated semi-natural grassland
sites showed relative small variation. Possibly larger gradients would result in a positive
linear relation of soil catabolic diversity and aboveground plant biomass, similar to which was
found in a grassland study with a broad range of 13-140 g DM m-2 (Liu et al., 2008).
In May, increases in water content decreased Esoil (Table 8), indicating that the chosen
range for the optimal water content during the SIR measurements was too broad. An increase
in water content may have led to limiting conditions for microbial catabolic processes and
therefore decreased Esoil (Gömöryová et al., 2013). The decrease of Esoil with decreasing
soil pH (5.2 to 4.3) is in accordance to results of an artificial acidification experiment with
grassland soil of Degens et al. (2001). Kemmit et al. 2006 observed similarly to the
respiration response of most of the amino acids used in this study a reduced metabolism with
decreasing pH, whereas other substrates were unaffected, leading to an unbalanced substrate
utilization and hence decreased Esoil. In addition to differences in microbial biomass and
community structure, a possible explanation for reduction of amino acid respiration would be
the favoured adsorption to soil exchange sites of minerals under acidic conditions (Strahm
and Harrison, 2007; Rothstein, 2010). However, Sradnick et al. (2013) found no correlation

CHAPTER 4
45
between soil pH and microbial functional diversity (Shannon diversity index) for an arable
soil.
Previous studies reported an increasing catabolic evenness with increasing organic matter
content in the soil due to differing land uses (e.g. permanent grassland versus arable land) and
application of organic fertilizer (Degens et al., 2000; Brackin et al., 2013; Sradnick et al.,
2013). Contrary to these results, no correlation of SOC and only a weak positive relation of
the soil C/N ratio and Esoil were found in this study, probably because soils of the investigated
semi-natural grassland sites differed only little in C/N ratio (10.2-12.0) and SOC content
(42-65 mg C g-1). Within these levels, variation does not lead to changes in the catabolic
diversity of the soil microbial soil community, although the substrate utilization pattern might
differ. Accordingly, Zak et al. (2003) hypothesized a weaker effect of plant community
diversity on soil microbial communities in SOC rich soils (130 mg g-1) compared with low
SOC soils (4-5 mg g-1). Due to the small range in SOC content and pH of the investigated
soils, our findings can not be extrapolated to soils with a broader range of these parameters.
Furthermore, influence of nutrient and water regime on substrate utilization patter should be
systematically investigated.
4.5 Conclusions
The low mountain semi-natural grasslands investigated here, showed consistently high
soil microbial functional evenness and all differed in their response pattern to the selected
carbon substrates. This indicates the high functional range of soil microbial communities of
different NATURA 2000 grassland types, despite similar agricultural management and
geography. Our data suggest that aboveground plant functional group evenness and soil
microbial functional evenness are not linked to each other. Although the ranges of soil
properties were low, abiotic soil factors, especially soil pH, are the main factors in influencing
the soil substrate utilization pattern and determining soil microbial functional evenness,
whereas plant functional group composition, plant group evenness and aboveground plant dry
matter production are less important. However, a single plant functional group may play a key
role, as for instance an increasing legume proportion consistently decreased soil microbial
functional evenness. Furthermore, soil microbial functional evenness depends on the sampling
date, probably driven by changes in source availability. Thus the temporal dependency of the
substrate utilization pattern, leads to the conclusion that data of future studies, which focus on

CHAPTER 4
46
the functionality of the soil microbial community, should base on multiple sampling dates
through the vegetation period.
Our study emphasizes the role of abiotic soil factors and key plant functional groups
rather than plant functional group evenness as important determinants of soil microbial
catabolic responses. Such considerations are crucial in further completing our understanding
of plant-soil diversity interactions and, hence, ecosystem functioning of biodiverse semi-
natural grasslands.

CHAPTER 5
47
5 Shifts of plant functional groups and soil microbial catabolic
diversity due to management changes in temperate extensive
grasslands of a lower mountain range
Abstract Over the last decades species rich, semi-natural grasslands are increasingly
threatened by agricultural intensification, abandonment or afforestation. At five German
NATURA 2000 grassland sites, we assessed the effects of digestate application and mulching
as alternative managements to harvesting without nutrient application on plant functional
groups (graminoids, forbs and legumes) and soil microbial substrate utilization pattern three
years after implementation. Substrate utilization pattern were measured using multi-SIR
(substrate-induced respiration) at three sampling dates during the growing season. Evenness
indices were used to estimate plant functional group diversity and soil microbial catabolic
diversity. Digestate application and mulching increased the aboveground plant dry matter
production. No shifts in plant functional group composition and evenness were observed after
digestate application, whereas mulching tended to show contrasting responses depending on
the grassland type. Only small and transient shifts in soil microbial substrate utilization
pattern and catabolic evenness were induced by digestate application. SOC, total N, C/N and
soil pH value were not affected by any treatment. Our results provide evidence that moderate
dose digestate application may serve as an ecologically more suitable management alternative
compared with mulching for keeping semi-natural grassland meadows under agricultural
management and without substantially influencing plant functional group composition nor
soil microbial substrate catabolism.
5.1 Introduction
European semi-natural grasslands are grasslands accompanied with a more or less
extensive agricultural management and remaining relatively ‘unimproved’ in agricultural
terms (Hopkins, 2009). However, these systems are of high ecological and socio-economic
relevance, as they provide several ecosystem functions, such as biomass production, carbon
sequestration, as well as biodiversity preservation (Schläpfer et al., 1999; Schüpbach et al.,
2004; Wrage et al., 2011). They have established under long-time extensive management
forms such as grazing with low stocking rates or mowing with a low cutting frequency, which
are accompanied by low manure application rates or even no nutrient return (Isselstein et al.,
2005). Over the last decades, these ecosystems are increasingly threatened by agricultural

CHAPTER 5
48
intensification, abandonment or afforestation (Poschlod et al., 2005; Beilin et al., 2014). To
ensure their preservation, remaining areas were assigned to the Habitats Directive (Council
Directive 92/43/EEC), which includes a network of protected sites across Europe
(NATURA 2000) and a strict system of species protection. For preservation of the
characteristic plant species composition, the former extensive management has to be
continued or reintroduced (Drobnik et al., 2011). Unfortunately, nowadays such management
forms are hardly profitable to farmers (Strijker, 2005), as they result in lower biomass yields
and low forage quality because first cutting of extensive meadows is often conducted late
resulting in low crude protein and high crude fibre concentration (White et al., 2004;
De Cauwer et al., 2005).
In order to provide an approach for profitable utilization of the remaining semi-natural
grassland material, Wachendorf et al. (2009) suggested a new concept for bioenergy
production of heterogeneous and senescent plant biomass. The integrated generation of solid
fuel and biogas from biomass (IFBB)-concept overcomes the given restrictions for bioenergy
production from these biomasses, such as low methane yields (Prochnow et al., 2009a) and
high mineral contents (Prochnow et al., 2009b), by generating a solid and a liquid material
pathway (Richter et al., 2009; Richter et al., 2010; Richter et al., 2011). The remaining
biogas residue (hereinafter referred as digestate) from the liquid pathway, can be applied to
grasslands (Hensgen et al., 2012). However, the effect of this digestate on the grassland plant
and soil community under natural conditions is yet to be investigated (Andruschkewitsch
et al., 2013).
Semi-natural grasslands frequently exist on infertile soils and their characteristic plant
community composition is sensitive to nutrient application (Čámská and Skálová, 2012).
Therefore, fertilization of conservation areas e.g. NATURA 2000 grasslands is restricted or
completely prohibited. Nevertheless, maintenance of these ecosystems may require the return
of nutrients (Čámská and Skálová, 2012), because the development of the vegetation was
associated with occasional organic fertilizer application. Further, a moderate return of
nutrients would increase biomass yields, which may enhance profitability of grassland
farming. Due to different grassland types and site characteristics, N application rates tolerated
by the plant community widely range from 4-60 kg N ha-1 a-1 (Briemle, 1997; Kirkham et al.,
2008; Čámská and Skálová, 2012; Samuil et al., 2013). The N returned with the IFBB
digestate is 19 to 60% of the harvested amount, and therefore lower as in mulched systems

CHAPTER 5
49
because N is partly transferred into to the solid fraction, which finally constitutes a solid fuel
for combustion (Hensgen et al., 2012).
Mulching, i.e. cutting plant biomass and leaving it on the site, is frequently applied in
temperate grassland conservation because it is easier to implement as harvesting or grazing.
However, mulching is not profitable to farmers (Blumenstein et al., 2012) and the absence of
nutrient removal is occasional associated with undesired ecological effects such as
eutrophication (Laser, 2002; Briemle, 2005) and formation of a less decomposable biomass
layer (Uhlířova et al., 2005). This may result in plant community changes and loss of plant
species diversity.
On the other hand a modification of the former grassland management by mulching or
fertilizer application results in alteration of abiotic and biotic soil properties (Brodie et al.,
2003; Liliensiek et al., 2012) and might therefore also alter soil microbial functioning. Soil
microbial communities are major drivers of most grassland ecosystem functions and highly
linked to plant community (Bardgett et al., 1999; Dijkstra et al., 2006) with higher microbial
diversity under unimproved and species diverse grassland compared to improved and less
diverse grassland (Loranger-Merciris et al., 2006; Millard and Singh, 2010). However,
belowground ecosystem components are often neglected in conservation research. For arable
soils, it was shown that digestates increased soil microbial biomass and activity
(Terhoeven-Urselmans et al., 2006; Odlare et al., 2008), whereas effects on grassland soils
are rarely investigated (Andruschkewitsch et al., 2013). Particularly effects of application of
digestate and mulching on both, the plant biomass and diversity, as well as soil functional
diversity, have not simultaneously been investigated before.
A study was conducted on five different NATURA 2000 grassland sites to elucidate the
effects of IFBB digestate on plants and soil microbial community. The treatments comprised
harvesting with and without digestate application and a mulching treatment. The harvest
treatment without digestate application represents the actual conservation management and
the treatment with digestate with a return of 50% of the harvested N is based on the data of
Hensgen et al. (2012), who showed a maximum transfer of 50-60% of N from European
semi-natural grassland biomasses into the liquid phase, converted after fermentation to
digestate. In consideration that variation in soil microbial community occur during the
growing season (Brimecombe et al., 2007; Habekost et al., 2008; Andruschkewitsch et al.,
2014), the analysis was based on multiple sampling dates.
CHAPTER 5
50
We hypothesized that, due to greater net nutrient outputs, IFBB digestate application has
minor effects relatively to mulching on (1) aboveground plant dry matter yield, plant
functional group composition and diversity and on (2) soil microbial carbon substrate
utilization pattern and catabolic diversity of semi-natural, extensive managed meadows.
Furthermore, we hypothesized that (3) digestate effects are strongest shortly (14 days) after
application.
5.2 Material and Methods
5.2.1 Study sites
The experimental sites were part of the EU project PROGRASS (www.prograss.eu) and
were located at the lower mountain region Vogelsberg, Middle Germany. Five experimental
sites (I-V) with different NATURA 2000 habitat type were chosen to represent typical
vegetation communities of conservation grasslands of a lower mountain range of a temperate
region (Table 9). Over the past decades, the sites were managed extensively by mowing with
a low cutting frequency one or two times per year and without fertilizer application. This
resulted in agricultural unimproved grassland sites of high species richness but relatively low
biomass productivity. The local climate is characterized as temperate with a long-time
(1961-1990) average temperature varying with the altitude, 8.0°C (454 m a.s.l.) to 6.7°C,
(606 m a.s.l.). The average annual precipitation was between 923 and 1211 mm, respectively
(PIK, 2009). Soil types were classified according to WRB (IUSS, 2007) and were mainly
Cambisols (site I, III and IV), from volcanic bedrock, or Stagnosols (site II and V). Soil
texture in the upper soil layer was silty loam and the pH (CaCl2) ranged from 4.3 (sites II and
IV) to 5.2 (site I) (Hensgen et al., 2012).
5.2.2 Experimental setup and sampling
At each site, an experimental area of 700 m² was selected, where plant community was
characteristic for the NATURA 2000 habitat type and homogenously distributed. In 2009,
three treatments (100 m²) were established at each site: a control representing the actual
conservation treatment harvesting without nutrient application (H-N), IFBB technique
implementation including harvesting and digestate application (H+N) and a mulching
treatment including cutting and spreading chopped biomass (M). H-N and H+N were
established in triplicates and M with one repetition. Aboveground biomass was harvested and
mulched two times per year during the first two weeks of July and September. The
CHAPTER 5
51
species-rich Nardus grassland site IV was harvested only in July because of its low biomass
production. Harvest frequency and time was chosen according to the usual located harvesting
regime. Annual dry matter (DM) yield of the plots was carried out by mowing 5 m2 with a
finger-bar mower at a height of 5 cm and subsequent drying the fresh biomass at 105°C for 3
days.
The nutrient recirculation on H+N plots started in 2010. It was based on recycling 50% of
N removed by the harvest, leading to variable P and K application rates (Table 9). The IFBB
digestate was simulated by pressing a conventional biogas digestate (swine slurry and maize
silage as co-ferment) with a screw press (AV, Anhydro, Kassel, Germany) as original material
from the IFBB prototype plant was not available. The separated digestate was analyzed for N,
P, K and applied uniformly with watering cans once per year in the first week of May.
At each single plot of the five investigated sites, 7 subplots (diameter 20 cm) were
marked along a transect (14.1 m). Soil was sampled and plant functional group was
determined in the subplots at three consecutive dates in 2012: directly before digestate
application (day 0), day 14, and day 56 after digestate application, resulting in 147 samples
per site. At the first two sampling dates, plant functional group composition at each subplot
was determined by estimating visually the DM proportion of the plant functional groups, i.e.
graminoids including sedges and rushes, forbs and legumes in compliance with proceeding
outlined by Davies et al., 1993). Estimation was conducted always by the same person and its
accuracy was checked at the last sampling date 56 after digestate application, based on the
weighted proportion of dried subsamples of plant functional groups (r = 0.95, P<0.001). Plant
functional group composition was measured by cutting at 5 cm height, manual fractionation
and drying at 105°C for 3 days. To describe the plant functional group diversity, the Shannon
evenness index (Eplant) was calculated by the formula Eplant = -∑(pi ln(pi)) / ln(k), where pi
was the DM proportion of the plant functional group to the total DM yield and k the number
of functional groups. The evenness index ranges from 0 (total dominance of one functional
group) to 1 (all occurring functional groups have the same proportion to the DM yield). We
rather used the plant functional group evenness based on the group proportion to the
aboveground plant DM yield than the usually used plant functional group richness (Zhang
et al., 2011; Khalsa et al., 2012). As the richness does not provide information about the
yield and relative distribution of the groups, the evenness index provides more relevant
information for soil-plant interactions by giving the equitability of functional group yields.

CHAPTER 5
52
Table 9: Botanical characteristics and nutrient inputs of the H+N treatment at the study sites. Arithmetic means and standard deviations of the means in brackets;
H-N = harvest without nutrient return (n=3), H+N = harvest with nutrient return via digestate (n=3) and M = mulching (n=1).
Plant species Nutrient input H+N b
Site nr. NATURA 2000 habitat type Altitude
m a.s.l. Treatment
Total
numbera Dominant speciesa
kg N
ha-1 a-1
kg P
ha-1 a-1
kg K
ha-1 a-1
I Lowland hay meadow (6510) 570 H-N
H+N
M
43 (1.0)
42 (5.1)
35 (-)
Festuca rubra, Trifolium pratense,
Plantago lanceolata, Holcus
lanatus
35 (4)
3 (0)
28 (3)
II Lowland hay meadow (6510) 420 H-N
H+N
M
44 (2.3)
44 (1.5)
47 (-)
Festuca rubra, Agrostis
capillaries, Plantago lanceolata,
Trifolium pratense
47 (9)
4 (1)
37 (7)
III Mountain hay meadow (6520) 580 H-N
H+N
M
48 (4.4)
54 (7.0)
48 (-)
Festuca rubra, Sanguisorba
officinalis, Agrostis capillaris,
Plantago lanceolata
32 (8)
3 (1)
25 (6)
IV Species-rich Nardus grasslands
(6230)
580 H-N
H+N
M
37 (2.9
34 (1.0)
32 (-)
Festuca rubra, Agrostis
capillaries, Nardus stricta,
Plantago lanceolata
30 (6)
3 (0)
24 (5)
V Molinia meadow (6410) 500 H-N
H+N
M
42 (1.5)
44 (2.3)
38 (-)
Juncus acutiflorus, Festuca rubra,
Holcus lanatus, Valeriana dioica
46 (10)
4 (1)
37 (8)
a Plant species data collected in June and July 2011 as described by Hensgen et al. (2012), mosses are excluded b Mean of 2010-2012

CHAPTER 5
53
Soil samples were taken with an auger of a diameter of 2 cm within the subplots at each
date at 0-10 cm depth, sieved < 2 mm and stored at 4°C. Some of samples of site IV and most
samples of site V, which were too wet, were carefully dried before sieving at room
temperature. Soil pH-CaCl2 (1:2.5 w/w) was measured on composite samples of the moist
soil of the seven subplots for each sampling date. Soil organic C (SOC) and total N were
determined on composite samples of dried soil (60°C) for each subplot with an elemental
analyser (Vario MAX CHN, Elementar, Hanau, Germany) at the latest sampling date.
5.2.3 Soil microbial substrate utilization pattern
Substrate utilization patterns were determined according to the multi-SIR approach using
MicroResp™ method after Campbell et al. (2003). Into each 1.1 ml deep-well microtitre
plate (Nunc, Thermo electron LED, Langenselbold, Germany); soil was placed volumetrically
by a filling-devise (MicroResp™) as described in Campbell et al. (2003). The water content
was adjusted to 50-70% of the water holding capacity (WHC) with demineralised water. The
wells were pre-incubated for 7 days at 25°C in the dark and seedlings germinated during
incubation were removed. The respiration responses were detected by applying aqueous
solutions of different carbons substrates into individual chambers of the well and sealing the
well with a colorimetric CO2 trap accordingly to Campbell et al. (2003).
The carbon substrate utilization patterns were determined by applying four carbohydrates
(D-glucose, D-fructose, D-trehalose, L-arabinose), four carboxylic acids (α-ketoglutaric acid,
citric acid, malic acid, oxalic acid), eight amino acids (arginine, D-glucosamine, DL-aspartic
acid, L-alanine, L-glutamine, L-leucine, lysine, γ-aminobutyric acid) and one phenolic acid
(protocatechuic acid) into individual chambers of the well. These substrates were chosen
according to their ecological relevance, as most of them are reported as rhizosphere carbon
sources (Campbell et al., 1997). The substrates glucosamine, trehalose and α-ketoglutaric
acid were identified as key discriminators in studies comparing different ecosystems or
management treatments (Campbell et al., 1997; Stevenson et al., 2004; Lalor et al., 2007;
Romaniuk et al., 2011). The basal respiration was determined by adding demineralised water
in one chamber of the well. The analysis was conducted for the most substrates with 22 mg g-1
soil water. Because of its low solubility, L-leucine and L-glutamine were applied with
6 mg g-1 soil water and protocatechuic acid and aspartic acid with 2 mg g-1. The colour
development of the CO2 trap was measured at 572 nm (FLUORstar, BMG, Offenburg,
Germany) immediately before sealing the well and 4 h after incubation (25°C) in the dark. For

CHAPTER 5
54
determining the basal respiration a power function was used resulting from a calibration of
five different soils according to Sradnick et al. (2013):
µl CO2 = 63 x (0.1 + ABS)3, r = 0.98
where ABS is the difference in absorption of T1 and T0. To describe the soil microbial
functional diversity, the evenness index (Esoil), was calculated by the formula Esoil = -∑(pi
ln(pi)) / ln(k), where pi was the proportion of the individual substrate respiration to the total
substrate respiration and k the number of substrates according to Zak et al. (1994). It is
important to note, that carbon substrate utilization patterns are only indicators of functional
diversity based on the ability of the soil microbial community to utilize a selected range of
substrates.
5.2.4 Statistical analyses
We used two-way analysis of variance (ANOVA) on DM yield, SOC, total N (TN) and
C/N, using site and treatment (H+N and H-N) as main factors. Because of the single repetition
of the mulching, this treatment was not included in statistical analyses to avoid an unbalanced
statistical design. However, descriptive results were included in the discussion, giving
suggestions for further experiments and management applications. We used three-way
ANOVA on soil pH, basal respiration and the microbial functional evenness indices with site,
treatment and sampling date as independent factors. Sampling date was treated as independent
factor, as for each sampling date soil was destructively sampled within the subplot. When
interactions were detected, simple effects ANOVAs were conducted to receive detailed
information. All ANOVAs were conducted with the pooled values of the seven subplots per
plot (arithmetic mean). To identify site effects on plant functional groups and their evenness
(Eplant), we conducted a repeated measure analysis with multilevel linear model approach,
using site and treatment as main factors and sampling date as random factor (Field et al.,
2012), on the pooled data of the seven subplots per plot (arithmetic mean). The analyses
started with creating a baseline model without any predictor other than the intercept, after that
main effect models were created. The analysis ended up with an interaction model including
all main effects and their interaction.
The respiration rates of the substrates were standardized by dividing each substrate
respiration by the mean of the 17 substrates to receive a relative measure of its contribution to
the mean substrate utilization pattern. Multivariate outliers of these patterns, comprising only
0.01% of the data, were removed from the dataset according to Field et al. (2012). To

CHAPTER 5
55
investigate the effects of site, sampling date and treatment on the substrate utilization patterns,
MANOVA was conducted on the unstandardized data. Significant main effects and three-way
interaction identified by MANOVA were followed up by discriminant function analyses
(DFA) with Statistica. To describe the discrimination, the substrate specific respiration was
correlated to the canonical scores of the significant discriminant functions (DFs). Pearson
correlation coefficients were used to express the significance.
Analyses were performed with R, if not stated otherwise. Statistical treatment
comparisons were conducted for H-N and H+N, values for M were represented graphically
due to the single repetition. The significance level was set at P < 0.05.
5.3 Results
5.3.1 Aboveground plant dry matter yield, functional group composition and
diversity
DM yields of the sites varied in a typical range for extensive grasslands from 3.2 to
6.1 t ha-1 a-1 (Fig. 10). On average over all sites the treatments H+N and M increased the
annual DM yield by 14 and 19%, respectively, compared with H-N. Thereby the highest
increase was observed at the Lowland hay meadow II, which received the highest nutrient
amounts.
The mean values of plant functional group diversity measured by the evenness index
(Eplant) ranged from 0.20 to 0.75 with significant differences for the sites but not for the
treatments H-N and H+N (Table 10). The Lowland and Mountain hay meadows showed
highest values for Eplant (sites I-III), while the species-rich Nardus grassland (site IV) showed
lowest values (Table 10), because of its high graminoid proportion of 95% of the DM yield.
M treatment tended to affect plant functional group composition and plant functional group
diversity of the sites. On site I, mulching led to decreased graminoid and legume proportions
in comparison with H-N, while forb proportion was increased. Because of higher legume and
forb proportions on the M plot at site IV, Eplant was increased. On the opposite M decreased
Eplant at site V.

CHAPTER 5
56
Fig. 10: DM yields of five grassland sites and their means after harvest without nutrient return (H-N),
harvest with nutrient return (H+N) and mulching (M). ANOVA results of the DM yields with the factors
grassland site (I-V) and treatment (H-N and H+N). Mulching (M) was not statistically evaluated. Error
bars indicate standard deviations of the means.
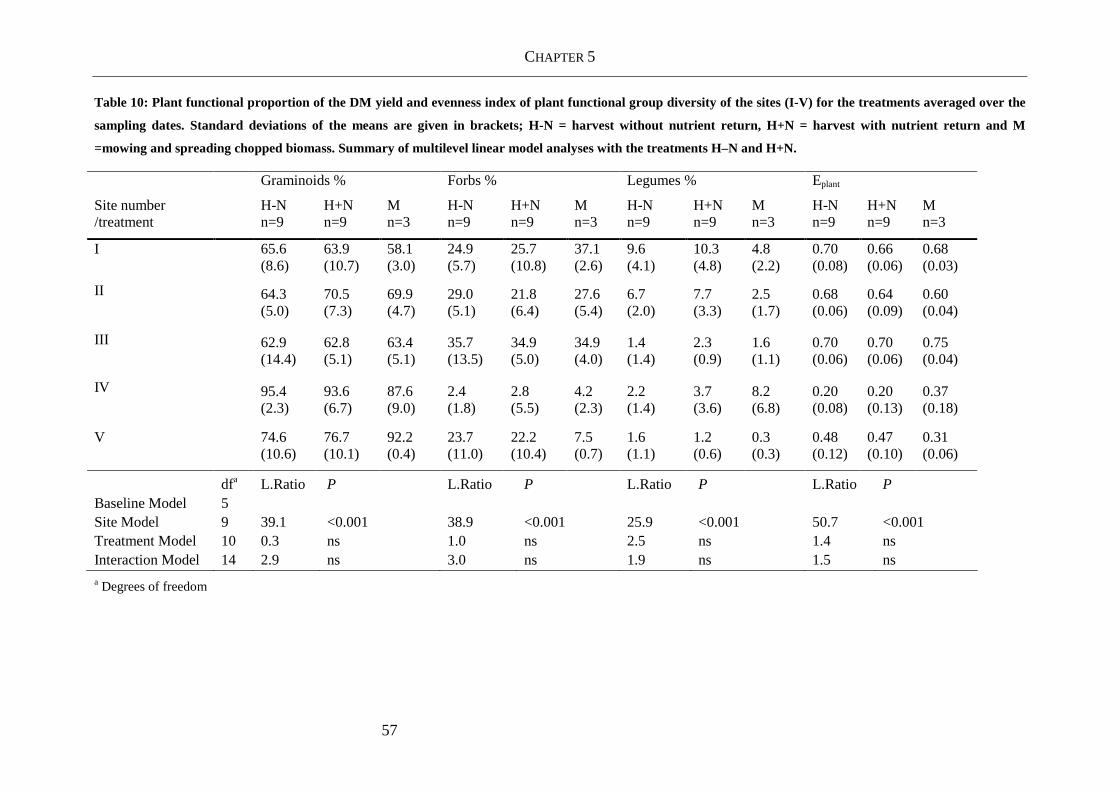
CHAPTER 5
57
Table 10: Plant functional proportion of the DM yield and evenness index of plant functional group diversity of the sites (I-V) for the treatments averaged over the
sampling dates. Standard deviations of the means are given in brackets; H-N = harvest without nutrient return, H+N = harvest with nutrient return and M
=mowing and spreading chopped biomass. Summary of multilevel linear model analyses with the treatments H–N and H+N.
Graminoids % Forbs % Legumes % Eplant
Site number /treatment
H-N n=9
H+N n=9
M n=3
H-N n=9
H+N n=9
M n=3
H-N n=9
H+N n=9
M n=3
H-N n=9
H+N n=9
M n=3
I 65.6 (8.6)
63.9 (10.7)
58.1 (3.0)
24.9 (5.7)
25.7 (10.8)
37.1 (2.6)
9.6 (4.1)
10.3 (4.8)
4.8 (2.2)
0.70 (0.08)
0.66 (0.06)
0.68 (0.03)
II 64.3 (5.0)
70.5 (7.3)
69.9 (4.7)
29.0 (5.1)
21.8 (6.4)
27.6 (5.4)
6.7 (2.0)
7.7 (3.3)
2.5 (1.7)
0.68 (0.06)
0.64 (0.09)
0.60 (0.04)
III 62.9 (14.4)
62.8 (5.1)
63.4 (5.1)
35.7 (13.5)
34.9 (5.0)
34.9 (4.0)
1.4 (1.4)
2.3 (0.9)
1.6 (1.1)
0.70 (0.06)
0.70 (0.06)
0.75 (0.04)
IV 95.4 (2.3)
93.6 (6.7)
87.6 (9.0)
2.4 (1.8)
2.8 (5.5)
4.2 (2.3)
2.2 (1.4)
3.7 (3.6)
8.2 (6.8)
0.20 (0.08)
0.20 (0.13)
0.37 (0.18)
V 74.6 (10.6)
76.7 (10.1)
92.2 (0.4)
23.7 (11.0)
22.2 (10.4)
7.5 (0.7)
1.6 (1.1)
1.2 (0.6)
0.3 (0.3)
0.48 (0.12)
0.47 (0.10)
0.31 (0.06)
dfa L.Ratio P L.Ratio P L.Ratio P L.Ratio P Baseline Model 5 Site Model 9 39.1 <0.001 38.9 <0.001 25.9 <0.001 50.7 <0.001 Treatment Model 10 0.3 ns 1.0 ns 2.5 ns 1.4 ns Interaction Model 14 2.9 ns 3.0 ns 1.9 ns 1.5 ns a Degrees of freedom

CHAPTER 5
58
5.3.2 Soil chemical parameters, substrate utilization pattern and functional diversity
Soil pH, SOC, TN and C/N differed significantly between the sites and were not affected
by any treatment (Tables 11 and 12). However, soil pH was marginally affected by sampling
date (Table 11). The mean basal respiration ranged from 1.40 to 2.87 µg CO2-C g-1 h-1, with
significant differences between the sites (Table 11). Basal respiration and SOC content were
positively correlated (r = 0.49, P<0.001). No differences were observed for the treatments
H+N and H-N (Table 11). However, a site × sampling date interaction was detected, caused
by a significant increase in basal respiration until day 56 after digestate application for site II.
The mulching treatment did not lead to differences in basal respiration (Fig. 11). No
differences in standardized utilization of single substrates or substrate groups could be
detected for the treatments, averaging sites and sampling dates (Fig. 11). The contribution of
substrate groups to the mean respiration decreased in the order carboxylic acids >
carbohydrates > protocatechuic acid > amino acids.
Table 11: Basal respiration and soil pH of the study sites from 0-10 cm depth for the three treatments and
averaged over the sampling dates. Arithmetic means and standard deviations of the means; H-N = harvest
without nutrient return, H+N = harvest with nutrient return and M = mulching. Summary of ANOVA
results with the factors site (I-V), treatment (H–N and H+N) and sampling date (0, 14 and 56 days after
digestate application) and their interactions.
Basal respiration pH
µg CO2-C g-1 h-1 -
Site number /treatment
H-N n=9
H+N n=9
M n=3
H-N n=9
H+N n=9
M n=3
I 2.03 (0.59)
1.88 (0.30)
2.14 (0.38)
5.19 (0.06)
5.19 (0.11)
5.28 (0.04)
II 1.53 (0.19)
1.40 (0.44)
1.40 (0.15)
4.38 (0.04)
4.39 (0.08)
4.36 (0.06)
III 2.34 (0.46)
2.34 (0.55)
2.87 (0.40)
4.86 (0.05)
4.84 (0.15)
4.92 (0.07)
IV 2.04 (0.27)
2.13 (0.31)
1.76 (0.38)
4.29 (0.05)
4.36 (0.13)
4.36 (0.02)
V 1.93 (0.42)
1.97 (0.17)
1.81 (0.25)
4.61 (0.10)
4.64 (0.11)
4.79 (0.14)
Factor dfa F P F P Site 4 16.2 <0.001 227.9 <0.001 Treatment 1 0.2 ns 0.6 ns Sampling date 2 0.0 ns 3.3 <0.05 Site x treat 4 0.4 ns 0.6 ns Site x date 8 3.7 <0.01 0.3 ns Treat x date 2 1.9 ns 0.8 ns Site x treat x date 8 2.1 ns 0.1 ns Residuals 60 a Degrees of freedom

CHAPTER 5
59
Table 12: Soil parameters SOC, TN and C/N assessed at sampling date 56 days after digestate application
from 0-10 cm depth for the three treatments. Arithmetic means and standard deviations of the means; H-
N = harvest without nutrient return, H+N = harvest with nutrient return and M = mulching. Summary of
ANOVA results with the factors site (I-V), treatment (H–N and H+N) and sampling date (0, 14 and 56
days after digestate application) and their interactions.
SOC TN C/N
mg g-1 mg g-1 -
Site number /treatment
H-N n=3
H+N n=3
M n=1
H-N n=3
H+N n=3
M n=1
H-N n=3
H+N n=3
M n=1
I 45.50 (5.62)
42.74 (0.90)
48.13 (-)
4.47 (0.63)
4.16 (0.04)
4.54 (-)
10.18 (0.20)
10.27 (0.16)
10.60 (-)
II 44.04 (5.51)
41.10 (1.28)
44.21 (-)
4.19 (0.60)
3.97 (0.21)
4.33 (-)
10.52 (0.24)
10.36 (0.26)
10.20 (-)
III 59.36 (2.70)
58.18 (10.71)
59.45 (-)
5.56 (0.16)
5.48 (1.08)
5.56 (-)
10.67 (0.19)
10.63 (0.17)
10.68 (-)
IV 65.42 (3.18)
64.59 (9.22)
57.42 (-)
5.45 (0.31)
5.43 (0.76)
4.56 (-)
12.01 (0.30)
11.91 (0.52)
12.59 (-)
V 47.90 (9.34)
46.78 (6.42)
38.77 (-)
4.45 (0.93)
4.35 (0.64)
3.38 (-)
10.81 (0.44)
10.77 (0.13)
11.48 (-)
Factor dfa F P F P F P Site 4 14.1 <0.001 6.9 <0.01 33.4 <0.001 Treatment 1 0.6 ns 0.4 ns 0.2 ns Site x treat 4 0.0 ns 0.1 ns 0.1 ns Residuals 20 a Degrees of freedom

CHAPTER 5
60
Fig. 11: Basal respiration rate (H2O) and individual standardized substrate utilization as proportion of the
total standardized substrate utilization and the substrate group sums for the five grassland sites
depending on the treatment summarized for the entire sampling period. The dashed line indicates the
overall mean of the proportional substrate respiration. Error bars indicate standard deviations of the
means; H-N = harvest without nutrient return, H+N = harvest with nutrient return and M = mulching.
There were significant main effects identified by MANOVA for site and sampling date
and a site × treatment × sampling date interaction for the unstandardized substrate utilization
pattern (Table 13). All of the sites significantly differ in their substrate utilization pattern
identified by discriminant function analyses (Wilks Lamda: 0.015, approx. F = 65.8,
P < 0.001). Day 0 and day 14 samples differed from the day 56 samples (Wilks Lamda:
0.791, approx. F = 4.41, P < 0.001). Discriminant function analyses on treatment effects
conducted for each site and sampling date individually, revealed that H+N significantly
differed from H-N at all sampling dates at site I, while differences for site II and IV occurred
at day 0 and for site III at day 14 (Table 14). Site V showed no differences in substrate
utilization pattern between the treatments. Correlation analyses of the DF1 of the significant
DFAs for treatment effects revealed that the most powerful key discriminatory substrates
were associated to the amino acid group (Fig. 12). However, dependent on sampling date and
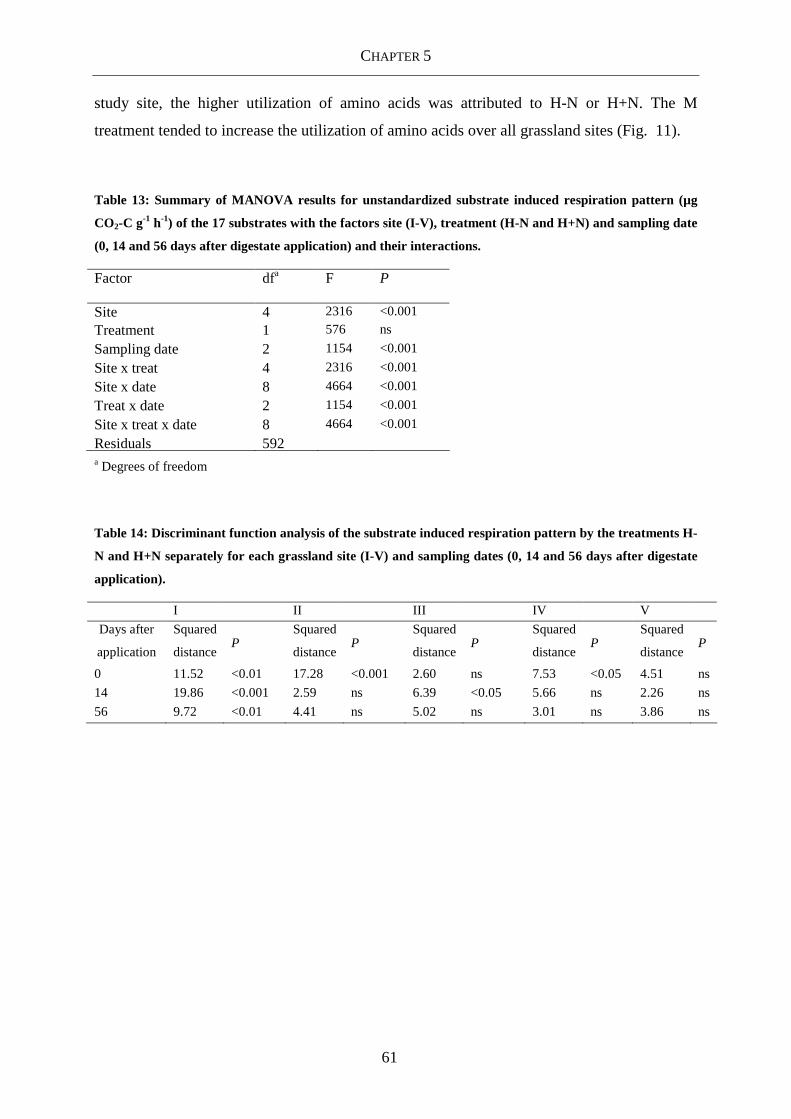
CHAPTER 5
61
study site, the higher utilization of amino acids was attributed to H-N or H+N. The M
treatment tended to increase the utilization of amino acids over all grassland sites (Fig. 11).
Table 13: Summary of MANOVA results for unstandardized substrate induced respiration pattern (µg
CO2-C g-1 h-1) of the 17 substrates with the factors site (I-V), treatment (H-N and H+N) and sampling date
(0, 14 and 56 days after digestate application) and their interactions.
Factor dfa F P
Site 4 2316 <0.001
Treatment 1 576 ns
Sampling date 2 1154 <0.001
Site x treat 4 2316 <0.001
Site x date 8 4664 <0.001
Treat x date 2 1154 <0.001
Site x treat x date 8 4664 <0.001
Residuals 592 a Degrees of freedom
Table 14: Discriminant function analysis of the substrate induced respiration pattern by the treatments H-
N and H+N separately for each grassland site (I-V) and sampling dates (0, 14 and 56 days after digestate
application).
I II III IV V
Days after
application
Squared
distance P
Squared
distance P
Squared
distance P
Squared
distance P
Squared
distance P
0 11.52 <0.01 17.28 <0.001 2.60 ns 7.53 <0.05 4.51 ns
14 19.86 <0.001 2.59 ns 6.39 <0.05 5.66 ns 2.26 ns
56 9.72 <0.01 4.41 ns 5.02 ns 3.01 ns 3.86 ns
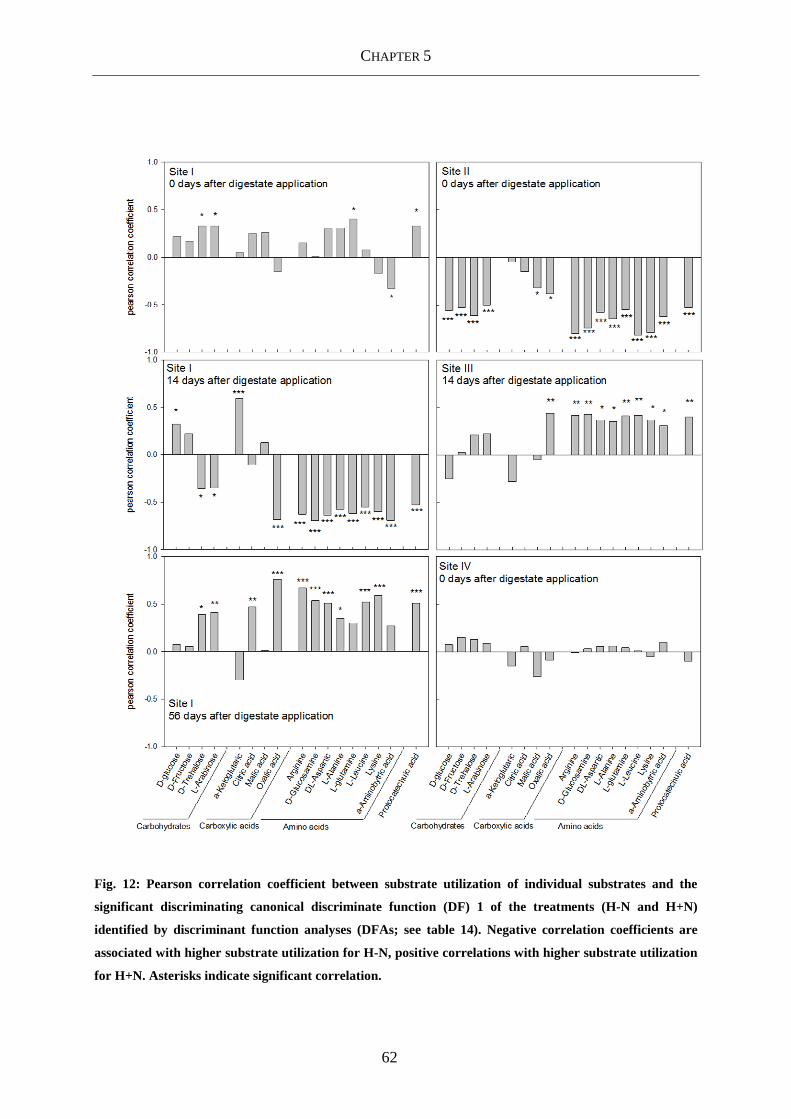
CHAPTER 5
62
Fig. 12: Pearson correlation coefficient between substrate utilization of individual substrates and the
significant discriminating canonical discriminate function (DF) 1 of the treatments (H-N and H+N)
identified by discriminant function analyses (DFAs; see table 14). Negative correlation coefficients are
associated with higher substrate utilization for H-N, positive correlations with higher substrate utilization
for H+N. Asterisks indicate significant correlation.

CHAPTER 5
63
The microbial functional diversity measured by evenness (Esoil) describes the uniformity
of the utilization of carbon substrates by the soil microbial community and ranged from 0.82
to 0.94, and the site-specific average increased in the order II < IV < V < I < III (Fig. 13).
Significant site × treatment × sampling date interaction were caused by a lower Esoil for
treatment H+N for site I and a higher Esoil for site III in comparison with H-N at day 14. The
effect of the M treatment on Esoil varied considerably between the sampling dates for the
single grassland sites, however, on average the M treatment tended not to differ from the
other treatments.
Fig. 13: The evenness indices of soil microbial functional diversity (Esoil) of five grassland sites depending
on treatment and sampling date and the mean values over all sites. Error bars indicate standard
deviations of the means. High evenness values indicate little variation in catabolism of substrates, whereas
low evenness values indicate large variation in catabolism of substrates. Asterisks indicate significant
differences between harvest without nutrient return (H-N) and harvest with nutrient return (H+N) within
one sampling date identified by simple effects ANOVAs. Mulching (M, dashed line) was not statistically
evaluated.

CHAPTER 5
64
5.4 Discussion
5.4.1 Response of aboveground plant parameters to applied treatments
Nutrient return with the IFBB digestate (H+N) and mulching (M) resulted on average in
higher aboveground biomass productivity in comparison with the actual harvesting without
nutrient return (H-N). This is in accordance to studies reporting increases in semi-natural
grassland productivity after mulching (Mašková et al., 2009; Doležal et al., 2011) and
nutrient supply (Briemle, 1997; Lepš, 2004). We showed that both alternative treatments
(H+N and M) have the potential to alter the biomass production of semi-natural grasslands
within three years of application, with mulching tending to increase the biomass production
stronger than digestate application. In consequence, we suggest that IFBB-concept
implementation is of potentially lower ecological impact than mulching, which might promote
eutrophication, nitrate leaching and gaseous emissions (Larsson et al., 1998; Ruhe et al.,
2001). However, this might not be the case for nutrient-poor grassland types with a low
biomass yield potential (about 3 t-1 DM ha-1 a-1). Briemle (1997) reported for Mesobrometum
grassland after 10 years of mulching lower biomass yields compared with mowing and NPK
application. In our study, mulching did not increase biomass production of the nutrient-poor
species-rich Nardus grassland compared with harvesting without nutrient application.
Despite the significant changes in aboveground DM production, there was no effect of
H+N on the composition of plant functional groups and their evenness, indicating no changes
in plant competition at the functional group level after three years. In contrast, mulching
resulted in contradictory results concerning plant functional group composition and evenness
(site I, IV and V). This is in coincidence with Kahmen and Poschlod (2008), which
investigated the response of plant functional traits (e.g. life from, plant height) to management
treatments. They stated to the limitations in finding plant functional responses among
treatments over a broad range of grassland types. However, studies focussing on a single
grassland type (Arrhenaterion), have clearly pointed to the sensitiveness of plant functional
groups to different management treatments. Čámská and Skálová (2012) revealed that
nitrophilous species and tall graminoids increased after harvesting and application of
56 kg N ha-1 a-1 over a period of seven years. Laser (2002) reported lower yield proportions of
legumes and other dicotyledonous species of higher light requirement after mulching due to
litter accumulation and reduced light intensity in the sward. With respect to the measured
aboveground plant functional group three-year response to mulching treatment, the results of

CHAPTER 5
65
our study coincide with other studies, observing that changes in plant species composition and
diversity may occur within 2 to 5 years of mulching or nutrient application (Jacquemyn et al.,
2002; Laser, 2002; Gaisler et al., 2013). On the other hand, Vanderpoorten et al. (2004)
noted that it might take decades of changes in mowing regimes to appear in plant community
shifts. Thus, we cannot exclude that in case of H+N shifts in plant functional group
composition and evenness may occur after a longer application period.
In this study, shifts in plant functional group composition and evenness were detectable
only for mulching compared with mowing, indicating possible changes in ecosystem
conditions. Mulching is generally known to be especially problematic for grassland types with
high aboveground productivity e.g. wetlands (Laser, 2002), where residual biomass increases
nutrient availability and support growth of nitrophilous species (Gaisler et al., 2013).
Negative effects on community composition and diversity depend on litter turnover, which
may take four weeks (Moog et al., 2002) up to one growing season (Mašková et al., 2009)
according to prevailing climate conditions, biomass quantity and quality. In our study litter
accumulation was evident as un-decomposed plant residues were apparent on the mulching
plots after one growing season. With respect to plant functional group composition the
implementation of the IFBB-concept with digestate application would therefore provide a
better alternative to traditional management on semi-natural grassland than mulching.
However, an exception might be low productive grasslands of 2 to 4 t DM ha-1 a-1 (Gaisler
et al., 2013), like the nutrient-poor species-rich Nardus grassland in this study (site IV),
which was even positively influenced in terms of plant functional group evenness by
mulching.
5.4.2 Response of microbial and abiotic soil parameters to applied treatments
Basal respiration differed between the grassland sites according to their SOC content, but
was not altered by any treatment (Fig. 11). In accordance to this, Bardgett et al. (1999) found
in a microcosm experiment that the short-term activity of soil microorganisms in N-limited
upland grasslands was more regulated by plant species traits than by a direct effect of N
application. At the field scale, stronger gradients in management intensity than in our study
may be necessary to cause measurable effects. For example, Grayston et al. (2001) observed
that the microbial biomass and activity was enhanced in temperate improved grasslands
systems compared with un-improved grasslands systems. However, it remains unclear
whether phyto-sociological or nutrient status-related factors cause these differences.

CHAPTER 5
66
Congruent to results from investigations of the H-N treatment plots (Andruschkewitsch
et al., 2014), all of the sites significantly differ in their substrate utilization pattern of selected
substrates identified by discriminant function analyses. Digestate application did not alter the
substrate utilization pattern over the grassland sites and sampling dates but it induced small
and transient differences on the site level. Only the Lowland hay meadow (site I) showed
differences at all three sampling dates. This suggests that the catabolism of the soil microbial
community was persistently influenced by digestate application only at this site. The
individual substrates responsible for the digestate treatment discriminations on the site level
were more frequently assigned to the amino acid group, which is similar to results found after
cattle slurry application to grass-clover and maize monoculture soils (Murugan et al., 2014).
Marshall et al. (2011) found that the amino acid induced respiration was decreased in mineral
NPK-fertilized grassland soil. They suggested that the reason was an increased utilization of
the more easily accessible fertilizer N than the bound amino acid N. However, in our study a
lower utilization of amino acids was associated with either the H-N or the H+N treatment,
depending on grassland site and sampling date. Mulching tended to increase the utilization of
amino acids over the sites, possibly reflecting an increased N-demand of the soil
microorganisms caused by increased aboveground biomass production and plant-soil
competition for N (Harrison et al., 2008). Therefore, the amino acid catabolism of soil
microbial community seems to be most sensitive to changes of grassland management.
Analyses of soil inorganic N and dissolved organic N might be useful to further elucidate
differences in substrate utilization pattern (Jones et al., 2004).
Previous studies have reported that, depending on application rate and experiment
duration, organic fertilizers may reduce the soil microbial catabolic diversity of arable soils in
comparison with unfertilized plots (Romaniuk et al., 2011). Nevertheless, overall our results
indicate that both management treatments did not result in any distinct and lasting changes in
soil catabolic evenness over the entire sampling period. On the site level, however, digestate
application and mulching resulted in transient and inconsistent differences in catabolic
evenness in comparison with the actual conservation management treatment (H-N) throughout
the sampling period. The observed temporal variation in the responses to the management
treatments of both, substrate utilization pattern and catabolic evenness of the soil microbial
community, could neither be explained by variation in the plant functional group composition
and their evenness nor in soil chemical parameters. However, the increase of aboveground
plant biomass production by both management treatments was likely accompanied by changes

CHAPTER 5
67
of the phenological plant development, root/shoot ratio and root system architecture (Fan and
Harris, 1996; Bardgett et al., 1999, Cleland et al., 2006; Mašková et al., 2009). For example,
the root biomass development of typical grass species from extensive semi-natural grassland
systems (T. flavescens and F. rubra rubra), have been observed to decrease by digestate
application in a pot experiment (Andruschkewitsch et al., 2013). In addition, root exudation
also depends on active phases of root growth; during which the release of exudates is high
(Brimecombe et al., 2007). Both in turn may have resulted in spatial and temporal differences
in root exudation between the treatments and thereby altering soil microbial community
(Badri and Vivanco, 2009).
Taken together, the results indicate that catabolic response and evenness of soil microbial
community is resilient to changes in management treatment and is not strongly linked to
aboveground DM yield, but rather depends on temporal shifts in root development and
exudation pattern throughout the growing period. These effects are likely to be most evident
in ecosystems where the soil catabolic evenness is as high (Degens et al., 2000; Degens
et al., 2001) and aboveground biomass is small relative to the root biomass, The latter
account for more than 80-90% of plant carbon stocks in grasslands (Jackson et al., 1996).
Unfortunately, for reasons of experimental design it was not possible to consider
belowground biomass repeatedly over the sampling period. Additional information on the
belowground biomass might help to explain plant-soil interactions in response to the
management treatments.
5.5 Conclusions
The grassland management treatments harvesting with moderate dose digestate
application (H+N) and mulching (M) increased the aboveground plant DM production in
comparison with harvesting without nutrient application (H-N) of different NATURA 2000
grasslands. Further H+N did not lead to shifts in plant functional group composition
(graminoids, forbs, legumes) and evenness, whereas M tended to show contrasting responses
depending on the grassland type. We found that the H+N treatment induced only small and
transient shifts of the microbial substrate utilization pattern, whereas tendencies for an
increased utilization of amino acids were observed for M. Digestate application and mulching
did not lead to consistent temporal effects or lasting changes on soil catabolic evenness,
which indicates a high functional resilience of the grassland soil community. The soil
chemical parameters SOC, total N, C/N and soil pH value were not affected by any treatment.

CHAPTER 5
68
The implementation of the IFBB-concept with recycling 50% of the harvested N by
digestate application may serve as an alternative conservation management to harvesting
without nutrient return. It keeps semi-natural grassland meadows under profitable agricultural
management by enabling bioenergy production from the harvested material and thereby
having no substantial ecologically negative effects. Mulching should be considered with more
caution, due to a stronger impact on aboveground plant community composition (at the plant
functional group level) and on soil microbial substrate catabolism. Studies with an extended
observation period are necessary to confirm these results for nature conservation purposes in
the long term.
6 SYNTHESIS AND GENERAL CONCLUSIONS
69
6 Synthesis and general conclusions
The evaluation of effects of the IFBB digestate on (1) soils planted with different grass
species in comparison to conventional whole crop digestate and mineral N fertilizer and on
(2) different semi-natural grasslands increased the understanding of plant and soil microbial
response to the implementation of the IFBB concept to grasslands. Based on the research
objectives highlighted in Chapter 2, the following synthesis and conclusions can be drawn:
(i) The application of IFBB digestate from separated grass silage (SGD), whole crop
digestate (WCD) and mineral N fertilizer (MIN) to pots planted with different grass
species (L. perenne, F. rubra rubra and T. flavescens) revealed inconsistent effects for
grassland species. In general, harvestable biomass yield was increased by both
digestates. However, the increase was higher for the species from cultivated grassland
systems with high N status (L. perenne) and was modest or, at highest application rates,
even negative for the species cultivated at grassland systems with lower N status
(T. flavescens and F. rubra rubra). This was particularly true for the belowground
biomass yields. The type of digestate (SGD/WCD) affected the N accumulation in the
plant biomass as over all species SGD showed a higher mineral nitrogen use efficiency
(NUEmin) of harvestable and stubble biomass attributed to higher plant N uptake, lower
gaseous N losses and higher N mineralization compared to WCD. This was probably
due to better rheological properties and lower C/Norg ratio of SGD. Therefore, SGD is
suitable as a short-term N fertilizer, which provides the plant with N similar to a mineral
N fertilizer. The N immobilization in microbial biomass, measured as MBN, was highly
affected by grass species but not by the type of digestate or application rates.
(ii) The five investigated low mountain semi-natural grasslands showed consistently high
soil microbial functional diversity (described by evenness of catabolic response to
different carbon substrates) and all differed in their response pattern to the selected
carbon substrates. The data further suggest that the evenness of aboveground plant
functional groups (graminoides, forbs, legumes) and soil microbial functional evenness
are not linked to each other. Although the ranges of soil properties were low, abiotic soil
factors, especially soil pH, were identified as the main factors influencing the soil
substrate utilization pattern and determining soil microbial functional evenness, whereas

6 SYNTHESIS AND GENERAL CONCLUSIONS
70
plant functional group composition, evenness and aboveground plant dry matter
production were less important. However, a single plant functional group may play a
key role, as for instance an increasing legume proportion consistently decreased soil
microbial functional evenness. Furthermore, soil microbial functional evenness depends
on the sampling date, probably driven by temporal changes in source availability.
(iii) The three-year implementation of the management treatments of low dose IFBB
digestate application (H+N) and mulching (M) at five low mountain semi-natural
grasslands increased the annual aboveground plant DM production in comparison with
harvesting without nutrient application (H-N). H+N did not lead to shifts in plant
functional group composition (graminoids, forbs, legumes) and evenness, whereas M
tended to show contrasting responses depending on the grassland type. We found that
the H+N treatment induced only small and transient shifts of the microbial substrate
utilization pattern, whereas tendencies for an increased utilization of amino acids were
observed for M. Digestate application did not lead to consistent temporal effects or
lasting changes on soil microbial catabolic evenness. The soil chemical parameters
SOC, total N, C/N and soil pH value were not affected by any treatment.
Overall, these results indicate that the digestate generated during the IFBB process stands
out from digestates of conventional whole crop digestion on the basis of higher nitrogen use
efficiency and that it is useful for increasing harvestable biomass and the nitrogen content of
the biomass, especially of L. perenne, which is a common species of intensively used
grasslands. This may offer to farmers the possibility to apply organic fertilizer to their
intensively managed grassland in the form of an internally produced digestate from species-
rich grassland biomass from less productive, extensively managed sites. Thus, a basic
requirement in organic farming according to the conservation of biodiversity can be met in a
whole farm approach, without having to relinquish high animal forage benefits. However, a
medium application rate of IFBB digestate (50% of nitrogen removed with harvested
biomass, corresponding to 30-50 kg N ha-1 a-1) may be a possibility for conservation meadow
management without changing the functional above- and belowground characteristic of the
grasslands, thereby offering an ecologically worthwhile alternative to mulching. Overall, the
soil microbial biomass and catabolic performance under planted soil was marginally affected
by digestate application but rather by soil properties and partly by grassland species, legume

6 SYNTHESIS AND GENERAL CONCLUSIONS
71
occurrence, and probably temporal variation in root development and exudation. The
investigated extensively managed meadows revealed a high soil catabolic evenness, which
was resilient to medium IFBB application rate after a three-year period of application.
However, soil properties and/or occurrence of legumes may possibly change due to longer
application periods and higher application rates. In addition to changes in plant community,
soil microbial biomass and its catabolic performance are likely to respond, which could result
in a differentiation from the original plant and soil functional characteristic of conservation
grassland.

7 REFERENCES
72
7 References
Andersen R, Wells C, Macrae M, Price J (2013) Nutrient mineralisation and microbial functional diversity in a restored bog approach natural conditions 10 years post restoration. Soil Biol Biochem 64:37–47
Andruschkewitsch M, Wachendorf C, Sradnick A, Joergensen RG, Wachendorf M (2014) Soil substrate utilization pattern and relation of functional evenness of plant groups and soil microbial community in five low mountain NATURA 2000 grasslands. Plant Soil 383:275–289
Andruschkewitsch M, Wachendorf C, Wachendorf M (2013) Effects of digestates from different biogas production systems on above and belowground grass growth and the nitrogen status of the plant-soil-system. Grassl Sci 59:183–195
Arthurson V (2009) Closing the global energy and nutrient cycles through application of biogas residue to agricultural land – potential benefits and drawbacks. Energies 2:226–242
Bachmann W, Wentzel S, Eichler–Loebermann B (2011) Codigested dairy slurry as a phosphorus and nitrogen source for Zea mays L. and Amaranthus cruentus L. J Plant Nutr Soil Sci 174:908–915
Badri DV, Vivanco JM (2009) Regulation and function of root exudates. Plant Cell Environ 32:666–681
Bardgett RD, Mawdsley JL, Edwards S, Hobbs PJ, Rodwell JS, Davies WJ (1999) Plant species and nitrogen effects on soil biological properties of temperate upland grasslands. Funct Ecol 13:650–660
Beilin R, Lindborg R, Stenseke M, Pereira MH, Llausàs A, Slätmo E, Cerqueira Y, Navarro L, Rodrigues P, Reichelt N, Munro N, Queiroz C (2014) Analysing how drivers of agricultural land abandonment affect biodiversity and cultural landscapes using case studies from Scandinavia, Iberia and Oceania. Land Use Pol 36:60–72
Bezemer TM, Lawson CS, Hedlund K, Edwards AR, Brook AJ, Igual JM, Mortimer SR, van der Putten WH (2006) Plant species and functional group effects on abiotic and microbial soil properties and plant-soil feedback responses in two grasslands. J Ecol 94:893–904
Bittman S, Forge TA, Kowalenko CG (2005) Responses of the bacterial and fungal biomass in a grassland soil to multi–year applications of dairy manure slurry and fertilizer. Soil Biol Biochem 37:613–623
Blumenstein B, Bühle L, Wachendorf M, Möller D (2012) Economic assessment of the integrated generation of solid fuel and biogas from biomass (IFBB) in comparison to different energy recovery, animal-based and non-refining management systems. Biores Technol 119:312–323
Brackin R, Robinson N, Lakshmanan P, Schmidt S (2013) Microbial function in adjacent subtropical forest and agricultural soil. Soil Biol Biochem 57:68–77
Briemle G (1997) Wieviel Düngung "verträgt" ein artenreicher Kalkmagerrasen der Schwäbischen Alb? Veröffentlichung Naturschutz Landschaftspflege Baden-Württemberg 1:201-225 (In German)
Briemle G (2005) Effekte einer Grünland-Mindestpflege nach „Cross-Compliance“. Ber Landwirtschaft 83:376–387 (In German)
Brimecombe MJ, de Leij FA, Lynch JM (2007) Rhizodeposition and microbial populations. In The Rhizosphere, Biochemistry and Organic Substances at the Soil–Plant Interface, 2nd edn., Marcel Dekker, New York, pp 73–140

7 REFERENCES
73
Brodie E, Edwards S, Clipson N (2003) Soil fungal community structure in a temperate upland grassland soil. FEMS Microbiol Ecol 45:105–114
Bühle L (2008) Vergleichende Energie– und Emissionsbilanz der Wärme– und Stromproduktion nach dem IFBB–Verfahren und herkömmlicher Ganzpflanzenvergärung. Master thesis, Kassel, Germany, University of Kassel, 1–77 (In German)
Buyer JS, Drinkwater LE (1997) Comparison of substrate utilization assay and fatty acid analysis of soil microbial communities. J Microbiol Meth 30:3–11
Campbell CD, Chapman SJ, Cameron CM, Davidson MS, Potts JM (2003) A rapid microtitre plate method to measure carbon dioxide evolved from carbon substrate amendments so as to determine the physiological profiles of soil microbial communities by using whole soil. Appl Environ Microbiol 69:3593–3599
Campbell CD, Grayston SJ, Hirst DJ (1997) Use of rhizosphere carbon sources in sole carbon source tests to discriminate soil microbial communities. J Microbiol Meth 30:33–41
Čámská K, Skálová H (2012) Effect of low-dose N application and early mowing on plant species composition of mesophilous meadow grassland (Arrhenatherion) in Central Europe. Grass For Sci 67:403–410
Chaparro JM, Badri DV, Bakker MG, Sugiyama A, Manter DK, Vivanco JM (2013) Root exudation of phytochemicals in Arabidopsis follows specific patterns that are developmentally programmed and correlate with soil microbial functions. PLoS One 8:e55731
Cleland EE, Chiaiello NR, Loarie SR, Mooney HA, Field CB (2006) Diverse response of phenology to global changes in a grassland ecosystem. Proc. Nat. Acad. Sci. USA 103:13740–13744
Davies A, Baker RD, Grant SA, Laidlaw AS (1993) Sward measurement handbook, 2nd edn., British Grassland Society, Reading, p 319
De Boer HC (2008) Co–digestion of animal slurry can increase short–term nitrogen recovery by crops. J Environ Qual 37:1968–1973
De Cauwer B, Reheul D, Nijs I, Milbau A (2005) Dry matter yield and herbage quality of field margin vegetation as a function of vegetation development and management regime. NJAS - Wageningen J Life Sci 54:37–60
De Deyn GB, Cornelissen JHC, Bardgett RD (2008) Plant functional traits and soil carbon sequestration in contrasting biomes. Ecol Lett 11:516–531
Degens BP, Harris JA (1997) Development of a physiological approach to measuring the catabolic diversity of soil microbial communities. Soil Biol Biochem 29:1309–1320
Degens BP, Schipper LA, Sparling GP, Duncan LC (2001) Is the microbial community in a soil with reduced catabolic diversity less resistant to stress or disturbance? Soil Biol Biochem 33:1143–1153
Degens BP, Schipper LA, Sparling GP, Vojvodic-Vukovic M (2000) Decreases in organic C reserves in soils can reduce the catabolic diversity of soil microbial communities. Soil Biol Biochem 32:189–196
Dick RP (1992) A review – Long–term effects of agricultural systems on soil biochemical and microbial parameters. Agric Ecosyst Environ 40:25–36
Dijkstra FA, Hobbie SE, Reich PB (2006) Soil processes affected by sixteen grassland species grown under different environmental conditions. Soil Sci Soc Am J 70:770–777
Doležal J, Mašková Z, Lepš J, Steinbachová D, de Bello F, Klimešová J, Tackenberg O, Zemek F, Květ J (2011) Positive long-term effect of mulching on species and functional trait diversity in a nutrient-poor mountain meadow in Central Europe. Agric Ecosyst Environ 145:10–28
Draper NR, Smith H (1998) Applied regression analysis, 3rd edn, John Wiley & Sons, New York

7 REFERENCES
74
Drobnik J, Römermann C, Bernhardt-Römermann M, Poschlod P (2011) Adaptation of plant functional group composition to management changes in calcareous grassland. Agric Ecosyst Environ 145:29–37
Eisenhauer N, Beßler H, Engels C, Gleixner G, Habekost M, Milcu A, Partsch S, Sabais A, Scherber C, Steinbeiss S (2010) Plant diversity effects on soil microorganisms support the singular hypothesis. Ecology 91:485–496
Eisenhauer N, Migunova VD, Ackermann M, Ruess L, Scheu S (2011) Changes in plant species richness induce functional shifts in soil nematode communities in experimental grassland. PLoS One 6:e24087
Eisenhauer N, Reich PB, Scheu S (2012) Increasing plant diversity effects on productivity with time due to delayed soil biota effects on plants. Basic Appl Ecol 13:571–578
Ellenberg H, Leuschner C (2010) Vegetation Mitteleuropas mit den Alpen in ökologischer, dynamischer und historischer Sicht, 6nd edn, UTB, Stuttgart (In German)
Elsässer M (2003) Möglichkeiten der Verwendung alternativer Verfahren zur Verwertung von Grünlandmähgut: Verbrennen, Vergären, Kompostieren. Berichte über Landwirtschaft 4:512–526 (In German)
Elsässer M, Kunz HG, Briemle G (1995) Unterschiedliche technische Behandlungen von Gülle und deren Auswirkungen auf intensiv genutztes Dauergrünland. J Agro Crop Sci 174:253–264 (In German with English abstract)
Ernst G, Mueller A, Goehler H, Emmerling C (2008) C and N turnover of fermented residues from biogas plants in soil in the presence of three different earthworm species (Lumbricus terrestris, Aporrectodea longa, Aporrectodea caliginosa). Soil Biol Biochem 40:1413–1420
Estavillo JM, Rodriguez M, Lacuesta M, Gonzalez-Murua C (1997) Effects of cattle slurry and mineral N fertilizer applications on various components of the nitrogen balance of mown grassland. Plant Soil 188:49–58
Eviner VT, Chapin FS, Vaughn CE (2006) Seasonal variations in plant species effects on soil N and P dynamics. Ecology 87:974–986
Fan J, Harris W (1996) Effects of soil fertility level and cutting frequency on interference among Hieracium pilosella, H. praealtum, Rumex acetosella, and Festuca novae-zelandiae. New Zealand J Agric Res 39:1–32
Fangueiro D, Gusmao M, Grilo J, Porfirio G, Vasconcelos FC (2010) Proportion, composition and potential N mineralisation of particle size fraction obtained by mechanical separation of animal slurry. Biosystems Eng 106:333–337
Field A, Miles J, Field Z (2012) Discovering statistics using R, 2nd edn. SAGE, Los Angeles, London, New Delhi, Singapore, Washington DC
Fonesca CR, Ganade G (2001) Species functional redundancy, random extinctions and the stability of ecosystems. J Ecol 89:118–125
Gaisler J, Pavlů V, Pavlů L, Heijman M (2013) Long-term effects of different mulching and cutting regimes on plant species composition of Festuca rubra grassland. Agric Ecosyst Environ 178:10–17
García-Palacios P, Maestre FT, Gallardo A (2011) Soil nutrient heterogeneity modulates ecosystem responses to changes in the identity and richness of plant functional groups. J Ecol 99:551–562
Garg RN, Pathak H, Das DK, Tomar RK (2005) Use of flyash and biogas slurry for improving wheat yield and physical properties of soil. Environ Monit Assess 107:1–9
Gastal F, Dawson LA, Thornton B (2010) Responses of plant traits of four grasses from contrasting habitats to defoliation and N supply. Nutr Cycling Agroecosyst 88:245–258

7 REFERENCES
75
Geisseler D, Horwath WR, Joergensen RG, Ludwig B (2010) Pathways of nitrogen utilization by soil microorganisms – A review. Soil Biol Biochem 42:2058–2067
Gericke D, Pacholski A, Henning K (2007) NH3-Emissionen bei der ackerbaulichen Nutzung von Gärrückständen aus Biogasanlagen. Mitteilungen der Gesellschaft für Pflanzenbauwissenschaften 19:1-2 (In German)
Giller KE, Beare MH, Lavelle P, Izac AMN, Swift MJ (1997) Agricultural intensification, soil biodiversity and agroecosystem function. Appl Soil Ecol 6:3–16
Gömöryová E, Strelcová K, JSkvarenina J, Gömöry D (2013) Responses of soil microorganisms and water content in forest floor horizons to environmental factors. Eur J Soil Biol 55:71–76
Graham MH, Haynes RJ (2005) Catabolic diversity of soil microbial communities under sugarcane and other land uses estimated by Biolog and substrate-induced respiration methods. Appl Soil Ecol 29:155–164
Grayston SJ, Campbell CD, Bardgett RD, Mawdsley JL, Clegg CD, Ritz K, Griffiths BS, Rodwell JS, Edwards SJ, Davies WJ, Elston DJ, Millard P (2004) Assessing shifts in microbial community structure across a range of grasslands of differing management intensity using CLPP, PLFA and community DNA techniques. Appl Soil Ecol 25:63–84
Grayston SJ, Griffith GS, Mawdsley JL, Campbell CD, Bardgett RD (2001) Accounting for variability in soil microbial communities of temperate upland grassland ecosystems. Soil Biol Biochem 33:533–551
Gunnarsson A, Bengtsson F, Caspersen S (2010) Use efficiency of nitrogen from biodigested plant material by ryegrass. J Plant Nutr Soil Sci 173:113–119
Gutser R, Ebertseder T, Weber A, Schraml M, Schmidhalter U (2005) Short–term and residual availability of nitrogen after long–term application of organic fertilizers on arable land. J Plant Nutr Soil Sci 168:439–446
Habekost M, Eisenhauer N, Scheu S, Steinbeiss S, Weigelt A, Gleixner G (2008) Seasonal changes in the soil microbial community in a grassland plant diversity gradient four years after establishment. Soil Biol Biochem 40:2588–2595
Harrison KA, Bardgett RD (2010) Influence of plant species and soil conditions on plant-soil feedback in mixed grassland communities. J Ecol 98:384-395
Harrison KA, Bol R, Bardgett RD (2008) Do plant species with different growth strategies vary in their ability to compete with soil microbes for chemical forms of nitrogen? Soil Biol Biochem 40:288–237
Hedlund K (2002) Soil microbial community structure in relation to vegetation management on former agricultural land. Soil Biol Biochem 34:1299–1307
Hensgen F, Bühle L, Donnison I, Frasier M, Vale J, Corton J, Heinsoo K, Melts I, Wachendorf M (2012) Mineral concentrations in solid fuels from European semi-natural grasslands after hydrothermal conditioning and subsequent mechanical dehydration. Bioresource Technol 118:332–342
Hertenberger G, Zampach P, Bachmann G (2002) Plant species affect the concentration of free sugars and free amino acids in different types of soil. J Plant Nutr Soil Sci 165:557–565
Hoffmann G (1991) VDLUFA-Methodenbuch Band 1: Die Untersuchung von Böden. VDLUFA-Verlag, Darmstadt, Germany (In German)
Hopkins A (2009) Relevance and functionality of semi-natural grassland in Europe –status quo and future prospective. In: International Workshop of the SALVERE-Project 2009, Agricultural Research and Education Centre Raumberg-Gumpenstein, 9-14

7 REFERENCES
76
ISO 10304 (2009) Water quality – Determination of dissolved anions by liquid chromatography of ions – Part 1: Determination of bromide, chloride, fluoride, nitrate, nitrite, phosphate and sulfate. Beuth–Verlag, Berlin, Germany
ISO 11885 (2009) Water quality – Determination of selected elements by inductively coupled plasma optical emission spectrometry. Beuth–Verlag, Berlin, Germany
Isselstein J, Jeangros B, Pavlů V (2005) Agronomic aspects of biodiversity targeted management of temperate grasslands in Europe – A review Agron Res 3:139–151
IUSS (IUSS Working Group WRB) (2007) World Reference Base for Soil Resources2006, first update 2007, World Soil Resources Reports No. 103, FAO, Rome
Jackson RB, Canadell J, Ehlringer JR, Mooney HA, Sala OE, Schulze ED (1996) A global analysis of root distributions for terrestrial biomes. Oecologica 108:389–411
Jacquemyn H, Brys R, Hermy M (2002) Short-term effects of different management regimes on the response of calcareous grassland vegetation to increased nitrogen. Biol Conserv 111:137–147
Joergensen RG, Mueller T (1996) The fumigation–extraction method to estimate soil microbial biomass: Calibration of the k(EN) value. Soil Biol Biochem 28:33–37
Johnson D, Phoenix GK, Grime JP (2008) Plant community composition, not diversity, regulates soil respiration in grasslands. Biol Lett 4:345–348
Jones DL, Shannon D, Murphy DV, Farrar J (2004) Role of dissolved organic nitrogen (DON) in soil N cycling in grassland soils. Soil Biol Biochem 36:749–756
Kahmen S, Poschlod P (2008) Effects of grassland management on plant functional trait composition. Agric Ecosyst Environ 128:137–145
Kandeler E, Eder G, Sobotik M (1994) Microbial biomass, N–mineralization, and the activities of various enzymes in relation to nitrate leaching and root distribution in a slurry–amended grassland. Biol Fertil Soils 18:7–12
Kemmit SJ, Wright D, Keith W.T. Goulding KWT, Jones DL (2006) pH regulation of carbon and nitrogen dynamics in two agricultural soils. Soil Biol Biochem 38:898–911
Khalsa J, Fricke T, Weisser WW, Weigelt A, Wachendorf M (2012) Effects of functional groups and species richness on biomass constituents relevant for combustion: results from a grassland diversity experiment. Grass Forage Sci 6:569–588
King M (2010) An Investigation into Policies Affecting Europe’s Semi-Natural Grasslands. Eastleigh, Hampshire, UK
Kirkham FW, Tallowin JRB, Sanderson RA, Bhogal A, Chambers BJ, Stevens DP (2008) The impact of organic and inorganic fertilizers and lime on the species-richness and plant functional characteristics of hay meadow communities. Biol Conserv 143:1411–1427
Lalor BM, Cookson WR, Murphy DV (2007) Comparison of two methods that assess soil community level physiological profiles in a forest ecosystem. Soil Biol Biochem 39:454–462
Larsson L, Ferm M, Kasimir-Klemedtsoon Å, Klemedtsson L (1998) Ammonia and nitrous oxide emissions from grass and alfalfa mulches. Nutr Cycl Agroecosyst 51:41-46
Laser H (2002) Long-term and short-term effects of undisturbed plant succession, mulching and meadow utilisation on the botanical diversity in a moist Arrhenatherion elatioris. In: Proc. 19th EGF Meeting, la Rochelle, Grassland Sci Eur 7, 27–30 May, 2002, pp. 806–807
Lepš J (2004) Variability in population and community biomass in a grassland community affected by environmental productivity and diversity. Oikos 107:64–71

7 REFERENCES
77
Liliensiek AK, Thakuria D, Clipson N (2012) Influences of plant species composition, fertilisation and Lolium perenne ingression on soil microbial community structure in three Irish grasslands. Microb Ecol 63:509–521
Lindemann-Matthies P, Junge X, Matthies D (2010) The Influence of plant diversity on people's perception and aesthetic appreciation of grassland vegetation. Biol Conserv 143:195–202
Linke B, Heiermann M, Plöchl M, Kenkmann T, Höhne B, Dahle S (2006) Biogas in der Landwirtschaft. Leitfaden für Landwirte und Investoren im Land Brandenburg (In German)
Liu Z, Liu G, Fu B, Zheng X (2008) Relationship between plant species diversity and soil microbial functional diversity along a longitudinal gradient in temperate grasslands of Hulunbeir, Inner Mongolia. China Ecol Res 23:511–518
Loranger-Merciris G, Barthes L, Gastine A, Leadley P (2006) Rapid effects of plant species diversity and identity on soil microbial communities in experimental grassland ecosystems. Soil Biol Biochem 38:2336–2343
Loreau M, Naeem S, Inchausti P, Bengtsson J, Grime JP, Hector A, Hooper DU, Huston MA, Raffaelli D, Schmid B, Tilman D, Wardle DA (2001) Biodiversity and ecosystem functioning: Current knowledge and future challenges. Sience 294:804–808
Malchair S, de Boeck HJ, Lemmens CMHM, Ceulemans R, Merckx R, Nijs I, Carnol M (2010) Diversity–function relationship of ammonia-oxidizing bacteria in soils among functional groups of grassland species under climate warming. Appl Soil Ecol 44:15–23
Marschner P, Yang CH, Lieberei R, Crowley D (2004) Soil and plant specific effects on bacterial community in composition in the rhizosphere. Soil Biol Biochem 33:14337–1445
Marshall CB, McLaren JR, Turkington R (2011) Soil microbial communities resistant to changes in plant functional group composition. Soil Biol Biochem 43:78–85
Mašková Z, Doležal J, Květ J, Zemek F (2009) Long-term functioning of a species-rich mountain meadow under different management regimes. Agric Ecosyst Environ 132:192–202
Meier CL, Suding KN, Bowman WD (2008) Carbon flux from plants to soil: roots are a below-ground source of phenolic secondary compounds in an alpine ecosystem. J Ecol 96:421–430
Merz HU, Trösch W (1989) Vergleichende Untersuchungen zur N–Bilanz unter Dactylis glomerata L. nach Gülle–, Biogas–Gülle und Mineraldüngung. 1. Mitteilung: TM–Erträge und N–Entzüge. Das wirtschaftseigene Futter 35:205–225 (In German)
Millard P, Singh BK (2010) Does grassland vegetation drive soil microbial diversity? Nutr Cycl Agroecosyst 88:147–158
Mokry M, Kluge R (2009) Inhaltsstoffe von Gärprodukten sowie Möglichkeiten zu ihrer geordneten pflanzenbaulichen Verwertung. Ladinfo 1:1-5 (In German)
Möller K, Müller T (2012) Effects of anaerobic digestion on digestate nutrient availability and crop growth: A review. Eng Life Sci 12:242–257
Möller K, Stinner W, Deuker A, Leithold G (2008) Effects of different manuring systems with and without biogas digestion on nitrogen cycle and crop yield in mixed organic dairy farming systems. Nutr Cycl Agroecosyst 82:209–232
Moog D, Poschlod P, Kahmen S, Schreiber KF (2002) Comparison of species composition between different grassland management treatments after 25 years. Appl Sci 5:99–106
Murugan R, Loges R, Taube F, Sradnick A, Joergensen RG (2014) Changes in soil microbial biomass and residual indices as ecological indicators of land use change in temperate permanent grassland. Microb Ecol 67:907–918
Nelder JA, Lane PW (1995) The computer analysis of factorial experiments. In memoriam—Frank Yates. The American Statistician 49:382–385
7 REFERENCES
78
Odlare M, Pell M, Svensson K (2008) Changes in soil chemical and microbiological properties during 4 years of application of various organic residues. Waste Manage (Oxford) 28:1246–1253
Papatheodorou EM, Kordatos H, Kouseras T, Monokrousos N, Menkissoglu-Spiroudi U, Diamantopoulos J, Stamou GP, Argyropoulou MD (2012) Differential responses of structural and functional aspects of soil microbes and nematodes to abiotic and biotic modifications of the soil environment. Appl Soil Ecol 61:26–33
Peters K, Jensen LS (2011) Biochemical characteristics of solid fractions from animal slurry separation and their effects on C and N mineralisation in soil. Biol Fertil Soils 47:447–455
PIK 2009. Protected areas in Germany under global change – Risks and policy options. Potsdam Institute for Climate Impact Research. <http://www.pik-potsdam.de/~wrobel/sg-klima-3/landk/Vogelsbergkreis.html> (accessed 21.02.14)
Poschlod P, Bakker JP, Kahmen S (2005) Changing land use and its impact on biodiversity. Basic Appl Ecol 6:93–98
Prochnow A, Heiermann M, Plöchl M, Amon T, Hobbs PJ (2009b) Bioenergy from permanent grassland – A review: 2. Combustion. Biores Technol 100:4945–4954
Prochnow A, Heiermann M, Plöchl M, Linke B, Idler C, Amon T, Hobbs PJ (2009a) Bioenergy from permanent grassland – A review: 1. Biogas. Biores Technol 100:4931–4944
R Development Core Team (2011) R A language and environment for statistical computing. R Foundation for Statistical Computing Vienna, Austria, available from URL: http://www.r-project.org (accessed 10 December 2012)
Richter F, Fricke T, Wachendorf M (2010) Utilization of semi–natural grassland through integrated generation of solid fuel and biogas from biomass. III. Effects of hydrothermal conditioning and mechanical dehydration on solid fuel properties and on energy and greenhouse gas balances. Grass Forage Sci 65:185–199
Richter F, Fricke T, Wachendorf M (2011) Influence of sward maturity and pre–conditioning temperature on the energy production from grass silage through the integrated generation of solid fuel and biogas from biomass (IFBB): 2. Properties of energy carriers and energy yield. Bioresour Technol 102:4866–4875
Richter F, Grass R, Fricke T, Zerr W, Wachendorf M (2009) Utilization of semi–natural grassland through integrated generation of solid fuel and biogas from biomass. II. Effects of hydrothermal conditioning and mechanical dehydration on anaerobic digestion of press fluids. Grass Forage Sci 64:354–363
Romaniuk R, Giuffré L, Costantini A, Nannipieri P (2011) Assessment of soil microbial diversity measurements as indicators of soil functioning in organic and conventional horticulture systems. Ecological Indicators 11:1345-1353
Rösch C, Skarka J, Raab K, Stelzer V (2009) Energy production from grassland –assessing the sustainability of different process chains under German conditions. Biomass Bioenergy 33:689–700
Rothstein DE (2010) Effects of amino-acid chemistry and soil properties on the behaviour of free amino acids in acidic forest soils. Soil Biol Biochem 42:1743–1750
Rudrappa T, Czymme KJ, Paré PW, Bais HP (2008) Root-secreted malic acid recruits beneficial soil bacteria. Plant Physiology 148:1547–1556
Ruhe I, Loges R, Taube F (2001) Vergleichende Analyse der N-Flüsse von Fruchtfolgen N-intensiver und N-extensiver ökologischer Produktionssysteme unter besonderer Berücksichtigung der Nitratverluste. In: Reents HJ (Eds.), Beiträge zur 6. Wissenschaftstagung zum Ökologischen Landbau, 237–240 (In German)

7 REFERENCES
79
Salminen E, Rintala J, Harkonen J, Kuitunen M, Hogmander H, Oikari A (2001) Anaerobically digested poultry slaughterhouse wastes as fertiliser in agriculture. Bioresour Technol 78:81–88
Samuil C, Vintu V, Sibru C, Stavarache M (2013) Influence of fertilizers on the biodiversity of semi-natural grassland in the eastern Carpathians. Notulae Botanicae Horti Agrobotanici Cluj-Napoca 41:195–200
Schläpfer F, Schmid B, Seidl I (1999) Expert estimates about effects of biodiversity on ecosystem processes and services. Oikos 84:346–352
Schüpbach B, Grüning A, Walter T (2004) Grassland and landscape aesthetics. Grassland Sci Eur 9:186–188
Singh KA (1996) Effect of age, cutting interval, nitrogen and farmyard manure on root–growth parameters of forage grasses in an acid Inceptisol. Indian J Agric Sci 66:38–44
Sowers KE, Pan WL, Miller BC, Smith JL (1994) Nitrogen use efficiency of split nitrogen applications in soft white winter wheat. Agron J 86:942–948
Sradnick A, Murugan R, Oltmanns M, Raupp J, Joergensen RG (2013) Changes in functional diversity of the soil microbial community in a heterogeneous sandy soil after long-term fertilization with cattle manure and mineral fertilizer. Appl Soil Ecol 63:23–28
Stephan A, Meyer AH, Schmid B (2000) Plant diversity affects culturable soil bacteria in experimental grassland communities. J Ecol 88:988–998
Stevenson B, Sparling G, Schipper L, Degens B, Duncan L (2004) Pasture and forest soil microbial communities show distinct patterns in their catabolic respiration responses at a landscape scale. Soil Biol Biochem 36:49–55
Strahm BD, Harrison RB (2007) Controls on the sorption, desorption, and mineralization of low-molecular-weight organic acids in variable-charge soils. Soil Sci Soc Am J 72:1653–1664
Strijker D (2005) Marginal lands in Europe - causes of decline. Basic Appl Ecol 6:99–106
Tambone F, Scaglia B, D‘Imporzano G, Schievano A, Salati S, Adani F (2010) Assessing amendment and fertilizing properties of digestates from anaerobic digestion through a comparative study with digested sludge and compost. Chemosphere 81:577–583
Terhoeven–Urselmans T, Scheller E, Raubuch M, Ludwig B, Joergensen RG (2009) CO2 evolution and N mineralization after biogas slurry application in the field and its yield effects on spring barley. Appl Soil Ecol 42:297–302
Uhlířova E, Šimek M, Šantrůčková H (2005) Microbial transformation of organic matter in soils of montane grasslands under different management. Appl Soil Ecol 28:225–235
Van der Heijden MGA, Kliromonos JN, Ursic M, Moutoglis P, Streitwolf-Engel R, Boller T, Wiemken A, Sanders IR (1998) Myccorhizal fungal diversity determines plant biodiversity, ecosystem variability and productivity. Nature 396:69–72
Van Eekeren N, De Boer H, Bloem J, Schouten T, Rutgers M, de Goede R, Brussaar L (2009) Soil biological quality of grassland fertilized with adjusted cattle manure slurries in comparison with organic and inorganic fertilizers. Biol Fertil Soils 45:595–608
Vanderpoorten A, Delescaille LM, Jacquemart AL (2004) The bryophyte layer in a calcareous grassland after a decade of contrasting mowing regimes. Biol Conserv 117:11–18
Wachendorf M, Richter F, Fricke T, Grass R, Neff R (2009) Utilization of semi–natural grassland through integrated generation of solid fuel and biogas from biomass. I. Effects of hydrothermal conditioning and mechanical dehydration on mass flows of organic and mineral plant compounds, and nutrient balances. Grass Forage Sci 64:132–143

7 REFERENCES
80
Wardle DA, Bonner KI, Barker GM, Yeates GW, Nicholson KS, Bardgett RD, Watson RN, Ghani A (1999) Plant removals in perennial grassland: Vegetation dynamics, decomposers, soil biodiversity, and ecosystem properties. Ecol Monogr 69:535–568
Weiland P (2010) Biogas production: Current state and perspectives. Appl Microbiol Biotechnol 85:849–860
Whipps JM (1990) Carbon economy. In: The Rhizosphere ed. JM Lynch. Pp 59-97. John Wiley & Sons Ltd. Essex UK.
White TA, Barker DJ, Moore KJ (2004) Vegetation diversity, growth, quality and decomposition in managed grasslands. Agric Ecosyst Environ 101:73–84
Widmer P, Brookes PC, Parry LC (1989) Microbial biomass nitrogen measurements in soils containing large amounts of inorganic nitrogen. Soil Biol Biochem 21:865–867
Wittebolle L, Marzorati M, Clement L, Balloi A, Daffonchio D, Heylen K, De Vos P, Verstraete W, Boon N (2009) Initial community evenness favours functionality under selective stress. Nature 458:623–626
Wrage N, Strodthoff J, Cuchillo MH, Isselstein J, Kayser M (2011) Phytodiversity of temperate permanent grasslands: Ecosystem services for agriculture and livestock management for diversity conservation. Biodivers Conserv, 20:3317–3339
www.prograss.eu (accessed 18.09.2014)
Zah R, Böni H, Gauch M, Hischier R, Lehmann M, Wäger P (2007) Ökobilanz von Energieprodukten – Ökologische Bewertung von Biotreibstoffen. Study of the EMPA, Zürich/St. Gallen/Dübendorf, Switzerland, available from URL: http://www.news-service.admin.ch/NSBSubscriber/message/attachments/8514.pdf (accessed 10 December 2012) (In German)
Zak DR, Holmes WE, White DC, A.D. Peacock AD, Tilman D (2003) Plant diversity, soil microbial communities, and ecosystem function: Are there any links? Ecology 84:2042–2050
Zak JC, Willig MR, Moorhead DL, Wildman HG (1994) Functional diversity of microbial communities: a quantitative approach. Soil Biol Biochem 26:1101–1108
Zhang CB, Ke SS, Wang J, Ge Y, Chang SX, Zhu SX, Chang J (2011) Responses of microbial activity and community metabolic profiles to plant functional group diversity in a full-scale constructed wetland. Geoderma 160:503–508