carbon and nitrogen relations among soils, …pub.epsilon.slu.se/609/1/silvestria314.pdfabstract...
TRANSCRIPT
Carbon and Nitrogen Relations among Soils, Microbes and Plants in Boreal Forests
Mona Nordström Högberg Department of Forest Mycology and Pathology
Uppsala
Doctoral thesis
Swedish University of Agricultural Sciences
Uppsala 2004
Acta Universitatis Agriculturae Sueciae
Silvestria 314
ISSN 1401-6230 ISBN 91-576-6548-6 © 2004 Mona Nordström Högberg Printed by: SLU, Grafiska enheten, Umeå, Sweden, 2004
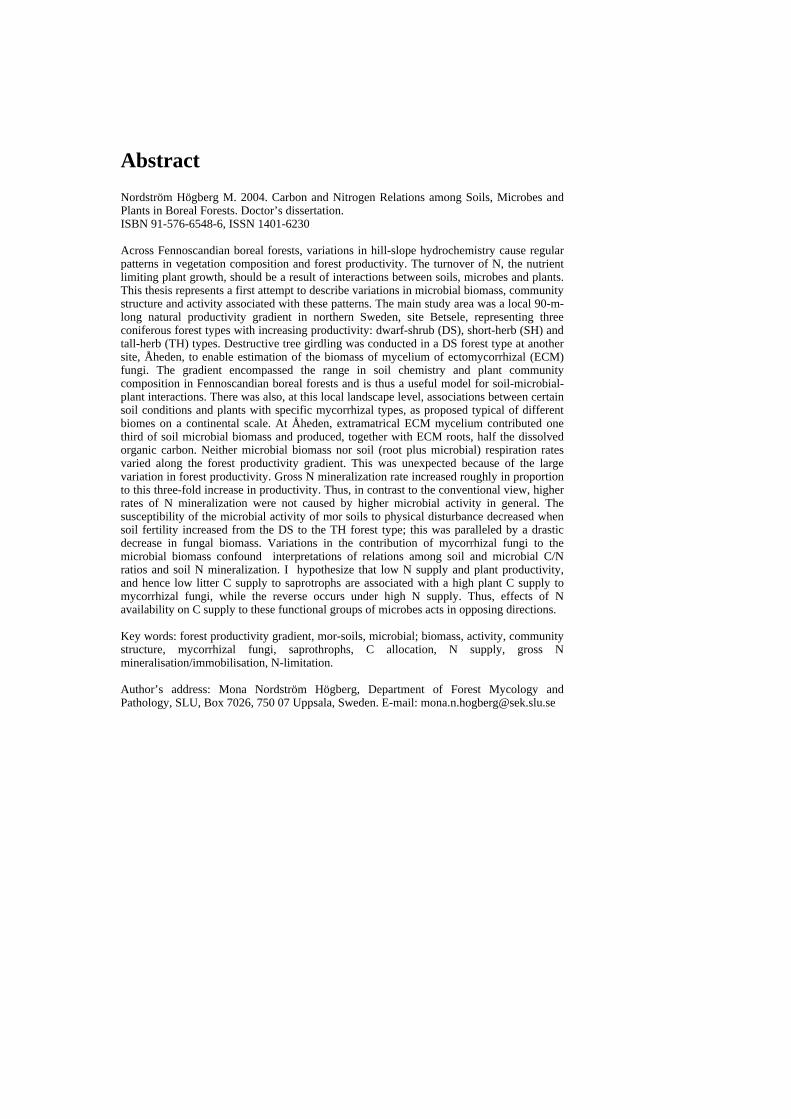
Abstract Nordström Högberg M. 2004. Carbon and Nitrogen Relations among Soils, Microbes and Plants in Boreal Forests. Doctor’s dissertation. ISBN 91-576-6548-6, ISSN 1401-6230 Across Fennoscandian boreal forests, variations in hill-slope hydrochemistry cause regular patterns in vegetation composition and forest productivity. The turnover of N, the nutrient limiting plant growth, should be a result of interactions between soils, microbes and plants. This thesis represents a first attempt to describe variations in microbial biomass, community structure and activity associated with these patterns. The main study area was a local 90-m-long natural productivity gradient in northern Sweden, site Betsele, representing three coniferous forest types with increasing productivity: dwarf-shrub (DS), short-herb (SH) and tall-herb (TH) types. Destructive tree girdling was conducted in a DS forest type at another site, Åheden, to enable estimation of the biomass of mycelium of ectomycorrhizal (ECM) fungi. The gradient encompassed the range in soil chemistry and plant community composition in Fennoscandian boreal forests and is thus a useful model for soil-microbial-plant interactions. There was also, at this local landscape level, associations between certain soil conditions and plants with specific mycorrhizal types, as proposed typical of different biomes on a continental scale. At Åheden, extramatrical ECM mycelium contributed one third of soil microbial biomass and produced, together with ECM roots, half the dissolved organic carbon. Neither microbial biomass nor soil (root plus microbial) respiration rates varied along the forest productivity gradient. This was unexpected because of the large variation in forest productivity. Gross N mineralization rate increased roughly in proportion to this three-fold increase in productivity. Thus, in contrast to the conventional view, higher rates of N mineralization were not caused by higher microbial activity in general. The susceptibility of the microbial activity of mor soils to physical disturbance decreased when soil fertility increased from the DS to the TH forest type; this was paralleled by a drastic decrease in fungal biomass. Variations in the contribution of mycorrhizal fungi to the microbial biomass confound interpretations of relations among soil and microbial C/N ratios and soil N mineralization. I hypothesize that low N supply and plant productivity, and hence low litter C supply to saprotrophs are associated with a high plant C supply to mycorrhizal fungi, while the reverse occurs under high N supply. Thus, effects of N availability on C supply to these functional groups of microbes acts in opposing directions. Key words: forest productivity gradient, mor-soils, microbial; biomass, activity, community structure, mycorrhizal fungi, saprothrophs, C allocation, N supply, gross N mineralisation/immobilisation, N-limitation. Author’s address: Mona Nordström Högberg, Department of Forest Mycology and Pathology, SLU, Box 7026, 750 07 Uppsala, Sweden. E-mail: [email protected]

To my beloved family: Gunvor John My dear husband Peter and our children Axel, Jon-Isak and Fredrika
Contents Introduction, 7
C and N links, soil, microbes and plants, 7 Mycorrhizal fungi and the N cycle, 9 Objectives, 11
Methodological considerations, 12
Study site descriptions, 12 The natural forest productivity gradient: Site Betsele, 12 The forest girdling experiment: Site Åheden, 14
Methods applied, 14 Site Betsele, 14 Site Åheden, 19
Results and discussion, 19
The natural forest productivity gradient: Soil chemistry and plants, 19
Soils, 19 Plants, 21 A landscape perspective on soil conditions and plant community composition, 22
The forest girdling experiment, 24 The contribution by ectomycorrhizal mycelium to microbial biomass and DOC, 24
The natural forest productivity gradient: Soil microbiology, 25
Microbial biomass C and N, 25 Microbial activity, 27 Microbial community structure, 29 Comparison between the F and H horizons, 30 N turnover in soils, 30
Hypothesis, 34 Concluding remarks and future perspectives, 36 References, 37 Acknowledgements, 44
Appendix Papers I-V The thesis is based on the following papers, which will be referred to by their Roman numerals:
I. Giesler, R., Högberg, M. and Högberg, P. (1998). Soil chemistry and plants in Fennoscandian boreal forest as exemplified by a local gradient. Ecology 79, 119-137.
II. Högberg, M. N. and Högberg, P. (2002). Extramatrical ectomycorrhizal mycelium contributes one-third of microbial biomass and produces, together with associated roots, half the dissolved organic carbon in a forest soil. New Phytologist 154, 791-795.
III. Högberg, M. N., Bååth, E., Nordgren, A., Arnebrant, K. and Högberg, P. (2003). Contrasting effects of nitrogen availability on plant carbon supply to mycorrhizal fungi and saprotrophs - a hypothesis based on field observations in boreal forest. New Phytologist 160, 225-238.
IV. Högberg, M. N., Nordgren, A. and Högberg, P. (0000). Large variability in sensitivity of microbial activity to physical disturbance among mor-layers from boreal forest. (Manuscript).
V. Högberg, M. N., Myrold, D. D., Giesler, R. and Högberg, P. (0000). Shifts in soil nitrogen dynamics along a local plant productivity gradient in boreal forest. (Manuscript).
Papers I, II, III are reproduced with kind permisson of the journals concerned. Academic thesis to be publicly defended for the degree of Doctor of Philosophy. Faculty opponent: Dr. Clare Robinson, Department of Life Sciences, Kings College, University of London, UK. Evaluation committee: Professor Åsa Frostegård, Dept. of Chemistry and Biotechnology, Agricultural University of Norway; Ass. Professor Stefan Olsson, The Royal Veterinary and Agricultural University, Dept. of Ecology and Molecular Biology, Copenhagen, Denmark; Professor Tryggve Persson, Inst. för ekologi och naturvård, SLU, Uppsala. Location: HVC FU 26. Date: 040908 Time: 9.15.…………………
7
Introduction In the Fennoscandian boreal forest landscape, there are typically regular variations in vegetation composition and forest productivity (Cajander, 1926). Plant productivity and composition increase down-slope longer slopes along with changes in species composition (Hägglund & Lundmark, 1977) and the edaphic cause of this variation is the hill-slope hydrochemistry (Högberg, 2001a). Nitrogen has been experimentally identified as the nutrient that most strongly influences forest growth and plant species composition in these forest (Tamm, 1991).
Plants characteristics such as certain carbon allocation patterns between above- and below-ground parts (Hansen et al., 1997; Aerts, 1999), life-spans and biochemical composition of tissues (Lambers et al., 1998; Berg & McClaugherty, 2003) in turn influence microbial turnover of C and nutrients (Vitousek, 1982; Chapin III et al., 1986; van Breemen & Finzi, 1998) through effects on activity and composition of the microbial community (Wardle, 1992; Zak et al., 2003). Thus, there are cause-effect relationships leading to soil-microbial-plant interactions, because microbially driven nutrient turnover is a result of both the site hydrochemistry and the plants.
Several processes can lead to a higher N supply to plants in groundwater discharge areas than in the up-slope recharge areas (Chapin III et al. 1988; Tamm, 1991; Giesler et al., 1998; Högberg 2001a): (1) transport of N towards toe-slope areas, i.e. a flux of N from recharge to discharge areas, (2) smaller losses of N during fires because of wetter conditions and lower position in the landscape, (3) conditions more conducive for N2-fixation, (4) higher rates of N mineralization and higher in situ flux of solutes to roots and mycorrhizas because of more favourable moisture conditions, and (5) a higher pH and other conditions more favourable for autotrophic nitrification (which produces NO3
-, the most mobile soil solute N form) and possible also N mineralisation. This thesis focuses on the relations between forest productivity and soil microbiology and N turnover in soils. C and N links soil, microbes, and plants Traditionally, large stores of organic C in boreal forest soils are attributed to negative effects of low temperature, soil acidity and plant residue recalcitrance upon microbial activity. While plants use solar energy to fix atmospheric CO2, derived from an almost unlimited and simple C source, into carbohydrates to build up their biomass, saprotrophic soil microbes rely on C in plant debris and in diverse and often complex C compounds constituting soil organic matter. In most ecosystems plant photosynthesis and production is often N-limited, especially outside the tropics (Tamm, 1991), while on the contrary, soil microbes are often said to be C-limited.
This assumption, which is not valid for all organisms and conditions, is primarily based on frequent observations of a strongly enhanced respiratory activity after C additions. That a part of the microbial community is C-limited is easily
8
demonstrated by additions of labile C to the soil, e.g., sugars (Anderson & Domsch, 1978a), but this effect can also be found after additions of more complex C sources (Anderson & Domsch, 1978b; Wu et al., 1993) . The C available to soil microorganisms is ultimately derived from plant photosynthesis and it could, therefore, be expected that processes or factors, which determine the availability of soil C, have the proximal control on microbial activity.
A coupling between plant production and the microbial biomass in the forest floor was found by Zak et al. (1994) in a study of a continent-wide gradient in North America. Myrold (1987, 1989) reported positive correlations between net primary production and microbial biomass C and N in the mineral soil. Zak et al. (1990) also suggested that patterns of C and N cycling within an old-field chronosequence were predictable and positively correlated to the accretion of plant and microbial biomass. It is expected that low soil microbial biomass and activity should be found when plant production or foliar litter production is low and the soil C/N ratio is high (Wardle, 1992), which is often associated with slowly degradable litter with high lignin/N ratio. In contrast, when high plant productivity is found, saprotrophic microbes are expected to gain C and N from a higher supply of litter (Wardle, 1992) (often easily degradable foilar litter with low lignin/N ratio) and the microbial release of C and mineral N should be higher. This in turn should favour plant growth and further litter production. Thus, the conventional theories link high microbial activity to high turnover of nutrients. Differences in plant productivity and plant community structure are therefore often thought to be associated with differences in microbial activity, in particular. However, this assumption has not been tested with regard to the large local landscape variation in forest productivity found in Fennoscandian boreal forest.
Plant roots proliferate preferentially in the humus beneath the litter layer, and this is the soil horizon where most of the plant N is taken up (Vogt et al., 1983). The importance of the forest floor in nutrient cycling has long been recognized; (e.g., Hesselmann, 1926; Romell, 1935; Flanagan & Van Cleve, 1977; Cole, 1981; Covington, 1981; Federer, 1984; Prescott et al., 2000).
Roots sensing low nutrient supply induce production of growth promoting cytokinins, alternatively, more carbohydrates in the leaves implies that more photosynthate can be translocated to the roots (Lambers et al., 1998). Under limiting nutrient supply there is considerably higher C allocation to the below-ground parts, i.e. to root growth, root respiration, N2 fixation, root exudation and mycorrhizas (van der Werf et al., 1994). Thus, the supply of the plant limiting nutrient in soil significantly affects plant growth and biomass allocation. The ectomycorrhizal symbiosis is known to be sensitive to the N availability in soil and changes in the plant C allocation to the ECM fungus will affect its performance (Wallenda & Kottke, 1998). In an experiment in a Pinus forest, fertilization led to a 50% decline in relative allocation of photosynthates to roots, while total net photosynthesis doubled (Cannell, 1989). In addition to soil nutrient status, the season determines patterns of C allocation in trees. In temperate coniferous tree species root growth activity shows a bimodal course with maxima in autumn and spring prior to bud break (Hansen et al., 1997).
9
In response to low N supply, compared to optimum nutrient supply, plants also increase their production of tannins and lignins (Lambers et al. 1998). These substances are well known to slow down litter decomposition in soil, which may further aggrevate the N shortage in the environment. It has been found that N concentration is a good predictor of limit values for litter decomposition (Berg & McClaugherty, 2003). Hence, plant species composition and the metabolic reaction of plants to soil nutrient status affects the build-up of the organic mor layer.
One of the first plant-microbe interactions observed, N immobilisation, was detrimental for plants and suggested strong competition between soil microbes and plants for soil N (Jansson, 1958). This is still an important subject for research (e.g., Kaye & Hart, 1997; Freeman et al., 1998; Lipson et al., 1999; Korsaeth et al., 2001). On contrary, the mycorrhizal symbiosis (Frank, 1877; Harley & Smith, 1983; Smith & Read, 1997) was found to be beneficial also for the plants. Romell (1935; 1938) studied natural forest mor-soils and found dense mycorrhizal fungal mycelium in the mor-layer of boreal forest soils and associated the abundance of mycorrhizal sporocarps directly to the presence of hyphal connections to trees. Thick mycelial mats with high respiratory activities were also found in similar mor soils in Finland by Hintikka & Näykki (1967) and provide evidence of substantial local activity by mycorrhizal fungi. Ectomycorrhizal hyphal mat soils may contain 30-50% fungal rhizomorph material per g dry forest floor material equivalent to 2 to 600 km mycelium (Ingham et al., 1991). Mycorrhizal fungi and the N cycle Mycorrhizas are involved in nutrient uptake by most land plants (Harley & Smith, 1983). Nearly all tree root tips (>98%) in temperate and boreal forests are ectomycorrhizal (Taylor et al., 2000). The external mycelium of all mycorrhizal types play a key role in uptake of nutrients by plants (Smith & Read, 1997). However, the mycorrhizal symbioses and their potential roles in nutrient turnover are often not considered in studies of N transformations. Jansson and Persson (1982) presented a detailed N cycle, which was divided into elemental, autotrophic and heterotrophic N cycles. Symbiotic N2-fixation was considered in the elemental N cycle, but mycorrhizal fungi were not included as an important component in any of the cycles. The most likely reason for this is that mycorrhizal fungi are difficult to characterize, since on one hand, with respect to their major C supply, which is photoassimilates, they are autotrophic organisms, but on the other hand, with respect to their taxonomic position, they are heterotrophic organisms. The symbiotic relationship links two kingdoms and two biologically distinct organisms.
Thus, the mycorrhizal fungi lie within an autotrophic-heterotrophic continuum which is illustrated (arrows) in the simplified N cycle (Fig. 1). Here, mycorrhizal fungi are intimately associated with the autotrophic plant (upper half), while mycorrhizal N at the same time cannot be distinguished from other microbial N (lower half) by available microbiological methods. Mycorrhizal N is not only reserved for its own N metabolism, which is the case for heterotrophic fungi, but partly also represents N on its way to the plant (Fig. 1). Mycorrhizal interactions
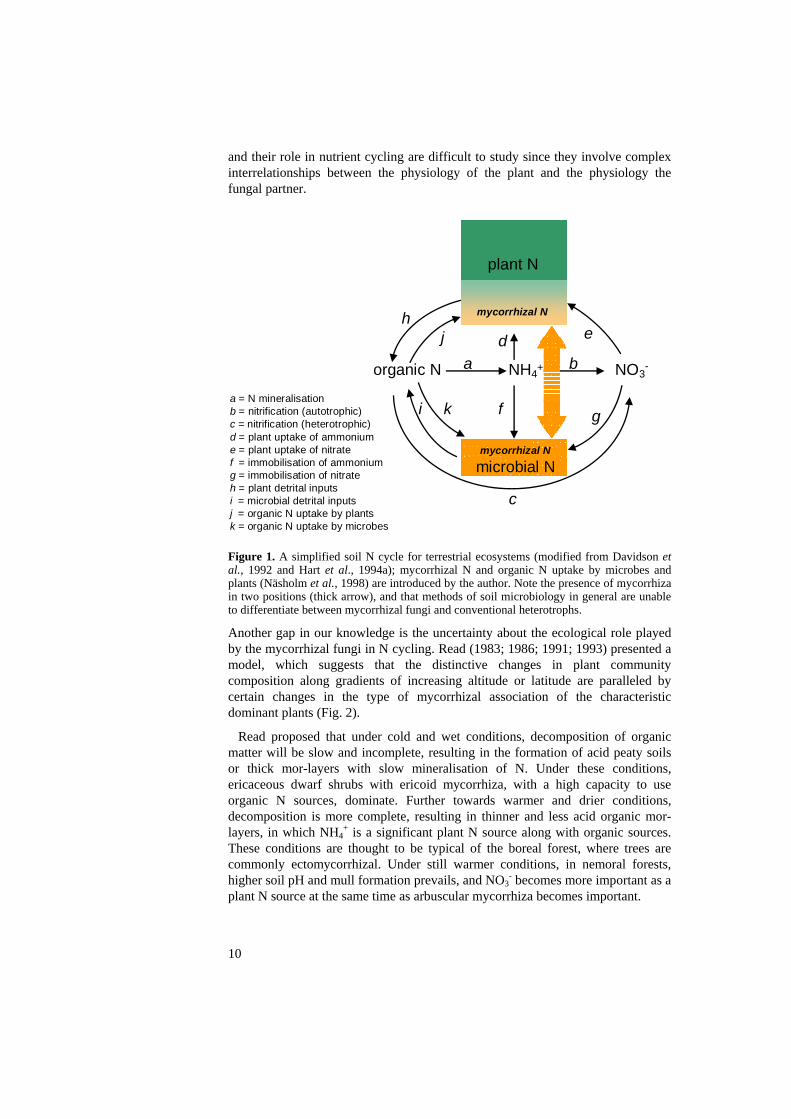
and their role in nutrient cycling are difficult to study since they involve complex interrelationships between the physiology of the plant and the physiology the fungal partner.
10
mycorrhizal N
b
e
gf
d
i
hj
c
a
Figure 1. A simplified soil N cycle for terrestrial ecosystems (modified from Davidson et al., 1992 and Hart et al., 1994a); mycorrhizal N and organic N uptake by microbes and plants (Näsholm et al., 1998) are introduced by the author. Note the presence of mycorrhiza in two positions (thick arrow), and that methods of soil microbiology in general are unable to differentiate between mycorrhizal fungi and conventional heterotrophs.
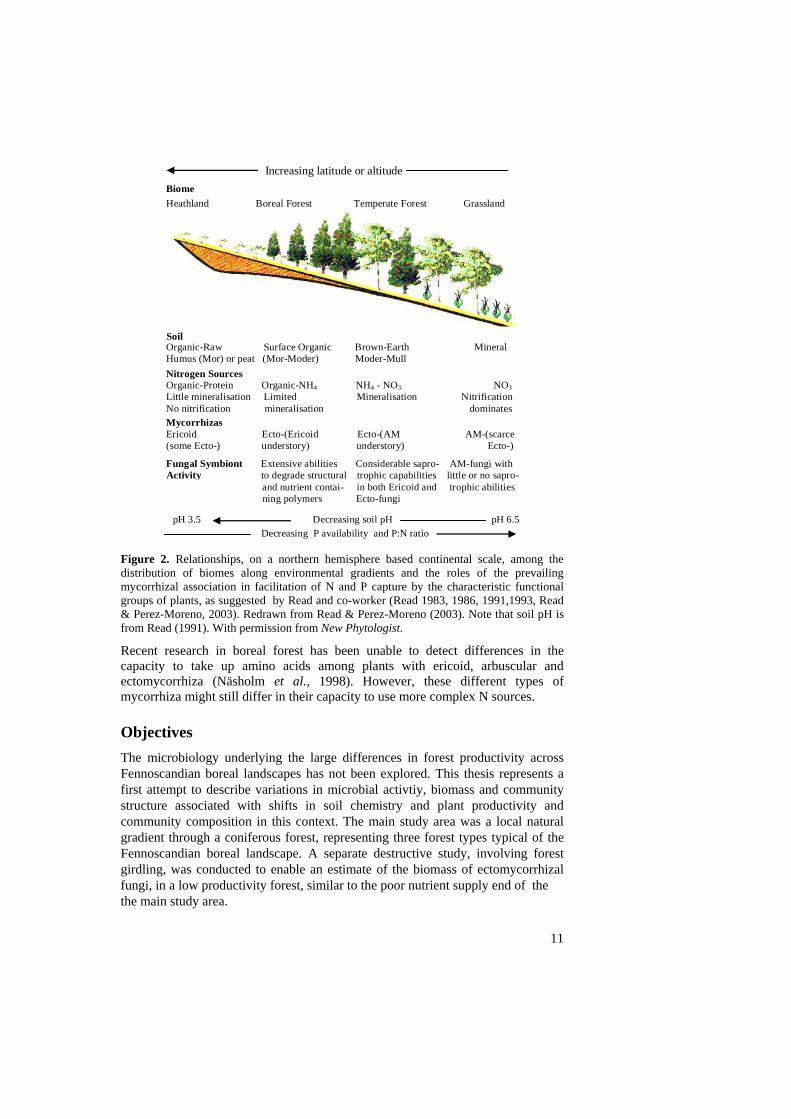
Another gap in our knowledge is the uncertainty about the ecological role played by the mycorrhizal fungi in N cycling. Read (1983; 1986; 1991; 1993) presented a model, which suggests that the distinctive changes in plant community composition along gradients of increasing altitude or latitude are paralleled by certain changes in the type of mycorrhizal association of the characteristic dominant plants (Fig. 2).
Read proposed that under cold and wet conditions, decomposition of organic matter will be slow and incomplete, resulting in the formation of acid peaty soils or thick mor-layers with slow mineralisation of N. Under these conditions, ericaceous dwarf shrubs with ericoid mycorrhiza, with a high capacity to use organic N sources, dominate. Further towards warmer and drier conditions, decomposition is more complete, resulting in thinner and less acid organic mor-layers, in which NH4
+ is a significant plant N source along with organic sources. These conditions are thought to be typical of the boreal forest, where trees are commonly ectomycorrhizal. Under still warmer conditions, in nemoral forests, higher soil pH and mull formation prevails, and NO3
- becomes more important as a plant N source at the same time as arbuscular mycorrhiza becomes important.
a = N mineralisation = nitrification (autotrophic)= nitrification (heterotrophic)= plant uptake of ammonium= plant uptake of nitrate= immobilisation of ammonium= immobilisation of nitrate= plant detrital inputs= microbial detrital inputs= organic N uptake by plants= organic N uptake by microbes
k
organic N NH4+ NO3-
mycorrhizal Nmicrobial N
plant N
bcd efg hi jk
Increasing latitude or altitude
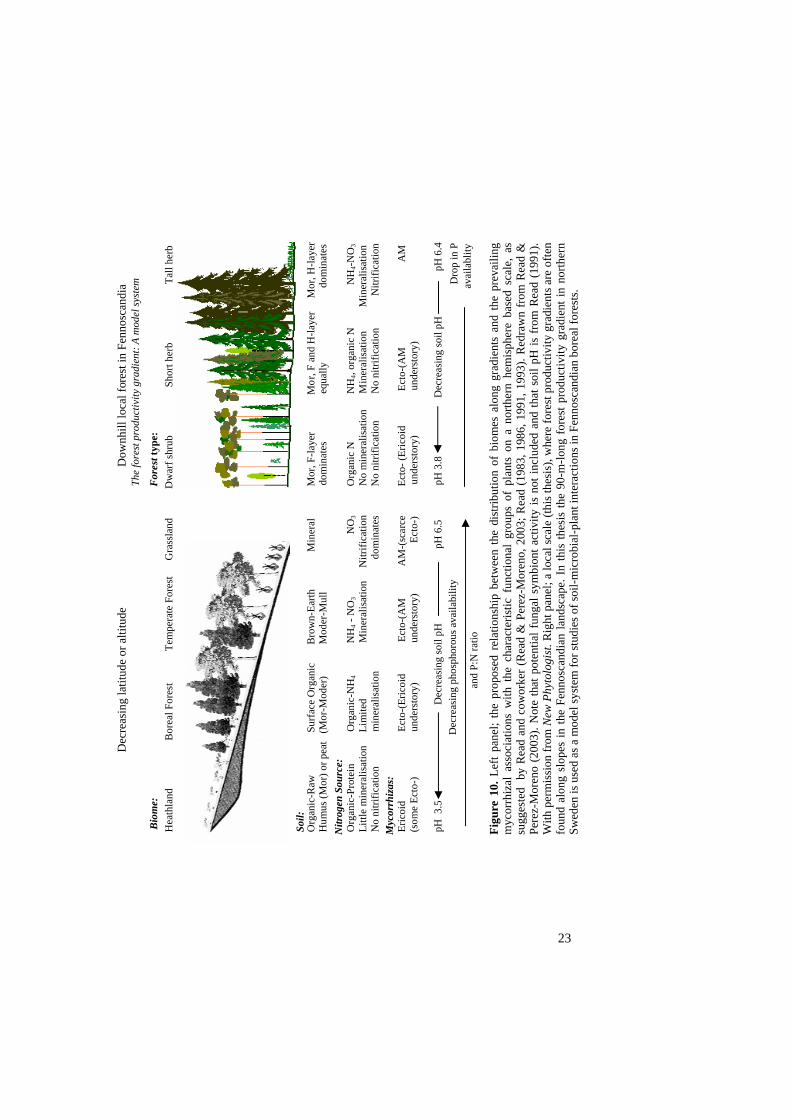
Biome Heathland Boreal Forest Temperate Forest Grassland
Soil Organic-Raw Surface Organic Brown-Earth Mineral Humus (Mor) or peat (Mor-Moder) Moder-Mull Nitrogen Sources Organic-Protein Organic-NH4 NH4 - NO3 NO3 Little mineralisation Limited Mineralisation Nitrification No nitrification mineralisation dominates Mycorrhizas
Ericoid Ecto-(Ericoid Ecto-(AM AM-(scarce (some Ecto-) understory) understory) Ecto-)
Fungal Symbiont Extensive abilities Considerable sapro- AM-fungi with Activity to degrade structural trophic capabilities little or no sapro- and nutrient contai- in both Ericoid and trophic abilities ning polymers Ecto-fungi
pH 3.5 Decreasing soil pH pH 6.5 Decreasing P availability and P:N ratio
Figure 2. Relationships, on a northern hemisphere based continental scale, among the distribution of biomes along environmental gradients and the roles of the prevailing mycorrhizal association in facilitation of N and P capture by the characteristic functional groups of plants, as suggested by Read and co-worker (Read 1983, 1986, 1991,1993, Read & Perez-Moreno, 2003). Redrawn from Read & Perez-Moreno (2003). Note that soil pH is from Read (1991). With permission from New Phytologist. Recent research in boreal forest has been unable to detect differences in the capacity to take up amino acids among plants with ericoid, arbuscular and ectomycorrhiza (Näsholm et al., 1998). However, these different types of mycorrhiza might still differ in their capacity to use more complex N sources. Objectives The microbiology underlying the large differences in forest productivity across Fennoscandian boreal landscapes has not been explored. This thesis represents a first attempt to describe variations in microbial activtiy, biomass and community structure associated with shifts in soil chemistry and plant productivity and community composition in this context. The main study area was a local natural gradient through a coniferous forest, representing three forest types typical of the Fennoscandian boreal landscape. A separate destructive study, involving forest girdling, was conducted to enable an estimate of the biomass of ectomycorrhizal fungi, in a low productivity forest, similar to the poor nutrient supply end of the the main study area.
11
The specific objectives were:
• To describe, in detail, soil conditions and plant community composition along a nutrient supply gradient (Paper I).
• To estimate the contribution by ectomycorrhizal extramatrical fungal mycelium to microbial biomass (Paper II) by a tree girdling experiment.
• To describe the soil microbiology (Paper III) and assess the contribution by ectomycorrhizal roots and extramatrical mycelium to microbial activity and microbial biomass along the natural N supply and forest productivity gradient (Papers III-IV).
• To link soil N dynamics to soil chemistry, plant community composition, mycorrhizal associations and microbial community composition in general (Paper V).
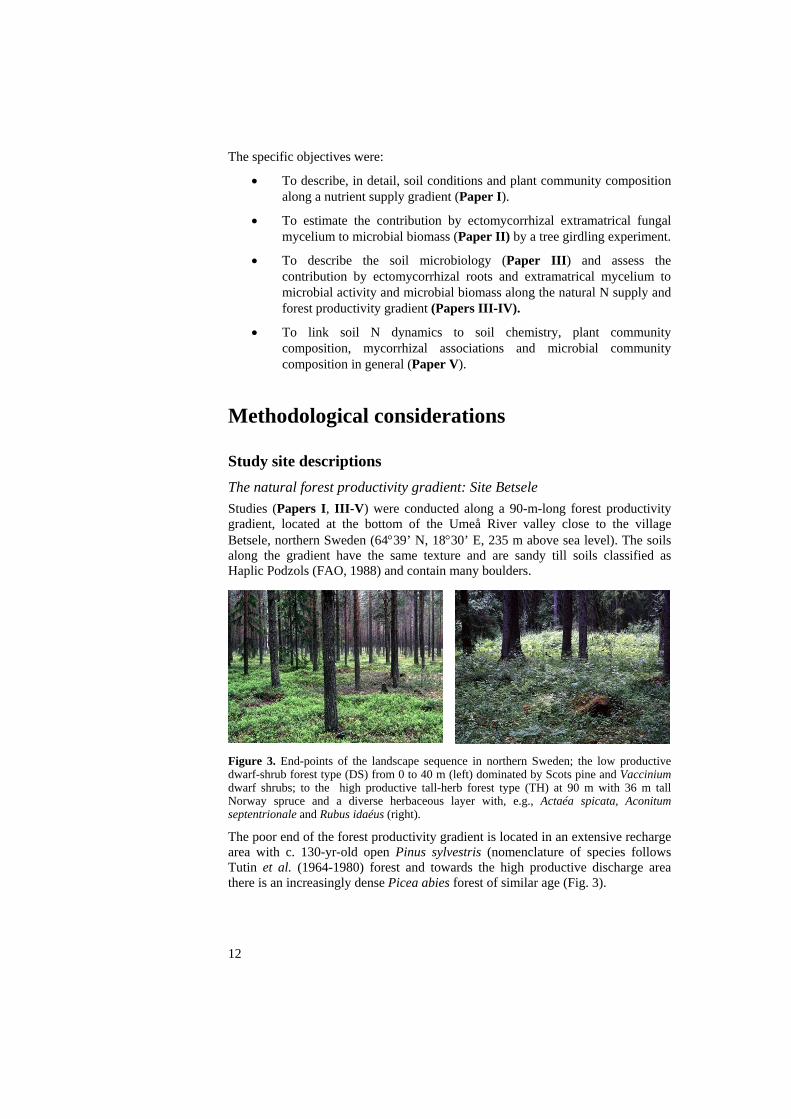
Methodological considerations Study site descriptions The natural forest productivity gradient: Site Betsele Studies (Papers I, III-V) were conducted along a 90-m-long forest productivity gradient, located at the bottom of the Umeå River valley close to the village Betsele, northern Sweden (64°39’ N, 18°30’ E, 235 m above sea level). The soils along the gradient have the same texture and are sandy till soils classified as Haplic Podzols (FAO, 1988) and contain many boulders.
12
Figure 3. End-points of the landscape sequence in northern Sweden; the low productive dwarf-shrub forest type (DS) from 0 to 40 m (left) dominated by Scots pine and Vaccinium dwarf shrubs; to the high productive tall-herb forest type (TH) at 90 m with 36 m tall Norway spruce and a diverse herbaceous layer with, e.g., Actaéa spicata, Aconitum septentrionale and Rubus idaéus (right).
The poor end of the forest productivity gradient is located in an extensive recharge area with c. 130-yr-old open Pinus sylvestris (nomenclature of species follows Tutin et al. (1964-1980) forest and towards the high productive discharge area there is an increasingly dense Picea abies forest of similar age (Fig. 3).

Mean annual temperature and precipitation are 1.0°C and 570 mm, respectively. The period with snow cover averages 170 days between late October and early May. The gradient does not encompass a complete slope spanning from the water divide to the discharge area. Some of the water may have flowed 700-800 m through the soils and bedrock up-slope of the discharge area. The slope is only 2%. The discharge area comprises only the last 10 m of the transect. Surface discharge usually occurs for about one or a few weeks during snow melt, but may also occur under exceptionally wet conditions in summer and autumn. Discharge events can be short and very dynamic. The groundwater level may rise and fall several decimeters in a day. No studies were performed during discharge events. The more open forests in the beginning, 0 m, and in the end of the gradient, 90 m, showed higher soil temperatures during the coldest winter period compared with the rest of the transect (Fig. 4). At 90 m, flush of discharge water may enhance soil thawing in the spring, leading to somewhat higher soil temperatures earlier in the season.
02-1
0-01
02-1
1-01
02
-12-
01
03-0
1-01
03-0
2-01
03
-03-
01
03-0
4-01
03
-05-
01
03-0
6-01
03
-07-
01
03-0
8-01
03-0
9-01
03
-10-
01
Soi
l tem
pera
ture
(o C)
-6
-4
-2
0
2
4
6
8
10
12
14 DS ( 0 m) DS (30 m) SH (60 m) TH (90 m)
Figure 4. Soil temperatures during 48 weeks between 10 October 2002 and 4 September 2003 at c. 7 cm depth between the boundary between the mineral soil and the mor layer at 0, 30, 60 and 90 m along the forest productivity gradient at Betsele, northern Sweden. Data are weekly mean temperatures.
Three forest types have been defined along the gradient (Paper I). At the poor upper portion (0-40 m) in the dwarf shrub forest type (DS), plants with either ectomycorrhiza (ECM) or ericoid (EM) mycorrhiza dominate. The field layer is dominated by ericaceous dwarf shrubs; e.g., Vaccinium myrtillus, V. vitis-idaea, Empetrum hermaphroditum. In the short herb forest type (SH) at 50-80 m, plants with arbuscular mycorrhiza (AM) become prominent along with ECM and EM species. Several short herbs are abundant, e.g., Oxalis acetosella Maianthemum bifolium and Solidago virgaurea. At 90 m in the tall herb forest type (TH), which is now a glade caused by tree falls, AM or non-mycorrhizal species totally dominate, e.g., Aconitum septentrionale, Actea spicata and Rubus ideaeus (Paper I). The Pinus forest (here represented by 0-40 m) has an average productivity (as estimated by two independent methods applied to areas >1 ha) of 2.9 m3 stem wood ha-1 yr-1, while the Picea forest (50-90 m) has an average productivity of 8.0 m3 stem wood ha-1 yr-1 (P. Högberg and L. Kinell, unpubl. data). Around the low end of the gradient (90 m) windfalls have opened up the forest and the productivity cannot be accurately quantified. The potential productivity should, however, be
13
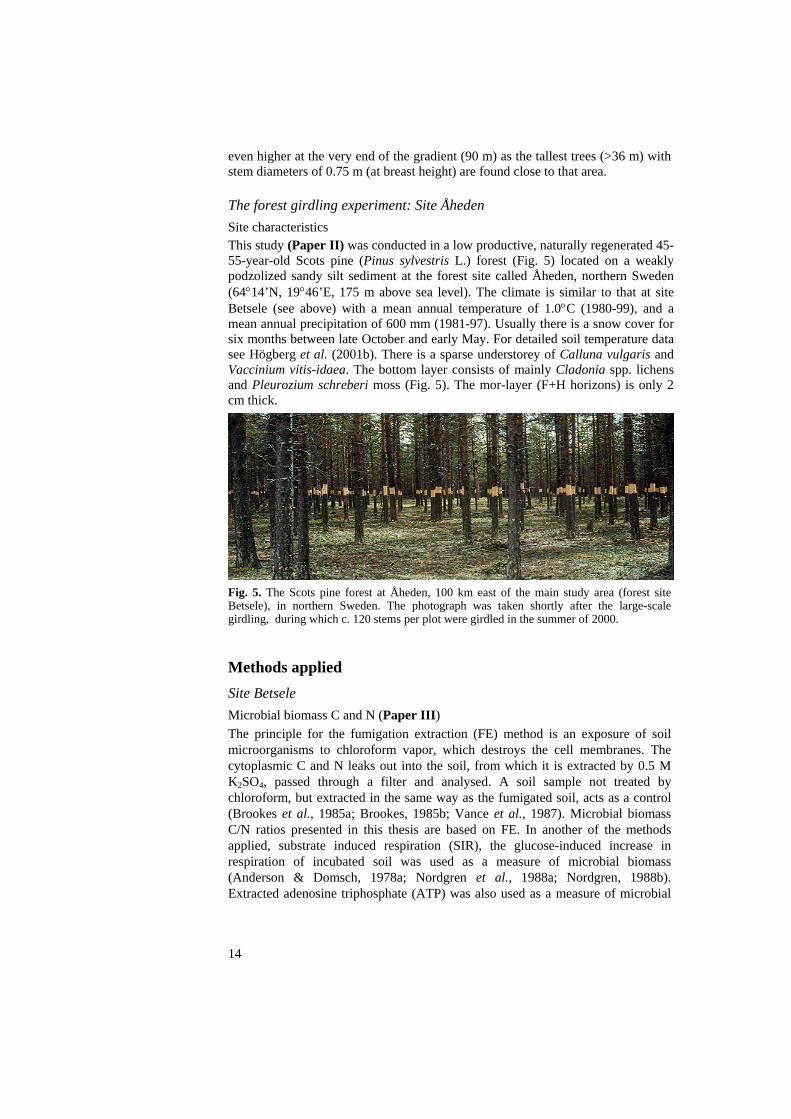
even higher at the very end of the gradient (90 m) as the tallest trees (>36 m) with stem diameters of 0.75 m (at breast height) are found close to that area. The forest girdling experiment: Site Åheden Site characteristics This study (Paper II) was conducted in a low productive, naturally regenerated 45-55-year-old Scots pine (Pinus sylvestris L.) forest (Fig. 5) located on a weakly podzolized sandy silt sediment at the forest site called Åheden, northern Sweden (64°14’N, 19°46’E, 175 m above sea level). The climate is similar to that at site Betsele (see above) with a mean annual temperature of 1.0°C (1980-99), and a mean annual precipitation of 600 mm (1981-97). Usually there is a snow cover for six months between late October and early May. For detailed soil temperature data see Högberg et al. (2001b). There is a sparse understorey of Calluna vulgaris and Vaccinium vitis-idaea. The bottom layer consists of mainly Cladonia spp. lichens and Pleurozium schreberi moss (Fig. 5). The mor-layer (F+H horizons) is only 2 cm thick.
Fig. 5. The Scots pine forest at Åheden, 100 km east of the main study area (forest site Betsele), in northern Sweden. The photograph was taken shortly after the large-scale girdling, during which c. 120 stems per plot were girdled in the summer of 2000.
Methods applied Site Betsele Microbial biomass C and N (Paper III) The principle for the fumigation extraction (FE) method is an exposure of soil microorganisms to chloroform vapor, which destroys the cell membranes. The cytoplasmic C and N leaks out into the soil, from which it is extracted by 0.5 M K2SO4, passed through a filter and analysed. A soil sample not treated by chloroform, but extracted in the same way as the fumigated soil, acts as a control (Brookes et al., 1985a; Brookes, 1985b; Vance et al., 1987). Microbial biomass C/N ratios presented in this thesis are based on FE. In another of the methods applied, substrate induced respiration (SIR), the glucose-induced increase in respiration of incubated soil was used as a measure of microbial biomass (Anderson & Domsch, 1978a; Nordgren et al., 1988a; Nordgren, 1988b). Extracted adenosine triphosphate (ATP) was also used as a measure of microbial
14
15
biomass. ATP in soil pre-incubated for a week at 25 °C was determined by using the reaction luciferin-luciferase (Eiland, 1983; Arnebrant & Bååth, 1991). The total amount of membrane bound phospholipid fatty acids (total PLFA) was extracted according to (Frostegård et al., 1991; Frostegård & Bååth, 1996) and used as another estimate of microbial biomass. Bacteria were counted microscopially after AO staining of bacteria extracted from soil (Söderberg & Bååth, 1998). Analyses of ATP, PLFA and counting (and measurements of activity) of bacteria were performed in another laboratory. Microbial community structure (Paper III) The composition of the microbial community was determined by analysis of group specific PLFAs in soil (Tunlid & White, 1992; Frostegård et al., 1993; Frostegård & Bååth, 1996; Frostegård et al., 1996). Specifically, the PLFA 18:2ω6, 9 was used as an indicator of fungal biomass (Federle, 1986), and the sum of the specific bacterial PFLAs as an indicator of the bacterial biomass. Lipids were extracted from fresh soil (1 g) using the Bligh & Dyer (1959) extraction technique as modified by Frostegård et al.. Polar lipids (phospholipids) were separated on silica acid columns, dried under N2 and subjected to mild alkaline methanolysis. The resulting fatty acid methyl esters were analysed on a gas chromatograph with a flame ionisation detector. Methyl nonadecanoate fatty acid was used as the internal standard. Microbial activity (Paper III) The total microbial activity in sieved root-free soil samples was estimated by measuring basal respiration at 20 °C (Nordgren et al., 1988a; Nordgren, 1988b). Bacterial activity was estimated as the rate of thymidine incorporation (TdR) into bacteria extracted from soil after homogenization and centrifugation (Bååth, 1992). To examine the extent, to which the bacterial community in the field is adapted to the pH of the bulk soil (Bååth, 1996a), bacteria were separated from soils (Bååth, 1996b), incubated in two different buffers (pH 7 and pH 4), and the ratio between the rates of thymidine incorporation at the two pH levels was used as an index of the pH tolerance of the bacterial community. The rate ratio was then related to the pH in soil (soil:water ratio, 1:5). A high ratio was taken to indicate a community well adapted to high pH conditions, and vice versa. Field basal soil respiration (Paper III) Gas was sampled sequentially from headspaces placed on the ground after removal of mosses and plant shoots. Analyses of CO2 was performed on an ANCA-NT (Europa Scientific Ltd, Crewe, U.K.) (Högberg & Ekblad, 1996; Högberg et al., 2001b). Note that these measurements also include root respiration. Microbial acitvity response to trenching (Paper IV) Ten-cm diameter plots were trenched through the mor-layer down to the uppermost mineral soil with an auger at every tenth meter along three 10 m long transects perpendicular to the 90-m-long forest productivity gradient at site Betsele. Sampling sites were chosen to exclude plant shoots. To ensure that all roots were cut, each soil core was lifted up and then placed back into its initial
16
position. After 24 days of pre-incubation in situ in the field, the trenched mor-layer samples and control samples were recovered. During transportation and manual sorting out of roots (>2mm), samples were kept at temperatures of 10.3±0.6 °C (mean±SD). The microbial activity (µg CO2-C h-1g-1o.m.) in 10 g of fresh root free soil from each sample was measured at 20±0.1 °C in a respirometer (Respicond V, Nordgren Innovations, Djäkneboda, Sweden) during a period of 258 h. The relative decrease in microbial activity after trenching was calculated using the following equation: Relative decrease (%)= (eq. 1) 100× [(microbial activitycontrol–microbial activitytrenched)] /microbial activitycontrol
Net mineralisation and nitrification rates (Paper V) Rates of net N mineralisation were determined in the absence of plant N-uptake and plant N-inputs (Nadelhoffer et al., 1984). Long-term net mineralization and nitrification rates were determined in root free soil equivalent to 25 g (d.m.) in O2 permeable polyethylene bags and incubated in the field beneath the mor-layer. After 7 weeks, pool sizes of ammonia and nitrate were used to estimate mineralisation rates (Eno, 1960). The same methodology was used for short-term net mineralisation and nitrification rates, but these soils were incubated 24 h only. Time zero denotes initial levels of inorganic N and t denotes inorganic pool size at the end of the incubation period.
Net N mineralisation = [(NH4+-N+ NO3
--N)t - (NH4+-N+NO3
--N)t0]/t (eq. 2)
Similarly, net rates of nitrification were calculated from the net change in the soil NO3
- pool size:
Net nitrification =[(NO3--N)t - (NO3
--N)t0]/t (eq. 3) Gross N turnover rates (Paper V) Actual N transformation rates, i.e. gross N mineralisation or gross nitrification rates include the whole production of NH4
+ (or NO3-) in soil and microbial
immobilisation of NH4+ (or NO3
-). Gross N mineralisation thus encompasses all consumptive processes of NH4
+, while gross nitrification includes all consumptive processes of NO3
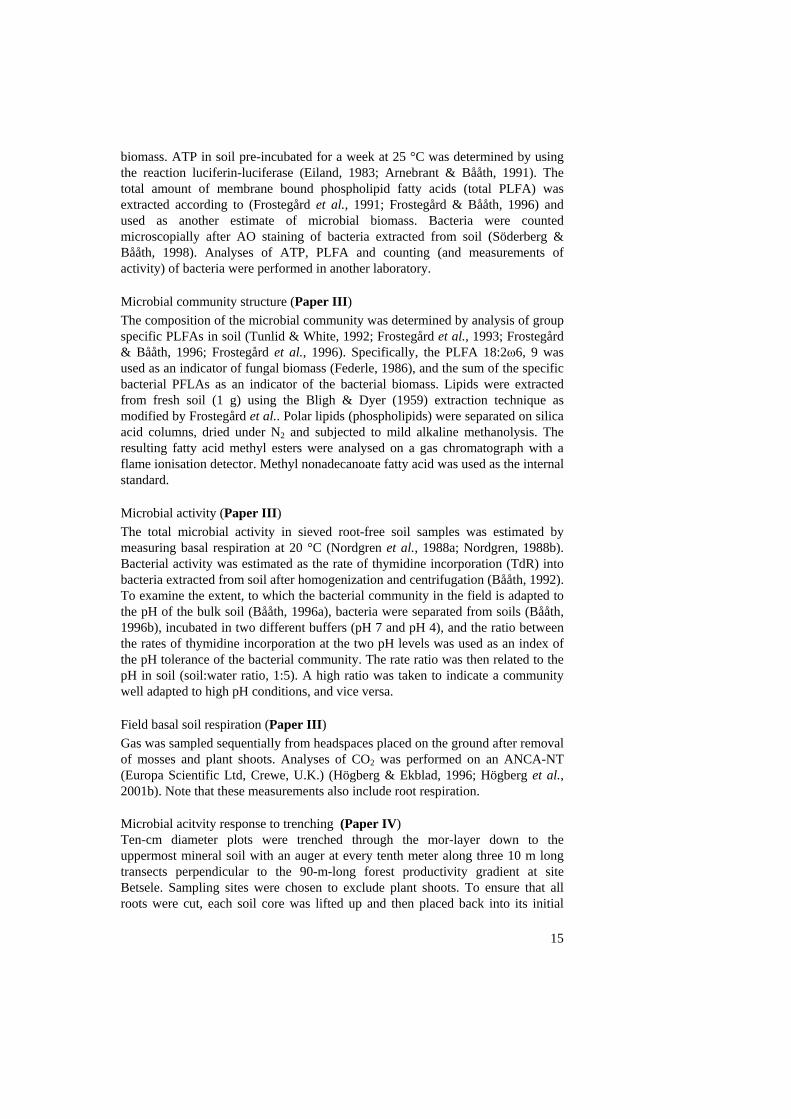
-. This technique relates the changes in 15N abundance of the labelled inorganic N pool to the rate of N mineralisation (or nitrification) (Fig. 6).
We established a simple field laboratory. Mor layer soil, F+H (approximately corresponding to Oe + Oa), were sampled and roots were sorted out, whereafter the remaining soil was mixed and fresh soil equivalent to ~75 g (f.w.) was put into plastic bags. A total of 3.5 mL 98 atom % 15NH4Cl or Na15NO3 was dispersed slowly into each soil sample by three separate injections using a syringe and needle. The amount injected corresponded to 2.1 ± 0.3 (mean±SD) µg N/g dry organic matter. Within 30 seconds after injection (time zero= t0), 125 mL 2 M KCl was added. Samples and the extractant were gently mixed by hand at intervals. Extracts were filtered after 1 h extraction time in a nearby indoor laboratory. A parallel sample, denoted t24, was placed in O2 permeable polyethylene bags and incubated in the field under the mor-layer in the forest type, from which the soil was sampled, for 24 hours before extraction. A diffusion method served the
purpose of concentrating and transferring dilute inorganic 14+15N from the soil extract as NH3 onto a solid substrate for subsequent 15N analysis. Diffusion was performed using the methods by Sörensen & Jensen (1991) and Stark & Hart (1996).
0 h 24 h
14N
15N
14N14N
15N15N
70
30
14
6
70:30 = 14:6
14+15NH4+
pool
14N 14N 14N Figure. 6. Principle of the pool-dilution technique in which the product pool is labelled (soil ammonium or nitrate pool) and the 15N abundance of that pool will decline when 14N is released during N mineralization (Left panel). Note that proportional exploitation of the soil ammonium (or nitrate) pool containing labelled N (15N) and unlabelled N (14N), will not alter the 15N abundance of the pool under study, i.e there is no preferential use of added 15N (Right panel). Figures are redrawn from Powlson & Barraclough (1993).
Gross mineralization (m), NH4+ immobilization (c), gross nitrification, and NO3
-
immobilization rates were calculated using equations (4) and (5) of Kirkham & Bartholomew (1954), which are described below. The term immobilization, as used in the original article, is here replaced by consumption and refers to the sum of all consumptive processes of the labelled pool (Davidson et al., 1990; Davidson et al., 1991).
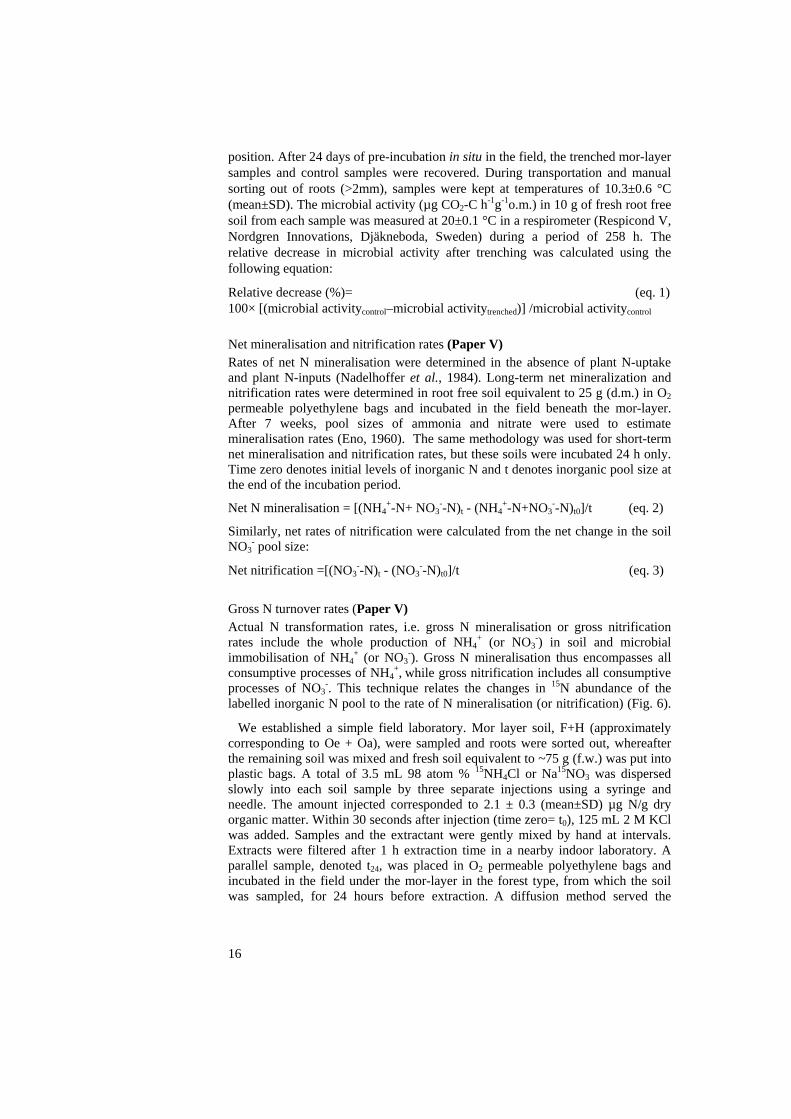
m (or n) = [(M0 – M1)/t] log(H0M1/H1M0)/log(M0/M1) (eq. 4) ca (or cn) = [(M0 – M1)/t] log(H0H1)/log(M0/M1) (eq. 5)
Where:
M0 = initial 14+15NH4 pool size (µg N g-1 o.m.) M1 = post-incubation 14+15NH4 pool size (µg N g-1 o.m.) H0 = initial 15NH4 pool (µg N g-1 o.m.) H1 = post-incubation 15NH4 pool (µg N g-1 o.m.) m = mineralization rate (µg N g-1 o.m. d-1) n = nitrification rate (µg N g-1 o.m. d-1) ca = NH4
+ consumption rate (µg N g-1 o.m. d-1) cn = NO3
- consumption rate (µg N g-1 o.m. d-1) t = time (1 d for the present study)
We labelled and analysed the soil NH4+ and NO3
- pools separately, i.e. for samples that received 15NH4
+, the NH4+ pool was used for M and H, respectively. For
samples that received 15NO3-, the NO3
- pool was used for M and H in Eqns. (4) and
17
(5) and the symbol m was replaced by n, which is the nitrification rate (µg N g-1 o.m.).
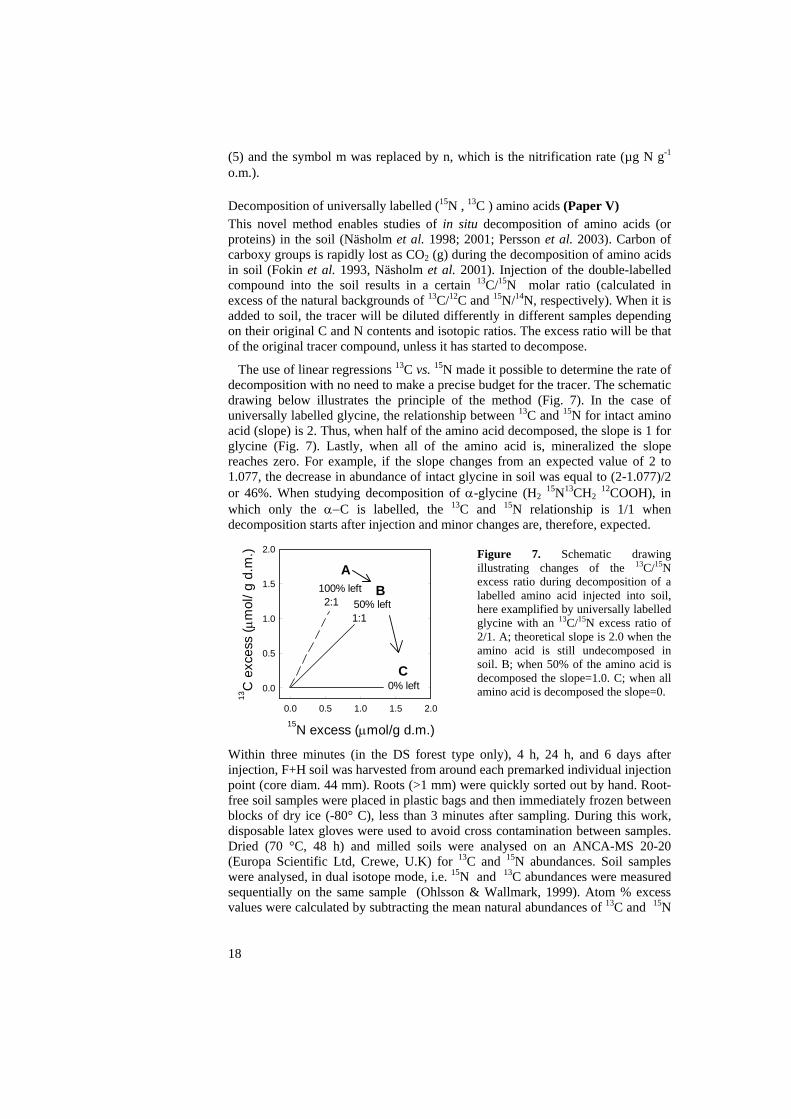
Decomposition of universally labelled (15N , 13C ) amino acids (Paper V) This novel method enables studies of in situ decomposition of amino acids (or proteins) in the soil (Näsholm et al. 1998; 2001; Persson et al. 2003). Carbon of carboxy groups is rapidly lost as CO2 (g) during the decomposition of amino acids in soil (Fokin et al. 1993, Näsholm et al. 2001). Injection of the double-labelled compound into the soil results in a certain 13C/15N molar ratio (calculated in excess of the natural backgrounds of 13C/12C and 15N/14N, respectively). When it is added to soil, the tracer will be diluted differently in different samples depending on their original C and N contents and isotopic ratios. The excess ratio will be that of the original tracer compound, unless it has started to decompose.
The use of linear regressions 13C vs. 15N made it possible to determine the rate of decomposition with no need to make a precise budget for the tracer. The schematic drawing below illustrates the principle of the method (Fig. 7). In the case of universally labelled glycine, the relationship between 13C and 15N for intact amino acid (slope) is 2. Thus, when half of the amino acid decomposed, the slope is 1 for glycine (Fig. 7). Lastly, when all of the amino acid is, mineralized the slope reaches zero. For example, if the slope changes from an expected value of 2 to 1.077, the decrease in abundance of intact glycine in soil was equal to (2-1.077)/2 or 46%. When studying decomposition of α-glycine (H2 15N13CH2 12COOH), in which only the α−C is labelled, the 13C and 15N relationship is 1/1 when decomposition starts after injection and minor changes are, therefore, expected.
0.0 0.5 1.0 1.5 2.0
0.0
0.5
1.0
1.5
2.0
15N excess (µmol/g d.m.)
13C
exc
ess
( µm
ol/ g
d.m
.)
AB
C
2:11:1
100% left50% left
0% left
Figure 7. Schematic drawing illustrating changes of the 13C/15N excess ratio during decomposition of a labelled amino acid injected into soil, here examplified by universally labelled glycine with an 13C/15N excess ratio of 2/1. A; theoretical slope is 2.0 when the amino acid is still undecomposed in soil. B; when 50% of the amino acid is decomposed the slope=1.0. C; when all amino acid is decomposed the slope=0.
Within three minutes (in the DS forest type only), 4 h, 24 h, and 6 days after injection, F+H soil was harvested from around each premarked individual injection point (core diam. 44 mm). Roots (>1 mm) were quickly sorted out by hand. Root-free soil samples were placed in plastic bags and then immediately frozen between blocks of dry ice (-80° C), less than 3 minutes after sampling. During this work, disposable latex gloves were used to avoid cross contamination between samples. Dried (70 °C, 48 h) and milled soils were analysed on an ANCA-MS 20-20 (Europa Scientific Ltd, Crewe, U.K) for 13C and 15N abundances. Soil samples were analysed, in dual isotope mode, i.e. 15N and 13C abundances were measured sequentially on the same sample (Ohlsson & Wallmark, 1999). Atom % excess values were calculated by subtracting the mean natural abundances of 13C and 15N
18

19
of water treated control soils (n=24) from the atom % value of 13C or 15N of the amino acid treated soil sample in each forest type separately. Potential denitrification enzyme activity (Paper V) Mor layer soil was sampled at every tenth meter along the gradient. In the laboratory, ten grams of root-free fresh soil from each position and 80 mL DEA solution (1mM glucose, 1mM KNO3, 200 mg chloramphenicol/L) were added to a 125-mL serum bottle, which was sealed, evacuated and flushed with N2 and filled with acetylene equivalent to 10% of gas volume. Samples were shaken continuously. Gas samples were taken at 0, 0.5, 1.0, and 1.5 hours and analysed for N2O (g) on a gas chromatograph (ECD-GC). Total N2O concentration was calculated including N2O dissolved in the solution, using a Bunsen coefficient of 0.632 (Tiedje, 1982). Site Åheden Biomass of ECM, production of DOC (Paper II) In early June 2000, the Scots pine trees on three square plots (900m2) were girdled 1.3 m above ground, by complete removal of the bark over 0.3-m long sections around circumferences of the stems (early girdled plots). In mid-August 2000, trees on three more plots were girdled (late girdled plots) (Högberg et al., 2001b) (Fig. 5). Girdling completely stops the flow of photosynthates in the phloem from the canopy to the roots and ectomycorrhizal fungi, but water and nutrients can still be taken up from soil via the xylem for some time. Girdling enabled estimates in the field of the contribution of extramatrical mycelium of ECM fungi to soil microbial biomass and by ECM roots and extramatrical ECM mycelia to production of dissolved organic carbon (DOC). Determination of microbial C and microbial N in root-free mor layer soil was performed by using the fumigation-extraction (FE) technique. Extractable DOC was determined on filtered extracts of
on-fumigated soil. n Results and Discussion The natural forest productivity gradient: Soil chemistry and plants Soils Selected soil and microbiological characteristics of the superficial mor-layer (F+H horizon) in the dwarf shrub (DS), short herb (SH) and tall herb (TH) forest types, are presented in Table 1. Soil C/N ratios ranged from 41 in the DS type (at 0 m) to 19 in the TH type at 90 m and pH in the soil solution increased 2.6 pH units (Table 1). The total N pool in the mor-layer, in kg per hectare, increased c. 3.6 times from the DS to the TH forest type, NH4
+ in the soil solution increased from 0 to 80 m, but from 80 to 90 m, NO3
- became the most abundant inorganic N form in the soil solution (Paper I). However, in soil extracts (soil:water) the concentration of amino acids exceeds that of inorganic N in the DS type, as shown by Nordin et al.,
(2001) is equal to inorganic N in the SH type and lower than inorganic N in the TH type.
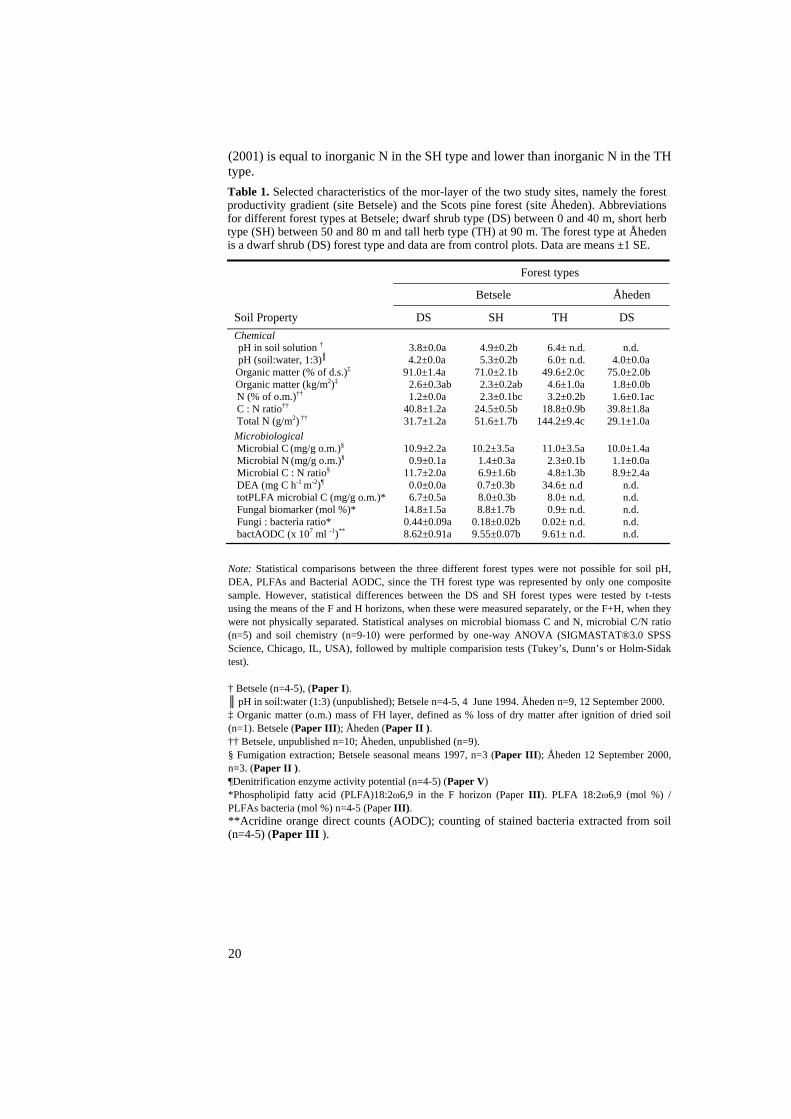
Table 1. Selected characteristics of the mor-layer of the two study sites, namely the forest productivity gradient (site Betsele) and the Scots pine forest (site Åheden). Abbreviations for different forest types at Betsele; dwarf shrub type (DS) between 0 and 40 m, short herb type (SH) between 50 and 80 m and tall herb type (TH) at 90 m. The forest type at Åheden is a dwarf shrub (DS) forest type and data are from control plots. Data are means ±1 SE.
Forest types
Betsele Åheden
Soil Property DS SH TH DS Chemical
pH in soil solution † 3.8±0.0a 4.9±0.2b 6.4± n.d. n.d. pH (soil:water, 1:3)║ 4.2±0.0a 5.3±0.2b 6.0± n.d. 4.0±0.0a Organic matter (% of d.s.)‡ 91.0±1.4a 71.0±2.1b 49.6±2.0c 75.0±2.0b Organic matter (kg/m2)‡ 2.6±0.3ab 2.3±0.2ab 4.6±1.0a 1.8±0.0b
N (% of o.m.)†† 1.2±0.0a 2.3±0.1bc 3.2±0.2b 1.6±0.1ac C : N ratio†† 40.8±1.2a 24.5±0.5b 18.8±0.9b 39.8±1.8a Total N (g/m2) †† 31.7±1.2a 51.6±1.7b 144.2±9.4c 29.1±1.0a Microbiological Microbial C (mg/g o.m.)§ 10.9±2.2a 10.2±3.5a 11.0±3.5a 10.0±1.4a Microbial N (mg/g o.m.)§ 0.9±0.1a 1.4±0.3a 2.3±0.1b 1.1±0.0a Microbial C : N ratio§ 11.7±2.0a 6.9±1.6b 4.8±1.3b 8.9±2.4a DEA (mg C h-1 m-2)¶ 0.0±0.0a 0.7±0.3b 34.6± n.d n.d. totPLFA microbial C (mg/g o.m.)* 6.7±0.5a 8.0±0.3b 8.0± n.d. n.d. Fungal biomarker (mol %)* 14.8±1.5a 8.8±1.7b 0.9± n.d. n.d. Fungi : bacteria ratio* 0.44±0.09a 0.18±0.02b 0.02± n.d. n.d. bactAODC (x 107 ml -1)** 8.62±0.91a 9.55±0.07b 9.61± n.d. n.d.
Note: Statistical comparisons between the three different forest types were not possible for soil pH, DEA, PLFAs and Bacterial AODC, since the TH forest type was represented by only one composite sample. However, statistical differences between the DS and SH forest types were tested by t-tests using the means of the F and H horizons, when these were measured separately, or the F+H, when they were not physically separated. Statistical analyses on microbial biomass C and N, microbial C/N ratio (n=5) and soil chemistry (n=9-10) were performed by one-way ANOVA (SIGMASTAT®3.0 SPSS Science, Chicago, IL, USA), followed by multiple comparision tests (Tukey’s, Dunn’s or Holm-Sidak test). † Betsele (n=4-5), (Paper I). ║ pH in soil:water (1:3) (unpublished); Betsele n=4-5, 4 June 1994. Åheden n=9, 12 September 2000. ‡ Organic matter (o.m.) mass of FH layer, defined as % loss of dry matter after ignition of dried soil (n=1). Betsele (Paper III); Åheden (Paper II ). †† Betsele, unpublished n=10; Åheden, unpublished (n=9). § Fumigation extraction; Betsele seasonal means 1997, n=3 (Paper III); Åheden 12 September 2000, n=3. (Paper II ). ¶Denitrification enzyme activity potential (n=4-5) (Paper V) *Phospholipid fatty acid (PLFA)18:2ω6,9 in the F horizon (Paper III). PLFA 18:2ω6,9 (mol %) / PLFAs bacteria (mol %) n=4-5 (Paper III). **Acridine orange direct counts (AODC); counting of stained bacteria extracted from soil (n=4-5) (Paper III ).
20
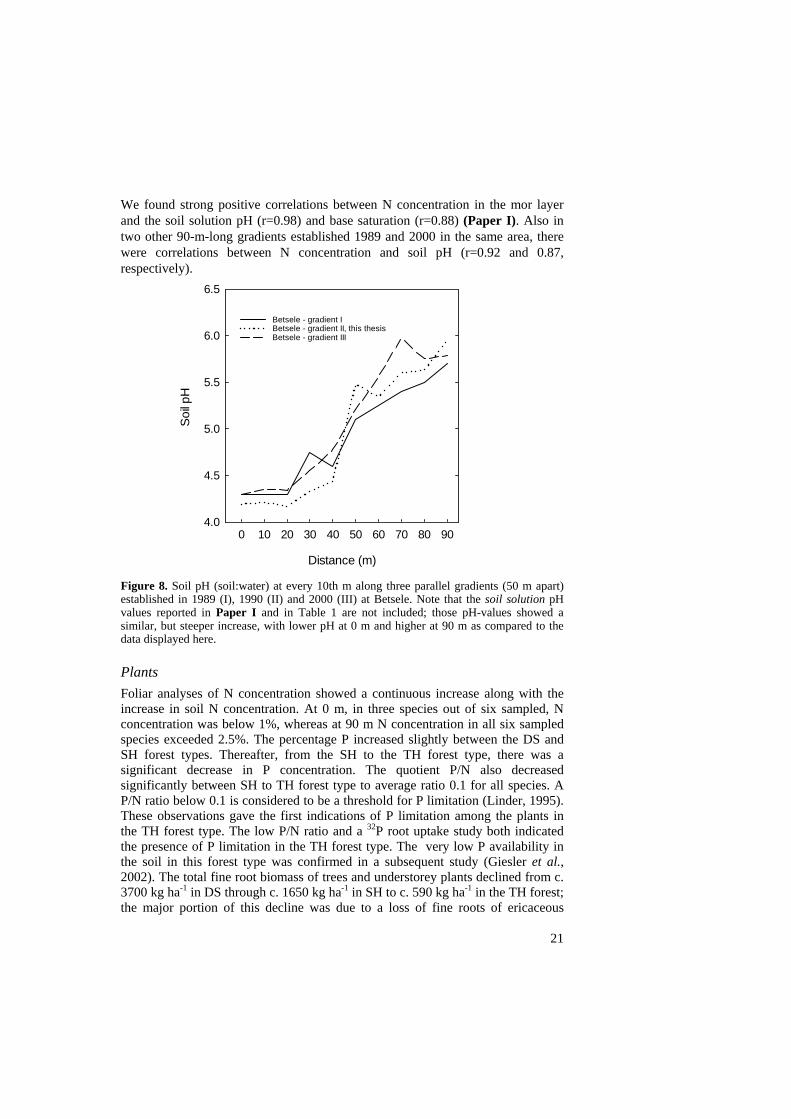
We found strong positive correlations between N concentration in the mor layer and the soil solution pH (r=0.98) and base saturation (r=0.88) (Paper I). Also in two other 90-m-long gradients established 1989 and 2000 in the same area, there were correlations between N concentration and soil pH (r=0.92 and 0.87, respectively).
Distance (m)
0 10 20 30 40 50 60 70 80 90
Soil p
H
4.0
4.5
5.0
5.5
6.0
6.5
Betsele - gradient I Betsele - gradient II, this thesisBetsele - gradient III
Figure 8. Soil pH (soil:water) at every 10th m along three parallel gradients (50 m apart) established in 1989 (I), 1990 (II) and 2000 (III) at Betsele. Note that the soil solution pH values reported in Paper I and in Table 1 are not included; those pH-values showed a similar, but steeper increase, with lower pH at 0 m and higher at 90 m as compared to the data displayed here. Plants Foliar analyses of N concentration showed a continuous increase along with the increase in soil N concentration. At 0 m, in three species out of six sampled, N concentration was below 1%, whereas at 90 m N concentration in all six sampled species exceeded 2.5%. The percentage P increased slightly between the DS and SH forest types. Thereafter, from the SH to the TH forest type, there was a significant decrease in P concentration. The quotient P/N also decreased significantly between SH to TH forest type to average ratio 0.1 for all species. A P/N ratio below 0.1 is considered to be a threshold for P limitation (Linder, 1995). These observations gave the first indications of P limitation among the plants in the TH forest type. The low P/N ratio and a 32P root uptake study both indicated the presence of P limitation in the TH forest type. The very low P availability in the soil in this forest type was confirmed in a subsequent study (Giesler et al., 2002). The total fine root biomass of trees and understorey plants declined from c. 3700 kg ha-1 in DS through c. 1650 kg ha-1 in SH to c. 590 kg ha-1 in the TH forest; the major portion of this decline was due to a loss of fine roots of ericaceous
21
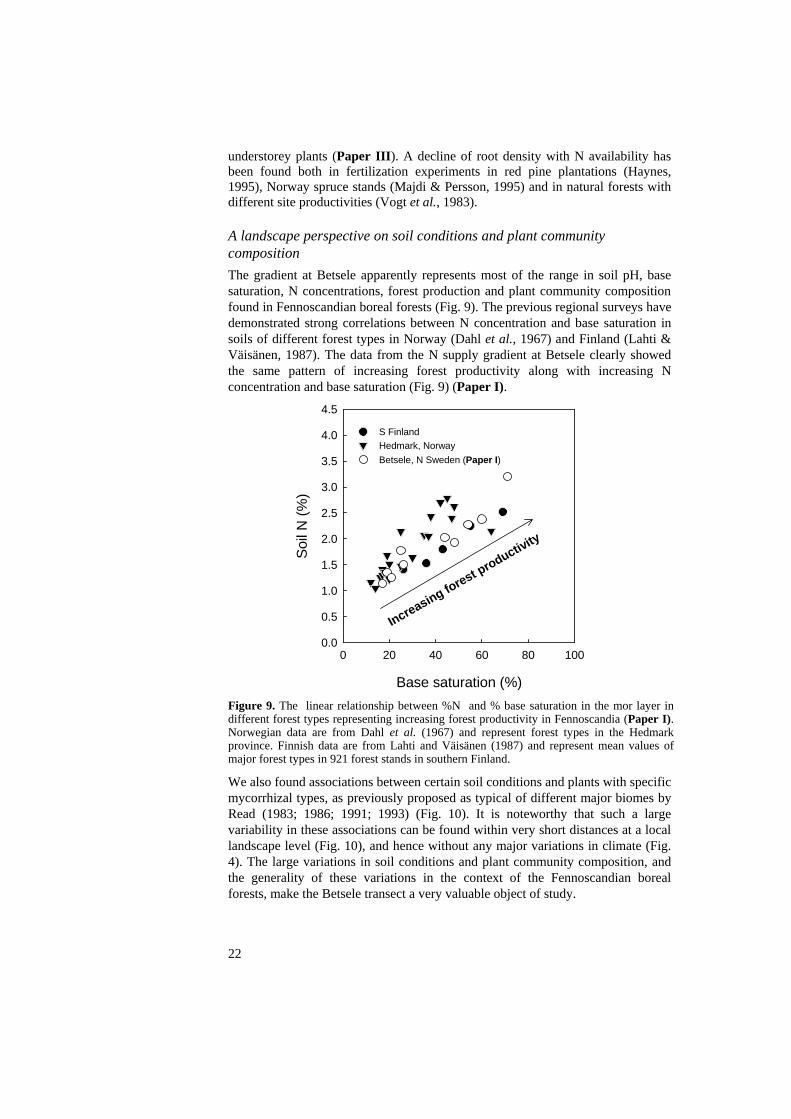
understorey plants (Paper III). A decline of root density with N availability has been found both in fertilization experiments in red pine plantations (Haynes, 1995), Norway spruce stands (Majdi & Persson, 1995) and in natural forests with different site productivities (Vogt et al., 1983). A landscape perspective on soil conditions and plant community composition The gradient at Betsele apparently represents most of the range in soil pH, base saturation, N concentrations, forest production and plant community composition found in Fennoscandian boreal forests (Fig. 9). The previous regional surveys have demonstrated strong correlations between N concentration and base saturation in soils of different forest types in Norway (Dahl et al., 1967) and Finland (Lahti & Väisänen, 1987). The data from the N supply gradient at Betsele clearly showed the same pattern of increasing forest productivity along with increasing N concentration and base saturation (Fig. 9) (Paper I).
Base saturation (%)
0 20 40 60 80 100
Soil
N (%
)
0.0
0.5
1.0
1.5
2.0
2.5
3.0
3.5
4.0
4.5
S FinlandHedmark, Norway Betsele, N Sweden (Paper I)
Increasing forest productivity
Figure 9. The linear relationship between %N and % base saturation in the mor layer in different forest types representing increasing forest productivity in Fennoscandia (Paper I). Norwegian data are from Dahl et al. (1967) and represent forest types in the Hedmark province. Finnish data are from Lahti and Väisänen (1987) and represent mean values of major forest types in 921 forest stands in southern Finland.
We also found associations between certain soil conditions and plants with specific mycorrhizal types, as previously proposed as typical of different major biomes by Read (1983; 1986; 1991; 1993) (Fig. 10). It is noteworthy that such a large variability in these associations can be found within very short distances at a local landscape level (Fig. 10), and hence without any major variations in climate (Fig. 4). The large variations in soil conditions and plant community composition, and the generality of these variations in the context of the Fennoscandian boreal forests, make the Betsele transect a very valuable object of study.
22
Dec
reas
ing
latit
ude
or a
ltitu
de
Dow
nhill
loca
l for
est i
n Fe
nnos
cand
ia
The
fore
st p
rodu
ctiv
ity g
radi
ent:
A m
odel
syst
em
Bio
me:
F
ores
t typ
e:
Hea
thla
nd
B
orea
l For
est
T
empe
rate
For
est
G
rass
land
D
war
f shr
ub
Sh
ort h
erb
Ta
ll he
rb
0-4
0 m
50-8
0 m
9
0 m
So
il:
Org
anic
-Raw
S
urfa
ce O
rgan
ic
B
row
n-Ea
rth
M
iner
al
M
or, F
-laye
r
M
or, F
and
H-la
yer
M
or, H
-laye
r
H
umus
(Mor
) or p
eat
(Mor
-Mod
er)
M
oder
-Mul
l
d
omin
ates
equa
lly
dom
inat
es
N
itrog
en S
ourc
e:
O
rgan
ic-P
rote
in
O
rgan
ic-N
H4
N
H4 -
NO
3
NO
3
Org
anic
N
N
H4,
orga
nic
N
NH
4-NO
3
Littl
e m
iner
alis
atio
n
Lim
ited
Min
eral
isat
ion
N
itrifi
catio
n
No
min
eral
isat
ion
M
iner
alis
atio
n
M
iner
alis
atio
n
N
o ni
trific
atio
n
m
iner
alis
atio
n
dom
inat
es
No
nitri
ficat
ion
N
o ni
trific
atio
n
Nitr
ifica
tion
Myc
orrh
izas
:
Eric
oid
Ect
o-(E
ricoi
d
Ect
o-(A
M
A
M-(
scar
ce
Ect
o- (E
ricoi
d
Ec
to-(
AM
AM
(s
ome
Ecto
-)
und
erst
ory)
un
ders
tory
)
Ect
o-)
u
nder
stor
y)
und
erst
ory)
pH
3.5
Dec
reas
ing
soil
pH
pH
6.5
pH
3.8
D
ecre
asin
g so
il pH
p
H 6
.4
Dec
reas
ing
phos
phor
ous a
vaila
bilit
y
D
rop
in P
a
vaila
blity
and
P:N
ratio
23
Figu
re 1
0. L
eft
pane
l; th
e pr
opos
ed r
elat
ions
hip
betw
een
the
dist
ribut
ion
of b
iom
es a
long
gra
dien
ts a
nd t
he p
reva
iling
m
ycor
rhiz
al a
ssoc
iatio
ns w
ith t
he c
hara
cter
istic
fun
ctio
nal
grou
ps o
f pl
ants
on
a no
rther
n he
mis
pher
e ba
sed
scal
e, a
s su
gges
ted
by
Rea
d an
d co
wor
ker (
Rea
d &
Per
ez-M
oren
o, 2
003;
Rea
d (1
983,
198
6, 1
991,
199
3). R
edra
wn
from
Rea
d &
Pe
rez-
Mor
eno
(200
3). N
ote
that
pot
entia
l fun
gal s
ymbi
ont a
ctiv
ity is
not
incl
uded
and
that
soi
l pH
is f
rom
Rea
d (1
991)
. W
ith p
erm
issi
on fr
om N
ew P
hyto
logi
st. R
ight
pan
el; a
loca
l sca
le (t
his t
hesi
s), w
here
fore
st p
rodu
ctiv
ity g
radi
ents
are
ofte
n fo
und
alon
g sl
opes
in th
e Fe
nnos
cand
ian
land
scap
e. I
n th
is th
esis
the
90-m
-long
for
est p
rodu
ctiv
ity g
radi
ent i
n no
rther
n Sw
eden
is u
sed
as a
mod
el sy
stem
for s
tudi
es o
f soi
l-mic
robi
al-p
lant
inte
ract
ions
in F
enno
scan
dian
bor
eal f
ores
ts.
23232323
232323
24
The forest girdling experiment The contribution by ectomycorrhizal mycelium to soil microbial biomass and to DOC A month after the late girdling treatment, soil microbial C was 41% lower in late girdled plots than in control plots, whereas at the same time, three months after early girdling, the soil microbial C was 23% lower in early girdled than in control plots (Paper II). Microbial N did not change significantly after girdling. A 30-50% decline in microbial C was also found in another recent forest girdling experiment in Norway spruce forest in Germany (Subke et al., 2004). Thus, based on the average loss of microbial C in the early and late girdling treatments, at least 32% of the microbial biomass C was contributed by extramatrical ECM mycelium. This contribution was calculated to be equivalent to 145 kg ha-1, corresponding to 58 kg C ha-1 at a fungal biomass C content of 40% by weight. This is lower than the 160 to 800 kg ha-1 ECM extramatrical mycelium and mantles found by Wallander et al. (2001) after using decreases in PLFA18:2ω6,9 after trenching as an estimate of ECM mycelium in soil. However, Wallander et al. (2001) studied more productive forests in southern Sweden. Our estimate of a 32% contribution by extramatrical ECM fungi to microbial biomass should be a conservative estimate, primarily because the necromass of ECM mycelium in soil in girdled plots could be used as a substrate by other soil organisms.
Levels of extractable DOC were 45% lower in girdled than in control plots. In the mor layer of boreal forests the abundance of DOC is high (van Hees et al., 2000). For the first time (Paper II ), it was shown that ECM roots and fungi were directly involved in production of DOC at this scale in the field. This has also been found more recently in a girdling experiment in Wetzstein, Germany, where 37 and 75% lower DOC levels was found in the mineral soil in girdled plots in a young and an old Norway spruce stand, respectively, 3 months after girdling (Michael Andersson, personal communication). Griffiths et al. (1994) compared ectomycorrhizal mats soils with non-mat soils in forests dominated by Douglas-fir and found 5 to 360 times higher DOC levels in mat soils and the highest levels were recorded in autumn.
In boreal mor layer soil, low molecular organic acid C contribute 5 to 10% of DOC (van Hees et al., 2000). The production of low molecular weight organic acids by roots is promoted by mycorrhiza and contributes to weathering of minerals (Lundström et al., 2000; van Breemen et al., 2000). One common view is that most of the DOC constitutes more or less recalcitrant substances left over from decomposition or is a refractory product of decomposition. However, the DOC produced is a potential C source for other microbes in the mycorrhizosphere (eg., Nurmiaho-Lassila et al., 1997; Bonkowski, 2004). It is well known that microbial activity is very high in the rhizosphere as compared with the bulk soil.
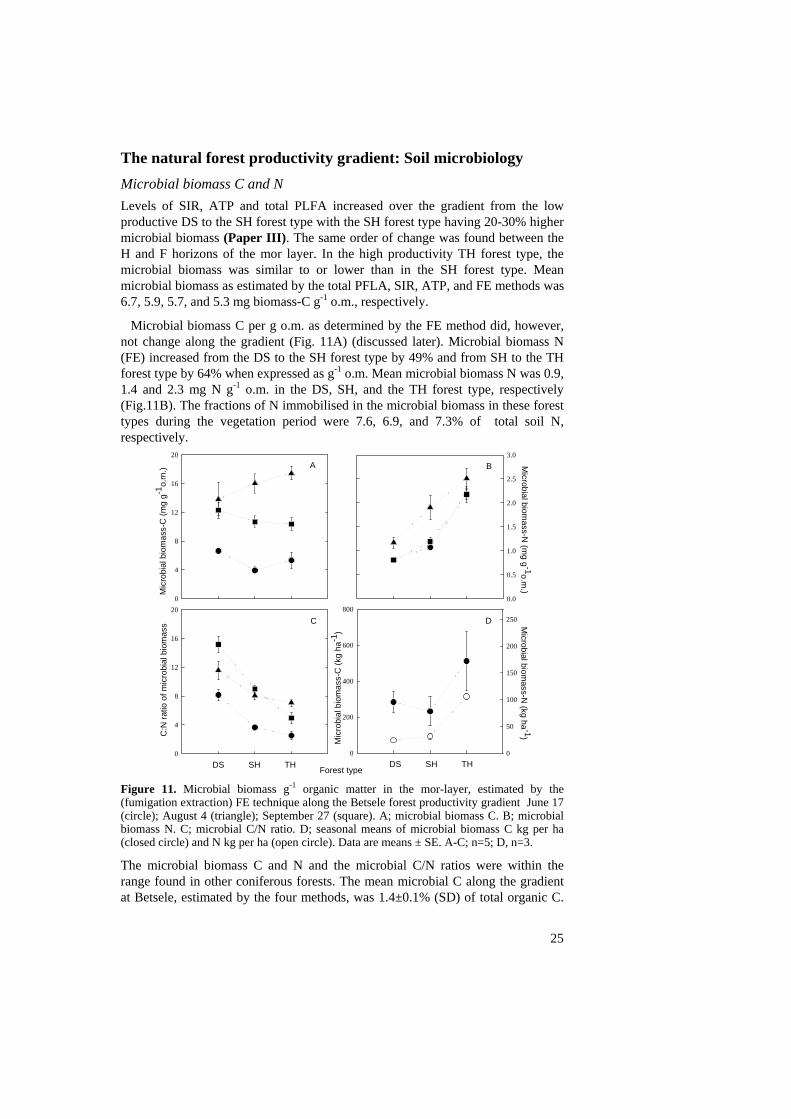
The natural forest productivity gradient: Soil microbiology Microbial biomass C and N Levels of SIR, ATP and total PLFA increased over the gradient from the low productive DS to the SH forest type with the SH forest type having 20-30% higher microbial biomass (Paper III). The same order of change was found between the H and F horizons of the mor layer. In the high productivity TH forest type, the microbial biomass was similar to or lower than in the SH forest type. Mean microbial biomass as estimated by the total PFLA, SIR, ATP, and FE methods was 6.7, 5.9, 5.7, and 5.3 mg biomass-C g-1 o.m., respectively.
Microbial biomass C per g o.m. as determined by the FE method did, however, not change along the gradient (Fig. 11A) (discussed later). Microbial biomass N (FE) increased from the DS to the SH forest type by 49% and from SH to the TH forest type by 64% when expressed as g-1 o.m. Mean microbial biomass N was 0.9, 1.4 and 2.3 mg N g-1 o.m. in the DS, SH, and the TH forest type, respectively (Fig.11B). The fractions of N immobilised in the microbial biomass in these forest types during the vegetation period were 7.6, 6.9, and 7.3% of total soil N, respectively.
Figure 11. Microbial biomass g-1 organic matter in the mor-layer, estimated by the (fumigation extraction) FE technique along the Betsele forest productivity gradient June 17 (circle); August 4 (triangle); September 27 (square). A; microbial biomass C. B; microbial biomass N. C; microbial C/N ratio. D; seasonal means of microbial biomass C kg per ha (closed circle) and N kg per ha (open circle). Data are means ± SE. A-C; n=5; D, n=3.
0
4
8
12
16
20
dist vs juneCmg dist vs augCmg dist vs sepCmg
0.0
0.5
1.0
1.5
2.0
2.5
3.0
C:N
ratio
of m
icro
bial
bio
mas
s
0
4
8
12
16
20
A B
C
Forest type
Mic
robi
al b
iom
ass-
C (k
g ha
-1)
0
200
400
600
800
Microbial biom
ass-N (kg ha -1)
0
50
100
150
200
250D
Microbial biom
ass-N (m
g g -1o.m. )M
icro
bial
bio
mas
s-C
(mg
g-1o.
m.)
DS SH TH DS SH TH
The microbial biomass C and N and the microbial C/N ratios were within the range found in other coniferous forests. The mean microbial C along the gradient at Betsele, estimated by the four methods, was 1.4±0.1% (SD) of total organic C.
25
26
This was close to the 1.7% found in a coniferous boreal forest of similar age (Bauhus et al., 1998), the 1.2% in Finnish Scots pine forests (Martikainen & Palojärvi, 1990), the 1.6% in Finnish Norway spruce stands (Smolander & Mälkönen, 1994), but slighly lower than the 2.2% based on FE (64 studies), SIR (9 studies) and microcalorimetry (1 study), previously found for boreal forests (Bauhus & Khanna, 1999). The mean contribution of microbial N to total N was 7.3%; almost the same concentration (7.5%) was found by Bauhus et al. (1998) in the forest floor of coniferous boreal forests. Thus, microbial C and N constitute rather constant fractions of total C and N along the gradient. The mean microbial C/N ratio over the Betsele gradient was c. 8 (Fig. 11C) compared to 9 in the study of boreal forests by Bauhus et al. (1998). In fact, the mean microbial C/N ratio of 4.8 in the TH forest is slightly below values found in many agricultural soils of 5.3 and 5.5 estimated by the FI and FE technique, respectively (Jenkinson, 1987; Joergensen et al., 1994). However, Smith and Paul (1990) reported a microbial C/N ratio of 3.7 for cultivated soils. Microbial C and N expressed per area was similar in the poor DS and the SH forest type, whereas the TH forest type contained twice as much microbial C and almost four times more microbial N per area. This is because of accumulation of soil organic matter in this forest type.
In the following I will concentrate on differences in microbial biomass, community structure and activity between the DS and SH forest types, which show a three-fold difference in forest productivity. The TH forest type has significantly different forest and soil conditions (more open, periodically water-logged) compared to the rest of the gradient. Periodic anaerobic conditions and/or very high concentrations of N (Berg & McClaugherty, 2003) may, for example, explain the greater soil organic matter accumulation in the TH forest.
There were significantly higher microbial biomass C and N (FE) values in August than in June and the mean C/N ratio of the microbial biomass was highest in the autumn. (Fig. 11). Estimates of microbial biomass were found to increase in both a forest and a grass ecosystem when 14C flow to roots increased in a bimodal pattern of early spring and late autumn, at the same time as soil water content increased during these periods, which was suggested to have a contributing effect on microbial activity (Smith & Paul, 1986). Soil fungal biomass, determined by the fluorescein diacetate (FDA) method (Bååth & Söderström, 1982) was studied in a mature and a clear-cut pine forest in Sweden, with and without slash. Bååth and Söderström observed a seasonality, that was most obvious in the treatment without slash, where FDA-active fungal length had the same seasonal pattern as soil moisture with high values during early spring and autumn. Biomass peaks of FDA active fungal mycelium in a Scots pine forest (Sweden) were registered in autumn and early spring (Söderström, 1979). Seasonality in microbial biomass may thus be linked not only to soil moisture but also to the suggested bimodal course of root growth activity, with maxima in autumn and spring (Smith & Paul, 1986) and prior to bud break (Hansen et al., 1997). However, seasonality in microbial biomass was not found in a hardwood forest in northwestern Lower Michigan, after applying the fumigation incubation technique (Holmes & Zak, 1994).
All estimates of microbial biomass are based on root-free soils and all four
27
methods applied (SIR, ATP, total PLFA, FE) require corrections of raw data to be converted to soil microbial biomass data. The SIR, ATP and PLFA were calibrated against the SIR method, which in turn is calibrated to the fumigation incubation (FI) technique. The correction factors applied in the FE method was calibrated by microscopic counting (Martikainen & Palojärvi, 1990) (Paper III). As is discussed above, the microbial activity of mor soils seems to be very sensitive to disturbance and responds differently to incubation (Paper IV). Some important distinctions can be made between the four methodologies applied in Paper III, i.e. SIR, ATP, total PLFA, FE: i) whether they require a preincubation period (20 °C, c. 7-10 days for SIR, at 25 °C c. 5-7 days for ATP) or not (FE and total PLFA), ii) if they measure microbial activities in a direct manner (after glucose addition, SIR) or in an indirect manner (ATP, total PLFA), and iii) if the method is applied shortly after sampling (FE) or after different periods of storage of soil at 4 °C (SIR, ATP and PLFA). Hence, the FE method is valuable to use as the method can be applied directly after soil sampling wihout pre-incubation. Microbial activity Microbial activity determined as CO2 released g-1 o.m., i.e. basal respiration, was significantly higher in sieved root-free soil from the intermediate SH compared to the low productivity DS forest type with increases between 28 and 37% depending on the sampling occasion. In soil samples from the TH forest type, the microbial activity was generally lower than in the SH forest type. However, there were no significant differences in field respiration rates, which comprise both root activity and microbial activity, between forest types. Field rates showed a seasonal trend with significantly higher rates throughout the gradient late in the summer. Interestingly, this high soil respiration rate coincided with the season when C allocation to the roots is thought to be highest in these forests (Hansen et al., 1997). The weekly mean soil temperature increased c. 2.5 °C between late June and early August. At Åheden the heterotrophic respiration declined after a 20-day-long 6 °C decline in soil temperature, whereas root respiration did not decline (Bhupinderpal-Singh et al., 2003). However, sometimes also a respiration peak in spring has been observed elsewhere (Smith & Paul, 1986; Griffiths, 1990). The larger above-ground plant biomass and three-fold higher productivity towards the productive end of the gradient at Betsele does not support a higher soil microbial activity (via root allocation and above-ground litter fall).
However, the stand girdling experiment (Högberg et al., 2001b) suggests that the respiration of mycorrhizal roots is equal to or even exceeds saprotrophic microbial respiration in strongly N-limited boreal forests. Hence, a reduction in the activity of mycorrhizal fungi towards the high productivity end of the gradient could be significant. In another girdling experiment, fertilized and non-fertilized plots were compared, and the effect of girdling on soil respiration was clearly smaller in fertilized plots (Olsson, P; Högberg, P; Linder, S, unpubl.). This demonstrated that trees, which experience a higher nutrient supply, allocate less C below-ground (Cannell & Dewar, 1994). I propose that the same occurs as the nutrient availability increases along the Betsele gradient (Paper III). The result is that the microbial biomass C and overall microbial respiratory activity varies remarkablylittlealong the gradient (Paper III), despite the large suspected
variation in rates of N cycling and the two-and-half fold increase in microbial N and three-fold increase in forest productivity.
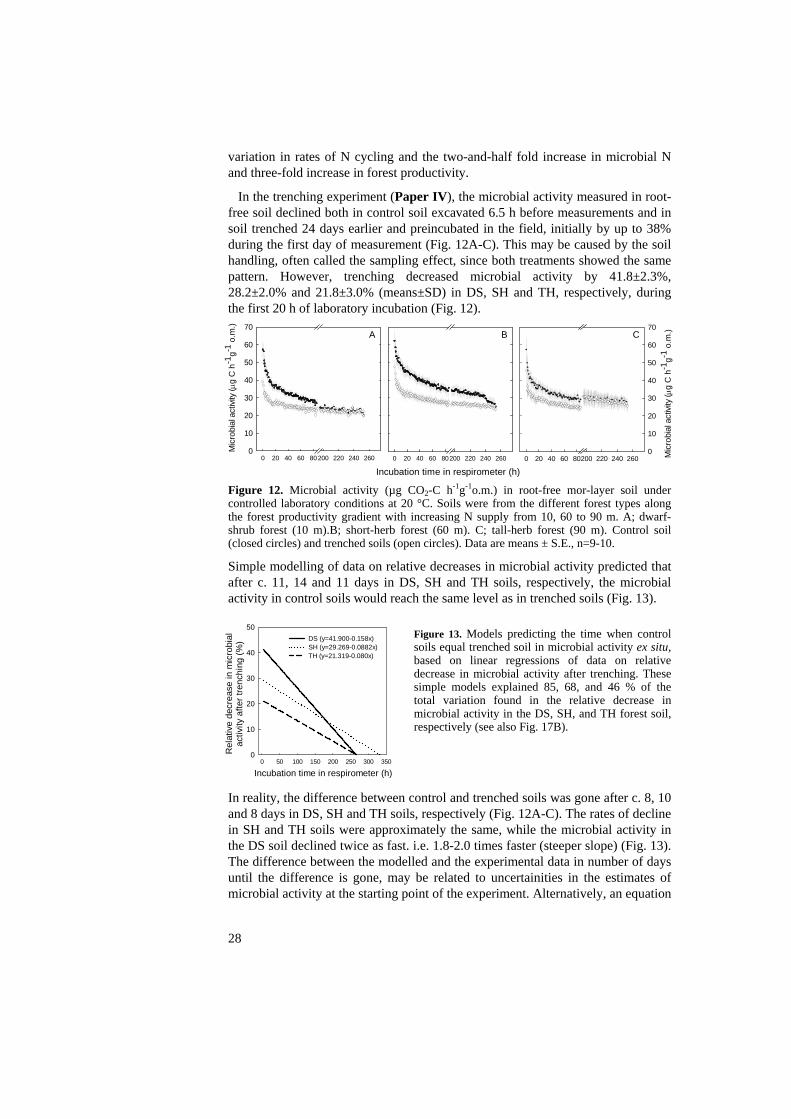
In the trenching experiment (Paper IV), the microbial activity measured in root-free soil declined both in control soil excavated 6.5 h before measurements and in soil trenched 24 days earlier and preincubated in the field, initially by up to 38% during the first day of measurement (Fig. 12A-C). This may be caused by the soil handling, often called the sampling effect, since both treatments showed the same pattern. However, trenching decreased microbial activity by 41.8±2.3%, 28.2±2.0% and 21.8±3.0% (means±SD) in DS, SH and TH, respectively, during the first 20 h of laboratory incubation (Fig. 12).
28
0 20 40 60 80 200 220 240 260
Mic
robi
al a
ctivi
ty (µ
g C
h-1
g-1 o
.m.
0
10
20
30
40
50
60
70A
Incubation time in respirometer (h)0 20 40 60 80200 220 240 260
B
0 20 40 60 80200 220 240 2600
10
20
30
40
50
60
70C
Mic
robi
al a
ctivi
ty (µ
g C
h-1
g-1 o
.m.)
)
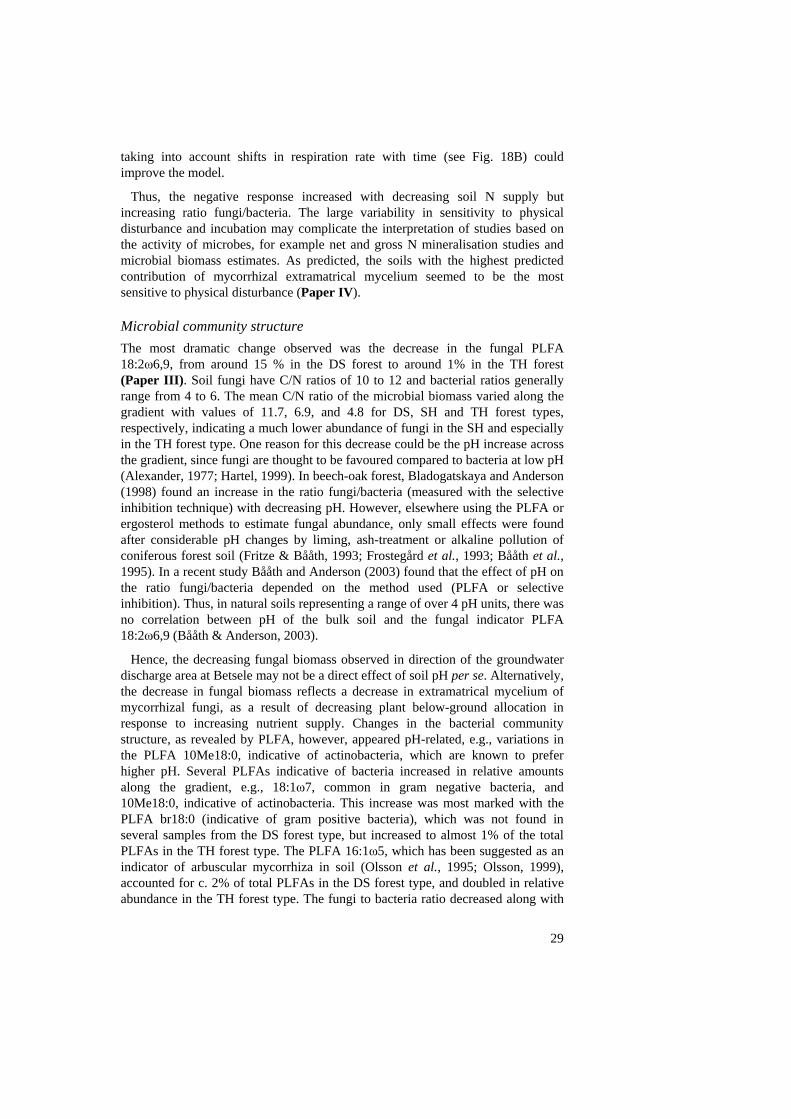
Figure 12. Microbial activity (µg CO2-C h-1g-1o.m.) in root-free mor-layer soil under controlled laboratory conditions at 20 °C. Soils were from the different forest types along the forest productivity gradient with increasing N supply from 10, 60 to 90 m. A; dwarf-shrub forest (10 m).B; short-herb forest (60 m). C; tall-herb forest (90 m). Control soil (closed circles) and trenched soils (open circles). Data are means ± S.E., n=9-10. Simple modelling of data on relative decreases in microbial activity predicted that after c. 11, 14 and 11 days in DS, SH and TH soils, respectively, the microbial activity in control soils would reach the same level as in trenched soils (Fig. 13).
Incubation time in respirometer (h)0 50 100 150 200 250 300 350
Rel
ativ
e de
crea
se in
mic
robi
al
ac
tivity
afte
r tre
nchi
ng (%
)
0
10
20
30
40
50DS (y=41.900-0.158x)SH (y=29.269-0.0882x) TH (y=21.319-0.080x)
Figure 13. Models predicting the time when control soils equal trenched soil in microbial activity ex situ, based on linear regressions of data on relative decrease in microbial activity after trenching. These simple models explained 85, 68, and 46 % of the total variation found in the relative decrease in microbial activity in the DS, SH, and TH forest soil, respectively (see also Fig. 17B).
In reality, the difference between control and trenched soils was gone after c. 8, 10 and 8 days in DS, SH and TH soils, respectively (Fig. 12A-C). The rates of decline in SH and TH soils were approximately the same, while the microbial activity in the DS soil declined twice as fast. i.e. 1.8-2.0 times faster (steeper slope) (Fig. 13). The difference between the modelled and the experimental data in number of days until the difference is gone, may be related to uncertainities in the estimates of microbial activity at the starting point of the experiment. Alternatively, an equation
29
taking into account shifts in respiration rate with time (see Fig. 18B) could improve the model.
Thus, the negative response increased with decreasing soil N supply but increasing ratio fungi/bacteria. The large variability in sensitivity to physical disturbance and incubation may complicate the interpretation of studies based on the activity of microbes, for example net and gross N mineralisation studies and microbial biomass estimates. As predicted, the soils with the highest predicted contribution of mycorrhizal extramatrical mycelium seemed to be the most sensitive to physical disturbance (Paper IV). Microbial community structure The most dramatic change observed was the decrease in the fungal PLFA 18:2ω6,9, from around 15 % in the DS forest to around 1% in the TH forest (Paper III). Soil fungi have C/N ratios of 10 to 12 and bacterial ratios generally range from 4 to 6. The mean C/N ratio of the microbial biomass varied along the gradient with values of 11.7, 6.9, and 4.8 for DS, SH and TH forest types, respectively, indicating a much lower abundance of fungi in the SH and especially in the TH forest type. One reason for this decrease could be the pH increase across the gradient, since fungi are thought to be favoured compared to bacteria at low pH (Alexander, 1977; Hartel, 1999). In beech-oak forest, Bladogatskaya and Anderson (1998) found an increase in the ratio fungi/bacteria (measured with the selective inhibition technique) with decreasing pH. However, elsewhere using the PLFA or ergosterol methods to estimate fungal abundance, only small effects were found after considerable pH changes by liming, ash-treatment or alkaline pollution of coniferous forest soil (Fritze & Bååth, 1993; Frostegård et al., 1993; Bååth et al., 1995). In a recent study Bååth and Anderson (2003) found that the effect of pH on the ratio fungi/bacteria depended on the method used (PLFA or selective inhibition). Thus, in natural soils representing a range of over 4 pH units, there was no correlation between pH of the bulk soil and the fungal indicator PLFA 18:2ω6,9 (Bååth & Anderson, 2003).
Hence, the decreasing fungal biomass observed in direction of the groundwater discharge area at Betsele may not be a direct effect of soil pH per se. Alternatively, the decrease in fungal biomass reflects a decrease in extramatrical mycelium of mycorrhizal fungi, as a result of decreasing plant below-ground allocation in response to increasing nutrient supply. Changes in the bacterial community structure, as revealed by PLFA, however, appeared pH-related, e.g., variations in the PLFA 10Me18:0, indicative of actinobacteria, which are known to prefer higher pH. Several PLFAs indicative of bacteria increased in relative amounts along the gradient, e.g., 18:1ω7, common in gram negative bacteria, and 10Me18:0, indicative of actinobacteria. This increase was most marked with the PLFA br18:0 (indicative of gram positive bacteria), which was not found in several samples from the DS forest type, but increased to almost 1% of the total PLFAs in the TH forest type. The PLFA 16:1ω5, which has been suggested as an indicator of arbuscular mycorrhiza in soil (Olsson et al., 1995; Olsson, 1999), accounted for c. 2% of total PLFAs in the DS forest type, and doubled in relative abundance in the TH forest type. The fungi to bacteria ratio decreased along with
30
decrease in soil pH and organic matter content in soil. The ratio of 0.02 found in the TH forest soil was similar to the lowest values reported among forest, grassland, arable, and garden soils in Frostegård & Bååth (1996).
Pennanen et al. (1999) studied the structure of the microbial community in Finnish coniferous forests and its relation to site fertility. Their gradient spanned variations in soil pH and C/N ratio of 3.95-4.22 and 37.4-27.9, respectively, i.e., a much smaller range than observed at Betsele. They observed no differences in SIR, total PLFA or basal respiration. However, they observerved a narrowing in the ratio fungi to bacteria from 0.6 to 0.4. Thus, like me they found no variations in microbial biomass, but variations in community structure. Comparison between the F and H horizons We found almost twice as high microbial activity and about 30% higher microbial biomass (ATP, SIR, total PLFA) in the F than in the H horizon (Paper III). Community structure differed between the F and H layers. There was a lower fungi/bacteria ratio in the H horizon compared to the F horizon throughout the gradient. The F horizon had relatively higher amounts of the PLFAs 16:1ω7c, 18:1ω7 and 20:4 (eucaryotic PLFA), while the H horizon, especially, had relatively higher amounts of the PLFAs 19:1b, 20:0, cy19:0, 10Me16:0, 10Me17:0 and 10Me18:0 (Paper III). In Paper I, the mor layer was divided in two equally thick parts, O1 and O2. This was not optimal since the contribution of F and H layer changes remarkably through the gradient. At the poor end, the H layer constitutes about 1/7, but at the rich end almost the entire mor is H. Hence, the contribution of the F horizon, the most active horizon, decreases along the gradient. Nitrogen turnover in soils In the DS forest type, where the soil C/N ratio is 41, there was no net mineralization and NH4
+ consumption exceeded the gross N mineralization rate. This system was, therefore, classified as strongly N-limited.
In the SH forest type, with a soil C/N ratio of 25, the pool size of NH4+ was
larger than in the DS type, while gross NH4+ consumption still exceeded gross N
mineralization. Net N mineralization occurred after >1 month long incubations. The SH type was thus classified as less N-limited than the DS forest type.
The TH type, with a soil C/N ratio of 19, was the only forest type, in which gross N mineralization exceeded gross NH4
+ consumption; here net N mineralization was found already after 1 day of incubation. I thus classify this forest type as not limited by N. Gross nitrification was high although gross NO3- consumption was higher in the TH forest type, which could be explained by strong abiotic and biotic sinks for nitrate; we found high potential denitrification enzyme activity in this forest type only. In the TH forest soil, P is strongly bound to sesquioxides (Paper I). Hence, N is not limiting because of a limitation by P and/or C. The very low C/N ratio of microbial biomass in this forest type, c. 5, supports the latter.
Seasonal means of gross NH4+-N mineralisation rate were 12.8±3.5, 48.8±14.4,
and 93.3±23.7 µg g-1 o.m. day-1 (mean±SE) in the DS, the SH, and the TH forest

type, respectively (Fig. 14). Seasonal means of NH4
+ consumption rates were 15.6±3.1, 55.7±15.1, and 76.1±30.3 µg NH4
+-N g-1o.m.day-1 (mean±SE) in the DS, the SH, and the TH forest type, respectively (Fig. 14A).
0
20
40
60
80
100
120
140
160
JuneAugust September
0
20
40
60
80
100
120
140
16017 June 4 August27 September
B
DS SH TH
Rat
e of
gro
ss N
min
eral
izat
ion
( µ
g N
g-1
o.m
. day
-1)
Rat
e of
gro
ss n
itrifi
catio
n (µg
N g
-1 o
.m. d
ay-1
)
n.d. n.d.
A
DS SH THForest type
Figure 14. Gross rates of N cycling along the forest productivity gradient at Betsele. Abbreviations: (DS); dwarf-shrub (SH); short herb, (TH); tall herb forest type. A; gross N mineralisation g N (µg-1 o.m. day-1) .B; gross nitrification rate (µg N g-1 o.m. day-1 ) in the tall herb (TH) forest type.
Gross N mineralisation data from a primary successional transect (grey alder/rowan, downy birch, downy birch/Norway spruce and Norway spruce) typical for the up-lift land coast in Western Finland (Merilä et al., 2002) were close to the rates found in the DS forest type, c. 20µg NH4
+-N g-1 o.m. day-1
(mean±SE). Artic soils and temperate hardwood forest soils (Fisk et al., 1998; Fisk & Fahey, 2001) also show similar rates as found in the DS forest type. The rates in the SH and in particular in the TH forest type are very high, but similar rates were found in O2-layer soil at the Blodgett Research forest in California (Davidson et al., 1992). After recalculating our highest rates in August to per g dry substance, our gross N mineralisation rates in the SH and TH forest type were 55±6 and 68±8µg NH4
+-N g-1d.s. day-1 (mean±SE), respectively. This was slightly below the rate of 81±10µg NH4
+-N g-1d.s. day-1 (mean±SE) found in the forest floor of a aspen/coniferous mixed forest in the Boreal Plain in eastern Canada (Carmosini et al., 2002). In a study of N cycling in an evergreen forest in S. Chile, Perakis and Hedin (2001) found gross N mineralisation rates of c. 42 µg g-1 o.m. day-1.
Many studies on gross N turnover in various forests and tundra ecosystems have shown that NH4
+ production (N mineralisation) seldom exceeds gross N consumption (all processes consuming NH4
+ ) (e.g., Davidson et al., 1992; Fisk et al., 1998; Fisk & Fahey, 2001; Perakis & Hedin, 2001; Carmosini et al., 2002). This was also found at Betsele in the DS and SH, but not in the TH forest type (Fig. 15A-C). Data below the 1/1 line show that gross N consumption rate, c, exceeds gross N mineralization rate, m, (Fig. A-B), while data above the 1/1 line show that m >c (Fig. 5C). Hence, in the TH forest, the gross N mineralisation rate was higher than the gross NH4
+ consumption rate (Fig. 15C), whereas the NO3-
consumption exceeded the gross nitrification rate (Fig. 16C) (Paper V). Seasonal
31
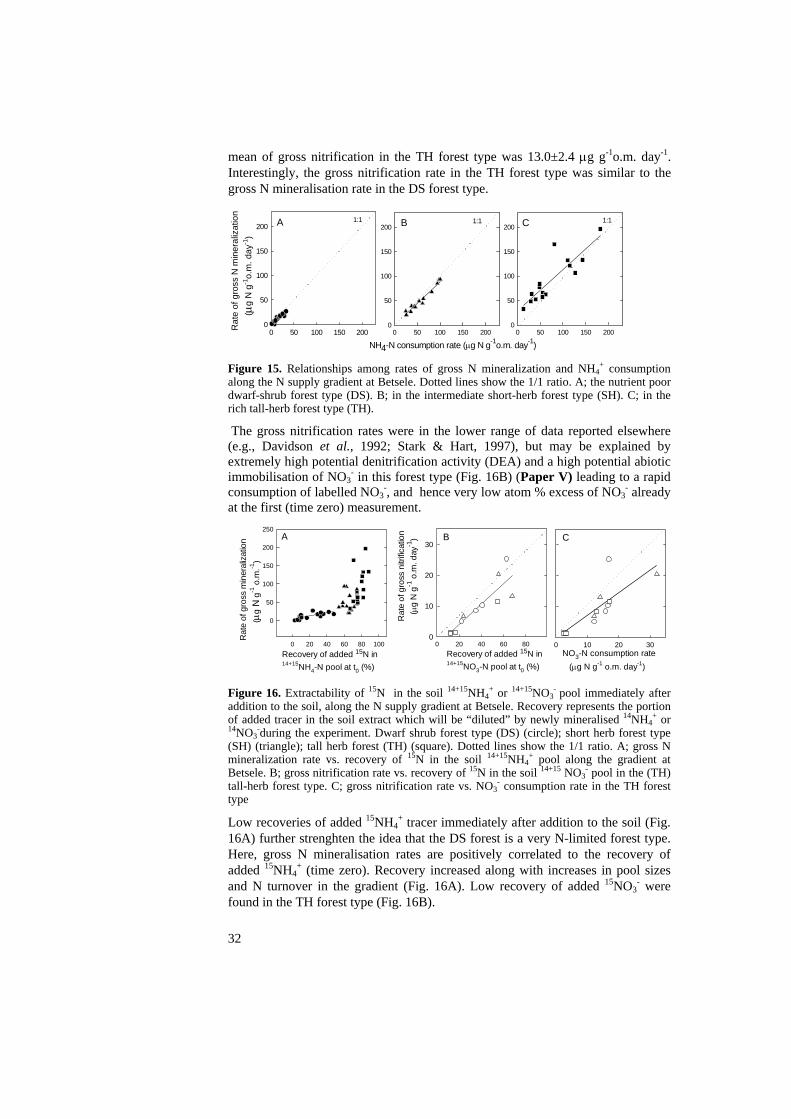
mean of gross nitrification in the TH forest type was 13.0±2.4 µg g-1o.m. day-1. Interestingly, the gross nitrification rate in the TH forest type was similar to the gross N mineralisation rate in the DS forest type.
0 50 100 150 200Rat
e of
gro
ss N
min
eral
izat
ion
( µg
N g
-1o.
m. d
ay-1
)
0
50
100
150
200
0 50 100 150 2000
50
100
150
200
0 50 100 150 2000
50
100
150
200A B C1:1
NH4-N consumption rate (µg N g-1o.m. day-1)
1:1 1:1
Figure 15. Relationships among rates of gross N mineralization and NH4
+ consumption along the N supply gradient at Betsele. Dotted lines show the 1/1 ratio. A; the nutrient poor dwarf-shrub forest type (DS). B; in the intermediate short-herb forest type (SH). C; in the rich tall-herb forest type (TH).
The gross nitrification rates were in the lower range of data reported elsewhere (e.g., Davidson et al., 1992; Stark & Hart, 1997), but may be explained by extremely high potential denitrification activity (DEA) and a high potential abiotic immobilisation of NO3
- in this forest type (Fig. 16B) (Paper V) leading to a rapid consumption of labelled NO3
-, and hence very low atom % excess of NO3- already
at the first (time zero) measurement.
0 10 20 30
Rat
e of
gro
ss n
itrific
atio
n
(µg
N g
-1 o
.m. d
ay-1
)
Recovery of added 15N in 14+15NO3-N pool at t0 (%)
0 20 40 60 800
10
20
30
0 20 40 60 80 100
Rat
e of
gro
ss m
iner
aliza
tion
(µ g
N g
-1 o
.m.-1
)
0
50
100
150
200
250CBA
Recovery of added 15N in 14+15NH4-N pool at t0 (%)
NO3-N consumption rate (µg N g-1 o.m. day-1)
Figure 16. Extractability of 15N in the soil 14+15NH4
+ or 14+15NO3- pool immediately after
addition to the soil, along the N supply gradient at Betsele. Recovery represents the portion of added tracer in the soil extract which will be “diluted” by newly mineralised 14NH4
+ or 14NO3
-during the experiment. Dwarf shrub forest type (DS) (circle); short herb forest type (SH) (triangle); tall herb forest (TH) (square). Dotted lines show the 1/1 ratio. A; gross N mineralization rate vs. recovery of 15N in the soil 14+15NH4
+ pool along the gradient at Betsele. B; gross nitrification rate vs. recovery of 15N in the soil 14+15 NO3
- pool in the (TH) tall-herb forest type. C; gross nitrification rate vs. NO3
- consumption rate in the TH forest type
Low recoveries of added 15NH4+ tracer immediately after addition to the soil (Fig.
16A) further strenghten the idea that the DS forest is a very N-limited forest type. Here, gross N mineralisation rates are positively correlated to the recovery of added 15NH4
+ (time zero). Recovery increased along with increases in pool sizes and N turnover in the gradient (Fig. 16A). Low recovery of added 15NO3
- were found in the TH forest type (Fig. 16B).
32

The mean residence time (average number of days an N atom resides in a pool) for N was generally 10 h to 1 day for NH4
+-N along the gradient but >2 days for NO3--
N in the TH forest type. Davidson et al. (1992) found similar residence times, which varied (depending on sampling time) between 7 h to 2 days for NH4
+-N and 7 h to 4 days in the O2-layer in an >100 yr old forest at the Blodgett Research forest (composed by Douglas fir, white fir, ponderosa/sugar pine, incence cedar, and California black oak). The turnover rate for chloroform labile N (here uncorrected, i.e. the N-flush after fumigation) spanned between 7 to 17 days in the SH and TH forest types. Consequently, microbial N turned over within 18 to 43 days. This was close to the 23-55 days found by Davidson et al. (1992). There was a tendency towards longer pool turnover times for both inorganic N and microbial N in the DS forest type than in the SH and TH forest types, but not significantly so, due to exceptionally high turnover rates in DS in June.
Apparently, our studies of gross and net turnover of NH4+ and NO3
- pools confirmed the presence of profound differences along this forest productivity gradient in in situ N cycling. Obviously, the changes in N cycling occur along with variations in base saturation and other soil chemical properties. However, soil N is turned over by microorganisms, and should proximally be controlled by the supplies of C and N to the organisms. This was supported by a strong correlation between soil and microbial C/N ratios (Fig. 17A); these two ratios were negatively correlated with gross N mineralization rates (Fig. 17B). This seemingly supports the classical view of strong links between saprotrophs, their substrates and soil N turnover. A problem is, however, that the relationship between soil and microbial
Microbial C/N ratio
2 4 6 8 10 12 14
Soil
C/N
ratio
15
20
25
30
35
40
45
Gro
ss N
min
eral
izat
ion
rate
(µ
g N
g-1
o.m
. day
-1)
0
20
40
60
80
100
120
140A
B
Figure 17. Stoichiometry among soil and microbial C/N ratios and gross N mineralization along the forest productivity gradient at Betsele (Paper V). A; relationship between gross N mineralization and microbial C/N ratio. B; linear relationship between soil C/N ratio and microbial C/N ratio. Note that the microbial C/N ratio is based on the same correction factors for microbial C and N, consequently, microbial C/N is equal to C/N of the microbial cytoplasma (the FE method extracts mainly the cytoplasmic content of microbial cells (Tate et al., 1988; Jenkinson et al., 2004)).
33
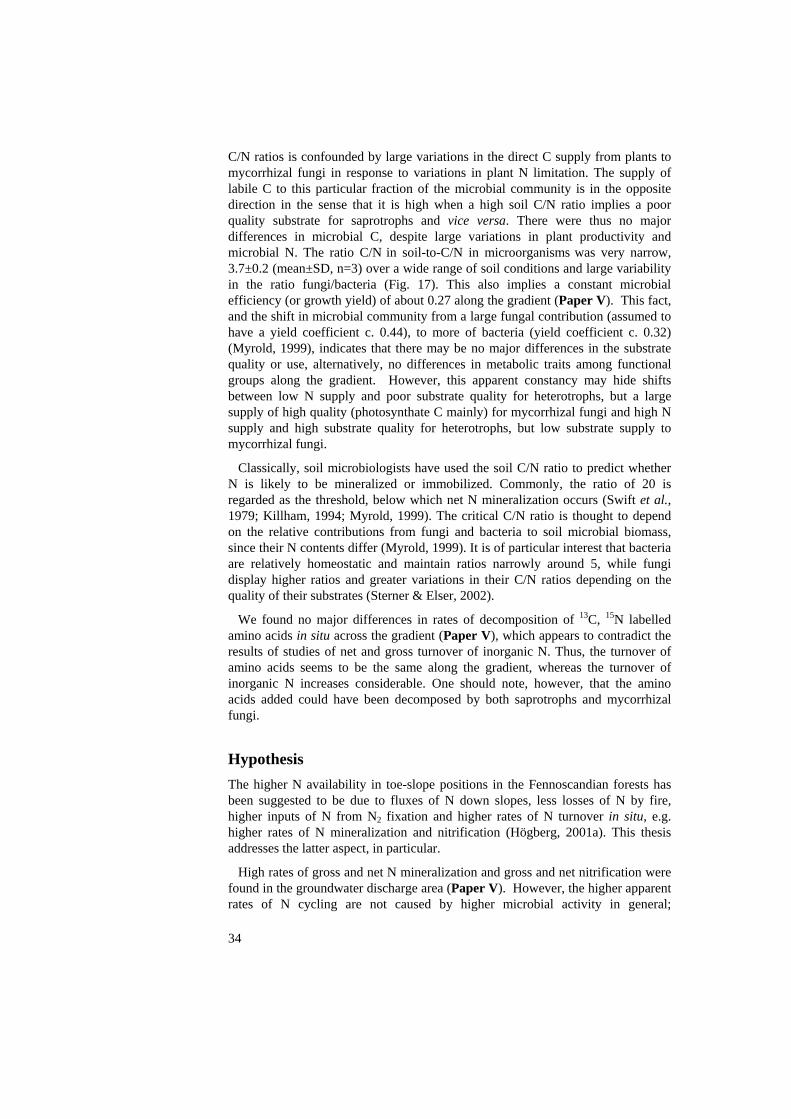
34
C/N ratios is confounded by large variations in the direct C supply from plants to mycorrhizal fungi in response to variations in plant N limitation. The supply of labile C to this particular fraction of the microbial community is in the opposite direction in the sense that it is high when a high soil C/N ratio implies a poor quality substrate for saprotrophs and vice versa. There were thus no major differences in microbial C, despite large variations in plant productivity and microbial N. The ratio C/N in soil-to-C/N in microorganisms was very narrow, 3.7±0.2 (mean±SD, n=3) over a wide range of soil conditions and large variability in the ratio fungi/bacteria (Fig. 17). This also implies a constant microbial efficiency (or growth yield) of about 0.27 along the gradient (Paper V). This fact, and the shift in microbial community from a large fungal contribution (assumed to have a yield coefficient c. 0.44), to more of bacteria (yield coefficient c. 0.32) (Myrold, 1999), indicates that there may be no major differences in the substrate quality or use, alternatively, no differences in metabolic traits among functional groups along the gradient. However, this apparent constancy may hide shifts between low N supply and poor substrate quality for heterotrophs, but a large supply of high quality (photosynthate C mainly) for mycorrhizal fungi and high N supply and high substrate quality for heterotrophs, but low substrate supply to mycorrhizal fungi.
Classically, soil microbiologists have used the soil C/N ratio to predict whether N is likely to be mineralized or immobilized. Commonly, the ratio of 20 is regarded as the threshold, below which net N mineralization occurs (Swift et al., 1979; Killham, 1994; Myrold, 1999). The critical C/N ratio is thought to depend on the relative contributions from fungi and bacteria to soil microbial biomass, since their N contents differ (Myrold, 1999). It is of particular interest that bacteria are relatively homeostatic and maintain ratios narrowly around 5, while fungi display higher ratios and greater variations in their C/N ratios depending on the quality of their substrates (Sterner & Elser, 2002).
We found no major differences in rates of decomposition of 13C, 15N labelled amino acids in situ across the gradient (Paper V), which appears to contradict the results of studies of net and gross turnover of inorganic N. Thus, the turnover of amino acids seems to be the same along the gradient, whereas the turnover of inorganic N increases considerable. One should note, however, that the amino acids added could have been decomposed by both saprotrophs and mycorrhizal fungi.
Hypothesis The higher N availability in toe-slope positions in the Fennoscandian forests has been suggested to be due to fluxes of N down slopes, less losses of N by fire, higher inputs of N from N2 fixation and higher rates of N turnover in situ, e.g. higher rates of N mineralization and nitrification (Högberg, 2001a). This thesis addresses the latter aspect, in particular.
High rates of gross and net N mineralization and gross and net nitrification were found in the groundwater discharge area (Paper V). However, the higher apparent rates of N cycling are not caused by higher microbial activity in general;
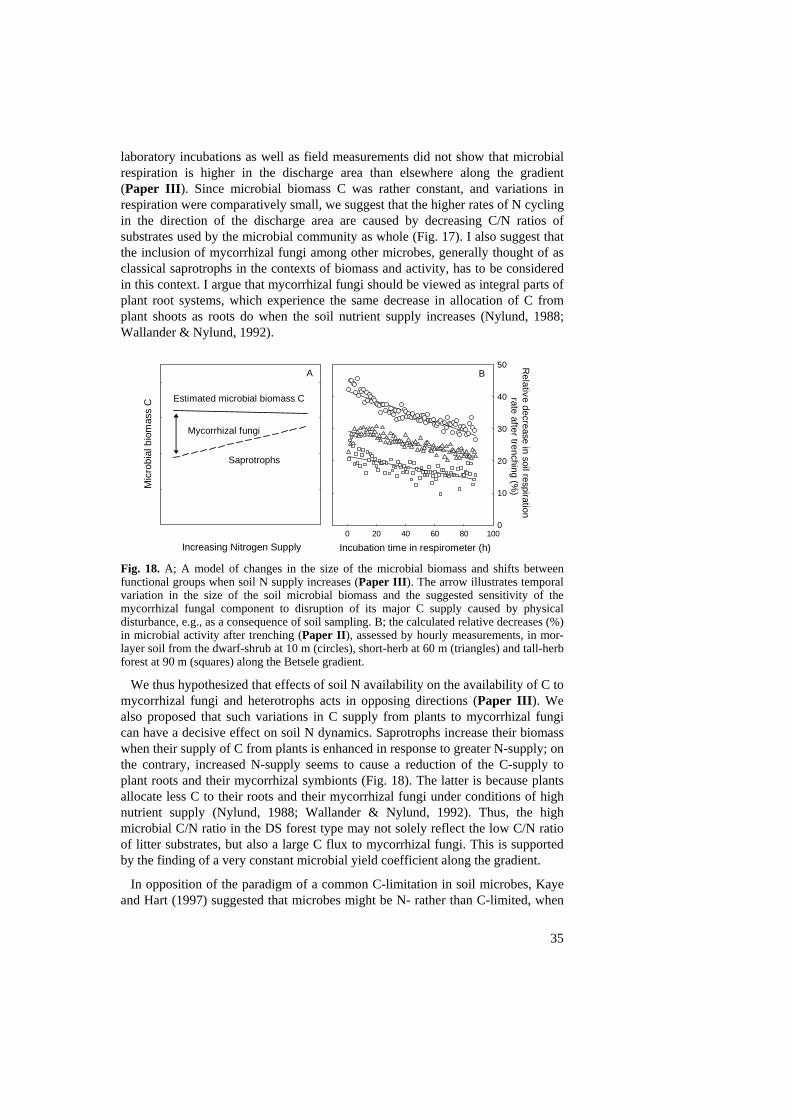
laboratory incubations as well as field measurements did not show that microbial respiration is higher in the discharge area than elsewhere along the gradient (Paper III). Since microbial biomass C was rather constant, and variations in respiration were comparatively small, we suggest that the higher rates of N cycling in the direction of the discharge area are caused by decreasing C/N ratios of substrates used by the microbial community as whole (Fig. 17). I also suggest that the inclusion of mycorrhizal fungi among other microbes, generally thought of as classical saprotrophs in the contexts of biomass and activity, has to be considered in this context. I argue that mycorrhizal fungi should be viewed as integral parts of plant root systems, which experience the same decrease in allocation of C from plant shoots as roots do when the soil nutrient supply increases (Nylund, 1988; Wallander & Nylund, 1992).
Incubation time in respirometer (h)0 20 40 60 80 100
0
10
20
30
40
50
Increasing Nitrogen Supply
Mic
robi
al b
iom
ass
C
Mycorrhizal fungi
Saprotrophs
Estimated microbial biomass C
Relative decrease in soil respiration
rate after trenching (%)
A B Fig. 18. A; A model of changes in the size of the microbial biomass and shifts between functional groups when soil N supply increases (Paper III). The arrow illustrates temporal variation in the size of the soil microbial biomass and the suggested sensitivity of the mycorrhizal fungal component to disruption of its major C supply caused by physical disturbance, e.g., as a consequence of soil sampling. B; the calculated relative decreases (%) in microbial activity after trenching (Paper II), assessed by hourly measurements, in mor-layer soil from the dwarf-shrub at 10 m (circles), short-herb at 60 m (triangles) and tall-herb forest at 90 m (squares) along the Betsele gradient.
We thus hypothesized that effects of soil N availability on the availability of C to mycorrhizal fungi and heterotrophs acts in opposing directions (Paper III). We also proposed that such variations in C supply from plants to mycorrhizal fungi can have a decisive effect on soil N dynamics. Saprotrophs increase their biomass when their supply of C from plants is enhanced in response to greater N-supply; on the contrary, increased N-supply seems to cause a reduction of the C-supply to plant roots and their mycorrhizal symbionts (Fig. 18). The latter is because plants allocate less C to their roots and their mycorrhizal fungi under conditions of high nutrient supply (Nylund, 1988; Wallander & Nylund, 1992). Thus, the high microbial C/N ratio in the DS forest type may not solely reflect the low C/N ratio of litter substrates, but also a large C flux to mycorrhizal fungi. This is supported by the finding of a very constant microbial yield coefficient along the gradient.
In opposition of the paradigm of a common C-limitation in soil microbes, Kaye and Hart (1997) suggested that microbes might be N- rather than C-limited, when
35
36
the soil C/N ratio is high. This may very well be the case in the DS forest type, and especially for mycorrhizal fungi, which have access to a large C supply. Read (1991) emphasized, in his model of relations between soils and plant communities, exclusive capacities of certain mycorrhizal types to access specific soil N sources. I would rather like to emphasize the quantitative importance of the direct C flow from plants to their mycorrhizal fungi. This large C supply gives the latter a unique position in nutrient-poor systems. However, when plants decrease their below-ground C allocation in response to a higher nutrient supply, mycorrhizal fungi become less important. In the nutrient-poor system, they are a strong sink for N, because they can maintain a high C/N ratio, but their importance as N sink should decrease drastically as the soil N supply increases. This in turn leads to even higher N availability to other soil organisms, and may be one explanation of the harp increase in inorganic N towards the discharge area at Betsele. s Concluding remarks and future perspectives
• Local plant productivity gradients, like the one at Betsele, can be used as model systems for soil-microbial-plant interactions in forest ecosystems commonly found in Fennoscandia.
• In a poor Scots pine forest extramatrical ectomycorrhizal (ECM) mycelium contributed one third of microbial biomass and produced together with ECM roots half the dissolved organic carbon in the soil.
• The abundance of mycorrhizal extramatrical mycelium, based on the decline in activity after trenching, decreased with increasing soil fertility from 42, 28, to 22% in the DS, the SH, and the TH forest types respectively. This confirmed the finding of a drastic decline in biomarkers indicative of fungi along the gradient.
• Neither mean microbial biomass nor soil respiration rates varied significantly along the forest productivity gradient, which was totally unexpected because of the three-fold increment in plant production.
• Gross N mineralisation rate increased 2.6 to 5.6 times between the DS and SH forest type, i.e. roughly in proportion to the three-fold increase in forest productivity along the gradient, while there was net mineralization in the TH forest only. Gross nitrification was only measurable in the TH forest type. Net nitrification was absent in DS, detectable in the SH and significant in the TH forest type.
• The higher apparent rates of N cycling are not caused by higher microbial activity in general.
• The suprisingly high microbial biomass C and respiratory activity in the poor DS forest is suggested to be caused by a high C allocation by trees to their ectomycorrhizal fungal symbionts in response to a strong soil N limitation.
37
• The large fractional contribution of mycorrhizal fungi to the microbial community confounds the interpretation of relations among soil and microbial C/N ratios and soil N mineralization.
• Susceptibility of the microbial activity of mor soils to physical disturbance decreases when soil fertility increases, which may further confound the interpretation of measures of soil microbial activity in these kind of soils.
Declining microbial activity after sampling thus complicate the interpretation of estimates of microbial biomass and N cycling. My primary concern is that mycorrhizal fungi, in particular, quickly run out of C during incubations after sampling as pointed out by (Lindahl et al., 2002). It is, therefore, of considerable interest to develop methods taking the effects of the mycorrhizal mycelium into account. There is also a need to clarify the mechanisms of the rapid immobilisation of N to soils, especially in N-limited soils. Further advances in isotopic and molecular methods will likely enable distinctions to be made between different metabolic traits among soil microbes in general and, in particular they will likely help to distinguish the role played by mycorrhizal fungi. This is most important, but may be difficult because of the many complex potential interactions between saprotrophs and mycorrhizal fungi (Lindahl et al., 2001).
References Aerts R. 1999. Interspecific competition in natural plant communities: mechanisms, trade-
offs and plant-soil feedback. Journal of Experimental Botany 50. Alexander M. 1977. Introduction to Soil Microbiology. 2nd edn. New York, USA: John
Wiley & Sons. Anderson JPE & Domsch KH. 1978a. A physiological method for the quantitative
measurement of microbial biomass in soil. Soil Biology and Biochemistry 10: 215-221. Anderson JPE & Domsch KH. 1978b. Mineralisation of bacteria and fungi in chloroform-
fumigated soils. Soil Biology and Biochemistry 10: 207-213. Arnebrant K & Bååth E. 1991. Measurements of ATP in forest humus. Soil Biology and
Biochemistry 23: 501-506. Bauhus J & Khanna PK. 1999. The significance of microbial biomass in forest soils. In:
Rastin N and Bauhus J, eds. Going underground-ecological studies in forest soils. Trivandrum, India: Research Signpost, 77-110.
Bauhus J, Pare´ D & Côte´ L. 1998. Effects of tree species, stand age and soil type on soil microbial biomass and its activity in a southern boreal forest. Soil Biology and Biochemistry 30: 1077-1089.
Berg B & McClaugherty C. 2003. Plant litter. Decomposition. Humus Formation. Carbon Sequestration. Heidelberg, Berlin, Germany: Springer Verlag.
Bhupinderpal-Singh, Nordgren A, Ottosson-Löfvenius M, Högberg MN, Mellander P-E & Högberg P. 2003. Tree root and soil heterotrophic respiration as revealed by girdling of boreal Scots pine forest: extending observations beyond the first year. Plant Cell and Environment 26: 1287-1296.
Blagodatskaya EV & Anderson T-H. 1998. Interactive effects of pH and substrate quality on the fungal-to-bacterial ratio and qCO2 of microbial communities in forest soils. Soil Biology and Biochemistry 30: 1269-1274.
Bligh EG & Dyer WJ. 1959. A rapid method of total lipid extraction and purification. Canadian Journal of Biochemistry and Physiology 37: 911-917.
38
Bonkowski M. 2004. Protozoa and plant growth: the microbial loop in soil revisited. New Phytologist 162: 617-631.
Brookes PC. 1985b. Chloroform fumigation and the release of soil nitrogen: the effect of fumigation time and temperature. Soil Biology and Biochemistry 17: 831-835.
Brookes PC, Landman A, Pruden G & Jenkinson DS. 1985a. Chloroform fumigation and release of soil nitrogen: a rapid direct extraction method to measure microbial biomass nitrogen in soil. Soil Biology and Biochemistry 17: 837-842.
Bååth E. 1992. Thymidine incorporation into macromolecules of bacteria extracted from soil by homogenization-centrifugation. Soil Biology and Biochemistry 24: 1157-1165.
Bååth E. 1996a. Adaptation of soil bacterial communities to prevailing pH in different soils. FEMS Microbiology Ecology 19: 227-237.
Bååth E. 1996b. Thymidine incorporation of bacteria sequently extracted from soil using repeated homogenization-centrifugation. Microbial Ecology 31: 153-166.
Bååth E & Anderson T-H. 2003. Comparison of soil fungal/bacterial ratios in a pH gradient using physiological and PLFA-based techniques. Soil Biology and Biochemistry 35: 955-963.
Bååth E, Frostegård Å, Pennanen T & Fritze H. 1995. Microbial community structure and pH response in relation to soil organic matter quality in wood-ash fertilized, clear-cut or burned coniferous forest soils. Soil Biology and Biochemistry 27: 229-240.
Bååth E & Söderström B. 1982. Seasonal and spatial variation in fungal biomass in a forest soil. Soil Biology and Biochemistry 14: 353-358.
Cajander AK. 1926. The theory of forest types. Acta Forestalia Fennica 29: 1-108. Cannell MGR. 1989. Physiological basis of wood production: a review. Scandinavian
Journal of Forest Research 4: 459-490. Cannell MGR & Dewar RC. 1994. Carbon allocation in trees - A review of concepts for
modelling. Advances in Ecosystem Research 25: 59-104. Carmosini N, Devito KJ & Prepas EE. 2002. Gross nitrogen transformations in harvested
and mature aspen-conifer mixed forest soils from the Boreal Plain. Soil Biology and Biochemistry 34: 1949-1951.
Chapin III FS, Fetcher N, Kiellland K & Everett KR. 1988. Productivity and nutrient cycling of Alaskan tundra: Enhancement by flowing soil water. Ecology 69: 693-702.
Chapin III FS, Vitousek PM & Van Cleve K. 1986. The nature of nutrient limitation in plant communities. The American Naturalist 127: 48-58.
Cole DW. 1981. Nitrogen uptake and translocation by forest ecosystems. Ecological Bulletins 33: 219-232.
Covington WW. 1981. Changes in forest floor organic matter and nutrient content following clear cutting in northern hardwood. Ecology 62: 41-48.
Dahl E, Gjems O & Kjelland-Lund JJ. 1967. On the vegetation of Norwegian conifer forest in relation to the chemical properties of the humus layer. Meddelelser fra det Norske Skogsforsøksvesen 85: 501-531.
Davidson E, Hart SC, Shanks CA & Firestone MK. 1991. Measuring gross nitrogen mineralization, immobilization, and nitrification by 15N isotopic pool dilution in intact soil cores. Journal of Soil Science 42: 335-349.
Davidson EA, Hart SC & Firestone MK. 1992. Internal cycling of nitrate in soils of a mature coniferous forest. Ecology 73: 1148-1156.
Davidson EA, Stark JM & Firestone MK. 1990. Microbial production and consumption of nitrate in an annual grassland. Ecology 71: 1968-1975.
Eiland F. 1983. A simple method for quantitative measurements of ATP in soil. Soil Biology and Biochemistry 15: 665-670.
Eno CF. 1960. Nitrate production in the field by incubating the soil in polyethylene bags. Soil Science Society America Proceedings 24: 277-279.
FAO. 1988. Food and Agriculture Organization of the United Nations (FAO). FAO/UNESCO Soil Map of the World. Revised legend. World Resources Report. In. Rome, Italy: FAO.
39
Federer CA. 1984. Organic matter and nitrogen content of the forest floor in even-aged northern hardwoods. Canadian Journal of Forest Research 14: 763-767.
Federle TW. 1986. Microbial distributions in soil - new techniques. In: Megusar F and Gantar M, eds. Perspectives in Microbial Ecology. Ljubljana, Slovene: Slovene Society for Microbiology, 493-498.
Fisk MC & Fahey TJ. 2001. Microbial biomass and nitrogen cycling responses to fertilization and litter removal in young northern hardwood forests. Biogeochemistry 53: 201-223.
Fisk MC, Schmidt SK & Seastedt TR. 1998. Topographic patterns of above- and belowground production and nitrogen cycling in alpine tundra. Ecology 79: 2253-2266.
Flanagan PW & Van Cleve K. 1977. Microbial biomass, respiration and nutrient cycling in a black spruce taiga ecosystem. Ecological Bulletins 25: 261-273.
Fokin AD, Knyazev DA & Kuzyakov YV. 1993. Destruction of 14C- and 15N-labelled amino acids and nucleic bases in soil and the supply of their transformation products to plants. Eurasian Soil Science 25: 109-122.
Frank A. 1877. Über die biologischen Verhältnisse des Thallus einiger Krustenflechten. Beiträge Zur Biologie der Pflanzen 2: 123-200.
Freeman C, Baxter R, Farrar JF, Jones SE, Plum S, Axhenton TW & Stirling C. 1998. Could competition between plant and microbes regulate plant nutrition and atmospheric CO2 concentrations. The Science of the Total Environment: 181-184.
Fritze H & Bååth E. 1993. Microfungal species composition and fungal biomass in a coniferous forest soil polluted by alkaline deposition. Microbial Ecology 25: 83-92.
Frostegård Å & Bååth E. 1996. The use of phospholipid fatty acid analysis to estimate bacterial and fungal biomass in soil. Biology and Fertility of Soils 22: 59-65.
Frostegård Å, Bååth E & Tunlid A. 1993. Shifts in the structure of soil microbial communities in limed forests as revealed by phospholipid fatty acid analysis. Soil Biology and Biochemistry 25: 723-730.
Frostegård Å, Tunlid A & Bååth E. 1991. Microbial biomass measured as total lipid phosphate in soil of different organic content. Journal of Microbiological Methods 14: 151-163.
Frostegård Å, Tunlid A & Bååth E. 1996. Changes in microbial community structure during long-term incubation in two soils experimentally contaminated with metals. Soil Biology and Biochemistry 28: 55-63.
Giesler R, Högberg M & Högberg P. 1998. Soil chemistry and plants in Fennoscandian boreal forest as exemplified by a local gradient. Ecology 79: 119-137.
Giesler R, Petersson T & Högberg P. 2002. Phosphorus limitation in boreal forests: effects of aluminum and iron accumulation in the humus layer. Ecosystems 5: 300-314.
Griffiths RP. 1990. Douglas-fir forest soils colonized by ectomycorrhizal mats. I. Seasonal variation in nitrogen chemistry and nitrogen cycle transformation rates. Canadian Journal of Forest Research 20: 211-218.
Griffiths RP, Baham JE & Caldwell BA. 1994. Soil solution chemistry of ectomycorrhizal mats in forest soil. Soil Biology and Biochemistry 26: 331-337.
Hansen J, Türk R, Vogg G, Heim R & Beck E. 1997. Conifer carbohydrate physiology: updating classical views. In: Rennenberg H, Eschrich W and Ziegler H, eds. Trees-Contributions to Modern Tree Physiology. Leiden, The Netherlands: Backhuys Publishers, 97-108.
Harley JL & Smith SE. 1983. Mycorrhizal symbiosis. London, UK: Academic Press. Hart SC, Stark JM, Davidson EA & Firestone MK eds. 1994a. Nitrogen mineralization,
immobilization and nitrification. Madison, USA: Soil Science Society of America. Hartel PG. 1999. The soil habitat. In: Sylvia DM, Fuhrmann JJ, Hartel PG and Zuberer DA,
eds. Principles and Applications of Soil Microbiology. New Jersey, NJ, USA: Prentice Hall, 21-43.
Haynes BE. 1995. Belowground carbon allocation in unfertilized and fertilized red pine plantations in northern Wisconsin. Tree Physiology 15: 317-325.
40
Hesselmann H. 1926. Studier över barrskogens humustäcke, dess egenskaper och beroende av skogsvården. Stockholm: Statens skogsförsöksanstalt. 169-552.
Hintikka V & Näykki O. 1967. Notes on the effects of the fungus Hydnellum ferrugineum (Fr.) Karst. on forest soil and vegetation. Communicationes Instituti forestalis Fenniae 62: 1-22.
Holmes W & Zak DR. 1994. Soil microbial biomass dynamics and net nitrogen mineralization in northern hardwood ecosystems. Soil Science Society of America Journal 58: 238-243.
Hägglund B & Lundmark J-E. 1977. Site index estimations by means of site properties, Scots pine and Norway spruce in Sweden. Studia Forestalia Suecica 103.
Högberg P. 2001a. Interactions between hillslope hydrochemistry, nitrogen dynamics, and plants in Fennoscandian boreal forest. In: Schulze E-D, Heimann M, Harrison S, Holland E, Lloyd J, Prentice IC and Schimel D, eds. Global Biogeochemical Cycles in the Climate System. San Diego, USA: Academic Press, 227-233.
Högberg P & Ekblad A. 1996. Substrate-induced respiration mesured in situ in a C3-plant ecosystem using additions of C4-sucrose. Soil Biology and Biochemistry 28: 1131-1138.
Högberg P, Nordgren A, Buchmann N, Taylor AFS, Ekblad A, Högberg MN, Nyberg G, Ottosson-Löfvenius M & Read DJ. 2001b. Large-scale forest girdling shows that current photosynthesis drives soil respiration. Nature 411: 789-792.
Ingham ER, Griffiths RP, Cromack K & Entry JA. 1991. Comparison of direct vs fumigation incubation microbial biomass estimates from ectomycorrhizal mat and non-mat soils. Soil Biology and Biochemistry 23: 465-471.
Jansson SL. 1958. Tracer studies on nitrogen transformations in soil with special attention to mineralization-immobilization relationships. Annals of the Royal Agricultural College of Sweden 24: 101-361.
Jansson SL & Persson J. 1982. Mineralization and immobilization of soil nitrogen. In: Stevenson FJ, ed. Nitrogen in Agricultural Soils. Madison, Wisconsin, USA: Soil Science Society of America, Inc., 229-252.
Jenkinson DS. 1987. Determination of microbial biomass carbon and nitrogen in soil. In Wilson JR, ed. Advances in Nitrogen cycling in Agricultural Ecosystems. Brisbane, Qld, Australia: CAB International, Wallingford 1988, 368-386.
Jenkinson DS, Brookes PC & Powlson DS. 2004. Measuring soil microbial biomass. Soil Biology and Biochemistry 36: 5-7.
Joergensen RG, Meyer B & Mueller T. 1994. Time-course of the soil microbial biomass under wheat: A one year field study. Soil Biology and Biochemistry 26: 987-994.
Kaye JP & Hart SC. 1997. Competition for nitrogen between plants and soil microorganisms. TREE 12, 139-143.
Killham K. 1994. Soil Ecology. Cambridge, UK: Cambridge University Press. Kirkham D & Bartholomew WV. 1954. Equations for following nutrient transformations in
soil, utilizing tracer data. Proceedings of the Soil Science Society of America 18: 33-34. Korsaeth A, Molstad L & Bakken LR. 2001. Modelling the competition for nitrogen
between plants and microflora as a function of soil heterogeneity. Soil Biology and Biochemistry 33: 215-226.
Lahti T & Väisänen RA. 1987. Ecological gradients of boreal forests in South Finland: an ordination test of Cajander's forest type theory. Vegetatio 68: 145-156.
Lambers H, Chapin III FS & Pons TL. 1998. Plant Physiological Ecology. New York: Springer-Verlag.
Lindahl B, Stenlid J & Finlay R. 2001. Effects of resource availability on mycelial interactions and 32P transfer between a saprotrophic and an ectomycorrhizal fungus in soil microcosms. FEMS Microbiology Ecology 38: 43-52.
Lindahl BO, Taylor AFS & Finlay RD. 2002. Defining nutritional constrains on carbon cycling in boreal forests - towards a less "phytocentric" perspective. Plant Soil 242: 123-135.
Linder S. 1995. Foliar analysis for detecting and correcting nutrient imbalances in Norway spruce. Ecological Bulletins 44: 178-190.
41
Lipson DA, Raab TK, Schmidt SK & Monson RK. 1999. Variation in competitive abilities of plants and microbes for specific amino acids. Biology and Fertility of Soils 28: 257-261.
Lundström U, van Breemen N & Bain D. 2000. The podzolization process. A review. Geoderma 94: 97-107.
Majdi H & Persson H. 1995. Effects of ammonium sulphate application on the chemistry of bulk soil, rhizosphere, fine roots and fine-root distribution in a Picea abies (L.) Karst. stand. Plant and Soil 168-169: 151-160.
Martikainen PJ & Palojärvi A. 1990. Evaluation of the fumigation-extraction method for the determination of microbial C and N in a range of forest soils. Soil Biology and Biochemistry 22: 797-802.
Merilä P, Smolander A & Strömmer R. 2002. Soil nitrogen transformations along a primary succession transect on the land-uplift coast in western Finland. Soil Biology and Biochemistry 34: 373-385.
Myrold DD. 1987. Relationship between microbial biomass nitrogen and a nitrogen availability index. Soil Science Society of America Journal 51: 1047-1049.
Myrold DD. 1999. Transformations of nitrogen. In: Sylvia DM, Fuhrmann JJ, Hartel PG and Zuberer DA, eds. Principles and Applications of Soil Microbiology. New Jersey, USA: Prentice Hall, 259-294.
Myrold DD, Matson PA & Peterson DL. 1989. Relationships between soil microbial properties and aboveground stand characteristics of conifer forest in Oregon. Biogeochemistry 8: 265-281.
Nadelhoffer KJ, Aber JD & Melillo JM. 1984. Seasonal patterns of ammonium and nitrate uptake in nine temperate forest ecosystems. Plant and Soil 80: 321-335.
Nordgren A. 1988b. Apparatus for the continuous, long-term monitoring of soil respiration rate in large number of samples. Soil Biology and Biochemistry 20: 955-957.
Nordgren A, Bååth E & Söderström B. 1988a. Evaluation of soil respiration characteristics to assess heavy metal effect on soil microorganisms using glutamic acid as a substrate. Soil Biology and Biochemistry 20: 949-954.
Nordin A, Högberg P & Näsholm T. 2001. Soil nitrogen form and plant nitrogen uptake in a boreal forest along a forest productivity gradient. Oecologia 129: 125-132.
Nurmiaho-Lassila E-L, Timonen S, Haahtela K & Sen R. 1997. Bacterial colonization patterns of intact Pinus sylvestris mycorrhizospheres in dry pine forest soil: an electron microscopy study. Canadian Journal of Microbiology 43: 1017-1035.
Nylund J-E. 1988. The regulation of mycorrhiza formation - carbohydrate and hormone theories reviewed. Scandinavian Journal of Forest Research 3: 465-479.
Näsholm T, Ekblad A, Nordin A, Giesler G, Högberg M & Högberg P. 1998. Boreal forest plants take up organic nitrogen. Nature 392: 914-916.
Näsholm T, Huss-Danell K & Högberg P. 2001. Uptake of glycine by field grown wheat. New Phytologist 150: 59-63.
Ohlsson KEA & Wallmark H. 1999. Novel calibration with correction for drift and non-linear response for continuous flow isotope ratio mass spectrometry applied to the determination of delta N-15, total nitrogen, delta C-13 and total carbon in biological material. Analyst 124: 571-577.
Olsson PA. 1999. Signature fatty acids provide tools for determination of the distribution and interactions of mycorrhizal fungi in soil. MiniReview. FEMS Microbiology Ecology 29: 303-310.
Olsson PA, Bååth E, Jakobsen I & Söderström B. 1995. The use of phospholipid and neutral lipid fatty acids to estimate biomass of arbuscular mycorrhizal fungi in soil. Mycological Research 99: 623-629.
Pennanen T, Liski J, Bååth E, Kitunen V, Uotila J, Westman CJ & Fritze H. 1999. Structure of the microbial communities in coniferous forest soils in relation to site fertility and stand developement stage. Microbial Ecology 38: 168-179.
Perakis SS & Hedin LO. 2001. Fluxes and fates of nitrogen in soil of an unpolluted old-growth temperate forest, southern Chile. Ecology 82: 2245-2260.
42
Persson J, Högberg P, Ekblad A, Högberg MN, Nordgren A & Näsholm T. 2003. Nitrogen acquisition from inorganic and organic sources by boreal forest plants in the field. Oecologia 137: 252-257.
Powlson DS & Barraclough D. 1993. Mineralization and assimilation in soil-plant systems. In: Knowles R and Blackburn TH, eds. Nitrogen Isotope Techniques. San Diego, USA: Academic Press, 209-242.
Prescott CE, Maynard DG & Laiho R. 2000. Humus in northern forests: friend or foe? Forest Ecology and Management 133: 23-36.
Read DJ. 1983. The biology of mycorrhiza in the Ericales. Canadian Journal Botany 61: 985-1004.
Read DJ. 1986. Non-nutritional effects of mycorrhizal infection. In: V. Gianinazzi-Pearson and Gianinazzi S, eds. Physiological and Genetical aspects of Mycorrhizae. Paris, France: Institut National de la Recherche Agronomique (INRA), 169-176.
Read DJ. 1991. Mycorrhizas in ecosystems. Experientia 47: 376-391. Read DJ. 1993. Mycorrhiza in Plant Communities. In: Ingram DS, Williams PH and
Tommerup IC, eds. Advances in Plant Pathology: Mycorrhiza Synthesis. London, UK: Academic Press, 1-31.
Read DJ & Perez-Moreno J. 2003. Mycorrhizas and nutrient cycling in ecosystems - a journey towards relevance? New Phytol 157: 475-492.
Romell LG. 1935. Ecological problems of the humus layer in the forest. Cornell University Agricultural Experimental Station Memoir No. 170: 3-28.
Romell LG. 1938. A trenching experiment in spruce forest and its bearing on problems of mycotrophy. Svensk Botanisk Tidskrift 32: 89-99.
Smith JL & Paul EA. 1986. The role of soil type and vegetation on microbial biomass and activity. In Megusar F and Gantar M, eds. Perspectives in Microbial Ecology. Ljubljana, Slovene: Slovene Society for Microbiology, 460-466.
Smith JL & Paul EA. 1990. The significance of soil microbial biomass estimations. In: Bollag J-M and Stotsky G, eds. Soil Biochemistry. New York, USA: Dekker, 357-396.
Smith SE & Read DJ. 1997. Mycorrhizal symbiosis. 2nd. London, UK: Academic Press. Smolander A & Mälkönen E. 1994. Microbial biomass C and N in limed soil of Norway
spruce stands. Soil Biology and Biochemistry 26: 503-509. Stark JM & Hart SC. 1996. Diffusion techniques for preparing salt solutions, Kjeldahl
digests and persulphate digests for nitrogen-15 analysis. Soil Science Society of America Journal 60: 1846-1855.
Stark JM & Hart SC. 1997. High rates of nitrification and nitrate turnover in undisturbed coniferous forests. Nature 385: 61-64.
Sterner RW & Elser JJ. 2002. Ecological Stoichiometry: The Biology of Elements from Molecules to the Biosphere. New Jersey, USA: Princeton University Press.
Subke J-A, Hahn V, Battipaglia G, Linder S, Buchmann N & Cotrufo MF. 2004. Feedback interactions between needle litter decomposition and rhizosphere activity. Oecologia 139: 551-559.
Swift MJ, Heal OW & Anderson JM. 1979. Decomposition in Terrestrial Ecosystems. In: Studies in Ecology. Oxford, UK: Blackwell.
Söderberg KH & Bååth E. 1998. Bacterial activity along a young barley root measured by the thymidine and leucine incorporation techniques. Soil Biology and Biochemistry 30: 1259-1268.
Söderström B. 1979. Seasonal fluctuations of active fungal biomass in horizons of a podzolized pine-forest soil in central Sweden. Soil Biology and Biochemistry 11: 149-154.
Sörensen P & Jensen ES. 1991. Sequential diffusion of ammonium and nitrate from soil extract to a polytetrafluoroethylene trap for 15N determination. Analytica Chimica Acta 252: 201-203.
Tamm C-O. 1991. Nitrogen in Terrestrial Systems. Berlin, Germany: Springer-Verlag.
43
Tate KR, Ross DJ & Feltham CW. 1988. A direct extraction method to estimate soil microbial C: effects of experimental variables and some different calibration procedures. Soil Biology and Biochemistry 20: 329-335.
Taylor AFS, Martin F & Read DJ. 2000. Fungal diversity in ectomycorrhizal communities of Norway spruce (Picea abies (L.) Karst.) and beech (Fagus sylvatica L.) along north-south transects in Europe. In: Schulze E-D, ed. Carbon and Nitrogen Cycling in European Forest Ecosystems Ecological Studies. Berlin, Germany: Springer-Verlag, 343-365.
Tiedje JM. 1982. Denitrification. In: Page AL, ed. Methods in Soil Analysis, Part 2. Chemical and Microbiological Properties - Agronomy Monograph no. 9. 2nd ed. Madison, USA: ASA - SSSA, 1011-1026.
Tietema A. 1998. Microbial carbon and nitrogen dynamics in coniferous forest floor material collected along a European nitrogen deposing gradient. Forest Ecology and Management 101, 29-36.
Tunlid A & White DC. 1992. Biochemical analysis of biomass, community structure, nutritional status, and metabolic activity of microbial communities in soil. In: Stotzky G and Bollag J-M, eds. Soil Biochemistry. New York, USA: Dekker, 229-261.
Tutin TG, Heywood VH, Burges NA, Valentine SM, Walters SM & Webb DA eds. 1964-1980. Flora Europea. Cambridge, UK: Cambridge University Press.
Wallander H, Nilsson L-O, Hagerberg D & Bååth E. 2001. Estimation of the biomass and seasonal growth of external mycelium of ectomycorrhizal fungi in the field. New Phytologist 151: 753-760.
Wallander H & Nylund J-E. 1992. Effects of excess nitrogen and phosphorus starvation on the extramatrical mycelium of ectomycorrhizas of Pinus sylvestris L. New Phytologist 120: 495-503.
Wallenda T & Kottke I. 1998. Nitrogen deposition and ectomycorrhizas. New Phytologist 139: 169-187.
van Breemen N, Finlay RD, Lundsröm U, Jongmans AG, Giesler R & Olsson M. 2000. Mycorrhizal weathering: a true case of mineral nutrition? Biogeochemistry 49: 53-67.
van Breemen N & Finzi AC. 1998. Plant-soil interactions: ecological aspects and evolutionary implications. Biogeochemistry 42: 1-19.
van der Werf A, Poorter H & Lambers H. 1994. Respiration as dependent on a species inherent growth rate and on the nitrogen supply to the plant. In: Roy J and Garnier E, eds. A Whole Plant Perspective of Carbon-Nitrogen Interactions. The Haag, The Netherlands: SPB Academic Publishing, 91-110.
van Hees PAW, Lundström U & Giesler R. 2000. Low molecular weight organic acids and their Al-complexes in soil solution - composition, distribution and seasonal variation in three podzolized soils. Geoderma 94: 173-200.
Vance ED, Brookes PC & Jenkinson DS. 1987. An extraction method for measuring microbial biomass C. Soil Biology and Biochemistry 19: 703-707.
Wardle DA. 1992. A comparative assessement of factors which influence microbial biomass carbon and nitrogen levels in soil. Biological Reviews 67: 321-358.
Vitousek P. 1982. Nutrient cycling and nutrient use efficiency. American Naturalist 119: 553-572.
Vogt KA, Moore EE, Vogt DJ, Redlin MJ & Edmonds RL. 1983. Conifer fine root and mycorrhizal root biomass within the forest floors of Douglas-fir stands of different ages and site productivities. Canadian Journal of Forest Research 13: 429-437.
Wu J, Brookes PC & Jenkinson DS. 1993. Formation and destruction of microbial biomass during the decomposition of glucose and ryegrass in soil. Soil Biology and Biochemistry 25: 1435-1441.
Zak DR, Grigal DF, Gleeson S & Tilman D. 1990. Carbon and nitrogen cycling during old-field succession: Constraints in plant and microbial biomass. Biogeochemistry 11: 111-129.
44
Zak DR, Holmes WE, White DC, Peacock AD & Tilman D. 2003. Plant diversity, soil microbial communities, and ecosystem function: are there any links? Ecology 84: 2042-2050.
Zak DR, Tilman D, Parmente RR, Rice CW, Fischer FM, Vose J, Milchunas D & Martin CW. 1994. Plant production and soil microorganisms in late successional ecosystems: a continental-scale study. Ecology 75: 2333-2347.
Acknowledgements Most of all I am grateful to Professors Roger Finlay, Marianne Clarholm, Torgny Näsholm and Erland Bååth for the support they gave me to finish this thesis.
My gratitude to Professor David Myrold for his contribution to the last paper.
I thank Dr. Björn Berg for introducing me to the field of soil microbiology.
My warmest and deepest thanks goes to my dear Peter and to our lovely children Axel, Jon-Isak och Fredrika, who encouraged me all the way through - together we can accomplish everything we want to!
I give my appreciation to my mother Gun for always being by my side.
Special thanks to my friends Christina Röckner, Eva Lundin, my sister Ingrid and my brothers Bertil, Olof and Per for encouragement.
I am also grateful to past and present staff at the Department of Forest Ecology: Doc. Anders Nordgren, Dr. Bhupinder-Pal Singh (University of Western Australia), Doc. Reiner Giesler (Umeå University), Doc. Ulf Skyllberg, and Dr. Mikael Ottosson-Löfvenius for good collaboration. I thank Doc. Anders Ohlsson, Håkan Wallmark, Birgitta Olsson, Bengt Andersson and Leif Olsson for skilful help with chemical analyses.
The work was financially supported by the Swedish Science Council (VR, formerly the Swedish Natural Science Research Council), the Swedish Research Council for Environment, Agricultural Sciences and Spatial Planning (FORMAS, formerly the Swedish Council for Forestry and Agricultural Sciences), and the Commission of the European Community (grants to the projects NiPhys, CANIF, and FORCAST).
~~~