4.d crop production and agricultural soils gb2009 · market gardening grassland ... the main...
TRANSCRIPT

4.D Crop production and agricultural soils
EMEP/EEA emission inventory guidebook 2009 1
Category Title
NFR: 4.D Crop production and agricultural soils
SNAP: 100101 100102 100103 100104 100105 100101
Permanent crops Arable land crops Rice field Market gardening Grassland Fallows
Version Guidebook 2009
Lead authors Nicholas Hutchings, Jim Webb, Barbara Amon Contributing authors (including to earlier versions of this chapter) Ulrich Dämmgen, Torsten Hinz, Klaas Van Der Hoek, Rainer Steinbrecher, Tom Misselbrook, Kentaro Hayashi, Annette Freibauer, Pierre Cellier, Klaus Butterbach-Bahl, Mark Sutton, Ute Skiba, Carolien Kroeze, Brian Pain, Wilfried Winiwarter, Guiseppi Bonazzi, Ingrid Svedinger, David Simpson

4.D Crop production and agricultural soils
EMEP/EEA emission inventory guidebook 2009 2
Contents 1 Overview ..................................................................................................................................3 2 Description of sources.............................................................................................................4
2.1 Process description ..............................................................................................................4 2.2 Emissions ............................................................................................................................6 2.3 Controls ...............................................................................................................................8
3 Methods....................................................................................................................................9 3.1 Choice of method ................................................................................................................9 3.2 Tier 1 default approach......................................................................................................10 3.3 Tier 2 technology-specific approach .................................................................................12 3.4 Tier 3 emission modelling and use of facility data............................................................16
4 Data quality ...........................................................................................................................17 4.1 Completeness ....................................................................................................................17 4.2 Avoiding double counting with other sectors....................................................................17 4.3 Verification........................................................................................................................17 4.4 Developing a consistent time series and recalculation ......................................................17 4.5 Uncertainty assessment .....................................................................................................18 4.6 Inventory quality assurance/quality control QA/QC .........................................................18 4.7 Gridding ............................................................................................................................19 4.8 Reporting and documentation............................................................................................19
5 References..............................................................................................................................20 5.1 Bibliography......................................................................................................................22
6 Point of enquiry.....................................................................................................................22 Appendix A1 Ammonia ................................................................................................................23 Appendix A2 Nitric oxide .............................................................................................................26 Appendix A3 NMVOCs ................................................................................................................29 Appendix A4 Particulate matter..................................................................................................32 Appendix A5 Summary of updates..............................................................................................36 Appendix references .....................................................................................................................37 Supplementary information is given in the Appendix under analogous headings, e.g. A1 in the Appendix corresponds to Section 1 in the main body of this chapter.

4.D Crop production and agricultural soils
EMEP/EEA emission inventory guidebook 2009 3
1 Overview Ammonia (NH3) emissions lead to the acidification and eutrophication of natural ecosystems. Ammonia may also form secondary particulate matter (PM). Nitric oxide (NO) and non-methane volatile organic compounds (NMVOCs) play a role in the formation of ozone, which near the surface of the Earth can have an adverse effect on human health and plant growth. Particulate emissions also have an adverse impact on human health.
This chapter describes methods to estimate the emissions of NH3, NO, NMVOCs and PM from crop production and agricultural soils. This includes both from land to which nitrogen (N)-containing fertilisers are applied and soils cultivated for crop production and grasslands, which are not given N-fertiliser.
Although losses of NH3 from N-fertilisers applied to grass grazed by livestock are difficult to distinguish from subsequent NH3 emissions from urine patches produced by grazing animals, those two emissions are calculated separately. Emissions following application of fertiliser-N and sewage sludge are calculated in this chapter. However, those emissions following application of livestock manures to land and from excreta deposited on fields by grazing animals are calculated in Chapter 4.B Animal husbandry and manure management. This is because the methodology developed to calculate NH3 emissions from animal husbandry treat those emissions as part of a chain of events so that we may estimate the impacts of any factors that affect NH3 emissions at one stage of manure management on subsequent NH3 emissions (see Appendix A1 of Chapter 4.B Animal husbandry and manure management). Nevertheless, grazing emissions have to be reported in NFR category 4.D.2.c Persistent organic pollutants should be reported under 4G Agriculture other; as yet, no robust methodology has been developed.
We currently consider that there is insufficient evidence to justify discriminating between different crops when estimating emissions of NH3, even though there is some evidence that NH3 emissions from rice fields are significantly different to NH3 emissions from the other crops. Emissions from unfertilised crops, with the exception of legumes, are usually considered to be negligible.
Crop production and agricultural soils typically contribute ca. 10 % of the total source strength for European emissions of NH3 (the European Centre for Ecotoxicology and Toxicology of Chemicals (ECETOC), 1994) and NO (Skiba et al., 1997), albeit the contribution varies widely among EU Member States. Emissions of gaseous N species from crop production and agricultural soils are generally related closely to the amount of fertiliser-N applied. Further information on NO is provided in Appendix A2.1.
Crop production and agricultural soils are currently estimated to emit < 1 % of total NMVOC emissions, and therefore do not yet require a methodology for calculation. However, given current uncertainties over the magnitude of NMVOC emissions from agricultural crops, some information is given in this chapter, in order to provide background information and a tool to estimate the order of magnitude of these emissions as well as to highlight current uncertainties.
Particulate matter emitted to the atmosphere is defined according to size or size distribution. In different conventions, fractions are reported from total dust down to the ultra-fine particles (see definitions in Appendix A4). Emissions from tillage land are currently estimated to account for ca. 10 % of agricultural PM10 emissions, and as a first estimate between 1 and 4 % of total national PM emissions.
Emissions from movement of agricultural vehicles on unpaved roads, from the consumption of fuels and emissions due to the input of pesticides are not included here. Pollen and wind-blown

4.D Crop production and agricultural soils
EMEP/EEA emission inventory guidebook 2009 4
particles from cultivated soils not arising directly from field operations are considered as natural emissions. Further information on PM is provided in Appendix A4.1.
Table 1-1 Contributions of emissions of gases from livestock excreta and fertiliser application only: 2005 estimates from http://webdab.emep.in for EU-27
NH31 NOx NMVOC PM2.5 PM10 TSP2
Total Gg a-1 3 554 9 776 8 288 1 234 1 930 3 453 Crop production and agricultural soils Gg a-1
745 0 28 0 0 0
Crop production and agricultural soils %
21.0 0.0 0.3 0.0 0.0 0.0
Notes: 1. The estimate of NH3 emissions includes those from grazing which while reported under 4.D, Crop production and agricultural soils, are calculated in chapter 4.B, Animal husbandry and manure management. 2. TSP = total suspended particles.
2 Description of sources There are four main sources of emissions from crop production and agricultural soils:
• fertiliser application (NH3)
• soil microbial processes (NO)
• crop processes (NH3 and NMVOCs)
• soil cultivation and crop harvesting (PM).
2.1 Process description
2.1.1 Ammonia
Ammonia volatilization occurs when NH3 in solution is exposed to the atmosphere. The extent to which NH3 is emitted depends on the chemical composition of the solution (including the concentration of NH3), the temperature of the solution (He et al., 1999), the surface area exposed to the atmosphere and the resistance to NH3 transport in the atmosphere.
Although N-fertilisers are normally applied as solids, there is usually sufficient moisture in the soil or air for the fertiliser to dissolve. High pH favours the volatilization of NH3 from many N fertilisers, so where the soil is acidic (pH values less than ca. 7), volatilization will tend to be small. In contrast, where the soil is alkaline, the potential for volatilization will be larger. However, the strong interaction between the fertiliser and the soil may override the effects of initial soil pH, so the volatilization depends on both the type of soil and the type of fertiliser. Direct emissions of NH3 only occur from fertilisers containing N as ammonium (NH4
+) or where, as for urea, the fertiliser is rapidly decomposed into NH4
+. Those fertilisers containing N only as nitrate (NO3
-) are not direct sources of NH3 but may increase NH3 emissions via the crop foliage.
Emissions of NH3 from crops mainly occur due to the increase in the concentration of N in the leaves of crops following the addition of fertiliser-N. The emission of NH3 from crops is a complex process as it is influenced by both the concentration of NH3 in the air and environmental conditions.
For further details see Appendix A1.2.1.1.

4.D Crop production and agricultural soils
EMEP/EEA emission inventory guidebook 2009 5
2.1.2 Nitric oxide
In agricultural soils, where pH is likely to be maintained above 5.0, nitrification is considered to be the dominant pathway of NO emission (Remde and Conrad, 1991; Skiba et al., 1997; Venterea et al., 2005). Nitrification is the process by which micro-organisms oxidize NH4
+-N to NO3--N.
The main determinants of NO production in crop production and agricultural soils are mineral N concentration, temperature, soil carbon concentration and soil moisture.
Increased nitrification is likely to occur following application of fertilisers containing NH4+, soil
cultivation and incorporation of crop residues (Aneja et al., 1997). Activities such as tillage and incorporation are considered to increase NO emissions by a factor of 4 (Skiba et al., 1997; Skiba and Ball, 2002; Civerolo and Dickerson, 1998), for periods of between one and three weeks.
2.1.3 NMVOCs
Emissions from crops may arise to attract pollinating insects, eliminate waste products or as a means of losing surplus energy. Ethene emission has been observed to increase when plants are under stress. As with forest NMVOC emissions, biogenic emissions from grasslands consist of a wide variety of species, including isoprene, monoterpenes, (α-pinene, limonene, etc.), and ‘other’ volatile organic compounds (VOC). The ‘other’ VOC (OVOC) species consist of a large number of oxygenated compounds (alcohols, aldehydes, etc.), and have proven difficult to quantify in atmospheric samples. Factors that can influence the emission of NMVOCs include temperature and light intensity, plant growth stage, water stress, air pollution and senescence.
2.1.4 PM
The main sources of PM emissions are soil cultivation and crop harvesting, which together account for > 80 % of total PM10 emissions from tillage land. These emissions originate at the sites where the tractors and other machinery operate and are thought to consist of a mixture of organic fragments from the crop and soil mineral and organic matter. There is considerable settling of dust close to the sources and washing out of fine particles by large particles. Field operations may also lead to re-suspension of dust already settled (re-entrainment). Emissions of PM are dependent on climatic conditions.
Figure 2-1 Process scheme for PM emissions from crop production and agricultural soils

4.D Crop production and agricultural soils
EMEP/EEA emission inventory guidebook 2009 6
2.2 Emissions
2.2.1 Ammonia
General reviews and estimates of NH3 from fertilisers have been provided by Asman (1992), ECETOC (1994), Sutton et al. (1995b), Schjørring and Mattsson (2001) and Harrison and Webb (2001). These reviews have concluded that NH3 emissions from urea are the most variable, ranging from 6 to 47 % of applied N, and are very dependent on factors such as soil type, weather conditions and application rates. In contrast, reported emissions from ammonium nitrate (AN) (and calcium AN, CAN) were much smaller, never exceeding 4 % of applied N. There are fewer studies of other fertilisers such as ammonium sulphate (AS) and di-ammonium phosphate (DAP). Variations in emissions result from differences in soil type and time of application. In general, it is considered that emissions from other fertilisers are less than those from urea, with the exception of AS and DAP on calcareous or otherwise alkaline soils. Results of field experiments reviewed by Harrison and Webb (2001) showed that emissions from urea ammonium nitrate (UAN) solutions were intermediate between those from urea and AN granules, but it is difficult to make firm conclusions on the effect of application in solution per se.
Van der Weerden and Jarvis (1997) and subsequently Harrison and Webb (2001) reviewed data from field measurements of NH3 loss following application of N fertilisers to grassland and arable land, and concluded that NH3 losses from N fertilisers are greater by a factor of 2 on grassland. However, subsequent measurements have failed to show such a large difference (Bouwman et al. 2002b; Misselbrook personal communication), and different EFs when N fertilisers are applied to arable or grassland are no longer considered appropriate.
Losses of NH3 following applications of N-fertiliser to flooded rice soils are considered to be potentially greater than from other cropping systems (Fenn and Hossner 1985). Vlek and Crasswell (1979) measured NH3 losses of up to 50 % of urea-N applied, and up to 60 % of AS-N. More recent studies of NH3 emissions following urea application to flooded soils have measured losses in the range c. 8–56 % of urea-N, with a median loss of 30 %. Many of these studies used micrometeorological techniques. A review by Patel et al. (1989) concluded that earlier studies using chambers had overestimated NH3 losses in the field.
The evidence for direct emissions from, and uptake by, plant foliage is also good (Whitehead and Lockyer, 1989; Schjørring and Mattsson, 2001; Sutton et al., 1993). Although estimates of the component emissions from crop foliage have been made (Denmead et al., 1978; Nemitz et al., 2000), it is often difficult to separate the direct fertiliser and plant emissions in practice, since both are a function of fertiliser-N supply, and in many experiments total emissions were measured. Crop emissions appear to be rather small on an area basis; for example, Harrison (personal communication) found emissions of 1–2 kg ha-1 N early in the season. This means that it is difficult to obtain accurate estimates of crop emissions and the data are currently considered too uncertain to establish separate default EFs for this source. In the Tier 1 and 2 methodologies described here, the EFs used include direct emission from the fertiliser and the emission from foliage that occurs immediately following application. The only exception is the emission from cultivated legumes; here, a separate, tentative default EF is provided.
A further emission may occur from cereal crops during grain-filling or if the crop becomes diseased. However, there are currently insufficient data to justify establishing a default EF. If users have sufficient information to estimate emissions from crops, this would be considered a Tier 3 approach. In which case, users would also need to amend the EFs for fertilisers, otherwise there will be an element of double-counting.

4.D Crop production and agricultural soils
EMEP/EEA emission inventory guidebook 2009 7
Asman (1992) concluded that sewage sludge is a source of NH3 emissions, but that emissions are very uncertain and not very important.
Further information on NH3 is provided in Appendix A1.
2.2.2 Nitric oxide
A review of a global dataset of NO measurements from 189 agricultural fields, but biased toward industrialised countries, has shown that NO emissions are well related to the amount of N applied. Broadcasting fertiliser-N results in greater NO emissions than incorporating fertiliser-N or applying it as solution. Soils with organic C contents of > 3 % have significantly greater NO emissions than soils with < 3 % organic C, and good drainage, coarse texture and neutral pH promote NO emissions. Fertiliser and crop type do not appear to significantly influence NO emissions (Bouwman et al., 2002; Stehfest and Bouwman, 2006).
Stehfest and Bouwman (2006) suggested that for Europe, 1.2 % of N applied on cropland and fertilised grassland is reemitted as NO (manure application included). Freibauer and Kaltschmitt (2000) had earlier suggested 1.0 % of applied N be used as the EF. An EF of 0.66% was recently used to estimate emissions from upland soils in Asia (Yan et al., 2003). Bouwman et al. (2002) reported means of 0.5 % for animal manures and 1 % for fertiliser-N, albeit there was no significant difference in those means.
For further details see Appendix A2.
2.2.3 NMVOCs
Hewitt and Street (1992) concluded that only ca. 700 plant species, mainly from North America, had been investigated as isoprene or monoterpene emitters. Few of these were agricultural crops, and quantitative data was available for only a few species. Many measurements had been made at temperatures higher than those prevailing in North and West Europe. However, based on these limited data, a preliminary estimate of the order of magnitude of crop emissions may be made.
Emissions of NMVOCs from plants have usually been associated with woodlands, which predominantly emit isoprene and terpenes (König et al., 1995). Hewitt and Street (1992) took qualitative measurements of the major grass and crop species in the UK (except for barley, Hordeum vulgare). The only crop species producing any significant emissions was Blackcurrant (Ribes nigrum). However, these workers cautioned against classifying plants as ‘non-emitters’ on the basis of limited measurements, as plant growth stage had been shown to be an important factor in emission. The role of the soil as a source or sink of VOCs requires investigation.
Progress in quantification of OVOC from European vegetation has been made (König et al., 1995), although many more measurement data will be required before reliable attempts to inventory specific OVOC can be made.
Further information on how the methodology was developed is provided in Appendix A3.
2.2.4 PM
Emissions from crop production arise from soil cultivation and harvesting, of which harvesting is the predominant source. Source strength depends on crop, soil type, cultivation method, and weather conditions before and while working. Total dust emissions contain only small proportions of PM10 and PM2.5.

4.D Crop production and agricultural soils
EMEP/EEA emission inventory guidebook 2009 8
2.3 Controls
2.3.1 Ammonia
Ensuring that applications of N-fertiliser are no greater than are needed for optimum crop yield, by making full allowance for the N supplied by crop residues, organic manures, previous N-fertiliser applications, and mineralization of soil N, can lead to reductions of all N emissions including those of NH3 and NO. Fertiliser application should also be timed to match crop demand.
Ammonia emissions from urea can be reduced by compliance with the United Nations Economic Commission for Europe (UNECE) Framework Advisory Code of Good Agricultural Practice for Reducing Ammonia Emissions (hwww.unece.org/env/documents/2001/eb/wg5/eb.air.wg.5.2001.7.e.pdf) and related guidelines, for example by rapid incorporation of urea immediately after application. However, the majority of fertiliser-N is applied to growing crops of cereals or grass, where incorporation is seldom a practical option. Addition of a urease inhibitor has been reported to significantly improve the performance of urea, so that dry matter production and N uptake were almost the same as those with CAN (e.g. Watson et al., 1998). Nevertheless, it may be more cost-effective to choose an alternative N-fertiliser if the climate, soil and crop conditions are unfavourable for urea. This can reduce the NH3 emission by up to 90 %, depending on the substituting fertiliser and on climatic and soil conditions.
Ammonia emissions may also be reduced by placing the fertiliser granule into the soil at the same depth as the seed (ca. 7–8 cm). This will only be applicable for crops sown in the spring (apart from grass reseeds in autumn). Following placement of fertilisers into the soil, NH3 emissions have been estimated to be negligible (assuming that N supply is dimensioned correctly). Deep placement of fertiliser granules is a common technology and has been used for many years in Finland (Aura, 1967). Incorporation of fertiliser-N prior to rice planting, or delaying application until panicle initiation, have been shown to reduce NH3 emissions from rice fields (Humphreys et al., 1988). These are already standard practices in the USA (Bacon et al., 1988). Simultaneous fertiliser application and soil cultivation could be adopted for reasons other than the desire to reduce NH3 emissions (e.g. reduced labour demand).
Application of fertiliser-N when the weather is cool and moist or directly prior to probable rainfall will reduce NH3 emissions. In general, increasing N use efficiency by proper timing and matching of fertilisation to crop demands will reduce all N fertiliser use, which will lead not only to reduced NH3 emission, but losses of N2O, NO and NO3
- leaching will also be reduced. As NH3 emissions are strongly a function of N supply, another potential control is to use cultivars or crop species which require less N.
It should be noted that few of these changes have so far been applied by countries as measures to limit NH3 emissions, and further work would be required to provide a detailed evaluation of all these possibilities. If these techniques are adopted, it is important to consider wider implications than at the field scale. For example, if a technique decreases the yield of feed crops on a livestock farm, the farmer may respond by importing more feed. This could negate the reductions achieved and lead to other adverse side-effects.
2.3.2 NO
No potential controls have been proposed for NO emissions from fertilised crops, but the topic is discussed in Appendix A2.

4.D Crop production and agricultural soils
EMEP/EEA emission inventory guidebook 2009 9
2.3.3 NMVOCs
No potential controls have been proposed for NMVOC emissions from fertilised crops.
2.3.4 PM
No potential controls have been proposed for PM emissions from tillage operations. Emissions can be reduced during harvesting by encapsulating the source of emissions/by the use of dust separators.
3 Methods
3.1 Choice of method Figure 3-1 provides the decision tree for this source category. Starting from the top left, it guides the user towards the most applicable approach.

4.D Crop production and agricultural soils
EMEP/EEA emission inventory guidebook 2009 10
Start
Is countryspecific Tier 3 methodology
available?
Estimate emissionsusing Tier 3
approach
Are amounts of fertilizer applied to land
and average soil temperaturesavailable or reliably
estimated?
Estimate emissions from the fertilizer sub-
category using Tier 1 approach
Is the pollutant a key source?
Collect data on amounts of fertilizer
applied and average soil temperatures
Yes
Yes
Yes
No
No
No
Estimate emissions fromfertilizer sub-category using Tier 2 approach
Is this a key source?Estimate emissions
using Tier 1 approach
No
Yes
Figure 3-1 Decision tree for source category 4.D Crop production and agricultural soils
3.2 Tier 1 default approach
3.2.1 Algorithm
The Tier 1 approach for NH3 and NO emissions from crop production and agricultural soils uses the general equation
Epollutant = ARfertiliser_applied · EFpollutant (1)
where:

4.D Crop production and agricultural soils
EMEP/EEA emission inventory guidebook 2009 11
Epollutant = amount of pollutant emitted (kg a-1),
ARfertiliser_applied = amount of N applied (kg a-1),
EFpollutant = EF of pollutant (kg kg-1).
This equation is applied at the national level, using annual national total fertiliser nitrogen use.
The Tier 1 approach and for NMVOC and PM emissions from crop production and agricultural soils uses the general equation
Epollutant = ARarea · EFpollutant (2)
where:
Epollutant = amount of pollutant emitted (kg a-1),
ARarea = area covered by crop (ha),
EFpollutant = EF of pollutant (kg ha-1 a-1).
It is important to note that the PM emissions calculated here are intended to reflect the amounts found immediately adjacent to the field operations. A substantial proportion of this emission will normally be deposited within a short distance of the location at which it is generated.
3.2.2 Default emission factors
The Tier 1 default NH3 EF has been derived as a mean of default EFs for individual N fertilisers weighted according to their use in the EU-27 in 2006/7. More information on the key equations and assumptions behind these defaults can be found in Appendices A1–A4.
Table 3-1 Tier 1 emission factors for source category 4.D crop production and agricultural soils
CodeNFR Source Category 4DFuelNot estimated
Not applicable
Lower UpperNMVOC 5.95539E-09 kg kg-1 fertilizer-N
applied1.92E-10 8.51E-08 Steinbrecher et al (2008)
NH3 0.084 kg kg-1 fertilizer-N applied
0.06 0.10 Harrison & Webb (2001)
PM10 1.56 kg/ha 0.78 7.8 van der Hoek & Hinz (2007)
PM2.5 0.06 kg/ha 0.03 0.3 van der Hoek & Hinz (2007)
NO 0.026 kg kg-1 fertilizer-N applied
0.005 0.104 Steinbrecher et al (2008)
NOX, CO, SOX, Pb, Cd, Hg, As, Cr, Cu, Ni, Se, Zn, Aldrin, Chlordane, Chlordecone, Dieldrin, Endrin, Heptachlor, Heptabromo-biphenyl, Mirex, Toxaphene, HCH, DDT, PCB, PCDD/F, Benzo(a)pyrene, Benzo(b)fluoranthene, Benzo(k)fluoranthene, Indeno(1,2,3-cd)pyrene, Total 4 PAHs, HCB, PCP, SCCP
TSPPollutant Value Unit 95% confidence interval Reference
Tier 1 default emission factorsNameAgricultural Soils
NA
Note: * NH3 range of emission factors due to temperature range. Lower value refers to average spring soil temperatures below 6 ˚C, default 6–13 ˚C and upper above 13 ˚C.
The NO emission factor was calculated from data for Europe in Table 6 of Stehfest and Bouwman (2006), as the weighted average of the emission factors for cropland and grassland. See Appendix A3 for details of how the EF for NMVOCs was derived. The values for PM do not include emissions from fertiliser, pesticides or from grassland, e.g. hay making. These emissions

4.D Crop production and agricultural soils
EMEP/EEA emission inventory guidebook 2009 12
are mainly from combine harvesting and soil cultivation. In Appendix A4, further information is provided on estimates of PM emissions. In the absence of specific data with which to produce EFs following the application of sewage sludge, as a first approximation the EFs for animal manure application reported in Chapter 4.B, Animal husbandry and manure management, may be used. It is suggested that for liquid sludge the EF for pig slurry (0.40, Table 3–5) be used, while for solid sludge the EF for solid pig manure (0.81, Table 3–5) be used. Both EFs are expressed as proportion of total ammoniacal N (TAN) in the manures applied and reported in kg NH3-N.
3.2.3 Activity data
Information is required on the annual consumption national of total N-fertiliser. Annual fertiliser consumption data may be collected from official country statistics, often recorded as fertiliser sales and/or as domestic production and imports. If country-specific data are not available, data from the International Fertiliser Industry Association (IFIA, 2002) on total fertiliser use by type and by crop, or from the Food and Agriculture Organisation of the United Nations (FAO, http://faostat.fao.org/) on mineral fertiliser consumption, can be used. The amounts and types of sewage sludge applied to land will also need to be known. To calculate emissions of NO data is also needed on additions of N in manures and excreta. Methods to estimate emissions of NO following manure application and from excreta deposited during grazing are provided in Chapter 4.B, Animal husbandry and manure management.
3.3 Tier 2 technology-specific approach
3.3.1 Algorithm
3.3.1.1 Ammonia
Noting the interdependence of direct fertiliser emissions and subsequent emissions from foliage and decomposing residues from fertilised vegetation, the emissions are treated here as a single integrated term. These are estimated as proportional losses of the fertiliser-N use for each of the main fertiliser categories. Emissions from unfertilised crops are considered to be zero.
A simple calculation routine is provided to estimate an EF for each major type of fertiliser-N, according to the mean spring air temperature (ts; °C). Spring is defined as beginning when the accumulated day degrees above 0 °C since 1 January have reached 400 °C (Tsum = 400 °C) and ending three months later. The justification for this is well established, as crop emissions are known to be larger in warmer climates (Fenn and Hossner, 1985; He et al., 1999).
Step 1 is to partition the total area to which N fertiliser is applied into a number of climatic regions, according to mean spring air temperature. The temperature range within each region should not exceed 7 °C. For example, if the mean spring air temperature varies between 2 ° C and 15 °C, the total area could be partitioned into the following regions; ts ≤ 6 ° C, > 6 ° C, ≤ 13 ° C, > 13 ° C.
Step 2 is to use the model in Table 3–2 to estimate emissions from each type of N fertiliser in each of the regions. The emission from each fertiliser type for each region is calculated as the product of the mass of fertiliser of that type applied in the region and the EF for that fertiliser type in that region. Emissions of NH3 from fertilisers applied to grass cut for hay or silage may be calculated using the same factors as for arable and other crops. In addition, the effect of calcareous soils is included through use of a multiplier on the basis of values for different areas.

4.D Crop production and agricultural soils
EMEP/EEA emission inventory guidebook 2009 13
( )( )( )_ _ _ _ _1 1
1 1I J
fert NH3 fert i j i j alk j ii j
E m EF p c= =
= ⋅ ⋅ − ⋅ −∑∑ (3)
where:
Efert_NH3 = emission flux (kg a-1 NH3),
mfert_i_j = mass of fertiliser-N applied as type i in the jth region (kg a-1, N),
EFi_j = EF for fertiliser type i in region j (kg NH3 (kg N) -1),
palk_j = proportion of the ith region where soil pH>7.0,
ci = soil pH multiplier for fertiliser type i.
Step 3 is to calculate the ammonia emission from pasture grazed by livestock (Egraz_NH3; kg a-1 NH3):
Egraz_NH3 = Egraz · 17/14 (4)
where
Egraz (kg a-1, NH3-N) is calculated in Step 14 of the Tier 2 methodology of calculating ammonia emission from Chapter 4.B, Animal husbandry and manure management.
Step 4 is to calculate the total ammonia emission from soil (ENH3; kg a-1 NH3):
ENH3 = Efert_NH3 + Egraz_NH3 (5)
There is no Tier 2 approach for sewage sludge applications.
3.3.1.2 Nitric oxide
No Tier 2 methodology available; use Tier 1, but see Appendix A2 for discussion of proposed approaches.
3.3.1.3 NMVOCs
No Tier 2 methodology available; use Tier 1.
3.3.1.4 PM Emissions should be calculated by multiplying the cultivated area of each crop by an EF and by the number of times the emitting practice is carried out.
_
_ _1 0
i kNI
PM PM i k ii n
E EF A n= =
= ⋅ ⋅∑∑ (6)
where
EPM emission of PM10 or PM2.5 from the ith crop in kg a-1, I number of crops grown, Ai annual cropped area of the ith crop in ha, Ni_k number of times the kth operation is performed on the ith crop, in a-1, EFPM_i_k EF for the kth operation of the ith crop, in kg ha-1.
The default values of the EF are shown in Tables 3–3 to 3–6.

4.D Crop production and agricultural soils
EMEP/EEA emission inventory guidebook 2009 14
It is important to note that the PM emissions calculated here are intended to reflect the amounts found immediately adjacent to the field operations. A substantial proportion of this emission will normally be deposited within a short distance of the location at which it is generated.
3.3.2 Technology-specific emission factors
3.3.2.1 Ammonia
For ease of reference, the NH3 EF are summarized below in a single table.
Table 3-2 Emission factors for total NH3 emissions from soils due to N fertiliser volatilization and foliar emissions for various climatological regions with adjustments for emissions on soils of pH > 7.0. Values are kg NH3 volatilized per kg fertiliser-N applied and the mean spring temperature ts (in °C). Derived from van der Weerden and Jarvis (1997) and expert judgement
Fertiliser type EFi Multiplier c Ammonium sulphate = 0.0107 + 0.0006 ts 1)10 Ammonium nitrate = 0.0080 + 0.0001 ts 1 Calcium ammonium nitrate = 0.0080 + 0.0001 ts 1 Anhydrous ammonia = 0.0127 + 0.0012 ts 4 Urea = 0.1067 + 0.0035 ts 1 Nitrogen solutions = 0.0481 + 0.0025 ts 1 Ammonium phosphates = 0.0107 + 0.0006 ts 1)10 Other NK and NPK = 0.0080 + 0.0001 ts 1
Note 1) The multipliers are used when these fertilisers are applied to soils with pH > 7.0 (Harrison and Webb, 2001).
3.3.2.2 Nitric oxide
No method is currently available.
3.3.2.3 NMVOCs
No method is currently available.
3.3.2.4 PM
Dry climate conditions = mediterranean climate, wet climate conditions = all other climates
Table 3–3 Tier 2 EFs for agricultural crop operations, in kg ha-1 PM10, wet climate conditions Crop Soil cultivation Harvesting Cleaning Drying
K I 1 2 3 4 Wheat 1 0.25 0.49 0.19 0.56 Rye 2 0.25 0.37 0.16 0.37 Barley 3 0.25 0.41 0.16 0.43 Oat 4 0.25 0.62 0.25 0.66 Other arable 5 0.25 NA NA NA Grass 6 0.25 0.25 0 0
Note: grass includes hay making only.

4.D Crop production and agricultural soils
EMEP/EEA emission inventory guidebook 2009 15
Table 3–4 Tier 2 EFs for agricultural crop operations, in kg ha-1 PM10, dry climate conditions Crop Soil cultivation Harvesting Cleaning Drying
k I 1 2 3 4 Wheat 1 2.25 2.45 0.19 0 Rye 2 2.25 1.85 0.16 0 Barley 3 2.25 2.05 0.16 0 Oat 4 2.25 3.10 0.25 0 Other arable 5 2.25 NA NA NA Grass 6 2.25 1.25 0 0
Note: grass includes hay making only. Table 3–5 Tier 2 EFs for agricultural crop operations, in kg ha-1 PM2.5, wet climate
conditions
Crop Soil cultivation Harvesting Cleaning Drying k
I 1 2 3 4 Wheat 1 0.015 0.02 0.009 0.168 Rye 2 0.015 0.015 0.008 0.111 Barley 3 0.015 0.016 0.008 0.129 Oat 4 0.015 0.025 0.0125 0.198 Other arable 5 0.015 NA NA NA Grass 6 0.015 0.01 0 0
Note: grass includes hay making only. Table 3–6 Tier 2 EFs for agricultural crop operations, in kg ha-1 PM2.5 , dry climate
conditions
Crop Soil cultivation Harvesting Cleaning Drying k
I 1 2 3 4 Wheat 1 0.12 0.098 0.0095 0 Rye 2 0.12 0.074 0.008 0 Barley 3 0.12 0.082 0.008 0 Oat 4 0.12 0.125 0.0125 0 Other arable 5 0.12 NA NA NA Grass 6 0.12 0.05 0 0
Note: grass includes haymaking only. Source of default EFs - Van der Hoek and Hinz (2007).
3.3.3 Activity data
Information is required on the annual national consumption of the N-fertiliser types shown in Table 3–2. Annual fertiliser consumption data may be collected from official country statistics, often recorded as fertiliser sales and/or as domestic production and imports. If country-specific data are not available, data from the International Fertiliser Industry Association (IFIA, 2002) on total fertiliser use by type and by crop, or from the Food and Agriculture Organisation of the United Nations (FAO, http://faostat.fao.org/) on mineral fertiliser consumption, can be used. Fertiliser use also needs to be disaggregated by fertiliser type and climatic region for major crops. In addition, if ammonium sulphate or diammonium phosphate are significant sources, then

4.D Crop production and agricultural soils
EMEP/EEA emission inventory guidebook 2009 16
information will be needed on the amounts of those fertilisers applied to soils of < and > pH 7.0. It should be noted that most data sources (including FAO) might limit reporting to agricultural N uses, although applications may also occur on forest land, settlements, or other lands. This unaccounted N is likely to account for a small proportion of the overall emissions. However, it is recommended that countries seek out this additional information whenever possible.
Where spatially disaggregated inventories of fertilised culture emissions are required (see subsection 4.7 of the present chapter), information on the spatial distribution of different crop types and average N-fertiliser inputs to each crop type may be used. In the absence of data on the use of different fertilisers for crop types, the average N-fertiliser inputs to crops may be combined with the average NH3 EF for a country estimated: total NH3 emission/total N-fertiliser consumption.
3.4 Tier 3 emission modelling and use of facility data
3.4.1 Algorithm
Tier 3 methodologies are those that result in more accurate estimates of emissions than would be achieved using the Tier 2 methodology. This could include the use of alternative EFs, based on local measurement, the use of more detailed activity data and EFs or the use of process-based models. Users are encouraged to use Tier 3 methodologies wherever possible. If measures are taken to reduce emissions, such as those mentioned in subsection 2.4 above, it may be necessary to use a Tier 3 methodology to gain acceptance of the effect on emissions. For example, immediate incorporation of mineral fertiliser would reduce direct emissions, so the EF for the relevant type of fertiliser would require modification. In contrast, reducing fertiliser use by balancing fertiliser applications to crop requirements would not require a Tier 3 approach, since the effect would be adequately reflected by the change in the activity data.
For estimating NH3 emissions using Tier 3 methodology, process-based models are useful because in appropriate forms they can relate the soil and environmental variables responsible for NH3 emissions to the size of those emissions. These relationships may then be used to predict emissions from whole countries or regions for which experimental measurements are impracticable. Models should only be used after validation by representative experimental measurements.
An example of a simple process-based model for estimating NH3 emissions from fertiliser applications to agricultural land is provided by Misselbrook et al. (2004). This has been incorporated into the UK NARSES model and used for construction of the UK NH3 emission inventory. Important influencing variables which are included in this model are type of N fertiliser, soil pH, land use, application rate, rainfall and temperature. Each fertiliser type is associated with a maximum potential emission (EFmax), which is modified by functions relating to the other variables (soil pH, land use, etc.,) to give an EF for a given scenario:
EF = EFmax · RFsoilpH · RFlanduse · RFrate · RFrainfall · RFtemperature (7)
where
RF is the reduction factor, expressed as a proportion, associated with the variable.
Process-based modelling could also be used to estimate emissions from legumes and unfertilised pastures. A Tier 3 methodology for NH3 emission from legumes could include alternative, empirically-derived values of the N fixation rate or EF used in equation 3.

4.D Crop production and agricultural soils
EMEP/EEA emission inventory guidebook 2009 17
3.4.2 Activity data
Data will typically be required on type of N fertiliser applied, soil pH, land use, application rate, rainfall and temperature. Activity data for model input can be gathered from country-specific databases, trade associations (preferred) or, where these data are unavailable, can be found in different international databases: International Food Policy Research Institute (IFRI) and International Soil Reference and Information Centre (ISRIC) in Wageningen, Netherlands (www.isric.org); EUROSTAT (http://epp.eurostat.ec.europa.eu); CAPRI database (www.agp.uni-bonn.de/agpo/rsrch/capri/capri_e.htm).
4 Data quality
4.1 Completeness All nitrogenous fertilisers and all cropped land should be included. See Appendices A3.4.1 and A4.4.1 for NMVOC and PM.
4.2 Avoiding double counting with other sectors Caution is required to account for the possible double counting of fertiliser/foliar emissions from grazed grassland, noted in subsection 2.1.1. Where only the distribution of total grassland is available, estimates would need to be made of the fraction that is grazed, while account of the temporal overlap of grazing and soil emission should also be taken.
4.3 Verification There are no direct methods to evaluate total inventory estimates of NH3 emissions from croplands, and verification is dependent on laboratory and micrometeorological field studies of emissions from example situations. In particular, many studies have focused on laboratory measurements and there is a need to provide long-term field measurements using micrometeorological techniques to estimate NH3 fluxes over a range of crop types in different climates.
Emissions of NO, NMVOC and PM cannot be verified except by field studies of emissions from example situations.
4.4 Developing a consistent time series and recalculation Ideally, the same method is used throughout the entire time series. However, the detail and disaggregation of emissions estimates from this source category may improve over time. In cases where some historic data are missing, it may be necessary to derive the data using other references or data sets. Estimates of the proportions of N fertilisers applied to soils of pH > 7.0 may need to be derived based on expert judgment. Interannual changes in EF are not expected unless mitigation measures are undertaken. These factors should be changed only with the proper justification and documentation. If updated defaults for any of these variables become available through future research, inventory agencies must recalculate their historical emissions. It is important that the methods used reflect the results of action taken to reduce emissions and the methods and results are thoroughly documented. If policy measures are implemented such that activity data are affected directly (e.g., increased efficiency of fertiliser use resulting in a decrease in fertiliser consumption), the effect of the policy measures on emissions will be transparent, assuming the activity data is carefully documented. In cases where policy measures have an

4.D Crop production and agricultural soils
EMEP/EEA emission inventory guidebook 2009 18
indirect effect on activity data or EF (e.g., a change to the timing of fertiliser-N application), inventory input data should reflect these effects. The inventory text should thoroughly explain the effect of the policies on the input data.
4.5 Uncertainty assessment The main uncertainty lies in the generalization of EF, rather than the areas of crops under cultivation which is probably accurate in most countries to better than ± 10 %. Overall emissions are probably no better than ± 50 %.
The relative 95 %-confidence interval for the NO emission estimates may be regarded as from -80 % to +406 % as given by Stehfest and Bouwman (2006), thus overall uncertainty may be considered to be a factor of four. See also Appendix A2.4.5.
For NMVOCs, the uncertainty in the emission potential of plant species accounts for about half of the overall uncertainty of a factor of four for, e.g. an annual emission inventory of Great Britain (Stewart et al., 2003). See also Appendix A3.4.5.
No uncertainty can be given for the first estimates of PM, but will be probably in the range of one order of magnitude depending on the high variations of EFs and activity data.
4.5.1 Activity data uncertainties
Application of fertiliser-N may be estimated with an accuracy of ± 10 %; other factors such as returns of N in manures may be estimated to within ± 25 %. With respect to national data on crop areas, an uncertainty of < 5 % is assumed, with a normal distribution.
4.6 Inventory quality assurance/quality control QA/QC Guidance on the checks of the emission estimates that should be undertaken by the persons preparing the inventory are given in the General Guidance Chapter 6, Inventory management. Some issues of particular relevance are given here.
Review of emission factors
The inventory compiler should review the default EFs and document the rationale for selecting specific values. If using country-specific factors, the inventory compiler should compare them with the default EFs reported here. Also, if accessible, relate to country-specific EFs used by other countries with comparable circumstances. Differences among country-specific factors and default or other country factors should be explained and documented.
Review of any direct measurements
If using factors based on direct measurements, the inventory compiler should review the measurements to ensure that they are representative of the actual range of environmental and management conditions, and interannual climatic variability, and were developed according to recognised standards (IAEA, 1992). The QA/QC protocol in effect at the sites should also be reviewed and the resulting estimates compared between sites and with default-based estimates.
Activity data check
The inventory compiler should compare country-specific data on mineral fertiliser consumption with fertiliser usage data from the IFA and mineral fertiliser consumption estimates from the FAO. National crop production statistics should be compared with FAO crop production statistics.

4.D Crop production and agricultural soils
EMEP/EEA emission inventory guidebook 2009 19
4.7 Gridding Emissions due to N-fertiliser application may be spatially- as well as temporally-disaggregated using census data on the distribution of different crops and the application data statistics, together with mean fertiliser-N inputs to those crops, and climatic information as outlined in Appendices A1.4.7 and A2.4.7.
In the absence of specific data for NMVOC emissions from different agricultural crops, there appears to be little scope at present for spatially disaggregating NMVOC emissions. Emissions of NMVOCs are likely to differ according to crop type, crop growth stage, soil type, cultivation and weather conditions. Some temporal disaggregation may be possible, if seasonal variations in emissions by non-agricultural plants, can be assumed to be valid for fertilised crops.
Specific yield is one factor which may influence PM emissions during harvesting. More important are climatic conditions and soil composition in the particular cereal-growing regions. This is important because there are large regional differences in plant production depending on the properties of soil and climate and the requirements of the end user.
4.8 Reporting and documentation General guidance on reporting and documentation is given in the General Guidance Chapter 6, Inventory management.
The main supplementary documentation required for applying the estimates in this chapter are details of national N-fertiliser consumption. The approximate timing of soil cultivation, including crop residue incorporation, will also be useful. Where disaggregated estimates are to be made, details on N application rates to crops and spatially disaggregated crop distribution are needed.
The use of temperature and soil pH-dependent data presupposes knowledge and documentation of regional spring air temperatures and soil pH distribution.

4.D Crop production and agricultural soils
EMEP/EEA emission inventory guidebook 2009 20
5 References Aneja, V.P., Holbrook, B., Robarge, W.P. (1997). ‘Nitrogen Oxide Flux from an Agricultural Soil during winter fallow in the Upper Coastal Plain of North Carolina, USA’, Journal of the Air and Waste Management Association, 47, pp. 800–805.
Asman, W.A.H. (1992). Ammonia emission in Europe: updated emission and emission variations. RIVM report 228471008. RIVM, Bilthoven, Netherlands.
Aura, E. (1967). ‘Effect of the placement of fertiliser on the development of spring wheat’, Journal of the Scientific Agricultural Society of Finland, 39, pp. 148–155.
Bacon, P.E., Hoult, E.H., Lewin, L.G., McGarity, J.W. (1988). ‘Ammonia volatilization from drill sown rice bays’, Fertiliser research, 16, pp. 257–272.
Bouwman, A.F., Boumans, L.J.M., Batjes, N.H. (2002a). ‘Modelling global annual N2O and NO emissions from fertilised fields’, Global Biogeochemical Cycles, 16, pp. 1080.
Bouwman, A.F., Boumans, L.J.M., Batjes, N.H. (2002b). ‘Estimation of global NH3 volatilization loss from synthetic fertilisers and animal manure applied to arable lands and grasslands’, Global Biogeochemical Cycles, 16, pp. 1024.
Civerolo, K.L., Dickerson, R.R. (1998). ‘Nitric oxide emissions from tilled and untilled cornfields’, Agriculture Forest Meteorology, 90, pp. 307–311.
Denmead, O.T., Nulsen, R., Thurtell, G.W. (1978). ‘Ammonia exchange over a corn crop’, Soil Science Society of America Journal, 42, pp. 840–842.
ECETOC (1994). ‘Ammonia emissions to air in western Europe’. Technical report 62. European Centre for Ecotoxicology and Toxicology of Chemicals, Brussels. FAO http://faostat.fao.org/
FAO Production Yearbook, http://faostat.fao.org/. FAO Statistical Yearbooks 2005/2006. www.fao.org/economic/ess/publications-studies/statistical-yearbook/fao-statistical-yearbook-2005-2006/en/
Fenn, L.B., Hossner, L.R. (1985). ‘Ammonia volatilization from ammonium or ammonium-forming fertilisers’, Advances in Soil Science, 1, pp. 123–169.
Freibauer, A., Kaltschmitt, M., eds. (2000). ‘Emission Rates and Emission Factors of Greenhouse Gas Fluxes in Arable and Animal Agriculture’. Project report Task 1. EU Concerted Action ‘Biogenic Emissions of Greenhouse Gases Caused by Arable and Animal Agriculture’ (FAIR3-CT96-1877). Universität Stuttgart, Institut für Energiewirtschaft und Rationelle Energieanwendung, pp. 375.
Harrison, R., Webb, J. (2001). ‘A Review of the effect of N fertiliser form on gaseous N emissions’, Advances in Agronomy, 73, pp. 65–108.
He, Z.L., Alva, A.K., Calvert, D.V., Banks, D.J. (1999). ‘Ammonia volatilization from different fertiliser sources and effects of temperature and soil pH’, Soil Science, 164, pp. 750–758.
Hewitt, C.N., Street, R.A. (1992). ‘A qualitative assessment of the emission of non-methane hydrocarbons from the biosphere to the atmosphere in the U.K: Present knowledge and uncertainties’, Atmospheric Environment, 26A, pp. 3069–3077.

4.D Crop production and agricultural soils
EMEP/EEA emission inventory guidebook 2009 21
Humphreys, E., Freney, J.R., Muirhead, W.A., Denmead, O.T., Simpson, J.R., Leuning, R., Trevitt, A.C.F., Obcemea, W.N., Wetselaar, R., Cai G-X. (1988). ‘Loss of ammonia after application of urea at different times to dry-seeded irrigated rice’, Fertiliser Research, 16, pp. 47–58.
IAEA (1992). ‘Manual on measurement of methane and nitrous oxide emissions from agriculture’, IAEA-TECDOC-674, pp. 91.
IFIA — International Fertiliser Industry Association (2002). World fertiliser consumption statistics. International Fertiliser Industry Association Limited, Paris. www.fertiliser.org/ifa/statistics.asp and sources mentioned therein.
König, G., Brunda, M., Puxbaum, H., Hewitt, C. N., Duckham, S.C., Rudolph, J. (1995). ‘Relative contribution of oxygenated hydrocarbons to the total biogenic VOC emissions of selected mid-European agricultural and natural plant species’, Atmospheric Environment, 29, pp. 861–874.
Misselbrook, T.H., Sutton, M.A., Scholefield, D. (2004). ‘A simple process-based model for estimating ammonia emissions from agricultural land after fertiliser applications’, Soil Use and Management 20, pp. 365–372.
Nemitz, E., Sutton, M.A., Gut, A., San José, R., Husted, S., Schjørring, J.K. (2000). ‘Sources and sinks of ammonia within an oilseed rape canopy’, Agriculture and Forest Meteorology, 105, pp. 385–404.
Patel, S.K., Panda, D., Mohanty, S.K. (1989). ‘Relative ammonia loss from urea-based fertilisers applied to rice under different hydrological situations’, Fertiliser Research, 19, pp. 113–120.
Remde, A., Conrad, R. (1991). ‘Role of nitrification and denitrification for NO metabolism in soils’, Biogeochemistry, 12, pp. 189–205.
Schjørring, J.K., Mattsson, M. (2001). ‘Quantification of ammonia exchange between agricultural cropland and the atmosphere: Measurements over two complete growth cycles of oilseed rape, wheat, barley and pea’, Plant and Soil, 228, pp. 105–115.
Skiba, U., Ball, B. (2002). ‘The influence of tillage on NO and N2O fluxes under spring and winter barley’, Soil Use and Management,18, pp. 340–345.
Skiba, U., Fowler, D., Smith, K.A. (1997). ‘Nitric oxide emissions from agricultural soils in temperate and tropical climates: Sources, controls and mitigation options’, Nutrient Cycling in Agroecosystems, 48, pp. 75–90.
Stehfest, E., Bouwman, L. (2006). ‘N2O and NO emission from agricultural fields and soils under natural vegetation: summarizing available measurement data and modelling of global annual emissions’, Nutrient Cycling in Agroecosystems, 74, pp. 1385–1314.
Stewart, E.H., Hewitt, C.N., Bunce, R.G.H., Steinbrecher, R., Smiatek, G., Schoenemeyer, T., (2003). ‘A highly spatially and temporally resolved inventory for biogenic isoprene and monoterpene emissions — Model description and application to Great Britain’, Journal of Geophysical Research D108 (20), pp. 4644.
Steinbrecher, R., Smiatek, G., Köble, R., Seufert, G., Theloke, J., Hauff,K., Ciccioli, P., Vautard, R. (2008). ‘VOC emissions from Natural and Semi-Natural Vegetation for Europe and neighbouring countries in the East and South: Intra-/Inter-Annual Variability’, Atmospheric Environment (submitted).

4.D Crop production and agricultural soils
EMEP/EEA emission inventory guidebook 2009 22
Sutton, M.A., Pitairn, C.E.R., Fowler, D. (1993). ‘The exchange of ammonia between the atmosphere and plant communities’, Advances in Ecological Research, 24, pp. 301–393.
Sutton, M.A., Place, C.J., Eager, M., Fowler, D., Smith, R.I. (1995b). ‘Assessment of the magnitude of ammonia emissions in the United Kingdom’, Atmospheric Environment, 29, pp. 1393–1411.
van der Hoek, K., Hinz, T. (2007). ‘Particulate matter emissions from arable production-a guide for UNECE emission inventories’. In: Hinz, T., Tamoschat-Depolt, K. (Eds). Particulate Matter in and from Agriculture. Special Issue 308, pp. 15–19. Landbauforschung Völkenrode.
Venterea, R.T., Rolston, D.E.E., Cardon, Z.G. (2005). ‘Effects of soil moisture, physical, and chemical characteristics on abiotic nitric oxide production’, Nutrient Cycling in Agroecosystems, 72, pp. 27–40.
Vlek, P.L.G., Craswell, E.T. (1979). ‘Effect of Nitrogen Source and Management on Ammonia Volatilization Losses from Flooded Rice-Soil Systems’, Soil Science Society of America Journal, 43, pp. 352–358.
Watson, C.J., Poland, P., Allen, M.B.D. (1998). ‘The efficacy of repeated applications of the urease inhibitor N-(n-butyl) thiophosphoric triamide for improving the efficiency of urea fertiliser utilization on temperate grassland’, Grass and Forage Science 53, pp. 137–145.
Weerden van der, T.J., Jarvis, S.C. (1997). ‘Ammonia emission factors for N-fertilisers applied to two contrasting grassland soils’, Environmental Pollution, 95, pp. 205–211.
Whitehead, D.C., Lockyer, D.R. (1989). ‘Decomposing grass herbage as a source of ammonia in the atmosphere’, Atmospheric Environment, 23, pp. 1867–1869.
Williams, E.J., Guenther, A., Fehsenfeld, F.C. (1992). ‘An inventory of nitric oxide emissions from soils in the United States’, Journal of Geophysical Research, 97, pp. 7511–7519.
Yan, X., Akimoto, H., Ohara, T. (2003). ‘Estimation of nitrous oxide, nitric oxide and ammonia emissions from croplands in East, Southeast and South Asia’, Global Change Biology, 9, pp. 1080–1096.
5.1 Bibliography See in particular: Asman (1992), Bouwman (1996), ECETOC (1994), Holtan-Hartwig and Bøckman (1994), Intergovernmental Panel on Climate Change (IPPC)/ Organisation for Economic Co-operation and Development (OECD) (1995), Skiba et al. (1997), Sutton et al. (1995b), and Harrison and Webb (2001).
6 Point of enquiry Enquiries concerning this chapter should be directed to the relevant leader(s) of the Task Force on Emission Inventories and Projection’s expert panel on Agriculture and Nature. Please refer to the TFEIP website (tfeip-secretariat.org/) for the contact details of the current expert panel leaders.

4.D Crop production and agricultural soils
EMEP/EEA emission inventory guidebook 2009 23
Appendix A1 Ammonia
A1.2 Description of sources A1.2.1 Process description
Ammonia volatilization is a physic-chemical process which results from the equilibrium (described by Henry’s law) between gaseous phase NH3 and NH3 in solution (equation A1.1), NH3 in solution is in turn maintained by the equilibrium between ammonium (NH4
+) and NH3 (equation A1.2):
NH3 (aq) ↔ NH3 (g) (A1.1) NH4
+ (aq) ↔ NH3 (aq) + H+ (aq) (A1.2)
High pH (i.e. low [H+ (aq)]) favours the right-hand side of equation (A1.2), resulting in a greater concentration of NH3 in solution and also, therefore, in the gaseous phase. Thus, where the soil is buffered at pH values less than ca. 7, the dominant form of ammoniacal-N (NHx) will be NH4
+ and the potential for volatilization will be small. In contrast, where the soil is buffered at higher pH values, the dominant form of NHx will be NH3 and the potential for volatilization will be large, although other chemical equilibriums may serve to increase or decrease this.
While NH3 emissions tend to increase with soil pH, there is a strong interaction between the fertiliser and the soil solution which may (e.g. for urea) override the effects of initial soil pH through hydrolysis and precipitation reactions. Important in this regard is the effect of the soil cation exchange capacity (CEC); large soil CEC (more specifically, high NH4
+ retention) tends to reduce NH3 volatilization potential by reducing the concentration of NH4
+ in the soil solution by adsorption of NH4
+ on the exchange sites.
The ambient soil pH results in the establishment of bicarbonate-carbonate equilibrium with dissolved carbon dioxide (CO2):
CO2 (aq, g) ↔ H2CO3 (aq) ↔ HCO3- (aq) + H+ (aq) ↔ CO3
2- (aq) + 2H+ (aq) (A1.3)
In acid soils, this equilibrium lies to the left, so that the concentration of free carbonate (CO32-)
ions is negligible. However, in alkaline (calcareous) soils, the CaCO3 solubility equilibrium also becomes important:
Ca2+ (aq) + CO32- (aq) ↔ CaCO3 (s) (A1.4)
It is apparent that the addition of soluble Ca2+ will move this equilibrium (A1.4) to the right, reducing the concentration of CO3
2- in solution, thus generating additional H+ ions (i.e. reducing the pH) via equilibrium (A1.3). Further, the addition of any other ion which forms sparingly soluble salts with Ca2+ (e.g. sulphate) will act in the opposite manner by reducing [Ca2+] and hence increasing [CO3
2-] (A1.4). This will move equilibrium (A1.3) to the right and reduce [H+] (i.e. increase pH).
Meteorological conditions and time of application in relation to crop canopy development (Holtan-Hartwig and Bøckmann, 1994; Génermont, 1996) also have an influence. Emissions of NH3 increase with increasing temperature and wind speed. Emissions may be reduced if significant rainfall occurs during the main volatilization period, essentially in the 10 days after fertiliser application (Misselbrook et al., 2004).

4.D Crop production and agricultural soils
EMEP/EEA emission inventory guidebook 2009 24
The timescale over which the emission estimates are made is important to note. Fertiliser emissions are largest in the days after fertiliser application, but in some instances (e.g. urea applied in dry conditions resulting in a slow hydrolysis), fertiliser emission may proceed for over a month after application (Sutton et al., 1995a). For background emissions (other than initial fertiliser losses) during the plant growing period, most of the emission occurs indirectly from the foliage. The direct emissions of NH3 that have been measured from crops have been attributed to enrichment of the apoplast with NH4
+ following addition of fertiliser-N (Sutton et al., 1995a).
However, as well as being influenced by air concentration and environmental conditions, both emission and deposition occur on diurnal cycles.
Foliar emissions are expected to be larger from annual cereal crops than from fertilised agricultural grassland, since much of the emission may occur during the grain ripening and vegetation senescence phase (Schjørring, 1991). In contrast, where agricultural grassland, or other crops, are cut and left in the field for extended periods, decomposition may result in emissions of similar magnitude. Emissions from this source are extremely uncertain, and probably vary greatly from year to year depending on environmental conditions and success of harvests. The limited experimental work (Whitehead and Lockyer, 1989) found only emission from grass foliage with a large N content where much N-fertiliser had been applied, and was restricted to laboratory measurements which may overestimate emission. Measurements have also indicated significant NH3 emissions from decomposing brassica leaves, especially after cutting (Sutton et al., 2001; Husted et al., 2000).
A1.1.2 Additional justification of methodologies and emission factors
Ammonia
Direct emission following fertiliser-N application is the most understood source of NH3 emissions from crop production and agricultural soils. Emissions take place from the soil surface layer and decrease as the NH4
+ ions are absorbed onto soil colloids or nitrified. Hence, fertiliser-N that is immediately incorporated into the soil will not be a source of NH3.
The main factors controlling NH3 volatilization are the type of N-fertiliser applied, the rate of hydrolysis for urea fertiliser, and changes in soil pH following application for all fertilisers (Whitehead and Raistrick, 1993; ECETOC, 1994; Harrison and Webb, 2001). When N is applied to soils in the form of urea it is rapidly hydrolyzed by the extracellular enzyme urease (which is ubiquitous in soils) to ammonium carbonate ((NH4)2CO3) and the NH4
+ ions provide the main source of NH3. In addition, hydrolysis of urea releases CO2, which increases pH and favours NH3 volatilization (equation A1.2). While NH3 losses from AS and di-ammonium phosphate (DAP) have been found to increase markedly with increasing pH (e.g. Whitehead and Raistrick, 1993), NH3 loss from urea is less dependent on initial soil pH, due to the pH increase immediately around the fertiliser granule to ca. 9.2 from urea hydrolysis (Fenn, 1988). Moreover reaction with calcium ions reduces the volatilization potential of (NH4)2CO3 produced by urea hydrolysis (Fenn and Hossner, 1985). In contrast to other N-fertilisers, NH3 loss from urea did not increase consistently with pH, and was not greater on a calcareous soil (Whitehead and Raistrick, 1993). This was considered due to differences in cation exchange capacity (CEC). Whitehead and Raistrick (1993) also found losses of NH3 from cattle urine were no greater on calcareous than on non-calcareous soils. The best correlation with NH3 loss was with CEC. Gezgin and Bayrakli (1995) measured NH3 losses from urea, AS and AN on calcareous soils in Turkey. Losses from AS (ca. 16 %) and AN (ca. 5 %) were greater than those measured on non-calcareous soils by Sommer and Jensen (1994), which were < 5 % and < 2 % respectively. However losses from urea at ca. 8 % were less

4.D Crop production and agricultural soils
EMEP/EEA emission inventory guidebook 2009 25
than those measured by Sommer and Jensen (1994). Nevertheless a greater EF for urea in Group 1 countries is justified by the greater temperatures. Application to calcareous soils will, however, increase NH3 losses from AS (Fleisher et al., 1987). Other fertilisers, such as AN, are more neutral in pH and produce much smaller emissions. These are often difficult to distinguish in measurements from plant-atmosphere fluxes.
Recent results from Japan (Hayashi et al., 2006) suggest large losses usually reported from paddy fields may be a consequence of high temperatures and not directly applicable to production in more temperate regions. Furthermore, an application rate also affects an EF for urea; 21 % with a rate of 30 kg N ha-1 at panicle formation and reduced to 0.5 % with a rate of 10 kg N ha-1 at heading, in which the rice plants effect on net exchange was included (Hayashi et al., 2008). In consideration of the reduced emissions from application at panicle initiation and the practice of applying much of the fertiliser-N at that stage, an EF of 22 % for urea was recently proposed by Yan et al. (2003). The same EF was used for AS.
Measured data on NH3 fluxes over legume crops are sparse. Dabney and Bouldin (1985) measured significant diurnal variation in emissions from a growing alfalfa crop with an average daily emission equivalent to 1.2 kg ha-1. a-1 NH3-N, but an annual nightly deposition of 1.6 kg ha-1. a-1 NH3-N. However, losses during the three 10-day periods following the three cuts of hay averaged 3.8 g ha-1. h-1 for 24-h-day-1, or ca. 2.3 kg ha-1. a-1 NH3-N from an alfalfa crop. Harper et al. (1989) reported fluxes ranging from -0.4 (deposition) to 0.4 g ha-1. h-1, with net depositions of 0.4–3.1 kg ha-1. a-1 to soybeans. Lemon and van Houtte (1980) measured both emissions of 3 g ha-
1. h-1 NH3 from soybeans and 0.36 mg ha-1. h-1 NH3 from the top leaves of the alfalfa, and deposition fluxes over soybeans, the balance depending upon the ambient concentration at the top of the canopy. These data indicate that, while the impact of such emissions on annual net emissions might be small, they may have a substantial impact on temporal variability at both the seasonal and diurnal scales.

4.D Crop production and agricultural soils
EMEP/EEA emission inventory guidebook 2009 26
Appendix A2 Nitric oxide
A2.1 Overview
Soils and crops are considered to be a net sink for most NOx (NO + NO2) compounds. However, NO may be released from soils during nitrification and denitrification following N application and mineralization of incorporated crop residues and soil organic matter. Estimates of NO emissions are very uncertain, but soils may contribute c. 4–8 % of total European emissions. On a hot summer day this fraction may increase to values > 27 % (Stohl et al., 1996, Butterbach-Bahl et al., 2001). At the global scale recent estimates consider that NOx emission from soils could represent more than 40 % of NOx emission (Davidson and Kingerlee, 1997; Penner et al., 1993) and up to 65 % for the USA (Hall et al., 1996).
A2.2 Description of sources A2.2.1 Process description
In plant production and agricultural soils, where pH is likely to be maintained above 5.0, nitrification is considered to be the dominant pathway of NO emission. Nitric oxide is also a substrate and product of denitrification, but it is only very rarely emitted as a consequence of denitrification in European soils. See Ludwig et al (2001) for further details.
A2.2.2 Emissions
Data on NO emissions in relation to fertiliser-N use were reviewed by Yienger and Levy (1995) and were updated by Skiba et al. (1997). Yienger and Levy (1995) calculated an arithmetic mean emission of 2.5 % loss of fertiliser-N. Based on almost the same dataset Skiba et al. (1997) showed that NO losses ranged from 0.003 to 11 % of applied fertiliser-N with a geometric mean emission of 0.3 %. More recently Bouwman et al. (2002) used the Residual Maximum Likelihood (REML) technique to calculate from 99 studies of NO emissions a global mean fertiliser induced NO emission of 0.7 %. Earlier, an EF of 1.0 % of applied N was suggested by Freibauer and Kaltschmitt (2000).
A2.2.3 Controls
In temperate climates, NO emissions are considered to be predominantly a consequence of nitrification. Hence, substitution of AN for urea to reduce NH3 emissions, may also give some reduction in NO emissions, the results from Slemr and Seiler (1984) are consistent with this hypothesis. Nevertheless, these conclusions can only be tentative as there are insufficient data to discriminate between fertiliser-N sources (Skiba et al., 1997). Chu et al. (2006) reported that the use of controlled-release urea fertiliser could reduce emissions of NO.
A2.3 Methods A2.3.1 Tier 2 Technology Specific Approach
A more detailed methodology, based on the soil temperature and the land use type has been developed by Williams et al. (1992) and is summarised here.
ENO =α · eζ · ts (A2.1)
where:

4.D Crop production and agricultural soils
EMEP/EEA emission inventory guidebook 2009 27
ENO = emission flux (ng m-2 s-1 NO-N),
α = experimentally derived constant for the land use types of grasslands and pasture, forests and urban trees, and the individual agricultural categories (ng m-2 s-1 NO-N),
ζ = factor (ζ = 0.071 K-1),
ts = soil temperature (°C).
To improve this approach, N input and soil moisture contents (Meixner, 1994) need to be included in the equation. Furthermore, also the soil pH is crucial determinant, since NO can be produced at soil-pH < 4.0 also by chemo-denitrification. A multiple regression approach was developed by Sozanska (1999, see Skiba et al., 2001). Soil NO emissions were calculated from the N input and the water filled pore space of the soil
ln ENO = -0.82 + 0.354 ln Ninput + 0.0036 (-WFPS2 + 80 WFPS – 1593) (A2.1)
where
ENO = emission flux (kg ha-1. a-1 N),
Ninput = input of N to soil by fertiliser, animal excreta, N deposition (kg ha-1. a-1 N),
WFPS = water filled pore space (%).
The Williams approach produces much greater estimates of NO emission than are given by the simpler methodology, whereas Sozanska’s multiple regression model produces much smaller estimates than the simple methodology. The authors conclude that due to the lack of data it is not appropriate to use either methodology at this stage.
Based on a statistical analysis of a wide range of published experimental data, Stehfest and Bouwman (2006) produced the following model for the emission of NO (ENO):
ln(ENO) = const + cclimate + csoilN +cNrate (A2.2)
Where cclimate, csoilN and cNrate are constants describing the effect of climate, soil N and the rate of N fertiliser application respectively. The ‘const’ term relates to the empirical constant found in the analysis, plus the effect of the length of the trials from which the data were collated. This model seems suitable for use as a Tier 2 methodology but further consideration of the availability of activity data.
An improvement of estimates of NO emissions from soils may be achieved by use of detailed mechanistic models, which allow simultaneous calculations of production, consumption and emission of NO from soils with regard to all processes involved.
A2.4 Data quality A2.4.5 Uncertainty assessment
Less information is available on factors determining losses of NO from soils (N input, soil temperature and soil moisture, soil texture, soil carbon). Long-term intensive field experiments are not currently sufficient to provide a good degree of certainty in the estimate. Data available suggest that the EF for NO is broadly similar to the EF for N2O (Bouwman et al., 2002; Stehfest and Bouwman, 2006).

4.D Crop production and agricultural soils
EMEP/EEA emission inventory guidebook 2009 28
A2.4.7 Gridding and temporal disaggregation
Losses of NO take place mainly as a consequence of nitrification and in acid soils as a consequence of chemo-denitrification. Peaks in NO emission are therefore likely following application of NH4
+-based N-fertilisers, incorporation of crop residues and tillage of soils. Data on all these should be available, for some countries at least. At present, however there are insufficient data on NO emissions to quantify these effects. Ultimately, as the mechanisms of NO production become better understood, climatic data may also be utilised to assess when soil and weather conditions are favourable for nitrification, and hence NO production (Butterbach-Bahl et al., 2004). In common with NH3, NO emissions may vary greatly in space and time from year to year, depending upon weather conditions, and fertiliser input.

4.D Crop production and agricultural soils
EMEP/EEA emission inventory guidebook 2009 29
Appendix A3 NMVOCs
A3.2 Description of sources A3.2.1 Emissions
Hewitt and Street (1992) concluded that trees are the main emitters of non-methane hydrocarbons (NMHCs). Other plants, including crops, were insignificant sources in comparison. However, although NMVOC emissions from plant production and agricultural soils are smaller than from woodlands, they may not be entirely negligible (Simpson et al., 1999). König et al., (1995) noted that in earlier studies NMHCs had been regarded as the major component of VOC emissions. However, König et al. (1995) found oxygenated VOCs to be the major VOC emissions from cereals. In that study emissions were not invariably greater from trees than from agricultural crops.
The emission of some NMVOCs may be of benefit to plants, e.g. to attract pollinating insects, while others may be waste products or a means of losing surplus energy (Hewitt and Street, 1992). Ethene emission has been observed to increase when plants are under stress.
As with forest NMVOC emissions, biogenic emissions from grasslands consist of a wide variety of species, including isoprene, monoterpenes, (α-pinene, limonene, etc.), and ‘other’ VOC. The ‘other’ VOC (OVOC) species consist of a large number of oxygenated compounds (alcohols, aldehydes, etc.), and have proven difficult to quantify in atmospheric samples. Progress in quantification of OVOC from European vegetation has been made (König et al., 1995), although many more measurement data will be required before reliable attempts to inventory specific OVOC can be made.
Factors that can influence the emission of NMVOCs include temperature and light intensity, plant growth stage, water stress, air pollution and senescence (Hewitt and Street, 1992).
Justification of methodologies and emission factors
The sparse information on NMVOC emissions does not allow for the construction of a Tier 2 methodology. However, Dämmgen et al. (2008) have compiled the data presently available. They can be used to provide information of the order of magnitude of NMVOC emissions from agriculture as a Tier 1 methodology. The EFs include partial EFs for isoprene, terpenes, alcohols, aldehydes, ketones, ethers and other organic compounds and their contribution to overall emissions.
The use of the following equation and data is recommended for Northern and Central Europe:
ENMVOC_crop = ∑Ai · mD_i · ti · EFi · β (A3.1)
where ENMVOC_crop NMVOC emission flux from cropped areas (kg a-1 NMVOC),
Ai area covered by cropi (ha a-1), mD_i mean dry matter of cropi (kg ha-1. a-1), ti fraction of year during which cropi is emitting (in a a-1), EFi emission factor for crop i (kg kg-1 NMVOC), β mass units conversion (β = kg kg-1). with
EFNMVOC-C_ i_k = EFNMVOC_ i_k / fNMVOC_k (A3.2)

4.D Crop production and agricultural soils
EMEP/EEA emission inventory guidebook 2009 30
where
EFNMVOC_ i_k NMVOC-C emission factor for crop i and aggregated species k (in kg kg-1 NMVOC-C),
conversion factor NMVOC-C to NMVOC for aggregated species k (in kg kg-1).
For further information consult Dämmgen et al. (2007) and the literature cited therein.
Table A3-1 NMVOC EFs EFNMVOC-C, i for agricultural crops, in kg kg-1 NMVOC, and fraction of year, during which crops emit, in a a-1
Crop Isoprene terpenes alcohols aldehydes ketones ethers and others
Fraction of year emitting
Cereals 8.0 · 10-10 2.8 · 10-9 2.2 · 10-9 5.1 · 10-9 0.3 Oilseed rape
7.5 · 10-8 5.2 · 10-8 1.1 · 10-9 6.4 · 10-8 0.3
Grass 2 · 10-10 6.4 · 10-8 7.5 · 10-10 1.3 · 10-9 1.8 · 10-9 0.5
NMVOC-C EF can be converted to NMVOC EF once the speciation is known. In Table A3–2, alcohols, aldehydes and ketones as well as ethers and others have to be disaggregated. For alcohols, aldehydes and ketones we made use of the default NMVOC split provided in Steinbrecher et al. (2008) for oxy-VOCs. In Helmig et al. (1999), one compound was identified for ‘ethers and others’ that was analyzed for a grass species (cis-3-hexenyl acetate). It occurs in roughly the same concentration ratio terpenes to ester as given by König et al. (1995). The derivation of the conversion factors can be traced in Table A3–2.
The conversion factor fNMVOC, k for aggregated species is calculated from the percentage abundance aj of a species j within a group of species (alcohols, aldehydes, etc.) and the ratio of the molecular mass Mj and the carbon content of the single species XC, j.
fNMVOC_k = (1/100) · Σaj · Mj/XC_j (A3.3)
Table A3-2 Conversion of NMVOC-C EFs to NMVOC EFs Group of compounds
Constituents Relative abundance
aj
Composition Molecular mass Mj
Individual mass conversion factor
Mj/XC_j
Aggregated mass
conversion factor
fNMVOC_k g mol-1 kg kg-1 kg kg-1 isoprene C5H8 68.13 1.1355 1.1355 terpenes C10H16 136.24 1.1353 1.1353 alcohols methanol 84.51 CH4O 32.04 2.6700 2.5537 ethanol 15.49 C2H6O 46.07 1.9196 aldehydes formaldehyde 47.83 CH2O 30.03 2.5025 2.1545 acetaldehyd 52.17 C2H4O 44.05 1.8354 ketones acetone C3H6O 58.08 1.6133 1.6133 ethers and others
cis-3-hexenyl acetate
C8H14O2 142.2 1.4813 1.4813
The values used for calculating the Tier 1 emission factors are those used by Dämmgen et al. (2008).
4.D Crop production and agricultural soils
EMEP/EEA emission inventory guidebook 2009 31
A3.4 Data quality
A3.4.1 Completeness
The small number of measurements of NMVOC emissions from agricultural vegetation is a considerable weakness. It is unknown whether emissions are related to fertiliser-N inputs.
A3.4.5 Uncertainty Assessment
A3.4.5.1 Emission factor uncertainties
Biogenic VOC emissions for the UK were summarized by Hewitt and Street (1992). These ranged from 38–211 Gg a-1 total NMVOCs. Emissions from woodlands were estimated to be 72 % of total biogenic emissions by Anastasi et al. (1991). Thus between ca. 10 and 59 Gg a-1 appear to be of agricultural origin. In their incomplete analysis Hobbs et al. (2004) calculated ca. 5 t a-1 from agricultural crops. This compares with the Corinair 94 estimate of only 2 Gg a-1 for SNAP Code 1001, Cultures with fertilisers, NFR 4.D.1, or < 2 % of emission from agriculture and forestry. Thus the range of emissions may be uncertain by a factor of 30. However, the estimate for agriculture by Anastasi et al. (1991) was recognised as likely to be too large.
A3.4.5.2 Activity data uncertainties
Hewitt and Street (1992) concluded that only ca. 700 plant species, mainly from North America, had been investigated as isoprene or monoterpene emitters. Few of these were agricultural crops, and quantitative data was available for only a few species. Many measurements had been made at temperatures higher than those prevailing in North and West Europe.
With respect to national data on crop areas, an uncertainty of < 5 % is assumed, with a normal distribution.

4.D Crop production and agricultural soils
EMEP/EEA emission inventory guidebook 2009 32
Appendix A4 Particulate matter
A4.1 Overview Definitions of PM10, PM2.5 and TSP
There are different definitions for particle fractions, but all of them define penetration curves by particle size fractions into the lungs. The US Environmental Protection Agency (USEPA) defined PM10 and PM2.5 for environmental purposes, while ISO gives health related definitions.
Figure A4–1 shows these different curves. Differences are obvious for PM10 and the thoracic fraction which corresponds with it by the same cut off at 10 µm. PM10 do not consider particles larger than 15 µm while thoracic reaches up to 40 µm.
Figure A1–1 Sampling criteria for inhalable, thoracic and respirable particles expressed as percentage of TSP.
Curves describe virtual particle separators simulating the corresponding parts of the breathing tract. They are characterized by their shape and by the 50 % value of separation and penetration the so-called cut off diameter. Samplers with the same cut off diameters but different shaped penetration curves will collect different fractions of PM. This must be considered for PM10 and thoracic fraction if the emissions include a high portion of particles with size between 15 µm and 40 µm. Practical measuring equipment will often follow the ISO definition.
Definitions for PM2.5 and the respirable fraction (risk group) are consistent.
TSP means total suspended particles and it is mainly used in ambient air for sizes below 57 µm.
For emission site, TSP means more or less total dust considering all sizes up to the largest particles which size depends on the origin of the dust.
Dust particles should be limited to sizes not larger than 500 µm (aerodynamic diameter).

4.D Crop production and agricultural soils
EMEP/EEA emission inventory guidebook 2009 33
A4.2 Description of sources Emissions of PM vary according to the following:
• type of crop;
• the physical properties of the particles;
• origin of the particles: soil, plant, machinery;
• meteorological conditions of soil and/or produce before and during the operation (wind speed, temperature, rain fall, humidity);
• type of operation;
• parameters of the machinery (working speed, working capacity, working surface).
A4.3 Methods A4.3.1 Tier 1 default approach
The EFs for PM10 and PM2.5 can be determined directly by measurements using pre-separators which realize the aerodynamic definitions by the flow properties. These measurements can be used directly for comparison or balancing. Another way is to calculate the pEFs from the total size distribution of the total dust emissions. For this it is necessary to know the sizing system which may influence the result. A third way which has been done in the past is to calculate PMx as share of TSP. To get comparable results the definition and measuring procedure for TSP must be known. Takai et al. (1998) introduced a sampler for the inhalable part of dust to be total dust (TSP). These samplers have a cut diameter (50 % separation) at 100 µm.
A literature review reported different ways to create EFs for arable farming.
Direct measurements of the primary PM emissions from the use of cultivation implements. From these, machinery-related estimates of the potential strength of a source and field-related EF may be calculated.
Indirect estimation of source strength using concentration measurements carried out using machinery placed in the driver's cab and layer- or plume-based models of the treated area to establish a relationship with a balance volume or a volume flow rate concerned.
Measurements of PM concentrations at the border of a field fitted to an inverse computing model of dispersion.
The following PM10 EFs were reported:
Combine harvesting:
• 4.1–6.9 kg ha-1, parameter cereal, cereals humidity during harvesting (Batel, 1976);
• 3.3–5.8 kg ha-1 (WRAP, 2006).
Due to the settling effect of coarse particles, it was assumed that only a part of the primary emitted PM10 leaves the field to comprise the field EF. Two situations have been considered: one with 50 % of the original PM10 emissions leaving the field and one with 10 % leaving the field.
Soil cultivation:
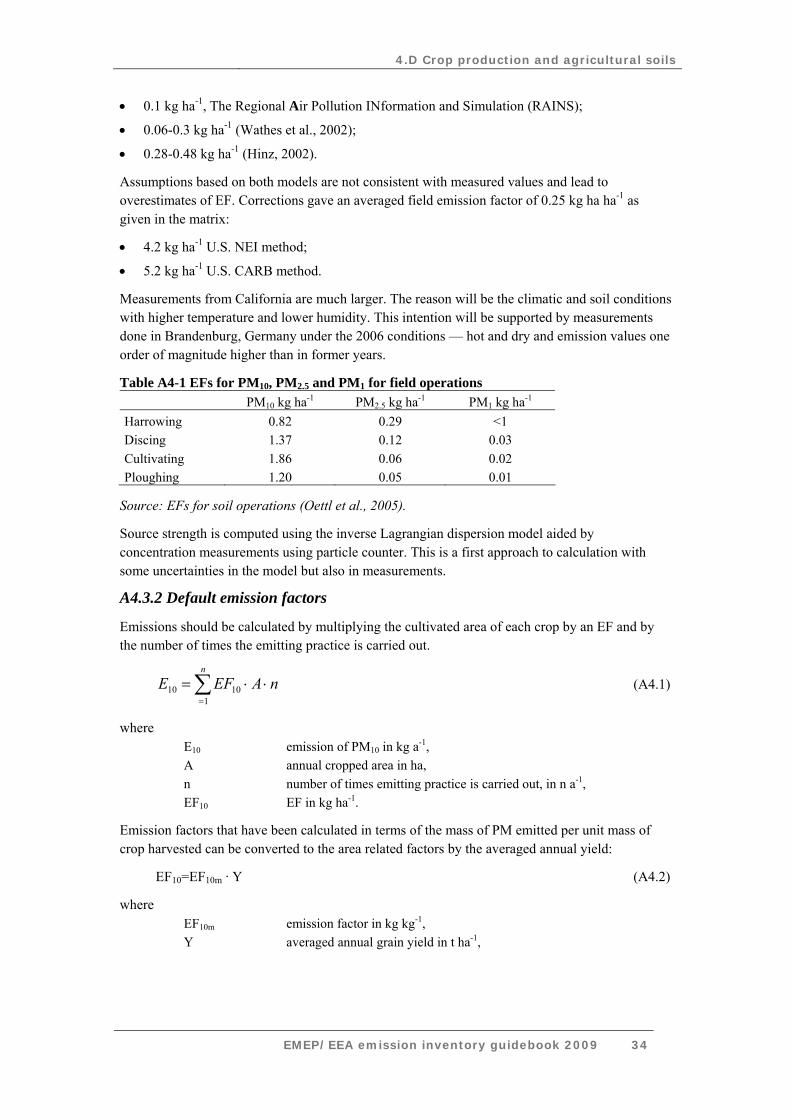
4.D Crop production and agricultural soils
EMEP/EEA emission inventory guidebook 2009 34
• 0.1 kg ha-1, The Regional Air Pollution INformation and Simulation (RAINS);
• 0.06-0.3 kg ha-1 (Wathes et al., 2002);
• 0.28-0.48 kg ha-1 (Hinz, 2002).
Assumptions based on both models are not consistent with measured values and lead to overestimates of EF. Corrections gave an averaged field emission factor of 0.25 kg ha ha-1 as given in the matrix:
• 4.2 kg ha-1 U.S. NEI method;
• 5.2 kg ha-1 U.S. CARB method.
Measurements from California are much larger. The reason will be the climatic and soil conditions with higher temperature and lower humidity. This intention will be supported by measurements done in Brandenburg, Germany under the 2006 conditions — hot and dry and emission values one order of magnitude higher than in former years.
Table A4-1 EFs for PM10, PM2.5 and PM1 for field operations PM10 kg ha-1 PM2.5 kg ha-1 PM1 kg ha-1 Harrowing 0.82 0.29 <1 Discing 1.37 0.12 0.03 Cultivating 1.86 0.06 0.02 Ploughing 1.20 0.05 0.01
Source: EFs for soil operations (Oettl et al., 2005).
Source strength is computed using the inverse Lagrangian dispersion model aided by concentration measurements using particle counter. This is a first approach to calculation with some uncertainties in the model but also in measurements.
A4.3.2 Default emission factors
Emissions should be calculated by multiplying the cultivated area of each crop by an EF and by the number of times the emitting practice is carried out.
nAEFEn
⋅⋅= ∑=1
1010 (A4.1)
where E10 emission of PM10 in kg a-1, A annual cropped area in ha, n number of times emitting practice is carried out, in n a-1, EF10 EF in kg ha-1.
Emission factors that have been calculated in terms of the mass of PM emitted per unit mass of crop harvested can be converted to the area related factors by the averaged annual yield:
EF10=EF10m · Y (A4.2)
where EF10m emission factor in kg kg-1, Y averaged annual grain yield in t ha-1,

4.D Crop production and agricultural soils
EMEP/EEA emission inventory guidebook 2009 35
Table A4-2 PM emission factors EFPM for agricultural crop operations, in kg ha-1 PM. (van der Hoek and Hinz, 2007)
Crop Soil cultivation Harvesting Cleaning Drying Wheat 0.25 4.9 0.19 0.56 Rye 0.25 3.7 0.16 0.37 Barley 0.25 4.1 0.16 0.43 Oat 0.25 6.2 0.25 0.66
The measured values are of emissions from the immediate surroundings of the tractors and harvesting machinery in the field.
Further information about PM emissions can be found in Hinz and Funk (2007) and Hinz and Tamoschat-Depolt (2007).
A4.4 Data quality A4.4.1 Completeness
The small number of measurements of PM emissions from agricultural activities is a considerable weakness.

4.D Crop production and agricultural soils
EMEP/EEA emission inventory guidebook 2009 36
Appendix A5 Summary of updates Table A5-1 Summary of updates to calculation methodologies and EFs made during the
2009 revision of this chapter Emission Tier 1 Tier 2 Methodology EFs Methodology EFs NH3 Updated Updated Updated Updated NO Not updated Updated NA NA NMVOC Updated Updated NA NA PM Updated Updated Updated Updated
NA, not applicable

4.D Crop production and agricultural soils
EMEP/EEA emission inventory guidebook 2009 37
Appendix references Anastasi, C., Hopkinson, L., Simpson, V.J. (1991). ‘Natural Hydrocarbon emissions in the United Kingdom’, Atmospheric Environment, 25A, pp. 1403–1408.
Batel, W. (1976). ‘Staubemission, Staubimmission und Staubbekämpfung beim Mähdrescher. Grundl.’, Landtechnik Bd, 26, pp. 205– 248.
Butterbach-Bahl, K., Kesik, M., Miehle, P., Papen, H., Li, C. (2004). ‚Quantifying the regional source strength of N-trace gases across agricultural and forest ecosystems with process based models’, Plant and Soil, 260, pp. 311–329.
Butterbach-Bahl, K., Stange, F., Papen, H., Li C. (2001). ‘Regional inventory of nitric oxide and nitrous oxide emissions for forest soils of Southeast Germany using the biogeochemical model PnET-N-DNDC’, Journal of Geophysical Research, 106, pp. 34155–34166.
Chu, H., Hosen, Y., Yagi, K. (2007). ‘NO, N2O, CH4 and CO2 fluxes in winter barley field of Japanese Andisol as affected by N fertiliser management’, Soil Biology and Biochemistry 39, pp. 330–339.
Dabney, S.M., Bouldin, D.R. (1985). ‘Fluxes of ammonia over an alfalfa field’, Agronomy Journal, 77, pp. 572–578.
Dämmgen U, Haenel H-D, Rösemann C, Conrad J, Lüttich M, Döhler H, Eurich-Menden B, Laubach P, Osterburg B (2008). Calculations of Emissions from German Agriculture — National Emission Inventory Report (NIR) 2009 for 2007. Methods and Data (GAS-EM). In preparation.
Davidson, E.A., Kingerlee, W. (1997) ‘A global inventory of nitric oxide emissions from soils’, Nutrient Cycling in Agroecosystems, 48, pp. 37–50.
EMEP/CORINAIR (1999). Atmospheric Emission Inventory Guidebook, second edition (Richardson, S., ed.). European Environment Agency, Copenhagen.
Fenn, L.B. (1988). ‘Effects of initial soil calcium content on ammonia losses from surface-applied urea and calcium-urea’, Fertiliser Research, 16, pp. 207–216.
Fleisher, Z., Kenig, A., Ravina, I. and Hagin, J. (1987). ‘Model of ammonia volatilization from calcareous soils’, Plant and Soil, 103, pp. 205–212.
Génermont, S. (1996). Modélisation de la volatilisation d'ammoniac après épandage de lisier sur parcelle agricole. Thèse de Doctorat Thesis, Université Paul Sabatier, Toulouse, 331 pp.
Gezgin, S., Bayrakli, F. (1995). ‘Ammonia volatilization from ammonium sulphate, ammonium nitrate, and urea surface applied to winter wheat on a calcareous soil’, Journal of Plant Nutrition, 18, pp. 2483–2494.
Hall, S.J., Matson, P.A., Roth, P.M. (1996). ‘NOx Emissions From Soil: Implications for Air Quality Modelling in Agricultural Regions’, Annual Review of Energy and the Environment, 21, pp. 311–346.
Harper, L.A., Giddens, J.E., Langdale, G.W., Sharpe, R.R. (1989). ‘Environmental effects on nitrogen dynamics in soybean under conservation and clean tillage systems’, Agronomy Journal, 81, pp. 623–631.

4.D Crop production and agricultural soils
EMEP/EEA emission inventory guidebook 2009 38
Hayashi, K., Nishimura, S., Yagi, K. (2006). ‘Ammonia volatilization from the surface of a Japanese paddy field during rice cultivation’, Soil Science and Plant Nutrition, 52, pp. 545–555.
Hayashi, K., Nishimura, S., Yagi, K. (2008). ‘Ammonia volatilization from a paddy field following applications of urea: Rice plants are both an absorber and an emitter for atmospheric ammonia’, Science of the Total Environment, 390, pp. 486–495.
Helmig, D., Klinger, L.F., Guenther, A., Vierling, L., Geron, C., Zimmerman, P. (1999). ‘Biogenic volatile organic compound emission (BVOCs). I. Identifications from three continental sites in the U.S.’, Chemosphere 38, pp. 2163–2178.
Hinz, T. (2002). ‘Particulate Matter in and from Agriculture’, Special Issue 235. Landbauforschung Völkenrode
Hinz, T., Funk, R. (2007). ‘Particle emissions of soils induced by agricultural field operations’. DustConf 2007, International Conference Maastricht, 23–24 April 2007, www.dustconf.org.
Hinz, T., Tamoschat-Depolt, K. (Eds) (2007). ‘Particulate Matter in and from Agriculture’. Special Issue 308. Landbauforschung Völkenrode.
Hobbs, P.J., King, L., Webb, J., Mottram, T.T., Grant, B., Misselbrook, T.M. (2004). ‘Significant projections of non-methane volatile organic compounds originating from UK agriculture’, Journal of the Science of Food and Agriculture 84, pp. 1414–1420.
Holtan-Hartwig L. and Bøckman O. C. (1994). ‘Ammonia exchange between crops and air’, Norwegian Journal of Agricultural Science, Supplement No 14, pp. 41.
Husted, S., Schjørring, J.K., Nielsen, K.H., Nemitz, E. and Sutton, M.A. (2000). ‘Stomatal compensation points for ammonia in oilseed rape plants under field conditions’, Agriculture and Forest Meteorology (Special issue on ammonia fluxes with oilseed rape), 105, pp. 371–383.
IPCC 2006. Chapter 11, N2O Emissions from Managed Soils, and CO2 Emissions from Lime and Urea Application of the IPCC Guidelines.
Lemon, E. and Van Houtte, R. (1980). ‘Ammonia exchange at the land surface’, Agronomy Journal, 72, pp. 876–883.
Ludwig, J., Meixner, F.X., Vogel, B., Förstner, J. (2001). ‘Soil-air exchange of nitric oxide: An overview of processes, environmental factors, and modelling studies’, Biogeochemistry 52, pp. 225–257.
Meixner, F.X. (1994). ‘Surface exchange of odd nitrogen oxides. Nova Acta Leopoldina NF70’, 288, pp. 299–348.
Oettl, D., Funk, R., Sturm, P. (2005). PM emission factors for farming activities. In: Proceedings of the 14th Symposium Transport and Air Pollution, 1–3.6 2005, Graz, Technical University Graz, Austria.
Penner, J.E., Atherton, C.S., Graedel T.E. (1993). Global Emissions and Models of Photochemically Active Compounds. International Global Atmospheric Chemistry (IGAC) project conference, Eilat (Israel), 18–22.4.1993.
Schjørring, J.K. (1991). ‘Ammonia emissions from the foliage of growing plants’, pp. 267–292. In: T.D. Sharkey, E.A. Holland and H.A. Mooney, eds., Trace gas emissions by plants. Academic Press, San Diego.

4.D Crop production and agricultural soils
EMEP/EEA emission inventory guidebook 2009 39
Schjørring, J.K., Byskov-Nielsen (1991). ‘Ammonia emission from barley plants: field investigations 1989 and 19900’. In: Nitrogen and phosphorus in soil and air. Nat. Agency of Env. Prot., Ministry of the Environment, Kopenhagen, Denmark, pp. 249–265.
Simpson, D., Winiwarter, W., Borjesson, B., Cinderby, S., Ferreiro, A., Guenther, A., Hewitt, C.N., Janson, R., Khalil, A.M.K., Owen, S., Pierce, T.E., Puxbaum, H., Shearer, M., Skiba, U., Steinbrecher, R., Tarrason, L., Oquist, M.G. (1999). ‘Inventorying emissions from nature in Europe’, Journal of Geophysical Research 104 (D7), pp. 8113–8152.
Skiba, U., Sozanska, M., Metcalfe, S. and Fowler, D. (2001). ‘Spatially disaggregated inventories of soil NO and N2O emissions from Great Britain’, Water Air and Soil Pollution Focus, 1, pp. 109–118.
Slemr, F. and Seiler (1984). ‘Field measurements of NO and NO2 emissions from fertilised and unfertilised soils’, Journal of Atmospheric Chemistry, 2, pp. 1–24.
Sommer, S.G. and Jensen, C. (1994). ‘Ammonia volatilization from urea and ammoniacal fertilisers surface applied to winter wheat and grassland’, Fertiliser Research, 37, pp. 85–92.
Sozanska, M., Skiba, U., Metcalfe, S. (2002). ‘Developing an inventory of N2O emissions from British soils’, Atmospheric Environment 36, pp. 987–998.
Stohl, A., Williams, E., Wotawa, G., Kronup-Kolb, H. (1996). ‘A European Inventory of soil nitric oxide emissions and the effect of these emissions on the photochemical formation of ozone’, Atmospheric Environment 30, pp. 3741–3755.
Sutton, M.A., Milford, C., Nemitz, E., Theobald, M.R., Hill, P.W., Fowler, D., Schjørring, J.K., Mattson, M.E., Nielsen, K.H., Husted, S., Erisman, J.W., Otjes, R., Hensen, A., Cellier, P., Loubet, B., David, M., Genermont, S., Neftel, A., Blatter, A., Hermann, B., Jones, S.K., Horvath, L., Führer, E., Mantzanas, K., Koukoura, Z., Gallagher, M.W., Williams, P.I., Riedo, M. (2001). ‘Biosphere-atmosphere interactions of ammonia with grasslands: experimental strategy and results from a new European initiative’, Plant and Soil (Nitrogen Special Issue) 228(1), pp. 131–145.
Sutton, M.A., Nemitz, E., Fowler, D., Wyers, G.P., Otjes, R.P., Schjørring, J.K., Husted, S., Nielsen, K., San José, R., Moreno, J., Gallagher, M.W., Gut, A. (2000). ‘Fluxes of ammonia over oilseed rape: Overview of the EXAMINE experiment’, Agriculture and Forest Meteorology (Ammonia Exchange Special Issue), 105, pp. 327–349.
Takai, H., Pedersen, S., Johnsen, J.O., Metz, J.H.M., Groot Koerkamp, P.W.G., Uenk, G.H., Phillips, V.R., Holden, M.R., Sneath, R.W., Short, J.L., White, R.P., Hartung, J., Seedorf, J., Schröder, M., Linkert, K.H., Wathes, C.M. (1998). ‘Concentrations and Emissions of Airborne Dust in Livestock Buildings in Northern Europe’, Journal of Agricultural Engineering Research, 70, pp. 59–77.
Wathes, C.M., Phillips, V.R., Sneath, R.W., Brush, S., ApSimon, H.M. (2002). Atmospheric emissions of particulates (PM10) from agriculture in the Untied Kingdom. ASAE Paper number 024217.
Whitehead, D.C., Raistrick, N. (1993). ‘The volatilization of ammonia from cattle urine applied to soils as influenced by soil properties’, Plant and Soil, 148, pp. 43–51.
WRAP Fugitive Dust Handbook (2006). Prepared for: Western Governors Association by Countess Environmental, Westlake Village, CA.
Yienger, J.J., Levy, H. (1995). ‘Empirical model of the global soil-biogenic NOx emissions’, Journal of Geophysical Research, 100, pp. 11447–11464.