nitrate leaching from turf fertilization- a summary of...
TRANSCRIPT
Nitrate Leaching From Turf Fertilization- A
Summary of FDEP-Funded Research
Laurie E. Trenholm
Urban Turfgrass BMP Specialist
UF-IFAS

Master Gardener Turfgrass Field Day – May 31st
Contact Crystal in the Statewide MG office to register
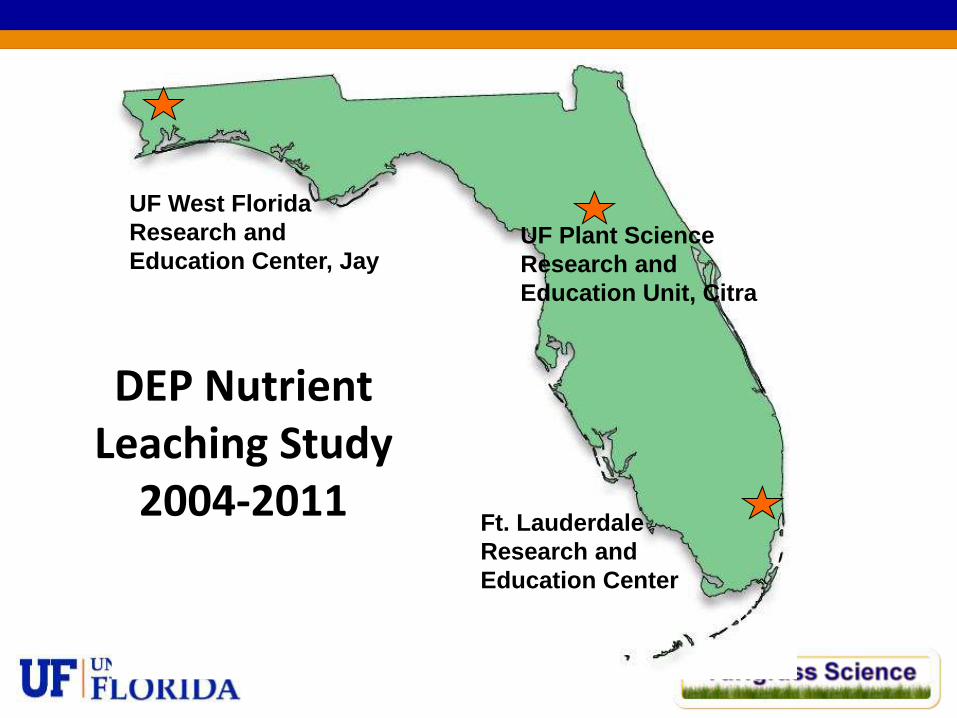
UF West Florida
Research and
Education Center, Jay UF Plant Science
Research and
Education Unit, Citra
Ft. Lauderdale
Research and
Education Center
DEP Nutrient Leaching Study
2004-2011

DEP Research – Nutrient Leaching
• Part of a FDEP $4.5 million grant to study nutrient leaching in lawn grasses
• Statewide project
• Apply nitrogen and phosphorus to lawngrasses under a wide variety of circumstances
• Measure visual quality, physiological responses, and nitrate and phosphate concentration in leachate
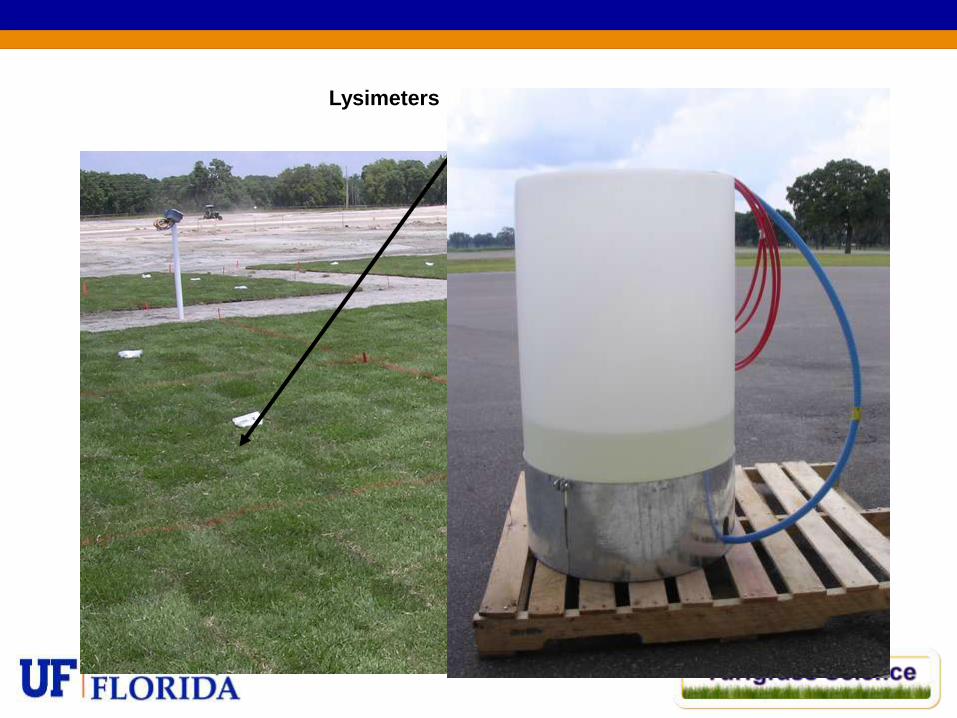
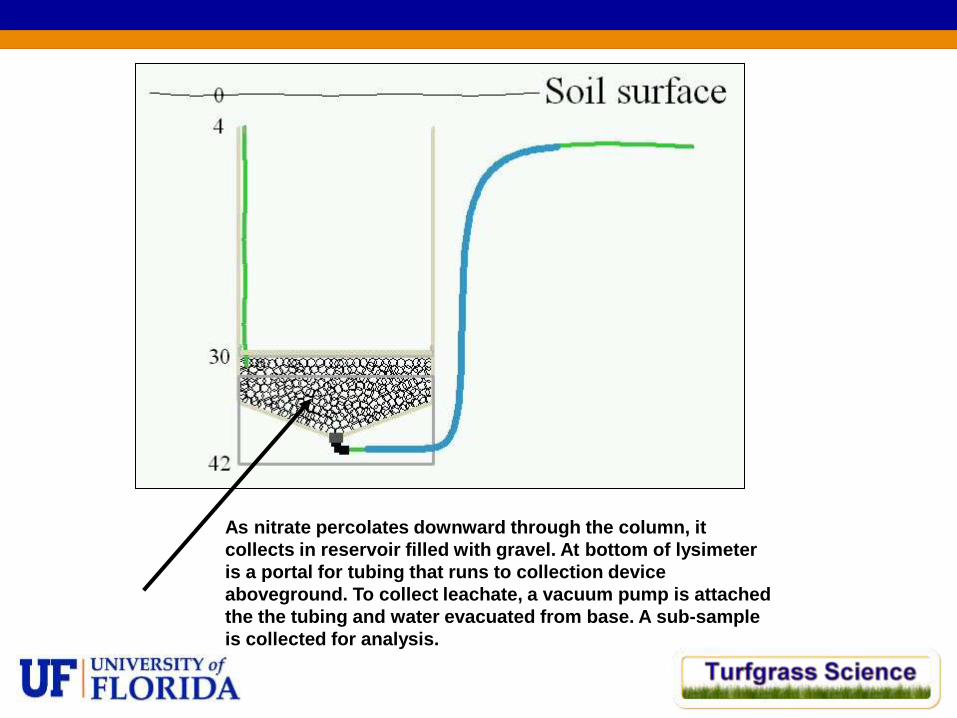
As nitrate percolates downward through the column, it
collects in reservoir filled with gravel. At bottom of lysimeter
is a portal for tubing that runs to collection device
aboveground. To collect leachate, a vacuum pump is attached
the the tubing and water evacuated from base. A sub-sample
is collected for analysis.
Research Projects
1. Nitrate Leaching from Newly Sodded Turf
2. Nitrate Leaching Due to N Rate
3. Nitrate Leaching Due to N Source
4. Nitrate Leaching in Winter Months
5. Phosphorus Leaching
6. Nitrate Leaching Due to Mowing Height
7. Nitrate Leaching Due to Clipping Management
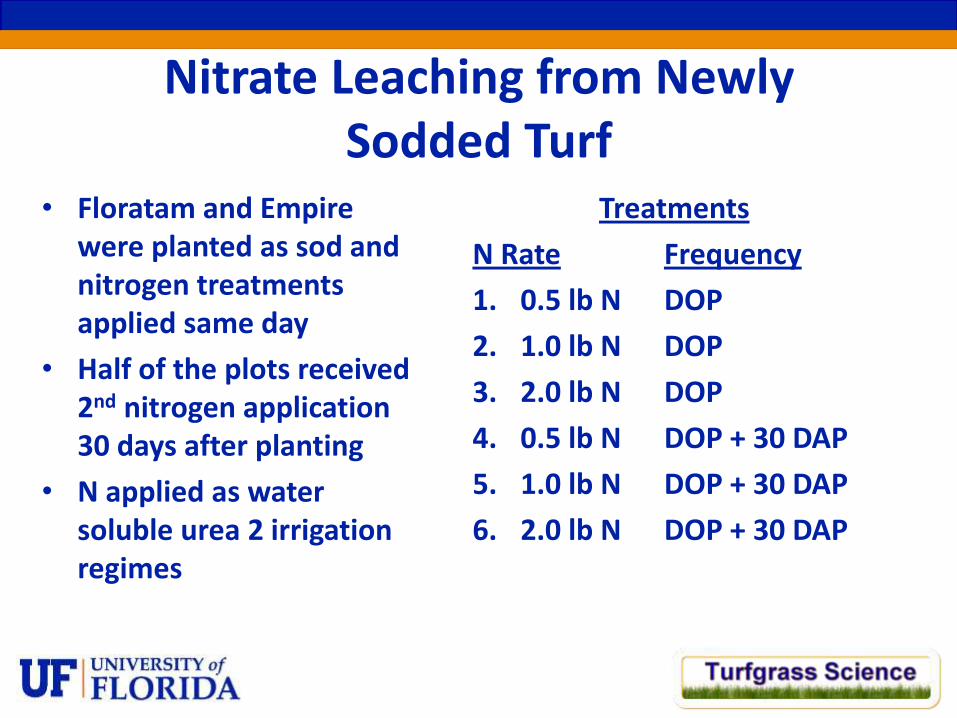
Nitrate Leaching from Newly Sodded Turf
• Floratam and Empire were planted as sod and nitrogen treatments applied same day
• Half of the plots received 2nd nitrogen application 30 days after planting
• N applied as water soluble urea 2 irrigation regimes
Treatments
N Rate Frequency
1. 0.5 lb N DOP
2. 1.0 lb N DOP
3. 2.0 lb N DOP
4. 0.5 lb N DOP + 30 DAP
5. 1.0 lb N DOP + 30 DAP
6. 2.0 lb N DOP + 30 DAP
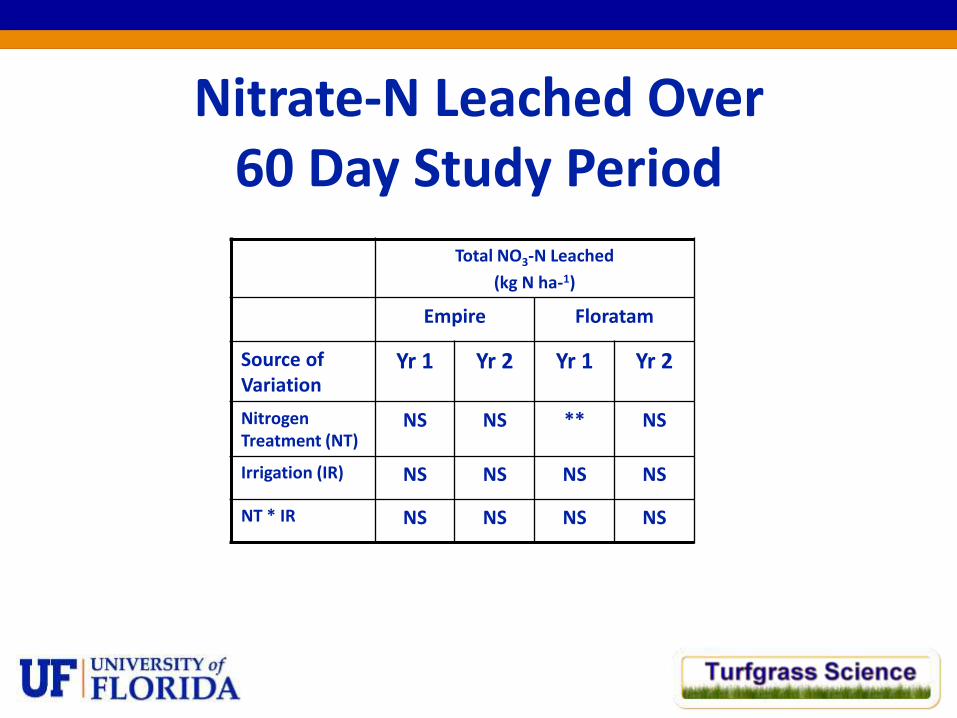
Nitrate-N Leached Over 60 Day Study Period
Total NO3-N Leached
(kg N ha-1)
Empire Floratam
Source of Variation
Yr 1 Yr 2 Yr 1 Yr 2
Nitrogen Treatment (NT)
NS NS ** NS
Irrigation (IR) NS NS NS NS
NT * IR NS NS NS NS
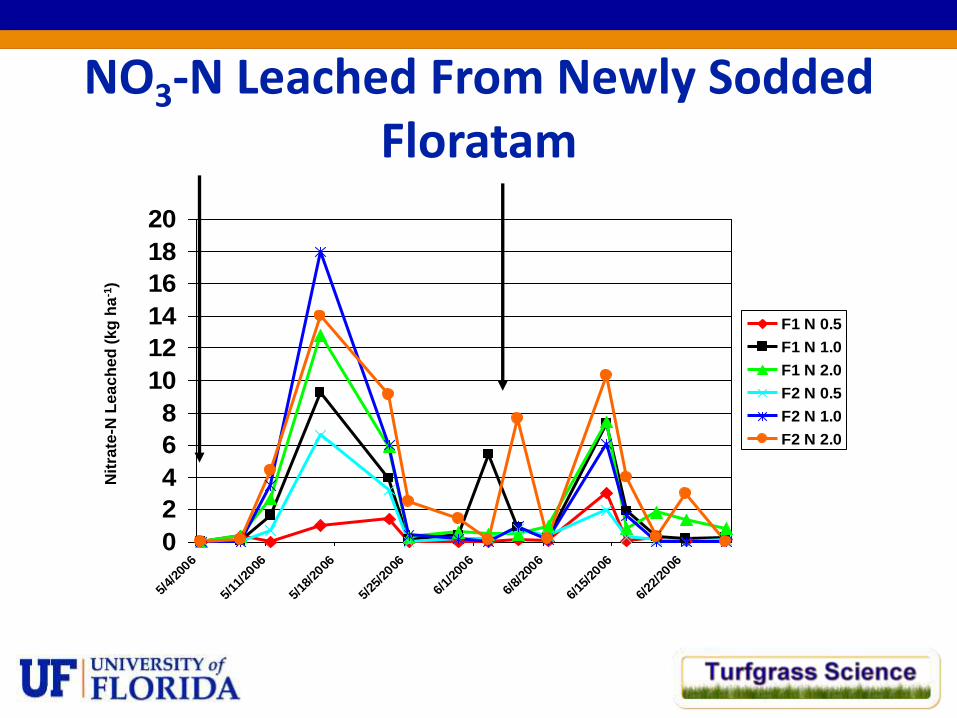
NO3-N Leached From Newly Sodded Floratam
0
2
4
6
8
10
12
14
16
18
20
5/4/
2006
5/11
/2006
5/18
/2006
5/25
/2006
6/1/
2006
6/8/
2006
6/15
/2006
6/22
/2006
F1 N 0.5
F1 N 1.0
F1 N 2.0
F2 N 0.5
F2 N 1.0
F2 N 2.0
Nit
rate
-N L
ea
ch
ed
(kg
ha
-1)
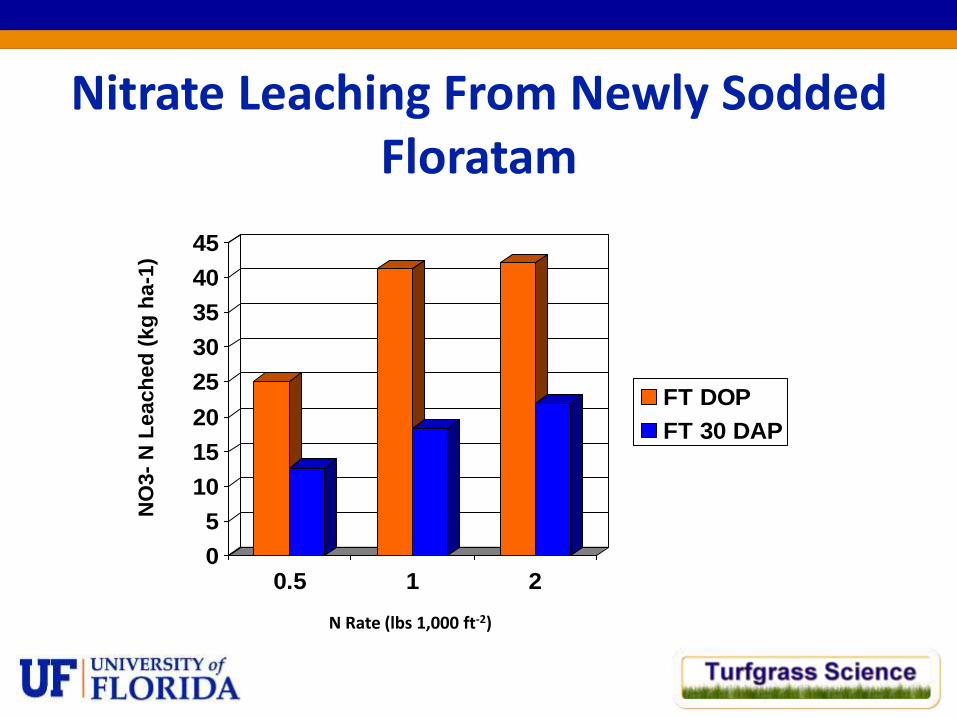
Nitrate Leaching From Newly Sodded Floratam
0
5
10
15
20
25
30
35
40
45
0.5 1 2
FT DOP
FT 30 DAP
NO
3-
N L
each
ed
(kg
ha
-1)
N Rate (lbs 1,000 ft-2)
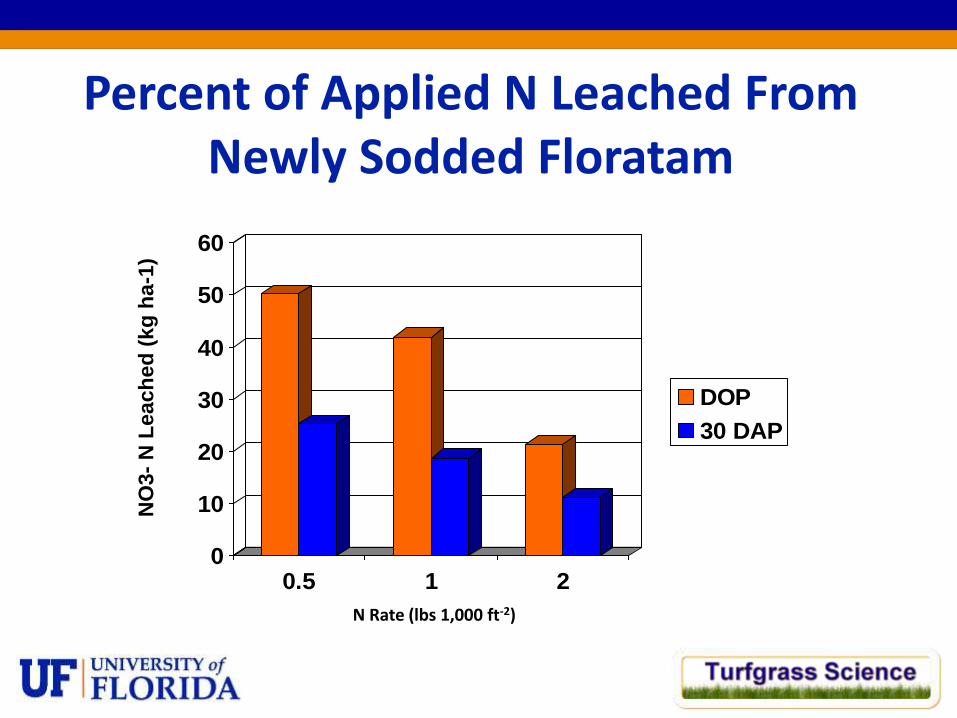
Percent of Applied N Leached From Newly Sodded Floratam
0
10
20
30
40
50
60
0.5 1 2
DOP
30 DAP
NO
3-
N L
each
ed
(kg
ha
-1)
N Rate (lbs 1,000 ft-2)
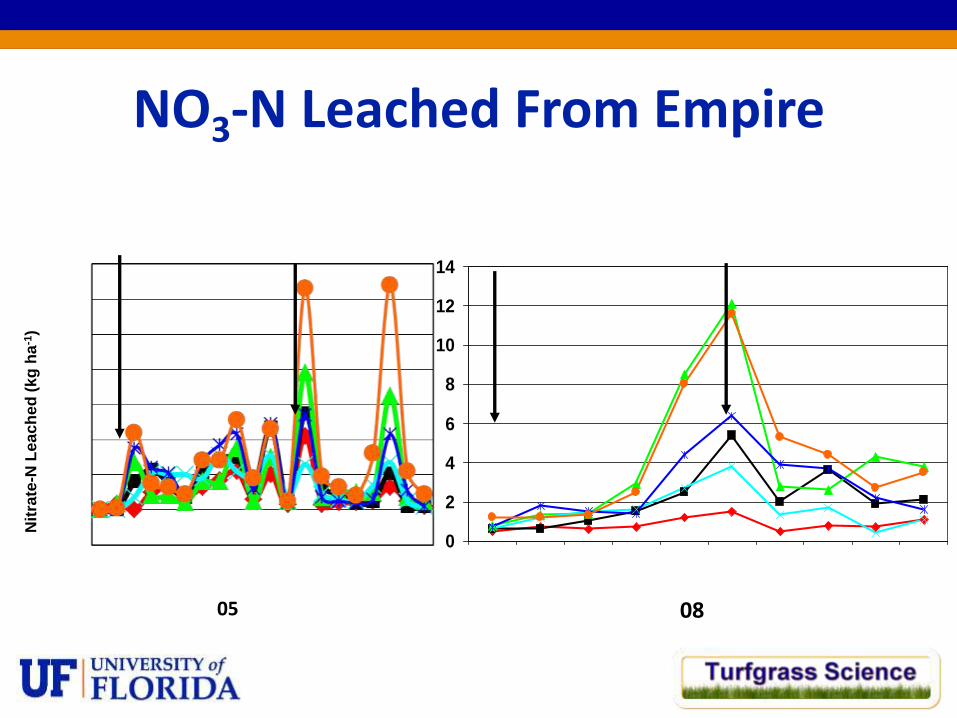
NO3-N Leached From Empire
Nit
rate
-N L
ea
ch
ed
(kg
ha
-1)
05
0
2
4
6
8
10
12
14
08
Conclusions
• Important to note that these rates of leaching are MUCH higher than from established turf
• Do not fertilize newly planted sod for 30-60 days after planting
• No pre-plant fertilizer incorporation, even with biosolid products
• Without an established root system, more N likely to leach
• Turf quality and establishment time not compromised by lack of fertilization
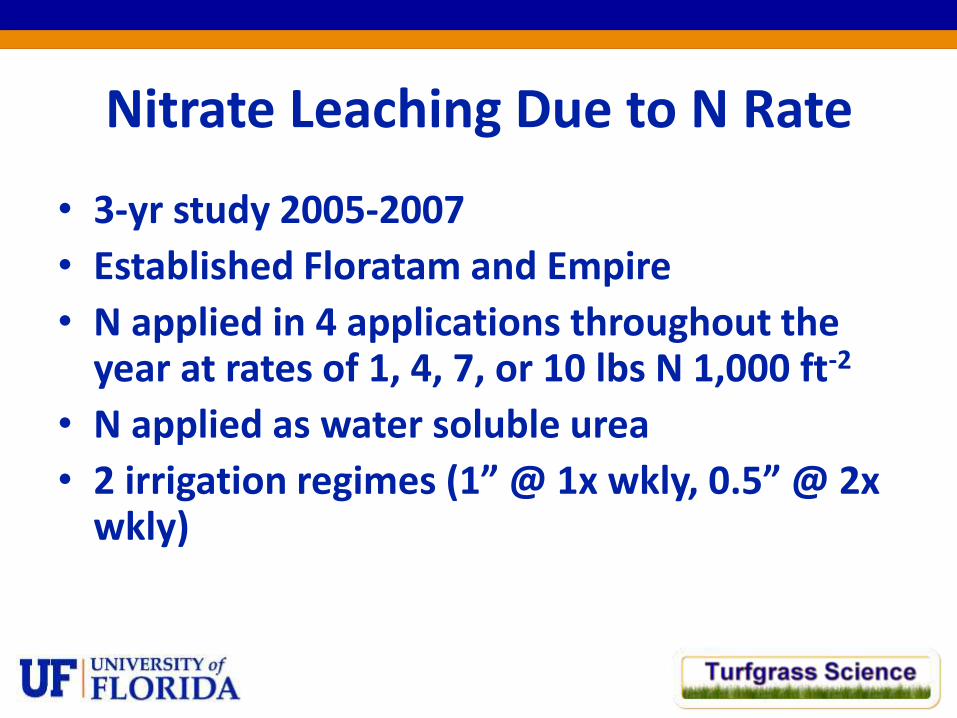
Nitrate Leaching Due to N Rate
• 3-yr study 2005-2007
• Established Floratam and Empire
• N applied in 4 applications throughout the year at rates of 1, 4, 7, or 10 lbs N 1,000 ft-2
• N applied as water soluble urea
• 2 irrigation regimes (1” @ 1x wkly, 0.5” @ 2x wkly)
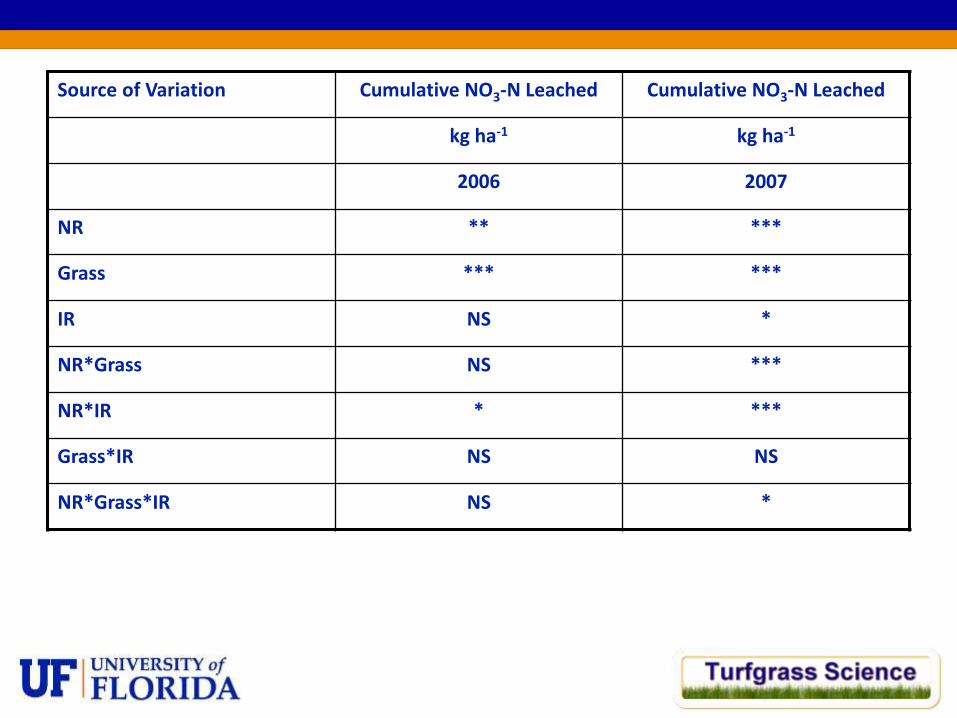
Source of Variation Cumulative NO3-N Leached Cumulative NO3-N Leached
kg ha-1 kg ha-1
2006 2007
NR ** ***
Grass *** ***
IR NS *
NR*Grass NS ***
NR*IR * ***
Grass*IR NS NS
NR*Grass*IR NS *
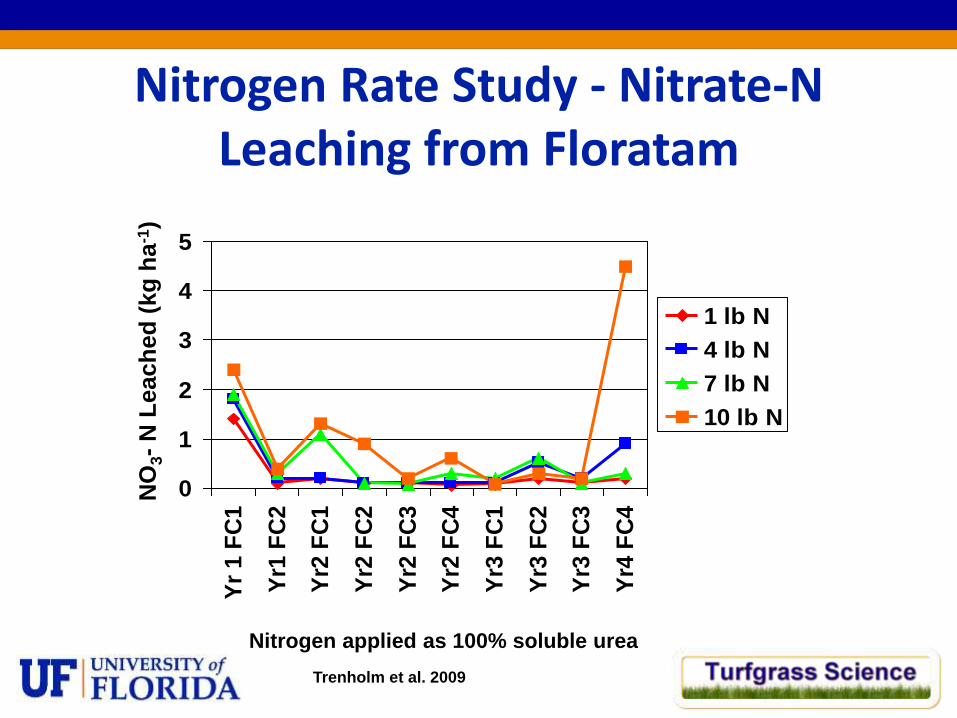
Nitrogen Rate Study - Nitrate-N Leaching from Floratam
0
1
2
3
4
5Y
r 1 F
C1
Yr1
FC
2
Yr2
FC
1
Yr2
FC
2
Yr2
FC
3
Yr2
FC
4
Yr3
FC
1
Yr3
FC
2
Yr3
FC
3
Yr4
FC
4
1 lb N
4 lb N
7 lb N
10 lb N
Nitrogen applied as 100% soluble urea
NO
3-
N L
each
ed
(kg
ha
-1)
Trenholm et al. 2009
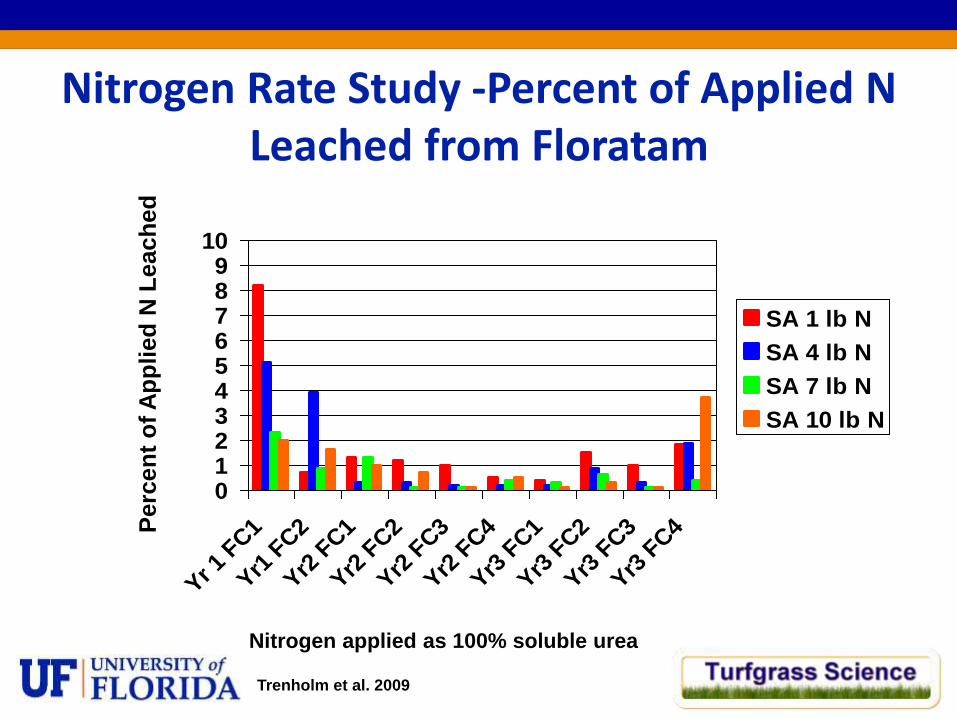
Nitrogen Rate Study -Percent of Applied N Leached from Floratam
0123456789
10
Yr 1 F
C1
Yr1 F
C2
Yr2 F
C1
Yr2 F
C2
Yr2 F
C3
Yr2 F
C4
Yr3 F
C1
Yr3 F
C2
Yr3 F
C3
Yr3 F
C4
SA 1 lb N
SA 4 lb N
SA 7 lb N
SA 10 lb N
Nitrogen applied as 100% soluble urea
Perc
en
t o
f A
pp
lied
N L
each
ed
Trenholm et al. 2009
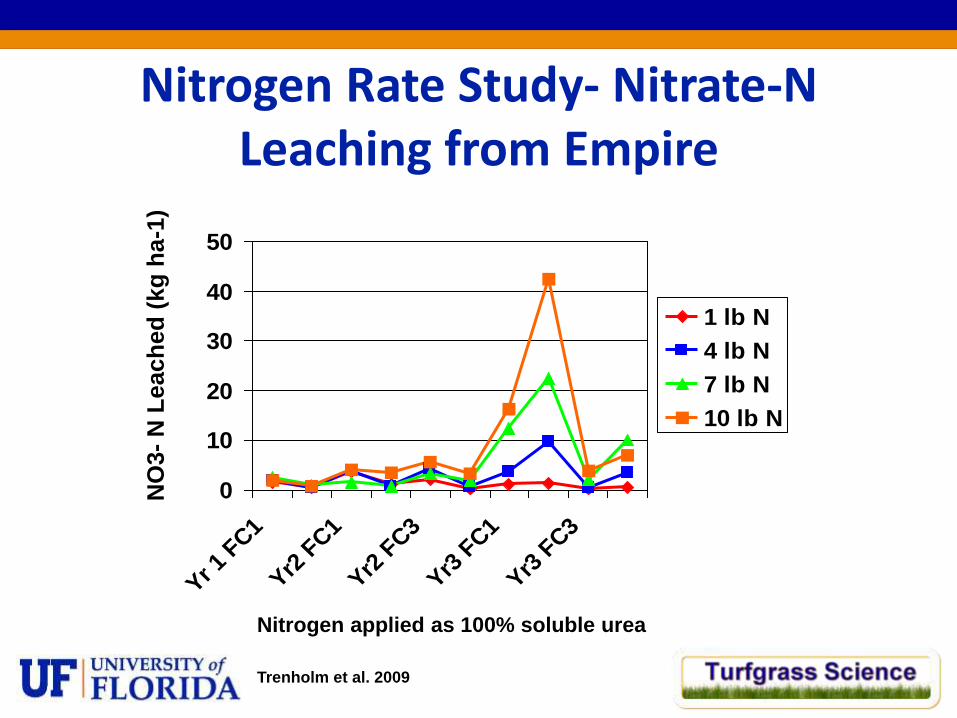
Nitrogen Rate Study- Nitrate-N Leaching from Empire
0
10
20
30
40
50
Yr 1 F
C1
Yr2 F
C1
Yr2 F
C3
Yr3 F
C1
Yr3 F
C3
1 lb N
4 lb N
7 lb N
10 lb N
Nitrogen applied as 100% soluble urea
NO
3-
N L
each
ed
(kg
ha
-1)
Trenholm et al. 2009
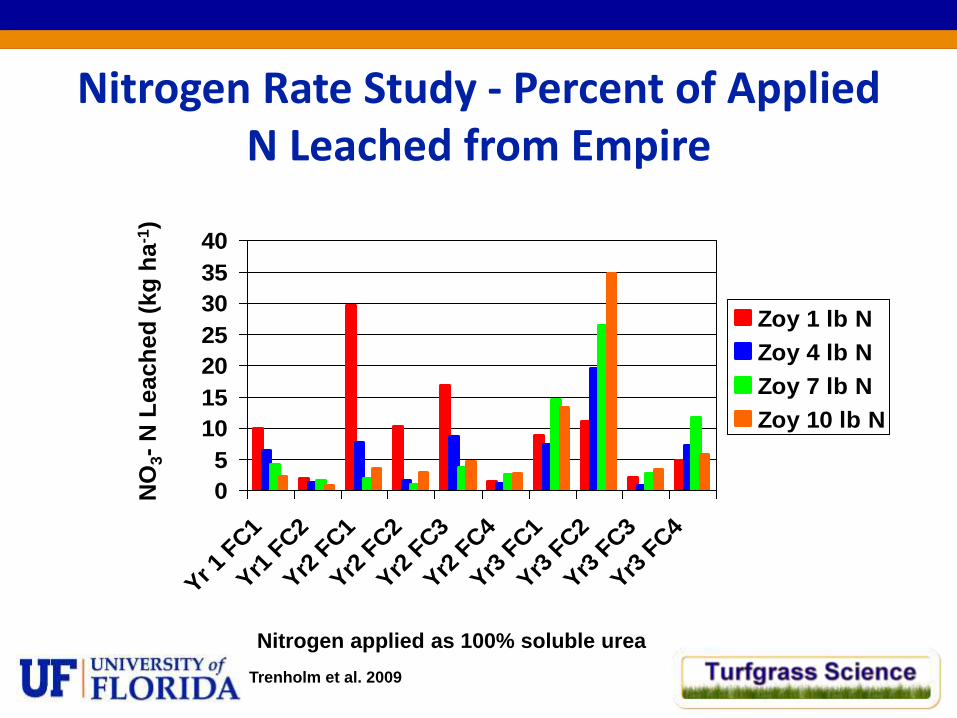
Nitrogen Rate Study - Percent of Applied N Leached from Empire
0
5
10
15
20
25
30
35
40
Yr 1 F
C1
Yr1 F
C2
Yr2 F
C1
Yr2 F
C2
Yr2 F
C3
Yr2 F
C4
Yr3 F
C1
Yr3 F
C2
Yr3 F
C3
Yr3 F
C4
Zoy 1 lb N
Zoy 4 lb N
Zoy 7 lb N
Zoy 10 lb N
Nitrogen applied as 100% soluble urea
NO
3-
N L
each
ed
(kg
ha
-1)
Trenholm et al. 2009
Conclusions
• A healthy turf cover mitigated N leaching loads
• Importance of BMPs in maintaining a healthy turf cover (fertilization, mowing, irrigation)
• As SA matured after first year, nitrate leaching was minimized, regardless of N rate
• When turf cover was eroded, N leaching losses increased
• Current N recommendations for SA are good
Conclusions
• Zoysia more prone to increased leaching as applied N increased – Greater disease at higher N rates
• Zoysia N recommendations being revised downwards to reduce disease and potential for greater N losses
• Empire needs for N lower than in SA – quality and color good with less N
• Highest tendency for increased leaching occurred in spring and fall, not in summer
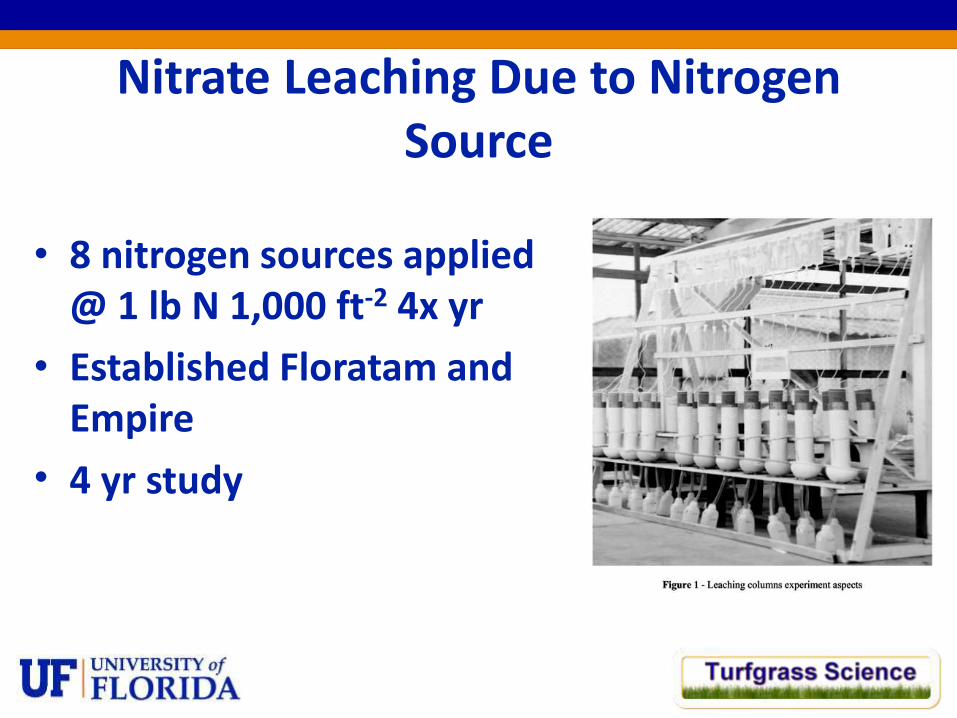
Nitrate Leaching Due to Nitrogen Source
• 8 nitrogen sources applied @ 1 lb N 1,000 ft-2 4x yr
• Established Floratam and Empire
• 4 yr study
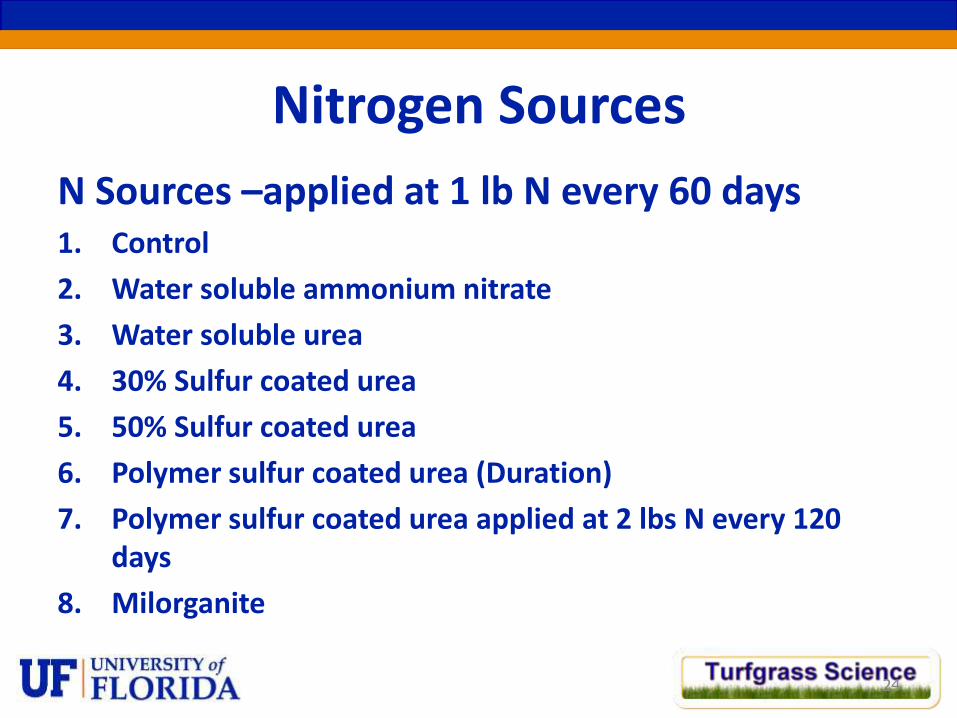
Nitrogen Sources
N Sources –applied at 1 lb N every 60 days 1. Control
2. Water soluble ammonium nitrate
3. Water soluble urea
4. 30% Sulfur coated urea
5. 50% Sulfur coated urea
6. Polymer sulfur coated urea (Duration)
7. Polymer sulfur coated urea applied at 2 lbs N every 120 days
8. Milorganite
24
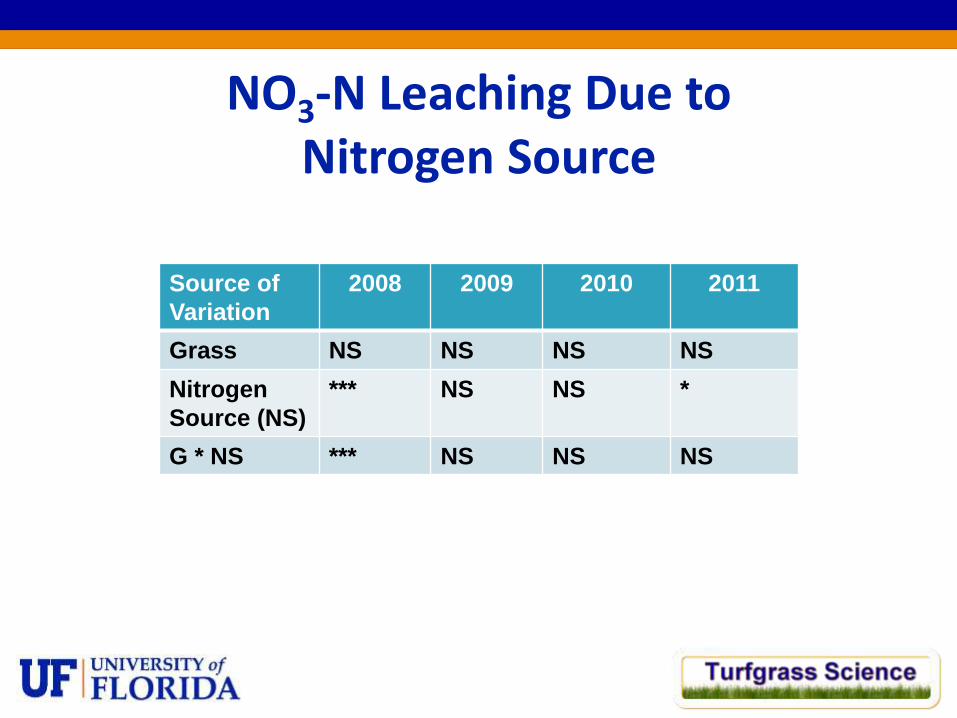
NO3-N Leaching Due to Nitrogen Source
Source of
Variation
2008 2009 2010 2011
Grass NS NS NS NS
Nitrogen
Source (NS)
*** NS NS *
G * NS *** NS NS NS
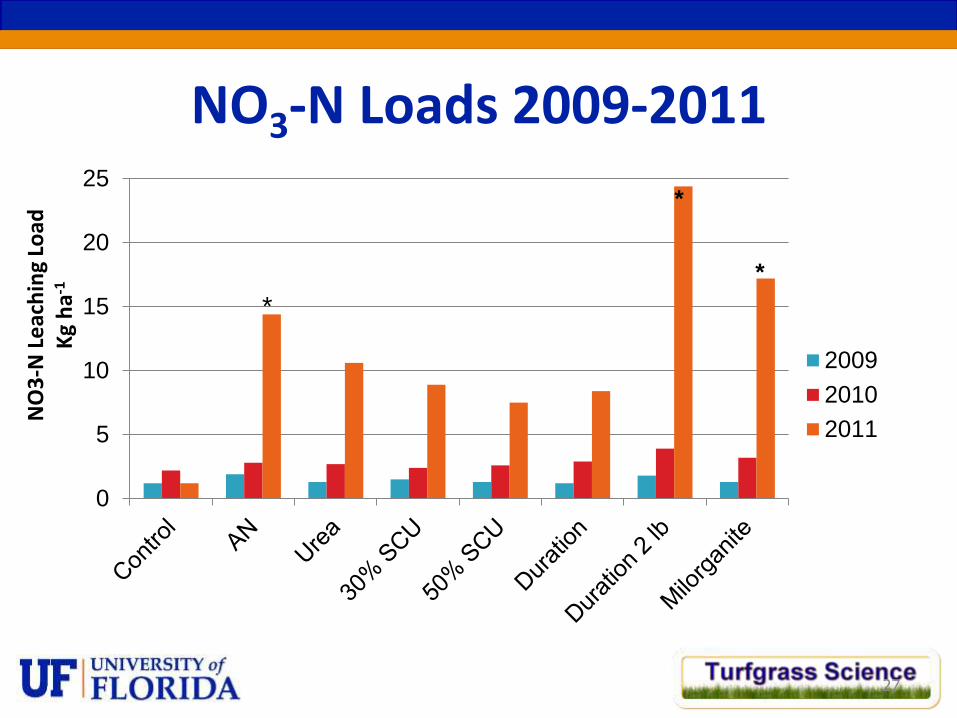
NO3-N Loads 2009-2011
0
5
10
15
20
25
2009
2010
2011
*
*
*
27
NO
3-N
Le
ach
ing
Load
K
g h
a-1
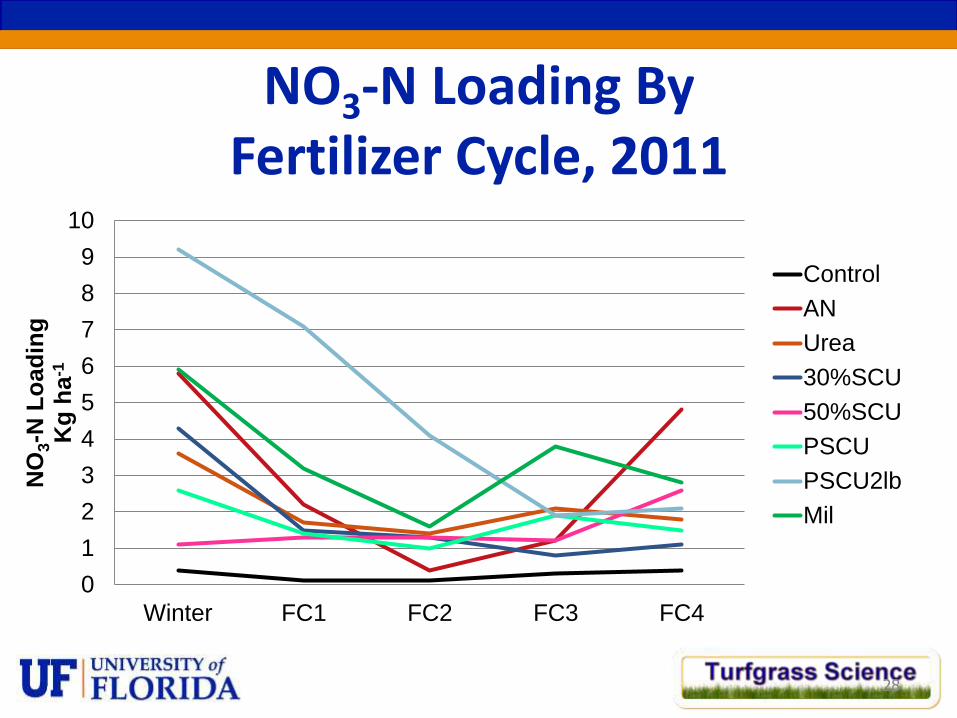
NO3-N Loading By Fertilizer Cycle, 2011
0
1
2
3
4
5
6
7
8
9
10
Winter FC1 FC2 FC3 FC4
NO
3-N
Lo
ad
ing
K
g h
a-1
Control
AN
Urea
30%SCU
50%SCU
PSCU
PSCU2lb
Mil
28
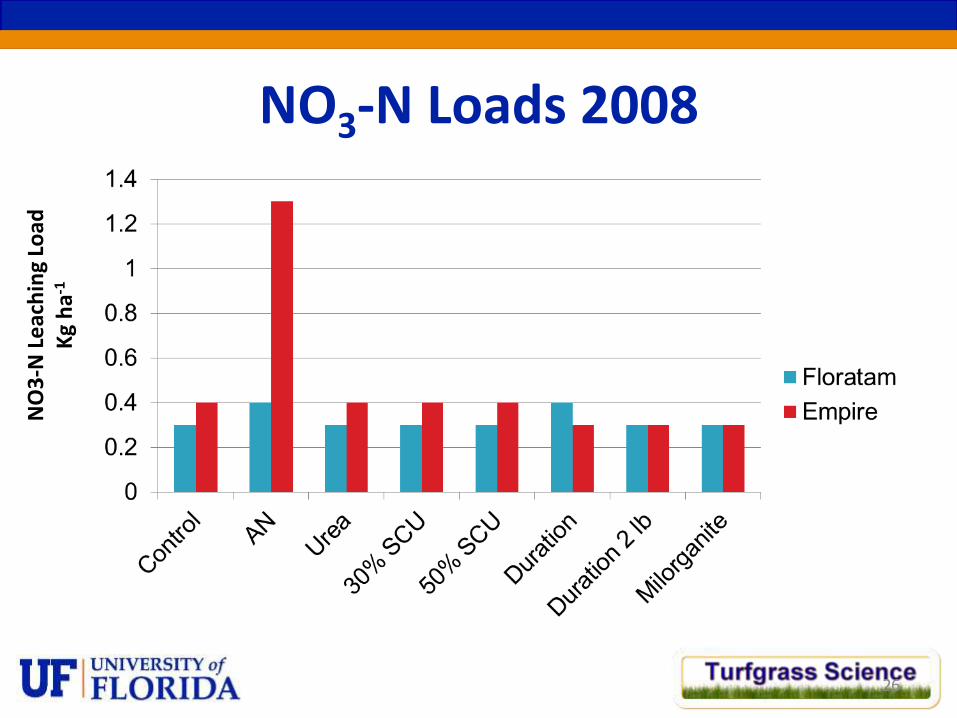
Conclusions • No significant differences in NO3-N loading between grasses
• Differences due to N source in 2 of 4 yrs
• Where differences occurred, greatest loading from AN (2008) and AN, PSCU at 2 lb twice a year, and Milorganite (2011)
• What about ordinances banning use of water soluble N sources?
• Should DACS allow Fertilizer Label Rule to change to allow application of 2 lb PSCU products?
• Should DACS allow Fertilizer Label Rule to change to allow application of up to 1 lb water soluble N?
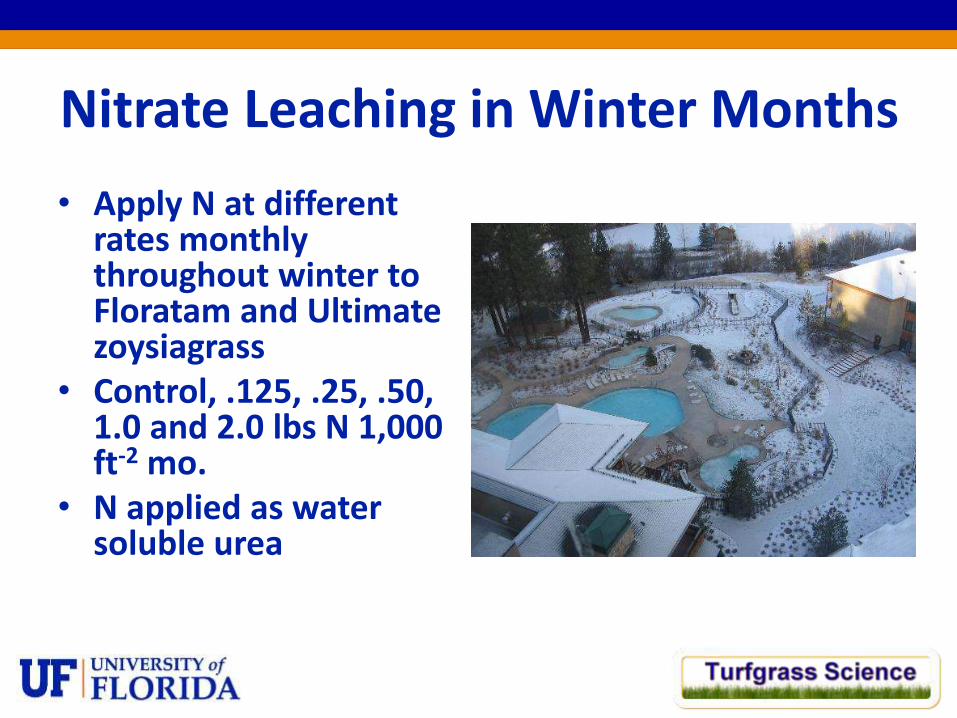
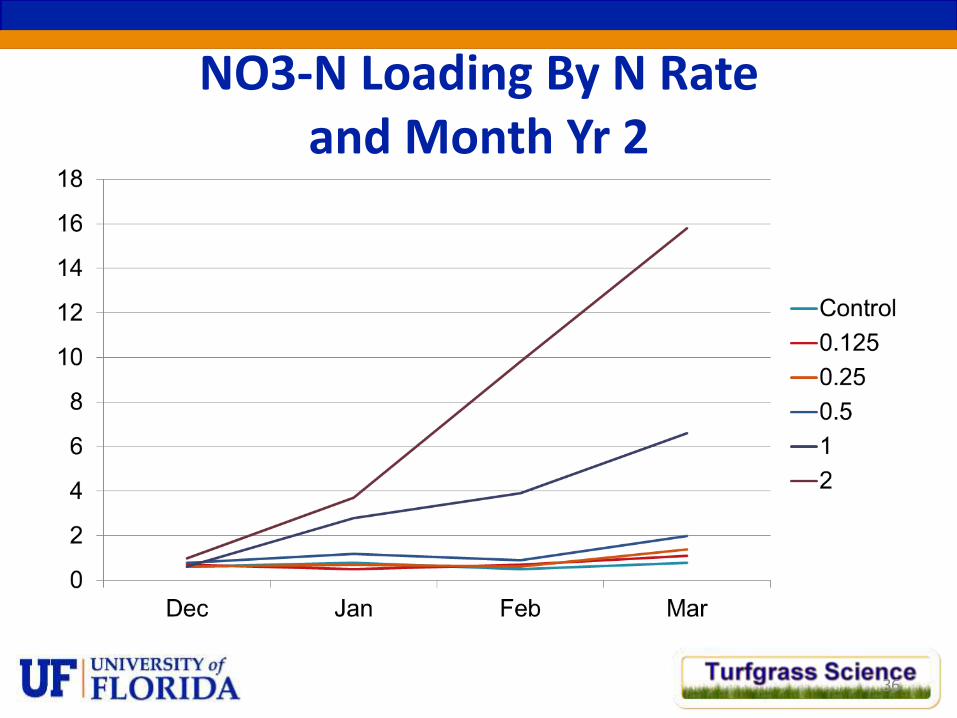
Nitrate Leaching in Winter Months
• Apply N at different rates monthly throughout winter to Floratam and Ultimate zoysiagrass
• Control, .125, .25, .50, 1.0 and 2.0 lbs N 1,000 ft-2 mo.
• N applied as water soluble urea
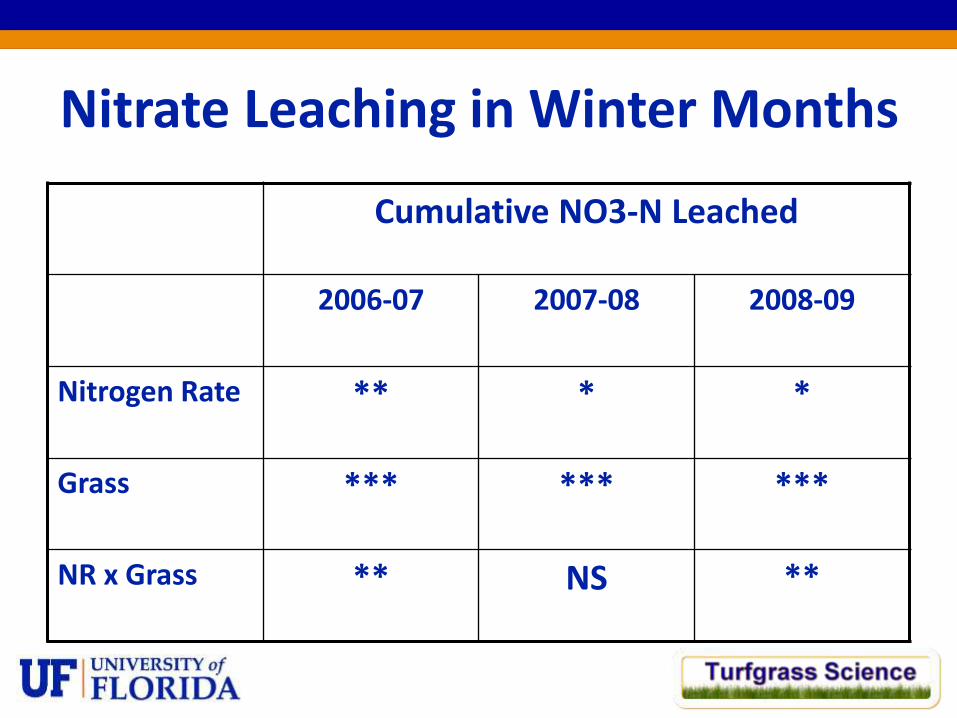
Nitrate Leaching in Winter Months
Cumulative NO3-N Leached
2006-07 2007-08 2008-09
Nitrogen Rate ** * *
Grass *** *** ***
NR x Grass ** NS **
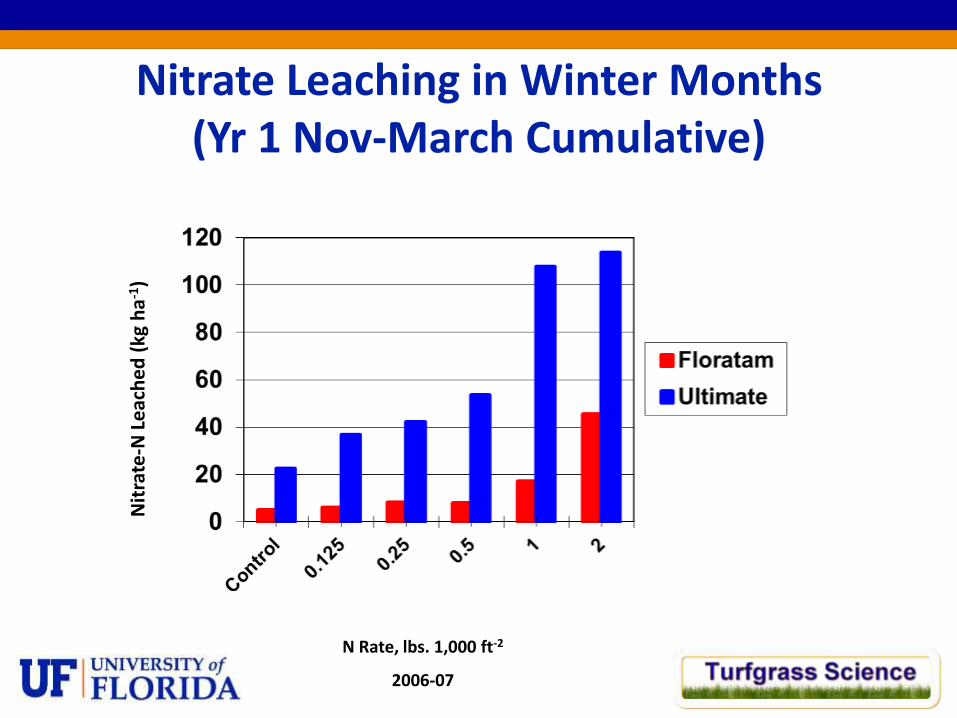
Nitrate Leaching in Winter Months (Yr 1 Nov-March Cumulative)
N Rate, lbs. 1,000 ft-2
2006-07
Nit
rate
-N L
eac
he
d (
kg h
a-1
)
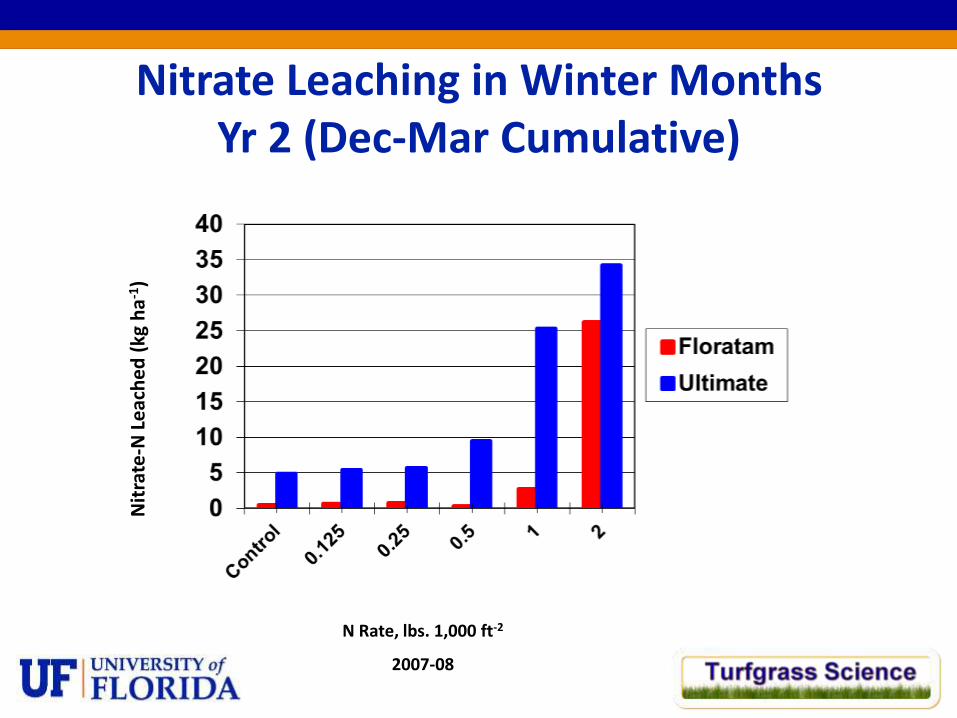
Nitrate Leaching in Winter Months Yr 2 (Dec-Mar Cumulative)
N Rate, lbs. 1,000 ft-2
2007-08
Nit
rate
-N L
eac
he
d (
kg h
a-1
)
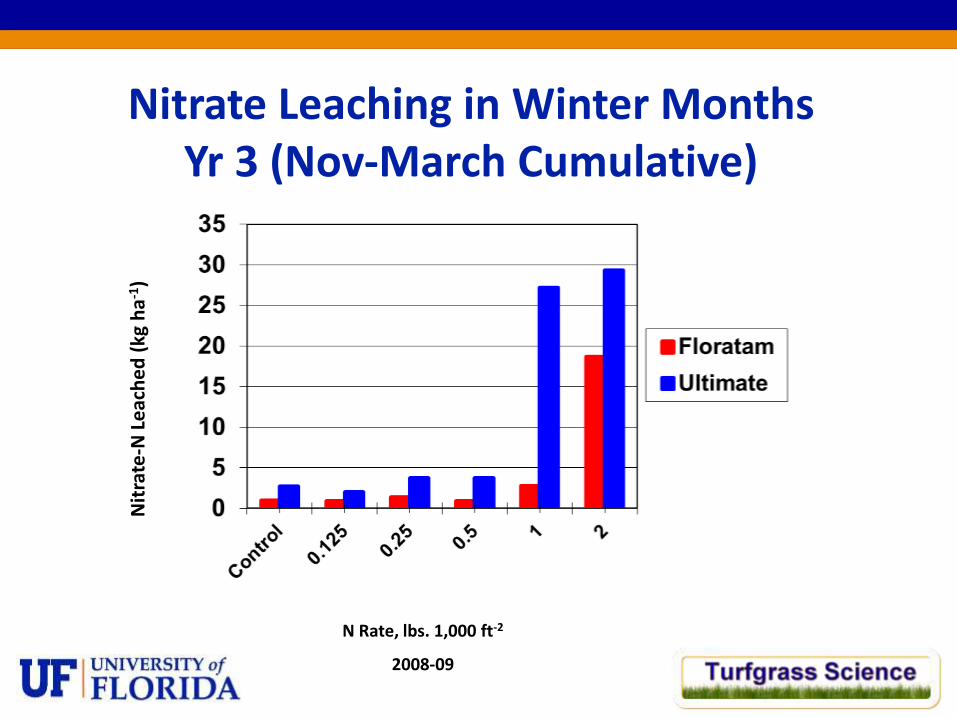
Nitrate Leaching in Winter Months Yr 3 (Nov-March Cumulative)
N Rate, lbs. 1,000 ft-2
2008-09
Nit
rate
-N L
eac
he
d (
kg h
a-1
)
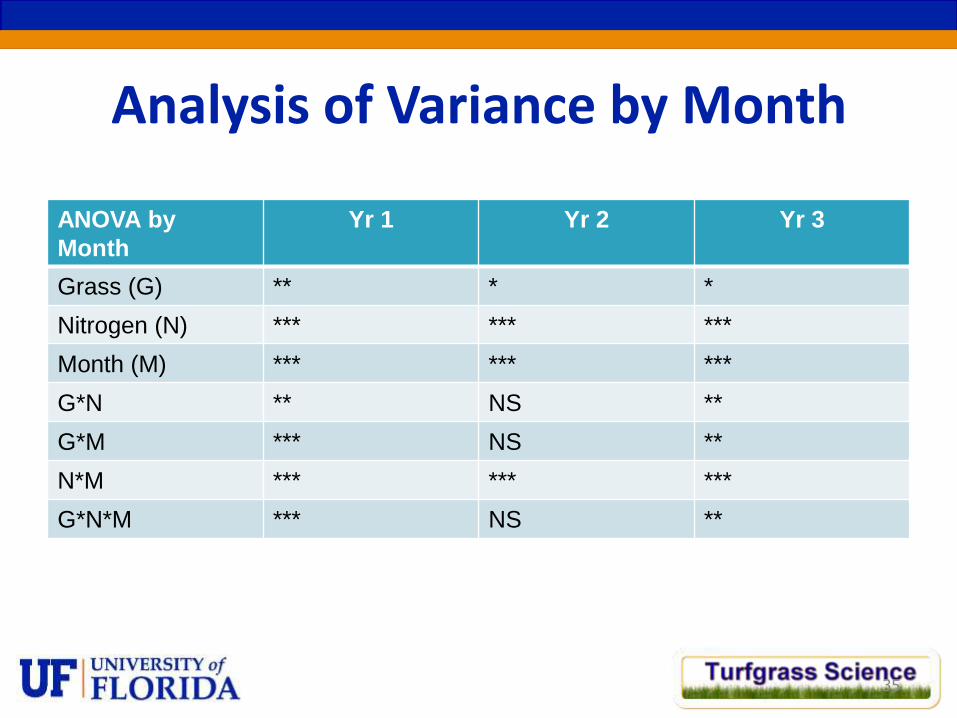
Analysis of Variance by Month
ANOVA by
Month
Yr 1 Yr 2 Yr 3
Grass (G) ** * *
Nitrogen (N) *** *** ***
Month (M) *** *** ***
G*N ** NS **
G*M *** NS **
N*M *** *** ***
G*N*M *** NS **
35
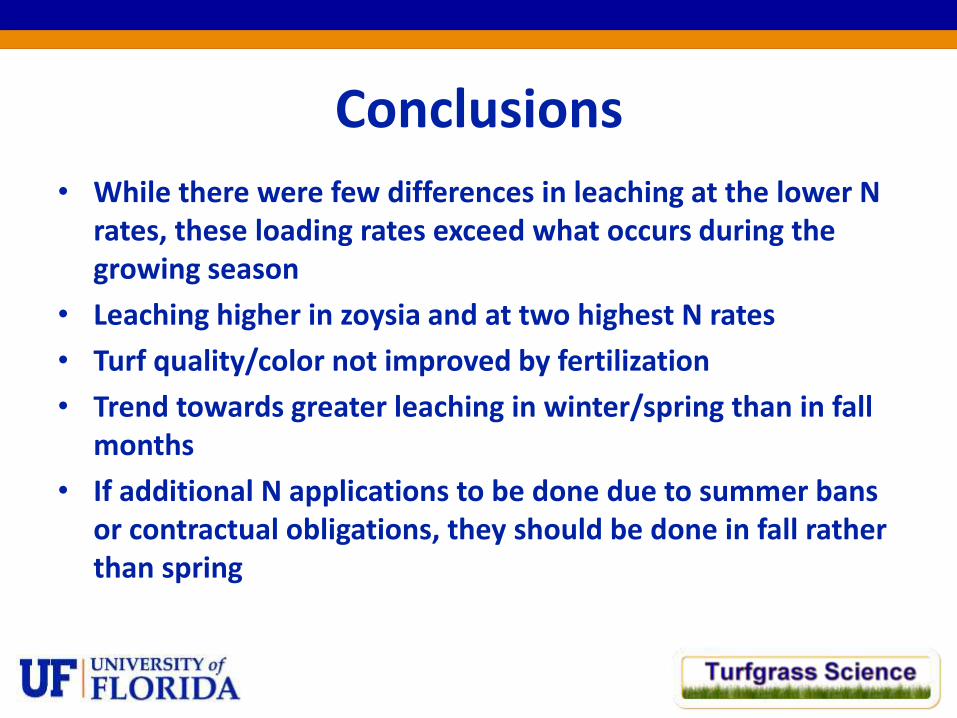
Conclusions
• While there were few differences in leaching at the lower N rates, these loading rates exceed what occurs during the growing season
• Leaching higher in zoysia and at two highest N rates
• Turf quality/color not improved by fertilization
• Trend towards greater leaching in winter/spring than in fall months
• If additional N applications to be done due to summer bans or contractual obligations, they should be done in fall rather than spring
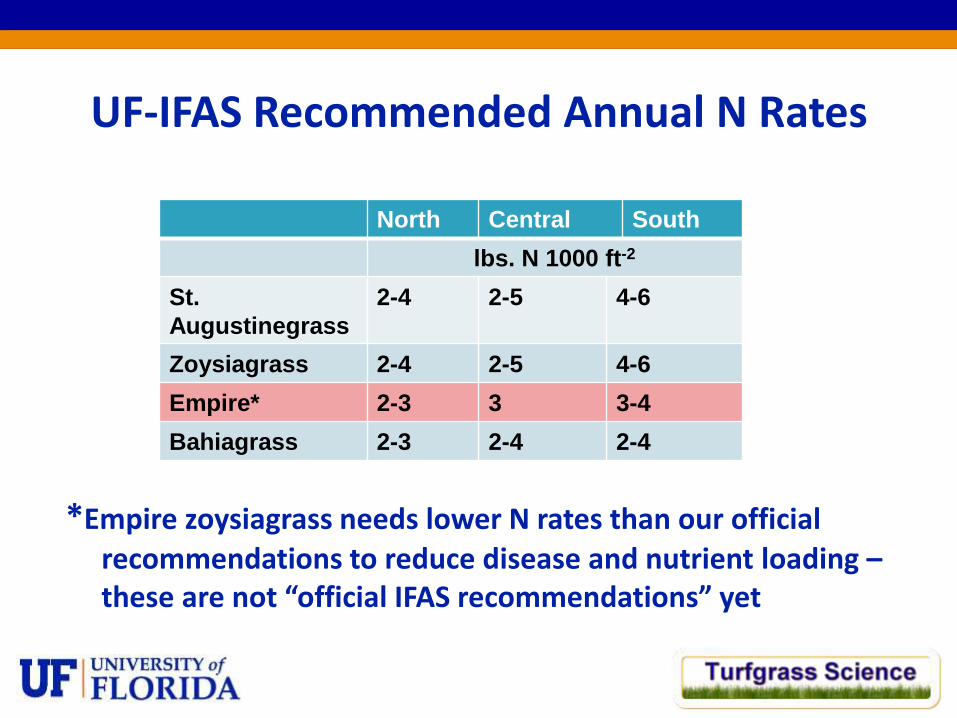
UF-IFAS Recommended Annual N Rates
*Empire zoysiagrass needs lower N rates than our official recommendations to reduce disease and nutrient loading – these are not “official IFAS recommendations” yet
North Central South
lbs. N 1000 ft-2
St.
Augustinegrass
2-4 2-5 4-6
Zoysiagrass 2-4 2-5 4-6
Empire* 2-3 3 3-4
Bahiagrass 2-3 2-4 2-4

Other Factors to Reduce Nutrient Movement
• Do not apply nitrogen fertilizer at excessive rates – stick to the UF-IFAS recommendations
• Remove fertilizer granules from impervious surfaces
• Remove leaf clippings from impervious surfaces
• Use deflector shields around water bodies
• Maintain a buffer zone around water bodies
• All of these will likely have more impact on reducing pollution than nitrogen source used
We thank the Florida Department of
Environmental Protection for funding
this research