long-term simulations of nitrate leaching from potato
TRANSCRIPT
ORIGINAL ARTICLE
Long-term simulations of nitrate leaching from potatoproduction systems in Prince Edward Island, Canada
Yefang Jiang • Bernie Zebarth • Jonathan Love
Received: 9 June 2011 / Accepted: 23 September 2011
� Springer Science+Business Media B.V. 2011
Abstract LEACHN was employed to simulate
nitrate leaching from a representative potato produc-
tion system in Prince Edward Island (PEI), Canada
and enhance the understanding of impacts of potato
(Solanum tuberosum L.) production on groundwater
quality. The model’s performance on predicting
drainage was examined against water table measure-
ments through coupled LEACHN and MODFLOW
modeling. LEACHN was calibrated and verified to
data from tile-drain leaching experiments of potato
grown in rotation with barley (Hordeum vulgare L.)
and red clover (Trifolium pratense L.) during
1999–2008. Long-term simulations using the cali-
brated model were performed to evaluate the effects
of climate and N fertilization for the potato crop on
nitrate leaching. The modeling suggests LEACHN
can be an effective tool for predicting nitrate leaching
from similar cropping systems in PEI. Both measure-
ments and simulations showed nitrate leaching pri-
marily occurred during the non-growing season when
crop uptake diminishes, and nitrate from mineraliza-
tion and residual fertilizer coexists with excessive
moisture from rainfall and snowmelt infiltration.
Annual average nitrate leaching following potato,
barley and red clover phases was predicted to be 81,
54 and 35 kg N ha-1, respectively, and the corre-
sponding leached concentrations were 15.7, 10.1 and
7.3 mg N l-1. Increased N input for potato alone
increased nitrate leaching not only during potato
phase but also during the rotation crop phases. To
reduce the risk of nitrate leaching, practices should be
developed to minimize nitrate accumulation in soil
both during and outside of the growing season and in
both the potato and the rotation crop phases.
Keywords Water quality � LEACHN �MODFLOW � Solanum tuberosum
Introduction
Nitrate leaching from agricultural cropping systems is
a common issue world-wide (Power and Schepers
1989; Spalding and Exner 1993; Bohlke 2002). This
nitrate leaching may contribute to contamination of
the underlying groundwater and impair drinking water
quality (McMahon et al. 2007; Jiang and Somers
2009). In many cases, nitrate-enriched groundwater
Y. Jiang (&)
Agri-Environment Services Branch,
Agriculture and Agri-Food Canada, 440 University
Avenue, Charlottetown, PE C1A 4N6, Canada
e-mail: [email protected]
B. Zebarth
Potato Research Centre, Agriculture and Agri-Food
Canada, 850 Lincoln Rd, Fredericton, NB E3B 4Z7,
Canada
e-mail: [email protected]
J. Love
Environmental Sciences, Nova Scotia Agricultural
College, Truro, NS B2N 5E3, Canada
e-mail: [email protected]
123
Nutr Cycl Agroecosyst
DOI 10.1007/s10705-011-9463-z
discharges to local streams and rivers and associated
estuaries, contributing to eutrophication (Pionke and
Urban 1985; Bachman et al. 1998; Burkart and James
1999; Keith and Zhang 2004). Thus nitrate losses from
agricultural cropping systems are of concern for both
drinking water and aquatic ecosystem protection.
Nitrate leaching loss from potato production systems
is of particular concern for water quality protection
because the potato crop usually receives high fertilizer
N inputs and N uptake by the potato crop is generally
not very efficient (Delgado et al. 2001; Zebarth and
Rosen 2007; Jego et al. 2008). Several modeling efforts
(Verhagen 1997; Delgado et al. 2001; Peralta and
Stockle 2001; De Neve et al. 2003; Vos and van der
Putten 2004; Jego et al. 2008) have been made to
enhance the understanding of nitrate leaching from
potato production systems. These studies showed that
nitrate leaching from potato production systems could
be estimated through modeling and that nitrate leaching
varied widely depending on soil properties, meteoro-
logical conditions and crop management practices.
Nitrate leaching from potato fields was usually higher
from potato compared with rotation crop fields. For
example, Delgado et al. (2001) reported simulated
nitrate leaching from the root zone of potato fields was
approximately two times higher than from barley (94
vs. 34 kg N ha-1). Peralta and Stockle (2001) exam-
ined nitrate leaching under an irrigated potato rotation
on low organic matter sandy soils in Washington State,
US, through a long-term simulation study using Crop-
Syst. They concluded that nitrate leaching occurred
primarily outside of the crop growth period and that
reducing fertilizer N rates was the only effective
approach to reducing nitrate leaching. De Neve et al.
(2003) simulated nitrate leaching from an organic and a
conventional mixed farm, and found that there was an
important contribution of autumn and winter N miner-
alization to nitrate leaching which could only be taken
into account explicitly using simulation models.
Prince Edward Island (PEI), Canada, is the smallest
province in Canada, yet it produces one fourth of the
Canadian potato crop (Statistics Canada 2009). About
20% of the island’s land mass is in potato production
rotations. Typically, potatoes (cultivar Russet Bur-
bank) are grown in rotation with barley and red clover,
and used for processing purposes. PEI is characterized
with a cool maritime climate, wet soil moisture
regimes, cool humid spring conditions and short
growing seasons. The soils for potato production were
derived from continental glacial till and are sandy and
well-drained. The soils are underlain by an unconfined
and semi-confined sandstone aquifer which supplies
all of the drinking water, and a large majority of
industrial water and stream flow on the island.
Elevated nitrate concentrations have been detected
in many drinking water wells in PEI, and have been
primarily associated with intensive potato production
(Jiang and Somers 2009). Nitrate contamination has
become a major concern for drinking water quality
protection (Commission on Nitrates in Groundwater
in PEI 2008). Groundwater contributes to as much as
about 65% of annual stream flow in a typical stream in
PEI (Jiang et al. 2004), and nitrate-enriched ground-
water discharges to the local streams and associated
estuaries, leading to nitrate enrichment of surface
water. Elevated nitrate in surface water has been
suggested as one of the factors implicated with the
anoxia events prevailing in some estuaries in PEI
(Young et al. 2002). Nitrate contamination of ground-
water is thus of concern for aquatic ecosystem health.
Knowledge of the effect of different cropping prac-
tices on nitrate leaching to groundwater and associ-
ated surface water, which is essential for prescribing
remediation actions, is lacking.
Knowledge of the effects of the processes and
parameters on nitrate leaching is required for efficient
targeting of restoration and management actions and
prescribing restoration and management techniques
(Jorgensen 2002). Nitrate leaching from cropland
is governed by coupled processes and parameters
(Rodriguez et al. 2005). Many physical, chemical and
biological processes affecting soil N transformations
and transport can occur simultaneously; consequently,
prediction of soil N dynamics requires an explicit,
computer-based model (Addiscott and Whitmore
1991). Field research experimentation alone that
isolates processes for study has a difficult or impossible
task in quantifying the impacts of each process or
parameter on the measurements (for example, nitrate
concentration) (Shaffer 1995; Jego et al. 2008).
However, the information from field experiments is
essential for model calibration and verification. Joint
use of field experiments and models will help obtain a
more complete understanding of soil N dynamics and
allow extrapolation of the findings in time and space
(Peralta and Stockle 2001). Extensive and intensive
data requirements render model applications to routine
management practices challenging (Shaffer 1995).
Nutr Cycl Agroecosyst
123
LEACHN has been tested against many field
measured data sets, with varying degrees of success.
Sogbedji et al. (2001, 2006) modeled N dynamics
under corn and concluded that using LEACHN to
predict N dynamics appears feasible when appropriate
calibrations are performed and N transformation rate
constants were similar or close to those used in other
model simulations. Jemison et al. (1994) evaluated
LEACHN by simulating nitrate leaching from N-fer-
tilized and manured corn, and concluded the model
produced reasonably accurate predictions of nitrate
mass leached when properly calibrated; however,
tended to overestimate summer and underestimate
spring nitrate leaching losses. They attributed the
discrepancy to limitations in simulation of dual-pore
water flow in the soil and to insufficient representation
of crop growth. The limitations of LEACHM in
addressing the effects of macro pore flow on solute
transport were also noted by Mutch et al. (1992) and
Nolan et al. (2005). Jabro et al. (1995) evaluated
LEACHN using field data from a 5-year nitrate
leaching experiment for N-fertilized and manured
corn in central Pennsylvania, USA, and Jabro et al.
(2006) compared the accuracy and performance of
LEACHN against SOILN and NCSWAP for predict-
ing nitrate losses under corn. They concluded that
LEACHN has the potential to adequately predict
nitrate leaching under field conditions, and that much
of the simulation error in some treatments appeared to
be related to the model sub-routines controlling soil N
transformation processes and their rate constants.
These studies demonstrated that LEACHN can poten-
tially be used to predict nitrate leaching from soil–
plant-water systems if properly calibrated and verified,
and provided care is taken to address model limitations
and uncertainties. Use of LEACHN for modeling
nitrate leaching from potato production systems has
not been reported yet.
In this study, LEACHN was employed to simulate
nitrate leaching from a typical potato production
system in PEI. Specific objectives were to: (1)
evaluate the performance of LEACHN on predicting
drainage using long-term water table measurements
through coupled LEACHN and MODFLOW model-
ing: (2) calibrate the LEACHN model against mea-
sured nitrate concentrations from a tile drain leaching
experiment of potato grown in rotation with barley and
red clover conducted in PEI from 1999 to 2003: (3)
verify the model against independent measured nitrate
concentrations from a second leaching experiment of
potato grown in rotation with barley and red clover
performed at the same site between 2006 and 2008:
and (4) utilize model simulations to understand the
timing, magnitude and controls of nitrate leaching
from typical potato production systems in PEI. This
modeling exercise will evaluate if LEACHN can be
used to predict nitrate loads to groundwater from
potato production systems for nitrate fate and transport
modeling in PEI to assist in guiding local water quality
restoration planning.
Materials and methods
LEACHN
LEACHM is a deterministic one-dimensional model
that simulates flow and solute transport in the unsat-
urated zone (Hutson 2003). LEACHN is the version of
LEACHM developed for simulating N dynamics. The
code includes subroutines to calculate water flow,
nitrate leaching, evapotranspiration, heat transfer, N
and carbon transformations and crop N uptake.
Water flow in LEACHN is simulated by solution of
the Richards’ equation. The empirical water retention
equations of Campbell (1974) and Hutson and Cass
(1987) are used to define hydraulic conductivity.
Hydraulic properties of soil can also be estimated from
pedotransfer functions based on bulk density, organic
matter content and soil particle size information
(Hutson 2003). The transport of inorganic N species
(urea, ammonium and nitrate) in the soil is assumed
following the convection–dispersion process. Organic
N in the soil is divided into plant residue, manure and
soil humus, each of which is defined in terms of C/N
ratios. LEACHN uses adaptations of the concepts and
equations similar to Johnsson et al. (1987) to represent
the transformation of, and the fluxes of N among, the
three organic N pools and three inorganic N pools.
Mineralization of the organic pools is assumed to
follow first-order rate processes. Nitrification pro-
ceeds at a potential rate, decreasing as a maximum
NO3-/NH4
? concentration ratio is approached. Deni-
trification follows Michaelis–Menten kinetics. The
rate constants of N transformations are adjusted for
temperature (Q10 temperature response) and water
content. Crop N uptake is calculated using the method
of Watts and Hanks (1978). Annual N uptake by crop
Nutr Cycl Agroecosyst
123
uptake from emergence to harvest is an input require-
ment, and sets the maximum simulated N uptake.
Field experiments
Leaching experiments were performed to evaluate N
losses from potato production systems at the Agricul-
ture and Agri-Food Canada Research Farm located at
Harrington, PEI (46�210N, 63� 90W) using a tile
drainage facility established in 1988. Experiments for
the period 1 April 1999 and 31 December 2008 were
selected for model calibration and verification. (Note
that nitrate concentration of tile drainage was not
available for the period 1 April 2004 and 31 March
2006). Experimental treatments were replicated three
times and included several cycles of potato (cultivar
Russet Burbank) grown in rotation with barley and red
clover (typical rotation in PEI) during the simulation
period. Cropping sequence and management practices
are described in Table 1. No irrigation was applied as
is common for this region. The soils were mainly
Charlottetown fine sandy loam, classified in the
Canadian soil classification system as Orthic Humo-
Ferric Podzols, with some Malpeque sandy loam,
classified as Gleyed Eluviated Drystic Brunisols,
present at lower elevations (MacDougall et al. 1988).
These soils are commonly used for potato production
in PEI.
The experimental facility consists of twelve
0.34–0.50 ha subsurface tile drained plots and a
discharge monitoring system as described by Milburn
and MacLeod (1991) and Milburn et al. (1997). All
plots are independently tiled with 10 cm diameter
drainage tiles located at approximately 85 cm depth.
Plots are hydrologically isolated with additional
drainage lines which collect and remove water at plot
boundaries. Each drainage plot had its own dedicated
tipping bucket to monitor flow and sample collection
system located in the heated discharge hut (Milburn
and MacLeod 1991). Automated water samplers ISCO
6712 (ISCO Inc. Lincoln, Nebraska) were used to
collect water samples from the tile lines daily. Tipping
bucket flow data were recorded by a CR10X Campbell
Scientific data logger (Campbell Scientific, Edmon-
ton, Alberta, Canada) via a magnetic relay switches
located on the tipping bucket gauge. During flow
events the ISCO 6712 samplers were programmed to
take one 250 ml sample per day from the water
discharged from the tile lines. During the period
selected for model calibration, samples were retrieved
on a weekly basis and stored at 3�C until analysis.
During the period used for model verification, every
24 days samples were transferred from samplers to
50 ml disposable centrifuge tubes and stored at 3�C
until analysis was performed. The samples collected
for model verification were automatically preserved
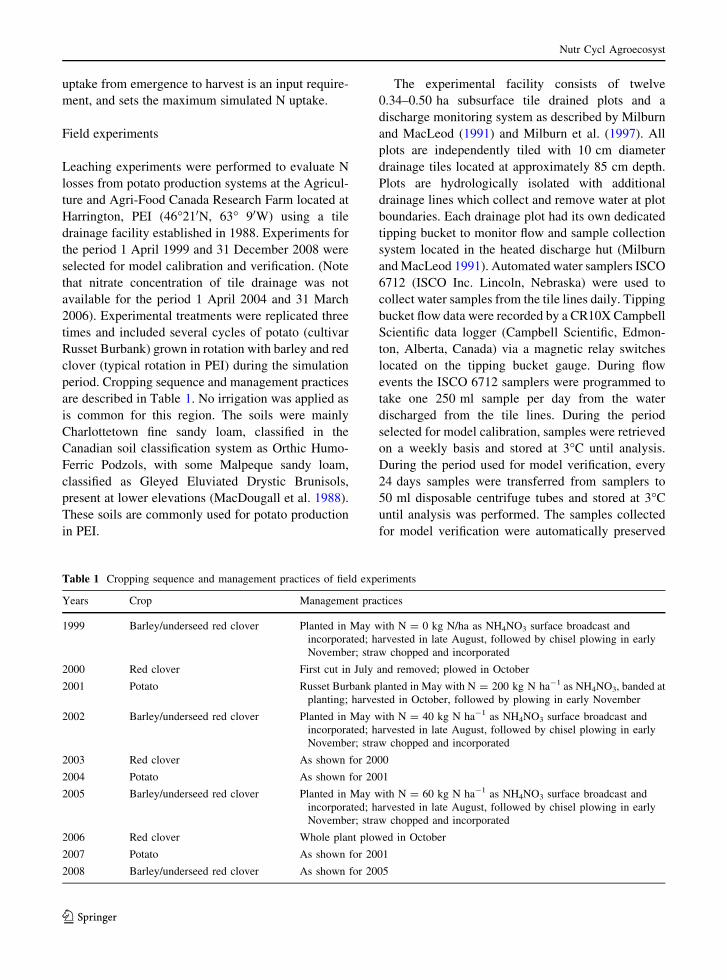
Table 1 Cropping sequence and management practices of field experiments
Years Crop Management practices
1999 Barley/underseed red clover Planted in May with N = 0 kg N/ha as NH4NO3 surface broadcast and
incorporated; harvested in late August, followed by chisel plowing in early
November; straw chopped and incorporated
2000 Red clover First cut in July and removed; plowed in October
2001 Potato Russet Burbank planted in May with N = 200 kg N ha-1 as NH4NO3, banded at
planting; harvested in October, followed by plowing in early November
2002 Barley/underseed red clover Planted in May with N = 40 kg N ha-1 as NH4NO3 surface broadcast and
incorporated; harvested in late August, followed by chisel plowing in early
November; straw chopped and incorporated
2003 Red clover As shown for 2000
2004 Potato As shown for 2001
2005 Barley/underseed red clover Planted in May with N = 60 kg N ha-1 as NH4NO3 surface broadcast and
incorporated; harvested in late August, followed by chisel plowing in early
November; straw chopped and incorporated
2006 Red clover Whole plant plowed in October
2007 Potato As shown for 2001
2008 Barley/underseed red clover As shown for 2005
Nutr Cycl Agroecosyst
123
using 200 ll concentrated sulfuric acid to lower the
pH of the water sample to below 2.0.
Water samples collected during 1 April 1999 and 16
December 2003 were analyzed for NO2--N ?NO3
--N
concentration using TRAACS 800 analyzer (BRAN ?
LUBBE Technicon Industrial Systems). Water samples
collected during 11 April 11 2006 and 1 June 2008 were
analyzed for NO2--N ? NO3
--N concentration as
described by QuickChem Method 10-107-04-1-A using
a Lachat QuickChem QC 8500 Automated Ion Analyzer
(Lachat Instruments Inc., Loveland, Co.).
In addition to monitoring daily nitrate concentra-
tions of tile drainage year round, soil nitrate concen-
trations were measured monthly from June to
November 2007 at soil depths of 0–15, 15–30 and
30–45 cm (average of four cores per plot). Soil
samples were extracted in 2 M KCl solution and
filtered. The filtrate was analyzed using QC 8500
Automatic Ion analyzer for nitrate concentration.
Measured nitrate concentrations of tile drainage
and soil served as targets for model calibration and
verification.
Soil properties and meteorological data
A soil column of 90 cm, which approximately equals
to the depth of the tile lines, was simulated in this
work, and the measured leached nitrate concentrations
from the tile lines were assumed comparable with the
simulated concentrations below this soil column. Soil
in the top 20 cm of the profile is well-drained and low
in organic matter (33–35 g kg-1) and the pH is
6.0–6.2 (Sanderson and MacLeod 1994). Below
20 cm, soil physical properties were derived from
local published sources (MacDougall et al. 1988;
Crowe and Mutch 1994; Mutch et al. 1992; Carter
et al. 1998). The values used for model input are listed
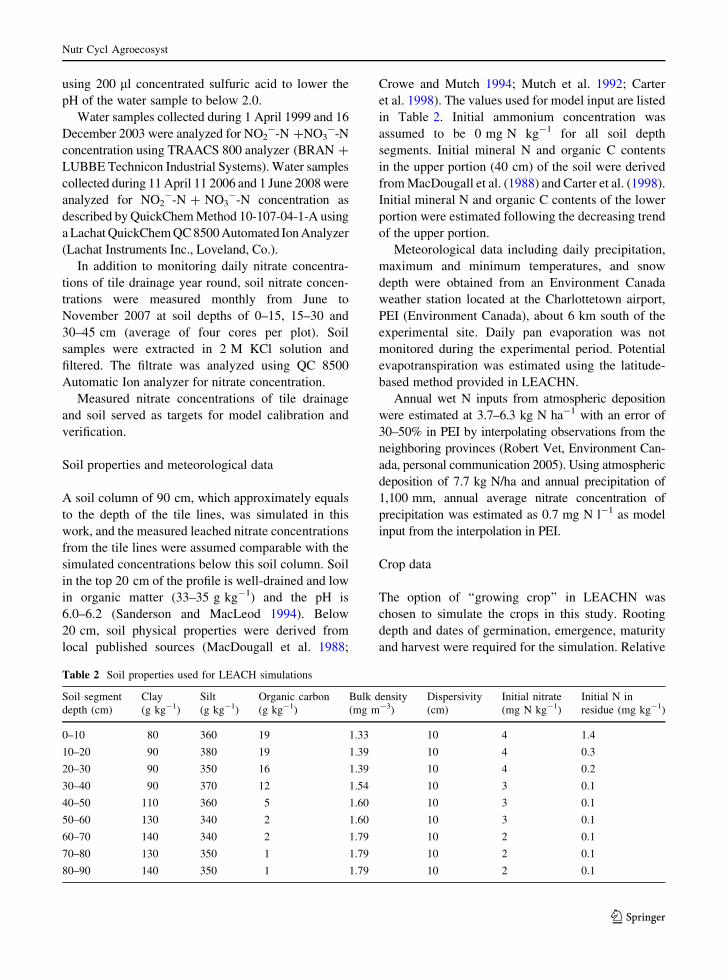
in Table 2. Initial ammonium concentration was
assumed to be 0 mg N kg-1 for all soil depth
segments. Initial mineral N and organic C contents
in the upper portion (40 cm) of the soil were derived
from MacDougall et al. (1988) and Carter et al. (1998).
Initial mineral N and organic C contents of the lower
portion were estimated following the decreasing trend
of the upper portion.
Meteorological data including daily precipitation,
maximum and minimum temperatures, and snow
depth were obtained from an Environment Canada
weather station located at the Charlottetown airport,
PEI (Environment Canada), about 6 km south of the
experimental site. Daily pan evaporation was not
monitored during the experimental period. Potential
evapotranspiration was estimated using the latitude-
based method provided in LEACHN.
Annual wet N inputs from atmospheric deposition
were estimated at 3.7–6.3 kg N ha-1 with an error of
30–50% in PEI by interpolating observations from the
neighboring provinces (Robert Vet, Environment Can-
ada, personal communication 2005). Using atmospheric
deposition of 7.7 kg N/ha and annual precipitation of
1,100 mm, annual average nitrate concentration of
precipitation was estimated as 0.7 mg N l-1 as model
input from the interpolation in PEI.
Crop data
The option of ‘‘growing crop’’ in LEACHN was
chosen to simulate the crops in this study. Rooting
depth and dates of germination, emergence, maturity
and harvest were required for the simulation. Relative
Table 2 Soil properties used for LEACH simulations
Soil segment
depth (cm)
Clay
(g kg-1)
Silt
(g kg-1)
Organic carbon
(g kg-1)
Bulk density
(mg m-3)
Dispersivity
(cm)
Initial nitrate
(mg N kg-1)
Initial N in
residue (mg kg-1)
0–10 80 360 19 1.33 10 4 1.4
10–20 90 380 19 1.39 10 4 0.3
20–30 90 350 16 1.39 10 4 0.2
30–40 90 370 12 1.54 10 3 0.1
40–50 110 360 5 1.60 10 3 0.1
50–60 130 340 2 1.60 10 3 0.1
60–70 140 340 2 1.79 10 2 0.1
70–80 130 350 1 1.79 10 2 0.1
80–90 140 350 1 1.79 10 2 0.1
Nutr Cycl Agroecosyst
123
root depth (Hutson 2003) for all crops was assumed to
be 0.7. The dates of germination, emergence, maturity
and harvest for barley and potato were based on
experimental records or local empirical data (Jerry
Ivany, personal communication 2008). The growth of
red clover was different from that of barley and potato
due to its perennial nature. In the first growing season,
red clover was under-seeded at the time of barley
seeding in the spring, and grew and established rapidly
after barley harvest in the autumn; the above-ground
plant subsequently died off and the root system was
dormant in the winter when air temperature dropped
below 0�C. In the second growing season, red clover
re-grew quickly in the spring when air temperature
rose above 0�C, and was cut and removed in 2000 and
2003 in late July (not cut in 2006); the residues in 2000
and 2003, or the whole plant in 2006, were plowed into
the soil in late October as a green manure. LEACHN
cannot simulate simultaneous growth of barley and
under-seeded red clover. The perennial growth of red
clover was simulated as two separate annual crops, and
the red clover was assumed to have limited N uptake
before barley harvest. Germination, emergence and
maturity of the of red clover in the first growing season
were assumed to occur on August 31, September 3 and
September 15, respectively (the assumed rapid growth
of red clover upon barley harvest was designed to
reflect that red clover started to grow from existing
small plants rather than seed) and the crop was
assumed to be dormant starting on December 2.
Germination, emergence and maturity of red clover in
the second growing season were assumed to occur on
April 5, April 7 and April 15, respectively (again, the
assumed rapid growth of red clover in the spring was
designed to reflect that red clover started to grow from
existing plant rather than seed) and the crop was cut
and harvested on August 3 in 2000 and 2003 (not cut in
2006) and was plowed on October 28.
Annual whole plant N uptake and N harvest index
for each crop were pre-requirements as model input
and were not fully measured during the experiments.
Annual average N uptakes and N harvest index
(N harvest fraction over N uptake) for potato were
calculated based on data (1999–2001) from experi-
ments performed in Fredericton, New Brunswick,
Canada (Zebarth et al. 2004). The C/N ratio in potato
residues recycled into the soil was based on Zebarth
(unpublished data). Annual average whole plant N
uptake and N harvest index for barley were calculated
based on Zebarth et al. (2004) and Zebarth et al.
(2005, 2007), respectively. Litter of barley was
subdivided into roots and residues, and the C/N ratios
for roots and residues were cited from Zebarth et al.
(2005) and Johnsson et al. (1987).
The N interactions between red clover, soil and air
are more complicated, and a full simulation of these
processes is beyond the scope of this work and
consequently simplifications were made for red clover
simulation. Crop N uptake from soil mineral N, N
fixation and harvest N by red clover for different
growth stages were estimated from empirical data
under normal conditions in Prince Edward Island and
New Brunswick, Canada (Mike Price, cereal and
forage specialist, New Brunswick Department of
Agriculture and Aquaculture, Canada, personal com-
munication 2008) and literature values. Red clover was
assumed to have a plant N accumulation of 200 kg N
ha-1 during the second growing season (annual forage
yield for red clover was estimated as 6,000–8,000
kg ha-1; average N concentration of about 28.8 mg N
kg-1), and the N accumulation for the first growing
season was estimated as 30 kg N ha-1 (15% of plant N
accumulation in the second growing season). The
assumed values for red clover were similar to the
measurements made by Papadopoulos et al. (2008) on
the study farm during another test. Total N uptake from
soil by red clover was assumed to be 105 kg N ha-1,
which was partitioned into 30 kg N ha-1 for the first
growing season, 45 kg N ha-1 for the harvest and
30 kg N ha-1 at plowing. The red clover N recycled
back into the soil was estimated as 10 and 100 kg N
ha-1 (170 kg N ha-1 if not subject to first harvest and
removal) at the end of the first growing season and at
plowing, respectively. The first harvest removed
120 kg N ha-1. The assumed fraction of N fixation
(54%) fell in the range of 40–100% of total plant N
reported by Carlsson and Huss-Danell (2003). The C/N
ratio of red clover was assumed as 15 (Zebarth,
unpublished). Note that N uptake, N harvest index and
N fixation fraction can vary widely and the above
values represented normal conditions or the most
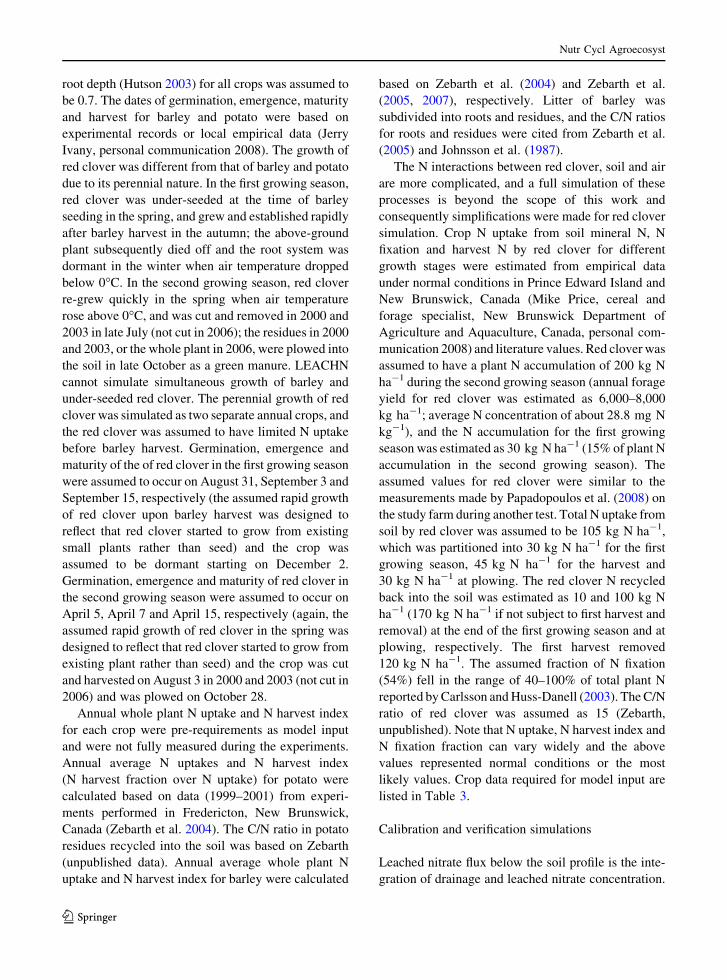
likely values. Crop data required for model input are
listed in Table 3.
Calibration and verification simulations
Leached nitrate flux below the soil profile is the inte-
gration of drainage and leached nitrate concentration.
Nutr Cycl Agroecosyst
123
Only if the model respects both the complete drainage
and observed nitrate concentration of tile drainage
below the soil profile within acceptable error ranges
for both the calibration and verification periods can it
be used for predicting nitrate leaching. Thus, testing
the performance of LEACHN on predicting both
drainage and leached nitrate concentration are essen-
tial for model calibration and verification.
Observed water table responses to simulated
drainage
Ideally, complete drainage measurements should be
used for testing the reliability of the model on
simulating drainage (Jemison et al. 1994; Jabro et al.
1995). However, the experiments at the study facility
during 1989–1992 showed annual tile-drain outflow
was only 71–152 mm, corresponding to 7.3–14.7% of
annual precipitation (1,056–1,232 mm) (Milburn
et al. 1997), which was significantly lower than
empirical groundwater recharge (i.e. 30–45% of
annual precipitation) in PEI (Francis 1989; Jiang
et al. 2004). This discrepancy was likely due to
drainage bypassing the tile drains. Furthermore, tile
drainage was not accurately monitored during some
periods of the experiments due to equipment
malfunction. For these reasons, the tile drainage
measurements were not used for model calibration
and verification in this study. Instead, predicted
drainage was fed into a groundwater flow model as
recharge, and simulated water table elevation was
compared with observed water table elevation as an
examination of the model’s performance on predicting
the drainage process. Normalized Root Mean Squared
of measured and calculated water table values (i.e.
RMS error divided by the difference between maxi-
mum and minimum observed water table values) was
calculated as a measurement of model fit.
The simulated soil column was partitioned into 9
segments with equal thickness of 10 cm in the model.
The lower boundary was set as free drainage. Soil
survey data (limited data points) from MacDougall
et al. (1988) were used to develop water retention
curves based on the water retention equations of
Campbell (1974) and Hutson and Cass (1987). Using
the water retention curve, the flow model failed to
produce any runoff, whereas surface runoff is known
to occur at this site. Therefore, this approach did not
appear to adequately characterize soil hydraulic
properties at this site. Instead, the particle size-based
Table 3 Fertilizer N application and crop parameters used for calibration and verification simulations
Crop N application
date
N application
(kg N ha-1)
N uptake
(kg N ha-1)
N harvest
index (%)aC/N ratio
in residue
C/N ratio
in root
Barley 0 68 41 60 25
Red clover Ib 0 30 0 15 15
Red clover IIb 0 45 69 15 15
Red clover IIIb 0 30 0 15 15
Potato 5/16/01 200 234 53 20 20
Barley 5/15/02 40 91 50 60 25
Red clover I 0 30 0 15 15
Red clover II 0 45 69 15 15
Red clover III 0 30 0 15 15
Potato 5/16/04 200 234 53 20 20
Barley 5/15/05 40 91 50 60 25
Red clover I 0 30 0 15 15
Red clover II 0 80 0 15 15
Potato 5/16/07 200 234 53 20 20
Barley 5/15/08 60 102 53 60 25
a N harvest index for red clover reflects the component of interaction between plant N and soil mineral N onlyb Red clover I, II and III refer to the period of red clover under seeded with barley to the end of the growing season, the period of re-
growing in the following season to the first cut in July and the period from the first cut to the plowing date in October respectively
Nutr Cycl Agroecosyst
123
regression model for predicting water retention curves
from particle size distribution, soil bulk density and
soil organic carbon proposed by Rawls and Brakensiek
(1985) was adopted. Simulation was performed for the
period from 1 April 1999 to 31 December 2008 with a
maximum time step of 0.1 days. The time series of
daily drainage predicted by LEACHN was then fed
into the groundwater flow model as daily recharge.
Steady state simulation with a recharge rate of
440 mm year-1 (Jiang et al. 2004) across the model
domain served as initial conditions for transient
groundwater flow simulation. As a result, the transient
groundwater flow simulation covered a time period of
3,563 days (9 years and 8 months) with a uniform
time step of 1 day.
A regional MODFLOW model (McDonald et al.
1988) developed for evaluating the impacts of ground-
water extractions on stream flow (Jiang et al. 2004) was
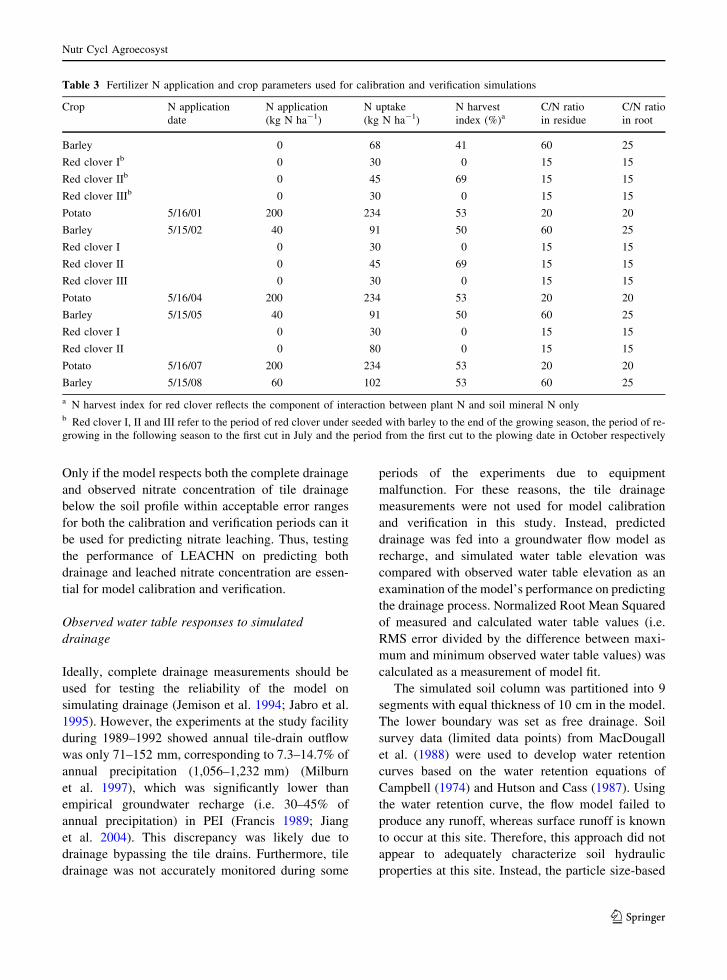
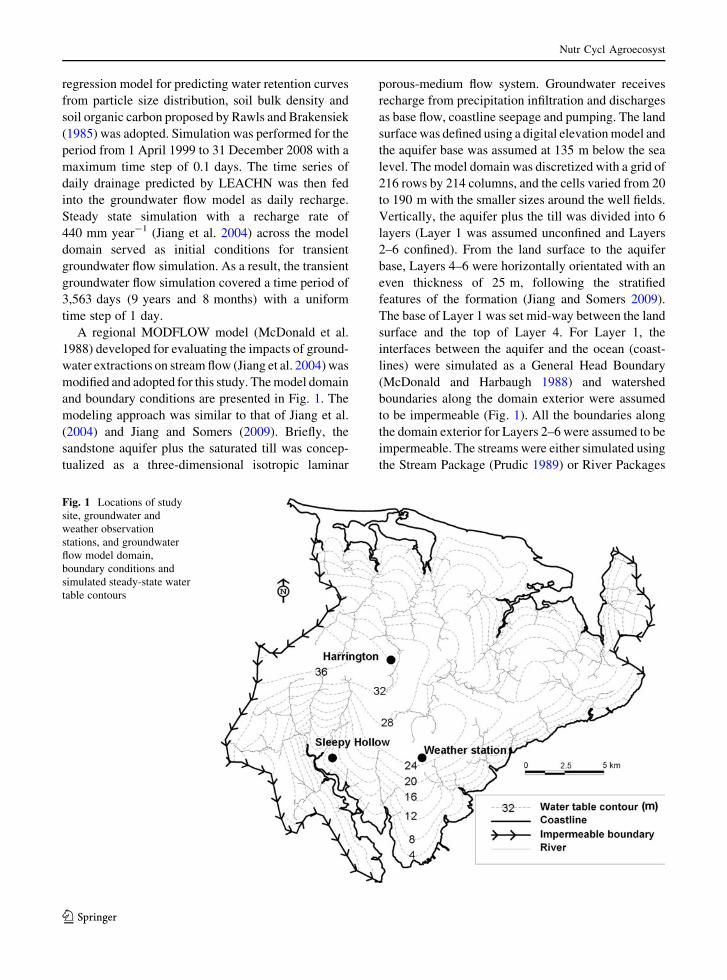
modified and adopted for this study. The model domain
and boundary conditions are presented in Fig. 1. The
modeling approach was similar to that of Jiang et al.
(2004) and Jiang and Somers (2009). Briefly, the
sandstone aquifer plus the saturated till was concep-
tualized as a three-dimensional isotropic laminar
porous-medium flow system. Groundwater receives
recharge from precipitation infiltration and discharges
as base flow, coastline seepage and pumping. The land
surface was defined using a digital elevation model and
the aquifer base was assumed at 135 m below the sea
level. The model domain was discretized with a grid of
216 rows by 214 columns, and the cells varied from 20
to 190 m with the smaller sizes around the well fields.
Vertically, the aquifer plus the till was divided into 6
layers (Layer 1 was assumed unconfined and Layers
2–6 confined). From the land surface to the aquifer
base, Layers 4–6 were horizontally orientated with an
even thickness of 25 m, following the stratified
features of the formation (Jiang and Somers 2009).
The base of Layer 1 was set mid-way between the land
surface and the top of Layer 4. For Layer 1, the
interfaces between the aquifer and the ocean (coast-
lines) were simulated as a General Head Boundary
(McDonald and Harbaugh 1988) and watershed
boundaries along the domain exterior were assumed
to be impermeable (Fig. 1). All the boundaries along
the domain exterior for Layers 2–6 were assumed to be
impermeable. The streams were either simulated using
the Stream Package (Prudic 1989) or River Packages
Fig. 1 Locations of study
site, groundwater and
weather observation
stations, and groundwater
flow model domain,
boundary conditions and
simulated steady-state water
table contours
Nutr Cycl Agroecosyst
123
(McDonald and Harbaugh 1988). Hydraulic properties
were similar to those in Jiang et al. (2004) and Jiang
and Somers (2009). Hydraulic and geometric param-
eters of each model layer are listed in Table 4.
On-site water table measurements were not made
during the tests. However, daily water table elevation
was recorded using down-hole transducer (Minitroll,
In Situ Inc.) at Sleepy Hollow (63� 1201200; 46� 170800)located 7.8 km southwest of the study site (PEIEEF)
(Fig. 1). PEI is entirely underlain with a terrestrial
sandstone formation (known as ‘‘red beds’’) with
unknown thickness. The formation is overlain by a thin
veneer of till (5–10 m). The upper portion (0–200 m)
of the formation plus the saturated till forms the
unconfined and semi-confined aquifer (Jiang and
Somers 2009). Soil was derived from local till. The
relatively uniform hydrogeology and soil across the
island render water table measurements a few kilome-
ters away as relevant for coupled simulation of soil and
groundwater flows. Water table elevation was shallow,
varying from 1.7 to 4.1 m below the ground surface,
and was not influenced by pumping. By estimation,
drainage below the soil profile should reach the
shallow water table within a very short period of time.
Measured and simulated nitrate concentrations
Testing the performance of the model on simulating
leached nitrate concentration proceeded upon the flow
model calibration. The measured nitrate concentra-
tions of tile drainage during 1 April 1999 to 31 March
2006 were compared with the simulations for calibra-
tion purposes. Ammonia volatilization from the soil
surface was assumed to be negligible because fertilizer
N was banded for potato crop, and broadcast for barley
on moist soil and incorporated within a few hours.
Initial potential nitrification rate for ammonium was
estimated to have a half life of 40–80 days based on the
results of Zebarth and Milburn (2003). The values of
the other N transformation parameters were initially set
to the values specified in the input file of the example
provided with the LEACHN codes. The N transforma-
tion constants were optimized until the model fit as
measured using the normalized Root Mean Squared of
measured and calculated leached nitrate concentra-
tions was not further improved, taking into account the
N transformation parameters used by Johnsson et al.
(1987), and given the objectives of minimizing the
differences between simulated and observed nitrate
concentrations of drainage water and soil.
The calibrated model was verified using an indepen-
dent data set from the leaching experiment conducted
during 1 April 2006 to 31 April 2008. Soil properties,
hydraulic properties and N transformation parameters
were kept unchanged from model calibration, and the
parameters of management, meteorology and crop were
adjusted to reflect the experimental conditions. Simu-
lations were compared with the measurements of daily
nitrate concentrations of tile drainage and soil nitrate
concentrations at three depths (0–15, 15–30 and
30–45 cm) for the period May and November 2007.
Again, normalized Root Mean Squared of measured and
calculated leached nitrate concentrations was computed
as a measurement of model fit.
Long-term simulations of nitrate leaching
from conventional potato production systems
The verified LEACHN model was utilized to evaluate
the influences of weather conditions and fertilizer N
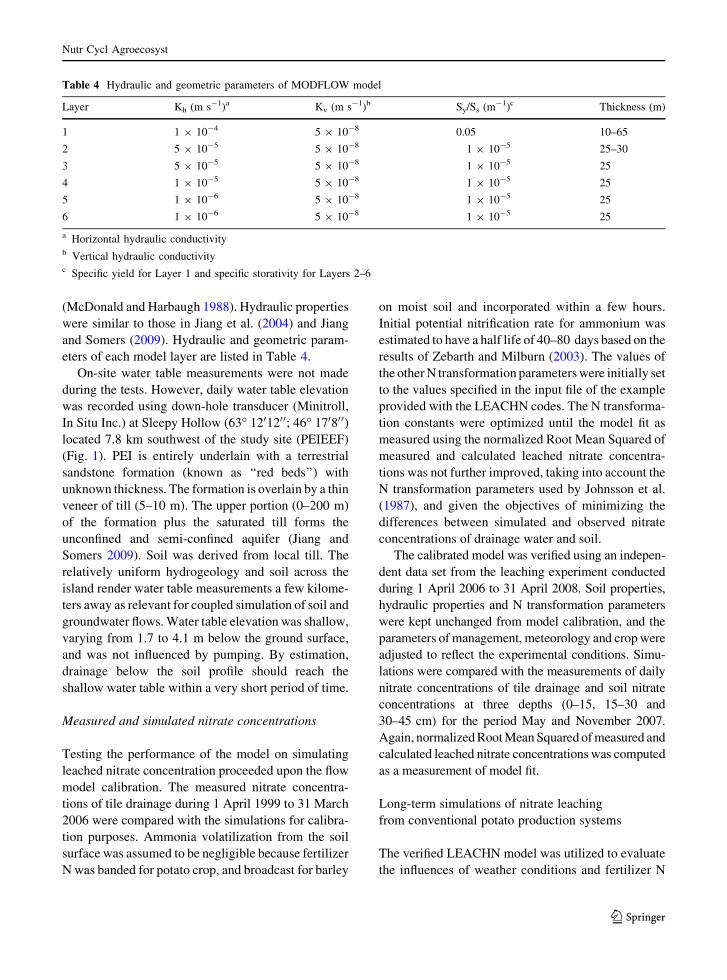
Table 4 Hydraulic and geometric parameters of MODFLOW model
Layer Kh (m s-1)a Kv (m s-1)b Sy/Ss (m-1)c Thickness (m)
1 1 9 10-4 5 9 10-8 0.05 10–65
2 5 9 10-5 5 9 10-8 1 9 10-5 25–30
3 5 9 10-5 5 9 10-8 1 9 10-5 25
4 1 9 10-5 5 9 10-8 1 9 10-5 25
5 1 9 10-6 5 9 10-8 1 9 10-5 25
6 1 9 10-6 5 9 10-8 1 9 10-5 25
a Horizontal hydraulic conductivityb Vertical hydraulic conductivityc Specific yield for Layer 1 and specific storativity for Layers 2–6
Nutr Cycl Agroecosyst
123
rate for the potato crop on nitrate leaching from a
conventional potato rotation in PEI. This was achieved
through a simulation conducted for multiple cycles of
a barley–red clover–potato rotation receiving recom-
mended fertilizer N rates for potato, barley and red
clover of 200, 60 and 0 kg N ha-1, respectively, over
the period of 1 April 1988 and 31 December 2008.
Specifically, soil properties, hydraulic properties and
N transformation parameters from the verified model
were used; parameters of management and N appli-
cation representing conventional potato practices in
PEI were applied over the simulation period (Tables 5,
6); and meteorology data were again derived from
Environment Canada weather station at the Charlotte-
town Airport. Since meteorological parameters (pre-
cipitation and air temperature) varied and all the other
model inputs were kept constant, comparison of nitrate
leaching under different weather conditions will
demonstrate the effects of weather on nitrate leaching.
In addition, simulations using fertilizer N rates of 0,
50, 100 and 150 kg N ha-1 for the potato crop,
holding N management for the barley and red clover
crops constant (i.e. 60 and 0 kg N ha-1 for barley and
red clover respectively), were also performed follow-
ing a similar approach over the same simulation period
described above. Estimates of annual nitrate leaching
from the potato and rotation crop phases were taken to
be for the period of May in the year until April of the
subsequent year for each fertilizer N rate scenario.
Comparing annual nitrate leaching under different
fertilizer N rate scenarios for potato will evidence the
effects of fertilizer N rate for potato crop on nitrate
leaching.
Results and discussion
Flow simulations
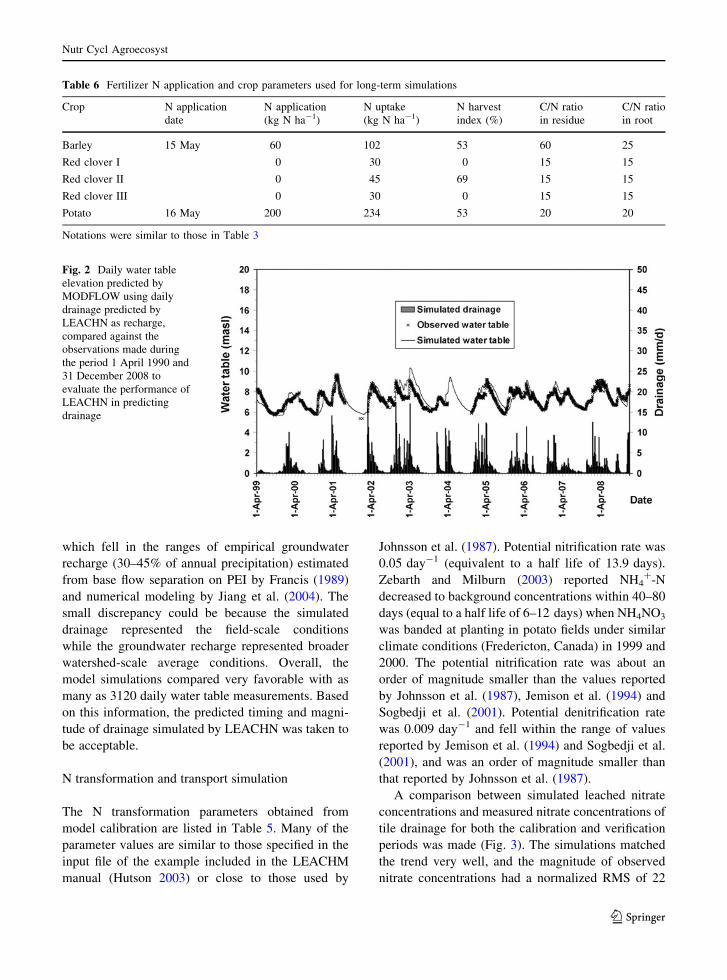
A comparison was made between observed water table
elevation (some missing measurements were due to
equipment malfunction) and simulated water table
elevation over a time period of 9 years plus 8 months
with a uniform time step of 1 day (Fig. 2). A glance at
Fig. 2 suggested that the simulated water table eleva-
tion based on predicted drainage as daily recharge
closely followed the observed fluctuation of the water
table most of the time, and the simulated magnitude of
water table matched the observations with a Normal-
ized RMS of 13%. Observed changes in water table
elevation were well synchronized with predicted
drainage, rising with high predicted drainage and
declining with low or zero predicted drainage (Fig. 2).
At the beginning of the simulation (spring 1999),
the simulated water table elevation was approximately
1 m lower than the observed value. This discrepancy
was due to the use of a steady state simulation of water
table elevation as the initial condition rather than the
water table of March (annual average is lower than the
water table in March due to snow melt recharge).
Simulated drainage and water table rise occurred a
few weeks later than was observed during the start of
some autumn drainage seasons (i.e. 2003 and 2005,
and to a lesser extent in 2006 and 2007). Simulations
based on possible ranges of soil hydraulic properties
could not fully eliminate the timing discrepancy
(results not presented). The discrepancy is likely
partially associated with the macropore flow in the
soil, a process which cannot be simulated by
LEACHN. The discrepancy may also reflect limita-
tions of LEACHN in representing a growing crop.
This discrepancy in timing is likely of limited
importance with respect to prediction of leaching
because it occurred only over a short period of time
compared with the whole drainage season. The model
predicted that annual drainage accounted for 36–55%
of annual precipitation within the simulation period,
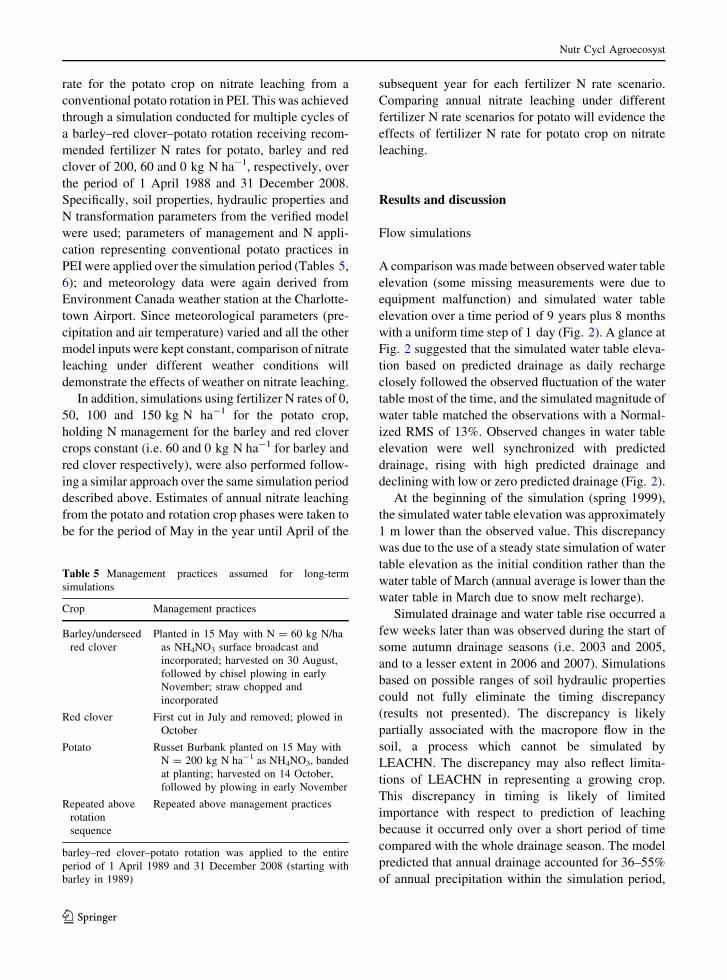
Table 5 Management practices assumed for long-term
simulations
Crop Management practices
Barley/underseed
red clover
Planted in 15 May with N = 60 kg N/ha
as NH4NO3 surface broadcast and
incorporated; harvested on 30 August,
followed by chisel plowing in early
November; straw chopped and
incorporated
Red clover First cut in July and removed; plowed in
October
Potato Russet Burbank planted on 15 May with
N = 200 kg N ha-1 as NH4NO3, banded
at planting; harvested on 14 October,
followed by plowing in early November
Repeated above
rotation
sequence
Repeated above management practices
barley–red clover–potato rotation was applied to the entire
period of 1 April 1989 and 31 December 2008 (starting with
barley in 1989)
Nutr Cycl Agroecosyst
123
which fell in the ranges of empirical groundwater
recharge (30–45% of annual precipitation) estimated
from base flow separation on PEI by Francis (1989)
and numerical modeling by Jiang et al. (2004). The
small discrepancy could be because the simulated
drainage represented the field-scale conditions
while the groundwater recharge represented broader
watershed-scale average conditions. Overall, the
model simulations compared very favorable with as
many as 3120 daily water table measurements. Based
on this information, the predicted timing and magni-
tude of drainage simulated by LEACHN was taken to
be acceptable.
N transformation and transport simulation
The N transformation parameters obtained from
model calibration are listed in Table 5. Many of the
parameter values are similar to those specified in the
input file of the example included in the LEACHM
manual (Hutson 2003) or close to those used by
Johnsson et al. (1987). Potential nitrification rate was
0.05 day-1 (equivalent to a half life of 13.9 days).
Zebarth and Milburn (2003) reported NH4?-N
decreased to background concentrations within 40–80
days (equal to a half life of 6–12 days) when NH4NO3
was banded at planting in potato fields under similar
climate conditions (Fredericton, Canada) in 1999 and
2000. The potential nitrification rate was about an
order of magnitude smaller than the values reported
by Johnsson et al. (1987), Jemison et al. (1994) and
Sogbedji et al. (2001). Potential denitrification rate
was 0.009 day-1 and fell within the range of values
reported by Jemison et al. (1994) and Sogbedji et al.
(2001), and was an order of magnitude smaller than
that reported by Johnsson et al. (1987).
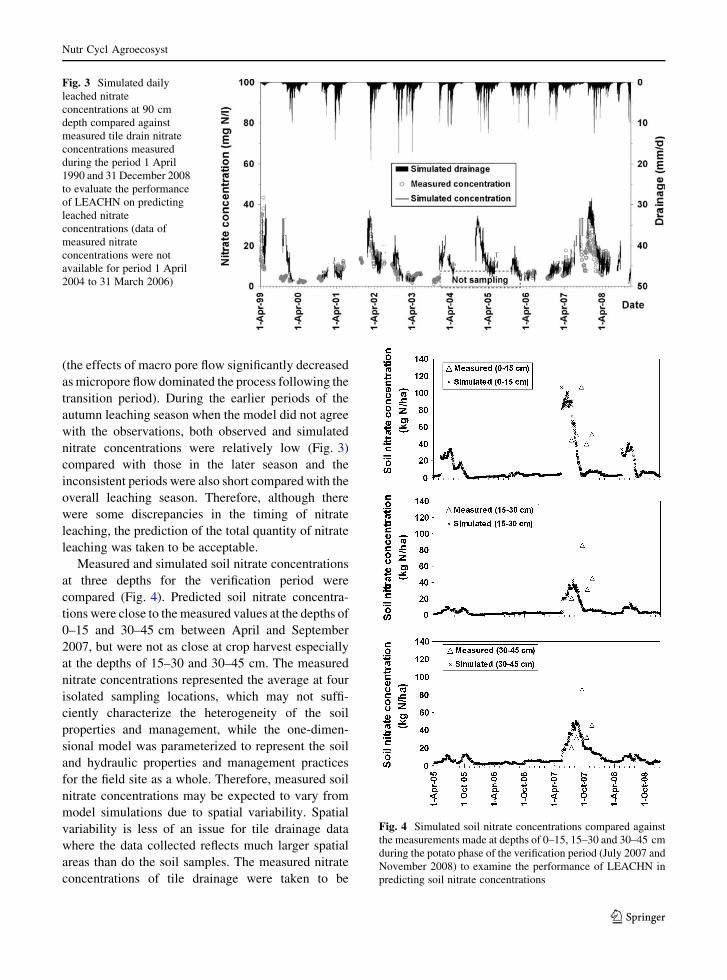
A comparison between simulated leached nitrate
concentrations and measured nitrate concentrations of
tile drainage for both the calibration and verification
periods was made (Fig. 3). The simulations matched
the trend very well, and the magnitude of observed
nitrate concentrations had a normalized RMS of 22
Table 6 Fertilizer N application and crop parameters used for long-term simulations
Crop N application
date
N application
(kg N ha-1)
N uptake
(kg N ha-1)
N harvest
index (%)
C/N ratio
in residue
C/N ratio
in root
Barley 15 May 60 102 53 60 25
Red clover I 0 30 0 15 15
Red clover II 0 45 69 15 15
Red clover III 0 30 0 15 15
Potato 16 May 200 234 53 20 20
Notations were similar to those in Table 3
Fig. 2 Daily water table
elevation predicted by
MODFLOW using daily
drainage predicted by
LEACHN as recharge,
compared against the
observations made during
the period 1 April 1990 and
31 December 2008 to
evaluate the performance of
LEACHN in predicting
drainage
Nutr Cycl Agroecosyst
123
and 27% during the calibration and verification
periods, respectively. The fit is particularly good
given that average crop N uptake and N harvest
information was used instead of experimental mea-
surements. Note that the simulated concentrations
represented leached concentrations below a 90-cm soil
profile, which were expected to be slightly different
from the observed concentrations integrated from
leached concentrations within the experimental plots.
The exception was that the model did not predict
drainage and associated nitrate leaching while the
tile drain produced drainage and associated nitrate
leaching during some early periods of the autumn
leaching season (10–30 October 2000, 23 November
to 4 December 2002, and 27 October to 13 December
2003). Thus, similar to drainage, the model predicted
nitrate leaching to occur a few weeks earlier compared
with tile drainage measurements during some periods
at the start of the autumn drainage seasons. Similar to
drainage, this discrepancy could not be eliminated
through modification of soil and crop model input
parameters (data not presented). This discrepancy is
likely also partially due to macropore flow in the soil
profile which the LEACHN model could not represent
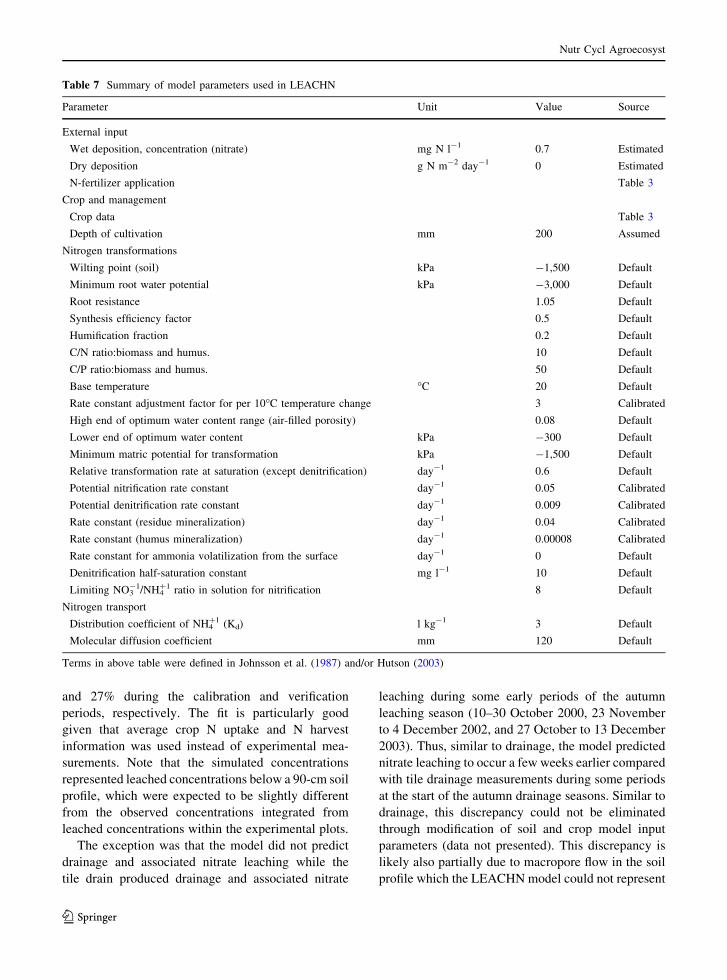
Table 7 Summary of model parameters used in LEACHN
Parameter Unit Value Source
External input
Wet deposition, concentration (nitrate) mg N l-1 0.7 Estimated
Dry deposition g N m-2 day-1 0 Estimated
N-fertilizer application Table 3
Crop and management
Crop data Table 3
Depth of cultivation mm 200 Assumed
Nitrogen transformations
Wilting point (soil) kPa -1,500 Default
Minimum root water potential kPa -3,000 Default
Root resistance 1.05 Default
Synthesis efficiency factor 0.5 Default
Humification fraction 0.2 Default
C/N ratio:biomass and humus. 10 Default
C/P ratio:biomass and humus. 50 Default
Base temperature �C 20 Default
Rate constant adjustment factor for per 10�C temperature change 3 Calibrated
High end of optimum water content range (air-filled porosity) 0.08 Default
Lower end of optimum water content kPa -300 Default
Minimum matric potential for transformation kPa -1,500 Default
Relative transformation rate at saturation (except denitrification) day-1 0.6 Default
Potential nitrification rate constant day-1 0.05 Calibrated
Potential denitrification rate constant day-1 0.009 Calibrated
Rate constant (residue mineralization) day-1 0.04 Calibrated
Rate constant (humus mineralization) day-1 0.00008 Calibrated
Rate constant for ammonia volatilization from the surface day-1 0 Default
Denitrification half-saturation constant mg l-1 10 Default
Limiting NO3-1/NH4
?1 ratio in solution for nitrification 8 Default
Nitrogen transport
Distribution coefficient of NH4?1 (Kd) l kg-1 3 Default
Molecular diffusion coefficient mm 120 Default
Terms in above table were defined in Johnsson et al. (1987) and/or Hutson (2003)
Nutr Cycl Agroecosyst
123
(the effects of macro pore flow significantly decreased
as micropore flow dominated the process following the
transition period). During the earlier periods of the
autumn leaching season when the model did not agree
with the observations, both observed and simulated
nitrate concentrations were relatively low (Fig. 3)
compared with those in the later season and the
inconsistent periods were also short compared with the
overall leaching season. Therefore, although there
were some discrepancies in the timing of nitrate
leaching, the prediction of the total quantity of nitrate
leaching was taken to be acceptable.
Measured and simulated soil nitrate concentrations
at three depths for the verification period were
compared (Fig. 4). Predicted soil nitrate concentra-
tions were close to the measured values at the depths of
0–15 and 30–45 cm between April and September
2007, but were not as close at crop harvest especially
at the depths of 15–30 and 30–45 cm. The measured
nitrate concentrations represented the average at four
isolated sampling locations, which may not suffi-
ciently characterize the heterogeneity of the soil
properties and management, while the one-dimen-
sional model was parameterized to represent the soil
and hydraulic properties and management practices
for the field site as a whole. Therefore, measured soil
nitrate concentrations may be expected to vary from
model simulations due to spatial variability. Spatial
variability is less of an issue for tile drainage data
where the data collected reflects much larger spatial
areas than do the soil samples. The measured nitrate
concentrations of tile drainage were taken to be
Fig. 3 Simulated daily
leached nitrate
concentrations at 90 cm
depth compared against
measured tile drain nitrate
concentrations measured
during the period 1 April
1990 and 31 December 2008
to evaluate the performance
of LEACHN on predicting
leached nitrate
concentrations (data of
measured nitrate
concentrations were not
available for period 1 April
2004 to 31 March 2006)
Fig. 4 Simulated soil nitrate concentrations compared against
the measurements made at depths of 0–15, 15–30 and 30–45 cm
during the potato phase of the verification period (July 2007 and
November 2008) to examine the performance of LEACHN in
predicting soil nitrate concentrations
Nutr Cycl Agroecosyst
123
comparable with simulated nitrate leaching. A larger
number of soil samples may be required to develop
average soil nitrate concentrations suitable for model
comparison purposes.
Based on the above discussions, it can be concluded
that LEACHN can be an effective tool to predict
nitrate leaching from similar cropping systems in PEI.
Timing, magnitude and controls of N leaching
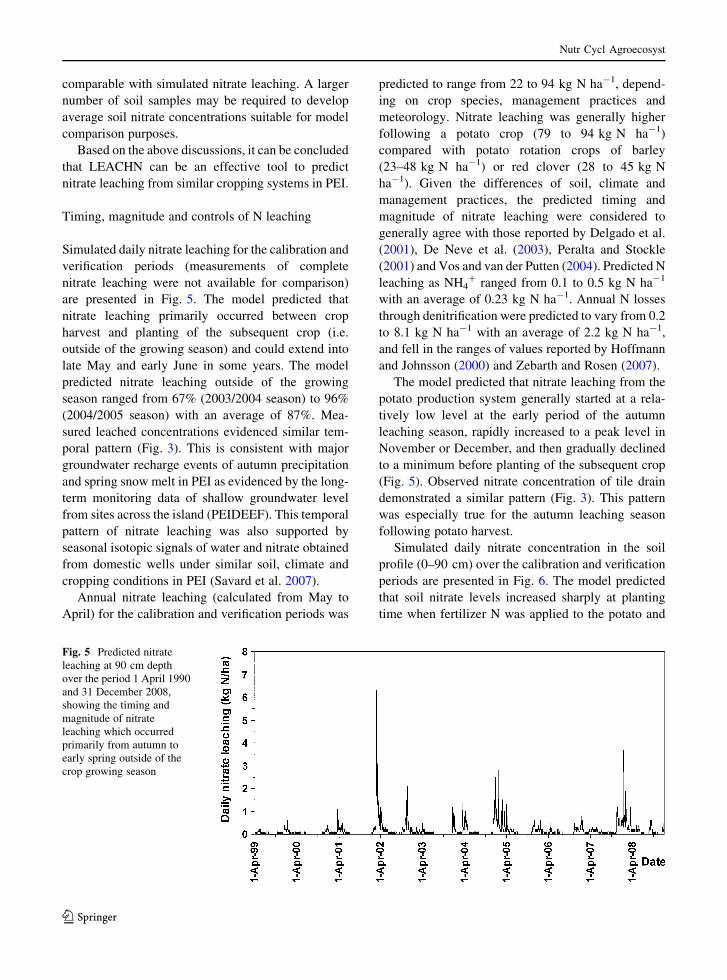
Simulated daily nitrate leaching for the calibration and
verification periods (measurements of complete
nitrate leaching were not available for comparison)
are presented in Fig. 5. The model predicted that
nitrate leaching primarily occurred between crop
harvest and planting of the subsequent crop (i.e.
outside of the growing season) and could extend into
late May and early June in some years. The model
predicted nitrate leaching outside of the growing
season ranged from 67% (2003/2004 season) to 96%
(2004/2005 season) with an average of 87%. Mea-
sured leached concentrations evidenced similar tem-
poral pattern (Fig. 3). This is consistent with major
groundwater recharge events of autumn precipitation
and spring snow melt in PEI as evidenced by the long-
term monitoring data of shallow groundwater level
from sites across the island (PEIDEEF). This temporal
pattern of nitrate leaching was also supported by
seasonal isotopic signals of water and nitrate obtained
from domestic wells under similar soil, climate and
cropping conditions in PEI (Savard et al. 2007).
Annual nitrate leaching (calculated from May to
April) for the calibration and verification periods was
predicted to range from 22 to 94 kg N ha-1, depend-
ing on crop species, management practices and
meteorology. Nitrate leaching was generally higher
following a potato crop (79 to 94 kg N ha-1)
compared with potato rotation crops of barley
(23–48 kg N ha-1) or red clover (28 to 45 kg N
ha-1). Given the differences of soil, climate and
management practices, the predicted timing and
magnitude of nitrate leaching were considered to
generally agree with those reported by Delgado et al.
(2001), De Neve et al. (2003), Peralta and Stockle
(2001) and Vos and van der Putten (2004). Predicted N
leaching as NH4? ranged from 0.1 to 0.5 kg N ha-1
with an average of 0.23 kg N ha-1. Annual N losses
through denitrification were predicted to vary from 0.2
to 8.1 kg N ha-1 with an average of 2.2 kg N ha-1,
and fell in the ranges of values reported by Hoffmann
and Johnsson (2000) and Zebarth and Rosen (2007).
The model predicted that nitrate leaching from the
potato production system generally started at a rela-
tively low level at the early period of the autumn
leaching season, rapidly increased to a peak level in
November or December, and then gradually declined
to a minimum before planting of the subsequent crop
(Fig. 5). Observed nitrate concentration of tile drain
demonstrated a similar pattern (Fig. 3). This pattern
was especially true for the autumn leaching season
following potato harvest.
Simulated daily nitrate concentration in the soil
profile (0–90 cm) over the calibration and verification
periods are presented in Fig. 6. The model predicted
that soil nitrate levels increased sharply at planting
time when fertilizer N was applied to the potato and
Fig. 5 Predicted nitrate
leaching at 90 cm depth
over the period 1 April 1990
and 31 December 2008,
showing the timing and
magnitude of nitrate
leaching which occurred
primarily from autumn to
early spring outside of the
crop growing season
Nutr Cycl Agroecosyst
123
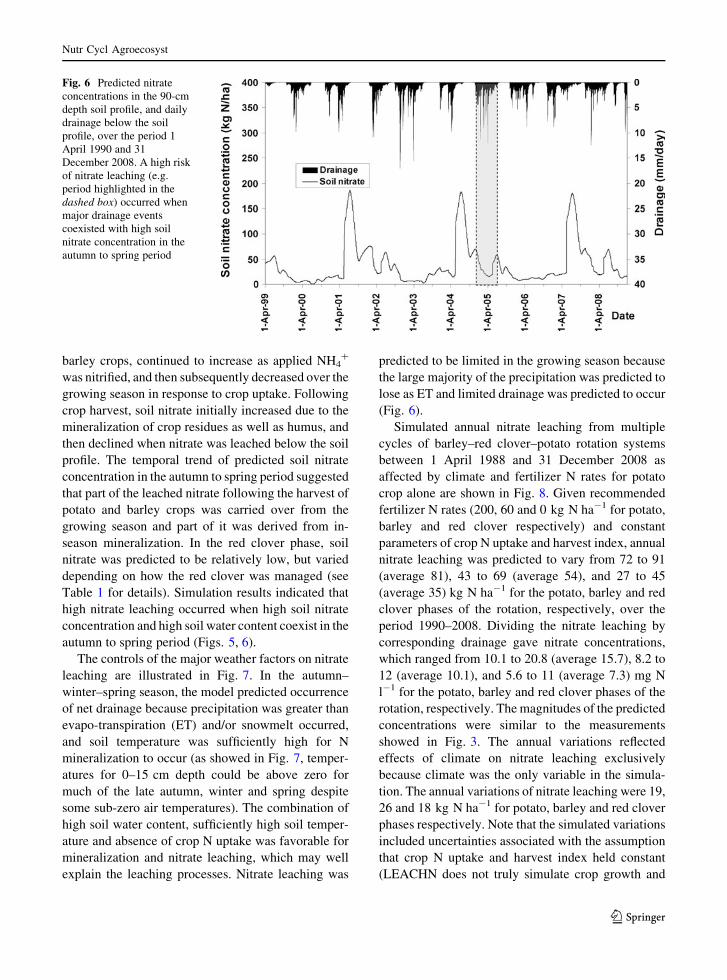
barley crops, continued to increase as applied NH4?
was nitrified, and then subsequently decreased over the
growing season in response to crop uptake. Following
crop harvest, soil nitrate initially increased due to the
mineralization of crop residues as well as humus, and
then declined when nitrate was leached below the soil
profile. The temporal trend of predicted soil nitrate
concentration in the autumn to spring period suggested
that part of the leached nitrate following the harvest of
potato and barley crops was carried over from the
growing season and part of it was derived from in-
season mineralization. In the red clover phase, soil
nitrate was predicted to be relatively low, but varied
depending on how the red clover was managed (see
Table 1 for details). Simulation results indicated that
high nitrate leaching occurred when high soil nitrate
concentration and high soil water content coexist in the
autumn to spring period (Figs. 5, 6).
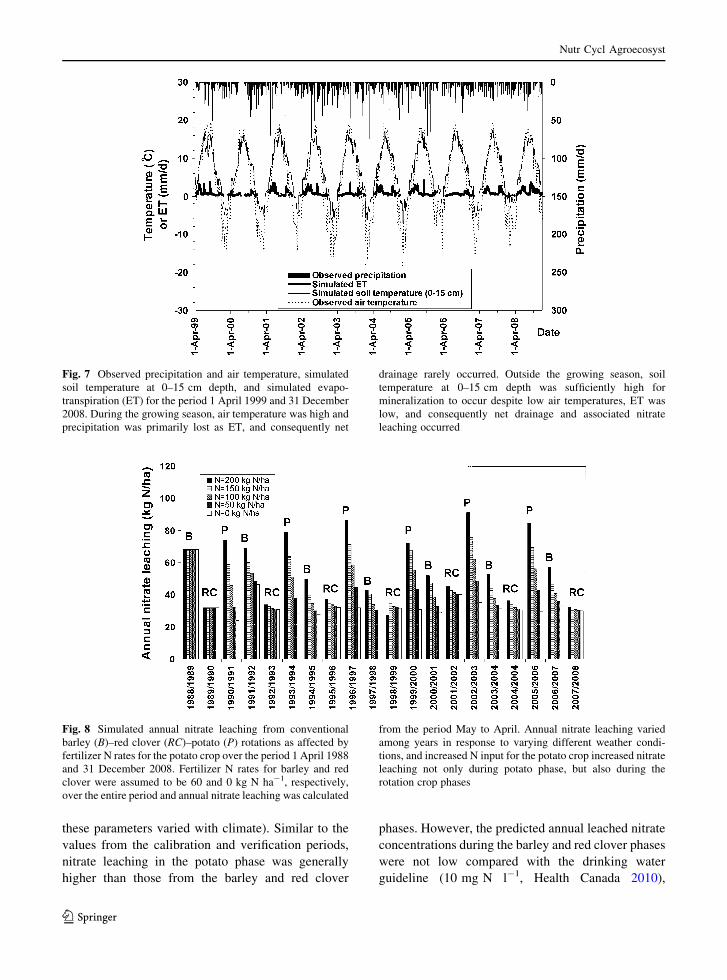
The controls of the major weather factors on nitrate
leaching are illustrated in Fig. 7. In the autumn–
winter–spring season, the model predicted occurrence
of net drainage because precipitation was greater than
evapo-transpiration (ET) and/or snowmelt occurred,
and soil temperature was sufficiently high for N
mineralization to occur (as showed in Fig. 7, temper-
atures for 0–15 cm depth could be above zero for
much of the late autumn, winter and spring despite
some sub-zero air temperatures). The combination of
high soil water content, sufficiently high soil temper-
ature and absence of crop N uptake was favorable for
mineralization and nitrate leaching, which may well
explain the leaching processes. Nitrate leaching was
predicted to be limited in the growing season because
the large majority of the precipitation was predicted to
lose as ET and limited drainage was predicted to occur
(Fig. 6).
Simulated annual nitrate leaching from multiple
cycles of barley–red clover–potato rotation systems
between 1 April 1988 and 31 December 2008 as
affected by climate and fertilizer N rates for potato
crop alone are shown in Fig. 8. Given recommended
fertilizer N rates (200, 60 and 0 kg N ha-1 for potato,
barley and red clover respectively) and constant
parameters of crop N uptake and harvest index, annual
nitrate leaching was predicted to vary from 72 to 91
(average 81), 43 to 69 (average 54), and 27 to 45
(average 35) kg N ha-1 for the potato, barley and red
clover phases of the rotation, respectively, over the
period 1990–2008. Dividing the nitrate leaching by
corresponding drainage gave nitrate concentrations,
which ranged from 10.1 to 20.8 (average 15.7), 8.2 to
12 (average 10.1), and 5.6 to 11 (average 7.3) mg N
l-1 for the potato, barley and red clover phases of the
rotation, respectively. The magnitudes of the predicted
concentrations were similar to the measurements
showed in Fig. 3. The annual variations reflected
effects of climate on nitrate leaching exclusively
because climate was the only variable in the simula-
tion. The annual variations of nitrate leaching were 19,
26 and 18 kg N ha-1 for potato, barley and red clover
phases respectively. Note that the simulated variations
included uncertainties associated with the assumption
that crop N uptake and harvest index held constant
(LEACHN does not truly simulate crop growth and
Fig. 6 Predicted nitrate
concentrations in the 90-cm
depth soil profile, and daily
drainage below the soil
profile, over the period 1
April 1990 and 31
December 2008. A high risk
of nitrate leaching (e.g.
period highlighted in the
dashed box) occurred when
major drainage events
coexisted with high soil
nitrate concentration in the
autumn to spring period
Nutr Cycl Agroecosyst
123
these parameters varied with climate). Similar to the
values from the calibration and verification periods,
nitrate leaching in the potato phase was generally
higher than those from the barley and red clover
phases. However, the predicted annual leached nitrate
concentrations during the barley and red clover phases
were not low compared with the drinking water
guideline (10 mg N l-1, Health Canada 2010),
Fig. 7 Observed precipitation and air temperature, simulated
soil temperature at 0–15 cm depth, and simulated evapo-
transpiration (ET) for the period 1 April 1999 and 31 December
2008. During the growing season, air temperature was high and
precipitation was primarily lost as ET, and consequently net
drainage rarely occurred. Outside the growing season, soil
temperature at 0–15 cm depth was sufficiently high for
mineralization to occur despite low air temperatures, ET was
low, and consequently net drainage and associated nitrate
leaching occurred
Fig. 8 Simulated annual nitrate leaching from conventional
barley (B)–red clover (RC)–potato (P) rotations as affected by
fertilizer N rates for the potato crop over the period 1 April 1988
and 31 December 2008. Fertilizer N rates for barley and red
clover were assumed to be 60 and 0 kg N ha-1, respectively,
over the entire period and annual nitrate leaching was calculated
from the period May to April. Annual nitrate leaching varied
among years in response to varying different weather condi-
tions, and increased N input for the potato crop increased nitrate
leaching not only during potato phase, but also during the
rotation crop phases
Nutr Cycl Agroecosyst
123
suggesting that N management for nitrate leaching
reduction should be exercised not only during the
potato phase but also during the barley and clover
phases. Nitrate leaching from potato production
systems act as non-point source of contamination
and the risk of nitrate contamination to groundwater
and associated surface water increases proportionally
with increased area in potato production rotation
within a watershed. These levels of nitrate leaching
losses are therefore of concern for aquatic habitat
protections if the potato production systems occupy a
larger proportion of a watershed in PEI.
Comparing the predicted nitrate leaching under
different fertilizer N rate scenarios implied that nitrate
leaching was positively correlated with fertilizer N
inputs to the potato crop (Fig. 8). The simulations also
predicted increasing fertilizer N inputs to the potato
crop not only increased nitrate leaching in the potato
phase, but also increased nitrate leaching in barley and
red clover phases in most cases through changes in soil
mineralizable N pools. These findings suggested that
reducing N input to the potato crop is very critical for
minimizing nitrate leaching losses from the produc-
tion system.
Conclusions and recommendations
Coupled LEACHNN and MODFLOW simulation
showed the model output closely respected the timing
and magnitude of long-term shallow water level
measurements, and the predicted drainage was con-
sistent with local empirical groundwater recharge.
Leached nitrate concentrations predicted by LEACHN
matched the measured nitrate concentrations of tile
drainage very well most of the time during both the
calibration and verification periods. The model tended
to predict the occurrence of autumn leaching a few
weeks later than what was indicated by the observed
water table elevations and the tile drainage nitrate
concentrations in some years during the transition
from the dry summer period to the onset of the autumn
drainage season. This discrepancy was attributed to
model’s limitations in representing macropore flow
and possibly also crop growth. Although there were
some discrepancies in the time of the onset of nitrate
leaching, the drainage and leached concentrations in
the concerned periods were relatively low and the
concerned periods were relatively short, and therefore
the discrepancies should result in a limited effect on
estimates of nitrate leaching. Rate constants of
N transformations and other key model input param-
eters were similar to those from the literature.
LEACHN respected the measurements of soil nitrate
concentrations well in some cases and not so well in
other cases. The discrepancy was explained as the soil
samples may reflect the heterogeneity of the soil
properties and management, while the one-dimen-
sional model only represented the input properties and
management parameters. This modeling exercise
suggests that LEACHN can be an effective tool for
predicting nitrate leaching losses from similar potato
cropping systems in support of nitrate loading calcu-
lation of water quality restoration planning in PEI.
LEACHN could be improved through adapting the
crop growth and N uptake as a function of weather and
soil conditions, and adding functions of simulating
multiple crops within a single growing season and
macropore flow.
Both the measurements and simulations showed
that nitrate leaching from conventional barley–red
clover–potato rotation systems primarily occurred
during autumn, winter and spring when crop uptake
diminishes, and nitrate from mineralization and
residual fertilizer coexist with excessive moisture
from rainfall and snowmelt infiltration. The model
predicted nitrate leaching for the period from May to
April to range from 22 to 94 kg N ha-1, depending on
crop species, management practices and meteorology.
The long-term simulation predicted that annual aver-
age nitrate leaching rates following potato, barley and
red clover crops were 81, 54 and 35 kg N ha-1
respectively, corresponding to leached concentrations
of 15.7, 10.1 and 7.3 mg N l-1. These levels of nitrate
leaching losses are of concern for both drinking water
and aquatic habitat protections in PEI especially if
potato production systems occupy a large portion of a
watershed. The model predicted that about 50–60% of
the nitrate leaching losses were associated with the
barley and red clover phases, suggesting there is the
potential to reduce nitrate leaching not just in the
potato phase, but also in the rotation crop phases.
Future studies should investigate the opportunities
of minimizing nitrate accumulation in the soil both
during and outside of the growing season both in the
potato phase and the rotation crop phases. Develop-
ment of improved practices with respect to the
selection of rate, timing and form of fertilizer N
Nutr Cycl Agroecosyst
123
products and development of soil- and plant-based
diagnostic tests to guide at-planting and in-season
fertilizer N management will be important in reducing
the risk of nitrate leaching. Development of potato
cultivars with low N input requirements and high N
use efficiency may also reduce the risk of nitrate
leaching (Zebarth and Rosen 2007). The effects of
BMPs developed to minimize nitrate leaching losses
from potato production systems outside of the growing
season, such as incorporation of wheat straw, planting
cover crops following potato crops, and delayed red
clover plough-down, have been tested with various
degrees of success in PEI and should be further tested
in commercial fields. Incorporation of wheat straw and
planting cover crops following fertilized barley (grain)
crops should also be tested. In addition, the possibil-
ities of growing other high value and low N input crops
and removing legume crops, such as red clover, out of
potato rotation systems should be explored.
Acknowledgments This work was funded by the Prince
Edward Island Department of Environment, Energy and
Forestry, Environment Canada and Agriculture and Agri-Food
Canada. The study was also supported by the project of Watershed
Evaluation of Beneficial Management Practices of Agriculture
and Agri-Food Canada. The authors would like to thank John
Macleod and Brian J. Murray for providing the data of the leaching
experiments for model calibration, and Barry Thompson and Jerry
Ivany for providing some information for model input.
References
Addiscott TM, Whitmore AP (1991) Simulation of solute
leaching in soils of differing permeabilities. Soil Use
Manage 7:94–102
Bachman LJ, Lindsey B, Brakebill J, Powars DS (1998)
Ground-water discharge and base-flow nitrate loads of
national streams, and their relation to a hydrogeomorphic
classification of the Chesapeake Bay watershed, Middle
Atlantic Coast. USGS Water-Resources Investigations
Report 98-4059
Bohlke JK (2002) Groundwater recharge and agricultural con-
tamination. Hydrogeol J 10:153–179
Burkart MR, James DE (1999) Agriculture-nitrogen contribu-
tions to hypoxia in the Gulf of Mexico. J Environ Qual
28:850–859
Campbell G (1974) A simple method for determining unsatu-
rated conductivity from moisture retention data. Soil Sci
117:311–314
Carlsson G, Huss-Danell K (2003) Nitrogen fixation in peren-
nial forage legumes in the field. Plant Soil 253:353–372
Carter MR, Gregorich EG, Angers DA, Donald RG, Bolinder
MA (1998) Organic C and N storage, and organic C
fractions, in adjacent cultivated and forested soils of east-
ern Canada. Soil Tillage Res 47:253–261
Commission on Nitrates in Groundwater in PEI (2008) The
report of the commission of nitrates in groundwater, Prince
Edward Island Government, Canada At http://www.gov.
pe.ca/CommissiononNitrates/index.php?number=1019762
&lang=E. Accessed 23 December 2008
Crowe AS, Mutch JP (1994) An expert systems approach for
assessing the potential for pesticide contamination of
ground water. Ground Water 32:487–498
De Neve S, Dieltjens I, Moreels E, Hofman G (2003) Measured
and simulated nitrate leaching on an organic and a con-
ventional mixed farm. Biol Agric Hortic 21:217–229
Delgado JA, Riggenbach RR, Sparks RT, Dillon SM, Kawandbe
LM, Ristau RJ (2001) Evaluation of nitrate-nitrogen
transport in a potato–barley rotation. Soil Sci Soc Am J 65:
878–883
Environment Canada, online climate data At http://www.climate.
weatheroffice.ec.gc.ca/climateData/menu_e.html?timeframe=
1&Prov=PE&StationID=99999&Year=2004&Month=12&
Day=6. Accessed 10 December 2009
Francis RM (1989) Hydrogeology of the Winter River Basin,
Prince Edward Island. Department of the Environment,
Prince Edward Island, Canada
Health Canada (2010) Guidelines for Canadian drinking water
quality at http://www.hc-sc.gc.ca/ewh-semt/pubs/water-eau/
2010-sum_guide-res_recom/index-eng.php. Accessed on 4
August 2011
Hoffmann M, Johnsson H (2000) Nitrogen leaching from agri-
cultural land in Sweden. Ambio 29:67–73
Hutson JL (2003) Leaching estimation and chemistry model-
LEACHM: Model description and user’s guide. School of
Chemistry, Physics and Earth Sciences, The Flinders Uni-
versity of South Australia, GPO Box 2100, Adelaide,
SA5001 At http://www.scieng.flinders.edu.au/cpes/people/
hutson_j/leachweb.html. Accessed 10 August 2007
Hutson JL, Cass A (1987) A retentivity function for use in soil-
water simulation models. J Soil Sci 38:105–113
Jabro JD, Toth JD, Dou Z, Fox RH, Fritton DD (1995) Evalu-
ation of nitrogen version of LEACHM for predicting
nitrate leaching. Soil Sci 160:209–217
Jabro JD, Jabro AD, Fox RH (2006) Accuracy and performance
of three water quality models for simulating nitrate nitro-
gen losses under corn. J Environ Qual 35:1227–1236
Jego G, Martinez M, Antiguedad I, Launay M, Sanchez-Perez
JM, Juestes E (2008) Evaluation of the impact of various
agricultural practices on nitrate leaching under the root
zone of potato and sugar beet using the STICS soil-crop
model. Sci Total Environ 394(2–3):207–221
Jemison JM Jr, Jabro JD, Fox RH (1994) Evaluation of
LEACHM: simulation of nitrate leaching from nitrogen-
fertilized and manured corn. Agron J 86:852–859
Jiang Y, Somers GH (2009) Modeling effects of nitrate from
non-point sources on groundwater quality in an agricultural
watershed in Prince Edward Island, Canada. Hydrogeol J
17:707–724
Jiang Y, Somers GH, Mutch J (2004) Application of numerical
modeling to groundwater assessment and management in
Prince Edward Island. In: Proceedings of the 57th Cana-
dian geotechnical conference and the 5th Joint CGS/IAH-
CNC Conference, Quebec City, 24–27 October 2004
Nutr Cycl Agroecosyst
123
Johnsson H, Bergstorm L, Jansson P (1987) Simulated nitrogen
dynamics and losses in a layered agricultural soil. Agric
Ecosyst Environ 18:333–356
Jorgensen EE (2002) Advances in restoration science, Number
2: Opportunities in nitrogen management research:
improving applications for proven technologies and iden-
tifying new tools for managing nitrogen flux and input in
ecosystems. United States Environmental Protection
Agency (EPA) Issue Paper, EPA/600/S-02/003, 4 pp
Keith S, Zhang Y (2004) Baseflow contribution to nitrate-
nitrogen export from a large, agricultural watershed, USA.
J Hydrol 295:305–316
MacDougall JI, Veer C, Wilson F (1988) Soils of Prince Edward
Island. Agriculture Canada, Supply and Services Canada,
Ottawa, p 210
McDonald MG, Harbaugh A (1988) A modular three-dimen-
sional finite-difference ground-water flow model: The
USGS techniques of water-resources investigations report,
Book 6
McMahon PB, Bohlke JK, Kauffman LJ, Kipp KL, Landon MK,
Crandall CA, Burow KR, Brown CJ (2007) Source and
transport controls on the movement of nitrate to public
supply wells in selected principal aquifers of the United
States. Water Resour Res 44:W04401
Milburn PH, MacLeod JA (1991) Considerations for tile
drainage-water quality studies in temperate regions. Appl
Eng Agric 7:209–215
Milburn PH, MacLeod JA, Sanderson B (1997) Control of fall
nitrate leaching from early harvested potatoes on Prince
Edward Island. Can Agric Eng 39:263–271
Mutch JP, Jackson RE, Priddle MW, Bray DI (1992) The fate
and simulation of Aldicarb in the soil and groundwater of
Prince Edward Island. National Water Research Institute,
Environment Canada, Burlington
Nolan BT, Bayless ER, Green CT Garg S, Voss FD, Lampe DC
Barbash JE, Capel PD, Bekins BA (2005) Evaluation of
unsaturated-zone solute-transport models for studies of
agricultural chemicals. USGS Open-File Report 2005-1196,
Reston
Papadopoulos YR, Christie BR, Choo TM, Michaud R, McRae
KB, Gehl D, Fillmore SAE (2008) Rapani red clover. Can J
Plant Sci 88:1091–1092
PEIEEF (Prince Edward Island Department of Environment,
Energy and Forestry), water level monitoring data online
At http://www.gov.pe.ca/envengfor/groundwater/app.php.
Accessed 24 July 2009
Peralta JM, Stockle CO (2001) Dynamics of nitrate leaching
under irrigated potato rotation in Washington State: a long-
term simulation study. Agric Ecosyst Environ 88:23–34
Pionke HB, Urban JB (1985) Effect of agricultural land use on
ground-water quality in a small Pennsylvania watershed.
Ground Water 23:68–80
Power JF, Schepers JS (1989) Nitrate contamination of
groundwater in North America. Agric Ecosyst Environ
26:165–187
Prudic DE (1989) Documentation of a computer program to
simulate stream-aquifer relations using a modular, finite-
difference, ground-water flow model: U.S. Geological
Survey Open-File Report 88-729, 113 p
Rawls WJ, Brakensiek DL (1985) Agricultural management
effects on soil water retention. In: DeCoursey DG (ed)
1985 Proceedings of the 1983 natural resources modeling
symposium. US department of agricultural research ser-
vice, ARS-30, 523 p
Rodriguez SB, Alonson-Gaite A, Alvarez-Benedi J (2005)
Characterization of nitrogen transformations, sorption and
volatilization processes in urea fertilized soils. Vadose
Zone J 4:329–336
Sanderson JB, MacLeod JA (1994) Soil nitrate profile and
response of potatoes to fertilizer N in relation to time of
incorporation of lupin (Lupinus albus). Can J Soil Sci
74:241–246
Savard MM, Paradise D, Somers GH, Liao S, van Bochove E
(2007) Winter nitrification contributes to excess NO3- in
groundwater of an agricultural region: a dual-isotope study.
Water Resour Res 43:W06422
Shaffer MJ (1995) Fate and transport of nitrogen: what models
can and cannot do? At http://www.nrcs.usda.gov/technical/
rca/wp11text.html. Accessed 6 January 2010
Sogbedji JM, van Es HM, Hutson JL (2001) N fate and transport
under variable cropping history and fertilizer rate on loamy
sand and clay loam soils: I. Calibration of the LEACHMN
model. Plant Soil 229:57–70
Sogbedji JM, van Es HM, Agbeko KL (2006) Modeling nitrogen
dynamics under maize on ferralsols in Western Africa.
Nutr Cycl Agroecosyst 74:99–113
Spalding RF, Exner ME (1993) Occurrence of nitrate in
groundwater-A review. J Environ Qual 22:392–402
Statistics Canada (2009) Canadian Potato Production. Cata-
logue no. 22-008-X, vol. 6/No. 3
Verhagen J (1997) Site specific fertiliser application for potato
production and effects on N-leaching using dynamic sim-
ulation modelling. Agric Ecosyst Environ 66:165–175
Vos J, van der Putten PEL (2004) Nutrient cycling in a cropping
system with potato, spring wheat, sugar beet, oats and
nitrogen catch crops. II. Effect of catch crops on nitrate
leaching in autumn and winter. Nutr Cycl Agroecosyst
70:23–31
Watts DG, Hanks RJ (1978) A soil-water-nitrogen model for
irrigated corn on sandy soils. Soil Sci Soc Am J 42:492–499
Young JJ, Somers GH, Raymond BG (2002) Distribution and
trends for nitrate in PEI groundwater and surface waters.
Paper presented in the National Conference on Agricultural
Nutrients and their Impact on Rural Water Quality,
Waterloo, Ontario, 28-30 April 2002
Zebarth BJ, Milburn PH (2003) Spatial and temporal distribu-
tion of soil inorganic nitrogen concentration in potato hills.
Can J Soil Sci 83:183–195
Zebarth BJ, Rosen CJ (2007) Research perspective on nitrogen
BMP development for potato. Am J Potato Res 84:3–18
Zebarth BJ, Leclerc Y, Moreau G (2004) Rate and timing of
nitrogen fertilization of Russet Burbank potato: nitrogen
use efficiency. Can J Plant Sci 84:845–854
Zebarth BJ, Scott P, Price M (2005) Cereal management effects
on potato nitrogen fertility: 2004 results. Potato Research
Centre Technical Report No. 2005-02, Agriculture and
Agri-Food Canada
Zebarth BJ, Botha EJ, Rees H (2007) Rate and time of fertilizer
nitrogen application on yield, protein and apparent effi-
ciency of fertilizer nitrogen use of spring wheat. Can J
Plant Sci 87:709–718
Nutr Cycl Agroecosyst
123