integrated modelling of crop production and nitrate...
TRANSCRIPT
Integrated modelling of crop production andnitrate leaching with the Daisy model
Kiril Manevskia,b,c,*, Christen D. Børgesena,c, Xiaoxin Lib,Mathias N. Andersena,c, Per Abrahamsend, Chunsheng Hub,Søren Hansenc,d
aDepartment of Agroecology, Aarhus University, Blichers Allé 20, 8830 Tjele, Denmarkb Institute of Genetics and Developmental Biology, Chinese Academy of Science, Huaizhong Lu 286, 050021Shijiazhuang, Chinac Sino-Danish Center for Education and Research, Zhongguancun College, 271 N 4th Ring Road, Haidian,100080 Beijing, ChinadDepartment of Plant and Environmental Sciences, University of Copenhagen, Thorvaldsensvej 40,Frederiksberg, 1871 Copenhagen, Denmark
G R A P H I C A L A B S T R A C T
Stage II(evaluation)
Stage I(preparation)
Sensitivity analysis
Validation (time period 2)
Soil water dynamics
Soil hydraulics
Crop growth
Development, photosynthesis,nitrogen uptake
Oganic matter turnover
Initial SOM distribution,soil C/N ratio
Stage III(application) Scenario analysis
Daisy model set up for North-Europeanclimate-soil-cropconditions
Daisy modelset up for North China Plainclimate-soil-cropconditions
E.g. crop production(regional statistics)
E.g. crop production,soil mineral nitrogen,
nitrate leaching
Calibration (time period 1)
Re-validation(time period 3)
Crop productionNitrate leaching
Inputpreparation
Field data collection
Soil texture and hydraulicsCrop growth
Soil water and nitrate
Model runField data split (time periods)
A B S T R A C T
An integrated modelling strategy was designed and applied to the Soil-Vegetation-Atmosphere Transfer modelDaisy for simulation of crop production and nitrate leaching under pedo-climatic and agronomic environmentdifferent than that of model original parameterisation. The points of significance and caution in the strategy are:� Model preparation should include field data in detail due to the high complexity of the soil and the cropprocesses simulated with process-based model, and should reflect the study objectives. Inclusion of
* Corresponding author at: Department of Agroecology, Aarhus University, Blichers Allé 20, 8830 Tjele, Denmark.E-mail addresses: [email protected] (K. Manevski), [email protected] (C.D. Børgesen),
[email protected] (X. Li), [email protected] (M.N. Andersen), [email protected] (P. Abrahamsen),[email protected] (C. Hu), [email protected] (S. Hansen).
http://dx.doi.org/10.1016/j.mex.2016.04.0082215-0161/ã 2016 The Author(s). Published by Elsevier B.V. This is an open access article under the CC BY license (http://creativecommons.org/licenses/by/4.0/).
MethodsX 3 (2016) 350–363
Contents lists available at ScienceDirect
MethodsX
journal homepage: www.elsevier.com/locate/mex
interactions between parameters in a sensitivity analysis results in better account for impacts on outputs ofmeasured variables.
� Model evaluation on several independent data sets increases robustness, at least on coarser time scales such asmonth or year. It produces a valuable platform for adaptation of the model to new crops or for the improvementof the existing parameters set. On daily time scale, validation for highly dynamic variables such as soil watertransport remains challenging.
� Model application is demonstrated with relevance for scientists and regional managers. The integratedmodelling strategy is applicable for other process-based models similar to Daisy. It is envisaged that the strategyestablishes model capability as a useful research/decision-making, and it increases knowledge transferability,reproducibility and traceability.
ã 2016 The Author(s). Published by Elsevier B.V. This is an open access article under the CC BY license (http://creativecommons.org/licenses/by/4.0/).
A R T I C L E I N F OMethod name: Integrated modelling of crop production and nitrate leaching at field scaleKeywords: Calibration, Sensitivity analysis, Validation, Re-validation, Model applicationArticle history: Received 20 March 2016; Accepted 19 April 2016; Available online 26 April 2016
Method details
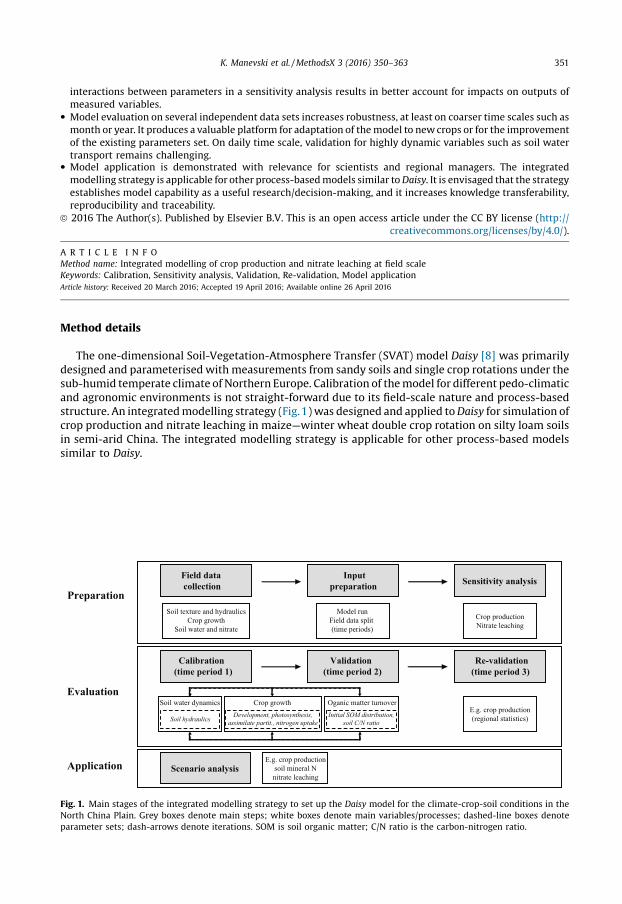
The one-dimensional Soil-Vegetation-Atmosphere Transfer (SVAT) model Daisy [8] was primarilydesigned and parameterised with measurements from sandy soils and single crop rotations under thesub-humid temperate climate of Northern Europe. Calibration of the model for different pedo-climaticand agronomic environments is not straight-forward due to its field-scale nature and process-basedstructure. An integrated modelling strategy (Fig.1) was designed and applied to Daisy for simulation ofcrop production and nitrate leaching in maize—winter wheat double crop rotation on silty loam soilsin semi-arid China. The integrated modelling strategy is applicable for other process-based modelssimilar to Daisy.
Evaluation
Preparation
Inputpreparation Sensitivity analysis
Validation (time period 2)
Soil water dynamics
Soil hydraulics
Crop growthDevelopment, photosynthesis,
assimilate partit., nitrogen uptake
Oganic matter turnoverInitial SOM distribution,
soil C/N ratio
E.g. crop production(regional statistics)
Field data collection
Calibration (time period 1)
Re-validation(time period 3)
Crop productionNitrate leaching
Soil texture and hydraulicsCrop growth
Soil water and nitrate
Model runField data split (time periods)
Application Scenario analysisE.g. crop production
soil mineral Nnitrate leaching
Fig. 1. Main stages of the integrated modelling strategy to set up the Daisy model for the climate-crop-soil conditions in theNorth China Plain. Grey boxes denote main steps; white boxes denote main variables/processes; dashed-line boxes denoteparameter sets; dash-arrows denote iterations. SOM is soil organic matter; C/N ratio is the carbon-nitrogen ratio.
K. Manevski et al. / MethodsX 3 (2016) 350–363 351
Model preparation
Field data collectionField data collection reflects the study objective, in this case calibration of a process-based model
for crop growth and soil nitrogen (N) processes. Field measurements were conducted at LuanchengAgro-Ecosystem Experimental Station (37�5301500N, 114�4004700E), the Chinese Academy of Science,Shijiazhuang, the North China Plain (NCP). The field measurements were performed on maize andwinter wheat grown in a double crop rotation, i.e., maize was typically sown in June and harvested inOctober, followed by winter wheat that was harvested the following June. Complete block N responseplots with three replicates were established in 1998 on two neighbouring fields: A (17% topsoil clay,30% subsoil clay, straw incorporated after each crop harvest) and B (5% topsoil clay, 14% subsoil clay,straw removed from the field after each crop harvest). The soil texture, organic matter and bulkdensity were described by Wang et al. [19] for field A and [10] for field B. The plots at both fields weretop dressed with urea fertiliser at annual rates of 0, 200, 400 and 600 kg N ha�1, referred to hereafter asN0, N200, N400, and N600, respectively. Half of the fertiliser amount was applied on maize duringflowering in August (field A) or at sowing (field B), while the other half was applied on winter wheateither in split dosage before sowing in October and at stem elongation in April (field A) or at sowing(field B). The field data covered the period June 2007–June 2013 (12 crop seasons) for field A, and June2001–June 2004 (6 crop seasons) for field B (Table 1). Recent crop measurements were conducted indetail from June 2012 to June 2013 at field A and included leaf area index (LiCor3100, Li-CorEnvironmental, USA), dry matter (DM; oven-drying) and N content (Kjeldahl System 2300, Tecator,Sweden) of crops organs (leaf, stem, grain) at juvenile, flowering and harvest. In addition, by diggingtwo soil pits and exposing the soil profiles from 0 to 200 cm depth, maize roots were sampled inOctober 2013 according to Ahmadi et al. [2]. Maize root length density (RLD) and maximum rootingdepth were determined according to Tennat [17], whereas winter wheat RLD and maximum rootingdepth were adopted from Zhang et al. [20].
Actual evapotranspiration (AET) was obtained with a weighing lysimeter (3 m2, 2.5 m depth,0.02 mm resolution of water loss) installed 100 m from the fields and managed similarly in terms ofcrop, irrigation and fertilisation; for details and data, see Li et al. [10]. The AET was used to calculate thedrainage (D) according to the water balance method [14], assuming no surface runoff and negligibleupward water movement at the site:
Dz ¼ P þ I þ DSWz � AET ð1Þwhere z is soil depth, P is precipitation, I is irrigation, DSW is change in soil water storage (24 h changein water content measured with neutron probes) and AET is actual evapotranspiration. Since the
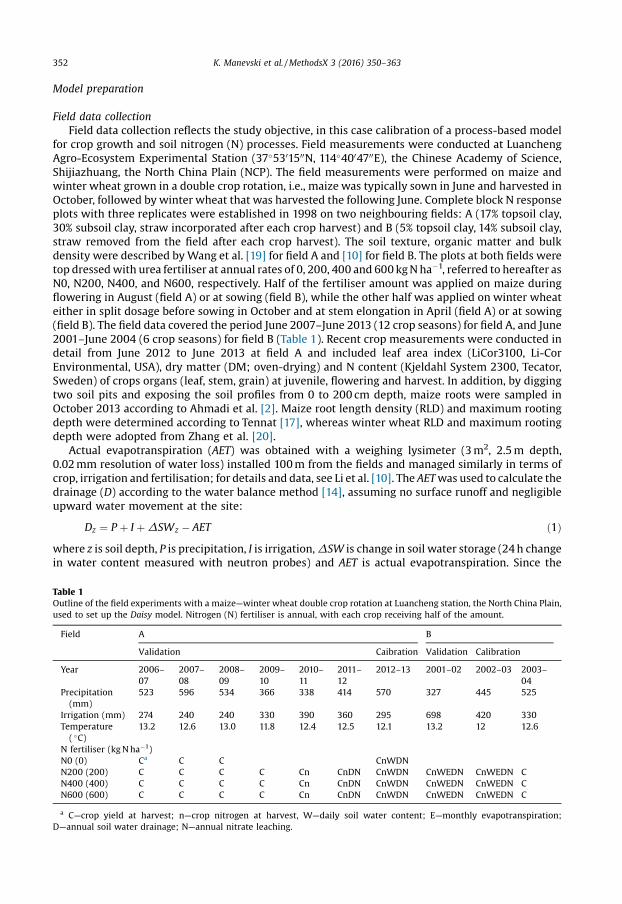
Table 1Outline of the field experiments with a maize—winter wheat double crop rotation at Luancheng station, the North China Plain,used to set up the Daisy model. Nitrogen (N) fertiliser is annual, with each crop receiving half of the amount.
Field A B
Validation Caibration Validation Calibration
Year 2006–07
2007–08
2008–09
2009–10
2010–11
2011–12
2012–13 2001–02 2002–03 2003–04
Precipitation(mm)
523 596 534 366 338 414 570 327 445 525
Irrigation (mm) 274 240 240 330 390 360 295 698 420 330Temperature( �C)
13.2 12.6 13.0 11.8 12.4 12.5 12.1 13.2 12 12.6
N fertiliser (kg N ha�1)N0 (0) Ca C C CnWDNN200 (200) C C C C Cn CnDN CnWDN CnWEDN CnWEDN CN400 (400) C C C C Cn CnDN CnWDN CnWEDN CnWEDN CN600 (600) C C C C Cn CnDN CnWDN CnWEDN CnWEDN C
a C—crop yield at harvest; n—crop nitrogen at harvest, W—daily soil water content; E—monthly evapotranspiration;D—annual soil water drainage; N—annual nitrate leaching.
352 K. Manevski et al. / MethodsX 3 (2016) 350–363
ammonium concentrations were negligible, leaching was obtained by multiplying the estimateddrainage by the measured nitrate concentrations:
Nleach ¼X
Dz;i�ci ð2Þ
where i is time of measurement, c is measured nitrate concentration, and Nleach is nitrate leaching.Daily management practices such as time of planting and harvest of the crops, time and rate of N
fertiliser and irrigation application, tilling date and depth, and fraction of crop straw returned to thesoil, were all recorded (Table 2).
Input preparationInput files necessary to run Daisy include daily weather, soil, crop and management information.
- Weather: daily air temperature, precipitation, solar radiation, wind speed and relative humiditywere recorded at Luancheng station. The respective values for wet and dry deposition of 7.5 ppmand 10 kg N ha�1 for ammonium and 2.5 ppm and 5 kg N ha�1 for nitrate required by the Daisyweather file were approximated from Zhang et al. [21]. However, modelers should use measuredvalues when these are available in order to increase the accuracy of the simulated atmospheric Ndeposition.
- Soil: two soil files, one for each field, were constructed with the measured soil properties. The vanGenuchten-Mualem soil hydraulic parameters, describing soil water retention and unsaturatedhydraulic conductivity at different soil water pressure potentials, were optimised against measuredwater retention in field A in 2007 (UMS GmbH, Germany, unpublished) with the nonlinear leastsquare algorithm of RETC code [18]; the parameters were used for both fields and were given asinput to Daisy. Further, for both soils the column was discretised with 2 cm increment from 0 to60 cm, 5 cm increment from 60 to 170 cm and 10 cm increments from 170 to 210 cm.
- Crop: “Pioneer maize” and “Winter wheat” were selected as respective maize and winter wheatinput files because these initially provided simulation results close to the measured DM dynamicscompared with the other parameterisations in the Daisy library that are based on specificexperiments in Denmark.
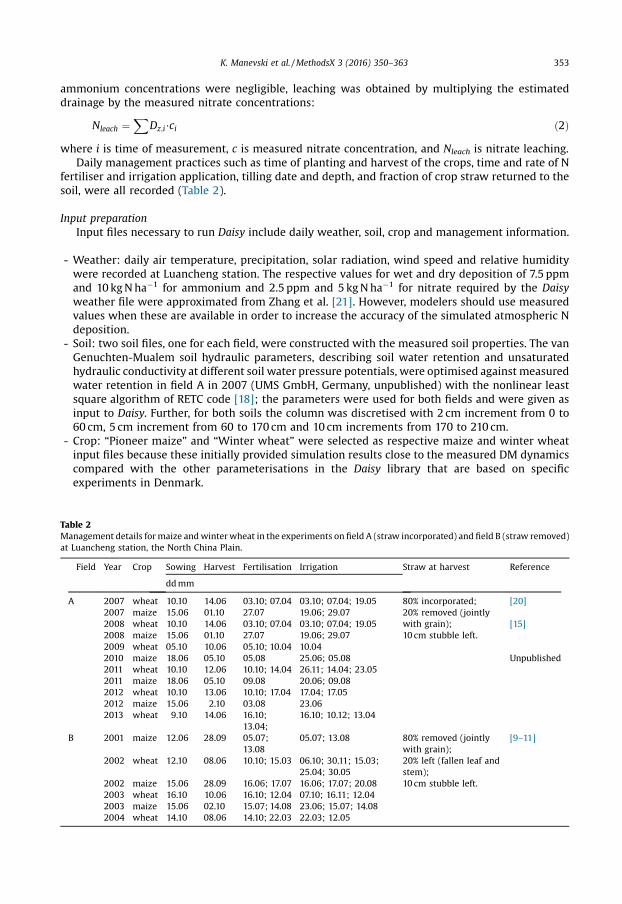
Table 2Management details for maize and winter wheat in the experiments on field A (straw incorporated) and field B (straw removed)at Luancheng station, the North China Plain.
Field Year Crop Sowing Harvest Fertilisation Irrigation Straw at harvest Reference
dd mm
A 2007 wheat 10.10 14.06 03.10; 07.04 03.10; 07.04; 19.05 80% incorporated;20% removed (jointlywith grain);10 cm stubble left.
[20]2007 maize 15.06 01.10 27.07 19.06; 29.072008 wheat 10.10 14.06 03.10; 07.04 03.10; 07.04; 19.05 [15]2008 maize 15.06 01.10 27.07 19.06; 29.072009 wheat 05.10 10.06 05.10; 10.04 10.042010 maize 18.06 05.10 05.08 25.06; 05.08 Unpublished2011 wheat 10.10 12.06 10.10; 14.04 26.11; 14.04; 23.052011 maize 18.06 05.10 09.08 20.06; 09.082012 wheat 10.10 13.06 10.10; 17.04 17.04; 17.052012 maize 15.06 2.10 03.08 23.062013 wheat 9.10 14.06 16.10;
13.04;16.10; 10.12; 13.04
B 2001 maize 12.06 28.09 05.07;13.08
05.07; 13.08 80% removed (jointlywith grain);20% left (fallen leaf andstem);10 cm stubble left.
[9–11]
2002 wheat 12.10 08.06 10.10; 15.03 06.10; 30.11; 15.03;25.04; 30.05
2002 maize 15.06 28.09 16.06; 17.07 16.06; 17.07; 20.082003 wheat 16.10 10.06 16.10; 12.04 07.10; 16.11; 12.042003 maize 15.06 02.10 15.07; 14.08 23.06; 15.07; 14.082004 wheat 14.10 08.06 14.10; 22.03 22.03; 12.05
K. Manevski et al. / MethodsX 3 (2016) 350–363 353
- Management information: the daily management practices at the two fields recorded during fielddata collection were used to construct the management file.
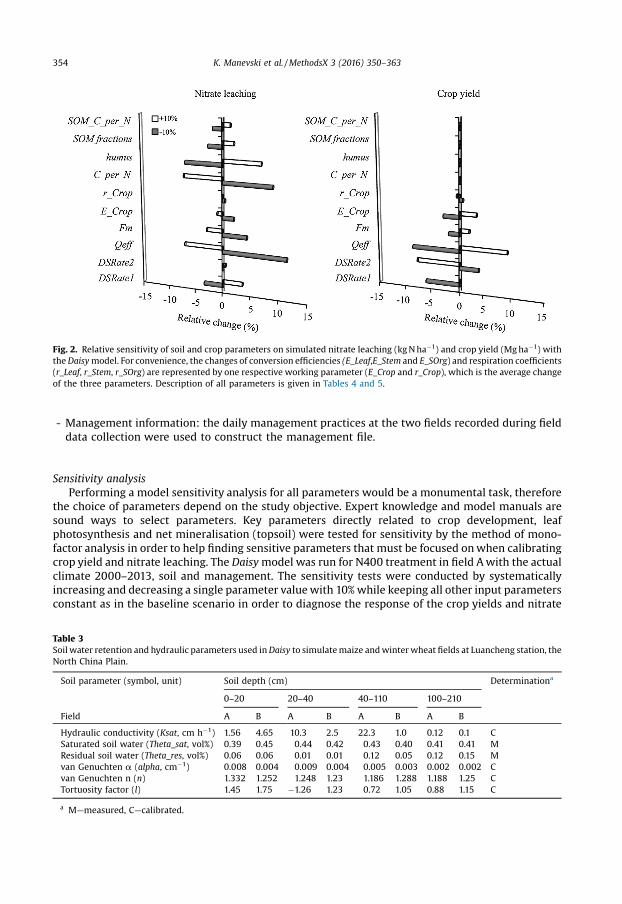
Sensitivity analysisPerforming a model sensitivity analysis for all parameters would be a monumental task, therefore
the choice of parameters depend on the study objective. Expert knowledge and model manuals aresound ways to select parameters. Key parameters directly related to crop development, leafphotosynthesis and net mineralisation (topsoil) were tested for sensitivity by the method of mono-factor analysis in order to help finding sensitive parameters that must be focused on when calibratingcrop yield and nitrate leaching. The Daisy model was run for N400 treatment in field A with the actualclimate 2000–2013, soil and management. The sensitivity tests were conducted by systematicallyincreasing and decreasing a single parameter value with 10% while keeping all other input parametersconstant as in the baseline scenario in order to diagnose the response of the crop yields and nitrate
Fig. 2. Relative sensitivity of soil and crop parameters on simulated nitrate leaching (kg N ha�1) and crop yield (Mg ha�1) withthe Daisy model. For convenience, the changes of conversion efficiencies (E_Leaf,E_Stem and E_SOrg) and respiration coefficients(r_Leaf, r_Stem, r_SOrg) are represented by one respective working parameter (E_Crop and r_Crop), which is the average changeof the three parameters. Description of all parameters is given in Tables 4 and 5.
Table 3Soil water retention and hydraulic parameters used in Daisy to simulate maize and winter wheat fields at Luancheng station, theNorth China Plain.
Soil parameter (symbol, unit) Soil depth (cm) Determinationa
0–20 20–40 40–110 100–210
Field A B A B A B A B
Hydraulic conductivity (Ksat, cm h�1) 1.56 4.65 10.3 2.5 22.3 1.0 0.12 0.1 CSaturated soil water (Theta_sat, vol%) 0.39 0.45 0.44 0.42 0.43 0.40 0.41 0.41 MResidual soil water (Theta_res, vol%) 0.06 0.06 0.01 0.01 0.12 0.05 0.12 0.15 Mvan Genuchten a (alpha, cm�1) 0.008 0.004 0.009 0.004 0.005 0.003 0.002 0.002 Cvan Genuchten n (n) 1.332 1.252 1.248 1.23 1.186 1.288 1.188 1.25 CTortuosity factor (l) 1.45 1.75 �1.26 1.23 0.72 1.05 0.88 1.15 C
a M—measured, C—calibrated.
354 K. Manevski et al. / MethodsX 3 (2016) 350–363
leaching (Fig. 2). The interacting effects between parameters were accounted for by testing thesensitivity of the crop yields to change in selected soil parameters, and that of nitrate leaching bychanging the crop parameters. The low sensitivity of crop production on change in the tested soilparameters is due to sufficient nitrate in the soil column for the treatments (except N0); users shouldinclude more nitrate- (or soil water-) limited treatments, when available, to obtain deeper insight intothe change of model outputs.
Model evaluation
For all simulations described next: 1. daily precipitation, irrigation and potential evapotranspira-tion were set as the atmospheric upper boundary and deep groundwater was the lower boundary, 2.all simulations started on 15 June 1998, and run until 15 June 2013 for field A and 15 June 2004 for fieldB, and 3. visual performance analysis and four objective measures were used to evaluate modelgoodness of fit to the measured data i.e. root mean squared residuals (RMSR), mean absolute deviation(Dev), Nash-Sutcliffe model efficiency (ME), and coefficient of determination (R2).
CalibrationThe field data were split up according to the “hold out” method [3] and those used for calibration
included the highest volume of details (Table 1). Although the method of splitting the data forcalibration and validation affects the bias of the estimated parameter value, the calibration data needsto be the most detailed. The model was calibrated by ‘trial and error’, first by fitting the soil waterdynamics, then the crop growth and N uptake patterns, and last the soil nitrate dynamics, with aniteration process in between (Fig. 1).
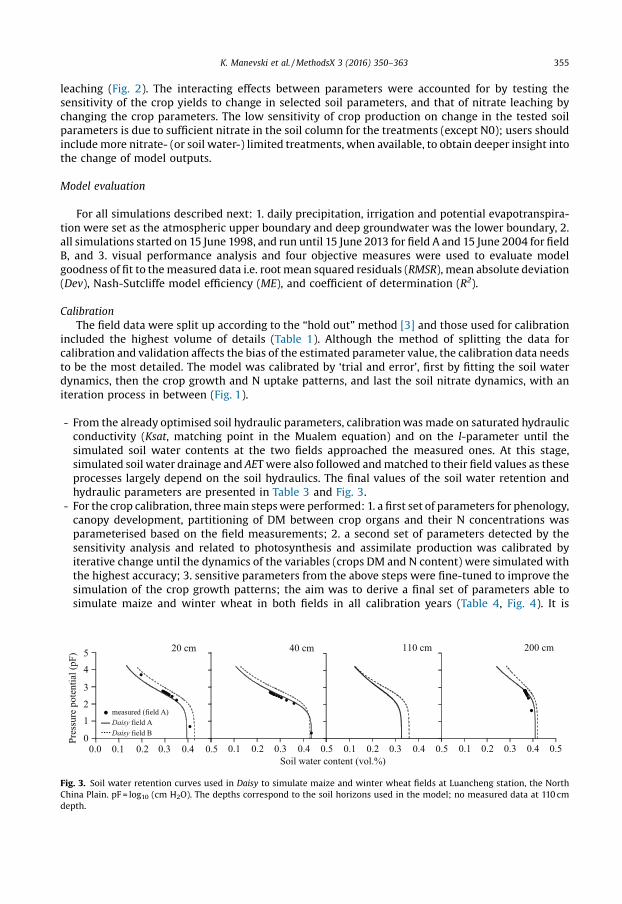
- From the already optimised soil hydraulic parameters, calibration was made on saturated hydraulicconductivity (Ksat, matching point in the Mualem equation) and on the l-parameter until thesimulated soil water contents at the two fields approached the measured ones. At this stage,simulated soil water drainage and AET were also followed and matched to their field values as theseprocesses largely depend on the soil hydraulics. The final values of the soil water retention andhydraulic parameters are presented in Table 3 and Fig. 3.
- For the crop calibration, three main steps were performed: 1. a first set of parameters for phenology,canopy development, partitioning of DM between crop organs and their N concentrations wasparameterised based on the field measurements; 2. a second set of parameters detected by thesensitivity analysis and related to photosynthesis and assimilate production was calibrated byiterative change until the dynamics of the variables (crops DM and N content) were simulated withthe highest accuracy; 3. sensitive parameters from the above steps were fine-tuned to improve thesimulation of the crop growth patterns; the aim was to derive a final set of parameters able tosimulate maize and winter wheat in both fields in all calibration years (Table 4, Fig. 4). It is
0
1
2
3
4
5
0.1 0.2 0.3 0.4 0.5
Pres
sure
pot
entia
l (pF
)
Soil water content (vol.%)
measured (field A)Daisy field ADaisy field B
0.0 0.1 0.2 0.3 0.4 0.5 0.1 0.2 0.3 0.4 0.5 0.1 0.2 0.3 0.4 0.5
20 cm 40 cm 110 cm 200 cm
Fig. 3. Soil water retention curves used in Daisy to simulate maize and winter wheat fields at Luancheng station, the NorthChina Plain. pF = log10 (cm H2O). The depths correspond to the soil horizons used in the model; no measured data at 110 cmdepth.
K. Manevski et al. / MethodsX 3 (2016) 350–363 355
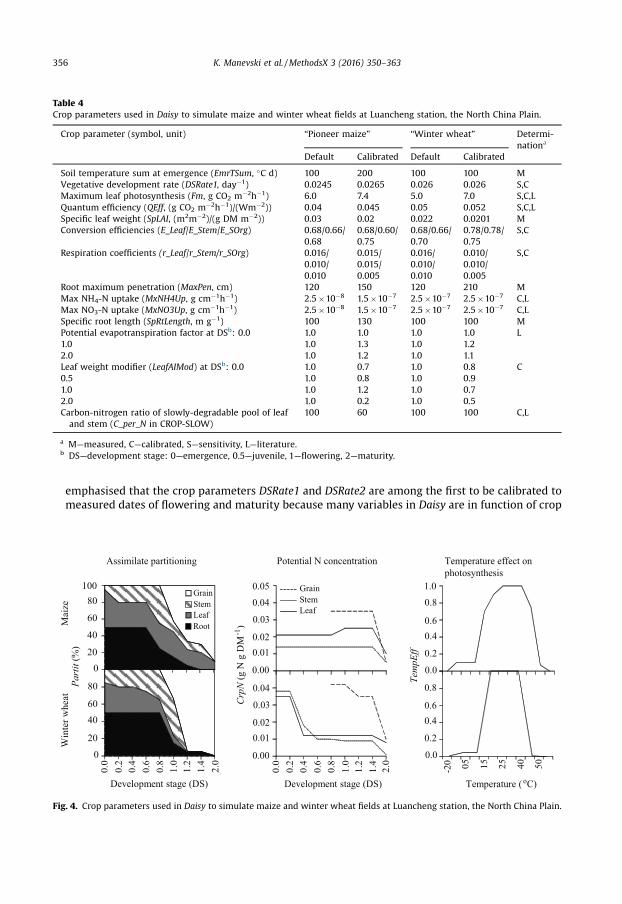
emphasised that the crop parameters DSRate1 and DSRate2 are among the first to be calibrated tomeasured dates of flowering and maturity because many variables in Daisy are in function of crop
Table 4Crop parameters used in Daisy to simulate maize and winter wheat fields at Luancheng station, the North China Plain.
Crop parameter (symbol, unit) “Pioneer maize” “Winter wheat” Determi-nationa
Default Calibrated Default Calibrated
Soil temperature sum at emergence (EmrTSum, �C d) 100 200 100 100 MVegetative development rate (DSRate1, day�1) 0.0245 0.0265 0.026 0.026 S,CMaximum leaf photosynthesis (Fm, g CO2 m�2h�1) 6.0 7.4 5.0 7.0 S,C,LQuantum efficiency (QEff, (g CO2 m�2h�1)/(Wm�2)) 0.04 0.045 0.05 0.052 S,C,LSpecific leaf weight (SpLAI, (m2m�2)/(g DM m�2)) 0.03 0.02 0.022 0.0201 MConversion efficiencies (E_Leaf/E_Stem/E_SOrg) 0.68/0.66/
0.680.68/0.60/0.75
0.68/0.66/0.70
0.78/0.78/0.75
S,C
Respiration coefficients (r_Leaf/r_Stem/r_SOrg) 0.016/0.010/0.010
0.015/0.015/0.005
0.016/0.010/0.010
0.010/0.010/0.005
S,C
Root maximum penetration (MaxPen, cm) 120 150 120 210 MMax NH4-N uptake (MxNH4Up, g cm�1h�1) 2.5 �10�8 1.5 �10�7 2.5 �10�7 2.5 �10�7 C,LMax NO3-N uptake (MxNO3Up, g cm�1h�1) 2.5 �10�8 1.5 �10�7 2.5 �10�7 2.5 �10�7 C,LSpecific root length (SpRtLength, m g�1) 100 130 100 100 MPotential evapotranspiration factor at DSb: 0.0 1.0 1.0 1.0 1.0 L1.0 1.0 1.3 1.0 1.22.0 1.0 1.2 1.0 1.1Leaf weight modifier (LeafAIMod) at DSb: 0.0 1.0 0.7 1.0 0.8 C0.5 1.0 0.8 1.0 0.91.0 1.0 1.2 1.0 0.72.0 1.0 0.2 1.0 0.5Carbon-nitrogen ratio of slowly-degradable pool of leafand stem (C_per_N in CROP-SLOW)
100 60 100 100 C,L
a M—measured, C—calibrated, S—sensitivity, L—literature.b DS—development stage: 0—emergence, 0.5—juvenile, 1—flowering, 2—maturity.
0
20
4060
80
0.2
0.4
0.6
0.8
1.2
1.4
0.0
0.2
0.40.6
0.81.0
020
40
60
80100
Part
it (%
)
Development stage (DS)
0.0
0.2
0.40.6
0.8
0.00
0.01
0.04
0.05
Tem
pEff
Temperature ( C)o
GrainStemLeaf
Mai
zeW
inte
r whe
at
Potential N concentration Temperature effect onphotosynthesis
Assimilate partitioning
1.0
2.0
0.0
Crp
N (g
N g
DM
)
-1
0.00
GrainStemLeafRoot
0.02
0.03
0.01
0.04
0.02
0.03
0.2
0.4
0.6
0.8
1.2
1.4
Development stage (DS)
1.0
2.0
0.0
-20 05 15 25 40 50
Fig. 4. Crop parameters used in Daisy to simulate maize and winter wheat fields at Luancheng station, the North China Plain.
356 K. Manevski et al. / MethodsX 3 (2016) 350–363

development, and their calibration exerts noticeable influence on the simulation of both crop yieldand nitrate leaching (Fig. 2).
- The calibration of the nitrate leaching was done by altering the soil organic matter (SOM) turnovercompartment. Historical period of five years before the experiment year (a “warm-up” period) withknown data for N input from fertiliser and crop residues was included for each simulation in orderto approximate the annual net mineralisation i.e. the release of N from mineralisation of the organic
Table 5Turnover parameters used in Daisy to simulate maize and winter wheat fields at Luancheng station, the North China Plain.
Soil parameter (symbol, unit) Soil depth (cm) Determi-nationa
0–20 20–40 40–110 100–210
Organic matter content (humus, %) 1.5 0.5 0.5 0.05Soil organic matter distribution(SOM_fractions)
(0.48 0.420.10)
(0.42 0.420.16)
(0.25 0.250.50)
(0.0 0.01.0)
(0.0 0.01.0)
S,C
Soil carbon-nitrogen ratio (C_per_N) 8–12 10–12 12 12 LSoil microbial biomass carbon-nitrogenratio (C_per_N)
4.8 L
Denitrification factor (water_factor)b (0.89 0.01) (0.98 0.01) (1.00 0.01) CEnd of root zone (MaxRootingDepth, cm) 190 MTotal carbon added (Input,kg C ha-1 y-1) c 1550 (field A), 800 (field B) C,LRoot carbon added (Root,kg C ha-1 y-1) c 750 (field A), 600 (field B) C,LDepth of non-root input (end, cm)c 25 C,L
a M–measured, C–calibrated, S–sensitivity, L–literature.b Fitting parameter with points (x,y) where first values (x) is fraction of maximal soil water content and second value (y) is
denitrification factor.c Initialisation parameters.
Table 6Model calibration performance for the field experiments at Luancheng station, North China Plain. Values are pooled for thecalibration periods of each variable. Values in brackets are one standard deviation of the mean.
Variable Field Model RMSR Dev ME R2
Maize biomass (Mg ha�1)Leaf 1.7 (0.3) 1.7 (0.2) 0.37 0.02 0.80 0.81Stem 2.0 (1.2) 1.8 (0.8) 0.66 �0.29 0.71 0.88Grain 5.7 (4.2) 5.2 (3.7) 0.77 �0.39 0.96 0.98Aboveground 7.5 (6.0) 7.0 (5.0) 1.37 �0.48 0.94 0.97Maize nitrogen (kg N ha�1)Leaf 34 (16.0) 32 (12.0) 10.09 �2.05 0.70 0.71Stem 19 (15.0) 18 (10.0) 8.69 �0.74 0.64 0.70Grain 70 (63.0) 69 (55.0) 12.91 �1.72 0.95 0.97Aboveground 107 (70.0) 101 (63.0) 19.84 �5.94 0.92 0.93Winter wheat biomass (Mg ha�1)Leaf 1.0 (0.5) 1.2 (0.9) 0.86 1.81 0.78 0.91Stem 2.5 (2.2) 2.3 (2.5) 1.12 �0.82 0.89 0.92Grain 4.2 (1.4) 4.6 (1.8) 0.71 0.23 0.88 0.94Aboveground 6.5 (4.6) 6.9 (5.2) 1.03 �0.06 0.98 0.98Winter wheat nitrogen (kg N ha�1)Leaf 14 (11.0) 15 (11.0) 5.22 �0.71 0.76 0.77Stem 25 (28.0) 25 (29.0) 13.88 �0.15 0.57 0.60Grain 100 (35.0) 99 (34.0) 6.68 �0.73 0.63 0.75Aboveground 93 (77.0) 93 (79.0) 15.05 �0.96 0.81 0.82Soil water (vol.%) at depth: 20 cm 35 (4) 33 (3) 4.32 �0.02 0.32 0.65
100 cm 29 (2) 30 (2) 2.67 0.00 0.37 0.30180 cm 39 (1) 38 (1) 1.91 �0.01 0.72 0.43
Evapotranspiration (mm month�1) 77 70 38.21 �8.17 0.68 0.73Soil water drainage (mm ha�1 year�1) 55 (11) 50 (18) 9.24 �5.53 0.87 0.80Nitrate leaching (kg N ha�1 year�1) 37 (32) 40 (38) 7.85 5.09 0.92 0.97
K. Manevski et al. / MethodsX 3 (2016) 350–363 357
matter pools in the model [4]. The net mineralisation is sensitive to the distribution of SOM at thestart of the simulation period, hence the model was initialised with SOM_fractions, a sensitiveparameter (Fig. 2) reflecting the amount of SOM in the slow, fast and inert pools of the model. Thisparameter was first calibrated for the N0 treatment until simulated crops N at harvest matched themeasured values. An inherent assumption was that the water balance is correct; otherwise thenitrate leaching will also be an unknown. The ratio was then used and adjusted, if needed, tosimulate the other treatments. The ammonia volatilisation was simulated assuming that increasedtemperature, soil wetness before application and amount of urea increases soil pH and thus lead torelatively higher fertiliser losses [12]. Hence, losses from 50, 100, 150, 200, and 300 kg N ha�1
fertiliser amounts were set at 5%, 10%, 12%, 15%, and 17%, respectively. The parameters relevant forthe organic matter turnover are given in Table 5.
The statistics of the model calibration were acceptable (Table 6). Given the iterations in theintegrated modelling framework, the calibration contributes decisively towards obtaining a betterunderstanding of the model structure and its correspondence to the real world system, although it isinherently subjective and can be time-consuming. A simulated 10-year period takes about 3 min inreal time on standard computers, and users may implement semi-automated procedures for parts ofthe calibration scheme, taking into account realistic values of the biophysical parameters present inthe model.
ValidationThe model was validated on the rest of the field data and the statistics were acceptable (Table 7),
despite a few negative ME values for aboveground N that probably occurred because of the very smallvariability in the measured yield at harvest. Hence, the newly parameterised maize and winter wheatare a significant outcome of the crop calibration and a valuable platform for future simulation studieswith the Daisy model in China or for improvement of the existing parameters set. The relatively largediscrepancy (highest RMSR, lowest ME) for the soil water contents was probably because of theproblems associated with getting true values for soil water retention and hydraulics for both fields(Fig. 3). Therefore, there is a need for measuring soil water retention and hydraulic properties of theactual field to be simulated with the model in order to increase the accuracy of soil water dynamics atdaily time scale. On a coarser time scale, which was the main intention in the method, the modelperformed well.
Table 7Model validation performance for the field experiments at Luancheng station, North China Plain. Values are pooled for thevalidation periods of each variable. Values in brackets are one standard deviation of the mean.
Variable Field Model RMSR Dev ME R2
Maize biomass (Mg ha�1)Grain 7.2 (0.1) 7.5 (0.4) 1.01 0.22 0.35 0.39Aboveground 11.8 (1.4) 12.7 (0.4) 1.28 0.72 0.64 0.75Maize nitrogen (kg N ha�1)Grain 105 (17) 121 (4.7) 22.40 20.04 0.17 0.24Aboveground 166 (5.8) 182 (2.4) 17.94 16.24 �0.77 0.22Winter wheat biomass (Mg ha�1)Grain 6.4 (0.8) 5.6 (0.5) 1.10 �0.68 0.17 0.14Aboveground 12.1 (1.4) 11.3 (0.8) 1.30 �0.92 0.79 0.38Winter wheat nitrogen (kg N ha�1)Grain 130 (11.8) 121 (24.2) 17.27 �8.54 0.18 0.58Aboveground 155 (18) 175 (33.7) 31.09 20.70 �1.82 0.45Soil water (vol.%) at: 20 cm 31 (5) 29 (6) 6.44 0.02 �0.17 0.35
100 cm 26 (4) 25 (6) 3.94 �0.01 �0.03 0.76180 cm 36 (3) 34 (4) 4.75 �0.02 0.01 0.29
Evapotranspiration (mm month�1) 83 73 30.34 �10.81 0.75 0.82Soil water drainage (mm ha�1 year�1) 51 (14) 40 (4) 16.48 �11.62 0.12 0.10Nitrate leaching (kg N ha�1 year�1) 45 (38) 34 (31) 16.68 �8.60 0.81 0.93
358 K. Manevski et al. / MethodsX 3 (2016) 350–363
One of the main purposes of the integrated modelling strategy is to keep track on the simulation ofall the major components of the mass balance of interest, in this case the N balance. The important Ncomponents other than N loss by nitrate leaching fell well within their measured ranges for the sameor similar silty loam fields in the NCP with comparable management practices (Table 8).
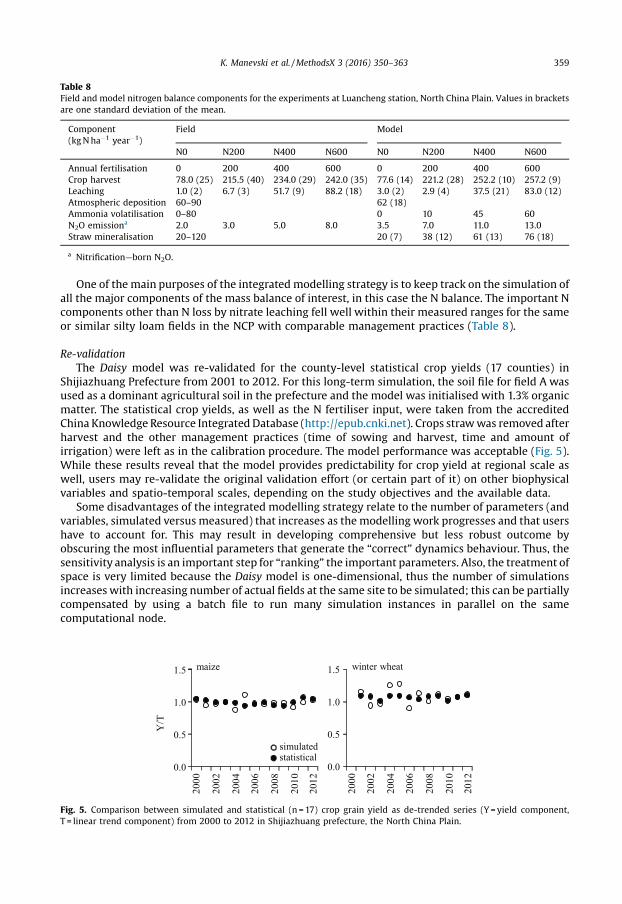
Re-validationThe Daisy model was re-validated for the county-level statistical crop yields (17 counties) in
Shijiazhuang Prefecture from 2001 to 2012. For this long-term simulation, the soil file for field A wasused as a dominant agricultural soil in the prefecture and the model was initialised with 1.3% organicmatter. The statistical crop yields, as well as the N fertiliser input, were taken from the accreditedChina Knowledge Resource Integrated Database (http://epub.cnki.net). Crops straw was removed afterharvest and the other management practices (time of sowing and harvest, time and amount ofirrigation) were left as in the calibration procedure. The model performance was acceptable (Fig. 5).While these results reveal that the model provides predictability for crop yield at regional scale aswell, users may re-validate the original validation effort (or certain part of it) on other biophysicalvariables and spatio-temporal scales, depending on the study objectives and the available data.
Some disadvantages of the integrated modelling strategy relate to the number of parameters (andvariables, simulated versus measured) that increases as the modelling work progresses and that usershave to account for. This may result in developing comprehensive but less robust outcome byobscuring the most influential parameters that generate the “correct” dynamics behaviour. Thus, thesensitivity analysis is an important step for “ranking” the important parameters. Also, the treatment ofspace is very limited because the Daisy model is one-dimensional, thus the number of simulationsincreases with increasing number of actual fields at the same site to be simulated; this can be partiallycompensated by using a batch file to run many simulation instances in parallel on the samecomputational node.
Table 8Field and model nitrogen balance components for the experiments at Luancheng station, North China Plain. Values in bracketsare one standard deviation of the mean.
Component(kg N ha�1 year�1)
Field Model
N0 N200 N400 N600 N0 N200 N400 N600
Annual fertilisation 0 200 400 600 0 200 400 600Crop harvest 78.0 (25) 215.5 (40) 234.0 (29) 242.0 (35) 77.6 (14) 221.2 (28) 252.2 (10) 257.2 (9)Leaching 1.0 (2) 6.7 (3) 51.7 (9) 88.2 (18) 3.0 (2) 2.9 (4) 37.5 (21) 83.0 (12)Atmospheric deposition 60–90 62 (18)Ammonia volatilisation 0–80 0 10 45 60N2O emissiona 2.0 3.0 5.0 8.0 3.5 7.0 11.0 13.0Straw mineralisation 20–120 20 (7) 38 (12) 61 (13) 76 (18)
a Nitrification—born N2O.
winter wheat
0.0
0.5
1.0
1.5
2000
2002
2004
2006
2008
2010
2012
Y/T
maize
simulatedstatistical
2000
2002
2004
2006
2008
2010
2012
0.0
0.5
1.0
1.5
Fig. 5. Comparison between simulated and statistical (n = 17) crop grain yield as de-trended series (Y = yield component,T = linear trend component) from 2000 to 2012 in Shijiazhuang prefecture, the North China Plain.
K. Manevski et al. / MethodsX 3 (2016) 350–363 359

Fig. 6. Application of the Daisy model setup for the North China Plain pedo-climatic conditions. A: Annual (cumulative) net Nmineralization at Luancheng (silty loam soil); results are presented as three-year (2009–2011) average for the treatments,shaded areas indicate year variation (�1 standard deviation); full-arrow indicates fertiliser application, dashed-arrowindicates harvest. B: Annual change in residual soil mineral nitrogen (0–2 m soil) under different straw managements andnitrogen fertiliser rates at Luancheng (silty loam soil); each bar represents the slope from linear regression of post-harvestsoil mineral nitrogen (6 October for maize,12 June for winter wheat) over 20-year continuous weather data (1991–2012), andannual nitrogen fertiliser is sum of the crop nitrogen fertiliser (maize + winter wheat). C: Regional variation in crop yield(maize + wheat) and nitrate leaching (2 m soil depth) for current management (S0) and different scenarios (S1–S5);description of the scenarios can be found in the text.
360 K. Manevski et al. / MethodsX 3 (2016) 350–363

Model application
The final stage of the integrated modelling strategy constitutes the ultimate use of the model inagro-environmental analysis as a research or a decision support tool. Two plausible modelapplications, at a field- and at a regional scale, are summarised and presented. In the field-scaleapplication, the calibrated model was firstly used to investigate the organic N turnover for the studiedsoil, with the results (Fig. 6A) showing large immobilisation of soil mineral N with straw incorporationafter harvest due to the high C/N ratio of the crop residues (Table 4); Net mineralisation dominated thesoil system shortly thereafter, especially during maize season in summer when both temperature andsoil moisture are high. The model was then run for field A, a dominant agricultural soil in Luancheng,for the period 1991–2013 with maize—winter wheat double crop rotation receiving annual fertiliserrates from 0 to 600 kg N ha�1 at 50 kg N ha�1 increments and split half between the crops; initialisationwas made with 1.3% topsoil organic matter and crops straw was either returned to the soil after eachcrop harvest (straw incorporated scenario) or was completely removed from the field (straw removedscenario). The results (Fig. 6B) pointed on an annual fertiliser rate of 300 kg N ha�1 with strawincorporation as balance between obtaining a high crop yield and a low environmental impact i.e.accumulation of soil mineral N, whereas annual fertiliser rate of at least 350 kg N ha�1 should beconsidered when straw is removed from the field.
The Daisy model was also run for several soil-management combinations for the Shijiazhuangregion. Based on the re-validation exercise (current management, S0), three scenarios (S1, S2 and S3)were derived and considered three annual N fertilizer rates uniformly applied across the region i.e.400, 300 and 200 kg N ha�1 for S1, S2 and S3 respectively. In these simulations, the crops straw wasincorporated into the soil after harvest as opposed to S0. Two additional scenarios (S4 and S5) werederived from S2 and introduced deficit irrigation. Since the time of irrigation for both crops wasconsidered as strategic in S0, only the irrigation amount was decreased only in winter wheat (by 25%;S4) and in both winter wheat and summer maize (by 25% in winter wheat and rainfed maize; S5).Single-station climate data from Luancheng station was used to covered the region (rather lowprecipitation and especially temperature gradient) and soil data were taken from [16] and aggregatedto six columns. Other management practices were left as in the calibration. The simulated crops yieldand nitrate leaching outputs for each climate-soil-management combination were upscaled on5 � 5 km grid using information on cropping area (Fig. 6C). The results depicted the spatial variation incrops yield and nitrate leaching in the region under the current management conditions, withcomparable results between the upscaled simulated- and the statistical yield. The upscaled yield washigher than the statistical yield for the north-west (probably due to higher clay content-high soil waterand N retention), but this mountainous region is of low agronomic importance with limited croppingarea. The scenario results pointed on options for regional N management in relation to N fertiliser rate,straw incorporation and field irrigation that will return high crop yield and low nitrate leaching.
Additional information
Description of the Daisy model
Daisy (version 5.19 used in this study) is a one-dimensional SVAT model that simulates crop-,water-, carbon- (C), and N dynamics as driven by daily weather data and daily field managementoperations [8]. The main compartments and their process descriptions used in this study are brieflyexplained in the following. The soil hydrology compartment simulates water transport (Richard’sequation), heat fluxes (Fourier’s law), and reference evapotranspiration (FAO Penman-Monteithequation used in the present study). The crop compartment simulates crop development and growth.Crop development stages (DS) from emergence (DS = 0) to flowering (DS = 1), and from flowering tomaturity (DS = 2) are simulated with the respective daily development rates. The leaf photosynthesis isdescribed by a light response curve [6] modified with temperature and senescence functions. Thegross photosynthesis is calculated by integration of the leaf photosynthesis over the canopy and isaffected by environmental stresses in relation to water, N and development. Assimilates (a net result ofphotosynthesis and respiration-growth and maintenance) are allocated to leaf, stem and storage
K. Manevski et al. / MethodsX 3 (2016) 350–363 361
organ (grain) as a function of root/shoot ratio at various DS. Root distribution depends on root massand, by default, decreases exponentially with soil depth according to Gerwitz and Page [5]. The SOMturnover compartment simulates mineralisation and immobilisation using three main discrete poolsof C and N, i.e. SOM, added organic matter (AOM) from crop residues, rhizodeposition and organicfertilisers, and soil microbial biomass (SMB). These pools are further subdivided according to first-order kinetics into slow (indexed 1, e.g. SOM1) and fast (indexed 2, e.g. SOM2), in addition to one inertpool (SOM3) that does not contribute to the turnover. N immobilisation occurs to the pool with a C/Nratio smaller than the C/N ratio of the source pool; otherwise, organic N mineralises to ammonium-Nthat is nitrified to nitrate-N and dissolved in the soil water. The mineralisation of SOM1, SOM2 andSMB1 depends on soil temperature, clay and water content, while mineralisation of SMB2 and AOMdepends on soil temperature and water content. Nitrification-denitrification is a function of soiltemperature, ammonium and water content. The transport of soil nitrate and ammonium, and hencetheir leaching, is simulated by the convection-dispersion equation. Ammonia volatilisation is given asa percentage of the ammonium fertiliser amount at the time of application. Atmospheric N input to thesoil is based on ammonium and nitrate concentrations in the rain, which are specified in the weatherfile. Further details on model equations and assumptions are available elsewhere [1,7,8,13].
The Daisy model is freely available (http://daisy.ku.dk/).
Acknowledgements
The authors would like to thank Yuan Haijing, Liting Liu and Junqi Yang at Luancheng Agro-Ecological Experimental Station for help with the field data collection and translations. Financialsupport for this study was provided by the Sino-Danish Center for Education and Research.
MethodsX thanks the reviewers of this article for taking the time to provide valuable feedback.
Appendix A. Supplementary data
Supplementary data associated with this article can be found, in the online version, at http://dx.doi.org/10.1016/j.mex.2016.04.008.
References
[1] P. Abrahamsen, S. Hansen, Daisy: an open soil-crop-atmosphere system model, Environ. Modell. Softw. 15 (3) (2000) 313–330.
[2] S.H. Ahmadi, F. Plauborg, M.N. Andersen, A.R. Sepaskhah, C.R. Jensen, S. Hansen, Effects of irrigation strategies and soils onfield grown potatoes: root distribution, Agric. Water Manage. 98 (8) (2011) 1280–1290.
[3] N.D. Bennett, B.F.W. Croke, G. Guariso, J.H.A. Guillaume, S.H. Hamilton, A.J. Jakeman, S. Marsili-Libelli, L.T.H. Newham, J.P.Norton, C. Perrin, S.A. Pierce, B. Robson, R. Seppelt, A.A. Voinov, B.D. Fath, V. Andreassian, Characterising performance ofenvironmental models, Environ. Modell. Softw. 40 (2013) 1–20.
[4] S. Bruun, L.S. Jensen, Initialisation of the soil organic matter pools of the Daisy model, Ecol. Model. 153 (3) (2002) 291–295.[5] A. Gerwitz, E.R. Page, An empirical mathematical model to describe plant root systems, J. Appl. Ecol. 11 (2) (1974) 773–781.[6] J. Goudriaan, H.H. van Laar, Calculation of daily totals of the gross C02 assimilation of leaf canopies, Neth. J. Agric. Sci. 26
(1978) 10.[7] S. Hansen, Daisy Description – Equation Section One, Copenhagen University, Copenhagen, Denmark, 2002 (https://daisy-
model.googlecode.com/files/DaisyDescription.pdf).[8] S. Hansen, P. Abrahamsen, C.T. Petersen, M. Styczen, Daisy: model use, calibration and validation, Trans. ASABE 55 (4)
(2012) 1315–1333.[9] X. Li, C. Hu, Y. Cheng, Effects of different fertilizers on crop yields and nitrate accumulation, Agric. Res. Arid Areas 21 (3)
(2003) 38–42.[10] X. Li, C. Hu, J.A. Delgado, Y. Zhang, Z. Ouyang, Increased nitrogen use efficiencies as a key mitigation alternative to reduce
nitrate leaching in north china plain, Agric. Water Manage. 89 (1–2) (2007) 137–147.[11] X. Li, H. Ma, H. Chunsheng, G. Zhang, Soil nitrate leaching and control methods in the piedmont of North China Plain, Chin. J.
Eco-Agric. 19 (5) (2011) 6.[12] B.L. Ma, T.Y. Wu, N. Tremblay, W. Deen, N.B. McLaughlin, M.J. Morrison, G. Stewart, On-Farm assessment of the amount and
timing of nitrogen fertilizer on ammonia volatilization, Agron. J. 102 (1) (2010) 134–144.[13] K. Manevski, C.D. Børgesen, M.N. Andersen, I.S. Kristensen, Reduced nitrogen leaching by intercropping maize with red
fescue on sandy soils in North Europe: a combined field and modeling study, Plant Soil 388 (1–2) (2015) 67–85.[14] F. Moreno, J.A. Cayuela, J.E. Fernandez, E. FernandezBoy, J.M. Murillo, F. Cabrera, Water balance and nitrate leaching in an
irrigated maize crop in SW Spain, Agric. Water Manage. 32 (1) (1996) 71–83.
362 K. Manevski et al. / MethodsX 3 (2016) 350–363

[15] S. Qin, Y. Wang, C. Hu, O. Oenema, X. Li, Y. Zhang, W. Dong, Yield-scaled N2O emissions in a winter wheat–summer corndouble-cropping system, Atmos. Environ. 55 (0) (2012) 240–244.
[16] W. Shangguan, Y. Dai, B. Liu, A. Zhu, Q. Duan, L. Wu, D. Ji, A. Ye, H. Yuan, Q. Zhang, D. Chen, M. Chen, J. Chu, Y. Dou, J. Guo, H.Li, J. Li, L. Liang, X. Liang, H. Liu, S. Liu, C. Miao, Y. Zhang, A China data set of soil properties for land surface modeling, J. Adv.Model. Earth Syst. 5 (2) (2013) 212–224.
[17] D. Tennant, A test of a modified line intersect method of estimating root length, J. Ecol. 63 (3) (1975) 995–1001.[18] M.T. van Genuchten, F.J. Leij, S.R. Yates, The RETC Code for Quantifying the Hydraulic Functions of Unsaturated Soils,
Version 1.0, U.S. Salinity Laboratory, USDA, ARS, Riverside, California, 1991.[19] Y.Y. Wang, C.S. Hu, H. Ming, Y.M. Zhang, X.X. Li, W.X. Dong, O. Oenema, Concentration profiles of CH4, CO2 and N2O in soils of
a wheat–maize rotation ecosystem in North China Plain, measured weekly over a whole year, Agric. Ecosyst. Environ. 164(0) (2013) 260–272.
[20] X. Zhang, S. Chen, H. Sun, Y. Wang, L. Shao, Root size, distribution and soil water depletion as affected by cultivars andenvironmental factors, Field Crops Res. 114 (1) (2009) 75–83.
[21] Y. Zhang, A.J. Dore, X. Liu, F. Zhang, Simulation of nitrogen deposition in the North China Plain by the FRAME model,Biogeosciences 8 (11) (2011) 3319–3329.
K. Manevski et al. / MethodsX 3 (2016) 350–363 363