ngam investment funds u.k. icvc - im.natixis.com · focus on corporate, convertible and government...
TRANSCRIPT

NGAM INVESTMENT FUNDS U.K. ICVC (Unaudited)
SHORT REPORT For the six months ending 30 June 2016

Loomis Sayles Strategic Income Fund 1Loomis Sayles U.S. Equity Leaders Fund 12H2O MultiReturns Fund 15Harris Associates Global Concentrated Equity Fund 21Seeyond Factor Plus Europe Ex U.K. Equity Fund 24Seeyond Factor Plus U.K. Equity Fund 28
Company Information 32
General Information 33
NGAM Investment Funds U.K. ICVC
Contents

NGAM Investment Funds U.K. ICVC
Loomis Sayles Strategic Income Fund
1Semi-Annual Short Report
Review of Fund Performance
Investment objective:The investment objective of Loomis Sayles Strategic IncomeFund (the “Fund”) is to achieve high income with asecondary objective of long-term growth of capital.
Principal investment strategy:In order to meet its objective, the Fund will invest at least80% of its assets in income-producing securities (includingbelow investment-grade securities, or “junk bonds”) with afocus on corporate, convertible and government bonds on aglobal basis, including emerging markets.
Income-producing securities may also include wherepermitted in accordance with FCA Rules: preferred stocks,asset-backed securities, mortgage-related securities, Rule144A securities, Regulation S securities, structured notes,pay-in-kind bonds and bank loans qualifying as money marketinstruments. These securities may also be issued orguaranteed by government agencies or supranationalentities. The Fund may invest no more than 10% of its totalassets in bank loans that qualify as money marketinstruments. Except as described elsewhere, the Fund is notlimited in the percentage of its assets that it may invest inthese instruments.
The Fund may invest up to 20% of its assets in securitiesother than those described above. The Fund may invest nomore than 20% of its assets in dividend-paying commonstocks. The Fund may invest no more than 10% of its assetsin other investment funds (subject to the eligibility criteria asset out in Appendix 1 in the Prospectus).
Loomis, Sayles & Company, L.P., the Investment Manager,may shift the Fund’s assets among various types ofincome-producing securities based upon changing marketconditions. The Investment Manager performs its ownextensive credit analyses to determine the creditworthinessand potential for capital appreciation of a security. It uses aflexible approach to identify securities in the global financialmarkets with characteristics including discounted pricecompared to economic value, undervalued credit ratings withstrong or improving credit profiles and attractive yield(although not all of the securities selected will have theseattributes).
In deciding which securities to buy and sell, the InvestmentManager will consider, among other things, the financialstrength of the issuer, current interest rates, currentvaluations, its expectations regarding future changes ininterest rates and comparisons of the level of risk associatedwith particular investments with the Investment Manager’sexpectations concerning the potential return of thoseinvestments. The Investment Manager generally seeks tomaintain a high level of diversification.
For a more complete description of the investmentpolicy and risks relevant to each Fund, please refer to thelatest version of the Company Prospectus.
Fund Manager’s ReportThe Fund outperformed its Reference Index in the six-monthperiod ended June 30, 2016.
High yield credit advanced in the first half of 2016, benefitingfrom risk-on market sentiment during most of the period.High yield industrial issues, particularly energy, chemicalsand metals and mining names, primarily drove performance.An allocation to high yield utilities was also beneficial.Elsewhere, convertible issues, which are more closelycorrelated with equity markets, also performed well.Selected energy, real estate investment trusts (REITs) andleisure names were leading performers. Additionally, theFund’s investment grade exposure aided performance.Despite an underweight allocation, security selection amonginvestment grade industrials contributed to performance,largely due to automotive and energy issues. Securityselection among high-quality financials names, along with anunderweight to the space, was also beneficial.
The Fund held short-maturity Treasury’s as reserves, whichweighed on performance since rates declined. In addition,exposure to common stock, particularly in the automotiveand technology industries, weighed on performance.
Period Performance%
Share Class I/AG USD 8.05
Barclays U.S. Aggregate Bond Index TR USD 5.31
Risk and Reward Profile
The risk and reward category of the Fund is indicated usinghistorical data which may not be a reliable indicator of theFund’s future risk profile. Due to its investment in fixedincome markets, the Fund may experience significant rangeand frequency of price movements (volatility), as expressedby its rank on the above scale.
The risk category shown is not guaranteed and may shift overtime. There is no capital guarantee or protection on the valueof the Fund. The lowest category does not mean “risk free”.
For further information on specific risks applicable to eachFund, please refer to the latest version of the Prospectus.
1 2 3 4 5 6 7
Lower risk
Typically lower rewards
Higher risk
Typically higher rewards

NGAM Investment Funds U.K. ICVC
Loomis Sayles Strategic Income Fund
2 Semi-Annual Short Report
Sector Breakdown30.06.16 31.12.15
Portfolio of Investments % %
US Dollar Denominated Bonds 67.88 67.38
Equities 8.55 7.34
Canadian Dollar Denominated Bonds 6.91 5.29
New Zealand Dollar Denominated Bonds* 3.25 2.55
Preference Shares 2.58 2.64
Euro Denominated Bonds 2.53 2.47
Mexican Peso Denominated Bonds 2.48 2.15
Australian Dollar Denominated Bonds* 1.90 1.51
Sterling Denominated Bonds 1.53 1.44
Norwegian Krone Denominated Bonds 1.49 1.17
Icelandic Krona Denominated Bonds 0.83 0.63
Brazilian Real Denominated Bonds – 0.67
Derivatives (3.41) (0.49)
Investment assets 96.52 94.75
Net other assets 3.48 5.25
Total net assets 100.00 100.00
* Prior Year Comparative restated.
Top Ten Holdings30.06.16
%
Canadian Government Bond 1% 01/08/2016 4.33
Intel 4.28
General Electric Capital 4.25% 17/01/2018 2.03
Telecom Italia Capital 6% 30/09/2034 1.73
ServiceMaster 7.45% 15/08/2027 1.62
Corning 1.59
Ford Motor Credit 4.389% 08/01/2026 1.58
Wagamama Finance 7.875% 01/02/2020 1.53
AES 4.875% 15/05/2023 1.52
Norway Government Bond 4.5% 22/05/2019 1.49
31.12.15%
United States Treasury Note 0.5% 30/04/2017 4.81
United States Treasury Note 0.625% 31/07/2017 4.58
United States Treasury Note 0.5% 30/06/2016 4.41
United States Treasury Note 2.375% 31/03/2016 4.37
Intel 3.83
Canadian Government Bond 1% 01/08/2016 3.32
Portugal Government International Bond 5.125% 15/10/2024 2.32
General Electric Capital 4.25% 17/01/2018 1.59
Weyerhaeuser 6.375% 01/07/2016 1.58
Alcatel-Lucent USA 6.45% 15/03/2029 1.48
Portfolio MovementsFor the six months ending 30 June 2016
£’000
Total purchases for the period 3,846
Major Purchases Cost
Ford Motor Credit 4.389% 08/01/2026 848
United States Treasury 0.75% 30/04/2018 698
American Airlines 2016-1 Class B Pass Through Trust 5.25% 15/07/2025 286
Santander Issuances 5.179% 19/11/2025 259
Societe Generale 4.75% 24/11/2025 158
Oceaneering International 4.65% 15/11/2024 150
Brocade Communications 1.375% 01/01/2020 146
Societe Generale 5.625% 24/11/2045 142
Devon Energy 5.85% 15/12/2025 94
Antero Resources 5.125% 01/12/2022 81
£’000
Total sales for the period 9,553
Major Sales Proceeds
United States Treasury 0.5% 30/04/2017 1,460
United States Treasury 0.625% 31/07/2017 1,398
United States Treasury 0.5% 30/06/2016 1,338
United States Treasury 2.375% 31/03/2016 1,321
United States Treasury 0.75% 30/04/2018 700
Republic of Portugal 5.125% 15/10/2024 695
Ford Motor Credit 4.389% 08/01/2026 531
Alcatel Lucent USA 6.45% 15/03/2029 470
Societe Generale 5.625% 24/11/2045 313
American Airlines 5.50% 01/10/2019 202
The fund has a valuation currency in USD and this has beenconverted to GBP.
Review of Fund Performance

NGAM Investment Funds U.K. ICVC
Loomis Sayles Strategic Income Fund
3Semi-Annual Short Report
Portfolio Credit Rating AnalysisMarket Value Total net
Rating block £'000 assets %
Investment grade 7,492 28.28Non-Investment grade 15,269 57.67Unrated 755 2.85Total of debt securities 23,516 88.80Preference shares 685 2.58Equities 2,259 8.55Forward currency contracts (908) (3.41)
Investment assets (including investment liabilities) 25,552 96.52
Net other assets 923 3.48
Net assets 26,475 100.00
Review of Fund Performance

NGAM Investment Funds U.K. ICVC
Loomis Sayles Strategic Income Fund
4 Semi-Annual Short Report
Net asset value and ongoing charges figure30.06.16 31.12.15 31.12.14 31.12.13
I/A (GBP) – Net Shares*
Closing net asset value (£’000) – 3 3 3Closing number of shares – 3,000 3,000 3,000Closing net asset value per share (p) – 101.76 105.06 98.58Operating charges – 0.65% 0.65% 0.65%
I/A (USD) – Net Shares*
Closing net asset value (£’000) – 2 2 2Closing number of shares – 3,000 3,000 3,000Closing net asset value per share (c) – 97.10 105.54 101.68Operating charges – 0.65% 0.65% 0.65%
I/DG (GBP) – Gross Shares
Closing net asset value (£’000) 832 1,151 734 3Closing number of shares 770,275 1,240,525 740,450 3,000Closing net asset value per share (p) 107.99 92.83 99.13 93.46Operating charges 0.65% 0.65% 0.65% 0.65%
I-AG (USD) – Gross Shares
Closing net asset value (£’000) 321 236 270 33Closing number of shares 405,216 357,250 398,371 53,500Closing net asset value per share (c) 106.39 98.03 105.72 100.90Operating charges 0.65% 0.65% 0.65% 0.65%
H-I/AG (EUR) – Gross Shares
Closing net asset value (£’000) 1,180 1,109 2,047 1,387Closing number of shares 1,343,924 1,532,817 2,472,851 1,637,142Closing net asset value per share (c) 106.18 98.42 106.31 101.73Operating charges 0.65% 0.65% 0.65% 0.65%
H-I/DG (EUR) – Gross Shares
Closing net asset value (£’000) 1,221 1,037 1,274 990Closing number of shares 1,607,165 1,616,525 1,662,385 1,207,675Closing net asset value per share (c) 91.83 87.22 98.38 98.46Operating charges 0.65% 0.65% 0.65% 0.65%
H-N/A (GBP) – Net Shares
Closing net asset value (£’000) 6,580 5,642 1,065 3Closing number of shares 6,297,235 5,827,479 1,010,270 3,049Closing net asset value per share (p) 104.51 96.82 105.46 101.58Operating charges 0.75% 0.75% 0.75% 0.75%
N/D (GBP) – Net Shares
Closing net asset value (£’000) 3,355 2,278 1,240 3Closing number of shares 3,078,893 2,432,648 1,240,282 3,052Closing net asset value per share (p) 108.96 93.65 100.01 94.30Operating charges 0.75% 0.75% 0.75% 0.75%
H-N/D (GBP) – Net Shares
Closing net asset value (£’000) 4,503 3,991 2,006 68Closing number of shares 4,849,233 4,538,511 2,026,010 68,729Closing net asset value per share (p) 92.88 87.94 99.02 98.78Operating charges 0.75% 0.75% 0.75% 0.75%
Comparative Table(Unaudited)
As at 30 June 2016

NGAM Investment Funds U.K. ICVC
Loomis Sayles Strategic Income Fund
5Semi-Annual Short Report
Comparative Table(Unaudited)
As at 30 June 2016
30.06.16 31.12.15 31.12.14 31.12.13
H-Q/A (GBP) – Net Shares
Closing net asset value (£’000) – 160 1,131 280Closing number of shares – 160,000 1,058,477 273,490Closing net asset value per share (p) – 99.86 106.83 102.47Operating charges – 0.25% 0.25% 0.25%
Q/AG (USD) – Gross Shares
Closing net asset value (£’000) 8,483 13,704 13,903 12,434Closing number of shares 10,535,832 20,031,729 19,931,729 19,850,000Closing net asset value per share (c) 108.61 101.38 108.87 103.51Operating charges 0.25% 0.25% 0.25% 0.25%
H-I/D (GBP) – Net Shares*
Closing net asset value (£’000) – 3 3 –Closing number of shares – 3,109 3,017 –Closing net asset value per share (p) – 83.56 94.10 –Operating charges – 0.65% 0.65% –
H-I/A (GBP) – Net Shares*
Closing net asset value (£’000) – 3 3 –Closing number of shares – 3,000 3,000 –Closing net asset value per share (p) – 87.43 95.19 –Operating charges – 0.65% 0.65% –
I/D (GBP) – Net Shares*
Closing net asset value (£’000) – 3 3 –Closing number of shares – 3,108 3,017 –Closing net asset value per share (p) – 93.77 100.14 –Operating charges – 0.65% 0.65% –
I/A (GBP) – Net shares, I/A (USD) – Net shares, I/DG (GBP) – Gross shares and H-N/A (GBP) – Net shares were launched on 10 June 2013.
I-AG (USD) – Gross shares were launched 30 April 2013.
H-I/AG (EUR) – Gross shares and H-I/DG – Gross shares were launched on 23 April 2013.
N/D (GBP) – Net shares were launched on 26 July 2013.
H-N/D (GBP) – Net shares were launched on 19 April 2013.
H-Q/A (GBP) – Net shares were launched on 24 September 2013.
Q/AG (USD) – Gross shares were launched on 8 March 2013.
H-I/D (GBP) – Net shares, H-IA (GBP) – Net shares and I/D (GBP) – Net shares were launched on 1 September 2014.
H-Q/A (GBP) – Net shares were closed on 22 January 2016.
* These shares had no active shareholders as at 30 June 2016.
NGAM Investment Funds U.K. ICVC
Loomis Sayles Strategic Income Fund
6 Semi-Annual Short Report
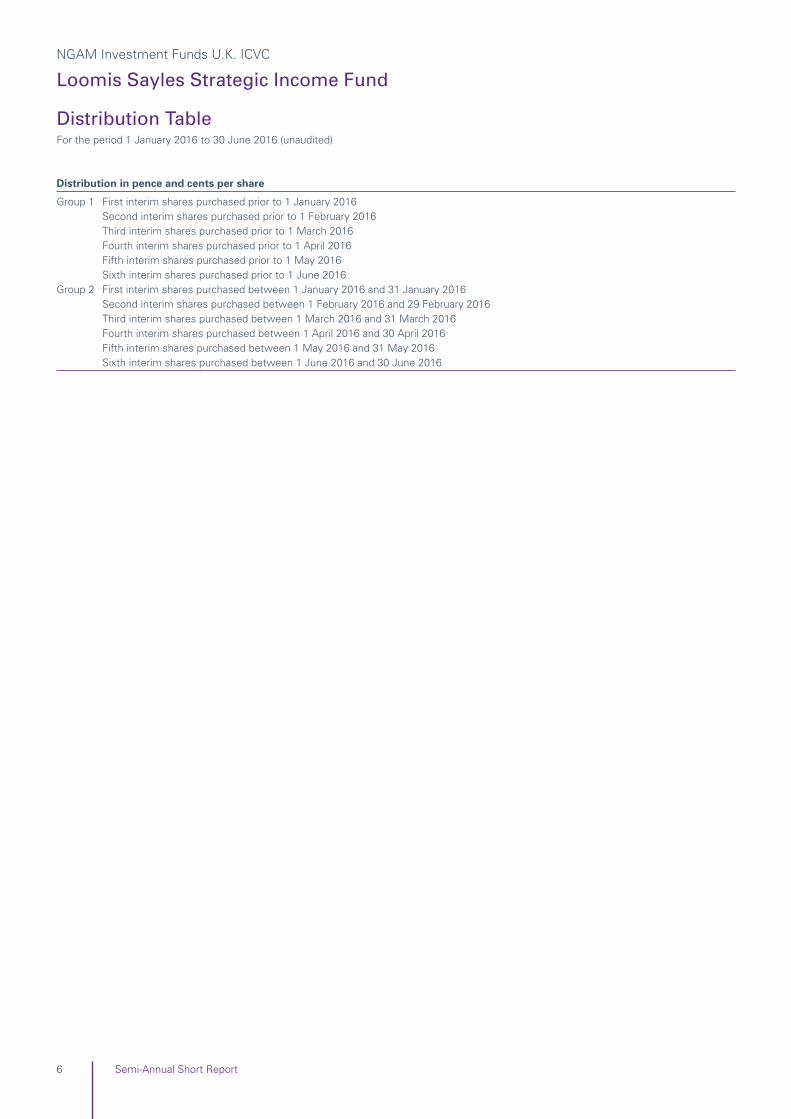
Distribution TableFor the period 1 January 2016 to 30 June 2016 (unaudited)
Distribution in pence and cents per share
Group 1 First interim shares purchased prior to 1 January 2016Second interim shares purchased prior to 1 February 2016Third interim shares purchased prior to 1 March 2016Fourth interim shares purchased prior to 1 April 2016Fifth interim shares purchased prior to 1 May 2016Sixth interim shares purchased prior to 1 June 2016
Group 2 First interim shares purchased between 1 January 2016 and 31 January 2016Second interim shares purchased between 1 February 2016 and 29 February 2016Third interim shares purchased between 1 March 2016 and 31 March 2016Fourth interim shares purchased between 1 April 2016 and 30 April 2016Fifth interim shares purchased between 1 May 2016 and 31 May 2016Sixth interim shares purchased between 1 June 2016 and 30 June 2016

NGAM Investment Funds U.K. ICVC
Loomis Sayles Strategic Income Fund
7Semi-Annual Short Report
Distribution TableFor the period 1 January 2016 to 30 June 2016 (unaudited)
I/A (GBP) – Net Shares
Distributions DistributionsGross Income Net paid/payable to paid to
revenue tax revenue Equalisation 31/08/2016 31/08/2015
Group 1 (p) (p) (p) (p) (p) (p)
First interim 0.3470 0.0694 0.2776 – 0.2776 0.3435 Second interim 0.4354 0.0871 0.3483 – 0.3483 0.2987 Third interim – – – – – 0.3768 Fourth interim – – – – – 0.2697 Fifth interim – – – – – 0.2958 Sixth interim – – – – – 0.2965
Group 2 (p) (p) (p) (p) (p) (p)
First interim 0.3470 0.0694 0.2776 – 0.2776 0.3435 Second interim 0.4354 0.0871 0.3483 – 0.3483 0.2987 Third interim – – – – – 0.3768 Fourth interim – – – – – 0.2697 Fifth interim – – – – – 0.2958 Sixth interim – – – – – 0.2965
I/A (USD) – Net Shares
Distributions DistributionsGross Income Net paid/payable to paid to
revenue tax revenue Equalisation 31/08/2016 31/08/2015
Group 1 (c) (c) (c) (c) (c) (c)
First interim 0.3333 0.0667 0.2666 – 0.2666 0.3310 Second interim 0.4000 0.0800 0.3200 – 0.3200 0.2903 Third interim – – – – – 0.3710 Fourth interim – – – – – 0.2676 Fifth interim – – – – – 0.2893 Sixth interim – – – – – 0.3003
Group 2 (c) (c) (c) (c) (c) (c)
First interim 0.3333 0.0667 0.2666 – 0.2666 0.3310 Second interim 0.4000 0.0800 0.3200 – 0.3200 0.2903 Third interim – – – – – 0.3710 Fourth interim – – – – – 0.2676 Fifth interim – – – – – 0.2893 Sixth interim – – – – – 0.3003
I/DG (GBP) – Gross Shares
Distributions DistributionsGross Income Net paid/payable to paid to
revenue tax revenue Equalisation 31/08/2016 31/08/2015
Group 1 (p) (p) (p) (p) (p) (p)
First interim 0.3140 – 0.3140 – 0.3140 0.4057 Second interim 0.3983 – 0.3983 – 0.3983 0.3482 Third interim 0.4094 – 0.4094 – 0.4094 0.4444 Fourth interim 0.3691 – 0.3691 – 0.3691 0.3154 Fifth interim 0.4608 – 0.4608 – 0.4608 0.3444 Sixth interim 0.5162 – 0.5162 – 0.5162 0.3446
Group 2 (p) (p) (p) (p) (p) (p)
First interim 0.3140 – 0.3140 – 0.3140 0.4057 Second interim 0.3983 – 0.3983 – 0.3983 0.3482 Third interim 0.4094 – 0.4094 – 0.4094 0.4444 Fourth interim 0.3691 – 0.3691 – 0.3691 0.3154 Fifth interim 0.4608 – 0.4608 – 0.4608 0.3444 Sixth interim 0.5162 – 0.5162 – 0.5162 0.3446

NGAM Investment Funds U.K. ICVC
Loomis Sayles Strategic Income Fund
8 Semi-Annual Short Report
Distribution TableFor the period 1 January 2016 to 30 June 2016 (unaudited)
I-AG (USD) – Gross Shares
Distributions DistributionsGross Income Net paid/payable to paid to
revenue tax revenue Equalisation 31/08/2016 31/08/2015
Group 1 (c) (c) (c) (c) (c) (c)
First interim 0.3184 – 0.3184 – 0.3184 0.4180 Second interim 0.3951 – 0.3951 – 0.3951 0.3686 Third interim 0.4345 – 0.4345 – 0.4345 0.4522 Fourth interim 0.3902 – 0.3902 – 0.3902 0.3360 Fifth interim 0.4840 – 0.4840 – 0.4840 0.3637 Sixth interim 0.4739 – 0.4739 – 0.4739 0.3769
Group 2 (c) (c) (c) (c) (c) (c)
First interim 0.3184 – 0.3184 – 0.3184 0.4180 Second interim 0.3951 – 0.3951 – 0.3951 0.3686 Third interim – – – 0.4345 0.4345 0.4522 Fourth interim 0.2395 – 0.2395 0.1507 0.3902 0.3360 Fifth interim 0.3837 – 0.3837 0.1003 0.4840 0.3637 Sixth interim 0.4739 – 0.4739 – 0.4739 0.3769
H-I/AG (EUR) – Gross Shares
Distributions DistributionsGross Income Net paid/payable to paid to
revenue tax revenue Equalisation 31/08/2016 31/08/2015
Group 1 (c) (c) (c) (c) (c) (c)
First interim 0.3161 – 0.3161 – 0.3161 0.4246 Second interim 0.4036 – 0.4036 – 0.4036 0.3755 Third interim 0.4267 – 0.4267 – 0.4267 0.4588 Fourth interim 0.3851 – 0.3851 – 0.3851 0.3237 Fifth interim 0.4923 – 0.4923 – 0.4923 0.3734 Sixth interim 0.4847 – 0.4847 – 0.4847 0.3778
Group 2 (c) (c) (c) (c) (c) (c)
First interim 0.1562 – 0.1562 0.1599 0.3161 0.4246 Second interim 0.4036 – 0.4036 – 0.4036 0.3755 Third interim 0.1827 – 0.1827 0.2440 0.4267 0.4588 Fourth interim 0.1805 – 0.1805 0.2046 0.3851 0.3237 Fifth interim 0.4923 – 0.4923 – 0.4923 0.3734 Sixth interim 0.4847 – 0.4847 – 0.4847 0.3778
H-I/DG (EUR) – Gross Shares
Distributions DistributionsGross Income Net paid/payable to paid to
revenue tax revenue Equalisation 31/08/2016 31/08/2015
Group 1 (c) (c) (c) (c) (c) (c)
First interim 0.2817 – 0.2817 – 0.2817 0.3930 Second interim 0.3566 – 0.3566 – 0.3566 0.3459 Third interim 0.3735 – 0.3735 – 0.3735 0.4213 Fourth interim 0.3372 – 0.3372 – 0.3372 0.2960 Fifth interim 0.4252 – 0.4252 – 0.4252 0.3442 Sixth interim 0.4186 – 0.4186 – 0.4186 0.3433
Group 2 (c) (c) (c) (c) (c) (c)
First interim 0.1385 – 0.1385 0.1432 0.2817 0.3930 Second interim 0.3566 – 0.3566 – 0.3566 0.3459 Third interim 0.1581 – 0.1581 0.2154 0.3735 0.4213 Fourth interim 0.1636 – 0.1636 0.1736 0.3372 0.2960 Fifth interim 0.1418 – 0.1418 0.2834 0.4252 0.3442 Sixth interim 0.0904 – 0.0904 0.3282 0.4186 0.3433

NGAM Investment Funds U.K. ICVC
Loomis Sayles Strategic Income Fund
9Semi-Annual Short Report
Distribution TableFor the period 1 January 2016 to 30 June 2016 (unaudited)
H-N/A (GBP) – Net Shares
Distributions DistributionsGross Income Net paid/payable to paid to
revenue tax revenue Equalisation 31/08/2016 31/08/2015
Group 1 (p) (p) (p) (p) (p) (p)
First interim 0.3148 0.0630 0.2518 – 0.2518 0.3284 Second interim 0.3971 0.0794 0.3177 – 0.3177 0.2865 Third interim 0.4110 0.0822 0.3288 – 0.3288 0.3583 Fourth interim 0.3641 0.0728 0.2913 – 0.2913 0.2521 Fifth interim 0.4651 0.0930 0.3721 – 0.3721 0.2865 Sixth interim 0.5050 0.1010 0.4040 – 0.4040 0.2885
Group 2 (p) (p) (p) (p) (p) (p)
First interim 0.1206 0.0241 0.0965 0.1553 0.2518 0.3284 Second interim 0.2259 0.0452 0.1807 0.1370 0.3177 0.2865 Third interim 0.1930 0.0386 0.1544 0.1744 0.3288 0.3583 Fourth interim 0.1989 0.0398 0.1591 0.1322 0.2913 0.2521 Fifth interim 0.3330 0.0666 0.2664 0.1057 0.3721 0.2865 Sixth interim 0.2890 0.0578 0.2312 0.1728 0.4040 0.2885
N/D (GBP) – Net Shares
Distributions DistributionsGross Income Net paid/payable to paid to
revenue tax revenue Equalisation 31/08/2016 31/08/2015
Group 1 (p) (p) (p) (p) (p) (p)
First interim 0.3114 0.0623 0.2491 – 0.2491 0.3207 Second interim 0.3949 0.0790 0.3159 – 0.3159 0.2760 Third interim 0.4131 0.0826 0.3305 – 0.3305 0.3510 Fourth interim 0.3621 0.0724 0.2897 – 0.2897 0.2475 Fifth interim 0.4524 0.0905 0.3619 – 0.3619 0.2715 Sixth interim 0.5004 0.1001 0.4003 – 0.4003 0.2718
Group 2 (p) (p) (p) (p) (p) (p)
First interim 0.1743 0.0349 0.1394 0.1097 0.2491 0.3207 Second interim 0.2039 0.0408 0.1631 0.1528 0.3159 0.2760 Third interim 0.2276 0.0455 0.1821 0.1484 0.3305 0.3510 Fourth interim 0.1341 0.0268 0.1073 0.1824 0.2897 0.2475 Fifth interim 0.1521 0.0304 0.1217 0.2402 0.3619 0.2715 Sixth interim 0.2346 0.0469 0.1877 0.2126 0.4003 0.2718
H-N/D (GBP) – Net Shares
Distributions DistributionsGross Income Net paid/payable to paid to
revenue tax revenue Equalisation 31/08/2016 31/08/2015
Group 1 (p) (p) (p) (p) (p) (p)
First interim 0.2850 0.0570 0.2280 – 0.2280 0.3083 Second interim 0.3603 0.0721 0.2882 – 0.2882 0.2683 Third interim 0.3723 0.0745 0.2978 – 0.2978 0.3346 Fourth interim 0.3270 0.0654 0.2616 – 0.2616 0.2341 Fifth interim 0.4170 0.0834 0.3336 – 0.3336 0.2657 Sixth interim 0.4515 0.0903 0.3612 – 0.3612 0.2670
Group 2 (p) (p) (p) (p) (p) (p)
First interim 0.0635 0.0127 0.0508 0.1772 0.2280 0.3083 Second interim 0.1651 0.0330 0.1321 0.1561 0.2882 0.2683 Third interim 0.1680 0.0336 0.1344 0.1634 0.2978 0.3346 Fourth interim 0.1763 0.0353 0.1410 0.1206 0.2616 0.2341 Fifth interim 0.1646 0.0329 0.1317 0.2019 0.3336 0.2657 Sixth interim 0.2459 0.0492 0.1967 0.1645 0.3612 0.2670

NGAM Investment Funds U.K. ICVC
Loomis Sayles Strategic Income Fund
10 Semi-Annual Short Report
Distribution TableFor the period 1 January 2016 to 30 June 2016 (unaudited)
Q/AG (USD) – Gross Shares
Distributions DistributionsGross Income Net paid/payable to paid to
revenue tax revenue Equalisation 31/08/2016 31/08/2015
Group 1 (c) (c) (c) (c) (c) (c)
First interim 0.3611 – 0.3611 – 0.3611 0.4664 Second interim 0.4421 – 0.4421 – 0.4421 0.4134 Third interim 0.4842 – 0.4842 – 0.4842 0.5045 Fourth interim 0.2804 – 0.2804 – 0.2804 0.3825 Fifth interim 0.5421 – 0.5421 – 0.5421 0.4105 Sixth interim 0.7418 – 0.7418 – 0.7418 0.4274
Group 2 (c) (c) (c) (c) (c) (c)
First interim 0.3611 – 0.3611 – 0.3611 0.4664 Second interim 0.4421 – 0.4421 – 0.4421 0.4134 Third interim 0.4842 – 0.4842 – 0.4842 0.5045 Fourth interim 0.2804 – 0.2804 – 0.2804 0.3825 Fifth interim 0.5421 – 0.5421 – 0.5421 0.4105 Sixth interim 0.7418 – 0.7418 – 0.7418 0.4274
H-I/D (GBP) – Net Shares
Distributions DistributionsGross Income Net paid/payable to paid to
revenue tax revenue Equalisation 31/08/2016 31/08/2015
Group 1 (p) (p) (p) (p) (p) (p)
First interim 0.2846 0.0569 0.2277 – 0.2277 0.2987 Second interim 0.3541 0.0708 0.2833 – 0.2833 0.2522 Third interim – – – – – 0.3319 Fourth interim – – – – – 0.2296 Fifth interim – – – – – 0.2587 Sixth interim – – – – – 0.2603
Group 2 (p) (p) (p) (p) (p) (p)
First interim 0.2846 0.0569 0.2277 – 0.2277 0.2987 Second interim 0.3541 0.0708 0.2833 – 0.2833 0.2522 Third interim – – – – – 0.3319 Fourth interim – – – – – 0.2296 Fifth interim – – – – – 0.2587 Sixth interim – – – – – 0.2603
H-I/A (GBP) – Net Shares
Distributions DistributionsGross Income Net paid/payable to paid to
revenue tax revenue Equalisation 31/08/2016 31/08/2015
Group 1 (p) (p) (p) (p) (p) (p)
First interim 0.2991 0.0598 0.2393 – 0.2393 0.3021 Second interim 0.3704 0.0741 0.2963 – 0.2963 0.2579 Third interim – – – – – 0.3362 Fourth interim – – – – – 0.2347 Fifth interim – – – – – 0.2651 Sixth interim – – – – – 0.2678
Group 2 (p) (p) (p) (p) (p) (p)
First interim 0.2991 0.0598 0.2393 – 0.2393 0.3021 Second interim 0.3704 0.0741 0.2963 – 0.2963 0.2579 Third interim – – – – – 0.3362 Fourth interim – – – – – 0.2347 Fifth interim – – – – – 0.2651 Sixth interim – – – – – 0.2678

NGAM Investment Funds U.K. ICVC
Loomis Sayles Strategic Income Fund
11Semi-Annual Short Report
Distribution TableFor the period 1 January 2016 to 30 June 2016 (unaudited)
I/D (GBP) – Net Shares
Distributions DistributionsGross Income Net paid/payable to paid to
revenue tax revenue Equalisation 31/08/2016 31/08/2015
Group 1 (p) (p) (p) (p) (p) (p)
First interim 0.3238 0.0648 0.2590 – 0.2590 0.3291 Second interim 0.4045 0.0809 0.3236 – 0.3236 0.2825 Third interim – – – – – 0.3548 Fourth interim – – – – – 0.2540 Fifth interim – – – – – 0.2790 Sixth interim – – – – – 0.2784
Group 2 (p) (p) (p) (p) (p) (p)
First interim 0.3238 0.0648 0.2590 – 0.2590 0.3291 Second interim 0.4045 0.0809 0.3236 – 0.3236 0.2825 Third interim – – – – – 0.3548 Fourth interim – – – – – 0.2540 Fifth interim – – – – – 0.2790 Sixth interim – – – – – 0.2784

NGAM Investment Funds U.K. ICVC
Loomis Sayles U.S. Equity Leaders Fund
12 Semi-Annual Short Report
Review of Fund Performance
Investment objective: The investment objective of Loomis Sayles U.S. Equity LeadersFund (the “Fund”) is to achieve long-term growth of capital.
Principal investment strategy: In order to meet its objective, the Fund will invest at least80% of its assets in equity securities of U.S. companies. TheFund focuses on stocks of large capitalisation companies,but the Fund may invest in companies of any size.
The Fund’s equity investments include common stocks,preferred stocks and equity-related instruments.
The Fund may invest up to 20% of its assets in equity-linkednotes and convertible bonds issued by U.S. companies aswell as common stocks, preferred stocks, equity-linkednotes, convertible bonds and other equity-relatedinstruments issued by non-U.S. companies traded onnon-U.S. exchanges or as depositary receipts. The Fund mayinvest no more than 10% of its assets in undertakings forcollective investment.
The Fund normally invests across a wide range of sectorsand industries. Loomis, Sayles & Company, L.P., theInvestment Manager, employs a growth style of equitymanagement that emphasises companies with sustainablecompetitive advantages, secular long-term cash flow growth,returns on invested capital above their cost of capital and theability to manage for profitable growth that can createlong-term value for Shareholders. The Investment Manageraims to invest in companies when they trade at a significantdiscount to the estimate of intrinsic value.
For a more complete description of the investmentpolicy and risks relevant to each Fund, please refer to thelatest version of the Company Prospectus.
Fund Manager’s ReportThe Fund underperformed its Comparative Index in thesix-month period ended 30 June 2016.
The Fund’s underperformance was primarily due to stockselection in the consumer staples, financials and healthcaresectors. Stock selection in the information technology,consumer discretionary and industrials sectors contributed torelative performance.
Autodesk, a leader in 3D design software, was the largestdetractor from performance during the period. The companydemonstrated further progress in transitioning to acloud-computing model, reporting solid growth in key metricssuch as new subscribers and annualized recurring revenue.After August 31, 2016, Autodesk will discontinue selling newperpetual licenses for its software products and offersubscription-only access via cloud computing. Althoughnear-term margins are pressured as the business modeltransitions, longer-term we believe the subscription-basedrevenue will generate a higher lifetime customer value,expanding margins, and greater free cash flow. Over ourinvestment time horizon, we believe Autodesk will be able togrow revenues in the high single digits and generatedouble-digit free cash flow growth.
Asset manager SEI Investments reported solid revenuegrowth during the period. Despite weak market performancein January, management reiterated its decision to augmentcapital investments in sales, operational capacity andtechnology, which pressured the company’s share price withconcerns over near-term profitability. Share prices somewhat
recovered in the second half of the period when reportedearnings exceeded expectations and net new sales eventshad the second highest quarter since 2010. SEI ended theperiod with $683.6 billion in assets under management andassets under administration. Over our investment timehorizon, we believe SEI will be able to grow margins fasterthan revenue and generate double-digit free cash flow growth.
Novo Nordisk, a leader in diabetes treatments, reportedfundamentally solid growth during the period led by strongadoption of Victoza and market share gains by Levemir in theUS. Positive recent clinical trial data further strengthened thegrowth opportunity for Tresiba, the company’snext-generation basal insulin therapy. However, managementlowered its guidance for long-term growth in operatingprofits to better reflect future investments required to extendits competitive moat. Shares were further pressured whenthe company released mixed results of a cardiovascularoutcomes study of Victoza. In our view, the strength of thecompany and its future opportunity have not diminished.
Conversely, Oracle was the largest contributor toperformance. The leader in the enterprise software anddatabase market reported rapid revenue growth and strongnew bookings in its cloud-computing business, helping tooffset revenue declines in its conventional database software.With an annual revenue run rate of over $2.7 billion, the company has become a sizable player in cloudservices. Despite the near-term declines in operating marginsdue to the impact of this major business model transition,Oracle’s financials are strong and during the past 12 monthsthe company generated $12.4 billion in free cash flow,representing 139% of net income. As the subscription-basedcloud-computing services model matures and increases insales mix, we believe Oracle will realize stronger revenue,margins, earnings and free cash flow growth.
Social media company Facebook reported robust growth inall key metrics including revenue, margins, earnings and freecash flow growth. The company continued to take marketshare with its growth more than three times its onlinecompetitors and many multiples faster than traditionaladvertisers. Mobile advertising revenue increased to 82% oftotal advertising revenue, up from 78% at the end of theprevious period. Facebook’s platform has impressive scale,ending the period with 1.65 billion users, with about 66% ofusers engaging daily with the platform and 87% residingoutside North America. Mobile users totaled 1.5 billion withabout 66% engaging daily. We believe Facebook is wellpositioned to benefit from the global secular shift fromtraditional advertising to online advertising.
Cisco Systems reported strong revenue growth withoperating margins surpassing the nine-year high achieved inlate 2015. The network provider is successfully migrating todata networking products delivered in both on-premise andcloud-based models. First introduced three years ago, Cisco’sSDN (software-defined-network) offering reached a $2.25 billion annual revenue run rate. Its continued robustadoption drove an increase in recurring revenue. Over time,the subscription-based revenue of its software and servicesbusiness will drive more recurring revenue and profitability.With its decades of know-how, Cisco has broadened itsarchitectural approach to deliver an unmatched solution.Cisco is well positioned to benefit from the growth in cloudcomputing and new networking architectures.

NGAM Investment Funds U.K. ICVC
Loomis Sayles U.S. Equity Leaders Fund
13Semi-Annual Short Report
Period Performance%
Share Class N/A GBP 10.94
S&P 500 Index TR GBP 14.49
Risk and Reward Profile
The risk and reward category is indicated using historicaldata which may not be a reliable indicator of the Fund’sfuture risk profile. Due to its investment in equity markets,the Fund may experience significant range and frequency ofprice movements (volatility), as expressed by its rank on theabove scale.
The risk category shown is not guaranteed and may shiftover time. There is no capital guarantee or protection on thevalue of the Fund. The lowest category does not mean“risk free”.
For further information on specific risks applicable to eachFund, please refer to the latest version of the Prospectus.
Sector Breakdown30.06.16 31.12.15
Portfolio of Investments % %
Information Technology 36.15 35.23
Consumer Staples 17.06 16.90
Consumer Discretionary 14.95 16.41
Health Care 10.76 11.44
Financials 8.87 9.72
Industrials 6.97 6.64
Energy 2.65 2.38
Derivatives – –
Investment assets 97.41 98.72
Net other assets 2.59 1.28
Total net assets 100.00 100.00
Top Ten Holdings30.06.16
%
Amazon.com 6.28
Facebook 5.96
Oracle 5.18
Visa 5.14
Cisco Systems 5.12
Monster Beverage 4.59
Alibaba ADR 4.38
Qualcomm 4.04
Coca-Cola 3.74
Procter & Gamble 3.55
31.12.15%
Amazon 6.90
Facebook 5.75
Visa 5.28
Cisco Systems 5.16
Oracle 4.72
Monster Beverage 4.31
Alibaba ADR 3.96
Qualcomm 3.75
Coca-Cola 3.70
Procter & Gamble 3.41
Portfolio MovementsFor the six months ending 30 June 2016
£’000
Total purchases for the period 95,492
Major purchases Cost
Alibaba ADR 7,539
Danone ADR 5,749
Novo Nordisk ADR 5,232
Facebook 4,780
Amazon.com 4,389
Visa 4,292
Oracle 4,151
Cisco Systems 3,917
SABMiller ADR 3,660
Monster Beverage 3,541
£’000
Total sales for the period 25,059
Major sales Proceeds
Alibaba ADR 3,769
Danone ADR 3,262
Novo Nordisk ADR 2,969
SABMiller ADR 2,210
Novartis ADR 1,836
Lowe's 1,831
ARM ADR 1,277
Amazon.com 952
Facebook 582
Cisco Systems 513
Stocks shown as ADRs represent American DepositaryReceipts.
The fund has a valuation currency in USD and this has beenconverted to GBP.
Lower risk
Typically lower rewards
Higher risk
Typically higher rewards
1 2 3 4 5 6 7
Review of Fund Performance

Net asset value and ongoing charges figure30.06.16 31.12.15 31.12.14 31.12.13
I/A (GBP) – Net Shares
Closing net asset value (£’000) 36,400 11,293 888 3 Closing number of shares 21,711,960 7,480,783 683,086 3,000 Closing net asset value per share (p) 167.65 150.96 130.01 109.62 Operating charges 0.80% 0.80% 0.80% 0.80%
I/A (USD) – Net Shares
Closing net asset value (£’000) 10,538 6,858 1,156 29 Closing number of shares 9,762,217 7,055,576 1,381,364 40,974 Closing net asset value per share (c) 145.59 144.04 130.60 116.57 Operating charges 0.80% 0.80% 0.80% 0.80%
N/A (GBP) – Net Shares
Closing net asset value (£’000) 68,329 7,317 159 3 Closing number of shares 40,169,170 4,772,630 120,272 3,046 Closing net asset value per share (p) 170.10 153.30 132.24 111.72 Operating charges 1.00% 1.00% 1.00% 1.00%
Q/A (GBP) – Net Shares
Closing net asset value (£’000) 53,868 56,710 46,046 18,964 Closing number of shares 31,043,893 36,330,588 34,374,745 16,882,579 Closing net asset value per share (p) 173.52 156.10 133.95 112.33 Operating charges 0.60% 0.60% 0.25% 0.25%
Q/A (USD) – Net Shares
Closing net asset value (£’000) 8,488 4,481 15,674 11,544Closing number of shares 7,383,385 4,331,853 17,623,562 15,477,729Closing net asset value per share (c) 155.05 153.28 138.82 123.24Operating charges 0.60% 0.60% 0.25% 0.25%
I/A (GBP) – Net shares, I/A (USD) – Net shares, N/A (GBP) – Net shares, Q/A (GBP) – Net shares, Q/A (USD) – Net shares were launched on10 June 2013.
Comparative Table(Unaudited)
As at 30 June 2016
NGAM Investment Funds U.K. ICVC
Loomis Sayles U.S. Equity Leaders Fund
14 Semi-Annual Short Report

NGAM Investment Funds U.K. ICVC
H2O MultiReturns Fund
15Semi-Annual Short Report
Review of Fund Performance
Investment objective: The H2O MultiReturns Fund (the “Fund”) seeks tooutperform 1-month GBP LIBOR by 4% p.a. over arecommended investment horizon of 3 years, less theongoing charges ratio.
Principal investment strategy: In order to meet its objective, the Fund seeks diversificationof its assets among asset classes, markets, strategies andtime horizons and does so within a risk allocation frameworkin the global fixed income, equity and currency markets.
The Fund may invest up to 100% of its assets in fixedincome securities and money market instruments issued orguaranteed by sovereign governments and corporationsincluding fixed income securities issued or guaranteed bysovereign governments of non-OECD countries and fixedincome securities rated below Investment-Grade as well aszero coupons bonds, certificates of deposit and commercialpaper.
The Fund may invest no more than 20% of its assets inInvestment-Grade collateralized bonds includingasset-backed securities and mortgage-backed securities.
In connection with its views on interest rates, theInvestment Manager may use derivatives, such as CDX, onone or more bond markets and/or may use derivatives linkedto interest rates, such as swaps, futures, options, amongothers, in order to adjust the interest rate sensitivity of theFund’s portfolio, which includes establishing a short position.
The Fund may invest up to 30% of its assets in equitysecurities of companies on a global basis. The Fund’s equityinvestments include common stocks, preferred stocks,depositary receipts, warrants and other equity-relatedinstruments.
In connection with its views on equity markets, theInvestment Manager may reduce the Fund’s exposure toequities, which includes establishing a short position,through the use of derivatives such as futures, contracts fordifference, options, among others, on one or more stocks orstock indexes. Any short position is limited to 30% of theFund’s assets.
The Fund may invest up to 10% of its net assets in collectiveinvestment schemes. The Fund will also invest in derivativeinstruments in order to gain exposure to these assetsincluding CDS, CDX, contracts for difference, swaps, futures,forwards and options, as further detailed under the sectionentitled “Use of derivatives or other investment techniquesand instruments” below.
The Fund may be exposed to any currency includingcurrencies of non-OECD countries. The dynamicmanagement of the Fund seeks to extract performance indifferent market environments. To this end, H2O AssetManagement, the Investment Manager determines itsmarket views based on macroeconomic, valuation and flowconsiderations among various financial markets in order toestablish the investment strategy and takes long and shortpositions across global debt, equity and currency markets.
The Fund’s performance is expected primarily frominvestment strategies that seek to capture relative trendsamong markets (implemented through relative valuepositions and arbitrage strategies). Strategies that seek tobenefit from the general direction of the markets (directionalstrategies) are secondary sources of performance.
In the implementation of the investment strategy, theInvestment Manager makes judgments on asset classvaluations, interest rate movements and currencies andexpresses those judgments through various types ofinvestment decisions. Investment decisions reflecting theInvestment Manager’s judgment that a certain investmenthas a more attractive valuation than another are expected tomake a profit as those valuations return to what theInvestment Manager believes are normal levels; thesedecisions are typically known as a relative value or arbitragestrategies. Investment decisions reflecting the InvestmentManager’s judgment that a certain investment is over- orunder-valued are expected to make a profit as theinvestment’s price falls or rises; these are typically known asdirectional strategies.
For a more complete description of the risks relevant toeach Fund, please refer to the latest version of theCompany Prospectus.
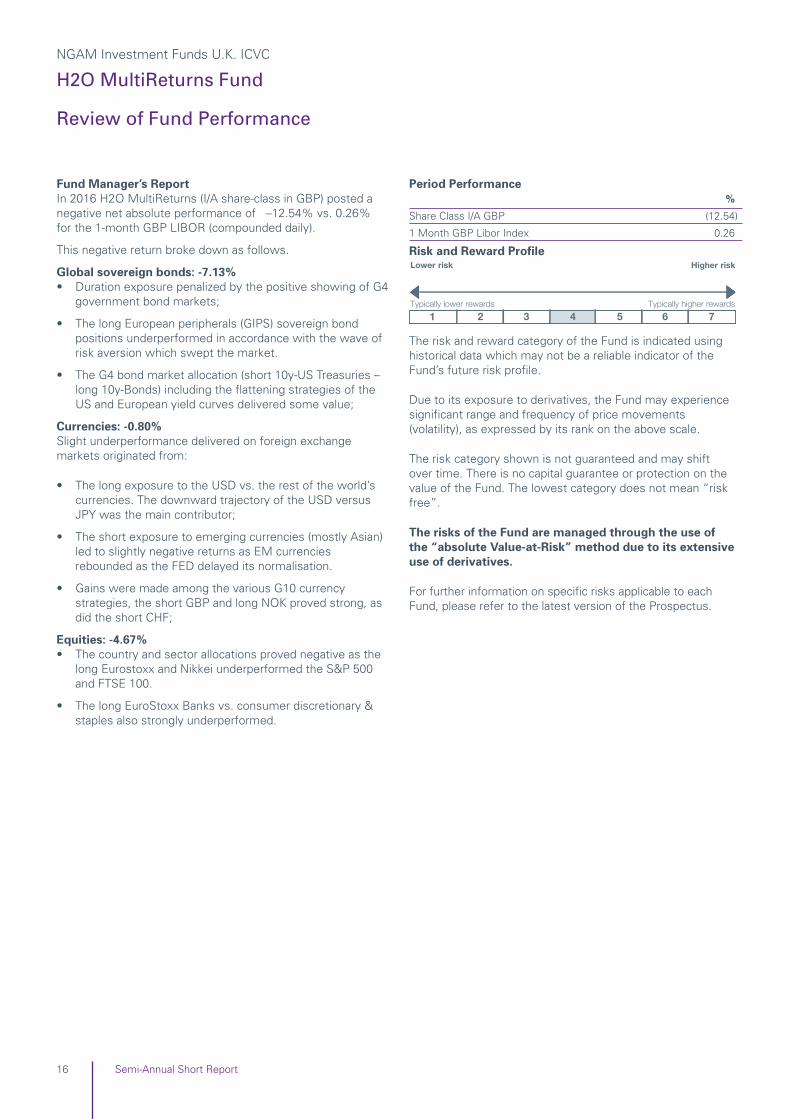
Fund Manager’s ReportIn 2016 H2O MultiReturns (I/A share-class in GBP) posted anegative net absolute performance of –12.54% vs. 0.26%for the 1-month GBP LIBOR (compounded daily).
This negative return broke down as follows.
Global sovereign bonds: -7.13%• Duration exposure penalized by the positive showing of G4
government bond markets;
• The long European peripherals (GIPS) sovereign bondpositions underperformed in accordance with the wave ofrisk aversion which swept the market.
• The G4 bond market allocation (short 10y-US Treasuries –long 10y-Bonds) including the flattening strategies of theUS and European yield curves delivered some value;
Currencies: -0.80%Slight underperformance delivered on foreign exchangemarkets originated from:
• The long exposure to the USD vs. the rest of the world’scurrencies. The downward trajectory of the USD versusJPY was the main contributor;
• The short exposure to emerging currencies (mostly Asian)led to slightly negative returns as EM currenciesrebounded as the FED delayed its normalisation.
• Gains were made among the various G10 currencystrategies, the short GBP and long NOK proved strong, asdid the short CHF;
Equities: -4.67%• The country and sector allocations proved negative as the
long Eurostoxx and Nikkei underperformed the S&P 500and FTSE 100.
• The long EuroStoxx Banks vs. consumer discretionary &staples also strongly underperformed.
Period Performance%
Share Class I/A GBP (12.54)
1 Month GBP Libor Index 0.26
Risk and Reward Profile
The risk and reward category of the Fund is indicated usinghistorical data which may not be a reliable indicator of theFund’s future risk profile.
Due to its exposure to derivatives, the Fund may experiencesignificant range and frequency of price movements(volatility), as expressed by its rank on the above scale.
The risk category shown is not guaranteed and may shiftover time. There is no capital guarantee or protection on thevalue of the Fund. The lowest category does not mean “riskfree”.
The risks of the Fund are managed through the use ofthe “absolute Value-at-Risk” method due to its extensiveuse of derivatives.
For further information on specific risks applicable to eachFund, please refer to the latest version of the Prospectus.
1 2 3 4 5 6 7
Lower risk
Typically lower rewards
Higher risk
Typically higher rewards
Review of Fund Performance
NGAM Investment Funds U.K. ICVC
H2O MultiReturns Fund
16 Semi-Annual Short Report

NGAM Investment Funds U.K. ICVC
H2O MultiReturns Fund
17Semi-Annual Short Report
Sector Breakdown30.06.16 31.12.15
Portfolio of Investments % %
Euro Denominated Bonds 50.21 37.99
Sterling Denominated Bonds 37.08 34.16
US Dollar Denominated Bonds 5.31 2.89
Mexican Peso Denominated Bonds 1.76 0.35
Australian Dollar Denominated Bonds 0.13 0.11
Options 0.01 0.15
Forward Currency Contracts (1.48) (1.10)
Futures (4.71) 0.33
Investment assets 88.31 74.88
Net other assets 11.69 25.12
Total net assets 100.00 100.00
Top Ten Holdings
30.06.16%
Hellenic Republic Government Bond 4.75% 17/04/2019 12.44
Portugal Obrigacoes do Tesouro 2.875% 15/10/2025 9.06
Italy Buoni Poliennali del Tesoro 4.75% 01/09/2044 5.43
Portugal Obrigacoes do Tesouro 4.1% 15/02/2045 4.48
Instituto de Credito Oficial 0% 07/07/2016 4.37
Commerzbank 0% 15/072016 4.37
Legal & General 0% 11/08/2016 4.37
Weir 0% 09/08/2016 4.37
Santander Commercial Paper 0% 31/08/2016 4.37
BBVA Senior Finance Sociedad 0% 07/11/2016 4.36
31.12.15%
Portugal Obrigacoes do Tesouro 2.875% 15/10/2025 6.84
Portugal Obrigacoes do Tesouro 4.1% 15/02/2045 5.11
Hellenic Republic Government Bond 4.75% 17/04/2019 4.66
Italy Buoni Poliennali del Tesoro 4.75% 01/09/2044 4.48
Santander Commercial Paper 0% 29/01/2016 4.30
SSE 0% 18/02/2016 4.30
SBAB Statens Bostadsfinansier 0% 14/01/2016 3.44
Paccar Financial Europe 0% 15/01/2016 3.44
Portugal Obrigacoes do Tesouro 5.65% 15/02/2024 2.21
Land Securities 0% 29/01/2016 2.15
Portfolio MovementsFor the six months ending 30 June 2016
£’000
Total purchases for the period 252,359
Major purchases Cost
Legal & General 0% 11/08/2016 19,974
Weir 0% 08/02/2016 19,960
Hellenic Republic Government Bond 4.75% 17/04/2019 17,334
DGZ Dekabank 0% 03/03/2016 16,987
Land Securities 0% 23/03/2016 9,996
Land Securities 0% 29/02/2016 9,995
SSE 0% 08/02/2016 9,995
BP Capital Markets 0% 21/06/2016 9,989
Matchpoint Finance 0% 24/02/2016 9,985
VINCI 0% 18/05/2016 9,982
£’000
Total sales for the period 224,624
Major sales Proceeds
Santander Commercial Paper 0% 29/01/2016 20,000
SSE 0% 18/02/2016 20,000
Land Securities 0% 29/01/2016 18,000
DGZ Dekabank 0% 03/03/2016 17,000
Land Securities 0% 23/03/2016 15,000
Weir 0% 08/02/2016 15,000
BP Capital Markets 0% 21/06/2016 10,000
Legal & General 0% 11/05/2016 10,000
Matchpoint Finance 0% 24/02/2016 10,000
VINCI 0% 18/05/2016 10,000
Review of Fund Performance

NGAM Investment Funds U.K. ICVC
H2O MultiReturns Fund
18 Semi-Annual Short Report
Review of Fund Performance
Portfolio Credit Rating AnalysisMarket Value Total net
Rating block £’000 assets %
Investment grade 47,622 20.83Non-Investment grade 101,582 44.43Unrated 66,871 29.23Total of debt securities 216,075 94.49Forward currency contracts (3,365) (1.48)Futures (10,763) (4.71)Options 21 0.01
Investment assets (including investment liabilities) 201,968 88.31
Net other assets 26,742 11.69
Net assets 228,710 100.00

NGAM Investment Funds U.K. ICVC
H2O MultiReturns Fund
19Semi-Annual Short Report
Comparative Table(Unaudited)
As at 30 June 2016
Net asset value and ongoing charges figure30.06.16 31.12.15 31.12.14 31.12.13
I/A (GBP) – Net Shares
Closing net asset value (£’000) 71,122 101,956 27,002 3 Closing number of shares 58,202,293 72,874,009 23,321,107 3,000 Closing net asset value per share (p) 122.20 139.91 115.78 102.81 Operating charges 0.80% 0.80% 0.80% 0.80%
N/D (GBP) – Net Shares
Closing net asset value (£’000) 12,443 8,419 1,038 3 Closing number of shares 10,672,546 6,256,846 918,150 3,049 Closing net asset value per share (p) 116.59 134.56 113.11 102.44 Operating charges 1.00% 1.00% 1.00% 1.00%
I/D (GBP) – Net Shares
Closing net asset value (£’000) 73,264 75,198 11,407 3 Closing number of shares 62,868,763 55,902,881 10,086,286 3,000 Closing net asset value per share (p) 116.54 134.51 113.09 102.43 Operating charges 0.80% 0.80% 0.80% 0.80%
N/A (GBP) – Net Shares
Closing net asset value (£’000) 71,881 46,796 3,045 3 Closing number of shares 59,026,248 33,538,037 2,635,023 3,049 Closing net asset value per share (p) 121.78 139.53 115.56 102.77 Operating charges 1.00% 1.00% 1.00% 1.00%
Q/A (GBP) – Net Shares
Closing net asset value (£’000) – – 14,548 12,862 Closing number of shares – – 12,500,000 12,500,000 Closing net asset value per share (p) – – 116.39 102.90 Operating charges – – 0.25% 0.25%
I/A (GBP) – Net shares, N/D (GBP) – Net shares, I/D (GBP) – Net shares, N/A (GBP) – Net shares were launched on 16 October 2013.
Q/A (GBP) – Net shares were launched on 16 October 2013 and closed on 15 September 2015.
NGAM Investment Funds U.K. ICVC
H2O MultiReturns Fund
20 Semi-Annual Short Report
NGAM Investment Funds U.K. ICVC
H2O MultiReturns Fund
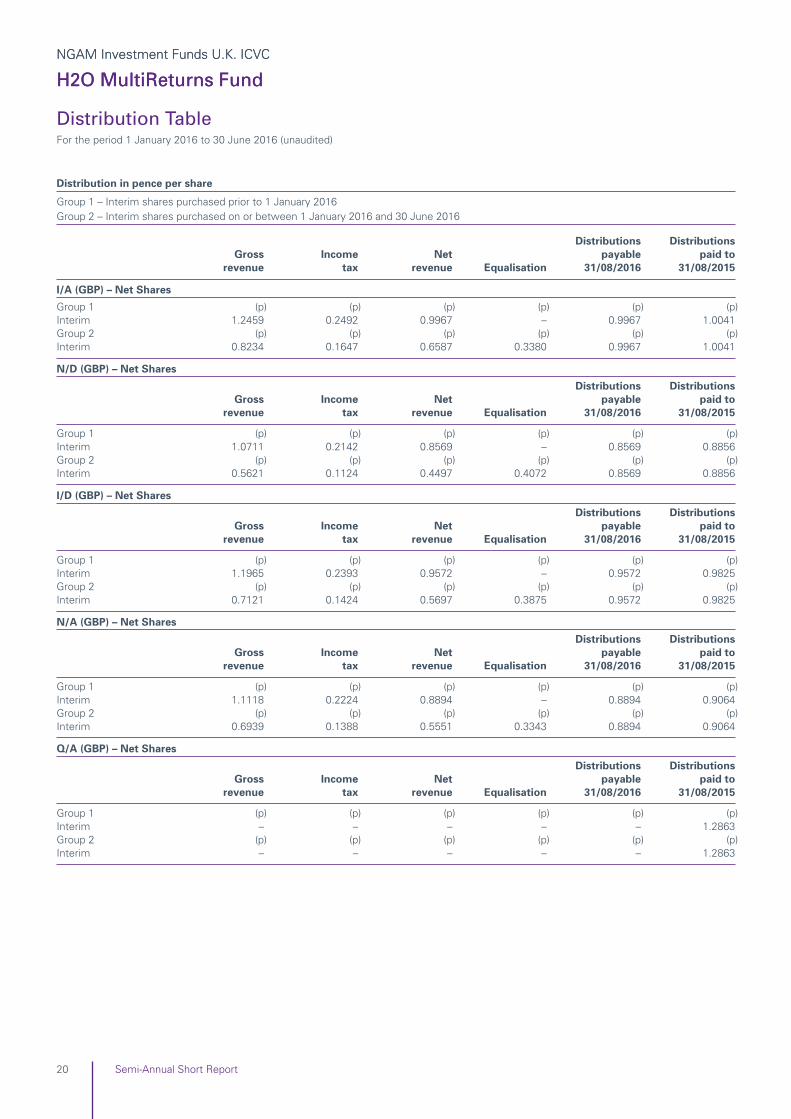
Distribution in pence per share
Group 1 – Interim shares purchased prior to 1 January 2016Group 2 – Interim shares purchased on or between 1 January 2016 and 30 June 2016
Distributions DistributionsGross Income Net payable paid to
revenue tax revenue Equalisation 31/08/2016 31/08/2015
I/A (GBP) – Net Shares
Group 1 (p) (p) (p) (p) (p) (p)Interim 1.2459 0.2492 0.9967 – 0.9967 1.0041 Group 2 (p) (p) (p) (p) (p) (p)Interim 0.8234 0.1647 0.6587 0.3380 0.9967 1.0041
N/D (GBP) – Net Shares
Distributions DistributionsGross Income Net payable paid to
revenue tax revenue Equalisation 31/08/2016 31/08/2015
Group 1 (p) (p) (p) (p) (p) (p)Interim 1.0711 0.2142 0.8569 – 0.8569 0.8856 Group 2 (p) (p) (p) (p) (p) (p)Interim 0.5621 0.1124 0.4497 0.4072 0.8569 0.8856
I/D (GBP) – Net Shares
Distributions DistributionsGross Income Net payable paid to
revenue tax revenue Equalisation 31/08/2016 31/08/2015
Group 1 (p) (p) (p) (p) (p) (p)Interim 1.1965 0.2393 0.9572 – 0.9572 0.9825 Group 2 (p) (p) (p) (p) (p) (p)Interim 0.7121 0.1424 0.5697 0.3875 0.9572 0.9825
N/A (GBP) – Net Shares
Distributions DistributionsGross Income Net payable paid to
revenue tax revenue Equalisation 31/08/2016 31/08/2015
Group 1 (p) (p) (p) (p) (p) (p)Interim 1.1118 0.2224 0.8894 – 0.8894 0.9064 Group 2 (p) (p) (p) (p) (p) (p)Interim 0.6939 0.1388 0.5551 0.3343 0.8894 0.9064
Q/A (GBP) – Net Shares
Distributions DistributionsGross Income Net payable paid to
revenue tax revenue Equalisation 31/08/2016 31/08/2015
Group 1 (p) (p) (p) (p) (p) (p)Interim – – – – – 1.2863 Group 2 (p) (p) (p) (p) (p) (p)Interim – – – – – 1.2863
Distribution TableFor the period 1 January 2016 to 30 June 2016 (unaudited)

NGAM Investment Funds U.K. ICVC
Harris Associates Global Concentrated Equity Fund
21Semi-Annual Short Report
Investment objective: The investment objective of Harris Associates GlobalConcentrated Equity Fund (the “Fund”) is to achievelong-term growth of capital.
Principal investment strategy In order to meet its objective, the Fund will invest at least80% of its assets in equity securities of companies around theworld quoted on Eligible Markets, including emerging markets.The Fund may invest in companies with a market capitalizationgreater than $5 billion at the time of initial purchase.
The Fund’s equity investments include common stocks,preferred stocks and equity-related instruments such aswarrants, rights, equity-linked notes and convertible bonds,as well as depositary receipts for any of those equityinvestments.
The Fund may invest up to 20% of its assets in cash, cashequivalents or other types of securities other than thosedescribed above, including, where permitted in accordancewith FCA Rules, Rule 144A securities. The Fund may investno more than 10% of its assets in collective investmentschemes. The Fund may invest no more than 10% of itsassets in unlisted securities.
The Fund is actively managed and seeks to hold a limitednumber of securities resulting in a concentrated portfolio.The Fund will generally have approximately 20 securities inits portfolio, but may hold more or less securities dependingon investment opportunities. Investing in a limited numberof securities could result in less diversification than fundsthat invest in a larger number of securities.
The Investment Manager, Harris Associates, uses a valueinvestment philosophy in selecting equity securities. Thisinvestment philosophy is based upon the belief that, overtime, a company's stock price converges with thecompany's intrinsic or true business value. By “truebusiness value”, the Investment Manager means anestimate of the price a knowledgeable buyer would pay toacquire the entire business. The Investment Manager usesthis value philosophy to identify companies that it believeshave discounted stock prices compared to the companies’true business values, and thus present the best opportunityto achieve the Fund's investment objective.
On an ancillary basis, the Fund may use derivatives forhedging and investment purposes and enter into securitieslending and borrowing transactions as well as repurchaseagreements transactions and reverse repurchaseagreements, as described in Appendix 1 above (andexceptionally up to 100%).
Under certain exceptional market conditions, the Fund mayhold a significant amount of its assets in cash and/or investin short-term debt securities, time deposits or moneymarket instruments, if the Investment Manager believesthat it would be in the best interest of the Fund and itsShareholders. When the Fund is pursuing a defensivestrategy, it will not be pursuing its investment objective.
For a more complete description of the investmentpolicy and risks relevant to each Fund, please refer tothe latest version of the Company Prospectus.
Fund Manager’s ReportThe Fund returned -5.41% for the six-month period endingon June 30, 2016, and its Comparative Index returned0.66% for the same period.
Top contributor: GlencoreGlencore’s fiscal year 2015 results met management’sguidance. The debt restructuring plan and asset sales areproceeding as management expected, and its aggressivestrategy to deleverage the balance sheet is progressing.Glencore benefited as well from positive analysts’ notes onthe mining sector that cited recovering commodities prices,improved demand from China and attractiveness versusother sectors. We believe that Glencore possesses one ofthe strongest management teams in its field who are goodstewards of shareholder value.
Bottom detractor: Credit SuisseCredit Suisse has faced some significant challenges in themidst of its restructuring, and its fourth-quarter earningswere weak, as expected. However, there were a fewnegative surprises, which prompted management toaccelerate the improvement plan and reduction of non-coreinvestment banking lines of businesses. Its first-quarterresults showed some improvement, as its cost cuts wereahead of schedule, while net new money and revenuesgrew in the private banking businesses despite the low(and/or negative) interest rate environment along withgenerally challenging market conditions. Lastly, the U.K.’sdecision to exit the European Union pressured CreditSuisse’s share price. We believe it is important that the bankderives minimal revenues (2%) from the U.K. and 13% of itscosts are denominated in pound sterling currency, the netresult of which may be somewhat positive for profitability.While near-term results may suffer, we continue to believethat Credit Suisse is a compelling investment.
Markets and Investment ClimateDuring the past six months, central bank actions (the FederalReserve’s decision to leave U.S. interest rates unchangedand the implementation of negative interest rates andexpanded stimulus measures by the European Central Bankand the Bank of Japan) as well as the U.K.’s vote to exit theEuropean Union caused bouts of market instability. For us,volatility in global markets has translated to investmentopportunities in undervalued companies. We continue tobelieve current conditions are favorable for long-terminvestment success, and we strive to stay disciplined andpatient during times when others grow restless.
Period Performance%
Share Class I/A USD (5.41)
MSCI World NR USD 0.66
Review of Fund Performance

Risk and Reward Profile
The risk and reward category of the Fund is indicated usinghistorical data which may not be a reliable indicator of theFund’s future risk profile. Due to its investment in fixedincome markets, the Fund may experience significant rangeand frequency of price movements (volatility), as expressedby its rank on the above scale.
The risk category shown is not guaranteed and may shiftover time. There is no capital guarantee or protection on thevalue of the Fund. The lowest category does not mean “riskfree”.
Sector Breakdown30.06.16 31.12.15
Portfolio of Investments % %
United States of America 33.22 36.68
Switzerland 13.46 10.53
Japan 9.84 10.61
Germany 9.10 11.58
The Netherlands 8.98 9.32
United Kingdom 6.85 6.36
The Channel Islands 6.84 5.13
South Korea 4.36 4.26
France 4.28 4.82
Investment assets 96.93 99.29
Net other assets 3.07 0.71
Total net assets 100.00 100.00
Top Ten Holdings30.06.16
%
Glencore 6.84
American International 6.23
Caterpillar 5.74
CNH Industrial 5.70
Toyota Motor 5.18
General Motors 5.08
LafargeHolcim 4.81
Daimler 4.75
Daiwa Securities 4.66
JPMorgan Chase 4.62
31.12.15%
American International 7.19
Credit Suisse 6.10
Daimler 6.07
General Motors 5.91
Toyota Motor 5.81
Allianz 5.51
Glencore 5.13
Caterpillar 5.04
CNH Industrial 4.92
Kering 4.82
Portfolio MovementsFor the six months ending 30 June 2016
£’000
Total purchases for the period 10,173
Major purchases Cost
LafargeHolcim 869
Credit Suisse 719
American International 593
Toyota Motor 587
Daimler 578
Glencore 542
Diageo 502
Allianz 497
General Motors 493
Caterpillar 482
£’000
Total sales for the period 10,299
Major sales Proceeds
Koninklijke Philips 685
American International 672
Daimler 637
Toyota Motor 635
Glencore 608
Allianz 605
Credit Suisse 590
General Motors 542
Diageo 530
Kering 514
The fund has a valuation currency in USD and this has beenconverted to GBP.
Lower risk
Typically lower rewards
Higher risk
Typically higher rewards
1 2 3 4 5 6 7
NGAM Investment Funds U.K. ICVC
Harris Associates Global Concentrated Equity Fund
22 Semi-Annual Short Report
Review of Fund Performance

NGAM Investment Funds U.K. ICVC
Harris Associates Global Concentrated Equity Fund
23Semi-Annual Short Report
Net asset value and ongoing charges figure30.06.16 31.12.15 31.12.14
I/A (GBP) – Net Shares
Closing net asset value (£’000) 6,704 6,464 3,183 Closing number of shares 6,130,259 6,118,489 2,989,804 Closing net asset value per share (p) 109.36 105.65 106.45 Operating charges 0.95% 0.95% 0.95%
I/A (USD) – Net Shares
Closing net asset value (£’000) 9,503 128 10,617 Closing number of shares 14,832,198 207,254 17,074,038 Closing net asset value per share (c) 86.41 91.68 97.05 Operating charges 0.95% 0.95% 0.95%
N/A (GBP) – Net Shares
Closing net asset value (£’000) 702 495 111 Closing number of shares 645,589 470,591 104,829 Closing net asset value per share (p) 108.71 105.15 106.20 Operating charges 1.20% 1.20% 1.20%
Q/A (USD) – Net Shares
Closing net asset value (£’000) 1,461 10,971 31,301 Closing number of shares 2,248,287 17,535,343 50,000,000 Closing net asset value per share (c) 87.67 92.71 97.71 Operating charges 0.25% 0.25% 0.25%
N/A (USD) – Net Shares
Closing net asset value (£’000) 3 3 3 Closing number of shares 5,000 5,000 5,000 Closing net asset value per share (c) 85.60 90.98 96.79 Operating charges 1.20% 1.20% 1.20%
I/A (GBP) – Net shares, I/A (USD) – Net shares, N/A (GBP) – Net shares, Q/A (USD) – Net shares, N/A (USD) – Net shares were launched on8 July 2014.
Comparative Table(Unaudited)
As at 30 June 2016
NGAM Investment Funds U.K. ICVC
Seeyond Factor Plus Europe Ex U.K. Equity Fund
24 Semi-Annual Short Report
Review of Fund Performance
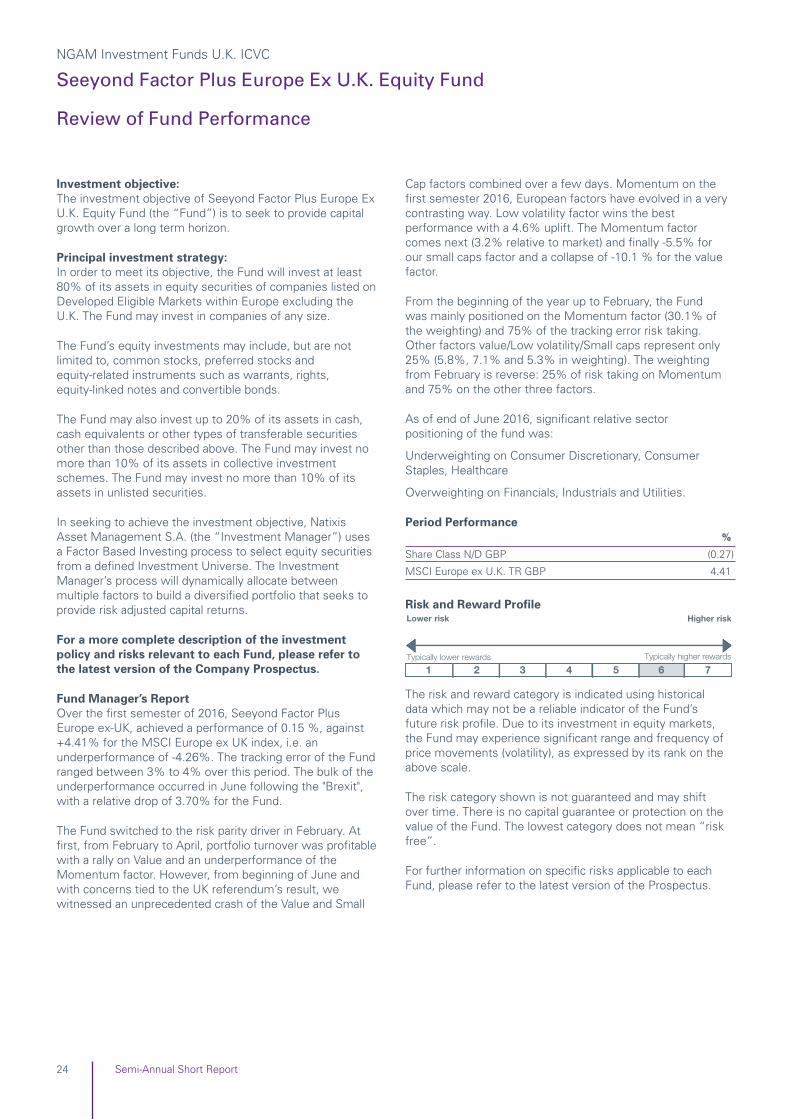
Investment objective: The investment objective of Seeyond Factor Plus Europe ExU.K. Equity Fund (the “Fund”) is to seek to provide capitalgrowth over a long term horizon.
Principal investment strategy: In order to meet its objective, the Fund will invest at least80% of its assets in equity securities of companies listed onDeveloped Eligible Markets within Europe excluding theU.K. The Fund may invest in companies of any size.
The Fund’s equity investments may include, but are notlimited to, common stocks, preferred stocks andequity-related instruments such as warrants, rights,equity-linked notes and convertible bonds.
The Fund may also invest up to 20% of its assets in cash,cash equivalents or other types of transferable securitiesother than those described above. The Fund may invest nomore than 10% of its assets in collective investmentschemes. The Fund may invest no more than 10% of itsassets in unlisted securities.
In seeking to achieve the investment objective, NatixisAsset Management S.A. (the “Investment Manager”) usesa Factor Based Investing process to select equity securitiesfrom a defined Investment Universe. The InvestmentManager’s process will dynamically allocate betweenmultiple factors to build a diversified portfolio that seeks toprovide risk adjusted capital returns.
For a more complete description of the investmentpolicy and risks relevant to each Fund, please refer tothe latest version of the Company Prospectus.
Fund Manager’s ReportOver the first semester of 2016, Seeyond Factor PlusEurope ex-UK, achieved a performance of 0.15 %, against+4.41% for the MSCI Europe ex UK index, i.e. anunderperformance of -4.26%. The tracking error of the Fundranged between 3% to 4% over this period. The bulk of theunderperformance occurred in June following the "Brexit",with a relative drop of 3.70% for the Fund.
The Fund switched to the risk parity driver in February. Atfirst, from February to April, portfolio turnover was profitablewith a rally on Value and an underperformance of theMomentum factor. However, from beginning of June andwith concerns tied to the UK referendum’s result, wewitnessed an unprecedented crash of the Value and Small
Cap factors combined over a few days. Momentum on thefirst semester 2016, European factors have evolved in a verycontrasting way. Low volatility factor wins the bestperformance with a 4.6% uplift. The Momentum factorcomes next (3.2% relative to market) and finally -5.5% forour small caps factor and a collapse of -10.1 % for the valuefactor.
From the beginning of the year up to February, the Fundwas mainly positioned on the Momentum factor (30.1% ofthe weighting) and 75% of the tracking error risk taking.Other factors value/Low volatility/Small caps represent only25% (5.8%, 7.1% and 5.3% in weighting). The weightingfrom February is reverse: 25% of risk taking on Momentumand 75% on the other three factors.
As of end of June 2016, significant relative sectorpositioning of the fund was:
Underweighting on Consumer Discretionary, ConsumerStaples, Healthcare
Overweighting on Financials, Industrials and Utilities.
Period Performance%
Share Class N/D GBP (0.27)
MSCI Europe ex U.K. TR GBP 4.41
Risk and Reward Profile
The risk and reward category is indicated using historicaldata which may not be a reliable indicator of the Fund’sfuture risk profile. Due to its investment in equity markets,the Fund may experience significant range and frequency ofprice movements (volatility), as expressed by its rank on theabove scale.
The risk category shown is not guaranteed and may shiftover time. There is no capital guarantee or protection on thevalue of the Fund. The lowest category does not mean “riskfree”.
For further information on specific risks applicable to eachFund, please refer to the latest version of the Prospectus.
Lower risk
Typically lower rewards
Higher risk
Typically higher rewards
1 2 3 4 5 6 7

NGAM Investment Funds U.K. ICVC
Seeyond Factor Plus Europe Ex U.K. Equity Fund
25Semi-Annual Short Report
Sector Breakdown30.06.16 31.12.15
Portfolio of Investments % %
Switzerland 25.52 17.79
Germany 15.95 22.29
France 15.54 17.18
Italy 8.59 4.49
Spain 8.18 7.74
The Netherlands 6.40 6.64
Sweden 5.39 4.24
Denmark 4.27 7.45
Belgium 2.87 2.42
Ireland 1.88 3.07
Finland 1.23 1.76
Norway 0.79 0.70
Austria 0.78 1.48
Portugal 0.59 0.35
Luxembourg 0.32 0.47
Malta 0.17 –
United Kingdom – 0.60
Bermuda – 0.27
Investment assets 98.47 98.94
Net other assets 1.53 1.06
Total net assets 100.00 100.00
Top Ten Holdings
30.06.16%
Nestle 3.29
Novartis 2.85
Roche 2.76
Enel 1.56
Vinci 1.54
Air Liquide 1.27
Total 1.27
Swiss Life 1.23
Novo Nordisk 1.16
Iberdrola 1.16
31.12.15%
Nestle 3.12
Novartis 2.60
Roche 2.48
International Consolidated Airlines 1.77
Novo Nordisk 1.47
SAP 1.44
Total 1.29
Vestas Wind Systems 1.27
Sanofi 1.22
Fresenius 1.15
Portfolio Movements
For the period ending 30 June 2016
£’000
Total purchases for the period 12,101
Major purchases Cost
STADA Arzneimittel 175
NN 157
Ageas 145
Banca Popolare dell’Emilia Romagna 141
Banca Monte dei Paschi di Siena 133
UBISOFT Entertainment 120
Enel 120
Lonza 119
DSV 117
Wolters Kluwer 114
£’000
Total sales for the period 11,907
Major sales Proceeds
International Consolidated Airlines 172
DSV 162
Capgemini 161
Partners 132
Delhaize 125
Novo Nordisk 121
Koninklijke KPN 117
NN 117
Subsea 7 113
adidas 112
Review of Fund Performance

NGAM Investment Funds U.K. ICVC
Seeyond Factor Plus Europe Ex U.K. Equity Fund
26 Semi-Annual Short Report
Net asset value and ongoing charges figure30.06.16 31.12.15
N/D (GBP) – Net Shares
Closing net asset value (£’000) 3 3Closing number of shares 3,049 3,049Closing net asset value per share (p) 96.34 98.43Operating charges 0.45% 0.45%
N/A (GBP) – Net Shares
Closing net asset value (£’000) 6 3Closing number of shares 5,994 3,049Closing net asset value per share (p) 100.86 100.72Operating charges 0.45% 0.45%
Q/A (GBP) – Net Shares
Closing net asset value (£’000) 10,099 10,080Closing number of shares 10,000,000 10,000,000Closing net asset value per share (p) 100.99 100.80Operating charges 0.35% 0.35%
N/D (GBP) – Net shares, N/A (GBP) – Net shares and Q/A (GBP) – Net shares were launched on 27 January 2015.
Comparative Table(Unaudited)
As at 30 June 2016

NGAM Investment Funds U.K. ICVC
Seeyond Factor Plus Europe Ex U.K. Equity Fund
27Semi-Annual Short Report
Distribution in pence per share
Group 1 Interim shares purchased prior to 1 January 2016Group 2 Interim shares purchased on or between 1 January 2016 and 30 June 2016
N/D (GBP) – Net Shares
Distributions DistributionsNet payable paid to
revenue Equalisation 31/08/2016 31/08/2015
Group 1 (p) (p) (p) (p)
Interim 2.2108 – 2.2108 1.8099
Group 2 (p) (p) (p) (p)
Interim 2.2108 – 2.2108 1.8099
N/A (GBP) – Net Shares
Distributions DistributionsNet payable paid to
revenue Equalisation 31/08/2016 31/08/2015
Group 1 (p) (p) (p) (p)
Interim 2.2616 – 2.2616 1.7968
Group 2 (p) (p) (p) (p)
Interim 0.8579 1.4037 2.2616 1.7968
Q/A (GBP) – Net Shares
Distributions DistributionsNet payable paid to
revenue Equalisation 31/08/2016 31/08/2015
Group 1 (p) (p) (p) (p)
Interim 2.3200 – 2.3200 1.8464
Group 2 (p) (p) (p) (p)
Interim 2.3200 – 2.3200 1.8464
Distribution TableFor the period 1 January 2016 to 30 June 2016 (unaudited)

NGAM Investment Funds U.K. ICVC
Seeyond Factor Plus U.K. Equity Fund
28 Semi-Annual Short Report
Review of Fund Performance
Investment objective: The investment objective of Seeyond Factor Plus U.K. EquityFund (the “Fund”) is to seek to provide capital growth over along term horizon.
Principal investment strategy: In order to meet its objective, the Fund will invest at least80% of its assets in equity securities of companies listed onEligible Markets within the U.K. The Fund may invest incompanies of any size.
The Fund’s equity investments may include, but are notlimited to, common stocks, preferred stocks andequity-related instruments such as warrants, rights,equity-linked notes and convertible bonds.
The Fund may also invest up to 20% of its assets in cash,cash equivalents or other types of transferable securitiesother than those described above. The Fund may invest nomore than 10% of its assets in collective investmentschemes. The Fund may invest no more than 10% of itsassets in unlisted securities.
In seeking to achieve the investment objective, Natixis AssetManagement S.A. (the “Investment Manager”) uses a FactorBased Investing process to select equity securities from adefined Investment Universe7. The Investment Manager’sprocess will dynamically allocate between multiple factors tobuild a diversified portfolio that seeks to provide risk adjustedcapital returns.
For a more complete description of the investmentpolicy and risks relevant to each Fund, please refer to thelatest version of the Company Prospectus.
Fund Manager’s ReportOver S1 2016, Seeyond Factor Plus UK generated aperformance of -4.09%, versus + 4.27% for the FTSE AllShare TR GBP. The Fund’s tracking error ranged between 3%and 4% over the period. Most of the underperformanceoccurred in June following the Brexit.
The Fund switched to the risk parity driver in February. Atfirst, from February to April, portfolio turnover was profitablewith a rally on Value and an underperformance of theMomentum factor. However, from beginning of June andwith concerns tied to the UK referendum’s result, wewitnessed an unprecedented crash of the Value and SmallCap factors combined over a few days.
All of our factors generally underperformed in the UK overthe first semester of 2016: the worst performer remains theValue factor (-9% vs benchmark) followed by Small Caps(-7%), Low Volatility (-4 %) and Momentum (-1%).
At the beginning of the year and before February, the Fundwas mainly positioned on the Momentum factor (20% of theweighting) and 75% of the tracking error risk taking. Theother factors (Value/Low volatility/Small Caps) represent only25% (respectively 5.8%, 6.7% and 6.3% in weighting). Theweighting changed in February: 25% of the risk taking onMomentum and 75% on the other three factors.
Over the period, the sector allocation of the fund was:
Overweighting on consumer discretionary (+ 4.5%) mainlyon Digital and Consumer Services
Underweighting on consumer staples (-4%) mainly on FoodBeverage & Tobacco
Energy underweighting was significantly reduced (from -3%to -0.5% during the semester)
Underweighting on Banks and diversifying Financialsecurities (-3.5% and -2%)
Overweighting on Insurance and Real Estate (+ 2% and + 2%)
Underweighting on Healthcare with an increase in exposure(by -2% to 4% during the semester)
Overweighting on Industrials (including transportation),Technology and Utilities
Period Performance%
Share Class N/D GBP (4.11)
FTSE All Share TR GBP 4.27
Risk and Reward Profile
The risk and reward category is indicated using historical datawhich may not be a reliable indicator of the Fund’s future riskprofile. Due to its investment in equity markets, the Fundmay experience significant range and frequency of pricemovements (volatility), as expressed by its rank on the abovescale.
The risk category shown is not guaranteed and may shiftover time. There is no capital guarantee or protection on thevalue of the Fund. The lowest category does not mean “riskfree”.
For further information on specific risks applicable to eachFund, please refer to the latest version of the Prospectus.
Lower risk
Typically lower rewards
Higher risk
Typically higher rewards
1 2 3 4 5 6 7

NGAM Investment Funds U.K. ICVC
Seeyond Factor Plus U.K. Equity Fund
29Semi-Annual Short Report
Sector Breakdown30.06.16 31.12.15
Portfolio of Investments % %
Financials 20.68 25.12
Consumer Services 16.79 14.62
Consumer Goods 14.56 13.57
Industrials 13.91 17.28
Oil & Gas 11.88 7.52
Health Care 5.61 6.38
Utilities 5.40 3.75
Basic Materials 4.61 3.82
Telecommunications 3.78 4.90
Technology 1.10 2.02
Investment assets 98.32 98.98
Net other assets 1.68 1.02
Total net assets 100.00 100.00
Top Ten Holdings30.06.16
%
Royal Dutch Shell ‘A’ Shares (GBP) 3.26
British American Tobacco 3.17
Royal Dutch Shell 'B' Shares 2.55
GlaxoSmithKline 2.53
BP 2.34
HSBC 2.32
Vodafone 2.15
Reckitt Benckiser 2.08
National Grid 1.92
Diageo 1.88
31.12.15%
HSBC 3.86
GlaxoSmithKline 2.55
BP 2.36
British American Tobacco 2.29
AstraZeneca 2.22
Royal Dutch Shell ‘A’ Shares (GBP) 2.17
Vodafone 2.03
Lloyds Banking 1.89
Diageo 1.56
Reckitt Benckiser 1.47
Portfolio Movements
For the period ending 30 June 2016
£’000
Total purchases for the period 8,386
Major purchases Cost
British American Tobacco 165
GlaxoSmithKline 126
Equinix* 121
Just Eat 120
Vodafone 119
Great Portland Estates* 117
Royal Dutch Shell ‘A’ Shares (GBP) 117
Royal Dutch Shell ‘B’ Shares 109
Travis Perkins 106
Petrofac 106
*Real Estate Investment Trust (REIT)
£’000
Total sales for the period 8,246
Major sales Proceeds
HSBC 161
BG 160
GlaxoSmithKline 157
British American Tobacco 125
AstraZeneca 124
Howden Joinery 119
Vodafone 110
BP 110
Lancashire 107
Balfour Beatty 107
Review of Fund Performance

NGAM Investment Funds U.K. ICVC
Seeyond Factor Plus U.K. Equity Fund
30 Semi-Annual Short Report
Comparative Table(Unaudited)
As at 30 June 2016
Net asset value and ongoing charges figure30.06.16 31.12.15
N/D (GBP) – Net SharesClosing net asset value (£’000) 3 3 Closing number of shares 3,049 3,049 Closing net asset value per share (p) 91.47 97.20 Operating charges 0.45% 0.45%
N/A (GBP) – Net Shares
Closing net asset value (£’000) 8 5 Closing number of shares 8,264 5,250 Closing net asset value per share (p) 96.25 100.32 Operating charges 0.45% 0.45%
Q/A (GBP) – Net Shares
Closing net asset value (£’000) 9,638 10,041 Closing number of shares 10,000,000 10,000,000 Closing net asset value per share (p) 96.38 100.41 Operating charges 0.35% 0.35%
N/D (GBP) – Net shares, N/A (GBP) – Net shares and Q/A (GBP) – Net shares were launched on 27 January 2015.

NGAM Investment Funds U.K. ICVC
Seeyond Factor Plus U.K. Equity Fund
31Semi-Annual Short Report
Distribution in pence per share
Group 1 Interim shares purchased prior to 1 January 2016Group 2 Interim shares purchased on or between 1 January 2016 and 30 June 2016
N/D (GBP) – Net Shares
Distributions DistributionsNet payable paid to
revenue Equalisation 31/08/2016 31/08/2015
Group 1 (p) (p) (p) (p)
Interim 1.7913 – 1.7913 1.8719
Group 2 (p) (p) (p) (p)
Interim 1.7913 – 1.7913 1.8719
N/A (GBP) – Net Shares
Distributions DistributionsNet payable paid to
revenue Equalisation 31/08/2016 31/08/2015
Group 1 (p) (p) (p) (p)
Interim 1.8428 – 1.8428 1.8588
Group 2 (p) (p) (p) (p)
Interim 0.5147 1.3281 1.8428 1.8588
Q/A (GBP) – Net Shares
Distributions DistributionsNet payable paid to
revenue Equalisation 31/08/2016 31/08/2015
Group 1 (p) (p) (p) (p)
Interim 1.8982 – 1.8982 1.9080
Group 2 (p) (p) (p) (p)
Interim 1.8982 – 1.8982 1.9080
Distribution TableFor the period 1 January 2016 to 30 June 2016 (unaudited)

NGAM Investment Funds U.K. ICVC
32 Semi-Annual Short Report
Company Information
Head OfficeOne Carter LaneLondon EC4V 5ER
AdministratorState Street Bank and Trust CompanyA
20 Churchill PlaceCanary WharfLondon E14 5HJ
Transfer Agent and RegistrarInternational Financial Data Services(UK) LimitedSt. Nicholas Lane BasildonEssex SS15 5FS
DepositaryState Street Trustees Ltd.A
20 Churchill PlaceCanary WharfLondon E14 5HJ
Investment ManagersFor H2O MultiReturns FundH2O Asset Management L.L.P.A
10 Old Burlington StreetLondon W1S 3AG
For Loomis Sayles Strategic Income and Loomis Sayles U.S.Equity Leaders FundLoomis Sayles & Company, L.P.B
One Financial CenterBoston, Massachusetts 021111, USA
Harris Associates Global Concentrated Equity FundHarris Associates L.P.B
111 South Wacker Drive, Suite 4000Chicago, Illinois 60606, USA
For Seeyond Factor Plus Europe Ex U.K. Equity FundSeeyond Factor Plus U.K. Equity FundNatixis Assets Management S.A.21 quai d’Austerlitz75634 Paris, France
Authorised Corporate DirectorNGAM S.A.C
2 Rue Jean MonnetL-2180 Luxembourg
Independent AuditorPricewaterhouseCoopers LLPAtria One144 Morrison StreetEdinburgh EH3 8EX
A Authorised and Regulated by the Financial Conduct Authority.B Registered with the US Securities and Exchange Commission.C Authorised and Regulated by the Commission de Surveillance du Secteur Financier.

NGAM Investment Funds U.K. ICVC
33Semi-Annual Short Report
NGAM Investment Funds U.K. ICVC
Ref erences in this document to any fund do not constitute anoffer or invitation to subscribe to shares in such a fund. Werecommend you obtain detailed information before thepurchase of shares. Subscriptions to a fund may only be madeon the basis of the current Prospectus or Key InvestorInformation Document (KIID) and the latest annual and interimreports. Please refer also to the Risk Factors in theProspectus.
Past performance is not a guide to future returns. This value ofinvestments and any income from them is not guaranteed andmay fall as well as rise and the investor may not get back theoriginal investment. Exchange rate movements could increaseor decrease the value of underlying investments/holdings. Thedealing price of the fund may include a dilution adjustment.Further details are available in the Prospectus.
General Information
33
Please use the details below to ask for additional information, to buy or
sell investments or if you wish to contact us.
If you wIsh to wrIte to us:
PMS 7545
PMS 370
PMS 2613
50% K
NGAM S.A.
PO Box 12161
Chelmsford CM99 2DZ
United Kingdom
to learn more about natIxIs Global asset manaGement’s products and servIces:
PMS 7545
PMS 370
PMS 2613
50% K
Telephone: 0845 2669270
PMS 7545
PMS 370
PMS 2613
50% K
email: [email protected] 7545
PMS 370
PMS 2613
50% K
Website: www.ngam.natixis.co.uk
NGAM Investment Funds U.K. ICVC
Registered No. IC 000968
Authorised and Regulated by the Financial Conduct Authority.
Registered address: Cannon Bridge House, 25 Dowgate Hill, London EC4R 2YA.