hbos specialised investment funds icvc interim …reference.scottishwidows.co.uk/docs/49130.pdf ·...
TRANSCRIPT
HBOS Specialised Investment Funds ICVC Interim Report and Financial Statements
For the six month period ended 30th November 2017 (unaudited)
Investments

HBOS Specialised Investment Funds ICVCInterim Report and Financial Statementsfor the six month period ended 30th November 2017 (unaudited)
ContentsIntroduction* 1
Director's Report and Statement* 2
Statement of the Authorised Corporate Director's (ACD's) Responsibilities 4
Summary of Significant Accounting and Distribution Policies 5
Cautious Managed Fund 6
Ethical Fund 44
Fund of Investment Trusts 61
Smaller Companies Fund 73
Special Situations Fund 87
Distribution Tables 99
Additional Information* 102
*Collectively, these comprise the Authorised Corporate Director's Report.
Investment markets overview*, Comparative table, Material portfolio changes*, Portfolio statement*, Securities Financing Transactions (SFT) and Financial statements:

HBOS Specialised Investment Funds ICVCInterim Report and Financial Statementsfor the six month period ended 30th November 2017 (unaudited)
Introduction
Interim Report and Financial Statements
About the Company
The Cautious Managed Fund was launched on 6th April 2005.
The following four Funds were launched on 3rd November 2000 following the conversion of four existing unit trusts:
Ethical FundFund of Investment TrustsSmaller Companies FundSpecial Situations Fund
We are pleased to present the Interim Report and Financial Statements for the HBOS Specialised Investment Funds ICVC (“the Company”) for the sixmonth period ended 30th November 2017. The financial statements have been prepared on an individual basis for all Funds as permitted by the FinancialConduct Authority's (''the FCA'') Collective Investment Schemes Sourcebook (“the COLL Sourcebook”).
As required by the COLL Sourcebook, information for each of the five Funds has also been included.
The HBOS Specialised Investment Funds ICVC is an Open-Ended Investment Company (“OEIC”) with variable capital incorporated in England and Walessince 27th September 2000 and authorised by the Financial Conduct Authority “the FCA” (previously the Financial Services Authority “the FSA”) with effectfrom 20th September 2000. The Company is managed by HBOS Investment Fund Managers Limited, the Authorised Corporate Director (“the ACD”), whois responsible for the day to day running of the Company including the preparation of interim and annual reports. The property of the Company is entrustedto State Street Trustees Limited ("the Depositary").
The objective of the Company is to invest the Scheme Property in transferable securities, money market instruments, cash and near cash, Derivatives andforward transactions, deposits and units (as defined in the COLL Sourcebook) of collective investment schemes in accordance with the COLL Sourcebook,with the aim of spreading investment risk and giving its Shareholders the benefit of the results of the management of that property. The Shareholders haveno interest in the Scheme Property, and are not liable for the debts of the Company.
The Company is a UCITS scheme operating in accordance with the COLL Sourcebook and is structured as an umbrella company, as defined in the Open-Ended Investment Company Regulations 2001 (“the OEIC Regulations”), in that it currently contains five Funds, each with different investment objectives.New Funds may be established from time to time by the ACD with the approval of the FCA. Within the financial statements there is an investment reviewfor each Fund as at 30th November 2017, which includes details of the investment objectives.
1
●
●
-
-
-
-
-
-
-
●
an update to the available eligible securities markets in the Prospectus of the Company were updated for the Far Eastern Fund with Pakistan –Karachi Stock Exchange being included as an eligible securities market;
insertion of regulatory disclosure regarding potential conflicts of interest applicable to the Depositary; and
an updated list of sub-custodians.
With effect from 25th September 2017, the Prospectus of the Company was updated to remove redemption charges that may have applied on the sale of Shares held in Collective Investment Plans which started on or after 29th June 2009.
During the period there have been a number of changes to the Company. These changes are detailed below in the section Prospectus changes.
During the period and up to the date of this report, the following changes were made to the Company and therefore the following changes were reflectedin the Prospectus of HBOS Specialised Investment Funds ICVC:
A copy of the Prospectus is available on request.
For the purposes of backdating a reduction in annual management charges for top-ups made to sub-funds of the Company between 1st October 2012and 19th February 2017, the Instrument and Prospectus of the Company were amended with effect from 1st June 2017 to include a power to effect acompulsory conversion of certain shares issued between 1st October 2012 and 31th March 2017 in (i) Class C of the Cautious Managed Fund,Ethical Fund, Fund of Investment Trusts, Smaller Companies Fund and Special Situations Fund to shares in Class P of such sub-funds; (ii) Class F ofthe Cautious Managed Fund, Ethical Fund, Fund of Investment Trusts, Smaller Companies Fund and Special Situations Fund, to shares in Class Q ofsuch sub-funds; and (iii) Class G of the Cautious Managed Fund, Ethical Fund, Fund of Investment Trusts, Smaller Companies Fund and SpecialSituations Fund to shares in Class R of such sub-funds (the Conversions).
The Conversions only apply for certain impacted shareholders whose investment product(s) were arranged and advised via a Lloyds Banking Groupauthorised representative.
With effect from 10th July 2017, the Prospectus of the Company was updated to include:
additional information and regulatory disclosures with respect to stock lending and collateral as required by the Securities Financing TransactionRegulation;
updates to tax wording with respect to interest distributions in line with tax changes that came into force in April 2017;
clarification that purchases and redemptions of shares can take place electronically through messaging platforms such as Calastone/EMX where thisis available for certain investors (in line with industry practice for institutional investors/platforms);
Prospectus changes
updates to list of ACD directors;
The ultimate parent undertaking of the ACD is Lloyds Banking Group plc.
HBOS Specialised Investment Funds ICVCInterim Report and Financial Statementsfor the six month period ended 30th November 2017 (unaudited)
Director's Report and Statement
Director's Report
The statement of the ACD's Responsibilities is set out on page 4 of this report. The names and addresses of the ACD, the Depositary, the InvestmentAdviser, the Registrar and the Auditors can be found on page 102 of this report.
HBOS Investment Fund Managers Limited is the Authorised Corporate Director (“the ACD”) and Registrar for the HBOS Specialised Investment FundsICVC. HBOS Investment Fund Managers Limited is authorised and regulated by the Financial Conduct Authority (“the FCA”). The ACD is the soledirector.
The HBOS Specialised Investment Funds ICVC is an Open-Ended Investment Company with variable capital under Regulation 12 (Authorisation) of theOpen-Ended Investment Companies Regulations 2001. It is a UCITS scheme and is structured as an umbrella scheme with five Funds. The shareholdersare not liable for any debts of the Company.
The assets of each Fund are separate from those of every other Fund and are invested in accordance with the investment objective and investment policyapplicable to that Fund. The investment objective for each of the five Funds, together with the ACD's policy for achieving those objectives and a review ofthe investment activities during the period, is set out in the respective investment market overview in this report.
The assets of each Fund belong exclusively to that Fund and shall not be used or made available to discharge (directly or indirectly) the liabilities of, orclaims against, any other person or body, including the Company and any other Fund and shall not be available for such purpose.
Whilst the provisions of the OEIC Regulations provide for segregated liability between Funds, the concept of segregated liability is relatively new.Accordingly, where claims are brought by local creditors in foreign courts or under foreign law contracts, it is not yet known whether a foreign court wouldgive effect to the segregated liability and cross-investments provisions contained in the OEIC Regulations. Therefore, it is not possible to be certain thatthe assets of a Fund will always be completely insulated from the liabilities of another Fund of the Company in every circumstance.
New Funds may be established from time to time by the ACD with the approval of the FCA and Depositary.
2
HBOS Specialised Investment Funds ICVCInterim Report and Financial Statementsfor the six month period ended 30th November 2017 (unaudited)
Director's Report and Statement (continued)
Sub-fund cross-holdings table
Sub Fund Shares held by other Sub-Funds HoldingMarket Value
£'000
Smaller Companies Fund 2,018,754 4,766
29th January 2018
As required by the FCA's COLL Sourcebook, the following table shows the number and value of shares held by each of the other sub-funds of theCompany.
As at 30th November 2017, the cross-holdings were as follows:
In accordance with the rules in the Collective Investment Schemes Sourcebook as issued and amended by the Financial Conduct Authority, I herebyapprove the report and financial statements on behalf of the Authorised Corporate Director of the HBOS Specialised Investment Funds ICVC.
Gavin Stewart
Important information
The Prospectus of the Company has been updated to explain that we will no longer produce short reports twice a year.
As part of its Smarter Consumer Communications initiative, the Financial Conduct Authority (FCA) has now removed the requirement for firms such as theACD to prepare and issue short reports. Investors in the Company will therefore no longer receive short reports and the references to short reports havebeen removed from the Prospectus of the Company. You can contact us for copies of the interim or annual Long Reports. These are available free ofcharge and can also be downloaded from our website at:www.scottishwidows.co.uk/reportandaccounts
Director's Report (continued)
DirectorHBOS Investment Fund Managers Limited
Director's Statement
Special Situations Fund
3
HBOS Specialised Investment Funds ICVCInterim Report and Financial Statementsfor the six month period ended 30th November 2017 (unaudited)
Statement of the Authorised Corporate Director's (ACD's) Responsibilities
● select suitable accounting policies and then apply them consistently;
● make judgments and estimates that are reasonable and prudent;
● comply with the requirements of the Statement of Recommended Practice relating to the Financial Statements of Authorised Funds issued by theInvestment Management Association in May 2014;
● follow generally accepted UK accounting principles and applicable UK accounting standards; and
● prepare the financial statements on the going concern basis unless it is inappropriate to presume that the Company will continue in operation.
Statement and Reports
The rules in the Collective Investment Schemes Sourcebook issued by the Financial Conduct Authority ("the FCA") require the ACD to prepare financialstatements for each accounting period which give a true and fair view of the financial position of the Company and of the net revenue and net gains andlosses on the property of the Company for the period then ended. In preparing the financial statements the ACD is required to:
The ACD is responsible for keeping proper accounting records and for the management of the Company in accordance with its Instrument ofIncorporation, the Prospectus and the FCA Rules.
The ACD has general responsibility for taking such steps as are reasonably open to it to prevent and detect fraud and other irregularities.
4
HBOS Specialised Investment Funds ICVCInterim Report and Financial Statementsfor the six month period ended 30th November 2017 (unaudited)
Summary of Significant Accounting and Distribution PoliciesThe financial statements have been prepared under the historical cost basis, as modified by the revaluation of investments, and in accordance withapplicable law, United Kingdom Generally Accepted Accounting Practice (UK GAAP), the Statement of Recommended Practice (SORP) for UKAuthorised Funds issued by the Investment Management Association (IMA) in May 2014 and the Financial Reporting Standard applicable in the UK andRepublic of Ireland (FRS 102). The accounting and distribution policies applied are consistent with those of the financial statements for the year ended31st May 2017 and are described in those annual financial statements.
5
HBOS Specialised Investment Funds ICVCInterim Report and Financial Statementsfor the six month period ended 30th November 2017 (unaudited)
Cautious Managed FundInvestment markets overview
Investment objective
Investment policy
UCITS scheme
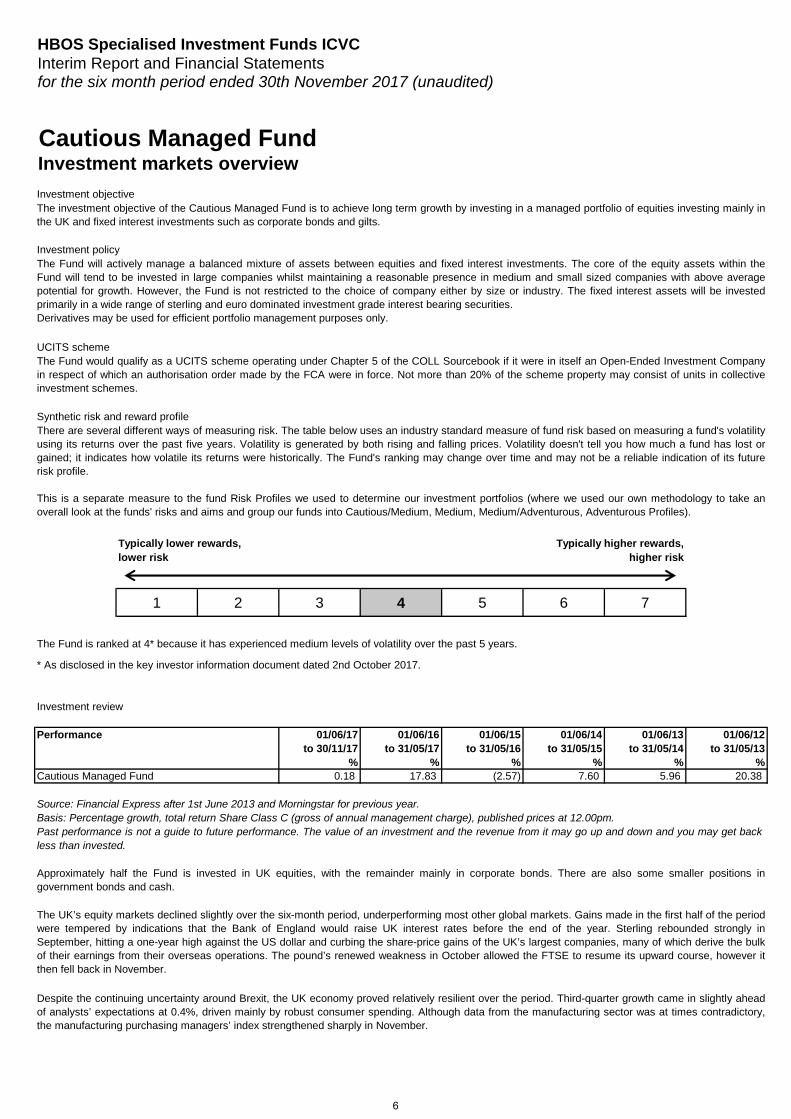
Synthetic risk and reward profile
1 2 3 4 5 6 7
Investment review
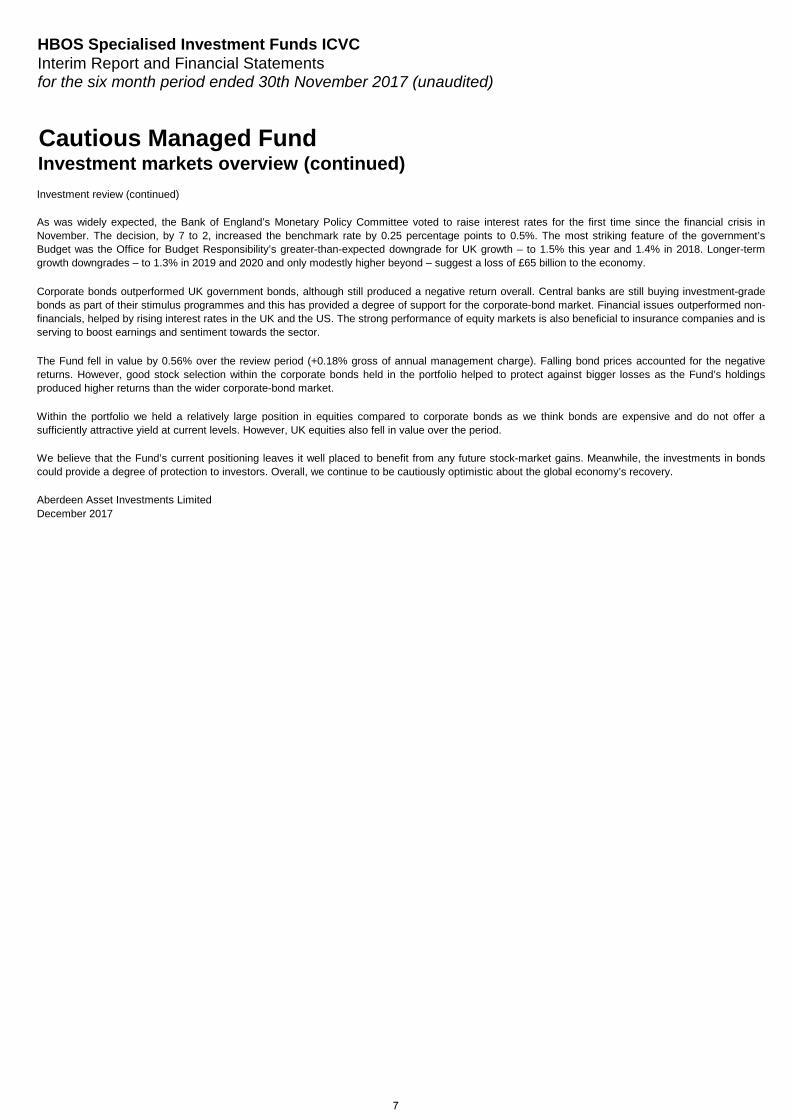
Performance 01/06/17 01/06/16 01/06/15 01/06/14 01/06/13 01/06/12to 30/11/17 to 31/05/17 to 31/05/16 to 31/05/15 to 31/05/14 to 31/05/13
% % % % % %0.18 17.83 (2.57) 7.60 5.96 20.38
* As disclosed in the key investor information document dated 2nd October 2017.
Cautious Managed Fund
The UK’s equity markets declined slightly over the six-month period, underperforming most other global markets. Gains made in the first half of the periodwere tempered by indications that the Bank of England would raise UK interest rates before the end of the year. Sterling rebounded strongly inSeptember, hitting a one-year high against the US dollar and curbing the share-price gains of the UK’s largest companies, many of which derive the bulkof their earnings from their overseas operations. The pound’s renewed weakness in October allowed the FTSE to resume its upward course, however itthen fell back in November.
Despite the continuing uncertainty around Brexit, the UK economy proved relatively resilient over the period. Third-quarter growth came in slightly aheadof analysts’ expectations at 0.4%, driven mainly by robust consumer spending. Although data from the manufacturing sector was at times contradictory,the manufacturing purchasing managers’ index strengthened sharply in November.
Approximately half the Fund is invested in UK equities, with the remainder mainly in corporate bonds. There are also some smaller positions ingovernment bonds and cash.
The investment objective of the Cautious Managed Fund is to achieve long term growth by investing in a managed portfolio of equities investing mainly inthe UK and fixed interest investments such as corporate bonds and gilts.
The Fund will actively manage a balanced mixture of assets between equities and fixed interest investments. The core of the equity assets within theFund will tend to be invested in large companies whilst maintaining a reasonable presence in medium and small sized companies with above averagepotential for growth. However, the Fund is not restricted to the choice of company either by size or industry. The fixed interest assets will be investedprimarily in a wide range of sterling and euro dominated investment grade interest bearing securities.Derivatives may be used for efficient portfolio management purposes only.
There are several different ways of measuring risk. The table below uses an industry standard measure of fund risk based on measuring a fund's volatilityusing its returns over the past five years. Volatility is generated by both rising and falling prices. Volatility doesn't tell you how much a fund has lost orgained; it indicates how volatile its returns were historically. The Fund's ranking may change over time and may not be a reliable indication of its futurerisk profile.
This is a separate measure to the fund Risk Profiles we used to determine our investment portfolios (where we used our own methodology to take anoverall look at the funds' risks and aims and group our funds into Cautious/Medium, Medium, Medium/Adventurous, Adventurous Profiles).
The Fund would qualify as a UCITS scheme operating under Chapter 5 of the COLL Sourcebook if it were in itself an Open-Ended Investment Companyin respect of which an authorisation order made by the FCA were in force. Not more than 20% of the scheme property may consist of units in collectiveinvestment schemes.
Typically lower rewards,lower risk
Typically higher rewards,higher risk
Source: Financial Express after 1st June 2013 and Morningstar for previous year. Basis: Percentage growth, total return Share Class C (gross of annual management charge), published prices at 12.00pm.Past performance is not a guide to future performance. The value of an investment and the revenue from it may go up and down and you may get back less than invested.
The Fund is ranked at 4* because it has experienced medium levels of volatility over the past 5 years.
6
HBOS Specialised Investment Funds ICVCInterim Report and Financial Statementsfor the six month period ended 30th November 2017 (unaudited)
Cautious Managed FundInvestment markets overview (continued)
Corporate bonds outperformed UK government bonds, although still produced a negative return overall. Central banks are still buying investment-gradebonds as part of their stimulus programmes and this has provided a degree of support for the corporate-bond market. Financial issues outperformed non-financials, helped by rising interest rates in the UK and the US. The strong performance of equity markets is also beneficial to insurance companies and is serving to boost earnings and sentiment towards the sector.
The Fund fell in value by 0.56% over the review period (+0.18% gross of annual management charge). Falling bond prices accounted for the negativereturns. However, good stock selection within the corporate bonds held in the portfolio helped to protect against bigger losses as the Fund’s holdingsproduced higher returns than the wider corporate-bond market.
December 2017
We believe that the Fund’s current positioning leaves it well placed to benefit from any future stock-market gains. Meanwhile, the investments in bondscould provide a degree of protection to investors. Overall, we continue to be cautiously optimistic about the global economy’s recovery.
As was widely expected, the Bank of England’s Monetary Policy Committee voted to raise interest rates for the first time since the financial crisis inNovember. The decision, by 7 to 2, increased the benchmark rate by 0.25 percentage points to 0.5%. The most striking feature of the government’sBudget was the Office for Budget Responsibility’s greater-than-expected downgrade for UK growth – to 1.5% this year and 1.4% in 2018. Longer-termgrowth downgrades – to 1.3% in 2019 and 2020 and only modestly higher beyond – suggest a loss of £65 billion to the economy.
Within the portfolio we held a relatively large position in equities compared to corporate bonds as we think bonds are expensive and do not offer asufficiently attractive yield at current levels. However, UK equities also fell in value over the period.
Aberdeen Asset Investments Limited
Investment review (continued)
7
Interim Report and Financial Statementsfor the six month period ended 30th November 2017 (unaudited)
Comparative table
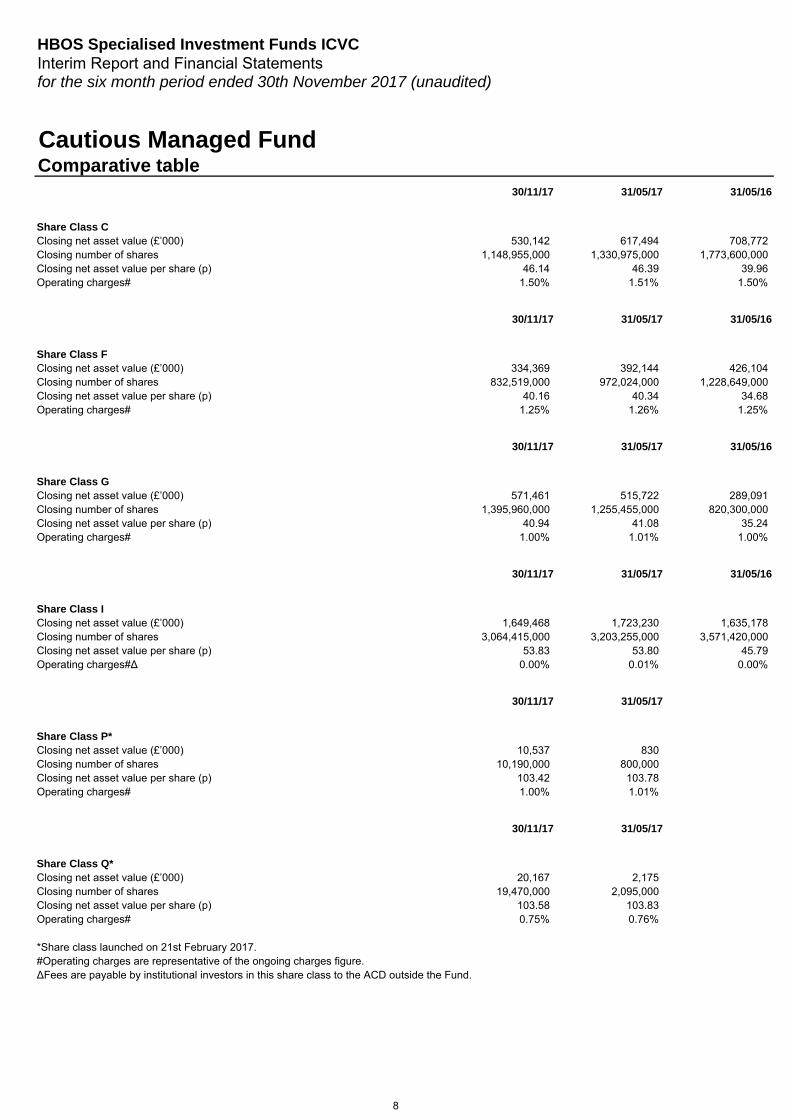
Share Class CClosing net asset value (£’000)Closing number of sharesClosing net asset value per share (p)Operating charges#
Share Class FClosing net asset value (£’000)Closing number of sharesClosing net asset value per share (p)Operating charges#
Share Class GClosing net asset value (£’000)Closing number of sharesClosing net asset value per share (p)Operating charges#
Share Class IClosing net asset value (£’000)Closing number of sharesClosing net asset value per share (p)Operating charges#∆
Share Class P*Closing net asset value (£’000)Closing number of sharesClosing net asset value per share (p)Operating charges#
Share Class Q*Closing net asset value (£’000)Closing number of sharesClosing net asset value per share (p)Operating charges#
Cautious Managed Fund
30/11/17 31/05/17 31/05/16
46.14 46.39 39.96
617,494 708,772530,1421,148,955,000 1,330,975,000 1,773,600,000
HBOS Specialised Investment Funds ICVC
1.50% 1.51% 1.50%
334,369 392,144 426,104832,519,000 972,024,000 1,228,649,000
40.16 40.34 34.681.25% 1.26% 1.25%
30/11/17 31/05/17 31/05/16
30/11/17 31/05/17 31/05/16
571,461 515,722 289,0911,395,960,000 1,255,455,000 820,300,000
40.94 41.08 35.241.00% 1.01% 1.00%
30/11/17 31/05/17 31/05/16
3,064,415,000 3,203,255,000 3,571,420,00053.83 53.80 45.79
0.00% 0.01% 0.00%
1,649,468 1,723,230 1,635,178
30/11/17 31/05/17
10,537 83010,190,000 800,000
103.42 103.781.00% 1.01%
30/11/17 31/05/17
19,470,000 2,095,000103.58 103.830.75% 0.76%
20,167 2,175
*Share class launched on 21st February 2017.
∆Fees are payable by institutional investors in this share class to the ACD outside the Fund.#Operating charges are representative of the ongoing charges figure.
8
Interim Report and Financial Statementsfor the six month period ended 30th November 2017 (unaudited)
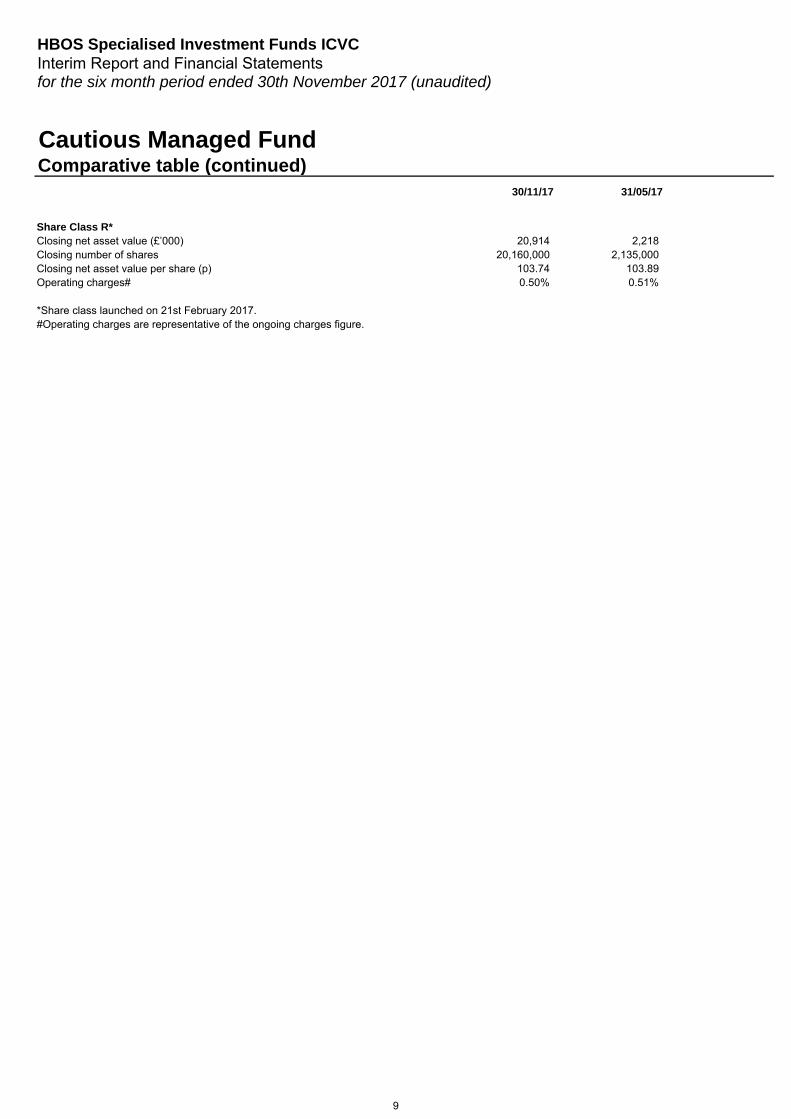
Comparative table (continued)Cautious Managed Fund
HBOS Specialised Investment Funds ICVC
Share Class R*Closing net asset value (£’000)Closing number of sharesClosing net asset value per share (p)Operating charges#
30/11/17 31/05/17
20,914 2,21820,160,000 2,135,000
103.74 103.890.50% 0.51%
*Share class launched on 21st February 2017.#Operating charges are representative of the ongoing charges figure.
9
HBOS Specialised Investment Funds ICVCInterim Report and Financial Statementsfor the six month period ended 30th November 2017 (unaudited)
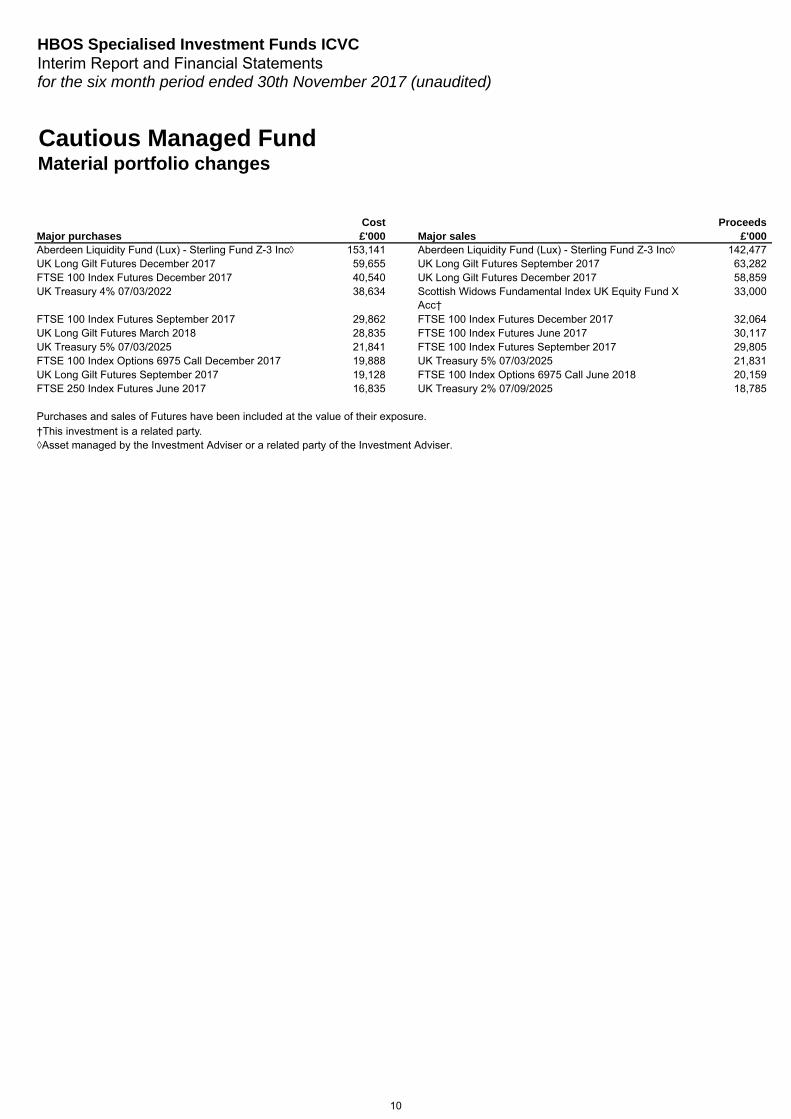
Cautious Managed FundMaterial portfolio changes
Cost ProceedsMajor purchases £'000 Major sales £'000 Aberdeen Liquidity Fund (Lux) - Sterling Fund Z-3 Inc◊ 153,141 Aberdeen Liquidity Fund (Lux) - Sterling Fund Z-3 Inc◊ 142,477UK Long Gilt Futures December 2017 59,655 UK Long Gilt Futures September 2017 63,282FTSE 100 Index Futures December 2017 40,540 UK Long Gilt Futures December 2017 58,859UK Treasury 4% 07/03/2022 38,634 Scottish Widows Fundamental Index UK Equity Fund X
Acc† 33,000
FTSE 100 Index Futures September 2017 29,862 FTSE 100 Index Futures December 2017 32,064UK Long Gilt Futures March 2018 28,835 FTSE 100 Index Futures June 2017 30,117UK Treasury 5% 07/03/2025 21,841 FTSE 100 Index Futures September 2017 29,805FTSE 100 Index Options 6975 Call December 2017 19,888 UK Treasury 5% 07/03/2025 21,831UK Long Gilt Futures September 2017 19,128 FTSE 100 Index Options 6975 Call June 2018 20,159FTSE 250 Index Futures June 2017 16,835 UK Treasury 2% 07/09/2025 18,785
Purchases and sales of Futures have been included at the value of their exposure.†This investment is a related party.◊Asset managed by the Investment Adviser or a related party of the Investment Adviser.
10
HBOS Specialised Investment Funds ICVCInterim Report and Financial Statementsfor the six month period ended 30th November 2017 (unaudited)
HoldingMarket Value
£'000% of
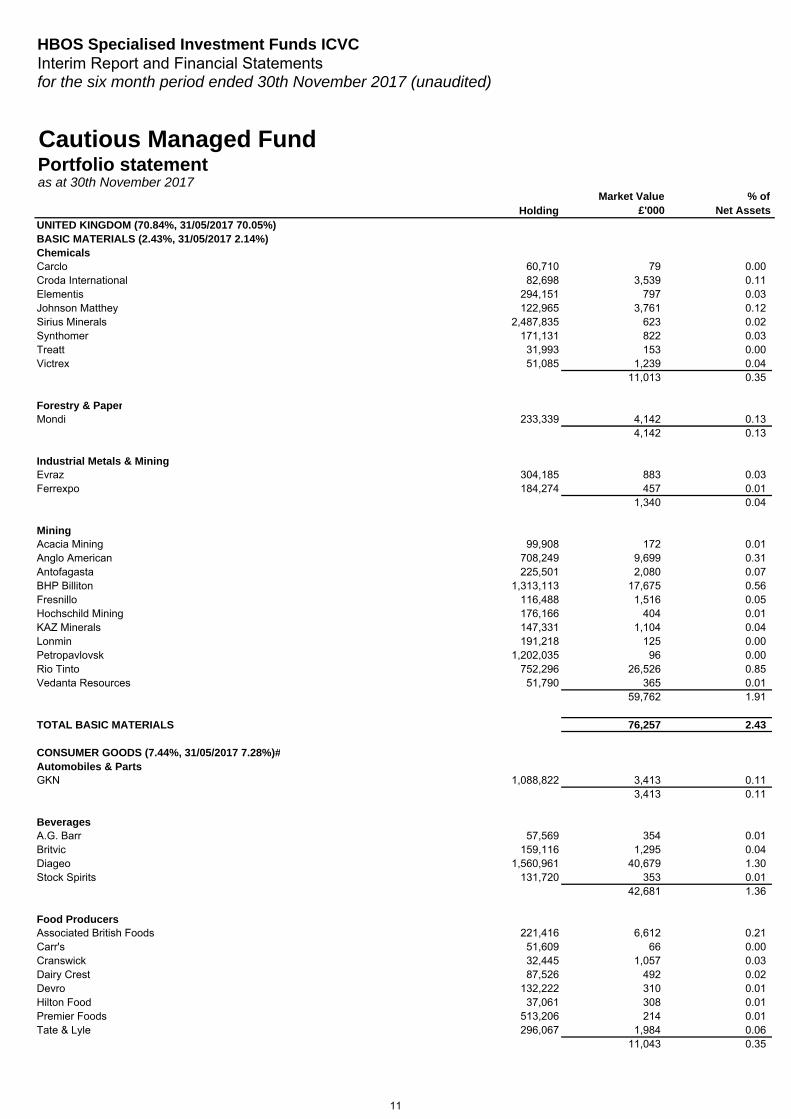
Net AssetsUNITED KINGDOM (70.84%, 31/05/2017 70.05%) BASIC MATERIALS (2.43%, 31/05/2017 2.14%) ChemicalsCarclo 60,710 79 0.00Croda International 82,698 3,539 0.11Elementis 294,151 797 0.03Johnson Matthey 122,965 3,761 0.12Sirius Minerals 2,487,835 623 0.02Synthomer 171,131 822 0.03Treatt 31,993 153 0.00Victrex 51,085 1,239 0.04
11,013 0.35
Forestry & PaperMondi 233,339 4,142 0.13
4,142 0.13
Industrial Metals & MiningEvraz 304,185 883 0.03Ferrexpo 184,274 457 0.01
1,340 0.04
MiningAcacia Mining 99,908 172 0.01Anglo American 708,249 9,699 0.31Antofagasta 225,501 2,080 0.07BHP Billiton 1,313,113 17,675 0.56Fresnillo 116,488 1,516 0.05Hochschild Mining 176,166 404 0.01KAZ Minerals 147,331 1,104 0.04Lonmin 191,218 125 0.00Petropavlovsk 1,202,035 96 0.00Rio Tinto 752,296 26,526 0.85Vedanta Resources 51,790 365 0.01
59,762 1.91
TOTAL BASIC MATERIALS 76,257 2.43
CONSUMER GOODS (7.44%, 31/05/2017 7.28%)#Automobiles & PartsGKN 1,088,822 3,413 0.11
3,413 0.11
BeveragesA.G. Barr 57,569 354 0.01Britvic 159,116 1,295 0.04Diageo 1,560,961 40,679 1.30Stock Spirits 131,720 353 0.01
42,681 1.36
Food ProducersAssociated British Foods 221,416 6,612 0.21Carr's 51,609 66 0.00Cranswick 32,445 1,057 0.03Dairy Crest 87,526 492 0.02Devro 132,222 310 0.01Hilton Food 37,061 308 0.01Premier Foods 513,206 214 0.01Tate & Lyle 296,067 1,984 0.06
11,043 0.35
Cautious Managed FundPortfolio statement as at 30th November 2017
11
HBOS Specialised Investment Funds ICVCInterim Report and Financial Statementsfor the six month period ended 30th November 2017 (unaudited)
HoldingMarket Value
£'000% of
Net Assets
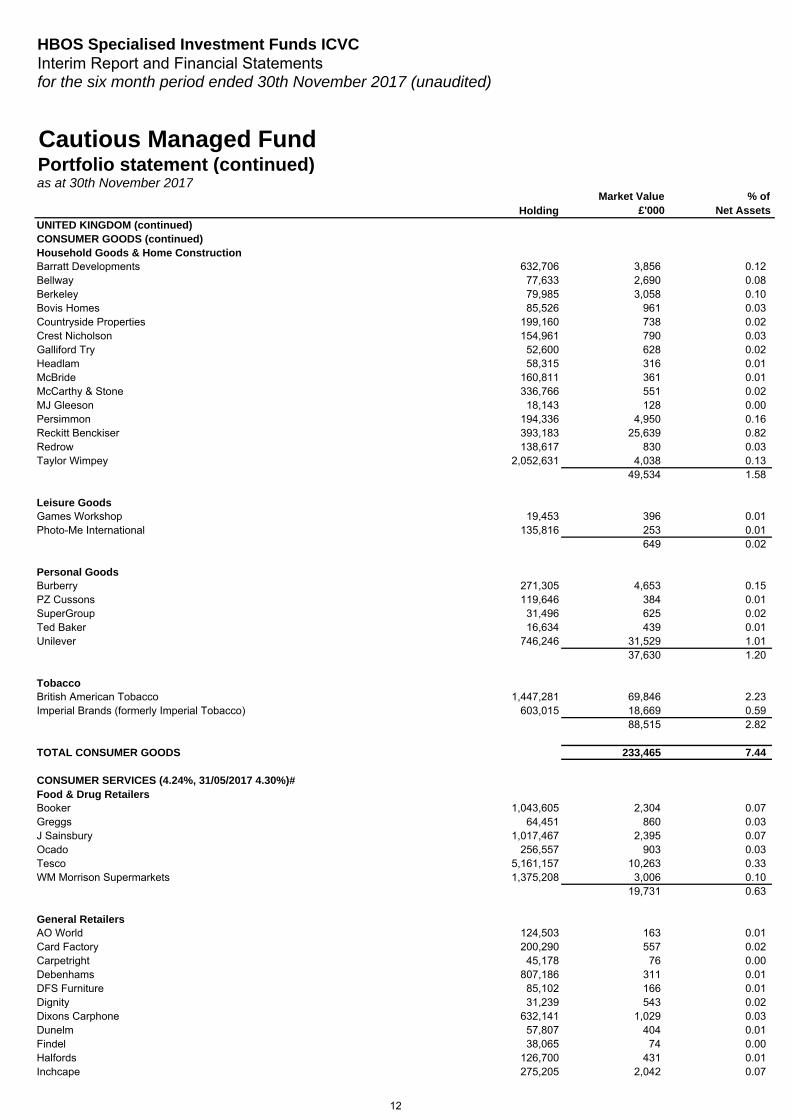
Cautious Managed FundPortfolio statement (continued)as at 30th November 2017
UNITED KINGDOM (continued) CONSUMER GOODS (continued) Household Goods & Home Construction Barratt Developments 632,706 3,856 0.12Bellway 77,633 2,690 0.08Berkeley 79,985 3,058 0.10Bovis Homes 85,526 961 0.03Countryside Properties 199,160 738 0.02Crest Nicholson 154,961 790 0.03Galliford Try 52,600 628 0.02Headlam 58,315 316 0.01McBride 160,811 361 0.01McCarthy & Stone 336,766 551 0.02MJ Gleeson 18,143 128 0.00Persimmon 194,336 4,950 0.16Reckitt Benckiser 393,183 25,639 0.82Redrow 138,617 830 0.03Taylor Wimpey 2,052,631 4,038 0.13
49,534 1.58
Leisure GoodsGames Workshop 19,453 396 0.01Photo-Me International 135,816 253 0.01
649 0.02
Personal GoodsBurberry 271,305 4,653 0.15PZ Cussons 119,646 384 0.01SuperGroup 31,496 625 0.02Ted Baker 16,634 439 0.01Unilever 746,246 31,529 1.01
37,630 1.20
TobaccoBritish American Tobacco 1,447,281 69,846 2.23Imperial Brands (formerly Imperial Tobacco) 603,015 18,669 0.59
88,515 2.82
TOTAL CONSUMER GOODS 233,465 7.44
CONSUMER SERVICES (4.24%, 31/05/2017 4.30%)#Food & Drug RetailersBooker 1,043,605 2,304 0.07Greggs 64,451 860 0.03J Sainsbury 1,017,467 2,395 0.07Ocado 256,557 903 0.03Tesco 5,161,157 10,263 0.33WM Morrison Supermarkets 1,375,208 3,006 0.10
19,731 0.63
General RetailersAO World 124,503 163 0.01Card Factory 200,290 557 0.02Carpetright 45,178 76 0.00Debenhams 807,186 311 0.01DFS Furniture 85,102 166 0.01Dignity 31,239 543 0.02Dixons Carphone 632,141 1,029 0.03Dunelm 57,807 404 0.01Findel 38,065 74 0.00Halfords 126,700 431 0.01Inchcape 275,205 2,042 0.07
12
HBOS Specialised Investment Funds ICVCInterim Report and Financial Statementsfor the six month period ended 30th November 2017 (unaudited)
HoldingMarket Value
£'000% of
Net Assets
Cautious Managed FundPortfolio statement (continued)as at 30th November 2017
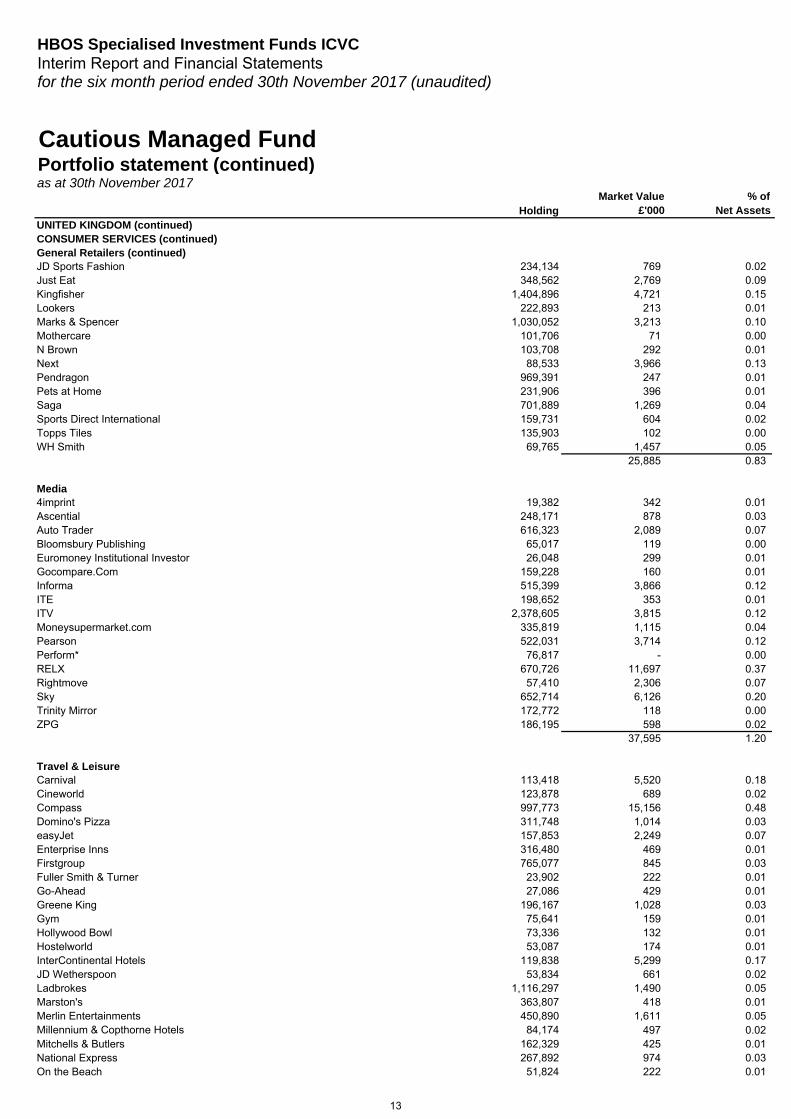
UNITED KINGDOM (continued) CONSUMER SERVICES (continued) General Retailers (continued) JD Sports Fashion 234,134 769 0.02Just Eat 348,562 2,769 0.09Kingfisher 1,404,896 4,721 0.15Lookers 222,893 213 0.01Marks & Spencer 1,030,052 3,213 0.10Mothercare 101,706 71 0.00N Brown 103,708 292 0.01Next 88,533 3,966 0.13Pendragon 969,391 247 0.01Pets at Home 231,906 396 0.01Saga 701,889 1,269 0.04Sports Direct International 159,731 604 0.02Topps Tiles 135,903 102 0.00WH Smith 69,765 1,457 0.05
25,885 0.83
Media4imprint 19,382 342 0.01Ascential 248,171 878 0.03Auto Trader 616,323 2,089 0.07Bloomsbury Publishing 65,017 119 0.00Euromoney Institutional Investor 26,048 299 0.01Gocompare.Com 159,228 160 0.01Informa 515,399 3,866 0.12ITE 198,652 353 0.01ITV 2,378,605 3,815 0.12Moneysupermarket.com 335,819 1,115 0.04Pearson 522,031 3,714 0.12Perform* 76,817 - 0.00RELX 670,726 11,697 0.37Rightmove 57,410 2,306 0.07Sky 652,714 6,126 0.20Trinity Mirror 172,772 118 0.00ZPG 186,195 598 0.02
37,595 1.20
Travel & LeisureCarnival 113,418 5,520 0.18Cineworld 123,878 689 0.02Compass 997,773 15,156 0.48Domino's Pizza 311,748 1,014 0.03easyJet 157,853 2,249 0.07Enterprise Inns 316,480 469 0.01Firstgroup 765,077 845 0.03Fuller Smith & Turner 23,902 222 0.01Go-Ahead 27,086 429 0.01Greene King 196,167 1,028 0.03Gym 75,641 159 0.01Hollywood Bowl 73,336 132 0.01Hostelworld 53,087 174 0.01InterContinental Hotels 119,838 5,299 0.17JD Wetherspoon 53,834 661 0.02Ladbrokes 1,116,297 1,490 0.05Marston's 363,807 418 0.01Merlin Entertainments 450,890 1,611 0.05Millennium & Copthorne Hotels 84,174 497 0.02Mitchells & Butlers 162,329 425 0.01National Express 267,892 974 0.03On the Beach 51,824 222 0.01
13
HBOS Specialised Investment Funds ICVCInterim Report and Financial Statementsfor the six month period ended 30th November 2017 (unaudited)
HoldingMarket Value
£'000% of
Net Assets
Cautious Managed FundPortfolio statement (continued)as at 30th November 2017
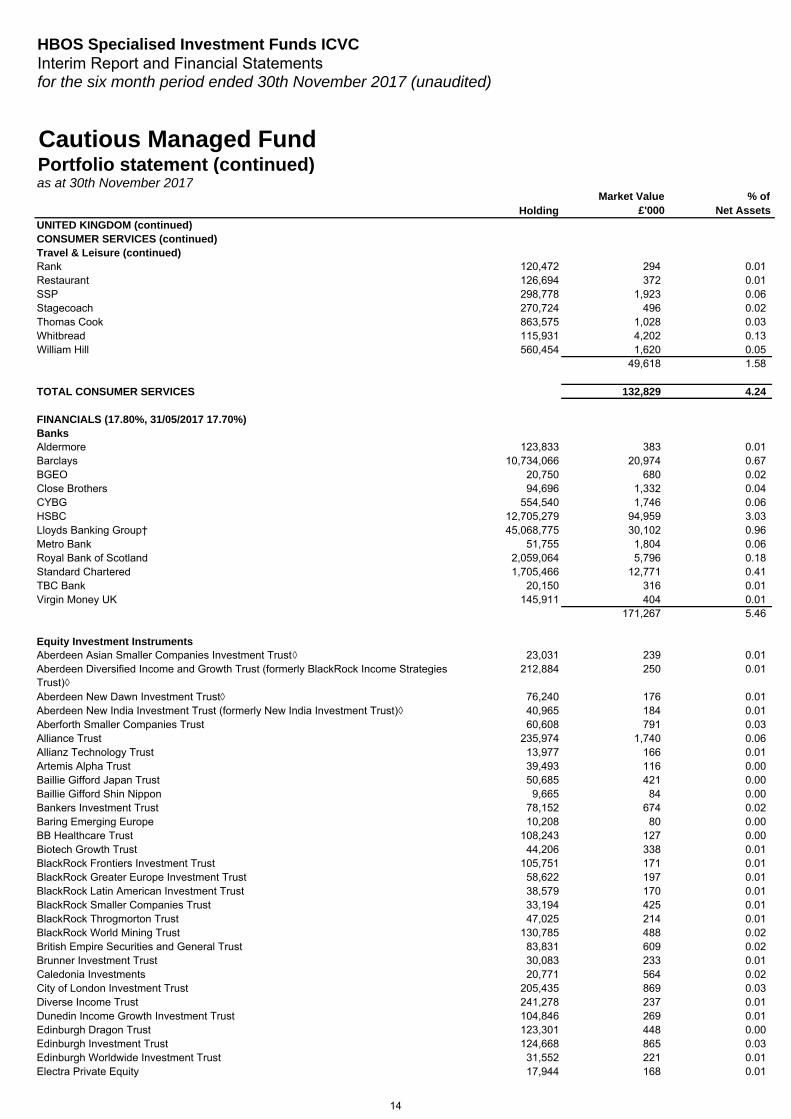
UNITED KINGDOM (continued) CONSUMER SERVICES (continued) Travel & Leisure (continued) Rank 120,472 294 0.01Restaurant 126,694 372 0.01SSP 298,778 1,923 0.06Stagecoach 270,724 496 0.02Thomas Cook 863,575 1,028 0.03Whitbread 115,931 4,202 0.13William Hill 560,454 1,620 0.05
49,618 1.58
TOTAL CONSUMER SERVICES 132,829 4.24
FINANCIALS (17.80%, 31/05/2017 17.70%) BanksAldermore 123,833 383 0.01Barclays 10,734,066 20,974 0.67BGEO 20,750 680 0.02Close Brothers 94,696 1,332 0.04CYBG 554,540 1,746 0.06HSBC 12,705,279 94,959 3.03Lloyds Banking Group† 45,068,775 30,102 0.96Metro Bank 51,755 1,804 0.06Royal Bank of Scotland 2,059,064 5,796 0.18Standard Chartered 1,705,466 12,771 0.41TBC Bank 20,150 316 0.01Virgin Money UK 145,911 404 0.01
171,267 5.46
Equity Investment Instruments Aberdeen Asian Smaller Companies Investment Trust◊ 23,031 239 0.01Aberdeen Diversified Income and Growth Trust (formerly BlackRock Income Strategies Trust)◊
212,884 250 0.01
Aberdeen New Dawn Investment Trust◊ 76,240 176 0.01Aberdeen New India Investment Trust (formerly New India Investment Trust)◊ 40,965 184 0.01Aberforth Smaller Companies Trust 60,608 791 0.03Alliance Trust 235,974 1,740 0.06Allianz Technology Trust 13,977 166 0.01Artemis Alpha Trust 39,493 116 0.00Baillie Gifford Japan Trust 50,685 421 0.00Baillie Gifford Shin Nippon 9,665 84 0.00Bankers Investment Trust 78,152 674 0.02Baring Emerging Europe 10,208 80 0.00BB Healthcare Trust 108,243 127 0.00Biotech Growth Trust 44,206 338 0.01BlackRock Frontiers Investment Trust 105,751 171 0.01BlackRock Greater Europe Investment Trust 58,622 197 0.01BlackRock Latin American Investment Trust 38,579 170 0.01BlackRock Smaller Companies Trust 33,194 425 0.01BlackRock Throgmorton Trust 47,025 214 0.01BlackRock World Mining Trust 130,785 488 0.02British Empire Securities and General Trust 83,831 609 0.02Brunner Investment Trust 30,083 233 0.01Caledonia Investments 20,771 564 0.02City of London Investment Trust 205,435 869 0.03Diverse Income Trust 241,278 237 0.01Dunedin Income Growth Investment Trust 104,846 269 0.01Edinburgh Dragon Trust 123,301 448 0.00Edinburgh Investment Trust 124,668 865 0.03Edinburgh Worldwide Investment Trust 31,552 221 0.01Electra Private Equity 17,944 168 0.01
14
HBOS Specialised Investment Funds ICVCInterim Report and Financial Statementsfor the six month period ended 30th November 2017 (unaudited)
HoldingMarket Value
£'000% of
Net Assets
Cautious Managed FundPortfolio statement (continued)as at 30th November 2017
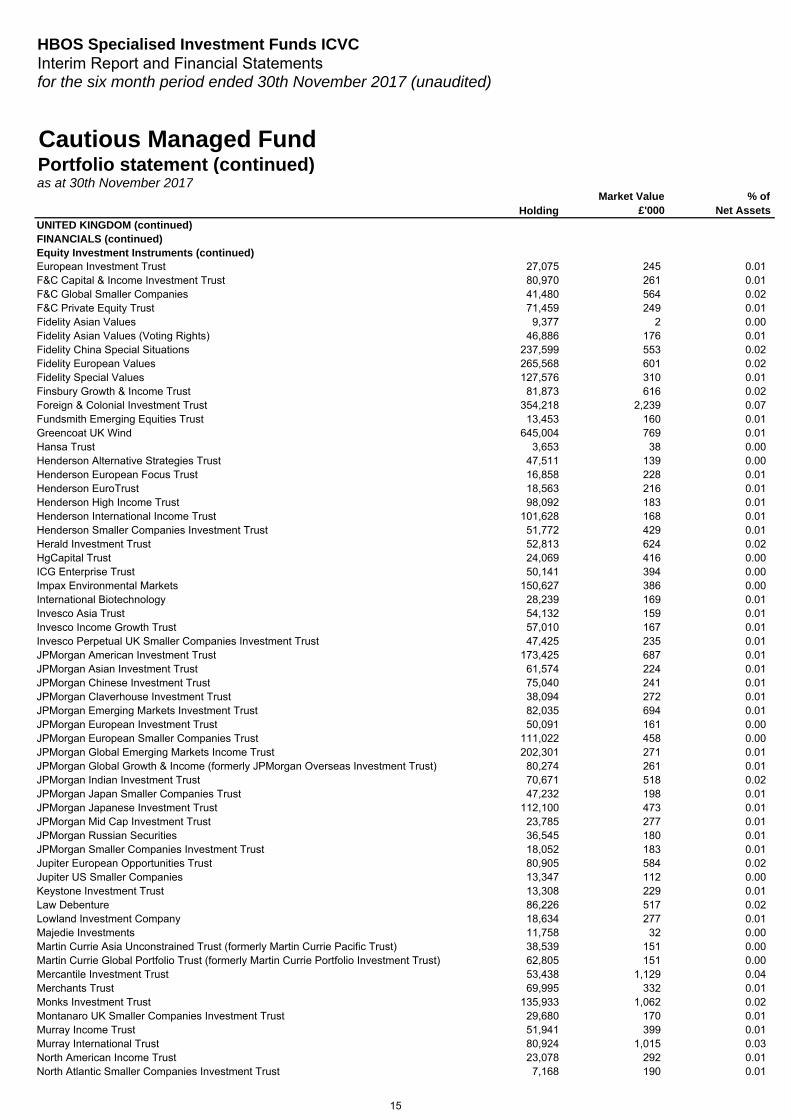
UNITED KINGDOM (continued) FINANCIALS (continued) Equity Investment Instruments (continued) European Investment Trust 27,075 245 0.01F&C Capital & Income Investment Trust 80,970 261 0.01F&C Global Smaller Companies 41,480 564 0.02F&C Private Equity Trust 71,459 249 0.01Fidelity Asian Values 9,377 2 0.00Fidelity Asian Values (Voting Rights) 46,886 176 0.01Fidelity China Special Situations 237,599 553 0.02Fidelity European Values 265,568 601 0.02Fidelity Special Values 127,576 310 0.01Finsbury Growth & Income Trust 81,873 616 0.02Foreign & Colonial Investment Trust 354,218 2,239 0.07Fundsmith Emerging Equities Trust 13,453 160 0.01Greencoat UK Wind 645,004 769 0.01Hansa Trust 3,653 38 0.00Henderson Alternative Strategies Trust 47,511 139 0.00Henderson European Focus Trust 16,858 228 0.01Henderson EuroTrust 18,563 216 0.01Henderson High Income Trust 98,092 183 0.01Henderson International Income Trust 101,628 168 0.01Henderson Smaller Companies Investment Trust 51,772 429 0.01Herald Investment Trust 52,813 624 0.02HgCapital Trust 24,069 416 0.00ICG Enterprise Trust 50,141 394 0.00Impax Environmental Markets 150,627 386 0.00International Biotechnology 28,239 169 0.01Invesco Asia Trust 54,132 159 0.01Invesco Income Growth Trust 57,010 167 0.01Invesco Perpetual UK Smaller Companies Investment Trust 47,425 235 0.01JPMorgan American Investment Trust 173,425 687 0.01JPMorgan Asian Investment Trust 61,574 224 0.01JPMorgan Chinese Investment Trust 75,040 241 0.01JPMorgan Claverhouse Investment Trust 38,094 272 0.01JPMorgan Emerging Markets Investment Trust 82,035 694 0.01JPMorgan European Investment Trust 50,091 161 0.00JPMorgan European Smaller Companies Trust 111,022 458 0.00JPMorgan Global Emerging Markets Income Trust 202,301 271 0.01JPMorgan Global Growth & Income (formerly JPMorgan Overseas Investment Trust) 80,274 261 0.01JPMorgan Indian Investment Trust 70,671 518 0.02JPMorgan Japan Smaller Companies Trust 47,232 198 0.01JPMorgan Japanese Investment Trust 112,100 473 0.01JPMorgan Mid Cap Investment Trust 23,785 277 0.01JPMorgan Russian Securities 36,545 180 0.01JPMorgan Smaller Companies Investment Trust 18,052 183 0.01Jupiter European Opportunities Trust 80,905 584 0.02Jupiter US Smaller Companies 13,347 112 0.00Keystone Investment Trust 13,308 229 0.01Law Debenture 86,226 517 0.02Lowland Investment Company 18,634 277 0.01Majedie Investments 11,758 32 0.00Martin Currie Asia Unconstrained Trust (formerly Martin Currie Pacific Trust) 38,539 151 0.00Martin Currie Global Portfolio Trust (formerly Martin Currie Portfolio Investment Trust) 62,805 151 0.00Mercantile Investment Trust 53,438 1,129 0.04Merchants Trust 69,995 332 0.01Monks Investment Trust 135,933 1,062 0.02Montanaro UK Smaller Companies Investment Trust 29,680 170 0.01Murray Income Trust 51,941 399 0.01Murray International Trust 80,924 1,015 0.03North American Income Trust 23,078 292 0.01North Atlantic Smaller Companies Investment Trust 7,168 190 0.01
15
HBOS Specialised Investment Funds ICVCInterim Report and Financial Statementsfor the six month period ended 30th November 2017 (unaudited)
HoldingMarket Value
£'000% of
Net Assets
Cautious Managed FundPortfolio statement (continued)as at 30th November 2017
55,724 451 0.0176,146 188 0.0155,761 178 0.0123,152 433 0.01
152,047 573 0.021,053 428 0.01
110,840 152 0.0084,591 168 0.0184,087 975 0.0380,738 1,581 0.0573,794 265 0.01
117,663 542 0.0267,408 192 0.0180,458 175 0.01
102,008 173 0.0135,488 188 0.0191,857 335 0.0152,734 444 0.01
867,759 3,914 0.1220,062 205 0.01
113,349 192 0.0137,304 172 0.0149,811 172 0.01
43,388 211 0.0142,713 547 0.02
191,334 1,506 0.0532,260 385 0.01
203,089 761 0.02238,755 186 0.0138,554 105 0.00
112,485 1,197 0.0465,486 214 0.01
525,472 448 0.01
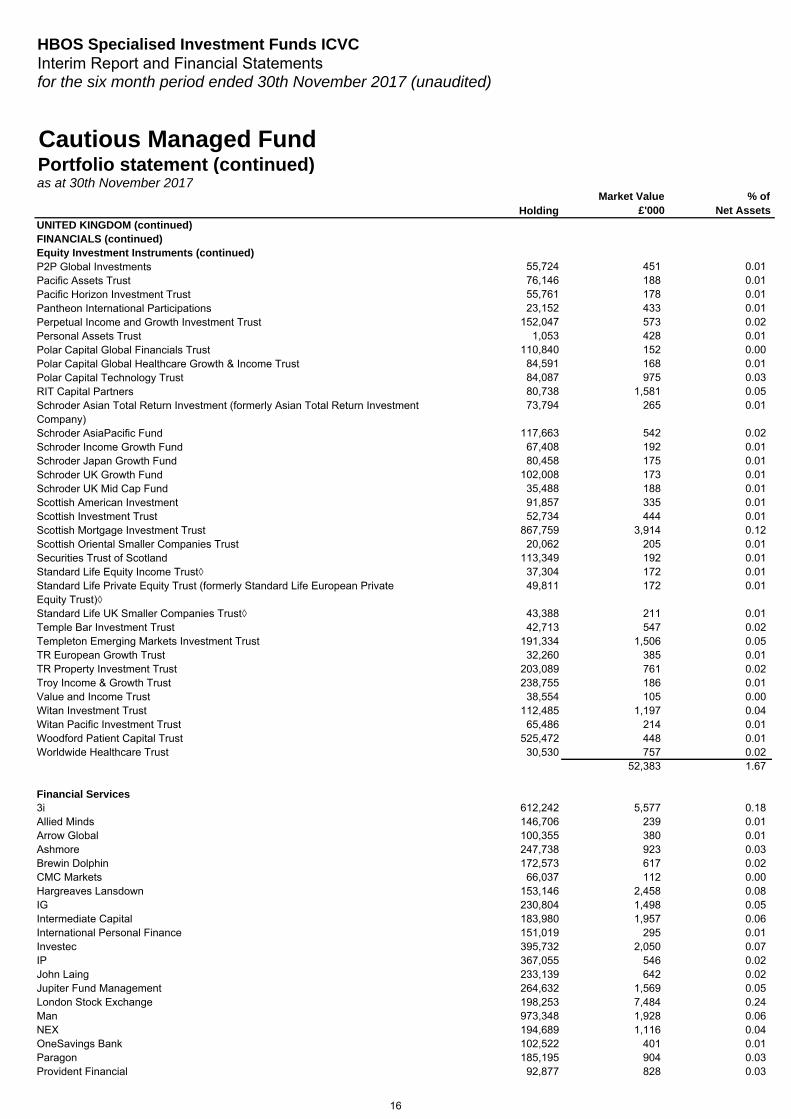
UNITED KINGDOM (continued) FINANCIALS (continued) Equity Investment Instruments (continued) P2P Global InvestmentsPacific Assets TrustPacific Horizon Investment TrustPantheon International ParticipationsPerpetual Income and Growth Investment TrustPersonal Assets TrustPolar Capital Global Financials TrustPolar Capital Global Healthcare Growth & Income TrustPolar Capital Technology TrustRIT Capital PartnersSchroder Asian Total Return Investment (formerly Asian Total Return Investment Company)Schroder AsiaPacific FundSchroder Income Growth FundSchroder Japan Growth FundSchroder UK Growth FundSchroder UK Mid Cap FundScottish American InvestmentScottish Investment TrustScottish Mortgage Investment TrustScottish Oriental Smaller Companies TrustSecurities Trust of ScotlandStandard Life Equity Income Trust◊Standard Life Private Equity Trust (formerly Standard Life European Private Equity Trust)◊Standard Life UK Smaller Companies Trust◊Temple Bar Investment TrustTempleton Emerging Markets Investment TrustTR European Growth TrustTR Property Investment TrustTroy Income & Growth TrustValue and Income TrustWitan Investment TrustWitan Pacific Investment TrustWoodford Patient Capital TrustWorldwide Healthcare Trust 30,530 757 0.02
52,383 1.67
Financial Services3i 612,242 5,577 0.18Allied Minds 146,706 239 0.01Arrow Global 100,355 380 0.01Ashmore 247,738 923 0.03Brewin Dolphin 172,573 617 0.02CMC Markets 66,037 112 0.00Hargreaves Lansdown 153,146 2,458 0.08IG 230,804 1,498 0.05Intermediate Capital 183,980 1,957 0.06International Personal Finance 151,019 295 0.01Investec 395,732 2,050 0.07IP 367,055 546 0.02John Laing 233,139 642 0.02Jupiter Fund Management 264,632 1,569 0.05London Stock Exchange 198,253 7,484 0.24Man 973,348 1,928 0.06NEX 194,689 1,116 0.04OneSavings Bank 102,522 401 0.01Paragon 185,195 904 0.03Provident Financial 92,877 828 0.03
16
HBOS Specialised Investment Funds ICVCInterim Report and Financial Statementsfor the six month period ended 30th November 2017 (unaudited)
HoldingMarket Value
£'000% of
Net Assets
Cautious Managed FundPortfolio statement (continued)as at 30th November 2017
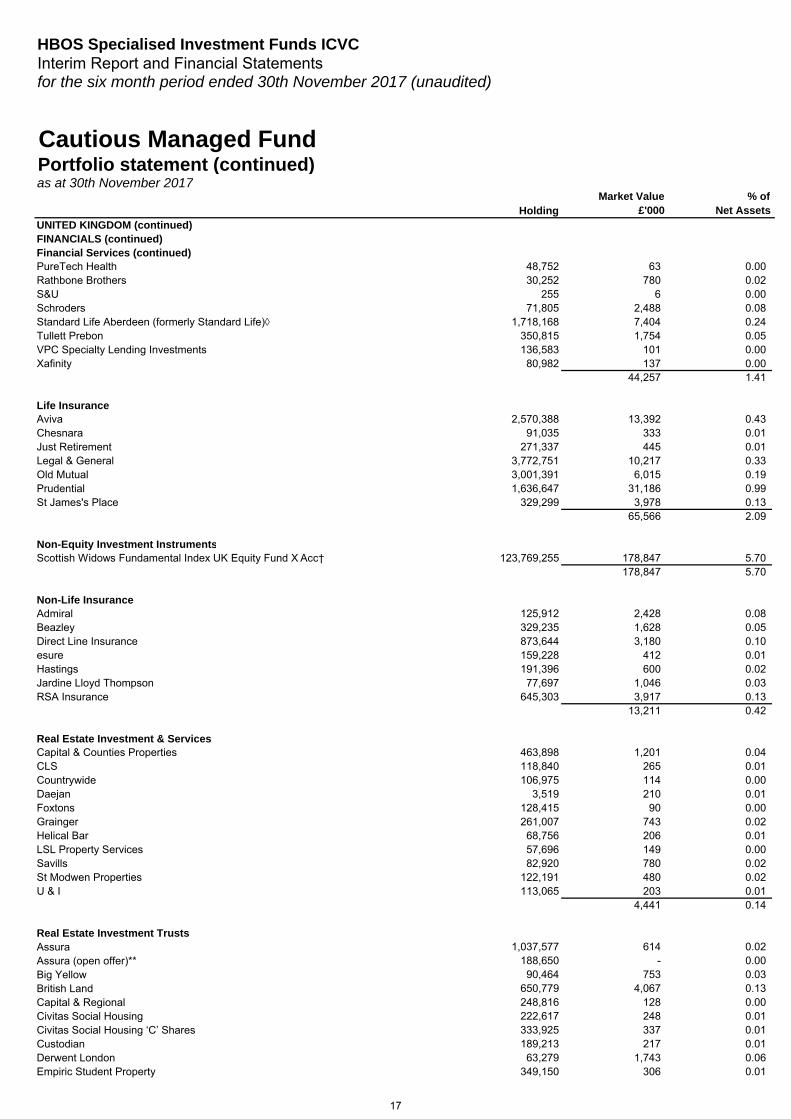
UNITED KINGDOM (continued) FINANCIALS (continued) Financial Services (continued) PureTech Health 48,752 63 0.00Rathbone Brothers 30,252 780 0.02S&U 255 6 0.00Schroders 71,805 2,488 0.08Standard Life Aberdeen (formerly Standard Life)◊ 1,718,168 7,404 0.24Tullett Prebon 350,815 1,754 0.05VPC Specialty Lending Investments 136,583 101 0.00Xafinity 80,982 137 0.00
44,257 1.41
Life InsuranceAviva 2,570,388 13,392 0.43Chesnara 91,035 333 0.01Just Retirement 271,337 445 0.01Legal & General 3,772,751 10,217 0.33Old Mutual 3,001,391 6,015 0.19Prudential 1,636,647 31,186 0.99St James's Place 329,299 3,978 0.13
65,566 2.09
Non-Equity Investment InstrumentsScottish Widows Fundamental Index UK Equity Fund X Acc† 123,769,255 178,847 5.70
178,847 5.70
Non-Life InsuranceAdmiral 125,912 2,428 0.08Beazley 329,235 1,628 0.05Direct Line Insurance 873,644 3,180 0.10esure 159,228 412 0.01Hastings 191,396 600 0.02Jardine Lloyd Thompson 77,697 1,046 0.03RSA Insurance 645,303 3,917 0.13
13,211 0.42
Real Estate Investment & ServicesCapital & Counties Properties 463,898 1,201 0.04CLS 118,840 265 0.01Countrywide 106,975 114 0.00Daejan 3,519 210 0.01Foxtons 128,415 90 0.00Grainger 261,007 743 0.02Helical Bar 68,756 206 0.01LSL Property Services 57,696 149 0.00Savills 82,920 780 0.02St Modwen Properties 122,191 480 0.02U & I 113,065 203 0.01
4,441 0.14
1,037,577 614 0.02188,650 - 0.0090,464 753 0.03
650,779 4,067 0.13248,816 128 0.00222,617 248 0.01333,925 337 0.01189,213 217 0.0163,279 1,743 0.06
Real Estate Investment Trusts AssuraAssura (open offer)**Big YellowBritish LandCapital & RegionalCivitas Social HousingCivitas Social Housing ‘C’ Shares CustodianDerwent LondonEmpiric Student Property 349,150 306 0.01
17
HBOS Specialised Investment Funds ICVCInterim Report and Financial Statementsfor the six month period ended 30th November 2017 (unaudited)
HoldingMarket Value
£'000% of
Net Assets
Cautious Managed FundPortfolio statement (continued)as at 30th November 2017
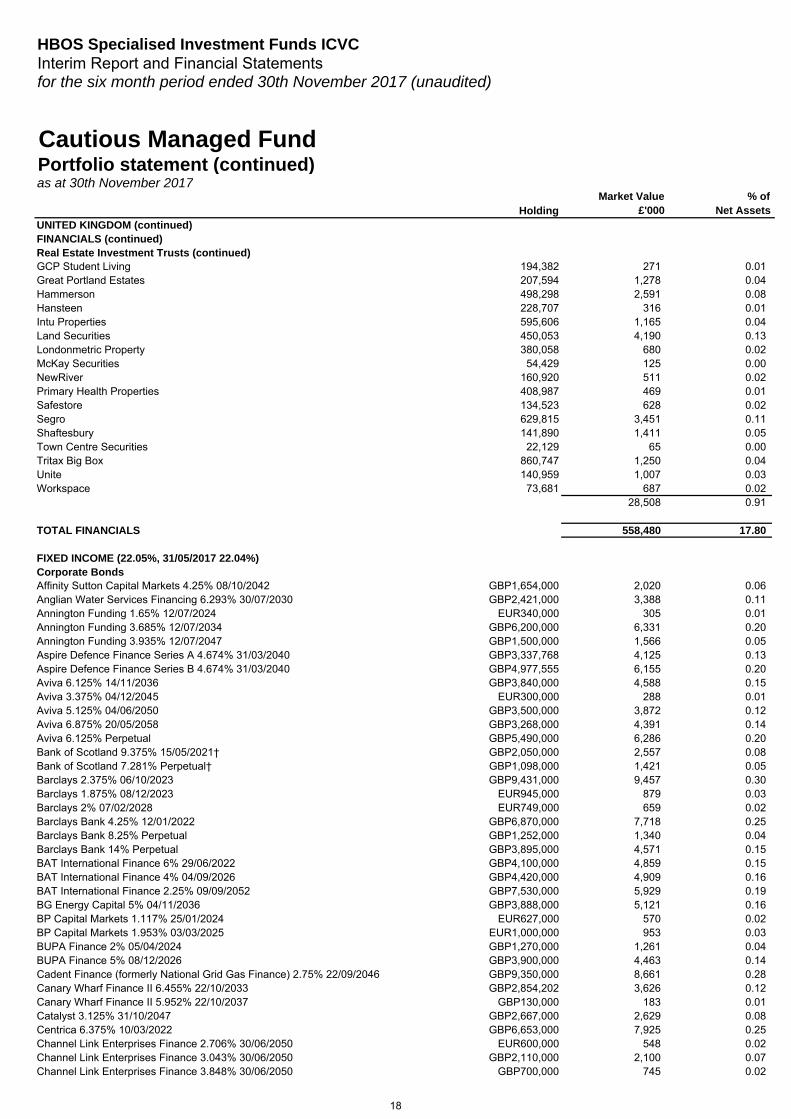
UNITED KINGDOM (continued) FINANCIALS (continued) Real Estate Investment Trusts (continued) GCP Student Living 194,382 271 0.01Great Portland Estates 207,594 1,278 0.04Hammerson 498,298 2,591 0.08Hansteen 228,707 316 0.01Intu Properties 595,606 1,165 0.04Land Securities 450,053 4,190 0.13Londonmetric Property 380,058 680 0.02McKay Securities 54,429 125 0.00NewRiver 160,920 511 0.02Primary Health Properties 408,987 469 0.01Safestore 134,523 628 0.02Segro 629,815 3,451 0.11Shaftesbury 141,890 1,411 0.05Town Centre Securities 22,129 65 0.00Tritax Big Box 860,747 1,250 0.04Unite 140,959 1,007 0.03Workspace 73,681 687 0.02
28,508 0.91
TOTAL FINANCIALS 558,480 17.80
FIXED INCOME (22.05%, 31/05/2017 22.04%) Corporate Bonds Affinity Sutton Capital Markets 4.25% 08/10/2042 GBP1,654,000 2,020 0.06Anglian Water Services Financing 6.293% 30/07/2030 GBP2,421,000 3,388 0.11Annington Funding 1.65% 12/07/2024 EUR340,000 305 0.01Annington Funding 3.685% 12/07/2034 GBP6,200,000 6,331 0.20Annington Funding 3.935% 12/07/2047 GBP1,500,000 1,566 0.05Aspire Defence Finance Series A 4.674% 31/03/2040 GBP3,337,768 4,125 0.13Aspire Defence Finance Series B 4.674% 31/03/2040 GBP4,977,555 6,155 0.20Aviva 6.125% 14/11/2036 GBP3,840,000 4,588 0.15Aviva 3.375% 04/12/2045 EUR300,000 288 0.01Aviva 5.125% 04/06/2050 GBP3,500,000 3,872 0.12Aviva 6.875% 20/05/2058 GBP3,268,000 4,391 0.14Aviva 6.125% Perpetual GBP5,490,000 6,286 0.20Bank of Scotland 9.375% 15/05/2021† GBP2,050,000 2,557 0.08Bank of Scotland 7.281% Perpetual† GBP1,098,000 1,421 0.05Barclays 2.375% 06/10/2023 GBP9,431,000 9,457 0.30Barclays 1.875% 08/12/2023 EUR945,000 879 0.03Barclays 2% 07/02/2028 EUR749,000 659 0.02Barclays Bank 4.25% 12/01/2022 GBP6,870,000 7,718 0.25Barclays Bank 8.25% Perpetual GBP1,252,000 1,340 0.04Barclays Bank 14% Perpetual GBP3,895,000 4,571 0.15BAT International Finance 6% 29/06/2022 GBP4,100,000 4,859 0.15BAT International Finance 4% 04/09/2026 GBP4,420,000 4,909 0.16BAT International Finance 2.25% 09/09/2052 GBP7,530,000 5,929 0.19BG Energy Capital 5% 04/11/2036 GBP3,888,000 5,121 0.16BP Capital Markets 1.117% 25/01/2024 EUR627,000 570 0.02BP Capital Markets 1.953% 03/03/2025 EUR1,000,000 953 0.03BUPA Finance 2% 05/04/2024 GBP1,270,000 1,261 0.04BUPA Finance 5% 08/12/2026 GBP3,900,000 4,463 0.14Cadent Finance (formerly National Grid Gas Finance) 2.75% 22/09/2046 GBP9,350,000 8,661 0.28Canary Wharf Finance II 6.455% 22/10/2033 GBP2,854,202 3,626 0.12Canary Wharf Finance II 5.952% 22/10/2037 GBP130,000 183 0.01Catalyst 3.125% 31/10/2047 GBP2,667,000 2,629 0.08Centrica 6.375% 10/03/2022 GBP6,653,000 7,925 0.25Channel Link Enterprises Finance 2.706% 30/06/2050 EUR600,000 548 0.02Channel Link Enterprises Finance 3.043% 30/06/2050 GBP2,110,000 2,100 0.07Channel Link Enterprises Finance 3.848% 30/06/2050 GBP700,000 745 0.02
18
HBOS Specialised Investment Funds ICVCInterim Report and Financial Statementsfor the six month period ended 30th November 2017 (unaudited)
HoldingMarket Value
£'000% of
Net Assets
Cautious Managed FundPortfolio statement (continued)as at 30th November 2017
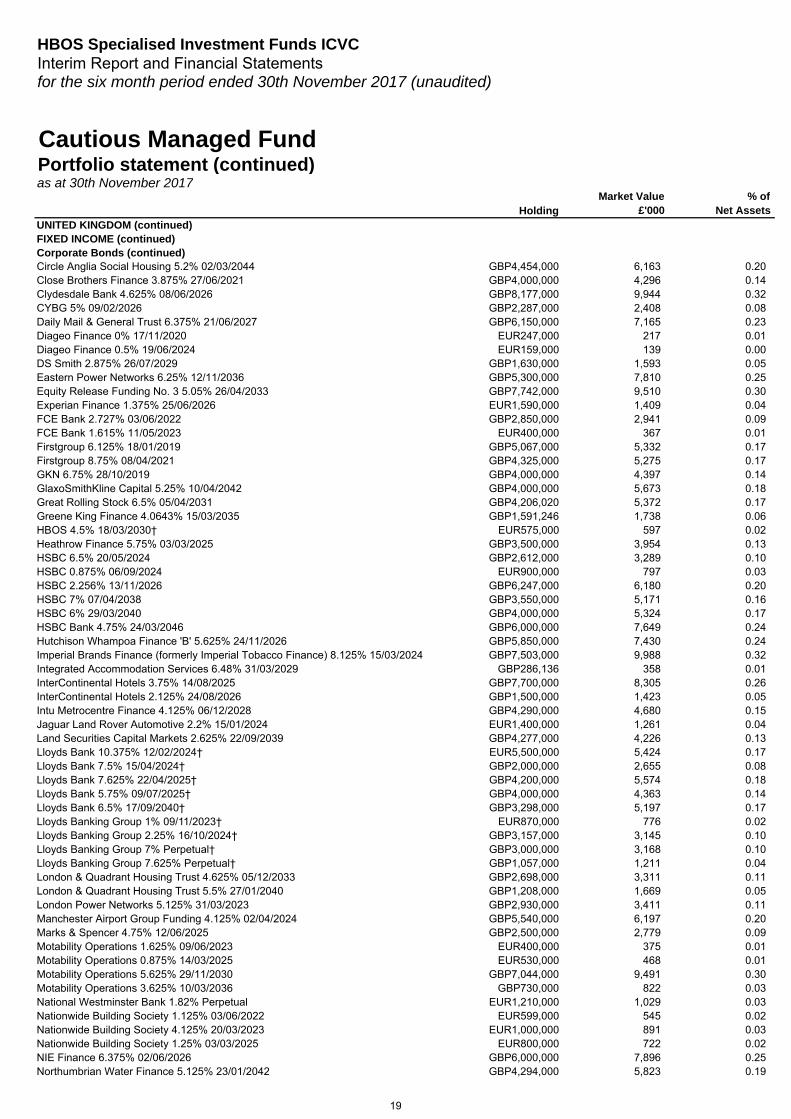
UNITED KINGDOM (continued) FIXED INCOME (continued) Corporate Bonds (continued) Circle Anglia Social Housing 5.2% 02/03/2044 GBP4,454,000 6,163 0.20Close Brothers Finance 3.875% 27/06/2021 GBP4,000,000 4,296 0.14Clydesdale Bank 4.625% 08/06/2026 GBP8,177,000 9,944 0.32CYBG 5% 09/02/2026 GBP2,287,000 2,408 0.08Daily Mail & General Trust 6.375% 21/06/2027 GBP6,150,000 7,165 0.23Diageo Finance 0% 17/11/2020 EUR247,000 217 0.01Diageo Finance 0.5% 19/06/2024 EUR159,000 139 0.00DS Smith 2.875% 26/07/2029 GBP1,630,000 1,593 0.05Eastern Power Networks 6.25% 12/11/2036 GBP5,300,000 7,810 0.25Equity Release Funding No. 3 5.05% 26/04/2033 GBP7,742,000 9,510 0.30Experian Finance 1.375% 25/06/2026 EUR1,590,000 1,409 0.04FCE Bank 2.727% 03/06/2022 GBP2,850,000 2,941 0.09FCE Bank 1.615% 11/05/2023 EUR400,000 367 0.01Firstgroup 6.125% 18/01/2019 GBP5,067,000 5,332 0.17Firstgroup 8.75% 08/04/2021 GBP4,325,000 5,275 0.17GKN 6.75% 28/10/2019 GBP4,000,000 4,397 0.14GlaxoSmithKline Capital 5.25% 10/04/2042 GBP4,000,000 5,673 0.18Great Rolling Stock 6.5% 05/04/2031 GBP4,206,020 5,372 0.17Greene King Finance 4.0643% 15/03/2035 GBP1,591,246 1,738 0.06HBOS 4.5% 18/03/2030† EUR575,000 597 0.02Heathrow Finance 5.75% 03/03/2025 GBP3,500,000 3,954 0.13HSBC 6.5% 20/05/2024 GBP2,612,000 3,289 0.10HSBC 0.875% 06/09/2024 EUR900,000 797 0.03HSBC 2.256% 13/11/2026 GBP6,247,000 6,180 0.20HSBC 7% 07/04/2038 GBP3,550,000 5,171 0.16HSBC 6% 29/03/2040 GBP4,000,000 5,324 0.17HSBC Bank 4.75% 24/03/2046 GBP6,000,000 7,649 0.24Hutchison Whampoa Finance 'B' 5.625% 24/11/2026 GBP5,850,000 7,430 0.24Imperial Brands Finance (formerly Imperial Tobacco Finance) 8.125% 15/03/2024 GBP7,503,000 9,988 0.32Integrated Accommodation Services 6.48% 31/03/2029 GBP286,136 358 0.01InterContinental Hotels 3.75% 14/08/2025 GBP7,700,000 8,305 0.26InterContinental Hotels 2.125% 24/08/2026 GBP1,500,000 1,423 0.05Intu Metrocentre Finance 4.125% 06/12/2028 GBP4,290,000 4,680 0.15Jaguar Land Rover Automotive 2.2% 15/01/2024 EUR1,400,000 1,261 0.04Land Securities Capital Markets 2.625% 22/09/2039 GBP4,277,000 4,226 0.13Lloyds Bank 10.375% 12/02/2024† EUR5,500,000 5,424 0.17Lloyds Bank 7.5% 15/04/2024† GBP2,000,000 2,655 0.08Lloyds Bank 7.625% 22/04/2025† GBP4,200,000 5,574 0.18Lloyds Bank 5.75% 09/07/2025† GBP4,000,000 4,363 0.14Lloyds Bank 6.5% 17/09/2040† GBP3,298,000 5,197 0.17Lloyds Banking Group 1% 09/11/2023† EUR870,000 776 0.02Lloyds Banking Group 2.25% 16/10/2024† GBP3,157,000 3,145 0.10Lloyds Banking Group 7% Perpetual† GBP3,000,000 3,168 0.10Lloyds Banking Group 7.625% Perpetual† GBP1,057,000 1,211 0.04London & Quadrant Housing Trust 4.625% 05/12/2033 GBP2,698,000 3,311 0.11London & Quadrant Housing Trust 5.5% 27/01/2040 GBP1,208,000 1,669 0.05London Power Networks 5.125% 31/03/2023 GBP2,930,000 3,411 0.11Manchester Airport Group Funding 4.125% 02/04/2024 GBP5,540,000 6,197 0.20Marks & Spencer 4.75% 12/06/2025 GBP2,500,000 2,779 0.09Motability Operations 1.625% 09/06/2023 EUR400,000 375 0.01Motability Operations 0.875% 14/03/2025 EUR530,000 468 0.01Motability Operations 5.625% 29/11/2030 GBP7,044,000 9,491 0.30Motability Operations 3.625% 10/03/2036 GBP730,000 822 0.03National Westminster Bank 1.82% Perpetual EUR1,210,000 1,029 0.03Nationwide Building Society 1.125% 03/06/2022 EUR599,000 545 0.02Nationwide Building Society 4.125% 20/03/2023 EUR1,000,000 891 0.03Nationwide Building Society 1.25% 03/03/2025 EUR800,000 722 0.02NIE Finance 6.375% 02/06/2026 GBP6,000,000 7,896 0.25Northumbrian Water Finance 5.125% 23/01/2042 GBP4,294,000 5,823 0.19
19
HBOS Specialised Investment Funds ICVCInterim Report and Financial Statementsfor the six month period ended 30th November 2017 (unaudited)
HoldingMarket Value
£'000% of
Net Assets
Cautious Managed FundPortfolio statement (continued)as at 30th November 2017
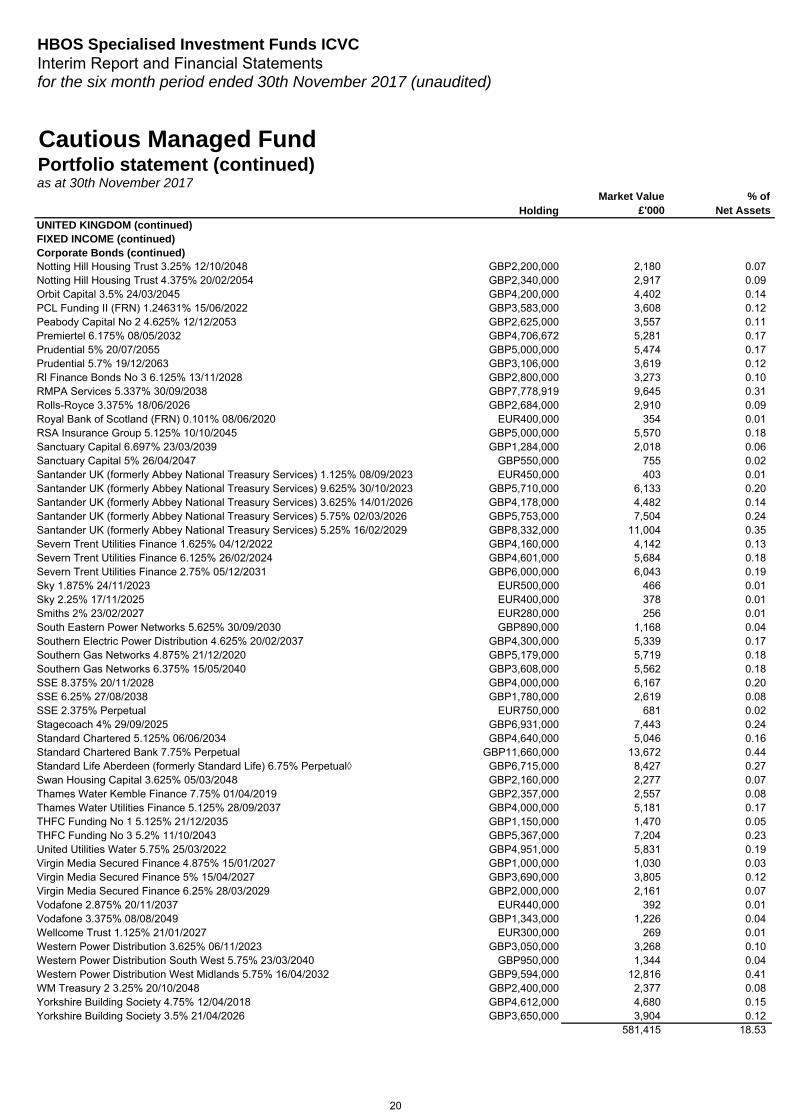
UNITED KINGDOM (continued) FIXED INCOME (continued) Corporate Bonds (continued) Notting Hill Housing Trust 3.25% 12/10/2048 GBP2,200,000 2,180 0.07Notting Hill Housing Trust 4.375% 20/02/2054 GBP2,340,000 2,917 0.09Orbit Capital 3.5% 24/03/2045 GBP4,200,000 4,402 0.14PCL Funding II (FRN) 1.24631% 15/06/2022 GBP3,583,000 3,608 0.12Peabody Capital No 2 4.625% 12/12/2053 GBP2,625,000 3,557 0.11Premiertel 6.175% 08/05/2032 GBP4,706,672 5,281 0.17Prudential 5% 20/07/2055 GBP5,000,000 5,474 0.17Prudential 5.7% 19/12/2063 GBP3,106,000 3,619 0.12Rl Finance Bonds No 3 6.125% 13/11/2028 GBP2,800,000 3,273 0.10RMPA Services 5.337% 30/09/2038 GBP7,778,919 9,645 0.31Rolls-Royce 3.375% 18/06/2026 GBP2,684,000 2,910 0.09Royal Bank of Scotland (FRN) 0.101% 08/06/2020 EUR400,000 354 0.01RSA Insurance Group 5.125% 10/10/2045 GBP5,000,000 5,570 0.18Sanctuary Capital 6.697% 23/03/2039 GBP1,284,000 2,018 0.06Sanctuary Capital 5% 26/04/2047 GBP550,000 755 0.02Santander UK (formerly Abbey National Treasury Services) 1.125% 08/09/2023 EUR450,000 403 0.01Santander UK (formerly Abbey National Treasury Services) 9.625% 30/10/2023 GBP5,710,000 6,133 0.20Santander UK (formerly Abbey National Treasury Services) 3.625% 14/01/2026 GBP4,178,000 4,482 0.14Santander UK (formerly Abbey National Treasury Services) 5.75% 02/03/2026 GBP5,753,000 7,504 0.24Santander UK (formerly Abbey National Treasury Services) 5.25% 16/02/2029 GBP8,332,000 11,004 0.35Severn Trent Utilities Finance 1.625% 04/12/2022 GBP4,160,000 4,142 0.13Severn Trent Utilities Finance 6.125% 26/02/2024 GBP4,601,000 5,684 0.18Severn Trent Utilities Finance 2.75% 05/12/2031 GBP6,000,000 6,043 0.19Sky 1.875% 24/11/2023 EUR500,000 466 0.01Sky 2.25% 17/11/2025 EUR400,000 378 0.01Smiths 2% 23/02/2027 EUR280,000 256 0.01South Eastern Power Networks 5.625% 30/09/2030 GBP890,000 1,168 0.04Southern Electric Power Distribution 4.625% 20/02/2037 GBP4,300,000 5,339 0.17Southern Gas Networks 4.875% 21/12/2020 GBP5,179,000 5,719 0.18Southern Gas Networks 6.375% 15/05/2040 GBP3,608,000 5,562 0.18SSE 8.375% 20/11/2028 GBP4,000,000 6,167 0.20SSE 6.25% 27/08/2038 GBP1,780,000 2,619 0.08SSE 2.375% Perpetual EUR750,000 681 0.02Stagecoach 4% 29/09/2025 GBP6,931,000 7,443 0.24Standard Chartered 5.125% 06/06/2034 GBP4,640,000 5,046 0.16Standard Chartered Bank 7.75% Perpetual GBP11,660,000 13,672 0.44Standard Life Aberdeen (formerly Standard Life) 6.75% Perpetual◊ GBP6,715,000 8,427 0.27Swan Housing Capital 3.625% 05/03/2048 GBP2,160,000 2,277 0.07Thames Water Kemble Finance 7.75% 01/04/2019 GBP2,357,000 2,557 0.08Thames Water Utilities Finance 5.125% 28/09/2037 GBP4,000,000 5,181 0.17THFC Funding No 1 5.125% 21/12/2035 GBP1,150,000 1,470 0.05THFC Funding No 3 5.2% 11/10/2043 GBP5,367,000 7,204 0.23United Utilities Water 5.75% 25/03/2022 GBP4,951,000 5,831 0.19Virgin Media Secured Finance 4.875% 15/01/2027 GBP1,000,000 1,030 0.03Virgin Media Secured Finance 5% 15/04/2027 GBP3,690,000 3,805 0.12Virgin Media Secured Finance 6.25% 28/03/2029 GBP2,000,000 2,161 0.07Vodafone 2.875% 20/11/2037 EUR440,000 392 0.01Vodafone 3.375% 08/08/2049 GBP1,343,000 1,226 0.04Wellcome Trust 1.125% 21/01/2027 EUR300,000 269 0.01Western Power Distribution 3.625% 06/11/2023 GBP3,050,000 3,268 0.10Western Power Distribution South West 5.75% 23/03/2040 GBP950,000 1,344 0.04Western Power Distribution West Midlands 5.75% 16/04/2032 GBP9,594,000 12,816 0.41WM Treasury 2 3.25% 20/10/2048 GBP2,400,000 2,377 0.08Yorkshire Building Society 4.75% 12/04/2018 GBP4,612,000 4,680 0.15Yorkshire Building Society 3.5% 21/04/2026 GBP3,650,000 3,904 0.12
581,415 18.53
20
HBOS Specialised Investment Funds ICVCInterim Report and Financial Statementsfor the six month period ended 30th November 2017 (unaudited)
HoldingMarket Value
£'000% of
Net Assets
Cautious Managed FundPortfolio statement (continued)as at 30th November 2017
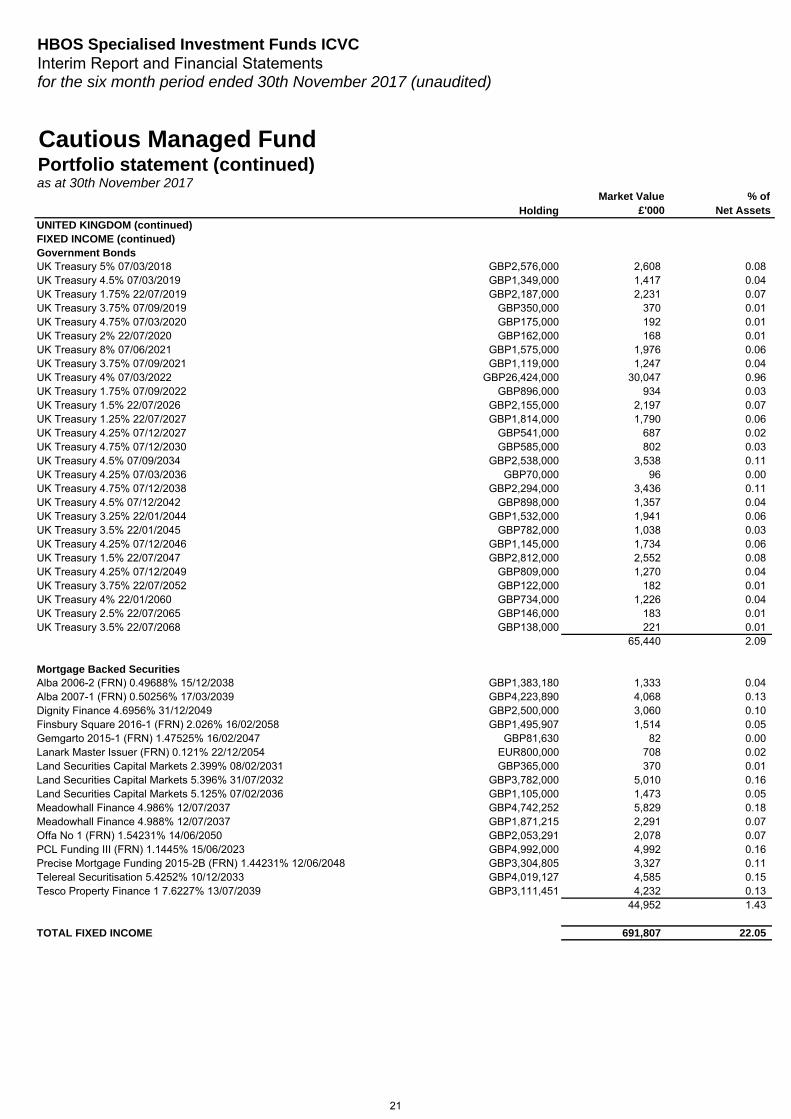
UNITED KINGDOM (continued) FIXED INCOME (continued) Government Bonds UK Treasury 5% 07/03/2018 GBP2,576,000 2,608 0.08UK Treasury 4.5% 07/03/2019 GBP1,349,000 1,417 0.04UK Treasury 1.75% 22/07/2019 GBP2,187,000 2,231 0.07UK Treasury 3.75% 07/09/2019 GBP350,000 370 0.01UK Treasury 4.75% 07/03/2020 GBP175,000 192 0.01UK Treasury 2% 22/07/2020 GBP162,000 168 0.01UK Treasury 8% 07/06/2021 GBP1,575,000 1,976 0.06UK Treasury 3.75% 07/09/2021 GBP1,119,000 1,247 0.04UK Treasury 4% 07/03/2022 GBP26,424,000 30,047 0.96UK Treasury 1.75% 07/09/2022 GBP896,000 934 0.03UK Treasury 1.5% 22/07/2026 GBP2,155,000 2,197 0.07UK Treasury 1.25% 22/07/2027 GBP1,814,000 1,790 0.06UK Treasury 4.25% 07/12/2027 GBP541,000 687 0.02UK Treasury 4.75% 07/12/2030 GBP585,000 802 0.03UK Treasury 4.5% 07/09/2034 GBP2,538,000 3,538 0.11UK Treasury 4.25% 07/03/2036 GBP70,000 96 0.00UK Treasury 4.75% 07/12/2038 GBP2,294,000 3,436 0.11UK Treasury 4.5% 07/12/2042 GBP898,000 1,357 0.04UK Treasury 3.25% 22/01/2044 GBP1,532,000 1,941 0.06UK Treasury 3.5% 22/01/2045 GBP782,000 1,038 0.03UK Treasury 4.25% 07/12/2046 GBP1,145,000 1,734 0.06UK Treasury 1.5% 22/07/2047 GBP2,812,000 2,552 0.08UK Treasury 4.25% 07/12/2049 GBP809,000 1,270 0.04UK Treasury 3.75% 22/07/2052 GBP122,000 182 0.01UK Treasury 4% 22/01/2060 GBP734,000 1,226 0.04UK Treasury 2.5% 22/07/2065 GBP146,000 183 0.01UK Treasury 3.5% 22/07/2068 GBP138,000 221 0.01
65,440 2.09
Mortgage Backed SecuritiesAlba 2006-2 (FRN) 0.49688% 15/12/2038 GBP1,383,180 1,333 0.04Alba 2007-1 (FRN) 0.50256% 17/03/2039 GBP4,223,890 4,068 0.13Dignity Finance 4.6956% 31/12/2049 GBP2,500,000 3,060 0.10Finsbury Square 2016-1 (FRN) 2.026% 16/02/2058 GBP1,495,907 1,514 0.05Gemgarto 2015-1 (FRN) 1.47525% 16/02/2047 GBP81,630 82 0.00Lanark Master Issuer (FRN) 0.121% 22/12/2054 EUR800,000 708 0.02Land Securities Capital Markets 2.399% 08/02/2031 GBP365,000 370 0.01Land Securities Capital Markets 5.396% 31/07/2032 GBP3,782,000 5,010 0.16Land Securities Capital Markets 5.125% 07/02/2036 GBP1,105,000 1,473 0.05Meadowhall Finance 4.986% 12/07/2037 GBP4,742,252 5,829 0.18Meadowhall Finance 4.988% 12/07/2037 GBP1,871,215 2,291 0.07Offa No 1 (FRN) 1.54231% 14/06/2050 GBP2,053,291 2,078 0.07PCL Funding III (FRN) 1.1445% 15/06/2023 GBP4,992,000 4,992 0.16Precise Mortgage Funding 2015-2B (FRN) 1.44231% 12/06/2048 GBP3,304,805 3,327 0.11Telereal Securitisation 5.4252% 10/12/2033 GBP4,019,127 4,585 0.15Tesco Property Finance 1 7.6227% 13/07/2039 GBP3,111,451 4,232 0.13
44,952 1.43
TOTAL FIXED INCOME 691,807 22.05
21
HBOS Specialised Investment Funds ICVCInterim Report and Financial Statementsfor the six month period ended 30th November 2017 (unaudited)
HoldingMarket Value
£'000% of
Net Assets
Cautious Managed FundPortfolio statement (continued)as at 30th November 2017
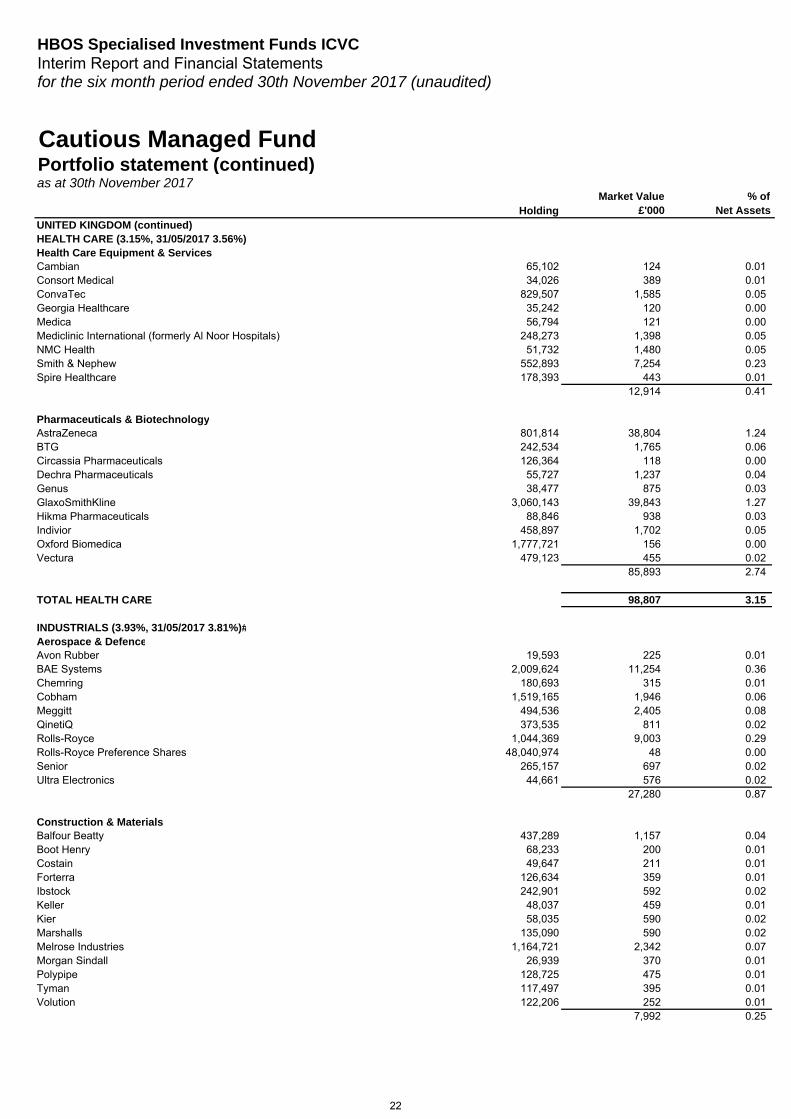
UNITED KINGDOM (continued) HEALTH CARE (3.15%, 31/05/2017 3.56%) Health Care Equipment & Services Cambian 65,102 124 0.01Consort Medical 34,026 389 0.01ConvaTec 829,507 1,585 0.05Georgia Healthcare 35,242 120 0.00Medica 56,794 121 0.00Mediclinic International (formerly Al Noor Hospitals) 248,273 1,398 0.05NMC Health 51,732 1,480 0.05Smith & Nephew 552,893 7,254 0.23Spire Healthcare 178,393 443 0.01
12,914 0.41
Pharmaceuticals & BiotechnologyAstraZeneca 801,814 38,804 1.24BTG 242,534 1,765 0.06Circassia Pharmaceuticals 126,364 118 0.00Dechra Pharmaceuticals 55,727 1,237 0.04Genus 38,477 875 0.03GlaxoSmithKline 3,060,143 39,843 1.27Hikma Pharmaceuticals 88,846 938 0.03Indivior 458,897 1,702 0.05Oxford Biomedica 1,777,721 156 0.00Vectura 479,123 455 0.02
85,893 2.74
TOTAL HEALTH CARE 98,807 3.15
INDUSTRIALS (3.93%, 31/05/2017 3.81%)#Aerospace & DefenceAvon Rubber 19,593 225 0.01BAE Systems 2,009,624 11,254 0.36Chemring 180,693 315 0.01Cobham 1,519,165 1,946 0.06Meggitt 494,536 2,405 0.08QinetiQ 373,535 811 0.02Rolls-Royce 1,044,369 9,003 0.29Rolls-Royce Preference Shares 48,040,974 48 0.00Senior 265,157 697 0.02Ultra Electronics 44,661 576 0.02
27,280 0.87
Construction & MaterialsBalfour Beatty 437,289 1,157 0.04Boot Henry 68,233 200 0.01Costain 49,647 211 0.01Forterra 126,634 359 0.01Ibstock 242,901 592 0.02Keller 48,037 459 0.01Kier 58,035 590 0.02Marshalls 135,090 590 0.02Melrose Industries 1,164,721 2,342 0.07Morgan Sindall 26,939 370 0.01Polypipe 128,725 475 0.01Tyman 117,497 395 0.01Volution 122,206 252 0.01
7,992 0.25
22
HBOS Specialised Investment Funds ICVCInterim Report and Financial Statementsfor the six month period ended 30th November 2017 (unaudited)
HoldingMarket Value
£'000% of
Net Assets
Cautious Managed FundPortfolio statement (continued)as at 30th November 2017
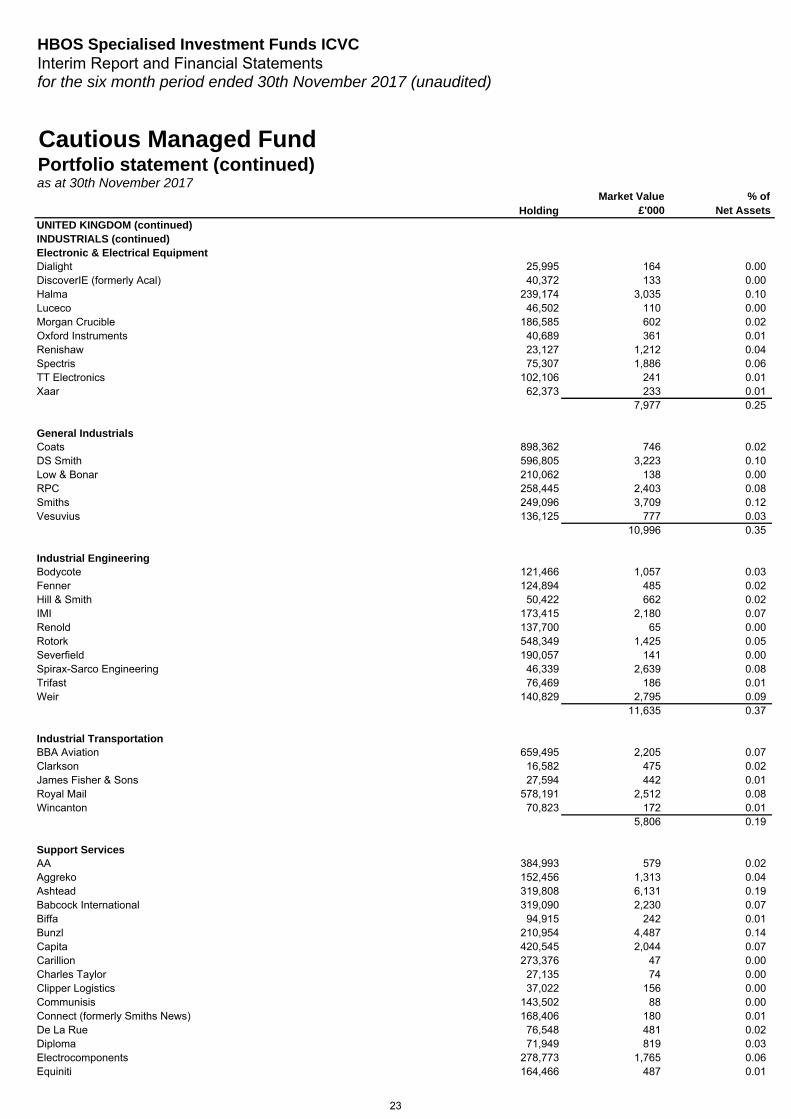
UNITED KINGDOM (continued) INDUSTRIALS (continued) Electronic & Electrical Equipment Dialight 25,995 164 0.00DiscoverIE (formerly Acal) 40,372 133 0.00Halma 239,174 3,035 0.10Luceco 46,502 110 0.00Morgan Crucible 186,585 602 0.02Oxford Instruments 40,689 361 0.01Renishaw 23,127 1,212 0.04Spectris 75,307 1,886 0.06TT Electronics 102,106 241 0.01Xaar 62,373 233 0.01
7,977 0.25
General IndustrialsCoats 898,362 746 0.02DS Smith 596,805 3,223 0.10Low & Bonar 210,062 138 0.00RPC 258,445 2,403 0.08Smiths 249,096 3,709 0.12Vesuvius 136,125 777 0.03
10,996 0.35
Industrial EngineeringBodycote 121,466 1,057 0.03Fenner 124,894 485 0.02Hill & Smith 50,422 662 0.02IMI 173,415 2,180 0.07Renold 137,700 65 0.00Rotork 548,349 1,425 0.05Severfield 190,057 141 0.00Spirax-Sarco Engineering 46,339 2,639 0.08Trifast 76,469 186 0.01Weir 140,829 2,795 0.09
11,635 0.37
Industrial TransportationBBA Aviation 659,495 2,205 0.07Clarkson 16,582 475 0.02James Fisher & Sons 27,594 442 0.01Royal Mail 578,191 2,512 0.08Wincanton 70,823 172 0.01
5,806 0.19
Support ServicesAA 384,993 579 0.02Aggreko 152,456 1,313 0.04Ashtead 319,808 6,131 0.19Babcock International 319,090 2,230 0.07Biffa 94,915 242 0.01Bunzl 210,954 4,487 0.14Capita 420,545 2,044 0.07Carillion 273,376 47 0.00Charles Taylor 27,135 74 0.00Clipper Logistics 37,022 156 0.00Communisis 143,502 88 0.00Connect (formerly Smiths News) 168,406 180 0.01De La Rue 76,548 481 0.02Diploma 71,949 819 0.03Electrocomponents 278,773 1,765 0.06Equiniti 164,466 487 0.01
23
HBOS Specialised Investment Funds ICVCInterim Report and Financial Statementsfor the six month period ended 30th November 2017 (unaudited)
HoldingMarket Value
£'000% of
Net Assets
Cautious Managed FundPortfolio statement (continued)as at 30th November 2017
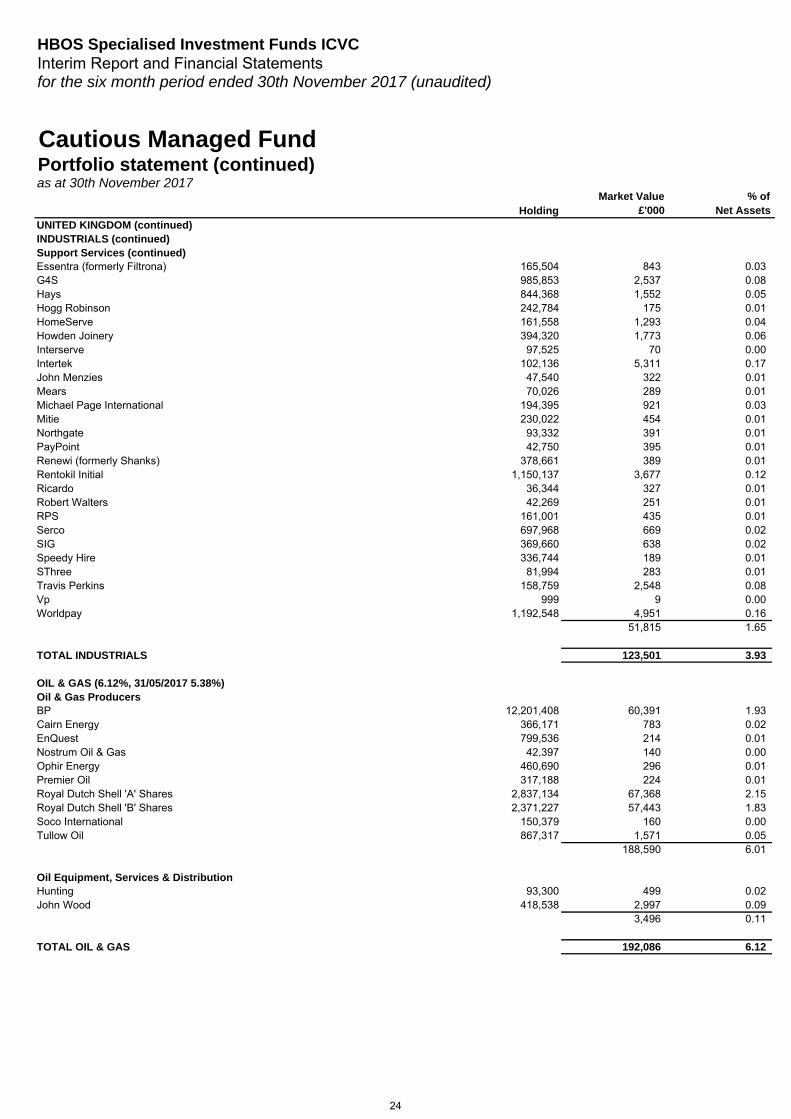
UNITED KINGDOM (continued) INDUSTRIALS (continued) Support Services (continued) Essentra (formerly Filtrona) 165,504 843 0.03G4S 985,853 2,537 0.08Hays 844,368 1,552 0.05Hogg Robinson 242,784 175 0.01HomeServe 161,558 1,293 0.04Howden Joinery 394,320 1,773 0.06Interserve 97,525 70 0.00Intertek 102,136 5,311 0.17John Menzies 47,540 322 0.01Mears 70,026 289 0.01Michael Page International 194,395 921 0.03Mitie 230,022 454 0.01Northgate 93,332 391 0.01PayPoint 42,750 395 0.01Renewi (formerly Shanks) 378,661 389 0.01Rentokil Initial 1,150,137 3,677 0.12Ricardo 36,344 327 0.01Robert Walters 42,269 251 0.01RPS 161,001 435 0.01Serco 697,968 669 0.02SIG 369,660 638 0.02Speedy Hire 336,744 189 0.01SThree 81,994 283 0.01Travis Perkins 158,759 2,548 0.08Vp 999 9 0.00Worldpay 1,192,548 4,951 0.16
51,815 1.65
TOTAL INDUSTRIALS 123,501 3.93
OIL & GAS (6.12%, 31/05/2017 5.38%) Oil & Gas ProducersBP 12,201,408 60,391 1.93Cairn Energy 366,171 783 0.02EnQuest 799,536 214 0.01Nostrum Oil & Gas 42,397 140 0.00Ophir Energy 460,690 296 0.01Premier Oil 317,188 224 0.01Royal Dutch Shell 'A' Shares 2,837,134 67,368 2.15Royal Dutch Shell 'B' Shares 2,371,227 57,443 1.83Soco International 150,379 160 0.00Tullow Oil 867,317 1,571 0.05
188,590 6.01
Oil Equipment, Services & DistributionHunting 93,300 499 0.02John Wood 418,538 2,997 0.09
3,496 0.11
TOTAL OIL & GAS 192,086 6.12
24
HBOS Specialised Investment Funds ICVCInterim Report and Financial Statementsfor the six month period ended 30th November 2017 (unaudited)
HoldingMarket Value
£'000% of
Net Assets
Cautious Managed FundPortfolio statement (continued)as at 30th November 2017
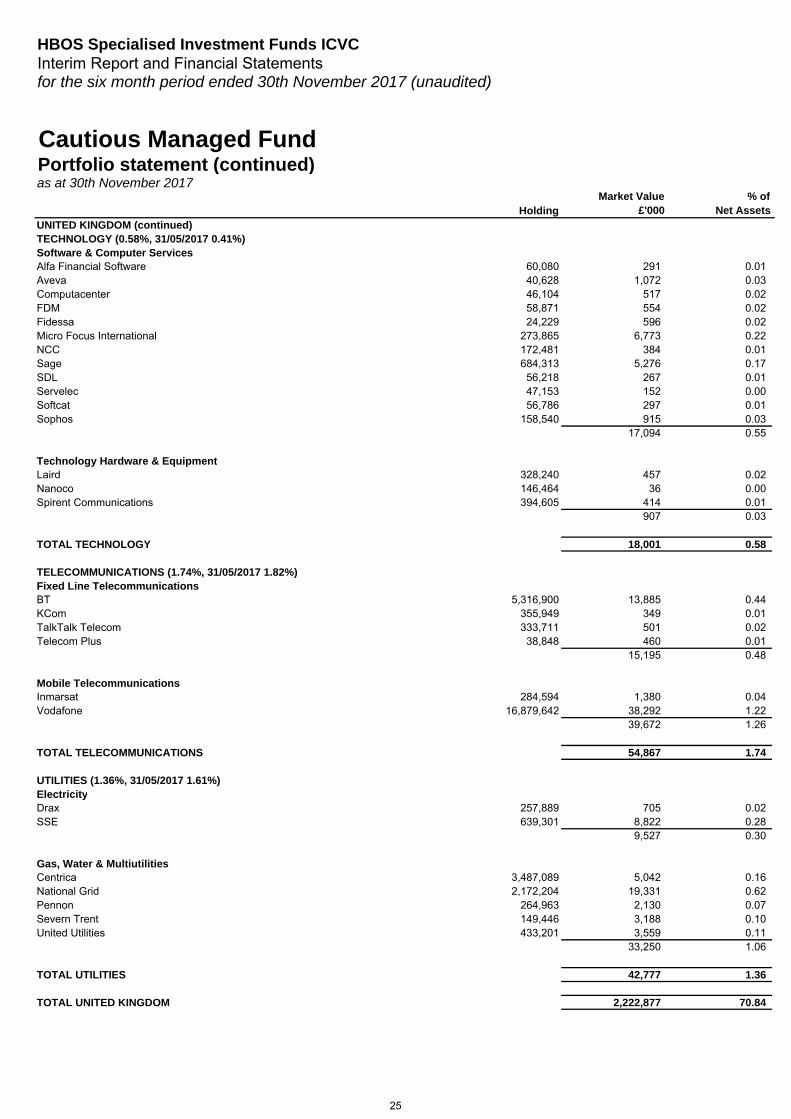
UNITED KINGDOM (continued) TECHNOLOGY (0.58%, 31/05/2017 0.41%) Software & Computer Services Alfa Financial Software 60,080 291 0.01Aveva 40,628 1,072 0.03Computacenter 46,104 517 0.02FDM 58,871 554 0.02Fidessa 24,229 596 0.02Micro Focus International 273,865 6,773 0.22NCC 172,481 384 0.01Sage 684,313 5,276 0.17SDL 56,218 267 0.01Servelec 47,153 152 0.00Softcat 56,786 297 0.01Sophos 158,540 915 0.03
17,094 0.55
Technology Hardware & EquipmentLaird 328,240 457 0.02Nanoco 146,464 36 0.00Spirent Communications 394,605 414 0.01
907 0.03
TOTAL TECHNOLOGY 18,001 0.58
TELECOMMUNICATIONS (1.74%, 31/05/2017 1.82%) Fixed Line TelecommunicationsBT 5,316,900 13,885 0.44KCom 355,949 349 0.01TalkTalk Telecom 333,711 501 0.02Telecom Plus 38,848 460 0.01
15,195 0.48
Mobile TelecommunicationsInmarsat 284,594 1,380 0.04Vodafone 16,879,642 38,292 1.22
39,672 1.26
TOTAL TELECOMMUNICATIONS 54,867 1.74
UTILITIES (1.36%, 31/05/2017 1.61%) ElectricityDrax 257,889 705 0.02SSE 639,301 8,822 0.28
9,527 0.30
Gas, Water & MultiutilitiesCentrica 3,487,089 5,042 0.16National Grid 2,172,204 19,331 0.62Pennon 264,963 2,130 0.07Severn Trent 149,446 3,188 0.10United Utilities 433,201 3,559 0.11
33,250 1.06
TOTAL UTILITIES 42,777 1.36
TOTAL UNITED KINGDOM 2,222,877 70.84
25
HBOS Specialised Investment Funds ICVCInterim Report and Financial Statementsfor the six month period ended 30th November 2017 (unaudited)
HoldingMarket Value
£'000% of
Net Assets
Cautious Managed FundPortfolio statement (continued)as at 30th November 2017
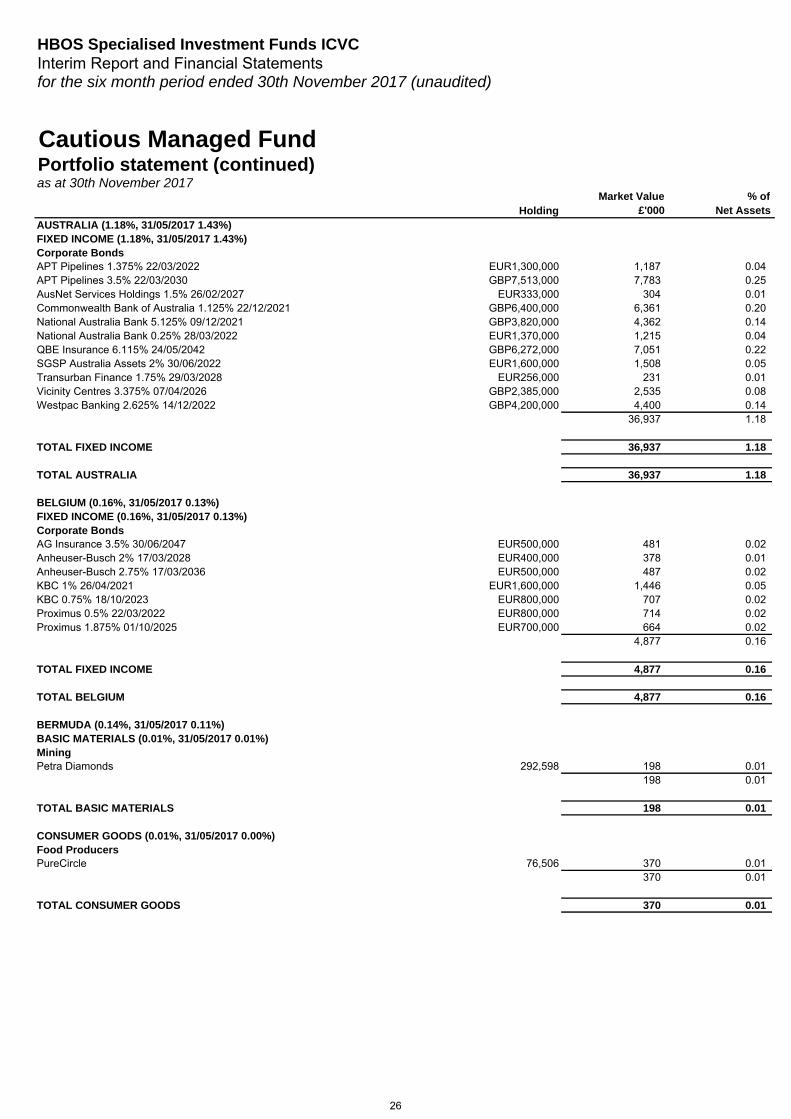
AUSTRALIA (1.18%, 31/05/2017 1.43%) FIXED INCOME (1.18%, 31/05/2017 1.43%) Corporate BondsAPT Pipelines 1.375% 22/03/2022 EUR1,300,000 1,187 0.04APT Pipelines 3.5% 22/03/2030 GBP7,513,000 7,783 0.25AusNet Services Holdings 1.5% 26/02/2027 EUR333,000 304 0.01Commonwealth Bank of Australia 1.125% 22/12/2021 GBP6,400,000 6,361 0.20National Australia Bank 5.125% 09/12/2021 GBP3,820,000 4,362 0.14National Australia Bank 0.25% 28/03/2022 EUR1,370,000 1,215 0.04QBE Insurance 6.115% 24/05/2042 GBP6,272,000 7,051 0.22SGSP Australia Assets 2% 30/06/2022 EUR1,600,000 1,508 0.05Transurban Finance 1.75% 29/03/2028 EUR256,000 231 0.01Vicinity Centres 3.375% 07/04/2026 GBP2,385,000 2,535 0.08Westpac Banking 2.625% 14/12/2022 GBP4,200,000 4,400 0.14
36,937 1.18
TOTAL FIXED INCOME 36,937 1.18
TOTAL AUSTRALIA 36,937 1.18
BELGIUM (0.16%, 31/05/2017 0.13%) FIXED INCOME (0.16%, 31/05/2017 0.13%) Corporate BondsAG Insurance 3.5% 30/06/2047 EUR500,000 481 0.02Anheuser-Busch 2% 17/03/2028 EUR400,000 378 0.01Anheuser-Busch 2.75% 17/03/2036 EUR500,000 487 0.02KBC 1% 26/04/2021 EUR1,600,000 1,446 0.05KBC 0.75% 18/10/2023 EUR800,000 707 0.02Proximus 0.5% 22/03/2022 EUR800,000 714 0.02Proximus 1.875% 01/10/2025 EUR700,000 664 0.02
4,877 0.16
TOTAL FIXED INCOME 4,877 0.16
TOTAL BELGIUM 4,877 0.16
BERMUDA (0.14%, 31/05/2017 0.11%) BASIC MATERIALS (0.01%, 31/05/2017 0.01%) MiningPetra Diamonds 292,598 198 0.01
198 0.01
TOTAL BASIC MATERIALS 198 0.01
CONSUMER GOODS (0.01%, 31/05/2017 0.00%) Food ProducersPureCircle 76,506 370 0.01
370 0.01
TOTAL CONSUMER GOODS 370 0.01
26
HBOS Specialised Investment Funds ICVCInterim Report and Financial Statementsfor the six month period ended 30th November 2017 (unaudited)
HoldingMarket Value
£'000% of
Net Assets
Cautious Managed FundPortfolio statement (continued)as at 30th November 2017
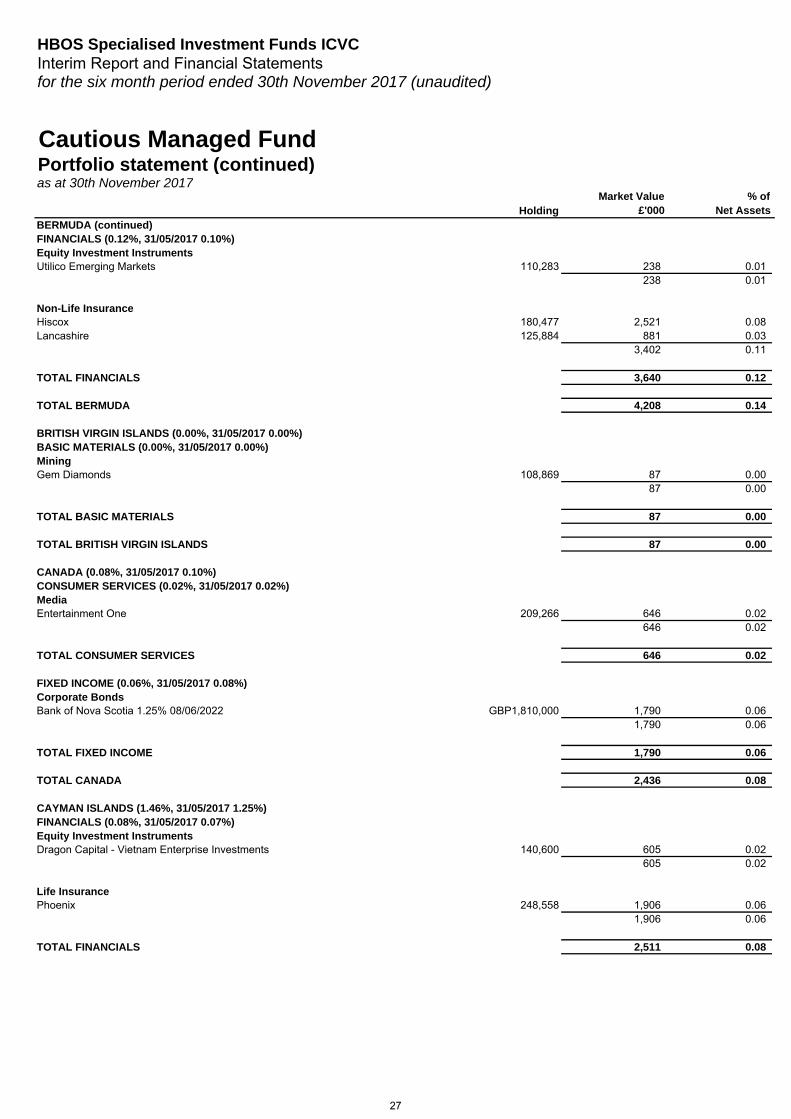
BERMUDA (continued) FINANCIALS (0.12%, 31/05/2017 0.10%) Equity Investment Instruments Utilico Emerging Markets 110,283 238 0.01
238 0.01
Non-Life InsuranceHiscox 180,477 2,521 0.08Lancashire 125,884 881 0.03
3,402 0.11
TOTAL FINANCIALS 3,640 0.12
TOTAL BERMUDA 4,208 0.14
BRITISH VIRGIN ISLANDS (0.00%, 31/05/2017 0.00%) BASIC MATERIALS (0.00%, 31/05/2017 0.00%) MiningGem Diamonds 108,869 87 0.00
87 0.00
TOTAL BASIC MATERIALS 87 0.00
TOTAL BRITISH VIRGIN ISLANDS 87 0.00
CANADA (0.08%, 31/05/2017 0.10%) CONSUMER SERVICES (0.02%, 31/05/2017 0.02%) MediaEntertainment One 209,266 646 0.02
646 0.02
TOTAL CONSUMER SERVICES 646 0.02
FIXED INCOME (0.06%, 31/05/2017 0.08%) Corporate BondsBank of Nova Scotia 1.25% 08/06/2022 GBP1,810,000 1,790 0.06
1,790 0.06
TOTAL FIXED INCOME 1,790 0.06
TOTAL CANADA 2,436 0.08
CAYMAN ISLANDS (1.46%, 31/05/2017 1.25%) FINANCIALS (0.08%, 31/05/2017 0.07%) Equity Investment InstrumentsDragon Capital - Vietnam Enterprise Investments 140,600 605 0.02
605 0.02
Life InsurancePhoenix 248,558 1,906 0.06
1,906 0.06
TOTAL FINANCIALS 2,511 0.08
27
HBOS Specialised Investment Funds ICVCInterim Report and Financial Statementsfor the six month period ended 30th November 2017 (unaudited)
HoldingMarket Value
£'000% of
Net Assets
Cautious Managed FundPortfolio statement (continued)as at 30th November 2017
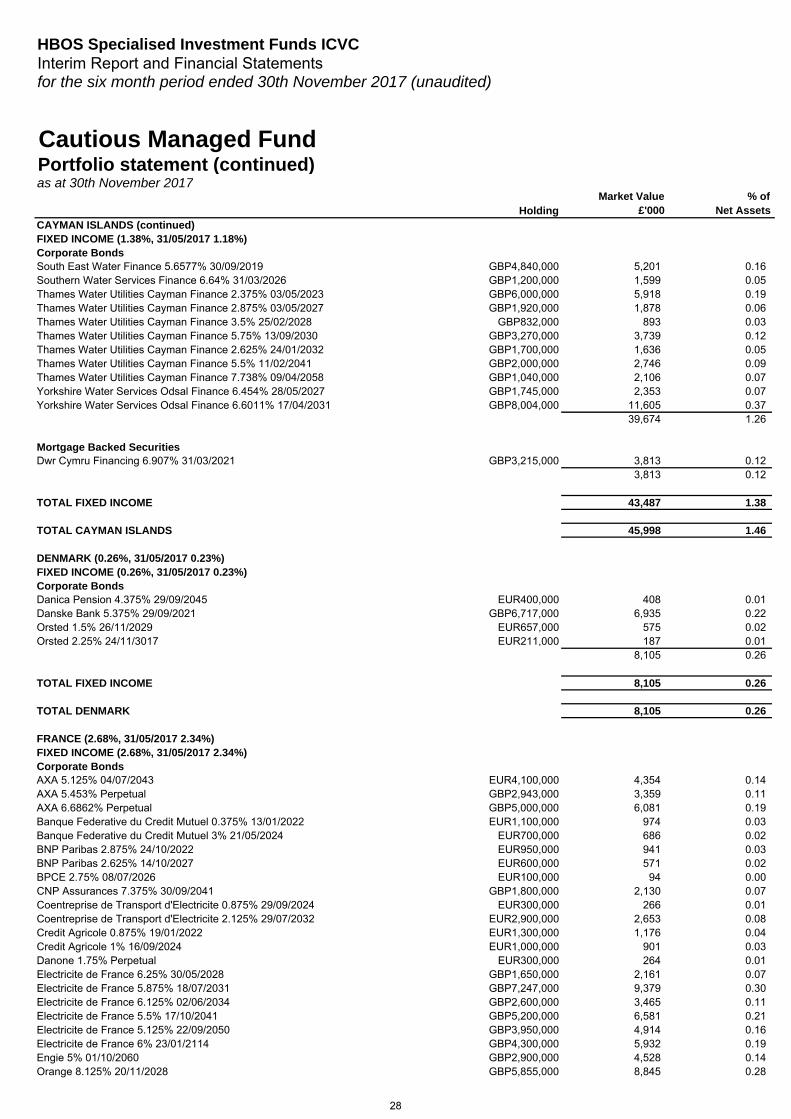
CAYMAN ISLANDS (continued) FIXED INCOME (1.38%, 31/05/2017 1.18%) Corporate BondsSouth East Water Finance 5.6577% 30/09/2019 GBP4,840,000 5,201 0.16Southern Water Services Finance 6.64% 31/03/2026 GBP1,200,000 1,599 0.05Thames Water Utilities Cayman Finance 2.375% 03/05/2023 GBP6,000,000 5,918 0.19Thames Water Utilities Cayman Finance 2.875% 03/05/2027 GBP1,920,000 1,878 0.06Thames Water Utilities Cayman Finance 3.5% 25/02/2028 GBP832,000 893 0.03Thames Water Utilities Cayman Finance 5.75% 13/09/2030 GBP3,270,000 3,739 0.12Thames Water Utilities Cayman Finance 2.625% 24/01/2032 GBP1,700,000 1,636 0.05Thames Water Utilities Cayman Finance 5.5% 11/02/2041 GBP2,000,000 2,746 0.09Thames Water Utilities Cayman Finance 7.738% 09/04/2058 GBP1,040,000 2,106 0.07Yorkshire Water Services Odsal Finance 6.454% 28/05/2027 GBP1,745,000 2,353 0.07Yorkshire Water Services Odsal Finance 6.6011% 17/04/2031 GBP8,004,000 11,605 0.37
39,674 1.26
Mortgage Backed SecuritiesDwr Cymru Financing 6.907% 31/03/2021 GBP3,215,000 3,813 0.12
3,813 0.12
TOTAL FIXED INCOME 43,487 1.38
TOTAL CAYMAN ISLANDS 45,998 1.46
DENMARK (0.26%, 31/05/2017 0.23%) FIXED INCOME (0.26%, 31/05/2017 0.23%) Corporate BondsDanica Pension 4.375% 29/09/2045 EUR400,000 408 0.01Danske Bank 5.375% 29/09/2021 GBP6,717,000 6,935 0.22Orsted 1.5% 26/11/2029 EUR657,000 575 0.02Orsted 2.25% 24/11/3017 EUR211,000 187 0.01
8,105 0.26
TOTAL FIXED INCOME 8,105 0.26
TOTAL DENMARK 8,105 0.26
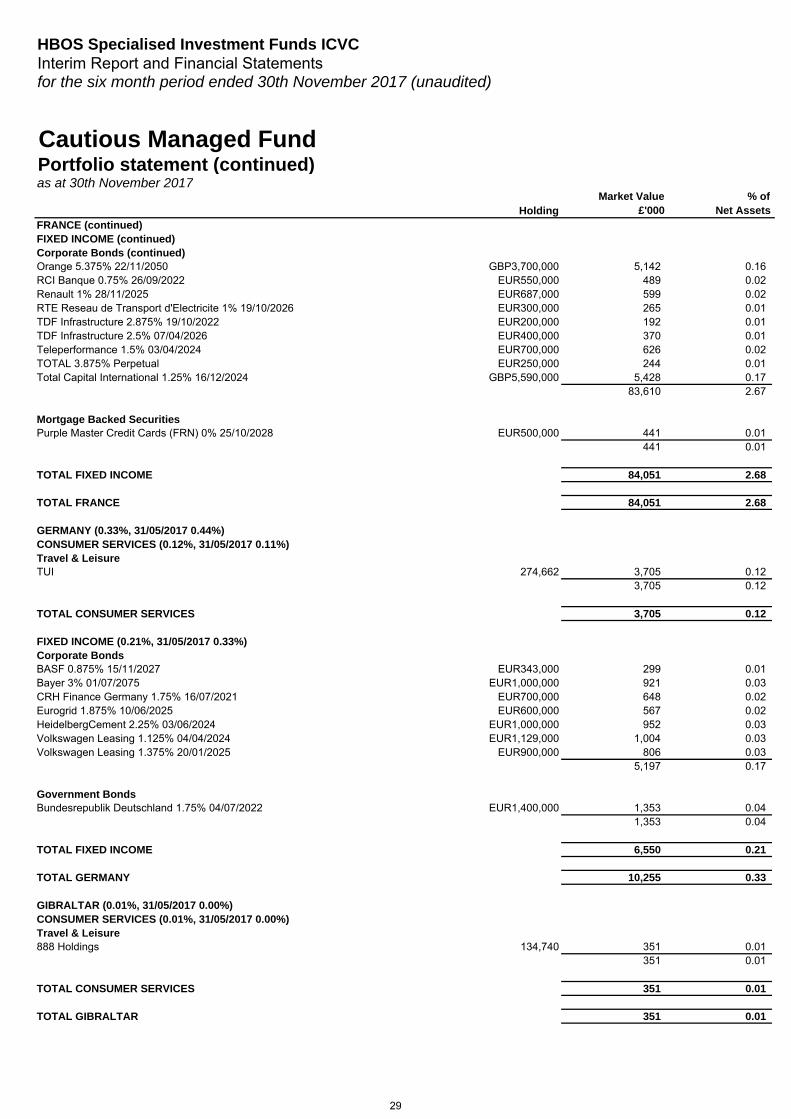
FRANCE (2.68%, 31/05/2017 2.34%) FIXED INCOME (2.68%, 31/05/2017 2.34%) Corporate BondsAXA 5.125% 04/07/2043 EUR4,100,000 4,354 0.14AXA 5.453% Perpetual GBP2,943,000 3,359 0.11AXA 6.6862% Perpetual GBP5,000,000 6,081 0.19Banque Federative du Credit Mutuel 0.375% 13/01/2022 EUR1,100,000 974 0.03Banque Federative du Credit Mutuel 3% 21/05/2024 EUR700,000 686 0.02BNP Paribas 2.875% 24/10/2022 EUR950,000 941 0.03BNP Paribas 2.625% 14/10/2027 EUR600,000 571 0.02BPCE 2.75% 08/07/2026 EUR100,000 94 0.00CNP Assurances 7.375% 30/09/2041 GBP1,800,000 2,130 0.07Coentreprise de Transport d'Electricite 0.875% 29/09/2024 EUR300,000 266 0.01Coentreprise de Transport d'Electricite 2.125% 29/07/2032 EUR2,900,000 2,653 0.08Credit Agricole 0.875% 19/01/2022 EUR1,300,000 1,176 0.04Credit Agricole 1% 16/09/2024 EUR1,000,000 901 0.03Danone 1.75% Perpetual EUR300,000 264 0.01Electricite de France 6.25% 30/05/2028 GBP1,650,000 2,161 0.07Electricite de France 5.875% 18/07/2031 GBP7,247,000 9,379 0.30Electricite de France 6.125% 02/06/2034 GBP2,600,000 3,465 0.11Electricite de France 5.5% 17/10/2041 GBP5,200,000 6,581 0.21Electricite de France 5.125% 22/09/2050 GBP3,950,000 4,914 0.16Electricite de France 6% 23/01/2114 GBP4,300,000 5,932 0.19Engie 5% 01/10/2060 GBP2,900,000 4,528 0.14Orange 8.125% 20/11/2028 GBP5,855,000 8,845 0.28
28
HBOS Specialised Investment Funds ICVCInterim Report and Financial Statementsfor the six month period ended 30th November 2017 (unaudited)
HoldingMarket Value
£'000% of
Net Assets
Cautious Managed FundPortfolio statement (continued)as at 30th November 2017
FRANCE (continued) FIXED INCOME (continued) Corporate Bonds (continued) Orange 5.375% 22/11/2050 GBP3,700,000 5,142 0.16RCI Banque 0.75% 26/09/2022 EUR550,000 489 0.02Renault 1% 28/11/2025 EUR687,000 599 0.02RTE Reseau de Transport d'Electricite 1% 19/10/2026 EUR300,000 265 0.01TDF Infrastructure 2.875% 19/10/2022 EUR200,000 192 0.01TDF Infrastructure 2.5% 07/04/2026 EUR400,000 370 0.01Teleperformance 1.5% 03/04/2024 EUR700,000 626 0.02TOTAL 3.875% Perpetual EUR250,000 244 0.01Total Capital International 1.25% 16/12/2024 GBP5,590,000 5,428 0.17
83,610 2.67
Mortgage Backed SecuritiesPurple Master Credit Cards (FRN) 0% 25/10/2028 EUR500,000 441 0.01
441 0.01
TOTAL FIXED INCOME 84,051 2.68
TOTAL FRANCE 84,051 2.68
GERMANY (0.33%, 31/05/2017 0.44%) CONSUMER SERVICES (0.12%, 31/05/2017 0.11%) Travel & LeisureTUI 274,662 3,705 0.12
3,705 0.12
TOTAL CONSUMER SERVICES 3,705 0.12
FIXED INCOME (0.21%, 31/05/2017 0.33%) Corporate BondsBASF 0.875% 15/11/2027 EUR343,000 299 0.01Bayer 3% 01/07/2075 EUR1,000,000 921 0.03CRH Finance Germany 1.75% 16/07/2021 EUR700,000 648 0.02Eurogrid 1.875% 10/06/2025 EUR600,000 567 0.02HeidelbergCement 2.25% 03/06/2024 EUR1,000,000 952 0.03Volkswagen Leasing 1.125% 04/04/2024 EUR1,129,000 1,004 0.03Volkswagen Leasing 1.375% 20/01/2025 EUR900,000 806 0.03
5,197 0.17
Government BondsBundesrepublik Deutschland 1.75% 04/07/2022 EUR1,400,000 1,353 0.04
1,353 0.04
TOTAL FIXED INCOME 6,550 0.21
TOTAL GERMANY 10,255 0.33
GIBRALTAR (0.01%, 31/05/2017 0.00%) CONSUMER SERVICES (0.01%, 31/05/2017 0.00%) Travel & Leisure888 Holdings 134,740 351 0.01
351 0.01
TOTAL CONSUMER SERVICES 351 0.01
TOTAL GIBRALTAR 351 0.01
29
HBOS Specialised Investment Funds ICVCInterim Report and Financial Statementsfor the six month period ended 30th November 2017 (unaudited)
HoldingMarket Value
£'000% of
Net Assets
Cautious Managed FundPortfolio statement (continued)as at 30th November 2017
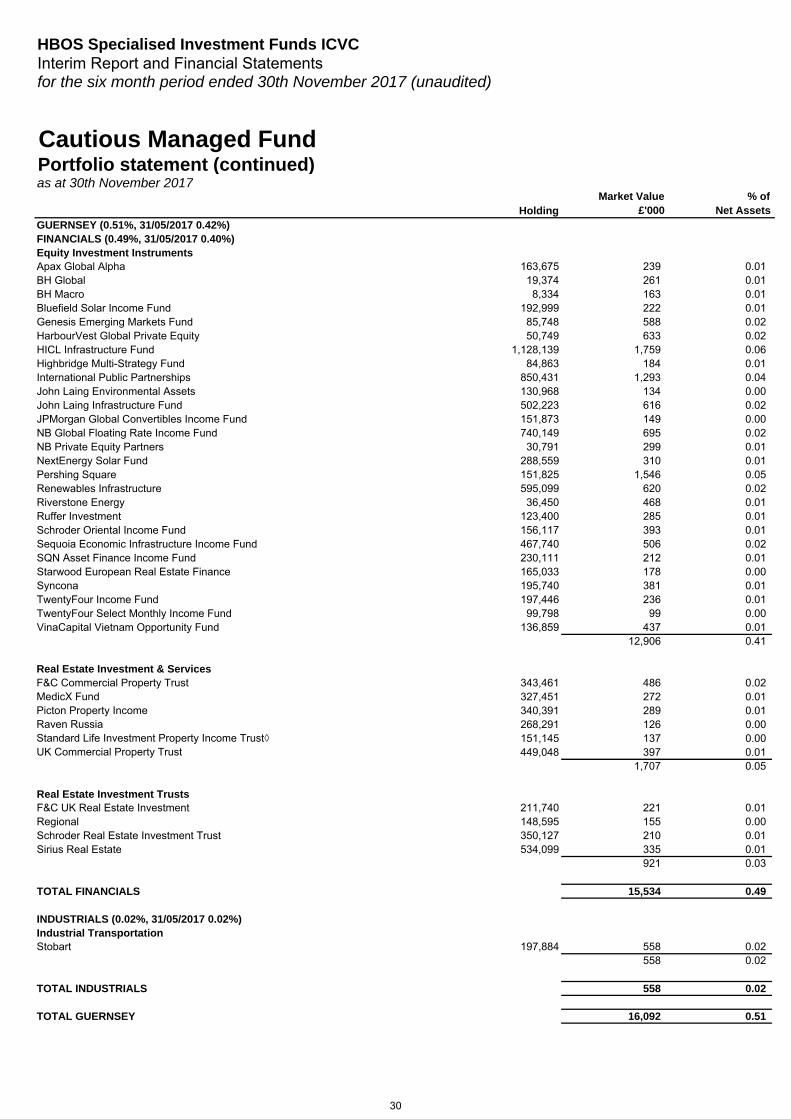
GUERNSEY (0.51%, 31/05/2017 0.42%) FINANCIALS (0.49%, 31/05/2017 0.40%) Equity Investment InstrumentsApax Global Alpha 163,675 239 0.01BH Global 19,374 261 0.01BH Macro 8,334 163 0.01Bluefield Solar Income Fund 192,999 222 0.01Genesis Emerging Markets Fund 85,748 588 0.02HarbourVest Global Private Equity 50,749 633 0.02HICL Infrastructure Fund 1,128,139 1,759 0.06Highbridge Multi-Strategy Fund 84,863 184 0.01International Public Partnerships 850,431 1,293 0.04John Laing Environmental Assets 130,968 134 0.00John Laing Infrastructure Fund 502,223 616 0.02JPMorgan Global Convertibles Income Fund 151,873 149 0.00NB Global Floating Rate Income Fund 740,149 695 0.02NB Private Equity Partners 30,791 299 0.01NextEnergy Solar Fund 288,559 310 0.01Pershing Square 151,825 1,546 0.05Renewables Infrastructure 595,099 620 0.02Riverstone Energy 36,450 468 0.01Ruffer Investment 123,400 285 0.01Schroder Oriental Income Fund 156,117 393 0.01Sequoia Economic Infrastructure Income Fund 467,740 506 0.02SQN Asset Finance Income Fund 230,111 212 0.01Starwood European Real Estate Finance 165,033 178 0.00Syncona 195,740 381 0.01TwentyFour Income Fund 197,446 236 0.01TwentyFour Select Monthly Income Fund 99,798 99 0.00VinaCapital Vietnam Opportunity Fund 136,859 437 0.01
12,906 0.41
343,461 486 0.02327,451 272 0.01340,391 289 0.01268,291 126 0.00151,145 137 0.00
Real Estate Investment & ServicesF&C Commercial Property TrustMedicX FundPicton Property IncomeRaven RussiaStandard Life Investment Property Income Trust◊ UK Commercial Property Trust 449,048 397 0.01
1,707 0.05
Real Estate Investment TrustsF&C UK Real Estate Investment 211,740 221 0.01Regional 148,595 155 0.00Schroder Real Estate Investment Trust 350,127 210 0.01Sirius Real Estate 534,099 335 0.01
921 0.03
TOTAL FINANCIALS 15,534 0.49
INDUSTRIALS (0.02%, 31/05/2017 0.02%) Industrial TransportationStobart 197,884 558 0.02
558 0.02
TOTAL INDUSTRIALS 558 0.02
TOTAL GUERNSEY 16,092 0.51
30
HBOS Specialised Investment Funds ICVCInterim Report and Financial Statementsfor the six month period ended 30th November 2017 (unaudited)
HoldingMarket Value
£'000% of
Net Assets
Cautious Managed FundPortfolio statement (continued)as at 30th November 2017
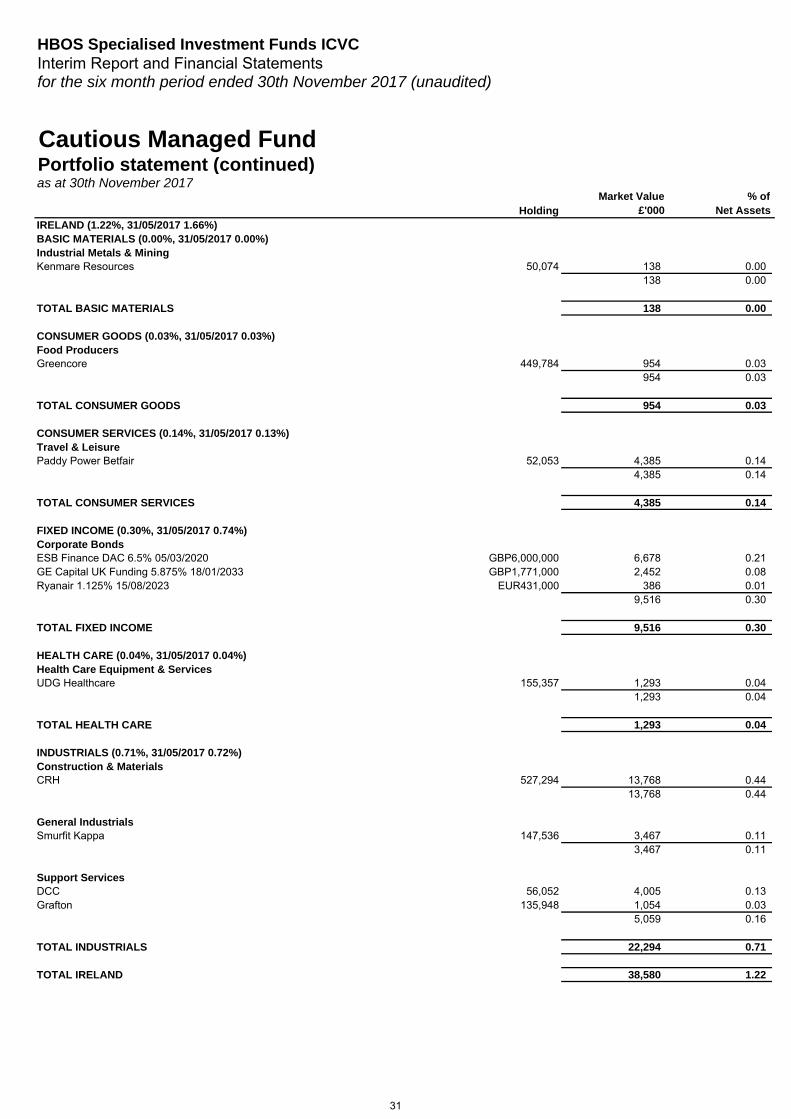
IRELAND (1.22%, 31/05/2017 1.66%) BASIC MATERIALS (0.00%, 31/05/2017 0.00%) Industrial Metals & Mining Kenmare Resources 50,074 138 0.00
138 0.00
TOTAL BASIC MATERIALS 138 0.00
CONSUMER GOODS (0.03%, 31/05/2017 0.03%) Food ProducersGreencore 449,784 954 0.03
954 0.03
TOTAL CONSUMER GOODS 954 0.03
CONSUMER SERVICES (0.14%, 31/05/2017 0.13%) Travel & LeisurePaddy Power Betfair 52,053 4,385 0.14
4,385 0.14
TOTAL CONSUMER SERVICES 4,385 0.14
FIXED INCOME (0.30%, 31/05/2017 0.74%) Corporate BondsESB Finance DAC 6.5% 05/03/2020 GBP6,000,000 6,678 0.21GE Capital UK Funding 5.875% 18/01/2033 GBP1,771,000 2,452 0.08Ryanair 1.125% 15/08/2023 EUR431,000 386 0.01
9,516 0.30
TOTAL FIXED INCOME 9,516 0.30
HEALTH CARE (0.04%, 31/05/2017 0.04%) Health Care Equipment & ServicesUDG Healthcare 155,357 1,293 0.04
1,293 0.04
TOTAL HEALTH CARE 1,293 0.04
INDUSTRIALS (0.71%, 31/05/2017 0.72%) Construction & MaterialsCRH 527,294 13,768 0.44
13,768 0.44
General IndustrialsSmurfit Kappa 147,536 3,467 0.11
3,467 0.11
Support ServicesDCC 56,052 4,005 0.13Grafton 135,948 1,054 0.03
5,059 0.16
TOTAL INDUSTRIALS 22,294 0.71
TOTAL IRELAND 38,580 1.22
31
HBOS Specialised Investment Funds ICVCInterim Report and Financial Statementsfor the six month period ended 30th November 2017 (unaudited)
HoldingMarket Value
£'000% of
Net Assets
Cautious Managed FundPortfolio statement (continued)as at 30th November 2017
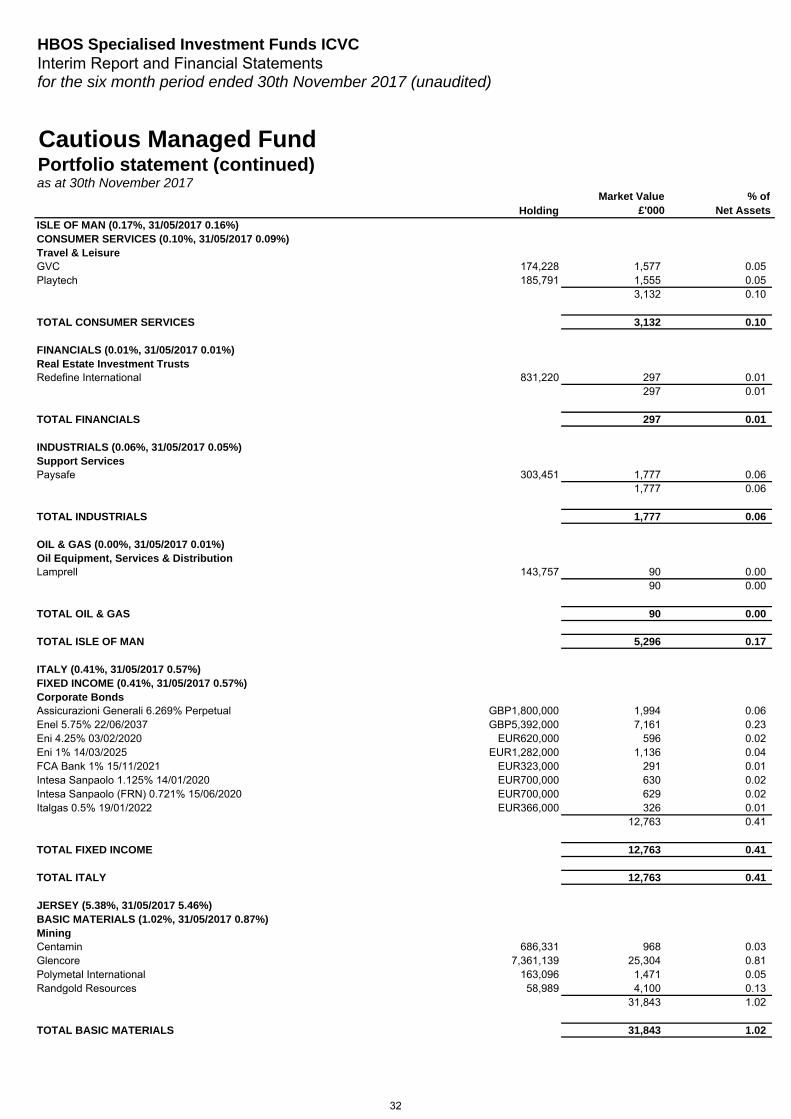
ISLE OF MAN (0.17%, 31/05/2017 0.16%) CONSUMER SERVICES (0.10%, 31/05/2017 0.09%) Travel & LeisureGVC 174,228 1,577 0.05Playtech 185,791 1,555 0.05
3,132 0.10
TOTAL CONSUMER SERVICES 3,132 0.10
FINANCIALS (0.01%, 31/05/2017 0.01%) Real Estate Investment TrustsRedefine International 831,220 297 0.01
297 0.01
TOTAL FINANCIALS 297 0.01
INDUSTRIALS (0.06%, 31/05/2017 0.05%) Support ServicesPaysafe 303,451 1,777 0.06
1,777 0.06
TOTAL INDUSTRIALS 1,777 0.06
OIL & GAS (0.00%, 31/05/2017 0.01%) Oil Equipment, Services & DistributionLamprell 143,757 90 0.00
90 0.00
TOTAL OIL & GAS 90 0.00
TOTAL ISLE OF MAN 5,296 0.17
ITALY (0.41%, 31/05/2017 0.57%) FIXED INCOME (0.41%, 31/05/2017 0.57%) Corporate BondsAssicurazioni Generali 6.269% Perpetual GBP1,800,000 1,994 0.06Enel 5.75% 22/06/2037 GBP5,392,000 7,161 0.23Eni 4.25% 03/02/2020 EUR620,000 596 0.02Eni 1% 14/03/2025 EUR1,282,000 1,136 0.04FCA Bank 1% 15/11/2021 EUR323,000 291 0.01Intesa Sanpaolo 1.125% 14/01/2020 EUR700,000 630 0.02Intesa Sanpaolo (FRN) 0.721% 15/06/2020 EUR700,000 629 0.02Italgas 0.5% 19/01/2022 EUR366,000 326 0.01
12,763 0.41
TOTAL FIXED INCOME 12,763 0.41
TOTAL ITALY 12,763 0.41
JERSEY (5.38%, 31/05/2017 5.46%) BASIC MATERIALS (1.02%, 31/05/2017 0.87%) MiningCentamin 686,331 968 0.03Glencore 7,361,139 25,304 0.81Polymetal International 163,096 1,471 0.05Randgold Resources 58,989 4,100 0.13
31,843 1.02
TOTAL BASIC MATERIALS 31,843 1.02
32
HBOS Specialised Investment Funds ICVCInterim Report and Financial Statementsfor the six month period ended 30th November 2017 (unaudited)
HoldingMarket Value
£'000% of
Net Assets
Cautious Managed FundPortfolio statement (continued)as at 30th November 2017
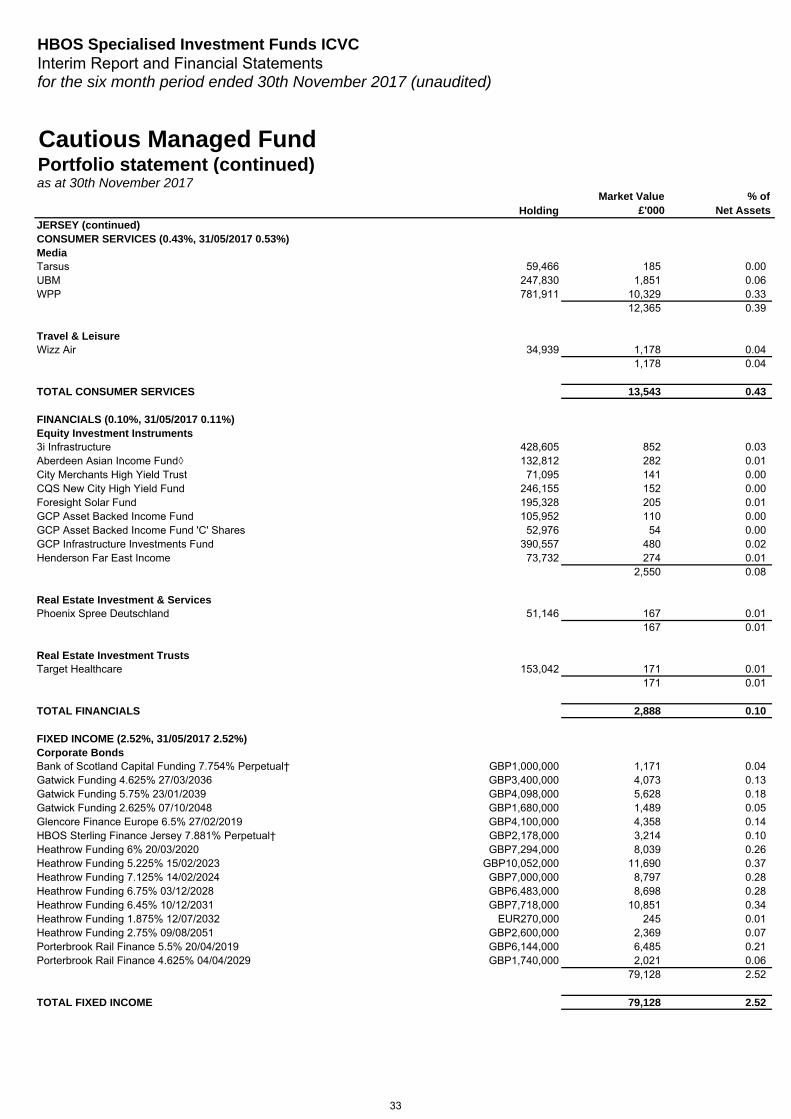
JERSEY (continued) CONSUMER SERVICES (0.43%, 31/05/2017 0.53%) MediaTarsus 59,466 185 0.00UBM 247,830 1,851 0.06WPP 781,911 10,329 0.33
12,365 0.39
Travel & LeisureWizz Air 34,939 1,178 0.04
1,178 0.04
TOTAL CONSUMER SERVICES 13,543 0.43
FINANCIALS (0.10%, 31/05/2017 0.11%) Equity Investment Instruments3i Infrastructure 428,605 852 0.03Aberdeen Asian Income Fund◊ 132,812 282 0.01City Merchants High Yield Trust 71,095 141 0.00CQS New City High Yield Fund 246,155 152 0.00Foresight Solar Fund 195,328 205 0.01GCP Asset Backed Income Fund 105,952 110 0.00GCP Asset Backed Income Fund 'C' Shares 52,976 54 0.00GCP Infrastructure Investments Fund 390,557 480 0.02Henderson Far East Income 73,732 274 0.01
2,550 0.08
Real Estate Investment & ServicesPhoenix Spree Deutschland 51,146 167 0.01
167 0.01
Real Estate Investment TrustsTarget Healthcare 153,042 171 0.01
171 0.01
TOTAL FINANCIALS 2,888 0.10
FIXED INCOME (2.52%, 31/05/2017 2.52%) Corporate BondsBank of Scotland Capital Funding 7.754% Perpetual† GBP1,000,000 1,171 0.04Gatwick Funding 4.625% 27/03/2036 GBP3,400,000 4,073 0.13Gatwick Funding 5.75% 23/01/2039 GBP4,098,000 5,628 0.18Gatwick Funding 2.625% 07/10/2048 GBP1,680,000 1,489 0.05Glencore Finance Europe 6.5% 27/02/2019 GBP4,100,000 4,358 0.14HBOS Sterling Finance Jersey 7.881% Perpetual† GBP2,178,000 3,214 0.10Heathrow Funding 6% 20/03/2020 GBP7,294,000 8,039 0.26Heathrow Funding 5.225% 15/02/2023 GBP10,052,000 11,690 0.37Heathrow Funding 7.125% 14/02/2024 GBP7,000,000 8,797 0.28Heathrow Funding 6.75% 03/12/2028 GBP6,483,000 8,698 0.28Heathrow Funding 6.45% 10/12/2031 GBP7,718,000 10,851 0.34Heathrow Funding 1.875% 12/07/2032 EUR270,000 245 0.01Heathrow Funding 2.75% 09/08/2051 GBP2,600,000 2,369 0.07Porterbrook Rail Finance 5.5% 20/04/2019 GBP6,144,000 6,485 0.21Porterbrook Rail Finance 4.625% 04/04/2029 GBP1,740,000 2,021 0.06
79,128 2.52
TOTAL FIXED INCOME 79,128 2.52
33
HBOS Specialised Investment Funds ICVCInterim Report and Financial Statementsfor the six month period ended 30th November 2017 (unaudited)
HoldingMarket Value
£'000% of
Net Assets
Cautious Managed FundPortfolio statement (continued)as at 30th November 2017
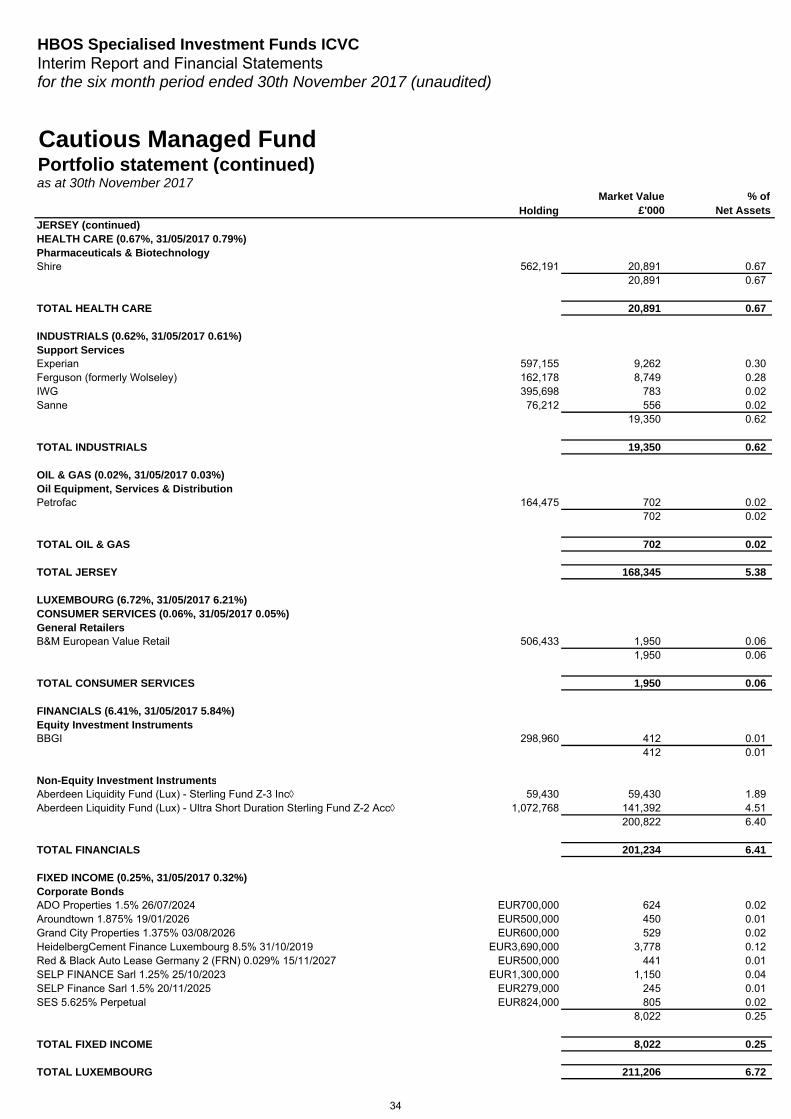
JERSEY (continued) HEALTH CARE (0.67%, 31/05/2017 0.79%) Pharmaceuticals & Biotechnology Shire 562,191 20,891 0.67
20,891 0.67
TOTAL HEALTH CARE 20,891 0.67
INDUSTRIALS (0.62%, 31/05/2017 0.61%) Support ServicesExperian 597,155 9,262 0.30Ferguson (formerly Wolseley) 162,178 8,749 0.28IWG 395,698 783 0.02Sanne 76,212 556 0.02
19,350 0.62
TOTAL INDUSTRIALS 19,350 0.62
OIL & GAS (0.02%, 31/05/2017 0.03%) Oil Equipment, Services & Distribution Petrofac 164,475 702 0.02
702 0.02
TOTAL OIL & GAS 702 0.02
TOTAL JERSEY 168,345 5.38
LUXEMBOURG (6.72%, 31/05/2017 6.21%) CONSUMER SERVICES (0.06%, 31/05/2017 0.05%) General RetailersB&M European Value Retail 506,433 1,950 0.06
1,950 0.06
TOTAL CONSUMER SERVICES 1,950 0.06
FINANCIALS (6.41%, 31/05/2017 5.84%) Equity Investment InstrumentsBBGI 298,960 412 0.01
412 0.01
Non-Equity Investment InstrumentsAberdeen Liquidity Fund (Lux) - Sterling Fund Z-3 Inc◊ 59,430 59,430 1.89Aberdeen Liquidity Fund (Lux) - Ultra Short Duration Sterling Fund Z-2 Acc◊ 1,072,768 141,392 4.51
200,822 6.40
TOTAL FINANCIALS 201,234 6.41
FIXED INCOME (0.25%, 31/05/2017 0.32%) Corporate BondsADO Properties 1.5% 26/07/2024 EUR700,000 624 0.02Aroundtown 1.875% 19/01/2026 EUR500,000 450 0.01Grand City Properties 1.375% 03/08/2026 EUR600,000 529 0.02HeidelbergCement Finance Luxembourg 8.5% 31/10/2019 EUR3,690,000 3,778 0.12Red & Black Auto Lease Germany 2 (FRN) 0.029% 15/11/2027 EUR500,000 441 0.01SELP FINANCE Sarl 1.25% 25/10/2023 EUR1,300,000 1,150 0.04SELP Finance Sarl 1.5% 20/11/2025 EUR279,000 245 0.01SES 5.625% Perpetual EUR824,000 805 0.02
8,022 0.25
TOTAL FIXED INCOME 8,022 0.25
TOTAL LUXEMBOURG 211,206 6.72
34
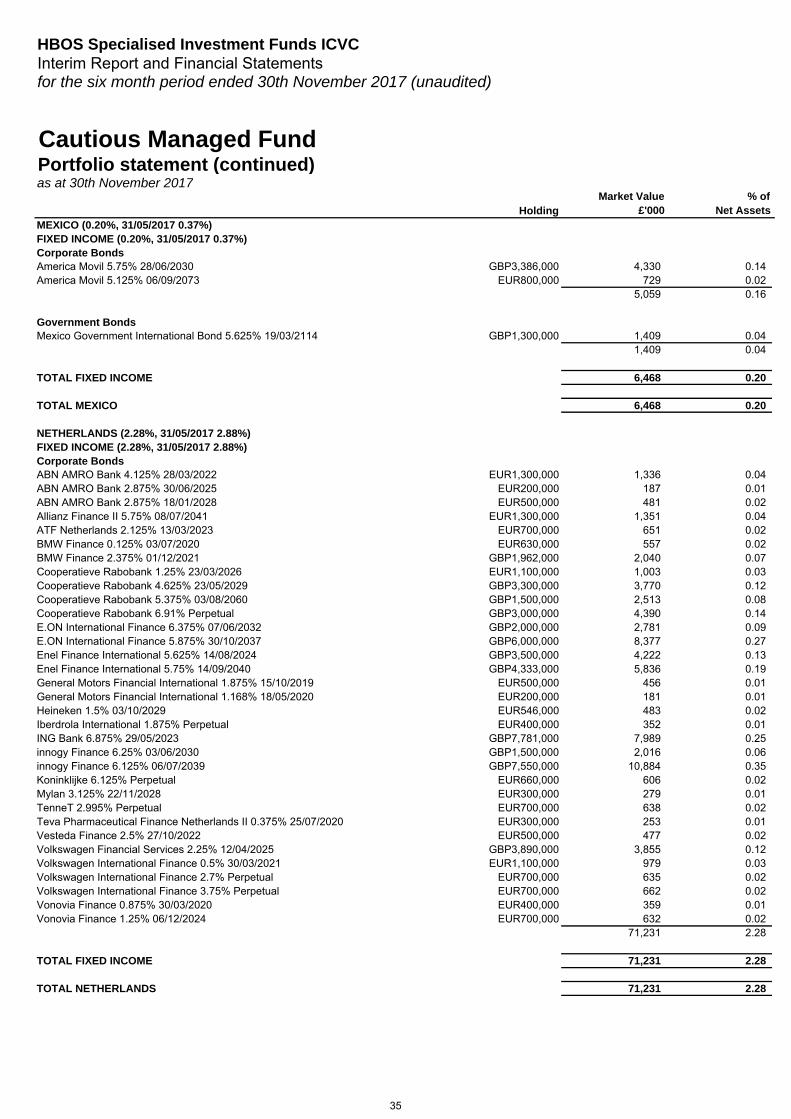
HBOS Specialised Investment Funds ICVCInterim Report and Financial Statementsfor the six month period ended 30th November 2017 (unaudited)
HoldingMarket Value
£'000% of
Net Assets
Cautious Managed FundPortfolio statement (continued)as at 30th November 2017
MEXICO (0.20%, 31/05/2017 0.37%) FIXED INCOME (0.20%, 31/05/2017 0.37%) Corporate BondsAmerica Movil 5.75% 28/06/2030 GBP3,386,000 4,330 0.14America Movil 5.125% 06/09/2073 EUR800,000 729 0.02
5,059 0.16
Government BondsMexico Government International Bond 5.625% 19/03/2114 GBP1,300,000 1,409 0.04
1,409 0.04
TOTAL FIXED INCOME 6,468 0.20
TOTAL MEXICO 6,468 0.20
NETHERLANDS (2.28%, 31/05/2017 2.88%) FIXED INCOME (2.28%, 31/05/2017 2.88%) Corporate BondsABN AMRO Bank 4.125% 28/03/2022 EUR1,300,000 1,336 0.04ABN AMRO Bank 2.875% 30/06/2025 EUR200,000 187 0.01ABN AMRO Bank 2.875% 18/01/2028 EUR500,000 481 0.02Allianz Finance II 5.75% 08/07/2041 EUR1,300,000 1,351 0.04ATF Netherlands 2.125% 13/03/2023 EUR700,000 651 0.02BMW Finance 0.125% 03/07/2020 EUR630,000 557 0.02BMW Finance 2.375% 01/12/2021 GBP1,962,000 2,040 0.07Cooperatieve Rabobank 1.25% 23/03/2026 EUR1,100,000 1,003 0.03Cooperatieve Rabobank 4.625% 23/05/2029 GBP3,300,000 3,770 0.12Cooperatieve Rabobank 5.375% 03/08/2060 GBP1,500,000 2,513 0.08Cooperatieve Rabobank 6.91% Perpetual GBP3,000,000 4,390 0.14E.ON International Finance 6.375% 07/06/2032 GBP2,000,000 2,781 0.09E.ON International Finance 5.875% 30/10/2037 GBP6,000,000 8,377 0.27Enel Finance International 5.625% 14/08/2024 GBP3,500,000 4,222 0.13Enel Finance International 5.75% 14/09/2040 GBP4,333,000 5,836 0.19General Motors Financial International 1.875% 15/10/2019 EUR500,000 456 0.01General Motors Financial International 1.168% 18/05/2020 EUR200,000 181 0.01Heineken 1.5% 03/10/2029 EUR546,000 483 0.02Iberdrola International 1.875% Perpetual EUR400,000 352 0.01ING Bank 6.875% 29/05/2023 GBP7,781,000 7,989 0.25innogy Finance 6.25% 03/06/2030 GBP1,500,000 2,016 0.06innogy Finance 6.125% 06/07/2039 GBP7,550,000 10,884 0.35Koninklijke 6.125% Perpetual EUR660,000 606 0.02Mylan 3.125% 22/11/2028 EUR300,000 279 0.01TenneT 2.995% Perpetual EUR700,000 638 0.02Teva Pharmaceutical Finance Netherlands II 0.375% 25/07/2020 EUR300,000 253 0.01Vesteda Finance 2.5% 27/10/2022 EUR500,000 477 0.02Volkswagen Financial Services 2.25% 12/04/2025 GBP3,890,000 3,855 0.12Volkswagen International Finance 0.5% 30/03/2021 EUR1,100,000 979 0.03Volkswagen International Finance 2.7% Perpetual EUR700,000 635 0.02Volkswagen International Finance 3.75% Perpetual EUR700,000 662 0.02Vonovia Finance 0.875% 30/03/2020 EUR400,000 359 0.01Vonovia Finance 1.25% 06/12/2024 EUR700,000 632 0.02
71,231 2.28
TOTAL FIXED INCOME 71,231 2.28
TOTAL NETHERLANDS 71,231 2.28
35
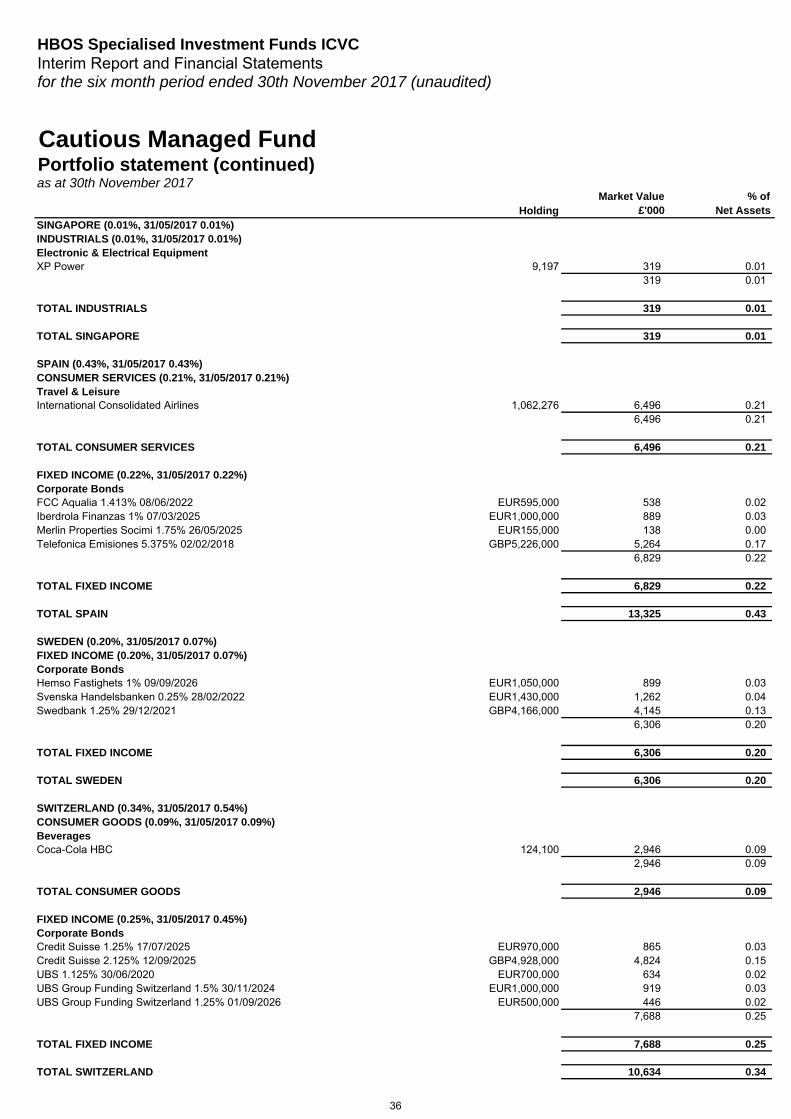
HBOS Specialised Investment Funds ICVCInterim Report and Financial Statementsfor the six month period ended 30th November 2017 (unaudited)
HoldingMarket Value
£'000% of
Net Assets
Cautious Managed FundPortfolio statement (continued)as at 30th November 2017
SINGAPORE (0.01%, 31/05/2017 0.01%) INDUSTRIALS (0.01%, 31/05/2017 0.01%) Electronic & Electrical Equipment XP Power 9,197 319 0.01
319 0.01
TOTAL INDUSTRIALS 319 0.01
TOTAL SINGAPORE 319 0.01
SPAIN (0.43%, 31/05/2017 0.43%) CONSUMER SERVICES (0.21%, 31/05/2017 0.21%) Travel & LeisureInternational Consolidated Airlines 1,062,276 6,496 0.21
6,496 0.21
TOTAL CONSUMER SERVICES 6,496 0.21
FIXED INCOME (0.22%, 31/05/2017 0.22%) Corporate BondsFCC Aqualia 1.413% 08/06/2022 EUR595,000 538 0.02Iberdrola Finanzas 1% 07/03/2025 EUR1,000,000 889 0.03Merlin Properties Socimi 1.75% 26/05/2025 EUR155,000 138 0.00Telefonica Emisiones 5.375% 02/02/2018 GBP5,226,000 5,264 0.17
6,829 0.22
TOTAL FIXED INCOME 6,829 0.22
TOTAL SPAIN 13,325 0.43
SWEDEN (0.20%, 31/05/2017 0.07%) FIXED INCOME (0.20%, 31/05/2017 0.07%) Corporate BondsHemso Fastighets 1% 09/09/2026 EUR1,050,000 899 0.03Svenska Handelsbanken 0.25% 28/02/2022 EUR1,430,000 1,262 0.04Swedbank 1.25% 29/12/2021 GBP4,166,000 4,145 0.13
6,306 0.20
TOTAL FIXED INCOME 6,306 0.20
TOTAL SWEDEN 6,306 0.20
SWITZERLAND (0.34%, 31/05/2017 0.54%) CONSUMER GOODS (0.09%, 31/05/2017 0.09%) BeveragesCoca-Cola HBC 124,100 2,946 0.09
2,946 0.09
TOTAL CONSUMER GOODS 2,946 0.09
FIXED INCOME (0.25%, 31/05/2017 0.45%) Corporate BondsCredit Suisse 1.25% 17/07/2025 EUR970,000 865 0.03Credit Suisse 2.125% 12/09/2025 GBP4,928,000 4,824 0.15UBS 1.125% 30/06/2020 EUR700,000 634 0.02UBS Group Funding Switzerland 1.5% 30/11/2024 EUR1,000,000 919 0.03UBS Group Funding Switzerland 1.25% 01/09/2026 EUR500,000 446 0.02
7,688 0.25
TOTAL FIXED INCOME 7,688 0.25
TOTAL SWITZERLAND 10,634 0.34
36
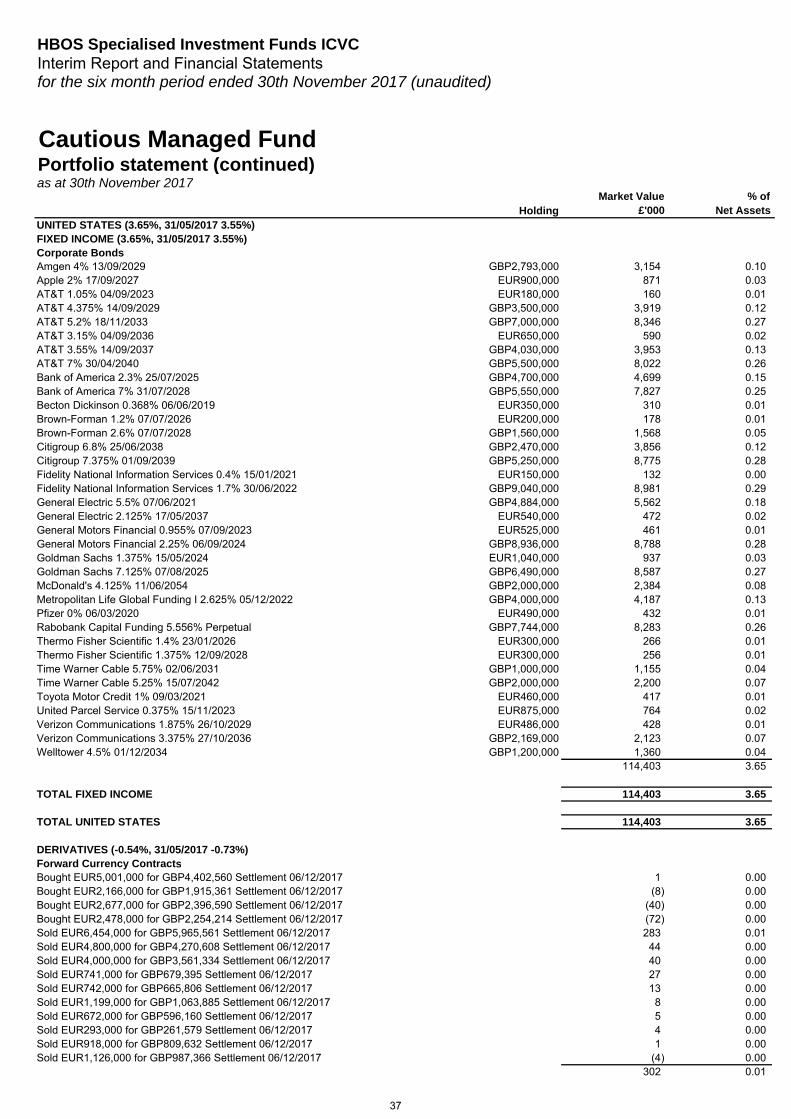
HBOS Specialised Investment Funds ICVCInterim Report and Financial Statementsfor the six month period ended 30th November 2017 (unaudited)
HoldingMarket Value
£'000% of
Net Assets
Cautious Managed FundPortfolio statement (continued)as at 30th November 2017
UNITED STATES (3.65%, 31/05/2017 3.55%) FIXED INCOME (3.65%, 31/05/2017 3.55%) Corporate Bonds Amgen 4% 13/09/2029 GBP2,793,000 3,154 0.10Apple 2% 17/09/2027 EUR900,000 871 0.03AT&T 1.05% 04/09/2023 EUR180,000 160 0.01AT&T 4.375% 14/09/2029 GBP3,500,000 3,919 0.12AT&T 5.2% 18/11/2033 GBP7,000,000 8,346 0.27AT&T 3.15% 04/09/2036 EUR650,000 590 0.02AT&T 3.55% 14/09/2037 GBP4,030,000 3,953 0.13AT&T 7% 30/04/2040 GBP5,500,000 8,022 0.26Bank of America 2.3% 25/07/2025 GBP4,700,000 4,699 0.15Bank of America 7% 31/07/2028 GBP5,550,000 7,827 0.25Becton Dickinson 0.368% 06/06/2019 EUR350,000 310 0.01Brown-Forman 1.2% 07/07/2026 EUR200,000 178 0.01Brown-Forman 2.6% 07/07/2028 GBP1,560,000 1,568 0.05Citigroup 6.8% 25/06/2038 GBP2,470,000 3,856 0.12Citigroup 7.375% 01/09/2039 GBP5,250,000 8,775 0.28Fidelity National Information Services 0.4% 15/01/2021 EUR150,000 132 0.00Fidelity National Information Services 1.7% 30/06/2022 GBP9,040,000 8,981 0.29General Electric 5.5% 07/06/2021 GBP4,884,000 5,562 0.18General Electric 2.125% 17/05/2037 EUR540,000 472 0.02General Motors Financial 0.955% 07/09/2023 EUR525,000 461 0.01General Motors Financial 2.25% 06/09/2024 GBP8,936,000 8,788 0.28Goldman Sachs 1.375% 15/05/2024 EUR1,040,000 937 0.03Goldman Sachs 7.125% 07/08/2025 GBP6,490,000 8,587 0.27McDonald's 4.125% 11/06/2054 GBP2,000,000 2,384 0.08Metropolitan Life Global Funding I 2.625% 05/12/2022 GBP4,000,000 4,187 0.13Pfizer 0% 06/03/2020 EUR490,000 432 0.01Rabobank Capital Funding 5.556% Perpetual GBP7,744,000 8,283 0.26Thermo Fisher Scientific 1.4% 23/01/2026 EUR300,000 266 0.01Thermo Fisher Scientific 1.375% 12/09/2028 EUR300,000 256 0.01Time Warner Cable 5.75% 02/06/2031 GBP1,000,000 1,155 0.04Time Warner Cable 5.25% 15/07/2042 GBP2,000,000 2,200 0.07Toyota Motor Credit 1% 09/03/2021 EUR460,000 417 0.01United Parcel Service 0.375% 15/11/2023 EUR875,000 764 0.02Verizon Communications 1.875% 26/10/2029 EUR486,000 428 0.01Verizon Communications 3.375% 27/10/2036 GBP2,169,000 2,123 0.07Welltower 4.5% 01/12/2034 GBP1,200,000 1,360 0.04
114,403 3.65
TOTAL FIXED INCOME 114,403 3.65
TOTAL UNITED STATES 114,403 3.65
DERIVATIVES (-0.54%, 31/05/2017 -0.73%) Forward Currency ContractsBought EUR5,001,000 for GBP4,402,560 Settlement 06/12/2017 1 0.00Bought EUR2,166,000 for GBP1,915,361 Settlement 06/12/2017 (8) 0.00Bought EUR2,677,000 for GBP2,396,590 Settlement 06/12/2017 (40) 0.00Bought EUR2,478,000 for GBP2,254,214 Settlement 06/12/2017 (72) 0.00Sold EUR6,454,000 for GBP5,965,561 Settlement 06/12/2017 283 0.01Sold EUR4,800,000 for GBP4,270,608 Settlement 06/12/2017 44 0.00Sold EUR4,000,000 for GBP3,561,334 Settlement 06/12/2017 40 0.00Sold EUR741,000 for GBP679,395 Settlement 06/12/2017 27 0.00Sold EUR742,000 for GBP665,806 Settlement 06/12/2017 13 0.00Sold EUR1,199,000 for GBP1,063,885 Settlement 06/12/2017 8 0.00Sold EUR672,000 for GBP596,160 Settlement 06/12/2017 5 0.00Sold EUR293,000 for GBP261,579 Settlement 06/12/2017 4 0.00Sold EUR918,000 for GBP809,632 Settlement 06/12/2017 1 0.00Sold EUR1,126,000 for GBP987,366 Settlement 06/12/2017 (4) 0.00
302 0.01
37
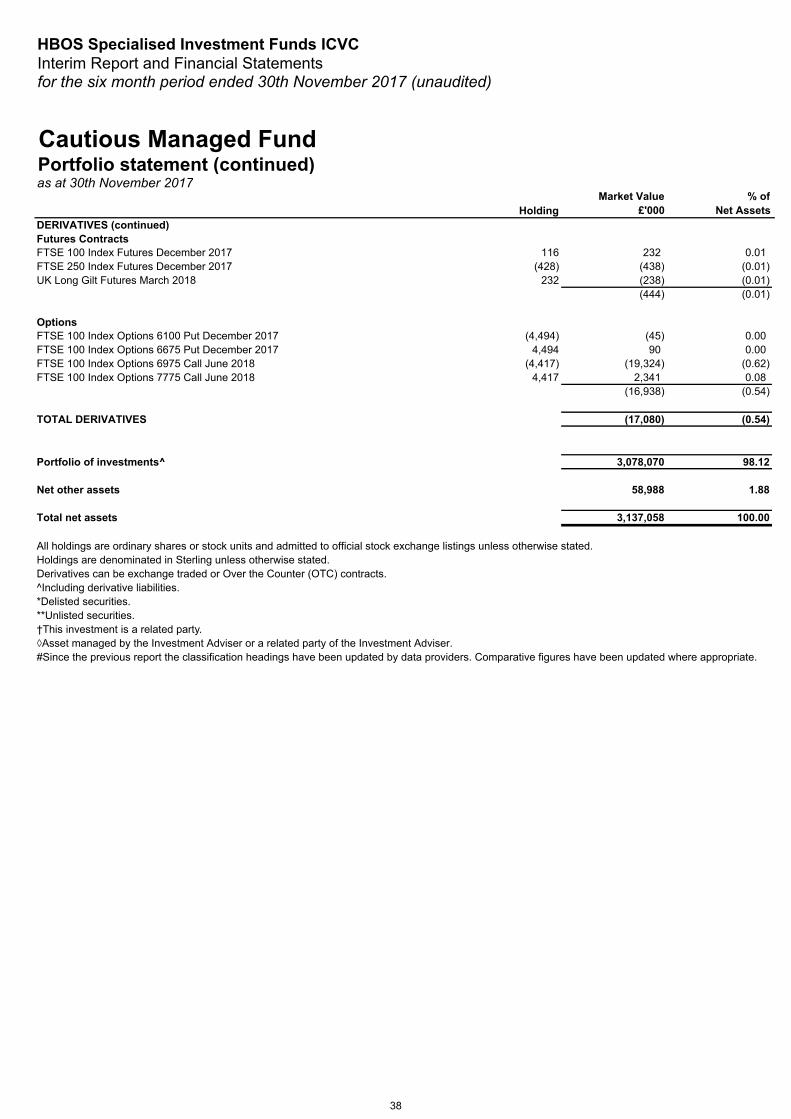
HBOS Specialised Investment Funds ICVCInterim Report and Financial Statementsfor the six month period ended 30th November 2017 (unaudited)
HoldingMarket Value
£'000% of
Net Assets
Cautious Managed FundPortfolio statement (continued)as at 30th November 2017
DERIVATIVES (continued) Futures ContractsFTSE 100 Index Futures December 2017 116 232 0.01FTSE 250 Index Futures December 2017 (428) (438) (0.01)UK Long Gilt Futures March 2018 232 (238) (0.01)
(444) (0.01)
OptionsFTSE 100 Index Options 6100 Put December 2017 (4,494) (45) 0.00FTSE 100 Index Options 6675 Put December 2017 4,494 90 0.00FTSE 100 Index Options 6975 Call June 2018 (4,417) (19,324) (0.62)FTSE 100 Index Options 7775 Call June 2018 4,417 2,341 0.08
(16,938) (0.54)
TOTAL DERIVATIVES (17,080) (0.54)
Portfolio of investments^ 3,078,070 98.12
Net other assets 58,988 1.88
Total net assets 3,137,058 100.00
All holdings are ordinary shares or stock units and admitted to official stock exchange listings unless otherwise stated.Holdings are denominated in Sterling unless otherwise stated.Derivatives can be exchange traded or Over the Counter (OTC) contracts.^Including derivative liabilities.
#Since the previous report the classification headings have been updated by data providers. Comparative figures have been updated where appropriate.
**Unlisted securities. *Delisted securities.
◊Asset managed by the Investment Adviser or a related party of the Investment Adviser.†This investment is a related party.
38
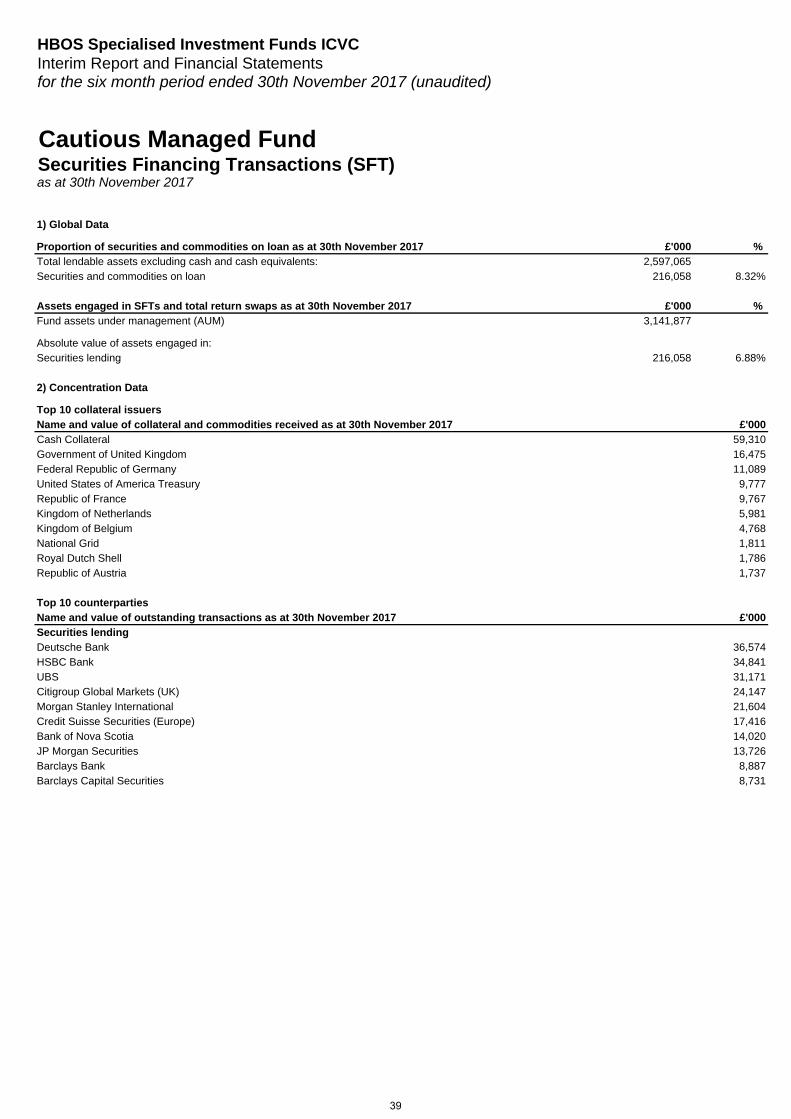
HBOS Specialised Investment Funds ICVCInterim Report and Financial Statementsfor the six month period ended 30th November 2017 (unaudited)
1) Global Data
Proportion of securities and commodities on loan as at 30th November 2017 £'000 % Total lendable assets excluding cash and cash equivalents: 2,597,065Securities and commodities on loan 216,058 8.32%
Assets engaged in SFTs and total return swaps as at 30th November 2017 £'000 % Fund assets under management (AUM) 3,141,877
Absolute value of assets engaged in:Securities lending 216,058 6.88%
2) Concentration Data
Top 10 collateral issuersName and value of collateral and commodities received as at 30th November 2017 £'000Cash Collateral 59,310Government of United Kingdom 16,475Federal Republic of Germany 11,089United States of America Treasury 9,777Republic of France 9,767Kingdom of Netherlands 5,981Kingdom of Belgium 4,768National Grid 1,811Royal Dutch Shell 1,786Republic of Austria 1,737
Top 10 counterpartiesName and value of outstanding transactions as at 30th November 2017 £'000Securities lendingDeutsche Bank 36,574HSBC Bank 34,841UBS 31,171Citigroup Global Markets (UK) 24,147Morgan Stanley International 21,604Credit Suisse Securities (Europe) 17,416Bank of Nova Scotia 14,020JP Morgan Securities 13,726Barclays Bank 8,887Barclays Capital Securities 8,731
Cautious Managed FundSecurities Financing Transactions (SFT) as at 30th November 2017
39
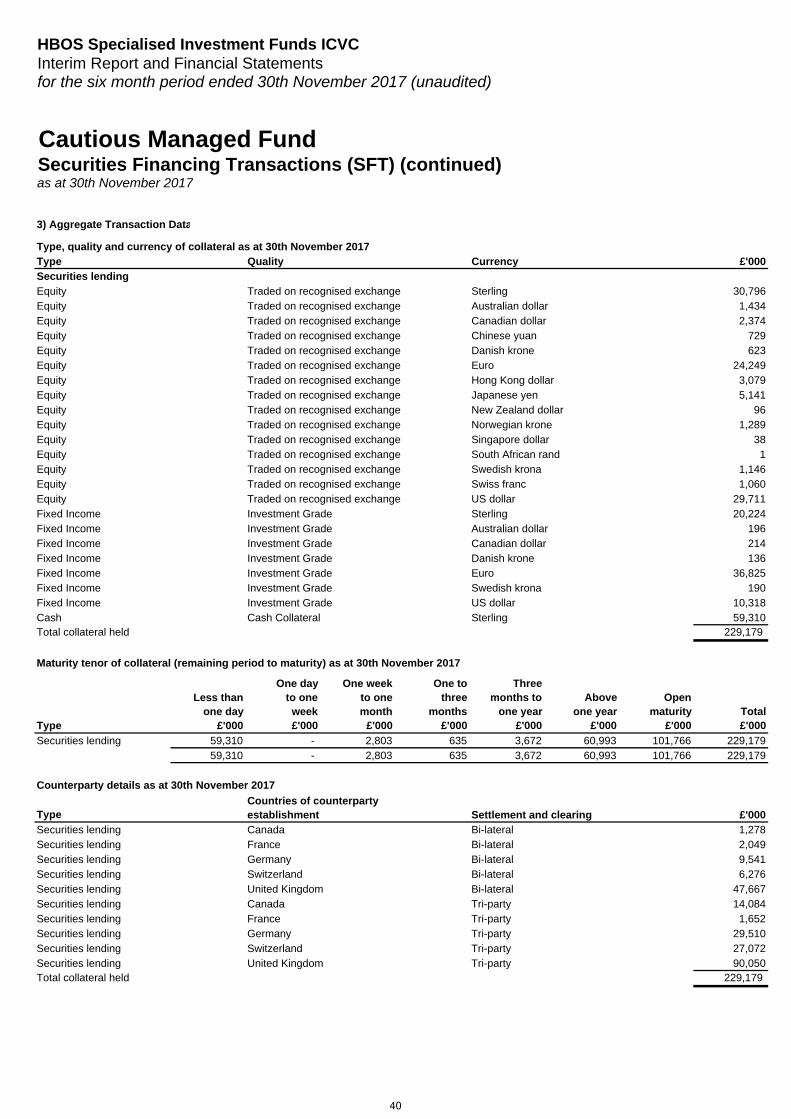
HBOS Specialised Investment Funds ICVCInterim Report and Financial Statementsfor the six month period ended 30th November 2017 (unaudited)
Securities Financing Transactions (SFT) (continued)Cautious Managed Fund
as at 30th November 2017
3) Aggregate Transaction Data
Type, quality and currency of collateral as at 30th November 2017Type Quality Currency £'000Securities lendingEquity Traded on recognised exchange Sterling 30,796Equity Traded on recognised exchange Australian dollar 1,434Equity Traded on recognised exchange Canadian dollar 2,374Equity Traded on recognised exchange Chinese yuan 729Equity Traded on recognised exchange Danish krone 623Equity Traded on recognised exchange Euro 24,249Equity Traded on recognised exchange Hong Kong dollar 3,079Equity Traded on recognised exchange Japanese yen 5,141Equity Traded on recognised exchange New Zealand dollar 96Equity Traded on recognised exchange Norwegian krone 1,289Equity Traded on recognised exchange Singapore dollar 38Equity Traded on recognised exchange South African rand 1Equity Traded on recognised exchange Swedish krona 1,146Equity Traded on recognised exchange Swiss franc 1,060Equity Traded on recognised exchange US dollar 29,711Fixed Income Investment Grade Sterling 20,224Fixed Income Investment Grade Australian dollar 196Fixed Income Investment Grade Canadian dollar 214Fixed Income Investment Grade Danish krone 136Fixed Income Investment Grade Euro 36,825Fixed Income Investment Grade Swedish krona 190Fixed Income Investment Grade US dollar 10,318Cash Cash Collateral Sterling 59,310Total collateral held 229,179
Maturity tenor of collateral (remaining period to maturity) as at 30th November 2017
Type
Less than one day
£'000
One day to one week£'000
One week to one month
£'000
One to three
months£'000
Three months to
one year£'000
Above one year
£'000
Open maturity
£'000Total£'000
Securities lending 59,310 - 2,803 635 3,672 60,993 101,766 229,17959,310 - 2,803 635 3,672 60,993 101,766 229,179
Counterparty details as at 30th November 2017
Type £'000Securities lending Canada Bi-lateral 1,278Securities lending France Bi-lateral 2,049Securities lending Germany Bi-lateral 9,541Securities lending Switzerland Bi-lateral 6,276Securities lending United Kingdom Bi-lateral 47,667Securities lending Canada Tri-party 14,084Securities lending France Tri-party 1,652Securities lending Germany Tri-party 29,510Securities lending Switzerland Tri-party 27,072Securities lending United Kingdom Tri-party 90,050Total collateral held 229,179
Settlement and clearingCountries of counterparty establishment
40
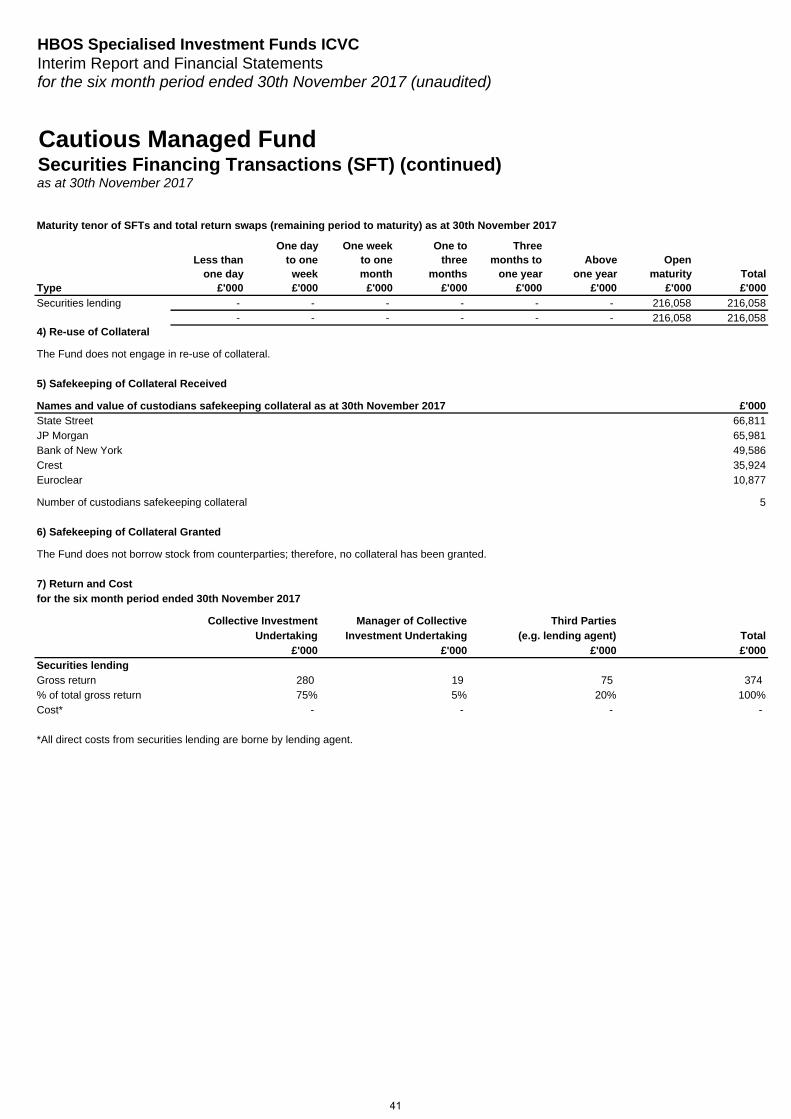
HBOS Specialised Investment Funds ICVCInterim Report and Financial Statementsfor the six month period ended 30th November 2017 (unaudited)
Securities Financing Transactions (SFT) (continued)Cautious Managed Fund
as at 30th November 2017
Maturity tenor of SFTs and total return swaps (remaining period to maturity) as at 30th November 2017
Type
Less than one day
£'000
One day to one week£'000
One week to one month
£'000
One to three
months£'000
Three months to
one year£'000
Above one year
£'000
Open maturity
£'000Total£'000
Securities lending - - - - - - 216,058 216,058- - - - - - 216,058 216,058
4) Re-use of Collateral
The Fund does not engage in re-use of collateral.
5) Safekeeping of Collateral Received
Names and value of custodians safekeeping collateral as at 30th November 2017 £'000State Street 66,811JP Morgan 65,981Bank of New York 49,586Crest 35,924Euroclear 10,877
Number of custodians safekeeping collateral 5
6) Safekeeping of Collateral Granted
The Fund does not borrow stock from counterparties; therefore, no collateral has been granted.
7) Return and Costfor the six month period ended 30th November 2017
Collective Investment Manager of Collective Third Parties Undertaking Investment Undertaking (e.g. lending agent) Total
£'000 £'000 £'000 £'000Securities lendingGross return 280 19 75 374% of total gross return 75% 5% 20% 100%Cost* - - - -
*All direct costs from securities lending are borne by lending agent.
41
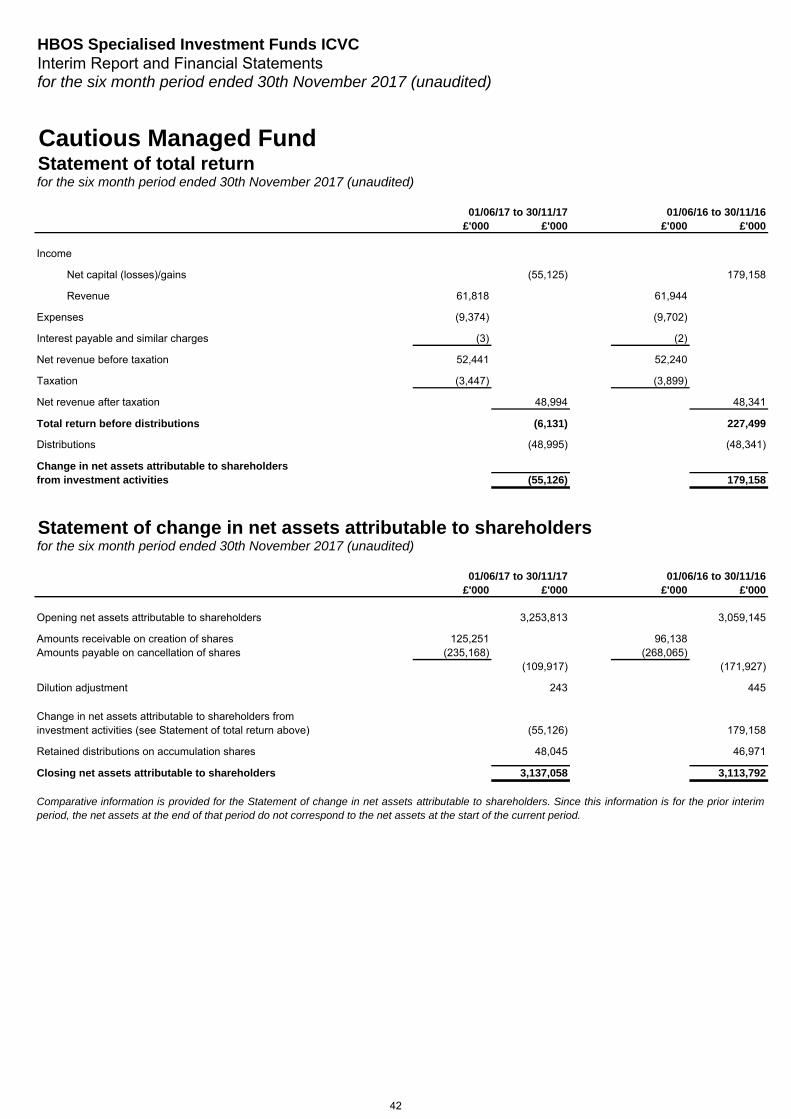
HBOS Specialised Investment Funds ICVCInterim Report and Financial Statementsfor the six month period ended 30th November 2017 (unaudited)
Cautious Managed FundStatement of total returnfor the six month period ended 30th November 2017 (unaudited)
01/06/17 to 30/11/17 01/06/16 to 30/11/16£'000 £'000 £'000 £'000
Income
Net capital (losses)/gains (55,125) 179,158
Revenue 61,818 61,944
Expenses (9,374) (9,702)
Interest payable and similar charges (3) (2)
Net revenue before taxation 52,441 52,240
Taxation (3,447) (3,899)
Net revenue after taxation 48,994 48,341
Total return before distributions (6,131) 227,499
Distributions (48,995) (48,341)
Change in net assets attributable to shareholdersfrom investment activities (55,126) 179,158
Statement of change in net assets attributable to shareholdersfor the six month period ended 30th November 2017 (unaudited)
01/06/17 to 30/11/17 01/06/16 to 30/11/16£'000 £'000 £'000 £'000
Opening net assets attributable to shareholders 3,253,813 3,059,145
Amounts receivable on creation of shares 125,251 96,138Amounts payable on cancellation of shares (235,168) (268,065)
(109,917) (171,927)
Dilution adjustment 243 445
Change in net assets attributable to shareholders frominvestment activities (see Statement of total return above) (55,126) 179,158
Retained distributions on accumulation shares 48,045 46,971
Closing net assets attributable to shareholders 3,137,058 3,113,792
Comparative information is provided for the Statement of change in net assets attributable to shareholders. Since this information is for the prior interimperiod, the net assets at the end of that period do not correspond to the net assets at the start of the current period.
42
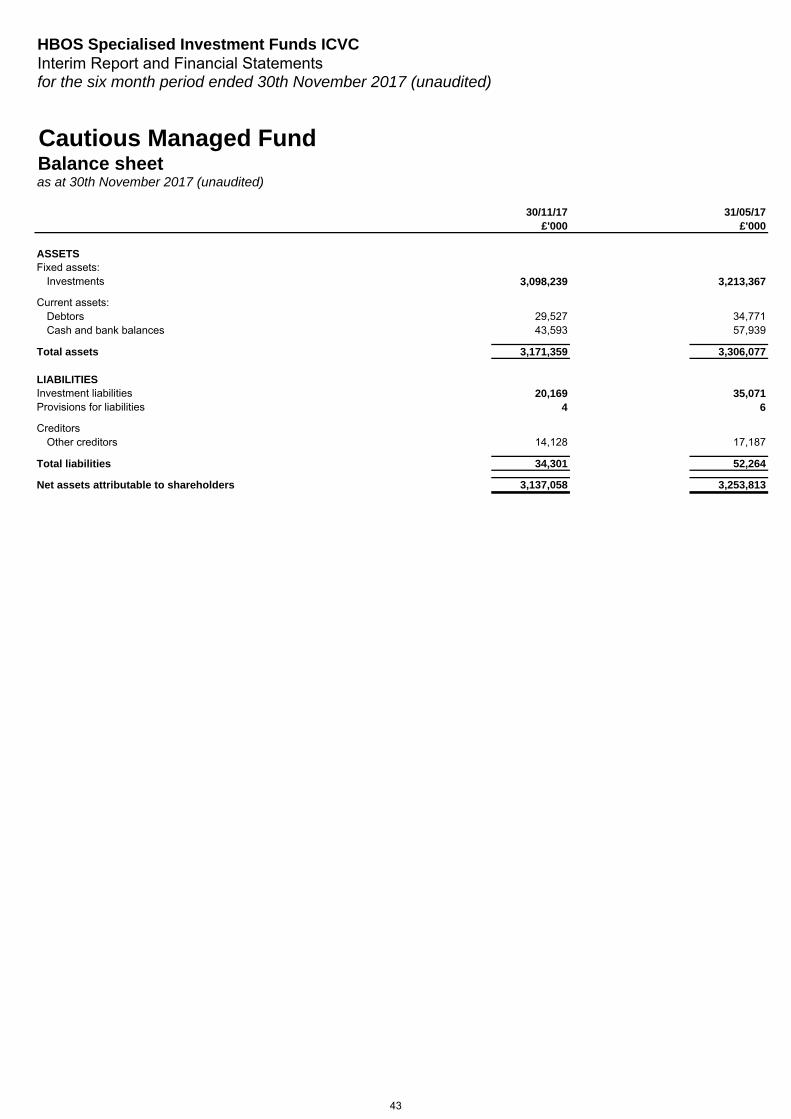
HBOS Specialised Investment Funds ICVCInterim Report and Financial Statementsfor the six month period ended 30th November 2017 (unaudited)
Cautious Managed FundBalance sheetas at 30th November 2017 (unaudited)
30/11/17 31/05/17£'000 £'000
ASSETSFixed assets:
Investments 3,098,239 3,213,367
Current assets:Debtors 29,527 34,771Cash and bank balances 43,593 57,939
Total assets 3,171,359 3,306,077
LIABILITIESInvestment liabilities 20,169 35,071Provisions for liabilities 4 6
CreditorsOther creditors 14,128 17,187
Total liabilities 34,301 52,264
Net assets attributable to shareholders 3,137,058 3,253,813
43
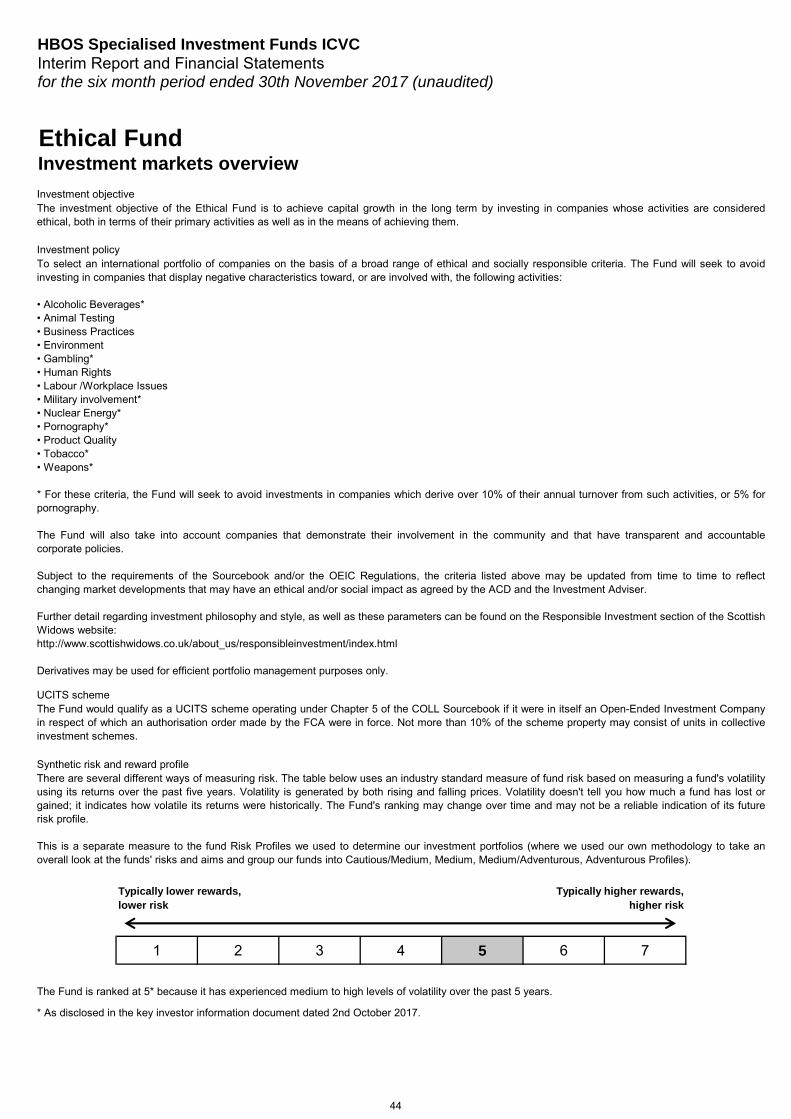
HBOS Specialised Investment Funds ICVCInterim Report and Financial Statementsfor the six month period ended 30th November 2017 (unaudited)
Ethical FundInvestment markets overview
Investment objective
Investment policy
UCITS scheme
Synthetic risk and reward profile
1 2 3 4 5 6 7
The Fund is ranked at 5* because it has experienced medium to high levels of volatility over the past 5 years.
* As disclosed in the key investor information document dated 2nd October 2017.
There are several different ways of measuring risk. The table below uses an industry standard measure of fund risk based on measuring a fund's volatilityusing its returns over the past five years. Volatility is generated by both rising and falling prices. Volatility doesn't tell you how much a fund has lost orgained; it indicates how volatile its returns were historically. The Fund's ranking may change over time and may not be a reliable indication of its futurerisk profile.
This is a separate measure to the fund Risk Profiles we used to determine our investment portfolios (where we used our own methodology to take anoverall look at the funds' risks and aims and group our funds into Cautious/Medium, Medium, Medium/Adventurous, Adventurous Profiles).
The investment objective of the Ethical Fund is to achieve capital growth in the long term by investing in companies whose activities are consideredethical, both in terms of their primary activities as well as in the means of achieving them.
To select an international portfolio of companies on the basis of a broad range of ethical and socially responsible criteria. The Fund will seek to avoidinvesting in companies that display negative characteristics toward, or are involved with, the following activities:
• Alcoholic Beverages*• Animal Testing• Business Practices• Environment• Gambling*• Human Rights• Labour /Workplace Issues• Military involvement*• Nuclear Energy*• Pornography*• Product Quality• Tobacco*• Weapons*
* For these criteria, the Fund will seek to avoid investments in companies which derive over 10% of their annual turnover from such activities, or 5% forpornography.
The Fund will also take into account companies that demonstrate their involvement in the community and that have transparent and accountablecorporate policies.
Subject to the requirements of the Sourcebook and/or the OEIC Regulations, the criteria listed above may be updated from time to time to reflectchanging market developments that may have an ethical and/or social impact as agreed by the ACD and the Investment Adviser.
Further detail regarding investment philosophy and style, as well as these parameters can be found on the Responsible Investment section of the ScottishWidows website:http://www.scottishwidows.co.uk/about_us/responsibleinvestment/index.html
Derivatives may be used for efficient portfolio management purposes only.
The Fund would qualify as a UCITS scheme operating under Chapter 5 of the COLL Sourcebook if it were in itself an Open-Ended Investment Companyin respect of which an authorisation order made by the FCA were in force. Not more than 10% of the scheme property may consist of units in collectiveinvestment schemes.
Typically lower rewards,lower risk
Typically higher rewards,higher risk
44
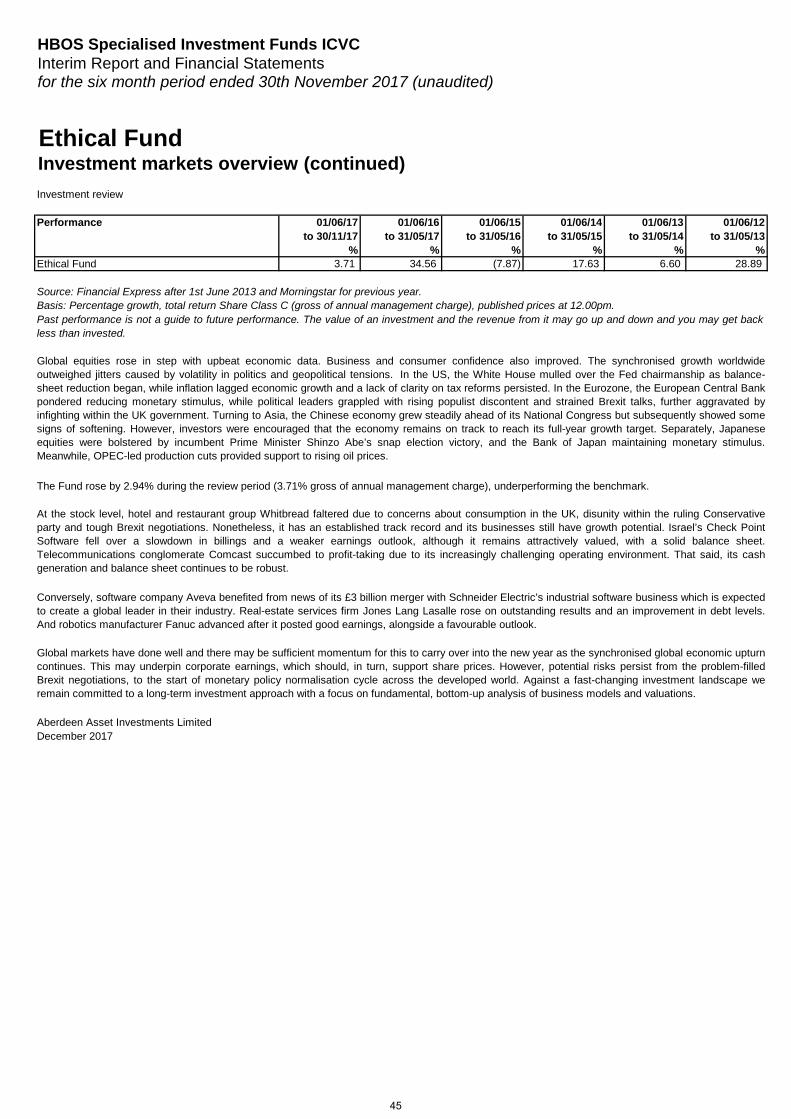
HBOS Specialised Investment Funds ICVCInterim Report and Financial Statementsfor the six month period ended 30th November 2017 (unaudited)
Ethical FundInvestment markets overview (continued)
Investment review
Performance 01/06/17 01/06/16 01/06/15 01/06/14 01/06/13 01/06/12to 30/11/17 to 31/05/17 to 31/05/16 to 31/05/15 to 31/05/14 to 31/05/13
% % % % % %3.71 34.56 (7.87) 17.63 6.60 28.89
Global markets have done well and there may be sufficient momentum for this to carry over into the new year as the synchronised global economic upturncontinues. This may underpin corporate earnings, which should, in turn, support share prices. However, potential risks persist from the problem-filledBrexit negotiations, to the start of monetary policy normalisation cycle across the developed world. Against a fast-changing investment landscape weremain committed to a long-term investment approach with a focus on fundamental, bottom-up analysis of business models and valuations.
Global equities rose in step with upbeat economic data. Business and consumer confidence also improved. The synchronised growth worldwideoutweighed jitters caused by volatility in politics and geopolitical tensions. In the US, the White House mulled over the Fed chairmanship as balance-sheet reduction began, while inflation lagged economic growth and a lack of clarity on tax reforms persisted. In the Eurozone, the European Central Bankpondered reducing monetary stimulus, while political leaders grappled with rising populist discontent and strained Brexit talks, further aggravated byinfighting within the UK government. Turning to Asia, the Chinese economy grew steadily ahead of its National Congress but subsequently showed somesigns of softening. However, investors were encouraged that the economy remains on track to reach its full-year growth target. Separately, Japaneseequities were bolstered by incumbent Prime Minister Shinzo Abe’s snap election victory, and the Bank of Japan maintaining monetary stimulus.Meanwhile, OPEC-led production cuts provided support to rising oil prices.
The Fund rose by 2.94% during the review period (3.71% gross of annual management charge), underperforming the benchmark.
At the stock level, hotel and restaurant group Whitbread faltered due to concerns about consumption in the UK, disunity within the ruling Conservativeparty and tough Brexit negotiations. Nonetheless, it has an established track record and its businesses still have growth potential. Israel’s Check PointSoftware fell over a slowdown in billings and a weaker earnings outlook, although it remains attractively valued, with a solid balance sheet.Telecommunications conglomerate Comcast succumbed to profit-taking due to its increasingly challenging operating environment. That said, its cashgeneration and balance sheet continues to be robust.
Conversely, software company Aveva benefited from news of its £3 billion merger with Schneider Electric’s industrial software business which is expectedto create a global leader in their industry. Real-estate services firm Jones Lang Lasalle rose on outstanding results and an improvement in debt levels.And robotics manufacturer Fanuc advanced after it posted good earnings, alongside a favourable outlook.
Aberdeen Asset Investments LimitedDecember 2017
Source: Financial Express after 1st June 2013 and Morningstar for previous year. Basis: Percentage growth, total return Share Class C (gross of annual management charge), published prices at 12.00pm.Past performance is not a guide to future performance. The value of an investment and the revenue from it may go up and down and you may get backless than invested.
Ethical Fund
45
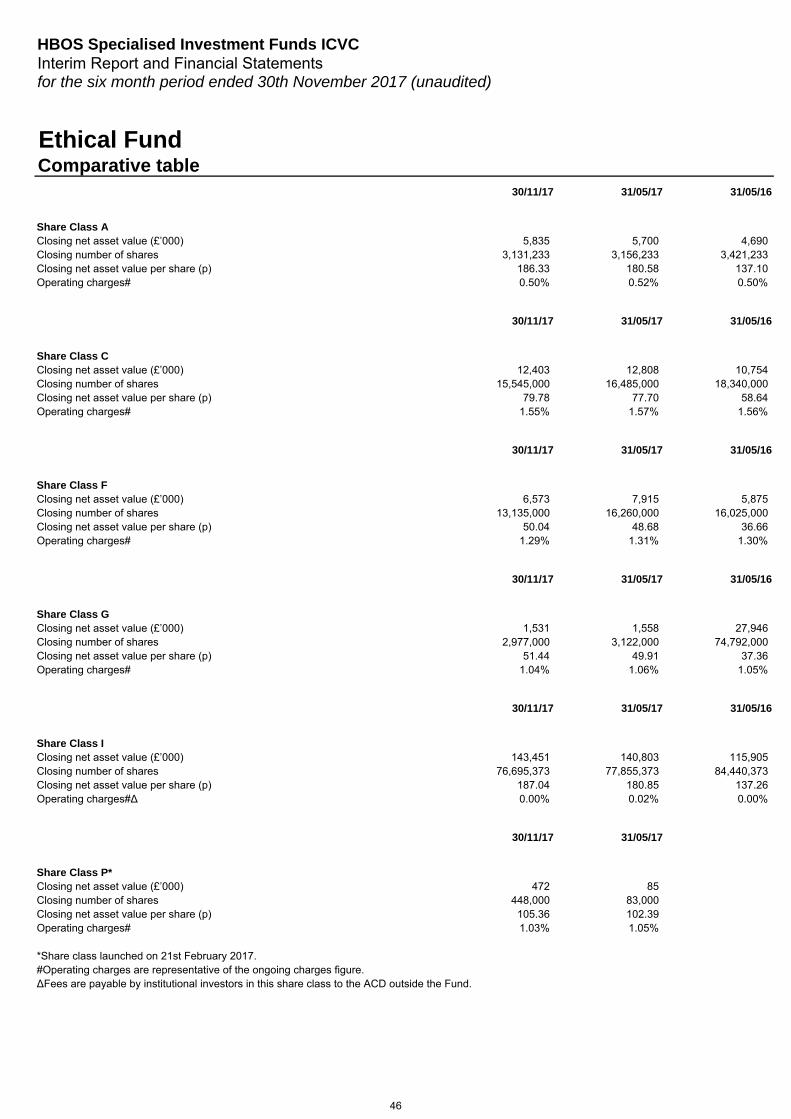
Interim Report and Financial Statementsfor the six month period ended 30th November 2017 (unaudited)
Comparative table
Share Class AClosing net asset value (£’000)Closing number of sharesClosing net asset value per share (p)Operating charges#
Share Class CClosing net asset value (£’000)Closing number of sharesClosing net asset value per share (p)Operating charges#
Share Class FClosing net asset value (£’000)Closing number of sharesClosing net asset value per share (p)Operating charges#
Share Class GClosing net asset value (£’000)Closing number of sharesClosing net asset value per share (p)Operating charges#
Share Class IClosing net asset value (£’000)Closing number of sharesClosing net asset value per share (p)Operating charges#∆
Share Class P*Closing net asset value (£’000)Closing number of sharesClosing net asset value per share (p)Operating charges#
HBOS Specialised Investment Funds ICVC
Ethical Fund
30/11/17 31/05/17 31/05/16
186.33 180.58 137.100.50% 0.52% 0.50%
5,835 5,700 4,6903,131,233 3,156,233 3,421,233
30/11/17 31/05/17 31/05/16
79.78 77.70 58.641.55% 1.57% 1.56%
12,403 12,808 10,75415,545,000 16,485,000 18,340,000
30/11/17 31/05/17 31/05/16
50.04 48.68 36.661.29% 1.31% 1.30%
6,573 7,915 5,87513,135,000 16,260,000 16,025,000
30/11/17 31/05/17 31/05/16
51.44 49.91 37.361.04% 1.06% 1.05%
1,531 1,558 27,9462,977,000 3,122,000 74,792,000
30/11/17 31/05/17 31/05/16
187.04 180.85 137.260.00% 0.02% 0.00%
143,451 140,803 115,90576,695,373 77,855,373 84,440,373
30/11/17 31/05/17
105.36 102.391.03% 1.05%
472 85448,000 83,000
*Share class launched on 21st February 2017.#Operating charges are representative of the ongoing charges figure.∆Fees are payable by institutional investors in this share class to the ACD outside the Fund.
46
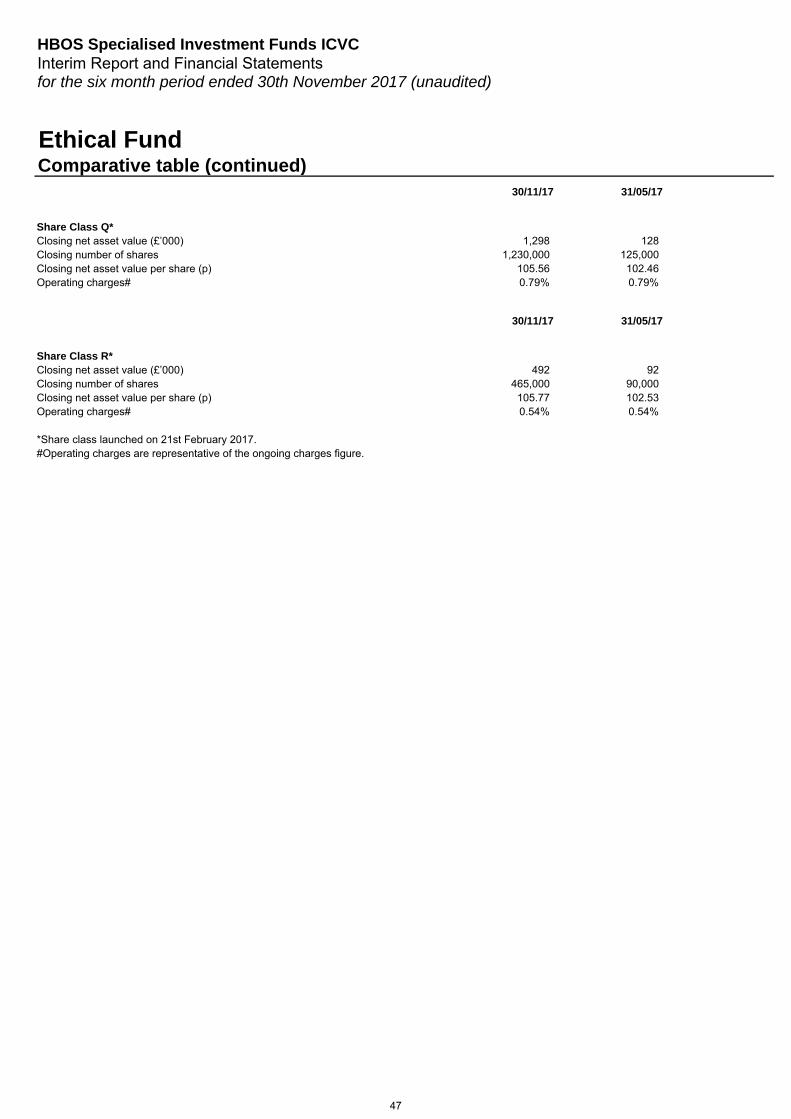
Interim Report and Financial Statementsfor the six month period ended 30th November 2017 (unaudited)
Comparative table (continued)
HBOS Specialised Investment Funds ICVC
Ethical Fund
Share Class Q*Closing net asset value (£’000)Closing number of sharesClosing net asset value per share (p)Operating charges#
Share Class R*Closing net asset value (£’000)Closing number of sharesClosing net asset value per share (p)Operating charges#
30/11/17 31/05/17
105.56 102.460.79% 0.79%
1,298 1281,230,000 125,000
30/11/17 31/05/17
105.77 102.530.54% 0.54%
492 92465,000 90,000
*Share class launched on 21st February 2017.#Operating charges are representative of the ongoing charges figure.
47
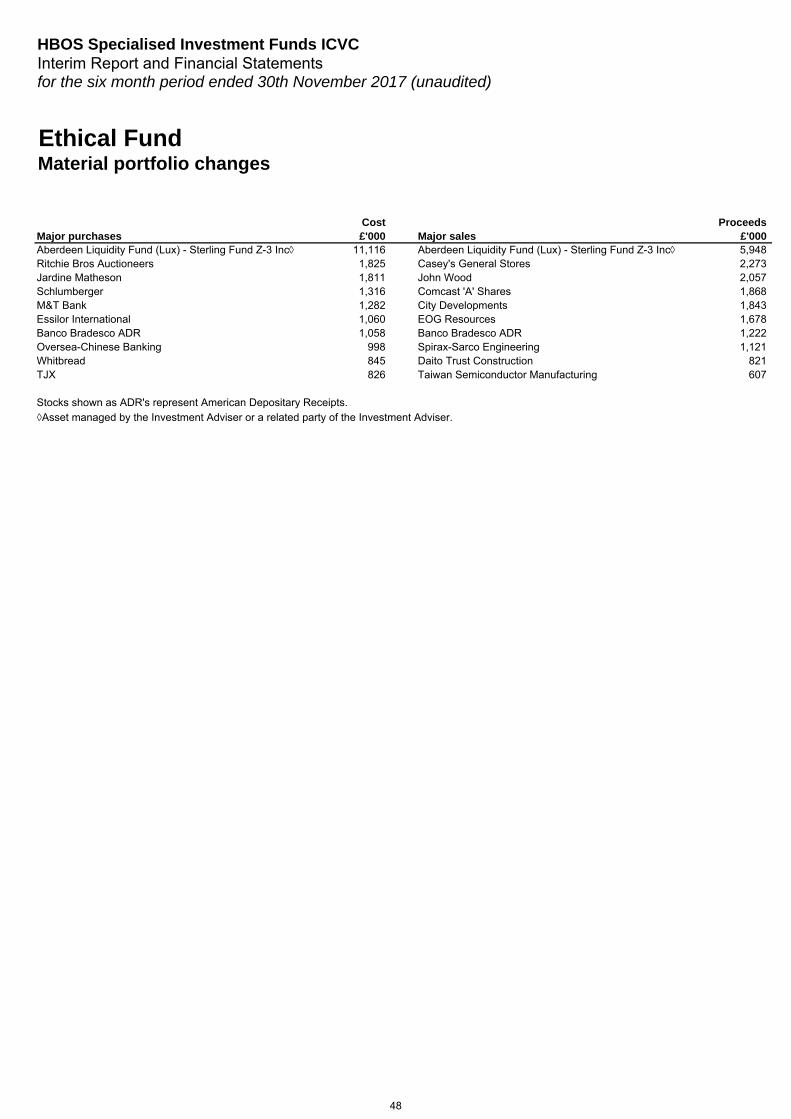
HBOS Specialised Investment Funds ICVCInterim Report and Financial Statementsfor the six month period ended 30th November 2017 (unaudited)
Ethical FundMaterial portfolio changes
Cost ProceedsMajor purchases £'000 Major sales £'000 Aberdeen Liquidity Fund (Lux) - Sterling Fund Z-3 Inc◊ 11,116 Aberdeen Liquidity Fund (Lux) - Sterling Fund Z-3 Inc◊ 5,948Ritchie Bros Auctioneers 1,825 Casey's General Stores 2,273Jardine Matheson 1,811 John Wood 2,057Schlumberger 1,316 Comcast 'A' Shares 1,868M&T Bank 1,282 City Developments 1,843Essilor International 1,060 EOG Resources 1,678Banco Bradesco ADR 1,058 Banco Bradesco ADR 1,222Oversea-Chinese Banking 998 Spirax-Sarco Engineering 1,121Whitbread 845 Daito Trust Construction 821TJX 826 Taiwan Semiconductor Manufacturing 607
Stocks shown as ADR's represent American Depositary Receipts.◊Asset managed by the Investment Adviser or a related party of the Investment Adviser.
48
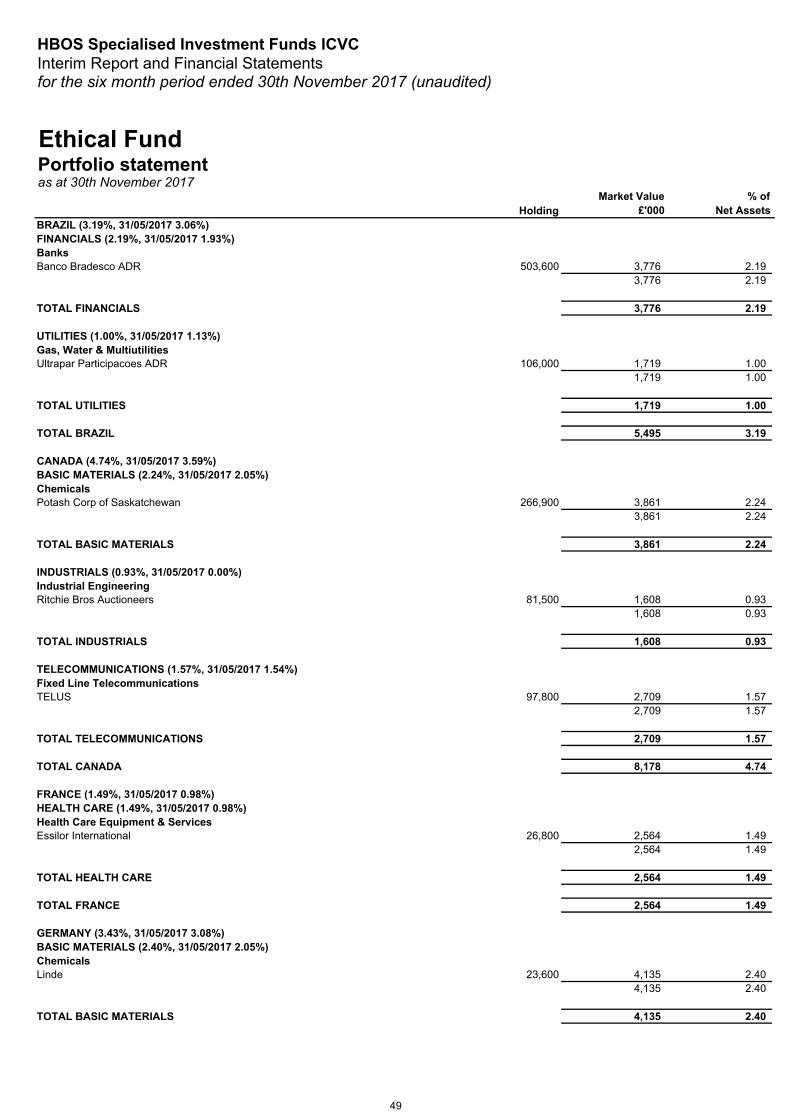
HBOS Specialised Investment Funds ICVCInterim Report and Financial Statementsfor the six month period ended 30th November 2017 (unaudited)
HoldingMarket Value
£'000% of
Net AssetsBRAZIL (3.19%, 31/05/2017 3.06%) FINANCIALS (2.19%, 31/05/2017 1.93%) BanksBanco Bradesco ADR 503,600 3,776 2.19
3,776 2.19
TOTAL FINANCIALS 3,776 2.19
UTILITIES (1.00%, 31/05/2017 1.13%) Gas, Water & MultiutilitiesUltrapar Participacoes ADR 106,000 1,719 1.00
1,719 1.00
TOTAL UTILITIES 1,719 1.00
TOTAL BRAZIL 5,495 3.19
CANADA (4.74%, 31/05/2017 3.59%) BASIC MATERIALS (2.24%, 31/05/2017 2.05%) ChemicalsPotash Corp of Saskatchewan 266,900 3,861 2.24
3,861 2.24
TOTAL BASIC MATERIALS 3,861 2.24
INDUSTRIALS (0.93%, 31/05/2017 0.00%) Industrial EngineeringRitchie Bros Auctioneers 81,500 1,608 0.93
1,608 0.93
TOTAL INDUSTRIALS 1,608 0.93
TELECOMMUNICATIONS (1.57%, 31/05/2017 1.54%) Fixed Line TelecommunicationsTELUS 97,800 2,709 1.57
2,709 1.57
TOTAL TELECOMMUNICATIONS 2,709 1.57
TOTAL CANADA 8,178 4.74
FRANCE (1.49%, 31/05/2017 0.98%) HEALTH CARE (1.49%, 31/05/2017 0.98%) Health Care Equipment & ServicesEssilor International 26,800 2,564 1.49
2,564 1.49
TOTAL HEALTH CARE 2,564 1.49
TOTAL FRANCE 2,564 1.49
GERMANY (3.43%, 31/05/2017 3.08%) BASIC MATERIALS (2.40%, 31/05/2017 2.05%) ChemicalsLinde 23,600 4,135 2.40
4,135 2.40
TOTAL BASIC MATERIALS 4,135 2.40
Ethical FundPortfolio statement as at 30th November 2017
49
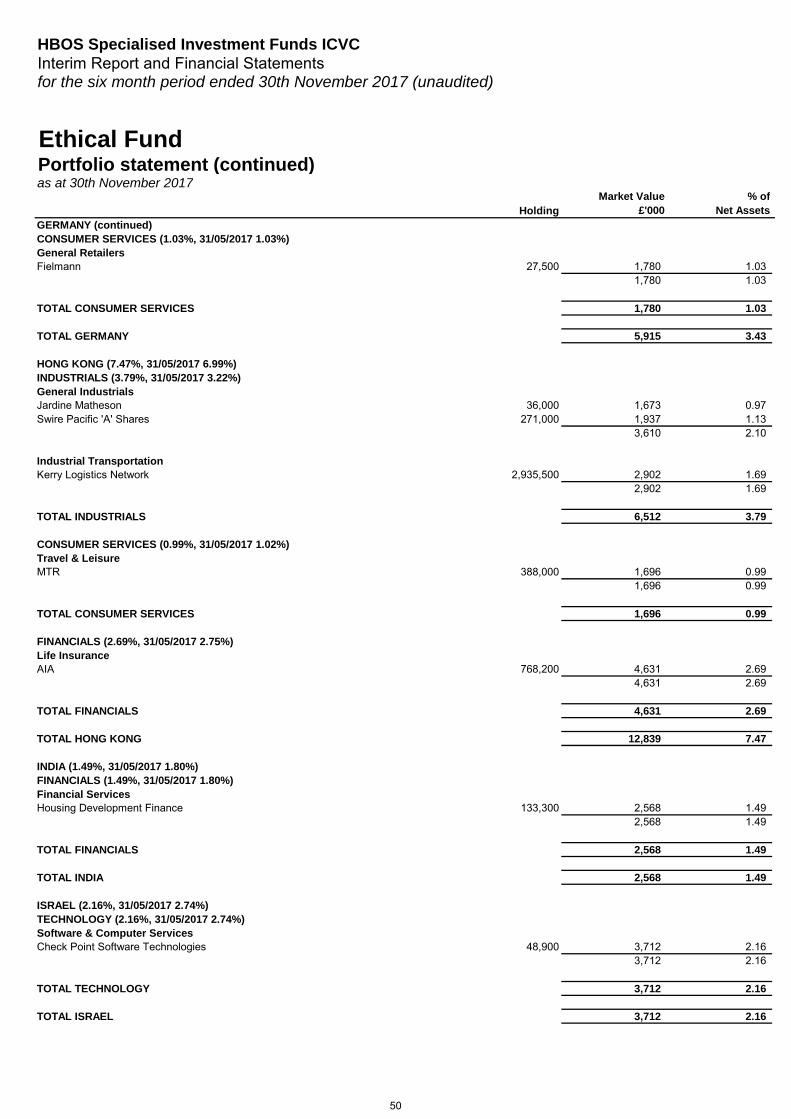
HBOS Specialised Investment Funds ICVCInterim Report and Financial Statementsfor the six month period ended 30th November 2017 (unaudited)
HoldingMarket Value
£'000% of
Net Assets
Ethical FundPortfolio statement (continued)as at 30th November 2017
GERMANY (continued) CONSUMER SERVICES (1.03%, 31/05/2017 1.03%) General RetailersFielmann 27,500 1,780 1.03
1,780 1.03
TOTAL CONSUMER SERVICES 1,780 1.03
TOTAL GERMANY 5,915 3.43
HONG KONG (7.47%, 31/05/2017 6.99%) INDUSTRIALS (3.79%, 31/05/2017 3.22%) General IndustrialsJardine Matheson 36,000 1,673 0.97Swire Pacific 'A' Shares 271,000 1,937 1.13
3,610 2.10
Industrial TransportationKerry Logistics Network 2,935,500 2,902 1.69
2,902 1.69
TOTAL INDUSTRIALS 6,512 3.79
CONSUMER SERVICES (0.99%, 31/05/2017 1.02%) Travel & LeisureMTR 388,000 1,696 0.99
1,696 0.99
TOTAL CONSUMER SERVICES 1,696 0.99
FINANCIALS (2.69%, 31/05/2017 2.75%) Life InsuranceAIA 768,200 4,631 2.69
4,631 2.69
TOTAL FINANCIALS 4,631 2.69
TOTAL HONG KONG 12,839 7.47
INDIA (1.49%, 31/05/2017 1.80%) FINANCIALS (1.49%, 31/05/2017 1.80%) Financial ServicesHousing Development Finance 133,300 2,568 1.49
2,568 1.49
TOTAL FINANCIALS 2,568 1.49
TOTAL INDIA 2,568 1.49
ISRAEL (2.16%, 31/05/2017 2.74%) TECHNOLOGY (2.16%, 31/05/2017 2.74%) Software & Computer ServicesCheck Point Software Technologies 48,900 3,712 2.16
3,712 2.16
TOTAL TECHNOLOGY 3,712 2.16
TOTAL ISRAEL 3,712 2.16
50
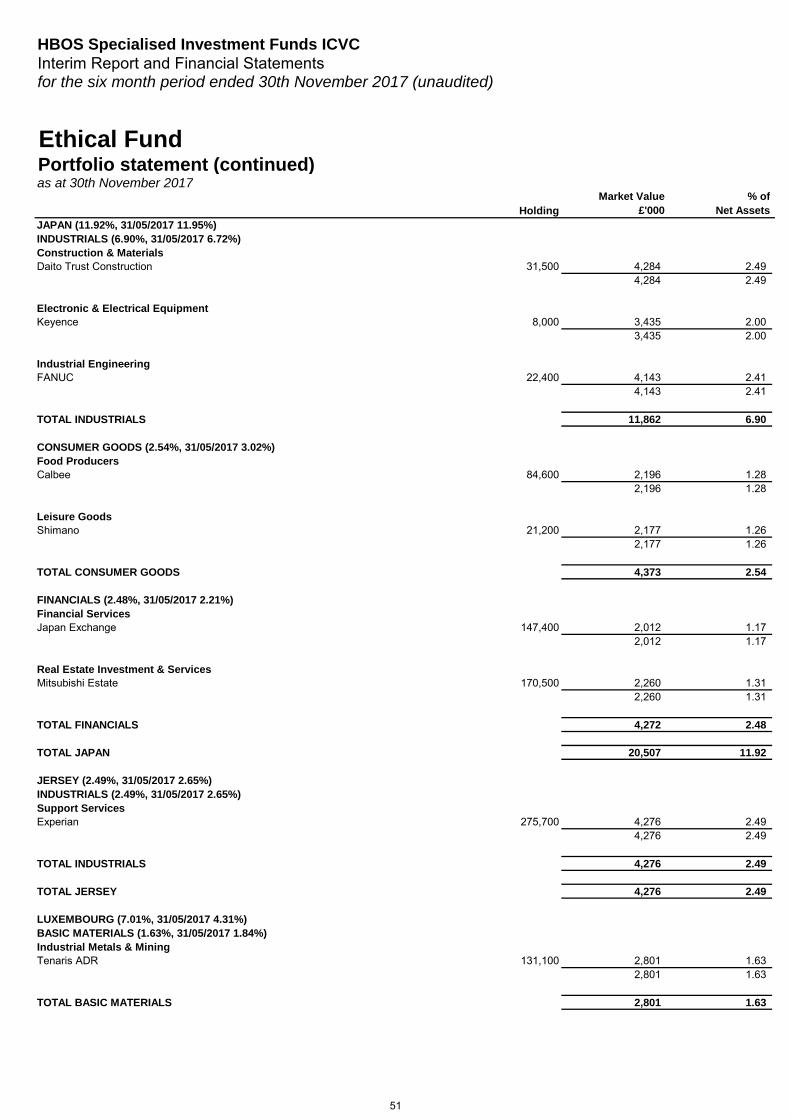
HBOS Specialised Investment Funds ICVCInterim Report and Financial Statementsfor the six month period ended 30th November 2017 (unaudited)
HoldingMarket Value
£'000% of
Net Assets
Ethical FundPortfolio statement (continued)as at 30th November 2017
JAPAN (11.92%, 31/05/2017 11.95%) INDUSTRIALS (6.90%, 31/05/2017 6.72%) Construction & MaterialsDaito Trust Construction 31,500 4,284 2.49
4,284 2.49
Electronic & Electrical EquipmentKeyence 8,000 3,435 2.00
3,435 2.00
Industrial EngineeringFANUC 22,400 4,143 2.41
4,143 2.41
TOTAL INDUSTRIALS 11,862 6.90
CONSUMER GOODS (2.54%, 31/05/2017 3.02%) Food ProducersCalbee 84,600 2,196 1.28
2,196 1.28
Leisure GoodsShimano 21,200 2,177 1.26
2,177 1.26
TOTAL CONSUMER GOODS 4,373 2.54
FINANCIALS (2.48%, 31/05/2017 2.21%) Financial ServicesJapan Exchange 147,400 2,012 1.17
2,012 1.17
Real Estate Investment & ServicesMitsubishi Estate 170,500 2,260 1.31
2,260 1.31
TOTAL FINANCIALS 4,272 2.48
TOTAL JAPAN 20,507 11.92
JERSEY (2.49%, 31/05/2017 2.65%) INDUSTRIALS (2.49%, 31/05/2017 2.65%) Support ServicesExperian 275,700 4,276 2.49
4,276 2.49
TOTAL INDUSTRIALS 4,276 2.49
TOTAL JERSEY 4,276 2.49
LUXEMBOURG (7.01%, 31/05/2017 4.31%) BASIC MATERIALS (1.63%, 31/05/2017 1.84%) Industrial Metals & MiningTenaris ADR 131,100 2,801 1.63
2,801 1.63
TOTAL BASIC MATERIALS 2,801 1.63
51
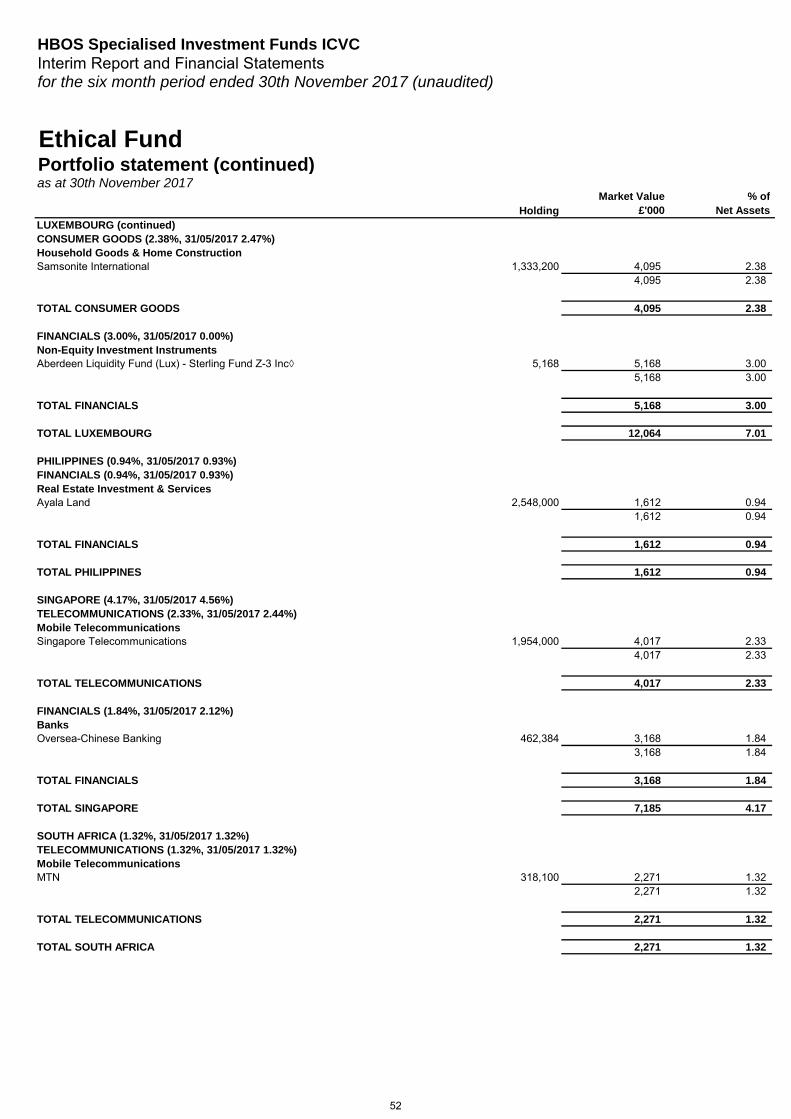
HBOS Specialised Investment Funds ICVCInterim Report and Financial Statementsfor the six month period ended 30th November 2017 (unaudited)
HoldingMarket Value
£'000% of
Net Assets
Ethical FundPortfolio statement (continued)as at 30th November 2017
LUXEMBOURG (continued) CONSUMER GOODS (2.38%, 31/05/2017 2.47%) Household Goods & Home ConstructionSamsonite International 1,333,200 4,095 2.38
4,095 2.38
TOTAL CONSUMER GOODS 4,095 2.38
FINANCIALS (3.00%, 31/05/2017 0.00%) Non-Equity Investment InstrumentsAberdeen Liquidity Fund (Lux) - Sterling Fund Z-3 Inc◊ 5,168 5,168 3.00
5,168 3.00
TOTAL FINANCIALS 5,168 3.00
TOTAL LUXEMBOURG 12,064 7.01
PHILIPPINES (0.94%, 31/05/2017 0.93%) FINANCIALS (0.94%, 31/05/2017 0.93%) Real Estate Investment & ServicesAyala Land 2,548,000 1,612 0.94
1,612 0.94
TOTAL FINANCIALS 1,612 0.94
TOTAL PHILIPPINES 1,612 0.94
SINGAPORE (4.17%, 31/05/2017 4.56%) TELECOMMUNICATIONS (2.33%, 31/05/2017 2.44%) Mobile TelecommunicationsSingapore Telecommunications 1,954,000 4,017 2.33
4,017 2.33
TOTAL TELECOMMUNICATIONS 4,017 2.33
FINANCIALS (1.84%, 31/05/2017 2.12%) BanksOversea-Chinese Banking 462,384 3,168 1.84
3,168 1.84
TOTAL FINANCIALS 3,168 1.84
TOTAL SINGAPORE 7,185 4.17
SOUTH AFRICA (1.32%, 31/05/2017 1.32%) TELECOMMUNICATIONS (1.32%, 31/05/2017 1.32%) Mobile TelecommunicationsMTN 318,100 2,271 1.32
2,271 1.32
TOTAL TELECOMMUNICATIONS 2,271 1.32
TOTAL SOUTH AFRICA 2,271 1.32
52
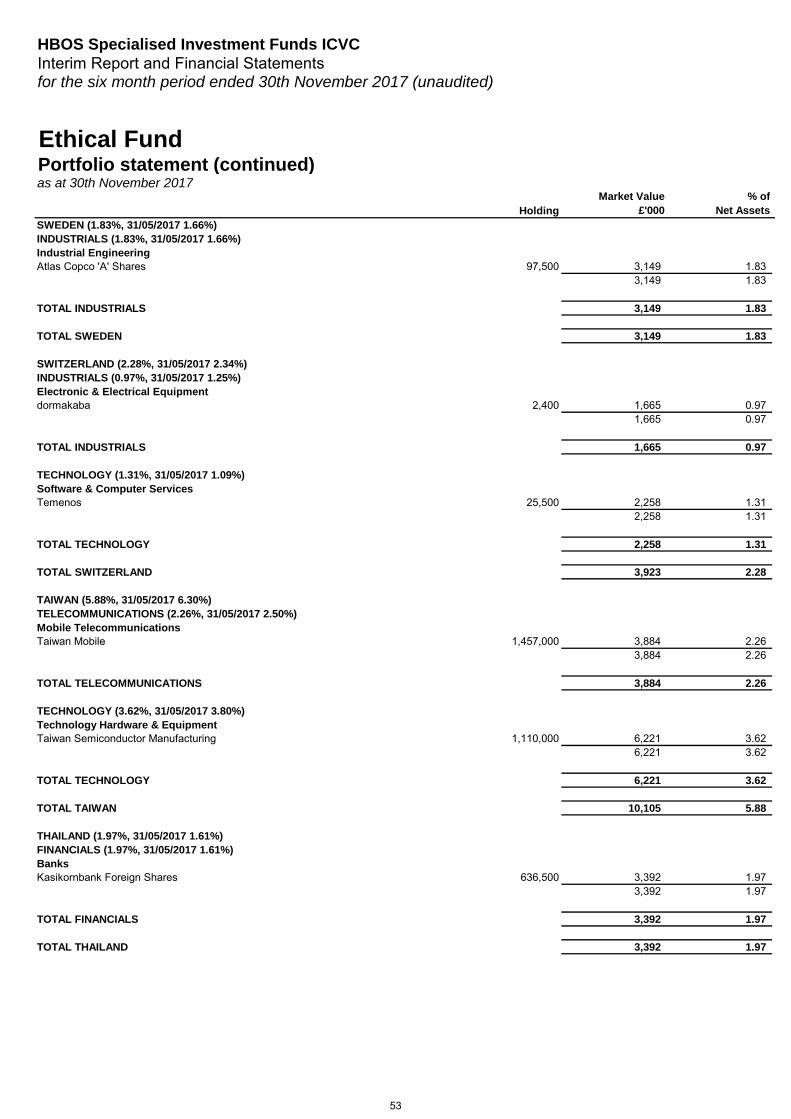
HBOS Specialised Investment Funds ICVCInterim Report and Financial Statementsfor the six month period ended 30th November 2017 (unaudited)
HoldingMarket Value
£'000% of
Net Assets
Ethical FundPortfolio statement (continued)as at 30th November 2017
SWEDEN (1.83%, 31/05/2017 1.66%) INDUSTRIALS (1.83%, 31/05/2017 1.66%) Industrial EngineeringAtlas Copco 'A' Shares 97,500 3,149 1.83
3,149 1.83
TOTAL INDUSTRIALS 3,149 1.83
TOTAL SWEDEN 3,149 1.83
SWITZERLAND (2.28%, 31/05/2017 2.34%) INDUSTRIALS (0.97%, 31/05/2017 1.25%) Electronic & Electrical Equipmentdormakaba 2,400 1,665 0.97
1,665 0.97
TOTAL INDUSTRIALS 1,665 0.97
TECHNOLOGY (1.31%, 31/05/2017 1.09%)Software & Computer ServicesTemenos 25,500 2,258 1.31
2,258 1.31
TOTAL TECHNOLOGY 2,258 1.31
TOTAL SWITZERLAND 3,923 2.28
TAIWAN (5.88%, 31/05/2017 6.30%) TELECOMMUNICATIONS (2.26%, 31/05/2017 2.50%) Mobile TelecommunicationsTaiwan Mobile 1,457,000 3,884 2.26
3,884 2.26
TOTAL TELECOMMUNICATIONS 3,884 2.26
TECHNOLOGY (3.62%, 31/05/2017 3.80%) Technology Hardware & EquipmentTaiwan Semiconductor Manufacturing 1,110,000 6,221 3.62
6,221 3.62
TOTAL TECHNOLOGY 6,221 3.62
TOTAL TAIWAN 10,105 5.88
THAILAND (1.97%, 31/05/2017 1.61%) FINANCIALS (1.97%, 31/05/2017 1.61%) BanksKasikornbank Foreign Shares 636,500 3,392 1.97
3,392 1.97
TOTAL FINANCIALS 3,392 1.97
TOTAL THAILAND 3,392 1.97
53
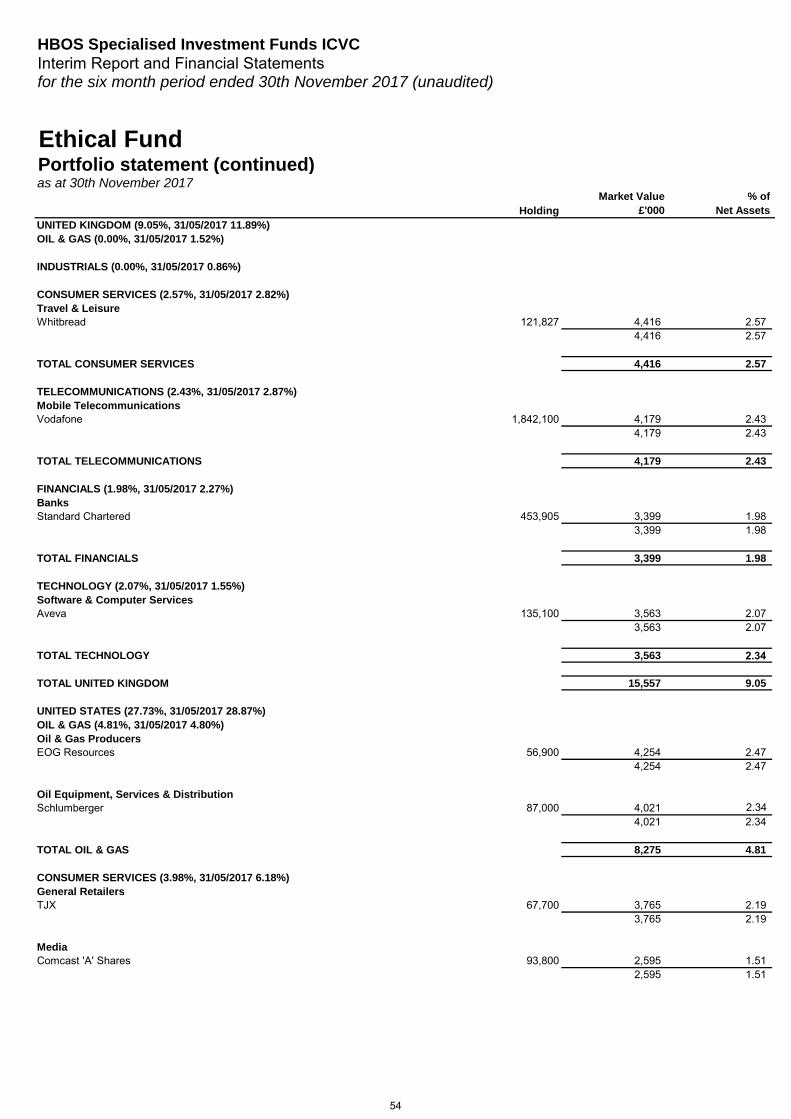
HBOS Specialised Investment Funds ICVCInterim Report and Financial Statementsfor the six month period ended 30th November 2017 (unaudited)
HoldingMarket Value
£'000% of
Net Assets
Ethical FundPortfolio statement (continued)as at 30th November 2017
UNITED KINGDOM (9.05%, 31/05/2017 11.89%) OIL & GAS (0.00%, 31/05/2017 1.52%)
INDUSTRIALS (0.00%, 31/05/2017 0.86%)
CONSUMER SERVICES (2.57%, 31/05/2017 2.82%) Travel & LeisureWhitbread 121,827 4,416 2.57
4,416 2.57
TOTAL CONSUMER SERVICES 4,416 2.57
TELECOMMUNICATIONS (2.43%, 31/05/2017 2.87%) Mobile TelecommunicationsVodafone 1,842,100 4,179 2.43
4,179 2.43
TOTAL TELECOMMUNICATIONS 4,179 2.43
FINANCIALS (1.98%, 31/05/2017 2.27%) BanksStandard Chartered 453,905 3,399 1.98
3,399 1.98
TOTAL FINANCIALS 3,399 1.98
TECHNOLOGY (2.07%, 31/05/2017 1.55%) Software & Computer ServicesAveva 135,100 3,563 2.07
3,563 2.07
TOTAL TECHNOLOGY 3,563
TOTAL UNITED KINGDOM 15,557 9.05
UNITED STATES (27.73%, 31/05/2017 28.87%) OIL & GAS (4.81%, 31/05/2017 4.80%) Oil & Gas ProducersEOG Resources 56,900 4,254 2.47
4,254 2.47
Oil Equipment, Services & DistributionSchlumberger 87,000 4,021
4,021 2.34
TOTAL OIL & GAS 8,275 4.81
CONSUMER SERVICES (3.98%, 31/05/2017 6.18%) General RetailersTJX 67,700 3,765 2.19
3,765 2.19
MediaComcast 'A' Shares 93,800 2,595 1.51
2,595 1.51
2.34
2.34
54
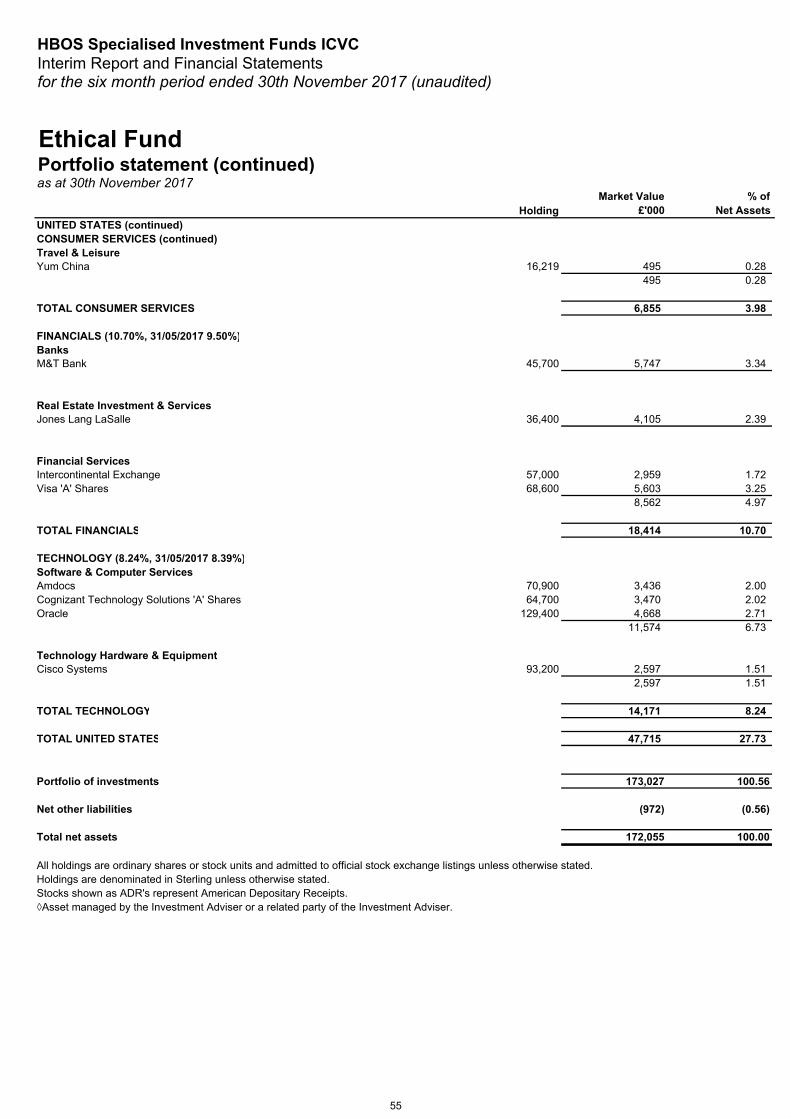
HBOS Specialised Investment Funds ICVCInterim Report and Financial Statementsfor the six month period ended 30th November 2017 (unaudited)
HoldingMarket Value
£'000% of
Net Assets
Ethical FundPortfolio statement (continued)as at 30th November 2017
UNITED STATES (continued) CONSUMER SERVICES (continued)Travel & LeisureYum China 16,219 495 0.28
495 0.28 TOTAL CONSUMER SERVICES 6,855 3.98 FINANCIALS (10.70%, 31/05/2017 9.50%)BanksM&T Bank 45,700 5,747 3.34
Real Estate Investment & ServicesJones Lang LaSalle 36,400 4,105 2.39
Financial ServicesIntercontinental Exchange 57,000 2,959 1.72Visa 'A' Shares 68,600 5,603 3.25
8,562 4.97 TOTAL FINANCIALS 18,414 10.70 TECHNOLOGY (8.24%, 31/05/2017 8.39%)Software & Computer ServicesAmdocs 70,900 3,436 2.00Cognizant Technology Solutions 'A' Shares 64,700 3,470 2.02Oracle 129,400 4,668 2.71
11,574 6.73
Technology Hardware & EquipmentCisco Systems 93,200 2,597 1.51
2,597 1.51 TOTAL TECHNOLOGY 14,171 8.24 TOTAL UNITED STATES 47,715 27.73
Portfolio of investments 173,027 100.56
Net other liabilities (972) (0.56)
Total net assets 172,055 100.00
◊Asset managed by the Investment Adviser or a related party of the Investment Adviser.Stocks shown as ADR's represent American Depositary Receipts.Holdings are denominated in Sterling unless otherwise stated.All holdings are ordinary shares or stock units and admitted to official stock exchange listings unless otherwise stated.
55
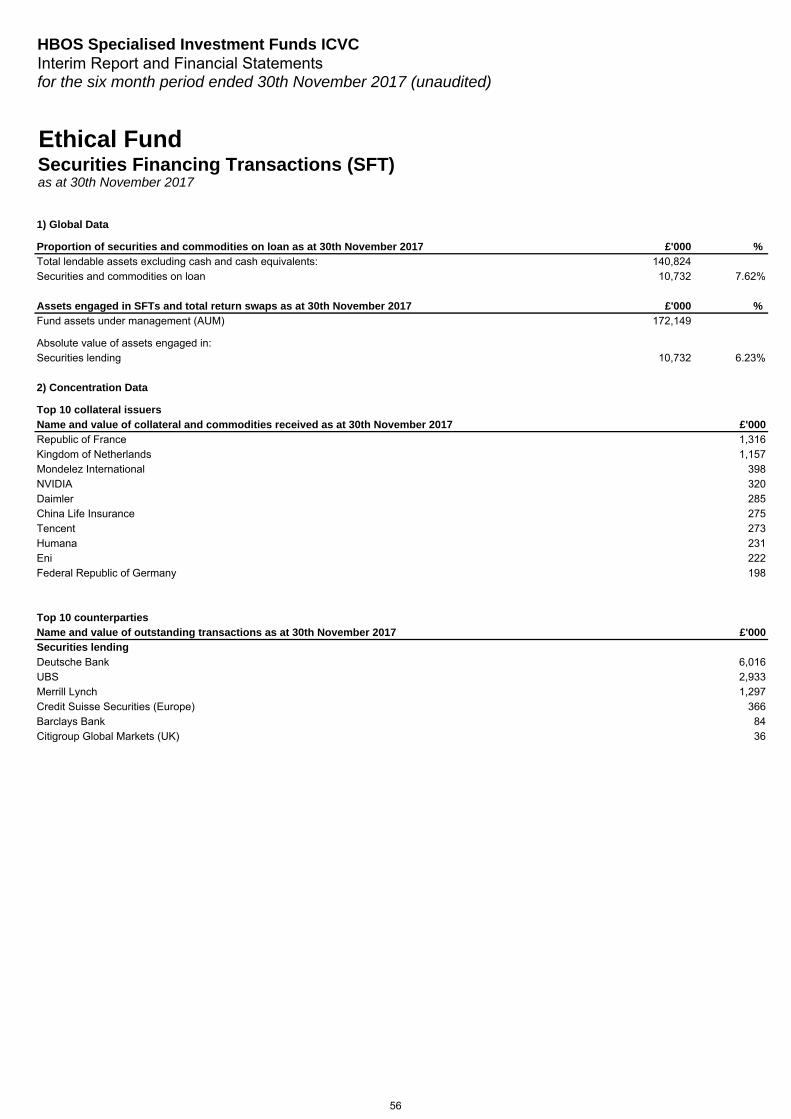
HBOS Specialised Investment Funds ICVCInterim Report and Financial Statementsfor the six month period ended 30th November 2017 (unaudited)
1) Global Data
Proportion of securities and commodities on loan as at 30th November 2017 £'000 % Total lendable assets excluding cash and cash equivalents: 140,824Securities and commodities on loan 10,732 7.62%
Assets engaged in SFTs and total return swaps as at 30th November 2017 £'000 % Fund assets under management (AUM) 172,149
Absolute value of assets engaged in:Securities lending 10,732 6.23%
2) Concentration Data
Top 10 collateral issuersName and value of collateral and commodities received as at 30th November 2017 £'000Republic of France 1,316Kingdom of Netherlands 1,157Mondelez International 398NVIDIA 320Daimler 285China Life Insurance 275Tencent 273Humana 231Eni 222Federal Republic of Germany 198
Top 10 counterpartiesName and value of outstanding transactions as at 30th November 2017 £'000Securities lendingDeutsche Bank 6,016UBS 2,933Merrill Lynch 1,297Credit Suisse Securities (Europe) 366Barclays Bank 84Citigroup Global Markets (UK) 36
Ethical FundSecurities Financing Transactions (SFT) as at 30th November 2017
56
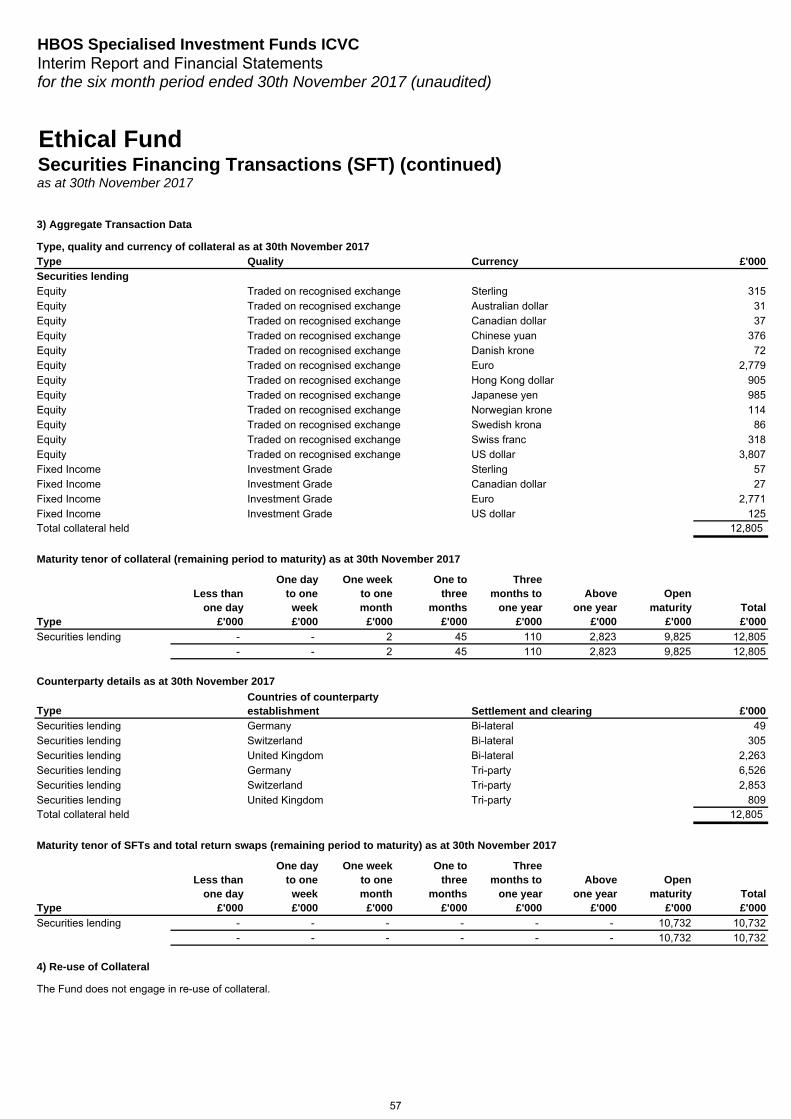
HBOS Specialised Investment Funds ICVCInterim Report and Financial Statementsfor the six month period ended 30th November 2017 (unaudited)
Securities Financing Transactions (SFT) (continued)Ethical Fund
as at 30th November 2017
3) Aggregate Transaction Data
Type, quality and currency of collateral as at 30th November 2017Type Quality Currency £'000Securities lendingEquity Traded on recognised exchange Sterling 315Equity Traded on recognised exchange Australian dollar 31Equity Traded on recognised exchange Canadian dollar 37Equity Traded on recognised exchange Chinese yuan 376Equity Traded on recognised exchange Danish krone 72Equity Traded on recognised exchange Euro 2,779Equity Traded on recognised exchange Hong Kong dollar 905Equity Traded on recognised exchange Japanese yen 985Equity Traded on recognised exchange Norwegian krone 114Equity Traded on recognised exchange Swedish krona 86Equity Traded on recognised exchange Swiss franc 318Equity Traded on recognised exchange US dollar 3,807Fixed Income Investment Grade Sterling 57Fixed Income Investment Grade Canadian dollar 27Fixed Income Investment Grade Euro 2,771Fixed Income Investment Grade US dollar 125Total collateral held 12,805
Maturity tenor of collateral (remaining period to maturity) as at 30th November 2017
Type
Less than one day
£'000
One day to one week£'000
One week to one month
£'000
One to three
months£'000
Three months to
one year£'000
Above one year
£'000
Open maturity
£'000Total£'000
Securities lending - - 2 45 110 2,823 9,825 12,805- - 2 45 110 2,823 9,825 12,805
Counterparty details as at 30th November 2017
Type £'000Securities lending Germany Bi-lateral 49Securities lending Switzerland Bi-lateral 305Securities lending United Kingdom Bi-lateral 2,263Securities lending Germany Tri-party 6,526Securities lending Switzerland Tri-party 2,853Securities lending United Kingdom Tri-party 809Total collateral held 12,805
Maturity tenor of SFTs and total return swaps (remaining period to maturity) as at 30th November 2017
Type
Less than one day
£'000
One day to one week£'000
One week to one month
£'000
One to three
months£'000
Three months to
one year£'000
Above one year
£'000
Open maturity
£'000Total£'000
Securities lending - - - - - - 10,732 10,732- - - - - - 10,732 10,732
4) Re-use of Collateral
The Fund does not engage in re-use of collateral.
Countries of counterparty establishment Settlement and clearing
57
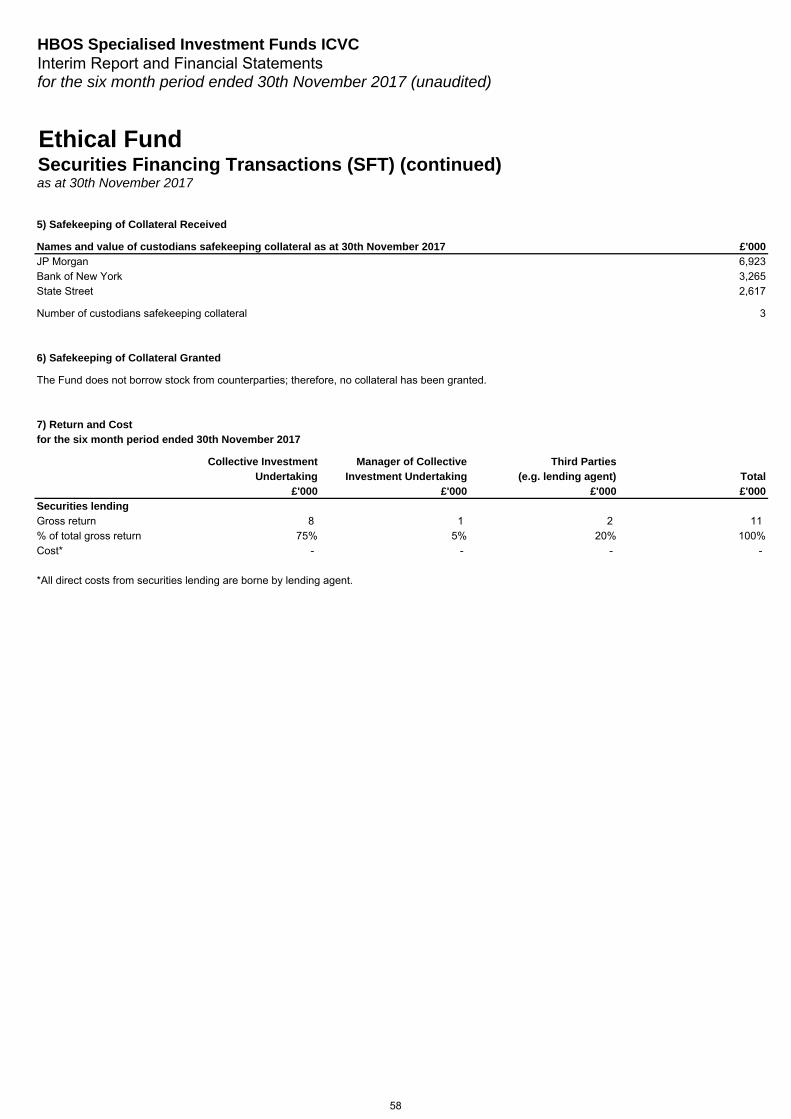
HBOS Specialised Investment Funds ICVCInterim Report and Financial Statementsfor the six month period ended 30th November 2017 (unaudited)
Securities Financing Transactions (SFT) (continued)Ethical Fund
as at 30th November 2017
5) Safekeeping of Collateral Received
Names and value of custodians safekeeping collateral as at 30th November 2017 £'000JP Morgan 6,923Bank of New York 3,265State Street 2,617
Number of custodians safekeeping collateral 3
6) Safekeeping of Collateral Granted
The Fund does not borrow stock from counterparties; therefore, no collateral has been granted.
7) Return and Costfor the six month period ended 30th November 2017
Collective Investment Manager of Collective Third Parties Undertaking Investment Undertaking (e.g. lending agent) Total
£'000 £'000 £'000 £'000Securities lendingGross return 8 1 2 11% of total gross return 75% 5% 20% 100%Cost* - - - -
*All direct costs from securities lending are borne by lending agent.
58
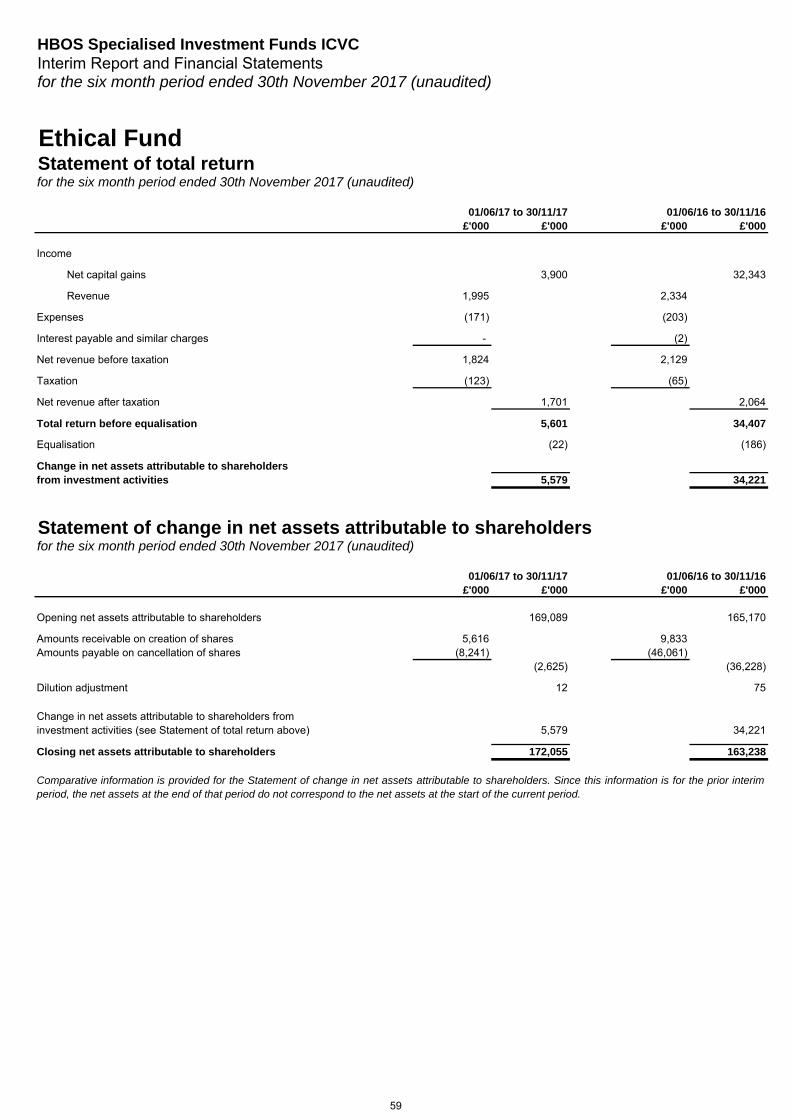
HBOS Specialised Investment Funds ICVCInterim Report and Financial Statementsfor the six month period ended 30th November 2017 (unaudited)
Ethical FundStatement of total returnfor the six month period ended 30th November 2017 (unaudited)
01/06/17 to 30/11/17 01/06/16 to 30/11/16£'000 £'000 £'000 £'000
Income
Net capital gains 3,900 32,343
Revenue 1,995 2,334
Expenses (171) (203)
Interest payable and similar charges - (2)
Net revenue before taxation 1,824 2,129
Taxation (123) (65)
Net revenue after taxation 1,701 2,064
Total return before equalisation 5,601 34,407
Equalisation (22) (186)
Change in net assets attributable to shareholdersfrom investment activities 5,579 34,221
Statement of change in net assets attributable to shareholdersfor the six month period ended 30th November 2017 (unaudited)
01/06/17 to 30/11/17 01/06/16 to 30/11/16£'000 £'000 £'000 £'000
Opening net assets attributable to shareholders 169,089 165,170
Amounts receivable on creation of shares 5,616 9,833Amounts payable on cancellation of shares (8,241) (46,061)
(2,625) (36,228)
Dilution adjustment 12 75
Change in net assets attributable to shareholders frominvestment activities (see Statement of total return above) 5,579 34,221
Closing net assets attributable to shareholders 172,055 163,238
Comparative information is provided for the Statement of change in net assets attributable to shareholders. Since this information is for the prior interimperiod, the net assets at the end of that period do not correspond to the net assets at the start of the current period.
59
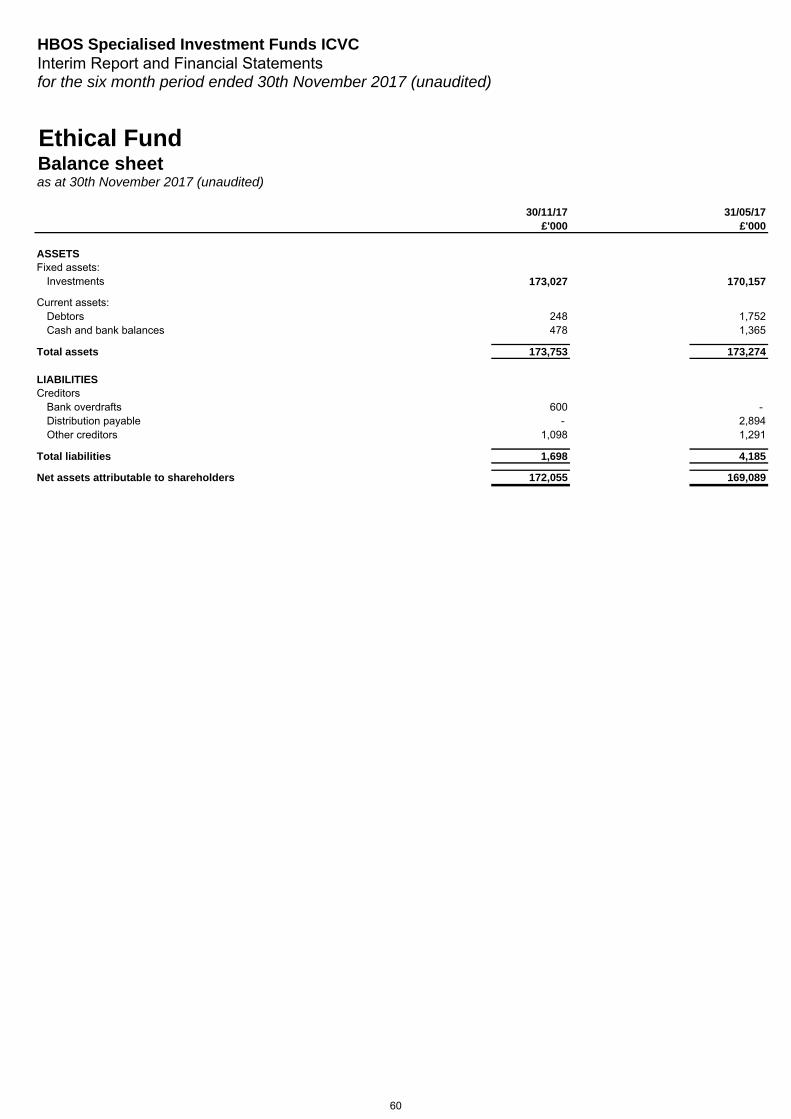
HBOS Specialised Investment Funds ICVCInterim Report and Financial Statementsfor the six month period ended 30th November 2017 (unaudited)
Ethical FundBalance sheetas at 30th November 2017 (unaudited)
30/11/17 31/05/17£'000 £'000
ASSETSFixed assets:
Investments 173,027 170,157
Current assets:Debtors 248 1,752Cash and bank balances 478 1,365
Total assets 173,753 173,274
LIABILITIESCreditors
Bank overdrafts 600 -Distribution payable - 2,894Other creditors 1,098 1,291
Total liabilities 1,698 4,185
Net assets attributable to shareholders 172,055 169,089
60
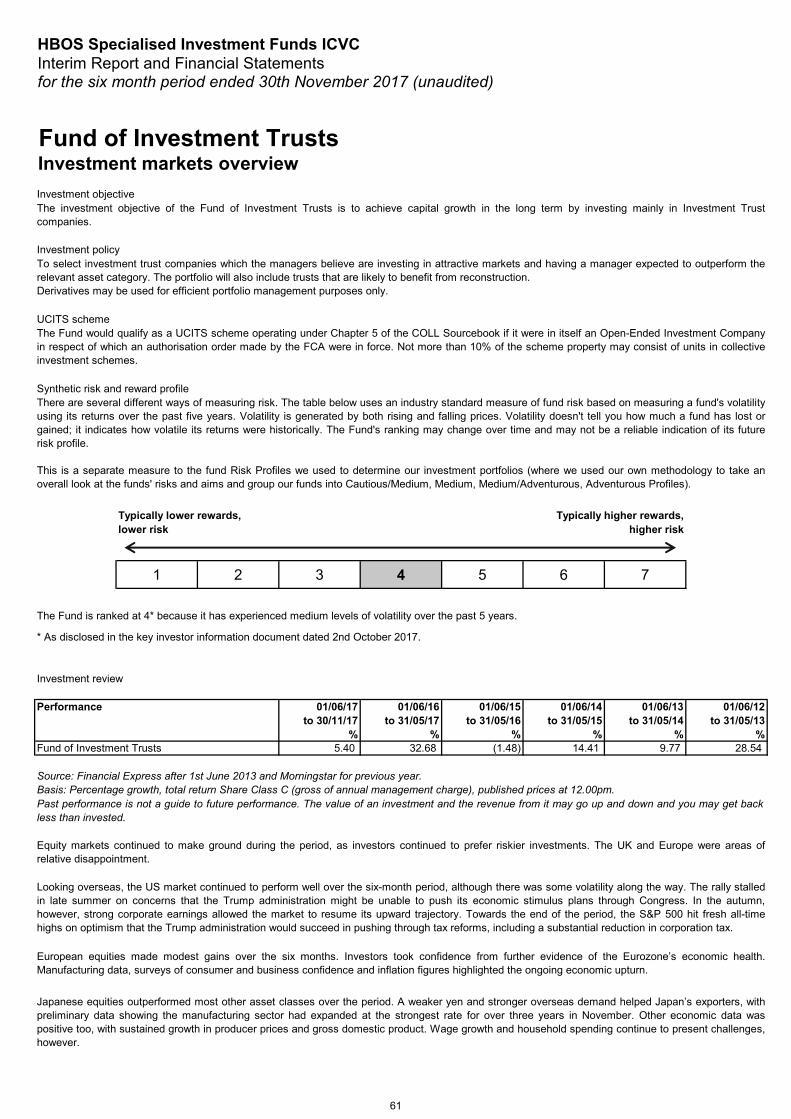
HBOS Specialised Investment Funds ICVCInterim Report and Financial Statementsfor the six month period ended 30th November 2017 (unaudited)
Fund of Investment TrustsInvestment markets overview Investment objective
Investment policy
UCITS scheme
Synthetic risk and reward profile
1 2 3 4 5 6 7
Investment review
Performance 01/06/17 01/06/16 01/06/15 01/06/14 01/06/13 01/06/12to 30/11/17 to 31/05/17 to 31/05/16 to 31/05/15 to 31/05/14 to 31/05/13
% % % % % %5.40 32.68 (1.48) 14.41 9.77 28.54Fund of Investment Trusts
The Fund is ranked at 4* because it has experienced medium levels of volatility over the past 5 years.
* As disclosed in the key investor information document dated 2nd October 2017.
There are several different ways of measuring risk. The table below uses an industry standard measure of fund risk based on measuring a fund's volatilityusing its returns over the past five years. Volatility is generated by both rising and falling prices. Volatility doesn't tell you how much a fund has lost orgained; it indicates how volatile its returns were historically. The Fund's ranking may change over time and may not be a reliable indication of its futurerisk profile.
This is a separate measure to the fund Risk Profiles we used to determine our investment portfolios (where we used our own methodology to take anoverall look at the funds' risks and aims and group our funds into Cautious/Medium, Medium, Medium/Adventurous, Adventurous Profiles).
Source: Financial Express after 1st June 2013 and Morningstar for previous year. Basis: Percentage growth, total return Share Class C (gross of annual management charge), published prices at 12.00pm.
The investment objective of the Fund of Investment Trusts is to achieve capital growth in the long term by investing mainly in Investment Trustcompanies.
To select investment trust companies which the managers believe are investing in attractive markets and having a manager expected to outperform therelevant asset category. The portfolio will also include trusts that are likely to benefit from reconstruction.Derivatives may be used for efficient portfolio management purposes only.
The Fund would qualify as a UCITS scheme operating under Chapter 5 of the COLL Sourcebook if it were in itself an Open-Ended Investment Companyin respect of which an authorisation order made by the FCA were in force. Not more than 10% of the scheme property may consist of units in collectiveinvestment schemes.
Typically lower rewards,lower risk
Typically higher rewards,higher risk
Past performance is not a guide to future performance. The value of an investment and the revenue from it may go up and down and you may get backless than invested.
Equity markets continued to make ground during the period, as investors continued to prefer riskier investments. The UK and Europe were areas ofrelative disappointment.
Looking overseas, the US market continued to perform well over the six-month period, although there was some volatility along the way. The rally stalledin late summer on concerns that the Trump administration might be unable to push its economic stimulus plans through Congress. In the autumn,however, strong corporate earnings allowed the market to resume its upward trajectory. Towards the end of the period, the S&P 500 hit fresh all-timehighs on optimism that the Trump administration would succeed in pushing through tax reforms, including a substantial reduction in corporation tax.
European equities made modest gains over the six months. Investors took confidence from further evidence of the Eurozone’s economic health.Manufacturing data, surveys of consumer and business confidence and inflation figures highlighted the ongoing economic upturn.
Japanese equities outperformed most other asset classes over the period. A weaker yen and stronger overseas demand helped Japan’s exporters, withpreliminary data showing the manufacturing sector had expanded at the strongest rate for over three years in November. Other economic data waspositive too, with sustained growth in producer prices and gross domestic product. Wage growth and household spending continue to present challenges,however.
61
HBOS Specialised Investment Funds ICVCInterim Report and Financial Statementsfor the six month period ended 30th November 2017 (unaudited)
Fund of Investment TrustsInvestment markets overview (continued)
Activity within the portfolio continued to reflect a shift towards relative value opportunities and profit taking from holdings that had driven recentoutperformance. In the period under review this entailed additional allocations to listed private equity investments, where discounts to asset value remainwide despite recent realisations providing ample evidence that these asset values are understated. NB Private Equity Partners and HarbourVest GlobalPrivate Equity Partners were our two preferred vehicles of choice for this increased exposure, both offering exposure to predominantly US buyoutopportunities. At the end of the period 7.4% of the portfolio was invested in private equity focussed vehicles, with each of the four holdings trading at adouble digit discount to net asset value.
Meanwhile, emerging markets and Asia Pacific continued their recovery, helped by stable currencies and robust earnings growth.
Over the six month period under review the Fund returned 4.62% (5.40% gross of annual management charge). This relatively strong performance wasdelivered by an overweight allocation to overseas equities at the expense of UK equities, narrowing discounts across the investment trust sector andstrong net asset value performances from some of the portfolio’s core holdings.
Investment review (continued)
The performance of the portfolio’s global growth oriented holdings (the two most obvious being Scottish Mortgage and Monks Investment Trust, bothmanaged by Baillie Gifford), and the premium ratings now being achieved by those and similar vehicles prompted material contemplation within our value-focussed team. The result so far has been a “trimming” of those and other positions after a period of strong returns (over the last three years ScottishMortgage and Monks Investment Trusts have delivered share price total returns of 80.2% and 99.1% respectively). While we cannot, at present, point toexactly what may end the ten-year trend of growth outperforming value, we believe that taking profit after such marked outperformance is prudent.
When surveying global equity markets at present, we see plenty to suggest that a cautious approach is warranted. Low interest rates and low (ornegative) bond yields globally have prompted liquidity to gravitate toward equities. Valuations have risen to levels where, historically, subsequent returnshave tended to be anaemic, certainly compared to the annual double-digit returns investors have become accustomed to over the recent past.
Within the investment trust universe, performance has been enhanced by narrowing discounts, to multi-year lows and in some instances premiums. Whilewe do not yet sense euphoria in either markets in general or the investment trust universe, we are certainly closer to it than to despair. We are positioningthe portfolio accordingly, by ensuring we have ample liquidity, protection from discount widening wherever possible and a suite of underlying investmentscapable of outperforming in the event of a period of less buoyant markets.
Aberdeen Asset Investments LimitedDecember 2017
The Fund’s geographic allocation was largely unchanged during the period, with Asia and Japan being the largest overweight holdings whilst the UKremains a relative underweight position.
62
Interim Report and Financial Statementsfor the six month period ended 30th November 2017 (unaudited)
Comparative table
Share Class AClosing net asset value (£’000)Closing number of sharesClosing net asset value per share (p)Operating charges#
Share Class CClosing net asset value (£’000)Closing number of sharesClosing net asset value per share (p)Operating charges#
Share Class FClosing net asset value (£’000)Closing number of sharesClosing net asset value per share (p)Operating charges#
Share Class GClosing net asset value (£’000)Closing number of sharesClosing net asset value per share (p)Operating charges#
Share Class IClosing net asset value (£’000)Closing number of sharesClosing net asset value per share (p)Operating charges#∆
Share Class P*Closing net asset value (£’000)Closing number of sharesClosing net asset value per share (p)Operating charges#
HBOS Specialised Investment Funds ICVC
Fund of Investment Trusts
30/11/17 31/05/17 31/05/16
965.91 924.88 704.140.50% 0.50% 0.50%
24,691 24,059 19,1262,556,260 2,601,260 2,716,260
30/11/17 31/05/17 31/05/16
113.29 108.31 82.241.58% 1.58% 1.58%
39,601 40,216 33,60134,954,000 37,129,000 40,859,000
30/11/17 31/05/17 31/05/16
51.51 49.16 37.211.27% 1.26% 1.26%
21,970 22,960 18,62942,657,000 46,702,000 50,062,000
30/11/17 31/05/17 31/05/16
52.76 50.30 37.971.01% 1.01% 1.01%
154,576 153,404 125,351292,973,000 304,998,000 330,123,000
30/11/17 31/05/17 31/05/16
966.82 925.69 704.570.00% 0.00% 0.00%
167,912 169,777 143,10317,367,540 18,340,540 20,310,540
30/11/17 31/05/17
110.98 105.851.01% 1.01%
905 122815,000 115,000
#Operating charges are representative of the ongoing charges figure.∆Fees are payable by institutional investors in this share class to the ACD outside the Fund.*Share class launched on 21st February 2017.
63
Interim Report and Financial Statementsfor the six month period ended 30th November 2017 (unaudited)
Comparative table (continued)
HBOS Specialised Investment Funds ICVC
Fund of Investment Trusts
Share Class Q*Closing net asset value (£’000)Closing number of sharesClosing net asset value per share (p)Operating charges#
Share Class R*Closing net asset value (£’000)Closing number of sharesClosing net asset value per share (p)Operating charges#
30/11/17 31/05/17
111.26 105.940.76% 0.76%
2,242 3282,015,000 310,000
30/11/17 31/05/17
111.48 106.000.51% 0.51%
909 95815,000 90,000
#Operating charges are representative of the ongoing charges figure.*Share class launched on 21st February 2017.
64
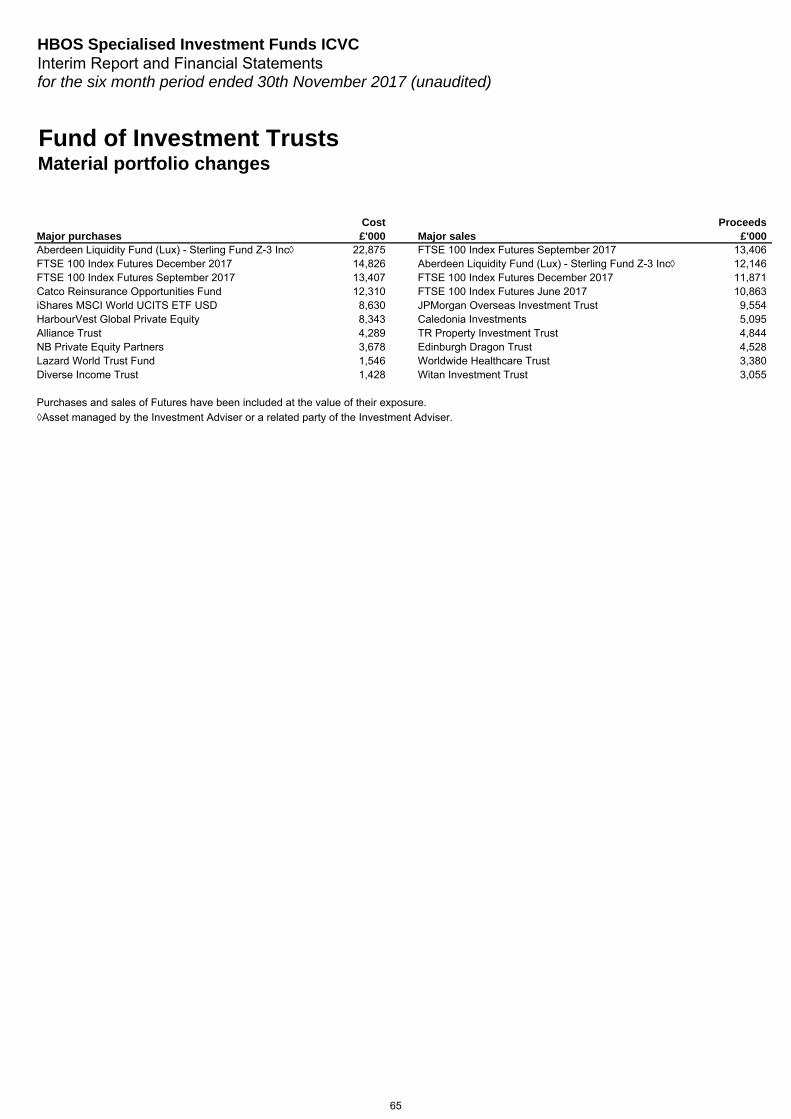
HBOS Specialised Investment Funds ICVCInterim Report and Financial Statementsfor the six month period ended 30th November 2017 (unaudited)
Fund of Investment TrustsMaterial portfolio changes
Cost ProceedsMajor purchases £'000 Major sales £'000 Aberdeen Liquidity Fund (Lux) - Sterling Fund Z-3 Inc◊ 22,875 FTSE 100 Index Futures September 2017 13,406FTSE 100 Index Futures December 2017 14,826 Aberdeen Liquidity Fund (Lux) - Sterling Fund Z-3 Inc◊ 12,146FTSE 100 Index Futures September 2017 13,407 FTSE 100 Index Futures December 2017 11,871Catco Reinsurance Opportunities Fund 12,310 FTSE 100 Index Futures June 2017 10,863iShares MSCI World UCITS ETF USD 8,630 JPMorgan Overseas Investment Trust 9,554HarbourVest Global Private Equity 8,343 Caledonia Investments 5,095Alliance Trust 4,289 TR Property Investment Trust 4,844NB Private Equity Partners 3,678 Edinburgh Dragon Trust 4,528Lazard World Trust Fund 1,546 Worldwide Healthcare Trust 3,380Diverse Income Trust 1,428 Witan Investment Trust 3,055
Purchases and sales of Futures have been included at the value of their exposure.◊Asset managed by the Investment Adviser or a related party of the Investment Adviser.
65
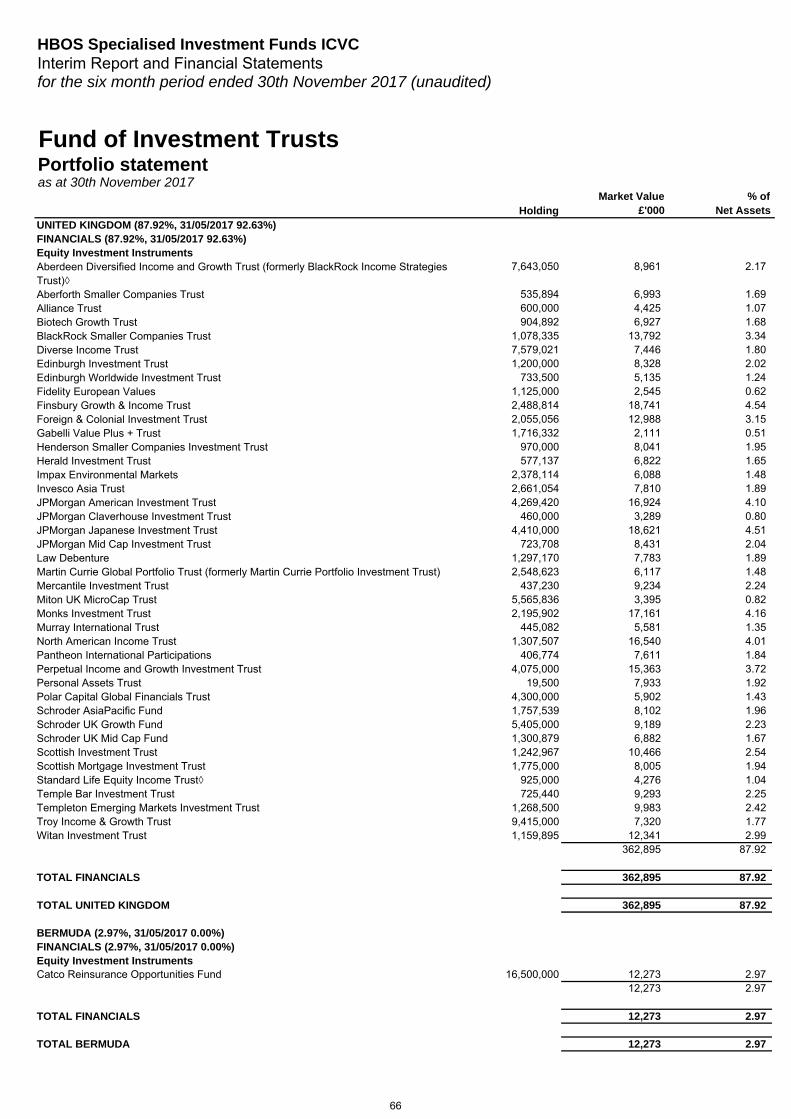
HBOS Specialised Investment Funds ICVCInterim Report and Financial Statementsfor the six month period ended 30th November 2017 (unaudited)
HoldingMarket Value
£'000% of
Net Assets
7,643,050 8,961 2.17
535,894 6,993 1.69600,000 4,425 1.07904,892 6,927 1.68
1,078,335 13,792 3.347,579,021 7,446 1.801,200,000 8,328 2.02
733,500 5,135 1.241,125,000 2,545 0.622,488,814 18,741 4.542,055,056 12,988 3.151,716,332 2,111 0.51
970,000 8,041 1.95577,137 6,822 1.65
2,378,114 6,088 1.482,661,054 7,810 1.894,269,420 16,924 4.10
460,000 3,289 0.804,410,000 18,621 4.51
723,708 8,431 2.041,297,170 7,783 1.892,548,623 6,117 1.48
437,230 9,234 2.245,565,836 3,395 0.822,195,902 17,161 4.16
445,082 5,581 1.351,307,507 16,540 4.01
406,774 7,611 1.844,075,000 15,363 3.72
19,500 7,933 1.924,300,000 5,902 1.431,757,539 8,102 1.965,405,000 9,189 2.231,300,879 6,882 1.671,242,967 10,466 2.541,775,000 8,005 1.94
925,000 4,276 1.04725,440 9,293 2.25
1,268,500 9,983 2.429,415,000 7,320 1.77
UNITED KINGDOM (87.92%, 31/05/2017 92.63%) FINANCIALS (87.92%, 31/05/2017 92.63%) Equity Investment InstrumentsAberdeen Diversified Income and Growth Trust (formerly BlackRock Income Strategies Trust)◊Aberforth Smaller Companies TrustAlliance TrustBiotech Growth TrustBlackRock Smaller Companies TrustDiverse Income TrustEdinburgh Investment TrustEdinburgh Worldwide Investment TrustFidelity European ValuesFinsbury Growth & Income TrustForeign & Colonial Investment TrustGabelli Value Plus + TrustHenderson Smaller Companies Investment TrustHerald Investment TrustImpax Environmental MarketsInvesco Asia TrustJPMorgan American Investment TrustJPMorgan Claverhouse Investment TrustJPMorgan Japanese Investment TrustJPMorgan Mid Cap Investment TrustLaw DebentureMartin Currie Global Portfolio Trust (formerly Martin Currie Portfolio Investment Trust) Mercantile Investment TrustMiton UK MicroCap TrustMonks Investment TrustMurray International TrustNorth American Income TrustPantheon International ParticipationsPerpetual Income and Growth Investment TrustPersonal Assets TrustPolar Capital Global Financials TrustSchroder AsiaPacific FundSchroder UK Growth FundSchroder UK Mid Cap FundScottish Investment TrustScottish Mortgage Investment TrustStandard Life Equity Income Trust◊Temple Bar Investment TrustTempleton Emerging Markets Investment TrustTroy Income & Growth TrustWitan Investment Trust 1,159,895 12,341 2.99
362,895 87.92
TOTAL FINANCIALS 362,895 87.92
TOTAL UNITED KINGDOM 362,895 87.92
BERMUDA (2.97%, 31/05/2017 0.00%) FINANCIALS (2.97%, 31/05/2017 0.00%) Equity Investment InstrumentsCatco Reinsurance Opportunities Fund 16,500,000 12,273 2.97
12,273 2.97
TOTAL FINANCIALS 12,273 2.97
TOTAL BERMUDA 12,273 2.97
Fund of Investment TrustsPortfolio statement as at 30th November 2017
66
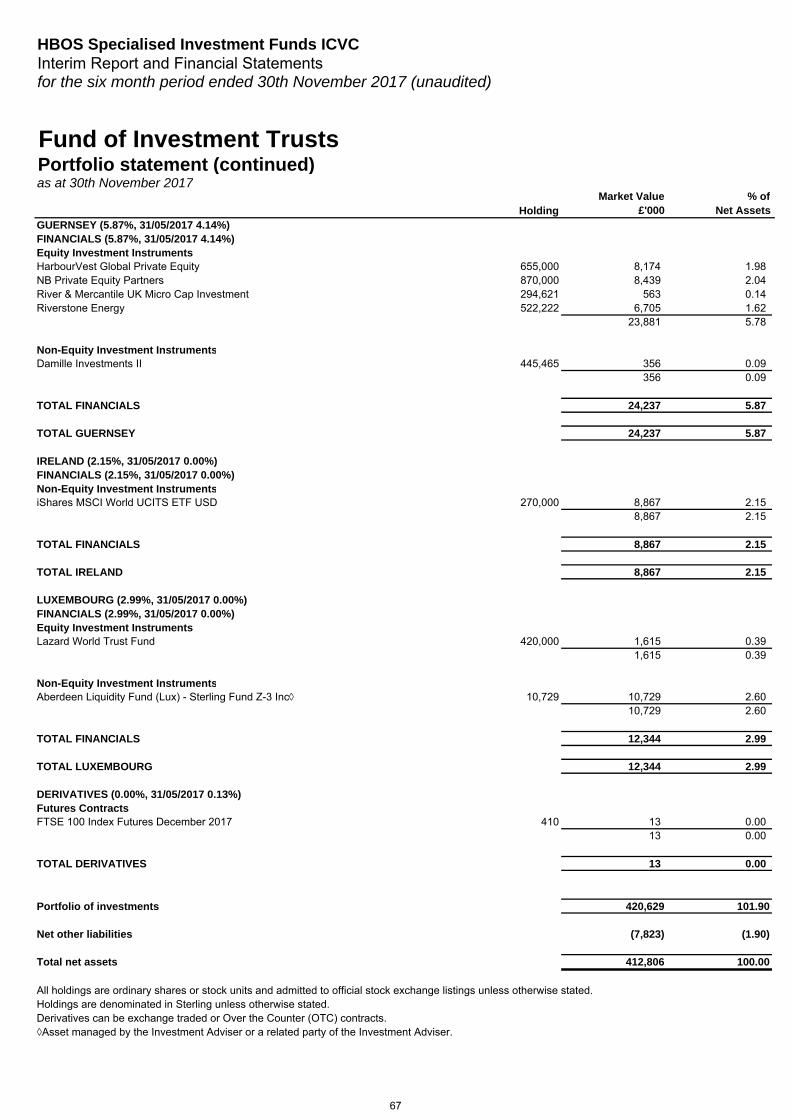
HBOS Specialised Investment Funds ICVCInterim Report and Financial Statementsfor the six month period ended 30th November 2017 (unaudited)
HoldingMarket Value
£'000% of
Net Assets
Fund of Investment TrustsPortfolio statement (continued)as at 30th November 2017
GUERNSEY (5.87%, 31/05/2017 4.14%) FINANCIALS (5.87%, 31/05/2017 4.14%) Equity Investment InstrumentsHarbourVest Global Private Equity 655,000 8,174 1.98NB Private Equity Partners 870,000 8,439 2.04River & Mercantile UK Micro Cap Investment 294,621 563 0.14Riverstone Energy 522,222 6,705 1.62
23,881 5.78
Non-Equity Investment InstrumentsDamille Investments II 445,465 356 0.09
356 0.09
TOTAL FINANCIALS 24,237 5.87
TOTAL GUERNSEY 24,237 5.87
IRELAND (2.15%, 31/05/2017 0.00%) FINANCIALS (2.15%, 31/05/2017 0.00%) Non-Equity Investment InstrumentsiShares MSCI World UCITS ETF USD 270,000 8,867 2.15
8,867 2.15
TOTAL FINANCIALS 8,867 2.15
TOTAL IRELAND 8,867 2.15
LUXEMBOURG (2.99%, 31/05/2017 0.00%) FINANCIALS (2.99%, 31/05/2017 0.00%) Equity Investment InstrumentsLazard World Trust Fund 420,000 1,615 0.39
1,615 0.39
Non-Equity Investment InstrumentsAberdeen Liquidity Fund (Lux) - Sterling Fund Z-3 Inc◊ 10,729 10,729 2.60
10,729 2.60
TOTAL FINANCIALS 12,344 2.99
TOTAL LUXEMBOURG 12,344 2.99
DERIVATIVES (0.00%, 31/05/2017 0.13%) Futures ContractsFTSE 100 Index Futures December 2017 410 13 0.00
13 0.00
TOTAL DERIVATIVES 13 0.00
Portfolio of investments 420,629 101.90
Net other liabilities (7,823) (1.90)
Total net assets 412,806 100.00
◊Asset managed by the Investment Adviser or a related party of the Investment Adviser.Derivatives can be exchange traded or Over the Counter (OTC) contracts.Holdings are denominated in Sterling unless otherwise stated.All holdings are ordinary shares or stock units and admitted to official stock exchange listings unless otherwise stated.
67

HBOS Specialised Investment Funds ICVCInterim Report and Financial Statementsfor the six month period ended 30th November 2017 (unaudited)
1) Global Data
Proportion of securities and commodities on loan as at 30th November 2017 £'000 % Total lendable assets excluding cash and cash equivalents: 338,571Securities and commodities on loan 19,248 5.69%
Assets engaged in SFTs and total return swaps as at 30th November 2017 £'000 % Fund assets under management (AUM) 416,004
Absolute value of assets engaged in:Securities lending 19,248 4.63%
2) Concentration Data
Top 10 collateral issuersName and value of collateral and commodities received as at 30th November 2017 £'000United States of America Treasury 1,042Federal Republic of Germany 1,020Government of United Kingdom 931Republic of France 582Banco Santander 466Eni 399NVIDIA 390Linde 321Humana 281Solaredge Technologies 275
Top 10 counterpartiesName and value of outstanding transactions as at 30th November 2017 £'000Securities lendingDeutsche Bank 7,449JP Morgan Securities 4,266Barclays Capital Securities 2,466UBS 2,096Credit Suisse Securities (Europe) 2,086Morgan Stanley International 744BMO Capital (UK) 90Citigroup Global Markets (UK) 51
Fund of Investment TrustsSecurities Financing Transactions (SFT) as at 30th November 2017
68

HBOS Specialised Investment Funds ICVCInterim Report and Financial Statementsfor the six month period ended 30th November 2017 (unaudited)
Securities Financing Transactions (SFT) (continued)Fund of Investment Trusts
as at 30th November 2017
3) Aggregate Transaction Data
Type, quality and currency of collateral as at 30th November 2017Type Quality Currency £'000Securities lendingEquity Traded on recognised exchange Sterling 677Equity Traded on recognised exchange Australian dollar 217Equity Traded on recognised exchange Canadian dollar 30Equity Traded on recognised exchange Chinese yuan 212Equity Traded on recognised exchange Danish krone 186Equity Traded on recognised exchange Euro 4,791Equity Traded on recognised exchange Hong Kong dollar 930Equity Traded on recognised exchange Japanese yen 1,490Equity Traded on recognised exchange Norwegian krone 383Equity Traded on recognised exchange Singapore dollar 11Equity Traded on recognised exchange Swedish krona 350Equity Traded on recognised exchange Swiss franc 145Equity Traded on recognised exchange US dollar 7,265Fixed Income Investment Grade Sterling 931Fixed Income Investment Grade Euro 2,206Fixed Income Investment Grade Swedish krona 17Fixed Income Investment Grade US dollar 1,042Total collateral held 20,883
Maturity tenor of collateral (remaining period to maturity) as at 30th November 2017
Type
Less than one day
£'000
One day to one week£'000
One week to one month
£'000
One to three
months£'000
Three months to
one year£'000
Above one year
£'000
Open maturity
£'000Total£'000
Securities lending - - 495 78 249 3,374 16,687 20,883- - 495 78 249 3,374 16,687 20,883
Counterparty details as at 30th November 2017
Type £'000Securities lending Germany Bi-lateral 111Securities lending United Kingdom Bi-lateral 96Securities lending Germany Tri-party 7,945Securities lending Switzerland Tri-party 2,263Securities lending United Kingdom Tri-party 10,468Total collateral held 20,883
Maturity tenor of SFTs and total return swaps (remaining period to maturity) as at 30th November 2017
Type
Less than one day
£'000
One day to one week£'000
One week to one month
£'000
One to three
months£'000
Three months to
one year£'000
Above one year
£'000
Open maturity
£'000Total£'000
Securities lending - - - - - - 19,248 19,248- - - - - - 19,248 19,248
4) Re-use of Collateral
The Fund does not engage in re-use of collateral.
Countries of counterparty establishment Settlement and clearing
69

HBOS Specialised Investment Funds ICVCInterim Report and Financial Statementsfor the six month period ended 30th November 2017 (unaudited)
Securities Financing Transactions (SFT) (continued)Fund of Investment Trusts
as at 30th November 2017
5) Safekeeping of Collateral Received
Names and value of custodians safekeeping collateral as at 30th November 2017 £'000JP Morgan 14,828Bank of New York 5,848State Street 207
Number of custodians safekeeping collateral 3
6) Safekeeping of Collateral Granted
The Fund does not borrow stock from counterparties; therefore, no collateral has been granted.
7) Return and Costfor the six month period ended 30th November 2017
Collective Investment Manager of Collective Third Parties Undertaking Investment Undertaking (e.g. lending agent) Total
£'000 £'000 £'000 £'000Securities lendingGross return 17 1 5 23% of total gross return 75% 5% 20% 100%Cost* - - - -
*All direct costs from securities lending are borne by lending agent.
70
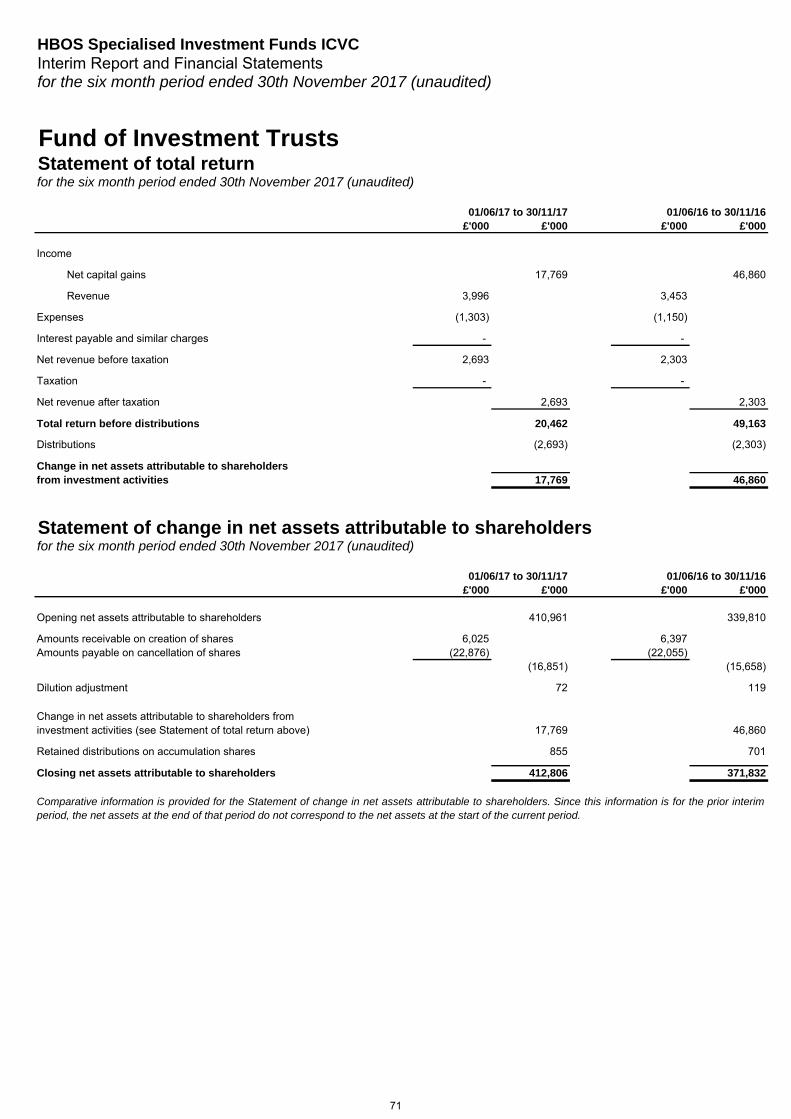
HBOS Specialised Investment Funds ICVCInterim Report and Financial Statementsfor the six month period ended 30th November 2017 (unaudited)
Fund of Investment TrustsStatement of total returnfor the six month period ended 30th November 2017 (unaudited)
01/06/17 to 30/11/17 01/06/16 to 30/11/16£'000 £'000 £'000 £'000
Income
Net capital gains 17,769 46,860
Revenue 3,996 3,453
Expenses (1,303) (1,150)
Interest payable and similar charges - -
Net revenue before taxation 2,693 2,303
Taxation - -
Net revenue after taxation 2,693 2,303
Total return before distributions 20,462 49,163
Distributions (2,693) (2,303)
Change in net assets attributable to shareholdersfrom investment activities 17,769 46,860
Statement of change in net assets attributable to shareholdersfor the six month period ended 30th November 2017 (unaudited)
01/06/17 to 30/11/17 01/06/16 to 30/11/16£'000 £'000 £'000 £'000
Opening net assets attributable to shareholders 410,961 339,810
Amounts receivable on creation of shares 6,025 6,397Amounts payable on cancellation of shares (22,876) (22,055)
(16,851) (15,658)
Dilution adjustment 72 119
Change in net assets attributable to shareholders frominvestment activities (see Statement of total return above) 17,769 46,860
Retained distributions on accumulation shares 855 701
Closing net assets attributable to shareholders 412,806 371,832
Comparative information is provided for the Statement of change in net assets attributable to shareholders. Since this information is for the prior interimperiod, the net assets at the end of that period do not correspond to the net assets at the start of the current period.
71

HBOS Specialised Investment Funds ICVCInterim Report and Financial Statementsfor the six month period ended 30th November 2017 (unaudited)
Fund of Investment TrustsBalance sheetas at 30th November 2017 (unaudited)
30/11/17 31/05/17£'000 £'000
ASSETSFixed assets:
Investments 420,629 398,237
Current assets:Debtors 1,497 665Cash and bank balances 5,631 14,824
Total assets 427,757 413,726
LIABILITIESCreditors
Distribution payable 1,769 1,733Other creditors 13,182 1,032
Total liabilities 14,951 2,765
Net assets attributable to shareholders 412,806 410,961
72
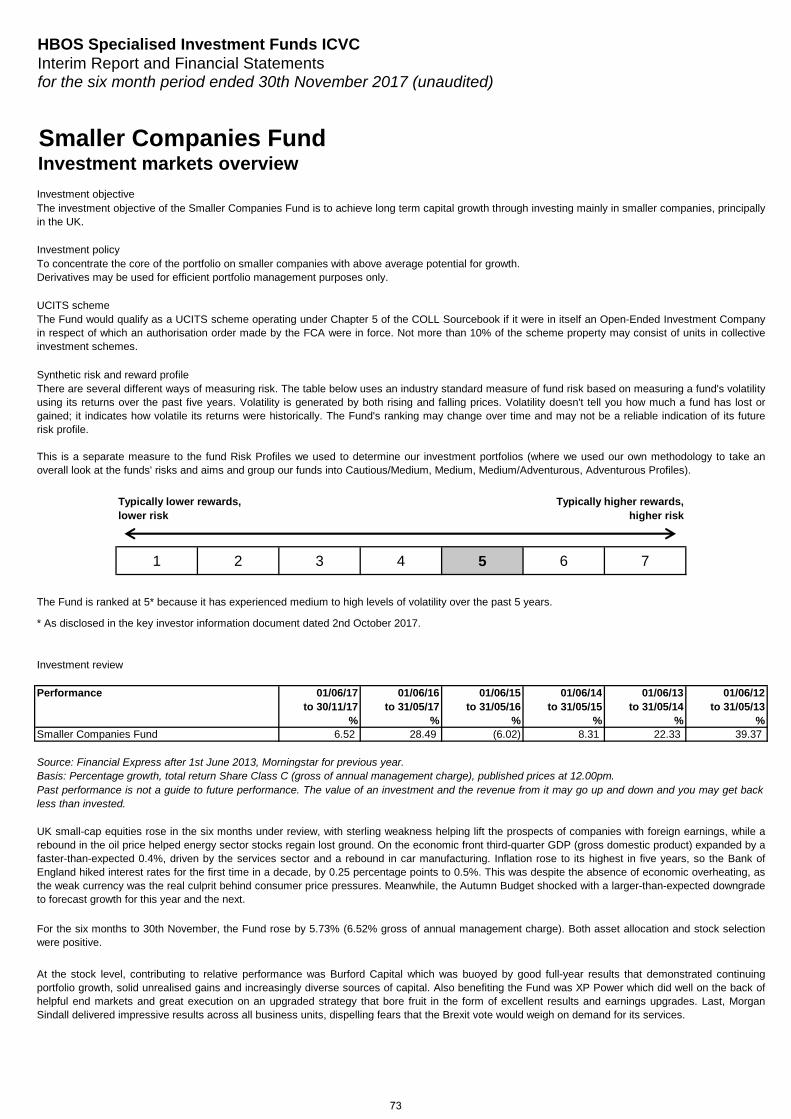
HBOS Specialised Investment Funds ICVCInterim Report and Financial Statementsfor the six month period ended 30th November 2017 (unaudited)
Smaller Companies FundInvestment markets overview
Investment objective
Investment policy
UCITS scheme
Synthetic risk and reward profile
1 2 3 4 5 6 7
Investment review
Performance 01/06/17 01/06/16 01/06/15 01/06/14 01/06/13 01/06/12to 30/11/17 to 31/05/17 to 31/05/16 to 31/05/15 to 31/05/14 to 31/05/13
% % % % % %6.52 28.49 (6.02) 8.31 22.33 39.37
UK small-cap equities rose in the six months under review, with sterling weakness helping lift the prospects of companies with foreign earnings, while arebound in the oil price helped energy sector stocks regain lost ground. On the economic front third-quarter GDP (gross domestic product) expanded by afaster-than-expected 0.4%, driven by the services sector and a rebound in car manufacturing. Inflation rose to its highest in five years, so the Bank ofEngland hiked interest rates for the first time in a decade, by 0.25 percentage points to 0.5%. This was despite the absence of economic overheating, asthe weak currency was the real culprit behind consumer price pressures. Meanwhile, the Autumn Budget shocked with a larger-than-expected downgradeto forecast growth for this year and the next.
For the six months to 30th November, the Fund rose by 5.73% (6.52% gross of annual management charge). Both asset allocation and stock selectionwere positive.
At the stock level, contributing to relative performance was Burford Capital which was buoyed by good full-year results that demonstrated continuingportfolio growth, solid unrealised gains and increasingly diverse sources of capital. Also benefiting the Fund was XP Power which did well on the back ofhelpful end markets and great execution on an upgraded strategy that bore fruit in the form of excellent results and earnings upgrades. Last, MorganSindall delivered impressive results across all business units, dispelling fears that the Brexit vote would weigh on demand for its services.
Source: Financial Express after 1st June 2013, Morningstar for previous year. Basis: Percentage growth, total return Share Class C (gross of annual management charge), published prices at 12.00pm.
The investment objective of the Smaller Companies Fund is to achieve long term capital growth through investing mainly in smaller companies, principallyin the UK.
To concentrate the core of the portfolio on smaller companies with above average potential for growth.Derivatives may be used for efficient portfolio management purposes only.
The Fund would qualify as a UCITS scheme operating under Chapter 5 of the COLL Sourcebook if it were in itself an Open-Ended Investment Companyin respect of which an authorisation order made by the FCA were in force. Not more than 10% of the scheme property may consist of units in collectiveinvestment schemes.
Typically lower rewards,lower risk
Typically higher rewards,higher risk
Past performance is not a guide to future performance. The value of an investment and the revenue from it may go up and down and you may get backless than invested.
Smaller Companies Fund
The Fund is ranked at 5* because it has experienced medium to high levels of volatility over the past 5 years.
* As disclosed in the key investor information document dated 2nd October 2017.
There are several different ways of measuring risk. The table below uses an industry standard measure of fund risk based on measuring a fund's volatilityusing its returns over the past five years. Volatility is generated by both rising and falling prices. Volatility doesn't tell you how much a fund has lost orgained; it indicates how volatile its returns were historically. The Fund's ranking may change over time and may not be a reliable indication of its futurerisk profile.
This is a separate measure to the fund Risk Profiles we used to determine our investment portfolios (where we used our own methodology to take anoverall look at the funds' risks and aims and group our funds into Cautious/Medium, Medium, Medium/Adventurous, Adventurous Profiles).
73
HBOS Specialised Investment Funds ICVCInterim Report and Financial Statementsfor the six month period ended 30th November 2017 (unaudited)
Smaller Companies FundInvestment markets overview (continued)
While recognising that we are not immune to these dynamics, we do however maintain the view that the underlying strength of our holdings will outweighthe broader environment in the long term, hence, our consistent approach to identify companies that possess the best diversified earnings streams,superior business models and healthy balance sheets at attractive valuations.
Aberdeen Asset Investments LimitedDecember 2017
Looking ahead, though a robust global economy continues to support economic activity, there remains uncertainty about the shape of Brexit negotiations, while a rise in inflation as a result of sterling’s weakness continues to push up the cost of imports. Indeed, acknowledging a weak economic outlook, the Bank of England decided to take interest rates to 0.5% in November, with the MPC also flagging that further modest increases might be warranted in the coming years to keep inflation to sustainable levels.
Capping gains were an overweight to Interserve as its shares weakened after another profit warning, with performance dampened by weak trading, costoverruns on contracts and delayed expected recoveries in some areas. Also costing the Fund was an overweight position in Ultra Electronics, as itsshares suffered from disappointing organic growth and worries over contract wins and execution. Finally, an overweight position in Dignity detracted fromperformance due to investor concerns over heightened market competition.
Investment review (continued)
74

Interim Report and Financial Statementsfor the six month period ended 30th November 2017 (unaudited)
Comparative table
Share Class AClosing net asset value (£’000)Closing number of sharesClosing net asset value per share (p)Operating charges#
Share Class CClosing net asset value (£’000)Closing number of sharesClosing net asset value per share (p)Operating charges#
Share Class FClosing net asset value (£’000)Closing number of sharesClosing net asset value per share (p)Operating charges#
Share Class GClosing net asset value (£’000)Closing number of sharesClosing net asset value per share (p)Operating charges#
Share Class IClosing net asset value (£’000)Closing number of sharesClosing net asset value per share (p)Operating charges#∆
Share Class P*Closing net asset value (£’000)Closing number of sharesClosing net asset value per share (p)Operating charges#
HBOS Specialised Investment Funds ICVC
Smaller Companies Fund
30/11/17 31/05/17 31/05/16
233.74 220.97 175.830.50% 0.50% 0.50%
7,182 6,955 5,9133,072,516 3,147,516 3,362,516
30/11/17 31/05/17 31/05/16
110.86 104.60 82.411.61% 1.63% 1.61%
22,398 22,812 20,26820,204,000 21,809,000 24,594,000
30/11/17 31/05/17 31/05/16
57.84 54.49 42.791.27% 1.27% 1.28%
14,948 16,917 14,66125,843,000 31,048,000 34,263,000
30/11/17 31/05/17 31/05/16
58.03 54.58 42.721.01% 1.01% 1.01%
5,586 5,833 31,7989,627,000 10,687,000 74,432,000
30/11/17 31/05/17 31/05/16
233.93 221.14 175.930.00% 0.00% 0.00%
118,175 122,019 101,91150,516,702 55,176,702 57,926,702
30/11/17 31/05/17
117.82 110.971.01% 1.01%
943 105800,000 95,000
*Share class launched on 21st February 2017.#Operating charges are representative of the ongoing charges figure.∆Fees are payable by institutional investors in this share class to the ACD outside the Fund.
75

Interim Report and Financial Statementsfor the six month period ended 30th November 2017 (unaudited)
Comparative table (continued)
HBOS Specialised Investment Funds ICVC
Smaller Companies Fund
Share Class Q*Closing net asset value (£’000)Closing number of sharesClosing net asset value per share (p)Operating charges#
Share Class R*Closing net asset value (£’000)Closing number of sharesClosing net asset value per share (p)Operating charges#
30/11/17 31/05/17
118.18 111.070.76% 0.76%
2,612 4392,210,000 395,000
30/11/17 31/05/17
118.41 111.140.51% 0.52%
1,474 1941,245,000 175,000
*Share class launched on 21st February 2017.#Operating charges are representative of the ongoing charges figure.
76
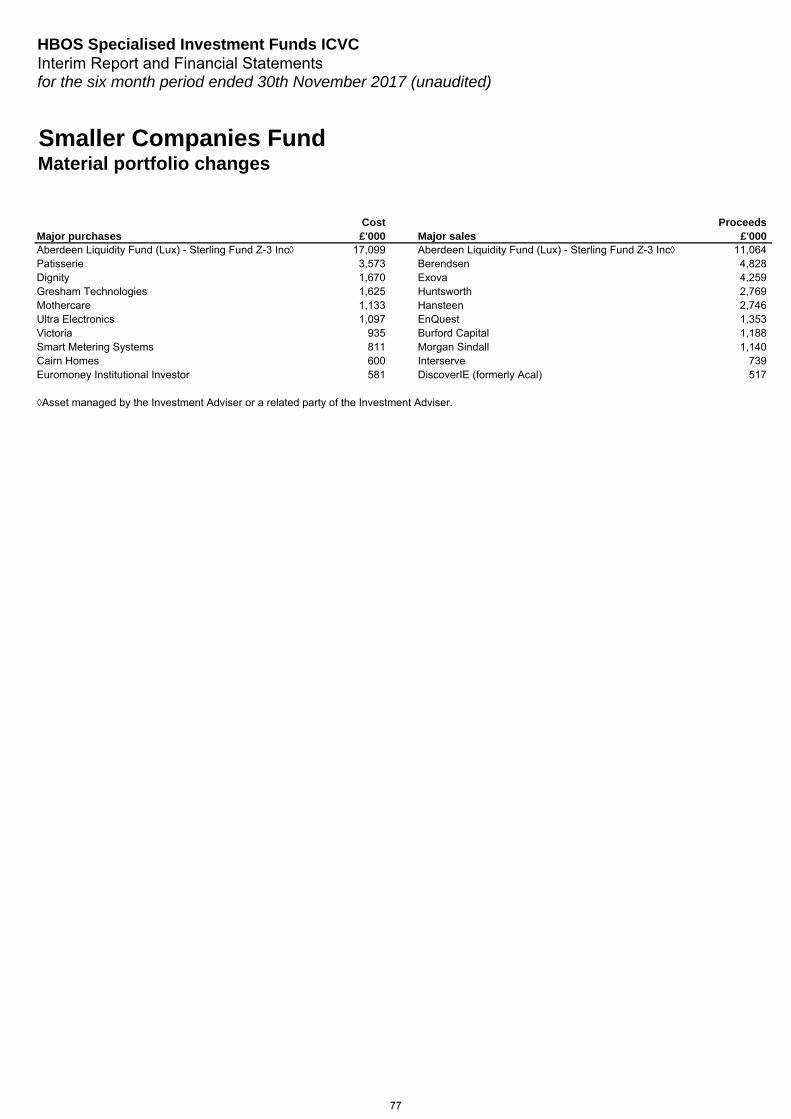
HBOS Specialised Investment Funds ICVCInterim Report and Financial Statementsfor the six month period ended 30th November 2017 (unaudited)
Smaller Companies FundMaterial portfolio changes
Cost ProceedsMajor purchases £'000 Major sales £'000 Aberdeen Liquidity Fund (Lux) - Sterling Fund Z-3 Inc◊ 17,099 Aberdeen Liquidity Fund (Lux) - Sterling Fund Z-3 Inc◊ 11,064Patisserie 3,573 Berendsen 4,828Dignity 1,670 Exova 4,259Gresham Technologies 1,625 Huntsworth 2,769Mothercare 1,133 Hansteen 2,746Ultra Electronics 1,097 EnQuest 1,353Victoria 935 Burford Capital 1,188Smart Metering Systems 811 Morgan Sindall 1,140Cairn Homes 600 Interserve 739Euromoney Institutional Investor 581 DiscoverIE (formerly Acal) 517
◊Asset managed by the Investment Adviser or a related party of the Investment Adviser.
77
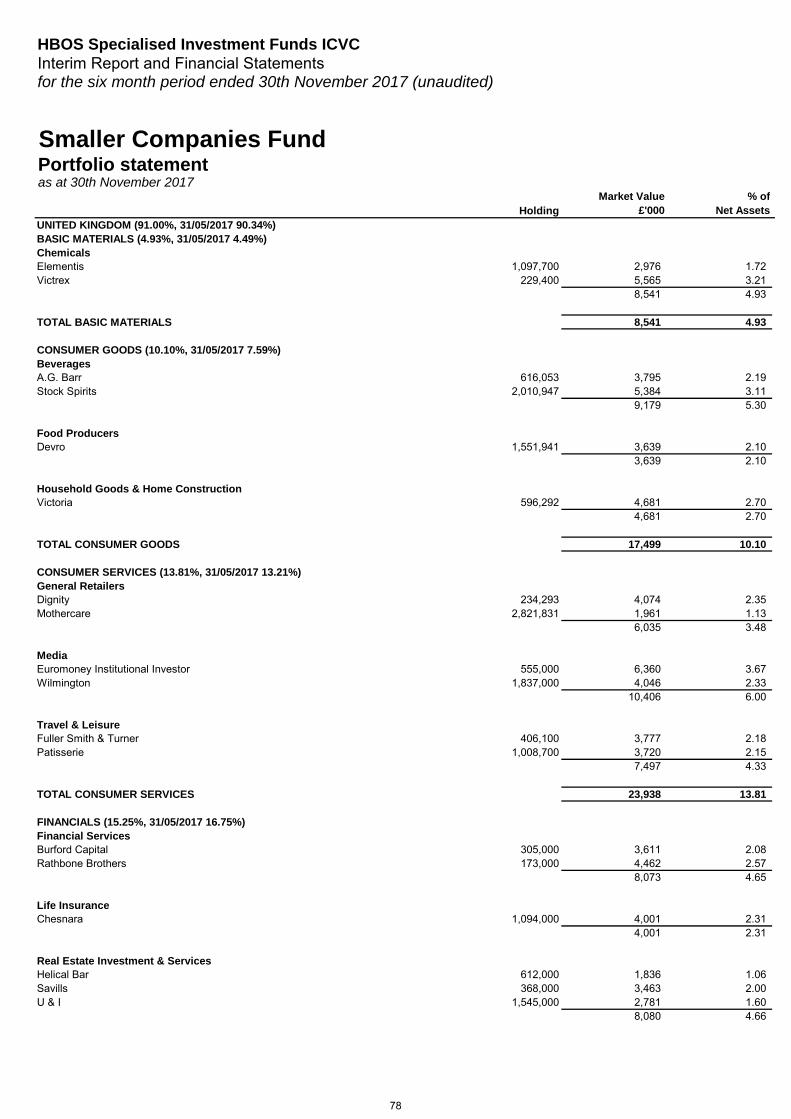
HBOS Specialised Investment Funds ICVCInterim Report and Financial Statementsfor the six month period ended 30th November 2017 (unaudited)
HoldingMarket Value
£'000% of
Net AssetsUNITED KINGDOM (91.00%, 31/05/2017 90.34%) BASIC MATERIALS (4.93%, 31/05/2017 4.49%) ChemicalsElementis 1,097,700 2,976 1.72Victrex 229,400 5,565 3.21
8,541 4.93
TOTAL BASIC MATERIALS 8,541 4.93
CONSUMER GOODS (10.10%, 31/05/2017 7.59%) BeveragesA.G. Barr 616,053 3,795 2.19Stock Spirits 2,010,947 5,384 3.11
9,179 5.30
Food ProducersDevro 1,551,941 3,639 2.10
3,639 2.10
Household Goods & Home ConstructionVictoria 596,292 4,681 2.70
4,681 2.70
TOTAL CONSUMER GOODS 17,499 10.10
CONSUMER SERVICES (13.81%, 31/05/2017 13.21%) General RetailersDignity 234,293 4,074 2.35Mothercare 2,821,831 1,961 1.13
6,035 3.48
MediaEuromoney Institutional Investor 555,000 6,360 3.67Wilmington 1,837,000 4,046 2.33
10,406 6.00
Travel & LeisureFuller Smith & Turner 406,100 3,777 2.18Patisserie 1,008,700 3,720 2.15
7,497 4.33
TOTAL CONSUMER SERVICES 23,938 13.81
FINANCIALS (15.25%, 31/05/2017 16.75%) Financial ServicesBurford Capital 305,000 3,611 2.08Rathbone Brothers 173,000 4,462 2.57
8,073 4.65
Life InsuranceChesnara 1,094,000 4,001 2.31
4,001 2.31
Real Estate Investment & ServicesHelical Bar 612,000 1,836 1.06Savills 368,000 3,463 2.00U & I 1,545,000 2,781 1.60
8,080 4.66
Smaller Companies FundPortfolio statement as at 30th November 2017
78

HBOS Specialised Investment Funds ICVCInterim Report and Financial Statementsfor the six month period ended 30th November 2017 (unaudited)
HoldingMarket Value
£'000% of
Net Assets
Smaller Companies FundPortfolio statement (continued)as at 30th November 2017
6,068,104 3,589 2.071,103,291 - 0.00
UNITED KINGDOM (continued) FINANCIALS (continued) Real Estate Investment Trusts AssuraAssura (open offer)*Hansteen 1,961,501 2,711 1.56
6,300 3.63
TOTAL FINANCIALS 26,454 15.25
HEALTH CARE (9.69%, 31/05/2017 8.06%) Pharmaceuticals & BiotechnologyAbcam 410,000 4,038 2.33Dechra Pharmaceuticals 330,000 7,326 4.23Genus 238,537 5,427 3.13
16,791 9.69
TOTAL HEALTH CARE 16,791 9.69
INDUSTRIALS (32.26%, 31/05/2017 36.45%) Aerospace & DefenceUltra Electronics 287,227 3,702 2.14
3,702 2.14
Construction & MaterialsKeller 302,737 2,894 1.67Morgan Sindall 318,400 4,372 2.52
7,266 4.19
Electronic & Electrical EquipmentDiscoverIE (formerly Acal) 1,612,577 5,322 3.07Oxford Instruments 471,300 4,180 2.41TT Electronics 727,500 1,717 0.99Xaar 910,020 3,403 1.96
14,622 8.43
General IndustrialsRPC 505,300 4,699 2.71
4,699 2.71
Industrial EngineeringFenner 1,231,000 4,786 2.76
4,786 2.76
Industrial TransportationBBA Aviation 1,445,000 4,832 2.79James Fisher & Sons 236,590 3,788 2.19
8,620 4.98
Support ServicesRobert Walters 808,397 4,802 2.77Smart Metering Systems 959,219 7,415 4.28
12,217 7.05
TOTAL INDUSTRIALS 55,912 32.26
79
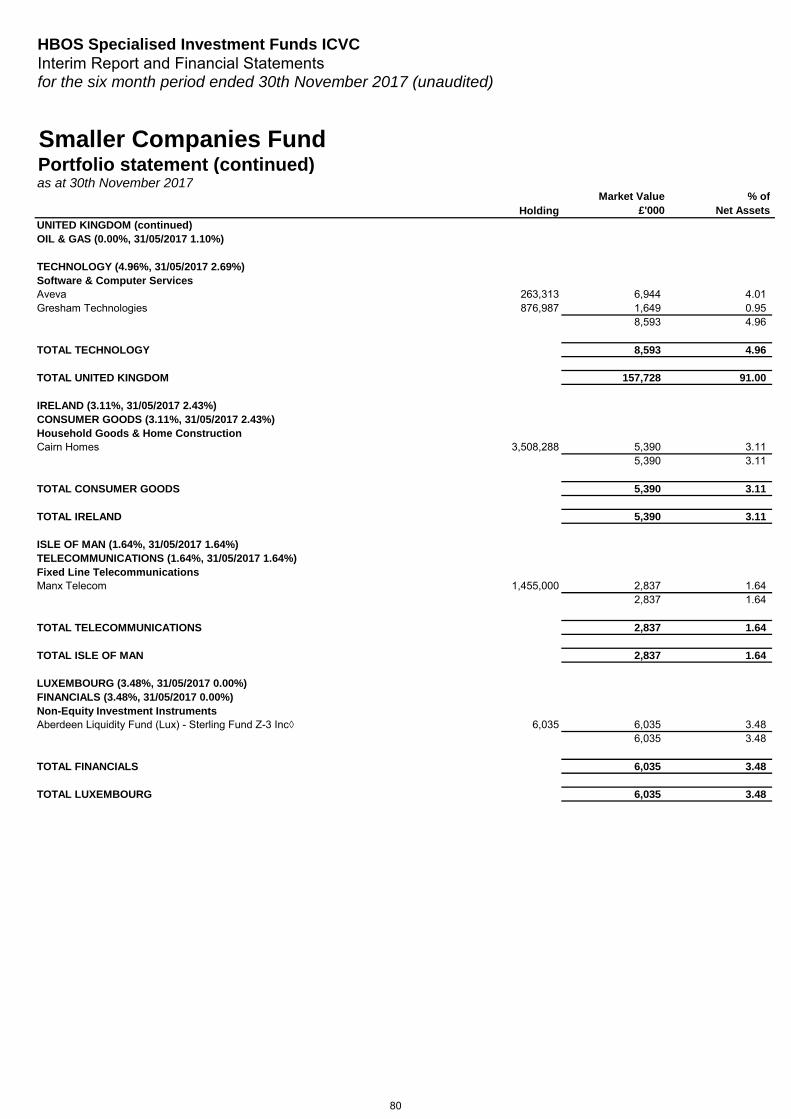
HBOS Specialised Investment Funds ICVCInterim Report and Financial Statementsfor the six month period ended 30th November 2017 (unaudited)
HoldingMarket Value
£'000% of
Net Assets
Smaller Companies FundPortfolio statement (continued)as at 30th November 2017
UNITED KINGDOM (continued) OIL & GAS (0.00%, 31/05/2017 1.10%)
TECHNOLOGY (4.96%, 31/05/2017 2.69%) Software & Computer ServicesAveva 263,313 6,944 4.01Gresham Technologies 876,987 1,649 0.95
8,593 4.96
TOTAL TECHNOLOGY 8,593 4.96
TOTAL UNITED KINGDOM 157,728 91.00
IRELAND (3.11%, 31/05/2017 2.43%) CONSUMER GOODS (3.11%, 31/05/2017 2.43%) Household Goods & Home Construction Cairn Homes 3,508,288 5,390 3.11
5,390 3.11
TOTAL CONSUMER GOODS 5,390 3.11
TOTAL IRELAND 5,390 3.11
ISLE OF MAN (1.64%, 31/05/2017 1.64%) TELECOMMUNICATIONS (1.64%, 31/05/2017 1.64%) Fixed Line TelecommunicationsManx Telecom 1,455,000 2,837 1.64
2,837 1.64
TOTAL TELECOMMUNICATIONS 2,837 1.64
TOTAL ISLE OF MAN 2,837 1.64
LUXEMBOURG (3.48%, 31/05/2017 0.00%) FINANCIALS (3.48%, 31/05/2017 0.00%) Non-Equity Investment InstrumentsAberdeen Liquidity Fund (Lux) - Sterling Fund Z-3 Inc◊ 6,035 6,035 3.48
6,035 3.48
TOTAL FINANCIALS 6,035 3.48
TOTAL LUXEMBOURG 6,035 3.48
80
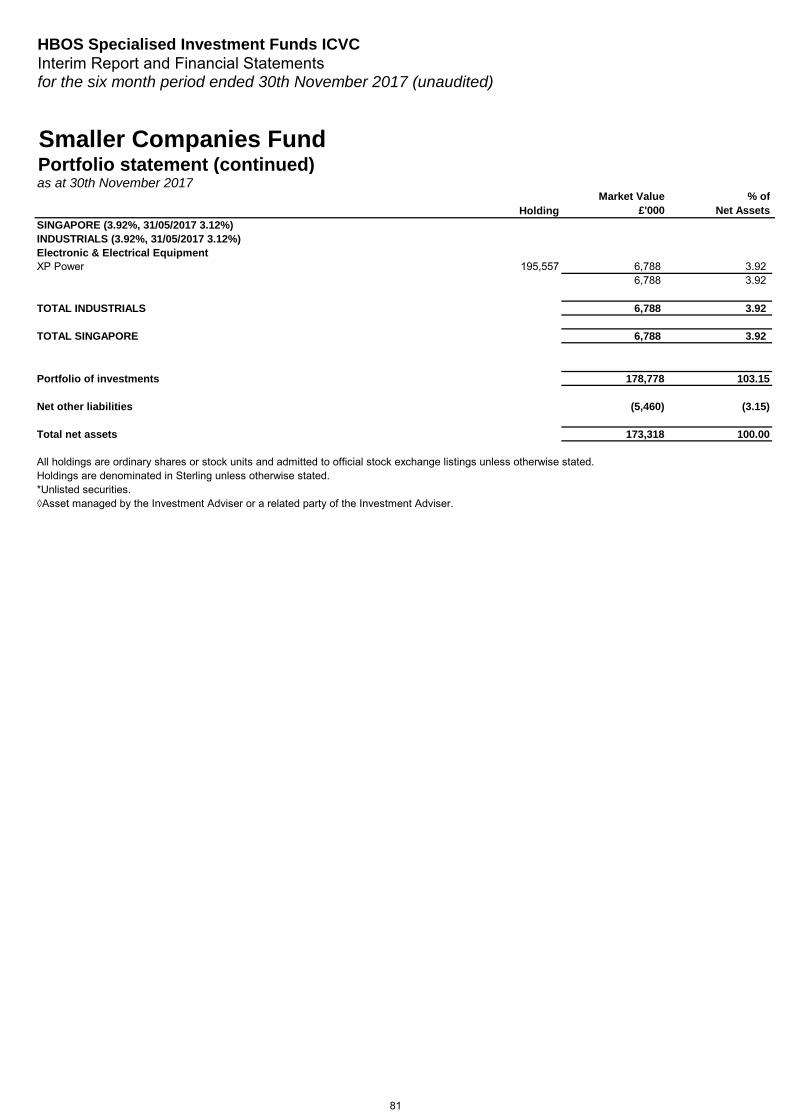
HBOS Specialised Investment Funds ICVCInterim Report and Financial Statementsfor the six month period ended 30th November 2017 (unaudited)
HoldingMarket Value
£'000% of
Net Assets
Smaller Companies FundPortfolio statement (continued)as at 30th November 2017
SINGAPORE (3.92%, 31/05/2017 3.12%) INDUSTRIALS (3.92%, 31/05/2017 3.12%) Electronic & Electrical EquipmentXP Power 195,557 6,788 3.92
6,788 3.92
TOTAL INDUSTRIALS 6,788 3.92
TOTAL SINGAPORE 6,788 3.92
Portfolio of investments 178,778 103.15
Net other liabilities (5,460) (3.15)
Total net assets 173,318 100.00
◊Asset managed by the Investment Adviser or a related party of the Investment Adviser.*Unlisted securities.Holdings are denominated in Sterling unless otherwise stated.All holdings are ordinary shares or stock units and admitted to official stock exchange listings unless otherwise stated.
81
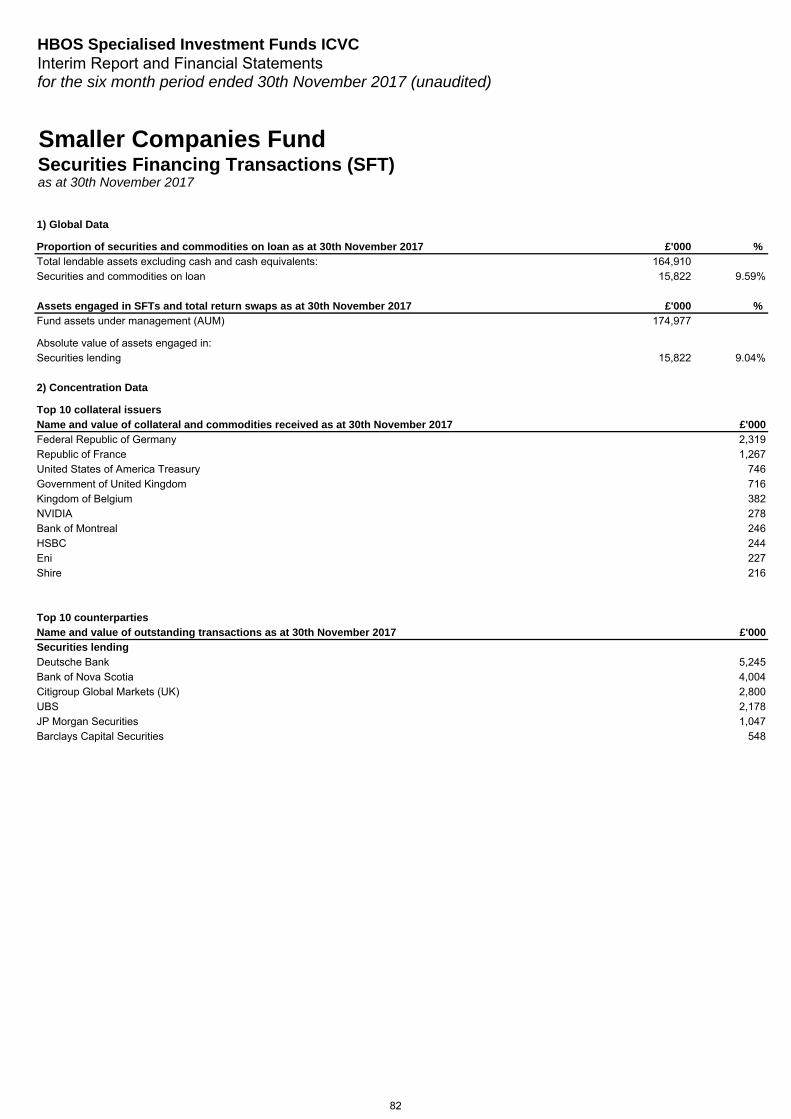
HBOS Specialised Investment Funds ICVCInterim Report and Financial Statementsfor the six month period ended 30th November 2017 (unaudited)
1) Global Data
Proportion of securities and commodities on loan as at 30th November 2017 £'000 % Total lendable assets excluding cash and cash equivalents: 164,910Securities and commodities on loan 15,822 9.59%
Assets engaged in SFTs and total return swaps as at 30th November 2017 £'000 % Fund assets under management (AUM) 174,977
Absolute value of assets engaged in:Securities lending 15,822 9.04%
2) Concentration Data
Top 10 collateral issuersName and value of collateral and commodities received as at 30th November 2017 £'000Federal Republic of Germany 2,319Republic of France 1,267United States of America Treasury 746Government of United Kingdom 716Kingdom of Belgium 382NVIDIA 278Bank of Montreal 246HSBC 244Eni 227Shire 216
Top 10 counterpartiesName and value of outstanding transactions as at 30th November 2017 £'000Securities lendingDeutsche Bank 5,245Bank of Nova Scotia 4,004Citigroup Global Markets (UK) 2,800UBS 2,178JP Morgan Securities 1,047Barclays Capital Securities 548
Smaller Companies FundSecurities Financing Transactions (SFT) as at 30th November 2017
82
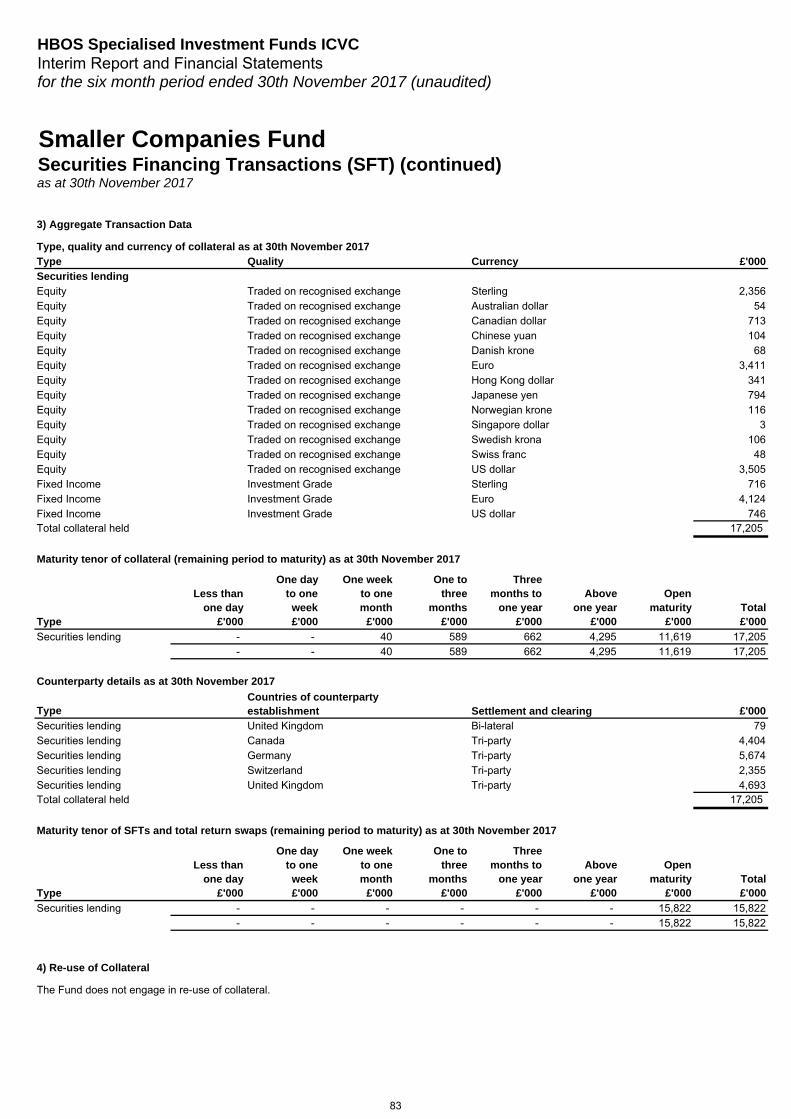
HBOS Specialised Investment Funds ICVCInterim Report and Financial Statementsfor the six month period ended 30th November 2017 (unaudited)
Securities Financing Transactions (SFT) (continued)Smaller Companies Fund
as at 30th November 2017
3) Aggregate Transaction Data
Type, quality and currency of collateral as at 30th November 2017Type Quality Currency £'000Securities lendingEquity Traded on recognised exchange Sterling 2,356Equity Traded on recognised exchange Australian dollar 54Equity Traded on recognised exchange Canadian dollar 713Equity Traded on recognised exchange Chinese yuan 104Equity Traded on recognised exchange Danish krone 68Equity Traded on recognised exchange Euro 3,411Equity Traded on recognised exchange Hong Kong dollar 341Equity Traded on recognised exchange Japanese yen 794Equity Traded on recognised exchange Norwegian krone 116Equity Traded on recognised exchange Singapore dollar 3Equity Traded on recognised exchange Swedish krona 106Equity Traded on recognised exchange Swiss franc 48Equity Traded on recognised exchange US dollar 3,505Fixed Income Investment Grade Sterling 716Fixed Income Investment Grade Euro 4,124Fixed Income Investment Grade US dollar 746Total collateral held 17,205
Maturity tenor of collateral (remaining period to maturity) as at 30th November 2017
Type
Less than one day
£'000
One day to one week£'000
One week to one month
£'000
One to three
months£'000
Three months to
one year£'000
Above one year
£'000
Open maturity
£'000Total£'000
Securities lending - - 40 589 662 4,295 11,619 17,205- - 40 589 662 4,295 11,619 17,205
Counterparty details as at 30th November 2017
Type £'000Securities lending United Kingdom Bi-lateral 79Securities lending Canada Tri-party 4,404Securities lending Germany Tri-party 5,674Securities lending Switzerland Tri-party 2,355Securities lending United Kingdom Tri-party 4,693Total collateral held 17,205
Maturity tenor of SFTs and total return swaps (remaining period to maturity) as at 30th November 2017
Type
Less than one day
£'000
One day to one week£'000
One week to one month
£'000
One to three
months£'000
Three months to
one year£'000
Above one year
£'000
Open maturity
£'000Total£'000
Securities lending - - - - - - 15,822 15,822- - - - - - 15,822 15,822
4) Re-use of Collateral
The Fund does not engage in re-use of collateral.
Countries of counterparty establishment Settlement and clearing
83
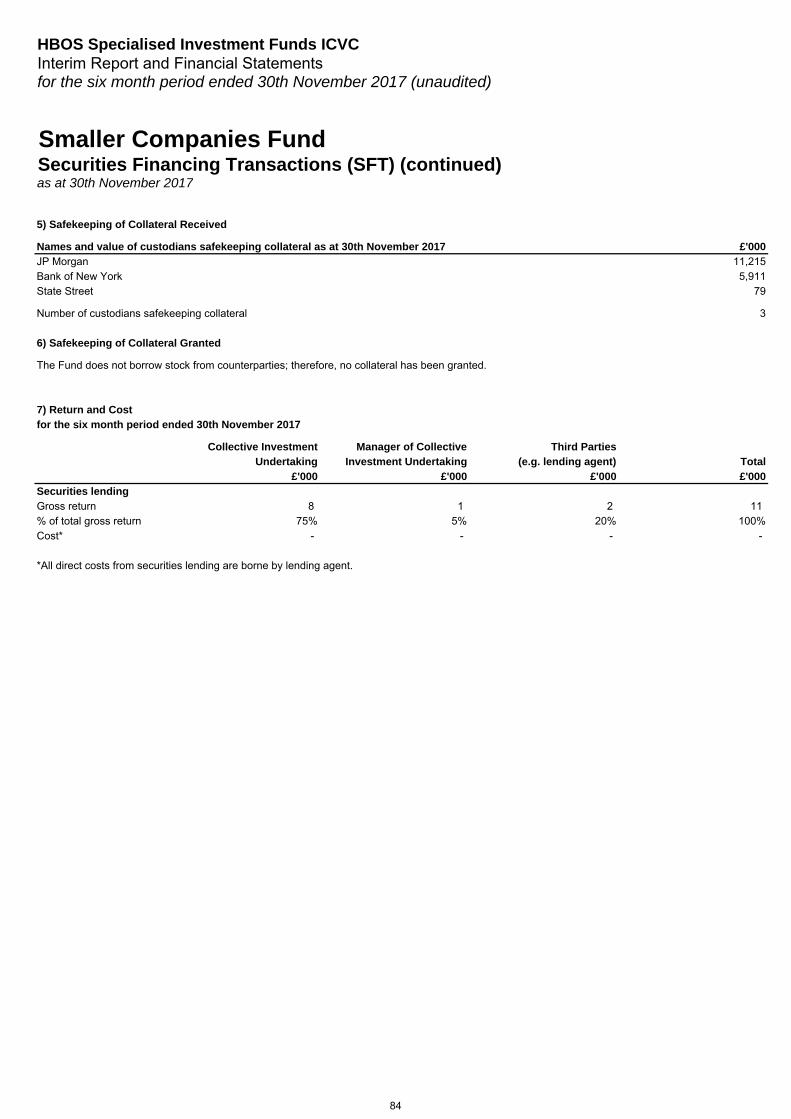
HBOS Specialised Investment Funds ICVCInterim Report and Financial Statementsfor the six month period ended 30th November 2017 (unaudited)
Securities Financing Transactions (SFT) (continued)Smaller Companies Fund
as at 30th November 2017
5) Safekeeping of Collateral Received
Names and value of custodians safekeeping collateral as at 30th November 2017 £'000JP Morgan 11,215Bank of New York 5,911State Street 79
Number of custodians safekeeping collateral 3
6) Safekeeping of Collateral Granted
The Fund does not borrow stock from counterparties; therefore, no collateral has been granted.
7) Return and Costfor the six month period ended 30th November 2017
Collective Investment Manager of Collective Third Parties Undertaking Investment Undertaking (e.g. lending agent) Total
£'000 £'000 £'000 £'000Securities lendingGross return 8 1 2 11% of total gross return 75% 5% 20% 100%Cost* - - - -
*All direct costs from securities lending are borne by lending agent.
84

HBOS Specialised Investment Funds ICVCInterim Report and Financial Statementsfor the six month period ended 30th November 2017 (unaudited)
Smaller Companies FundStatement of total returnfor the six month period ended 30th November 2017 (unaudited)
01/06/17 to 30/11/17 01/06/16 to 30/11/16£'000 £'000 £'000 £'000
Income
Net capital gains 9,294 6,258
Revenue 1,728 1,856
Expenses (339) (343)
Interest payable and similar charges - -
Net revenue before taxation 1,389 1,513
Taxation - -
Net revenue after taxation 1,389 1,513
Total return before distributions 10,683 7,771
Distributions (1,389) (1,513)
Change in net assets attributable to shareholdersfrom investment activities 9,294 6,258
Statement of change in net assets attributable to shareholdersfor the six month period ended 30th November 2017 (unaudited)
01/06/17 to 30/11/17 01/06/16 to 30/11/16£'000 £'000 £'000 £'000
Opening net assets attributable to shareholders 175,274 174,551
Amounts receivable on creation of shares 14,774 3,536Amounts payable on cancellation of shares (26,342) (39,593)
(11,568) (36,057)
Dilution adjustment 157 196
Change in net assets attributable to shareholders frominvestment activities (see Statement of total return above) 9,294 6,258
Retained distributions on accumulation shares 161 197
Closing net assets attributable to shareholders 173,318 145,145
Comparative information is provided for the Statement of change in net assets attributable to shareholders. Since this information is for the prior interimperiod, the net assets at the end of that period do not correspond to the net assets at the start of the current period.
85

HBOS Specialised Investment Funds ICVCInterim Report and Financial Statementsfor the six month period ended 30th November 2017 (unaudited)
Smaller Companies FundBalance sheetas at 30th November 2017 (unaudited)
30/11/17 31/05/17£'000 £'000
ASSETSFixed assets:
Investments 178,778 170,947
Current assets:Debtors 260 639Cash and bank balances 269 5,614
Total assets 179,307 177,200
LIABILITIESCreditors
Distribution payable 1,191 1,726Other creditors 4,798 200
Total liabilities 5,989 1,926
Net assets attributable to shareholders 173,318 175,274
86
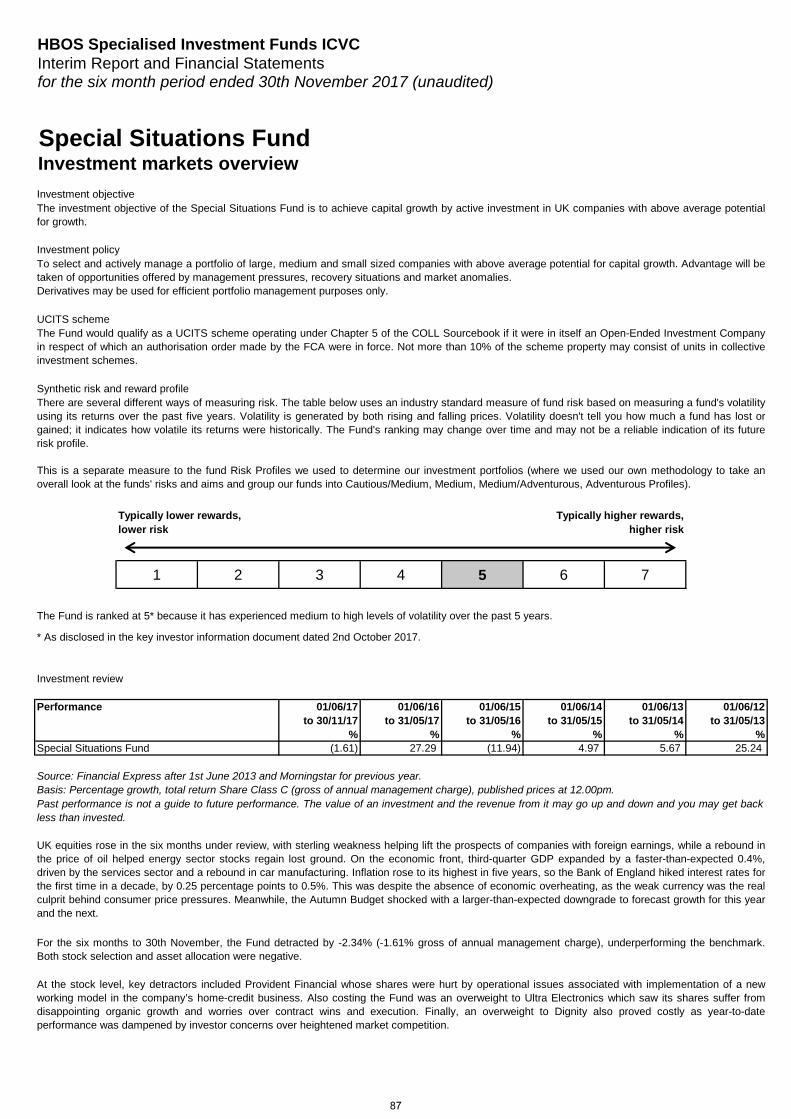
HBOS Specialised Investment Funds ICVCInterim Report and Financial Statementsfor the six month period ended 30th November 2017 (unaudited)
Special Situations FundInvestment markets overview
Investment objective
Investment policy
UCITS scheme
Synthetic risk and reward profile
1 2 3 4 5 6 7
Investment review
Performance 01/06/17 01/06/16 01/06/15 01/06/14 01/06/13 01/06/12to 30/11/17 to 31/05/17 to 31/05/16 to 31/05/15 to 31/05/14 to 31/05/13
% % % % % %(1.61) 27.29 (11.94) 4.97 5.67 25.24
UK equities rose in the six months under review, with sterling weakness helping lift the prospects of companies with foreign earnings, while a rebound inthe price of oil helped energy sector stocks regain lost ground. On the economic front, third-quarter GDP expanded by a faster-than-expected 0.4%,driven by the services sector and a rebound in car manufacturing. Inflation rose to its highest in five years, so the Bank of England hiked interest rates forthe first time in a decade, by 0.25 percentage points to 0.5%. This was despite the absence of economic overheating, as the weak currency was the realculprit behind consumer price pressures. Meanwhile, the Autumn Budget shocked with a larger-than-expected downgrade to forecast growth for this yearand the next.
For the six months to 30th November, the Fund detracted by -2.34% (-1.61% gross of annual management charge), underperforming the benchmark.Both stock selection and asset allocation were negative.
At the stock level, key detractors included Provident Financial whose shares were hurt by operational issues associated with implementation of a newworking model in the company’s home-credit business. Also costing the Fund was an overweight to Ultra Electronics which saw its shares suffer fromdisappointing organic growth and worries over contract wins and execution. Finally, an overweight to Dignity also proved costly as year-to-dateperformance was dampened by investor concerns over heightened market competition.
Source: Financial Express after 1st June 2013 and Morningstar for previous year.Basis: Percentage growth, total return Share Class C (gross of annual management charge), published prices at 12.00pm.
The investment objective of the Special Situations Fund is to achieve capital growth by active investment in UK companies with above average potentialfor growth.
To select and actively manage a portfolio of large, medium and small sized companies with above average potential for capital growth. Advantage will betaken of opportunities offered by management pressures, recovery situations and market anomalies. Derivatives may be used for efficient portfolio management purposes only.
The Fund would qualify as a UCITS scheme operating under Chapter 5 of the COLL Sourcebook if it were in itself an Open-Ended Investment Companyin respect of which an authorisation order made by the FCA were in force. Not more than 10% of the scheme property may consist of units in collectiveinvestment schemes.
Typically lower rewards,lower risk
Typically higher rewards,higher risk
Past performance is not a guide to future performance. The value of an investment and the revenue from it may go up and down and you may get backless than invested.
Special Situations Fund
The Fund is ranked at 5* because it has experienced medium to high levels of volatility over the past 5 years.
* As disclosed in the key investor information document dated 2nd October 2017.
There are several different ways of measuring risk. The table below uses an industry standard measure of fund risk based on measuring a fund's volatilityusing its returns over the past five years. Volatility is generated by both rising and falling prices. Volatility doesn't tell you how much a fund has lost orgained; it indicates how volatile its returns were historically. The Fund's ranking may change over time and may not be a reliable indication of its futurerisk profile.
This is a separate measure to the fund Risk Profiles we used to determine our investment portfolios (where we used our own methodology to take anoverall look at the funds' risks and aims and group our funds into Cautious/Medium, Medium, Medium/Adventurous, Adventurous Profiles).
87
HBOS Specialised Investment Funds ICVCInterim Report and Financial Statementsfor the six month period ended 30th November 2017 (unaudited)
Special Situations FundInvestment markets overview (continued)
While recognising that we are not immune to these dynamics, we do however maintain the view that the underlying strength of our holdings will outweighthe broader environment in the long term, hence, our consistent approach to identify companies that possess the best diversified earnings streams,superior business models and healthy balance sheets at attractive valuations.
Aberdeen Asset Investments LimitedDecember 2017
Looking ahead, though a robust global economy continues to support economic activity, there remains uncertainty about the shape of Brexit negotiationswhile a rise in inflation as a result of sterling’s weakness continues to push up the cost of imports. Indeed, acknowledging a weak economic outlook, theBank of England’s decided to take interest rates to 0.5% in November with the Monetary Policy Committee also flagging that further modest increasesmight be warranted in the coming years to keep inflation to sustainable levels.
Mitigating the underperformance were an overweight to Intertek which performed well after good interim results that were driven by buoyant demand fortesting, inspection and certification services that underpinned encouraging levels of organic growth. Meanwhile, Aveva benefited from news of its £3-billion deal to combine with Schneider Electric’s software division that will create a global leader in engineering and industrial software. Last, Shire hasbeen weaker due a slight downgrade in full-year sales expectations, concerns about looming competition in the haemophilia segment, as well as thesurprise departure of its CFO.
Investment review (continued)
88
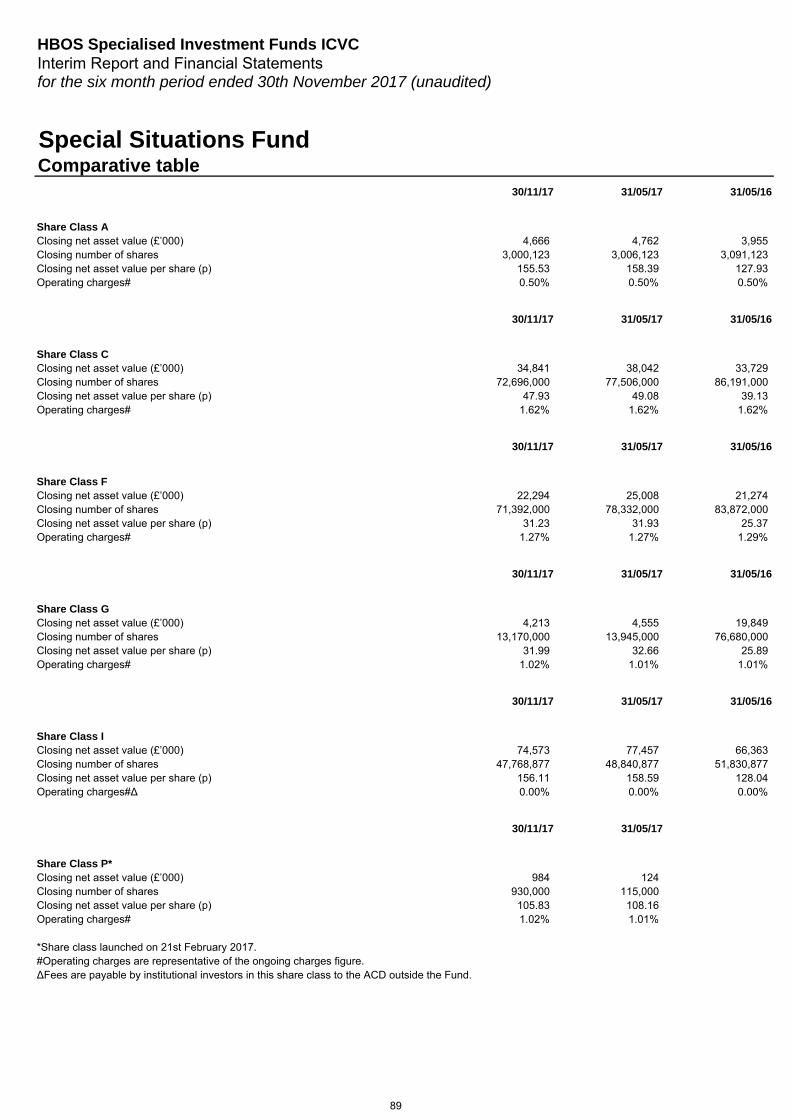
Interim Report and Financial Statementsfor the six month period ended 30th November 2017 (unaudited)
Comparative table
Share Class AClosing net asset value (£’000)Closing number of sharesClosing net asset value per share (p)Operating charges#
Share Class CClosing net asset value (£’000)Closing number of sharesClosing net asset value per share (p)Operating charges#
Share Class FClosing net asset value (£’000)Closing number of sharesClosing net asset value per share (p)Operating charges#
Share Class GClosing net asset value (£’000)Closing number of sharesClosing net asset value per share (p)Operating charges#
Share Class IClosing net asset value (£’000)Closing number of sharesClosing net asset value per share (p)Operating charges#∆
Share Class P*Closing net asset value (£’000)Closing number of sharesClosing net asset value per share (p)Operating charges#
HBOS Specialised Investment Funds ICVC
Special Situations Fund
30/11/17 31/05/17 31/05/16
155.53 158.39 127.930.50% 0.50% 0.50%
4,666 4,762 3,9553,000,123 3,006,123 3,091,123
30/11/17 31/05/17 31/05/16
47.93 49.08 39.131.62% 1.62% 1.62%
34,841 38,042 33,72972,696,000 77,506,000 86,191,000
30/11/17 31/05/17 31/05/16
31.23 31.93 25.371.27% 1.27% 1.29%
22,294 25,008 21,27471,392,000 78,332,000 83,872,000
30/11/17 31/05/17 31/05/16
31.99 32.66 25.891.02% 1.01% 1.01%
4,213 4,555 19,84913,170,000 13,945,000 76,680,000
30/11/17 31/05/17 31/05/16
156.11 158.59 128.040.00% 0.00% 0.00%
74,573 77,457 66,36347,768,877 48,840,877 51,830,877
30/11/17 31/05/17
105.83 108.161.02% 1.01%
984 124930,000 115,000
∆Fees are payable by institutional investors in this share class to the ACD outside the Fund.
*Share class launched on 21st February 2017.#Operating charges are representative of the ongoing charges figure.
89
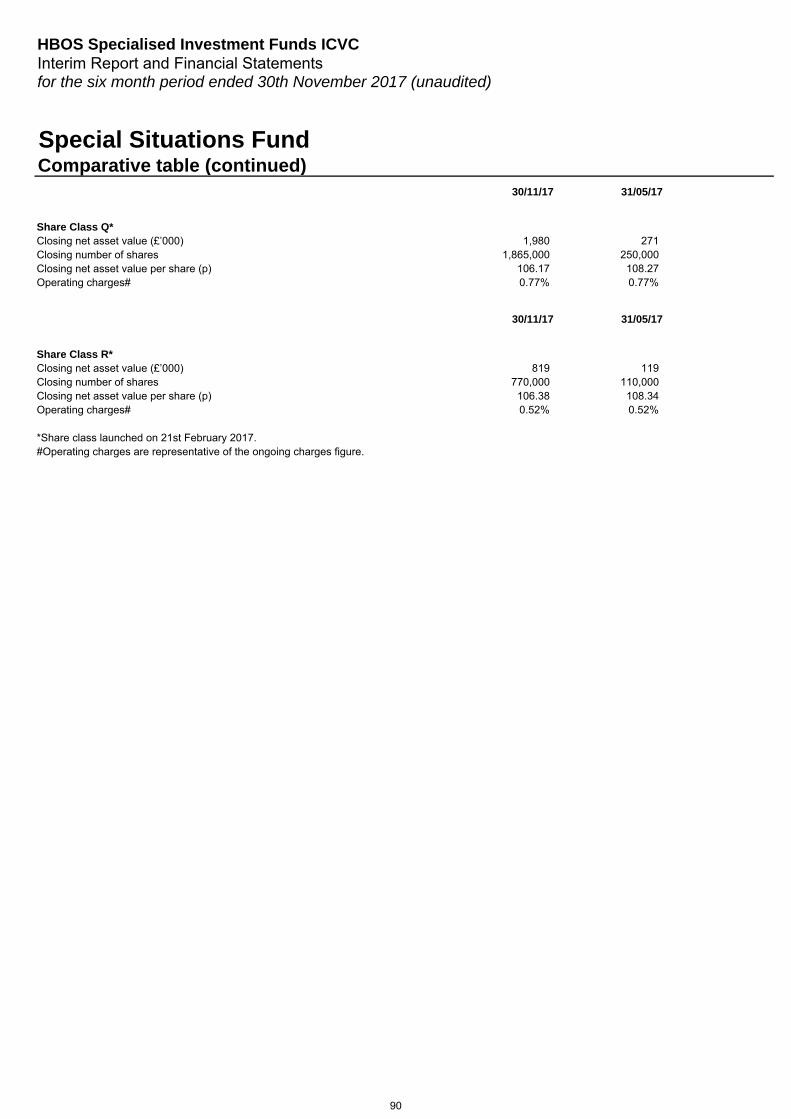
Interim Report and Financial Statementsfor the six month period ended 30th November 2017 (unaudited)
Comparative table (continued)
HBOS Specialised Investment Funds ICVC
Special Situations Fund
Share Class Q*Closing net asset value (£’000)Closing number of sharesClosing net asset value per share (p)Operating charges#
Share Class R*Closing net asset value (£’000)Closing number of sharesClosing net asset value per share (p)Operating charges#
30/11/17 31/05/17
1,980 2711,865,000 250,000
106.17 108.270.77% 0.77%
30/11/17 31/05/17
106.38 108.340.52% 0.52%
819 119770,000 110,000
*Share class launched on 21st February 2017.#Operating charges are representative of the ongoing charges figure.
90
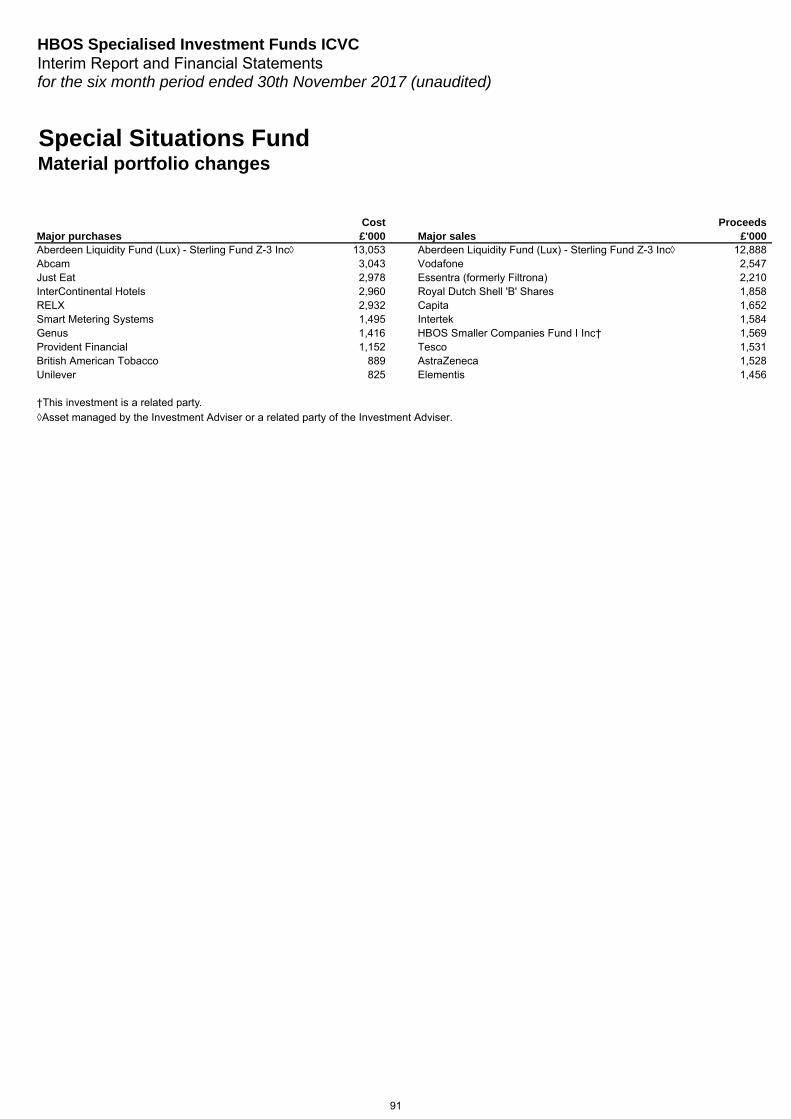
HBOS Specialised Investment Funds ICVCInterim Report and Financial Statementsfor the six month period ended 30th November 2017 (unaudited)
Special Situations FundMaterial portfolio changes
Cost ProceedsMajor purchases £'000 Major sales £'000 Aberdeen Liquidity Fund (Lux) - Sterling Fund Z-3 Inc◊ 13,053 Aberdeen Liquidity Fund (Lux) - Sterling Fund Z-3 Inc◊ 12,888Abcam 3,043 Vodafone 2,547Just Eat 2,978 Essentra (formerly Filtrona) 2,210InterContinental Hotels 2,960 Royal Dutch Shell 'B' Shares 1,858RELX 2,932 Capita 1,652Smart Metering Systems 1,495 Intertek 1,584Genus 1,416 HBOS Smaller Companies Fund I Inc† 1,569Provident Financial 1,152 Tesco 1,531British American Tobacco 889 AstraZeneca 1,528Unilever 825 Elementis 1,456
†This investment is a related party.◊Asset managed by the Investment Adviser or a related party of the Investment Adviser.
91
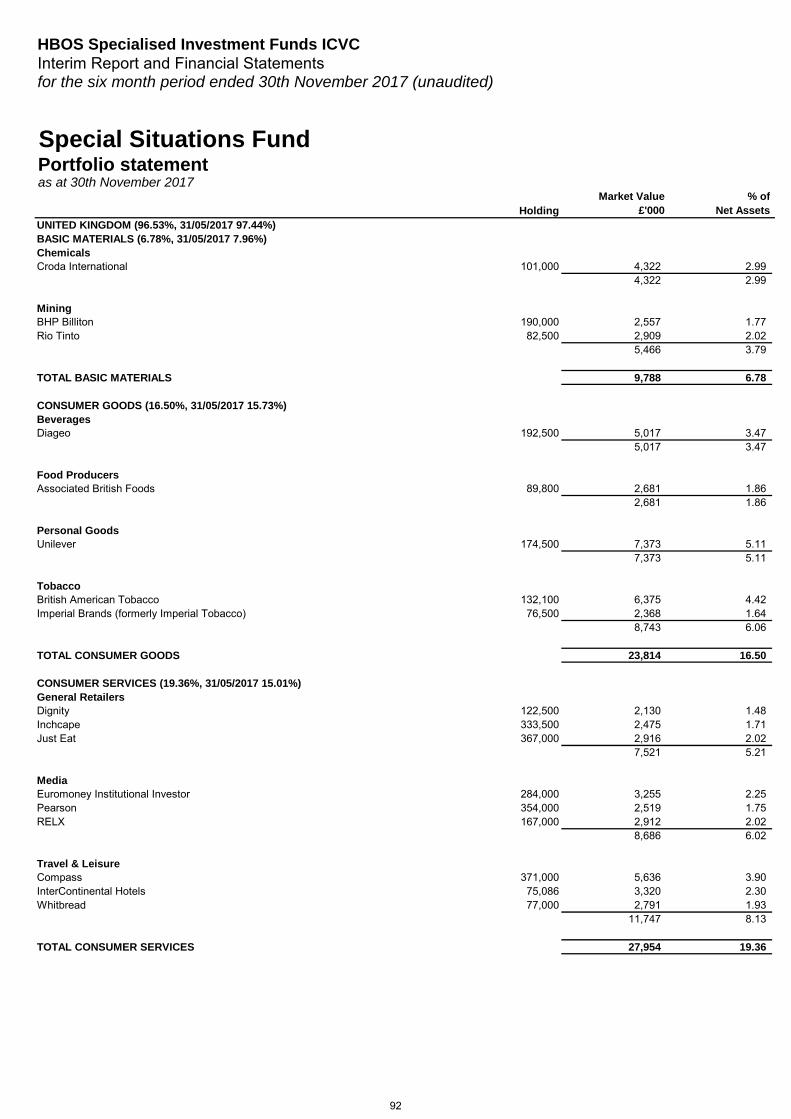
HBOS Specialised Investment Funds ICVCInterim Report and Financial Statementsfor the six month period ended 30th November 2017 (unaudited)
HoldingMarket Value
£'000% of
Net AssetsUNITED KINGDOM (96.53%, 31/05/2017 97.44%) BASIC MATERIALS (6.78%, 31/05/2017 7.96%) ChemicalsCroda International 101,000 4,322 2.99
4,322 2.99
MiningBHP Billiton 190,000 2,557 1.77Rio Tinto 82,500 2,909 2.02
5,466 3.79
TOTAL BASIC MATERIALS 9,788 6.78
CONSUMER GOODS (16.50%, 31/05/2017 15.73%) BeveragesDiageo 192,500 5,017 3.47
5,017 3.47
Food ProducersAssociated British Foods 89,800 2,681 1.86
2,681 1.86
Personal GoodsUnilever 174,500 7,373 5.11
7,373 5.11
TobaccoBritish American Tobacco 132,100 6,375 4.42Imperial Brands (formerly Imperial Tobacco) 76,500 2,368 1.64
8,743 6.06
TOTAL CONSUMER GOODS 23,814 16.50
CONSUMER SERVICES (19.36%, 31/05/2017 15.01%) General RetailersDignity 122,500 2,130 1.48Inchcape 333,500 2,475 1.71Just Eat 367,000 2,916 2.02
7,521 5.21
MediaEuromoney Institutional Investor 284,000 3,255 2.25Pearson 354,000 2,519 1.75RELX 167,000 2,912 2.02
8,686 6.02
Travel & LeisureCompass 371,000 5,636 3.90InterContinental Hotels 75,086 3,320 2.30Whitbread 77,000 2,791 1.93
11,747 8.13
TOTAL CONSUMER SERVICES 27,954 19.36
Special Situations FundPortfolio statement as at 30th November 2017
92
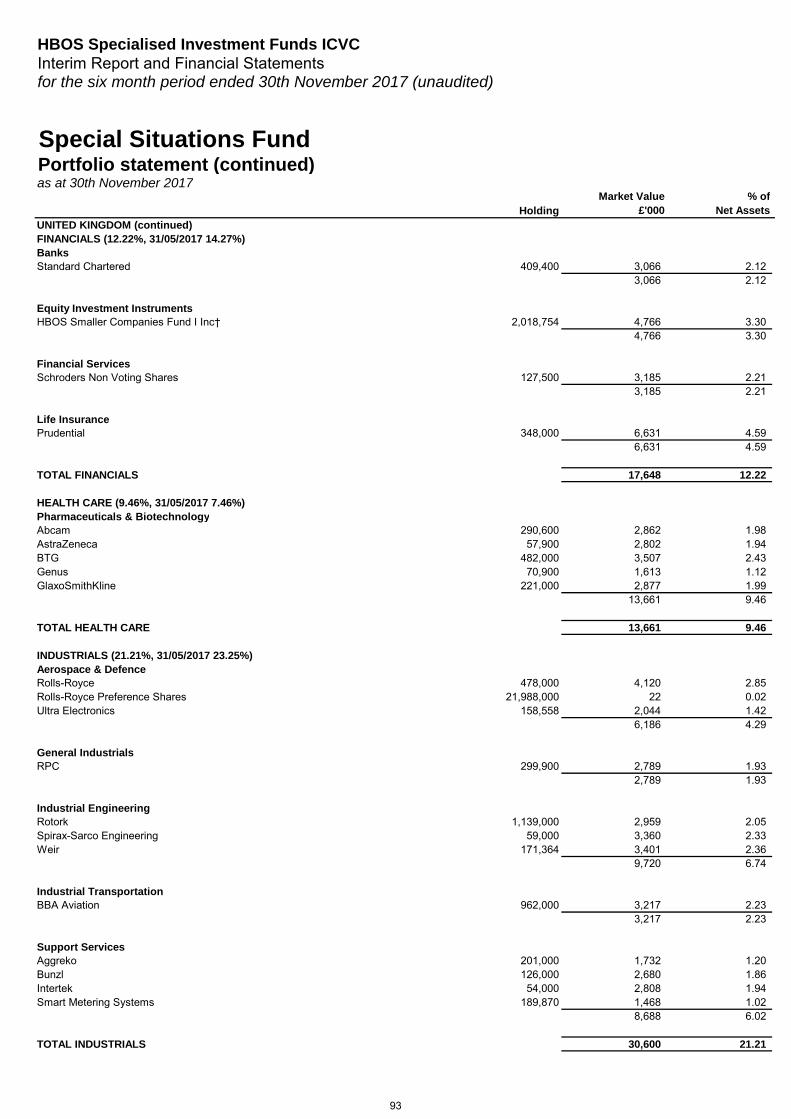
HBOS Specialised Investment Funds ICVCInterim Report and Financial Statementsfor the six month period ended 30th November 2017 (unaudited)
HoldingMarket Value
£'000% of
Net Assets
Special Situations FundPortfolio statement (continued)as at 30th November 2017
UNITED KINGDOM (continued) FINANCIALS (12.22%, 31/05/2017 14.27%) BanksStandard Chartered 409,400 3,066 2.12
3,066 2.12
Equity Investment InstrumentsHBOS Smaller Companies Fund I Inc† 2,018,754 4,766 3.30
4,766 3.30
Financial ServicesSchroders Non Voting Shares 127,500 3,185 2.21
3,185 2.21
Life InsurancePrudential 348,000 6,631 4.59
6,631 4.59
TOTAL FINANCIALS 17,648 12.22
HEALTH CARE (9.46%, 31/05/2017 7.46%) Pharmaceuticals & BiotechnologyAbcam 290,600 2,862 1.98AstraZeneca 57,900 2,802 1.94BTG 482,000 3,507 2.43Genus 70,900 1,613 1.12GlaxoSmithKline 221,000 2,877 1.99
13,661 9.46
TOTAL HEALTH CARE 13,661 9.46
INDUSTRIALS (21.21%, 31/05/2017 23.25%) Aerospace & DefenceRolls-Royce 478,000 4,120 2.85Rolls-Royce Preference Shares 21,988,000 22 0.02Ultra Electronics 158,558 2,044 1.42
6,186 4.29
General IndustrialsRPC 299,900 2,789 1.93
2,789 1.93
Industrial EngineeringRotork 1,139,000 2,959 2.05Spirax-Sarco Engineering 59,000 3,360 2.33Weir 171,364 3,401 2.36
9,720 6.74
Industrial TransportationBBA Aviation 962,000 3,217 2.23
3,217 2.23
Support ServicesAggreko 201,000 1,732 1.20Bunzl 126,000 2,680 1.86Intertek 54,000 2,808 1.94Smart Metering Systems 189,870 1,468 1.02
8,688 6.02
TOTAL INDUSTRIALS 30,600 21.21
93
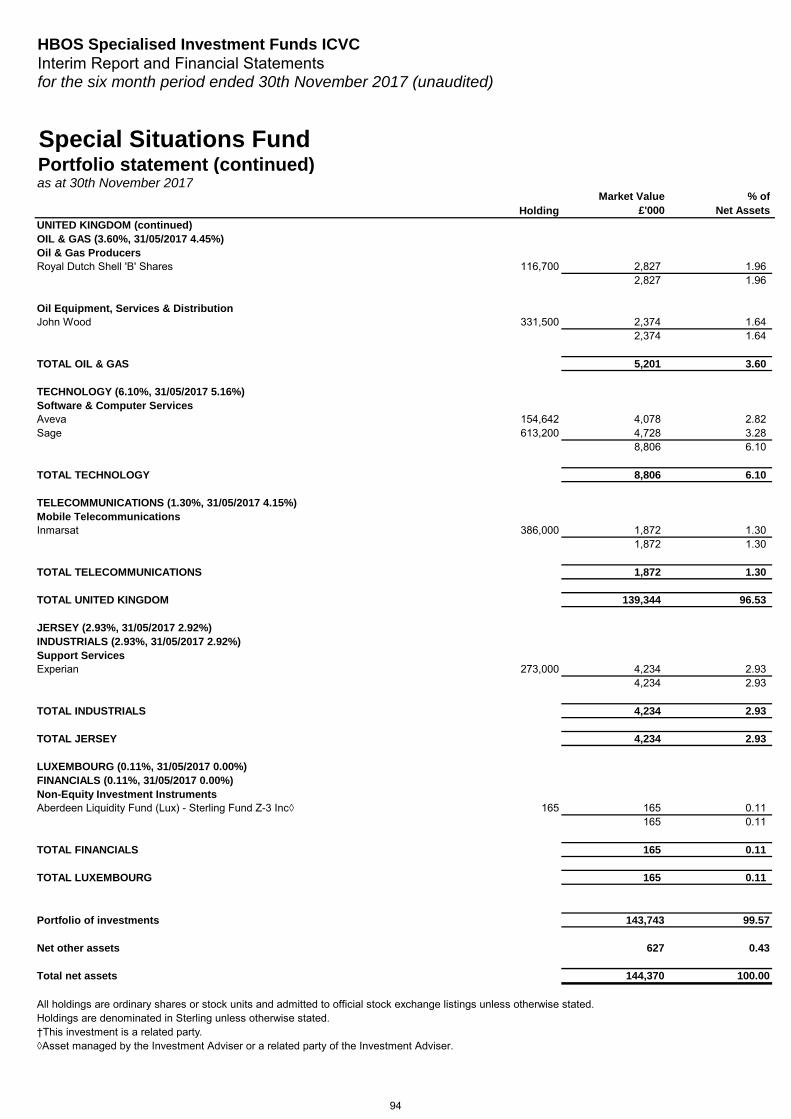
HBOS Specialised Investment Funds ICVCInterim Report and Financial Statementsfor the six month period ended 30th November 2017 (unaudited)
HoldingMarket Value
£'000% of
Net Assets
Special Situations FundPortfolio statement (continued)as at 30th November 2017
UNITED KINGDOM (continued) OIL & GAS (3.60%, 31/05/2017 4.45%) Oil & Gas ProducersRoyal Dutch Shell 'B' Shares 116,700 2,827 1.96
2,827 1.96
Oil Equipment, Services & DistributionJohn Wood 331,500 2,374 1.64
2,374 1.64
TOTAL OIL & GAS 5,201 3.60
TECHNOLOGY (6.10%, 31/05/2017 5.16%) Software & Computer ServicesAveva 154,642 4,078 2.82Sage 613,200 4,728 3.28
8,806 6.10
TOTAL TECHNOLOGY 8,806 6.10
TELECOMMUNICATIONS (1.30%, 31/05/2017 4.15%) Mobile TelecommunicationsInmarsat 386,000 1,872 1.30
1,872 1.30
TOTAL TELECOMMUNICATIONS 1,872 1.30
TOTAL UNITED KINGDOM 139,344 96.53
JERSEY (2.93%, 31/05/2017 2.92%) INDUSTRIALS (2.93%, 31/05/2017 2.92%) Support ServicesExperian 273,000 4,234 2.93
4,234 2.93
TOTAL INDUSTRIALS 4,234 2.93
TOTAL JERSEY 4,234 2.93
LUXEMBOURG (0.11%, 31/05/2017 0.00%) FINANCIALS (0.11%, 31/05/2017 0.00%) Non-Equity Investment InstrumentsAberdeen Liquidity Fund (Lux) - Sterling Fund Z-3 Inc◊ 165 165 0.11
165 0.11
TOTAL FINANCIALS 165 0.11
TOTAL LUXEMBOURG 165 0.11
Portfolio of investments 143,743 99.57
Net other assets 627 0.43
Total net assets 144,370 100.00
†This investment is a related party.◊Asset managed by the Investment Adviser or a related party of the Investment Adviser.
Holdings are denominated in Sterling unless otherwise stated.All holdings are ordinary shares or stock units and admitted to official stock exchange listings unless otherwise stated.
94
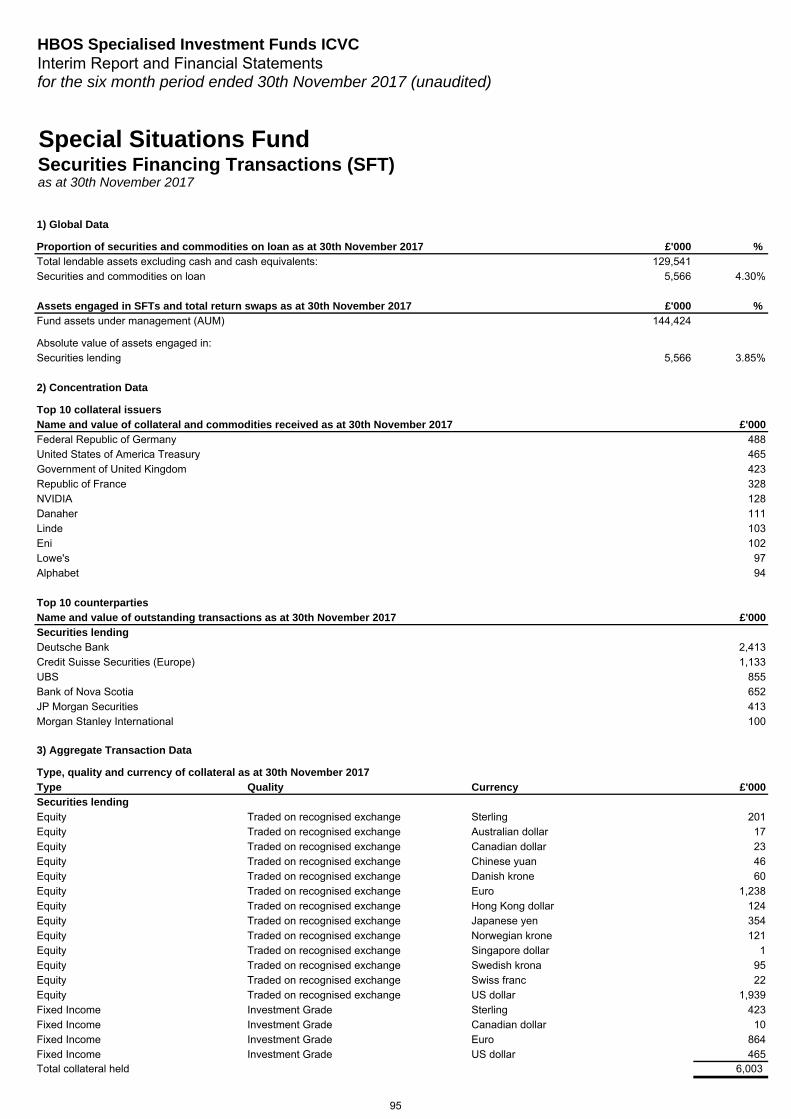
HBOS Specialised Investment Funds ICVCInterim Report and Financial Statementsfor the six month period ended 30th November 2017 (unaudited)
1) Global Data
Proportion of securities and commodities on loan as at 30th November 2017 £'000 % Total lendable assets excluding cash and cash equivalents: 129,541Securities and commodities on loan 5,566 4.30%
Assets engaged in SFTs and total return swaps as at 30th November 2017 £'000 % Fund assets under management (AUM) 144,424
Absolute value of assets engaged in:Securities lending 5,566 3.85%
2) Concentration Data
Top 10 collateral issuersName and value of collateral and commodities received as at 30th November 2017 £'000Federal Republic of Germany 488United States of America Treasury 465Government of United Kingdom 423Republic of France 328NVIDIA 128Danaher 111Linde 103Eni 102Lowe's 97Alphabet 94
Top 10 counterpartiesName and value of outstanding transactions as at 30th November 2017 £'000Securities lendingDeutsche Bank 2,413Credit Suisse Securities (Europe) 1,133UBS 855Bank of Nova Scotia 652JP Morgan Securities 413Morgan Stanley International 100
3) Aggregate Transaction Data
Type, quality and currency of collateral as at 30th November 2017Type Quality Currency £'000Securities lendingEquity Traded on recognised exchange Sterling 201Equity Traded on recognised exchange Australian dollar 17Equity Traded on recognised exchange Canadian dollar 23Equity Traded on recognised exchange Chinese yuan 46Equity Traded on recognised exchange Danish krone 60Equity Traded on recognised exchange Euro 1,238Equity Traded on recognised exchange Hong Kong dollar 124Equity Traded on recognised exchange Japanese yen 354Equity Traded on recognised exchange Norwegian krone 121Equity Traded on recognised exchange Singapore dollar 1Equity Traded on recognised exchange Swedish krona 95Equity Traded on recognised exchange Swiss franc 22Equity Traded on recognised exchange US dollar 1,939Fixed Income Investment Grade Sterling 423Fixed Income Investment Grade Canadian dollar 10Fixed Income Investment Grade Euro 864Fixed Income Investment Grade US dollar 465Total collateral held 6,003
Special Situations FundSecurities Financing Transactions (SFT) as at 30th November 2017
95
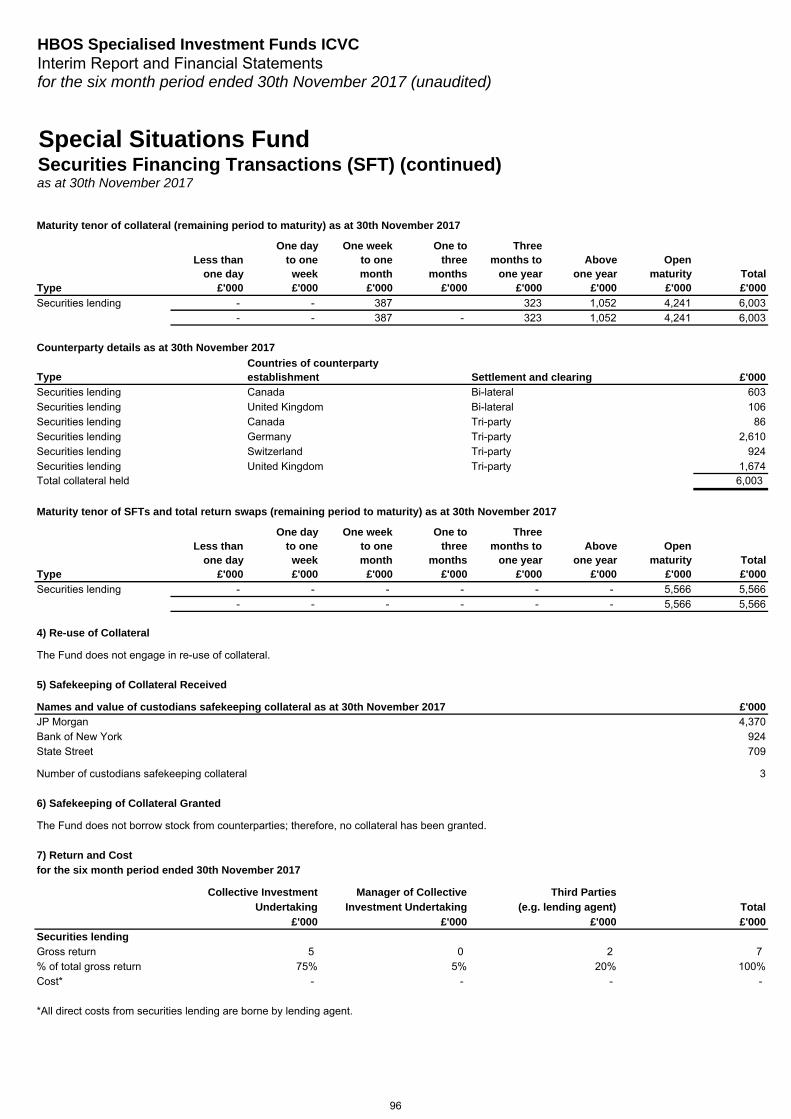
HBOS Specialised Investment Funds ICVCInterim Report and Financial Statementsfor the six month period ended 30th November 2017 (unaudited)
Securities Financing Transactions (SFT) (continued)Special Situations Fund
as at 30th November 2017
Maturity tenor of collateral (remaining period to maturity) as at 30th November 2017
Type
Less than one day
£'000
One day to one week£'000
One week to one month
£'000
One to three
months£'000
Three months to
one year£'000
Above one year
£'000
Open maturity
£'000Total£'000
Securities lending - - 387 323 1,052 4,241 6,003- - 387 - 323 1,052 4,241 6,003
Counterparty details as at 30th November 2017
Type £'000Securities lending Canada Bi-lateral 603Securities lending United Kingdom Bi-lateral 106Securities lending Canada Tri-party 86Securities lending Germany Tri-party 2,610Securities lending Switzerland Tri-party 924Securities lending United Kingdom Tri-party 1,674Total collateral held 6,003
Maturity tenor of SFTs and total return swaps (remaining period to maturity) as at 30th November 2017
Type
Less than one day
£'000
One day to one week£'000
One week to one month
£'000
One to three
months£'000
Three months to
one year£'000
Above one year
£'000
Open maturity
£'000Total£'000
Securities lending - - - - - - 5,566 5,566- - - - - - 5,566 5,566
4) Re-use of Collateral
The Fund does not engage in re-use of collateral.
5) Safekeeping of Collateral Received
Names and value of custodians safekeeping collateral as at 30th November 2017 £'000JP Morgan 4,370Bank of New York 924State Street 709
Number of custodians safekeeping collateral 3
6) Safekeeping of Collateral Granted
The Fund does not borrow stock from counterparties; therefore, no collateral has been granted.
7) Return and Costfor the six month period ended 30th November 2017
Collective Investment Manager of Collective Third Parties Undertaking Investment Undertaking (e.g. lending agent) Total
£'000 £'000 £'000 £'000Securities lendingGross return 5 0 2 7% of total gross return 75% 5% 20% 100%Cost* - - - -
*All direct costs from securities lending are borne by lending agent.
Countries of counterparty establishment Settlement and clearing
96
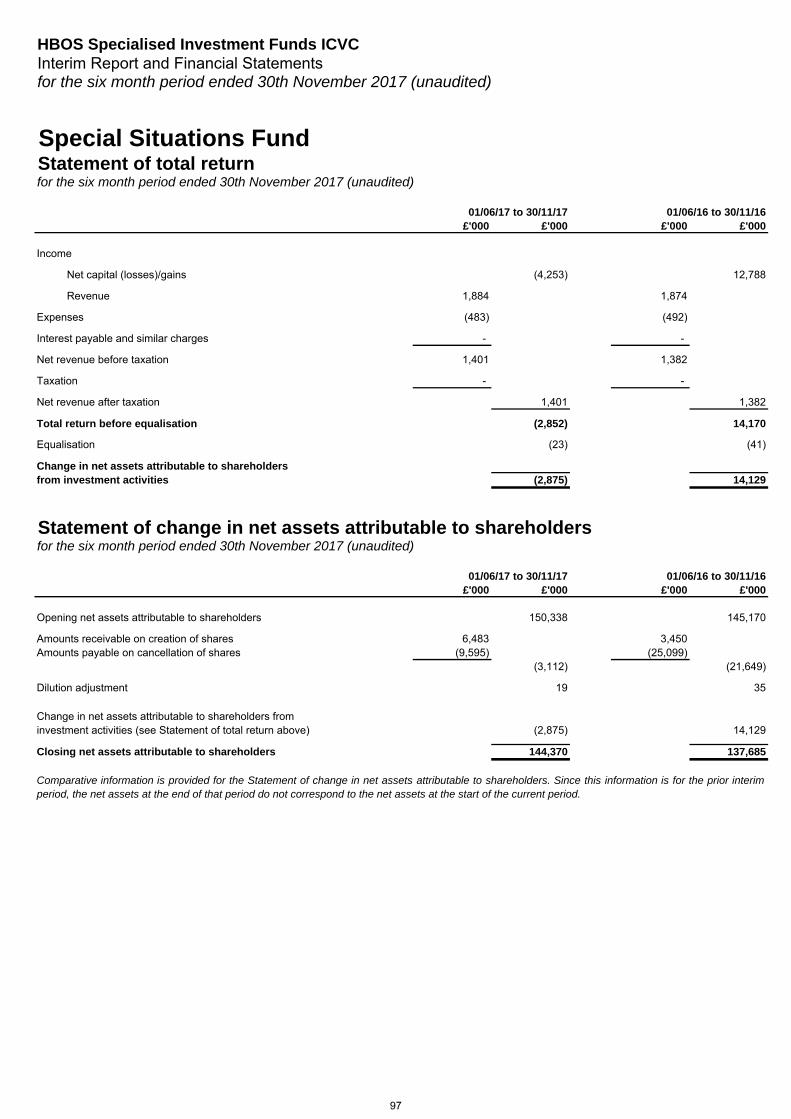
HBOS Specialised Investment Funds ICVCInterim Report and Financial Statementsfor the six month period ended 30th November 2017 (unaudited)
Special Situations FundStatement of total returnfor the six month period ended 30th November 2017 (unaudited)
01/06/17 to 30/11/17 01/06/16 to 30/11/16£'000 £'000 £'000 £'000
Income
Net capital (losses)/gains (4,253) 12,788
Revenue 1,884 1,874
Expenses (483) (492)
Interest payable and similar charges - -
Net revenue before taxation 1,401 1,382
Taxation - -
Net revenue after taxation 1,401 1,382
Total return before equalisation (2,852) 14,170
Equalisation (23) (41)
Change in net assets attributable to shareholdersfrom investment activities (2,875) 14,129
Statement of change in net assets attributable to shareholdersfor the six month period ended 30th November 2017 (unaudited)
01/06/17 to 30/11/17 01/06/16 to 30/11/16£'000 £'000 £'000 £'000
Opening net assets attributable to shareholders 150,338 145,170
Amounts receivable on creation of shares 6,483 3,450Amounts payable on cancellation of shares (9,595) (25,099)
(3,112) (21,649)
Dilution adjustment 19 35
Change in net assets attributable to shareholders frominvestment activities (see Statement of total return above) (2,875) 14,129
Closing net assets attributable to shareholders 144,370 137,685
Comparative information is provided for the Statement of change in net assets attributable to shareholders. Since this information is for the prior interimperiod, the net assets at the end of that period do not correspond to the net assets at the start of the current period.
97
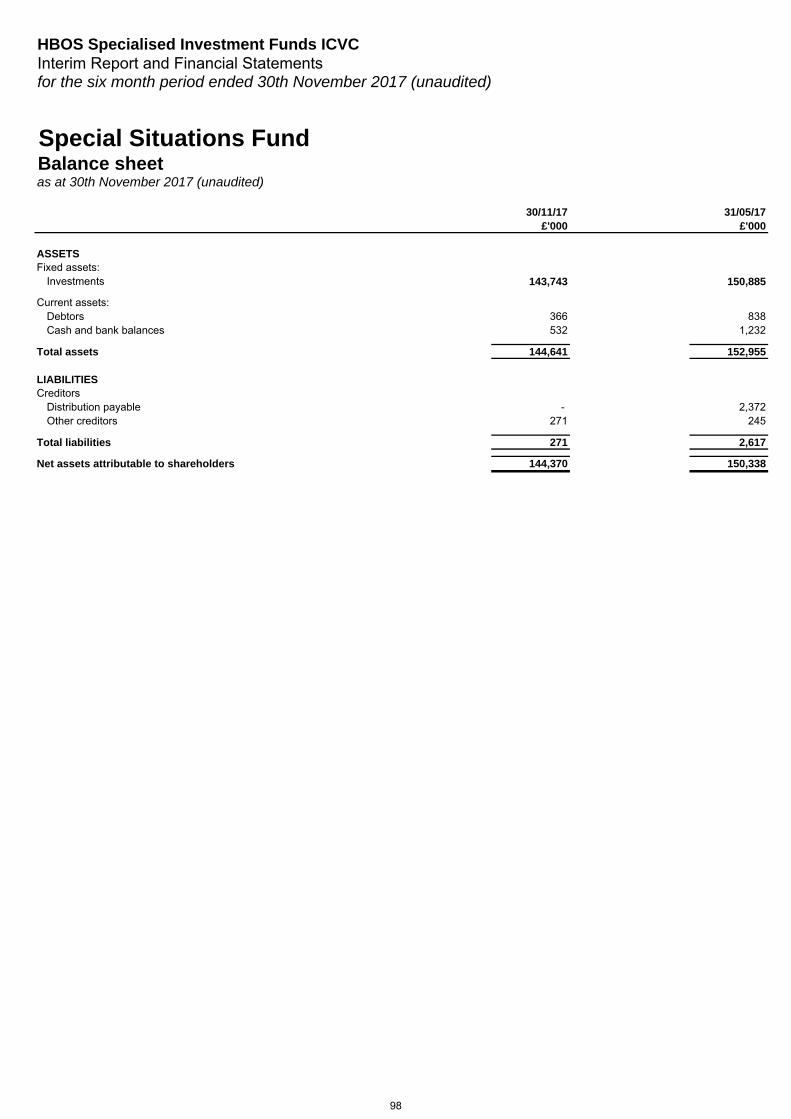
HBOS Specialised Investment Funds ICVCInterim Report and Financial Statementsfor the six month period ended 30th November 2017 (unaudited)
Special Situations FundBalance sheetas at 30th November 2017 (unaudited)
30/11/17 31/05/17£'000 £'000
ASSETSFixed assets:
Investments 143,743 150,885
Current assets:Debtors 366 838Cash and bank balances 532 1,232
Total assets 144,641 152,955
LIABILITIESCreditors
Distribution payable - 2,372Other creditors 271 245
Total liabilities 271 2,617
Net assets attributable to shareholders 144,370 150,338
98
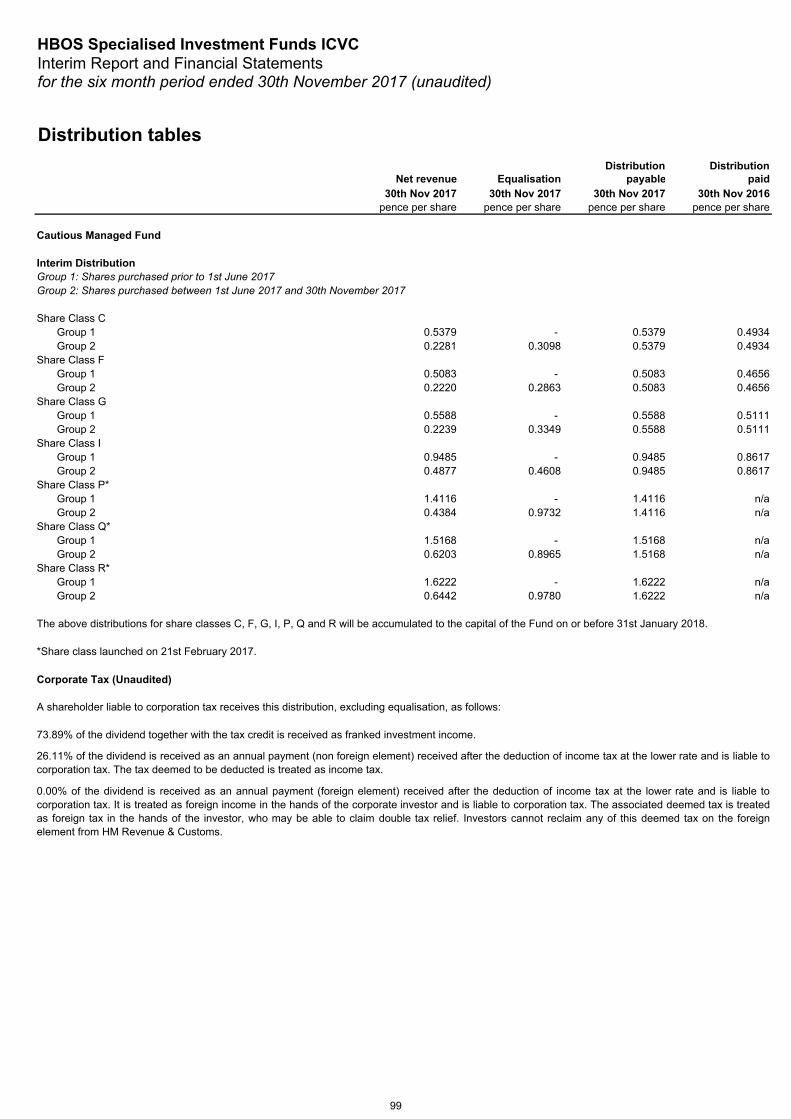
HBOS Specialised Investment Funds ICVCInterim Report and Financial Statementsfor the six month period ended 30th November 2017 (unaudited)
Distribution tables Distribution Distribution
Net revenue Equalisation payable paid30th Nov 2017 30th Nov 2017 30th Nov 2017 30th Nov 2016
pence per share pence per share pence per share pence per share
Cautious Managed Fund
Interim Distribution
Share Class CGroup 1 0.5379 - 0.5379 0.4934Group 2 0.2281 0.3098 0.5379 0.4934
Share Class FGroup 1 0.5083 - 0.5083 0.4656Group 2 0.2220 0.2863 0.5083 0.4656
Share Class GGroup 1 0.5588 - 0.5588 0.5111Group 2 0.2239 0.3349 0.5588 0.5111
Share Class IGroup 1 0.9485 - 0.9485 0.8617Group 2 0.4877 0.4608 0.9485 0.8617
Share Class P*Group 1 1.4116 - 1.4116 n/aGroup 2 0.4384 0.9732 1.4116 n/a
Share Class Q*Group 1 1.5168 - 1.5168 n/aGroup 2 0.6203 0.8965 1.5168 n/a
Share Class R*Group 1 1.6222 - 1.6222 n/aGroup 2 0.6442 0.9780 1.6222 n/a
The above distributions for share classes C, F, G, I, P, Q and R will be accumulated to the capital of the Fund on or before 31st January 2018.
Corporate Tax (Unaudited)
0.00% of the dividend is received as an annual payment (foreign element) received after the deduction of income tax at the lower rate and is liable tocorporation tax. It is treated as foreign income in the hands of the corporate investor and is liable to corporation tax. The associated deemed tax is treatedas foreign tax in the hands of the investor, who may be able to claim double tax relief. Investors cannot reclaim any of this deemed tax on the foreignelement from HM Revenue & Customs.
73.89% of the dividend together with the tax credit is received as franked investment income.
*Share class launched on 21st February 2017.
Group 1: Shares purchased prior to 1st June 2017Group 2: Shares purchased between 1st June 2017 and 30th November 2017
26.11% of the dividend is received as an annual payment (non foreign element) received after the deduction of income tax at the lower rate and is liable tocorporation tax. The tax deemed to be deducted is treated as income tax.
A shareholder liable to corporation tax receives this distribution, excluding equalisation, as follows:
99

HBOS Specialised Investment Funds ICVCInterim Report and Financial Statementsfor the six month period ended 30th November 2017 (unaudited)
Distribution tables (continued)Distribution Distribution
Net revenue Equalisation payable paid30th Nov 2017 30th Nov 2017 30th Nov 2017 30th Nov 2016
pence per share pence per share pence per share pence per share
Fund of Investment Trusts
Interim Distribution
Share Class AGroup 1 6.7779 - 6.7779 5.3444Group 2 3.0236 3.7543 6.7779 5.3444
Share Class CGroup 1 0.1926 - 0.1926 0.1370Group 2 0.0237 0.1689 0.1926 0.1370
Share Class FGroup 1 0.1662 - 0.1662 0.1268Group 2 0.0535 0.1127 0.1662 0.1268
Share Class GGroup 1 0.2367 - 0.2367 0.1824Group 2 0.0713 0.1654 0.2367 0.1824
Share Class IGroup 1 9.1892 - 9.1892 7.2705Group 2 4.6562 4.5330 9.1892 7.2705
Share Class P*Group 1 0.5016 - 0.5016 n/aGroup 2 0.1173 0.3843 0.5016 n/a
Share Class Q*Group 1 0.6367 - 0.6367 n/aGroup 2 0.2199 0.4168 0.6367 n/a
Share Class R*Group 1 0.7720 - 0.7720 n/aGroup 2 0.2665 0.5055 0.7720 n/a
The above distributions for share classes A and I are payable on or before 31st January 2018.The above distributions for share classes C, F, G, P, Q and R will be accumulated to the capital of the Fund on or before 31st January 2018.
Corporate Tax (Unaudited)
A shareholder liable to corporation tax receives this distribution, excluding equalisation, as follows:
Group 1: Shares purchased prior to 1st June 2017
0.00% of the dividend is received as an annual payment (non foreign element) received after the deduction of income tax at the lower rate and is liable tocorporation tax. The tax deemed to be deducted is treated as income tax.
0.00% of the dividend is received as an annual payment (foreign element) received after the deduction of income tax at the lower rate and is liable tocorporation tax. It is treated as foreign income in the hands of the corporate investor and is liable to corporation tax. The associated deemed tax is treatedas foreign tax in the hands of the investor, who may be able to claim double tax relief. Investors cannot reclaim any of this deemed tax on the foreignelement from HM Revenue & Customs.
*Share class launched on 21st February 2017.
Group 2: Shares purchased between 1st June 2017 and 30th November 2017
100.00% of the dividend together with the tax credit is received as franked investment income.
100
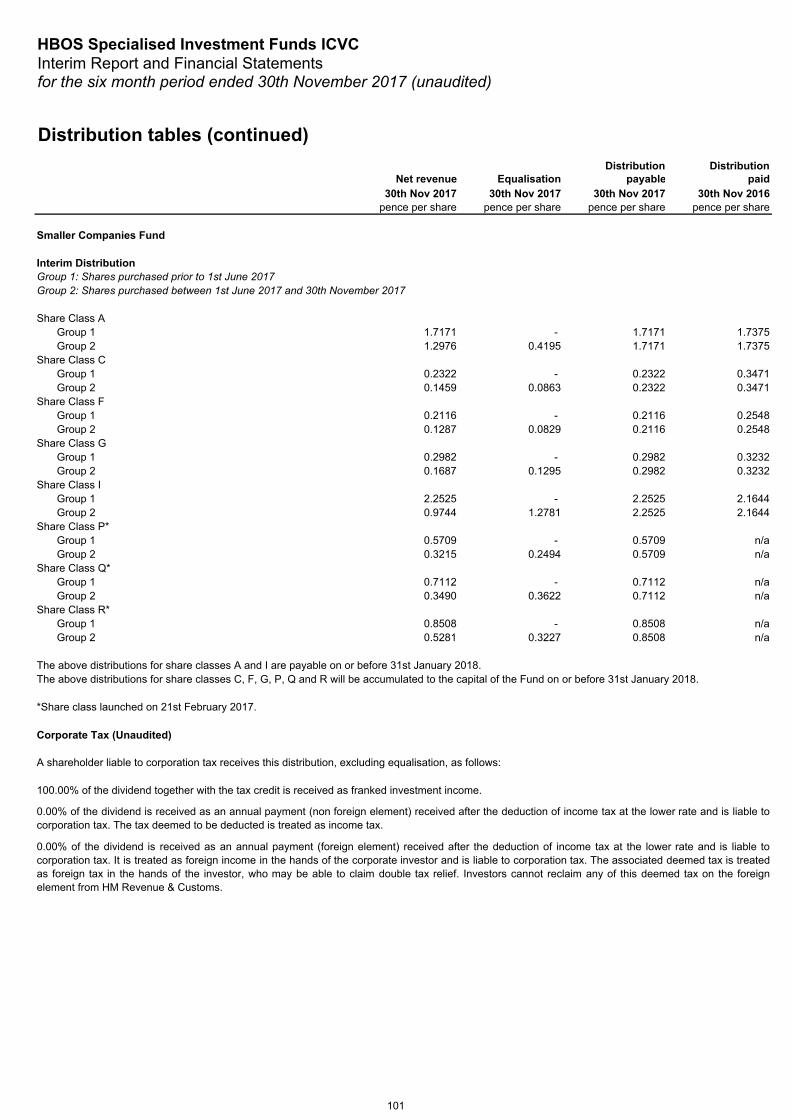
HBOS Specialised Investment Funds ICVCInterim Report and Financial Statementsfor the six month period ended 30th November 2017 (unaudited)
Distribution tables (continued)Distribution Distribution
Net revenue Equalisation payable paid30th Nov 2017 30th Nov 2017 30th Nov 2017 30th Nov 2016
pence per share pence per share pence per share pence per share
Smaller Companies Fund
Interim Distribution
Share Class AGroup 1 1.7171 - 1.7171 1.7375Group 2 1.2976 0.4195 1.7171 1.7375
Share Class CGroup 1 0.2322 - 0.2322 0.3471Group 2 0.1459 0.0863 0.2322 0.3471
Share Class FGroup 1 0.2116 - 0.2116 0.2548Group 2 0.1287 0.0829 0.2116 0.2548
Share Class GGroup 1 0.2982 - 0.2982 0.3232Group 2 0.1687 0.1295 0.2982 0.3232
Share Class IGroup 1 2.2525 - 2.2525 2.1644Group 2 0.9744 1.2781 2.2525 2.1644
Share Class P*Group 1 0.5709 - 0.5709 n/aGroup 2 0.3215 0.2494 0.5709 n/a
Share Class Q*Group 1 0.7112 - 0.7112 n/aGroup 2 0.3490 0.3622 0.7112 n/a
Share Class R*Group 1 0.8508 - 0.8508 n/aGroup 2 0.5281 0.3227 0.8508 n/a
The above distributions for share classes A and I are payable on or before 31st January 2018.The above distributions for share classes C, F, G, P, Q and R will be accumulated to the capital of the Fund on or before 31st January 2018.
*Share class launched on 21st February 2017.
Corporate Tax (Unaudited)
A shareholder liable to corporation tax receives this distribution, excluding equalisation, as follows:
Group 1: Shares purchased prior to 1st June 2017
0.00% of the dividend is received as an annual payment (non foreign element) received after the deduction of income tax at the lower rate and is liable tocorporation tax. The tax deemed to be deducted is treated as income tax.
0.00% of the dividend is received as an annual payment (foreign element) received after the deduction of income tax at the lower rate and is liable tocorporation tax. It is treated as foreign income in the hands of the corporate investor and is liable to corporation tax. The associated deemed tax is treatedas foreign tax in the hands of the investor, who may be able to claim double tax relief. Investors cannot reclaim any of this deemed tax on the foreignelement from HM Revenue & Customs.
Group 2: Shares purchased between 1st June 2017 and 30th November 2017
100.00% of the dividend together with the tax credit is received as franked investment income.
101
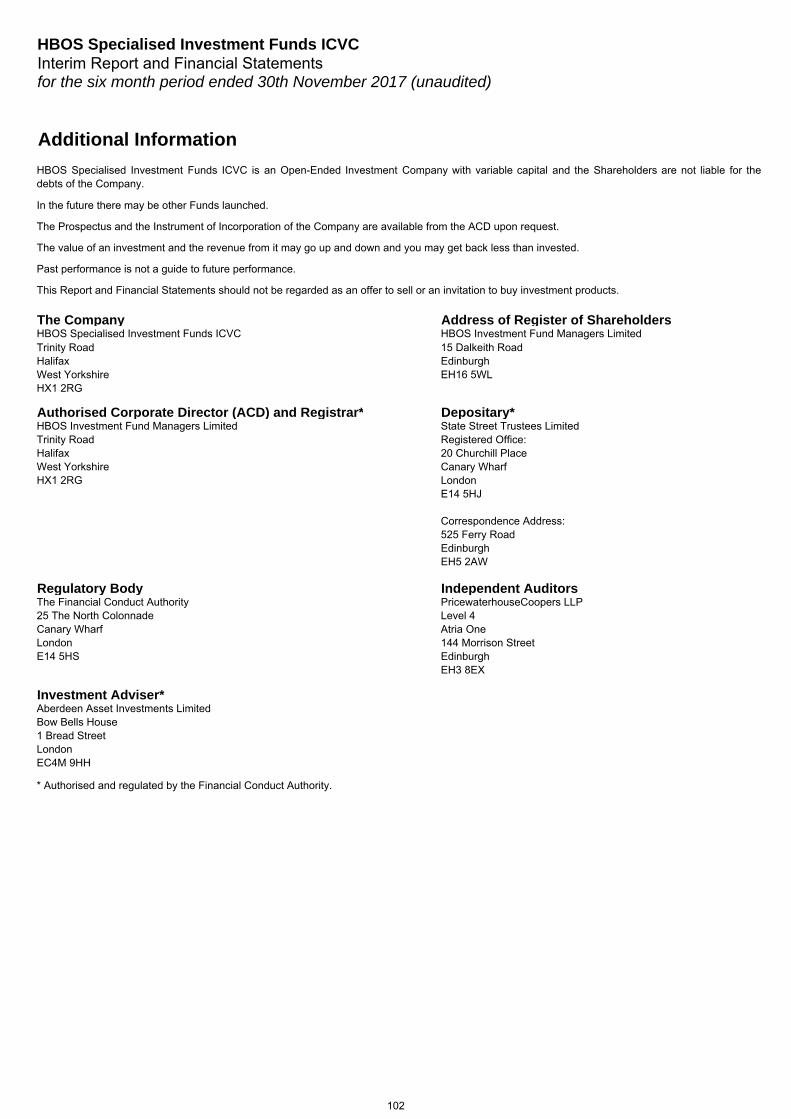
HBOS Specialised Investment Funds ICVCInterim Report and Financial Statementsfor the six month period ended 30th November 2017 (unaudited)
Additional Information
* Authorised and regulated by the Financial Conduct Authority.
Aberdeen Asset Investments LimitedBow Bells House1 Bread StreetLondonEC4M 9HH
Investment Adviser*
Authorised Corporate Director (ACD) and Registrar* Depositary*HBOS Investment Fund Managers LimitedTrinity RoadHalifaxWest Yorkshire HX1 2RG
Regulatory Body Independent AuditorsThe Financial Conduct Authority25 The North ColonnadeCanary WharfLondon E14 5HS
PricewaterhouseCoopers LLPLevel 4Atria One 144 Morrison Street Edinburgh EH3 8EX
State Street Trustees LimitedRegistered Office:20 Churchill PlaceCanary WharfLondonE14 5HJ
Correspondence Address:525 Ferry RoadEdinburghEH5 2AW
Address of Register of Shareholders
15 Dalkeith RoadEdinburghEH16 5WL
Trinity RoadHalifaxWest Yorkshire HX1 2RG
The CompanyHBOS Specialised Investment Funds ICVC HBOS Investment Fund Managers Limited
This Report and Financial Statements should not be regarded as an offer to sell or an invitation to buy investment products.
The Prospectus and the Instrument of Incorporation of the Company are available from the ACD upon request.
The value of an investment and the revenue from it may go up and down and you may get back less than invested.
Past performance is not a guide to future performance.
HBOS Specialised Investment Funds ICVC is an Open-Ended Investment Company with variable capital and the Shareholders are not liable for thedebts of the Company.
In the future there may be other Funds launched.
102

HBOS Investment Fund Managers Limited (Registered in England No. 941082). Registered Office: Trinity Road, Halifax, West Yorkshire HX1 2RG. Authorised and regulated by the Financial Conduct Authority.
49130 RANDA 01/18