hbos uk investment funds icvc...hbos uk investment funds icvc annual report and financial statements...
TRANSCRIPT
HBOS UK Investment Funds ICVCAnnual Report and Financial Statements
for the year ended 31 January 2014
HBOS UK Investment Funds ICVCAnnual Report and Financial Statementsfor the year ended 31 January 2014
ContentsIntroduction 2
Director's Report and Statement 3
Independent Auditors' Report 5
Statement of the Authorised Corporate Director's (ACD's) Responsibilities 7
Statement of the Depositary's Responsibilities and Report of the Depositary 7
Aggregated Annual Financial Statements 8
Investment markets overview, Performance record, Portfolio statement and Financial statements:
Corporate Bond Fund 10
UK Equity Income Fund 23
UK FTSE 100 Index Tracking Fund 35
UK FTSE All Share Index Tracking Fund 46
UK Growth Fund 68
Notes to the Aggregated and Fund Financial Statements 90
Distribution Tables 108
Additional Information 122
HBOS UK Investment Funds ICVCAnnual Report and Financial Statementsfor the year ended 31 January 2014
Introduction
Annual Report and Financial Statements
About the Company
The Corporate Bond Fund was launched on 11 September 2002.
The following four Funds were launched on 3 November 2000 following the conversion of four existing unit trusts:
UK Equity Income FundUK FTSE 100 Index Tracking FundUK FTSE All-Share Index Tracking FundUK Growth Fund
We are pleased to present the Annual Report and Financial Statements for the HBOS UK Investment Funds ICVC (“the Company”) for the year ended 31January 2014. The financial statements have been prepared on an aggregated basis including all Funds as permitted by the Financial Conduct Authority's(''the FCA'') Collective Investment Schemes sourcebook (“the COLL sourcebook”).
As required by the COLL sourcebook, information for each of the five Funds has also been included.
The HBOS UK Investment Funds ICVC is an Open-Ended Investment Company (“OEIC”) with variable capital incorporated in England and Wales andauthorised by the Financial Conduct Authority “the FCA” (previously the Financial Services Authority “the FSA”) from 20 September 2000. The Companyis managed by HBOS Investment Fund Managers Limited, the Authorised Corporate Director (“the ACD”), who is responsible for the day to day running ofthe Company including the preparation of interim and annual reports. The property of the Company is entrusted to State Street Trustees Limited (“theDepositary”).
The objective of the Company is to invest the Scheme Property in transferable securities, money market instruments, cash and near cash, derivatives andforward transactions, deposits and units (as defined in the soucebook) in collective investment schemes in accordance with the COLL sourcebook withthe aim of spreading investment risk and giving its shareholders the benefit of the results of the management of that property. The Shareholders are notliable for the debts of the Company.
The Company is a UCITS scheme operating in accordance with the COLL sourcebook and is structured as an umbrella company, as defined in the Open-Ended Investment Company Regulations 2001 (“the OEIC Regulations”), in that it currently contains five Funds, each with different investment objectives.New Funds may be established from time to time by the ACD with the approval of the FCA. Within the financial statements there is an investment reviewfor each Fund as at 31 January 2014, which includes details of the investment objectives.
2
HBOS UK Investment Funds ICVCAnnual Report and Financial Statementsfor the year ended 31 January 2014
Director's Report and Statement
Director's Report
Prospectus changes
● With effect from 6 April 2013 the dilution adjustment basis for the Funds was changed so that the ACD may now make a dilution adjustment under thefollowing circumstances:– on a Fund where there is a net inflow or net outflow on any Dealing Day; or– in any other case where the ACD believes that the imposition of a dilution adjustment is required to safeguard the interests of continuingShareholders;
● The wording in the Prospectus was updated on 6 April 2013 to explain the method used for the calculation of the global exposure of derivative andforward transactions that may be used by the Funds;
● The wording in the Prospectus was updated on 6 April 2013 to show the current Annual Management Charge for Share Classes C, D and F for theUK FTSE 100 Index Tracking Fund and UK FTSE All Share Index Tracking Fund had been reduced to 1% per annum;
● With effect from 2 December 2013, the Company's Prospectus and Instrument of Incorporation were updated to reflect recent regulations which wereintroduced for UK open-ended investment companies (OEICs), known as the Protected Cell Regulations (PCR). As a result of the new regulations,OEICs which have a number of sub-funds - such as the Company - now benefit from ring-fencing provisions which mean that the assets of a sub-fundbelong exclusively to that sub-fund and may not be used for any other purpose. As a result, in the event that a sub-fund is unable to meet its ownliabilities, the assets of other sub-funds cannot be used. Effectively, therefore, the new regulations introduce further protection for individual sub-funds. As a result of these protections, it is now also possible for a sub-fund of the Company to invest in another sub-fund of the Company (subject tothe investment policy and existing investment and borrowing powers of the investing sub-fund);
● The wording in the Prospectus was updated on 2 December 2013 to make it clear that no redemption charge applies to Share Class D of the UKFTSE 100 Index Tracking Fund; and
● With effect from 2 December 2013, the eligible securities and derivatives markets were updated.
A copy of the Prospectus is available on request.
Important information
Changes within our investment management business.
Importantly, as part of the sale agreement the Group and Aberdeen have entered into a long-term strategic asset management relationship whereby Aberdeen continues to manage assets on behalf of the Group. This means that you do not need to take any action as a result of the sale and there is no immediate change to the name of the funds you invest in or their aims, risks and objectives.
New Funds may be established from time to time by the ACD with the approval of the FCA and Depositary.
On Monday 18th November 2013, Lloyds Banking Group (the ‘Group’) announced that, having conducted a strategic review of its investment management activities, it had concluded that another owner would be better able to develop and commercialise further the strong capabilities that exist within Scottish Widows Investment Partnership (SWIP).
As a result, the Group agreed to sell SWIP to Aberdeen Asset Management (‘Aberdeen’). The sale was completed on Monday 31st March 2014. The sale only involves the Group’s asset management business and does not directly impact Scottish Widows or HBOS Investment Fund Managers Limited. In time, following a transitional period, the SWIP brand will no longer be used.
HBOS Investment Fund Managers Limited is the Authorised Corporate Director (“the ACD”) and Registrar for the HBOS UK Investment Funds ICVC.HBOS Investment Fund Managers Limited is authorised and regulated by the Financial Conduct Authority (“the FCA”). The ACD is the sole director.
During the year and up to the date of this report, the following changes were made to the Company and therefore the following changes were reflected inthe Prospectus of HBOS UK Investment Funds ICVC:
The HBOS UK Investment Funds ICVC is an Open-Ended Investment Company with variable capital under Regulation 12 (Authorisation) of the Open-Ended Investment Companies Regulations 2001. It is a UCITS scheme and is structured as an umbrella scheme with five Funds. The shareholders arenot liable for any debts of the Company.
The assets of each Fund are separate from those of every other Fund and are invested in accordance with the investment objective and investmentpolicy applicable to that Fund. The investment objective for each of the five Funds, together with the ACD's policy for achieving those objectives and areview of the investment activities during the year, is set out in the respective investment market overview in this report.
During the year there have been a number of changes to the company:
These changes are detailed below in the section Prospectus changes.
The assets of each Fund belong exclusively to that Fund and shall not be used or made available to discharge (directly or indirectly) the liabilities of, orclaims against, any other person or body, including the Company and any other Fund and shall not be available for such purpose.
The ultimate parent undertaking of the ACD is Lloyds Banking Group plc.
The statement of the ACD's Responsibilities is set out on page 7 of this report. The names and addresses of the ACD, the Depositary, the Investment Adviser, the Registrar and the Independent Auditors can be found on page 122 of this report.
3
HBOS UK Investment Funds ICVCAnnual Report and Financial Statementsfor the year ended 31 January 2014
Director's Report and Statement (continued)
Director's Statement
DirectorHBOS Investment Fund Managers Limited14 April 2014
Robert Fletcher
In accordance with the rules in the Collective Investment Schemes sourcebook as issued and amended by the Financial Conduct Authority, I herebyapprove the report and financial statements on behalf of the Authorised Corporate Director of the HBOS UK Investment Funds ICVC.
4
HBOS UK Investment Funds ICVCAnnual Report and Financial Statementsfor the year ended 31 January 2014
Report on the financial statements - Our opinion
● give a true and fair view of the financial position of the Company and each of the sub-funds as at 31 January 2014 and of the net revenue and the netcapital gains/(losses) of the scheme property of the Company and each of the sub-funds for the year then ended; and
● have been properly prepared in accordance with United Kingdom Generally Accepted Accounting Practice, the Statement of Recommended Practicefor Authorised Funds, the Collective Investment Schemes sourcebook and the Instrument of Incorporation.
What we have audited
● the aggregated balance sheet of the Company as at 31 January 2014;● the aggregated statement of total return of the Company for the year then ended;● the aggregated statement of change in net assets attributable to shareholders of the Company for the year then ended;● the balance sheets as at 31 January 2014 together with the statements of total return and statements of changes in net assets attributable to
shareholders for each of the Company’s sub-funds;● the notes to the Company’s financial statements and each of the Company’s sub-funds, which include a summary of significant accounting policies
and other explanatory information; and● the distribution tables.
What an audit of financial statements involves
● whether the accounting policies are appropriate to the Company’s circumstances and have been consistently applied and adequately disclosed;● the reasonableness of significant accounting estimates made by the Authorised Corporate Director; and ● the overall presentation of the financial statements.
Independent Auditors' Report to the shareholders of HBOS UK Investment Funds ICVC (“the Company”)
This opinion is to be read in the context of what we say in the remainder of this report.
The financial statements, which are prepared by HBOS UK Investment Funds ICVC (the “Company”), comprise:
In our opinion the financial statements, defined below:
The financial reporting framework that has been applied in their preparation is applicable law and United Kingdom Accounting Standards (UnitedKingdom Generally Accepted Accounting Practice), the Statement of Recommended Practice ‘Financial Statements of Authorised Funds’ issued by theInvestment Management Association (the “Statement of Recommended Practice for Authorised Funds”), the Collective Investment Schemes sourcebookand the Instrument of Incorporation.
In applying the financial reporting framework, the directors have made a number of subjective judgements, for example in respect of significantaccounting estimates. In making such estimates, they have made assumptions and considered future events.
We conducted our audit in accordance with International Standards on Auditing (UK and Ireland) (ISAs (UK & Ireland)). An audit involves obtainingevidence about the amounts and disclosures in the financial statements sufficient to give reasonable assurance that the financial statements are freefrom material misstatement, whether caused by fraud or error.
This includes an assessment of:
In addition, we read all the financial and non-financial information in the Annual Report and Financial Statements (the “Annual Report”) to identify materialinconsistencies with the audited financial statements and to identify any information that is apparently materially incorrect based on, or materiallyinconsistent with, the knowledge acquired by us in the course of performing the audit. If we become aware of any apparent material misstatements orinconsistencies we consider the implications for our report.
5
HBOS UK Investment Funds ICVCAnnual Report and Financial Statementsfor the year ended 31 January 2014
Opinions on matters prescribed by the Collective Investment Schemes sourcebook
● we have obtained all the information and explanations we consider necessary for the purposes of the audit; and● the information given in the Authorised Corporate Director’s Report for the financial year for which the financial statements are prepared is consistent
with the financial statements.
● proper accounting records have not been kept; or● the financial statements are not in agreement with the accounting records and returns.
PricewaterhouseCoopers LLPChartered Accountants & Statutory AuditorsEdinburgh
We do not, in giving these opinions, accept or assume responsibility for any other purpose or to any other person to whom this report is shown or intowhose hands it may come save where expressly agreed by our prior consent in writing.
Responsibilities for the financial statements and the audit - Our responsibilities and those of the Authorised Corporate Director
As explained more fully in the Authorised Corporate Director’s Responsibilities Statement set out on page 7, the Authorised Corporate Director isresponsible for the preparation of the financial statements and for being satisfied that they give a true and fair view.
Our responsibility is to audit and express an opinion on the financial statements in accordance with applicable law and ISAs (UK & Ireland). Thosestandards require us to comply with the Auditing Practices Board’s Ethical Standards for Auditors.
Other matters on which we are required to report by exception - Adequacy of accounting records and information and explanations received
Under the Collective Investment Schemes sourcebook we are required to report to you if, in our opinion:
We have no exceptions to report arising from this responsibility.
This report, including the opinions, has been prepared for and only for the Company’s members as a body in accordance with paragraph 4.5.12 of theCollective Investment Schemes sourcebook as required by paragraph 67(2) of the Open-Ended Investment Companies Regulations 2001 and for noother purpose.
Independent Auditors' Report to the shareholders of HBOS UK Investment Funds ICVC (“the Company”) (continued)
In our opinion:
The maintenance and integrity of the Halifax (www.halifax.co.uk) and Scottish Widows (www.scottishwidows.co.uk) websites are the responsibility of thedirectors; the work carried out by the auditors does not involve consideration of these matters and, accordingly, the auditors accept no responsibility forany changes that may have occurred to the financial statements since they were initially presented on the website. Legislation in the United Kingdomgoverning the preparation and dissemination of financial statements may differ from legislation in other jurisdictions.
14 April 2014
6
HBOS UK Investment Funds ICVCAnnual Report and Financial Statementsfor the year ended 31 January 2014
Statement of the Authorised Corporate Director's (ACD's) Responsibilities
● select suitable accounting policies and then apply them consistently;
● make judgments and estimates that are reasonable and prudent;
● comply with the disclosure requirements of the Statement of Recommended Practice relating to the Financial Statements of Authorised Funds issuedby the Investment Management Association in October 2010;
● follow generally accepted UK accounting principles and applicable UK accounting standards; and
● prepare the financial statements on the going concern basis unless it is inappropriate to presume that the Company will continue in operation.
i) has carried out the issue, sale, redemption and cancellation, and calculation of the price of the Company's shares and the application of theCompany's revenue in accordance with COLL and, where applicable, the OEIC Regulations, the Instrument of Incorporation and Prospectus of theCompany, and;
ii) has observed the investment and borrowing powers and restrictions applicable to the Company.
State Street Trustees Limited15 April 2014
The ACD is responsible for keeping proper accounting records and for the management of the Company in accordance with its Instrument ofIncorporation, the Prospectus and the FCA Rules.
The ACD has general responsibility for taking such steps as are reasonably open to it to prevent and detect fraud and other irregularities.
Statement of the Depositary's responsibilities in respect of the Scheme
The Depositary is responsible for the safekeeping of all of the property of the Company (other than tangible moveable property) which is entrusted to itand for the collection of revenue that arises from that property.
It is the duty of the Depositary to take reasonable care to ensure that the Company is managed in accordance with the Financial Conduct Authority'sCollective Investment Schemes sourcebook (COLL), as amended, the Open-Ended Investment Companies Regulations 2001 (SI 2001/1228), asamended ("the OEIC Regulations"), the Company's Instrument of Incorporation and Prospectus, in relation to the pricing of, and dealings in, shares in theCompany; the application of revenue of the Company; and the investment and borrowing powers applicable to the Company.
Reports of the Depositary to the shareholders of the HBOS UK Investment Funds ICVC (''the Company'') for the year to31 January 2014
Having carried out such procedures as we considered necessary to discharge our responsibilities as Depositary of the Company, it is our opinion, basedon the information available to us and the explanations provided, that in all material respects the Company, acting through the Authorised CorporateDirector:
Statement and Reports
Statement of the Depositary's responsibilities and Report of the Depositary to the shareholders of the HBOS UK Investment Funds ICVC (“the Company”)
The rules in the Collective Investment Schemes sourcebook issued by the Financial Conduct Authority ("the FCA") require the ACD to prepare financialstatements for each accounting period which give a true and fair view of the financial position of the Company and of the net revenue and net gains andlosses on the property of the Company for the year then ended. In preparing the financial statements the ACD is required to:
7
HBOS UK Investment Funds ICVCAnnual Report and Financial Statementsfor the year ended 31 January 2014
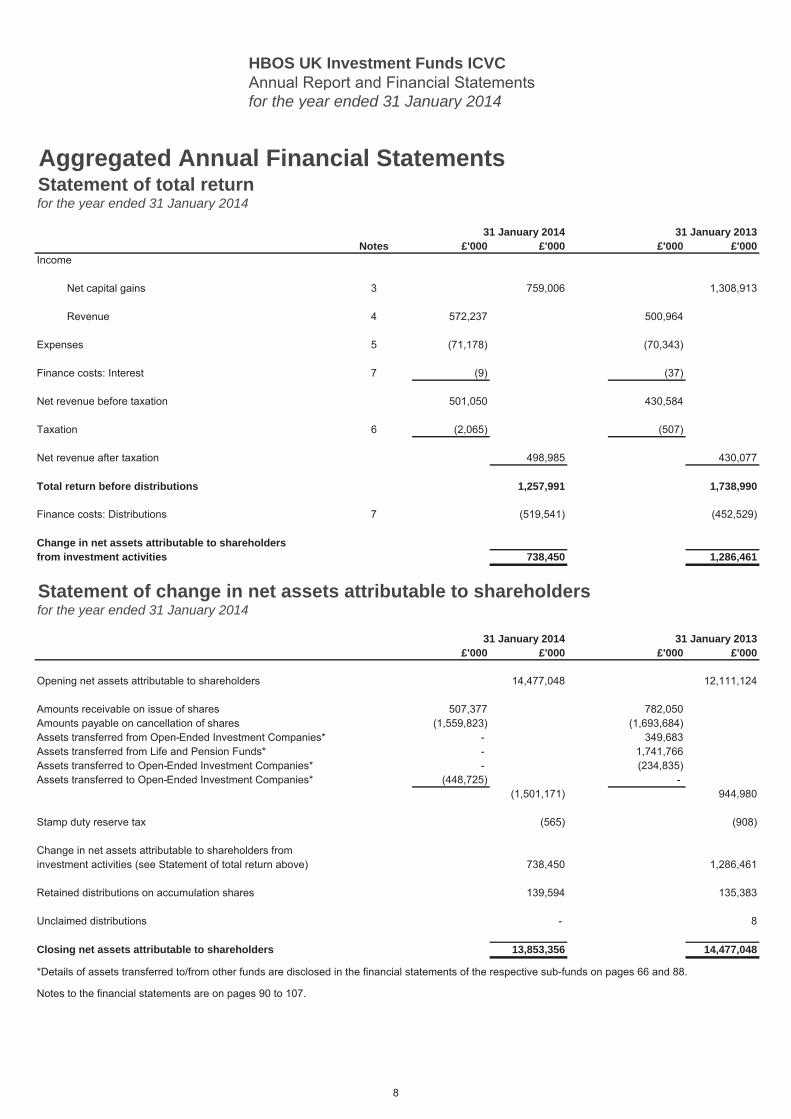
Aggregated Annual Financial StatementsStatement of total returnfor the year ended 31 January 2014
31 January 2014 31 January 2013Notes £'000 £'000 £'000 £'000
Income
Net capital gains 3 759,006 1,308,913
Revenue 4 572,237 500,964
Expenses 5 (71,178) (70,343)
Finance costs: Interest 7 (9) (37)
Net revenue before taxation 501,050 430,584
Taxation 6 (2,065) (507)
Net revenue after taxation 498,985 430,077
Total return before distributions 1,257,991 1,738,990
Finance costs: Distributions 7 (519,541) (452,529)
Change in net assets attributable to shareholdersfrom investment activities 738,450 1,286,461
Statement of change in net assets attributable to shareholdersfor the year ended 31 January 2014
31 January 2014 31 January 2013£'000 £'000 £'000 £'000
Opening net assets attributable to shareholders 14,477,048 12,111,124
Amounts receivable on issue of shares 507,377 782,050Amounts payable on cancellation of shares (1,559,823) (1,693,684)Assets transferred from Open-Ended Investment Companies* - 349,683Assets transferred from Life and Pension Funds* - 1,741,766Assets transferred to Open-Ended Investment Companies* - (234,835)Assets transferred to Open-Ended Investment Companies* (448,725) -
(1,501,171) 944,980
Stamp duty reserve tax (565) (908)
Change in net assets attributable to shareholders frominvestment activities (see Statement of total return above) 738,450 1,286,461
Retained distributions on accumulation shares 139,594 135,383
Unclaimed distributions - 8
Closing net assets attributable to shareholders 13,853,356 14,477,048
Notes to the financial statements are on pages 90 to 107.
*Details of assets transferred to/from other funds are disclosed in the financial statements of the respective sub-funds on pages 66 and 88.
8
HBOS UK Investment Funds ICVCAnnual Report and Financial Statementsfor the year ended 31 January 2014
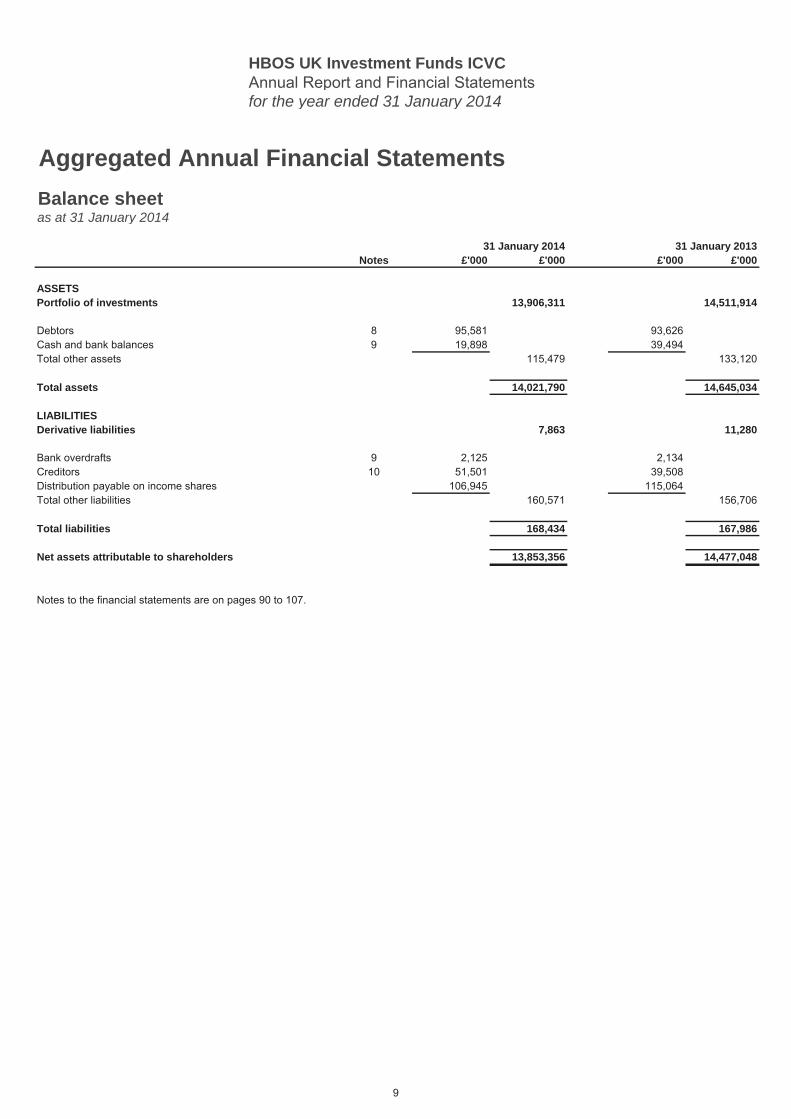
Aggregated Annual Financial StatementsBalance sheetas at 31 January 2014
31 January 2014 31 January 2013Notes £'000 £'000 £'000 £'000
ASSETSPortfolio of investments 13,906,311 14,511,914
Debtors 8 95,581 93,626Cash and bank balances 9 19,898 39,494Total other assets 115,479 133,120
Total assets 14,021,790 14,645,034
LIABILITIESDerivative liabilities 7,863 11,280
Bank overdrafts 9 2,125 2,134Creditors 10 51,501 39,508Distribution payable on income shares 106,945 115,064Total other liabilities 160,571 156,706
Total liabilities 168,434 167,986
Net assets attributable to shareholders 13,853,356 14,477,048
Notes to the financial statements are on pages 90 to 107.
9
HBOS UK Investment Funds ICVCAnnual Report and Financial Statementsfor the year ended 31 January 2014
Corporate Bond FundInvestment markets overview Investment objective
Investment policy
UCITS scheme
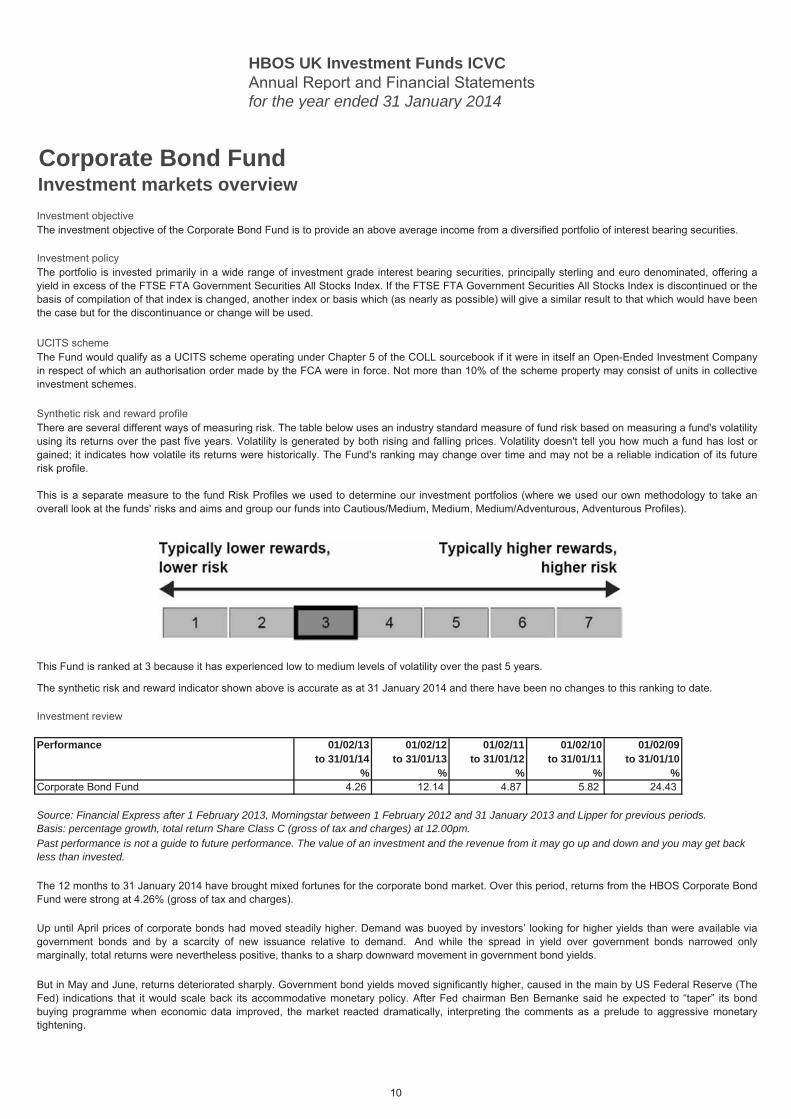
Synthetic risk and reward profile
Investment review
Performance 01/02/13 01/02/12 01/02/11 01/02/10 01/02/09 01/02/08to 31/01/14 to 31/01/13 to 31/01/12 to 31/01/11 to 31/01/10 to 31/01/09
% % % % % %Corporate Bond Fund 4.26 12.14 4.87 5.82 24.43
Source: Financial Express after 1 February 2013, Morningstar between 1 February 2012 and 31 January 2013 and Lipper for previous periods.Basis: percentage growth, total return Share Class C (gross of tax and charges) at 12.00pm.Past performance is not a guide to future performance. The value of an investment and the revenue from it may go up and down and you may get back less than invested.
The 12 months to 31 January 2014 have brought mixed fortunes for the corporate bond market. Over this period, returns from the HBOS Corporate BondFund were strong at 4.26% (gross of tax and charges).
Up until April prices of corporate bonds had moved steadily higher. Demand was buoyed by investors’ looking for higher yields than were available viagovernment bonds and by a scarcity of new issuance relative to demand. And while the spread in yield over government bonds narrowed onlymarginally, total returns were nevertheless positive, thanks to a sharp downward movement in government bond yields.
But in May and June, returns deteriorated sharply. Government bond yields moved significantly higher, caused in the main by US Federal Reserve (TheFed) indications that it would scale back its accommodative monetary policy. After Fed chairman Ben Bernanke said he expected to “taper” its bondbuying programme when economic data improved, the market reacted dramatically, interpreting the comments as a prelude to aggressive monetarytightening.
The investment objective of the Corporate Bond Fund is to provide an above average income from a diversified portfolio of interest bearing securities.
The portfolio is invested primarily in a wide range of investment grade interest bearing securities, principally sterling and euro denominated, offering ayield in excess of the FTSE FTA Government Securities All Stocks Index. If the FTSE FTA Government Securities All Stocks Index is discontinued or thebasis of compilation of that index is changed, another index or basis which (as nearly as possible) will give a similar result to that which would have beenthe case but for the discontinuance or change will be used.
There are several different ways of measuring risk. The table below uses an industry standard measure of fund risk based on measuring a fund's volatilityusing its returns over the past five years. Volatility is generated by both rising and falling prices. Volatility doesn't tell you how much a fund has lost orgained; it indicates how volatile its returns were historically. The Fund's ranking may change over time and may not be a reliable indication of its futurerisk profile.
This is a separate measure to the fund Risk Profiles we used to determine our investment portfolios (where we used our own methodology to take anoverall look at the funds' risks and aims and group our funds into Cautious/Medium, Medium, Medium/Adventurous, Adventurous Profiles).
This Fund is ranked at 3 because it has experienced low to medium levels of volatility over the past 5 years.
The synthetic risk and reward indicator shown above is accurate as at 31 January 2014 and there have been no changes to this ranking to date.
The Fund would qualify as a UCITS scheme operating under Chapter 5 of the COLL sourcebook if it were in itself an Open-Ended Investment Companyin respect of which an authorisation order made by the FCA were in force. Not more than 10% of the scheme property may consist of units in collectiveinvestment schemes.
10
HBOS UK Investment Funds ICVCAnnual Report and Financial Statementsfor the year ended 31 January 2014
Corporate Bond FundInvestment markets overview (continued)Investment review (continued)
Investment markets and conditions can change rapidly and as such the views expressed should not be taken as statements of fact nor should reliancebe placed on these views when making investment decisions.
Corporate bonds, both investment grade and high yield, outperformed government bonds in the latter part of 2013. In the third quarter, while governmentbonds moved higher, this was accompanied by a significant tightening of credit spreads, meaning overall returns were positive. That tightening waslargely due to a rise in investor confidence following a series of better-than-expected economic data. Sovereign yields continued to rise in the final threemonths of 2013. Yield spreads over government bonds narrowed considerably, but the rise in sovereign yields was such that overall returns from creditwere only marginally positive. There were pockets of excellence; high-yielding bonds were strongly positive and higher beta instruments such assubordinated bank debt and corporate hybrids delivered healthy returns. The fund benefited from exposure to these areas of the market.
In January 2014, government bonds in core areas of the eurozone benefited from a flight to quality as investors became increasingly nervous abouteconomic conditions in the emerging markets. Meanwhile, yield spreads widened significantly in the latter part of the month – again a result of emergingmarket turmoil.
Hybrid new issues have been a notable theme during 2013, as investors migrate along the risk curve in the search for yield. Hybrid bonds are anincreasingly important part of the market. The Fund’s purchases in this area included a sterling issue from Pennon, owners of South West Water, and aeuro-denominated issue from Hutchison Whampoa.
Scottish Widows Investment Partnership LimitedFebruary 2014
Early in the review period, trades to reduce portfolio risk included the sale of HSBC lower Tier 2 debt. The Fund reduced its exposure to G4S, the securityservices company.The holding in Telecom Italia was also reduced as the utility could be subject to a ratings downgrade in the coming months.
Recent trades included the sale of sold senior financial bonds including Goldman Sachs in favour of covered bonds including Abbey National. We boughtMitchell & Butler, a securitisation of the cash flows from a public house estate. We think the bond has a strong structure and offers a healthy yield overgovernment bonds. We also bought BHP Billiton 2024. This is a high quality low risk bond, with a decent yield pick-up compared to government bonds.
The Fund benefited from being short duration over the review period as core government bond yields moved higher. A further improvement in developedeconomies should see rates move higher on a longer term view. The Fund is currently overweight in high yield bonds. These represent good value giventhe relatively low default rate. Looking ahead, the fund managers are looking to take advantage of attractive valuations following the recent sell-off andselectively add risk in the coming months.
11
HBOS UK Investment Funds ICVCAnnual Report and Financial Statementsfor the year ended 31 January 2014
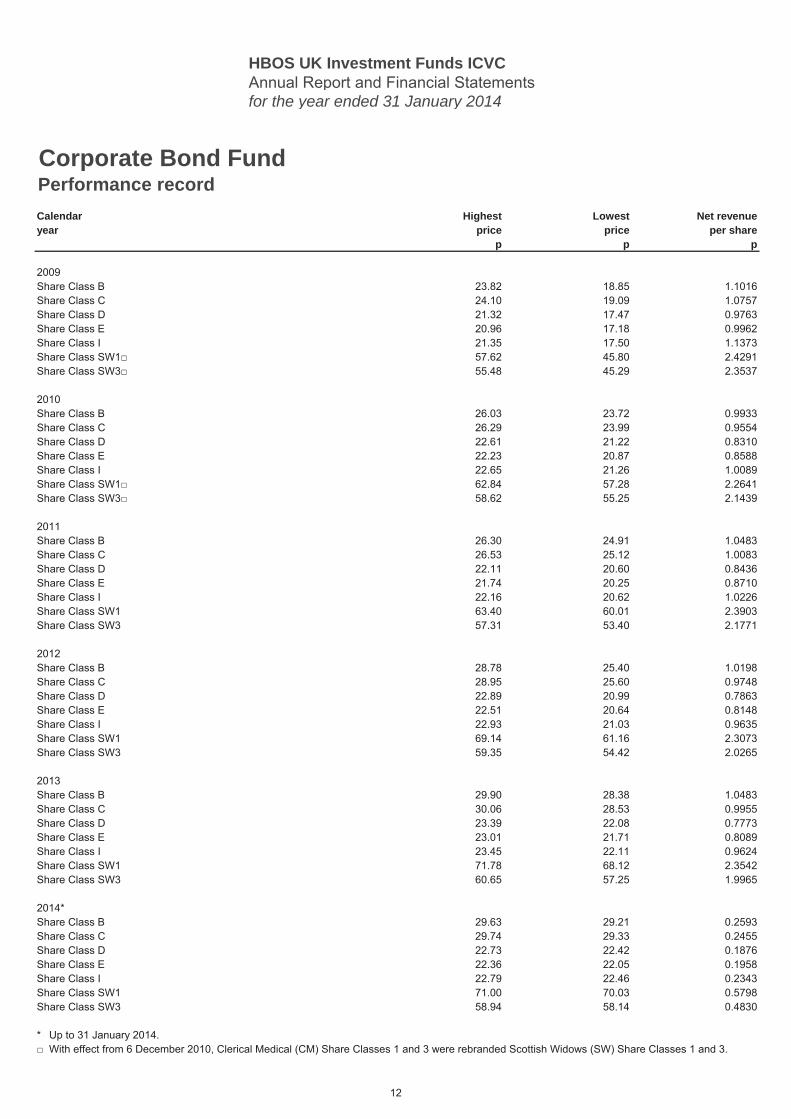
Corporate Bond FundPerformance recordCalendar Highest Lowest Net revenueyear price price per share
p p p
2009Share Class B 23.82 18.85 1.1016Share Class C 24.10 19.09 1.0757Share Class D 21.32 17.47 0.9763Share Class E 20.96 17.18 0.9962Share Class I 21.35 17.50 1.1373Share Class SW1□ 57.62 45.80 2.4291Share Class SW3□ 55.48 45.29 2.3537
2010Share Class B 26.03 23.72 0.9933Share Class C 26.29 23.99 0.9554Share Class D 22.61 21.22 0.8310Share Class E 22.23 20.87 0.8588Share Class I 22.65 21.26 1.0089Share Class SW1□ 62.84 57.28 2.2641Share Class SW3□ 58.62 55.25 2.1439
2011Share Class B 26.30 24.91 1.0483Share Class C 26.53 25.12 1.0083Share Class D 22.11 20.60 0.8436Share Class E 21.74 20.25 0.8710Share Class I 22.16 20.62 1.0226Share Class SW1 63.40 60.01 2.3903Share Class SW3 57.31 53.40 2.1771
2012Share Class B 28.78 25.40 1.0198Share Class C 28.95 25.60 0.9748Share Class D 22.89 20.99 0.7863Share Class E 22.51 20.64 0.8148Share Class I 22.93 21.03 0.9635Share Class SW1 69.14 61.16 2.3073Share Class SW3 59.35 54.42 2.0265
2013Share Class B 29.90 28.38 1.0483Share Class C 30.06 28.53 0.9955Share Class D 23.39 22.08 0.7773Share Class E 23.01 21.71 0.8089Share Class I 23.45 22.11 0.9624Share Class SW1 71.78 68.12 2.3542Share Class SW3 60.65 57.25 1.9965
2014*Share Class B 29.63 29.21 0.2593Share Class C 29.74 29.33 0.2455Share Class D 22.73 22.42 0.1876Share Class E 22.36 22.05 0.1958Share Class I 22.79 22.46 0.2343Share Class SW1 71.00 70.03 0.5798Share Class SW3 58.94 58.14 0.4830
*□
Up to 31 January 2014.With effect from 6 December 2010, Clerical Medical (CM) Share Classes 1 and 3 were rebranded Scottish Widows (SW) Share Classes 1 and 3.
12
HBOS UK Investment Funds ICVCAnnual Report and Financial Statementsfor the year ended 31 January 2014
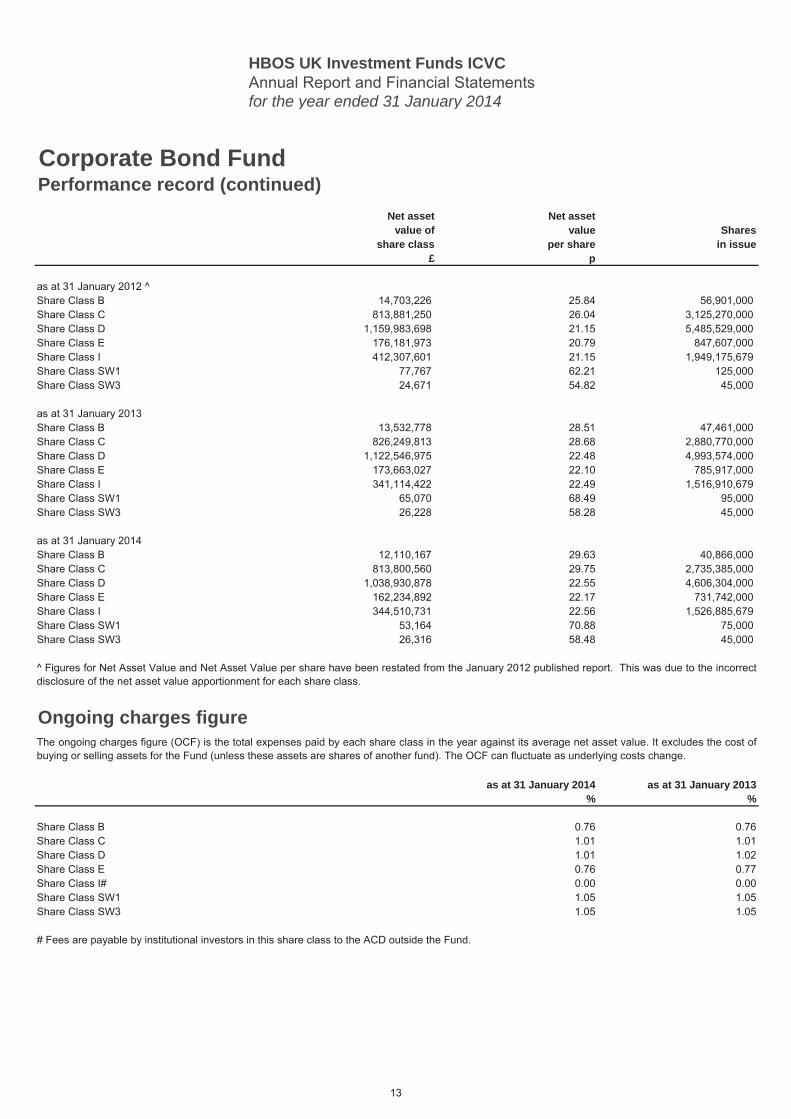
Corporate Bond FundPerformance record (continued)
Net asset Net assetvalue of value Shares
share class per share in issue£ p
Share Class B 14,703,226 25.84 56,901,000Share Class C 813,881,250 26.04 3,125,270,000Share Class D 1,159,983,698 21.15 5,485,529,000Share Class E 176,181,973 20.79 847,607,000Share Class I 412,307,601 21.15 1,949,175,679Share Class SW1 77,767 62.21 125,000Share Class SW3 24,671 54.82 45,000
Share Class B 13,532,778 28.51 47,461,000Share Class C 826,249,813 28.68 2,880,770,000Share Class D 1,122,546,975 22.48 4,993,574,000Share Class E 173,663,027 22.10 785,917,000Share Class I 341,114,422 22.49 1,516,910,679Share Class SW1 65,070 68.49 95,000Share Class SW3 26,228 58.28 45,000
Share Class B 12,110,167 29.63 40,866,000Share Class C 813,800,560 29.75 2,735,385,000Share Class D 1,038,930,878 22.55 4,606,304,000Share Class E 162,234,892 22.17 731,742,000Share Class I 344,510,731 22.56 1,526,885,679Share Class SW1 53,164 70.88 75,000Share Class SW3 26,316 58.48 45,000
Ongoing charges figure
as at 31 January 2014 as at 31 January 2013% %
Share Class B 0.76 0.76Share Class C 1.01 1.01Share Class D 1.01 1.02Share Class E 0.76 0.77Share Class I# 0.00 0.00Share Class SW1 1.05 1.05Share Class SW3 1.05 1.05
as at 31 January 2012 ^
as at 31 January 2013
as at 31 January 2014
The ongoing charges figure (OCF) is the total expenses paid by each share class in the year against its average net asset value. It excludes the cost ofbuying or selling assets for the Fund (unless these assets are shares of another fund). The OCF can fluctuate as underlying costs change.
^ Figures for Net Asset Value and Net Asset Value per share have been restated from the January 2012 published report. This was due to the incorrectdisclosure of the net asset value apportionment for each share class.
# Fees are payable by institutional investors in this share class to the ACD outside the Fund.
13
HBOS UK Investment Funds ICVCAnnual Report and Financial Statementsfor the year ended 31 January 2014
Holding
MarketValue£'000
% ofNet Assets
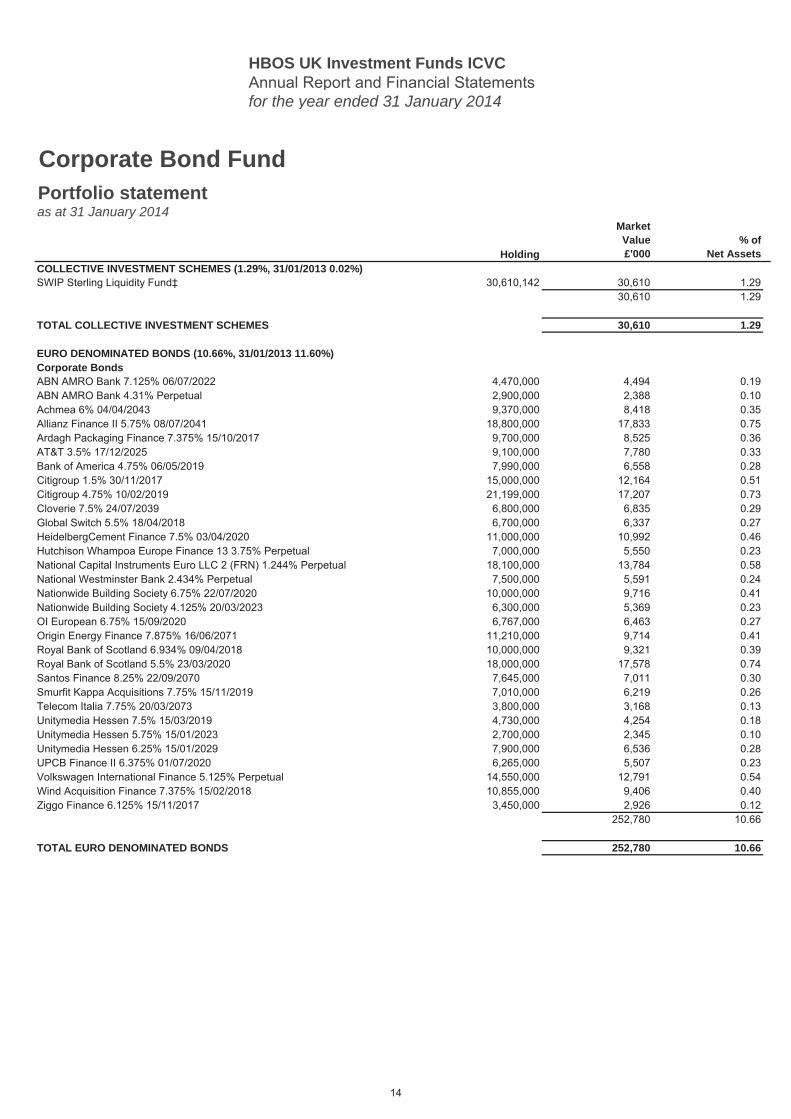
COLLECTIVE INVESTMENT SCHEMES (1.29%, 31/01/2013 0.02%) 1.29SWIP Sterling Liquidity Fund‡ 30,610,142 30,610 1.29
30,610 1.29
TOTAL COLLECTIVE INVESTMENT SCHEMES 30,610 1.29
EURO DENOMINATED BONDS (10.66%, 31/01/2013 11.60%) 10.66Corporate BondsABN AMRO Bank 7.125% 06/07/2022 4,470,000 4,494 0.19ABN AMRO Bank 4.31% Perpetual 2,900,000 2,388 0.10Achmea 6% 04/04/2043 9,370,000 8,418 0.35Allianz Finance II 5.75% 08/07/2041 18,800,000 17,833 0.75Ardagh Packaging Finance 7.375% 15/10/2017 9,700,000 8,525 0.36AT&T 3.5% 17/12/2025 9,100,000 7,780 0.33Bank of America 4.75% 06/05/2019 7,990,000 6,558 0.28Citigroup 1.5% 30/11/2017 15,000,000 12,164 0.51Citigroup 4.75% 10/02/2019 21,199,000 17,207 0.73Cloverie 7.5% 24/07/2039 6,800,000 6,835 0.29Global Switch 5.5% 18/04/2018 6,700,000 6,337 0.27HeidelbergCement Finance 7.5% 03/04/2020 11,000,000 10,992 0.46Hutchison Whampoa Europe Finance 13 3.75% Perpetual 7,000,000 5,550 0.23National Capital Instruments Euro LLC 2 (FRN) 1.244% Perpetual 18,100,000 13,784 0.58National Westminster Bank 2.434% Perpetual 7,500,000 5,591 0.24Nationwide Building Society 6.75% 22/07/2020 10,000,000 9,716 0.41Nationwide Building Society 4.125% 20/03/2023 6,300,000 5,369 0.23OI European 6.75% 15/09/2020 6,767,000 6,463 0.27Origin Energy Finance 7.875% 16/06/2071 11,210,000 9,714 0.41Royal Bank of Scotland 6.934% 09/04/2018 10,000,000 9,321 0.39Royal Bank of Scotland 5.5% 23/03/2020 18,000,000 17,578 0.74Santos Finance 8.25% 22/09/2070 7,645,000 7,011 0.30Smurfit Kappa Acquisitions 7.75% 15/11/2019 7,010,000 6,219 0.26Telecom Italia 7.75% 20/03/2073 3,800,000 3,168 0.13Unitymedia Hessen 7.5% 15/03/2019 4,730,000 4,254 0.18Unitymedia Hessen 5.75% 15/01/2023 2,700,000 2,345 0.10Unitymedia Hessen 6.25% 15/01/2029 7,900,000 6,536 0.28UPCB Finance II 6.375% 01/07/2020 6,265,000 5,507 0.23Volkswagen International Finance 5.125% Perpetual 14,550,000 12,791 0.54Wind Acquisition Finance 7.375% 15/02/2018 10,855,000 9,406 0.40Ziggo Finance 6.125% 15/11/2017 3,450,000 2,926 0.12
252,780 10.66
TOTAL EURO DENOMINATED BONDS 252,780 10.66
Corporate Bond FundPortfolio statement as at 31 January 2014
14
HBOS UK Investment Funds ICVCAnnual Report and Financial Statementsfor the year ended 31 January 2014
Holding
MarketValue£'000
% ofNet Assets
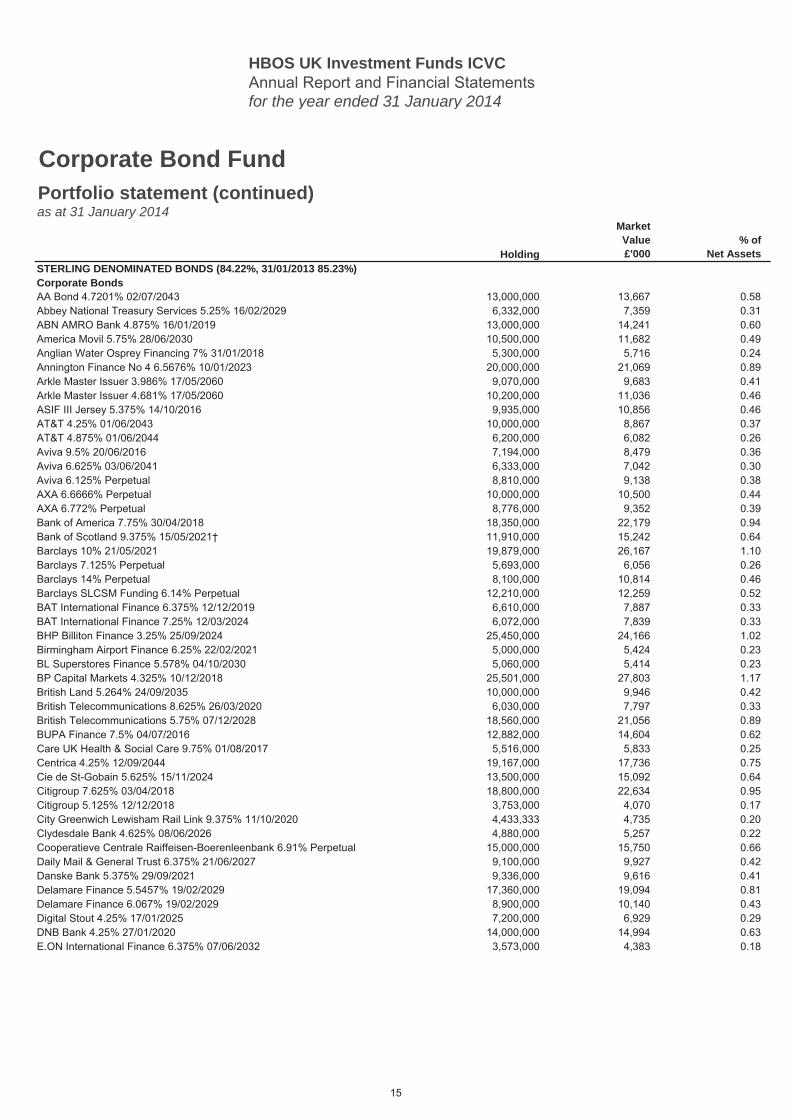
Corporate Bond FundPortfolio statement (continued)as at 31 January 2014
STERLING DENOMINATED BONDS (84.22%, 31/01/2013 85.23%) 84.22Corporate BondsAA Bond 4.7201% 02/07/2043 13,000,000 13,667 0.58Abbey National Treasury Services 5.25% 16/02/2029 6,332,000 7,359 0.31ABN AMRO Bank 4.875% 16/01/2019 13,000,000 14,241 0.60America Movil 5.75% 28/06/2030 10,500,000 11,682 0.49Anglian Water Osprey Financing 7% 31/01/2018 5,300,000 5,716 0.24Annington Finance No 4 6.5676% 10/01/2023 20,000,000 21,069 0.89Arkle Master Issuer 3.986% 17/05/2060 9,070,000 9,683 0.41Arkle Master Issuer 4.681% 17/05/2060 10,200,000 11,036 0.46ASIF III Jersey 5.375% 14/10/2016 9,935,000 10,856 0.46AT&T 4.25% 01/06/2043 10,000,000 8,867 0.37AT&T 4.875% 01/06/2044 6,200,000 6,082 0.26Aviva 9.5% 20/06/2016 7,194,000 8,479 0.36Aviva 6.625% 03/06/2041 6,333,000 7,042 0.30Aviva 6.125% Perpetual 8,810,000 9,138 0.38AXA 6.6666% Perpetual 10,000,000 10,500 0.44AXA 6.772% Perpetual 8,776,000 9,352 0.39Bank of America 7.75% 30/04/2018 18,350,000 22,179 0.94Bank of Scotland 9.375% 15/05/2021† 11,910,000 15,242 0.64Barclays 10% 21/05/2021 19,879,000 26,167 1.10Barclays 7.125% Perpetual 5,693,000 6,056 0.26Barclays 14% Perpetual 8,100,000 10,814 0.46Barclays SLCSM Funding 6.14% Perpetual 12,210,000 12,259 0.52BAT International Finance 6.375% 12/12/2019 6,610,000 7,887 0.33BAT International Finance 7.25% 12/03/2024 6,072,000 7,839 0.33BHP Billiton Finance 3.25% 25/09/2024 25,450,000 24,166 1.02Birmingham Airport Finance 6.25% 22/02/2021 5,000,000 5,424 0.23BL Superstores Finance 5.578% 04/10/2030 5,060,000 5,414 0.23BP Capital Markets 4.325% 10/12/2018 25,501,000 27,803 1.17British Land 5.264% 24/09/2035 10,000,000 9,946 0.42British Telecommunications 8.625% 26/03/2020 6,030,000 7,797 0.33British Telecommunications 5.75% 07/12/2028 18,560,000 21,056 0.89BUPA Finance 7.5% 04/07/2016 12,882,000 14,604 0.62Care UK Health & Social Care 9.75% 01/08/2017 5,516,000 5,833 0.25Centrica 4.25% 12/09/2044 19,167,000 17,736 0.75Cie de St-Gobain 5.625% 15/11/2024 13,500,000 15,092 0.64Citigroup 7.625% 03/04/2018 18,800,000 22,634 0.95Citigroup 5.125% 12/12/2018 3,753,000 4,070 0.17City Greenwich Lewisham Rail Link 9.375% 11/10/2020 4,433,333 4,735 0.20Clydesdale Bank 4.625% 08/06/2026 4,880,000 5,257 0.22Cooperatieve Centrale Raiffeisen-Boerenleenbank 6.91% Perpetual 15,000,000 15,750 0.66Daily Mail & General Trust 6.375% 21/06/2027 9,100,000 9,927 0.42Danske Bank 5.375% 29/09/2021 9,336,000 9,616 0.41Delamare Finance 5.5457% 19/02/2029 17,360,000 19,094 0.81Delamare Finance 6.067% 19/02/2029 8,900,000 10,140 0.43Digital Stout 4.25% 17/01/2025 7,200,000 6,929 0.29DNB Bank 4.25% 27/01/2020 14,000,000 14,994 0.63E.ON International Finance 6.375% 07/06/2032 3,573,000 4,383 0.18
15
HBOS UK Investment Funds ICVCAnnual Report and Financial Statementsfor the year ended 31 January 2014
Holding
MarketValue£'000
% ofNet Assets
Corporate Bond FundPortfolio statement (continued)as at 31 January 2014
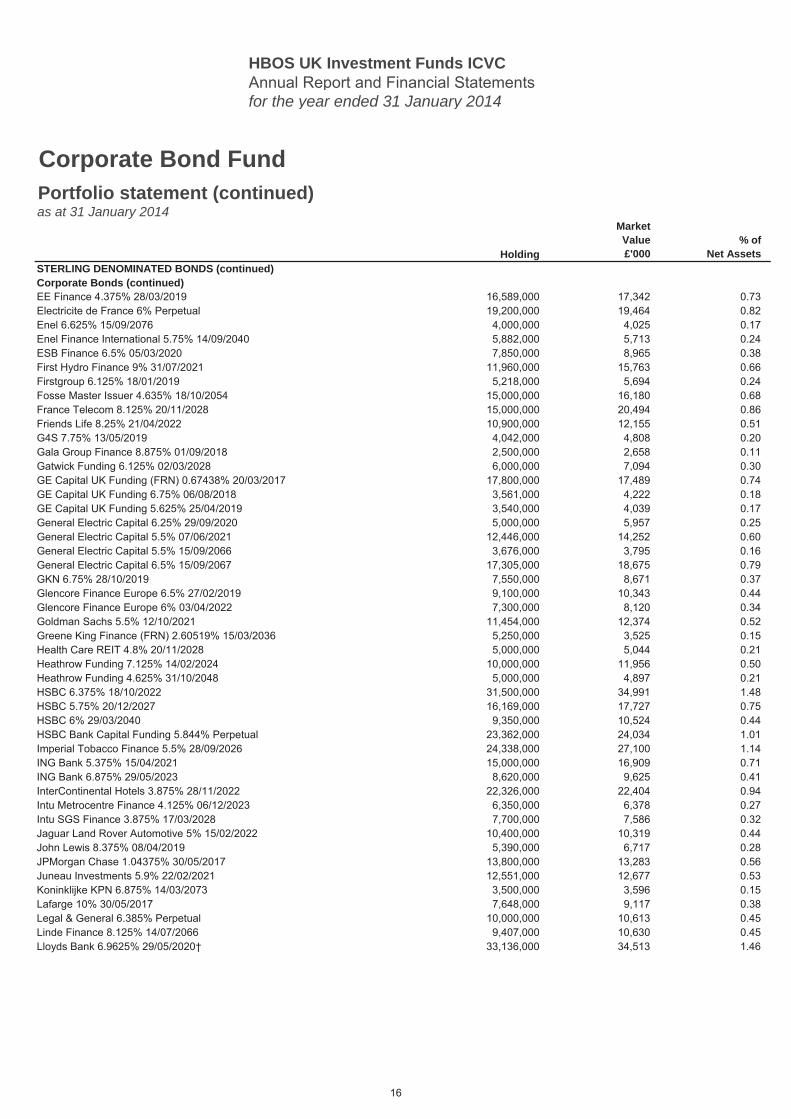
STERLING DENOMINATED BONDS (continued) 84.22Corporate Bonds (continued)EE Finance 4.375% 28/03/2019 16,589,000 17,342 0.73Electricite de France 6% Perpetual 19,200,000 19,464 0.82Enel 6.625% 15/09/2076 4,000,000 4,025 0.17Enel Finance International 5.75% 14/09/2040 5,882,000 5,713 0.24ESB Finance 6.5% 05/03/2020 7,850,000 8,965 0.38First Hydro Finance 9% 31/07/2021 11,960,000 15,763 0.66Firstgroup 6.125% 18/01/2019 5,218,000 5,694 0.24Fosse Master Issuer 4.635% 18/10/2054 15,000,000 16,180 0.68France Telecom 8.125% 20/11/2028 15,000,000 20,494 0.86Friends Life 8.25% 21/04/2022 10,900,000 12,155 0.51G4S 7.75% 13/05/2019 4,042,000 4,808 0.20Gala Group Finance 8.875% 01/09/2018 2,500,000 2,658 0.11Gatwick Funding 6.125% 02/03/2028 6,000,000 7,094 0.30GE Capital UK Funding (FRN) 0.67438% 20/03/2017 17,800,000 17,489 0.74GE Capital UK Funding 6.75% 06/08/2018 3,561,000 4,222 0.18GE Capital UK Funding 5.625% 25/04/2019 3,540,000 4,039 0.17General Electric Capital 6.25% 29/09/2020 5,000,000 5,957 0.25General Electric Capital 5.5% 07/06/2021 12,446,000 14,252 0.60General Electric Capital 5.5% 15/09/2066 3,676,000 3,795 0.16General Electric Capital 6.5% 15/09/2067 17,305,000 18,675 0.79GKN 6.75% 28/10/2019 7,550,000 8,671 0.37Glencore Finance Europe 6.5% 27/02/2019 9,100,000 10,343 0.44Glencore Finance Europe 6% 03/04/2022 7,300,000 8,120 0.34Goldman Sachs 5.5% 12/10/2021 11,454,000 12,374 0.52Greene King Finance (FRN) 2.60519% 15/03/2036 5,250,000 3,525 0.15Health Care REIT 4.8% 20/11/2028 5,000,000 5,044 0.21Heathrow Funding 7.125% 14/02/2024 10,000,000 11,956 0.50Heathrow Funding 4.625% 31/10/2048 5,000,000 4,897 0.21HSBC 6.375% 18/10/2022 31,500,000 34,991 1.48HSBC 5.75% 20/12/2027 16,169,000 17,727 0.75HSBC 6% 29/03/2040 9,350,000 10,524 0.44HSBC Bank Capital Funding 5.844% Perpetual 23,362,000 24,034 1.01Imperial Tobacco Finance 5.5% 28/09/2026 24,338,000 27,100 1.14ING Bank 5.375% 15/04/2021 15,000,000 16,909 0.71ING Bank 6.875% 29/05/2023 8,620,000 9,625 0.41InterContinental Hotels 3.875% 28/11/2022 22,326,000 22,404 0.94Intu Metrocentre Finance 4.125% 06/12/2023 6,350,000 6,378 0.27Intu SGS Finance 3.875% 17/03/2028 7,700,000 7,586 0.32Jaguar Land Rover Automotive 5% 15/02/2022 10,400,000 10,319 0.44John Lewis 8.375% 08/04/2019 5,390,000 6,717 0.28JPMorgan Chase 1.04375% 30/05/2017 13,800,000 13,283 0.56Juneau Investments 5.9% 22/02/2021 12,551,000 12,677 0.53Koninklijke KPN 6.875% 14/03/2073 3,500,000 3,596 0.15Lafarge 10% 30/05/2017 7,648,000 9,117 0.38Legal & General 6.385% Perpetual 10,000,000 10,613 0.45Linde Finance 8.125% 14/07/2066 9,407,000 10,630 0.45Lloyds Bank 6.9625% 29/05/2020† 33,136,000 34,513 1.46
16
HBOS UK Investment Funds ICVCAnnual Report and Financial Statementsfor the year ended 31 January 2014
Holding
MarketValue£'000
% ofNet Assets
Corporate Bond FundPortfolio statement (continued)as at 31 January 2014
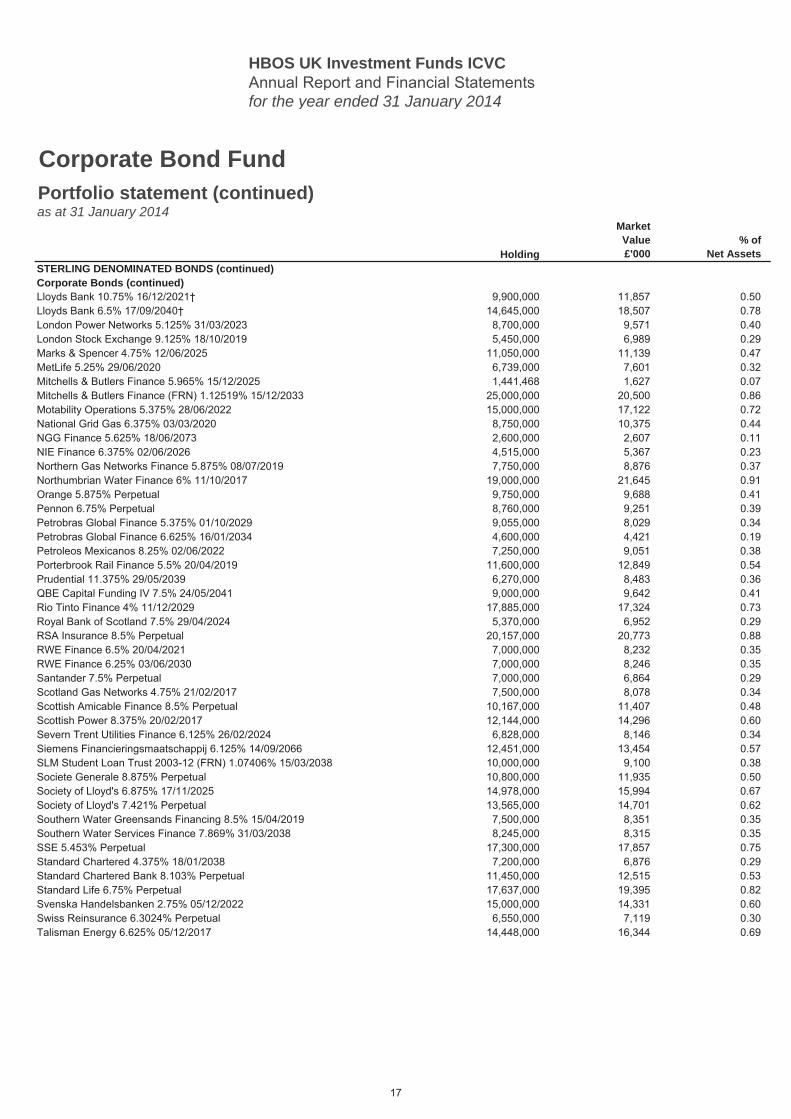
STERLING DENOMINATED BONDS (continued) 84.22Corporate Bonds (continued)Lloyds Bank 10.75% 16/12/2021† 9,900,000 11,857 0.50Lloyds Bank 6.5% 17/09/2040† 14,645,000 18,507 0.78London Power Networks 5.125% 31/03/2023 8,700,000 9,571 0.40London Stock Exchange 9.125% 18/10/2019 5,450,000 6,989 0.29Marks & Spencer 4.75% 12/06/2025 11,050,000 11,139 0.47MetLife 5.25% 29/06/2020 6,739,000 7,601 0.32Mitchells & Butlers Finance 5.965% 15/12/2025 1,441,468 1,627 0.07Mitchells & Butlers Finance (FRN) 1.12519% 15/12/2033 25,000,000 20,500 0.86Motability Operations 5.375% 28/06/2022 15,000,000 17,122 0.72National Grid Gas 6.375% 03/03/2020 8,750,000 10,375 0.44NGG Finance 5.625% 18/06/2073 2,600,000 2,607 0.11NIE Finance 6.375% 02/06/2026 4,515,000 5,367 0.23Northern Gas Networks Finance 5.875% 08/07/2019 7,750,000 8,876 0.37Northumbrian Water Finance 6% 11/10/2017 19,000,000 21,645 0.91Orange 5.875% Perpetual 9,750,000 9,688 0.41Pennon 6.75% Perpetual 8,760,000 9,251 0.39Petrobras Global Finance 5.375% 01/10/2029 9,055,000 8,029 0.34Petrobras Global Finance 6.625% 16/01/2034 4,600,000 4,421 0.19Petroleos Mexicanos 8.25% 02/06/2022 7,250,000 9,051 0.38Porterbrook Rail Finance 5.5% 20/04/2019 11,600,000 12,849 0.54Prudential 11.375% 29/05/2039 6,270,000 8,483 0.36QBE Capital Funding IV 7.5% 24/05/2041 9,000,000 9,642 0.41Rio Tinto Finance 4% 11/12/2029 17,885,000 17,324 0.73Royal Bank of Scotland 7.5% 29/04/2024 5,370,000 6,952 0.29RSA Insurance 8.5% Perpetual 20,157,000 20,773 0.88RWE Finance 6.5% 20/04/2021 7,000,000 8,232 0.35RWE Finance 6.25% 03/06/2030 7,000,000 8,246 0.35Santander 7.5% Perpetual 7,000,000 6,864 0.29Scotland Gas Networks 4.75% 21/02/2017 7,500,000 8,078 0.34Scottish Amicable Finance 8.5% Perpetual 10,167,000 11,407 0.48Scottish Power 8.375% 20/02/2017 12,144,000 14,296 0.60Severn Trent Utilities Finance 6.125% 26/02/2024 6,828,000 8,146 0.34Siemens Financieringsmaatschappij 6.125% 14/09/2066 12,451,000 13,454 0.57SLM Student Loan Trust 2003-12 (FRN) 1.07406% 15/03/2038 10,000,000 9,100 0.38Societe Generale 8.875% Perpetual 10,800,000 11,935 0.50Society of Lloyd's 6.875% 17/11/2025 14,978,000 15,994 0.67Society of Lloyd's 7.421% Perpetual 13,565,000 14,701 0.62Southern Water Greensands Financing 8.5% 15/04/2019 7,500,000 8,351 0.35Southern Water Services Finance 7.869% 31/03/2038 8,245,000 8,315 0.35SSE 5.453% Perpetual 17,300,000 17,857 0.75Standard Chartered 4.375% 18/01/2038 7,200,000 6,876 0.29Standard Chartered Bank 8.103% Perpetual 11,450,000 12,515 0.53Standard Life 6.75% Perpetual 17,637,000 19,395 0.82Svenska Handelsbanken 2.75% 05/12/2022 15,000,000 14,331 0.60Swiss Reinsurance 6.3024% Perpetual 6,550,000 7,119 0.30Talisman Energy 6.625% 05/12/2017 14,448,000 16,344 0.69
17
HBOS UK Investment Funds ICVCAnnual Report and Financial Statementsfor the year ended 31 January 2014
Holding
MarketValue£'000
% ofNet Assets
Corporate Bond FundPortfolio statement (continued)as at 31 January 2014
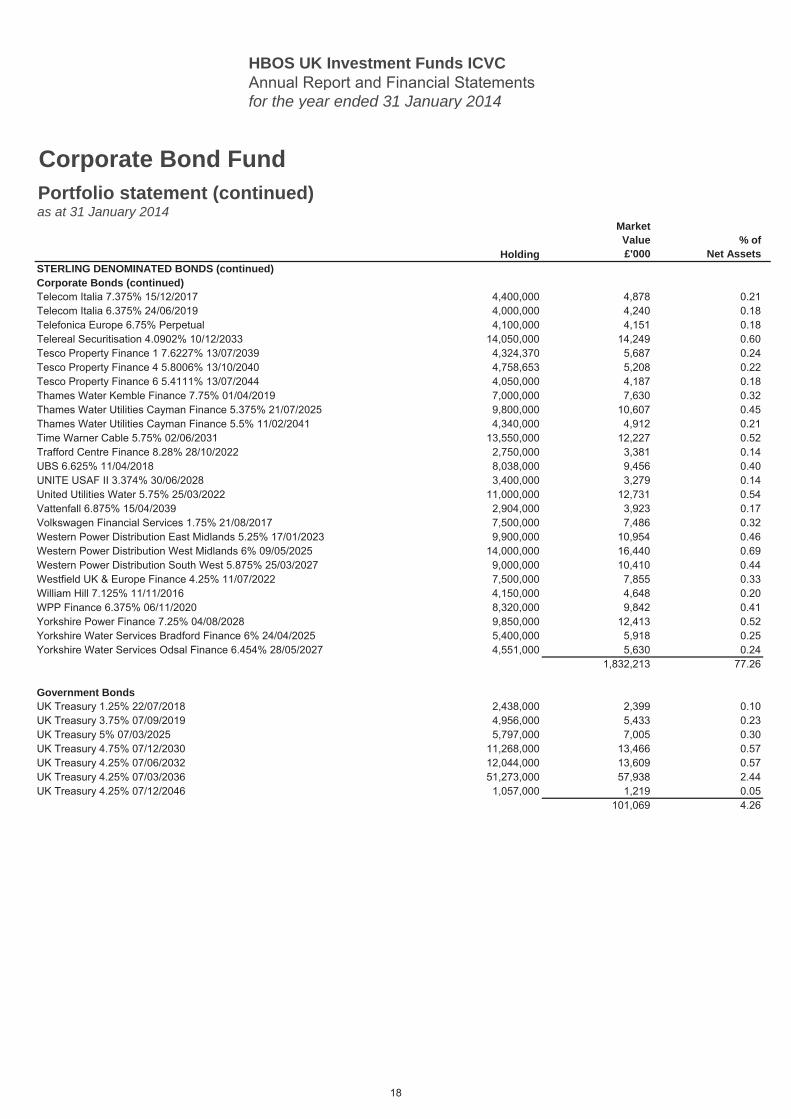
STERLING DENOMINATED BONDS (continued) 84.22Corporate Bonds (continued)Telecom Italia 7.375% 15/12/2017 4,400,000 4,878 0.21Telecom Italia 6.375% 24/06/2019 4,000,000 4,240 0.18Telefonica Europe 6.75% Perpetual 4,100,000 4,151 0.18Telereal Securitisation 4.0902% 10/12/2033 14,050,000 14,249 0.60Tesco Property Finance 1 7.6227% 13/07/2039 4,324,370 5,687 0.24Tesco Property Finance 4 5.8006% 13/10/2040 4,758,653 5,208 0.22Tesco Property Finance 6 5.4111% 13/07/2044 4,050,000 4,187 0.18Thames Water Kemble Finance 7.75% 01/04/2019 7,000,000 7,630 0.32Thames Water Utilities Cayman Finance 5.375% 21/07/2025 9,800,000 10,607 0.45Thames Water Utilities Cayman Finance 5.5% 11/02/2041 4,340,000 4,912 0.21Time Warner Cable 5.75% 02/06/2031 13,550,000 12,227 0.52Trafford Centre Finance 8.28% 28/10/2022 2,750,000 3,381 0.14UBS 6.625% 11/04/2018 8,038,000 9,456 0.40UNITE USAF II 3.374% 30/06/2028 3,400,000 3,279 0.14United Utilities Water 5.75% 25/03/2022 11,000,000 12,731 0.54Vattenfall 6.875% 15/04/2039 2,904,000 3,923 0.17Volkswagen Financial Services 1.75% 21/08/2017 7,500,000 7,486 0.32Western Power Distribution East Midlands 5.25% 17/01/2023 9,900,000 10,954 0.46Western Power Distribution West Midlands 6% 09/05/2025 14,000,000 16,440 0.69Western Power Distribution South West 5.875% 25/03/2027 9,000,000 10,410 0.44Westfield UK & Europe Finance 4.25% 11/07/2022 7,500,000 7,855 0.33William Hill 7.125% 11/11/2016 4,150,000 4,648 0.20WPP Finance 6.375% 06/11/2020 8,320,000 9,842 0.41Yorkshire Power Finance 7.25% 04/08/2028 9,850,000 12,413 0.52Yorkshire Water Services Bradford Finance 6% 24/04/2025 5,400,000 5,918 0.25Yorkshire Water Services Odsal Finance 6.454% 28/05/2027 4,551,000 5,630 0.24
1,832,213 77.26
Government BondsUK Treasury 1.25% 22/07/2018 2,438,000 2,399 0.10UK Treasury 3.75% 07/09/2019 4,956,000 5,433 0.23UK Treasury 5% 07/03/2025 5,797,000 7,005 0.30UK Treasury 4.75% 07/12/2030 11,268,000 13,466 0.57UK Treasury 4.25% 07/06/2032 12,044,000 13,609 0.57UK Treasury 4.25% 07/03/2036 51,273,000 57,938 2.44UK Treasury 4.25% 07/12/2046 1,057,000 1,219 0.05
101,069 4.26
18
HBOS UK Investment Funds ICVCAnnual Report and Financial Statementsfor the year ended 31 January 2014
Holding
MarketValue£'000
% ofNet Assets
Corporate Bond FundPortfolio statement (continued)as at 31 January 2014
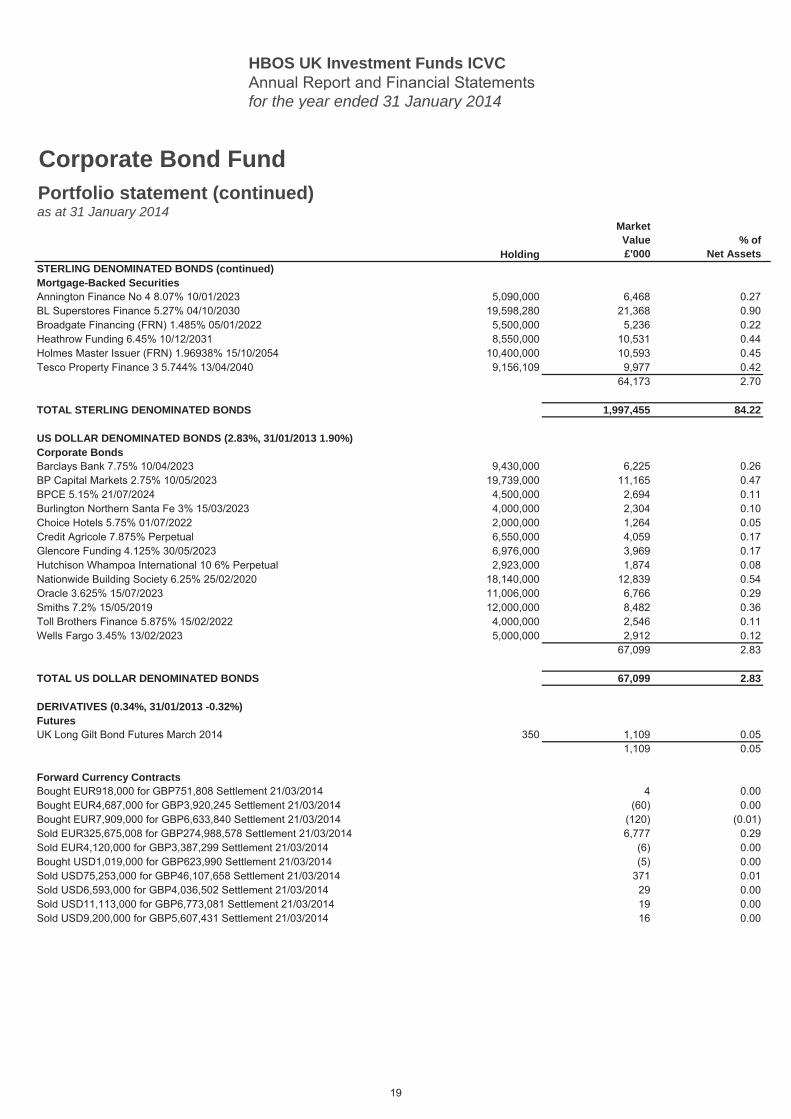
STERLING DENOMINATED BONDS (continued) 84.22Mortgage-Backed SecuritiesAnnington Finance No 4 8.07% 10/01/2023 5,090,000 6,468 0.27BL Superstores Finance 5.27% 04/10/2030 19,598,280 21,368 0.90Broadgate Financing (FRN) 1.485% 05/01/2022 5,500,000 5,236 0.22Heathrow Funding 6.45% 10/12/2031 8,550,000 10,531 0.44Holmes Master Issuer (FRN) 1.96938% 15/10/2054 10,400,000 10,593 0.45Tesco Property Finance 3 5.744% 13/04/2040 9,156,109 9,977 0.42
64,173 2.70
TOTAL STERLING DENOMINATED BONDS 1,997,455 84.22
US DOLLAR DENOMINATED BONDS (2.83%, 31/01/2013 1.90%) 2.83Corporate BondsBarclays Bank 7.75% 10/04/2023 9,430,000 6,225 0.26BP Capital Markets 2.75% 10/05/2023 19,739,000 11,165 0.47BPCE 5.15% 21/07/2024 4,500,000 2,694 0.11Burlington Northern Santa Fe 3% 15/03/2023 4,000,000 2,304 0.10Choice Hotels 5.75% 01/07/2022 2,000,000 1,264 0.05Credit Agricole 7.875% Perpetual 6,550,000 4,059 0.17Glencore Funding 4.125% 30/05/2023 6,976,000 3,969 0.17Hutchison Whampoa International 10 6% Perpetual 2,923,000 1,874 0.08Nationwide Building Society 6.25% 25/02/2020 18,140,000 12,839 0.54Oracle 3.625% 15/07/2023 11,006,000 6,766 0.29Smiths 7.2% 15/05/2019 12,000,000 8,482 0.36Toll Brothers Finance 5.875% 15/02/2022 4,000,000 2,546 0.11Wells Fargo 3.45% 13/02/2023 5,000,000 2,912 0.12
67,099 2.83
TOTAL US DOLLAR DENOMINATED BONDS 67,099 2.83
DERIVATIVES (0.34%, 31/01/2013 -0.32%) 0.34FuturesUK Long Gilt Bond Futures March 2014 350 1,109 0.05
1,109 0.05
Forward Currency ContractsBought EUR918,000 for GBP751,808 Settlement 21/03/2014 0 4 0.00Bought EUR4,687,000 for GBP3,920,245 Settlement 21/03/2014 0 (60) 0.00Bought EUR7,909,000 for GBP6,633,840 Settlement 21/03/2014 0 (120) (0.01)Sold EUR325,675,008 for GBP274,988,578 Settlement 21/03/2014 0 6,777 0.29Sold EUR4,120,000 for GBP3,387,299 Settlement 21/03/2014 0 (6) 0.00Bought USD1,019,000 for GBP623,990 Settlement 21/03/2014 0 (5) 0.00Sold USD75,253,000 for GBP46,107,658 Settlement 21/03/2014 0 371 0.01Sold USD6,593,000 for GBP4,036,502 Settlement 21/03/2014 0 29 0.00Sold USD11,113,000 for GBP6,773,081 Settlement 21/03/2014 0 19 0.00Sold USD9,200,000 for GBP5,607,431 Settlement 21/03/2014 0 16 0.00
19
HBOS UK Investment Funds ICVCAnnual Report and Financial Statementsfor the year ended 31 January 2014
Holding
MarketValue£'000
% ofNet Assets
Corporate Bond FundPortfolio statement (continued)as at 31 January 2014
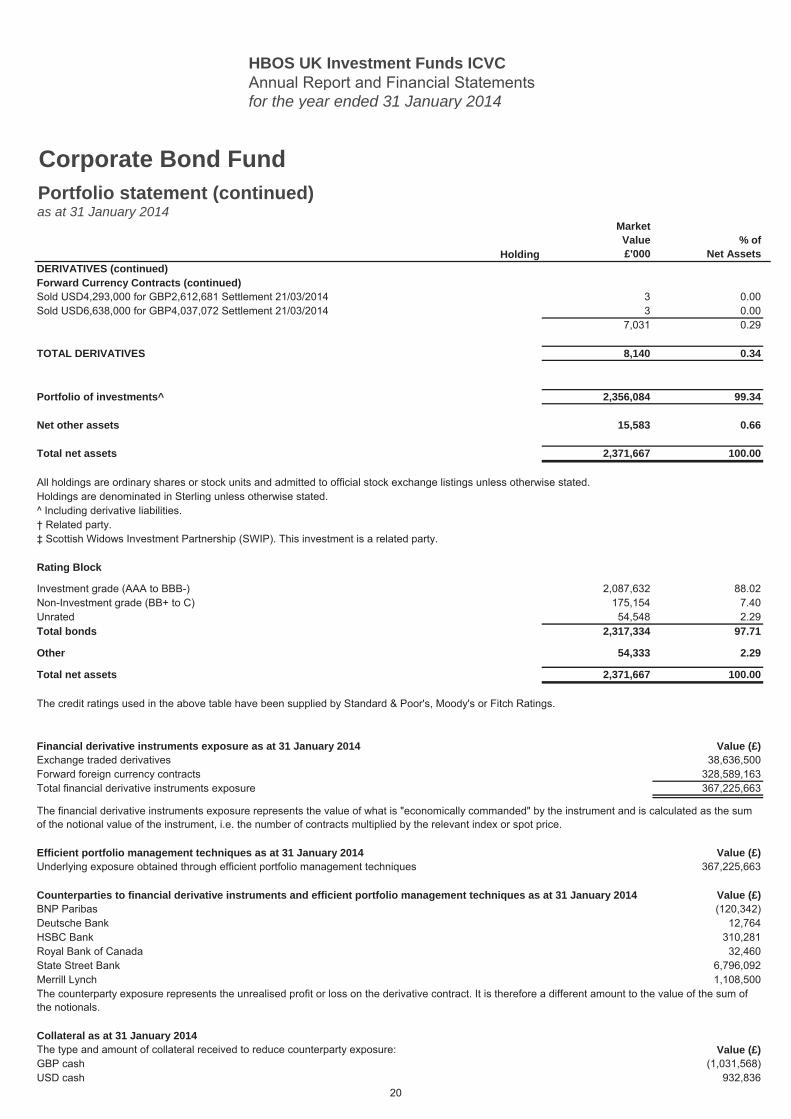
DERIVATIVES (continued) 0.34Forward Currency Contracts (continued)Sold USD4,293,000 for GBP2,612,681 Settlement 21/03/2014 0 3 0.00Sold USD6,638,000 for GBP4,037,072 Settlement 21/03/2014 0 3 0.00
7,031 0.29
TOTAL DERIVATIVES 8,140 0.34
Portfolio of investments^ 2,356,084 99.34
Net other assets 15,583 0.66
Total net assets 2,371,667 100.00
Rating Block
Investment grade (AAA to BBB-) 2,087,632 88.02Non-Investment grade (BB+ to C) 175,154 7.40Unrated 54,548 2.29Total bonds 2,317,334 97.71
Other 54,333 2.29
Total net assets 2,371,667 100.00
Financial derivative instruments exposure as at 31 January 2014 Value (£)Exchange traded derivatives 38,636,500Forward foreign currency contracts 328,589,163Total financial derivative instruments exposure 367,225,663
Efficient portfolio management techniques as at 31 January 2014 Value (£)Underlying exposure obtained through efficient portfolio management techniques 367,225,663
Counterparties to financial derivative instruments and efficient portfolio management techniques as at 31 January 2014 Value (£)BNP Paribas (120,342)Deutsche Bank 12,764HSBC Bank 310,281Royal Bank of Canada 32,460State Street Bank 6,796,092Merrill Lynch 1,108,500
Collateral as at 31 January 2014The type and amount of collateral received to reduce counterparty exposure: Value (£)GBP cash (1,031,568)USD cash 932,836
The counterparty exposure represents the unrealised profit or loss on the derivative contract. It is therefore a different amount to the value of the sum of the notionals.
‡ Scottish Widows Investment Partnership (SWIP). This investment is a related party.† Related party.
The financial derivative instruments exposure represents the value of what is "economically commanded" by the instrument and is calculated as the sum of the notional value of the instrument, i.e. the number of contracts multiplied by the relevant index or spot price.
The credit ratings used in the above table have been supplied by Standard & Poor's, Moody's or Fitch Ratings.
All holdings are ordinary shares or stock units and admitted to official stock exchange listings unless otherwise stated.Holdings are denominated in Sterling unless otherwise stated.^ Including derivative liabilities.
20
HBOS UK Investment Funds ICVCAnnual Report and Financial Statementsfor the year ended 31 January 2014
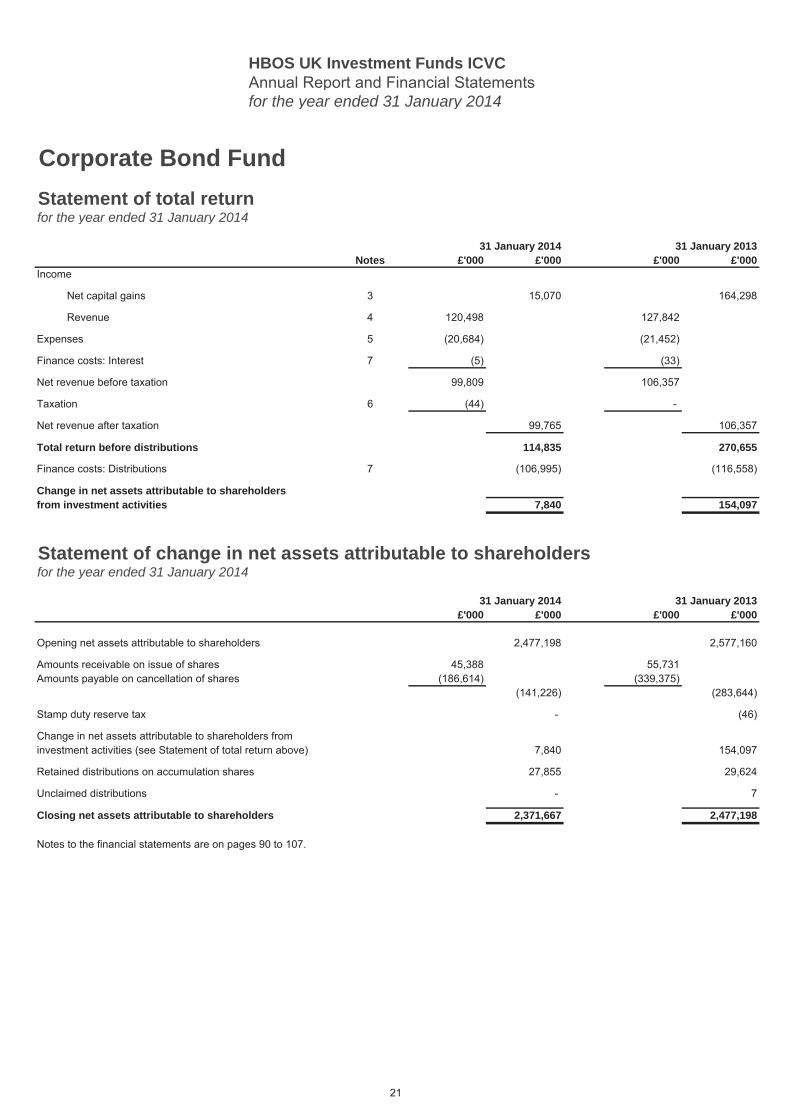
Corporate Bond FundStatement of total returnfor the year ended 31 January 2014
31 January 2014 31 January 2013Notes £'000 £'000 £'000 £'000
Income
Net capital gains 3 15,070 164,298
Revenue 4 120,498 127,842
Expenses 5 (20,684) (21,452)
Finance costs: Interest 7 (5) (33)
Net revenue before taxation 99,809 106,357
Taxation 6 (44) -
Net revenue after taxation 99,765 106,357
Total return before distributions 114,835 270,655
Finance costs: Distributions 7 (106,995) (116,558)
Change in net assets attributable to shareholdersfrom investment activities 7,840 154,097
Statement of change in net assets attributable to shareholdersfor the year ended 31 January 2014
31 January 2014 31 January 2013£'000 £'000 £'000 £'000
Opening net assets attributable to shareholders 2,477,198 2,577,160
Amounts receivable on issue of shares 45,388 55,731Amounts payable on cancellation of shares (186,614) (339,375)
(141,226) (283,644)
Stamp duty reserve tax - (46)
Change in net assets attributable to shareholders frominvestment activities (see Statement of total return above) 7,840 154,097
Retained distributions on accumulation shares 27,855 29,624
Unclaimed distributions - 7
Closing net assets attributable to shareholders 2,371,667 2,477,198
Notes to the financial statements are on pages 90 to 107.
21
HBOS UK Investment Funds ICVCAnnual Report and Financial Statementsfor the year ended 31 January 2014
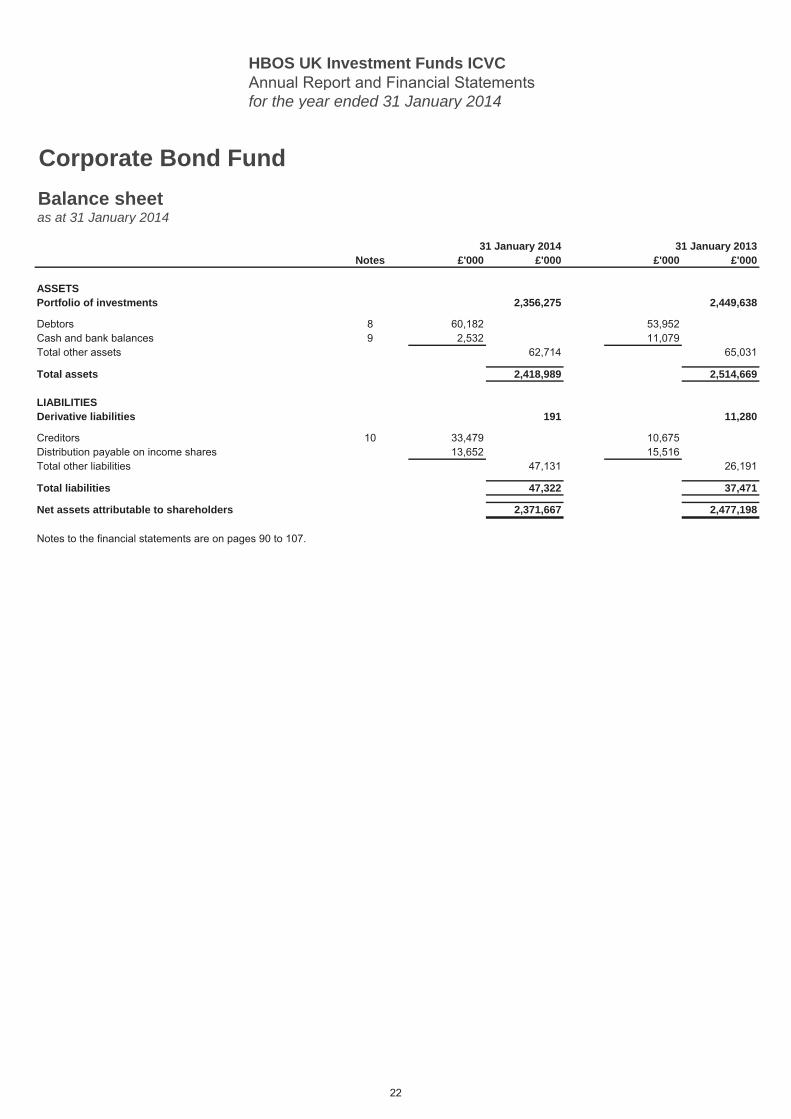
Corporate Bond FundBalance sheetas at 31 January 2014
31 January 2014 31 January 2013Notes £'000 £'000 £'000 £'000
ASSETSPortfolio of investments 2,356,275 2,449,638
Debtors 8 60,182 53,952Cash and bank balances 9 2,532 11,079Total other assets 62,714 65,031
Total assets 2,418,989 2,514,669
LIABILITIESDerivative liabilities 191 11,280
Creditors 10 33,479 10,675Distribution payable on income shares 13,652 15,516Total other liabilities 47,131 26,191
Total liabilities 47,322 37,471
Net assets attributable to shareholders 2,371,667 2,477,198
Notes to the financial statements are on pages 90 to 107.
22
HBOS UK Investment Funds ICVCAnnual Report and Financial Statementsfor the year ended 31 January 2014
UK Equity Income FundInvestment markets overview Investment objective
Investment policy
UCITS scheme
Synthetic risk and reward profile
Investment review
Performance 01/02/13 01/02/12 01/02/11 01/02/10 01/02/09 01/02/08to 31/01/14 to 31/01/13 to 31/01/12 to 31/01/11 to 31/01/10 to 31/01/09
% % % % % %UK Equity Income Fund 11.58 13.52 (2.09) 17.90 32.36 FTSE All-Share Index 10.10 16.30 (0.31) 18.13 33.24
Past performance is not a guide to future performance. The value of an investment and the revenue from it may go up and down and you may get back less than invested.
The investment objective of the UK Equity Income Fund is to provide an above average income, together with prospects of capital appreciation over thelonger term, derived mainly from a portfolio of securities in UK companies.
To select companies with a high probability of providing a rising income and capital growth over the longer term. Convertible stocks and bonds whichprovide a higher yield than equities are also considered for the portfolio.
The Fund would qualify as a UCITS scheme operating under Chapter 5 of the COLL sourcebook if it were in itself an Open-Ended Investment Companyin respect of which an authorisation order made by the FCA were in force. Not more than 10% of the scheme property may consist of units in collectiveinvestment schemes.
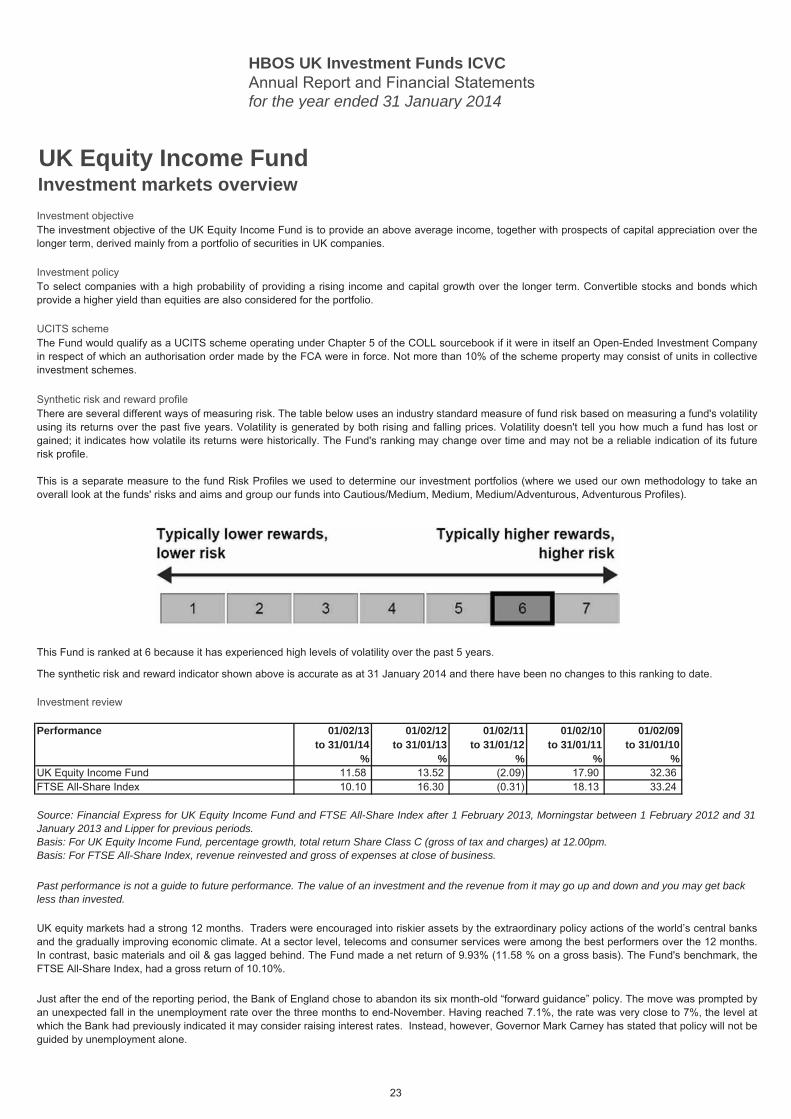
There are several different ways of measuring risk. The table below uses an industry standard measure of fund risk based on measuring a fund's volatilityusing its returns over the past five years. Volatility is generated by both rising and falling prices. Volatility doesn't tell you how much a fund has lost orgained; it indicates how volatile its returns were historically. The Fund's ranking may change over time and may not be a reliable indication of its futurerisk profile.
This is a separate measure to the fund Risk Profiles we used to determine our investment portfolios (where we used our own methodology to take anoverall look at the funds' risks and aims and group our funds into Cautious/Medium, Medium, Medium/Adventurous, Adventurous Profiles).
This Fund is ranked at 6 because it has experienced high levels of volatility over the past 5 years.
The synthetic risk and reward indicator shown above is accurate as at 31 January 2014 and there have been no changes to this ranking to date.
Source: Financial Express for UK Equity Income Fund and FTSE All-Share Index after 1 February 2013, Morningstar between 1 February 2012 and 31January 2013 and Lipper for previous periods.Basis: For UK Equity Income Fund, percentage growth, total return Share Class C (gross of tax and charges) at 12.00pm.Basis: For FTSE All-Share Index, revenue reinvested and gross of expenses at close of business.
UK equity markets had a strong 12 months. Traders were encouraged into riskier assets by the extraordinary policy actions of the world’s central banksand the gradually improving economic climate. At a sector level, telecoms and consumer services were among the best performers over the 12 months.In contrast, basic materials and oil & gas lagged behind. The Fund made a net return of 9.93% (11.58 % on a gross basis). The Fund's benchmark, theFTSE All-Share Index, had a gross return of 10.10%.
Just after the end of the reporting period, the Bank of England chose to abandon its six month-old “forward guidance” policy. The move was prompted byan unexpected fall in the unemployment rate over the three months to end-November. Having reached 7.1%, the rate was very close to 7%, the level atwhich the Bank had previously indicated it may consider raising interest rates. Instead, however, Governor Mark Carney has stated that policy will not beguided by unemployment alone.
23
HBOS UK Investment Funds ICVCAnnual Report and Financial Statementsfor the year ended 31 January 2014
UK Equity Income FundInvestment markets overview (continued)Investment review (continued)
Scottish Widows Investment Partnership Limited
In January, Mr Carney commented that the British economy was in a “different place” from last summer. Indeed, the strength of its recovery has surprisednearly everyone. The International Monetary Fund (IMF) recently upped its 2014 UK growth forecast from 1.9% to 2.4% – the fastest expansion rate inEurope. But while the recovery has been impressive, most commentators agree that the UK economy could ill-afford an increase in interest rates at thisearly stage. Wage growth has stagnated for five years (although it is starting to recover), while corporate spending remains stubbornly below pre-crisislevels. Finally, the much-hoped-for rebound in workers’ productivity – viewed as essential if economic growth is to gain momentum – remainsfrustratingly absent.
Turning to the portfolio, a holding in Travis Perkins, the builders’ merchant, boosted returns. The company had an excellent twelve months as thefortunes of the UK housing market improved after a long period in the doldrums. Travis Perkins’ market value rose impressively, culminating in the firmentering the FTSE 100 Index.
In contrast, KSK Power Ventur, the Indian power company, detracted from returns over the reporting period. Most recently, the company has been thevictim of general declines in emerging market stocks. The falls were sparked by concerns over the “tapering” of US monetary stimulus.
In terms of recent transactions, we recently opened a position in Wood Group. We bought the stock based on our view that the company’s engineeringrepair and maintenance segments would shelter it from the reductions to investment spending currently being made by the oil majors. Unfortunately, thishas not been the case and profit guidance was downgraded as a result. Nevertheless, we believe that the current valuation remains attractive.
We have also reduced the Fund’s exposure to RSA Insurance, after the company had to review its revenue recognition policy in Ireland. Although arecent auditors’ report suggested that the problems uncovered were specific to Ireland, we believe the issue has left the company in a position where itwill have to raise additional capital.
Overall, the Fund is positioned towards a continued economic recovery. Importantly, however, given recent jitters in emerging markets, this positioning ismainly via stocks that should benefit from increased credit availability and corporate and consumer confidence in developed economies. We areconcerned that profits in some emerging markets will be under pressure for several years as a result of reduced liquidity and pockets of deflation, partlydue to excessive investment over the last decade. Consequently, the Fund is underweight in sectors that have been heavily reliant upon these marketsfor earnings growth. These include mining and some traditionally “defensive” areas such as food & beverages.
February 2014
Investment markets and conditions can change rapidly and as such the views expressed should not be taken as statements of fact nor should reliancebe placed on these views when making investment decisions.
24
HBOS UK Investment Funds ICVCAnnual Report and Financial Statementsfor the year ended 31 January 2014
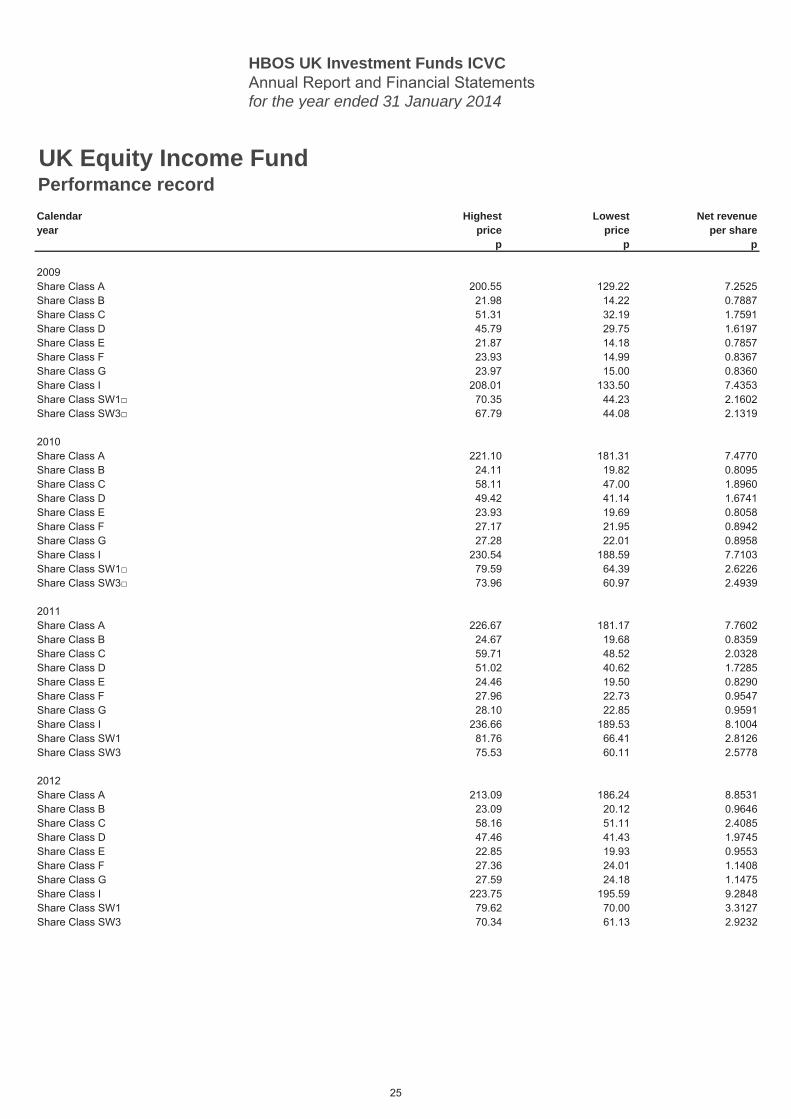
UK Equity Income FundPerformance record Calendar Highest Lowest Net revenueyear price price per share
p p p
2009Share Class A 200.55 129.22 7.2525Share Class B 21.98 14.22 0.7887Share Class C 51.31 32.19 1.7591Share Class D 45.79 29.75 1.6197Share Class E 21.87 14.18 0.7857Share Class F 23.93 14.99 0.8367Share Class G 23.97 15.00 0.8360Share Class I 208.01 133.50 7.4353Share Class SW1□ 70.35 44.23 2.1602Share Class SW3□ 67.79 44.08 2.1319
2010Share Class A 221.10 181.31 7.4770Share Class B 24.11 19.82 0.8095Share Class C 58.11 47.00 1.8960Share Class D 49.42 41.14 1.6741Share Class E 23.93 19.69 0.8058Share Class F 27.17 21.95 0.8942Share Class G 27.28 22.01 0.8958Share Class I 230.54 188.59 7.7103Share Class SW1□ 79.59 64.39 2.6226Share Class SW3□ 73.96 60.97 2.4939
2011Share Class A 226.67 181.17 7.7602Share Class B 24.67 19.68 0.8359Share Class C 59.71 48.52 2.0328Share Class D 51.02 40.62 1.7285Share Class E 24.46 19.50 0.8290Share Class F 27.96 22.73 0.9547Share Class G 28.10 22.85 0.9591Share Class I 236.66 189.53 8.1004Share Class SW1 81.76 66.41 2.8126Share Class SW3 75.53 60.11 2.5778
2012Share Class A 213.09 186.24 8.8531Share Class B 23.09 20.12 0.9646Share Class C 58.16 51.11 2.4085Share Class D 47.46 41.43 1.9745Share Class E 22.85 19.93 0.9553Share Class F 27.36 24.01 1.1408Share Class G 27.59 24.18 1.1475Share Class I 223.75 195.59 9.2848Share Class SW1 79.62 70.00 3.3127Share Class SW3 70.34 61.13 2.9232
25
HBOS UK Investment Funds ICVCAnnual Report and Financial Statementsfor the year ended 31 January 2014
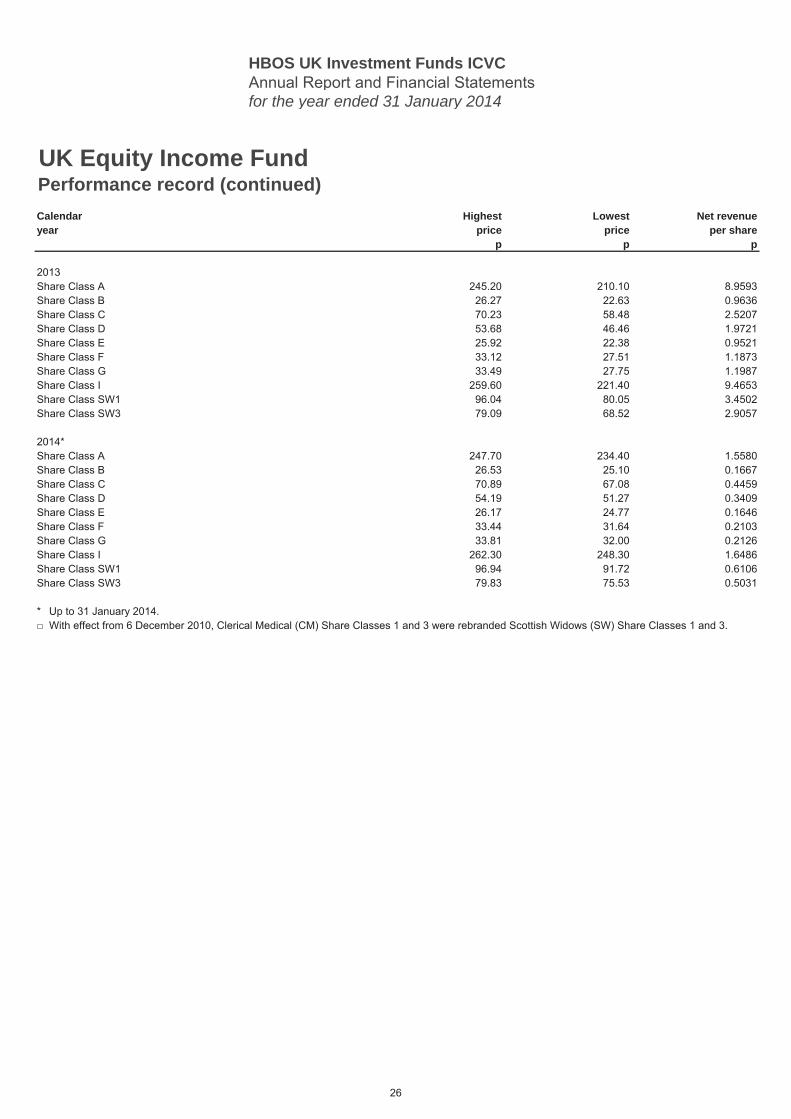
UK Equity Income FundPerformance record (continued)Calendar Highest Lowest Net revenueyear price price per share
p p p
2013Share Class A 245.20 210.10 8.9593Share Class B 26.27 22.63 0.9636Share Class C 70.23 58.48 2.5207Share Class D 53.68 46.46 1.9721Share Class E 25.92 22.38 0.9521Share Class F 33.12 27.51 1.1873Share Class G 33.49 27.75 1.1987Share Class I 259.60 221.40 9.4653Share Class SW1 96.04 80.05 3.4502Share Class SW3 79.09 68.52 2.9057
2014*Share Class A 247.70 234.40 1.5580Share Class B 26.53 25.10 0.1667Share Class C 70.89 67.08 0.4459Share Class D 54.19 51.27 0.3409Share Class E 26.17 24.77 0.1646Share Class F 33.44 31.64 0.2103Share Class G 33.81 32.00 0.2126Share Class I 262.30 248.30 1.6486Share Class SW1 96.94 91.72 0.6106Share Class SW3 79.83 75.53 0.5031
*□ With effect from 6 December 2010, Clerical Medical (CM) Share Classes 1 and 3 were rebranded Scottish Widows (SW) Share Classes 1 and 3.
Up to 31 January 2014.
26
HBOS UK Investment Funds ICVCAnnual Report and Financial Statementsfor the year ended 31 January 2014
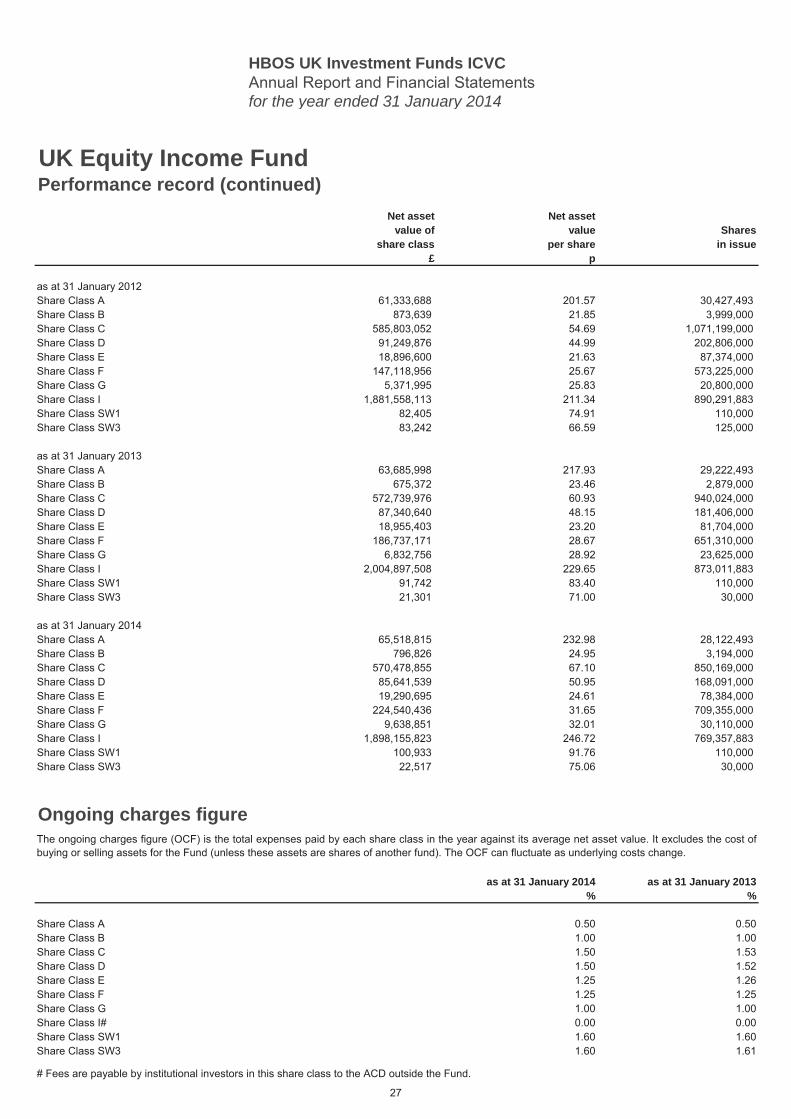
UK Equity Income FundPerformance record (continued)
Net asset Net assetvalue of value Shares
share class per share in issue£ p
Share Class A 61,333,688 201.57 30,427,493Share Class B 873,639 21.85 3,999,000Share Class C 585,803,052 54.69 1,071,199,000Share Class D 91,249,876 44.99 202,806,000Share Class E 18,896,600 21.63 87,374,000Share Class F 147,118,956 25.67 573,225,000Share Class G 5,371,995 25.83 20,800,000Share Class I 1,881,558,113 211.34 890,291,883Share Class SW1 82,405 74.91 110,000Share Class SW3 83,242 66.59 125,000
Share Class A 63,685,998 217.93 29,222,493Share Class B 675,372 23.46 2,879,000Share Class C 572,739,976 60.93 940,024,000Share Class D 87,340,640 48.15 181,406,000Share Class E 18,955,403 23.20 81,704,000Share Class F 186,737,171 28.67 651,310,000Share Class G 6,832,756 28.92 23,625,000Share Class I 2,004,897,508 229.65 873,011,883Share Class SW1 91,742 83.40 110,000Share Class SW3 21,301 71.00 30,000
Share Class A 65,518,815 232.98 28,122,493Share Class B 796,826 24.95 3,194,000Share Class C 570,478,855 67.10 850,169,000Share Class D 85,641,539 50.95 168,091,000Share Class E 19,290,695 24.61 78,384,000Share Class F 224,540,436 31.65 709,355,000Share Class G 9,638,851 32.01 30,110,000Share Class I 1,898,155,823 246.72 769,357,883Share Class SW1 100,933 91.76 110,000Share Class SW3 22,517 75.06 30,000
Ongoing charges figure
as at 31 January 2014 as at 31 January 2013% %
Share Class A 0.50 0.50Share Class B 1.00 1.00Share Class C 1.50 1.53Share Class D 1.50 1.52Share Class E 1.25 1.26Share Class F 1.25 1.25Share Class G 1.00 1.00Share Class I# 0.00 0.00Share Class SW1 1.60 1.60Share Class SW3 1.60 1.61
# Fees are payable by institutional investors in this share class to the ACD outside the Fund.
as at 31 January 2012
as at 31 January 2013
as at 31 January 2014
The ongoing charges figure (OCF) is the total expenses paid by each share class in the year against its average net asset value. It excludes the cost ofbuying or selling assets for the Fund (unless these assets are shares of another fund). The OCF can fluctuate as underlying costs change.
27
HBOS UK Investment Funds ICVCAnnual Report and Financial Statementsfor the year ended 31 January 2014
Holding
MarketValue£'000
% ofNet Assets
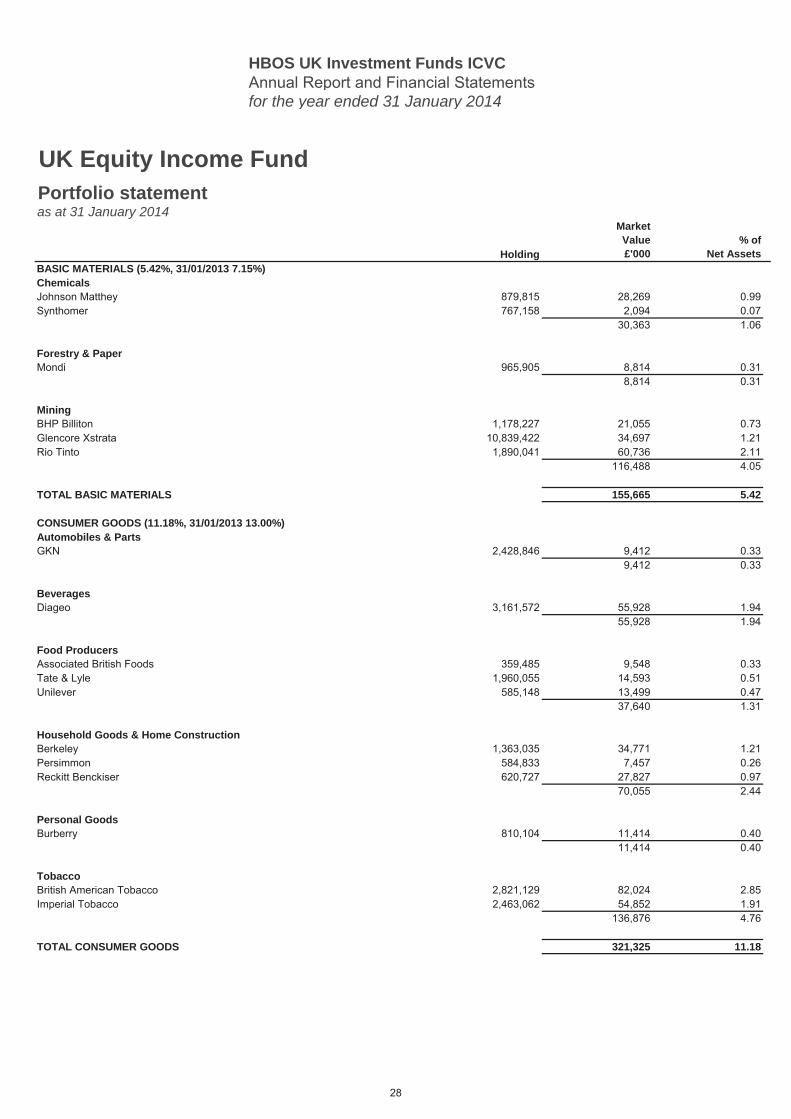
BASIC MATERIALS (5.42%, 31/01/2013 7.15%) 5.42ChemicalsJohnson Matthey 879,815 28,269 0.99Synthomer 767,158 2,094 0.07
30,363 1.06
Forestry & PaperMondi 965,905 8,814 0.31
8,814 0.31
MiningBHP Billiton 1,178,227 21,055 0.73Glencore Xstrata 10,839,422 34,697 1.21Rio Tinto 1,890,041 60,736 2.11
116,488 4.05
TOTAL BASIC MATERIALS 155,665 5.42
CONSUMER GOODS (11.18%, 31/01/2013 13.00%) 11.18Automobiles & PartsGKN 2,428,846 9,412 0.33
9,412 0.33
BeveragesDiageo 3,161,572 55,928 1.94
55,928 1.94
Food ProducersAssociated British Foods 359,485 9,548 0.33Tate & Lyle 1,960,055 14,593 0.51Unilever 585,148 13,499 0.47
37,640 1.31
Household Goods & Home ConstructionBerkeley 1,363,035 34,771 1.21Persimmon 584,833 7,457 0.26Reckitt Benckiser 620,727 27,827 0.97
70,055 2.44
Personal GoodsBurberry 810,104 11,414 0.40
11,414 0.40
TobaccoBritish American Tobacco 2,821,129 82,024 2.85Imperial Tobacco 2,463,062 54,852 1.91
136,876 4.76
TOTAL CONSUMER GOODS 321,325 11.18
UK Equity Income FundPortfolio statement as at 31 January 2014
28
HBOS UK Investment Funds ICVCAnnual Report and Financial Statementsfor the year ended 31 January 2014
Holding
MarketValue£'000
% ofNet Assets
UK Equity Income FundPortfolio statement (continued)as at 31 January 2014
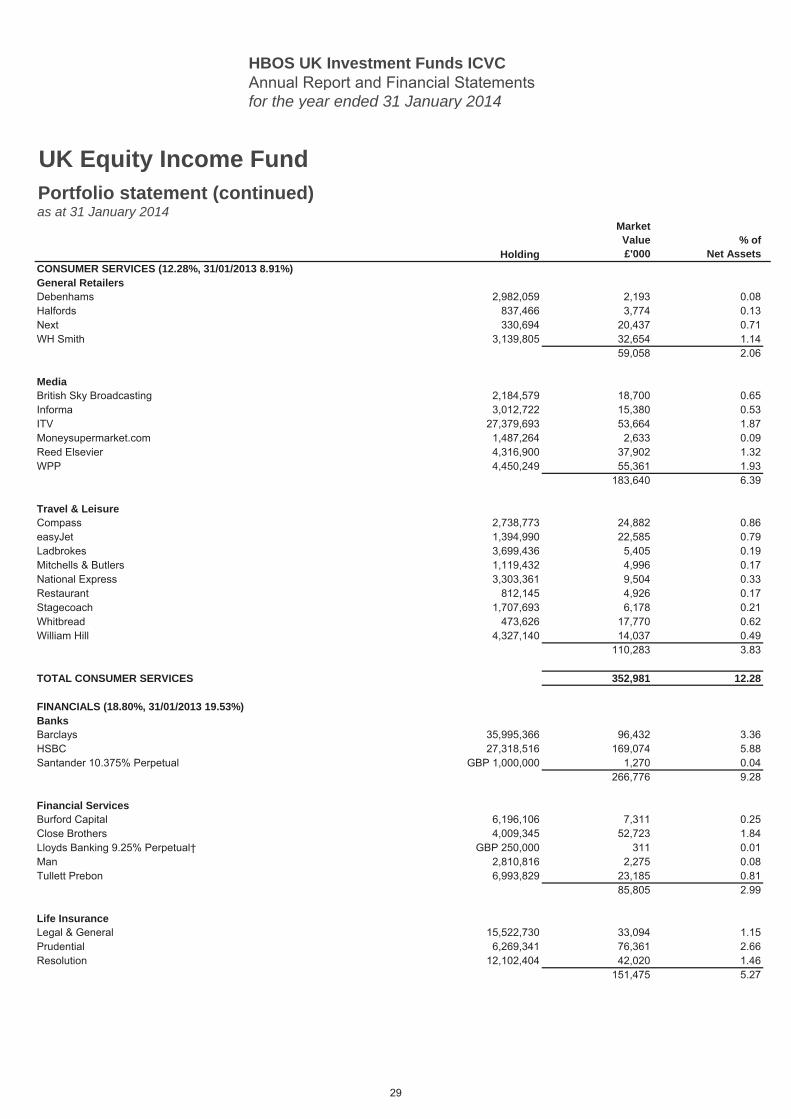
CONSUMER SERVICES (12.28%, 31/01/2013 8.91%) 12.28General RetailersDebenhams 2,982,059 2,193 0.08Halfords 837,466 3,774 0.13Next 330,694 20,437 0.71WH Smith 3,139,805 32,654 1.14
59,058 2.06
MediaBritish Sky Broadcasting 2,184,579 18,700 0.65Informa 3,012,722 15,380 0.53ITV 27,379,693 53,664 1.87Moneysupermarket.com 1,487,264 2,633 0.09Reed Elsevier 4,316,900 37,902 1.32WPP 4,450,249 55,361 1.93
183,640 6.39
Travel & LeisureCompass 2,738,773 24,882 0.86easyJet 1,394,990 22,585 0.79Ladbrokes 3,699,436 5,405 0.19Mitchells & Butlers 1,119,432 4,996 0.17National Express 3,303,361 9,504 0.33Restaurant 812,145 4,926 0.17Stagecoach 1,707,693 6,178 0.21Whitbread 473,626 17,770 0.62William Hill 4,327,140 14,037 0.49
110,283 3.83
TOTAL CONSUMER SERVICES 352,981 12.28
FINANCIALS (18.80%, 31/01/2013 19.53%) 18.80BanksBarclays 35,995,366 96,432 3.36HSBC 27,318,516 169,074 5.88Santander 10.375% Perpetual GBP 1,000,000 1,270 0.04
266,776 9.28
Financial ServicesBurford Capital 6,196,106 7,311 0.25Close Brothers 4,009,345 52,723 1.84Lloyds Banking 9.25% Perpetual† GBP 250,000 311 0.01Man 2,810,816 2,275 0.08Tullett Prebon 6,993,829 23,185 0.81
85,805 2.99
Life InsuranceLegal & General 15,522,730 33,094 1.15Prudential 6,269,341 76,361 2.66Resolution 12,102,404 42,020 1.46
151,475 5.27
29
HBOS UK Investment Funds ICVCAnnual Report and Financial Statementsfor the year ended 31 January 2014
Holding
MarketValue£'000
% ofNet Assets
UK Equity Income FundPortfolio statement (continued)as at 31 January 2014
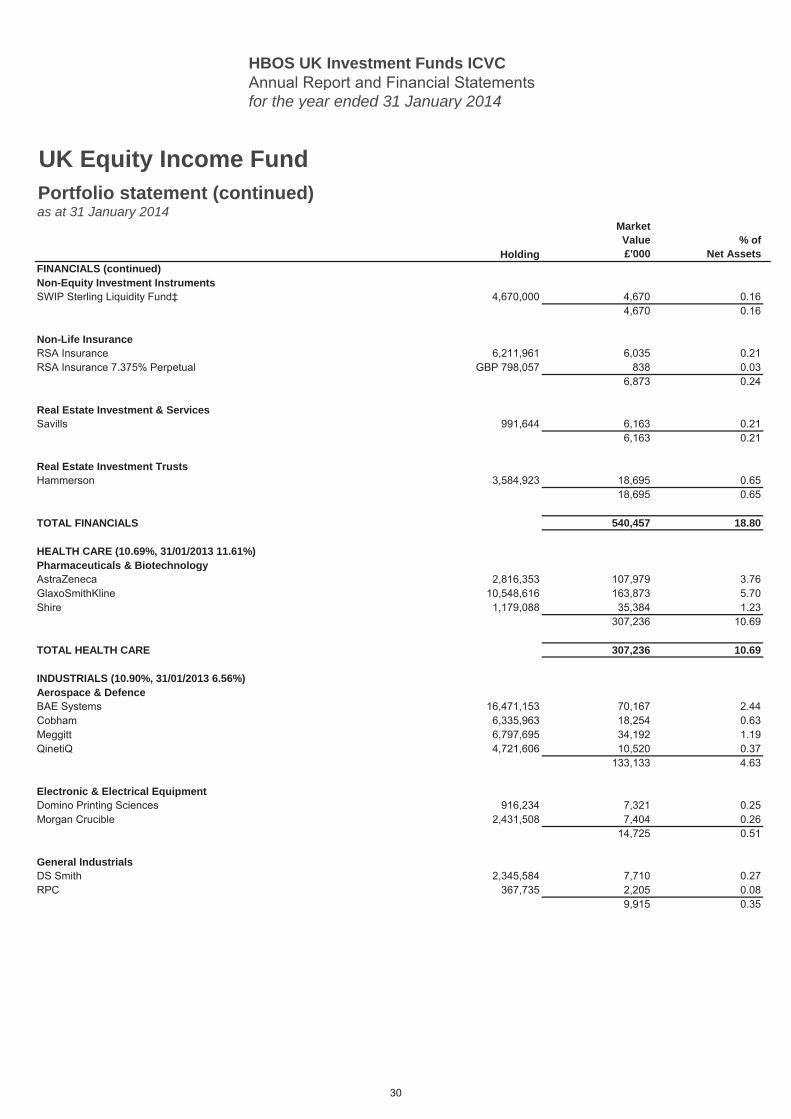
FINANCIALS (continued) 18.80Non-Equity Investment InstrumentsSWIP Sterling Liquidity Fund‡ 4,670,000 4,670 0.16
4,670 0.16
Non-Life InsuranceRSA Insurance 6,211,961 6,035 0.21RSA Insurance 7.375% Perpetual GBP 798,057 838 0.03
6,873 0.24
Real Estate Investment & ServicesSavills 991,644 6,163 0.21
6,163 0.21
Real Estate Investment TrustsHammerson 3,584,923 18,695 0.65
18,695 0.65
TOTAL FINANCIALS 540,457 18.80
HEALTH CARE (10.69%, 31/01/2013 11.61%) 10.69Pharmaceuticals & BiotechnologyAstraZeneca 2,816,353 107,979 3.76GlaxoSmithKline 10,548,616 163,873 5.70Shire 1,179,088 35,384 1.23
307,236 10.69
TOTAL HEALTH CARE 307,236 10.69
INDUSTRIALS (10.90%, 31/01/2013 6.56%) 10.90Aerospace & DefenceBAE Systems 16,471,153 70,167 2.44Cobham 6,335,963 18,254 0.63Meggitt 6,797,695 34,192 1.19QinetiQ 4,721,606 10,520 0.37
133,133 4.63
Electronic & Electrical EquipmentDomino Printing Sciences 916,234 7,321 0.25Morgan Crucible 2,431,508 7,404 0.26
14,725 0.51
General IndustrialsDS Smith 2,345,584 7,710 0.27RPC 367,735 2,205 0.08
9,915 0.35
30
HBOS UK Investment Funds ICVCAnnual Report and Financial Statementsfor the year ended 31 January 2014
Holding
MarketValue£'000
% ofNet Assets
UK Equity Income FundPortfolio statement (continued)as at 31 January 2014
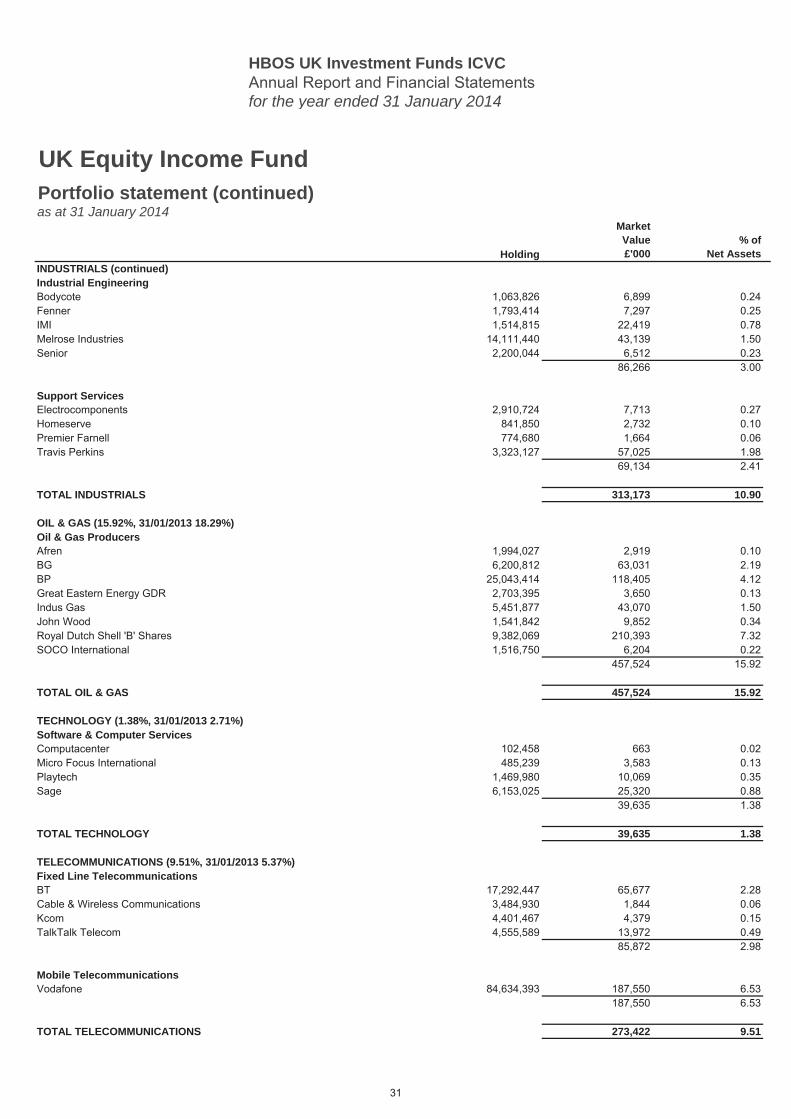
INDUSTRIALS (continued) 10.90Industrial EngineeringBodycote 1,063,826 6,899 0.24Fenner 1,793,414 7,297 0.25IMI 1,514,815 22,419 0.78Melrose Industries 14,111,440 43,139 1.50Senior 2,200,044 6,512 0.23
86,266 3.00
Support ServicesElectrocomponents 2,910,724 7,713 0.27Homeserve 841,850 2,732 0.10Premier Farnell 774,680 1,664 0.06Travis Perkins 3,323,127 57,025 1.98
69,134 2.41
TOTAL INDUSTRIALS 313,173 10.90
OIL & GAS (15.92%, 31/01/2013 18.29%) 15.92Oil & Gas ProducersAfren 1,994,027 2,919 0.10BG 6,200,812 63,031 2.19BP 25,043,414 118,405 4.12Great Eastern Energy GDR 2,703,395 3,650 0.13Indus Gas 5,451,877 43,070 1.50John Wood 1,541,842 9,852 0.34Royal Dutch Shell 'B' Shares 9,382,069 210,393 7.32SOCO International 1,516,750 6,204 0.22
457,524 15.92
TOTAL OIL & GAS 457,524 15.92
TECHNOLOGY (1.38%, 31/01/2013 2.71%) 1.38Software & Computer ServicesComputacenter 102,458 663 0.02Micro Focus International 485,239 3,583 0.13Playtech 1,469,980 10,069 0.35Sage 6,153,025 25,320 0.88
39,635 1.38
TOTAL TECHNOLOGY 39,635 1.38
TELECOMMUNICATIONS (9.51%, 31/01/2013 5.37%) 9.51Fixed Line TelecommunicationsBT 17,292,447 65,677 2.28Cable & Wireless Communications 3,484,930 1,844 0.06Kcom 4,401,467 4,379 0.15TalkTalk Telecom 4,555,589 13,972 0.49
85,872 2.98
Mobile TelecommunicationsVodafone 84,634,393 187,550 6.53
187,550 6.53
TOTAL TELECOMMUNICATIONS 273,422 9.51
31
HBOS UK Investment Funds ICVCAnnual Report and Financial Statementsfor the year ended 31 January 2014
Holding
MarketValue£'000
% ofNet Assets
UK Equity Income FundPortfolio statement (continued)as at 31 January 2014
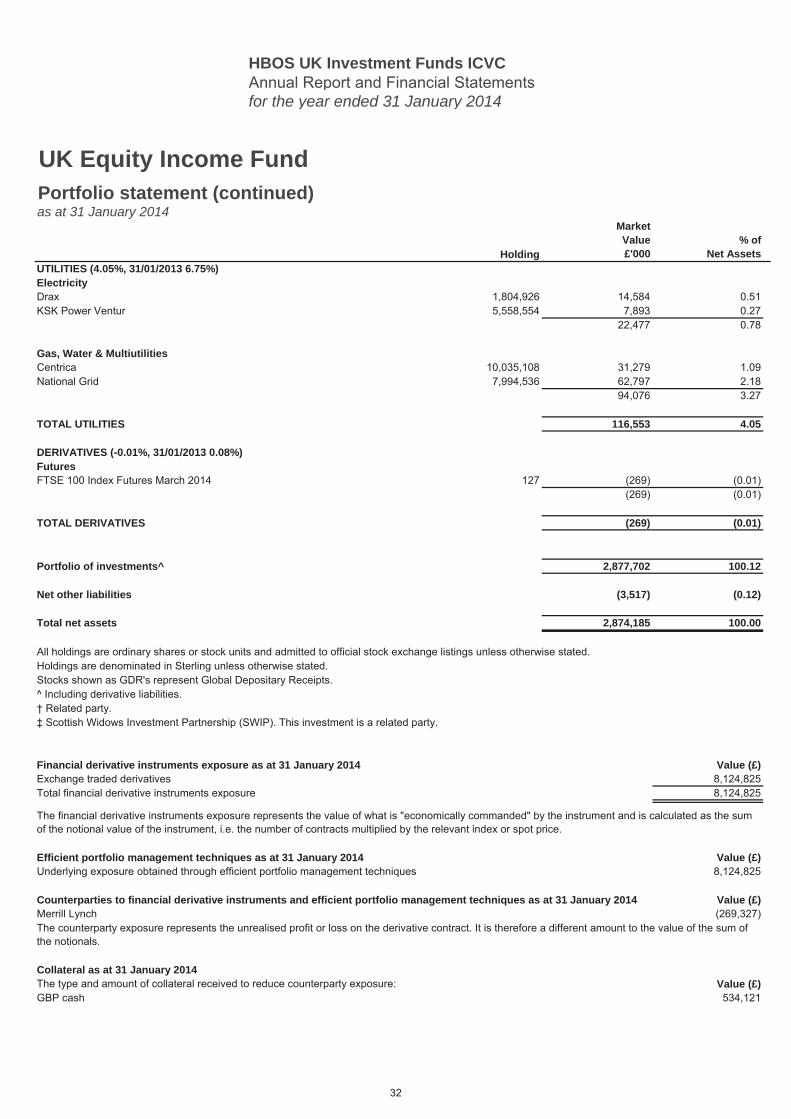
UTILITIES (4.05%, 31/01/2013 6.75%) 4.05ElectricityDrax 1,804,926 14,584 0.51KSK Power Ventur 5,558,554 7,893 0.27
22,477 0.78
Gas, Water & MultiutilitiesCentrica 10,035,108 31,279 1.09National Grid 7,994,536 62,797 2.18
94,076 3.27
TOTAL UTILITIES 116,553 4.05
DERIVATIVES (-0.01%, 31/01/2013 0.08%) (0.01)FuturesFTSE 100 Index Futures March 2014 127 (269) (0.01)
(269) (0.01)
TOTAL DERIVATIVES (269) (0.01)
Portfolio of investments^ 2,877,702 100.12
Net other liabilities (3,517) (0.12)
Total net assets 2,874,185 100.00
Financial derivative instruments exposure as at 31 January 2014 Value (£)Exchange traded derivatives 8,124,825Total financial derivative instruments exposure 8,124,825
Efficient portfolio management techniques as at 31 January 2014 Value (£)Underlying exposure obtained through efficient portfolio management techniques 8,124,825
Counterparties to financial derivative instruments and efficient portfolio management techniques as at 31 January 2014 Value (£)Merrill Lynch (269,327)
Collateral as at 31 January 2014The type and amount of collateral received to reduce counterparty exposure: Value (£)GBP cash 534,121
‡ Scottish Widows Investment Partnership (SWIP). This investment is a related party.
All holdings are ordinary shares or stock units and admitted to official stock exchange listings unless otherwise stated.Holdings are denominated in Sterling unless otherwise stated.Stocks shown as GDR's represent Global Depositary Receipts.^ Including derivative liabilities.† Related party.
The counterparty exposure represents the unrealised profit or loss on the derivative contract. It is therefore a different amount to the value of the sum of the notionals.
The financial derivative instruments exposure represents the value of what is "economically commanded" by the instrument and is calculated as the sum of the notional value of the instrument, i.e. the number of contracts multiplied by the relevant index or spot price.
32

HBOS UK Investment Funds ICVCAnnual Report and Financial Statementsfor the year ended 31 January 2014
UK Equity Income FundStatement of total returnfor the year ended 31 January 2014
31 January 2014 31 January 2013Notes £'000 £'000 £'000 £'000
Income
Net capital gains 3 215,469 235,016
Revenue 4 121,787 115,191
Expenses 5 (13,430) (12,466)
Finance costs: Interest 7 (1) -
Net revenue before taxation 108,356 102,725
Taxation 6 (258) 11
Net revenue after taxation 108,098 102,736
Total return before distributions 323,567 337,752
Finance costs: Distributions 7 (121,424) (114,979)
Change in net assets attributable to shareholdersfrom investment activities 202,143 222,773
Statement of change in net assets attributable to shareholdersfor the year ended 31 January 2014
31 January 2014 31 January 2013£'000 £'000 £'000 £'000
Opening net assets attributable to shareholders 2,941,978 2,792,372
Amounts receivable on issue of shares 100,764 225,197Amounts payable on cancellation of shares (402,723) (327,482)
(301,959) (102,285)
Stamp duty reserve tax (156) (294)
Change in net assets attributable to shareholders frominvestment activities (see Statement of total return above) 202,143 222,773
Retained distributions on accumulation shares 32,179 29,411
Unclaimed distributions - 1
Closing net assets attributable to shareholders 2,874,185 2,941,978
Notes to the financial statements are on pages 90 to 107.
33

HBOS UK Investment Funds ICVCAnnual Report and Financial Statementsfor the year ended 31 January 2014
UK Equity Income FundBalance sheetas at 31 January 2014
31 January 2014 31 January 2013Notes £'000 £'000 £'000 £'000
ASSETSPortfolio of investments 2,877,971 2,940,781
Debtors 8 14,282 17,265Cash and bank balances 9 1,324 6,626Total other assets 15,606 23,891
Total assets 2,893,577 2,964,672
LIABILITIESDerivative liabilities 269 -
Creditors 10 5,293 10,703Distribution payable on income shares 13,830 11,991Total other liabilities 19,123 22,694
Total liabilities 19,392 22,694
Net assets attributable to shareholders 2,874,185 2,941,978
Notes to the financial statements are on pages 90 to 107.
34
HBOS UK Investment Funds ICVCAnnual Report and Financial Statementsfor the year ended 31 January 2014
UK FTSE 100 Index Tracking FundInvestment markets overview Investment objective
Investment policy
Tracking Error
UCITS scheme
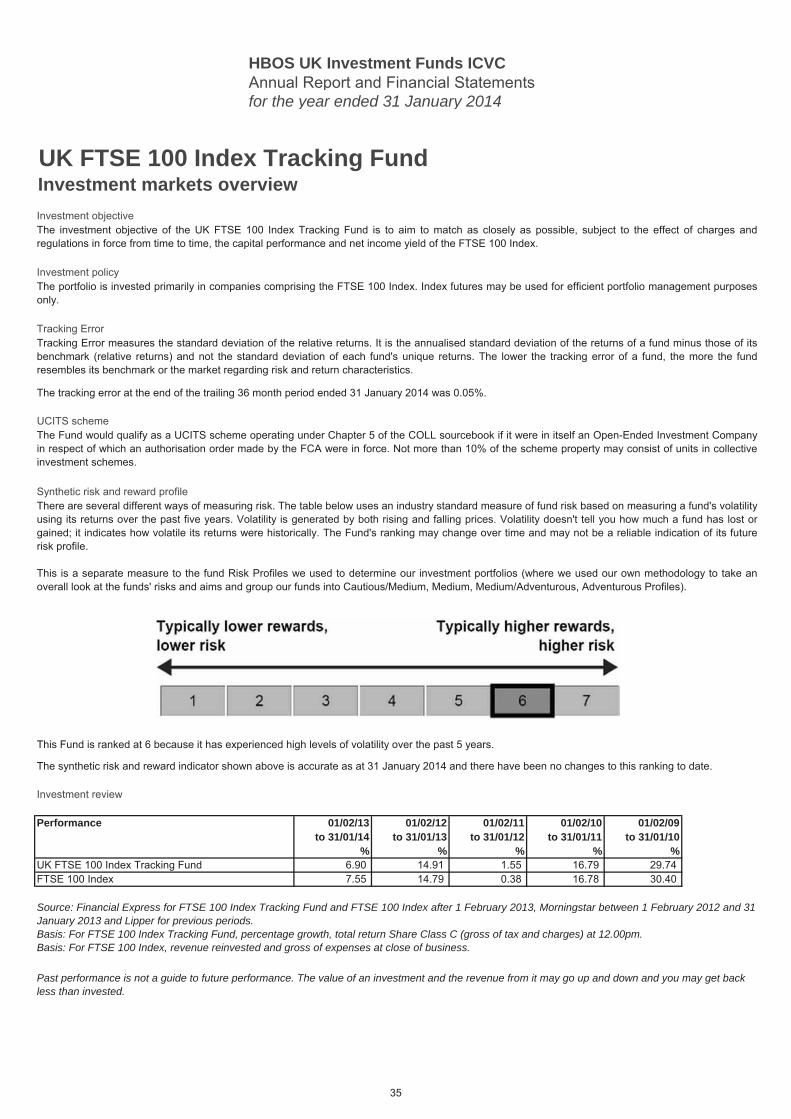
Synthetic risk and reward profile
Investment review
Performance 01/02/13 01/02/12 01/02/11 01/02/10 01/02/09 01/02/08to 31/01/14 to 31/01/13 to 31/01/12 to 31/01/11 to 31/01/10 to 31/01/09
% % % % % %UK FTSE 100 Index Tracking Fund 6.90 14.91 1.55 16.79 29.74 FTSE 100 Index 7.55 14.79 0.38 16.78 30.40
Past performance is not a guide to future performance. The value of an investment and the revenue from it may go up and down and you may get back less than invested.
The investment objective of the UK FTSE 100 Index Tracking Fund is to aim to match as closely as possible, subject to the effect of charges andregulations in force from time to time, the capital performance and net income yield of the FTSE 100 Index.
The portfolio is invested primarily in companies comprising the FTSE 100 Index. Index futures may be used for efficient portfolio management purposesonly.
The Fund would qualify as a UCITS scheme operating under Chapter 5 of the COLL sourcebook if it were in itself an Open-Ended Investment Companyin respect of which an authorisation order made by the FCA were in force. Not more than 10% of the scheme property may consist of units in collectiveinvestment schemes.
There are several different ways of measuring risk. The table below uses an industry standard measure of fund risk based on measuring a fund's volatilityusing its returns over the past five years. Volatility is generated by both rising and falling prices. Volatility doesn't tell you how much a fund has lost orgained; it indicates how volatile its returns were historically. The Fund's ranking may change over time and may not be a reliable indication of its futurerisk profile.
This is a separate measure to the fund Risk Profiles we used to determine our investment portfolios (where we used our own methodology to take anoverall look at the funds' risks and aims and group our funds into Cautious/Medium, Medium, Medium/Adventurous, Adventurous Profiles).
This Fund is ranked at 6 because it has experienced high levels of volatility over the past 5 years.
The synthetic risk and reward indicator shown above is accurate as at 31 January 2014 and there have been no changes to this ranking to date.
Source: Financial Express for FTSE 100 Index Tracking Fund and FTSE 100 Index after 1 February 2013, Morningstar between 1 February 2012 and 31January 2013 and Lipper for previous periods.Basis: For FTSE 100 Index Tracking Fund, percentage growth, total return Share Class C (gross of tax and charges) at 12.00pm.Basis: For FTSE 100 Index, revenue reinvested and gross of expenses at close of business.
Tracking Error measures the standard deviation of the relative returns. It is the annualised standard deviation of the returns of a fund minus those of itsbenchmark (relative returns) and not the standard deviation of each fund's unique returns. The lower the tracking error of a fund, the more the fundresembles its benchmark or the market regarding risk and return characteristics.
The tracking error at the end of the trailing 36 month period ended 31 January 2014 was 0.05%.
35
HBOS UK Investment Funds ICVCAnnual Report and Financial Statementsfor the year ended 31 January 2014
UK FTSE 100 Index Tracking FundInvestment markets overview (continued)
February 2014
Investment review (continued)
Just after the end of the reporting period, the Bank of England chose to abandon its six month-old “forward guidance” policy. The move was prompted byan unexpected fall in the unemployment rate over the three months to end-November. Having reached 7.1%, the rate was very close to 7%, the level atwhich the Bank had previously indicated it may consider raising interest rates. Instead, however, Governor Mark Carney has stated that policy will not beguided by unemployment alone.
In January, Mr Carney commented that the British economy was in a “different place” from last summer. Indeed, the strength of its recovery has surprisednearly everyone. The International Monetary Fund (IMF) recently upped its 2014 UK growth forecast from 1.9% to 2.4% – the fastest expansion rate inEurope. But while the recovery has been impressive, most commentators agree that the UK economy could ill-afford an increase in interest rates at thisearly stage. Wage growth has stagnated for five years (although it is starting to recover), while corporate spending remains stubbornly below pre-crisislevels. Finally, the much-hoped-for rebound in workers’ productivity – viewed as essential if economic growth is to gain momentum – remainsfrustratingly absent.
Over the reporting period, the top ten performing companies in the FTSE 100 Index were Hargreaves Lansdown, International Consolidated Airlines,easyjet, Ashtead Group, Sports Direct International, ITV, Persimmon, GKN, Lloyds Banking Group and Associated British Foods. The bottom tenperforming companies in the index were Fresnillo, Tullow Oil, Randgold Resources, Petrofac, RSA Insurance, Standard Chartered, Antofagasta, AngloAmerican, Glencore International and Xstrata.
In terms of activity and composition, the Fund continued to mirror the FTSE 100 Index. We therefore periodically rebalanced its holdings in accordancewith the changes that index provider FTSE made at its quarterly reviews. In March, Kazakhmys and Intu Properties were demoted to the FTSE 250 Indexand were replaced in the FTSE 100 Index by easyjet and the London Stock Exchange. In June, Evraz and Polymetal International were ousted, whilePersimmon and Travis Perkins were promoted.
September’s additions were Coca-Cola HBC AG, Sports Direct International and Mondi. Meanwhile, Wood Group (John), Eurasian Natural ResourcesCorporation and Serco Group were relegated. Finally, December saw the arrival of Royal Mail and Ashtead, while Croda International and VedantaResources were downgraded.
After several false starts, the UK economy is finally gathering momentum, with growth in 2014 expected to reach a seven-year high. So far, however, therecovery has been narrowly focused on the consumer sector and housing market. We therefore hope to see a broadening out of activity as the yearprogresses.
Scottish Widows Investment Partnership Limited
UK equity markets had a strong 12 months. Traders were encouraged into riskier assets by the extraordinary policy actions of the world’s central banksand the gradually improving economic climate. The Fund made a net return of 5.32% (6.90% on a gross basis). The Fund's benchmark, the FTSE 100Index, had a gross return of 7.55%.
Investment markets and conditions can change rapidly and as such the views expressed should not be taken as statements of fact nor should reliancebe placed on these views when making investment decisions.
36
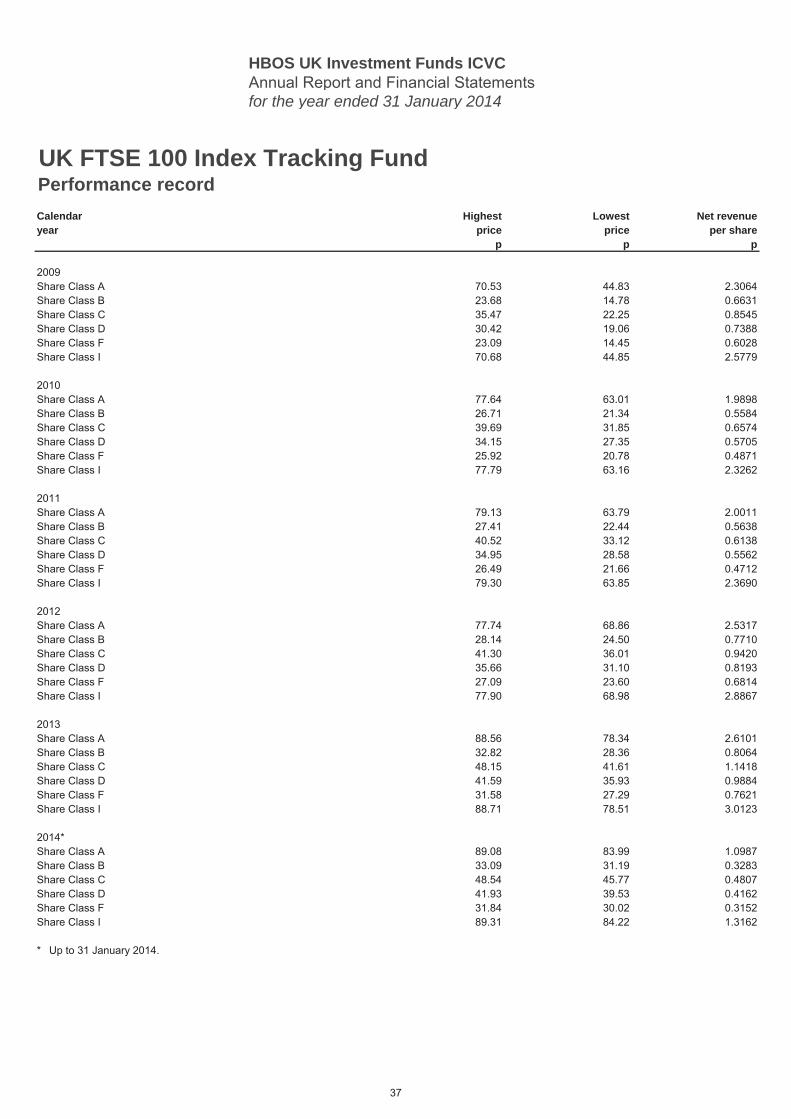
HBOS UK Investment Funds ICVCAnnual Report and Financial Statementsfor the year ended 31 January 2014
UK FTSE 100 Index Tracking FundPerformance recordCalendar Highest Lowest Net revenueyear price price per share
p p p
2009Share Class A 70.53 44.83 2.3064Share Class B 23.68 14.78 0.6631Share Class C 35.47 22.25 0.8545Share Class D 30.42 19.06 0.7388Share Class F 23.09 14.45 0.6028Share Class I 70.68 44.85 2.5779
2010Share Class A 77.64 63.01 1.9898Share Class B 26.71 21.34 0.5584Share Class C 39.69 31.85 0.6574Share Class D 34.15 27.35 0.5705Share Class F 25.92 20.78 0.4871Share Class I 77.79 63.16 2.3262
2011Share Class A 79.13 63.79 2.0011Share Class B 27.41 22.44 0.5638Share Class C 40.52 33.12 0.6138Share Class D 34.95 28.58 0.5562Share Class F 26.49 21.66 0.4712Share Class I 79.30 63.85 2.3690
2012Share Class A 77.74 68.86 2.5317Share Class B 28.14 24.50 0.7710Share Class C 41.30 36.01 0.9420Share Class D 35.66 31.10 0.8193Share Class F 27.09 23.60 0.6814Share Class I 77.90 68.98 2.8867
2013Share Class A 88.56 78.34 2.6101Share Class B 32.82 28.36 0.8064Share Class C 48.15 41.61 1.1418Share Class D 41.59 35.93 0.9884Share Class F 31.58 27.29 0.7621Share Class I 88.71 78.51 3.0123
2014*Share Class A 89.08 83.99 1.0987Share Class B 33.09 31.19 0.3283Share Class C 48.54 45.77 0.4807Share Class D 41.93 39.53 0.4162Share Class F 31.84 30.02 0.3152Share Class I 89.31 84.22 1.3162
* Up to 31 January 2014.
37
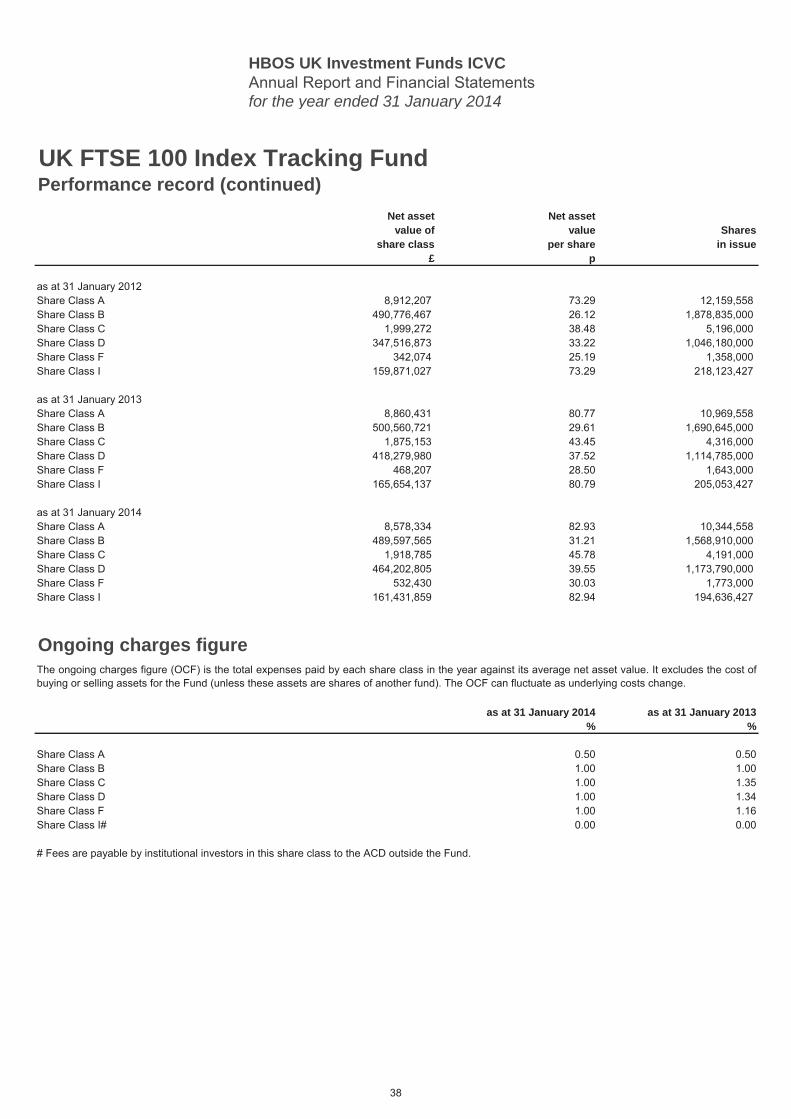
HBOS UK Investment Funds ICVCAnnual Report and Financial Statementsfor the year ended 31 January 2014
UK FTSE 100 Index Tracking FundPerformance record (continued)
Net asset Net assetvalue of value Shares
share class per share in issue£ p
Share Class A 8,912,207 73.29 12,159,558Share Class B 490,776,467 26.12 1,878,835,000Share Class C 1,999,272 38.48 5,196,000Share Class D 347,516,873 33.22 1,046,180,000Share Class F 342,074 25.19 1,358,000Share Class I 159,871,027 73.29 218,123,427
Share Class A 8,860,431 80.77 10,969,558Share Class B 500,560,721 29.61 1,690,645,000Share Class C 1,875,153 43.45 4,316,000Share Class D 418,279,980 37.52 1,114,785,000Share Class F 468,207 28.50 1,643,000Share Class I 165,654,137 80.79 205,053,427
Share Class A 8,578,334 82.93 10,344,558Share Class B 489,597,565 31.21 1,568,910,000Share Class C 1,918,785 45.78 4,191,000Share Class D 464,202,805 39.55 1,173,790,000Share Class F 532,430 30.03 1,773,000Share Class I 161,431,859 82.94 194,636,427
Ongoing charges figure
as at 31 January 2014 as at 31 January 2013% %
Share Class A 0.50 0.50Share Class B 1.00 1.00Share Class C 1.00 1.35Share Class D 1.00 1.34Share Class F 1.00 1.16Share Class I# 0.00 0.00
# Fees are payable by institutional investors in this share class to the ACD outside the Fund.
as at 31 January 2012
as at 31 January 2013
as at 31 January 2014
The ongoing charges figure (OCF) is the total expenses paid by each share class in the year against its average net asset value. It excludes the cost ofbuying or selling assets for the Fund (unless these assets are shares of another fund). The OCF can fluctuate as underlying costs change.
38
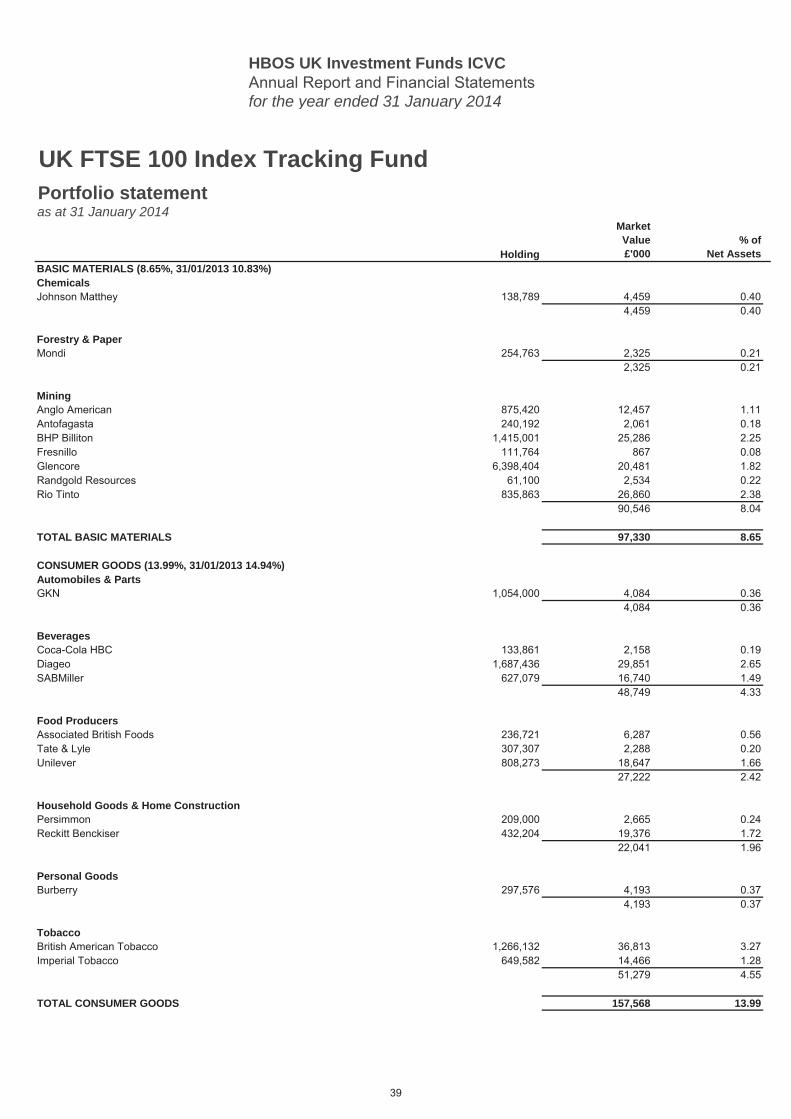
HBOS UK Investment Funds ICVCAnnual Report and Financial Statementsfor the year ended 31 January 2014
Holding
MarketValue£'000
% ofNet Assets
BASIC MATERIALS (8.65%, 31/01/2013 10.83%) 8.65ChemicalsJohnson Matthey 138,789 4,459 0.40
4,459 0.40
Forestry & PaperMondi 254,763 2,325 0.21
2,325 0.21
MiningAnglo American 875,420 12,457 1.11Antofagasta 240,192 2,061 0.18BHP Billiton 1,415,001 25,286 2.25Fresnillo 111,764 867 0.08Glencore 6,398,404 20,481 1.82Randgold Resources 61,100 2,534 0.22Rio Tinto 835,863 26,860 2.38
90,546 8.04
TOTAL BASIC MATERIALS 97,330 8.65
CONSUMER GOODS (13.99%, 31/01/2013 14.94%) 13.99Automobiles & PartsGKN 1,054,000 4,084 0.36
4,084 0.36
BeveragesCoca-Cola HBC 133,861 2,158 0.19Diageo 1,687,436 29,851 2.65SABMiller 627,079 16,740 1.49
48,749 4.33
Food ProducersAssociated British Foods 236,721 6,287 0.56Tate & Lyle 307,307 2,288 0.20Unilever 808,273 18,647 1.66
27,222 2.42
Household Goods & Home ConstructionPersimmon 209,000 2,665 0.24Reckitt Benckiser 432,204 19,376 1.72
22,041 1.96
Personal GoodsBurberry 297,576 4,193 0.37
4,193 0.37
TobaccoBritish American Tobacco 1,266,132 36,813 3.27Imperial Tobacco 649,582 14,466 1.28
51,279 4.55
TOTAL CONSUMER GOODS 157,568 13.99
UK FTSE 100 Index Tracking FundPortfolio statement as at 31 January 2014
39
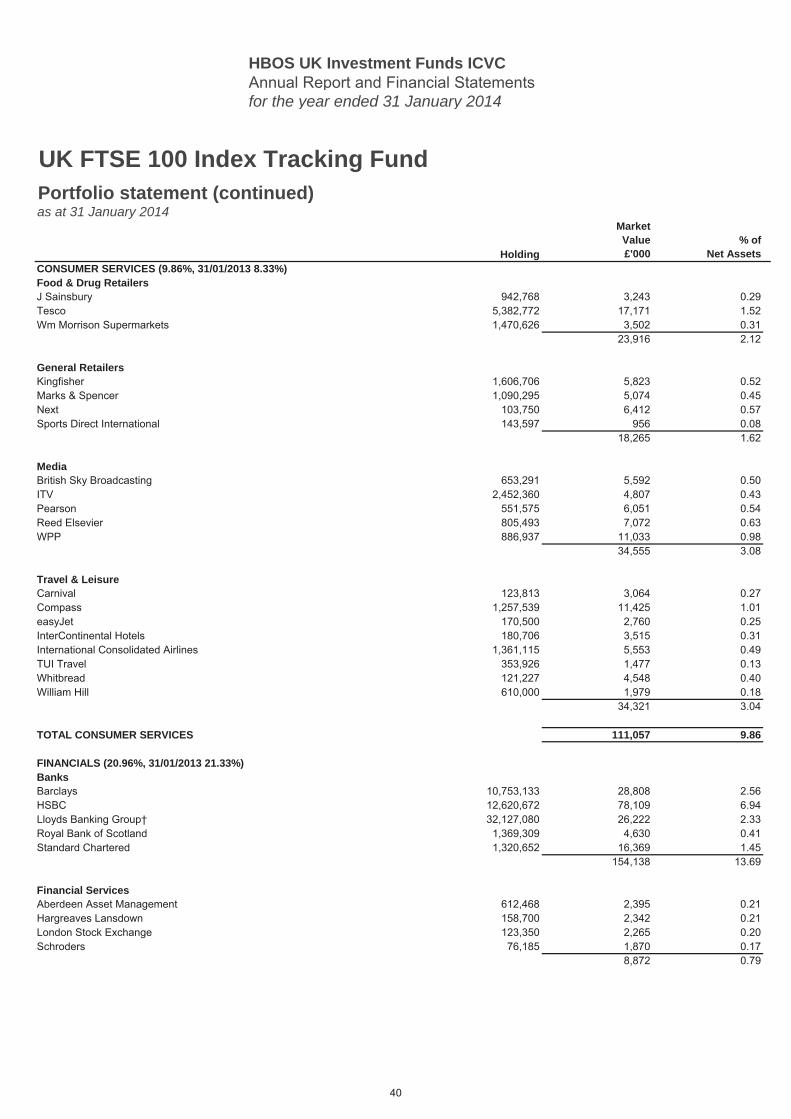
HBOS UK Investment Funds ICVCAnnual Report and Financial Statementsfor the year ended 31 January 2014
Holding
MarketValue£'000
% ofNet Assets
UK FTSE 100 Index Tracking FundPortfolio statement (continued)as at 31 January 2014
CONSUMER SERVICES (9.86%, 31/01/2013 8.33%) 9.86Food & Drug RetailersJ Sainsbury 942,768 3,243 0.29Tesco 5,382,772 17,171 1.52Wm Morrison Supermarkets 1,470,626 3,502 0.31
23,916 2.12
General RetailersKingfisher 1,606,706 5,823 0.52Marks & Spencer 1,090,295 5,074 0.45Next 103,750 6,412 0.57Sports Direct International 143,597 956 0.08
18,265 1.62
MediaBritish Sky Broadcasting 653,291 5,592 0.50ITV 2,452,360 4,807 0.43Pearson 551,575 6,051 0.54Reed Elsevier 805,493 7,072 0.63WPP 886,937 11,033 0.98
34,555 3.08
Travel & LeisureCarnival 123,813 3,064 0.27Compass 1,257,539 11,425 1.01easyJet 170,500 2,760 0.25InterContinental Hotels 180,706 3,515 0.31International Consolidated Airlines 1,361,115 5,553 0.49TUI Travel 353,926 1,477 0.13Whitbread 121,227 4,548 0.40William Hill 610,000 1,979 0.18
34,321 3.04
TOTAL CONSUMER SERVICES 111,057 9.86
FINANCIALS (20.96%, 31/01/2013 21.33%) 20.96BanksBarclays 10,753,133 28,808 2.56HSBC 12,620,672 78,109 6.94Lloyds Banking Group† 32,127,080 26,222 2.33Royal Bank of Scotland 1,369,309 4,630 0.41Standard Chartered 1,320,652 16,369 1.45
154,138 13.69
Financial ServicesAberdeen Asset Management 612,468 2,395 0.21Hargreaves Lansdown 158,700 2,342 0.21London Stock Exchange 123,350 2,265 0.20Schroders 76,185 1,870 0.17
8,872 0.79
40
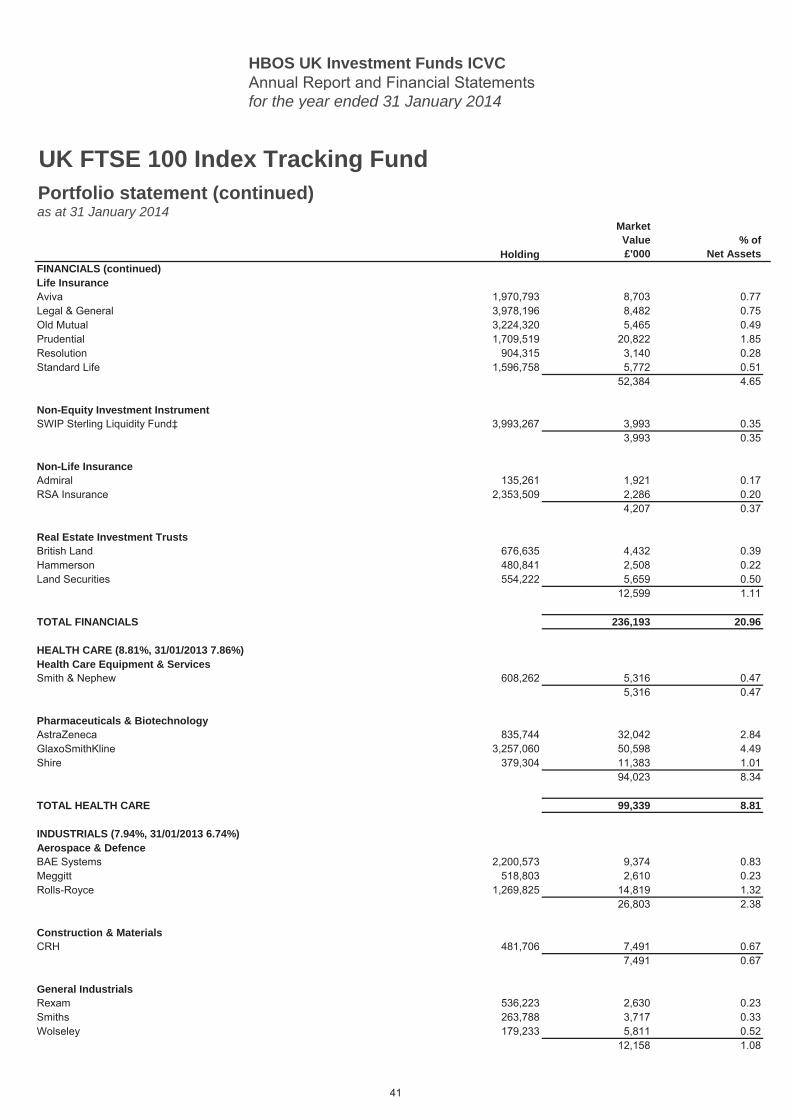
HBOS UK Investment Funds ICVCAnnual Report and Financial Statementsfor the year ended 31 January 2014
Holding
MarketValue£'000
% ofNet Assets
UK FTSE 100 Index Tracking FundPortfolio statement (continued)as at 31 January 2014
FINANCIALS (continued) 20.96Life InsuranceAviva 1,970,793 8,703 0.77Legal & General 3,978,196 8,482 0.75Old Mutual 3,224,320 5,465 0.49Prudential 1,709,519 20,822 1.85Resolution 904,315 3,140 0.28Standard Life 1,596,758 5,772 0.51
52,384 4.65
Non-Equity Investment InstrumentSWIP Sterling Liquidity Fund‡ 3,993,267 3,993 0.35
3,993 0.35
Non-Life InsuranceAdmiral 135,261 1,921 0.17RSA Insurance 2,353,509 2,286 0.20
4,207 0.37
Real Estate Investment TrustsBritish Land 676,635 4,432 0.39Hammerson 480,841 2,508 0.22Land Securities 554,222 5,659 0.50
12,599 1.11
TOTAL FINANCIALS 236,193 20.96
HEALTH CARE (8.81%, 31/01/2013 7.86%) 8.81Health Care Equipment & ServicesSmith & Nephew 608,262 5,316 0.47
5,316 0.47
Pharmaceuticals & BiotechnologyAstraZeneca 835,744 32,042 2.84GlaxoSmithKline 3,257,060 50,598 4.49Shire 379,304 11,383 1.01
94,023 8.34
TOTAL HEALTH CARE 99,339 8.81
INDUSTRIALS (7.94%, 31/01/2013 6.74%) 7.94Aerospace & DefenceBAE Systems 2,200,573 9,374 0.83Meggitt 518,803 2,610 0.23Rolls-Royce 1,269,825 14,819 1.32
26,803 2.38
Construction & MaterialsCRH 481,706 7,491 0.67
7,491 0.67
General IndustrialsRexam 536,223 2,630 0.23Smiths 263,788 3,717 0.33Wolseley 179,233 5,811 0.52
12,158 1.08
41
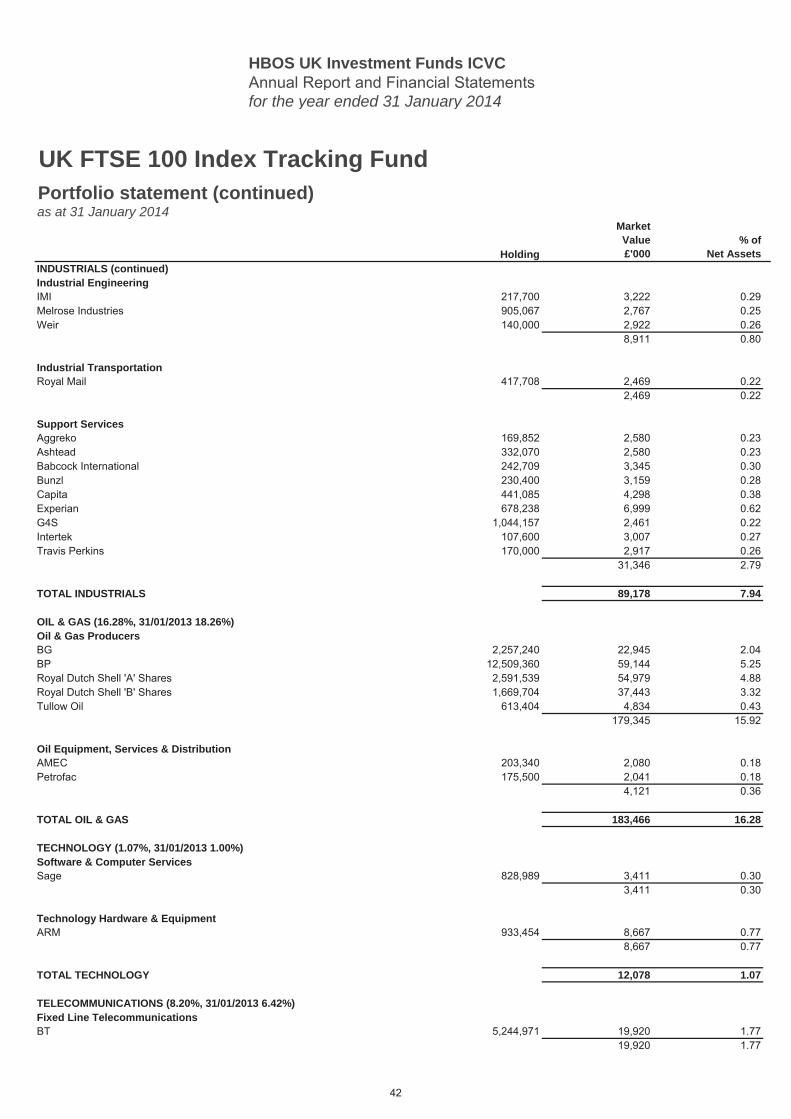
HBOS UK Investment Funds ICVCAnnual Report and Financial Statementsfor the year ended 31 January 2014
Holding
MarketValue£'000
% ofNet Assets
UK FTSE 100 Index Tracking FundPortfolio statement (continued)as at 31 January 2014
INDUSTRIALS (continued) 7.94Industrial EngineeringIMI 217,700 3,222 0.29Melrose Industries 905,067 2,767 0.25Weir 140,000 2,922 0.26
8,911 0.80
Industrial TransportationRoyal Mail 417,708 2,469 0.22
2,469 0.22
Support ServicesAggreko 169,852 2,580 0.23Ashtead 332,070 2,580 0.23Babcock International 242,709 3,345 0.30Bunzl 230,400 3,159 0.28Capita 441,085 4,298 0.38Experian 678,238 6,999 0.62G4S 1,044,157 2,461 0.22Intertek 107,600 3,007 0.27Travis Perkins 170,000 2,917 0.26
31,346 2.79
TOTAL INDUSTRIALS 89,178 7.94
OIL & GAS (16.28%, 31/01/2013 18.26%) 16.28Oil & Gas ProducersBG 2,257,240 22,945 2.04BP 12,509,360 59,144 5.25Royal Dutch Shell 'A' Shares 2,591,539 54,979 4.88Royal Dutch Shell 'B' Shares 1,669,704 37,443 3.32Tullow Oil 613,404 4,834 0.43
179,345 15.92
Oil Equipment, Services & DistributionAMEC 203,340 2,080 0.18Petrofac 175,500 2,041 0.18
4,121 0.36
TOTAL OIL & GAS 183,466 16.28
TECHNOLOGY (1.07%, 31/01/2013 1.00%) 1.07Software & Computer ServicesSage 828,989 3,411 0.30
3,411 0.30
Technology Hardware & EquipmentARM 933,454 8,667 0.77
8,667 0.77
TOTAL TECHNOLOGY 12,078 1.07
TELECOMMUNICATIONS (8.20%, 31/01/2013 6.42%) 8.20Fixed Line TelecommunicationsBT 5,244,971 19,920 1.77
19,920 1.77
42
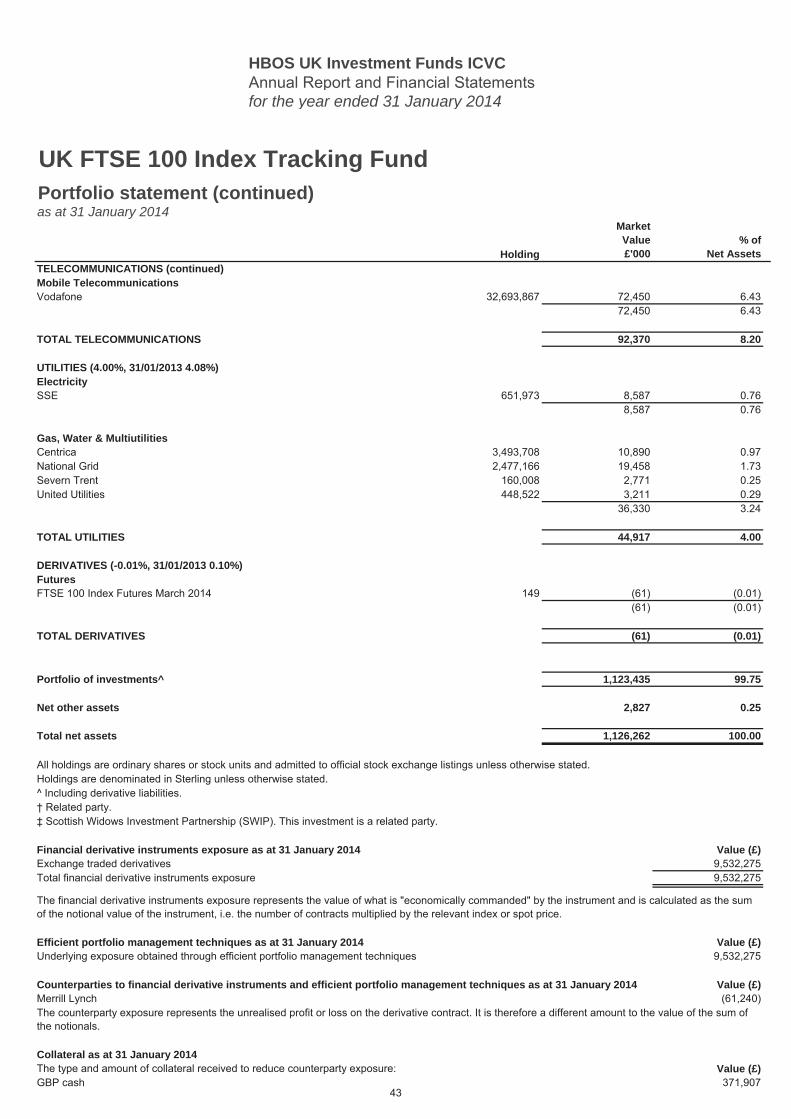
HBOS UK Investment Funds ICVCAnnual Report and Financial Statementsfor the year ended 31 January 2014
Holding
MarketValue£'000
% ofNet Assets
UK FTSE 100 Index Tracking FundPortfolio statement (continued)as at 31 January 2014
TELECOMMUNICATIONS (continued) 8.20Mobile TelecommunicationsVodafone 32,693,867 72,450 6.43
72,450 6.43
TOTAL TELECOMMUNICATIONS 92,370 8.20
UTILITIES (4.00%, 31/01/2013 4.08%) 4.00ElectricitySSE 651,973 8,587 0.76
8,587 0.76
Gas, Water & MultiutilitiesCentrica 3,493,708 10,890 0.97National Grid 2,477,166 19,458 1.73Severn Trent 160,008 2,771 0.25United Utilities 448,522 3,211 0.29
36,330 3.24
TOTAL UTILITIES 44,917 4.00
DERIVATIVES (-0.01%, 31/01/2013 0.10%) (0.01)FuturesFTSE 100 Index Futures March 2014 149 (61) (0.01)
(61) (0.01)
TOTAL DERIVATIVES (61) (0.01)
Portfolio of investments^ 1,123,435 99.75
Net other assets 2,827 0.25
Total net assets 1,126,262 100.00
Financial derivative instruments exposure as at 31 January 2014 Value (£)Exchange traded derivatives 9,532,275Total financial derivative instruments exposure 9,532,275
Efficient portfolio management techniques as at 31 January 2014 Value (£)Underlying exposure obtained through efficient portfolio management techniques 9,532,275
Counterparties to financial derivative instruments and efficient portfolio management techniques as at 31 January 2014 Value (£)Merrill Lynch (61,240)
Collateral as at 31 January 2014The type and amount of collateral received to reduce counterparty exposure: Value (£)GBP cash 371,907
‡ Scottish Widows Investment Partnership (SWIP). This investment is a related party.
All holdings are ordinary shares or stock units and admitted to official stock exchange listings unless otherwise stated.Holdings are denominated in Sterling unless otherwise stated.^ Including derivative liabilities.† Related party.
The counterparty exposure represents the unrealised profit or loss on the derivative contract. It is therefore a different amount to the value of the sum of the notionals.
The financial derivative instruments exposure represents the value of what is "economically commanded" by the instrument and is calculated as the sum of the notional value of the instrument, i.e. the number of contracts multiplied by the relevant index or spot price.
43
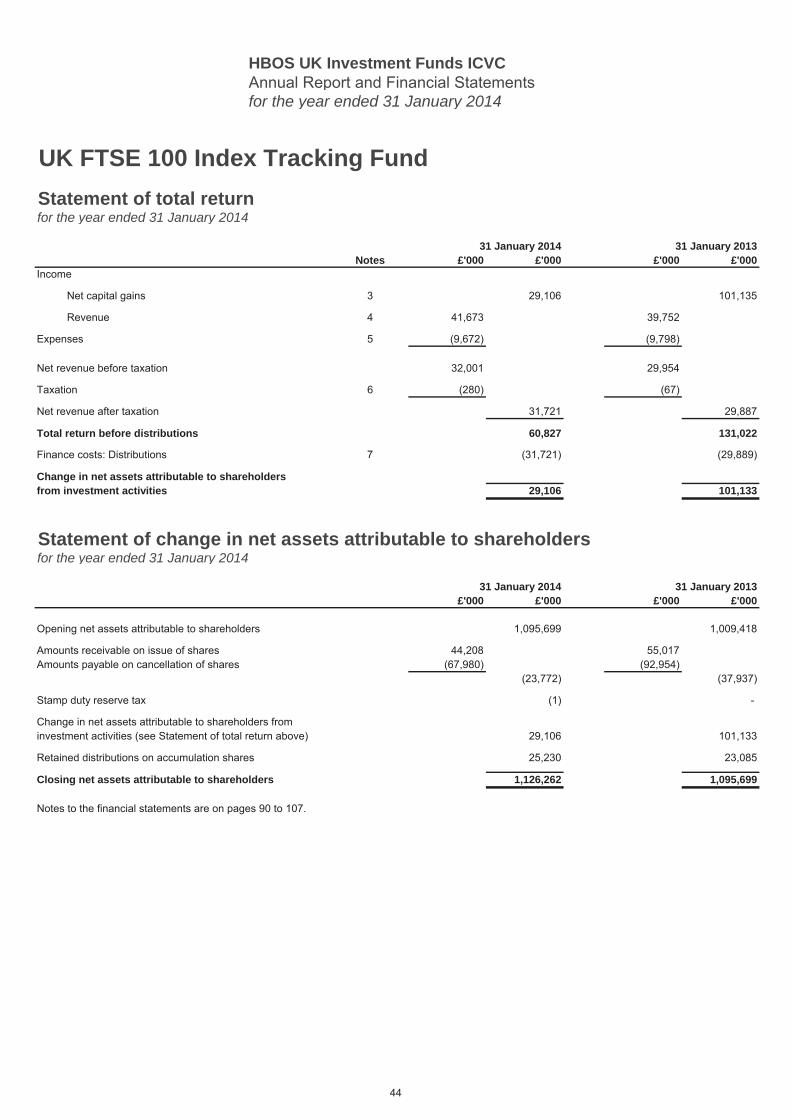
HBOS UK Investment Funds ICVCAnnual Report and Financial Statementsfor the year ended 31 January 2014
UK FTSE 100 Index Tracking FundStatement of total returnfor the year ended 31 January 2014
31 January 2014 31 January 2013Notes £'000 £'000 £'000 £'000
Income
Net capital gains 3 29,106 101,135
Revenue 4 41,673 39,752
Expenses 5 (9,672) (9,798)
Net revenue before taxation 32,001 29,954
Taxation 6 (280) (67)
Net revenue after taxation 31,721 29,887
Total return before distributions 60,827 131,022
Finance costs: Distributions 7 (31,721) (29,889)
Change in net assets attributable to shareholdersfrom investment activities 29,106 101,133
Statement of change in net assets attributable to shareholdersfor the year ended 31 January 2014
31 January 2014 31 January 2013£'000 £'000 £'000 £'000
Opening net assets attributable to shareholders 1,095,699 1,009,418
Amounts receivable on issue of shares 44,208 55,017Amounts payable on cancellation of shares (67,980) (92,954)
(23,772) (37,937)
Stamp duty reserve tax (1) -
Change in net assets attributable to shareholders frominvestment activities (see Statement of total return above) 29,106 101,133
Retained distributions on accumulation shares 25,230 23,085
Closing net assets attributable to shareholders 1,126,262 1,095,699
Notes to the financial statements are on pages 90 to 107.
44
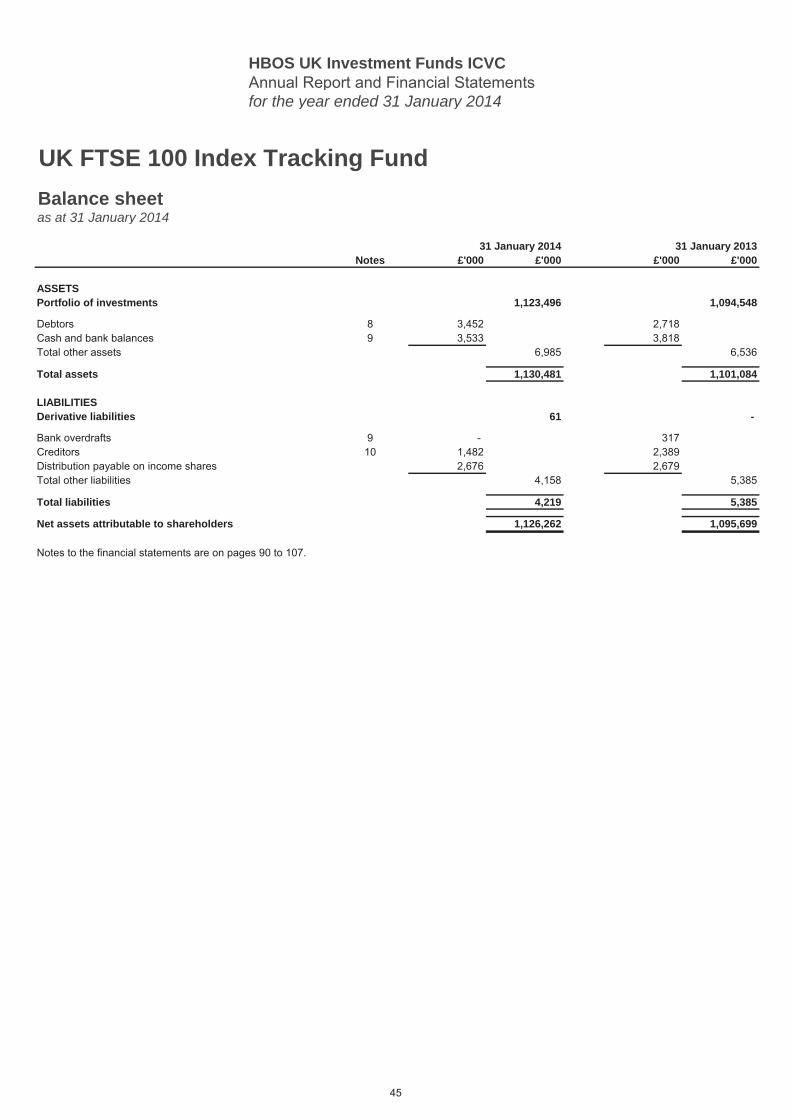
HBOS UK Investment Funds ICVCAnnual Report and Financial Statementsfor the year ended 31 January 2014
UK FTSE 100 Index Tracking FundBalance sheetas at 31 January 2014
31 January 2014 31 January 2013Notes £'000 £'000 £'000 £'000
ASSETSPortfolio of investments 1,123,496 1,094,548
Debtors 8 3,452 2,718Cash and bank balances 9 3,533 3,818Total other assets 6,985 6,536
Total assets 1,130,481 1,101,084
LIABILITIESDerivative liabilities 61 -
Bank overdrafts 9 - 317Creditors 10 1,482 2,389Distribution payable on income shares 2,676 2,679Total other liabilities 4,158 5,385
Total liabilities 4,219 5,385
Net assets attributable to shareholders 1,126,262 1,095,699
Notes to the financial statements are on pages 90 to 107.
45
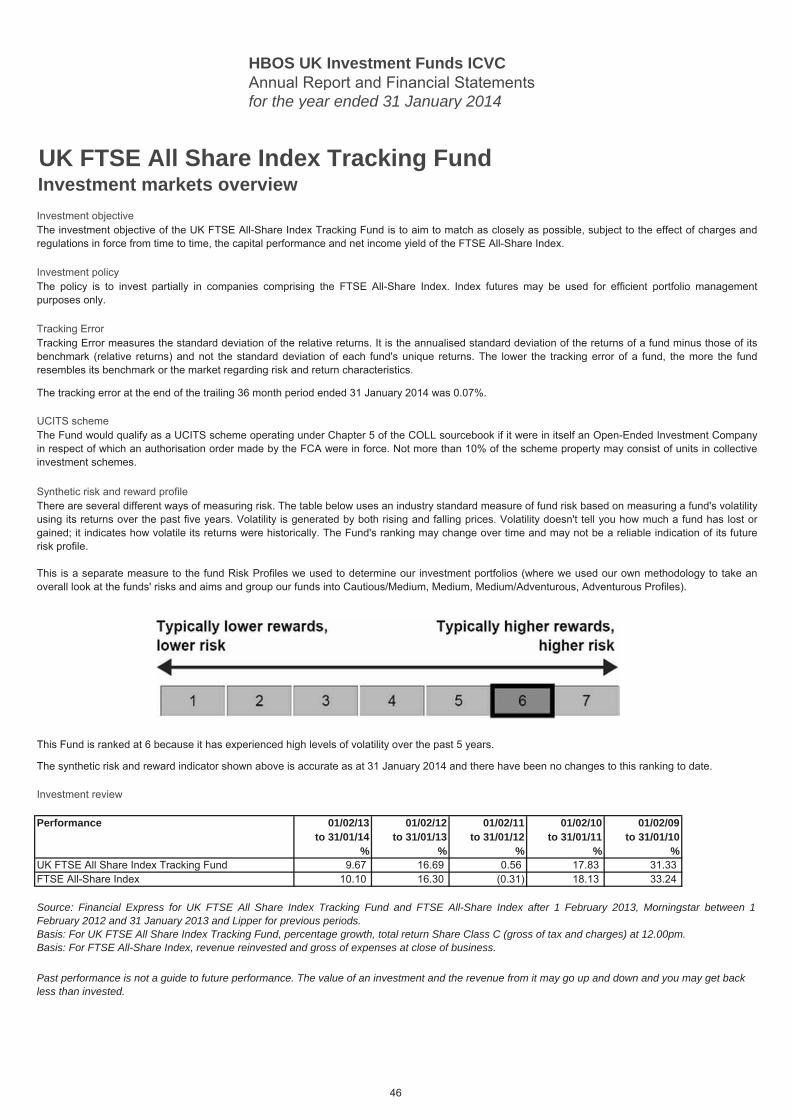
HBOS UK Investment Funds ICVCAnnual Report and Financial Statementsfor the year ended 31 January 2014
UK FTSE All Share Index Tracking FundInvestment markets overview Investment objective
Investment policy
Tracking Error
UCITS scheme
Synthetic risk and reward profile
Investment review
Performance 01/02/13 01/02/12 01/02/11 01/02/10 01/02/09 01/02/08to 31/01/14 to 31/01/13 to 31/01/12 to 31/01/11 to 31/01/10 to 31/01/09
% % % % % %UK FTSE All Share Index Tracking Fund 9.67 16.69 0.56 17.83 31.33 FTSE All-Share Index 10.10 16.30 (0.31) 18.13 33.24
Past performance is not a guide to future performance. The value of an investment and the revenue from it may go up and down and you may get back less than invested.
The investment objective of the UK FTSE All-Share Index Tracking Fund is to aim to match as closely as possible, subject to the effect of charges andregulations in force from time to time, the capital performance and net income yield of the FTSE All-Share Index.
The policy is to invest partially in companies comprising the FTSE All-Share Index. Index futures may be used for efficient portfolio managementpurposes only.
The Fund would qualify as a UCITS scheme operating under Chapter 5 of the COLL sourcebook if it were in itself an Open-Ended Investment Companyin respect of which an authorisation order made by the FCA were in force. Not more than 10% of the scheme property may consist of units in collectiveinvestment schemes.
There are several different ways of measuring risk. The table below uses an industry standard measure of fund risk based on measuring a fund's volatilityusing its returns over the past five years. Volatility is generated by both rising and falling prices. Volatility doesn't tell you how much a fund has lost orgained; it indicates how volatile its returns were historically. The Fund's ranking may change over time and may not be a reliable indication of its futurerisk profile.
This is a separate measure to the fund Risk Profiles we used to determine our investment portfolios (where we used our own methodology to take anoverall look at the funds' risks and aims and group our funds into Cautious/Medium, Medium, Medium/Adventurous, Adventurous Profiles).
This Fund is ranked at 6 because it has experienced high levels of volatility over the past 5 years.
The synthetic risk and reward indicator shown above is accurate as at 31 January 2014 and there have been no changes to this ranking to date.
Source: Financial Express for UK FTSE All Share Index Tracking Fund and FTSE All-Share Index after 1 February 2013, Morningstar between 1February 2012 and 31 January 2013 and Lipper for previous periods.Basis: For UK FTSE All Share Index Tracking Fund, percentage growth, total return Share Class C (gross of tax and charges) at 12.00pm.Basis: For FTSE All-Share Index, revenue reinvested and gross of expenses at close of business.
Tracking Error measures the standard deviation of the relative returns. It is the annualised standard deviation of the returns of a fund minus those of itsbenchmark (relative returns) and not the standard deviation of each fund's unique returns. The lower the tracking error of a fund, the more the fundresembles its benchmark or the market regarding risk and return characteristics.
The tracking error at the end of the trailing 36 month period ended 31 January 2014 was 0.07%.
46
HBOS UK Investment Funds ICVCAnnual Report and Financial Statementsfor the year ended 31 January 2014
UK FTSE All Share Index Tracking FundInvestment markets overview (continued)Investment review (continued)
Just after the end of the reporting period, the Bank of England chose to abandon its six month-old “forward guidance” policy. The move was prompted byan unexpected fall in the unemployment rate over the three months to end-November. Having reached 7.1%, the rate was very close to 7%, the level atwhich the Bank had previously indicated it may consider raising interest rates. Instead, however, Governor Mark Carney has stated that policy will not beguided by unemployment alone.
In January, Mr Carney commented that the British economy was in a “different place” from last summer. Indeed, the strength of its recovery has surprisednearly everyone. The International Monetary Fund (IMF) recently upped its 2014 UK growth forecast from 1.9% to 2.4% – the fastest expansion rate inEurope. But while the recovery has been impressive, most commentators agree that the UK economy could ill-afford an increase in interest rates at thisearly stage. Wage growth has stagnated for five years (although it is starting to recover), while corporate spending remains stubbornly below pre-crisislevels. Finally, the much-hoped-for rebound in workers’ productivity – viewed as essential if economic growth is to gain momentum – remainsfrustratingly absent.
At a stock level, the top ten performing companies in the FTSE All-Share Index over the year were Ocado, Xaar, Thomas Cook, Topps Tiles,Supergroup, Greencore, Darty, JD Sports Fashion, Gleeson (MJ) and Hargreaves Lansdown. The bottom ten performing companies in the index wereNew World Resources, Petropavlovsk, Talvivaara Mining, Kazakhmys, Evraz, Imagination Technologies, Carclo, Hochschild Mining, Essar and Fresnillo.
In terms of activity, the Fund continued to track the FTSE All-Share Index. We therefore periodically rebalanced its holdings in accordance with thechanges made by index provider FTSE at its quarterly reviews. Firms that exited the index included: Aegis, Avocet Mining, Breedon Aggregates Limited,Camellia, CPP, Electric General Investment, Eurasion Natural. Fiberweb, Fortune Oil, Genel Energy, Goldenport, iEnergizer, Invensys, ISIS Property,Lonrho, Mecom, Promethean World, and Southern Cross Healthcare.
In their place came: Al Noor Hospitals, Biotech Growth, Carcal Energy, Carphone Warehouse, Crest Nicholson, Countrywide, CVC Credit Partners,Entertainment One, Esure, Foxtons, Games Workshop, Grafton, HellermannTyton, Lupus Capital, Merlin Entertainment, Partnership Assurance,Renewables Infrastructure and Innovation.
After several false starts, the UK economy is finally gathering momentum, with growth in 2014 expected to reach a seven-year high. So far, however, therecovery has been narrowly focused on the consumer sector and housing market. We therefore hope to see a broadening out of activity as the yearprogresses.
Scottish Widows Investment Partnership LimitedFebruary 2014
UK equity markets had a strong 12 months. Traders were encouraged into riskier assets by the extraordinary policy actions of the world’s central banksand the gradually improving economic climate. At a sector level, telecoms and consumer services were among the best performers over the 12 months.In contrast, basic materials and oil & gas lagged behind. The Fund made a net return of 8.05% (9.67% on a gross basis). The Fund's benchmark, theFTSE All-Share Index, had a gross return of 10.10%.
Investment markets and conditions can change rapidly and as such the views expressed should not be taken as statements of fact nor should reliancebe placed on these views when making investment decisions.
47
HBOS UK Investment Funds ICVCAnnual Report and Financial Statementsfor the year ended 31 January 2014
UK FTSE All Share Index Tracking FundPerformance recordCalendar Highest Lowest Net revenueyear price price per share
p p p
2009Share Class A 47.26 29.78 1.5275Share Class C 37.71 23.46 0.9698Share Class F 23.12 14.36 0.6329Share Class G 23.23 14.40 0.6593Share Class I 47.33 29.79 1.6787
2010Share Class A 52.83 42.84 1.3229Share Class C 42.99 34.41 0.6814Share Class F 26.41 21.12 0.4836Share Class G 26.61 21.25 0.5436Share Class I 52.91 42.92 1.5282
2011Share Class A 54.14 43.37 1.3466Share Class C 44.22 35.92 0.6913Share Class F 27.22 22.12 0.4905Share Class G 27.41 22.30 0.5563Share Class I 54.25 43.41 1.5944
2012Share Class A 53.55 46.99 1.6711Share Class C 45.36 39.22 0.9956Share Class F 28.00 24.19 0.6746Share Class G 28.29 24.42 0.7411Share Class I 53.64 47.06 1.9042
2013Share Class A 62.11 54.05 1.7212Share Class C 53.93 45.79 1.1959Share Class F 33.28 28.26 0.7475Share Class G 33.62 28.55 0.7697Share Class I 62.30 54.16 1.9964
2014*Share Class A 62.74 59.39 0.7297Share Class C 54.45 51.54 0.5059Share Class F 33.61 31.81 0.3106Share Class G 33.95 32.13 0.3137Share Class I 62.95 59.60 0.8793
* Up to 31 January 2014.
48
HBOS UK Investment Funds ICVCAnnual Report and Financial Statementsfor the year ended 31 January 2014
UK FTSE All Share Index Tracking FundPerformance record (continued)
Net asset Net assetvalue of value Shares
share class per share in issue£ p
Share Class A 106,442,983 49.66 214,336,272Share Class C 382,184,369 41.58 919,146,000Share Class F 101,236,529 25.63 394,992,000Share Class G 1,136,994 25.85 4,398,000Share Class I 1,459,044,651 49.66 2,937,969,068
Share Class A 113,597,071 55.60 204,306,272Share Class C 365,759,546 47.67 767,251,000Share Class F 131,427,009 29.43 446,627,000Share Class G 2,321,198 29.73 7,808,000Share Class I 1,604,702,405 55.65 2,883,384,068
Share Class A 115,643,369 58.69 197,051,272Share Class C 350,830,565 51.56 680,436,000Share Class F 150,152,291 31.82 471,842,000Share Class G 5,021,386 32.15 15,618,000Share Class I 1,613,323,969 58.74 2,746,379,068
Ongoing charges figure
as at 31 January 2014 as at 31 January 2013% %
Share Class A 0.50 0.50Share Class C 1.00 1.36Share Class F 1.00 1.17Share Class G 1.00 1.00Share Class I# 0.00 0.00
# Fees are payable by institutional investors in this share class to the ACD outside the Fund.
as at 31 January 2012
as at 31 January 2013
as at 31 January 2014
The ongoing charges figure (OCF) is the total expenses paid by each share class in the year against its average net asset value. It excludes the cost ofbuying or selling assets for the Fund (unless these assets are shares of another fund). The OCF can fluctuate as underlying costs change.
49
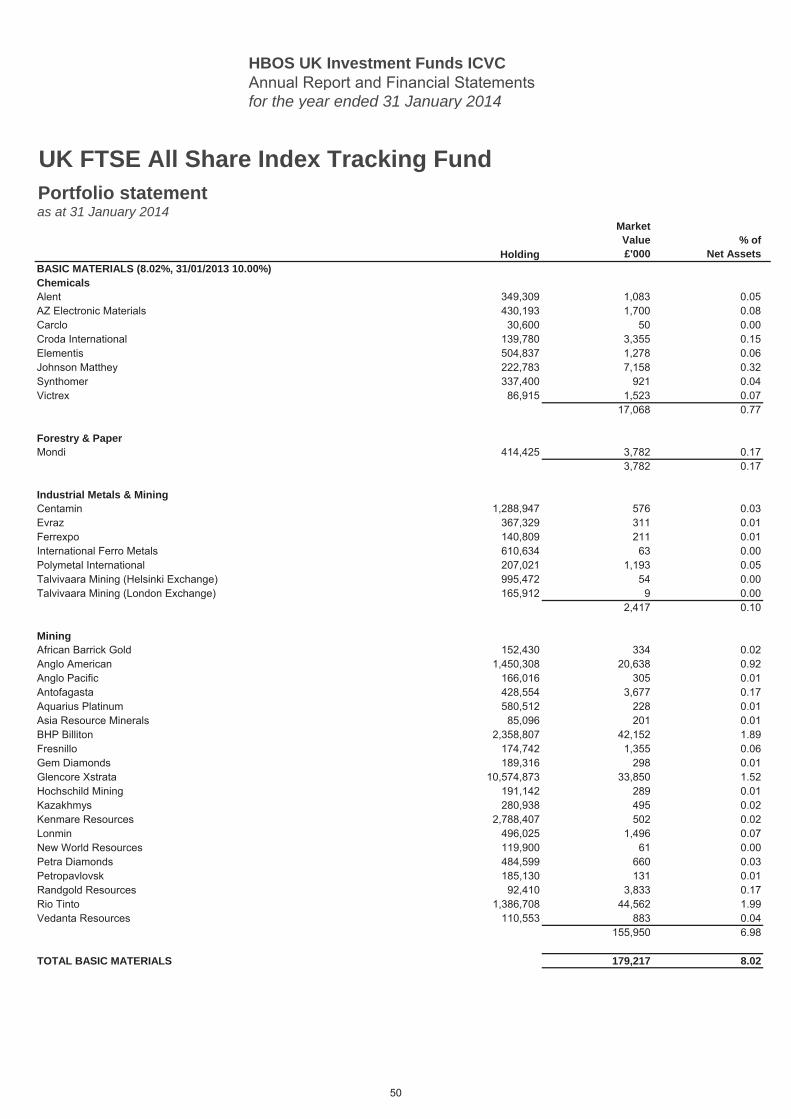
HBOS UK Investment Funds ICVCAnnual Report and Financial Statementsfor the year ended 31 January 2014
Holding
MarketValue£'000
% ofNet Assets
BASIC MATERIALS (8.02%, 31/01/2013 10.00%) 8.02ChemicalsAlent 349,309 1,083 0.05AZ Electronic Materials 430,193 1,700 0.08Carclo 30,600 50 0.00Croda International 139,780 3,355 0.15Elementis 504,837 1,278 0.06Johnson Matthey 222,783 7,158 0.32Synthomer 337,400 921 0.04Victrex 86,915 1,523 0.07
17,068 0.77
Forestry & PaperMondi 414,425 3,782 0.17
3,782 0.17
Industrial Metals & MiningCentamin 1,288,947 576 0.03Evraz 367,329 311 0.01Ferrexpo 140,809 211 0.01International Ferro Metals 610,634 63 0.00Polymetal International 207,021 1,193 0.05Talvivaara Mining (Helsinki Exchange) 995,472 54 0.00Talvivaara Mining (London Exchange) 165,912 9 0.00
2,417 0.10
MiningAfrican Barrick Gold 152,430 334 0.02Anglo American 1,450,308 20,638 0.92Anglo Pacific 166,016 305 0.01Antofagasta 428,554 3,677 0.17Aquarius Platinum 580,512 228 0.01Asia Resource Minerals 85,096 201 0.01BHP Billiton 2,358,807 42,152 1.89Fresnillo 174,742 1,355 0.06Gem Diamonds 189,316 298 0.01Glencore Xstrata 10,574,873 33,850 1.52Hochschild Mining 191,142 289 0.01Kazakhmys 280,938 495 0.02Kenmare Resources 2,788,407 502 0.02Lonmin 496,025 1,496 0.07New World Resources 119,900 61 0.00Petra Diamonds 484,599 660 0.03Petropavlovsk 185,130 131 0.01Randgold Resources 92,410 3,833 0.17Rio Tinto 1,386,708 44,562 1.99Vedanta Resources 110,553 883 0.04
155,950 6.98
TOTAL BASIC MATERIALS 179,217 8.02
UK FTSE All Share Index Tracking FundPortfolio statement as at 31 January 2014
50
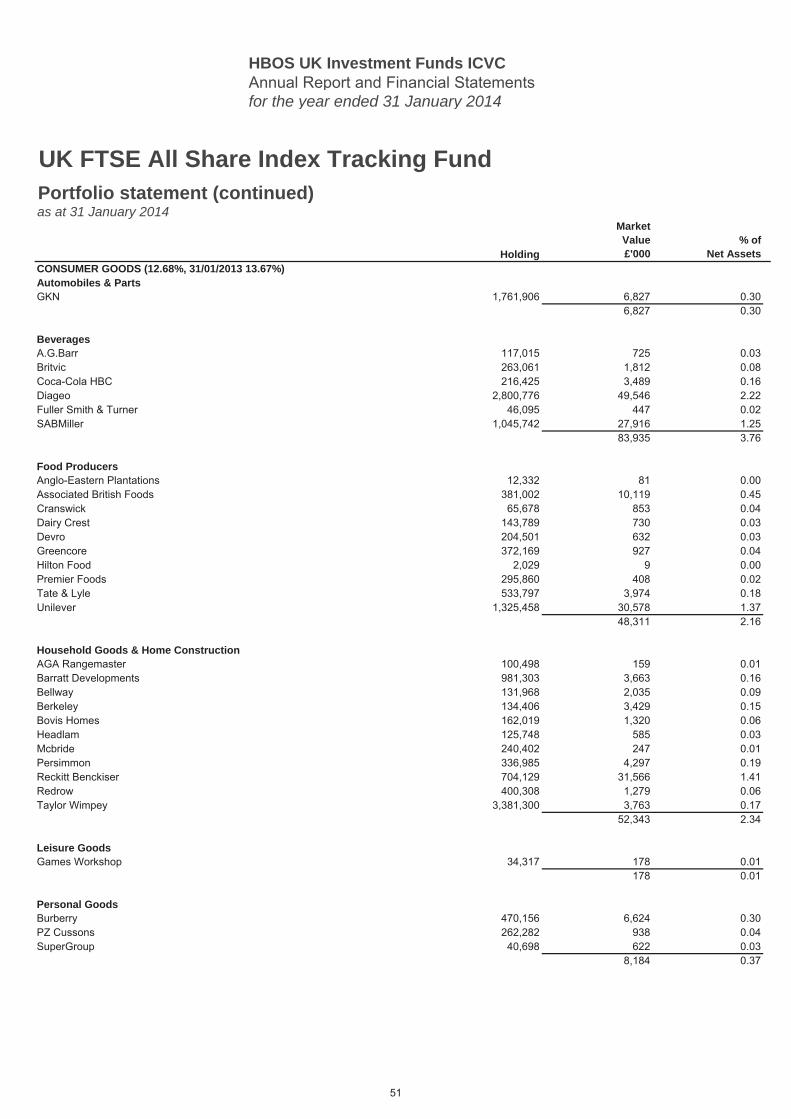
HBOS UK Investment Funds ICVCAnnual Report and Financial Statementsfor the year ended 31 January 2014
Holding
MarketValue£'000
% ofNet Assets
UK FTSE All Share Index Tracking FundPortfolio statement (continued)as at 31 January 2014
CONSUMER GOODS (12.68%, 31/01/2013 13.67%) 12.68Automobiles & PartsGKN 1,761,906 6,827 0.30
6,827 0.30
BeveragesA.G.Barr 117,015 725 0.03Britvic 263,061 1,812 0.08Coca-Cola HBC 216,425 3,489 0.16Diageo 2,800,776 49,546 2.22Fuller Smith & Turner 46,095 447 0.02SABMiller 1,045,742 27,916 1.25
83,935 3.76
Food ProducersAnglo-Eastern Plantations 12,332 81 0.00Associated British Foods 381,002 10,119 0.45Cranswick 65,678 853 0.04Dairy Crest 143,789 730 0.03Devro 204,501 632 0.03Greencore 372,169 927 0.04Hilton Food 2,029 9 0.00Premier Foods 295,860 408 0.02Tate & Lyle 533,797 3,974 0.18Unilever 1,325,458 30,578 1.37
48,311 2.16
Household Goods & Home ConstructionAGA Rangemaster 100,498 159 0.01Barratt Developments 981,303 3,663 0.16Bellway 131,968 2,035 0.09Berkeley 134,406 3,429 0.15Bovis Homes 162,019 1,320 0.06Headlam 125,748 585 0.03Mcbride 240,402 247 0.01Persimmon 336,985 4,297 0.19Reckitt Benckiser 704,129 31,566 1.41Redrow 400,308 1,279 0.06Taylor Wimpey 3,381,300 3,763 0.17
52,343 2.34
Leisure GoodsGames Workshop 34,317 178 0.01
178 0.01
Personal GoodsBurberry 470,156 6,624 0.30PZ Cussons 262,282 938 0.04SuperGroup 40,698 622 0.03
8,184 0.37
51
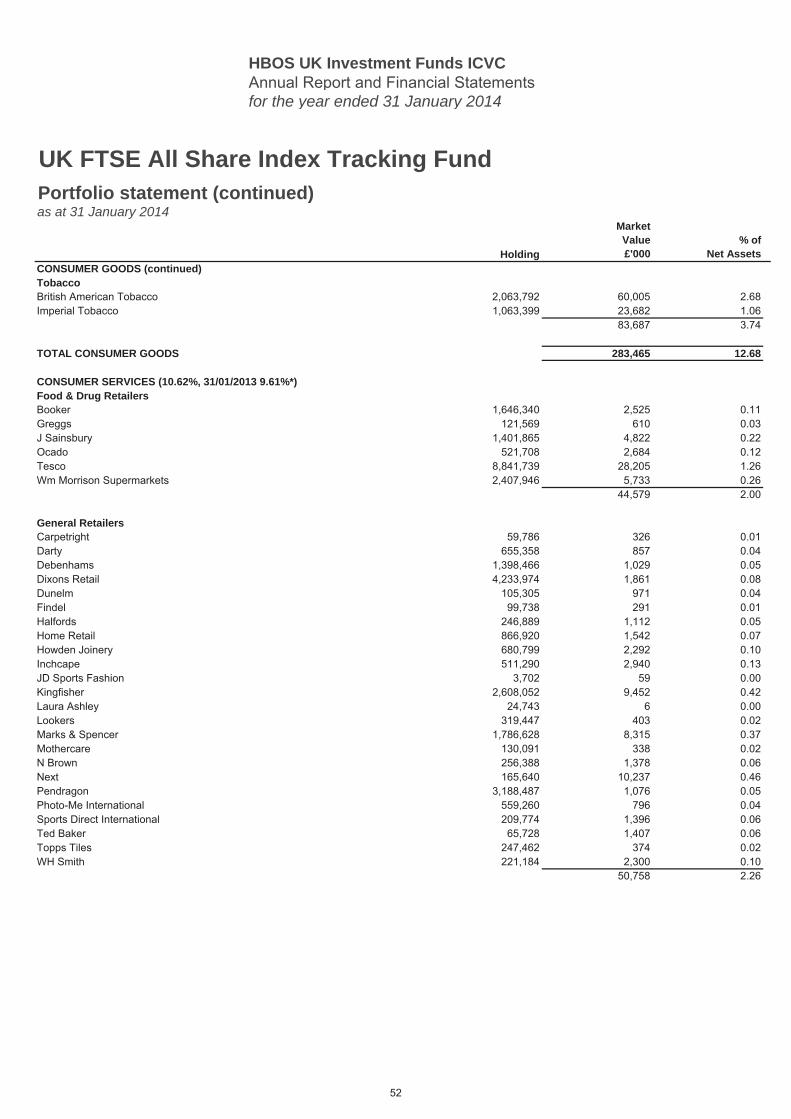
HBOS UK Investment Funds ICVCAnnual Report and Financial Statementsfor the year ended 31 January 2014
Holding
MarketValue£'000
% ofNet Assets
UK FTSE All Share Index Tracking FundPortfolio statement (continued)as at 31 January 2014
CONSUMER GOODS (continued) 12.68TobaccoBritish American Tobacco 2,063,792 60,005 2.68Imperial Tobacco 1,063,399 23,682 1.06
83,687 3.74
TOTAL CONSUMER GOODS 283,465 12.68
CONSUMER SERVICES (10.62%, 31/01/2013 9.61%*) 10.62Food & Drug RetailersBooker 1,646,340 2,525 0.11Greggs 121,569 610 0.03J Sainsbury 1,401,865 4,822 0.22Ocado 521,708 2,684 0.12Tesco 8,841,739 28,205 1.26Wm Morrison Supermarkets 2,407,946 5,733 0.26
44,579 2.00
General RetailersCarpetright 59,786 326 0.01Darty 655,358 857 0.04Debenhams 1,398,466 1,029 0.05Dixons Retail 4,233,974 1,861 0.08Dunelm 105,305 971 0.04Findel 99,738 291 0.01Halfords 246,889 1,112 0.05Home Retail 866,920 1,542 0.07Howden Joinery 680,799 2,292 0.10Inchcape 511,290 2,940 0.13JD Sports Fashion 3,702 59 0.00Kingfisher 2,608,052 9,452 0.42Laura Ashley 24,743 6 0.00Lookers 319,447 403 0.02Marks & Spencer 1,786,628 8,315 0.37Mothercare 130,091 338 0.02N Brown 256,388 1,378 0.06Next 165,640 10,237 0.46Pendragon 3,188,487 1,076 0.05Photo-Me International 559,260 796 0.04Sports Direct International 209,774 1,396 0.06Ted Baker 65,728 1,407 0.06Topps Tiles 247,462 374 0.02WH Smith 221,184 2,300 0.10
50,758 2.26
52
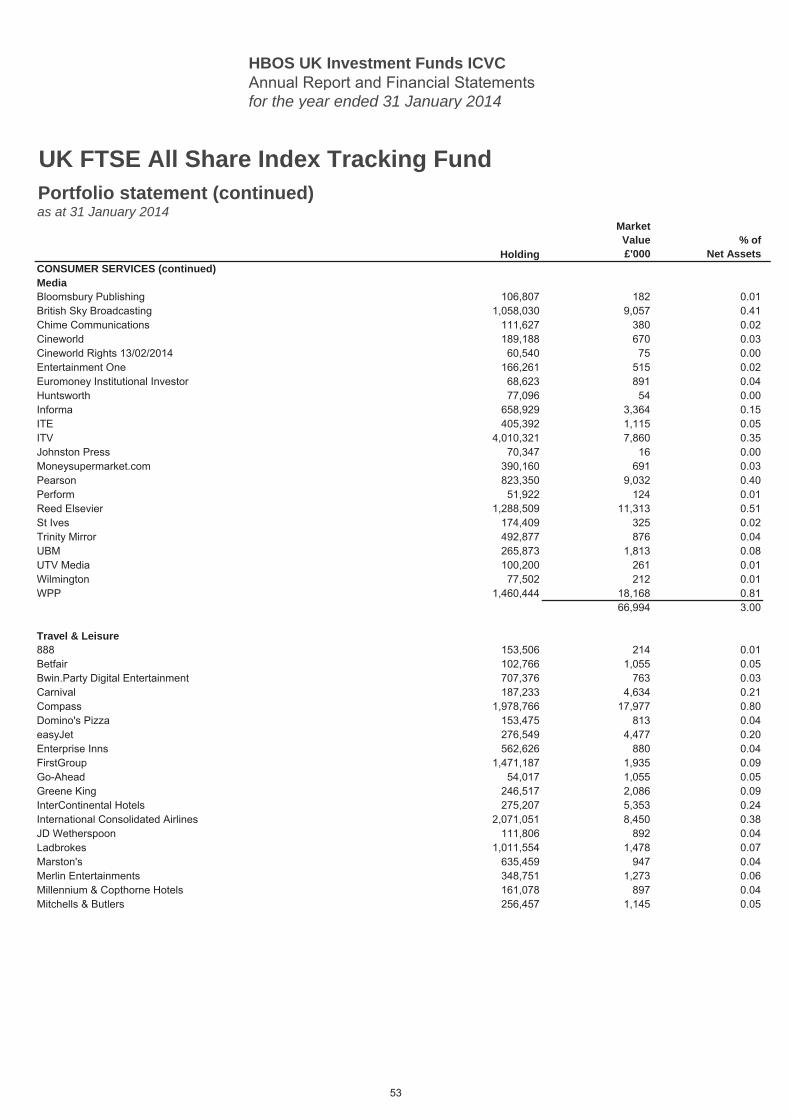
HBOS UK Investment Funds ICVCAnnual Report and Financial Statementsfor the year ended 31 January 2014
Holding
MarketValue£'000
% ofNet Assets
UK FTSE All Share Index Tracking FundPortfolio statement (continued)as at 31 January 2014
CONSUMER SERVICES (continued) 10.62MediaBloomsbury Publishing 106,807 182 0.01British Sky Broadcasting 1,058,030 9,057 0.41Chime Communications 111,627 380 0.02Cineworld 189,188 670 0.03Cineworld Rights 13/02/2014 60,540 75 0.00Entertainment One 166,261 515 0.02Euromoney Institutional Investor 68,623 891 0.04Huntsworth 77,096 54 0.00Informa 658,929 3,364 0.15ITE 405,392 1,115 0.05ITV 4,010,321 7,860 0.35Johnston Press 70,347 16 0.00Moneysupermarket.com 390,160 691 0.03Pearson 823,350 9,032 0.40Perform 51,922 124 0.01Reed Elsevier 1,288,509 11,313 0.51St Ives 174,409 325 0.02Trinity Mirror 492,877 876 0.04UBM 265,873 1,813 0.08UTV Media 100,200 261 0.01Wilmington 77,502 212 0.01WPP 1,460,444 18,168 0.81
66,994 3.00
Travel & Leisure888 153,506 214 0.01Betfair 102,766 1,055 0.05Bwin.Party Digital Entertainment 707,376 763 0.03Carnival 187,233 4,634 0.21Compass 1,978,766 17,977 0.80Domino's Pizza 153,475 813 0.04easyJet 276,549 4,477 0.20Enterprise Inns 562,626 880 0.04FirstGroup 1,471,187 1,935 0.09Go-Ahead 54,017 1,055 0.05Greene King 246,517 2,086 0.09InterContinental Hotels 275,207 5,353 0.24International Consolidated Airlines 2,071,051 8,450 0.38JD Wetherspoon 111,806 892 0.04Ladbrokes 1,011,554 1,478 0.07Marston's 635,459 947 0.04Merlin Entertainments 348,751 1,273 0.06Millennium & Copthorne Hotels 161,078 897 0.04Mitchells & Butlers 256,457 1,145 0.05
53
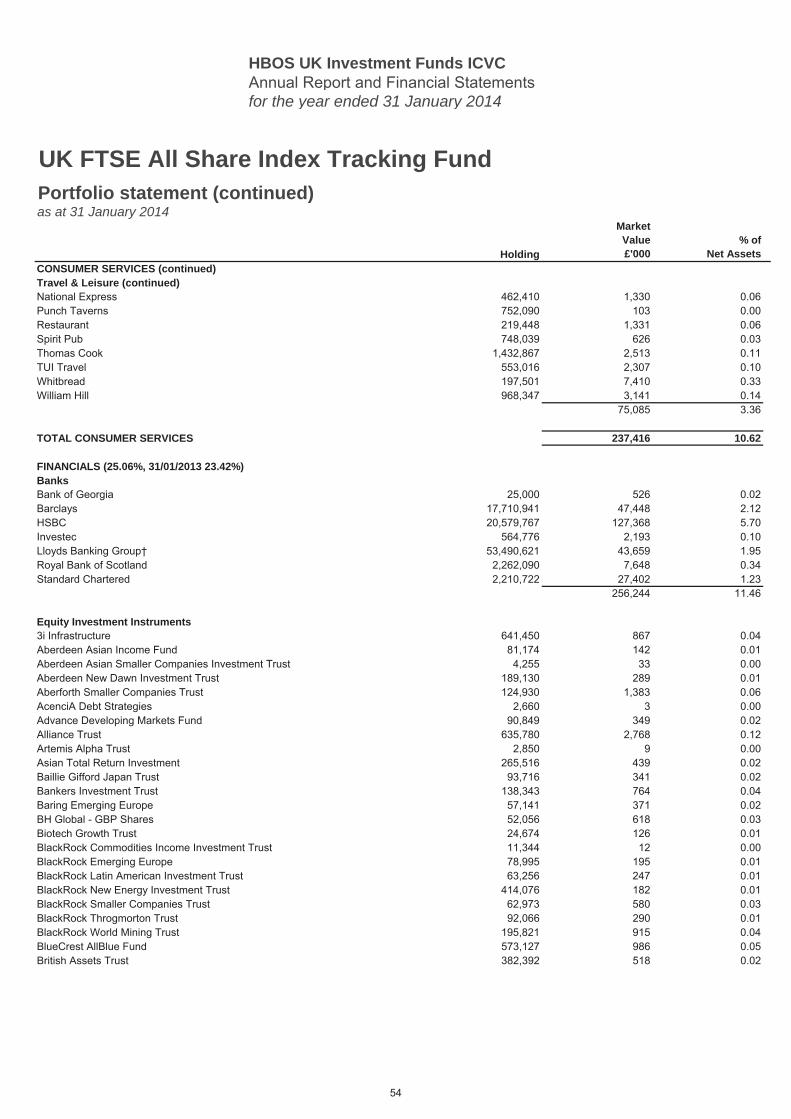
HBOS UK Investment Funds ICVCAnnual Report and Financial Statementsfor the year ended 31 January 2014
Holding
MarketValue£'000
% ofNet Assets
UK FTSE All Share Index Tracking FundPortfolio statement (continued)as at 31 January 2014
CONSUMER SERVICES (continued) 10.62Travel & Leisure (continued)National Express 462,410 1,330 0.06Punch Taverns 752,090 103 0.00Restaurant 219,448 1,331 0.06Spirit Pub 748,039 626 0.03Thomas Cook 1,432,867 2,513 0.11TUI Travel 553,016 2,307 0.10Whitbread 197,501 7,410 0.33William Hill 968,347 3,141 0.14
75,085 3.36
TOTAL CONSUMER SERVICES 237,416 10.62
FINANCIALS (25.06%, 31/01/2013 23.42%) 25.06BanksBank of Georgia 25,000 526 0.02Barclays 17,710,941 47,448 2.12HSBC 20,579,767 127,368 5.70Investec 564,776 2,193 0.10Lloyds Banking Group† 53,490,621 43,659 1.95Royal Bank of Scotland 2,262,090 7,648 0.34Standard Chartered 2,210,722 27,402 1.23
256,244 11.46
Equity Investment Instruments3i Infrastructure 641,450 867 0.04Aberdeen Asian Income Fund 81,174 142 0.01Aberdeen Asian Smaller Companies Investment Trust 4,255 33 0.00Aberdeen New Dawn Investment Trust 189,130 289 0.01Aberforth Smaller Companies Trust 124,930 1,383 0.06AcenciA Debt Strategies 2,660 3 0.00Advance Developing Markets Fund 90,849 349 0.02Alliance Trust 635,780 2,768 0.12Artemis Alpha Trust 2,850 9 0.00Asian Total Return Investment 265,516 439 0.02Baillie Gifford Japan Trust 93,716 341 0.02Bankers Investment Trust 138,343 764 0.04Baring Emerging Europe 57,141 371 0.02BH Global - GBP Shares 52,056 618 0.03Biotech Growth Trust 24,674 126 0.01BlackRock Commodities Income Investment Trust 11,344 12 0.00BlackRock Emerging Europe 78,995 195 0.01BlackRock Latin American Investment Trust 63,256 247 0.01BlackRock New Energy Investment Trust 414,076 182 0.01BlackRock Smaller Companies Trust 62,973 580 0.03BlackRock Throgmorton Trust 92,066 290 0.01BlackRock World Mining Trust 195,821 915 0.04BlueCrest AllBlue Fund 573,127 986 0.05British Assets Trust 382,392 518 0.02
54
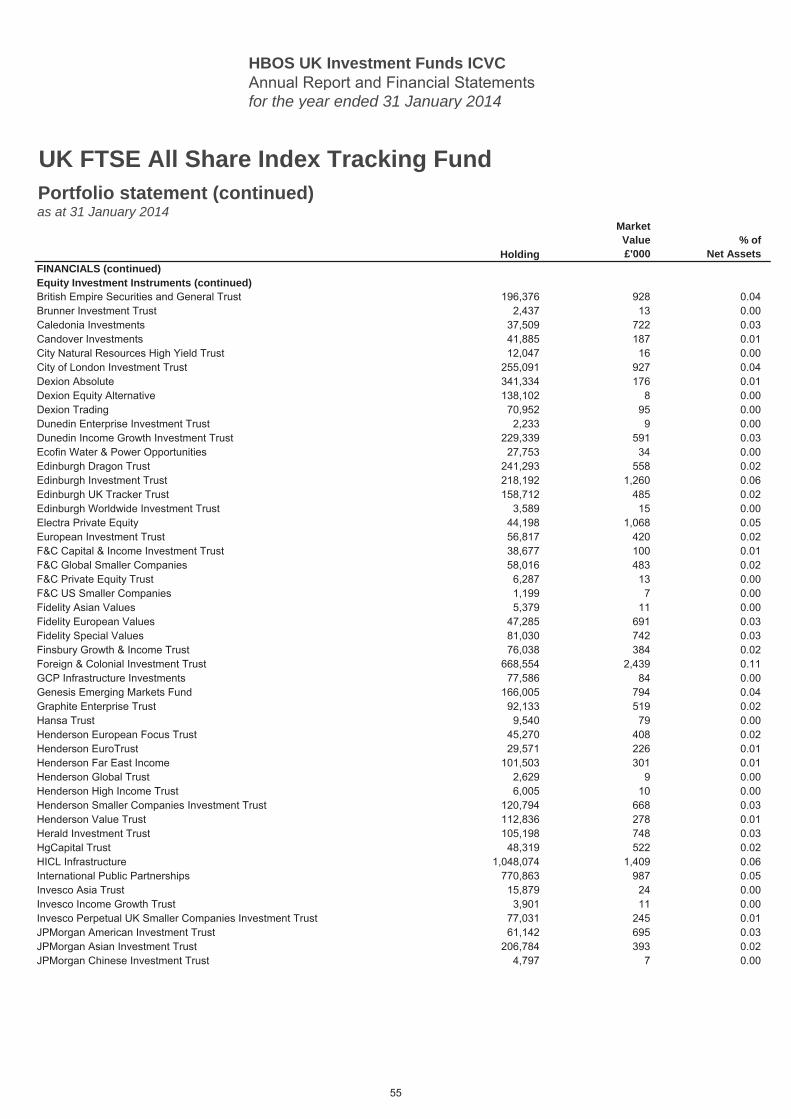
HBOS UK Investment Funds ICVCAnnual Report and Financial Statementsfor the year ended 31 January 2014
Holding
MarketValue£'000
% ofNet Assets
UK FTSE All Share Index Tracking FundPortfolio statement (continued)as at 31 January 2014
FINANCIALS (continued) 25.06Equity Investment Instruments (continued)British Empire Securities and General Trust 196,376 928 0.04Brunner Investment Trust 2,437 13 0.00Caledonia Investments 37,509 722 0.03Candover Investments 41,885 187 0.01City Natural Resources High Yield Trust 12,047 16 0.00City of London Investment Trust 255,091 927 0.04Dexion Absolute 341,334 176 0.01Dexion Equity Alternative 138,102 8 0.00Dexion Trading 70,952 95 0.00Dunedin Enterprise Investment Trust 2,233 9 0.00Dunedin Income Growth Investment Trust 229,339 591 0.03Ecofin Water & Power Opportunities 27,753 34 0.00Edinburgh Dragon Trust 241,293 558 0.02Edinburgh Investment Trust 218,192 1,260 0.06Edinburgh UK Tracker Trust 158,712 485 0.02Edinburgh Worldwide Investment Trust 3,589 15 0.00Electra Private Equity 44,198 1,068 0.05European Investment Trust 56,817 420 0.02F&C Capital & Income Investment Trust 38,677 100 0.01F&C Global Smaller Companies 58,016 483 0.02F&C Private Equity Trust 6,287 13 0.00F&C US Smaller Companies 1,199 7 0.00Fidelity Asian Values 5,379 11 0.00Fidelity European Values 47,285 691 0.03Fidelity Special Values 81,030 742 0.03Finsbury Growth & Income Trust 76,038 384 0.02Foreign & Colonial Investment Trust 668,554 2,439 0.11GCP Infrastructure Investments 77,586 84 0.00Genesis Emerging Markets Fund 166,005 794 0.04Graphite Enterprise Trust 92,133 519 0.02Hansa Trust 9,540 79 0.00Henderson European Focus Trust 45,270 408 0.02Henderson EuroTrust 29,571 226 0.01Henderson Far East Income 101,503 301 0.01Henderson Global Trust 2,629 9 0.00Henderson High Income Trust 6,005 10 0.00Henderson Smaller Companies Investment Trust 120,794 668 0.03Henderson Value Trust 112,836 278 0.01Herald Investment Trust 105,198 748 0.03HgCapital Trust 48,319 522 0.02HICL Infrastructure 1,048,074 1,409 0.06International Public Partnerships 770,863 987 0.05Invesco Asia Trust 15,879 24 0.00Invesco Income Growth Trust 3,901 11 0.00Invesco Perpetual UK Smaller Companies Investment Trust 77,031 245 0.01JPMorgan American Investment Trust 61,142 695 0.03JPMorgan Asian Investment Trust 206,784 393 0.02JPMorgan Chinese Investment Trust 4,797 7 0.00
55
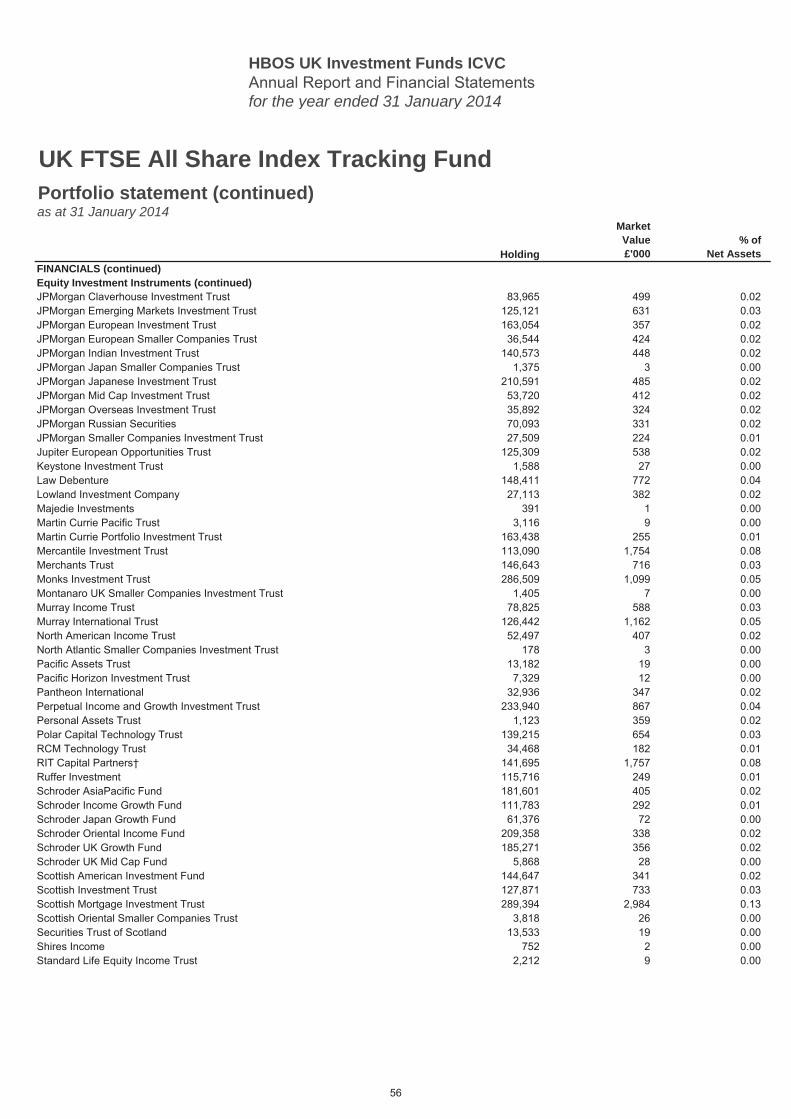
HBOS UK Investment Funds ICVCAnnual Report and Financial Statementsfor the year ended 31 January 2014
Holding
MarketValue£'000
% ofNet Assets
UK FTSE All Share Index Tracking FundPortfolio statement (continued)as at 31 January 2014
FINANCIALS (continued) 25.06Equity Investment Instruments (continued)JPMorgan Claverhouse Investment Trust 83,965 499 0.02JPMorgan Emerging Markets Investment Trust 125,121 631 0.03JPMorgan European Investment Trust 163,054 357 0.02JPMorgan European Smaller Companies Trust 36,544 424 0.02JPMorgan Indian Investment Trust 140,573 448 0.02JPMorgan Japan Smaller Companies Trust 1,375 3 0.00JPMorgan Japanese Investment Trust 210,591 485 0.02JPMorgan Mid Cap Investment Trust 53,720 412 0.02JPMorgan Overseas Investment Trust 35,892 324 0.02JPMorgan Russian Securities 70,093 331 0.02JPMorgan Smaller Companies Investment Trust 27,509 224 0.01Jupiter European Opportunities Trust 125,309 538 0.02Keystone Investment Trust 1,588 27 0.00Law Debenture 148,411 772 0.04Lowland Investment Company 27,113 382 0.02Majedie Investments 391 1 0.00Martin Currie Pacific Trust 3,116 9 0.00Martin Currie Portfolio Investment Trust 163,438 255 0.01Mercantile Investment Trust 113,090 1,754 0.08Merchants Trust 146,643 716 0.03Monks Investment Trust 286,509 1,099 0.05Montanaro UK Smaller Companies Investment Trust 1,405 7 0.00Murray Income Trust 78,825 588 0.03Murray International Trust 126,442 1,162 0.05North American Income Trust 52,497 407 0.02North Atlantic Smaller Companies Investment Trust 178 3 0.00Pacific Assets Trust 13,182 19 0.00Pacific Horizon Investment Trust 7,329 12 0.00Pantheon International 32,936 347 0.02Perpetual Income and Growth Investment Trust 233,940 867 0.04Personal Assets Trust 1,123 359 0.02Polar Capital Technology Trust 139,215 654 0.03RCM Technology Trust 34,468 182 0.01RIT Capital Partners† 141,695 1,757 0.08Ruffer Investment 115,716 249 0.01Schroder AsiaPacific Fund 181,601 405 0.02Schroder Income Growth Fund 111,783 292 0.01Schroder Japan Growth Fund 61,376 72 0.00Schroder Oriental Income Fund 209,358 338 0.02Schroder UK Growth Fund 185,271 356 0.02Schroder UK Mid Cap Fund 5,868 28 0.00Scottish American Investment Fund 144,647 341 0.02Scottish Investment Trust 127,871 733 0.03Scottish Mortgage Investment Trust 289,394 2,984 0.13Scottish Oriental Smaller Companies Trust 3,818 26 0.00Securities Trust of Scotland 13,533 19 0.00Shires Income 752 2 0.00Standard Life Equity Income Trust 2,212 9 0.00
56
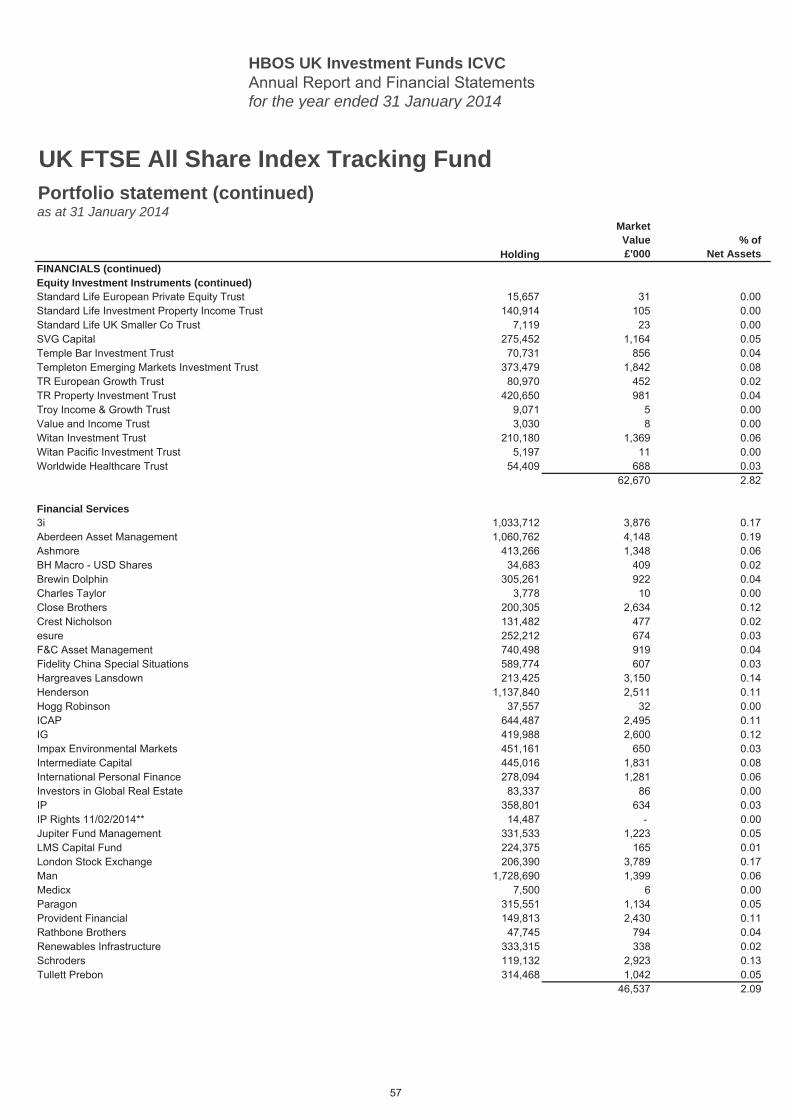
HBOS UK Investment Funds ICVCAnnual Report and Financial Statementsfor the year ended 31 January 2014
Holding
MarketValue£'000
% ofNet Assets
UK FTSE All Share Index Tracking FundPortfolio statement (continued)as at 31 January 2014
FINANCIALS (continued) 25.06Equity Investment Instruments (continued)Standard Life European Private Equity Trust 15,657 31 0.00Standard Life Investment Property Income Trust 140,914 105 0.00Standard Life UK Smaller Co Trust 7,119 23 0.00SVG Capital 275,452 1,164 0.05Temple Bar Investment Trust 70,731 856 0.04Templeton Emerging Markets Investment Trust 373,479 1,842 0.08TR European Growth Trust 80,970 452 0.02TR Property Investment Trust 420,650 981 0.04Troy Income & Growth Trust 9,071 5 0.00Value and Income Trust 3,030 8 0.00Witan Investment Trust 210,180 1,369 0.06Witan Pacific Investment Trust 5,197 11 0.00Worldwide Healthcare Trust 54,409 688 0.03
62,670 2.82
Financial Services3i 1,033,712 3,876 0.17Aberdeen Asset Management 1,060,762 4,148 0.19Ashmore 413,266 1,348 0.06BH Macro - USD Shares 34,683 409 0.02Brewin Dolphin 305,261 922 0.04Charles Taylor 3,778 10 0.00Close Brothers 200,305 2,634 0.12Crest Nicholson 131,482 477 0.02esure 252,212 674 0.03F&C Asset Management 740,498 919 0.04Fidelity China Special Situations 589,774 607 0.03Hargreaves Lansdown 213,425 3,150 0.14Henderson 1,137,840 2,511 0.11Hogg Robinson 37,557 32 0.00ICAP 644,487 2,495 0.11IG 419,988 2,600 0.12Impax Environmental Markets 451,161 650 0.03Intermediate Capital 445,016 1,831 0.08International Personal Finance 278,094 1,281 0.06Investors in Global Real Estate 83,337 86 0.00IP 358,801 634 0.03IP Rights 11/02/2014** 14,487 - 0.00Jupiter Fund Management 331,533 1,223 0.05LMS Capital Fund 224,375 165 0.01London Stock Exchange 206,390 3,789 0.17Man 1,728,690 1,399 0.06Medicx 7,500 6 0.00Paragon 315,551 1,134 0.05Provident Financial 149,813 2,430 0.11Rathbone Brothers 47,745 794 0.04Renewables Infrastructure 333,315 338 0.02Schroders 119,132 2,923 0.13Tullett Prebon 314,468 1,042 0.05
46,537 2.09
57
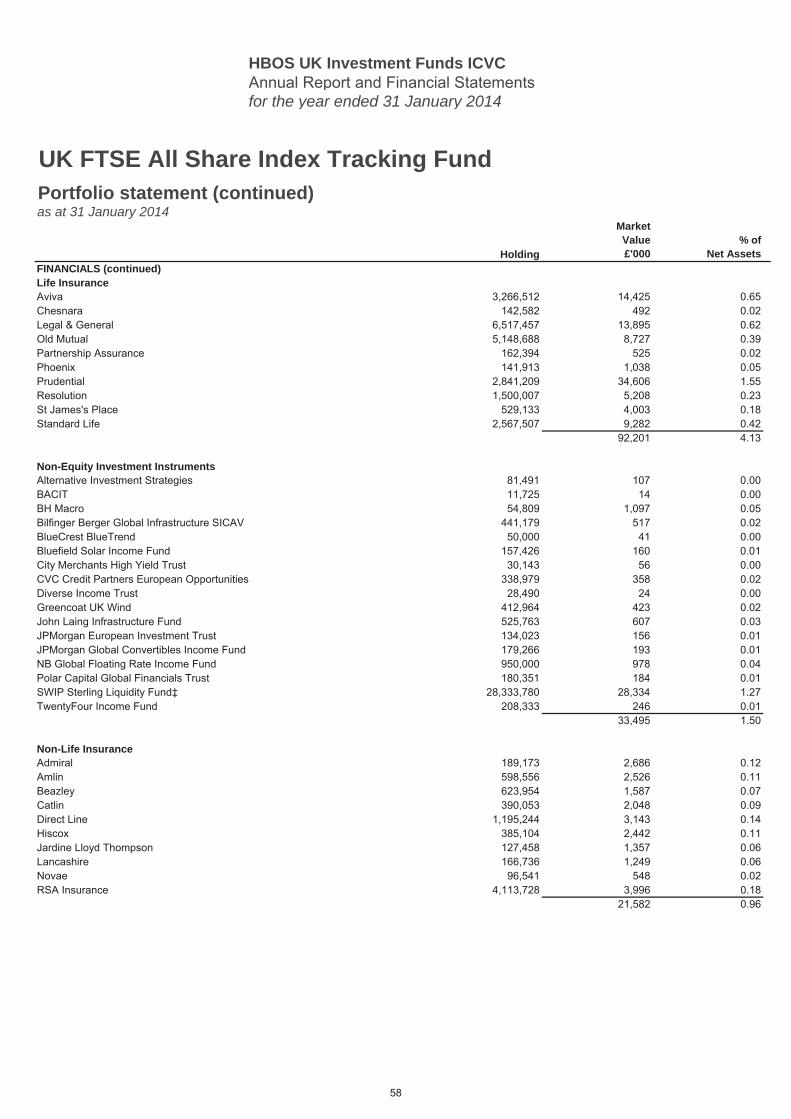
HBOS UK Investment Funds ICVCAnnual Report and Financial Statementsfor the year ended 31 January 2014
Holding
MarketValue£'000
% ofNet Assets
UK FTSE All Share Index Tracking FundPortfolio statement (continued)as at 31 January 2014
FINANCIALS (continued) 25.06Life InsuranceAviva 3,266,512 14,425 0.65Chesnara 142,582 492 0.02Legal & General 6,517,457 13,895 0.62Old Mutual 5,148,688 8,727 0.39Partnership Assurance 162,394 525 0.02Phoenix 141,913 1,038 0.05Prudential 2,841,209 34,606 1.55Resolution 1,500,007 5,208 0.23St James's Place 529,133 4,003 0.18Standard Life 2,567,507 9,282 0.42
92,201 4.13
Non-Equity Investment InstrumentsAlternative Investment Strategies 81,491 107 0.00BACIT 11,725 14 0.00BH Macro 54,809 1,097 0.05Bilfinger Berger Global Infrastructure SICAV 441,179 517 0.02BlueCrest BlueTrend 50,000 41 0.00Bluefield Solar Income Fund 157,426 160 0.01City Merchants High Yield Trust 30,143 56 0.00CVC Credit Partners European Opportunities 338,979 358 0.02Diverse Income Trust 28,490 24 0.00Greencoat UK Wind 412,964 423 0.02John Laing Infrastructure Fund 525,763 607 0.03JPMorgan European Investment Trust 134,023 156 0.01JPMorgan Global Convertibles Income Fund 179,266 193 0.01NB Global Floating Rate Income Fund 950,000 978 0.04Polar Capital Global Financials Trust 180,351 184 0.01SWIP Sterling Liquidity Fund‡ 28,333,780 28,334 1.27TwentyFour Income Fund 208,333 246 0.01
33,495 1.50
Non-Life InsuranceAdmiral 189,173 2,686 0.12Amlin 598,556 2,526 0.11Beazley 623,954 1,587 0.07Catlin 390,053 2,048 0.09Direct Line 1,195,244 3,143 0.14Hiscox 385,104 2,442 0.11Jardine Lloyd Thompson 127,458 1,357 0.06Lancashire 166,736 1,249 0.06Novae 96,541 548 0.02RSA Insurance 4,113,728 3,996 0.18
21,582 0.96
58
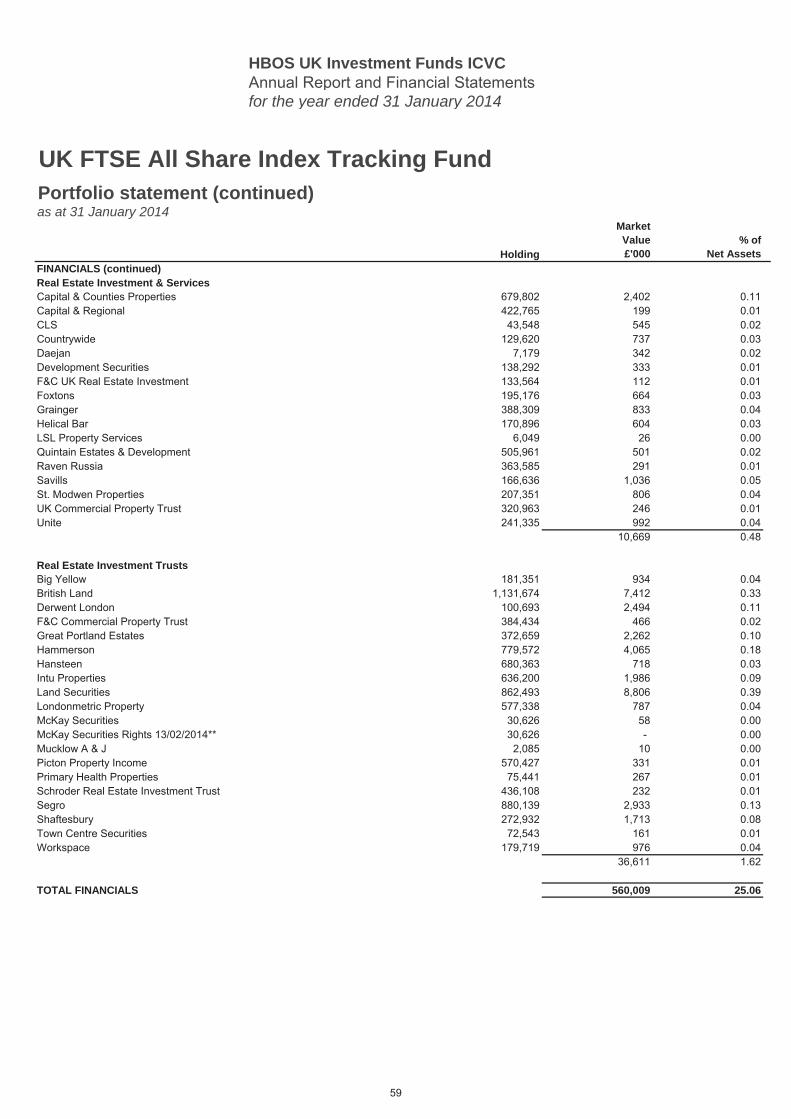
HBOS UK Investment Funds ICVCAnnual Report and Financial Statementsfor the year ended 31 January 2014
Holding
MarketValue£'000
% ofNet Assets
UK FTSE All Share Index Tracking FundPortfolio statement (continued)as at 31 January 2014
FINANCIALS (continued) 25.06Real Estate Investment & ServicesCapital & Counties Properties 679,802 2,402 0.11Capital & Regional 422,765 199 0.01CLS 43,548 545 0.02Countrywide 129,620 737 0.03Daejan 7,179 342 0.02Development Securities 138,292 333 0.01F&C UK Real Estate Investment 133,564 112 0.01Foxtons 195,176 664 0.03Grainger 388,309 833 0.04Helical Bar 170,896 604 0.03LSL Property Services 6,049 26 0.00Quintain Estates & Development 505,961 501 0.02Raven Russia 363,585 291 0.01Savills 166,636 1,036 0.05St. Modwen Properties 207,351 806 0.04UK Commercial Property Trust 320,963 246 0.01Unite 241,335 992 0.04
10,669 0.48
Real Estate Investment TrustsBig Yellow 181,351 934 0.04British Land 1,131,674 7,412 0.33Derwent London 100,693 2,494 0.11F&C Commercial Property Trust 384,434 466 0.02Great Portland Estates 372,659 2,262 0.10Hammerson 779,572 4,065 0.18Hansteen 680,363 718 0.03Intu Properties 636,200 1,986 0.09Land Securities 862,493 8,806 0.39Londonmetric Property 577,338 787 0.04McKay Securities 30,626 58 0.00McKay Securities Rights 13/02/2014** 30,626 - 0.00Mucklow A & J 2,085 10 0.00Picton Property Income 570,427 331 0.01Primary Health Properties 75,441 267 0.01Schroder Real Estate Investment Trust 436,108 232 0.01Segro 880,139 2,933 0.13Shaftesbury 272,932 1,713 0.08Town Centre Securities 72,543 161 0.01Workspace 179,719 976 0.04
36,611 1.62
TOTAL FINANCIALS 560,009 25.06
59
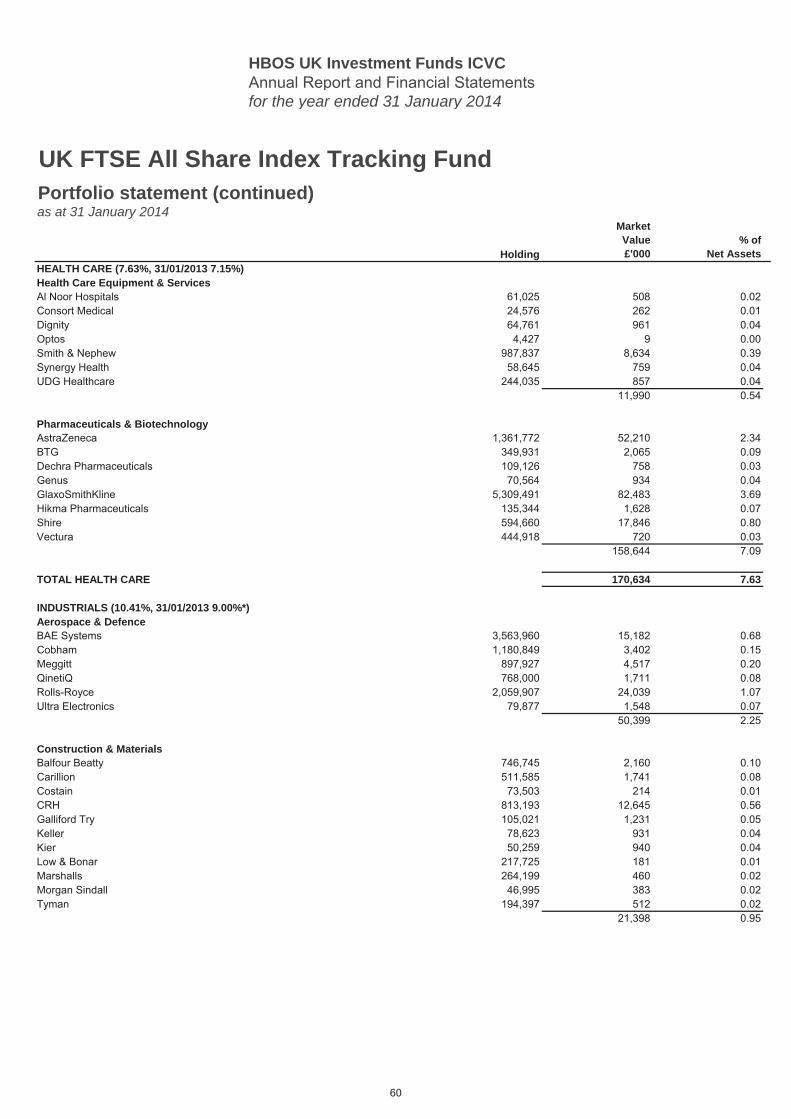
HBOS UK Investment Funds ICVCAnnual Report and Financial Statementsfor the year ended 31 January 2014
Holding
MarketValue£'000
% ofNet Assets
UK FTSE All Share Index Tracking FundPortfolio statement (continued)as at 31 January 2014
HEALTH CARE (7.63%, 31/01/2013 7.15%) 7.63Health Care Equipment & ServicesAl Noor Hospitals 61,025 508 0.02Consort Medical 24,576 262 0.01Dignity 64,761 961 0.04Optos 4,427 9 0.00Smith & Nephew 987,837 8,634 0.39Synergy Health 58,645 759 0.04UDG Healthcare 244,035 857 0.04
11,990 0.54
Pharmaceuticals & BiotechnologyAstraZeneca 1,361,772 52,210 2.34BTG 349,931 2,065 0.09Dechra Pharmaceuticals 109,126 758 0.03Genus 70,564 934 0.04GlaxoSmithKline 5,309,491 82,483 3.69Hikma Pharmaceuticals 135,344 1,628 0.07Shire 594,660 17,846 0.80Vectura 444,918 720 0.03
158,644 7.09
TOTAL HEALTH CARE 170,634 7.63
INDUSTRIALS (10.41%, 31/01/2013 9.00%*) 10.41Aerospace & DefenceBAE Systems 3,563,960 15,182 0.68Cobham 1,180,849 3,402 0.15Meggitt 897,927 4,517 0.20QinetiQ 768,000 1,711 0.08Rolls-Royce 2,059,907 24,039 1.07Ultra Electronics 79,877 1,548 0.07
50,399 2.25
Construction & MaterialsBalfour Beatty 746,745 2,160 0.10Carillion 511,585 1,741 0.08Costain 73,503 214 0.01CRH 813,193 12,645 0.56Galliford Try 105,021 1,231 0.05Keller 78,623 931 0.04Kier 50,259 940 0.04Low & Bonar 217,725 181 0.01Marshalls 264,199 460 0.02Morgan Sindall 46,995 383 0.02Tyman 194,397 512 0.02
21,398 0.95
60
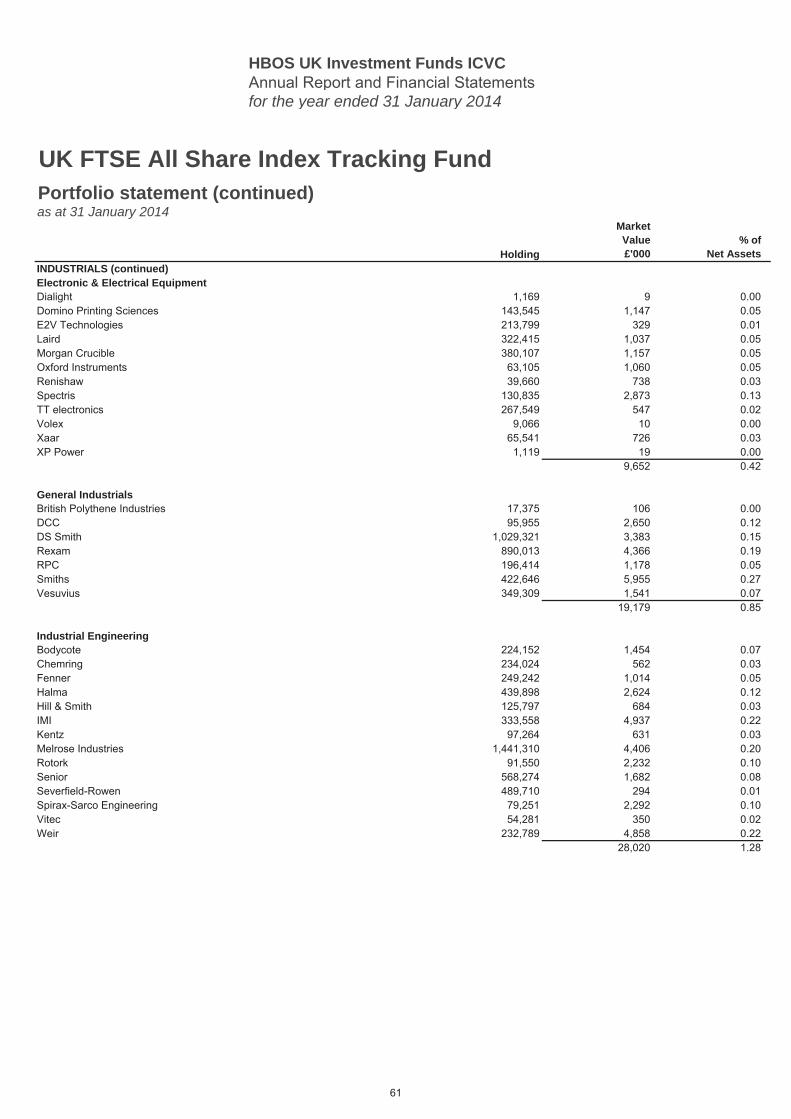
HBOS UK Investment Funds ICVCAnnual Report and Financial Statementsfor the year ended 31 January 2014
Holding
MarketValue£'000
% ofNet Assets
UK FTSE All Share Index Tracking FundPortfolio statement (continued)as at 31 January 2014
INDUSTRIALS (continued) 10.41Electronic & Electrical EquipmentDialight 1,169 9 0.00Domino Printing Sciences 143,545 1,147 0.05E2V Technologies 213,799 329 0.01Laird 322,415 1,037 0.05Morgan Crucible 380,107 1,157 0.05Oxford Instruments 63,105 1,060 0.05Renishaw 39,660 738 0.03Spectris 130,835 2,873 0.13TT electronics 267,549 547 0.02Volex 9,066 10 0.00Xaar 65,541 726 0.03XP Power 1,119 19 0.00
9,652 0.42
General IndustrialsBritish Polythene Industries 17,375 106 0.00DCC 95,955 2,650 0.12DS Smith 1,029,321 3,383 0.15Rexam 890,013 4,366 0.19RPC 196,414 1,178 0.05Smiths 422,646 5,955 0.27Vesuvius 349,309 1,541 0.07
19,179 0.85
Industrial EngineeringBodycote 224,152 1,454 0.07Chemring 234,024 562 0.03Fenner 249,242 1,014 0.05Halma 439,898 2,624 0.12Hill & Smith 125,797 684 0.03IMI 333,558 4,937 0.22Kentz 97,264 631 0.03Melrose Industries 1,441,310 4,406 0.20Rotork 91,550 2,232 0.10Senior 568,274 1,682 0.08Severfield-Rowen 489,710 294 0.01Spirax-Sarco Engineering 79,251 2,292 0.10Vitec 54,281 350 0.02Weir 232,789 4,858 0.22
28,020 1.28
61
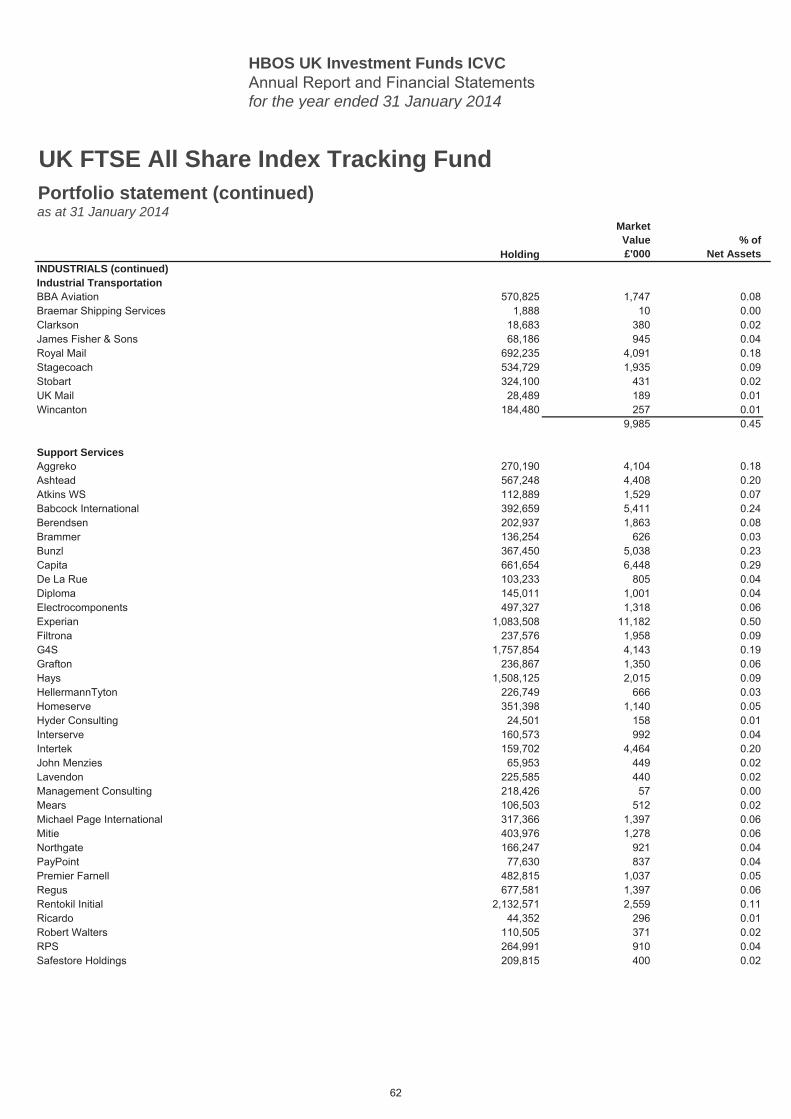
HBOS UK Investment Funds ICVCAnnual Report and Financial Statementsfor the year ended 31 January 2014
Holding
MarketValue£'000
% ofNet Assets
UK FTSE All Share Index Tracking FundPortfolio statement (continued)as at 31 January 2014
INDUSTRIALS (continued) 10.41Industrial TransportationBBA Aviation 570,825 1,747 0.08Braemar Shipping Services 1,888 10 0.00Clarkson 18,683 380 0.02James Fisher & Sons 68,186 945 0.04Royal Mail 692,235 4,091 0.18Stagecoach 534,729 1,935 0.09Stobart 324,100 431 0.02UK Mail 28,489 189 0.01Wincanton 184,480 257 0.01
9,985 0.45
Support ServicesAggreko 270,190 4,104 0.18Ashtead 567,248 4,408 0.20Atkins WS 112,889 1,529 0.07Babcock International 392,659 5,411 0.24Berendsen 202,937 1,863 0.08Brammer 136,254 626 0.03Bunzl 367,450 5,038 0.23Capita 661,654 6,448 0.29De La Rue 103,233 805 0.04Diploma 145,011 1,001 0.04Electrocomponents 497,327 1,318 0.06Experian 1,083,508 11,182 0.50Filtrona 237,576 1,958 0.09G4S 1,757,854 4,143 0.19Grafton 236,867 1,350 0.06Hays 1,508,125 2,015 0.09HellermannTyton 226,749 666 0.03Homeserve 351,398 1,140 0.05Hyder Consulting 24,501 158 0.01Interserve 160,573 992 0.04Intertek 159,702 4,464 0.20John Menzies 65,953 449 0.02Lavendon 225,585 440 0.02Management Consulting 218,426 57 0.00Mears 106,503 512 0.02Michael Page International 317,366 1,397 0.06Mitie 403,976 1,278 0.06Northgate 166,247 921 0.04PayPoint 77,630 837 0.04Premier Farnell 482,815 1,037 0.05Regus 677,581 1,397 0.06Rentokil Initial 2,132,571 2,559 0.11Ricardo 44,352 296 0.01Robert Walters 110,505 371 0.02RPS 264,991 910 0.04Safestore Holdings 209,815 400 0.02
62
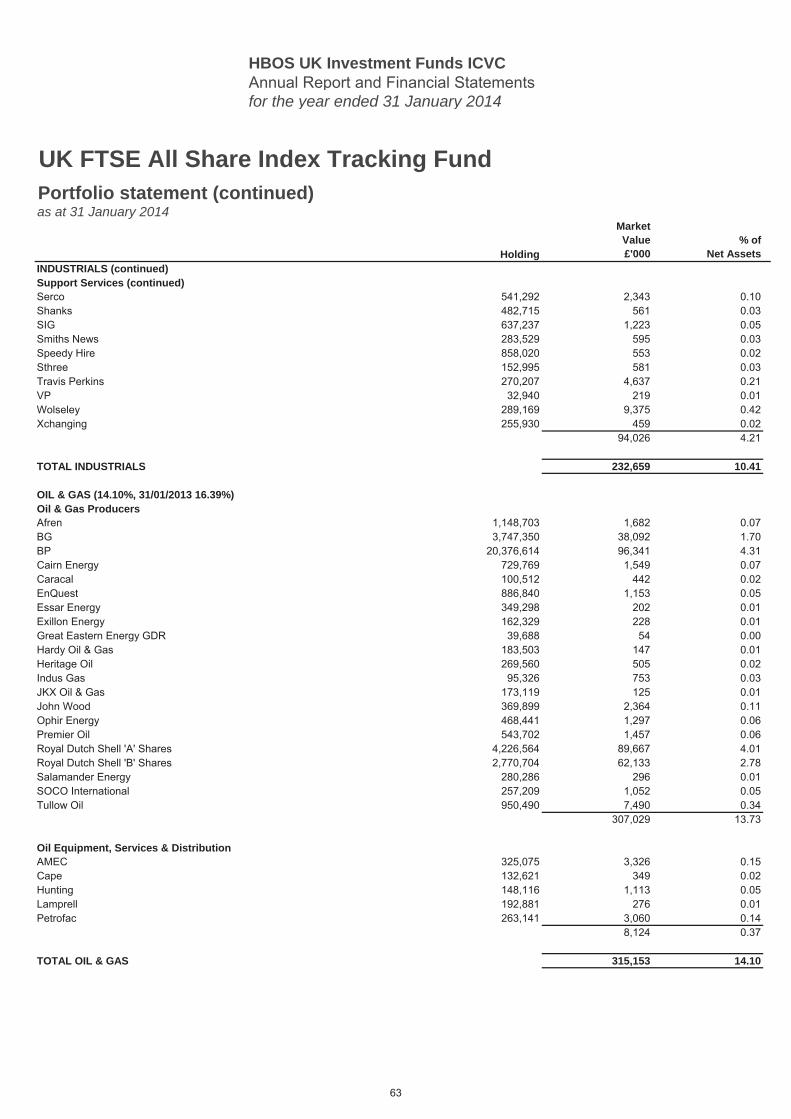
HBOS UK Investment Funds ICVCAnnual Report and Financial Statementsfor the year ended 31 January 2014
Holding
MarketValue£'000
% ofNet Assets
UK FTSE All Share Index Tracking FundPortfolio statement (continued)as at 31 January 2014
INDUSTRIALS (continued) 10.41Support Services (continued)Serco 541,292 2,343 0.10Shanks 482,715 561 0.03SIG 637,237 1,223 0.05Smiths News 283,529 595 0.03Speedy Hire 858,020 553 0.02Sthree 152,995 581 0.03Travis Perkins 270,207 4,637 0.21VP 32,940 219 0.01Wolseley 289,169 9,375 0.42Xchanging 255,930 459 0.02
94,026 4.21
TOTAL INDUSTRIALS 232,659 10.41
OIL & GAS (14.10%, 31/01/2013 16.39%) 14.10Oil & Gas ProducersAfren 1,148,703 1,682 0.07BG 3,747,350 38,092 1.70BP 20,376,614 96,341 4.31Cairn Energy 729,769 1,549 0.07Caracal 100,512 442 0.02EnQuest 886,840 1,153 0.05Essar Energy 349,298 202 0.01Exillon Energy 162,329 228 0.01Great Eastern Energy GDR 39,688 54 0.00Hardy Oil & Gas 183,503 147 0.01Heritage Oil 269,560 505 0.02Indus Gas 95,326 753 0.03JKX Oil & Gas 173,119 125 0.01John Wood 369,899 2,364 0.11Ophir Energy 468,441 1,297 0.06Premier Oil 543,702 1,457 0.06Royal Dutch Shell 'A' Shares 4,226,564 89,667 4.01Royal Dutch Shell 'B' Shares 2,770,704 62,133 2.78Salamander Energy 280,286 296 0.01SOCO International 257,209 1,052 0.05Tullow Oil 950,490 7,490 0.34
307,029 13.73
Oil Equipment, Services & DistributionAMEC 325,075 3,326 0.15Cape 132,621 349 0.02Hunting 148,116 1,113 0.05Lamprell 192,881 276 0.01Petrofac 263,141 3,060 0.14
8,124 0.37
TOTAL OIL & GAS 315,153 14.10
63
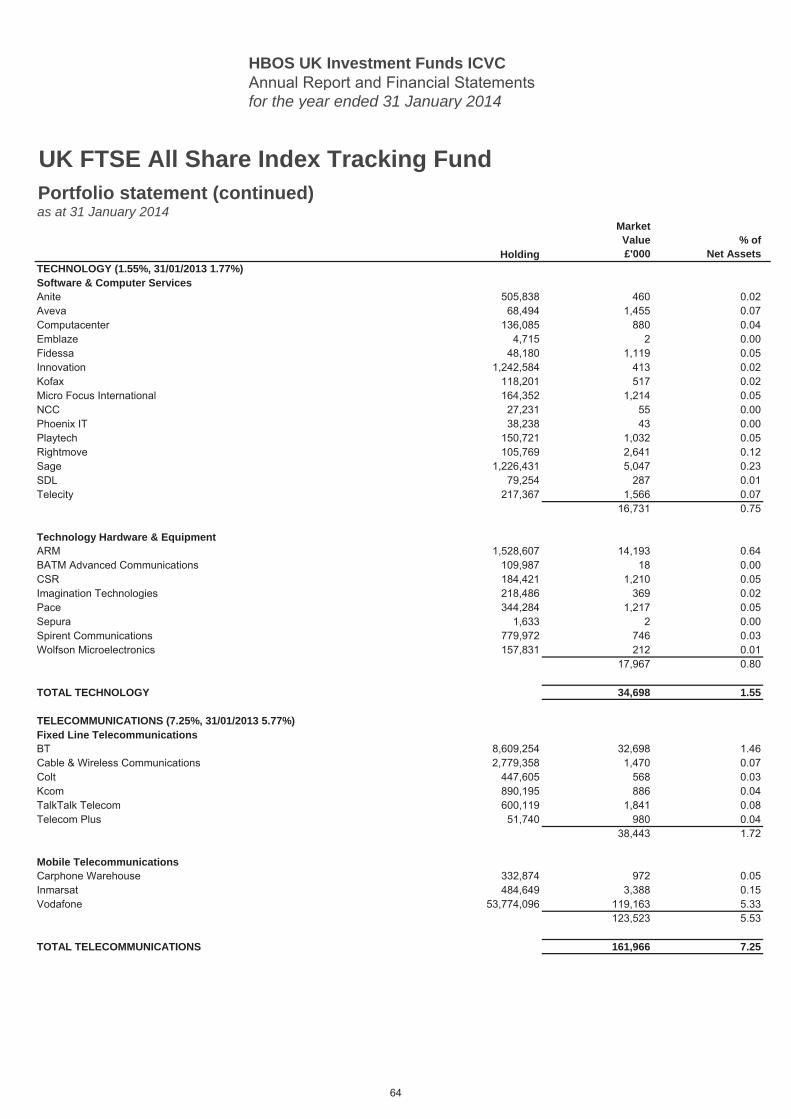
HBOS UK Investment Funds ICVCAnnual Report and Financial Statementsfor the year ended 31 January 2014
Holding
MarketValue£'000
% ofNet Assets
UK FTSE All Share Index Tracking FundPortfolio statement (continued)as at 31 January 2014
TECHNOLOGY (1.55%, 31/01/2013 1.77%) 1.55Software & Computer ServicesAnite 505,838 460 0.02Aveva 68,494 1,455 0.07Computacenter 136,085 880 0.04Emblaze 4,715 2 0.00Fidessa 48,180 1,119 0.05Innovation 1,242,584 413 0.02Kofax 118,201 517 0.02Micro Focus International 164,352 1,214 0.05NCC 27,231 55 0.00Phoenix IT 38,238 43 0.00Playtech 150,721 1,032 0.05Rightmove 105,769 2,641 0.12Sage 1,226,431 5,047 0.23SDL 79,254 287 0.01Telecity 217,367 1,566 0.07
16,731 0.75
Technology Hardware & EquipmentARM 1,528,607 14,193 0.64BATM Advanced Communications 109,987 18 0.00CSR 184,421 1,210 0.05Imagination Technologies 218,486 369 0.02Pace 344,284 1,217 0.05Sepura 1,633 2 0.00Spirent Communications 779,972 746 0.03Wolfson Microelectronics 157,831 212 0.01
17,967 0.80
TOTAL TECHNOLOGY 34,698 1.55
TELECOMMUNICATIONS (7.25%, 31/01/2013 5.77%) 7.25Fixed Line TelecommunicationsBT 8,609,254 32,698 1.46Cable & Wireless Communications 2,779,358 1,470 0.07Colt 447,605 568 0.03Kcom 890,195 886 0.04TalkTalk Telecom 600,119 1,841 0.08Telecom Plus 51,740 980 0.04
38,443 1.72
Mobile TelecommunicationsCarphone Warehouse 332,874 972 0.05Inmarsat 484,649 3,388 0.15Vodafone 53,774,096 119,163 5.33
123,523 5.53
TOTAL TELECOMMUNICATIONS 161,966 7.25
64
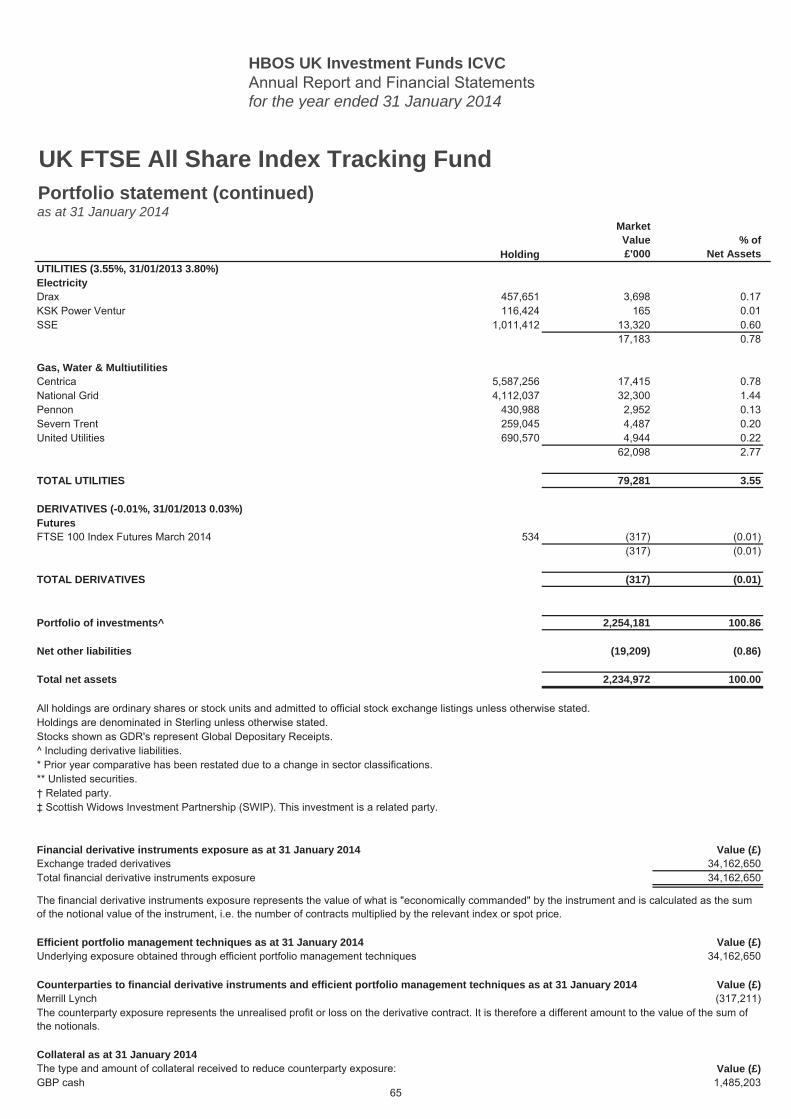
HBOS UK Investment Funds ICVCAnnual Report and Financial Statementsfor the year ended 31 January 2014
Holding
MarketValue£'000
% ofNet Assets
UK FTSE All Share Index Tracking FundPortfolio statement (continued)as at 31 January 2014
UTILITIES (3.55%, 31/01/2013 3.80%) 3.55ElectricityDrax 457,651 3,698 0.17KSK Power Ventur 116,424 165 0.01SSE 1,011,412 13,320 0.60
17,183 0.78
Gas, Water & MultiutilitiesCentrica 5,587,256 17,415 0.78National Grid 4,112,037 32,300 1.44Pennon 430,988 2,952 0.13Severn Trent 259,045 4,487 0.20United Utilities 690,570 4,944 0.22
62,098 2.77
TOTAL UTILITIES 79,281 3.55
DERIVATIVES (-0.01%, 31/01/2013 0.03%) (0.01)FuturesFTSE 100 Index Futures March 2014 534 (317) (0.01)
(317) (0.01)
TOTAL DERIVATIVES (317) (0.01)
Portfolio of investments^ 2,254,181 100.86
Net other liabilities (19,209) (0.86)
Total net assets 2,234,972 100.00
* Prior year comparative has been restated due to a change in sector classifications.** Unlisted securities.
Financial derivative instruments exposure as at 31 January 2014 Value (£)Exchange traded derivatives 34,162,650Total financial derivative instruments exposure 34,162,650
Efficient portfolio management techniques as at 31 January 2014 Value (£)Underlying exposure obtained through efficient portfolio management techniques 34,162,650
Counterparties to financial derivative instruments and efficient portfolio management techniques as at 31 January 2014 Value (£)Merrill Lynch (317,211)
Collateral as at 31 January 2014The type and amount of collateral received to reduce counterparty exposure: Value (£)GBP cash 1,485,203
‡ Scottish Widows Investment Partnership (SWIP). This investment is a related party.
All holdings are ordinary shares or stock units and admitted to official stock exchange listings unless otherwise stated.Holdings are denominated in Sterling unless otherwise stated.Stocks shown as GDR's represent Global Depositary Receipts.^ Including derivative liabilities.
† Related party.
The counterparty exposure represents the unrealised profit or loss on the derivative contract. It is therefore a different amount to the value of the sum of the notionals.
The financial derivative instruments exposure represents the value of what is "economically commanded" by the instrument and is calculated as the sum of the notional value of the instrument, i.e. the number of contracts multiplied by the relevant index or spot price.
65
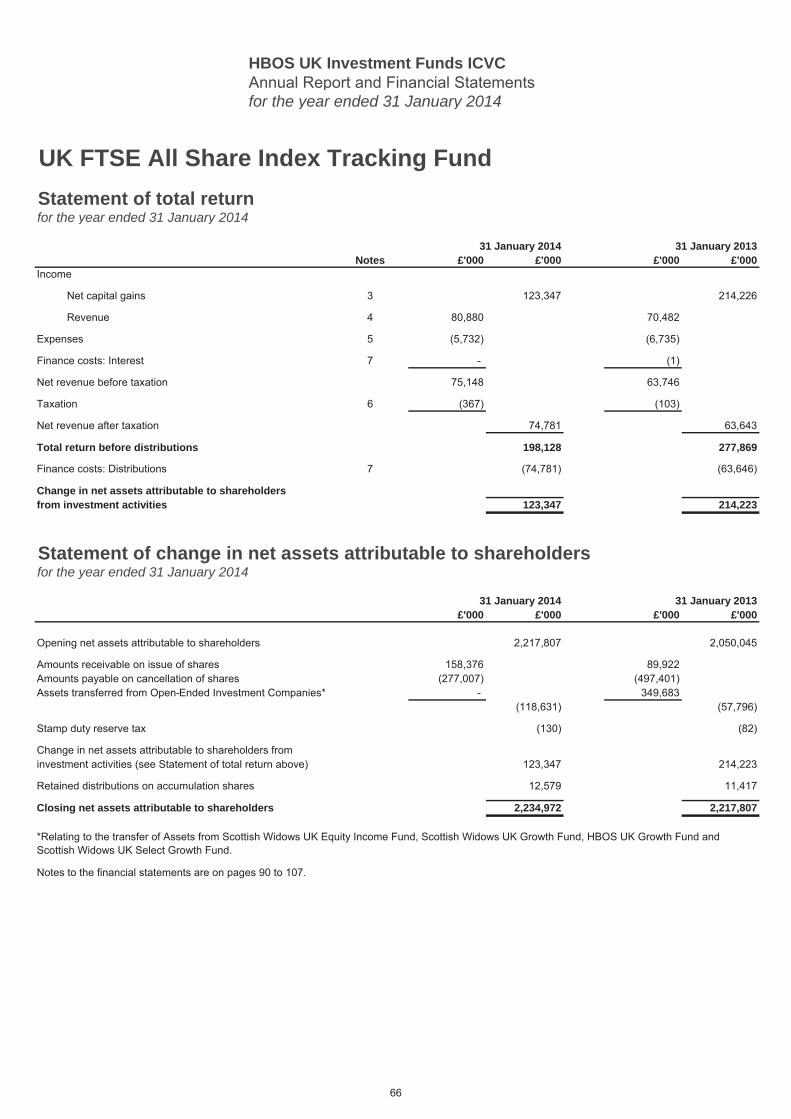
HBOS UK Investment Funds ICVCAnnual Report and Financial Statementsfor the year ended 31 January 2014
UK FTSE All Share Index Tracking FundStatement of total returnfor the year ended 31 January 2014
31 January 2014 31 January 2013Notes £'000 £'000 £'000 £'000
Income
Net capital gains 3 123,347 214,226
Revenue 4 80,880 70,482
Expenses 5 (5,732) (6,735)
Finance costs: Interest 7 - (1)
Net revenue before taxation 75,148 63,746
Taxation 6 (367) (103)
Net revenue after taxation 74,781 63,643
Total return before distributions 198,128 277,869
Finance costs: Distributions 7 (74,781) (63,646)
Change in net assets attributable to shareholdersfrom investment activities 123,347 214,223
Statement of change in net assets attributable to shareholdersfor the year ended 31 January 2014
31 January 2014 31 January 2013£'000 £'000 £'000 £'000
Opening net assets attributable to shareholders 2,217,807 2,050,045
Amounts receivable on issue of shares 158,376 89,922Amounts payable on cancellation of shares (277,007) (497,401)Assets transferred from Open-Ended Investment Companies* - 349,683
(118,631) (57,796)
Stamp duty reserve tax (130) (82)
Change in net assets attributable to shareholders frominvestment activities (see Statement of total return above) 123,347 214,223
Retained distributions on accumulation shares 12,579 11,417
Closing net assets attributable to shareholders 2,234,972 2,217,807
*Relating to the transfer of Assets from Scottish Widows UK Equity Income Fund, Scottish Widows UK Growth Fund, HBOS UK Growth Fund and Scottish Widows UK Select Growth Fund.
Notes to the financial statements are on pages 90 to 107.
66
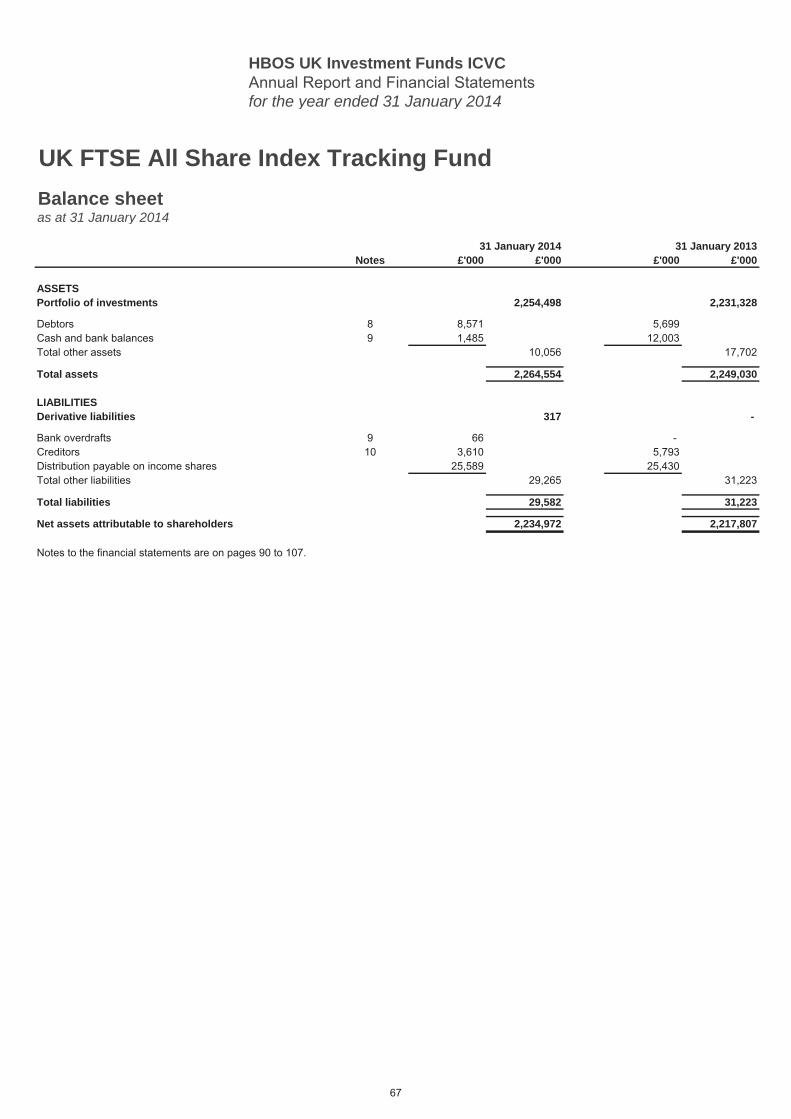
HBOS UK Investment Funds ICVCAnnual Report and Financial Statementsfor the year ended 31 January 2014
UK FTSE All Share Index Tracking FundBalance sheetas at 31 January 2014
31 January 2014 31 January 2013Notes £'000 £'000 £'000 £'000
ASSETSPortfolio of investments 2,254,498 2,231,328
Debtors 8 8,571 5,699Cash and bank balances 9 1,485 12,003Total other assets 10,056 17,702
Total assets 2,264,554 2,249,030
LIABILITIESDerivative liabilities 317 -
Bank overdrafts 9 66 -Creditors 10 3,610 5,793Distribution payable on income shares 25,589 25,430Total other liabilities 29,265 31,223
Total liabilities 29,582 31,223
Net assets attributable to shareholders 2,234,972 2,217,807
Notes to the financial statements are on pages 90 to 107.
67
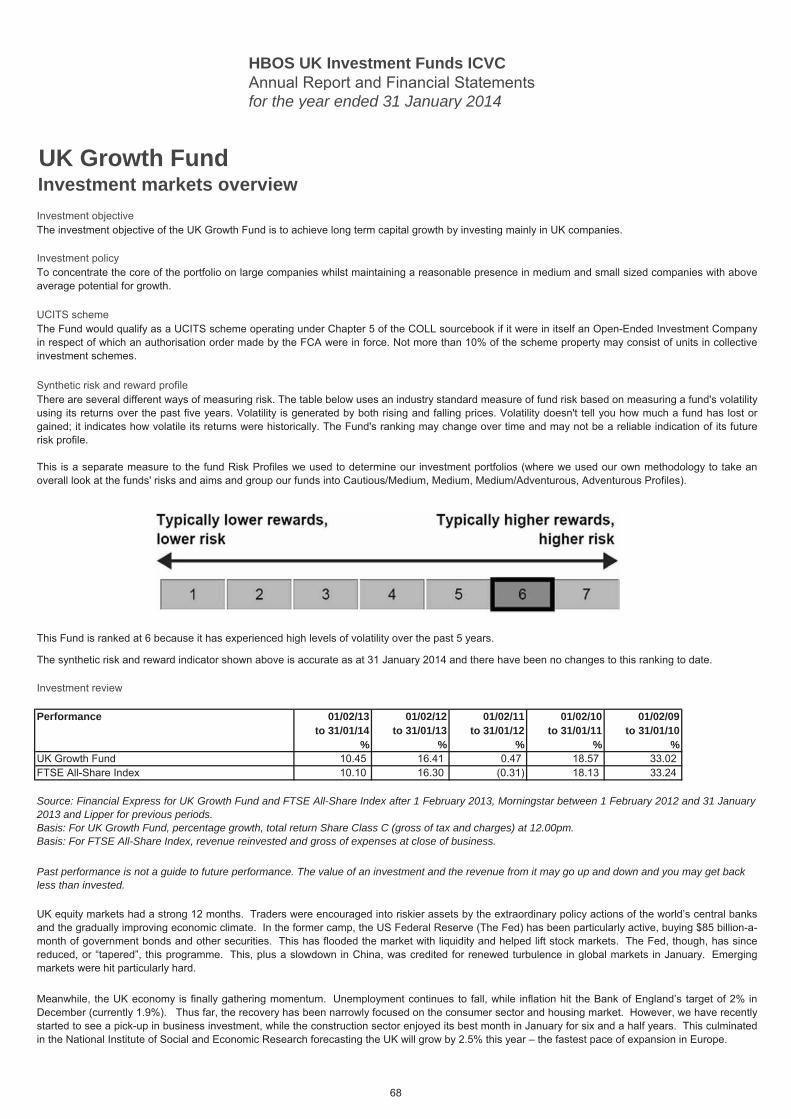
HBOS UK Investment Funds ICVCAnnual Report and Financial Statementsfor the year ended 31 January 2014
UK Growth FundInvestment markets overview Investment objective
Investment policy
UCITS scheme
Synthetic risk and reward profile
Investment review
Performance 01/02/13 01/02/12 01/02/11 01/02/10 01/02/09 01/02/08to 31/01/14 to 31/01/13 to 31/01/12 to 31/01/11 to 31/01/10 to 31/01/09
% % % % % %UK Growth Fund 10.45 16.41 0.47 18.57 33.02 FTSE All-Share Index 10.10 16.30 (0.31) 18.13 33.24
UK equity markets had a strong 12 months. Traders were encouraged into riskier assets by the extraordinary policy actions of the world’s central banksand the gradually improving economic climate. In the former camp, the US Federal Reserve (The Fed) has been particularly active, buying $85 billion-a-month of government bonds and other securities. This has flooded the market with liquidity and helped lift stock markets. The Fed, though, has sincereduced, or “tapered”, this programme. This, plus a slowdown in China, was credited for renewed turbulence in global markets in January. Emergingmarkets were hit particularly hard.
Meanwhile, the UK economy is finally gathering momentum. Unemployment continues to fall, while inflation hit the Bank of England’s target of 2% inDecember (currently 1.9%). Thus far, the recovery has been narrowly focused on the consumer sector and housing market. However, we have recentlystarted to see a pick-up in business investment, while the construction sector enjoyed its best month in January for six and a half years. This culminatedin the National Institute of Social and Economic Research forecasting the UK will grow by 2.5% this year – the fastest pace of expansion in Europe.
Past performance is not a guide to future performance. The value of an investment and the revenue from it may go up and down and you may get back less than invested.
The investment objective of the UK Growth Fund is to achieve long term capital growth by investing mainly in UK companies.
To concentrate the core of the portfolio on large companies whilst maintaining a reasonable presence in medium and small sized companies with aboveaverage potential for growth.
The Fund would qualify as a UCITS scheme operating under Chapter 5 of the COLL sourcebook if it were in itself an Open-Ended Investment Companyin respect of which an authorisation order made by the FCA were in force. Not more than 10% of the scheme property may consist of units in collectiveinvestment schemes.
There are several different ways of measuring risk. The table below uses an industry standard measure of fund risk based on measuring a fund's volatilityusing its returns over the past five years. Volatility is generated by both rising and falling prices. Volatility doesn't tell you how much a fund has lost orgained; it indicates how volatile its returns were historically. The Fund's ranking may change over time and may not be a reliable indication of its futurerisk profile.
This is a separate measure to the fund Risk Profiles we used to determine our investment portfolios (where we used our own methodology to take anoverall look at the funds' risks and aims and group our funds into Cautious/Medium, Medium, Medium/Adventurous, Adventurous Profiles).
This Fund is ranked at 6 because it has experienced high levels of volatility over the past 5 years.
The synthetic risk and reward indicator shown above is accurate as at 31 January 2014 and there have been no changes to this ranking to date.
Source: Financial Express for UK Growth Fund and FTSE All-Share Index after 1 February 2013, Morningstar between 1 February 2012 and 31 January2013 and Lipper for previous periods.Basis: For UK Growth Fund, percentage growth, total return Share Class C (gross of tax and charges) at 12.00pm.Basis: For FTSE All-Share Index, revenue reinvested and gross of expenses at close of business.
68
HBOS UK Investment Funds ICVCAnnual Report and Financial Statementsfor the year ended 31 January 2014
UK Growth FundInvestment markets overview (continued)Investment review (continued)
Investment markets and conditions can change rapidly and as such the views expressed should not be taken as statements of fact nor should reliancebe placed on these views when making investment decisions.
February 2014
Overall, the FTSE All-Share Index returned 10.10% over the 12-month review period. In contrast, the Fund returned 10.45% (gross of tax and charges).
Turning to the portfolio, an overweight position in the media company ITV boosted returns. The free-to-air broadcaster’s shares hit a record high after itdelivered an upbeat outlook statement, with the ongoing rebound in TV advertising helping to drive returns. ITV scored particularly well according to our“financial strength” metrics. In addition, our holding in Next did well. The company, which performed particularly well over the Christmas period,announced it will return surplus cash to shareholders through special dividends and buybacks. Next scored highly on our measure of “value plus quality",which identifies cheap companies that make efficient use of their capital.
On the downside, we lost on an overweight position in the utility firm Centrica which was a disappointment. The stock declined 7% over the period, in partdue to unfavourable news-flow over energy tariffs.
Looking ahead, the outlook for the UK economy is certainly encouraging, with hopes the country is finally back on track. This, however, has left Bank ofEngland Governor Mark Carney in something of a bind. He had promised to hold interest rates until unemployment reached 7%. This was thought tooccur around 2016. However, the jobless rate came in at 7.1 at end-November. At the time of writing, though, the reading surprisingly ticked-up to 7.2%.This should put the prospect of any immediate rate-rise to bed for now.
As for markets, following the recent rally equities no longer look compellingly cheap relative to their longer-term history. That said, after three years ofdisappointments, hopes are building that 2014 could be the year that these positive earnings surprises finally arrive.
Scottish Widows Investment Partnership Limited
Over the period, we added Bank of Georgia, DCC, Esure, Countrywide, Crest Nicholson, International Ferro Metals, Foxtons, Grafton, Greencoat UKWind, Partnership Assurance, Rank, Synthomer, The Innovation, and The Unite. These were partly funded from the proceeds of the sale of ThamesRiver, Xstrata, Promethean, SIG, Sportingbet, Marstons, Mecom, Pearson, LXB Retail Properties, Fidessa, Fortune Oil, G4S and Goldenport.
69
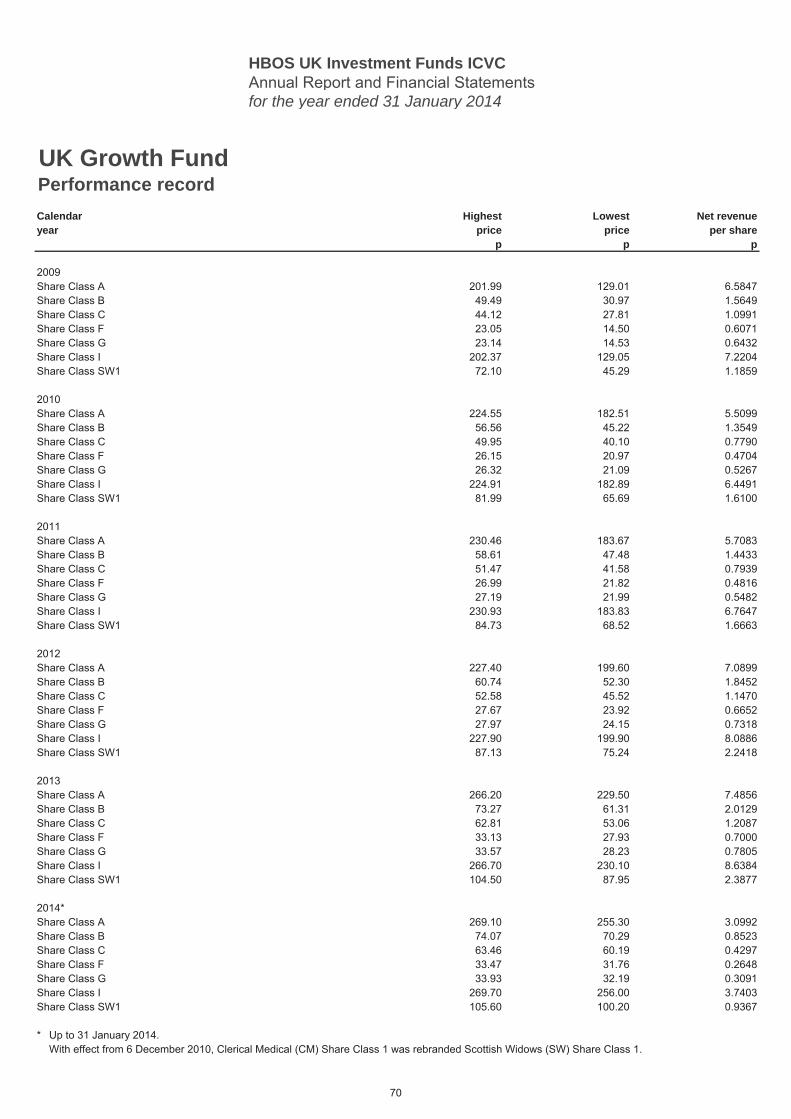
HBOS UK Investment Funds ICVCAnnual Report and Financial Statementsfor the year ended 31 January 2014
UK Growth FundPerformance recordCalendar Highest Lowest Net revenueyear price price per share
p p p
2009Share Class A 201.99 129.01 6.5847Share Class B 49.49 30.97 1.5649Share Class C 44.12 27.81 1.0991Share Class F 23.05 14.50 0.6071Share Class G 23.14 14.53 0.6432Share Class I 202.37 129.05 7.2204Share Class SW1� 72.10 45.29 1.1859
2010Share Class A 224.55 182.51 5.5099Share Class B 56.56 45.22 1.3549Share Class C 49.95 40.10 0.7790Share Class F 26.15 20.97 0.4704Share Class G 26.32 21.09 0.5267Share Class I 224.91 182.89 6.4491Share Class SW1� 81.99 65.69 1.6100
2011Share Class A 230.46 183.67 5.7083Share Class B 58.61 47.48 1.4433Share Class C 51.47 41.58 0.7939Share Class F 26.99 21.82 0.4816Share Class G 27.19 21.99 0.5482Share Class I 230.93 183.83 6.7647Share Class SW1 84.73 68.52 1.6663
2012Share Class A 227.40 199.60 7.0899Share Class B 60.74 52.30 1.8452Share Class C 52.58 45.52 1.1470Share Class F 27.67 23.92 0.6652Share Class G 27.97 24.15 0.7318Share Class I 227.90 199.90 8.0886Share Class SW1 87.13 75.24 2.2418
2013Share Class A 266.20 229.50 7.4856Share Class B 73.27 61.31 2.0129Share Class C 62.81 53.06 1.2087Share Class F 33.13 27.93 0.7000Share Class G 33.57 28.23 0.7805Share Class I 266.70 230.10 8.6384Share Class SW1 104.50 87.95 2.3877
2014*Share Class A 269.10 255.30 3.0992Share Class B 74.07 70.29 0.8523Share Class C 63.46 60.19 0.4297Share Class F 33.47 31.76 0.2648Share Class G 33.93 32.19 0.3091Share Class I 269.70 256.00 3.7403Share Class SW1 105.60 100.20 0.9367
*� With effect from 6 December 2010, Clerical Medical (CM) Share Class 1 was rebranded Scottish Widows (SW) Share Class 1.
Up to 31 January 2014.
70
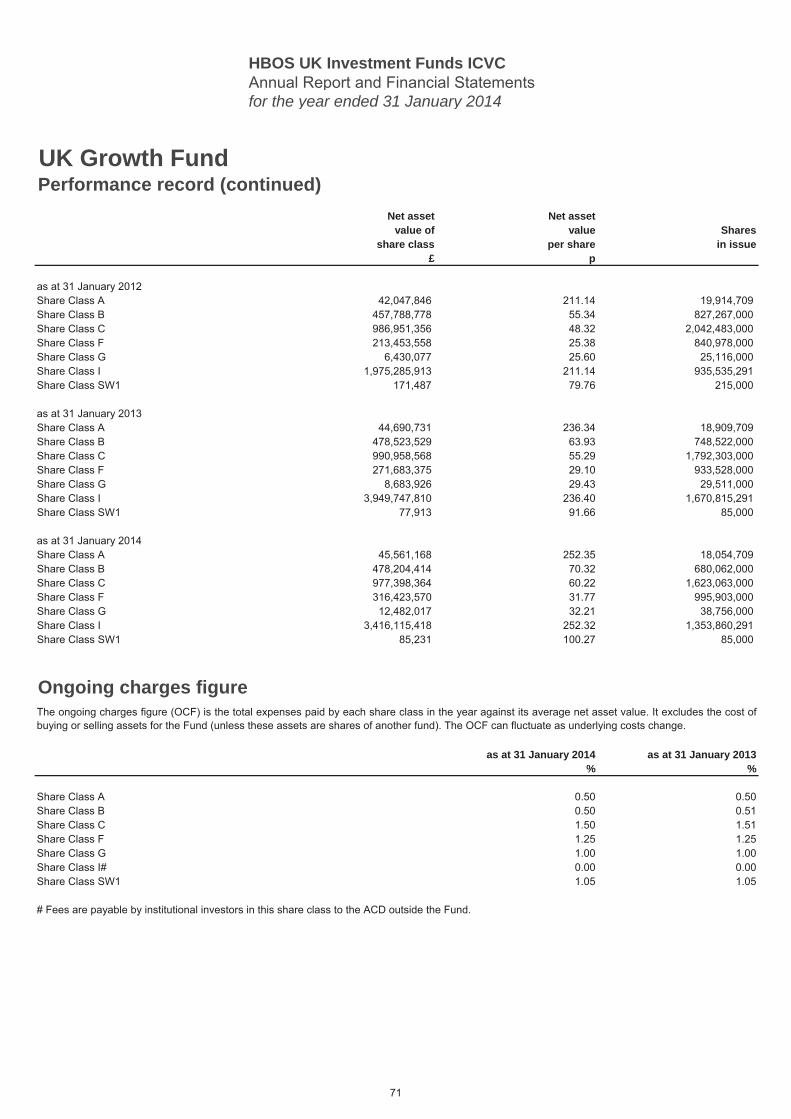
HBOS UK Investment Funds ICVCAnnual Report and Financial Statementsfor the year ended 31 January 2014
UK Growth FundPerformance record (continued)
Net asset Net assetvalue of value Shares
share class per share in issue£ p
Share Class A 42,047,846 211.14 19,914,709Share Class B 457,788,778 55.34 827,267,000Share Class C 986,951,356 48.32 2,042,483,000Share Class F 213,453,558 25.38 840,978,000Share Class G 6,430,077 25.60 25,116,000Share Class I 1,975,285,913 211.14 935,535,291Share Class SW1 171,487 79.76 215,000
Share Class A 44,690,731 236.34 18,909,709Share Class B 478,523,529 63.93 748,522,000Share Class C 990,958,568 55.29 1,792,303,000Share Class F 271,683,375 29.10 933,528,000Share Class G 8,683,926 29.43 29,511,000Share Class I 3,949,747,810 236.40 1,670,815,291Share Class SW1 77,913 91.66 85,000
Share Class A 45,561,168 252.35 18,054,709Share Class B 478,204,414 70.32 680,062,000Share Class C 977,398,364 60.22 1,623,063,000Share Class F 316,423,570 31.77 995,903,000Share Class G 12,482,017 32.21 38,756,000Share Class I 3,416,115,418 252.32 1,353,860,291Share Class SW1 85,231 100.27 85,000
Ongoing charges figure
as at 31 January 2014 as at 31 January 2013% %
Share Class A 0.50 0.50Share Class B 0.50 0.51Share Class C 1.50 1.51Share Class F 1.25 1.25Share Class G 1.00 1.00Share Class I# 0.00 0.00Share Class SW1 1.05 1.05
# Fees are payable by institutional investors in this share class to the ACD outside the Fund.
as at 31 January 2012
as at 31 January 2013
as at 31 January 2014
The ongoing charges figure (OCF) is the total expenses paid by each share class in the year against its average net asset value. It excludes the cost ofbuying or selling assets for the Fund (unless these assets are shares of another fund). The OCF can fluctuate as underlying costs change.
71
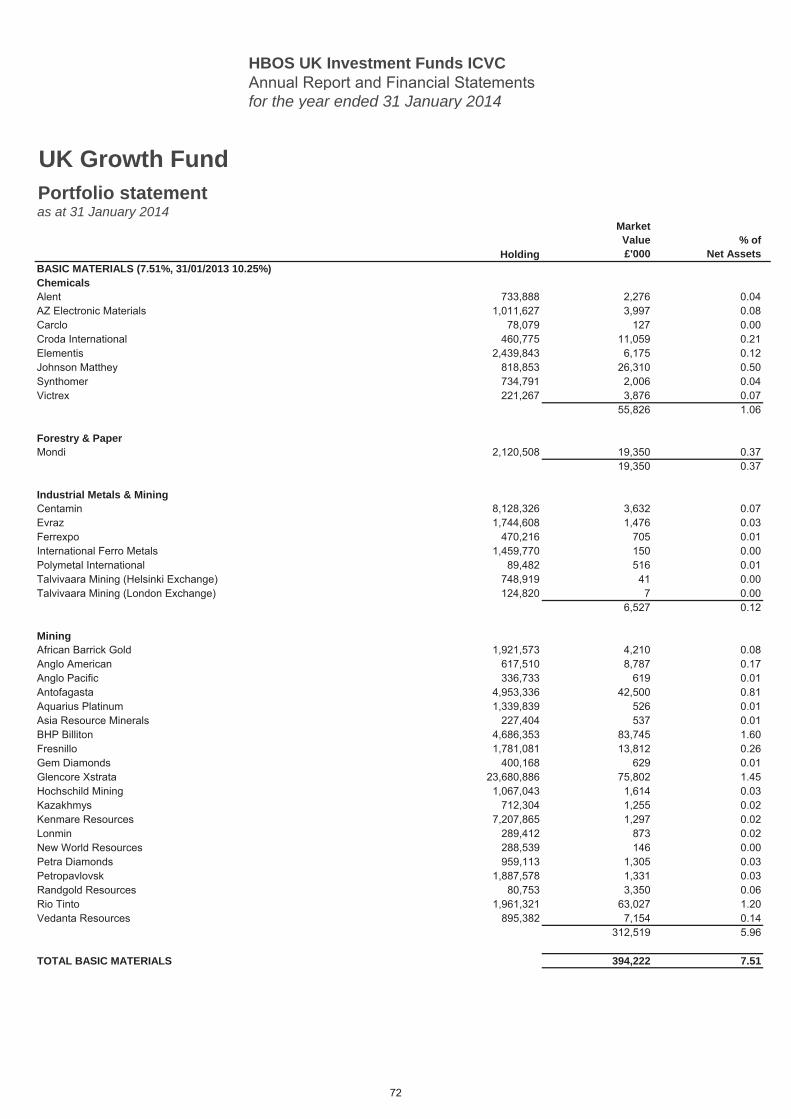
HBOS UK Investment Funds ICVCAnnual Report and Financial Statementsfor the year ended 31 January 2014
Holding
MarketValue£'000
% ofNet Assets
BASIC MATERIALS (7.51%, 31/01/2013 10.25%) 7.51ChemicalsAlent 733,888 2,276 0.04AZ Electronic Materials 1,011,627 3,997 0.08Carclo 78,079 127 0.00Croda International 460,775 11,059 0.21Elementis 2,439,843 6,175 0.12Johnson Matthey 818,853 26,310 0.50Synthomer 734,791 2,006 0.04Victrex 221,267 3,876 0.07
55,826 1.06
Forestry & PaperMondi 2,120,508 19,350 0.37
19,350 0.37
Industrial Metals & MiningCentamin 8,128,326 3,632 0.07Evraz 1,744,608 1,476 0.03Ferrexpo 470,216 705 0.01International Ferro Metals 1,459,770 150 0.00Polymetal International 89,482 516 0.01Talvivaara Mining (Helsinki Exchange) 748,919 41 0.00Talvivaara Mining (London Exchange) 124,820 7 0.00
6,527 0.12
MiningAfrican Barrick Gold 1,921,573 4,210 0.08Anglo American 617,510 8,787 0.17Anglo Pacific 336,733 619 0.01Antofagasta 4,953,336 42,500 0.81Aquarius Platinum 1,339,839 526 0.01Asia Resource Minerals 227,404 537 0.01BHP Billiton 4,686,353 83,745 1.60Fresnillo 1,781,081 13,812 0.26Gem Diamonds 400,168 629 0.01Glencore Xstrata 23,680,886 75,802 1.45Hochschild Mining 1,067,043 1,614 0.03Kazakhmys 712,304 1,255 0.02Kenmare Resources 7,207,865 1,297 0.02Lonmin 289,412 873 0.02New World Resources 288,539 146 0.00Petra Diamonds 959,113 1,305 0.03Petropavlovsk 1,887,578 1,331 0.03Randgold Resources 80,753 3,350 0.06Rio Tinto 1,961,321 63,027 1.20Vedanta Resources 895,382 7,154 0.14
312,519 5.96
TOTAL BASIC MATERIALS 394,222 7.51
UK Growth FundPortfolio statement as at 31 January 2014
72
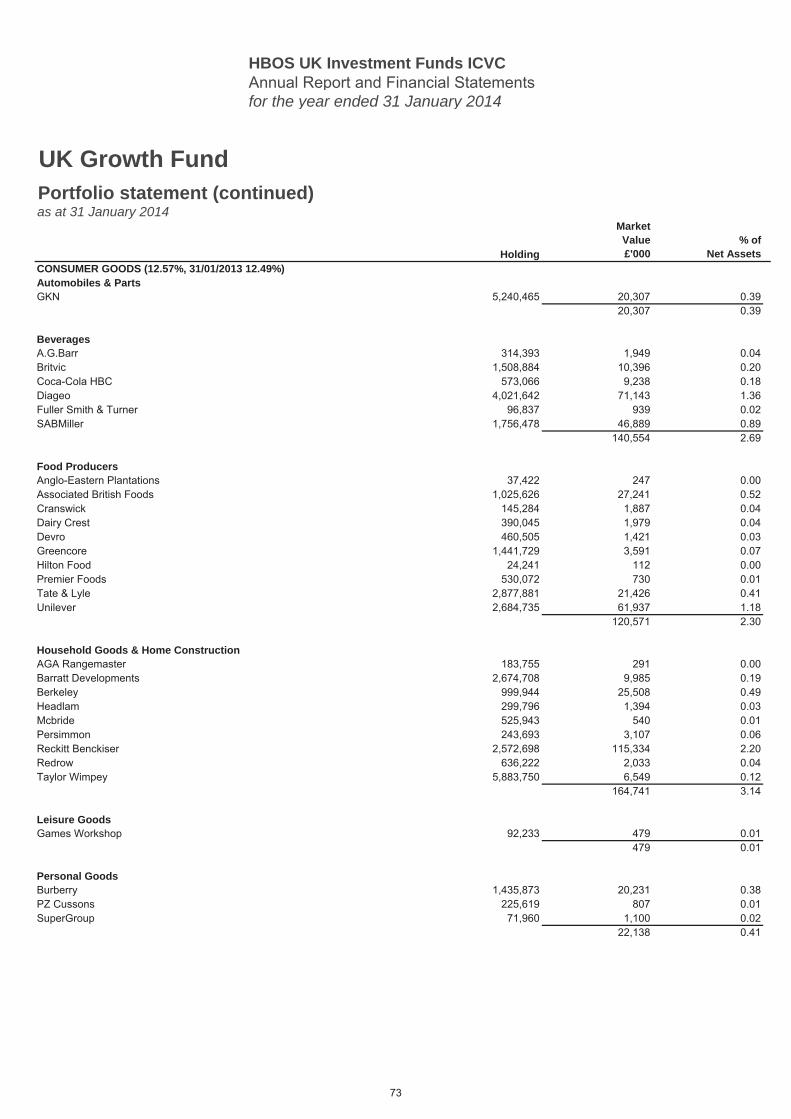
HBOS UK Investment Funds ICVCAnnual Report and Financial Statementsfor the year ended 31 January 2014
Holding
MarketValue£'000
% ofNet Assets
UK Growth FundPortfolio statement (continued)as at 31 January 2014
CONSUMER GOODS (12.57%, 31/01/2013 12.49%) 12.57Automobiles & PartsGKN 5,240,465 20,307 0.39
20,307 0.39
BeveragesA.G.Barr 314,393 1,949 0.04Britvic 1,508,884 10,396 0.20Coca-Cola HBC 573,066 9,238 0.18Diageo 4,021,642 71,143 1.36Fuller Smith & Turner 96,837 939 0.02SABMiller 1,756,478 46,889 0.89
140,554 2.69
Food ProducersAnglo-Eastern Plantations 37,422 247 0.00Associated British Foods 1,025,626 27,241 0.52Cranswick 145,284 1,887 0.04Dairy Crest 390,045 1,979 0.04Devro 460,505 1,421 0.03Greencore 1,441,729 3,591 0.07Hilton Food 24,241 112 0.00Premier Foods 530,072 730 0.01Tate & Lyle 2,877,881 21,426 0.41Unilever 2,684,735 61,937 1.18
120,571 2.30
Household Goods & Home ConstructionAGA Rangemaster 183,755 291 0.00Barratt Developments 2,674,708 9,985 0.19Berkeley 999,944 25,508 0.49Headlam 299,796 1,394 0.03Mcbride 525,943 540 0.01Persimmon 243,693 3,107 0.06Reckitt Benckiser 2,572,698 115,334 2.20Redrow 636,222 2,033 0.04Taylor Wimpey 5,883,750 6,549 0.12
164,741 3.14
Leisure GoodsGames Workshop 92,233 479 0.01
479 0.01
Personal GoodsBurberry 1,435,873 20,231 0.38PZ Cussons 225,619 807 0.01SuperGroup 71,960 1,100 0.02
22,138 0.41
73
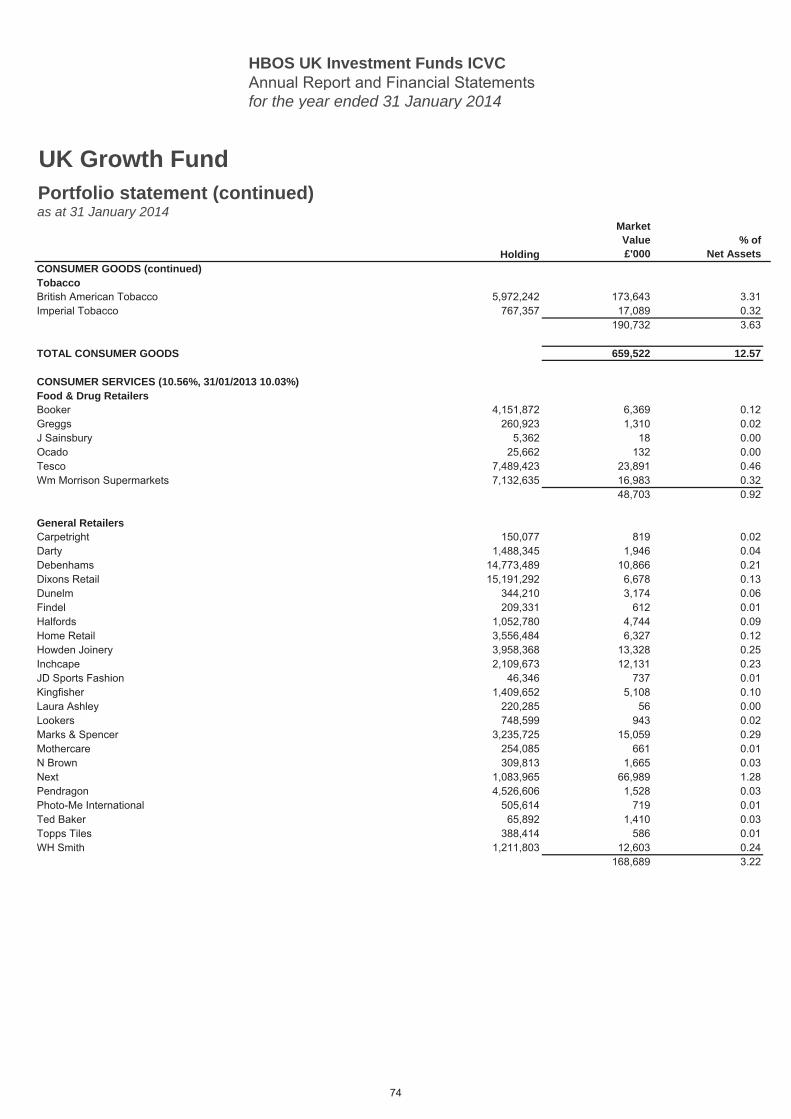
HBOS UK Investment Funds ICVCAnnual Report and Financial Statementsfor the year ended 31 January 2014
Holding
MarketValue£'000
% ofNet Assets
UK Growth FundPortfolio statement (continued)as at 31 January 2014
CONSUMER GOODS (continued) 12.57TobaccoBritish American Tobacco 5,972,242 173,643 3.31Imperial Tobacco 767,357 17,089 0.32
190,732 3.63
TOTAL CONSUMER GOODS 659,522 12.57
CONSUMER SERVICES (10.56%, 31/01/2013 10.03%) 10.56Food & Drug RetailersBooker 4,151,872 6,369 0.12Greggs 260,923 1,310 0.02J Sainsbury 5,362 18 0.00Ocado 25,662 132 0.00Tesco 7,489,423 23,891 0.46Wm Morrison Supermarkets 7,132,635 16,983 0.32
48,703 0.92
General RetailersCarpetright 150,077 819 0.02Darty 1,488,345 1,946 0.04Debenhams 14,773,489 10,866 0.21Dixons Retail 15,191,292 6,678 0.13Dunelm 344,210 3,174 0.06Findel 209,331 612 0.01Halfords 1,052,780 4,744 0.09Home Retail 3,556,484 6,327 0.12Howden Joinery 3,958,368 13,328 0.25Inchcape 2,109,673 12,131 0.23JD Sports Fashion 46,346 737 0.01Kingfisher 1,409,652 5,108 0.10Laura Ashley 220,285 56 0.00Lookers 748,599 943 0.02Marks & Spencer 3,235,725 15,059 0.29Mothercare 254,085 661 0.01N Brown 309,813 1,665 0.03Next 1,083,965 66,989 1.28Pendragon 4,526,606 1,528 0.03Photo-Me International 505,614 719 0.01Ted Baker 65,892 1,410 0.03Topps Tiles 388,414 586 0.01WH Smith 1,211,803 12,603 0.24
168,689 3.22
74
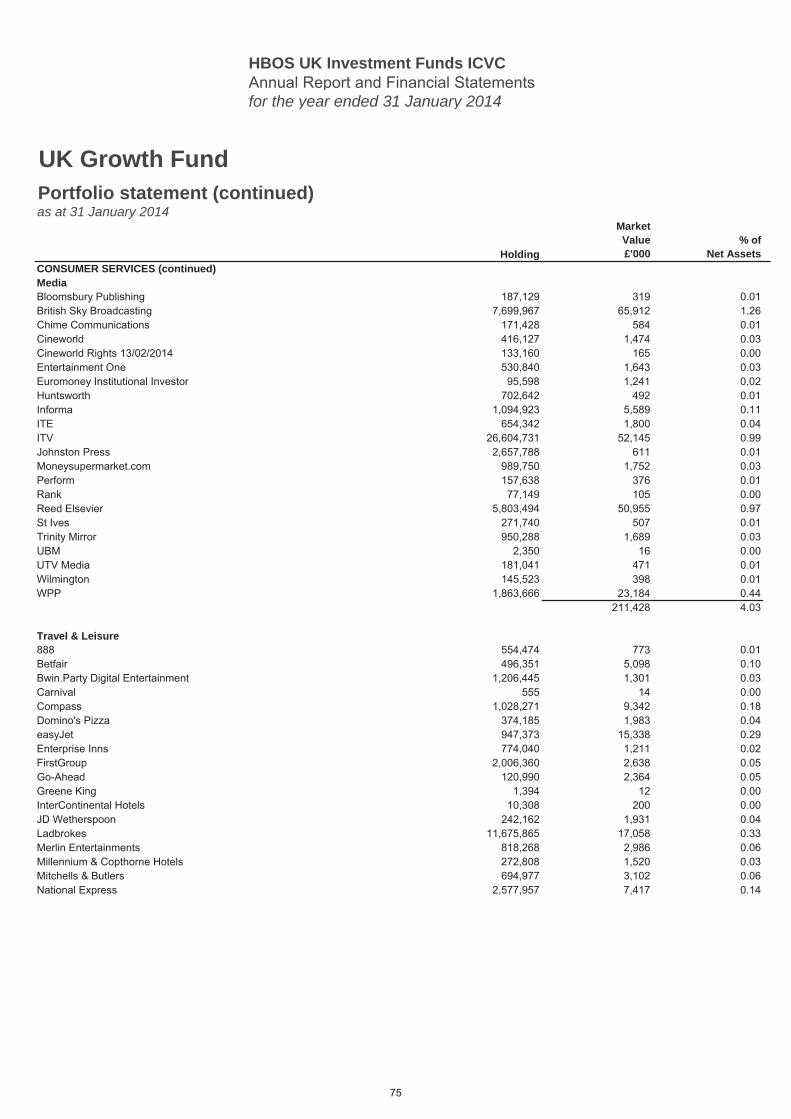
HBOS UK Investment Funds ICVCAnnual Report and Financial Statementsfor the year ended 31 January 2014
Holding
MarketValue£'000
% ofNet Assets
UK Growth FundPortfolio statement (continued)as at 31 January 2014
CONSUMER SERVICES (continued) 10.56MediaBloomsbury Publishing 187,129 319 0.01British Sky Broadcasting 7,699,967 65,912 1.26Chime Communications 171,428 584 0.01Cineworld 416,127 1,474 0.03Cineworld Rights 13/02/2014 133,160 165 0.00Entertainment One 530,840 1,643 0.03Euromoney Institutional Investor 95,598 1,241 0.02Huntsworth 702,642 492 0.01Informa 1,094,923 5,589 0.11ITE 654,342 1,800 0.04ITV 26,604,731 52,145 0.99Johnston Press 2,657,788 611 0.01Moneysupermarket.com 989,750 1,752 0.03Perform 157,638 376 0.01Rank 77,149 105 0.00Reed Elsevier 5,803,494 50,955 0.97St Ives 271,740 507 0.01Trinity Mirror 950,288 1,689 0.03UBM 2,350 16 0.00UTV Media 181,041 471 0.01Wilmington 145,523 398 0.01WPP 1,863,666 23,184 0.44
211,428 4.03
Travel & Leisure888 554,474 773 0.01Betfair 496,351 5,098 0.10Bwin.Party Digital Entertainment 1,206,445 1,301 0.03Carnival 555 14 0.00Compass 1,028,271 9,342 0.18Domino's Pizza 374,185 1,983 0.04easyJet 947,373 15,338 0.29Enterprise Inns 774,040 1,211 0.02FirstGroup 2,006,360 2,638 0.05Go-Ahead 120,990 2,364 0.05Greene King 1,394 12 0.00InterContinental Hotels 10,308 200 0.00JD Wetherspoon 242,162 1,931 0.04Ladbrokes 11,675,865 17,058 0.33Merlin Entertainments 818,268 2,986 0.06Millennium & Copthorne Hotels 272,808 1,520 0.03Mitchells & Butlers 694,977 3,102 0.06National Express 2,577,957 7,417 0.14
75
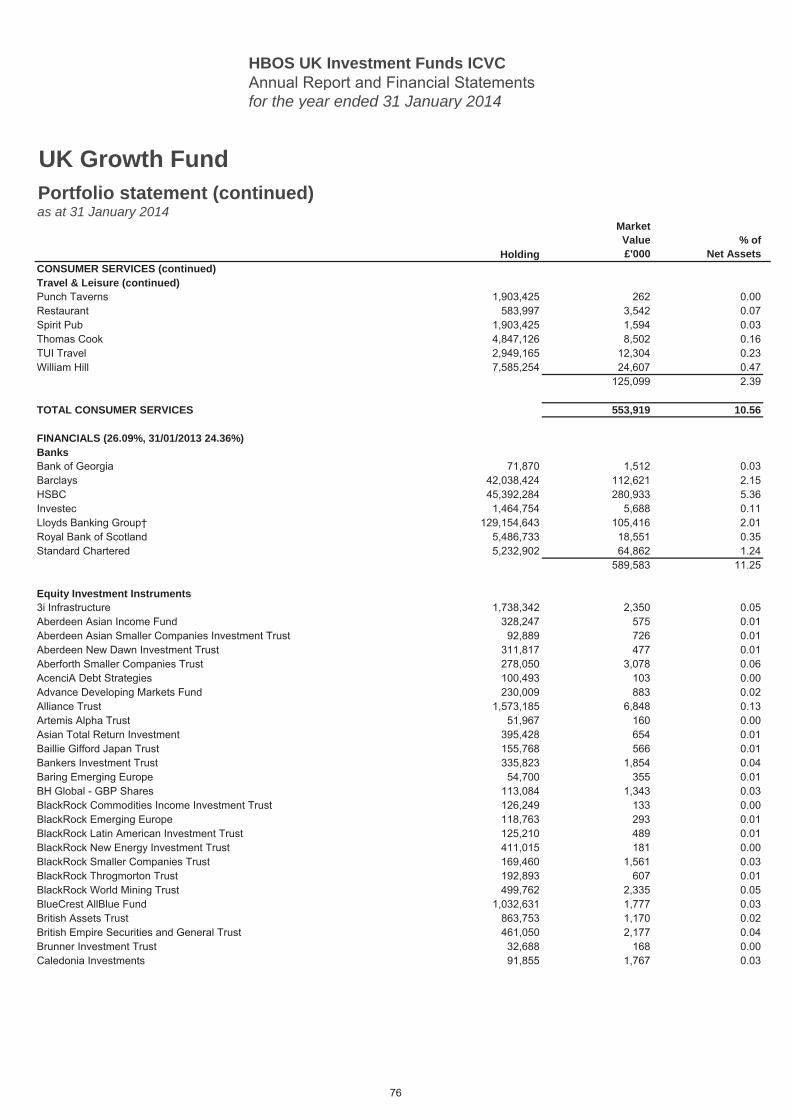
HBOS UK Investment Funds ICVCAnnual Report and Financial Statementsfor the year ended 31 January 2014
Holding
MarketValue£'000
% ofNet Assets
UK Growth FundPortfolio statement (continued)as at 31 January 2014
CONSUMER SERVICES (continued) 10.56Travel & Leisure (continued)Punch Taverns 1,903,425 262 0.00Restaurant 583,997 3,542 0.07Spirit Pub 1,903,425 1,594 0.03Thomas Cook 4,847,126 8,502 0.16TUI Travel 2,949,165 12,304 0.23William Hill 7,585,254 24,607 0.47
125,099 2.39
TOTAL CONSUMER SERVICES 553,919 10.56
FINANCIALS (26.09%, 31/01/2013 24.36%) 26.09BanksBank of Georgia 71,870 1,512 0.03Barclays 42,038,424 112,621 2.15HSBC 45,392,284 280,933 5.36Investec 1,464,754 5,688 0.11Lloyds Banking Group† 129,154,643 105,416 2.01Royal Bank of Scotland 5,486,733 18,551 0.35Standard Chartered 5,232,902 64,862 1.24
589,583 11.25
Equity Investment Instruments3i Infrastructure 1,738,342 2,350 0.05Aberdeen Asian Income Fund 328,247 575 0.01Aberdeen Asian Smaller Companies Investment Trust 92,889 726 0.01Aberdeen New Dawn Investment Trust 311,817 477 0.01Aberforth Smaller Companies Trust 278,050 3,078 0.06AcenciA Debt Strategies 100,493 103 0.00Advance Developing Markets Fund 230,009 883 0.02Alliance Trust 1,573,185 6,848 0.13Artemis Alpha Trust 51,967 160 0.00Asian Total Return Investment 395,428 654 0.01Baillie Gifford Japan Trust 155,768 566 0.01Bankers Investment Trust 335,823 1,854 0.04Baring Emerging Europe 54,700 355 0.01BH Global - GBP Shares 113,084 1,343 0.03BlackRock Commodities Income Investment Trust 126,249 133 0.00BlackRock Emerging Europe 118,763 293 0.01BlackRock Latin American Investment Trust 125,210 489 0.01BlackRock New Energy Investment Trust 411,015 181 0.00BlackRock Smaller Companies Trust 169,460 1,561 0.03BlackRock Throgmorton Trust 192,893 607 0.01BlackRock World Mining Trust 499,762 2,335 0.05BlueCrest AllBlue Fund 1,032,631 1,777 0.03British Assets Trust 863,753 1,170 0.02British Empire Securities and General Trust 461,050 2,177 0.04Brunner Investment Trust 32,688 168 0.00Caledonia Investments 91,855 1,767 0.03
76

HBOS UK Investment Funds ICVCAnnual Report and Financial Statementsfor the year ended 31 January 2014
Holding
MarketValue£'000
% ofNet Assets
UK Growth FundPortfolio statement (continued)as at 31 January 2014
FINANCIALS (continued) 26.09Equity Investment Instruments (continued)Candover Investments 209,221 935 0.02City Natural Resources High Yield Trust 188,036 250 0.01City of London Investment Trust 609,439 2,215 0.04Dexion Absolute 803,759 415 0.01Dexion Equity Alternative 141,112 8 0.00Dexion Trading 302,794 404 0.01Dunedin Income Growth Investment Trust 480,987 1,239 0.02Ecofin Water & Power Opportunities 556,239 687 0.01Edinburgh Dragon Trust 606,651 1,403 0.03Edinburgh Investment Trust 557,617 3,220 0.06Edinburgh UK Tracker Trust 285,942 874 0.02Edinburgh Worldwide Investment Trust 37,640 152 0.00Electra Private Equity 104,064 2,515 0.05European Investment Trust 110,965 820 0.02F&C Capital & Income Investment Trust 131,732 342 0.01F&C Global Smaller Companies 130,417 1,086 0.02F&C Private Equity Trust 5,391 11 0.00Fidelity Asian Values 80,435 158 0.00Fidelity European Values 123,552 1,806 0.04Fidelity Special Values 174,309 1,597 0.03Finsbury Growth & Income Trust 156,113 788 0.02Foreign & Colonial Investment Trust 1,577,263 5,754 0.11Genesis Emerging Markets Fund 375,381 1,794 0.03Graphite Enterprise Trust 209,056 1,177 0.02Hansa Trust 10,456 87 0.00Henderson European Focus Trust 44,975 405 0.01Henderson EuroTrust 29,229 224 0.00Henderson Far East Income 255,181 758 0.01Henderson Global Trust 31,592 110 0.00Henderson High Income Trust 44,029 75 0.00Henderson Smaller Companies Investment Trust 235,579 1,303 0.02Henderson Value Trust 183,370 451 0.01Herald Investment Trust 239,153 1,700 0.03HgCapital Trust 116,004 1,254 0.02HICL Infrastructure 3,255,325 4,375 0.08International Public Partnerships 2,169,050 2,779 0.05Invesco Asia Trust 180,587 271 0.01Invesco Income Growth Trust 42,563 116 0.00Invesco Perpetual UK Smaller Companies Investment Trust 44,597 142 0.00JPMorgan American Investment Trust 124,809 1,418 0.03JPMorgan Asian Investment Trust 486,009 923 0.02JPMorgan Chinese Investment Trust 50,121 75 0.00JPMorgan Claverhouse Investment Trust 140,759 836 0.02JPMorgan Emerging Markets Investment Trust 325,513 1,641 0.03JPMorgan European Investment Trust 448,033 982 0.02JPMorgan European Smaller Companies Trust 88,891 1,030 0.02JPMorgan Indian Investment Trust 323,806 1,033 0.02JPMorgan Japan Smaller Companies Trust 20,334 39 0.00
77
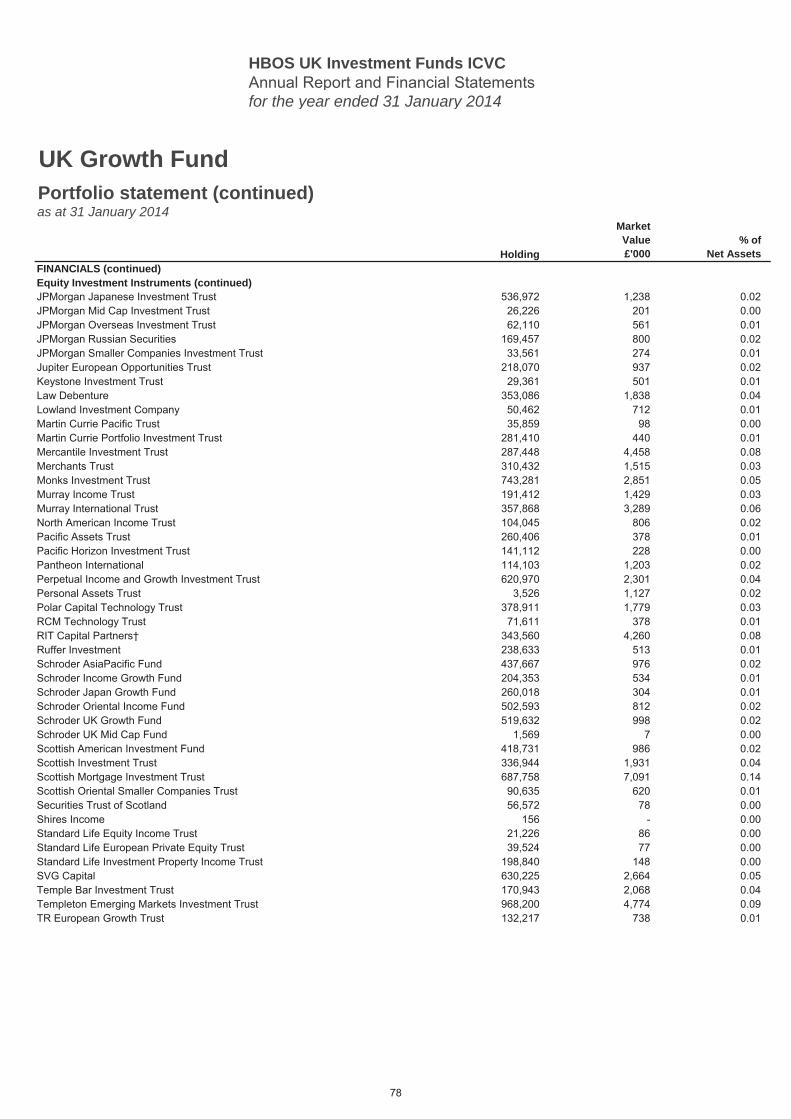
HBOS UK Investment Funds ICVCAnnual Report and Financial Statementsfor the year ended 31 January 2014
Holding
MarketValue£'000
% ofNet Assets
UK Growth FundPortfolio statement (continued)as at 31 January 2014
FINANCIALS (continued) 26.09Equity Investment Instruments (continued)JPMorgan Japanese Investment Trust 536,972 1,238 0.02JPMorgan Mid Cap Investment Trust 26,226 201 0.00JPMorgan Overseas Investment Trust 62,110 561 0.01JPMorgan Russian Securities 169,457 800 0.02JPMorgan Smaller Companies Investment Trust 33,561 274 0.01Jupiter European Opportunities Trust 218,070 937 0.02Keystone Investment Trust 29,361 501 0.01Law Debenture 353,086 1,838 0.04Lowland Investment Company 50,462 712 0.01Martin Currie Pacific Trust 35,859 98 0.00Martin Currie Portfolio Investment Trust 281,410 440 0.01Mercantile Investment Trust 287,448 4,458 0.08Merchants Trust 310,432 1,515 0.03Monks Investment Trust 743,281 2,851 0.05Murray Income Trust 191,412 1,429 0.03Murray International Trust 357,868 3,289 0.06North American Income Trust 104,045 806 0.02Pacific Assets Trust 260,406 378 0.01Pacific Horizon Investment Trust 141,112 228 0.00Pantheon International 114,103 1,203 0.02Perpetual Income and Growth Investment Trust 620,970 2,301 0.04Personal Assets Trust 3,526 1,127 0.02Polar Capital Technology Trust 378,911 1,779 0.03RCM Technology Trust 71,611 378 0.01RIT Capital Partners† 343,560 4,260 0.08Ruffer Investment 238,633 513 0.01Schroder AsiaPacific Fund 437,667 976 0.02Schroder Income Growth Fund 204,353 534 0.01Schroder Japan Growth Fund 260,018 304 0.01Schroder Oriental Income Fund 502,593 812 0.02Schroder UK Growth Fund 519,632 998 0.02Schroder UK Mid Cap Fund 1,569 7 0.00Scottish American Investment Fund 418,731 986 0.02Scottish Investment Trust 336,944 1,931 0.04Scottish Mortgage Investment Trust 687,758 7,091 0.14Scottish Oriental Smaller Companies Trust 90,635 620 0.01Securities Trust of Scotland 56,572 78 0.00Shires Income 156 - 0.00Standard Life Equity Income Trust 21,226 86 0.00Standard Life European Private Equity Trust 39,524 77 0.00Standard Life Investment Property Income Trust 198,840 148 0.00SVG Capital 630,225 2,664 0.05Temple Bar Investment Trust 170,943 2,068 0.04Templeton Emerging Markets Investment Trust 968,200 4,774 0.09TR European Growth Trust 132,217 738 0.01
78
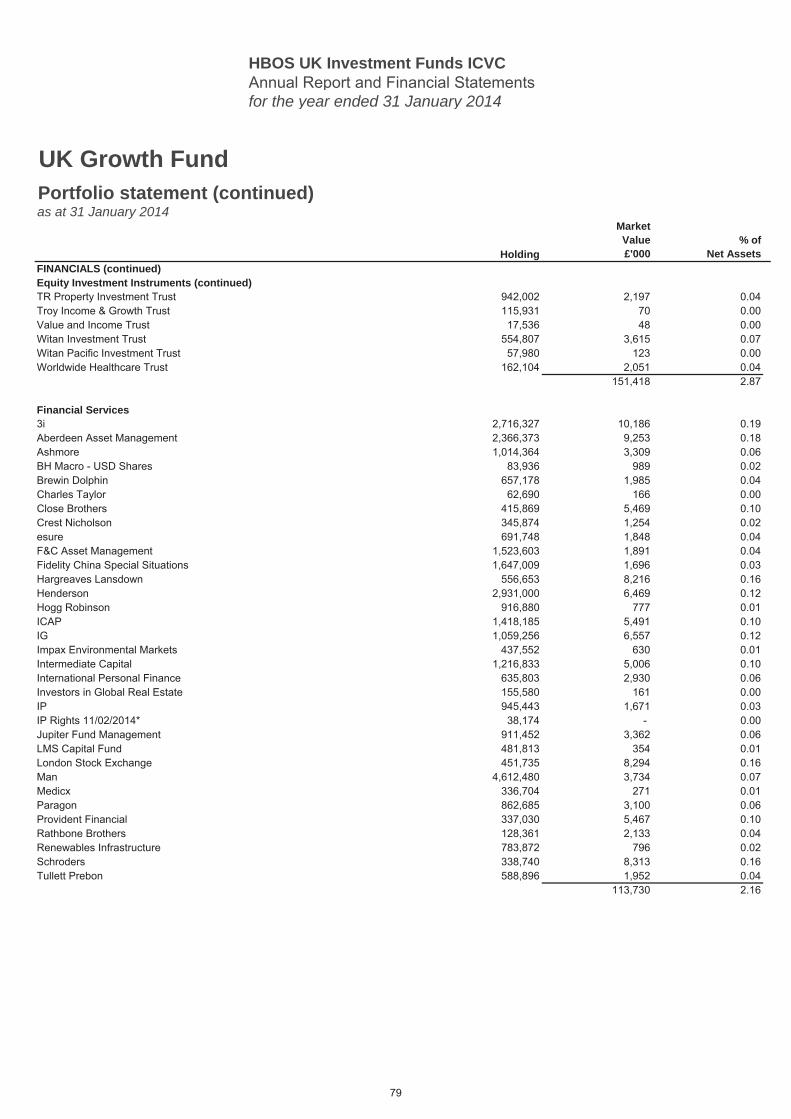
HBOS UK Investment Funds ICVCAnnual Report and Financial Statementsfor the year ended 31 January 2014
Holding
MarketValue£'000
% ofNet Assets
UK Growth FundPortfolio statement (continued)as at 31 January 2014
FINANCIALS (continued) 26.09Equity Investment Instruments (continued)TR Property Investment Trust 942,002 2,197 0.04Troy Income & Growth Trust 115,931 70 0.00Value and Income Trust 17,536 48 0.00Witan Investment Trust 554,807 3,615 0.07Witan Pacific Investment Trust 57,980 123 0.00Worldwide Healthcare Trust 162,104 2,051 0.04
151,418 2.87
Financial Services3i 2,716,327 10,186 0.19Aberdeen Asset Management 2,366,373 9,253 0.18Ashmore 1,014,364 3,309 0.06BH Macro - USD Shares 83,936 989 0.02Brewin Dolphin 657,178 1,985 0.04Charles Taylor 62,690 166 0.00Close Brothers 415,869 5,469 0.10Crest Nicholson 345,874 1,254 0.02esure 691,748 1,848 0.04F&C Asset Management 1,523,603 1,891 0.04Fidelity China Special Situations 1,647,009 1,696 0.03Hargreaves Lansdown 556,653 8,216 0.16Henderson 2,931,000 6,469 0.12Hogg Robinson 916,880 777 0.01ICAP 1,418,185 5,491 0.10IG 1,059,256 6,557 0.12Impax Environmental Markets 437,552 630 0.01Intermediate Capital 1,216,833 5,006 0.10International Personal Finance 635,803 2,930 0.06Investors in Global Real Estate 155,580 161 0.00IP 945,443 1,671 0.03IP Rights 11/02/2014* 38,174 - 0.00Jupiter Fund Management 911,452 3,362 0.06LMS Capital Fund 481,813 354 0.01London Stock Exchange 451,735 8,294 0.16Man 4,612,480 3,734 0.07Medicx 336,704 271 0.01Paragon 862,685 3,100 0.06Provident Financial 337,030 5,467 0.10Rathbone Brothers 128,361 2,133 0.04Renewables Infrastructure 783,872 796 0.02Schroders 338,740 8,313 0.16Tullett Prebon 588,896 1,952 0.04
113,730 2.16
79
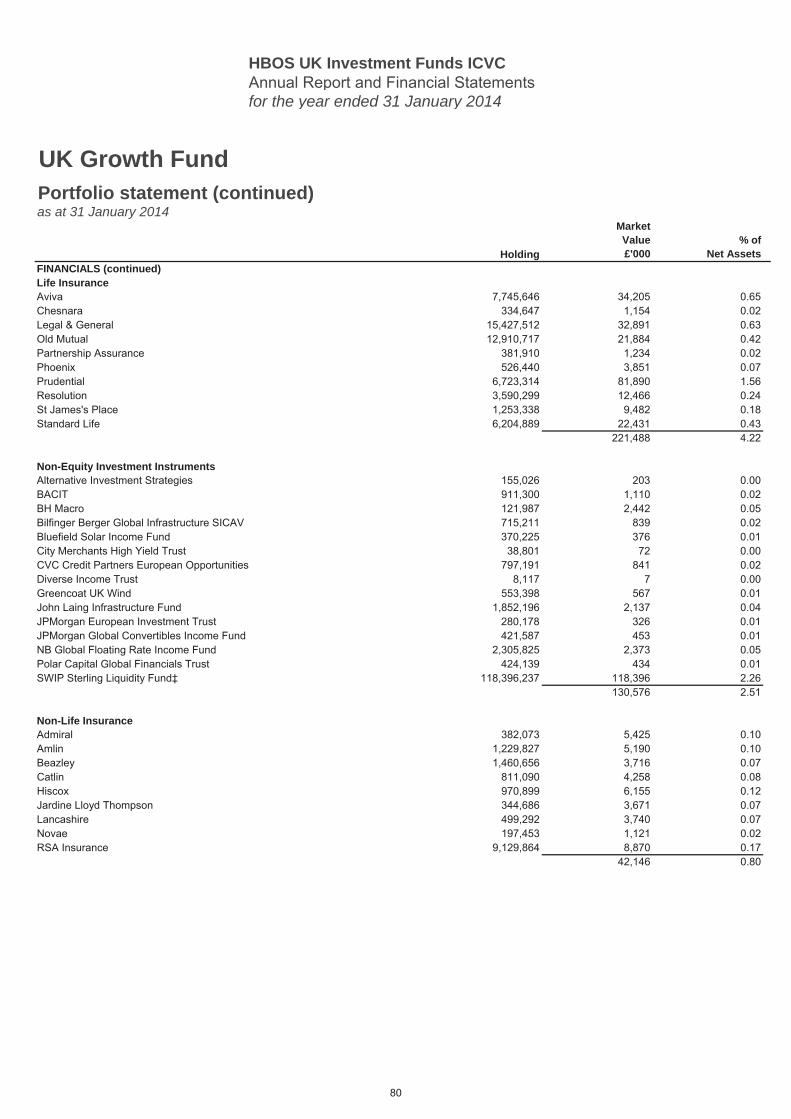
HBOS UK Investment Funds ICVCAnnual Report and Financial Statementsfor the year ended 31 January 2014
Holding
MarketValue£'000
% ofNet Assets
UK Growth FundPortfolio statement (continued)as at 31 January 2014
FINANCIALS (continued) 26.09Life InsuranceAviva 7,745,646 34,205 0.65Chesnara 334,647 1,154 0.02Legal & General 15,427,512 32,891 0.63Old Mutual 12,910,717 21,884 0.42Partnership Assurance 381,910 1,234 0.02Phoenix 526,440 3,851 0.07Prudential 6,723,314 81,890 1.56Resolution 3,590,299 12,466 0.24St James's Place 1,253,338 9,482 0.18Standard Life 6,204,889 22,431 0.43
221,488 4.22
Non-Equity Investment InstrumentsAlternative Investment Strategies 155,026 203 0.00BACIT 911,300 1,110 0.02BH Macro 121,987 2,442 0.05Bilfinger Berger Global Infrastructure SICAV 715,211 839 0.02Bluefield Solar Income Fund 370,225 376 0.01City Merchants High Yield Trust 38,801 72 0.00CVC Credit Partners European Opportunities 797,191 841 0.02Diverse Income Trust 8,117 7 0.00Greencoat UK Wind 553,398 567 0.01John Laing Infrastructure Fund 1,852,196 2,137 0.04JPMorgan European Investment Trust 280,178 326 0.01JPMorgan Global Convertibles Income Fund 421,587 453 0.01NB Global Floating Rate Income Fund 2,305,825 2,373 0.05Polar Capital Global Financials Trust 424,139 434 0.01SWIP Sterling Liquidity Fund‡ 118,396,237 118,396 2.26
130,576 2.51
Non-Life InsuranceAdmiral 382,073 5,425 0.10Amlin 1,229,827 5,190 0.10Beazley 1,460,656 3,716 0.07Catlin 811,090 4,258 0.08Hiscox 970,899 6,155 0.12Jardine Lloyd Thompson 344,686 3,671 0.07Lancashire 499,292 3,740 0.07Novae 197,453 1,121 0.02RSA Insurance 9,129,864 8,870 0.17
42,146 0.80
80
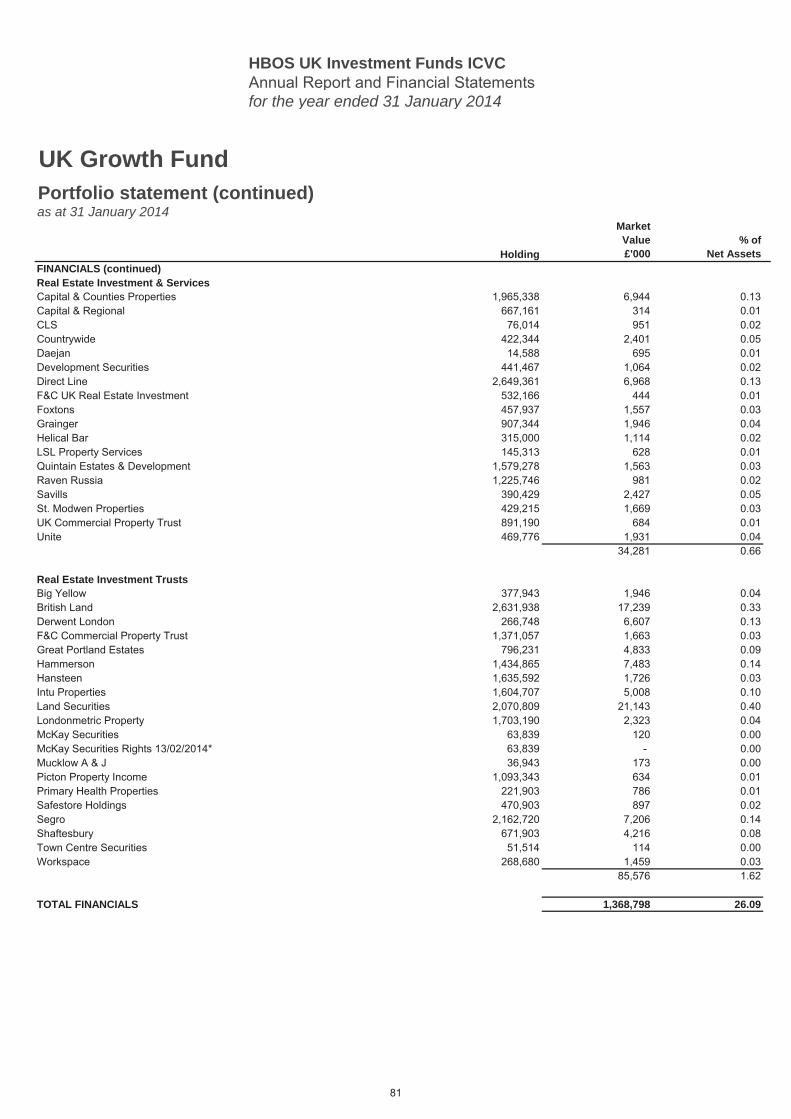
HBOS UK Investment Funds ICVCAnnual Report and Financial Statementsfor the year ended 31 January 2014
Holding
MarketValue£'000
% ofNet Assets
UK Growth FundPortfolio statement (continued)as at 31 January 2014
FINANCIALS (continued) 26.09Real Estate Investment & ServicesCapital & Counties Properties 1,965,338 6,944 0.13Capital & Regional 667,161 314 0.01CLS 76,014 951 0.02Countrywide 422,344 2,401 0.05Daejan 14,588 695 0.01Development Securities 441,467 1,064 0.02Direct Line 2,649,361 6,968 0.13F&C UK Real Estate Investment 532,166 444 0.01Foxtons 457,937 1,557 0.03Grainger 907,344 1,946 0.04Helical Bar 315,000 1,114 0.02LSL Property Services 145,313 628 0.01Quintain Estates & Development 1,579,278 1,563 0.03Raven Russia 1,225,746 981 0.02Savills 390,429 2,427 0.05St. Modwen Properties 429,215 1,669 0.03UK Commercial Property Trust 891,190 684 0.01Unite 469,776 1,931 0.04
34,281 0.66
Real Estate Investment TrustsBig Yellow 377,943 1,946 0.04British Land 2,631,938 17,239 0.33Derwent London 266,748 6,607 0.13F&C Commercial Property Trust 1,371,057 1,663 0.03Great Portland Estates 796,231 4,833 0.09Hammerson 1,434,865 7,483 0.14Hansteen 1,635,592 1,726 0.03Intu Properties 1,604,707 5,008 0.10Land Securities 2,070,809 21,143 0.40Londonmetric Property 1,703,190 2,323 0.04McKay Securities 63,839 120 0.00McKay Securities Rights 13/02/2014* 63,839 - 0.00Mucklow A & J 36,943 173 0.00Picton Property Income 1,093,343 634 0.01Primary Health Properties 221,903 786 0.01Safestore Holdings 470,903 897 0.02Segro 2,162,720 7,206 0.14Shaftesbury 671,903 4,216 0.08Town Centre Securities 51,514 114 0.00Workspace 268,680 1,459 0.03
85,576 1.62
TOTAL FINANCIALS 1,368,798 26.09
81
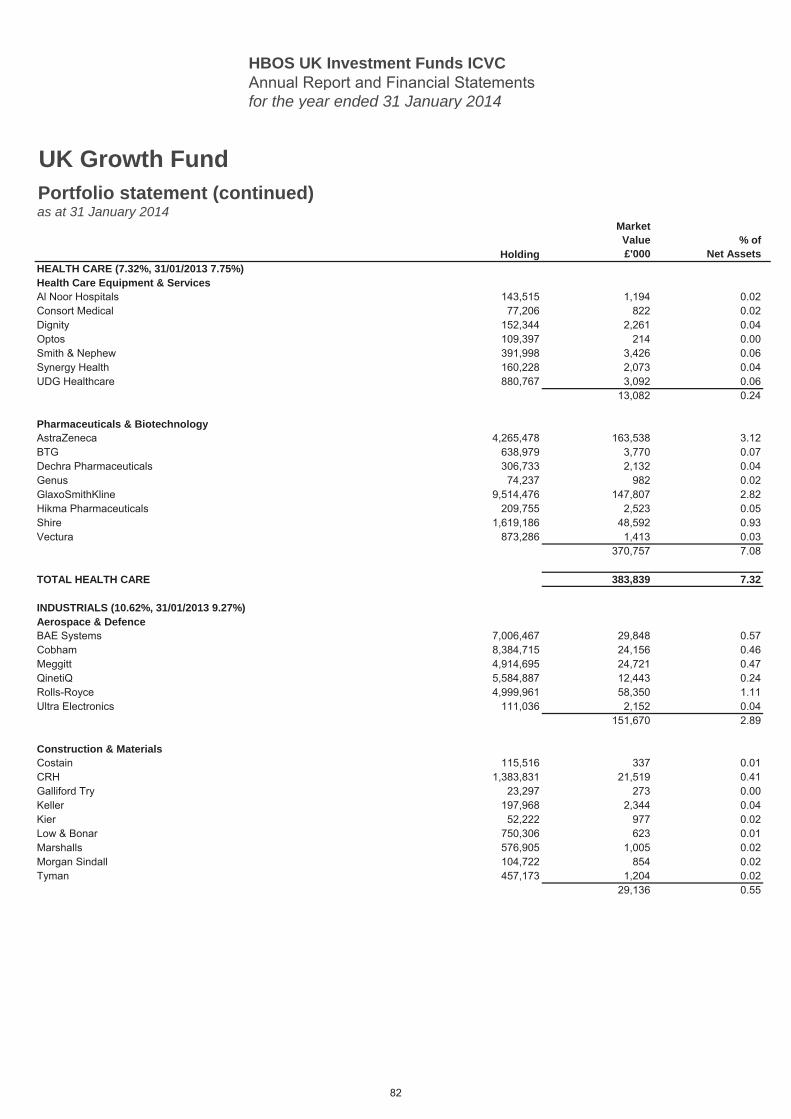
HBOS UK Investment Funds ICVCAnnual Report and Financial Statementsfor the year ended 31 January 2014
Holding
MarketValue£'000
% ofNet Assets
UK Growth FundPortfolio statement (continued)as at 31 January 2014
HEALTH CARE (7.32%, 31/01/2013 7.75%) 7.32Health Care Equipment & ServicesAl Noor Hospitals 143,515 1,194 0.02Consort Medical 77,206 822 0.02Dignity 152,344 2,261 0.04Optos 109,397 214 0.00Smith & Nephew 391,998 3,426 0.06Synergy Health 160,228 2,073 0.04UDG Healthcare 880,767 3,092 0.06
13,082 0.24
Pharmaceuticals & BiotechnologyAstraZeneca 4,265,478 163,538 3.12BTG 638,979 3,770 0.07Dechra Pharmaceuticals 306,733 2,132 0.04Genus 74,237 982 0.02GlaxoSmithKline 9,514,476 147,807 2.82Hikma Pharmaceuticals 209,755 2,523 0.05Shire 1,619,186 48,592 0.93Vectura 873,286 1,413 0.03
370,757 7.08
TOTAL HEALTH CARE 383,839 7.32
INDUSTRIALS (10.62%, 31/01/2013 9.27%) 10.62Aerospace & DefenceBAE Systems 7,006,467 29,848 0.57Cobham 8,384,715 24,156 0.46Meggitt 4,914,695 24,721 0.47QinetiQ 5,584,887 12,443 0.24Rolls-Royce 4,999,961 58,350 1.11Ultra Electronics 111,036 2,152 0.04
151,670 2.89
Construction & MaterialsCostain 115,516 337 0.01CRH 1,383,831 21,519 0.41Galliford Try 23,297 273 0.00Keller 197,968 2,344 0.04Kier 52,222 977 0.02Low & Bonar 750,306 623 0.01Marshalls 576,905 1,005 0.02Morgan Sindall 104,722 854 0.02Tyman 457,173 1,204 0.02
29,136 0.55
82
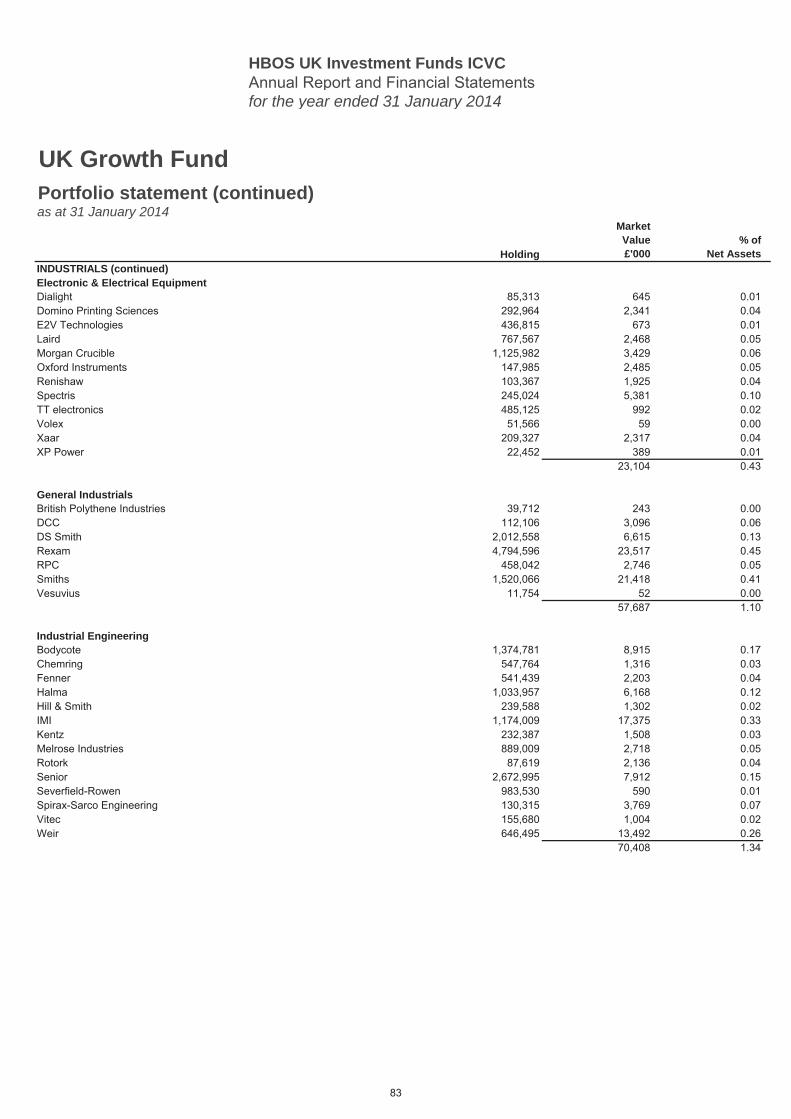
HBOS UK Investment Funds ICVCAnnual Report and Financial Statementsfor the year ended 31 January 2014
Holding
MarketValue£'000
% ofNet Assets
UK Growth FundPortfolio statement (continued)as at 31 January 2014
INDUSTRIALS (continued) 10.62Electronic & Electrical EquipmentDialight 85,313 645 0.01Domino Printing Sciences 292,964 2,341 0.04E2V Technologies 436,815 673 0.01Laird 767,567 2,468 0.05Morgan Crucible 1,125,982 3,429 0.06Oxford Instruments 147,985 2,485 0.05Renishaw 103,367 1,925 0.04Spectris 245,024 5,381 0.10TT electronics 485,125 992 0.02Volex 51,566 59 0.00Xaar 209,327 2,317 0.04XP Power 22,452 389 0.01
23,104 0.43
General IndustrialsBritish Polythene Industries 39,712 243 0.00DCC 112,106 3,096 0.06DS Smith 2,012,558 6,615 0.13Rexam 4,794,596 23,517 0.45RPC 458,042 2,746 0.05Smiths 1,520,066 21,418 0.41Vesuvius 11,754 52 0.00
57,687 1.10
Industrial EngineeringBodycote 1,374,781 8,915 0.17Chemring 547,764 1,316 0.03Fenner 541,439 2,203 0.04Halma 1,033,957 6,168 0.12Hill & Smith 239,588 1,302 0.02IMI 1,174,009 17,375 0.33Kentz 232,387 1,508 0.03Melrose Industries 889,009 2,718 0.05Rotork 87,619 2,136 0.04Senior 2,672,995 7,912 0.15Severfield-Rowen 983,530 590 0.01Spirax-Sarco Engineering 130,315 3,769 0.07Vitec 155,680 1,004 0.02Weir 646,495 13,492 0.26
70,408 1.34
83
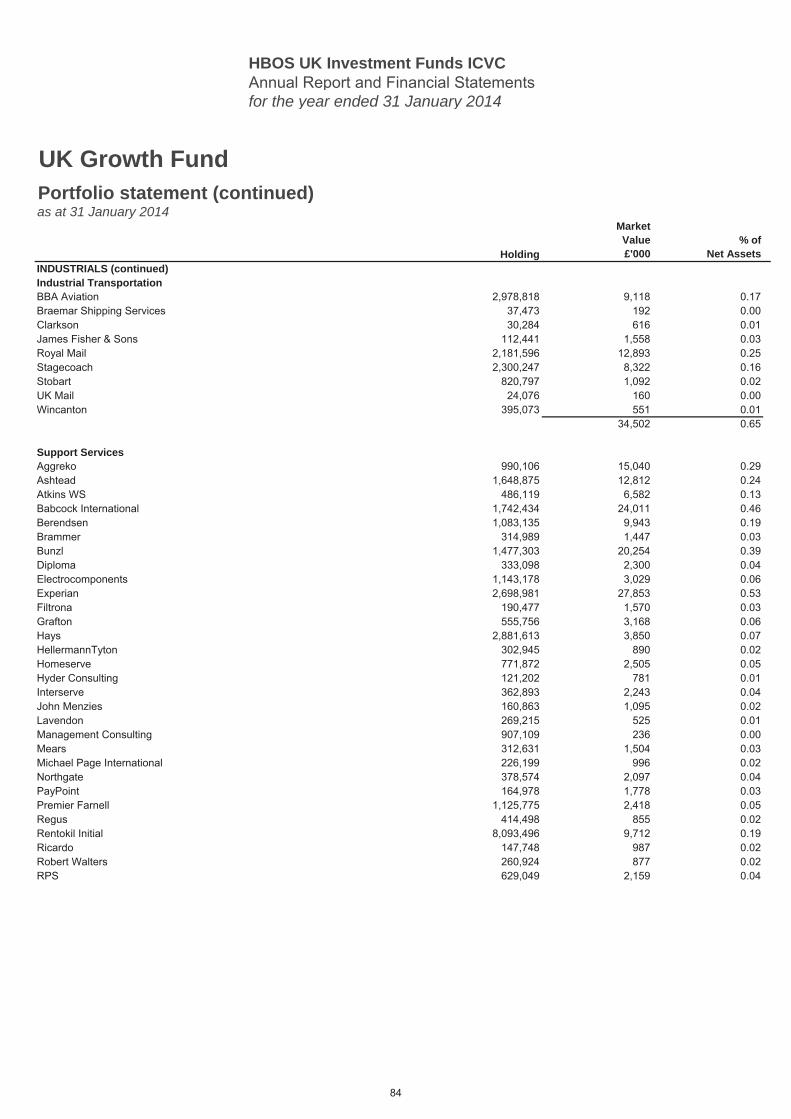
HBOS UK Investment Funds ICVCAnnual Report and Financial Statementsfor the year ended 31 January 2014
Holding
MarketValue£'000
% ofNet Assets
UK Growth FundPortfolio statement (continued)as at 31 January 2014
INDUSTRIALS (continued) 10.62Industrial TransportationBBA Aviation 2,978,818 9,118 0.17Braemar Shipping Services 37,473 192 0.00Clarkson 30,284 616 0.01James Fisher & Sons 112,441 1,558 0.03Royal Mail 2,181,596 12,893 0.25Stagecoach 2,300,247 8,322 0.16Stobart 820,797 1,092 0.02UK Mail 24,076 160 0.00Wincanton 395,073 551 0.01
34,502 0.65
Support ServicesAggreko 990,106 15,040 0.29Ashtead 1,648,875 12,812 0.24Atkins WS 486,119 6,582 0.13Babcock International 1,742,434 24,011 0.46Berendsen 1,083,135 9,943 0.19Brammer 314,989 1,447 0.03Bunzl 1,477,303 20,254 0.39Diploma 333,098 2,300 0.04Electrocomponents 1,143,178 3,029 0.06Experian 2,698,981 27,853 0.53Filtrona 190,477 1,570 0.03Grafton 555,756 3,168 0.06Hays 2,881,613 3,850 0.07HellermannTyton 302,945 890 0.02Homeserve 771,872 2,505 0.05Hyder Consulting 121,202 781 0.01Interserve 362,893 2,243 0.04John Menzies 160,863 1,095 0.02Lavendon 269,215 525 0.01Management Consulting 907,109 236 0.00Mears 312,631 1,504 0.03Michael Page International 226,199 996 0.02Northgate 378,574 2,097 0.04PayPoint 164,978 1,778 0.03Premier Farnell 1,125,775 2,418 0.05Regus 414,498 855 0.02Rentokil Initial 8,093,496 9,712 0.19Ricardo 147,748 987 0.02Robert Walters 260,924 877 0.02RPS 629,049 2,159 0.04
84
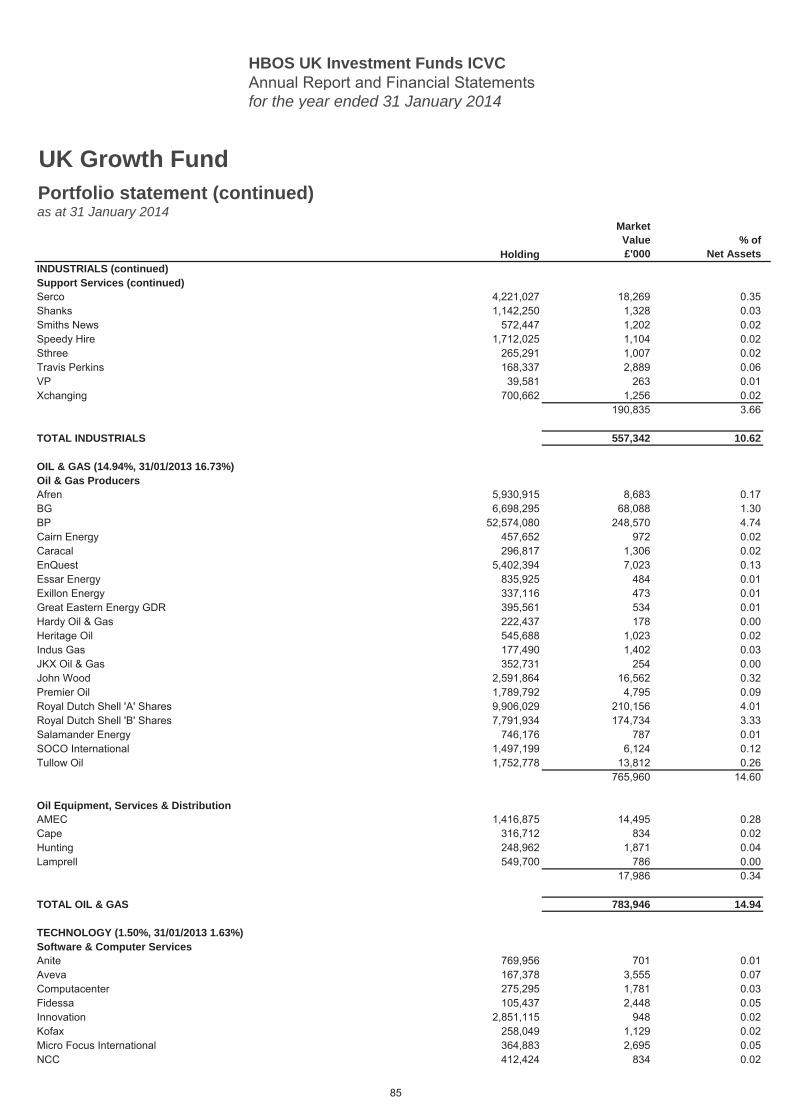
HBOS UK Investment Funds ICVCAnnual Report and Financial Statementsfor the year ended 31 January 2014
Holding
MarketValue£'000
% ofNet Assets
UK Growth FundPortfolio statement (continued)as at 31 January 2014
INDUSTRIALS (continued) 10.62Support Services (continued)Serco 4,221,027 18,269 0.35Shanks 1,142,250 1,328 0.03Smiths News 572,447 1,202 0.02Speedy Hire 1,712,025 1,104 0.02Sthree 265,291 1,007 0.02Travis Perkins 168,337 2,889 0.06VP 39,581 263 0.01Xchanging 700,662 1,256 0.02
190,835 3.66
TOTAL INDUSTRIALS 557,342 10.62
OIL & GAS (14.94%, 31/01/2013 16.73%) 14.94Oil & Gas ProducersAfren 5,930,915 8,683 0.17BG 6,698,295 68,088 1.30BP 52,574,080 248,570 4.74Cairn Energy 457,652 972 0.02Caracal 296,817 1,306 0.02EnQuest 5,402,394 7,023 0.13Essar Energy 835,925 484 0.01Exillon Energy 337,116 473 0.01Great Eastern Energy GDR 395,561 534 0.01Hardy Oil & Gas 222,437 178 0.00Heritage Oil 545,688 1,023 0.02Indus Gas 177,490 1,402 0.03JKX Oil & Gas 352,731 254 0.00John Wood 2,591,864 16,562 0.32Premier Oil 1,789,792 4,795 0.09Royal Dutch Shell 'A' Shares 9,906,029 210,156 4.01Royal Dutch Shell 'B' Shares 7,791,934 174,734 3.33Salamander Energy 746,176 787 0.01SOCO International 1,497,199 6,124 0.12Tullow Oil 1,752,778 13,812 0.26
765,960 14.60
Oil Equipment, Services & DistributionAMEC 1,416,875 14,495 0.28Cape 316,712 834 0.02Hunting 248,962 1,871 0.04Lamprell 549,700 786 0.00
17,986 0.34
TOTAL OIL & GAS 783,946 14.94
TECHNOLOGY (1.50%, 31/01/2013 1.63%) 1.50Software & Computer ServicesAnite 769,956 701 0.01Aveva 167,378 3,555 0.07Computacenter 275,295 1,781 0.03Fidessa 105,437 2,448 0.05Innovation 2,851,115 948 0.02Kofax 258,049 1,129 0.02Micro Focus International 364,883 2,695 0.05NCC 412,424 834 0.02
85
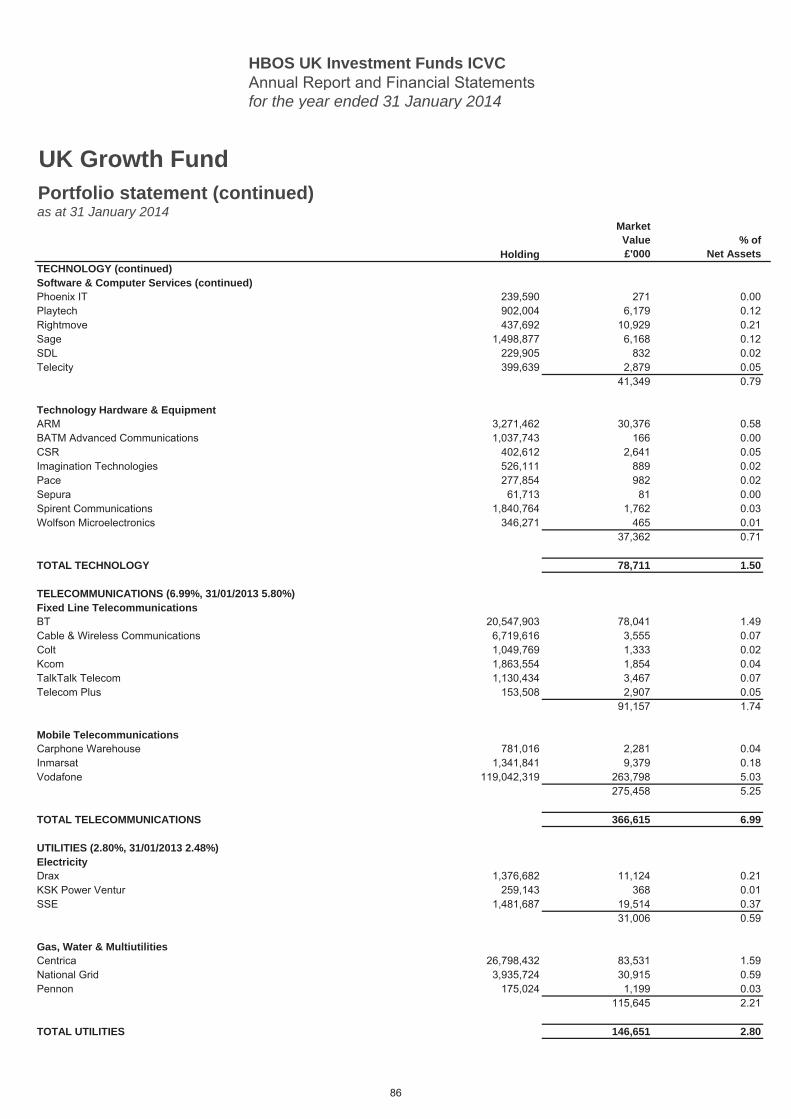
HBOS UK Investment Funds ICVCAnnual Report and Financial Statementsfor the year ended 31 January 2014
Holding
MarketValue£'000
% ofNet Assets
UK Growth FundPortfolio statement (continued)as at 31 January 2014
TECHNOLOGY (continued) 1.50Software & Computer Services (continued)Phoenix IT 239,590 271 0.00Playtech 902,004 6,179 0.12Rightmove 437,692 10,929 0.21Sage 1,498,877 6,168 0.12SDL 229,905 832 0.02Telecity 399,639 2,879 0.05
41,349 0.79
Technology Hardware & EquipmentARM 3,271,462 30,376 0.58BATM Advanced Communications 1,037,743 166 0.00CSR 402,612 2,641 0.05Imagination Technologies 526,111 889 0.02Pace 277,854 982 0.02Sepura 61,713 81 0.00Spirent Communications 1,840,764 1,762 0.03Wolfson Microelectronics 346,271 465 0.01
37,362 0.71
TOTAL TECHNOLOGY 78,711 1.50
TELECOMMUNICATIONS (6.99%, 31/01/2013 5.80%) 6.99Fixed Line TelecommunicationsBT 20,547,903 78,041 1.49Cable & Wireless Communications 6,719,616 3,555 0.07Colt 1,049,769 1,333 0.02Kcom 1,863,554 1,854 0.04TalkTalk Telecom 1,130,434 3,467 0.07Telecom Plus 153,508 2,907 0.05
91,157 1.74
Mobile TelecommunicationsCarphone Warehouse 781,016 2,281 0.04Inmarsat 1,341,841 9,379 0.18Vodafone 119,042,319 263,798 5.03
275,458 5.25
TOTAL TELECOMMUNICATIONS 366,615 6.99
UTILITIES (2.80%, 31/01/2013 2.48%) 2.80ElectricityDrax 1,376,682 11,124 0.21KSK Power Ventur 259,143 368 0.01SSE 1,481,687 19,514 0.37
31,006 0.59
Gas, Water & MultiutilitiesCentrica 26,798,432 83,531 1.59National Grid 3,935,724 30,915 0.59Pennon 175,024 1,199 0.03
115,645 2.21
TOTAL UTILITIES 146,651 2.80
86
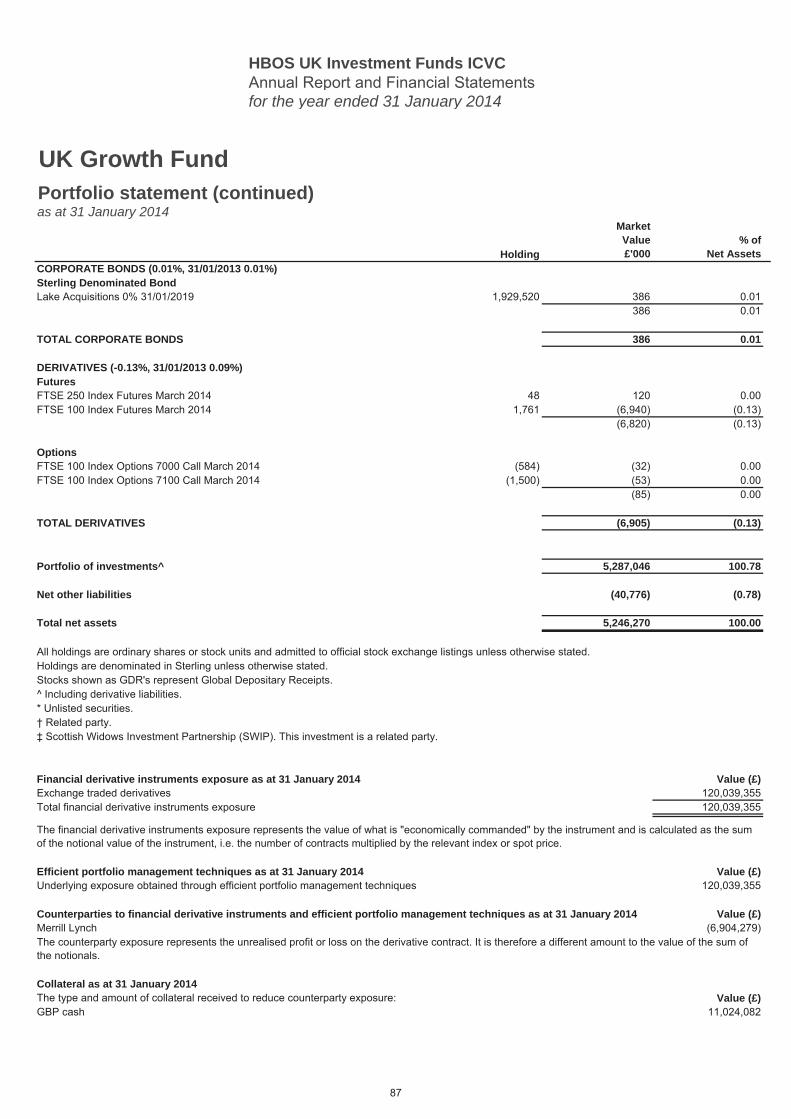
HBOS UK Investment Funds ICVCAnnual Report and Financial Statementsfor the year ended 31 January 2014
Holding
MarketValue£'000
% ofNet Assets
UK Growth FundPortfolio statement (continued)as at 31 January 2014
CORPORATE BONDS (0.01%, 31/01/2013 0.01%) 0.01Sterling Denominated BondLake Acquisitions 0% 31/01/2019 1,929,520 386 0.01
386 0.01
TOTAL CORPORATE BONDS 386 0.01
DERIVATIVES (-0.13%, 31/01/2013 0.09%) (0.13)FuturesFTSE 250 Index Futures March 2014 48 120 0.00FTSE 100 Index Futures March 2014 1,761 (6,940) (0.13)
(6,820) (0.13)
OptionsFTSE 100 Index Options 7000 Call March 2014 (584) (32) 0.00FTSE 100 Index Options 7100 Call March 2014 (1,500) (53) 0.00
(85) 0.00
TOTAL DERIVATIVES (6,905) (0.13)
Portfolio of investments^ 5,287,046 100.78
Net other liabilities (40,776) (0.78)
Total net assets 5,246,270 100.00
Financial derivative instruments exposure as at 31 January 2014 Value (£)Exchange traded derivatives 120,039,355Total financial derivative instruments exposure 120,039,355
Efficient portfolio management techniques as at 31 January 2014 Value (£)Underlying exposure obtained through efficient portfolio management techniques 120,039,355
Counterparties to financial derivative instruments and efficient portfolio management techniques as at 31 January 2014 Value (£)Merrill Lynch (6,904,279)
Collateral as at 31 January 2014The type and amount of collateral received to reduce counterparty exposure: Value (£)GBP cash 11,024,082
‡ Scottish Widows Investment Partnership (SWIP). This investment is a related party.
All holdings are ordinary shares or stock units and admitted to official stock exchange listings unless otherwise stated.Holdings are denominated in Sterling unless otherwise stated.Stocks shown as GDR's represent Global Depositary Receipts.^ Including derivative liabilities.* Unlisted securities.† Related party.
The counterparty exposure represents the unrealised profit or loss on the derivative contract. It is therefore a different amount to the value of the sum of the notionals.
The financial derivative instruments exposure represents the value of what is "economically commanded" by the instrument and is calculated as the sum of the notional value of the instrument, i.e. the number of contracts multiplied by the relevant index or spot price.
87
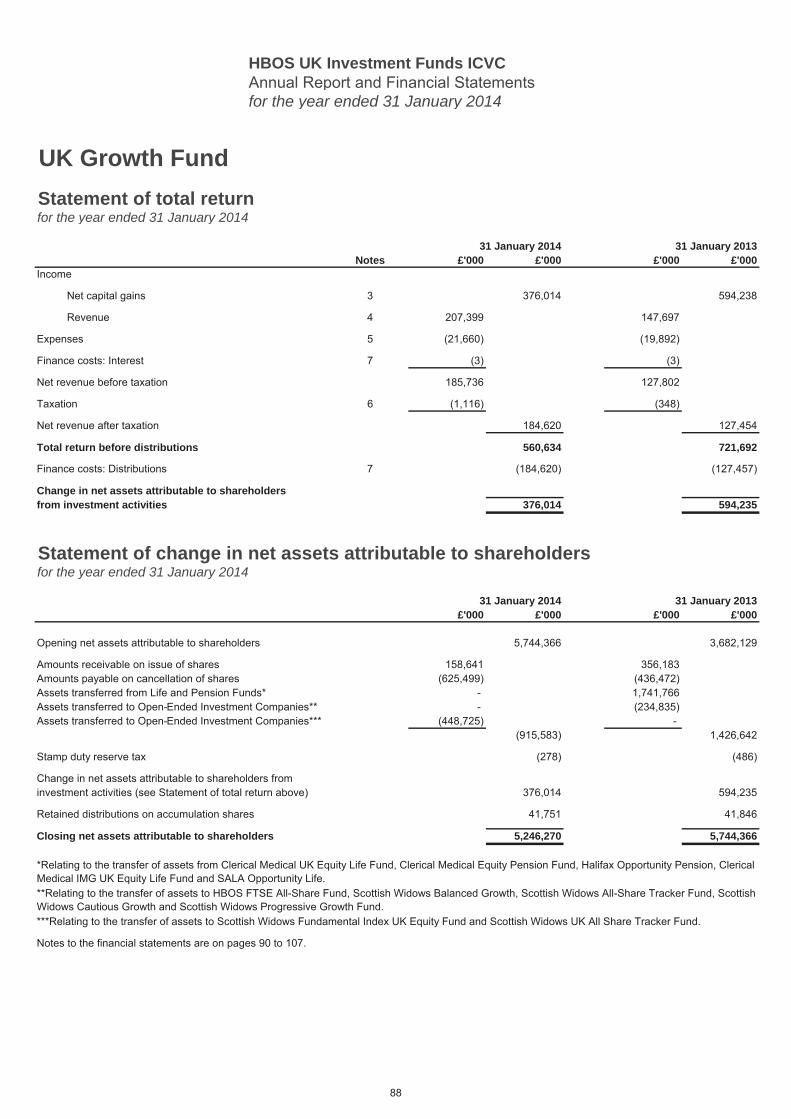
HBOS UK Investment Funds ICVCAnnual Report and Financial Statementsfor the year ended 31 January 2014
UK Growth FundStatement of total returnfor the year ended 31 January 2014
31 January 2014 31 January 2013Notes £'000 £'000 £'000 £'000
Income
Net capital gains 3 376,014 594,238
Revenue 4 207,399 147,697
Expenses 5 (21,660) (19,892)
Finance costs: Interest 7 (3) (3)
Net revenue before taxation 185,736 127,802
Taxation 6 (1,116) (348)
Net revenue after taxation 184,620 127,454
Total return before distributions 560,634 721,692
Finance costs: Distributions 7 (184,620) (127,457)
Change in net assets attributable to shareholdersfrom investment activities 376,014 594,235
Statement of change in net assets attributable to shareholdersfor the year ended 31 January 2014
31 January 2014 31 January 2013£'000 £'000 £'000 £'000
Opening net assets attributable to shareholders 5,744,366 3,682,129
Amounts receivable on issue of shares 158,641 356,183Amounts payable on cancellation of shares (625,499) (436,472)Assets transferred from Life and Pension Funds* - 1,741,766Assets transferred to Open-Ended Investment Companies** - (234,835)Assets transferred to Open-Ended Investment Companies*** (448,725) -
(915,583) 1,426,642
Stamp duty reserve tax (278) (486)
Change in net assets attributable to shareholders frominvestment activities (see Statement of total return above) 376,014 594,235
Retained distributions on accumulation shares 41,751 41,846
Closing net assets attributable to shareholders 5,246,270 5,744,366
Notes to the financial statements are on pages 90 to 107.
*Relating to the transfer of assets from Clerical Medical UK Equity Life Fund, Clerical Medical Equity Pension Fund, Halifax Opportunity Pension, Clerical Medical IMG UK Equity Life Fund and SALA Opportunity Life.**Relating to the transfer of assets to HBOS FTSE All-Share Fund, Scottish Widows Balanced Growth, Scottish Widows All-Share Tracker Fund, Scottish Widows Cautious Growth and Scottish Widows Progressive Growth Fund.***Relating to the transfer of assets to Scottish Widows Fundamental Index UK Equity Fund and Scottish Widows UK All Share Tracker Fund.
88
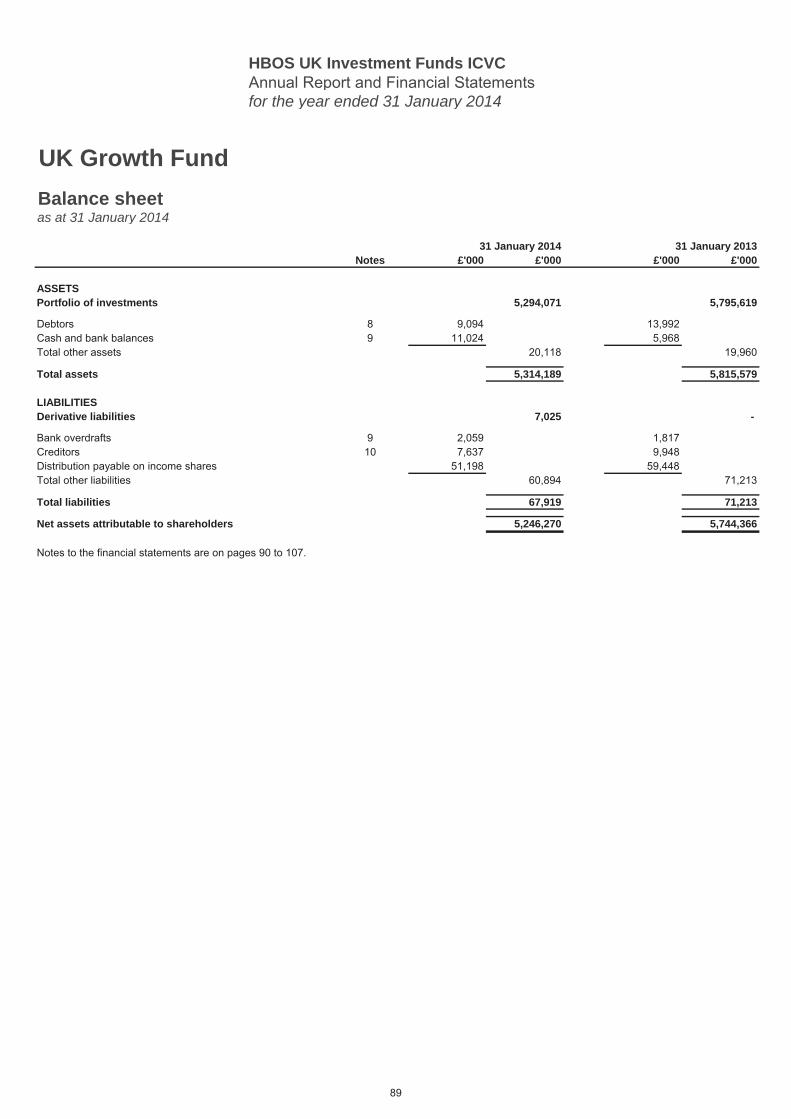
HBOS UK Investment Funds ICVCAnnual Report and Financial Statementsfor the year ended 31 January 2014
UK Growth FundBalance sheetas at 31 January 2014
31 January 2014 31 January 2013Notes £'000 £'000 £'000 £'000
ASSETSPortfolio of investments 5,294,071 5,795,619
Debtors 8 9,094 13,992Cash and bank balances 9 11,024 5,968Total other assets 20,118 19,960
Total assets 5,314,189 5,815,579
LIABILITIESDerivative liabilities 7,025 -
Bank overdrafts 9 2,059 1,817Creditors 10 7,637 9,948Distribution payable on income shares 51,198 59,448Total other liabilities 60,894 71,213
Total liabilities 67,919 71,213
Net assets attributable to shareholders 5,246,270 5,744,366
Notes to the financial statements are on pages 90 to 107.
89
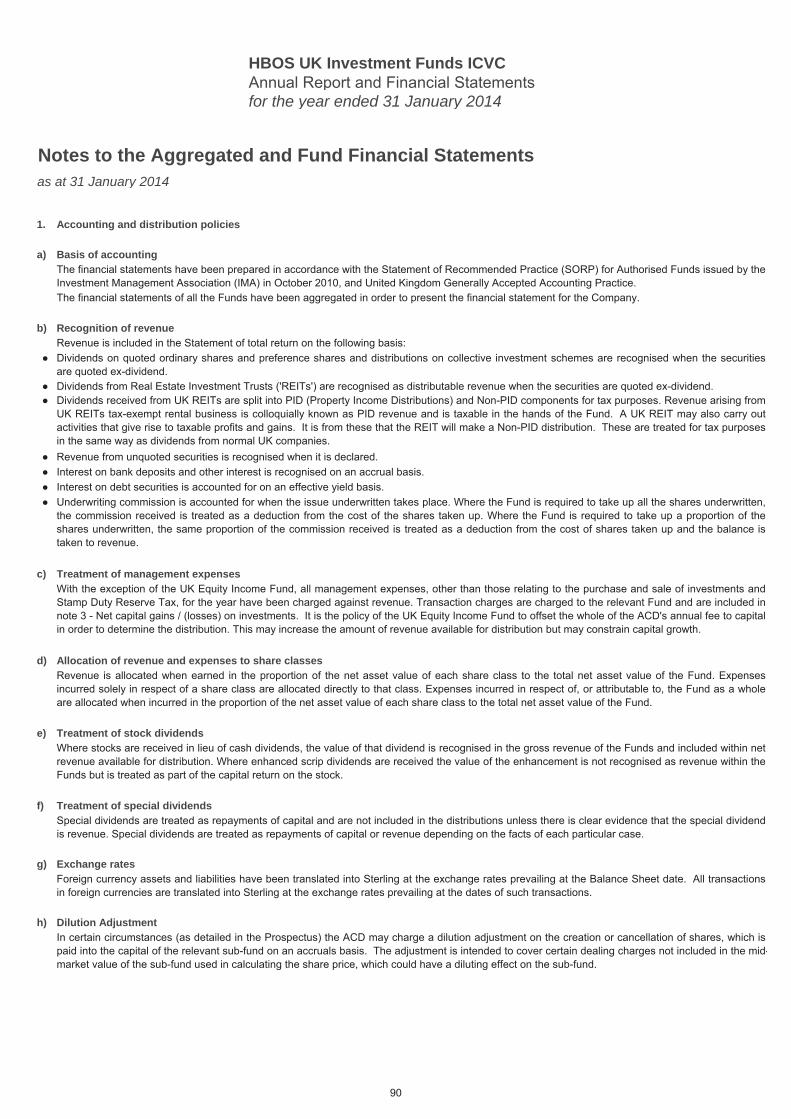
HBOS UK Investment Funds ICVCAnnual Report and Financial Statementsfor the year ended 31 January 2014
Notes to the Aggregated and Fund Financial Statements as at 31 January 2014
1.
a)
b)
●
●●
●●●●
c)
d)
e)
f)
g)
h)
Interest on debt securities is accounted for on an effective yield basis.Underwriting commission is accounted for when the issue underwritten takes place. Where the Fund is required to take up all the shares underwritten,the commission received is treated as a deduction from the cost of the shares taken up. Where the Fund is required to take up a proportion of theshares underwritten, the same proportion of the commission received is treated as a deduction from the cost of shares taken up and the balance istaken to revenue.
The financial statements have been prepared in accordance with the Statement of Recommended Practice (SORP) for Authorised Funds issued by theInvestment Management Association (IMA) in October 2010, and United Kingdom Generally Accepted Accounting Practice.The financial statements of all the Funds have been aggregated in order to present the financial statement for the Company.
Exchange ratesForeign currency assets and liabilities have been translated into Sterling at the exchange rates prevailing at the Balance Sheet date. All transactionsin foreign currencies are translated into Sterling at the exchange rates prevailing at the dates of such transactions.
Dilution AdjustmentIn certain circumstances (as detailed in the Prospectus) the ACD may charge a dilution adjustment on the creation or cancellation of shares, which ispaid into the capital of the relevant sub-fund on an accruals basis. The adjustment is intended to cover certain dealing charges not included in the mid-market value of the sub-fund used in calculating the share price, which could have a diluting effect on the sub-fund.
Treatment of stock dividendsWhere stocks are received in lieu of cash dividends, the value of that dividend is recognised in the gross revenue of the Funds and included within netrevenue available for distribution. Where enhanced scrip dividends are received the value of the enhancement is not recognised as revenue within theFunds but is treated as part of the capital return on the stock.
Dividends on quoted ordinary shares and preference shares and distributions on collective investment schemes are recognised when the securitiesare quoted ex-dividend.
Treatment of special dividendsSpecial dividends are treated as repayments of capital and are not included in the distributions unless there is clear evidence that the special dividendis revenue. Special dividends are treated as repayments of capital or revenue depending on the facts of each particular case.
Dividends received from UK REITs are split into PID (Property Income Distributions) and Non-PID components for tax purposes. Revenue arising fromUK REITs tax-exempt rental business is colloquially known as PID revenue and is taxable in the hands of the Fund. A UK REIT may also carry outactivities that give rise to taxable profits and gains. It is from these that the REIT will make a Non-PID distribution. These are treated for tax purposesin the same way as dividends from normal UK companies.
Accounting and distribution policies
Basis of accounting
Recognition of revenueRevenue is included in the Statement of total return on the following basis:
Treatment of management expenses
Allocation of revenue and expenses to share classesRevenue is allocated when earned in the proportion of the net asset value of each share class to the total net asset value of the Fund. Expensesincurred solely in respect of a share class are allocated directly to that class. Expenses incurred in respect of, or attributable to, the Fund as a wholeare allocated when incurred in the proportion of the net asset value of each share class to the total net asset value of the Fund.
Revenue from unquoted securities is recognised when it is declared. Interest on bank deposits and other interest is recognised on an accrual basis.
Dividends from Real Estate Investment Trusts ('REITs') are recognised as distributable revenue when the securities are quoted ex-dividend.
With the exception of the UK Equity Income Fund, all management expenses, other than those relating to the purchase and sale of investments andStamp Duty Reserve Tax, for the year have been charged against revenue. Transaction charges are charged to the relevant Fund and are included innote 3 - Net capital gains / (losses) on investments. It is the policy of the UK Equity Income Fund to offset the whole of the ACD's annual fee to capitalin order to determine the distribution. This may increase the amount of revenue available for distribution but may constrain capital growth.
90
HBOS UK Investment Funds ICVCAnnual Report and Financial Statementsfor the year ended 31 January 2014
Notes to the Aggregated and Fund Financial Statements (continued)as at 31 January 2014
1.
i)
j)
k)
Distributions which have remained unclaimed by shareholders for over six years are credited to the capital of the Fund.Income from debt securites will be distributed on an effective yield basis. However, investors in the Corporate Bond Fund should note that distributions from this sub-fund are paid on a coupon basis, unless the effective yield basis generates a higher distribution.
Final distribution - 31 March (all Funds)
The net revenue for share classes B, C and SW1 of the Corporate Bond Fund, share classes C, F, G and SW1 of the UK Equity Income Fund, shareclasses B, C, D and F of the UK FTSE 100 Index Tracking Fund, share class C, F and G of the UK FTSE All-Share Index Tracking Fund and shareclasses B, C, F, G and SW1 of the UK Growth Fund, will be transferred to capital on or before the distribution dates of those Funds.
Revenue accumulates during the distribution period. If, at the end of the accounting year, revenue exceeds expenses, the net revenue of the Fundswill be distributed (or re-invested) at share class level to the shareholders in accordance with the OEIC regulations. If expenses exceed revenue duringthe year, the net revenue shortfall may be funded from capital. Interim distributions will be at the ACD's discretion up to a maximum of the distributablenet revenue available for the interim period.
The distribution dates of the five Funds are as follows:
Provision is made for corporation tax at the current rate on the excess of taxable income over allowable exenses. UK dividend revenue is disclosednet of any related tax credit. Overseas dividends continue to be disclosed gross of any foreign tax suffered, the tax element being separately disclosedin the taxation note.Deferred taxation is provided on all timing differences that have originated but not reversed by the Balance Sheet date other than those differencesregarded as permanent. Any liability to deferred tax is provided at the average rate of tax expected to apply. Deferred tax assets and liabilities are notdiscounted to reflect the time value of money.Deferred tax assets are only recognised to the extent that it is regarded more likely than not that there will be taxable profits against which the reversalof underlying timing differences can be offset.
Basis of valuation of investmentsThe investments of the Company are valued at market value, defined as fair value, as at 12pm UK time on the final business day of the accountingyear. For fair value purposes equity investments are valued at bid, credit default swaps are valued at fair value per the counterparty, contracts fordifferences ('CFDs'), futures and options are valued using market prices. Where applicable, illiquid, unlisted, delisted, unapproved or suspendedsecurities are based on the ACD's assessment of their net realisable value.
Taxation
Investment asset prices are reviewed regularly by the ACD to identify those assets where the price has not moved since the previous review period.This review provides an initial indication that the market for each identified asset may be inactive. These assets are then reviewed by an internalcommittee who may identify an alternative price source for them. On conclusion that a particular asset is illiquid, the ACD will identify an alternativepricing method. The ACD will first identify if an appropriate price can be obtained from a recognised independent broker. Where this is the case, thebroker will be approved as a price source for the asset.
Distribution of net revenue
It is the policy of the following sub-funds to make interest distributions: Corporate Bond Fund. All other sub-funds make dividend distributions.
First quarter distribution - 30 June (Corporate Bond Fund and UK Equity Income Fund)Interim distribution - 30 September (all Funds)Third quarter distribution - 31 December (Corporate Bond Fund and UK Equity Income Fund)
Accounting and distribution policies (continued)
Open Forward Currency Contracts are shown in the Portfolio Statement and are valued using contracted forward rates. The net gains/(losses) arereflected in "Forward currency contracts" in Net capital gains/(losses) on investments.Open Futures Contracts are shown in the Portfolio Statement and are valued using market prices. The net gains/(losses) are reflected in "Derivativecontracts" in Net capital gains/(losses) on investments.
91
HBOS UK Investment Funds ICVCAnnual Report and Financial Statementsfor the year ended 31 January 2014
Notes to the Aggregated and Fund Financial Statements (continued)as at 31 January 2014
2.
As the Funds assets are held with a custodian, these assets are exposed to credit risk. These assets are ringfenced by the custodian. The custodianused by the ACD is subject to regular review.
Credit risk is the risk that one party to a financial instrument will cause a financial loss for the other party by failing to discharge an obligation. Thisincludes counterparty and issuer risk.
In general the Investment Adviser manages the Company's cash to ensure it can meet its liabilities. Where investments cannot be realised in time tomeet any potential liability, the Fund may borrow up to 10% of its value to ensure settlement.
Credit Risk
Certain transactions in securities that the Company enters into expose it to the risk that the counterparty will not deliver the investment for a purchase,or cash for a sale after the Company has fulfilled its responsibilities. The Company only buys and sells investments through brokers which have beenapproved by the ACD as an acceptable counterparty and these are reviewed on an ongoing basis.Assets of the Company may need to be sold if insufficient cash is available to finance redemptions. The Funds hold cash and cash deposits whichpotentially exposes them to counterparty risk. The manager constantly reviews the banks at which cash is deposited.
GeneralIn pursuing their investment objectives, the Funds hold a number of financial instruments. The Company's financial instruments, other than derivatives,comprise securities and other investments, cash balances, debtors and creditors that arise directly from its operations, for example, in respect of salesand purchases awaiting settlement, amounts receivable for share issues and payable for share cancellations and debtors for accrued revenue.
Market risk represents the potential loss the Company might suffer through holding market positions in the face of price movements. The ACDregularly reviews the asset allocation of each portfolio in order to minimise the risk associated with particular sectors whilst continuing to follow theinvestment objectives. The ACD has responsibility for monitoring the existing portfolio selected in accordance with the overall asset allocationparameters described above and seeks to ensure that individual stocks also meet the risk reward profile that is acceptable.
Liquidity RiskLiquidity risk is the risk that an entity will encounter difficulty in meeting obligations associated with its financial liabilities.The Company holds assets comprising mainly readily realisable securities and has no significant unlisted securities so therefore has limited exposureto liquidity risk. The main liability of the Company is the cancellation of shares by shareholders. This risk is minimised by holding readily realisablesecurities and cash to meet the liabilities of the Funds.
The main risks arising from the financial instruments are market price risk, liquidity risk, credit risk, interest rate risk and foreign exchange risk. TheACD's policies for managing these risks are summarised below and have been applied throughout the year.
Market Price RiskMarket price risk, being the risk that the value of the Company's investment holdings will fluctuate as a result of changes in market prices caused byfactors other than interest rate or currency movement, arise mainly from uncertainty about future prices of financial instruments the Company holds.
Derivatives and other financial instruments
92

HBOS UK Investment Funds ICVCAnnual Report and Financial Statementsfor the year ended 31 January 2014
Notes to the Aggregated and Fund Financial Statements (continued)as at 31 January 2014
2.
Corporate Bond Fund31 January 2014EuroUK SterlingUS Dollar31 January 2013EuroUK SterlingUS DollarUK Equity Income Fund31 January 2014UK Sterling31 January 2013UK SterlingUS Dollar
31 January 2014EuroUK Sterling31 January 2013EuroUK SterlingUS Dollar
31 January 2014EuroUK SterlingUS Dollar31 January 2013EuroUK SterlingUS DollarUK Growth Fund31 January 2014EuroUK SterlingUS Dollar31 January 2013EuroUK SterlingUS Dollar
The company has no significant borrowings which are exposed to interest rate risk.
UK FTSE All Share Index Tracking Fund
UK FTSE 100 Index Tracking Fund
- 47,143 (46,857)
(67,276)
286
17,600 269,982 (290,761) (3,179)79,071 2,043,335 357,685 2,480,091
67,848 1,931,012 376,759 2,375,61913,972 238,996 (257,677) (4,709)
933 75767,100
Interest Rate RiskInterest rate risk is the risk that the fair value or future cash flows of a financial instrument will fluctuate because of changes in market interest rates.
Derivatives and other financial instruments (continued)
Fixed ratefinancial assets
Financial assets / (liabilities) not
carrying interest Total£'000£'000£'000£'000
The interest rate risk profile of the Company's financial assets and liabilities as at 31 January was:
Floating ratefinancial assets
The Corporate Bond Fund invests significantly in debt securities. The value of debt securities may be affected by interest rate movements.
1,324 2,419 2,870,442 2,874,185
6,626 9,280 2,925,816 2,941,722256- - 256
- - 104 1043,532 - 1,122,626 1,126,158
3,501 - 1,092,105 1,095,606- - 31 31
- - 62 62
- - 235 2351,419 - 2,232,908 2,234,327
- - 410 410
- - 112 11212,004 - 2,205,213 2,217,217
- - 478 478
8,965 386 5,235,384 5,244,735- - 993 993
- - 542 542
- - 129 1294,151 533 5,738,221 5,742,905
- - 1,332 1,332
93
HBOS UK Investment Funds ICVCAnnual Report and Financial Statementsfor the year ended 31 January 2014
Notes to the Aggregated and Fund Financial Statements (continued)as at 31 January 2014
2.
Fixed Rate Financial Assets
Corporate Bond Fund31 January 2014EuroUK SterlingUS Dollar31 January 2013EuroUK Sterling
Net Foreign Currency Exposures Net Foreign Currency Exposures
MonetaryNon-
Monetary Total MonetaryNon-
Monetary Total£'000 £'000 £'000 £'000 £'000 £'000
Euro (257,489) 252,780 (4,709) (290,565) 287,386 (3,179)US Dollar (66,343) 67,099 756 (46,857) 47,143 286
2a.
With the exception of the Corporate Bond Fund, the Company does not significantly invest in fixed rate securities.
There is no material difference between the value of the financial assets and liabilities, shown in the balance sheet, and their fair value. The mainliability of the Company is its obligation to redeem shares on demand.
Fair value of financial assets and financial liabilities
14.24 years13.98 years
8.17 years
4.00%4.09%4.33%
12.88 years12.58 years
Weighted average period
Derivatives and other financial instruments (continued)
Weighted average
4.32%4.08%
interest rate for which rate is fixed
The Funds may receive revenue in foreign currencies and the Sterling value of this revenue can be affected by movements in exchange rates.Arrangements are in place for the conversion of all revenue receipts into Sterling on the date of receipt.
As most of the assets of the UK Equity Income Fund, UK FTSE All-Share Index Tracking Fund, UK FTSE 100 Index Tracking Fund and UK GrowthFund are Sterling denominated, there is little exposure to foreign exchange risk. However, the Corporate Bond Fund invests significantly in Eurodenominated bonds and, as a result, the capital value of investments and the revenue deriving from them can be significantly affected by currencymovements. The ACD has identified three principal areas where foreign currency risk could impact this Fund, namely where movements in exchangerates affect the sterling value of investments, short-term timing differences and revenue received. It may be subject to short-term exposure toexchange rate movements, for instance where there is a difference between the date an investment purchase or sale is entered into and the date therequisite foreign exchange transaction occurs. When the scheme enters into such a transaction, which will involve the buying or selling of foreigncurrency in order to complete, the ACD will instigate the necessary foreign exchange transactions in order to minimise exchange rate risk.
The Company may enter into derivative transactions in the form of investment in warrants, options, currency forwards and stock index futures. Thepurpose of these financial instruments is efficient portfolio management. In particular, stock index futures are used both to implement the investmentpolicy in a timely manner and to manage market price risk arising from the time lag between funds being receivable or payable by the Company andinvestment or disinvestment in underlying securities. Currently, the UK FTSE 100 Index Tracking Fund, the UK FTSE All-Share Index Tracking Fundand the UK Growth Fund invest in stock index futures for this purpose. The use of stock index futures is not significant and any movement in assetvalue would be in line with the securities held by these funds.
The Company has no material amounts of non-interest bearing assets, other than equities, which do not have maturity dates.
Foreign Exchange Risk
31 January 2014 31 January 2013Corporate Bond Fund
94
HBOS UK Investment Funds ICVCAnnual Report and Financial Statementsfor the year ended 31 January 2014
Notes to the Aggregated and Fund Financial Statements (continued)as at 31 January 2014
3. Net capital gains/(losses) on investments
The net gains/(losses) on investments during the year comprise:
TotalCorporate Bond
FundUK Equity
Income Fund
UK FTSE 100 Index Tracking
Fund
UK FTSE All Share Index
Tracking Fund UK Growth Fund 31 January 2014 £'000 £'000 £'000 £'000 £'000 £'000
Non-derivative securities 725,951 (5,132) 211,955 27,246 118,892 372,990 -Derivative contracts 17,713 4,928 3,514 1,843 4,457 2,971 -Forward currency contracts 14,863 14,863 - - - - -Transaction fees (23) (5) (2) - (3) (13) -Currency gains 502 416 2 17 1 66 -
Net capital gains/(losses) on investments 759,006 15,070 215,469 29,106 123,347 376,014 -
TotalCorporate Bond
FundUK Equity
Income Fund
UK FTSE 100 Index Tracking
Fund
UK FTSE All Share Index
Tracking Fund UK Growth Fund 31 January 2013 £'000 £'000 £'000 £'000 £'000 £'000
Non-derivative securities 1,288,542 174,569 228,607 96,989 211,682 576,695 -Derivative contracts 27,151 (3,539) 6,410 4,142 2,536 17,602 -Forward currency contracts (6,296) (6,296) - - - - -Transaction fees 14 3 (1) - 7 5 -Currency gains/(losses) (498) (439) - 4 1 (64) -
Net capital gains/(losses) on investments 1,308,913 164,298 235,016 101,135 214,226 594,238 -
95
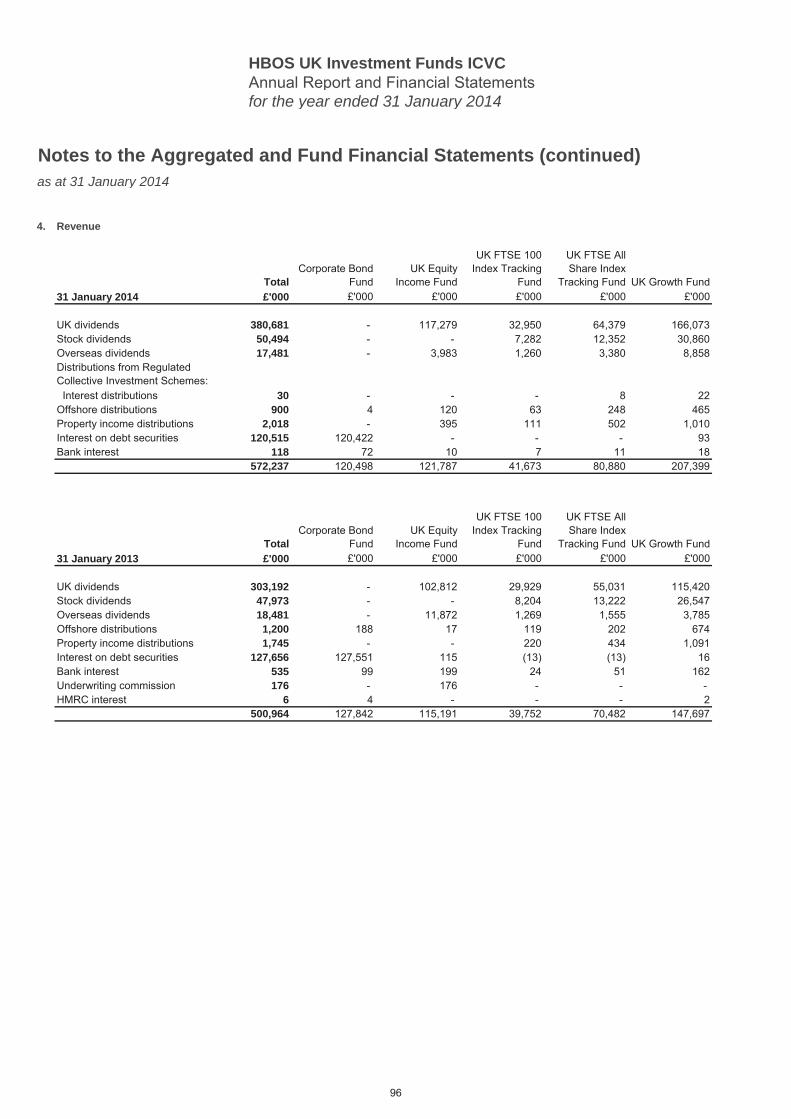
HBOS UK Investment Funds ICVCAnnual Report and Financial Statementsfor the year ended 31 January 2014
Notes to the Aggregated and Fund Financial Statements (continued)as at 31 January 2014
4. Revenue
TotalCorporate Bond
FundUK Equity
Income Fund
UK FTSE 100 Index Tracking
Fund
UK FTSE All Share Index
Tracking Fund UK Growth Fund 31 January 2014 £'000 £'000 £'000 £'000 £'000 £'000
UK dividends 380,681 - 117,279 32,950 64,379 166,073 -Stock dividends 50,494 - - 7,282 12,352 30,860 -Overseas dividends 17,481 - 3,983 1,260 3,380 8,858 -Distributions from Regulated Collective Investment Schemes: - - - - - - - Interest distributions 30 - - - 8 22 -Offshore distributions 900 4 120 63 248 465 -Property income distributions 2,018 - 395 111 502 1,010 -Interest on debt securities 120,515 120,422 - - - 93 -Bank interest 118 72 10 7 11 18 -
572,237 120,498 121,787 41,673 80,880 207,399 -
TotalCorporate Bond
FundUK Equity
Income Fund
UK FTSE 100 Index Tracking
Fund
UK FTSE All Share Index
Tracking Fund UK Growth Fund 31 January 2013 £'000 £'000 £'000 £'000 £'000 £'000
UK dividends 303,192 - 102,812 29,929 55,031 115,420 -Stock dividends 47,973 - - 8,204 13,222 26,547 -Overseas dividends 18,481 - 11,872 1,269 1,555 3,785 -Offshore distributions 1,200 188 17 119 202 674 -Property income distributions 1,745 - - 220 434 1,091 -Interest on debt securities 127,656 127,551 115 (13) (13) 16 -Bank interest 535 99 199 24 51 162 -Underwriting commission 176 - 176 - - - -HMRC interest 6 4 - - - 2 -
500,964 127,842 115,191 39,752 70,482 147,697 -
96
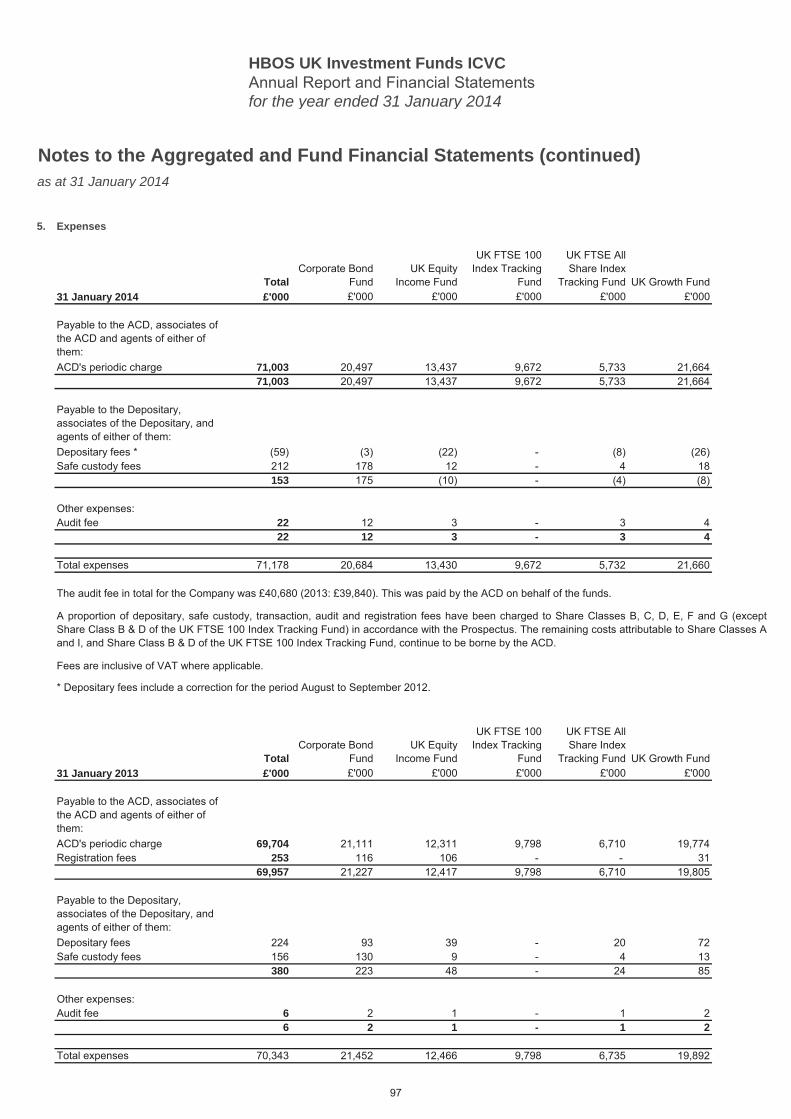
HBOS UK Investment Funds ICVCAnnual Report and Financial Statementsfor the year ended 31 January 2014
Notes to the Aggregated and Fund Financial Statements (continued)as at 31 January 2014
5. Expenses
TotalCorporate Bond
FundUK Equity
Income Fund
UK FTSE 100 Index Tracking
Fund
UK FTSE All Share Index
Tracking Fund UK Growth Fund 31 January 2014 £'000 £'000 £'000 £'000 £'000 £'000
Payable to the ACD, associates of the ACD and agents of either of them:ACD's periodic charge 71,003 20,497 13,437 9,672 5,733 21,664 -
71,003 20,497 13,437 9,672 5,733 21,664 -
Payable to the Depositary, associates of the Depositary, and agents of either of them:Depositary fees * (59) (3) (22) - (8) (26) -Safe custody fees 212 178 12 - 4 18 -
153 175 (10) - (4) (8) -
Other expenses:Audit fee 22 12 3 - 3 4 -
22 12 3 - 3 4 -
Total expenses 71,178 20,684 13,430 9,672 5,732 21,660 -
TotalCorporate Bond
FundUK Equity
Income Fund
UK FTSE 100 Index Tracking
Fund
UK FTSE All Share Index
Tracking Fund UK Growth Fund 31 January 2013 £'000 £'000 £'000 £'000 £'000 £'000
Payable to the ACD, associates of the ACD and agents of either of them:ACD's periodic charge 69,704 21,111 12,311 9,798 6,710 19,774 -Registration fees 253 116 106 - - 31 -
69,957 21,227 12,417 9,798 6,710 19,805 -
Payable to the Depositary, associates of the Depositary, and agents of either of them:Depositary fees 224 93 39 - 20 72 -Safe custody fees 156 130 9 - 4 13 -
380 223 48 - 24 85 -
Other expenses:Audit fee 6 2 1 - 1 2 -
6 2 1 - 1 2 -
Total expenses 70,343 21,452 12,466 9,798 6,735 19,892 -
A proportion of depositary, safe custody, transaction, audit and registration fees have been charged to Share Classes B, C, D, E, F and G (exceptShare Class B & D of the UK FTSE 100 Index Tracking Fund) in accordance with the Prospectus. The remaining costs attributable to Share Classes Aand I, and Share Class B & D of the UK FTSE 100 Index Tracking Fund, continue to be borne by the ACD.
The audit fee in total for the Company was £40,680 (2013: £39,840). This was paid by the ACD on behalf of the funds.
* Depositary fees include a correction for the period August to September 2012.
Fees are inclusive of VAT where applicable.
97
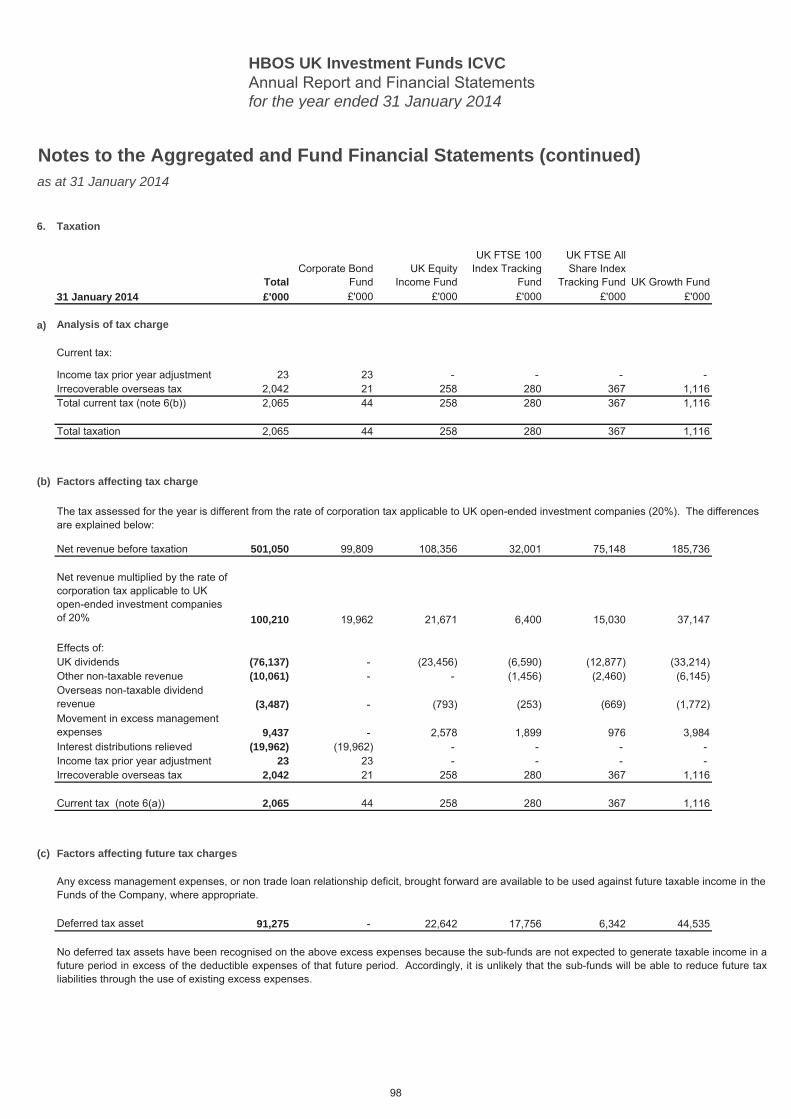
HBOS UK Investment Funds ICVCAnnual Report and Financial Statementsfor the year ended 31 January 2014
Notes to the Aggregated and Fund Financial Statements (continued)as at 31 January 2014
6. Taxation
TotalCorporate Bond
FundUK Equity
Income Fund
UK FTSE 100 Index Tracking
Fund
UK FTSE All Share Index
Tracking Fund UK Growth Fund 31 January 2014 £'000 £'000 £'000 £'000 £'000 £'000
a) Analysis of tax charge
Current tax:
Income tax prior year adjustment 23 23 - - - - -Irrecoverable overseas tax 2,042 21 258 280 367 1,116 -Total current tax (note 6(b)) 2,065 44 258 280 367 1,116 -
Total taxation 2,065 44 258 280 367 1,116 -
(b) Factors affecting tax charge
Net revenue before taxation 501,050 99,809 108,356 32,001 75,148 185,736 -
Net revenue multiplied by the rate of corporation tax applicable to UK open-ended investment companies of 20% 100,210 19,962 21,671 6,400 15,030 37,147 -
Effects of:UK dividends (76,137) - (23,456) (6,590) (12,877) (33,214) -Other non-taxable revenue (10,061) - - (1,456) (2,460) (6,145) -Overseas non-taxable dividend revenue (3,487) - (793) (253) (669) (1,772) -Movement in excess management expenses 9,437 - 2,578 1,899 976 3,984 -Interest distributions relieved (19,962) (19,962) - - - - -Income tax prior year adjustment 23 23 - - - - -Irrecoverable overseas tax 2,042 21 258 280 367 1,116 -
Current tax (note 6(a)) 2,065 44 258 280 367 1,116 -
(c) Factors affecting future tax charges
Deferred tax asset 91,275 - 22,642 17,756 6,342 44,535 -
No deferred tax assets have been recognised on the above excess expenses because the sub-funds are not expected to generate taxable income in afuture period in excess of the deductible expenses of that future period. Accordingly, it is unlikely that the sub-funds will be able to reduce future taxliabilities through the use of existing excess expenses.
Any excess management expenses, or non trade loan relationship deficit, brought forward are available to be used against future taxable income in the Funds of the Company, where appropriate.
The tax assessed for the year is different from the rate of corporation tax applicable to UK open-ended investment companies (20%). The differences are explained below:
98
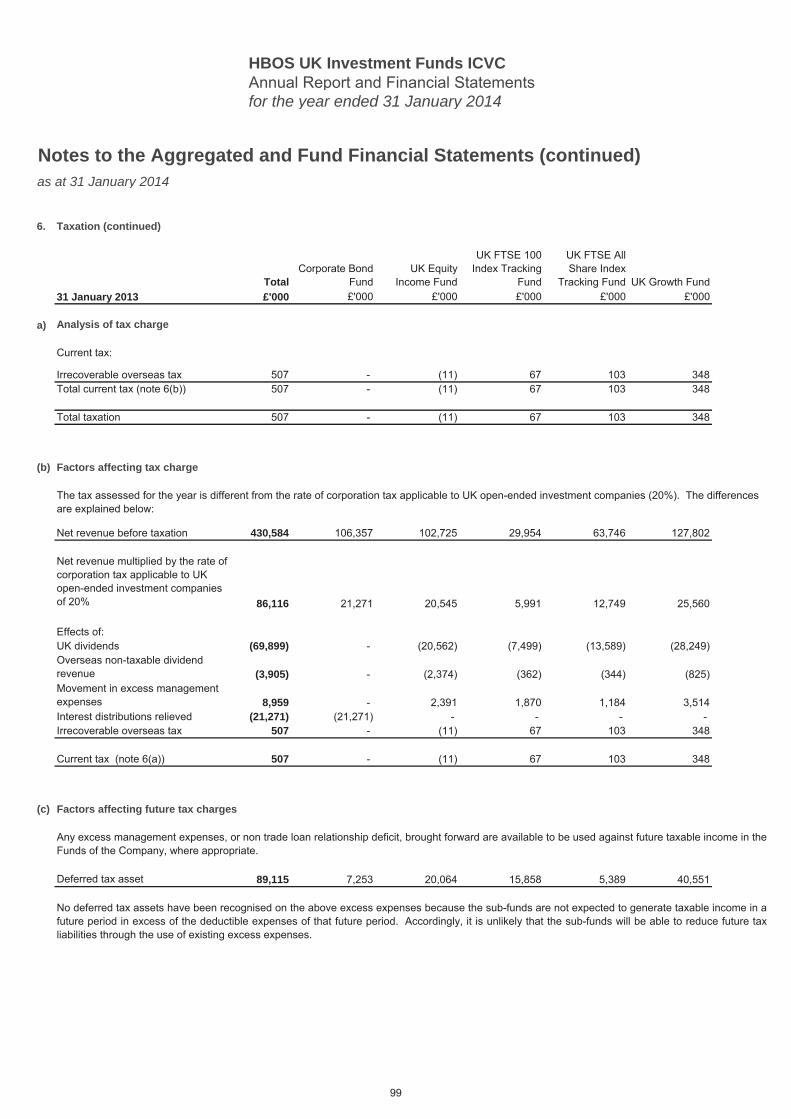
HBOS UK Investment Funds ICVCAnnual Report and Financial Statementsfor the year ended 31 January 2014
Notes to the Aggregated and Fund Financial Statements (continued)as at 31 January 2014
6. Taxation (continued)
TotalCorporate Bond
FundUK Equity
Income Fund
UK FTSE 100 Index Tracking
Fund
UK FTSE All Share Index
Tracking Fund UK Growth Fund 31 January 2013 £'000 £'000 £'000 £'000 £'000 £'000
a) Analysis of tax charge
Current tax:
Irrecoverable overseas tax 507 - (11) 67 103 348 -Total current tax (note 6(b)) 507 - (11) 67 103 348 -
Total taxation 507 - (11) 67 103 348 -
(b) Factors affecting tax charge
Net revenue before taxation 430,584 106,357 102,725 29,954 63,746 127,802 -
Net revenue multiplied by the rate of corporation tax applicable to UK open-ended investment companies of 20% 86,116 21,271 20,545 5,991 12,749 25,560 -
Effects of:UK dividends (69,899) - (20,562) (7,499) (13,589) (28,249) -Overseas non-taxable dividend revenue (3,905) - (2,374) (362) (344) (825) -Movement in excess management expenses 8,959 - 2,391 1,870 1,184 3,514 -Interest distributions relieved (21,271) (21,271) - - - - -Irrecoverable overseas tax 507 - (11) 67 103 348 -
Current tax (note 6(a)) 507 - (11) 67 103 348 -
(c) Factors affecting future tax charges
Deferred tax asset 89,115 7,253 20,064 15,858 5,389 40,551 -
Any excess management expenses, or non trade loan relationship deficit, brought forward are available to be used against future taxable income in theFunds of the Company, where appropriate.
No deferred tax assets have been recognised on the above excess expenses because the sub-funds are not expected to generate taxable income in afuture period in excess of the deductible expenses of that future period. Accordingly, it is unlikely that the sub-funds will be able to reduce future taxliabilities through the use of existing excess expenses.
The tax assessed for the year is different from the rate of corporation tax applicable to UK open-ended investment companies (20%). The differences are explained below:
99
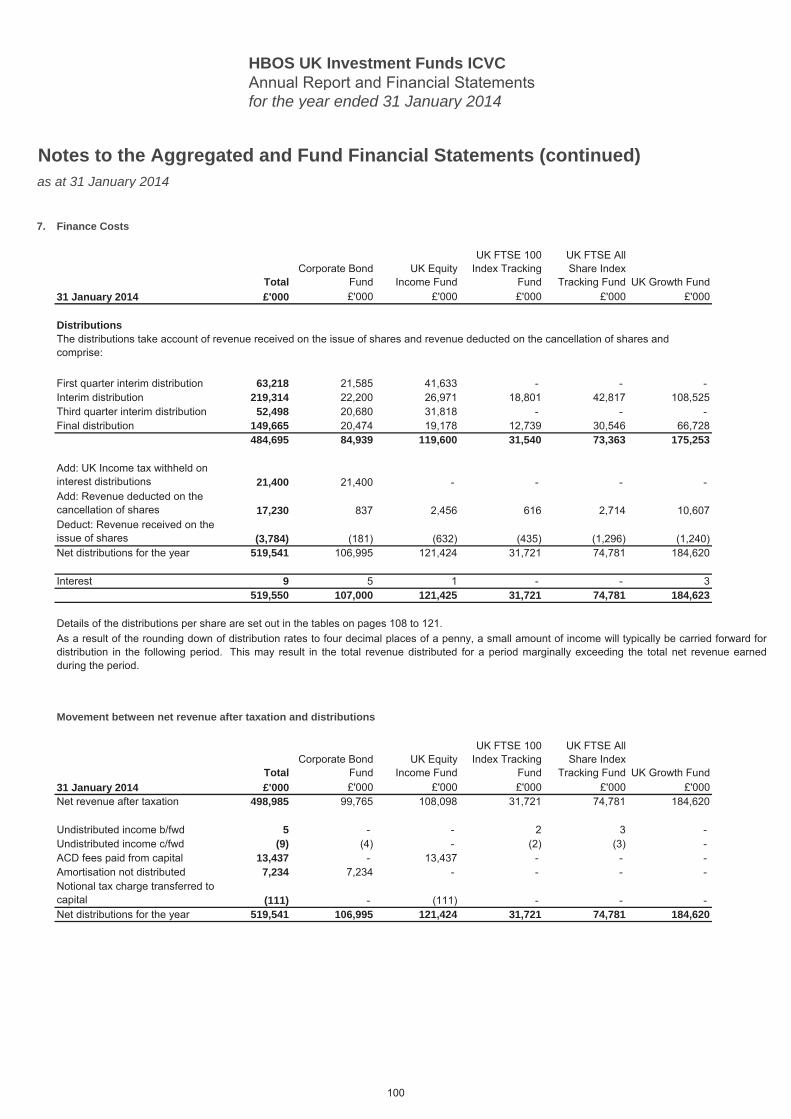
HBOS UK Investment Funds ICVCAnnual Report and Financial Statementsfor the year ended 31 January 2014
Notes to the Aggregated and Fund Financial Statements (continued)as at 31 January 2014
7. Finance Costs
TotalCorporate Bond
FundUK Equity
Income Fund
UK FTSE 100 Index Tracking
Fund
UK FTSE All Share Index
Tracking Fund UK Growth Fund 31 January 2014 £'000 £'000 £'000 £'000 £'000 £'000
Distributions
First quarter interim distribution 63,218 21,585 41,633 - - - -Interim distribution 219,314 22,200 26,971 18,801 42,817 108,525 -Third quarter interim distribution 52,498 20,680 31,818 - - - -Final distribution 149,665 20,474 19,178 12,739 30,546 66,728 -
484,695 84,939 119,600 31,540 73,363 175,253 -
Add: UK Income tax withheld on interest distributions 21,400 21,400 - - - - -Add: Revenue deducted on the cancellation of shares 17,230 837 2,456 616 2,714 10,607 -Deduct: Revenue received on the issue of shares (3,784) (181) (632) (435) (1,296) (1,240) -Net distributions for the year 519,541 106,995 121,424 31,721 74,781 184,620 -
Interest 9 5 1 - - 3 -519,550 107,000 121,425 31,721 74,781 184,623 -
Movement between net revenue after taxation and distributions
TotalCorporate Bond
FundUK Equity
Income Fund
UK FTSE 100 Index Tracking
Fund
UK FTSE All Share Index
Tracking Fund UK Growth Fund 31 January 2014 £'000 £'000 £'000 £'000 £'000 £'000Net revenue after taxation 498,985 99,765 108,098 31,721 74,781 184,620 -
Undistributed income b/fwd 5 - - 2 3 - -Undistributed income c/fwd (9) (4) - (2) (3) - -ACD fees paid from capital 13,437 - 13,437 - - - -Amortisation not distributed 7,234 7,234 - - - - -Notional tax charge transferred to capital (111) - (111) - - - -Net distributions for the year 519,541 106,995 121,424 31,721 74,781 184,620 -
The distributions take account of revenue received on the issue of shares and revenue deducted on the cancellation of shares and comprise:
Details of the distributions per share are set out in the tables on pages 108 to 121.As a result of the rounding down of distribution rates to four decimal places of a penny, a small amount of income will typically be carried forward fordistribution in the following period. This may result in the total revenue distributed for a period marginally exceeding the total net revenue earnedduring the period.
100
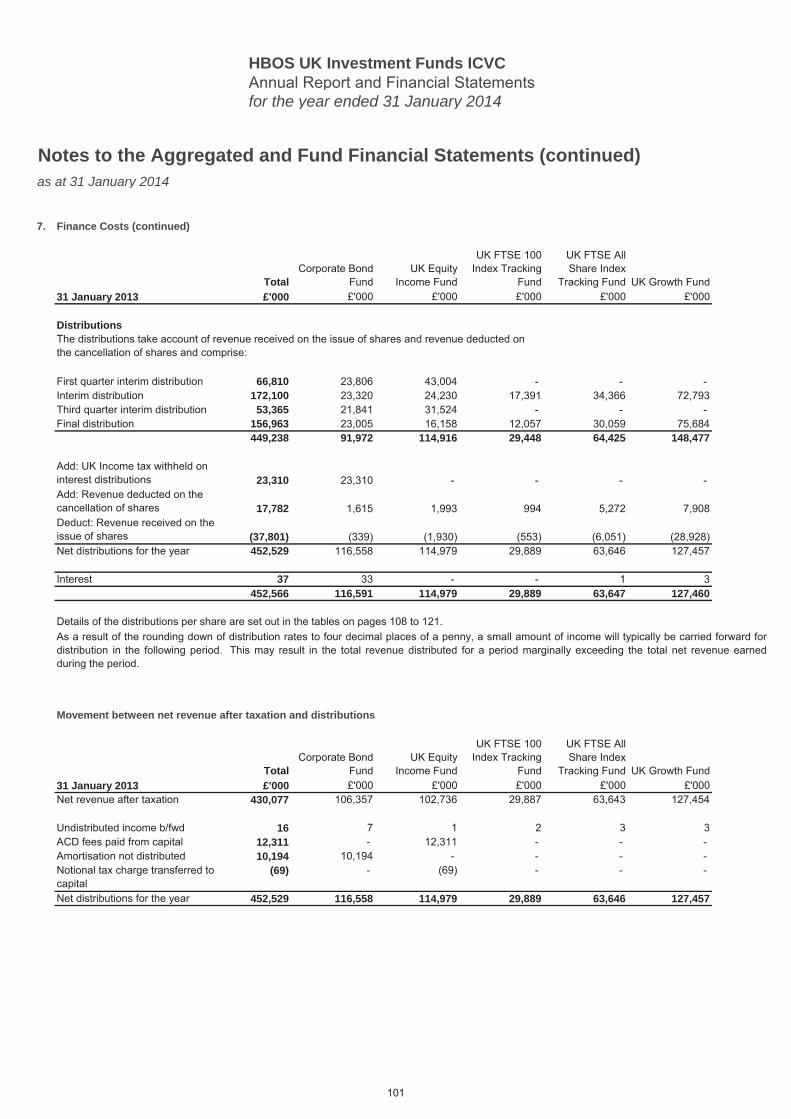
HBOS UK Investment Funds ICVCAnnual Report and Financial Statementsfor the year ended 31 January 2014
Notes to the Aggregated and Fund Financial Statements (continued)as at 31 January 2014
7. Finance Costs (continued)
TotalCorporate Bond
FundUK Equity
Income Fund
UK FTSE 100 Index Tracking
Fund
UK FTSE All Share Index
Tracking Fund UK Growth Fund 31 January 2013 £'000 £'000 £'000 £'000 £'000 £'000
Distributions
First quarter interim distribution 66,810 23,806 43,004 - - - -Interim distribution 172,100 23,320 24,230 17,391 34,366 72,793 -Third quarter interim distribution 53,365 21,841 31,524 - - - -Final distribution 156,963 23,005 16,158 12,057 30,059 75,684 -
449,238 91,972 114,916 29,448 64,425 148,477
Add: UK Income tax withheld on interest distributions 23,310 23,310 - - - - -Add: Revenue deducted on the cancellation of shares 17,782 1,615 1,993 994 5,272 7,908 -Deduct: Revenue received on the issue of shares (37,801) (339) (1,930) (553) (6,051) (28,928) -Net distributions for the year 452,529 116,558 114,979 29,889 63,646 127,457 -
Interest 37 33 - - 1 3 -452,566 116,591 114,979 29,889 63,647 127,460 -
Movement between net revenue after taxation and distributions
TotalCorporate Bond
FundUK Equity
Income Fund
UK FTSE 100 Index Tracking
Fund
UK FTSE All Share Index
Tracking Fund UK Growth Fund 31 January 2013 £'000 £'000 £'000 £'000 £'000 £'000Net revenue after taxation 430,077 106,357 102,736 29,887 63,643 127,454 -
Undistributed income b/fwd 16 7 1 2 3 3 -ACD fees paid from capital 12,311 - 12,311 - - - -Amortisation not distributed 10,194 10,194 - - - - -Notional tax charge transferred to capital
(69) - (69) - - - -
Net distributions for the year 452,529 116,558 114,979 29,889 63,646 127,457 -
As a result of the rounding down of distribution rates to four decimal places of a penny, a small amount of income will typically be carried forward fordistribution in the following period. This may result in the total revenue distributed for a period marginally exceeding the total net revenue earnedduring the period.
The distributions take account of revenue received on the issue of shares and revenue deducted on the cancellation of shares and comprise:
Details of the distributions per share are set out in the tables on pages 108 to 121.
101
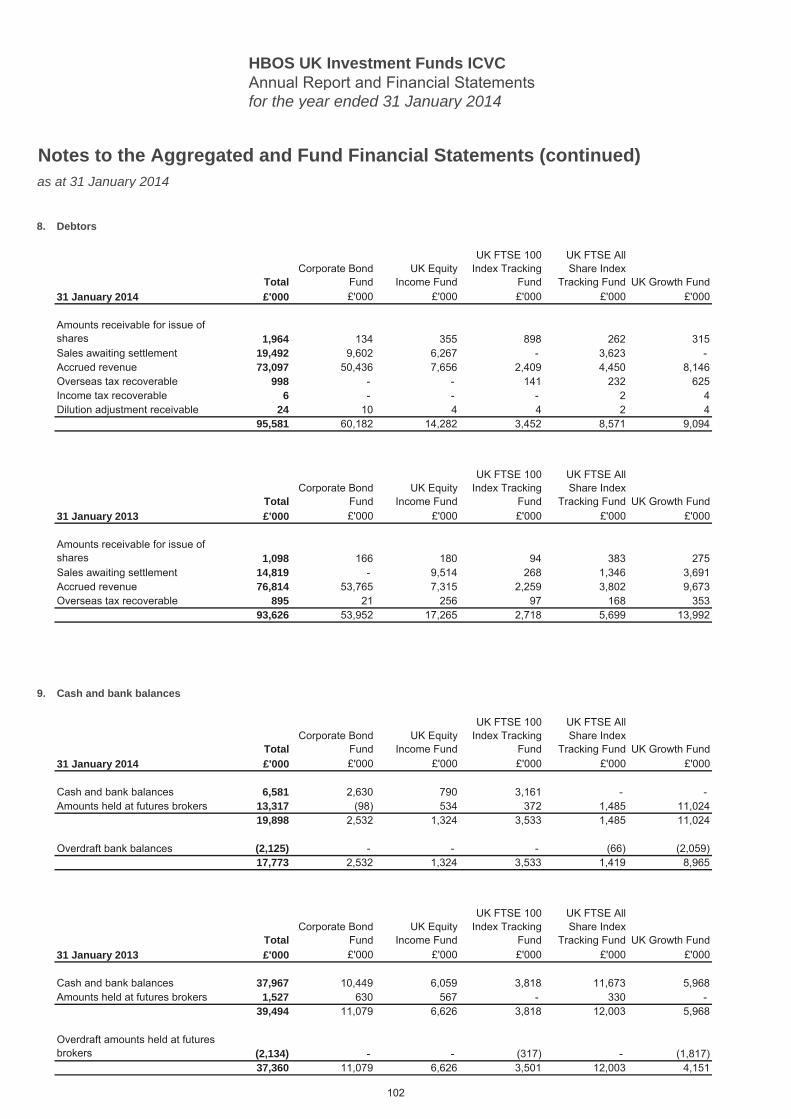
HBOS UK Investment Funds ICVCAnnual Report and Financial Statementsfor the year ended 31 January 2014
Notes to the Aggregated and Fund Financial Statements (continued)as at 31 January 2014
8. Debtors
TotalCorporate Bond
FundUK Equity
Income Fund
UK FTSE 100 Index Tracking
Fund
UK FTSE All Share Index
Tracking Fund UK Growth Fund 31 January 2014 £'000 £'000 £'000 £'000 £'000 £'000
Amounts receivable for issue of shares 1,964 134 355 898 262 315 -Sales awaiting settlement 19,492 9,602 6,267 - 3,623 - -Accrued revenue 73,097 50,436 7,656 2,409 4,450 8,146 -Overseas tax recoverable 998 - - 141 232 625 -Income tax recoverable 6 - - - 2 4 -Dilution adjustment receivable 24 10 4 4 2 4 -
95,581 60,182 14,282 3,452 8,571 9,094 -
TotalCorporate Bond
FundUK Equity
Income Fund
UK FTSE 100 Index Tracking
Fund
UK FTSE All Share Index
Tracking Fund UK Growth Fund 31 January 2013 £'000 £'000 £'000 £'000 £'000 £'000
Amounts receivable for issue of shares 1,098 166 180 94 383 275 -Sales awaiting settlement 14,819 - 9,514 268 1,346 3,691 -Accrued revenue 76,814 53,765 7,315 2,259 3,802 9,673 -Overseas tax recoverable 895 21 256 97 168 353 -
93,626 53,952 17,265 2,718 5,699 13,992 -
9. Cash and bank balances
TotalCorporate Bond
FundUK Equity
Income Fund
UK FTSE 100 Index Tracking
Fund
UK FTSE All Share Index
Tracking Fund UK Growth Fund 31 January 2014 £'000 £'000 £'000 £'000 £'000 £'000
Cash and bank balances 6,581 2,630 790 3,161 - - -Amounts held at futures brokers 13,317 (98) 534 372 1,485 11,024 -
19,898 2,532 1,324 3,533 1,485 11,024 -
Overdraft bank balances (2,125) - - - (66) (2,059) -17,773 2,532 1,324 3,533 1,419 8,965 -
TotalCorporate Bond
FundUK Equity
Income Fund
UK FTSE 100 Index Tracking
Fund
UK FTSE All Share Index
Tracking Fund UK Growth Fund 31 January 2013 £'000 £'000 £'000 £'000 £'000 £'000
Cash and bank balances 37,967 10,449 6,059 3,818 11,673 5,968 -Amounts held at futures brokers 1,527 630 567 - 330 - -
39,494 11,079 6,626 3,818 12,003 5,968 -
Overdraft amounts held at futures brokers (2,134) - - (317) - (1,817) -
37,360 11,079 6,626 3,501 12,003 4,151 -
102
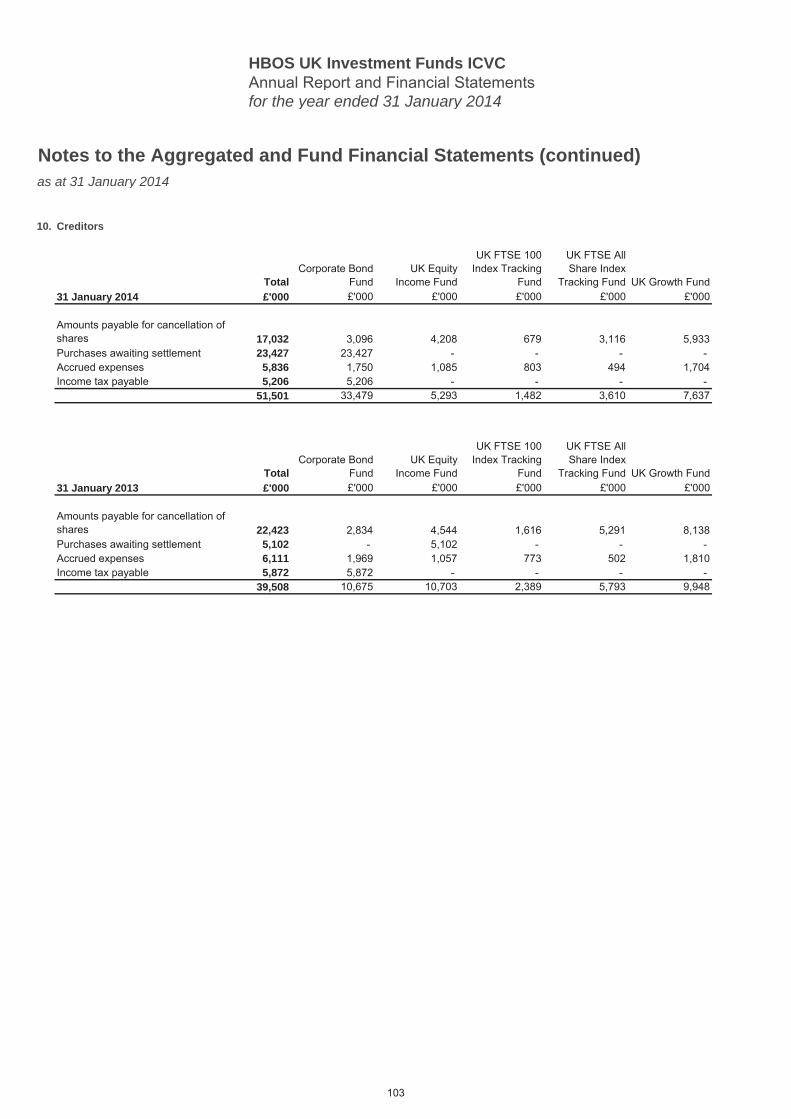
HBOS UK Investment Funds ICVCAnnual Report and Financial Statementsfor the year ended 31 January 2014
Notes to the Aggregated and Fund Financial Statements (continued)as at 31 January 2014
10. Creditors
TotalCorporate Bond
FundUK Equity
Income Fund
UK FTSE 100 Index Tracking
Fund
UK FTSE All Share Index
Tracking Fund UK Growth Fund 31 January 2014 £'000 £'000 £'000 £'000 £'000 £'000
Amounts payable for cancellation of shares 17,032 3,096 4,208 679 3,116 5,933 -Purchases awaiting settlement 23,427 23,427 - - - - -Accrued expenses 5,836 1,750 1,085 803 494 1,704 -Income tax payable 5,206 5,206 - - - - -
51,501 33,479 5,293 1,482 3,610 7,637 -
TotalCorporate Bond
FundUK Equity
Income Fund
UK FTSE 100 Index Tracking
Fund
UK FTSE All Share Index
Tracking Fund UK Growth Fund 31 January 2013 £'000 £'000 £'000 £'000 £'000 £'000
Amounts payable for cancellation of shares 22,423 2,834 4,544 1,616 5,291 8,138 -Purchases awaiting settlement 5,102 - 5,102 - - - -Accrued expenses 6,111 1,969 1,057 773 502 1,810 -Income tax payable 5,872 5,872 - - - - -
39,508 10,675 10,703 2,389 5,793 9,948 -
103
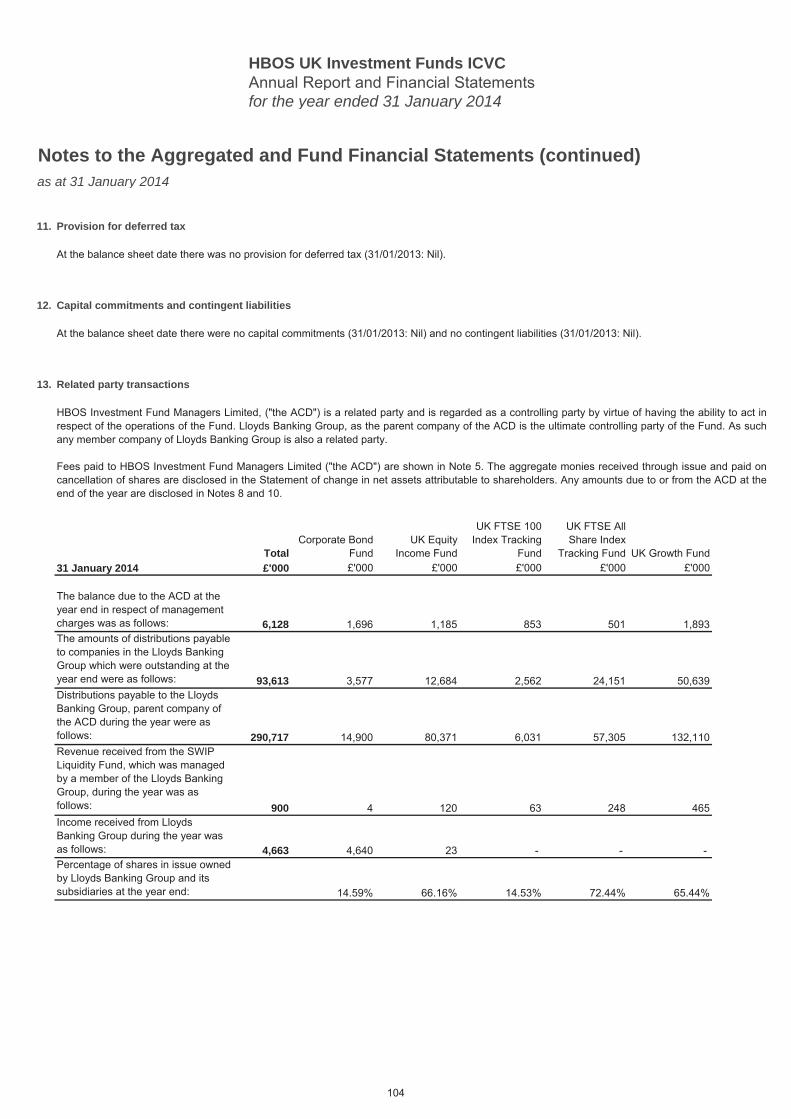
HBOS UK Investment Funds ICVCAnnual Report and Financial Statementsfor the year ended 31 January 2014
Notes to the Aggregated and Fund Financial Statements (continued)as at 31 January 2014
11. Provision for deferred tax
12. Capital commitments and contingent liabilities
13. Related party transactions
TotalCorporate Bond
FundUK Equity
Income Fund
UK FTSE 100 Index Tracking
Fund
UK FTSE All Share Index
Tracking Fund UK Growth Fund 31 January 2014 £'000 £'000 £'000 £'000 £'000 £'000
The balance due to the ACD at the year end in respect of management charges was as follows: 6,128 1,696 1,185 853 501 1,893 -The amounts of distributions payable to companies in the Lloyds Banking Group which were outstanding at the year end were as follows: 93,613 3,577 12,684 2,562 24,151 50,639 -Distributions payable to the Lloyds Banking Group, parent company of the ACD during the year were as follows: 290,717 14,900 80,371 6,031 57,305 132,110 -Revenue received from the SWIP Liquidity Fund, which was managed by a member of the Lloyds Banking Group, during the year was as follows: 900 4 120 63 248 465 -Income received from Lloyds Banking Group during the year was as follows: 4,663 4,640 23 - - - -Percentage of shares in issue owned by Lloyds Banking Group and its subsidiaries at the year end: 14.59% 66.16% 14.53% 72.44% 65.44% -
At the balance sheet date there was no provision for deferred tax (31/01/2013: Nil).
At the balance sheet date there were no capital commitments (31/01/2013: Nil) and no contingent liabilities (31/01/2013: Nil).
HBOS Investment Fund Managers Limited, ("the ACD") is a related party and is regarded as a controlling party by virtue of having the ability to act inrespect of the operations of the Fund. Lloyds Banking Group, as the parent company of the ACD is the ultimate controlling party of the Fund. As suchany member company of Lloyds Banking Group is also a related party.
Fees paid to HBOS Investment Fund Managers Limited ("the ACD") are shown in Note 5. The aggregate monies received through issue and paid oncancellation of shares are disclosed in the Statement of change in net assets attributable to shareholders. Any amounts due to or from the ACD at theend of the year are disclosed in Notes 8 and 10.
104
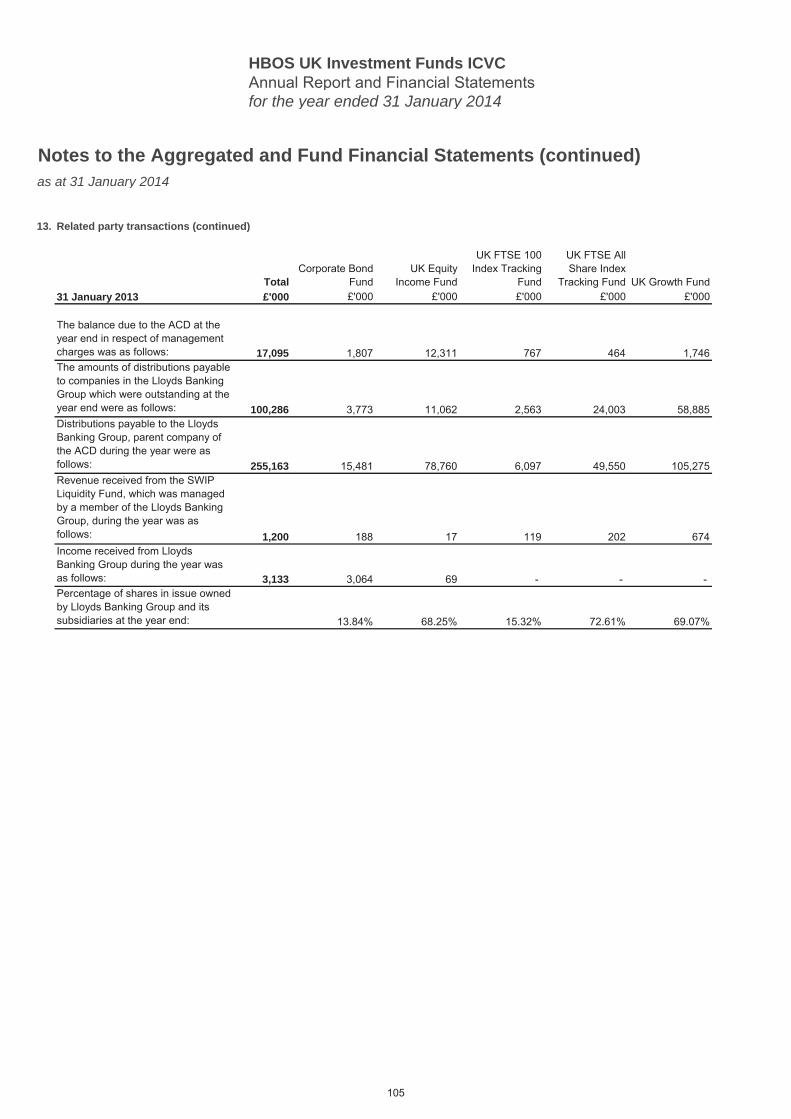
HBOS UK Investment Funds ICVCAnnual Report and Financial Statementsfor the year ended 31 January 2014
Notes to the Aggregated and Fund Financial Statements (continued)as at 31 January 2014
13. Related party transactions (continued)
TotalCorporate Bond
FundUK Equity
Income Fund
UK FTSE 100 Index Tracking
Fund
UK FTSE All Share Index
Tracking Fund UK Growth Fund 31 January 2013 £'000 £'000 £'000 £'000 £'000 £'000
The balance due to the ACD at the year end in respect of management charges was as follows: 17,095 1,807 12,311 767 464 1,746 -The amounts of distributions payable to companies in the Lloyds Banking Group which were outstanding at the year end were as follows: 100,286 3,773 11,062 2,563 24,003 58,885 -Distributions payable to the Lloyds Banking Group, parent company of the ACD during the year were as follows: 255,163 15,481 78,760 6,097 49,550 105,275 -Revenue received from the SWIP Liquidity Fund, which was managed by a member of the Lloyds Banking Group, during the year was as follows: 1,200 188 17 119 202 674 -Income received from Lloyds Banking Group during the year was as follows: 3,133 3,064 69 - - - -Percentage of shares in issue owned by Lloyds Banking Group and its subsidiaries at the year end: 13.84% 68.25% 15.32% 72.61% 69.07% -
105
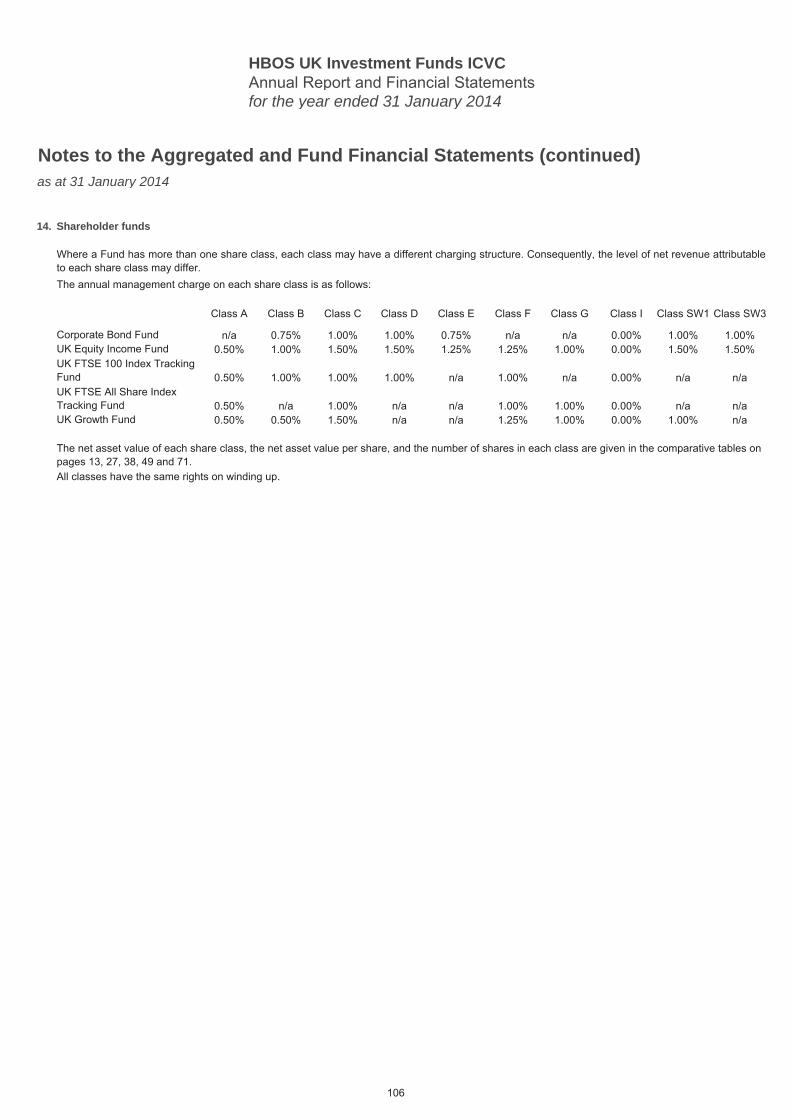
HBOS UK Investment Funds ICVCAnnual Report and Financial Statementsfor the year ended 31 January 2014
Notes to the Aggregated and Fund Financial Statements (continued)as at 31 January 2014
14. Shareholder funds
Class A Class B Class C Class D Class E Class F Class G Class I Class SW1 Class SW3
Corporate Bond Fund n/a 0.75% 1.00% 1.00% 0.75% n/a n/a 0.00% 1.00% 1.00%UK Equity Income Fund 0.50% 1.00% 1.50% 1.50% 1.25% 1.25% 1.00% 0.00% 1.50% 1.50%UK FTSE 100 Index Tracking Fund 0.50% 1.00% 1.00% 1.00% n/a 1.00% n/a 0.00% n/a n/aUK FTSE All Share Index Tracking Fund 0.50% n/a 1.00% n/a n/a 1.00% 1.00% 0.00% n/a n/aUK Growth Fund 0.50% 0.50% 1.50% n/a n/a 1.25% 1.00% 0.00% 1.00% n/a
All classes have the same rights on winding up.
Where a Fund has more than one share class, each class may have a different charging structure. Consequently, the level of net revenue attributableto each share class may differ.The annual management charge on each share class is as follows:
The net asset value of each share class, the net asset value per share, and the number of shares in each class are given in the comparative tables on pages 13, 27, 38, 49 and 71.
106
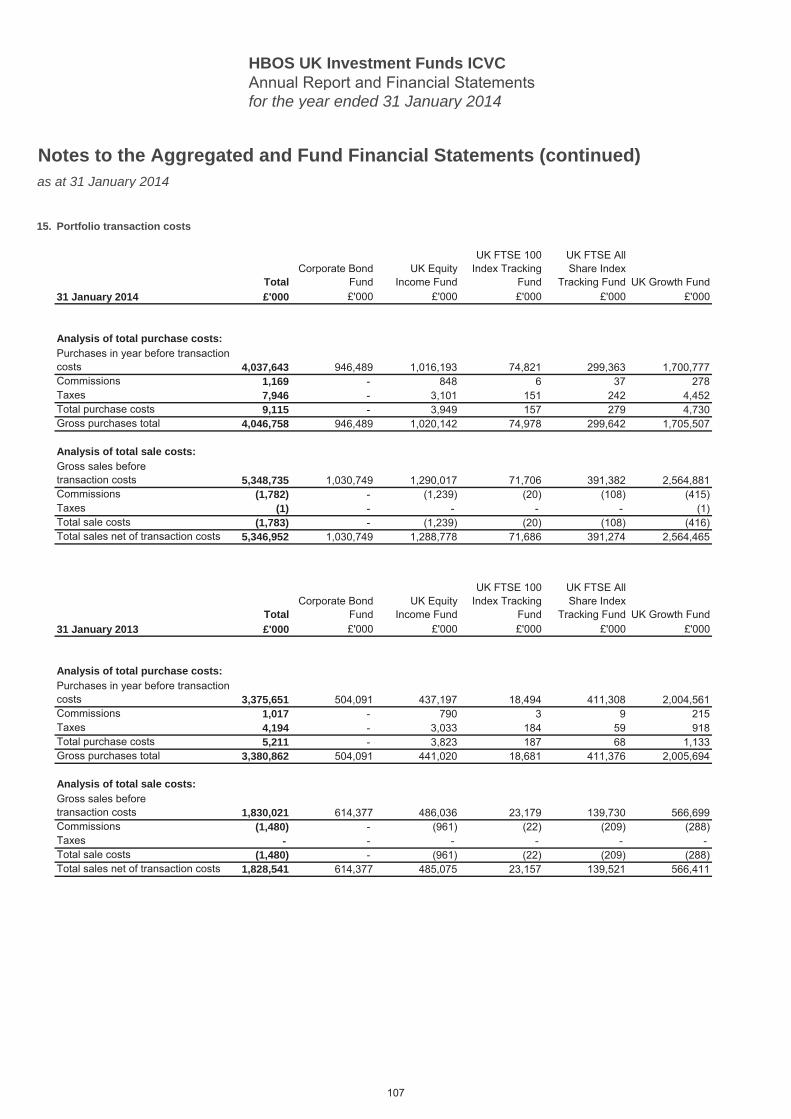
HBOS UK Investment Funds ICVCAnnual Report and Financial Statementsfor the year ended 31 January 2014
Notes to the Aggregated and Fund Financial Statements (continued)as at 31 January 2014
15. Portfolio transaction costs
TotalCorporate Bond
FundUK Equity
Income Fund
UK FTSE 100 Index Tracking
Fund
UK FTSE All Share Index
Tracking Fund UK Growth Fund 31 January 2014 £'000 £'000 £'000 £'000 £'000 £'000
Analysis of total purchase costs:Purchases in year before transaction costs 4,037,643 946,489 1,016,193 74,821 299,363 1,700,777 -Commissions 1,169 - 848 6 37 278 -Taxes 7,946 - 3,101 151 242 4,452 -Total purchase costs 9,115 - 3,949 157 279 4,730 -Gross purchases total 4,046,758 946,489 1,020,142 74,978 299,642 1,705,507 -
Analysis of total sale costs:Gross sales before transaction costs 5,348,735 1,030,749 1,290,017 71,706 391,382 2,564,881 -Commissions (1,782) - (1,239) (20) (108) (415) -Taxes (1) - - - - (1) -Total sale costs (1,783) - (1,239) (20) (108) (416) -Total sales net of transaction costs 5,346,952 1,030,749 1,288,778 71,686 391,274 2,564,465 -
TotalCorporate Bond
FundUK Equity
Income Fund
UK FTSE 100 Index Tracking
Fund
UK FTSE All Share Index
Tracking Fund UK Growth Fund 31 January 2013 £'000 £'000 £'000 £'000 £'000 £'000
Analysis of total purchase costs:Purchases in year before transaction costs 3,375,651 504,091 437,197 18,494 411,308 2,004,561 -Commissions 1,017 - 790 3 9 215 -Taxes 4,194 - 3,033 184 59 918 -Total purchase costs 5,211 - 3,823 187 68 1,133 -Gross purchases total 3,380,862 504,091 441,020 18,681 411,376 2,005,694 -
Analysis of total sale costs:Gross sales before transaction costs 1,830,021 614,377 486,036 23,179 139,730 566,699 -Commissions (1,480) - (961) (22) (209) (288) -Taxes - - - - - - -Total sale costs (1,480) - (961) (22) (209) (288) -Total sales net of transaction costs 1,828,541 614,377 485,075 23,157 139,521 566,411 -
107
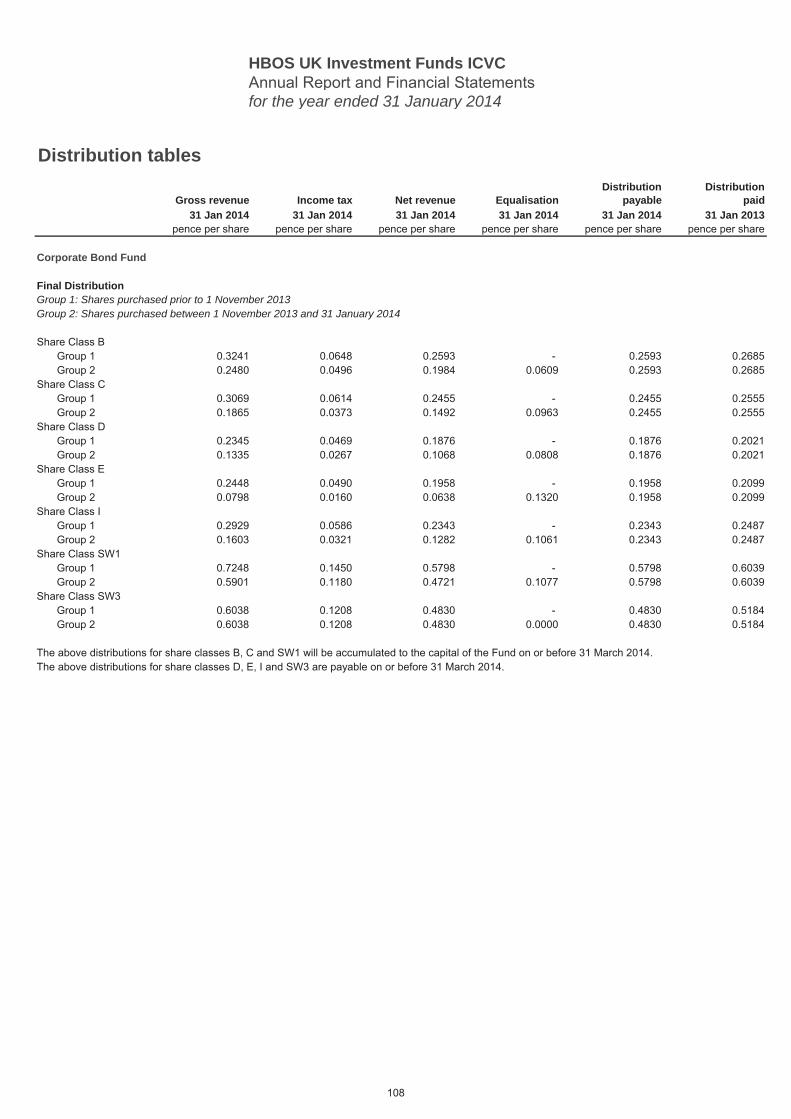
HBOS UK Investment Funds ICVCAnnual Report and Financial Statementsfor the year ended 31 January 2014
Distribution tables Distribution Distribution
Gross revenue Income tax Net revenue Equalisation payable paid31 Jan 2014 31 Jan 2014 31 Jan 2014 31 Jan 2014 31 Jan 2014 31 Jan 2013
pence per share pence per share pence per share pence per share pence per share pence per share
Corporate Bond Fund
Final Distribution
Share Class BGroup 1 0.3241 0.0648 0.2593 - 0.2593 0.2685Group 2 0.2480 0.0496 0.1984 0.0609 0.2593 0.2685
Share Class CGroup 1 0.3069 0.0614 0.2455 - 0.2455 0.2555Group 2 0.1865 0.0373 0.1492 0.0963 0.2455 0.2555
Share Class DGroup 1 0.2345 0.0469 0.1876 - 0.1876 0.2021Group 2 0.1335 0.0267 0.1068 0.0808 0.1876 0.2021
Share Class EGroup 1 0.2448 0.0490 0.1958 - 0.1958 0.2099Group 2 0.0798 0.0160 0.0638 0.1320 0.1958 0.2099
Share Class IGroup 1 0.2929 0.0586 0.2343 - 0.2343 0.2487Group 2 0.1603 0.0321 0.1282 0.1061 0.2343 0.2487
Share Class SW1Group 1 0.7248 0.1450 0.5798 - 0.5798 0.6039Group 2 0.5901 0.1180 0.4721 0.1077 0.5798 0.6039
Share Class SW3Group 1 0.6038 0.1208 0.4830 - 0.4830 0.5184Group 2 0.6038 0.1208 0.4830 0.0000 0.4830 0.5184
The above distributions for share classes B, C and SW1 will be accumulated to the capital of the Fund on or before 31 March 2014.The above distributions for share classes D, E, I and SW3 are payable on or before 31 March 2014.
Group 1: Shares purchased prior to 1 November 2013Group 2: Shares purchased between 1 November 2013 and 31 January 2014
108

HBOS UK Investment Funds ICVCAnnual Report and Financial Statementsfor the year ended 31 January 2014
Distribution tables (continued)
Gross revenue Income tax Net revenue Equalisation Distribution paid Distribution paid31 Oct 2013 31 Oct 2013 31 Oct 2013 31 Oct 2013 31 Oct 2013 31 Oct 2012
pence per share pence per share pence per share pence per share pence per share pence per share
Corporate Bond Fund - continued
3rd Interim Distribution
Share Class BGroup 1 0.3199 0.0640 0.2559 - 0.2559 0.2493Group 2 0.2389 0.0478 0.1911 0.0648 0.2559 0.2493
Share Class CGroup 1 0.3030 0.0606 0.2424 - 0.2424 0.2368Group 2 0.1760 0.0352 0.1408 0.1016 0.2424 0.2368
Share Class DGroup 1 0.2335 0.0467 0.1868 - 0.1868 0.1887Group 2 0.1200 0.0240 0.0960 0.0908 0.1868 0.1887
Share Class EGroup 1 0.2435 0.0487 0.1948 - 0.1948 0.1966Group 2 0.1805 0.0361 0.1444 0.0504 0.1948 0.1966
Share Class IGroup 1 0.2914 0.0583 0.2331 - 0.2331 0.2349Group 2 0.1329 0.0266 0.1063 0.1268 0.2331 0.2349
Share Class SW1Group 1 0.7166 0.1433 0.5733 - 0.5733 0.5604Group 2 0.4368 0.0874 0.3494 0.2239 0.5733 0.5604
Share Class SW3Group 1 0.6003 0.1201 0.4802 - 0.4802 0.4865Group 2 0.6003 0.1201 0.4802 0.0000 0.4802 0.4865
The above distributions for share classes B, C and SW1 were accumulated to the capital of the Fund on or before 31 December 2013.The above distributions for share classes D, E, I and SW3 were paid on or before 31 December 2013.
Group 1: Shares purchased prior to 1 August 2013Group 2: Shares purchased between 1 August 2013 and 31 October 2013
109
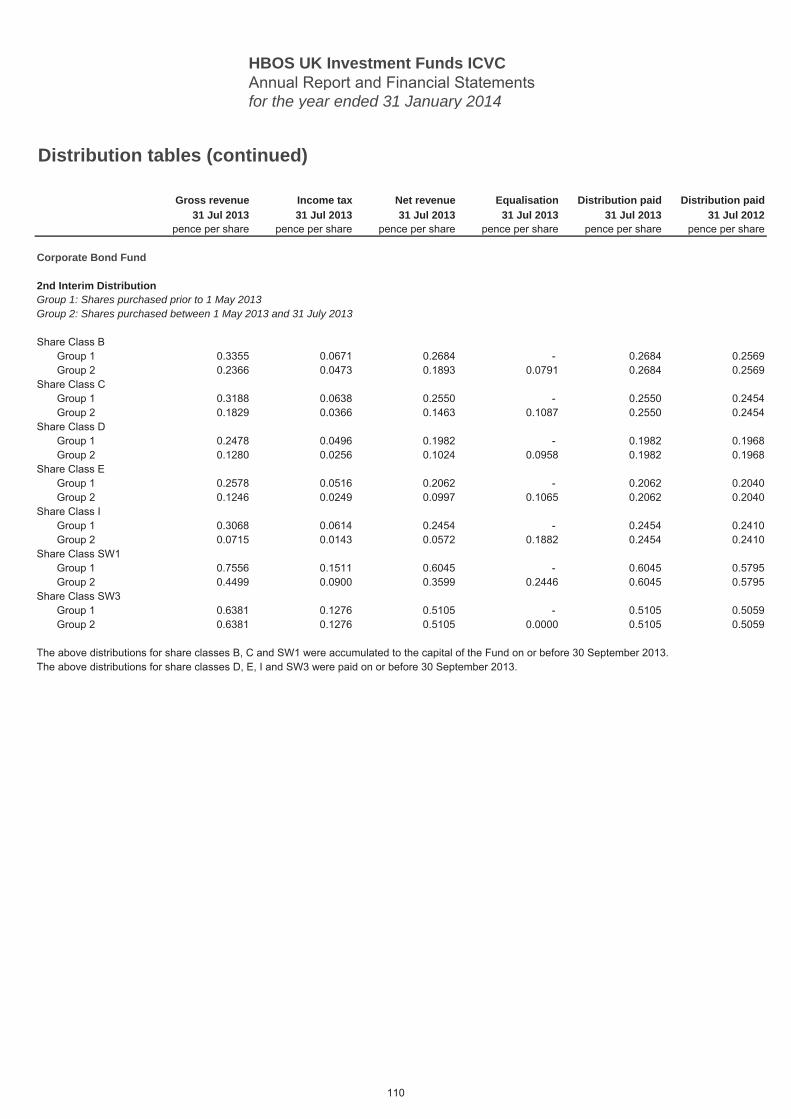
HBOS UK Investment Funds ICVCAnnual Report and Financial Statementsfor the year ended 31 January 2014
Distribution tables (continued)
Gross revenue Income tax Net revenue Equalisation Distribution paid Distribution paid31 Jul 2013 31 Jul 2013 31 Jul 2013 31 Jul 2013 31 Jul 2013 31 Jul 2012
pence per share pence per share pence per share pence per share pence per share pence per share
Corporate Bond Fund
2nd Interim Distribution
Share Class BGroup 1 0.3355 0.0671 0.2684 - 0.2684 0.2569Group 2 0.2366 0.0473 0.1893 0.0791 0.2684 0.2569
Share Class CGroup 1 0.3188 0.0638 0.2550 - 0.2550 0.2454Group 2 0.1829 0.0366 0.1463 0.1087 0.2550 0.2454
Share Class DGroup 1 0.2478 0.0496 0.1982 - 0.1982 0.1968Group 2 0.1280 0.0256 0.1024 0.0958 0.1982 0.1968
Share Class EGroup 1 0.2578 0.0516 0.2062 - 0.2062 0.2040Group 2 0.1246 0.0249 0.0997 0.1065 0.2062 0.2040
Share Class IGroup 1 0.3068 0.0614 0.2454 - 0.2454 0.2410Group 2 0.0715 0.0143 0.0572 0.1882 0.2454 0.2410
Share Class SW1Group 1 0.7556 0.1511 0.6045 - 0.6045 0.5795Group 2 0.4499 0.0900 0.3599 0.2446 0.6045 0.5795
Share Class SW3Group 1 0.6381 0.1276 0.5105 - 0.5105 0.5059Group 2 0.6381 0.1276 0.5105 0.0000 0.5105 0.5059
The above distributions for share classes B, C and SW1 were accumulated to the capital of the Fund on or before 30 September 2013.The above distributions for share classes D, E, I and SW3 were paid on or before 30 September 2013.
Group 1: Shares purchased prior to 1 May 2013Group 2: Shares purchased between 1 May 2013 and 31 July 2013
110

HBOS UK Investment Funds ICVCAnnual Report and Financial Statementsfor the year ended 31 January 2014
Distribution tables (continued)
Gross revenue Income tax Net revenue Equalisation Distribution paid Distribution paid30 Apr 2013 30 Apr 2013 30 Apr 2013 30 Apr 2013 30 Apr 2013 30 Apr 2012
pence per share pence per share pence per share pence per share pence per share pence per share
Corporate Bond Fund - continued
1st Interim Distribution
Share Class BGroup 1 0.3194 0.0639 0.2555 - 0.2555 0.2535Group 2 0.2326 0.0465 0.1861 0.0694 0.2555 0.2535
Share Class CGroup 1 0.3033 0.0607 0.2426 - 0.2426 0.2429Group 2 0.1720 0.0344 0.1376 0.1050 0.2426 0.2429
Share Class DGroup 1 0.2378 0.0476 0.1902 - 0.1902 0.1968Group 2 0.0808 0.0162 0.0646 0.1256 0.1902 0.1968
Share Class EGroup 1 0.2475 0.0495 0.1980 - 0.1980 0.2034Group 2 0.1044 0.0209 0.0835 0.1145 0.1980 0.2034
Share Class IGroup 1 0.2940 0.0588 0.2352 - 0.2352 0.2399Group 2 0.1538 0.0308 0.1230 0.1122 0.2352 0.2399
Share Class SW1Group 1 0.7156 0.1431 0.5725 - 0.5725 0.5751Group 2 0.7156 0.1431 0.5725 0.0000 0.5725 0.5751
Share Class SW3Group 1 0.6093 0.1219 0.4874 - 0.4874 0.5072Group 2 0.6093 0.1219 0.4874 0.0000 0.4874 0.5072
The above distributions for share classes B, C and SW1 were accumulated to the capital of the Fund on or before 30 June 2013.The above distributions for share classes D, E, I and SW3 were paid on or before 30 June 2013.
Group 1: Shares purchased prior to 1 February 2013Group 2: Shares purchased between 1 February 2013 and 30 April 2013
111
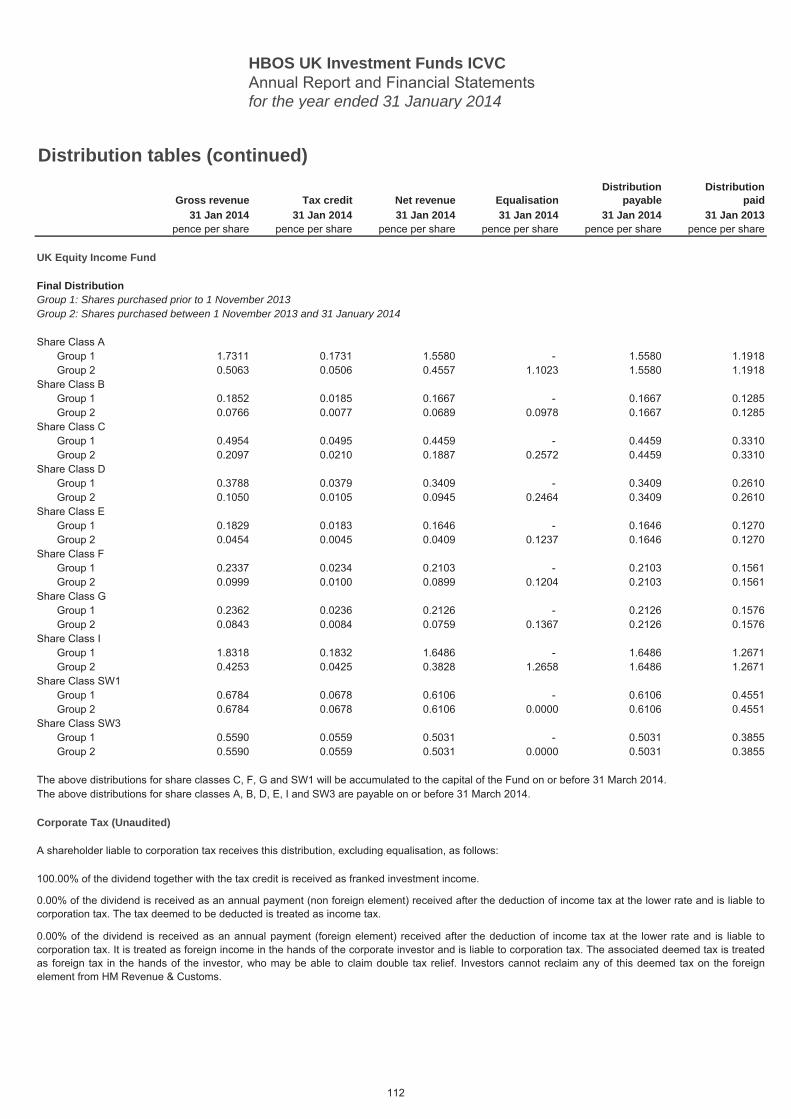
HBOS UK Investment Funds ICVCAnnual Report and Financial Statementsfor the year ended 31 January 2014
Distribution tables (continued)Distribution Distribution
Gross revenue Tax credit Net revenue Equalisation payable paid31 Jan 2014 31 Jan 2014 31 Jan 2014 31 Jan 2014 31 Jan 2014 31 Jan 2013
pence per share pence per share pence per share pence per share pence per share pence per share
UK Equity Income Fund
Final Distribution
Share Class AGroup 1 1.7311 0.1731 1.5580 - 1.5580 1.1918Group 2 0.5063 0.0506 0.4557 1.1023 1.5580 1.1918
Share Class BGroup 1 0.1852 0.0185 0.1667 - 0.1667 0.1285Group 2 0.0766 0.0077 0.0689 0.0978 0.1667 0.1285
Share Class CGroup 1 0.4954 0.0495 0.4459 - 0.4459 0.3310Group 2 0.2097 0.0210 0.1887 0.2572 0.4459 0.3310
Share Class DGroup 1 0.3788 0.0379 0.3409 - 0.3409 0.2610Group 2 0.1050 0.0105 0.0945 0.2464 0.3409 0.2610
Share Class EGroup 1 0.1829 0.0183 0.1646 - 0.1646 0.1270Group 2 0.0454 0.0045 0.0409 0.1237 0.1646 0.1270
Share Class FGroup 1 0.2337 0.0234 0.2103 - 0.2103 0.1561Group 2 0.0999 0.0100 0.0899 0.1204 0.2103 0.1561
Share Class GGroup 1 0.2362 0.0236 0.2126 - 0.2126 0.1576Group 2 0.0843 0.0084 0.0759 0.1367 0.2126 0.1576
Share Class IGroup 1 1.8318 0.1832 1.6486 - 1.6486 1.2671Group 2 0.4253 0.0425 0.3828 1.2658 1.6486 1.2671
Share Class SW1Group 1 0.6784 0.0678 0.6106 - 0.6106 0.4551Group 2 0.6784 0.0678 0.6106 0.0000 0.6106 0.4551
Share Class SW3Group 1 0.5590 0.0559 0.5031 - 0.5031 0.3855Group 2 0.5590 0.0559 0.5031 0.0000 0.5031 0.3855
The above distributions for share classes C, F, G and SW1 will be accumulated to the capital of the Fund on or before 31 March 2014.The above distributions for share classes A, B, D, E, I and SW3 are payable on or before 31 March 2014.
Corporate Tax (Unaudited)
A shareholder liable to corporation tax receives this distribution, excluding equalisation, as follows:
Group 1: Shares purchased prior to 1 November 2013Group 2: Shares purchased between 1 November 2013 and 31 January 2014
100.00% of the dividend together with the tax credit is received as franked investment income.
0.00% of the dividend is received as an annual payment (non foreign element) received after the deduction of income tax at the lower rate and is liable tocorporation tax. The tax deemed to be deducted is treated as income tax.
0.00% of the dividend is received as an annual payment (foreign element) received after the deduction of income tax at the lower rate and is liable tocorporation tax. It is treated as foreign income in the hands of the corporate investor and is liable to corporation tax. The associated deemed tax is treatedas foreign tax in the hands of the investor, who may be able to claim double tax relief. Investors cannot reclaim any of this deemed tax on the foreignelement from HM Revenue & Customs.
112
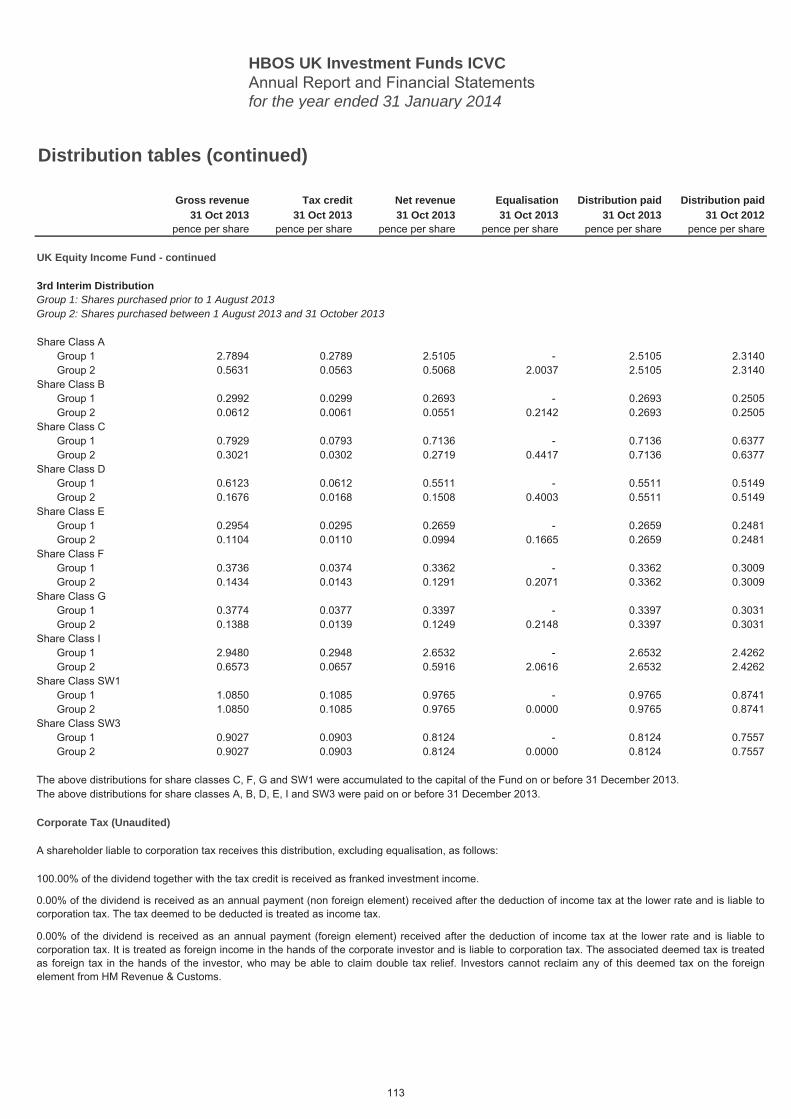
HBOS UK Investment Funds ICVCAnnual Report and Financial Statementsfor the year ended 31 January 2014
Distribution tables (continued)
Gross revenue Tax credit Net revenue Equalisation Distribution paid Distribution paid31 Oct 2013 31 Oct 2013 31 Oct 2013 31 Oct 2013 31 Oct 2013 31 Oct 2012
pence per share pence per share pence per share pence per share pence per share pence per share
UK Equity Income Fund - continued
3rd Interim Distribution
Share Class AGroup 1 2.7894 0.2789 2.5105 - 2.5105 2.3140Group 2 0.5631 0.0563 0.5068 2.0037 2.5105 2.3140
Share Class BGroup 1 0.2992 0.0299 0.2693 - 0.2693 0.2505Group 2 0.0612 0.0061 0.0551 0.2142 0.2693 0.2505
Share Class CGroup 1 0.7929 0.0793 0.7136 - 0.7136 0.6377Group 2 0.3021 0.0302 0.2719 0.4417 0.7136 0.6377
Share Class DGroup 1 0.6123 0.0612 0.5511 - 0.5511 0.5149Group 2 0.1676 0.0168 0.1508 0.4003 0.5511 0.5149
Share Class EGroup 1 0.2954 0.0295 0.2659 - 0.2659 0.2481Group 2 0.1104 0.0110 0.0994 0.1665 0.2659 0.2481
Share Class FGroup 1 0.3736 0.0374 0.3362 - 0.3362 0.3009Group 2 0.1434 0.0143 0.1291 0.2071 0.3362 0.3009
Share Class GGroup 1 0.3774 0.0377 0.3397 - 0.3397 0.3031Group 2 0.1388 0.0139 0.1249 0.2148 0.3397 0.3031
Share Class IGroup 1 2.9480 0.2948 2.6532 - 2.6532 2.4262Group 2 0.6573 0.0657 0.5916 2.0616 2.6532 2.4262
Share Class SW1Group 1 1.0850 0.1085 0.9765 - 0.9765 0.8741Group 2 1.0850 0.1085 0.9765 0.0000 0.9765 0.8741
Share Class SW3Group 1 0.9027 0.0903 0.8124 - 0.8124 0.7557Group 2 0.9027 0.0903 0.8124 0.0000 0.8124 0.7557
The above distributions for share classes C, F, G and SW1 were accumulated to the capital of the Fund on or before 31 December 2013.The above distributions for share classes A, B, D, E, I and SW3 were paid on or before 31 December 2013.
Corporate Tax (Unaudited)
A shareholder liable to corporation tax receives this distribution, excluding equalisation, as follows:
Group 1: Shares purchased prior to 1 August 2013Group 2: Shares purchased between 1 August 2013 and 31 October 2013
100.00% of the dividend together with the tax credit is received as franked investment income.
0.00% of the dividend is received as an annual payment (non foreign element) received after the deduction of income tax at the lower rate and is liable tocorporation tax. The tax deemed to be deducted is treated as income tax.
0.00% of the dividend is received as an annual payment (foreign element) received after the deduction of income tax at the lower rate and is liable tocorporation tax. It is treated as foreign income in the hands of the corporate investor and is liable to corporation tax. The associated deemed tax is treatedas foreign tax in the hands of the investor, who may be able to claim double tax relief. Investors cannot reclaim any of this deemed tax on the foreignelement from HM Revenue & Customs.
113
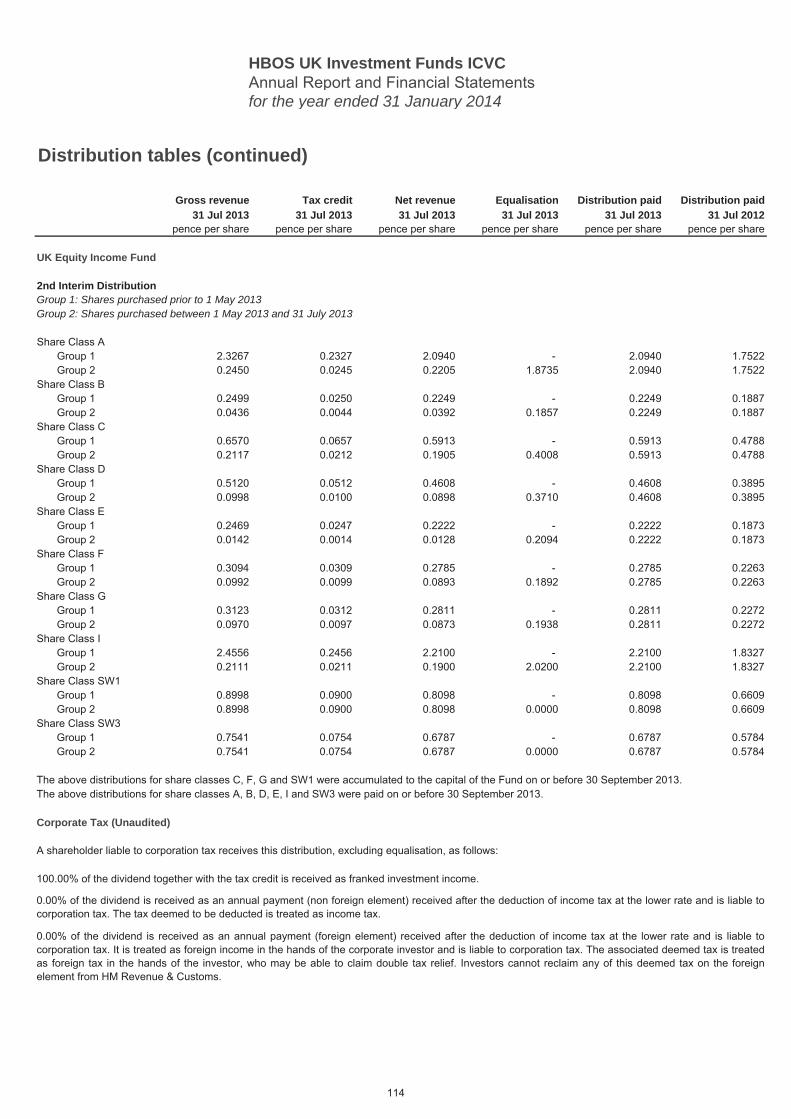
HBOS UK Investment Funds ICVCAnnual Report and Financial Statementsfor the year ended 31 January 2014
Distribution tables (continued)
Gross revenue Tax credit Net revenue Equalisation Distribution paid Distribution paid31 Jul 2013 31 Jul 2013 31 Jul 2013 31 Jul 2013 31 Jul 2013 31 Jul 2012
pence per share pence per share pence per share pence per share pence per share pence per share
UK Equity Income Fund
2nd Interim Distribution
Share Class AGroup 1 2.3267 0.2327 2.0940 - 2.0940 1.7522Group 2 0.2450 0.0245 0.2205 1.8735 2.0940 1.7522
Share Class BGroup 1 0.2499 0.0250 0.2249 - 0.2249 0.1887Group 2 0.0436 0.0044 0.0392 0.1857 0.2249 0.1887
Share Class CGroup 1 0.6570 0.0657 0.5913 - 0.5913 0.4788Group 2 0.2117 0.0212 0.1905 0.4008 0.5913 0.4788
Share Class DGroup 1 0.5120 0.0512 0.4608 - 0.4608 0.3895Group 2 0.0998 0.0100 0.0898 0.3710 0.4608 0.3895
Share Class EGroup 1 0.2469 0.0247 0.2222 - 0.2222 0.1873Group 2 0.0142 0.0014 0.0128 0.2094 0.2222 0.1873
Share Class FGroup 1 0.3094 0.0309 0.2785 - 0.2785 0.2263Group 2 0.0992 0.0099 0.0893 0.1892 0.2785 0.2263
Share Class GGroup 1 0.3123 0.0312 0.2811 - 0.2811 0.2272Group 2 0.0970 0.0097 0.0873 0.1938 0.2811 0.2272
Share Class IGroup 1 2.4556 0.2456 2.2100 - 2.2100 1.8327Group 2 0.2111 0.0211 0.1900 2.0200 2.2100 1.8327
Share Class SW1Group 1 0.8998 0.0900 0.8098 - 0.8098 0.6609Group 2 0.8998 0.0900 0.8098 0.0000 0.8098 0.6609
Share Class SW3Group 1 0.7541 0.0754 0.6787 - 0.6787 0.5784Group 2 0.7541 0.0754 0.6787 0.0000 0.6787 0.5784
The above distributions for share classes C, F, G and SW1 were accumulated to the capital of the Fund on or before 30 September 2013.The above distributions for share classes A, B, D, E, I and SW3 were paid on or before 30 September 2013.
Corporate Tax (Unaudited)
A shareholder liable to corporation tax receives this distribution, excluding equalisation, as follows:
Group 1: Shares purchased prior to 1 May 2013Group 2: Shares purchased between 1 May 2013 and 31 July 2013
100.00% of the dividend together with the tax credit is received as franked investment income.
0.00% of the dividend is received as an annual payment (non foreign element) received after the deduction of income tax at the lower rate and is liable tocorporation tax. The tax deemed to be deducted is treated as income tax.
0.00% of the dividend is received as an annual payment (foreign element) received after the deduction of income tax at the lower rate and is liable tocorporation tax. It is treated as foreign income in the hands of the corporate investor and is liable to corporation tax. The associated deemed tax is treatedas foreign tax in the hands of the investor, who may be able to claim double tax relief. Investors cannot reclaim any of this deemed tax on the foreignelement from HM Revenue & Customs.
114
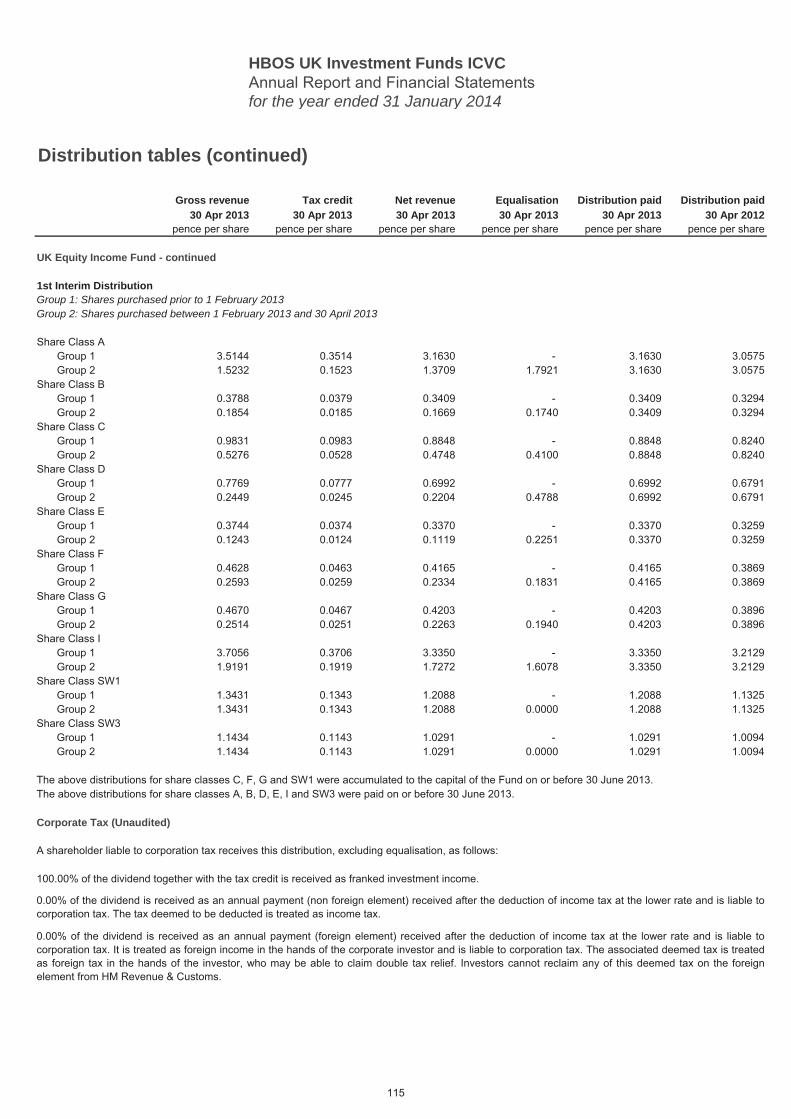
HBOS UK Investment Funds ICVCAnnual Report and Financial Statementsfor the year ended 31 January 2014
Distribution tables (continued)
Gross revenue Tax credit Net revenue Equalisation Distribution paid Distribution paid30 Apr 2013 30 Apr 2013 30 Apr 2013 30 Apr 2013 30 Apr 2013 30 Apr 2012
pence per share pence per share pence per share pence per share pence per share pence per share
UK Equity Income Fund - continued
1st Interim Distribution
Share Class AGroup 1 3.5144 0.3514 3.1630 - 3.1630 3.0575Group 2 1.5232 0.1523 1.3709 1.7921 3.1630 3.0575
Share Class BGroup 1 0.3788 0.0379 0.3409 - 0.3409 0.3294Group 2 0.1854 0.0185 0.1669 0.1740 0.3409 0.3294
Share Class CGroup 1 0.9831 0.0983 0.8848 - 0.8848 0.8240Group 2 0.5276 0.0528 0.4748 0.4100 0.8848 0.8240
Share Class DGroup 1 0.7769 0.0777 0.6992 - 0.6992 0.6791Group 2 0.2449 0.0245 0.2204 0.4788 0.6992 0.6791
Share Class EGroup 1 0.3744 0.0374 0.3370 - 0.3370 0.3259Group 2 0.1243 0.0124 0.1119 0.2251 0.3370 0.3259
Share Class FGroup 1 0.4628 0.0463 0.4165 - 0.4165 0.3869Group 2 0.2593 0.0259 0.2334 0.1831 0.4165 0.3869
Share Class GGroup 1 0.4670 0.0467 0.4203 - 0.4203 0.3896Group 2 0.2514 0.0251 0.2263 0.1940 0.4203 0.3896
Share Class IGroup 1 3.7056 0.3706 3.3350 - 3.3350 3.2129Group 2 1.9191 0.1919 1.7272 1.6078 3.3350 3.2129
Share Class SW1Group 1 1.3431 0.1343 1.2088 - 1.2088 1.1325Group 2 1.3431 0.1343 1.2088 0.0000 1.2088 1.1325
Share Class SW3Group 1 1.1434 0.1143 1.0291 - 1.0291 1.0094Group 2 1.1434 0.1143 1.0291 0.0000 1.0291 1.0094
The above distributions for share classes C, F, G and SW1 were accumulated to the capital of the Fund on or before 30 June 2013.The above distributions for share classes A, B, D, E, I and SW3 were paid on or before 30 June 2013.
Corporate Tax (Unaudited)
A shareholder liable to corporation tax receives this distribution, excluding equalisation, as follows:
Group 1: Shares purchased prior to 1 February 2013Group 2: Shares purchased between 1 February 2013 and 30 April 2013
100.00% of the dividend together with the tax credit is received as franked investment income.
0.00% of the dividend is received as an annual payment (non foreign element) received after the deduction of income tax at the lower rate and is liable tocorporation tax. The tax deemed to be deducted is treated as income tax.
0.00% of the dividend is received as an annual payment (foreign element) received after the deduction of income tax at the lower rate and is liable tocorporation tax. It is treated as foreign income in the hands of the corporate investor and is liable to corporation tax. The associated deemed tax is treatedas foreign tax in the hands of the investor, who may be able to claim double tax relief. Investors cannot reclaim any of this deemed tax on the foreignelement from HM Revenue & Customs.
115
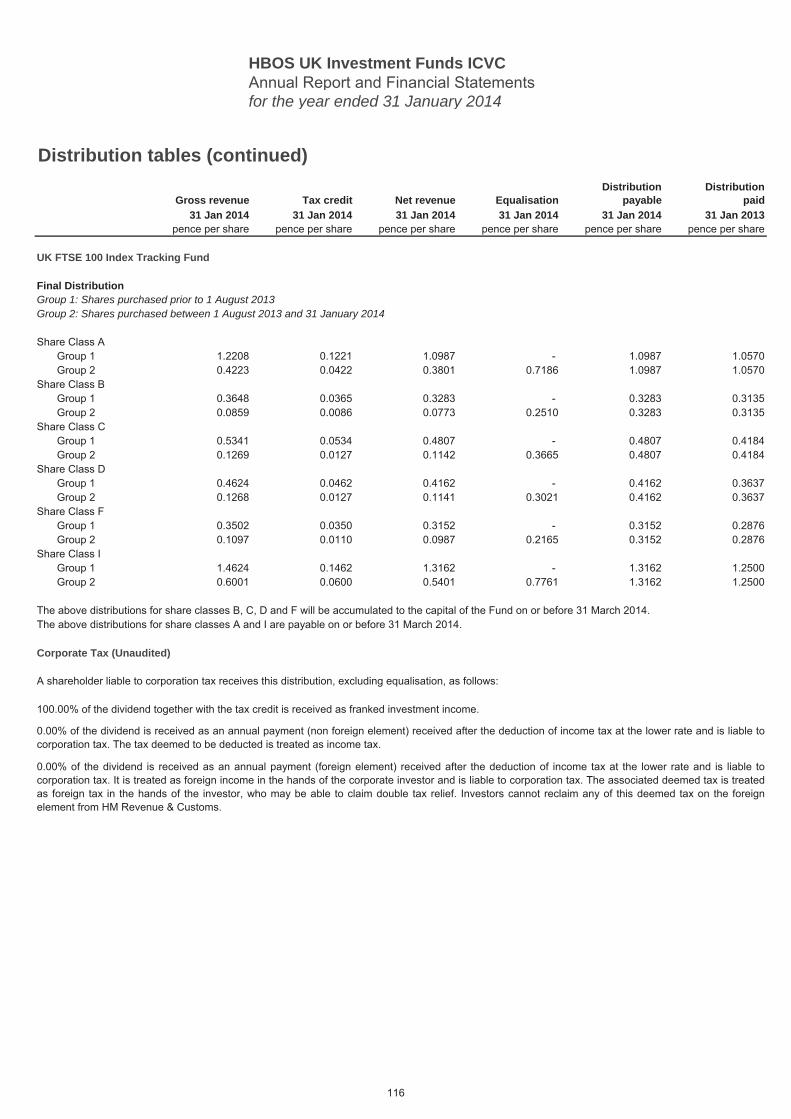
HBOS UK Investment Funds ICVCAnnual Report and Financial Statementsfor the year ended 31 January 2014
Distribution tables (continued)Distribution Distribution
Gross revenue Tax credit Net revenue Equalisation payable paid31 Jan 2014 31 Jan 2014 31 Jan 2014 31 Jan 2014 31 Jan 2014 31 Jan 2013
pence per share pence per share pence per share pence per share pence per share pence per share
UK FTSE 100 Index Tracking Fund
Final Distribution
Share Class AGroup 1 1.2208 0.1221 1.0987 - 1.0987 1.0570Group 2 0.4223 0.0422 0.3801 0.7186 1.0987 1.0570
Share Class BGroup 1 0.3648 0.0365 0.3283 - 0.3283 0.3135Group 2 0.0859 0.0086 0.0773 0.2510 0.3283 0.3135
Share Class CGroup 1 0.5341 0.0534 0.4807 - 0.4807 0.4184Group 2 0.1269 0.0127 0.1142 0.3665 0.4807 0.4184
Share Class DGroup 1 0.4624 0.0462 0.4162 - 0.4162 0.3637Group 2 0.1268 0.0127 0.1141 0.3021 0.4162 0.3637
Share Class FGroup 1 0.3502 0.0350 0.3152 - 0.3152 0.2876Group 2 0.1097 0.0110 0.0987 0.2165 0.3152 0.2876
Share Class IGroup 1 1.4624 0.1462 1.3162 - 1.3162 1.2500Group 2 0.6001 0.0600 0.5401 0.7761 1.3162 1.2500
The above distributions for share classes B, C, D and F will be accumulated to the capital of the Fund on or before 31 March 2014.The above distributions for share classes A and I are payable on or before 31 March 2014.
Corporate Tax (Unaudited)
A shareholder liable to corporation tax receives this distribution, excluding equalisation, as follows:
Group 1: Shares purchased prior to 1 August 2013Group 2: Shares purchased between 1 August 2013 and 31 January 2014
100.00% of the dividend together with the tax credit is received as franked investment income.
0.00% of the dividend is received as an annual payment (non foreign element) received after the deduction of income tax at the lower rate and is liable tocorporation tax. The tax deemed to be deducted is treated as income tax.
0.00% of the dividend is received as an annual payment (foreign element) received after the deduction of income tax at the lower rate and is liable tocorporation tax. It is treated as foreign income in the hands of the corporate investor and is liable to corporation tax. The associated deemed tax is treatedas foreign tax in the hands of the investor, who may be able to claim double tax relief. Investors cannot reclaim any of this deemed tax on the foreignelement from HM Revenue & Customs.
116
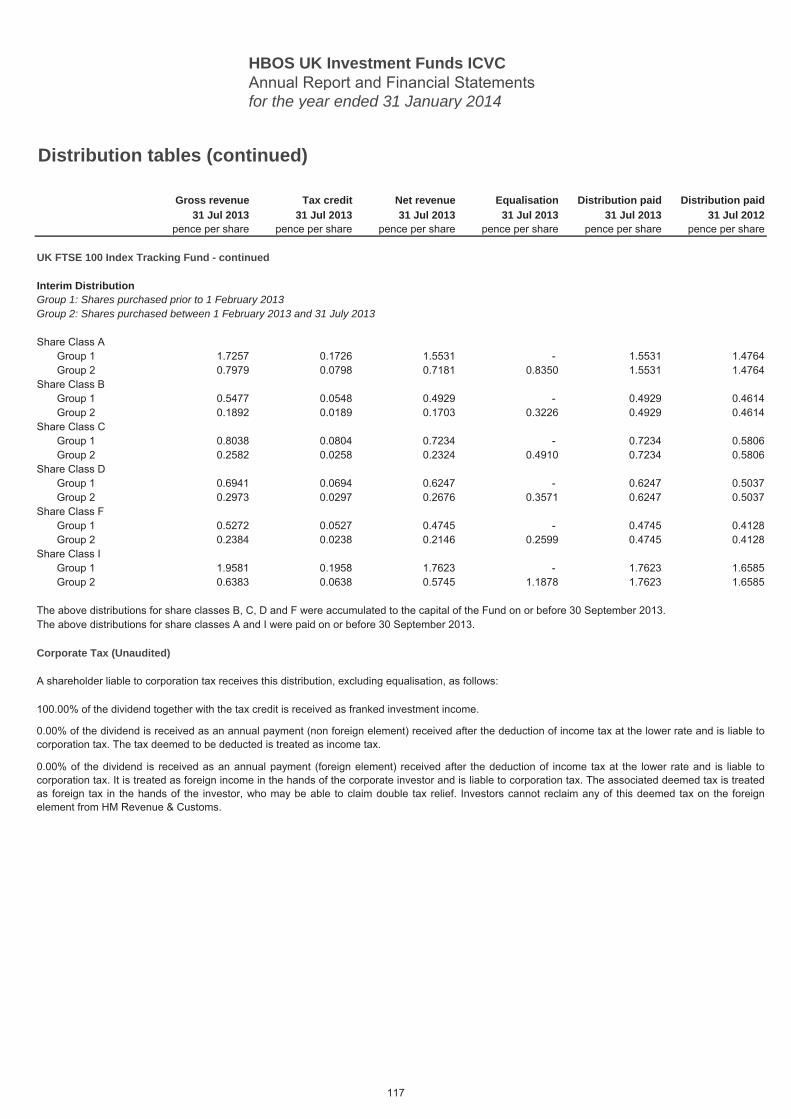
HBOS UK Investment Funds ICVCAnnual Report and Financial Statementsfor the year ended 31 January 2014
Distribution tables (continued)
Gross revenue Tax credit Net revenue Equalisation Distribution paid Distribution paid31 Jul 2013 31 Jul 2013 31 Jul 2013 31 Jul 2013 31 Jul 2013 31 Jul 2012
pence per share pence per share pence per share pence per share pence per share pence per share
UK FTSE 100 Index Tracking Fund - continued
Interim Distribution
Share Class AGroup 1 1.7257 0.1726 1.5531 - 1.5531 1.4764Group 2 0.7979 0.0798 0.7181 0.8350 1.5531 1.4764
Share Class BGroup 1 0.5477 0.0548 0.4929 - 0.4929 0.4614Group 2 0.1892 0.0189 0.1703 0.3226 0.4929 0.4614
Share Class CGroup 1 0.8038 0.0804 0.7234 - 0.7234 0.5806Group 2 0.2582 0.0258 0.2324 0.4910 0.7234 0.5806
Share Class DGroup 1 0.6941 0.0694 0.6247 - 0.6247 0.5037Group 2 0.2973 0.0297 0.2676 0.3571 0.6247 0.5037
Share Class FGroup 1 0.5272 0.0527 0.4745 - 0.4745 0.4128Group 2 0.2384 0.0238 0.2146 0.2599 0.4745 0.4128
Share Class IGroup 1 1.9581 0.1958 1.7623 - 1.7623 1.6585Group 2 0.6383 0.0638 0.5745 1.1878 1.7623 1.6585
The above distributions for share classes B, C, D and F were accumulated to the capital of the Fund on or before 30 September 2013.The above distributions for share classes A and I were paid on or before 30 September 2013.
Corporate Tax (Unaudited)
A shareholder liable to corporation tax receives this distribution, excluding equalisation, as follows:
Group 2: Shares purchased between 1 February 2013 and 31 July 2013Group 1: Shares purchased prior to 1 February 2013
0.00% of the dividend is received as an annual payment (foreign element) received after the deduction of income tax at the lower rate and is liable tocorporation tax. It is treated as foreign income in the hands of the corporate investor and is liable to corporation tax. The associated deemed tax is treatedas foreign tax in the hands of the investor, who may be able to claim double tax relief. Investors cannot reclaim any of this deemed tax on the foreignelement from HM Revenue & Customs.
100.00% of the dividend together with the tax credit is received as franked investment income.
0.00% of the dividend is received as an annual payment (non foreign element) received after the deduction of income tax at the lower rate and is liable tocorporation tax. The tax deemed to be deducted is treated as income tax.
117
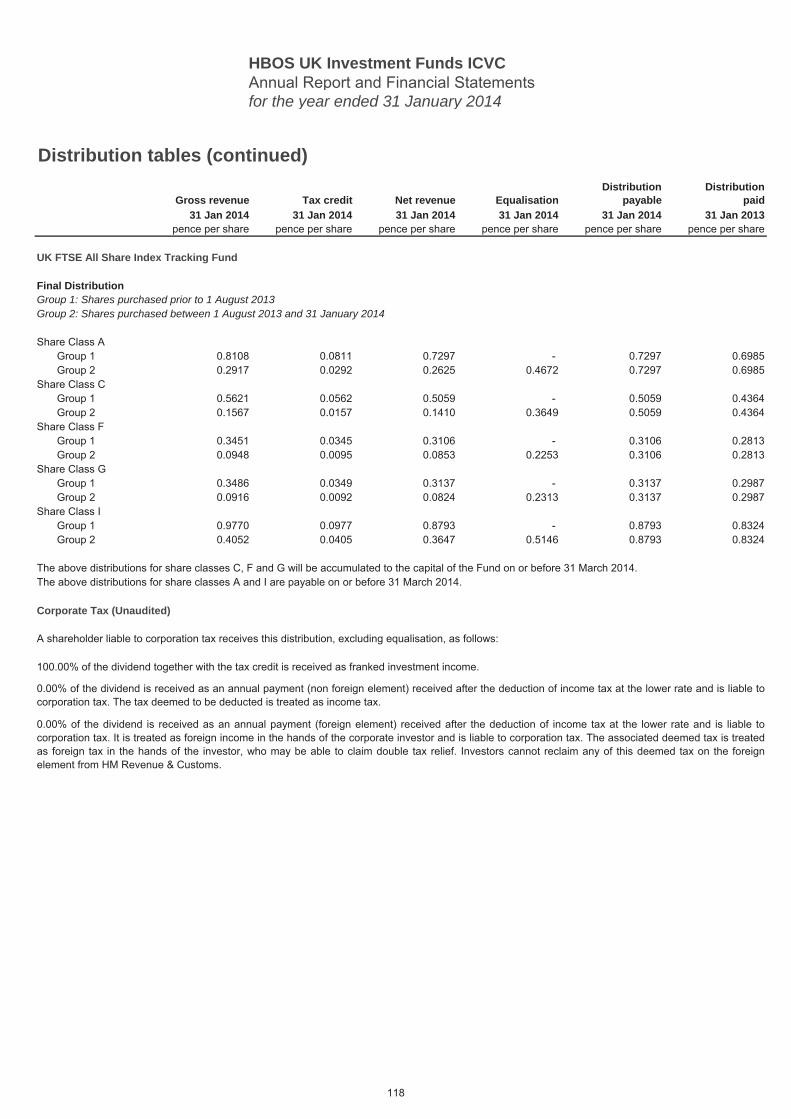
HBOS UK Investment Funds ICVCAnnual Report and Financial Statementsfor the year ended 31 January 2014
Distribution tables (continued)Distribution Distribution
Gross revenue Tax credit Net revenue Equalisation payable paid31 Jan 2014 31 Jan 2014 31 Jan 2014 31 Jan 2014 31 Jan 2014 31 Jan 2013
pence per share pence per share pence per share pence per share pence per share pence per share
UK FTSE All Share Index Tracking Fund
Final Distribution
Share Class AGroup 1 0.8108 0.0811 0.7297 - 0.7297 0.6985Group 2 0.2917 0.0292 0.2625 0.4672 0.7297 0.6985
Share Class CGroup 1 0.5621 0.0562 0.5059 - 0.5059 0.4364Group 2 0.1567 0.0157 0.1410 0.3649 0.5059 0.4364
Share Class FGroup 1 0.3451 0.0345 0.3106 - 0.3106 0.2813Group 2 0.0948 0.0095 0.0853 0.2253 0.3106 0.2813
Share Class GGroup 1 0.3486 0.0349 0.3137 - 0.3137 0.2987Group 2 0.0916 0.0092 0.0824 0.2313 0.3137 0.2987
Share Class IGroup 1 0.9770 0.0977 0.8793 - 0.8793 0.8324Group 2 0.4052 0.0405 0.3647 0.5146 0.8793 0.8324
The above distributions for share classes C, F and G will be accumulated to the capital of the Fund on or before 31 March 2014.The above distributions for share classes A and I are payable on or before 31 March 2014.
Corporate Tax (Unaudited)
A shareholder liable to corporation tax receives this distribution, excluding equalisation, as follows:
Group 1: Shares purchased prior to 1 August 2013Group 2: Shares purchased between 1 August 2013 and 31 January 2014
100.00% of the dividend together with the tax credit is received as franked investment income.
0.00% of the dividend is received as an annual payment (non foreign element) received after the deduction of income tax at the lower rate and is liable tocorporation tax. The tax deemed to be deducted is treated as income tax.
0.00% of the dividend is received as an annual payment (foreign element) received after the deduction of income tax at the lower rate and is liable tocorporation tax. It is treated as foreign income in the hands of the corporate investor and is liable to corporation tax. The associated deemed tax is treatedas foreign tax in the hands of the investor, who may be able to claim double tax relief. Investors cannot reclaim any of this deemed tax on the foreignelement from HM Revenue & Customs.
118

HBOS UK Investment Funds ICVCAnnual Report and Financial Statementsfor the year ended 31 January 2014
Distribution tables (continued)
Gross revenue Tax credit Net revenue Equalisation Distribution paid Distribution paid31 Jul 2013 31 Jul 2013 31 Jul 2013 31 Jul 2013 31 Jul 2013 31 Jul 2012
pence per share pence per share pence per share pence per share pence per share pence per share
UK FTSE All Share Index Tracking Fund - continued
Interim Distribution
Share Class AGroup 1 1.1363 0.1136 1.0227 - 1.0227 0.9687Group 2 0.5151 0.0515 0.4636 0.5591 1.0227 0.9687
Share Class CGroup 1 0.8439 0.0844 0.7595 - 0.7595 0.6080Group 2 0.3622 0.0362 0.3260 0.4335 0.7595 0.6080
Share Class FGroup 1 0.5180 0.0518 0.4662 - 0.4662 0.4054Group 2 0.2094 0.0209 0.1885 0.2777 0.4662 0.4054
Share Class GGroup 1 0.5233 0.0523 0.4710 - 0.4710 0.4414Group 2 0.1819 0.0182 0.1637 0.3073 0.4710 0.4414
Share Class IGroup 1 1.2933 0.1293 1.1640 - 1.1640 1.0870Group 2 0.7128 0.0713 0.6415 0.5225 1.1640 1.0870
The above distributions for share classes C, F and G were accumulated to the capital of the Fund on or before 30 September 2013.The above distributions for share classes A and I were paid on or before 30 September 2013.
Corporate Tax (Unaudited)
A shareholder liable to corporation tax receives this distribution, excluding equalisation, as follows:
Group 2: Shares purchased between 1 February 2013 and 31 July 2013Group 1: Shares purchased prior to 1 February 2013
0.00% of the dividend is received as an annual payment (foreign element) received after the deduction of income tax at the lower rate and is liable tocorporation tax. It is treated as foreign income in the hands of the corporate investor and is liable to corporation tax. The associated deemed tax is treatedas foreign tax in the hands of the investor, who may be able to claim double tax relief. Investors cannot reclaim any of this deemed tax on the foreignelement from HM Revenue & Customs.
100.00% of the dividend together with the tax credit is received as franked investment income.
0.00% of the dividend is received as an annual payment (non foreign element) received after the deduction of income tax at the lower rate and is liable tocorporation tax. The tax deemed to be deducted is treated as income tax.
119
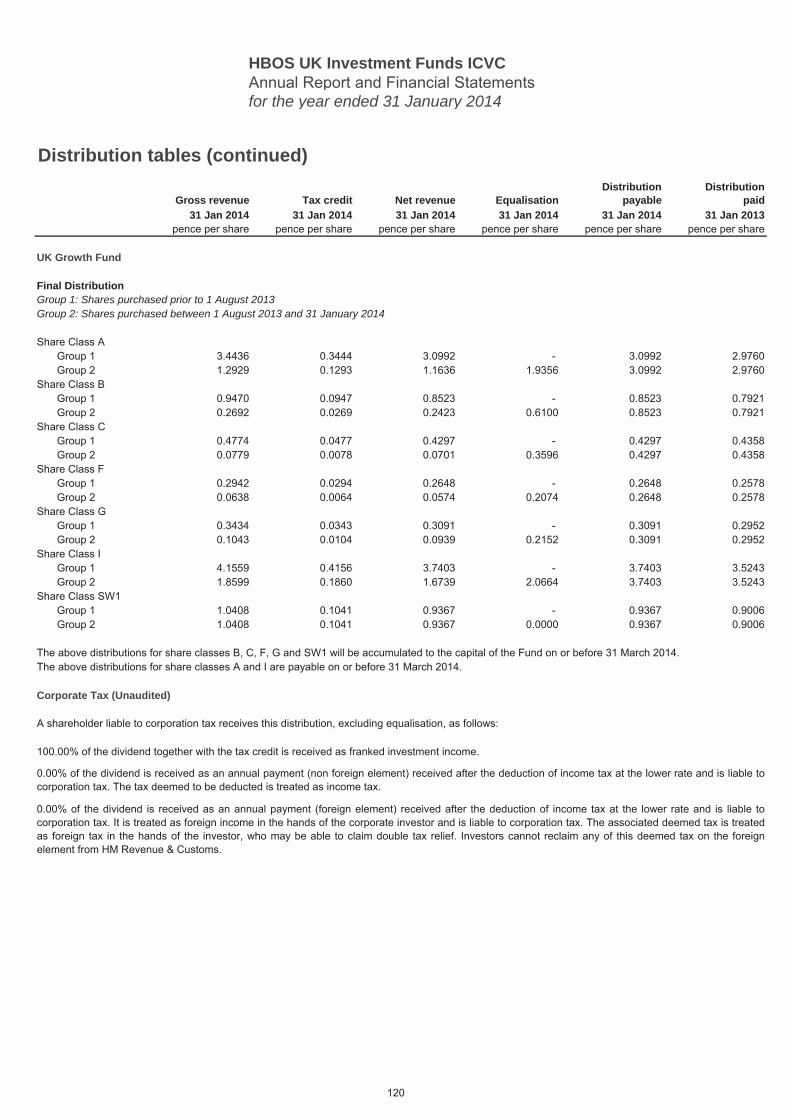
HBOS UK Investment Funds ICVCAnnual Report and Financial Statementsfor the year ended 31 January 2014
Distribution tables (continued)Distribution Distribution
Gross revenue Tax credit Net revenue Equalisation payable paid31 Jan 2014 31 Jan 2014 31 Jan 2014 31 Jan 2014 31 Jan 2014 31 Jan 2013
pence per share pence per share pence per share pence per share pence per share pence per share
UK Growth Fund
Final Distribution
Share Class AGroup 1 3.4436 0.3444 3.0992 - 3.0992 2.9760Group 2 1.2929 0.1293 1.1636 1.9356 3.0992 2.9760
Share Class BGroup 1 0.9470 0.0947 0.8523 - 0.8523 0.7921Group 2 0.2692 0.0269 0.2423 0.6100 0.8523 0.7921
Share Class CGroup 1 0.4774 0.0477 0.4297 - 0.4297 0.4358Group 2 0.0779 0.0078 0.0701 0.3596 0.4297 0.4358
Share Class FGroup 1 0.2942 0.0294 0.2648 - 0.2648 0.2578Group 2 0.0638 0.0064 0.0574 0.2074 0.2648 0.2578
Share Class GGroup 1 0.3434 0.0343 0.3091 - 0.3091 0.2952Group 2 0.1043 0.0104 0.0939 0.2152 0.3091 0.2952
Share Class IGroup 1 4.1559 0.4156 3.7403 - 3.7403 3.5243Group 2 1.8599 0.1860 1.6739 2.0664 3.7403 3.5243
Share Class SW1Group 1 1.0408 0.1041 0.9367 - 0.9367 0.9006Group 2 1.0408 0.1041 0.9367 0.0000 0.9367 0.9006
The above distributions for share classes B, C, F, G and SW1 will be accumulated to the capital of the Fund on or before 31 March 2014.The above distributions for share classes A and I are payable on or before 31 March 2014.
Corporate Tax (Unaudited)
A shareholder liable to corporation tax receives this distribution, excluding equalisation, as follows:
Group 1: Shares purchased prior to 1 August 2013Group 2: Shares purchased between 1 August 2013 and 31 January 2014
100.00% of the dividend together with the tax credit is received as franked investment income.
0.00% of the dividend is received as an annual payment (non foreign element) received after the deduction of income tax at the lower rate and is liable tocorporation tax. The tax deemed to be deducted is treated as income tax.
0.00% of the dividend is received as an annual payment (foreign element) received after the deduction of income tax at the lower rate and is liable tocorporation tax. It is treated as foreign income in the hands of the corporate investor and is liable to corporation tax. The associated deemed tax is treatedas foreign tax in the hands of the investor, who may be able to claim double tax relief. Investors cannot reclaim any of this deemed tax on the foreignelement from HM Revenue & Customs.
120
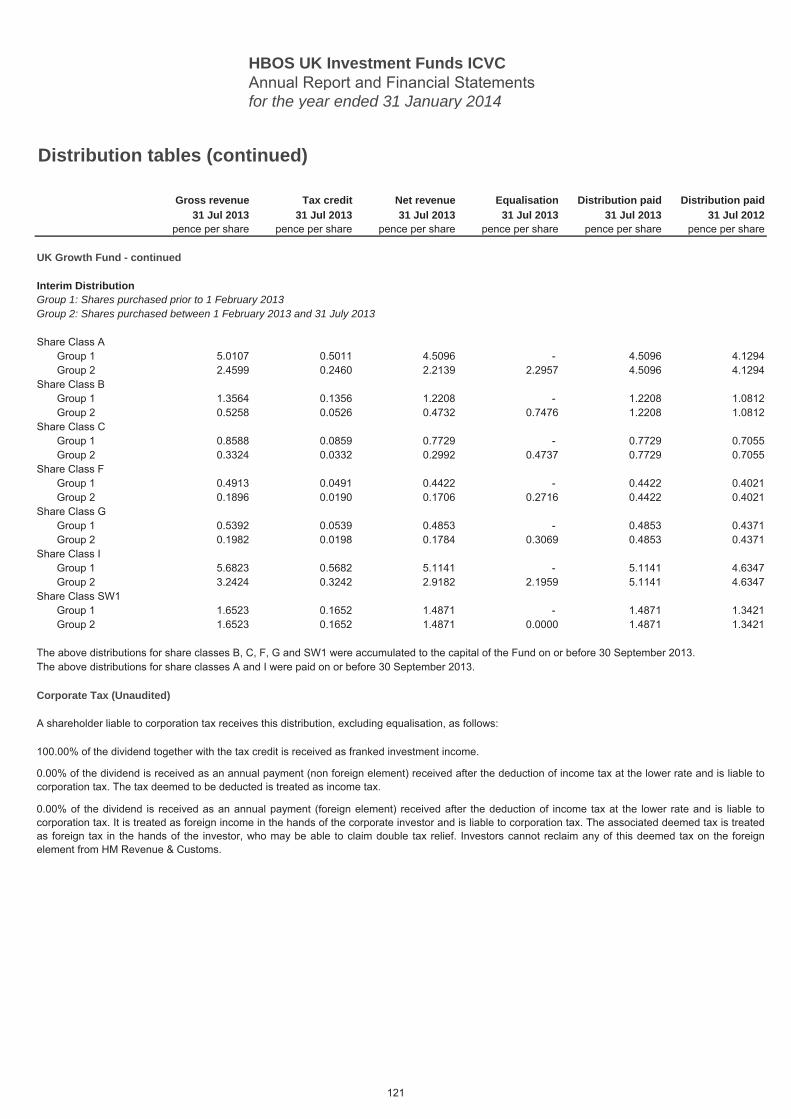
HBOS UK Investment Funds ICVCAnnual Report and Financial Statementsfor the year ended 31 January 2014
Distribution tables (continued)
Gross revenue Tax credit Net revenue Equalisation Distribution paid Distribution paid31 Jul 2013 31 Jul 2013 31 Jul 2013 31 Jul 2013 31 Jul 2013 31 Jul 2012
pence per share pence per share pence per share pence per share pence per share pence per share
UK Growth Fund - continued
Interim Distribution
Share Class AGroup 1 5.0107 0.5011 4.5096 - 4.5096 4.1294Group 2 2.4599 0.2460 2.2139 2.2957 4.5096 4.1294
Share Class BGroup 1 1.3564 0.1356 1.2208 - 1.2208 1.0812Group 2 0.5258 0.0526 0.4732 0.7476 1.2208 1.0812
Share Class CGroup 1 0.8588 0.0859 0.7729 - 0.7729 0.7055Group 2 0.3324 0.0332 0.2992 0.4737 0.7729 0.7055
Share Class FGroup 1 0.4913 0.0491 0.4422 - 0.4422 0.4021Group 2 0.1896 0.0190 0.1706 0.2716 0.4422 0.4021
Share Class GGroup 1 0.5392 0.0539 0.4853 - 0.4853 0.4371Group 2 0.1982 0.0198 0.1784 0.3069 0.4853 0.4371
Share Class IGroup 1 5.6823 0.5682 5.1141 - 5.1141 4.6347Group 2 3.2424 0.3242 2.9182 2.1959 5.1141 4.6347
Share Class SW1Group 1 1.6523 0.1652 1.4871 - 1.4871 1.3421Group 2 1.6523 0.1652 1.4871 0.0000 1.4871 1.3421
The above distributions for share classes B, C, F, G and SW1 were accumulated to the capital of the Fund on or before 30 September 2013.The above distributions for share classes A and I were paid on or before 30 September 2013.
Corporate Tax (Unaudited)
A shareholder liable to corporation tax receives this distribution, excluding equalisation, as follows:
Group 2: Shares purchased between 1 February 2013 and 31 July 2013Group 1: Shares purchased prior to 1 February 2013
0.00% of the dividend is received as an annual payment (foreign element) received after the deduction of income tax at the lower rate and is liable tocorporation tax. It is treated as foreign income in the hands of the corporate investor and is liable to corporation tax. The associated deemed tax is treatedas foreign tax in the hands of the investor, who may be able to claim double tax relief. Investors cannot reclaim any of this deemed tax on the foreignelement from HM Revenue & Customs.
100.00% of the dividend together with the tax credit is received as franked investment income.
0.00% of the dividend is received as an annual payment (non foreign element) received after the deduction of income tax at the lower rate and is liable tocorporation tax. The tax deemed to be deducted is treated as income tax.
121
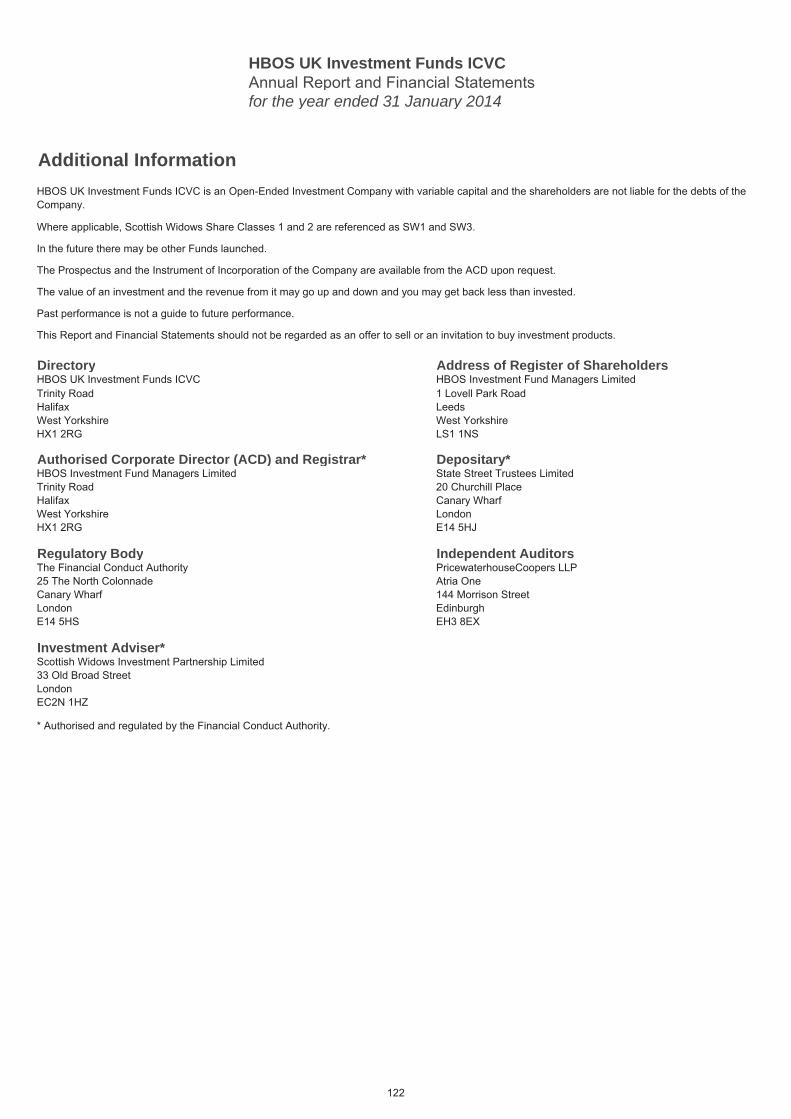
HBOS UK Investment Funds ICVCAnnual Report and Financial Statementsfor the year ended 31 January 2014
Additional Information
Investment Adviser*
* Authorised and regulated by the Financial Conduct Authority.
HBOS UK Investment Funds ICVC is an Open-Ended Investment Company with variable capital and the shareholders are not liable for the debts of the Company.
In the future there may be other Funds launched.
Where applicable, Scottish Widows Share Classes 1 and 2 are referenced as SW1 and SW3.
This Report and Financial Statements should not be regarded as an offer to sell or an invitation to buy investment products.
The Prospectus and the Instrument of Incorporation of the Company are available from the ACD upon request.
The value of an investment and the revenue from it may go up and down and you may get back less than invested.
Past performance is not a guide to future performance.
Address of Register of Shareholders
1 Lovell Park RoadLeedsWest YorkshireLS1 1NS
Trinity RoadHalifaxWest Yorkshire HX1 2RG
DirectoryHBOS UK Investment Funds ICVC HBOS Investment Fund Managers Limited
Investment Adviser*
Authorised Corporate Director (ACD) and Registrar* Depositary*HBOS Investment Fund Managers LimitedTrinity RoadHalifaxWest Yorkshire HX1 2RG
State Street Trustees Limited20 Churchill PlaceCanary WharfLondonE14 5HJ
Regulatory Body Independent AuditorsThe Financial Conduct Authority25 The North ColonnadeCanary WharfLondon E14 5HS
PricewaterhouseCoopers LLPAtria One 144 Morrison Street Edinburgh EH3 8EX
Scottish Widows Investment Partnership Limited33 Old Broad StreetLondon EC2N 1HZ
€ -
122

HBOS Investment Fund Managers Limited. Registered Office: Trinity Road, Halifax, West Yorkshire HX1 2RG.Registered in England No. 941082.
Authorised and regulated by the Financial Conduct Authority, 25 The North Colonnade, Canary Wharf, London, E14 5HS.
49131 RANDA 05/14