next-generation performance- based regulation - nrel · pdf filenext-generation...
TRANSCRIPT

Contract No. DE-AC36-08GO28308 Contract No. DE-AC36-08GO28308
Technical Report NREL/TP-6A50-68512 September 2017
Next-Generation Performance-Based Regulation Emphasizing Utility Performance to Unleash Power Sector Innovation
David Littell, Camille Kadoch, Phil Baker, Ranjit Bharvirkar, Max Dupuy, Brenda Hausauer, Carl Linvill, Janine Migden-Ostrander, Jan Rosenow, and Wang Xuan Regulatory Assistance Project
Owen Zinaman and Jeffrey Logan National Renewable Energy Laboratory
NREL is a national laboratory of the U.S. Department of Energy Office of Energy Efficiency & Renewable Energy Operated by the Alliance for Sustainable Energy, LLC
Contract No. DE-AC36-08GO28308 Contract No. DE-AC36-08GO28308
Next-Generation Performance-Based Regulation Emphasizing Utility Performance to Unleash Power Sector Innovation
David Littell, Camille Kadoch, Phil Baker, Ranjit Bharvirkar, Max Dupuy, Brenda Hausauer, Carl Linvill, Janine Migden-Ostrander, Jan Rosenow, and Wang Xuan Regulatory Assistance Project
Owen Zinaman and Jeffrey Logan National Renewable Energy Laboratory
Technical Report NREL/TP-6A50-68512 September 2017
This publication was reproduced from the best available copy submitted by the subcontractor and received minimal editorial review at NREL.
NOTICE
This report was prepared as an account of work sponsored by an agency of the United States government. Neither the United States government nor any agency thereof, nor any of their employees, makes any warranty, express or implied, or assumes any legal liability or responsibility for the accuracy, completeness, or usefulness of any information, apparatus, product, or process disclosed, or represents that its use would not infringe privately owned rights. Reference herein to any specific commercial product, process, or service by trade name, trademark, manufacturer, or otherwise does not necessarily constitute or imply its endorsement, recommendation, or favoring by the United States government or any agency thereof. The views and opinions of authors expressed herein do not necessarily state or reflect those of the United States government or any agency thereof.
This report is available at no cost from the National Renewable Energy Laboratory (NREL) at www.nrel.gov/publications.
Available electronically at SciTech Connect http:/www.osti.gov/scitech
Available for a processing fee to U.S. Department of Energy and its contractors, in paper, from:
U.S. Department of Energy Office of Scientific and Technical Information P.O. Box 62 Oak Ridge, TN 37831-0062 OSTI http://www.osti.gov Phone: 865.576.8401 Fax: 865.576.5728 Email: [email protected]
Available for sale to the public, in paper, from: U.S. Department of Commerce National Technical Information Service 5301 Shawnee Road Alexandria, VA 22312 NTIS http://www.ntis.gov Phone: 800.553.6847 or 703.605.6000 Fax: 703.605.6900 Email: [email protected]
NREL prints on paper that contains recycled content.
iii
Acknowledgments The authors would like to thank the Advisory Group for this report, who provided invaluable guidance and comments:
• Peter Fox-Penner, Boston University Institute for Sustainable Energy
• Marcelino Madrigal Martínez, Energy Regulatory Commission (CRE), Mexico
• Ann McCabe, Consultant
• Susan Tierney, Analysis Group
• Richard Sedano and Frederick Weston, The Regulatory Assistance Project.
We also acknowledge the comments and reviews by Douglas Arent of NREL and the 21st Century Power Partnership. The authors, however, are solely responsible for the accuracy and completeness of this study.
iv
Table of Contents 1 Introduction ........................................................................................................................................... 1 2 Brief Review of Performance-Based Regulation in Current Power Systems ................................. 3
2.1 Examples of Well-Functioning PBRs ........................................................................................... 3 2.1.1 The United Kingdom’s Revenues = Incentives + Innovation + Outputs (RIIO) ............. 3 2.1.2 United States .................................................................................................................... 5 2.1.3 Denmark ......................................................................................................................... 10 2.1.4 Mexico ............................................................................................................................ 11 2.1.5 South Africa ................................................................................................................... 12
2.2 What Worked? ............................................................................................................................. 13 2.2.1 Discrete take-aways........................................................................................................ 13 2.2.2 Measure Outputs and Focus on Outcomes ..................................................................... 15 2.2.3 Focus on Metrics with Clear Measurement Methods and Meaningful Impacts ............. 16
2.3 What Didn’t Work? ..................................................................................................................... 17 2.3.1 Examples of What Didn’t Work ..................................................................................... 17 2.3.2 Examples of What Didn’t Work Initially but Was Fixed ............................................... 18 2.3.3 Lessons Learned from What Did Not Work? ................................................................. 20
3 How Performance-Based Regulation Can Support Power Sector Transformation ..................... 23 3.1 What’s Changing ......................................................................................................................... 23
3.1.1 Penetration of Disruptive Technologies ......................................................................... 23 3.2 What Do We Not Know About What’s Changing? .................................................................... 27 3.3 Regulation for the Era of Disruptive Technology ....................................................................... 28
4 Institutional Arrangements, Utility Composition and Ownership Structure Matters .................. 29 4.1 The Utility Type .......................................................................................................................... 30 4.2 Utility Ownership Structures ....................................................................................................... 31
4.2.1 Regions with Investor-Owned Utilities .......................................................................... 31 4.2.2 Regions with State, Provincial or other Governmental Ownership of Utilities ............. 31 4.2.3 Investor-Owned and State-Owned-Utility Contexts ...................................................... 32
4.3 Institutional Arrangements Allocate Costs and Risk................................................................... 33 4.4 Examples of Underperforming Institutional Arrangements ........................................................ 34
5 Elements of a Successful PBR Mechanism ..................................................................................... 35 5.1 Clear Goal Setting ....................................................................................................................... 36 5.2 Identification of Clear and Measurable Metrics .......................................................................... 39 5.3 Establish Transparency at Each Step ........................................................................................... 40 5.4 Make Value to the Public Clear .................................................................................................. 43 5.5 Align Benefits and Rewards ........................................................................................................ 43 5.6 Learn from Experience ................................................................................................................ 44 5.7 Compared to What? ..................................................................................................................... 44 5.8 Simple Designs are Good ............................................................................................................ 44 5.9 Evaluation and Verification......................................................................................................... 45
6 Steps and Options for Establishing and Implementing Successful PBRs ................................... 46 6.1 Design Elements to Consider in Establishing and Implementing Successful PBRs ................... 46
6.1.1 How performance levels are set ..................................................................................... 46 6.1.2 Evaluation, Measurement & Verification ...................................................................... 47
6.2 Specific design options ................................................................................................................ 48 6.2.1 No Explicit Incentive ..................................................................................................... 48 6.2.2 Shared Net Benefits ........................................................................................................ 49 6.2.3 Program Costs Adders and Target Bonuses ................................................................... 50 6.2.4 Base Return on Equity + Performance Incentive Payments to Reach Maximum
ROE Cap ........................................................................................................................ 50
v
6.2.5 Bonus ROE for Capital for Projects or Programs .......................................................... 51 6.2.6 Base Incentives on kWh Reduction Targets .................................................................. 51 6.2.7 Peak Reduction Targets .................................................................................................. 52 6.2.8 Every Employee with a PBR Goal, Target and Metric? ................................................ 53
7 Innovative Performance-based Regulation Approaches ............................................................... 55 7.1 Areas ripe for PBR ...................................................................................................................... 55
7.1.1 Incentives for Water Savings ......................................................................................... 55 7.1.2 Greenhouse Gas Emissions Performance ....................................................................... 56 7.1.3 Locational metrics for reliability or High-Cost areas DER deployment ........................ 56 7.1.4 Incentives for EV rate education and charging station deployment ............................... 58 7.1.5 Compliance with Codes of Conduct in Support of Competition .................................... 59
7.2 Innovative PBR’s that are in Operation ...................................................................................... 61 7.2.1 Incentives for DER Implementation............................................................................... 61 7.2.2 Incentives for Sharing Utility Data ................................................................................ 65 7.2.3 Renewable Energy Performance Metrics ....................................................................... 65 7.2.4 Operational Incentives: Improved Power Plant Performance ........................................ 66 7.2.5 Operational Incentives: Improved Interconnection Request Response Times ............... 67 7.2.6 Operational Incentives: Differing Approaches to Achieving System Efficiency........... 69 7.2.7 Operational Efficiency: Financial Solvency Linked to Efficiency Improvement .......... 73 7.2.8 Operational Metrics: Reliability ..................................................................................... 76 7.2.9 Modified Fuel Adjustment Clauses to Address Higher Ramping Rates for Integration
of Renewables ................................................................................................................ 78 7.2.10 Performance-Based Regulatory Approaches to Promote Customer Empowerment ...... 78 7.2.11 Performance-Based Regulatory Approaches to Support Competition ........................... 81 7.2.12 Peak Load Reduction Enabled by Demand Response .................................................... 82 7.2.13 Customers Enrolled in Time-Varying Rates .................................................................. 82 7.2.14 PBR for Smart Meter Deployment ................................................................................. 83
8 Conclusion .......................................................................................................................................... 87
vi
List of Figures Figure 0. Present status and adjacent pathways to power system transformation........................... xv Figure 1. RIIO Outputs ................................................................................................................................ 5 Figure 2. Sources of utility revenue within NY REV ................................................................................ 7 Figure 3. Different state approaches to energy efficiency ...................................................................... 9 Figure 4. Identification of regional Danish DSOs with poor quality of supply ................................... 10 Figure 5. Predicted energy consumption compared to actual energy consumption, 1945–2005. ... 28 Figure 6. Metrics continuum .................................................................................................................... 40 Figure 7. UDAY State/DISCOM Quarterly Performance Ranking ......................................................... 76 Figure 8. Customer satisfaction in the UK ............................................................................................. 79
List of Tables Table 1. Mandated Timeframe for DG Interconnection Application Processing ................................ 12 Table 2. Utility Code of Conduct Areas ................................................................................................... 60 Table 3. Draft Performance Metrics by Area .......................................................................................... 73 Table 4. Puerto Rico Metrics for Customer Empowerment .................................................................. 80
List of Text Boxes Areas Ripe for PBR .................................................................................................................................... xi Innovative PBRs that are in operation .................................................................................................... xii Illustrative Example of Danish Quality of Supply Benchmark ............................................................. 10 Text Box 1. The multiple benefits of Multi-Year Rate Plans ................................................................. 14 Text Box 2. Clarity and Measurement Methodology are Important ..................................................... 21 Text Box 3. Transformative Technologies from the Past Increase Customer Control ...................... 30 Key PBR Terminology .............................................................................................................................. 37 Text Box 4. Long-term goals and costs are important .......................................................................... 38 Text Box 5. Transparency in the United Kingdom’s RIIO framework .................................................. 42 Text Box 6. Poorly designed bonus ROE example ................................................................................ 51 Text Box 7. Non-Wires Alternative Requirement in California ............................................................. 63
vii
List of Acronyms BAU Business As Usual
CAPEX Capital Expenditures
CEM Clean Energy Ministerial
CHP Combine Heat and Power
COS Cost of Service
CPUC California Public Utility Commission
DER Distributed Energy Resources
DPV Distributed Photovoltaics
DSO Distribution System Operator
DSP Distribution System Provider
EAM Earnings Adjustment Mechanism
EE Energy Efficiency
EM&V Evaluation, Measurement &Verification
ESCO Energy Services Company
EV Electric Vehicle
FERN Fair Electric Rates Now
ICT Information and Communication Technology
MW Megawatt
MWh Megawatt Hour
NEM Net Energy Metering
NPV Net Present Value
NREL National Renewable Energy Laboratory
NY REV New York’s Reforming the Energy Vision
NY-PSC New York Public Service Commission
OPEX Operational Expenditures
PBR Performance Based Regulation
PIM Performance Incentive Mechanism
viii
PREC Puerto Rico Energy Commission
PREPA Puerto Rico Electric Power Authority
PSR Public Service Revenues
RIIO Revenues = Incentives + Innovation +Outputs (UK)
SAIDI System Average Interruption Duration Index
SAIFI System Average Interruption Frequency Index
SOE State Owned Entity
TOTEX Total Expenditures
TSO Transmission System Operator
VRE Variable Renewable Energy
ix
Executive Summary Performance-based regulation (PBR) enables regulators to reform hundred-year-old regulatory structures to unleash innovations within 21st century power systems. An old regulatory paradigm built to ensure safe and reliable electricity at reasonable prices from capital-intensive electricity monopolies is now adjusting to a new century of disruptive technological advances that change the way utilities make money and what value customers expect from their own electricity company.
Advanced technologies are driving change in power sectors around the globe. Innovative technologies are transforming the way electricity is generated, delivered, and consumed. These emerging technology drivers include renewable generation, distributed energy resources such as distributed generation and energy storage, demand-side management measures such as demand-response, electric vehicles, and smart grid technologies and energy efficiency (EE).
Today, average residential customers are increasingly able to control their energy usage and even become grid resources, something not contemplated in the 20th century era of large, centrally operated generating plants. There are now new energy capabilities throughout the power sector: traditional centralized power generation and transmission are being supplemented with customer-sited generation, energy management and energy efficiency solutions, and energy storage.
PBR enables regulators to recognize the value that electric utilities bring to customers by enabling these advanced technologies and integrating smart solutions into the utility grid and utility operations. These changes in the electric energy system and customer capacities means that there is an increasing interest in motivating regulated entities in other areas beyond traditional cost-of-service performance regulation.
The ongoing transformation to a more efficient and more complex grid means the utility business models are changing, too. Utilities in many advanced economies that historically have grown by building new power plants and large transmission lines are now adjusting to lower—or even flat—growth in electricity usage. 1 Some utility business models are being challenged as they face less demand for electricity sales, and all are facing increasing demands for new services and uses of their system. With this transformation, utilities worldwide are increasingly finding themselves delivering value to customers with different needs, who want to use electricity in different ways and sometimes offer value back to the utilities.
Performance-Based Regulation provides a regulatory framework to connect goals, targets, and measures to utility performance, executive compensation, and investor returns. For some enterprises, PBRs determine utility revenue or shareholder earnings based on specific performance metrics and other non-investment factors. Non-investment factors can be particularly important for state-owned utility enterprises (SOEs), such as providing low-cost service and being responsive to government mandates. For utilities of all types, PBR can strengthen the incentives of utilities to deliver value to customers.
1 However, there are many advancing economies where demand for electricity continues to grow between 3 to 10 percent, such as Mexico, Indonesia, China, Vietnam, Brazil, etc.
x
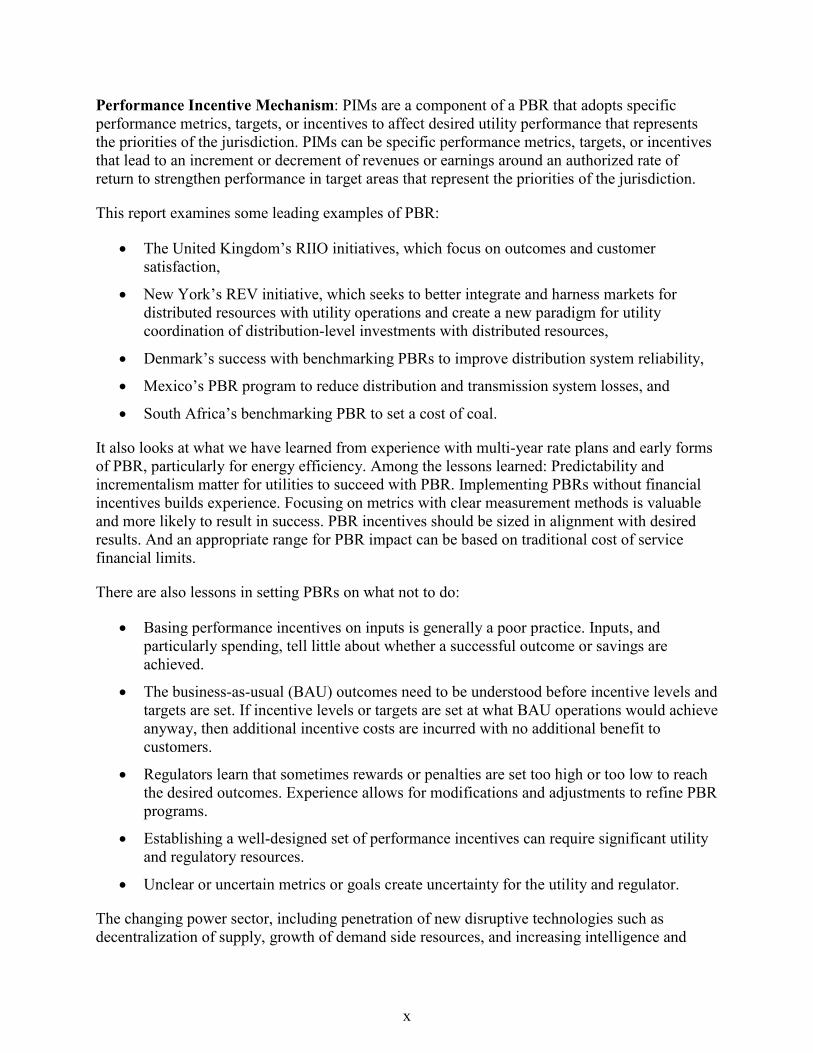
Performance Incentive Mechanism: PIMs are a component of a PBR that adopts specific performance metrics, targets, or incentives to affect desired utility performance that represents the priorities of the jurisdiction. PIMs can be specific performance metrics, targets, or incentives that lead to an increment or decrement of revenues or earnings around an authorized rate of return to strengthen performance in target areas that represent the priorities of the jurisdiction.
This report examines some leading examples of PBR:
• The United Kingdom’s RIIO initiatives, which focus on outcomes and customer satisfaction,
• New York’s REV initiative, which seeks to better integrate and harness markets for distributed resources with utility operations and create a new paradigm for utility coordination of distribution-level investments with distributed resources,
• Denmark’s success with benchmarking PBRs to improve distribution system reliability,
• Mexico’s PBR program to reduce distribution and transmission system losses, and
• South Africa’s benchmarking PBR to set a cost of coal.
It also looks at what we have learned from experience with multi-year rate plans and early forms of PBR, particularly for energy efficiency. Among the lessons learned: Predictability and incrementalism matter for utilities to succeed with PBR. Implementing PBRs without financial incentives builds experience. Focusing on metrics with clear measurement methods is valuable and more likely to result in success. PBR incentives should be sized in alignment with desired results. And an appropriate range for PBR impact can be based on traditional cost of service financial limits.
There are also lessons in setting PBRs on what not to do:
• Basing performance incentives on inputs is generally a poor practice. Inputs, and particularly spending, tell little about whether a successful outcome or savings are achieved.
• The business-as-usual (BAU) outcomes need to be understood before incentive levels and targets are set. If incentive levels or targets are set at what BAU operations would achieve anyway, then additional incentive costs are incurred with no additional benefit to customers.
• Regulators learn that sometimes rewards or penalties are set too high or too low to reach the desired outcomes. Experience allows for modifications and adjustments to refine PBR programs.
• Establishing a well-designed set of performance incentives can require significant utility and regulatory resources.
• Unclear or uncertain metrics or goals create uncertainty for the utility and regulator.
The changing power sector, including penetration of new disruptive technologies such as decentralization of supply, growth of demand side resources, and increasing intelligence and
xi
digitalization of networks will also change what regulation looks like in an era of disruptive technologies. Given unprecedented changes underway in the electricity sector, performance-based regulation—by specifying expectations of utility performance and outcomes for consumers, while staying agnostic to the exact means of delivery—constitutes a form of prescient regulation that harnesses disruption. PBR is one tool in a broader toolbox in the transition toward flexible regulatory and market structures that rewards utilities that adapt or evolve in reaction to market and technology change.
Well-designed PBR provides incentives for utility performance, and benefits consumers and utility owners alike. This report considers the role of both PBR and more discrete PIMs in 21st century power-sector transformation. It concludes that PBR has the potential to realign utility, investor, and consumer incentives, and mitigate emerging challenges to the utility business model, alleviate the challenges of and accelerate renewable integration, and even address cyber security concerns.
PBR that succeeds often does so because it relies on clear goal setting, uses a simple design, makes value of the utility service clear, and is transparent at each step. Alignment of incentives and benefits for customers and ratepayers tends to make the relationship of the cost of incentives and value of performance easier to understand. Metrics that are clearly identified with objective information support ease of implementation, accountability and the transparency of the value proposition to regulators, utility management, customers, policy-makers, and the public.
Depending on the PBR goals and needs of each jurisdiction there are number of proven PBR and PIM design options including shared net benefits, program cost adders, target bonuses, base return on equity (ROE) incentive payments, bonus ROEs for capital, incentives for kWh targets, peak reduction, and penetration measures for distributed energy resources (DERs).
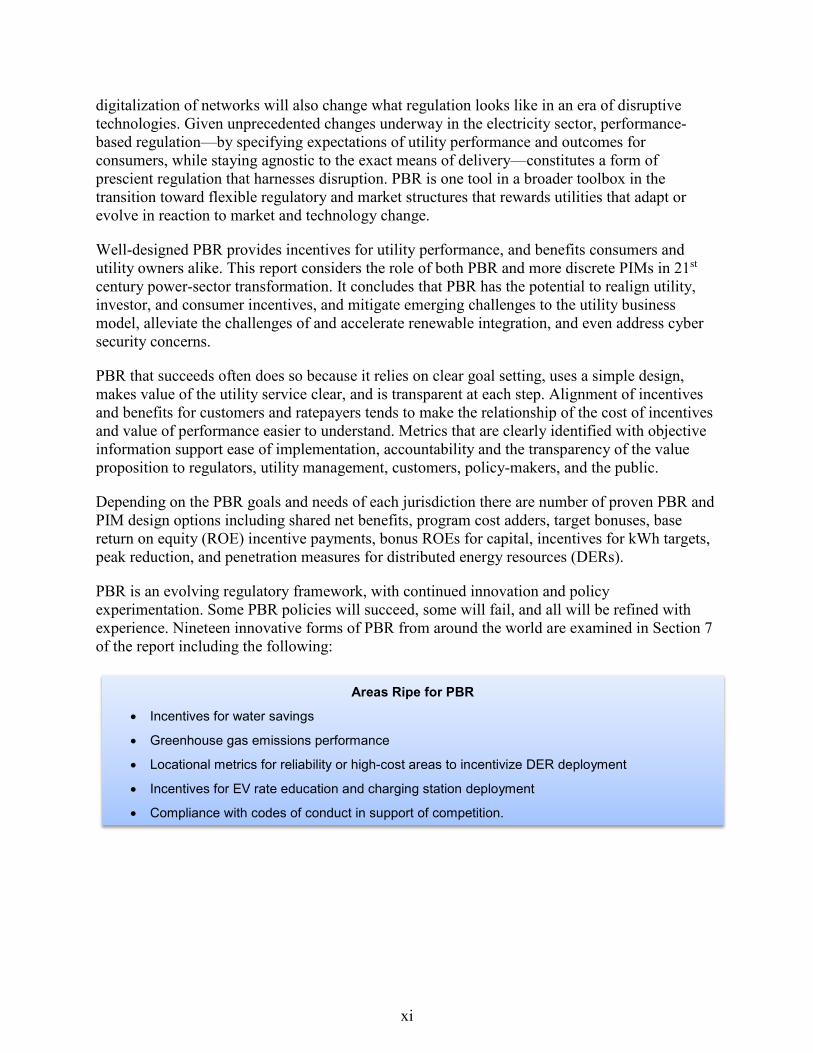
PBR is an evolving regulatory framework, with continued innovation and policy experimentation. Some PBR policies will succeed, some will fail, and all will be refined with experience. Nineteen innovative forms of PBR from around the world are examined in Section 7 of the report including the following:
Areas Ripe for PBR
• Incentives for water savings
• Greenhouse gas emissions performance
• Locational metrics for reliability or high-cost areas to incentivize DER deployment
• Incentives for EV rate education and charging station deployment
• Compliance with codes of conduct in support of competition.
xii
Electricity is historically a commodity product delivered by a monopoly service provider. Increasingly today, electricity is also an enhanced value service. PBR enables regulators to compensate utilities for the value utilities capture for the grid, customers, and society. While some analysts believe that PBR is only applicable to developed economies, this report takes a different view, mainly that well designed PBR is a valuable tool to be applied in a variety of economic and technological situations worldwide. PBR requires capable regulators but not necessarily mature economies.
PBR and PIMs have great value for the electric industry when designed well and can be applied to many different situations. How exactly PBR mechanisms are most effectively enacted will vary based upon the utility ownership model, institutional arrangements, and a variety of other local factors. PBR should be tailored to the needs and goals of each jurisdiction, and perhaps each utility, to most effectively achieve the needs of a 21st century power grid in that jurisdiction. PBR has a growing history, and this report highlights the lessons learned from this history, and indicates considerations for how PBR may be best applied. PBR will continue to evolve, and the lessons learned from new applications will continue to accrue.
Electric utilities are embedded in an increasingly sophisticated technological society. The power sector often represents progress in developing countries. In all jurisdictions, utilities enable achievement of important societal goals. Performance regulation is regulation where anyone can know how good utilities are at delivering on clearly-stated expectations and, in its higher form,
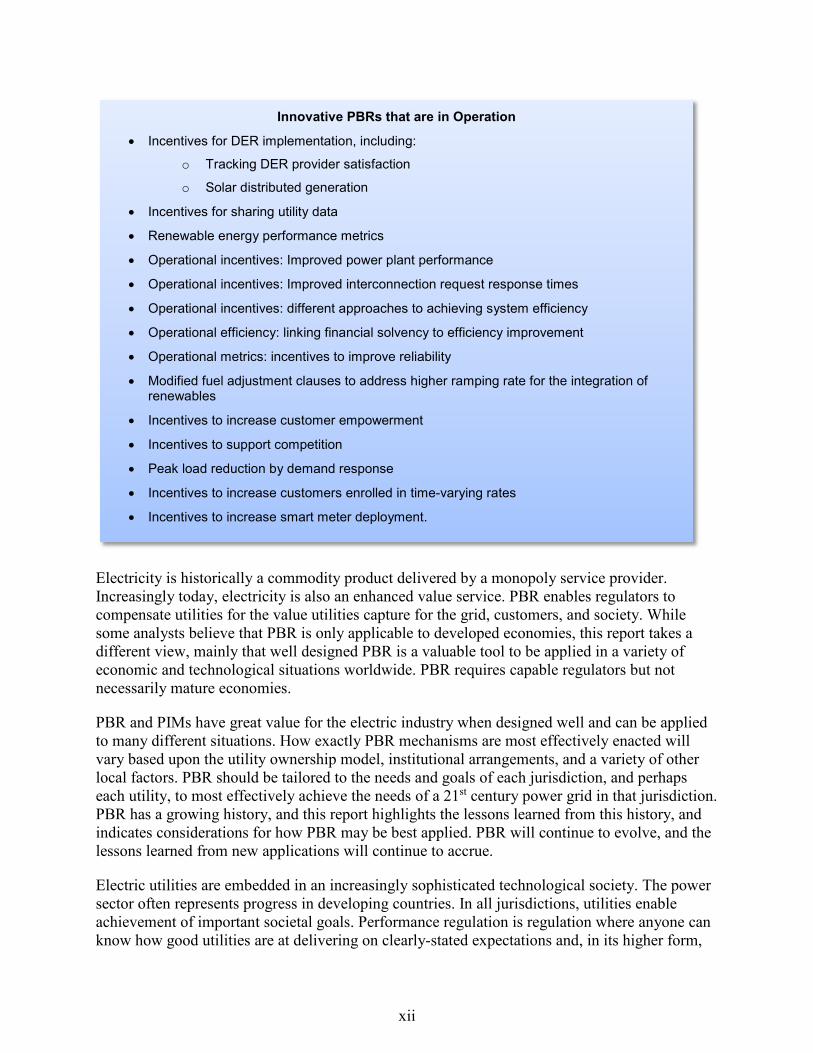
Innovative PBRs that are in Operation
• Incentives for DER implementation, including:
o Tracking DER provider satisfaction
o Solar distributed generation
• Incentives for sharing utility data
• Renewable energy performance metrics
• Operational incentives: Improved power plant performance
• Operational incentives: Improved interconnection request response times
• Operational incentives: different approaches to achieving system efficiency
• Operational efficiency: linking financial solvency to efficiency improvement
• Operational metrics: incentives to improve reliability
• Modified fuel adjustment clauses to address higher ramping rate for the integration of renewables
• Incentives to increase customer empowerment
• Incentives to support competition
• Peak load reduction by demand response
• Incentives to increase customers enrolled in time-varying rates
• Incentives to increase smart meter deployment.
xiii
where management is strongly motivated to deliver on public goals as well as internal and fiduciary goals.
This report addresses best practices gleaned from more than two decades of PBR in practice, and analyzes how those best practices and lessons can be used to design innovative PBR programs. Readers looking for an introduction to PBR may want to focus on Chapters 1-5. Chapters 6 and 7 contain more detail for those interested in the intricate workings of PBR or particularly innovative PBR. In order to assist readers to find the information most relevant for them, we provide a brief synopsis of the chapters below:
• Chapter 1 introduces PBR and PIMs, and provides a brief review of this report.
• Chapter 2 starts out with a survey of example of successful PBR programs from the United Kingdom, the United States, Denmark, Mexico, and South America. It then highlights some discrete take-aways from these and other successful programs, and highlights some important lessons, such as the importance of focusing on outcomes rather than the outputs of a mechanism, and to focus on metrics with clear measurement methods and meaningful impacts. The chapter then looks at PBR programs that did not work, and also those that did not work initially but were able to be fixed. It then extracts lessons learned from these examples and provides a list of distinct elements that are problematic for PBR mechanisms.
• Chapter 3 describes current technological trends in the power sector, and evaluates how these trends are changing the current structure. These trends include the penetration of disruptive technologies, decentralization of supply, the enrollment of the demand-side in the power sector, increasing cross-sectoral integration and increasing intelligence, and digitalization of networks. The chapter then goes on to explore how these trends are challenging the current system and how PBR can play a role in power sector transformation.
• Chapter 4 discusses the importance of understanding the incentives inherent in institutional arrangements, utility composition, and ownership structure. It is important to examine these structures and evaluate the incentives that are inherent in it. This is because an understanding of the institutional arrangements and the corresponding incentives or disincentives that have evolved over time is critical to being able to successfully build a PBR that can influence institutional behavior to achieve different outcomes. Factors that are important in this analysis include determining the utility type, by which we mean whether the utility provides generation, transmission, and distribution services as well as natural gas and even water service, or any combination of all of these, as this will affect how it responds to incentives. The ownership structure of the utility is also important, as it determines the type of incentive structure that will have traction on the specific utility.
• Chapter 5 offers best practices for development and design of successful PBR mechanisms. It focuses on the design process itself, and principles for the approach of specific elements of the mechanism. This chapter is intended to provide guidance to decision makers as they craft PBR mechanisms for their respective jurisdictions. This chapter details nine best practices that are important to successful PBR mechanisms.
xiv
There is no “cookbook” to create a PBR mechanism, because specific jurisdictional considerations will require modification and thought.
• Chapter 6 provides a listing of various PBR design elements that could be incorporated into specific jurisdictions. Not all of these elements will be used in every mechanism, but some of the design elements will be useful for readers to consider during the design process.
• Chapter 7 features examples of innovative PBR designs from around the world. These examples are meant to show readers the wide range of ways PBR can be used, and the variety of goals the mechanisms can achieve. Some of the examples are theoretical and are suggestions for new ways to apply PBR, while others are real-world examples.
• Chapter 8 provides concluding thoughts on PBR and the role of PBR in determining the mission of the next generation utility.
xv
Preface The 21st Century Power Partnership (21CPP), an initiative of the Clean Energy Ministerial (CEM), has since 2012 been examining the critical issues facing the powers sector across the globe. Under the direction of the U.S. National Renewable Energy Laboratory (NREL), 21CPP provides thought leadership to identify the best ideas, models and innovations in advanced power sector, utility and governmental interfaces across a range of countries.
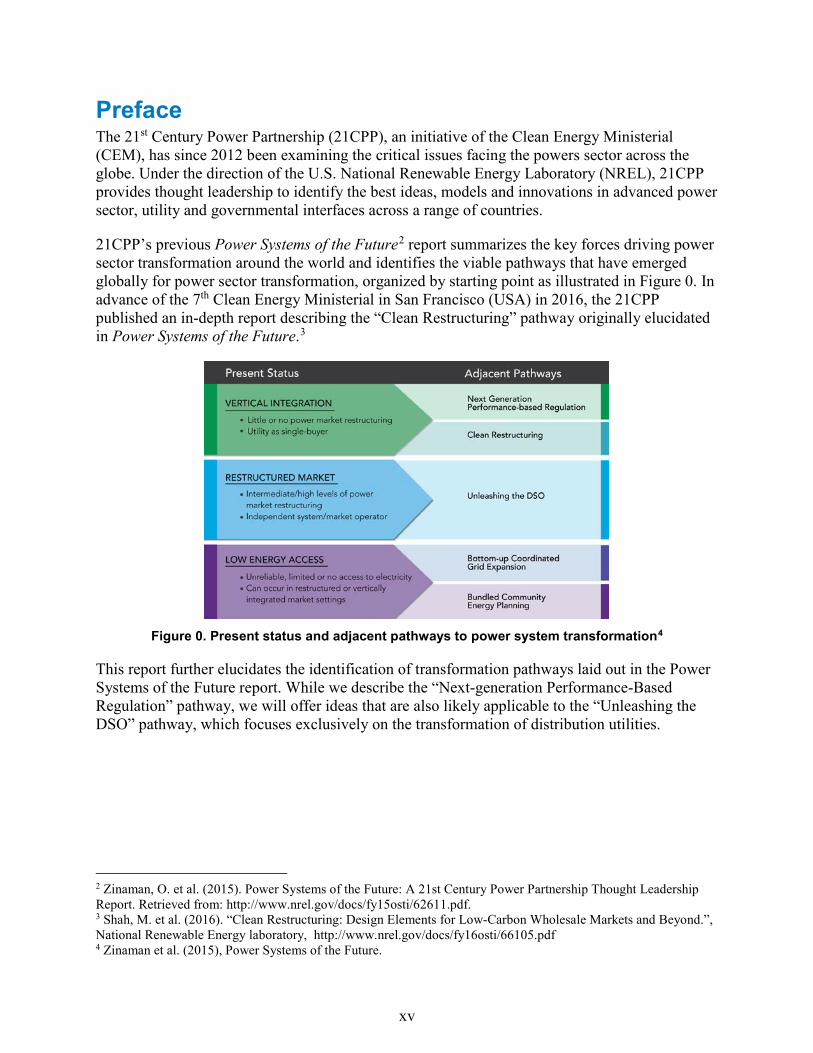
21CPP’s previous Power Systems of the Future2 report summarizes the key forces driving power sector transformation around the world and identifies the viable pathways that have emerged globally for power sector transformation, organized by starting point as illustrated in Figure 0. In advance of the 7th Clean Energy Ministerial in San Francisco (USA) in 2016, the 21CPP published an in-depth report describing the “Clean Restructuring” pathway originally elucidated in Power Systems of the Future.3
Figure 0. Present status and adjacent pathways to power system transformation4
This report further elucidates the identification of transformation pathways laid out in the Power Systems of the Future report. While we describe the “Next-generation Performance-Based Regulation” pathway, we will offer ideas that are also likely applicable to the “Unleashing the DSO” pathway, which focuses exclusively on the transformation of distribution utilities.
2 Zinaman, O. et al. (2015). Power Systems of the Future: A 21st Century Power Partnership Thought Leadership Report. Retrieved from: http://www.nrel.gov/docs/fy15osti/62611.pdf. 3 Shah, M. et al. (2016). “Clean Restructuring: Design Elements for Low-Carbon Wholesale Markets and Beyond.”, National Renewable Energy laboratory, http://www.nrel.gov/docs/fy16osti/66105.pdf 4 Zinaman et al. (2015), Power Systems of the Future.
1
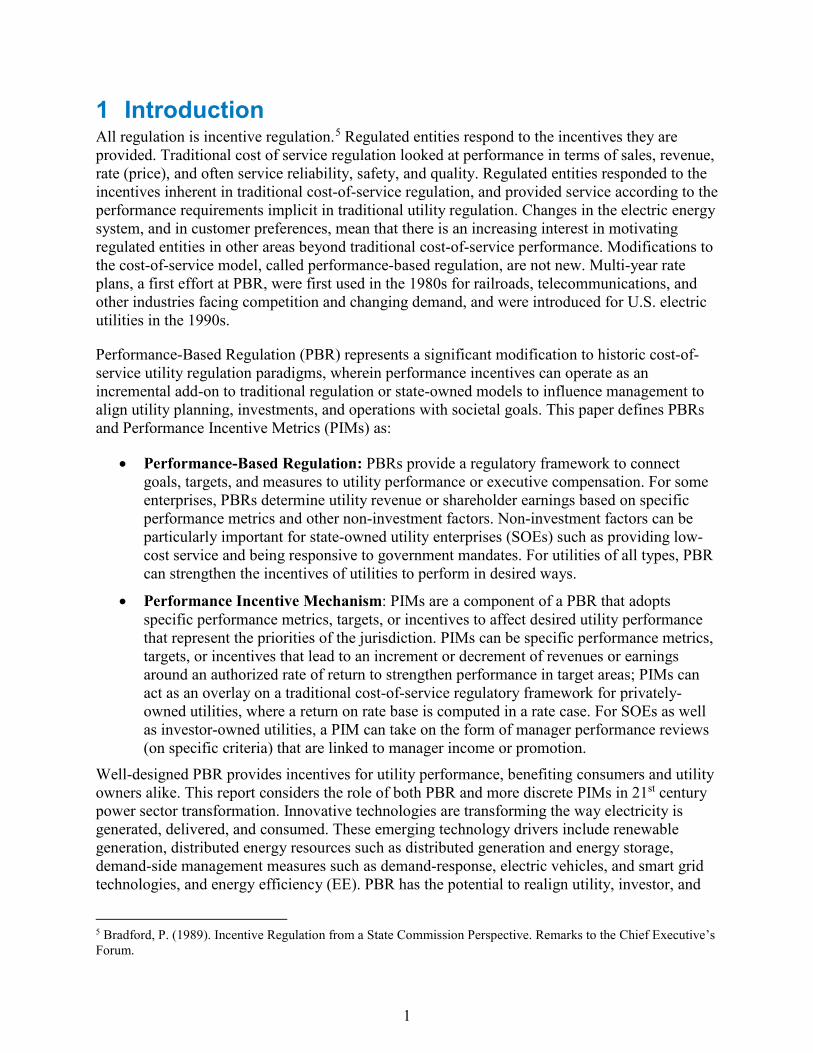
1 Introduction All regulation is incentive regulation.5 Regulated entities respond to the incentives they are provided. Traditional cost of service regulation looked at performance in terms of sales, revenue, rate (price), and often service reliability, safety, and quality. Regulated entities responded to the incentives inherent in traditional cost-of-service regulation, and provided service according to the performance requirements implicit in traditional utility regulation. Changes in the electric energy system, and in customer preferences, mean that there is an increasing interest in motivating regulated entities in other areas beyond traditional cost-of-service performance. Modifications to the cost-of-service model, called performance-based regulation, are not new. Multi-year rate plans, a first effort at PBR, were first used in the 1980s for railroads, telecommunications, and other industries facing competition and changing demand, and were introduced for U.S. electric utilities in the 1990s.
Performance-Based Regulation (PBR) represents a significant modification to historic cost-of-service utility regulation paradigms, wherein performance incentives can operate as an incremental add-on to traditional regulation or state-owned models to influence management to align utility planning, investments, and operations with societal goals. This paper defines PBRs and Performance Incentive Metrics (PIMs) as:
• Performance-Based Regulation: PBRs provide a regulatory framework to connect goals, targets, and measures to utility performance or executive compensation. For some enterprises, PBRs determine utility revenue or shareholder earnings based on specific performance metrics and other non-investment factors. Non-investment factors can be particularly important for state-owned utility enterprises (SOEs) such as providing low-cost service and being responsive to government mandates. For utilities of all types, PBR can strengthen the incentives of utilities to perform in desired ways.
• Performance Incentive Mechanism: PIMs are a component of a PBR that adopts specific performance metrics, targets, or incentives to affect desired utility performance that represent the priorities of the jurisdiction. PIMs can be specific performance metrics, targets, or incentives that lead to an increment or decrement of revenues or earnings around an authorized rate of return to strengthen performance in target areas; PIMs can act as an overlay on a traditional cost-of-service regulatory framework for privately-owned utilities, where a return on rate base is computed in a rate case. For SOEs as well as investor-owned utilities, a PIM can take on the form of manager performance reviews (on specific criteria) that are linked to manager income or promotion.
Well-designed PBR provides incentives for utility performance, benefiting consumers and utility owners alike. This report considers the role of both PBR and more discrete PIMs in 21st century power sector transformation. Innovative technologies are transforming the way electricity is generated, delivered, and consumed. These emerging technology drivers include renewable generation, distributed energy resources such as distributed generation and energy storage, demand-side management measures such as demand-response, electric vehicles, and smart grid technologies, and energy efficiency (EE). PBR has the potential to realign utility, investor, and
5 Bradford, P. (1989). Incentive Regulation from a State Commission Perspective. Remarks to the Chief Executive’s Forum.

2
consumer incentives, and mitigate emerging challenges to the utility business model, renewable integration, and even cyber security.
The history of early forms of PBR in many jurisdictions involved multi-year rate plans. The purpose of these plans was to motivate efficient operations and thus low-cost service while maintaining reliability and customer service. Traditional cost-of-service (COS) regulation essentially assumes that sales growth is a predictor of cost growth—an assumption that is clearly flawed, at least in the short run. To address this, PBR is often explicit in allowing utilities to earn higher revenue if they become more efficient by cutting cost and continuing to provide quality service.6 The PBR construct to control costs is to set utility revenue over a number of years and then allow the utility to retain all or some portion of cost savings resulting from efficiency gains. This report is not a historic review of PBR, though lessons are gleaned from that history where it is informative of how current challenges might be met.
The goals of PBRs in the form of multi-year rate plans are in many respects the same in terms of providing reasonably priced and reliable service to customers. However, today’s technologies have changed and there is more emphasis on clean energy, and thus the pathways and the potential outcomes are different than in the 20th century when centralized generator stations and large infrastructure additions dominated the utility landscape.
6 Regulatory Assistance Project. (2000). Performance-Based Regulation for Distribution Utilities. Montpelier, VT: The Regulatory Assistance Project. Retrieved from: http://www.raponline.org/wp-content/uploads/2016/05/rap-performancebasedregulationfordistributionutilities-2000-12.pdf, p. 35.
3
2 Brief Review of Performance-Based Regulation in Current Power Systems
Utilities and utility regulators across the world are experimenting with different business models and regulatory methods to address the technological, business, and economic challenges and opportunities that the 21st century has brought to the power sector. As context for a discussion around next-generation practices, below we offer some examples of what is working and why, and what might work better in the world of power utility PBR.
2.1 Examples of Well-Functioning PBRs The following are examples of PBR mechanisms worldwide that have been successful at achieving their objectives. This is not an exhaustive list of successful PBR mechanisms, but those that are known to the authors. It is also important to note that the context and jurisdiction are important: what is successful in one jurisdiction with one particular set of objectives and constraints may not succeed in another jurisdiction. As a result, there are a wide variety of PBR applications evident in diverse jurisdictions. The examples of PBR in this paper vary from, for example, energy efficiency, system reliability, transmission system efficiency, and cost of coal management to entire power sector transformation. Section 2.2 highlights lessons learned about what worked in some jurisdictions to achieve PBR goals and may offer lessons for other jurisdictions.
2.1.1 The United Kingdom’s Revenues = Incentives + Innovation + Outputs (RIIO) RIIO offers a point of departure to articulate the characteristics of next generation performance regulation. The main goal of RIIO is the ‘timely delivery of a sustainable energy sector at a lower cost to consumers than would be the case under the existing regimes’.7 RIIO is a framework which retains strong cost control incentives while attempting to focus on long-term performance, outputs, and outcomes, with less focus on ex-post review of investment costs.
A review of the previous RPI-X8 price and revenue control mechanism, instituted in the 1990s, concluded that, while there was a need for large-scale investment in low-carbon energy 7 Ofgem (2010): RIIO: A new way to regulate energy networks. Factsheet. Retrieved from: https://www.ofgem.gov.uk/ofgem-publications/64031/re-wiringbritainfs.pdf 8 The RPI-X framework had been in place since 1991 following privatisation of the energy industry. Mandel, B. (2015): The Merits of an ‘Integrated’ Approach to Performance-Based Regulation. Electricity Journal. 28(4), pp. 4-17.
This chapter offers some examples of successful PBRs from around the world, and then distills these elements into lessons learned. The chapter also briefly highlights some PBR mechanisms that did not work, and those that were fixed. This section provides the reader with real-world examples and lessons learned, both what to do and not to do, to start the PBR discussion.
• Key Point #1: PBR allows regulators to focus on whether desired outcomes will be achieved and how to achieve those goals.
• Key Point #2: The business-as-usual (BAU) outputs and outcomes need to be understood before incentive levels and targets are set based on utility history, statistical analysis, or robust and reliable models.
4
infrastructure and more effective engagement with customers, UK utilities were risk-averse, too slow to innovate, and focused on appeasing regulators rather than satisfying customers.9 There were also concerns that the previous regulatory framework encouraged a focus on capital costs containment rather than outputs, and the RPI-X framework had been modified and had become rather complex.10 RIIO, put in place in 2013, was intended to begin a transition away from the traditional approach of simply rewarding investment in networks (sometimes called the “predict and provide mentality”) under the prior regime to an outcome-based approach—a shift from inputs to outputs through revenue-based regulation overlayed with a system of financial rewards for achievement of specified goals (performance).11
The UK regulators changed their price and revenue control mechanism to remove any bias that may normally exist between capital expenses (CAPEX) and operational expenses (OPEX) that would tend to lead utilities to prefer CAPEX. This approach has been referred to as “TOTEX” (total expenditures).12 This means there is an incentive to deliver outputs rather than simply building new infrastructure. There was also an associated move from the previous five-year price control term to eight years as a reflection of the long-term nature of the investments necessary for a low-carbon transition. Output areas that emerged from a public process intended to distill regulatory priorities include:
1. Customer satisfaction 2. Network safety 3. Network reliability 4. New connection 5. Environmental impact 6. Social obligations.
RIIO separates goals into 1-year and 8-year outputs. For each price-revenue control regime (gas, electricity distribution, electricity transmission), the regulatory authority Ofgem defines deliverables (measures of success) and units for measurement where applicable (metrics). Using the example of the price-revenue control regime for gas transmission and distribution (known as RIIO-GD1) the table below shows the deliverables, incentives, and metrics for those price control regimes where applicable. Note that not all outputs are associated with incentives; this is
9 Mandel, B. (2014): A primer on utility regulation in the United Kingdom: Origins, aims, and mechanics of the RIIO model. Retrieved from: http://guarinicenter.org/wp-content/uploads/2015/01/RIIO-Issue-Brief.pdf 10 Jenkins, C. (2011): Examining the economics underlying Ofgem’s new regulatory framework. Working paper-June 2011. Florence School of Regulation Working Paper. Retrieved from: http://www.city.ac.uk/__data/assets/pdf_file/0011/80939/Jenkins_RIIO-Economics_draft-paper-FINAL.pdf 11 By “revenue-based,” we mean a method by which “target” or “allowed” revenue levels are determined by regulators and collected by means of adjustments to prices as sales vary (as they inevitably do) from expected levels. (This is what is known as decoupling in the United States.) The allowed revenues themselves may be periodically adjusted to deal with non-sales-related cost drivers, such as inflation, productivity improvements, and approved changes in investment. Such changes are often formulaic in nature, and embedded in multi-year regulatory plans. 12 The move to a total expenditure, or TOTEX, regime was first suggested by Ofgem in March 2008 when the energy regulator launched its RPI-X@20 review. From this comprehensive review of the previous regulatory regime, which had endured since privatization in 1989, emerged the RIIO (Revenue= Incentives+Innovation+Outputs) model.
5
to avoid unintended consequences (e.g., misreporting of incidents), and because some outputs are governed by other government agencies and are thus outside the control of the utility.
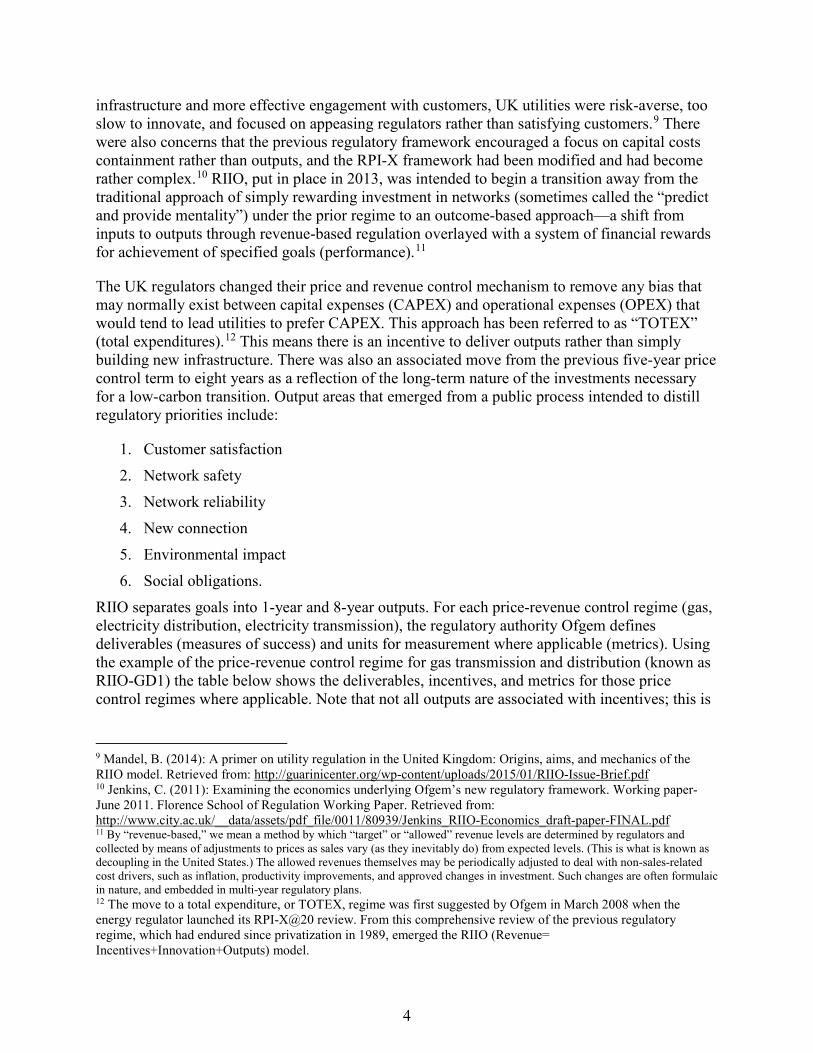
RIIO has a notable innovation: utility benchmarking and scorecards identify utilities that excel and lag. Ofgem publishes annual reports on the performance of all network companies including tables that compare performances output areas. Figure 1 shows one of the tables provided. A color code is used to indicate the level of success achieved in the last year or forecast to be achieved over the 8-year period
Figure 1. RIIO Outputs13
The more innovative elements of RIIO are addressed in Section 7.
2.1.2 United States U.S. PBR programs have successfully addressed cost-management, customer service, energy efficiency and reliability.
13 Ofgem (2016). RIIO-ED1 Annual Report 2015-16. Retrieved from: https://www.ofgem.gov.uk/system/files/docs/2017/02/riio-ed1_annual_report_2015-16_supplement.pdf
6
2.1.2.1 California California’s experience with PBR has produced some successes as well as some notable failures. Perhaps the most successful performance-based program in California is a gas utility mechanism that allows gas utilities to retain part of the proceeds from effectively managing gas supply costs on behalf of ratepayers. Gas utilities in California have established a track record of effectively purchasing and hedging gas supply. The PBR mechanism deserves credit for this success as the program consistently produces savings for ratepayers and revenue for gas utility shareholders.
A second performance based program that may have produced a beneficial outcome is the cost recovery mechanism established for Diablo Canyon Nuclear power plant. Cost overruns and project delays led to significant consumer discontent with the costs of Diablo Canyon. As a result a standard rate base focused cost recovery mechanism was rejected in favor of a performance based mechanism that made investor-owned utility Pacific Gas & Electric’s (PG&E’s) revenue recovery contingent upon the availability of the units. Diablo Canyon enjoyed a very high availability rate and operated with a very high capacity factor for much of its service life. One can reasonably infer that the performance based mechanism was at least partly responsible for this positive track record.14 The mechanism is not without its critics however. Some consumer advocates felt that the mechanism was too generous and that PG&E was not really held accountable for its relatively poor management of the construction of the facility.15 PG&E avoided billions of dollars of potential disallowed costs by accepting the mechanism, but it also was held accountable for its performance. Valid points are expressed on opposite sides of this debate and resolving them here is beyond the scope of this brief report. However, it is worth noting that this experience with “performance ratemaking” created some negative feelings toward PBR by consumer advocates that affected their receptivity to the performance-based regulatory proposals that followed.
2.1.2.2 New York’s Reforming the Energy Vision (REV) The State of New York has undertaken an ambitious effort to transform its regulatory system. New York’s effort aims to construct a regulatory system that rewards distribution utilities for high levels of customer satisfaction, facilitates power sector transformation to cleaner and more distributed resources, and increasingly focuses on outcomes rather than inputs (similar to the UK’s RIIO approach). This comprehensive effort, still in its infancy in terms of implementation, is referred to as “Reforming the Energy Vision”, or NY REV, and is led by the New York Public Service Commission (Commission).
To incubate power sector transformation, NY REV is using a form of PBR that provides for several outcome-based incentives to be implemented called Earnings Adjustment Mechanisms
14 Whited, M., Woolf, T., and Napoleon, A. (2015). Utility Performance Mechanisms: A Handbook for Regulators. Synapse Energy Economics. Retrieved from: http://www.synapse-energy.com/sites/default/files/Utility%20Performance%20Incentive%20Mechanisms%2014-098_0.pdf at pages 63-64. 15 Whited, M., Woolf, T., and Napoleon, A. (2015). Utility Performance Mechanisms: A Handbook for Regulators. Synapse Energy Economics. Retrieved from: http://www.synapse-energy.com/sites/default/files/Utility%20Performance%20Incentive%20Mechanisms%2014-098_0.pdf at pages 63-64.
7
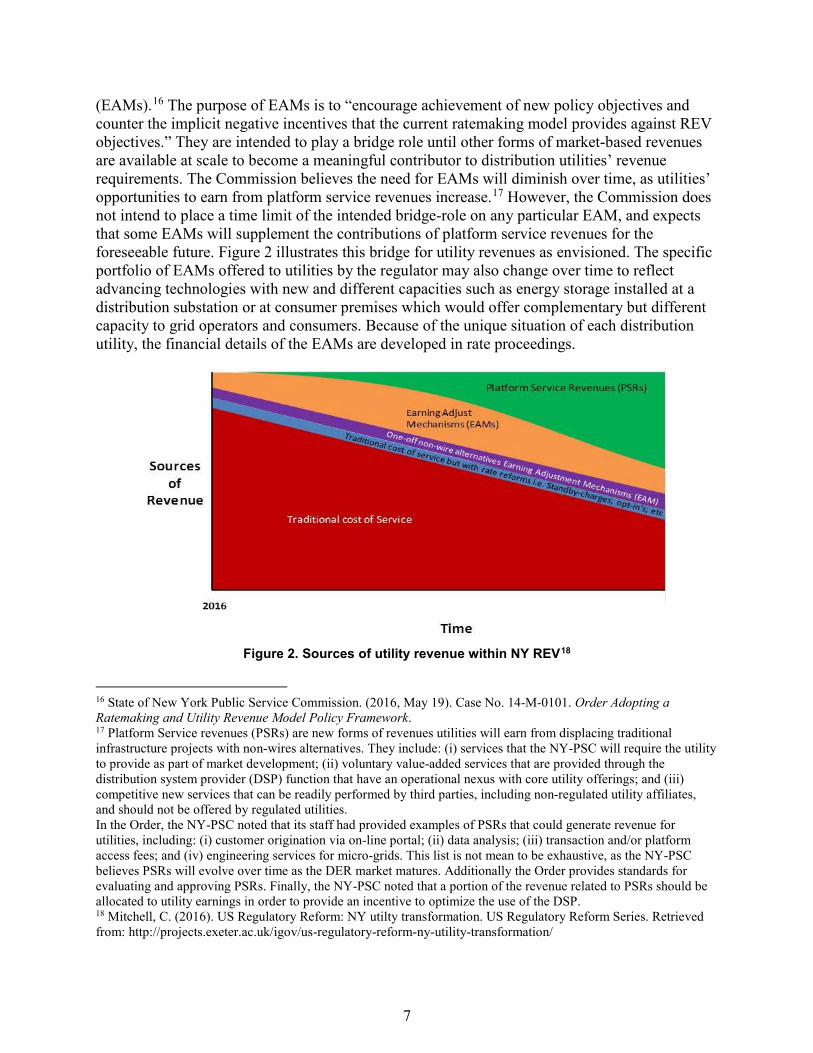
(EAMs).16 The purpose of EAMs is to “encourage achievement of new policy objectives and counter the implicit negative incentives that the current ratemaking model provides against REV objectives.” They are intended to play a bridge role until other forms of market-based revenues are available at scale to become a meaningful contributor to distribution utilities’ revenue requirements. The Commission believes the need for EAMs will diminish over time, as utilities’ opportunities to earn from platform service revenues increase.17 However, the Commission does not intend to place a time limit of the intended bridge-role on any particular EAM, and expects that some EAMs will supplement the contributions of platform service revenues for the foreseeable future. Figure 2 illustrates this bridge for utility revenues as envisioned. The specific portfolio of EAMs offered to utilities by the regulator may also change over time to reflect advancing technologies with new and different capacities such as energy storage installed at a distribution substation or at consumer premises which would offer complementary but different capacity to grid operators and consumers. Because of the unique situation of each distribution utility, the financial details of the EAMs are developed in rate proceedings.
Figure 2. Sources of utility revenue within NY REV18
16 State of New York Public Service Commission. (2016, May 19). Case No. 14-M-0101. Order Adopting a Ratemaking and Utility Revenue Model Policy Framework. 17 Platform Service revenues (PSRs) are new forms of revenues utilities will earn from displacing traditional infrastructure projects with non-wires alternatives. They include: (i) services that the NY-PSC will require the utility to provide as part of market development; (ii) voluntary value-added services that are provided through the distribution system provider (DSP) function that have an operational nexus with core utility offerings; and (iii) competitive new services that can be readily performed by third parties, including non-regulated utility affiliates, and should not be offered by regulated utilities. In the Order, the NY-PSC noted that its staff had provided examples of PSRs that could generate revenue for utilities, including: (i) customer origination via on-line portal; (ii) data analysis; (iii) transaction and/or platform access fees; and (iv) engineering services for micro-grids. This list is not mean to be exhaustive, as the NY-PSC believes PSRs will evolve over time as the DER market matures. Additionally the Order provides standards for evaluating and approving PSRs. Finally, the NY-PSC noted that a portion of the revenue related to PSRs should be allocated to utility earnings in order to provide an incentive to optimize the use of the DSP. 18 Mitchell, C. (2016). US Regulatory Reform: NY utilty transformation. US Regulatory Reform Series. Retrieved from: http://projects.exeter.ac.uk/igov/us-regulatory-reform-ny-utility-transformation/
8
Like RIIO, the NY REV process focuses on outcomes since the Commission believes that this focus will be the “most effective approach to address the mismatch between traditional revenue methods and modern electric system needs.”19 The Commission supports an outcome based model for the following reasons:
1. REV seeks to integrate the activities of markets, including customers and third-party DER developers. While utilities do not have control over customer or third party actions, this approach recognizes that their activities in the aggregate, along with utilities’ activities, are critical to the optimal performance of the new system. This opens the door to including metrics to encourage utilities to motivate third party activity where that provides efficient system outcomes. For example, metrics could reflect third-party market activity for DER providers. Utilities also could solve distribution level issues uncovered by their operation of the distribution system platform if a metric were established to measure private DER activity.
2. Outcome-based incentives encourage innovation by utilities, allowing utilities to determine the most effective strategy to achieve policy objectives, including cooperation with third parties and development of new business concepts that would not be considered under narrow, program-based incentives.
3. Outcome-based incentives encourage an enterprise-wide approach to achieving results; they are appropriate where there are many program inputs to the system. Good outcomes are created by a range of utility activities that are planned to jointly and perhaps synergistically to modify program inputs to influence the outcome along with private market activities of customers and third parties.
4. Regulation should seek outcomes that simulate competitive market behavior where possible and beneficial.
5. Having utility earnings affected by market outcomes over which they have limited influence is not a new principle. For example, under traditional ratemaking before decoupling, utilities had a general incentive to promote growth in sales, while many other market and customer factors also influenced this outcome.
This "outcome orientation" also has the potential to better align utility activity and performance with public policy and societal objectives of the regulators and jurisdiction authorities. The more innovative elements to NY’s REV are addressed in Section 7.
2.1.2.3 U.S. Jurisdictions with Energy Efficiency PBRs Numerous U.S. jurisdictions have used PBR to motivate adoption of energy efficiency goals and satisfaction of targets and metrics. For example, at least 26 U.S. states have used performance
19 The early NY experience with one utility is that in order to ensure the EAMs are outcome-oriented, there should be a strong stakeholder group and process to help define the metric outputs (the individual measurable activities undertaken by the utility, such as “X number of calls answered in less than 20 seconds”). If a stakeholder group does not exist, the utility may be more likely to propose metrics based on program targets rather than outcomes. This tendency may change over time as experience with NY’s EAMs grows and also as a function of strong utility leadership.

9
incentives to encourage energy efficiency deployments. These incentives range from allowing a utility to earn 1) a percentage of program costs for achieving a savings target (eight states), 2) a share of achieved savings (13 states), 3) a share of the net-present-value (NPV) of avoided costs (four states), and 4) an altered rate of return for achieving savings targets (one state). Over time, energy efficiency program performance improved markedly in states offering these incentives.20
Figure 3. Different state approaches to energy efficiency21
20 State and Local Energy Efficiency Action Network (2016). SEE Action Guide for States: Energy Efficiency as a Least Cost Strategy to Reduce Greenhouse Gases and Air Pollution and Meet Energy Needs in the Power Sector. Prepared by: Lisa Schwartz, Greg Leventis, Steven R. Schiller, and Emily Martin Fadrhonc of Lawrence Berkeley National Laboratory, with assistance by John Shenot, Ken Colburn and Chris James of the Regulatory Assistance Project and Johanna Zetterberg and Molly Roy of U.S. Department of Energy. Retrieved from: https://www4.eere.energy.gov/seeaction/system/files/documents/pathways-guide-states-final0415.pdf. See pages 12-13 citing numerous sources. 21 The figure also illustrates states that has adopted revenue decoupling and lost-revenue recovery adjustment mechanisms (LRAMs) which allow utilities to recover for revenue lost if utility sales decrease due energy efficiency program savings. Revenue decoupling and LRAMs are well established to ensure adequate utility revenue recovery and sometimes associated with PBRs while they operate differently to adjust utility revenue. DOE (2015, April). Quadrennial Energy Review: Energy transmission, storage, and distribution infrastructure. Retrieved from: https://energy.gov/sites/prod/files/2015/04/f22/QER-ALL%20FINAL_0.pdf
10
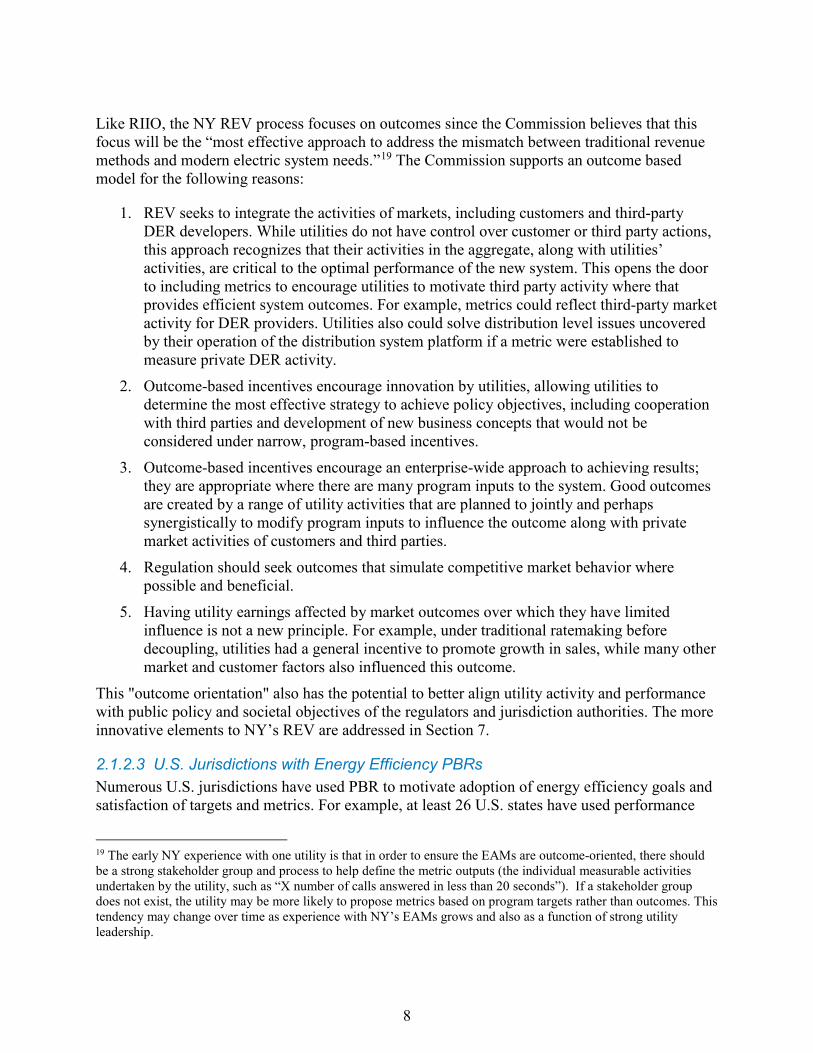
2.1.3 Denmark Denmark has used PBR to improve system reliability by imposing metrics on the Danish distribution system operators (DSOs). The DSOs are subject to an “outage” or quality of supply benchmarking model, which is applied annually. The goal of the quality of supply benchmarking model is to disincentivize utility outages and to improve network reliability, as measured by the System Average Interruption Frequency Index (SAIFI) and the System Average Interruption Duration Index (SAIDI). SAIFI and SAIDI are internationally recognized metrics commonly defined (even as precise definitions vary) and easily measured.
Illustrative Example of Danish Quality of Supply Benchmark The example includes five DSOs: A, B, C, D and E. Company A has the lowest weighted SAIFI while Company B has the second lowest and so forth. Together, Company A, Company B, Company C and Company D have precisely 80 % of the aggregate transmission network.
Source: DERA (2009).
Company D has a weighted SAIFI of 0.09. Thus, companies which have a weighted SAIFI higher than 0.09 are penalized with an up to 1 % reduction in their allowed operational costs. In this example, Company E is penalized.
Figure 4. Identification of regional Danish DSOs with poor quality of supply
Danish DSOs are penalized if they have a higher weighted SAIDI or SAIFI than a benchmark set by higher-performing DSOs. The “outage” methodology applies to DSOs rather than the TSO. The TSO reports SAIDI and SAIFI but is not included in the DSO PBR scheme. This Danish application of reliability metrics illustrates how PBR can improve system reliability through some versions of SAIFI and SAIDI and other common reliability metrics. As illustrated here in Figure 4, reliability PBR schemes often rely on negative incentives.22
22 NordReg. (2011). Economic regulation of electricity grids in Nordic countries. Retrieved from: http://www.nordicenergyregulators.org/wp-content/uploads/2013/02/Economic_regulation_of_electricity_grids_in_Nordic_countries.pdf
11
2.1.4 Mexico Mexico has implemented PBR for its transmission and distribution system. It also has developed some metrics for distributed generation and interconnection that could form the basis of a PBR mechanism. Since the beginning of the energy reform in Mexico, which began approximately 2 years ago, the Energy Regulatory Commission (CRE) has put in place performance-based compensation. Performance-based compensation is offered for minimizing transmission system losses and system losses. The transmission system has a performance-based compensation system for reducing line losses, but the targeted quantity of line loss reductions is quite small.
In contrast, distribution system technical and non-technical line losses tend to be quite high in Mexico, so the targeted distribution line loss reductions are far higher. Each of the Comisión de Electricidad’s 16 distribution service areas has its own distribution system loss reduction targets. The loss reduction schedules are linear, three year pathways toward a third year ultimate target. CFE Distribution Company (hereafter “CFE”) has the targeted amounts of losses incorporated within its revenue requirement. If the losses are above the target, CFE pays. If the losses are below the target, CFE keeps the money.
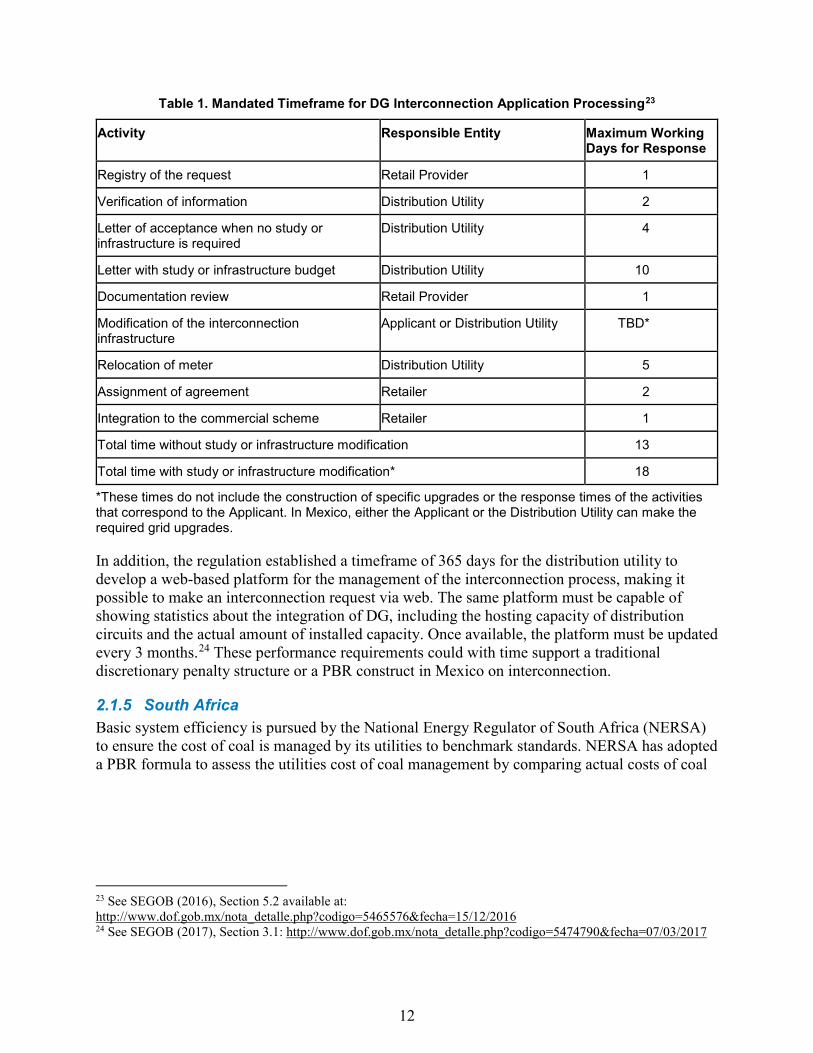
The new regulatory framework for distributed generation includes very specific performance requirements for the application and interconnection process, but there is no penalty or compensation mechanism associated with these requirements so far. For example, there is a schedule for interconnection with well-defined steps and associated mandatory timelines for DG interconnection, as depicted in Table 1.
12
Table 1. Mandated Timeframe for DG Interconnection Application Processing23
Activity Responsible Entity Maximum Working Days for Response
Registry of the request Retail Provider 1
Verification of information Distribution Utility 2
Letter of acceptance when no study or infrastructure is required
Distribution Utility 4
Letter with study or infrastructure budget Distribution Utility 10
Documentation review Retail Provider 1
Modification of the interconnection infrastructure
Applicant or Distribution Utility TBD*
Relocation of meter Distribution Utility 5
Assignment of agreement Retailer 2
Integration to the commercial scheme Retailer 1
Total time without study or infrastructure modification 13
Total time with study or infrastructure modification* 18
*These times do not include the construction of specific upgrades or the response times of the activities that correspond to the Applicant. In Mexico, either the Applicant or the Distribution Utility can make the required grid upgrades.
In addition, the regulation established a timeframe of 365 days for the distribution utility to develop a web-based platform for the management of the interconnection process, making it possible to make an interconnection request via web. The same platform must be capable of showing statistics about the integration of DG, including the hosting capacity of distribution circuits and the actual amount of installed capacity. Once available, the platform must be updated every 3 months.24 These performance requirements could with time support a traditional discretionary penalty structure or a PBR construct in Mexico on interconnection.
2.1.5 South Africa Basic system efficiency is pursued by the National Energy Regulator of South Africa (NERSA) to ensure the cost of coal is managed by its utilities to benchmark standards. NERSA has adopted a PBR formula to assess the utilities cost of coal management by comparing actual costs of coal
23 See SEGOB (2016), Section 5.2 available at: http://www.dof.gob.mx/nota_detalle.php?codigo=5465576&fecha=15/12/2016 24 See SEGOB (2017), Section 3.1: http://www.dof.gob.mx/nota_detalle.php?codigo=5474790&fecha=07/03/2017
13
to a benchmark for costs using a PBR formula.25 There are other performance expectations related to pricing such as maintaining adequate coal reserves for various contingencies including labor strikes that are unique to the South African context.
2.2 What Worked? This section draws upon examples of successful PBRs to highlight distinct design elements for incentive mechanisms. Both multi-year rate plans and PBRs to address reliability and safety offer lessons learned from more than two decades of experience. Experience with multi-year rates plans and early forms of PBR, particularly for energy efficiency, evinces some basic PBR lessons.
2.2.1 Discrete take-aways In this initial sub-section we highlight valuable insights into specific PBR elements that have been successful. There is no particular order to the grouping below, beyond the fact that they are important considerations and add to the lessons learned from the history of PBR implementation.
Multi-year Rate Plans: Multi-year rate plans were used first for electricity in California, New York, and the New England states, and have since become common in Australia, the U.K., Germany, the Netherlands, Canada, and New Zealand.26 In Canada, multi-year rate plans are becoming mandatory for electric and natural gas distributors in the four most populous provinces.27 Some statistical studies of vertically integrated electric utilities indeed suggest, and those that operate for long periods without rate cases actually prove, that multi-year rate plans can exhibit superior cost management28 – one of the primary goals of adopting multi-year rate plans in these jurisdictions.
25 The allowed coal cost for the regulatory control account purposes will be determined by comparing the coal benchmark costs with Eskom’s actual costs of coal (R/ton cost) using a PBR formula per contract type. The allowed actual total cost is calculated by applying the following formula on a contract type basis: 𝐴𝐴𝐴𝐴𝐴𝐴𝐴𝐴𝐴𝐴𝐴𝐴𝐴𝐴 𝑎𝑎c𝑡𝑡𝑡𝑡𝑎𝑎𝐴𝐴 𝑐𝑐𝐴𝐴𝑐𝑐𝑡𝑡 (𝑅𝑅𝑎𝑎𝑅𝑅𝐴𝐴)=⌈𝐴𝐴lph𝑎𝑎 𝑥𝑥 𝐴𝐴𝑐𝑐𝑡𝑡𝑡𝑡𝑎𝑎𝐴𝐴 𝑈𝑈𝑅𝑅𝑈𝑈𝑡𝑡 𝐶𝐶𝐴𝐴𝑐𝑐𝑡𝑡 𝐴𝐴𝑜𝑜 𝐶𝐶𝐴𝐴𝑎𝑎𝐴𝐴 𝐵𝐵𝑡𝑡𝐵𝐵𝑅𝑅+(1−𝐴𝐴𝐴𝐴𝐴𝐴ℎ𝑎𝑎) 𝑥𝑥 𝐵𝐵𝐴𝐴𝑅𝑅𝑐𝑐ℎ𝑚𝑚𝑎𝑎𝐵𝐵𝑚𝑚 𝑈𝑈𝑅𝑅𝑈𝑈𝑡𝑡 𝐶𝐶𝐴𝐴𝑐𝑐𝑡𝑡 𝐴𝐴𝑜𝑜 𝐶𝐶𝐴𝐴𝑎𝑎𝐴𝐴 𝐵𝐵𝑡𝑡𝐵𝐵𝑅𝑅⌉ 𝑥𝑥 𝐴𝐴𝑐𝑐𝑡𝑡𝑡𝑡𝑎𝑎𝐴𝐴 𝐶𝐶𝐴𝐴𝑎𝑎𝐴𝐴 𝐵𝐵𝑡𝑡𝐵𝐵𝑅𝑅 𝑉𝑉𝐴𝐴𝐴𝐴𝑡𝑡𝑚𝑚𝐴𝐴Where: 𝐴𝐴𝑐𝑐𝑡𝑡𝑡𝑡𝑎𝑎𝐴𝐴 𝑈𝑈𝑅𝑅𝑈𝑈𝑡𝑡 𝐶𝐶𝐴𝐴𝑐𝑐𝑡𝑡 = Actual unit cost of coal burn in a financial year (R/ton).𝐵𝐵𝐴𝐴𝑅𝑅𝑐𝑐ℎ𝑚𝑚𝑎𝑎𝐵𝐵𝑚𝑚 𝐶𝐶𝐴𝐴𝑐𝑐𝑡𝑡 = Allowed coal burn unit cost for the contract type for the year considered (R/ton). 𝐴𝐴𝑐𝑐𝑡𝑡𝑡𝑡𝑎𝑎𝐴𝐴 𝐶𝐶𝐴𝐴𝑎𝑎𝐴𝐴 𝐵𝐵𝑡𝑡𝐵𝐵𝑅𝑅 𝑉𝑉𝐴𝐴𝐴𝐴𝑡𝑡𝑚𝑚𝐴𝐴 = Actual tonnage of coal burn in the financial year considered. 𝐴𝐴𝐴𝐴𝐴𝐴ℎ𝑎𝑎 = Alpha is the factor that determines the ratio in which risks in coal burn expenditure is divided: i.e. those that are passed through to the customers, and those that must be carried by Eskom. Any number of the alpha between 0 and 1, set to share the risk of the coal cost variance between licensees and its customers. National Energy Regulator of South Africa, Annexure 1, Multi-Year Price Determination (MYPD) Methodology, 17.2.8, pp. 34-35. 26 There is strong evidence that electrical distribution company productivity is improved by operating under a multi-year rate plan. Lowry, M. (2016, March 29). Performance-Based Regulation: Can “The Other PBR” Make Sense for Wisconsin? Slide presentation at the Wisconsin Retreat on Utility Business Models of the Future. See slide 23 at https://www.nga.org/files/live/sites/NGA/files/pdf/2016/1603EETWIRetreatLowry.pdf; M. Lowry, T. Woolf, L. Schwartz. (2016). Performance-Based Regulation in a High Distributed Energy Resources Future. Lawrence Berkeley National Lab, Rept. No. 3. Retrieved from: https://emp.lbl.gov/publications/performance-based-regulation-high. 27 M. Lowry, T. Woolf, L. Schwartz. (2016). Performance-Based Regulation in a High Distributed Energy Resources Future. Lawrence Berkeley National Lab, Rept. No. 3. Retrieved from: https://emp.lbl.gov/publications/performance-based-regulation-high, p. 30. 28 M. Lowry, T. Woolf, L. Schwartz. (2016). Performance-Based Regulation in a High Distributed Energy Resources Future. Lawrence Berkeley National Lab, Rept. No. 3. Retrieved from: https://emp.lbl.gov/publications/performance-based-regulation-high, p. 31.
14
PBRs for Reliability and Customer Service: With cost-cutting incentives under PBR multi-year rate plans came the possibility that utilities would save money not by efficient operations, but by reducing quality of service. This concern revealed the need to address service quality through PBRs too. PBRs for service quality identify service goals, set targets for acceptable service levels, and measure outages (number and duration of), meter reading disputes, time to answer consumer phone line, number of customer complaints, time to provide a new service connection, and similar measures. Each measure is then translated into a reward or penalty or both to modify revenue. It should be noted that some customer service targets are likely to assist low or moderate income ratepayers who are more likely to access consumer phone lines, have service disconnected, and file complaints in some jurisdictions.
With this standard construct, multi-year rate plans with service quality and customer service PIMs established PBR incentives to control cost and maintain levels of customer service.
PBR Can Rationalize Utility Incentives and Make them Accessible: While it is true that all regulation provides financial incentives that motivate utility performance, these incentives are often only understood by experts involved in utility management or regulation. PBR arrangements make regulatory goals and incentives explicit for the utility, regulator, ratepayers and other stakeholders. The incentives of traditional utility regulation are often not understood by the public and many stakeholders. While many regulators and utility management professionals do understand the incentives built into traditional utility regulation, it is difficult to resolve the conflicting incentives that are inherent in much existing regulation. Examples include the conflict between the cost-recovery guaranteed for capital expenditure (the incentive to build more) and energy efficiency cost recovery structures (the incentive to save more energy). Performance based regulation is an explicit effort to rationalize sometimes conflicting regulatory incentives to make them consistent and to avoid conflicting regulatory signals.
Predictability and Incrementalism Matter: Experience with multi-year rate plans also suggests that regulatory predictably is important to encouraging utility and market investment, particularly over the long-term. Predictability allows utilities to project the impact of a change in
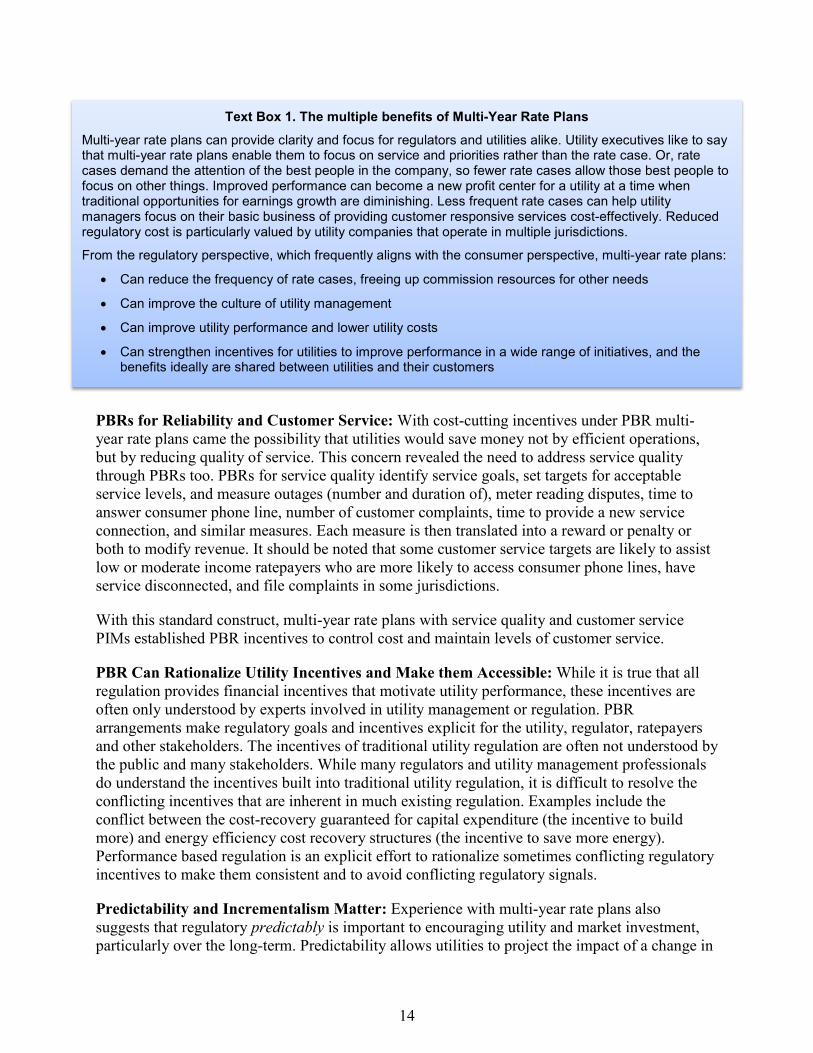
Text Box 1. The multiple benefits of Multi-Year Rate Plans Multi-year rate plans can provide clarity and focus for regulators and utilities alike. Utility executives like to say that multi-year rate plans enable them to focus on service and priorities rather than the rate case. Or, rate cases demand the attention of the best people in the company, so fewer rate cases allow those best people to focus on other things. Improved performance can become a new profit center for a utility at a time when traditional opportunities for earnings growth are diminishing. Less frequent rate cases can help utility managers focus on their basic business of providing customer responsive services cost-effectively. Reduced regulatory cost is particularly valued by utility companies that operate in multiple jurisdictions.
From the regulatory perspective, which frequently aligns with the consumer perspective, multi-year rate plans:
• Can reduce the frequency of rate cases, freeing up commission resources for other needs
• Can improve the culture of utility management
• Can improve utility performance and lower utility costs
• Can strengthen incentives for utilities to improve performance in a wide range of initiatives, and the benefits ideally are shared between utilities and their customers

15
utility investment or operational results on the utility revenues. Unpredictable incentives do not send efficient investment and management signals. For this reason, regulators are well advised to adjust targets and incentives gradually where a PBR system is working to encourage utility and market confidence in the investment environment.
PIMs for Energy Efficiency Work: Experience with multi-state utilities in the U.S. demonstrates that PIMs can help to improve utility energy efficiency program performance markedly. Utilities with operations in multiple states substantially improved efficiency markedly in states offering incentives.29 Multi-year rate plans are layered on top of traditional cost-cap regulation. Therefore, cost-cap regulation with cost control incentives that allow utilities to earn revenue even with lower sales can incentivize other utility behavior such as pursuing energy efficiency measures with properly designed performance incentives. This illustrates the potential of PBR (multi-year rate plans) and PIMs (additional efficiency incentives) to be effectively layered onto existing regulatory paradigms and yield excellent results.
2.2.2 Measure Outputs and Focus on Outcomes PBR allows regulators to focus on whether desired outcomes will be achieved and how to achieve those goals. Less time can be spent evaluating specific costs involved in cost-based cost-of-service regulation that some call input regulation. Thus, outputs are emphasized by regulators and stakeholders in evaluating utility outcomes.
Implementing Performance Metrics without Financial Incentives Builds Experience: One lesson is that regulators and utilities can implement performance metrics without attaching financial awards to gain experience and training as the performance metrics are fine tuned. Regulators, utilities and stakeholders can examine what’s important and ask how we are doing without focusing on obtaining rewards or penalties – at least initially. Then, after a while regulators and utilities can ask, “if we were doing better, what is that worth?”30
PBR Enables a Stronger Focus on Public Policy Goals: By providing more focus on outcomes, regulators can focus on technology changes and specific state policy goals and set specific goals and metrics associated with those objectives whether they are related to clean energy resources, universal service including service to low-income citizens, or advanced grid modernization. Reduced public health and environmental impacts are among the desired outcomes considered in many jurisdictions. Experience with 25 years of multi-year rate plans shows that utility performance can be tied to achievement of desired outcomes including reliability rather than capital asset investment.
Recalibration of Performance Criteria, Metrics and Perhaps Goals over Time is Wise. There is a complex tradeoff between setting PBR mechanisms to remain stable over N years to allow for the benefits of certainty to influence utility investments and operations, and the need to recalibrate performance criteria and metrics - and perhaps reassess goals over time. The UK 29 EE incentives were found to motivate utilities to improve EE performance targets. Nowak, S., Baatz, B., Gilleo, A., Kushler, M., Molina, M., and York, D. (2015) Beyond Carrots for Utilities: A National Review of Performance Incentives for Energy Efficiency. ACEEE. Retrieved from: http://aceee.org/research-report/u1504. 30 The U.S. State of Vermont used this approach and now has utility-specific service quality plans for all utilities. Vermont Public Service Board. (2016, December 9). Service Quality Plan. Retrieved from: http://psb.vermont.gov/document-category/service-quality-plan?page=1
16
regulators realized five years was too short a period and moved to 8 year periods under RIIO. For more targeted PBR mechanisms, such as the earned income mechanisms (EIMs) being implemented in New York, one of the key considerations a regulator must balance is the hands-off period over which the incentive should be free to influence utility behavior (to assess its success) and the need to recalibrate if the mechanism is not working as intended. Getting the balance right depends on complex considerations of how the incentive operates to influence both operational expenses and capital expenses, the life of capital, and many other factors including market influences external to the utility.
2.2.3 Focus on Metrics with Clear Measurement Methods and Meaningful Impacts
Using Comparable Metrics is Valuable: Ideally metrics would be defined to be consistent with international or national standards. Consistency of metrics allows for comparisons of performance across utilities. Continuous improvements can be measured whether from a deficient status or to exemplary performance. While regulators need not hesitate to use new metrics when there are no precedents for a desired outcome, and particularly when engaged in cutting-edge PBR development, the lack of comparable definitions can make meaningful comparisons difficult across jurisdictions and make identification of deficient results from exemplary performance difficult as well. Regulators, stakeholders, the public, and utility management benefit from having access to comparable data for utility performance using consistent standards.
Precise Targets and Metric are Valuable: Similarly, target and metric definitions that are imprecise can lead to questions over performance later. Targets and metrics are best based on data that is available, stated in units of measurement that are available, and specific as to measurement, analysis, frequency and reporting methods. These add clarity in assessing performance for the utility, regulators, stakeholders, and the public.
PBRs and PIMS should be Sized in Alignment with their Desired Impact: It is important to structure PBR or PIMs so that they have the appropriate level of impact. Each jurisdiction will need to assess the level of impact they want the PBR or PIM to have. If applied incrementally, PBR or PIM can provide a low-risk test of whether utility performance can be improved and can be flexibly adjusted to assess whether the desired outcomes are achieved or not. Success in implementation may be able to be measured at low incremental levels, but of course that can be assessed in evaluating the performance target. On the other hand, PBR incentives are unlikely to make a major impact if they remain a thin icing on a cake of existing utility revenues, earnings and the executive promotion system. If the primary measures of revenue remain as invested capital (in private utilities), sales, size of utility, and revenue in both private and state-owned enterprises, then PBRs will have little impact on outcomes.
An Appropriate Range of PBR Impact can be Established based on Cost-of-Service Regulation Financial Limits: While the level of impact can be carefully directed, jurisdictions should be careful to not unduly minimize the role of the PBR. It may not work to have all but a minor fraction of revenue determined by invested capital – this minor PBR may or may not work depending on the overall incentives facing the company. A moderate alternative to minor PBR incentives would be to have a significant fraction of revenue come from service and performance rewards. For privately-owned utilities and utilities with debt or bondholders, the cost of that debt
17
determines a floor to maintain utility solvency for important utility operations. The cost of debt service is a minimum floor for utility revenue whether privately or publicly owned. For investor-owned utilities, a negative incentive scheme could set incentives between the cost of debt return level and the allowed return on equity, whereas a positive incentive scheme could set incentives above the allowed return on equity to recognize superior utility performance as a competitive market would reward superior business performance.
2.3 What Didn’t Work? 2.3.1 Examples of What Didn’t Work While there have been many stories of successful PBR and PIMs, there have also been a few notable programs that did not succeed, and which provide valuable lessons today. As noted above, all regulation is incentive regulation, and if the incentives are ill-conceived, the results can be quite different than what was intended.
One such example is an energy efficiency PBR mechanism in the State of Washington in the U.S. In 1980, a Washington consumer group called Fair Electric Rates Now (FERN) convinced the Washington legislature to direct a 2% increased return on equity for energy efficiency investments. Utilities quickly figured out that the incentive structure encouraged them to spend as much as possible on measures that save as little as necessary – maximizing the incentive while minimizing the lost revenue. Nevada learned the same lesson 25 years later.
In 1986, Pacific Northwest Bell negotiated an “Alternative Form of Regulation” that included a 5-year rate freeze, and carte blanche to engage in cost-cutting measures. The utility severely cut customer service quality, and turned the customer service phone number into a 1-900 number, generating $0.25/minute in revenue while people were on hold, turning poor customer service into a profit center. This eventually led to a customer service index mechanism at the end of the rate freeze.
In 1990, Public Counsel and the Washington Utility and Transportation Commission negotiated a conservation incentive mechanism for Puget Sound Power and Light Company that provided a two-part incentive, based on how much energy efficiency is achieved, and how cheaply it is achieved. The utility fell short of the targets in 9 out of 10 topical areas, but deployed 800,000 low-flow showerheads into the service territory and retained an evaluation contractor who concluded that 72% of those shower heads were connected to electric water heaters, saving significant amounts of energy at very low cost. The utility earned a sizeable incentive, even though commercial, industrial, and low-income programs produced little savings. The Washington Commission terminated the program after one year due to vulnerability to gaming.31
In the 2006-2008 period with later proceedings on utility incentive compensation, California implemented an energy efficiency PBR. The California Public Utilities Commission (CPUC) established a performance incentive mechanism for EE programs that offered utilities performance payments if the efficiency portfolio of programs achieved certain savings benchmarks. The California Commission did extensive review of the utility results with
31 Jim Lazar (2006). Examples of Good, Bad, and Ugly Decoupling Mechanisms. Presented at NARUC Symposium Aligning Regulatory Incentives with Demand-Side Resources. Retrieved from: http://pubs.naruc.org/pub/4AC7A83F-2354-D714-5130-4C68971713CB
18
measurements (metrics) not developed initially. Utilities largely did not achieve the later developed performance criteria, but the utilities believed that they performed well until the attribution assessment. The Commission awarded the utilities roughly 10% of what they expected. The utilities were disappointed and the regulators were as well with what they assessed of utility performance after the fact. The perception of this program was also negative, as it was viewed as the CPUC awarding the incentive (even though it was a much smaller portion than the utilities expected) despite failing to meet the benchmarks. The CPUC awarded the amounts they did because they approved of the utilities contribution to transforming the market for energy efficiency and for enabling very aggressive codes and standards attainments by offering successful implementation training programs. This is a result and an example of two bad practices – going into a PBR program with an unresolved method of evaluating results, in this case energy efficiency, and going back in time to change the method of assessment. Assessing the merits of the supporters and detractors of this decision is beyond the scope of this report, but there is little doubt that this decision completely stopped further consideration of performance-based efficiency programs until 2016.
One obvious lesson from these illustrative failures is that it is not necessary to wait for an epic failure to fix a program that is not operating to achieve desired outputs and outcomes.
2.3.2 Examples of What Didn’t Work Initially but Was Fixed PBR carries a risk of utilities figuring out how to game the system to achieve results regulators do not anticipate. Some of successes and failures yielded important lessons, and regulatory frameworks were fixed.
California’s customer satisfaction survey experience from the late 1990s and early 2000s provides an example. California specified customer satisfaction mechanisms to be measured with a less than specific question (ranking experience on a 1-5 scale), and by customer service representatives who were under pressure to produce positive results for utilities. The utility representatives ultimately produced falsified results and offered small gifts to ratepayers to obtain positive answers.32 California and the utility later fixed the measurement bias incentive inherit in the first system with a more objective survey methods and third-party evaluation.
RIIO is another example of a mechanism that was improved after revision. In 2015, the House of Commons’ Energy and Climate Change Committee reviewed concerns that a lack of information makes it more complex to assess whether or not the price controls are providing value for money and recommended that ‘a standard form of reporting would bring clarity to the performance of the network companies and the impact of the RIIO price framework’.33 Following the recommendation by the Committee there were calls from consumer organisations for improved
32 Whited, M., Woolf, T., and Napoleon, A. (2015). Utility Performance Mechanisms: A Handbook for Regulators. Synapse Energy Economics. Retrieved from: http://www.synapse-energy.com/sites/default/files/Utility%20Performance%20Incentive%20Mechanisms%2014-098_0.pdf, at p. 31, 63-69. 33 House of Commons Energy and Climate Change Committee. (2015) Energy network costs: transparent and fair? - Sixth Report of Session 2014-15 (p.19). http://www.publications.parliament.uk/pa/cm201415/cmselect/cmenergy/386/386.pdf
19
reporting by the network companies on the performance against the outputs defined by RIIO.34 Since then, a reporting template has been developed by Ofgem which more effectively collects the necessary data. The results of this exercise are also communicated more transparently.35
PBR may work for some time but then require revision in light of new challenges. Many Mid-Atlantic and Northeastern U.S. states had well-developed experience with PBRs to govern electrical system reliability under multi-year rate plans. Nonetheless, in the wake of the service, reliability, and restoration issues associated with Hurricane Sandy in 2012, these reliability measures were reexamined. New York, Maryland and Pennsylvania have all undertaken significant regulatory or legislative efforts to improve service quality and reliability planning following Hurricane Sandy and other weather events in recent years.36
Energy efficiency PBR is well-recognized as an effective tool in achieving successful energy efficiency deployment. PIMs have contributed to utility management buy-in and can influence efficiency program planning.37 Utility management may be willing to dedicate more resources and employee time to planning and deployment of efficiency programming if success of that programming improves utility revenues. However, success does not imply that there has not been trial-and-error along the way. A PBR for energy efficiency is certainly innovative in jurisdictions experimenting with new forms of regulation or adopting it for the first time. Experience has shown that PBR for efficiency operates well when implemented in concert with a lost revenue recovery mechanism which removes the utility disincentive to reduce sales such as revenue decoupling, as well as mechanisms to enable recovery of energy efficiency program and administrative costs.
It is important to link the value of the outcomes with the amount of incentive received. Regulators in multiple jurisdictions have assessed the effectiveness and cancelled programs that are not working, or which are perceived as not working. The North Carolina “Save-A-Watt program” was an underperforming PBR program which was perceived as paying excessive incentives to the utility for avoided investment. Due to the utility earning excess revenue based on a theory of entitlement to planned investment, the Save-A-Watt program was cancelled after 34Citizens Action. (2015). Beginning to see the light Why we need greater transparency in the RIIO model of energy network regulation, and how to deliver it. Retrieved from: https://www.citizensadvice.org.uk/about-us/policy/policy-research-topics/energy-policy-research-and-consultation-responses/energy-policy-research/beginning-to-see-the-light/. See also, House of Commons Energy and Climate Change Committee. (2015) Energy network costs: transparent and fair? - Sixth Report of Session 2014-15. Retrieved from: https://www.publications.parliament.uk/pa/cm201415/cmselect/cmenergy/386/386.pdf, p.19. 35 Ofgem. (2016). Regulatory Reporting Pack. Retrieved from: https://www.ofgem.gov.uk/system/files/docs/2016/06/cando_rrp_template_version3.0_decision_2015_16_for_publishing.xlsx 36 State and Local Energy Efficiency Action Network (2016). SEE Action Guide for States: Energy Efficiency as a LeastCost Strategy to Reduce Greenhouse Gases and Air Pollution and Meet Energy Needs in the Power Sector. Prepared by: Lisa Schwartz, Greg Leventis, Steven R. Schiller, and Emily Martin Fadrhonc of Lawrence Berkeley National Laboratory, with assistance by John Shenot, Ken Colburn and Chris James of the Regulatory Assistance Project and Johanna Zetterberg and Molly Roy of U.S. Department of Energy. Retrieved from: https://www4.eere.energy.gov/seeaction/system/files/documents/pathways-guide-states-final0415.pdf at 61. 37 Whited, M., Woolf, T., and Napoleon, A. (2015). Utility Performance Mechanisms: A Handbook for Regulators. Synapse Energy Economics. Retrieved from: http://www.synapse-energy.com/sites/default/files/Utility%20Performance%20Incentive%20Mechanisms%2014-098_0.pdf
20
2009 to 2013 operation. Likewise, Washington State’s Puget Sound Power and Light over performed but only through a particular metric for high-efficiency showerheads and faucet aerators and earned high rewards for exceeding cost targets for a single measure while ignoring others.38 The metric to measure efficiency results allowed for significant achievement on one measure (efficient showerheads) to lead to substantial utility compensation even as other measures achieved few savings. This was perceived by the Washington regulators as overcompensation and arguable manipulation of the reward metrics.39 The latter program was cancelled over concerns of gaming and overcompensation. Thus, experience with PBR to encourage energy efficiency shows that programs can be cancelled when incentives are excessive or intended outcomes are perceived as not achieved. It is important to communicate the value of the intended outcome -- the value of actual utility outputs that produce beneficial customer outcomes- and to link the value of the incentive to that outcome, so that when the outcome is achieved the value of the incentive is not viewed as excessive.
2.3.3 Lessons Learned from What Did Not Work? The evolution of PBR and PIMs has provided various examples of success and failures. They’ve also provided some valuable lessons for elements that could be problematic unless care is taken on specific points. Examples include the following:
• Basing performance incentives on inputs is generally a poor practice. Inputs, and particularly spending, tell little about whether a successful outcome or savings are achieved.
• The business-as-usual (BAU) outcomes need to be understood before incentive levels and targets are set. If incentive levels or targets are set at what BAU operations would achieve anyway, then additional incentive costs are incurred with no additional benefit to customers.
• Regulators learn that sometimes rewards or penalties are set too high or low to reach the desired outcomes. If rewards or penalties are based on exogenous factors such as fuel prices or economic growth (even indirectly), they can produce disproportionate rewards or penalties and unintended results. A poorly designed set of PBR incentives might even distract utility managers from critical functions.
• Establishing a well-designed set of performance incentives can require significant utility and regulatory resources. This is particularly the case when performance is not well-defined by state or international standards and definitions, or when new rewards or penalty factors are not well understood. Implementation may also be difficult and performance incentives muted if incentives are based on hard-to-measure factors.
38 This example is more fully explored above under What Didn’t Work, in Section 2.3. 39 State and Local Energy Efficiency Action Network (2016). SEE Action Guide for States: Energy Efficiency as a LeastCost Strategy to Reduce Greenhouse Gases and Air Pollution and Meet Energy Needs in the Power Sector. Prepared by: Lisa Schwartz, Greg Leventis, Steven R. Schiller, and Emily Martin Fadrhonc of Lawrence Berkeley National Laboratory, with assistance by John Shenot, Ken Colburn and Chris James of the Regulatory Assistance Project and Johanna Zetterberg and Molly Roy of U.S. Department of Energy. Retrieved from: https://www4.eere.energy.gov/seeaction/system/files/documents/pathways-guide-states-final0415.pdf at 53.
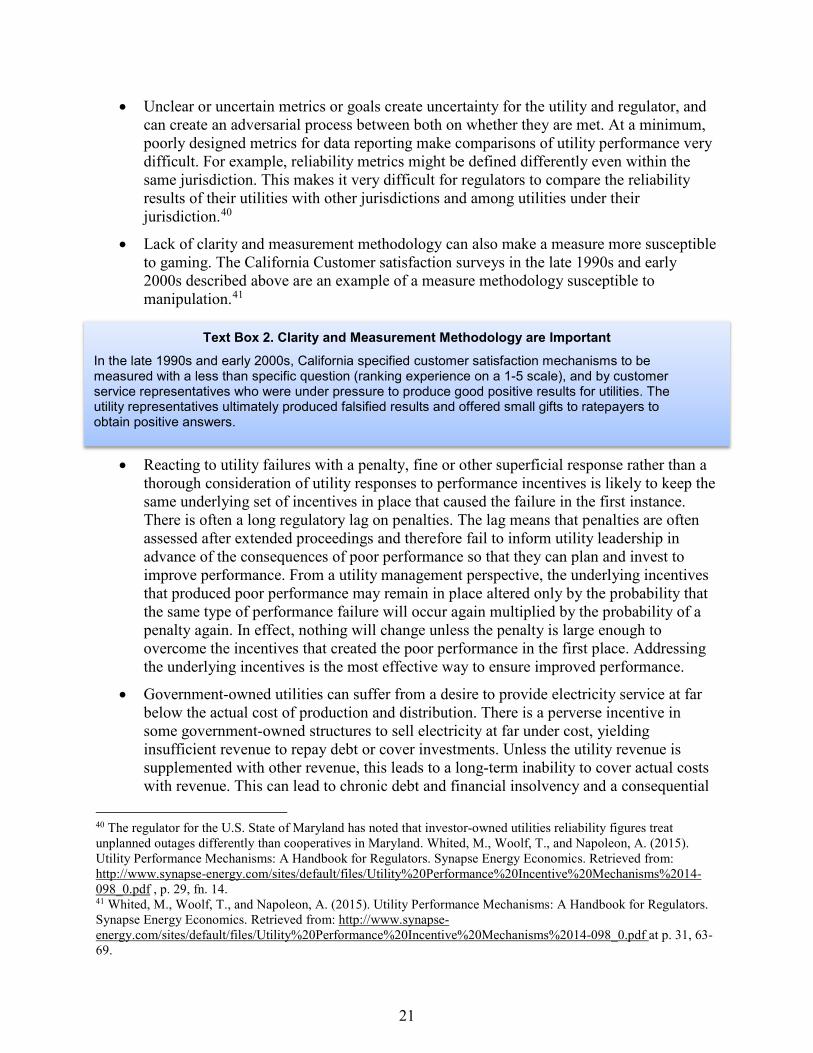
21
• Unclear or uncertain metrics or goals create uncertainty for the utility and regulator, and can create an adversarial process between both on whether they are met. At a minimum, poorly designed metrics for data reporting make comparisons of utility performance very difficult. For example, reliability metrics might be defined differently even within the same jurisdiction. This makes it very difficult for regulators to compare the reliability results of their utilities with other jurisdictions and among utilities under their jurisdiction.40
• Lack of clarity and measurement methodology can also make a measure more susceptible to gaming. The California Customer satisfaction surveys in the late 1990s and early 2000s described above are an example of a measure methodology susceptible to manipulation.41
• Reacting to utility failures with a penalty, fine or other superficial response rather than a thorough consideration of utility responses to performance incentives is likely to keep the same underlying set of incentives in place that caused the failure in the first instance. There is often a long regulatory lag on penalties. The lag means that penalties are often assessed after extended proceedings and therefore fail to inform utility leadership in advance of the consequences of poor performance so that they can plan and invest to improve performance. From a utility management perspective, the underlying incentives that produced poor performance may remain in place altered only by the probability that the same type of performance failure will occur again multiplied by the probability of a penalty again. In effect, nothing will change unless the penalty is large enough to overcome the incentives that created the poor performance in the first place. Addressing the underlying incentives is the most effective way to ensure improved performance.
• Government-owned utilities can suffer from a desire to provide electricity service at far below the actual cost of production and distribution. There is a perverse incentive in some government-owned structures to sell electricity at far under cost, yielding insufficient revenue to repay debt or cover investments. Unless the utility revenue is supplemented with other revenue, this leads to a long-term inability to cover actual costs with revenue. This can lead to chronic debt and financial insolvency and a consequential
40 The regulator for the U.S. State of Maryland has noted that investor-owned utilities reliability figures treat unplanned outages differently than cooperatives in Maryland. Whited, M., Woolf, T., and Napoleon, A. (2015). Utility Performance Mechanisms: A Handbook for Regulators. Synapse Energy Economics. Retrieved from: http://www.synapse-energy.com/sites/default/files/Utility%20Performance%20Incentive%20Mechanisms%2014-098_0.pdf , p. 29, fn. 14. 41 Whited, M., Woolf, T., and Napoleon, A. (2015). Utility Performance Mechanisms: A Handbook for Regulators. Synapse Energy Economics. Retrieved from: http://www.synapse-energy.com/sites/default/files/Utility%20Performance%20Incentive%20Mechanisms%2014-098_0.pdf at p. 31, 63-69.
Text Box 2. Clarity and Measurement Methodology are Important In the late 1990s and early 2000s, California specified customer satisfaction mechanisms to be measured with a less than specific question (ranking experience on a 1-5 scale), and by customer service representatives who were under pressure to produce good positive results for utilities. The utility representatives ultimately produced falsified results and offered small gifts to ratepayers to obtain positive answers.

22
inability to modernize the utility sector itself unless and until the perverse incentives are addressed.
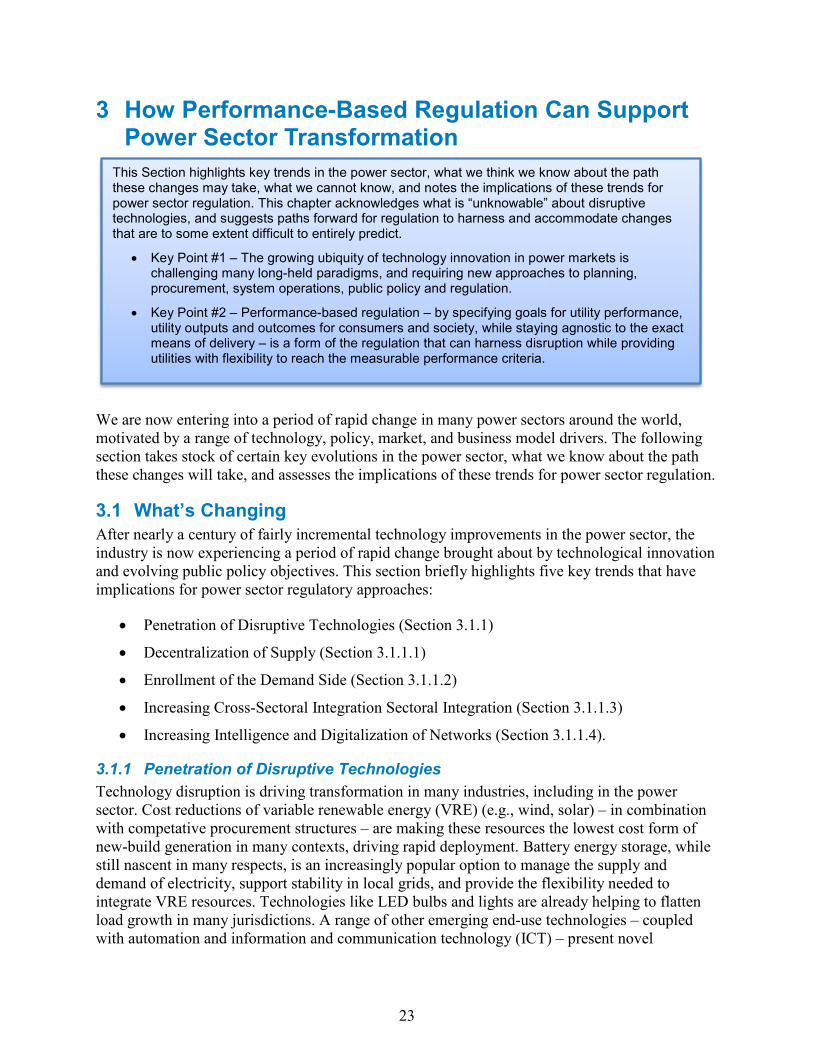
23
3 How Performance-Based Regulation Can Support Power Sector Transformation
We are now entering into a period of rapid change in many power sectors around the world, motivated by a range of technology, policy, market, and business model drivers. The following section takes stock of certain key evolutions in the power sector, what we know about the path these changes will take, and assesses the implications of these trends for power sector regulation.
3.1 What’s Changing After nearly a century of fairly incremental technology improvements in the power sector, the industry is now experiencing a period of rapid change brought about by technological innovation and evolving public policy objectives. This section briefly highlights five key trends that have implications for power sector regulatory approaches:
• Penetration of Disruptive Technologies (Section 3.1.1)
• Decentralization of Supply (Section 3.1.1.1)
• Enrollment of the Demand Side (Section 3.1.1.2)
• Increasing Cross-Sectoral Integration Sectoral Integration (Section 3.1.1.3)
• Increasing Intelligence and Digitalization of Networks (Section 3.1.1.4).
3.1.1 Penetration of Disruptive Technologies Technology disruption is driving transformation in many industries, including in the power sector. Cost reductions of variable renewable energy (VRE) (e.g., wind, solar) – in combination with competative procurement structures – are making these resources the lowest cost form of new-build generation in many contexts, driving rapid deployment. Battery energy storage, while still nascent in many respects, is an increasingly popular option to manage the supply and demand of electricity, support stability in local grids, and provide the flexibility needed to integrate VRE resources. Technologies like LED bulbs and lights are already helping to flatten load growth in many jurisdictions. A range of other emerging end-use technologies – coupled with automation and information and communication technology (ICT) – present novel
This Section highlights key trends in the power sector, what we think we know about the path these changes may take, what we cannot know, and notes the implications of these trends for power sector regulation. This chapter acknowledges what is “unknowable” about disruptive technologies, and suggests paths forward for regulation to harness and accommodate changes that are to some extent difficult to entirely predict.
• Key Point #1 – The growing ubiquity of technology innovation in power markets is challenging many long-held paradigms, and requiring new approaches to planning, procurement, system operations, public policy and regulation.
• Key Point #2 – Performance-based regulation – by specifying goals for utility performance, utility outputs and outcomes for consumers and society, while staying agnostic to the exact means of delivery – is a form of the regulation that can harness disruption while providing utilities with flexibility to reach the measurable performance criteria.
24
opportunities to enroll the demand-side of the power sector (See Section 3.1.1.2) and promote greater integration of power with other sectors (See Section 3.1.1.3). In general, the growing ubiquity of technology innovation in power markets is challenging many long-held paradigms, and requiring new approaches to planning, procurement, system operations, public policy and regulation.
3.1.1.1 Decentralization of Supply The combination of increasing VRE deployment and the rise of distributed energy resources (DERs)42 is resulting in an increasing decentralization of supply in some power markets. Geographically dispersed fleets of VRE resources are changing network investment strategies, and creating new challenges for regulators to evaluate the prudency of network investments. Sharply declining DER costs, particularly for distributed photovoltaic (DPV) systems, are accelerating public policy dialogues about the desired role of distribution utilities in 21st century power systems where some consumers produce their own electricity. Discussions around what constitutes “fair compensation” for consumers selling power to the grid have also proven to be a complex and contentious issue. Furthermore, with the power grid largely designed for unidirectional power flow, utilities and regulators are now grappling with how best to efficiently invest in their network infrastructure to enable greater integration. This decentralization of supply is driving a need for greater operational cohesion of distributed resources,43 and thus the rise of VRE and DERs is strongly complemented by the trend of increasing intelligence and digitalization of the power sector (See Section 3.1.1.4).
3.1.1.2 Enrollment of the Demand Side The demand side of the power sector has historically been unresponsive to supply-side conditions.44 New technology is now enabling customers from all segments to behave more responsively to the real-time price of energy, and enabling them to receive payments for shifting their demand when grid conditions require it. This is occurring through both regulated utility programs and via private third-parties; in both scenarios, an entity is responsible for aggregating groups of customers, calling upon them to reduce demand when needed, and facilitating a payment for services. Demand response programs are growing in number and sophistication, with some aggregation schemes allowing participation in wholesale power markets. There are still many technical and regulatory barriers to entry, with unresolved issues in many markets concerning, inter alia: access to customer and market data, the role of 3rd party aggregators, and reliability of and fair compensation for demand response resources. As increasing amounts of
42 Distributed energy resources (DERs) are modular, geographically dispersed and often smaller-scale technologies that allow consumers to produce their own energy, manage their consumption, and/or participate more actively in the power system. They include distributed generation such as solar PV, storage, electric vehicles, demand response, heating and cooling systems, and smart home automation. 43 Zinaman, O. et al. (2015). Power Systems of the Future: A 21st Century Power Partnership Thought Leadership Report. Retrieved from: http://www.nrel.gov/docs/fy15osti/62611.pdf 44 A notable exception to this statement is the example of large industrial customers (e.g., aluminum smelters) who enter into interruptible load demand response contracts with utilities, oftentimes for contingency events.
25
low-cost variable renewable energy drive the need for greater system flexibility, the aggregation of demand response may prove to be a valuable resource for many power systems.45
Customer load factor46 and load shape47 data is very valuable for determining the optimal customer, circuit and distributed resource approaches for the most efficient system design. DERs offer the potential to serve a range of customer loads with distinct load factors and load shapes to realize efficiencies simultaneously for the customer and the broader utility system. However, a utility may or may not benefit financially from some DER solutions, and could in fact lose revenue under certain circumstances. If utilities exercise sole control over consumer load data and are not required to share it, there exists a very real possibility that this information will never be shared with DER providers or customers, as it may show a solution which saves consumers money or reduces utility investments.
Utility management, whether private or publicly-owned and managed, often are motivated toward large investments that increase rate base (the “Averch-Johnson effect” 48). Traditional cost-of-service regulation sets a rate of return on rate base,49 and so the utility is incentivized to increase revenue (and earnings for shareholders if privately owned) by investing in its own plant. Early forms of PBR designed to counter the Averch-Johnson effect by allowing utilities to keep savings from efficient operations. This early form of PBR, multi-year rate plan mechanisms, set electric rates and adjusted them for inflation and productivity. Utilities that operate with fewer costs than what was approved in the last rate case (adjusted for inflation and productivity) can keep some or all of the savings. In this way, multi-year rate plans reward cost control.50 This means that between rate-setting proceedings, prices increase as function of inflation, and are reduced by expected productivity gains, but not as a function of capital investment. Not only do DER investments potentially reduce the need for utility investments, DERs also reduce utility sales volume which reduces utility revenue in the short-run. The utility desire to build rate base and increase the volume of sales (the “throughput incentive”) give utilities two strong structural incentives to resist DERs, even in scenarios where they are the lowest cost resource option available. These factors can become barriers to deploying DER solutions in some jurisdictions.
45 In competitive markets, the energy service company (ESCO) business model is predicated on monetizing a portion of the value associated with saving consumers money on their electricity bills. ESCO revenues are generated by sharing the savings achieved and thus driven by reductions in savings from retail prices. Whether that model can now extend into energy supply and potentially wholesale markets is an open question. 46 Load factor is the ratio of a customer’s or location’s average or actual electricity usage to peak load, usually over a period such as a billing period or annually (average load as a percentage of peak load).. 47 Load shape is a user’s or location’s energy consumption pattern over time, such as daily, monthly, seasonally or yearly. 48 The “Averch-Johnson” effect is identified by economists as the tendency of regulated companies to engage in excess capital investments to increase their profits. 49 For publicly owned systems with no private shareholders, there is still revenue and earnings pressure. Universally, lenders (bondholders) demand certain coverage ratios to justify investment grade interest rates and enable reasonable retail rates which drive revenue concerns. Other hidden incentives for growth include federal and global aid programs where loan administrators pursue volume of loans and grants placed. A related concern is setting administrator salaries keyed to the size of the electric system. 50 See Section 2.2.1.
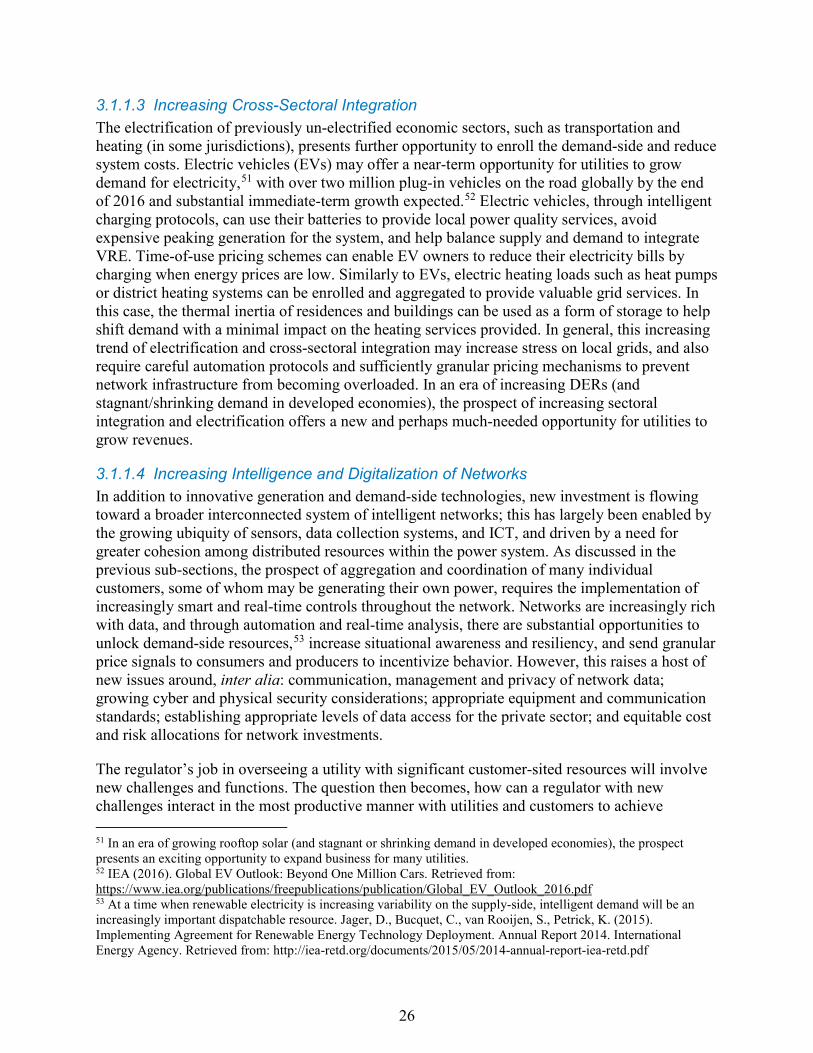
26
3.1.1.3 Increasing Cross-Sectoral Integration The electrification of previously un-electrified economic sectors, such as transportation and heating (in some jurisdictions), presents further opportunity to enroll the demand-side and reduce system costs. Electric vehicles (EVs) may offer a near-term opportunity for utilities to grow demand for electricity,51 with over two million plug-in vehicles on the road globally by the end of 2016 and substantial immediate-term growth expected.52 Electric vehicles, through intelligent charging protocols, can use their batteries to provide local power quality services, avoid expensive peaking generation for the system, and help balance supply and demand to integrate VRE. Time-of-use pricing schemes can enable EV owners to reduce their electricity bills by charging when energy prices are low. Similarly to EVs, electric heating loads such as heat pumps or district heating systems can be enrolled and aggregated to provide valuable grid services. In this case, the thermal inertia of residences and buildings can be used as a form of storage to help shift demand with a minimal impact on the heating services provided. In general, this increasing trend of electrification and cross-sectoral integration may increase stress on local grids, and also require careful automation protocols and sufficiently granular pricing mechanisms to prevent network infrastructure from becoming overloaded. In an era of increasing DERs (and stagnant/shrinking demand in developed economies), the prospect of increasing sectoral integration and electrification offers a new and perhaps much-needed opportunity for utilities to grow revenues.
3.1.1.4 Increasing Intelligence and Digitalization of Networks In addition to innovative generation and demand-side technologies, new investment is flowing toward a broader interconnected system of intelligent networks; this has largely been enabled by the growing ubiquity of sensors, data collection systems, and ICT, and driven by a need for greater cohesion among distributed resources within the power system. As discussed in the previous sub-sections, the prospect of aggregation and coordination of many individual customers, some of whom may be generating their own power, requires the implementation of increasingly smart and real-time controls throughout the network. Networks are increasingly rich with data, and through automation and real-time analysis, there are substantial opportunities to unlock demand-side resources,53 increase situational awareness and resiliency, and send granular price signals to consumers and producers to incentivize behavior. However, this raises a host of new issues around, inter alia: communication, management and privacy of network data; growing cyber and physical security considerations; appropriate equipment and communication standards; establishing appropriate levels of data access for the private sector; and equitable cost and risk allocations for network investments.
The regulator’s job in overseeing a utility with significant customer-sited resources will involve new challenges and functions. The question then becomes, how can a regulator with new challenges interact in the most productive manner with utilities and customers to achieve 51 In an era of growing rooftop solar (and stagnant or shrinking demand in developed economies), the prospect presents an exciting opportunity to expand business for many utilities. 52 IEA (2016). Global EV Outlook: Beyond One Million Cars. Retrieved from: https://www.iea.org/publications/freepublications/publication/Global_EV_Outlook_2016.pdf 53 At a time when renewable electricity is increasing variability on the supply-side, intelligent demand will be an increasingly important dispatchable resource. Jager, D., Bucquet, C., van Rooijen, S., Petrick, K. (2015). Implementing Agreement for Renewable Energy Technology Deployment. Annual Report 2014. International Energy Agency. Retrieved from: http://iea-retd.org/documents/2015/05/2014-annual-report-iea-retd.pdf

27
efficiencies and higher levels of service for customers who increasingly have differentiated load shapes, usage and even generation patterns.
3.2 What Do We Not Know About What’s Changing? While we cannot predict the precise evolution of the power systems of the future, we are able to identify trends. Those are addressed in Section 3.1. Here too there is a caveat: we do not know all the trends. But we do have sense of the existing trends. This is tricky as well, however, because we do not know at what pace and how each specific trend will develop. Or indeed, whether another trend will overtake and influence what we know is changing. So while we have a good sense of direction, we are not able to predict pace, precise development scenarios, and most especially disruptive trends. To accommodate technological, adoption and disruptive certainty, we want to design regulatory structures to accommodate future outcomes consistent with a wide variety of future scenarios all of which are plausible.
In the 20th century, power grid and power sector regulatory paradigms were designed to have flexibility to address uncertainties such as demand variability (daily and seasonal variations, fuel price fluctuations, and failures of system components such as failures or one or more generators.) The underlying energy markets for traditional fossil fuels can be very dynamic. These markets can be subnational, national and international, and fuel prices are often volatile so supply input economics vary just as electricity demand has varied. The regulatory models adequately addressed these uncertainties.
In the 21st century, advanced energy technologies such as battery storage and grid-enabled vehicle charging create new resources types with new capabilities and integration challenges. Battery storage may enable demand management heretofore unheard of, and looks sometimes like a generator, sometimes like a customer asset, and other times like a distribution or transmission assets. Regulators are still grappling with how to classify storage under traditional regulation and understand its true value to the grid.
Technologies, networks, and new applications are emerging very quickly and so are consumer expectations of the grid to provide the value they anticipate. Some consumers expect more opportunities for increased control over their energy use, and assume that new technologies will provide them with attractive options. As with transformative technology, business models of industries will start, end, or evolve as the waves of change move forward. Recent history is replete with transformative technology change that was not foreseen by experts.
Can regulators and utilities know what’s changing? Energy consumption has been over-predicted for six decades which suggests that even the experts and regulators predict energy trends incorrectly. Figure 5 illustrates this error, showing the projected energy consumption, and comparing it with actual energy consumption.
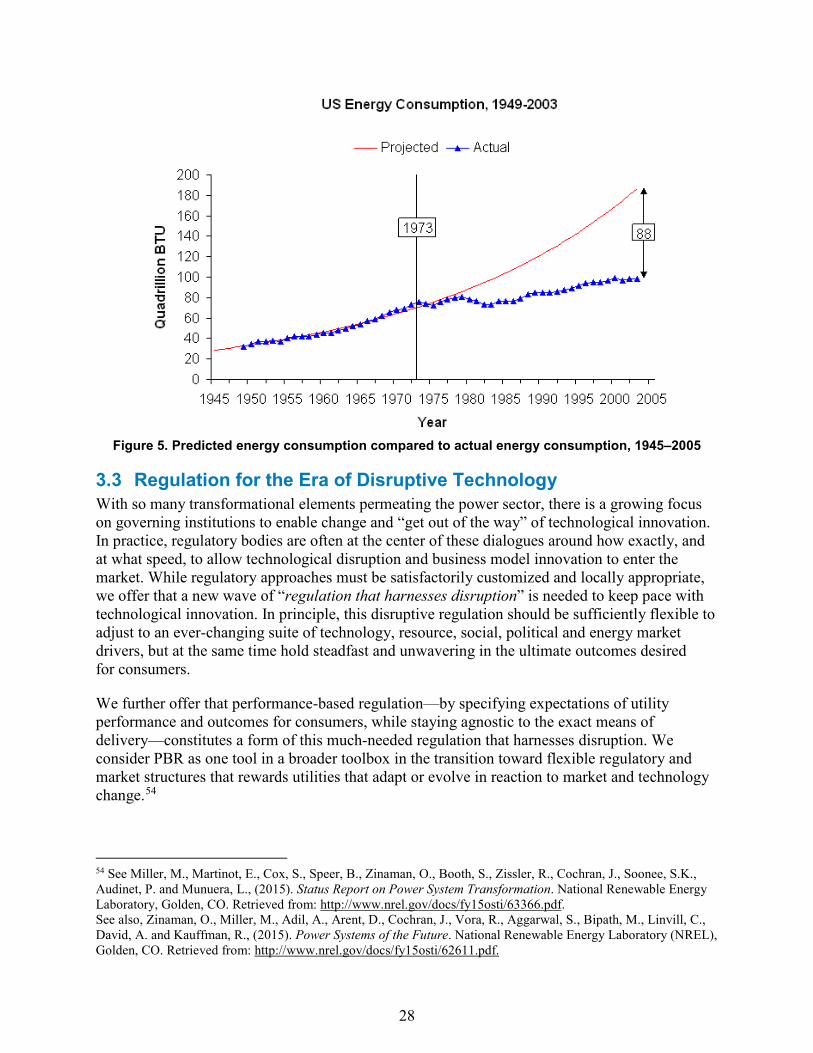
28
Figure 5. Predicted energy consumption compared to actual energy consumption, 1945–2005
3.3 Regulation for the Era of Disruptive Technology With so many transformational elements permeating the power sector, there is a growing focus on governing institutions to enable change and “get out of the way” of technological innovation. In practice, regulatory bodies are often at the center of these dialogues around how exactly, and at what speed, to allow technological disruption and business model innovation to enter the market. While regulatory approaches must be satisfactorily customized and locally appropriate, we offer that a new wave of “regulation that harnesses disruption” is needed to keep pace with technological innovation. In principle, this disruptive regulation should be sufficiently flexible to adjust to an ever-changing suite of technology, resource, social, political and energy market drivers, but at the same time hold steadfast and unwavering in the ultimate outcomes desired for consumers.
We further offer that performance-based regulation—by specifying expectations of utility performance and outcomes for consumers, while staying agnostic to the exact means of delivery—constitutes a form of this much-needed regulation that harnesses disruption. We consider PBR as one tool in a broader toolbox in the transition toward flexible regulatory and market structures that rewards utilities that adapt or evolve in reaction to market and technology change.54
54 See Miller, M., Martinot, E., Cox, S., Speer, B., Zinaman, O., Booth, S., Zissler, R., Cochran, J., Soonee, S.K., Audinet, P. and Munuera, L., (2015). Status Report on Power System Transformation. National Renewable Energy Laboratory, Golden, CO. Retrieved from: http://www.nrel.gov/docs/fy15osti/63366.pdf. See also, Zinaman, O., Miller, M., Adil, A., Arent, D., Cochran, J., Vora, R., Aggarwal, S., Bipath, M., Linvill, C., David, A. and Kauffman, R., (2015). Power Systems of the Future. National Renewable Energy Laboratory (NREL), Golden, CO. Retrieved from: http://www.nrel.gov/docs/fy15osti/62611.pdf.
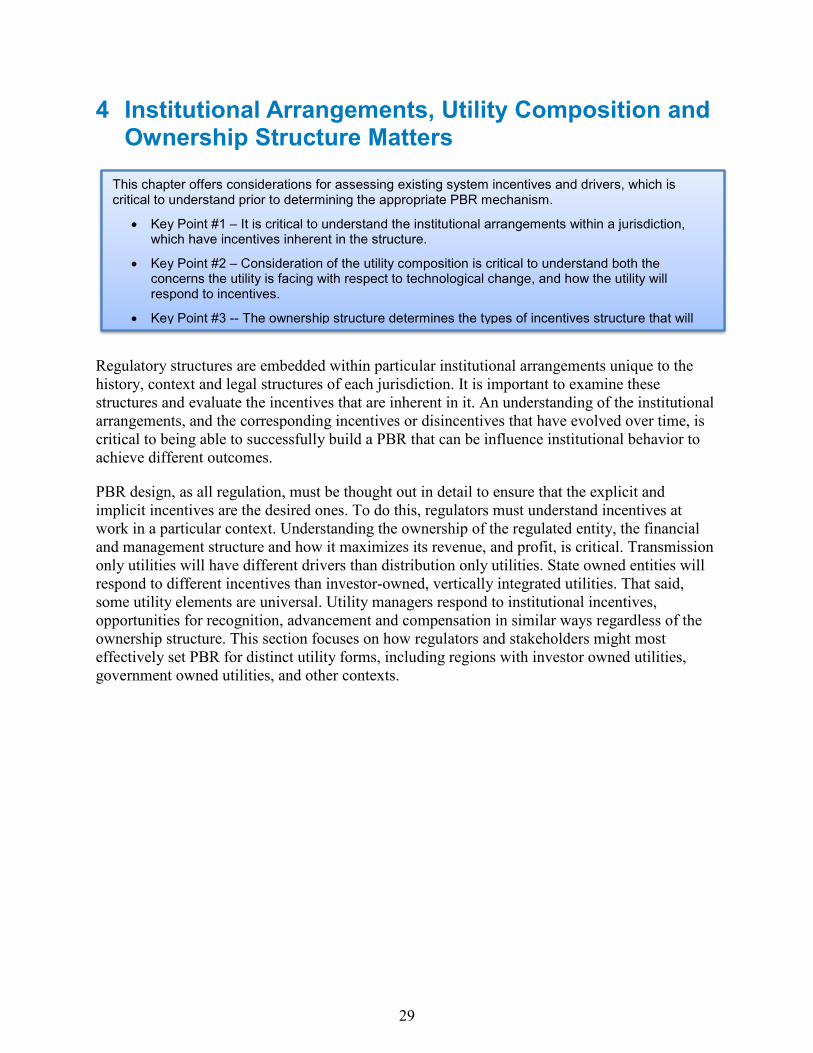
29
4 Institutional Arrangements, Utility Composition and Ownership Structure Matters
Regulatory structures are embedded within particular institutional arrangements unique to the history, context and legal structures of each jurisdiction. It is important to examine these structures and evaluate the incentives that are inherent in it. An understanding of the institutional arrangements, and the corresponding incentives or disincentives that have evolved over time, is critical to being able to successfully build a PBR that can be influence institutional behavior to achieve different outcomes.
PBR design, as all regulation, must be thought out in detail to ensure that the explicit and implicit incentives are the desired ones. To do this, regulators must understand incentives at work in a particular context. Understanding the ownership of the regulated entity, the financial and management structure and how it maximizes its revenue, and profit, is critical. Transmission only utilities will have different drivers than distribution only utilities. State owned entities will respond to different incentives than investor-owned, vertically integrated utilities. That said, some utility elements are universal. Utility managers respond to institutional incentives, opportunities for recognition, advancement and compensation in similar ways regardless of the ownership structure. This section focuses on how regulators and stakeholders might most effectively set PBR for distinct utility forms, including regions with investor owned utilities, government owned utilities, and other contexts.
This chapter offers considerations for assessing existing system incentives and drivers, which is critical to understand prior to determining the appropriate PBR mechanism.
• Key Point #1 – It is critical to understand the institutional arrangements within a jurisdiction, which have incentives inherent in the structure.
• Key Point #2 – Consideration of the utility composition is critical to understand both the concerns the utility is facing with respect to technological change, and how the utility will respond to incentives.
• Key Point #3 -- The ownership structure determines the types of incentives structure that will
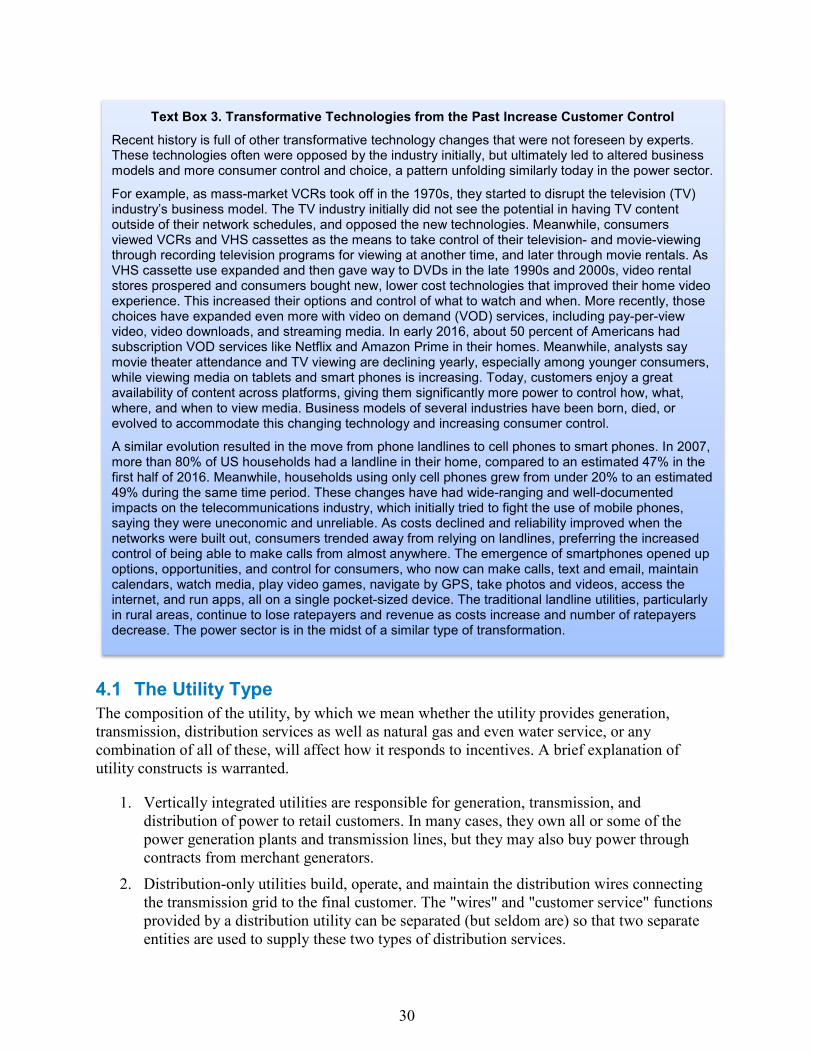
30
4.1 The Utility Type The composition of the utility, by which we mean whether the utility provides generation, transmission, distribution services as well as natural gas and even water service, or any combination of all of these, will affect how it responds to incentives. A brief explanation of utility constructs is warranted.
1. Vertically integrated utilities are responsible for generation, transmission, and distribution of power to retail customers. In many cases, they own all or some of the power generation plants and transmission lines, but they may also buy power through contracts from merchant generators.
2. Distribution-only utilities build, operate, and maintain the distribution wires connecting the transmission grid to the final customer. The "wires" and "customer service" functions provided by a distribution utility can be separated (but seldom are) so that two separate entities are used to supply these two types of distribution services.
Text Box 3. Transformative Technologies from the Past Increase Customer Control Recent history is full of other transformative technology changes that were not foreseen by experts. These technologies often were opposed by the industry initially, but ultimately led to altered business models and more consumer control and choice, a pattern unfolding similarly today in the power sector.
For example, as mass-market VCRs took off in the 1970s, they started to disrupt the television (TV) industry’s business model. The TV industry initially did not see the potential in having TV content outside of their network schedules, and opposed the new technologies. Meanwhile, consumers viewed VCRs and VHS cassettes as the means to take control of their television- and movie-viewing through recording television programs for viewing at another time, and later through movie rentals. As VHS cassette use expanded and then gave way to DVDs in the late 1990s and 2000s, video rental stores prospered and consumers bought new, lower cost technologies that improved their home video experience. This increased their options and control of what to watch and when. More recently, those choices have expanded even more with video on demand (VOD) services, including pay-per-view video, video downloads, and streaming media. In early 2016, about 50 percent of Americans had subscription VOD services like Netflix and Amazon Prime in their homes. Meanwhile, analysts say movie theater attendance and TV viewing are declining yearly, especially among younger consumers, while viewing media on tablets and smart phones is increasing. Today, customers enjoy a great availability of content across platforms, giving them significantly more power to control how, what, where, and when to view media. Business models of several industries have been born, died, or evolved to accommodate this changing technology and increasing consumer control.
A similar evolution resulted in the move from phone landlines to cell phones to smart phones. In 2007, more than 80% of US households had a landline in their home, compared to an estimated 47% in the first half of 2016. Meanwhile, households using only cell phones grew from under 20% to an estimated 49% during the same time period. These changes have had wide-ranging and well-documented impacts on the telecommunications industry, which initially tried to fight the use of mobile phones, saying they were uneconomic and unreliable. As costs declined and reliability improved when the networks were built out, consumers trended away from relying on landlines, preferring the increased control of being able to make calls from almost anywhere. The emergence of smartphones opened up options, opportunities, and control for consumers, who now can make calls, text and email, maintain calendars, watch media, play video games, navigate by GPS, take photos and videos, access the internet, and run apps, all on a single pocket-sized device. The traditional landline utilities, particularly in rural areas, continue to lose ratepayers and revenue as costs increase and number of ratepayers decrease. The power sector is in the midst of a similar type of transformation.
31
3. Generation companies (GENCOs) are regulated or non-regulated entities (depending upon the utility industry structure) that operate and maintain existing generating plants. The GENCO may own the generation plants or interact with the short term power generation market on behalf of plant owners.
4. Transmission companies build, maintain and either own or operate transmission lines.
Each utility type is also experiencing a wave of technological change and will have different concerns about these changes. Generation companies desire to have their generating plants called upon by the system operators, and do not want their plants to become stranded assets or seldom called upon as cheaper forms of generation (either utility owned or distributed) become available. Transmission companies want to ensure that their existing wires are utilized in the most advantageous way, which may be problematic as many of the best renewable generation sites are not located along major transmission routes. Distribution companies want to sell power to customers, and are concerned that increasing penetration of distributed energy resources and efficient uses of power are decreasing sales volume, and hence revenue. Vertically integrated utilities are facing all of these concerns. Addressing these concerns among others is key to implementing an incentive structure that will be fruitful from a utility and power sector owner perspective.
4.2 Utility Ownership Structures The ownership structure of the utility matters in the PBR context just as much as the utility composition. The ownership structure determines the types of incentives structure that will have traction on the specific utility. Investor-owned utilities (IOUs) are concerned with providing a high and stable rate of return for investors. Publically owned utilities are more likely to have political or societal objectives, but also often must pay borrowing costs in the form of bonds so they may act like IOUs in some regards because they need to ensure they can pay their bond holders. Ownership structure drivers, either investor-owned or publically owned, will also vary depending on their location in the globe, and the needs of the particular jurisdiction.
4.2.1 Regions with Investor-Owned Utilities A subtle evolution is already underway in jurisdictions with investor-owned utilities. This evolution is from a regulatory emphasis on rate-of-return structure to more of an emphasis on direct performance incentive structures. PBR frameworks can look as different and novel as the U.K.’s RIIO and NY’s REV from 20th century power sector regulation. Alternatively, PBR can look like a carefully designed PIM (or set of PIMs) layered onto a more traditional regulatory approach. Regardless of the exact structure, the pace of technological change is putting energy tools into customers’ hands that will require utilities to change how they do business. For that transition to work most effectively for utilities, customers and other stakeholders, regulators will be considering ways to change how they compensate utilities for doing business in ways they previously have not.
4.2.2 Regions with State, Provincial or other Governmental Ownership of Utilities There are many different forms of governmental ownership and governance from state- and provincial-ownership governed by relevant agencies or ministries, to city- and municipally-owned governed by local governments, boards or commissioners, utility districts and cooperatives that are private non-profit entities governed by boards of utility customers, and
32
other public and quasi-public entities. The institutional arrangements of these utilities will dictate how to consider appropriate PBRs discussed herein. An additional consideration for government-owned utilities is to assess whether PBR mechanisms will be enforced through internal incentives, or an independent government regulator. The effectiveness of compliance, reporting, transparency and enforcement mechanisms would be part of that consideration.
4.2.3 Investor-Owned and State-Owned-Utility Contexts The nature of SOEs in China is quite different from the ownership structures of utilities in the U.S. and U.K. Yet the Chinese are adopting a system of revenue regulation T&D reform that in principle parallels some Western regulatory systems.55 China has adopted an “allowed revenue” component of T&D price reform, and certain provinces have been tasked by the central government with developing outcome-specific PIMs for the grid companies. The PIM will operate as overlays on the revenue regulation framework, targeting specific outcomes.56 Yunnan and Western Inner Mongolia are the first provinces to try this framework. The policy documents in these two provinces explicitly mention DSM program performance as one of the criteria. This new T&D price reform will coexist with an older method of regulating grid companies (gridcos), primarily a system of individual performance reviews for SOE managers, based on specific target outcomes for the SOE, including profitability and environmental performance.57
PIMs appear to be part of the new T&D price reform in China, with some supplement to (or deduction from) revenues to be awarded (or subtracted) when a utility exceeds (or misses) a specific target for every item in the PIM, not only DSM. 58 Depending on local formulation details, the PIMs may differ across provinces. Specific PIMs under discussion focus on capital usage, reliability, service quality, DSM, or other criteria such as “innovation”.59
China’s new revenue regulation also takes Western approaches to control cost and capital investment in three primary ways: 1) operation and maintenance expenses are required to be benchmarked with the advanced standard costs and capped to a certain level; 2) gridco’s capital investments are carefully examined to curb overinvestment which doesn’t serve load growth or reliability purposes; and 3) gridcos can share savings accrued with customers within the three year regulatory period, if gridcos operate more efficiently or reduce unnecessary capital investment.
India has recognized the importance of accurately measuring progress on utility financial and energy efficiency with a utility, state and national level measurement scheme. Ujwal DISCOM Assurance Yojana (UDAY) is a performance incentive mechanism that is designed to facilitate financial & operational improvements among Indian distribution companies (DISCOMs). Progress is measured on an individual level against specialized targets for each DISCOM and Indian state, and then at a national level, to compare progress of all DISCOMs and states against
55 See also Section 6.2.9. 56 NDRC2016d). Notice on Issuing Provincial Grid T&D Pricing Rule(Trial). (NDRC Pricing Department No. 2711). http://www.ndrc.gov.cn/zcfb/zcfbtz/201701/t20170104_834311.html 57 See also Section 6.2.9 for further discussion. 58 NDRC2016d). Notice on Issuing Provincial Grid T&D Pricing Rule(Trial). (NDRC Pricing Department No. 2711). http://www.ndrc.gov.cn/zcfb/zcfbtz/201701/t20170104_834311.html 59 Capital usage, reliability and service quality are in the national guidance document. The other criteria such as DSM and innovation are adopted in local T&D pricing regulation.
33
each other. Initially UDAY states and DISCOMs are to be measured against their own metrics and targets, and progress is monitored on an “improvement barometer” that displays the post-UDAY cumulative progress (on an annual basis) made by the DISCOM on 14 selected parameters. For the first 12 parameters, the performance of the DISCOM is evaluated by comparing the achievement with respect to the targets submitted or memorandum of understanding (MOU) projections. Calculations for assigning the marks against improvement are done on a quarterly basis based on data provided by the DISCOM. The quarterly rankings show how each DISCOM/State ranks against each other, thus providing a national dashboard and ranking of the comparative progress of each DISCOM.
Each one of the directional incentives mentioned above for the UDAY initiative are to be measured accurately, i.e. with smart metering to determine the benefits of system improvements such as upgraded transformers, energy efficiency (e.g., LED light bulbs sold and installed), reduced losses, cost of power. For UDAY, it is also important to track incentives such as interest rates charged to state governments and financial measures, such as the gap between Average Cost of Supply and Average Revenue Recovered. The UDAY initiative has not reduced the incentives to formulas but tracking of data will allow for evaluation of success of financial support in improvements in provincial utility operations – as well as refinement of the incentives structures, performance criteria and metrics as UDAY and subsequent initiatives proceed.
Thus, in different contexts on different continents with different ownership structures, there are nonetheless efforts to use PBR mechanisms to pursue similar efficiency, renewable energy and advanced technology goals.
4.3 Institutional Arrangements Allocate Costs and Risk In most utility structures, revenue growth is a predominant goal. Multi-year rate plans may slow revenue growth compared to regular cost-of-service regulation. For this reason, utilities may oppose PBRs unless the PBR relieves the utility of costs or risks it otherwise would bear. Conversely, if the PBR produces faster than expected revenue growth, consumer advocates and groups may oppose it.60 That tension may be productive if decisions on PBR are made in a transparent manner.
Any PBR scheme must account for factors that are significant in scale and outside of the utility’s control that might affect metric achievement. For multi-year rate plans, an adjustment called a ‘Z Factor’ is commonly used to identify factors outside the utilities control. Advanced PBR target and metric setting can step beyond merely identifying risk within and outside the utility’s control to consider who currently bears the risk of non-achievement, who pays for achieving or not achieving the goals, who can most efficiently address the risk (utility, consumers, third-parties) and how the risk will affect the utility’s, customer’s and third-parties’ decisions.61
60 Regulatory Assistance Project. (2000). Performance-Based Regulation for Distribution Utilities. Montpelier, VT: The Regulatory Assistance Project. Retreived from: http://www.raponline.org/wp-content/uploads/2016/05/rap-performancebasedregulationfordistributionutilities-2000-12.pdf, p. 36. 61 Regulatory Assistance Project. (2000). Performance-Based Regulation for Distribution Utilities. Montpelier, VT: The Regulatory Assistance Project. Retreived from: http://www.raponline.org/wp-content/uploads/2016/05/rap-performancebasedregulationfordistributionutilities-2000-12.pdf, p. 38.
34
4.4 Examples of Underperforming Institutional Arrangements There is evidence that management of larger utilities receive higher compensation than their peers at smaller utilities.62 This means that whether in the U.S., Europe, China or elsewhere, there may be a desire on the part of utility executive to both grow the size of their utility and to perform well in order to move to other larger utilities or enterprises – rather than perform well for the sake of current customers. In an environment that focusses on revenues and company size, that will reinforce the incentive to invest in large infrastructure projects and to grow revenue, which may or may not provide the most cost efficient system for production and delivery of electricity. Thus, these outputs are driven by a separate executive compensation institutional incentive. For instance, in China, utilities have a strong PBR inherent in their state-owned structure: performance evaluations for China’s state-owned enterprise grid company managers.63 The manager performance evaluation focusses on economic criteria such as annual economic value added (EVA) and net profit. Manager income and promotion is directly linked to these evaluations, which has the potential to incentivize utility investment decisions that are not cost-optimal for the overall system.
62 Lazar, J, (2011). Beyond Decoupling, Creating an Effective Power Sector Framework for Clean Energy Objectives: Aligning Utility Business Models with Clean Energy Policies. Unpublished manuscript. Montpelier, VT: The Regulatory Assistance Project. 63 For example, see: Xia, J. (2015). Study of Evaluation Methods of SOEs Manager’s Performance for Inhibiting Corruption. Retrieved from: http://file.scirp.org/pdf/ME_2015101614064199.pdf
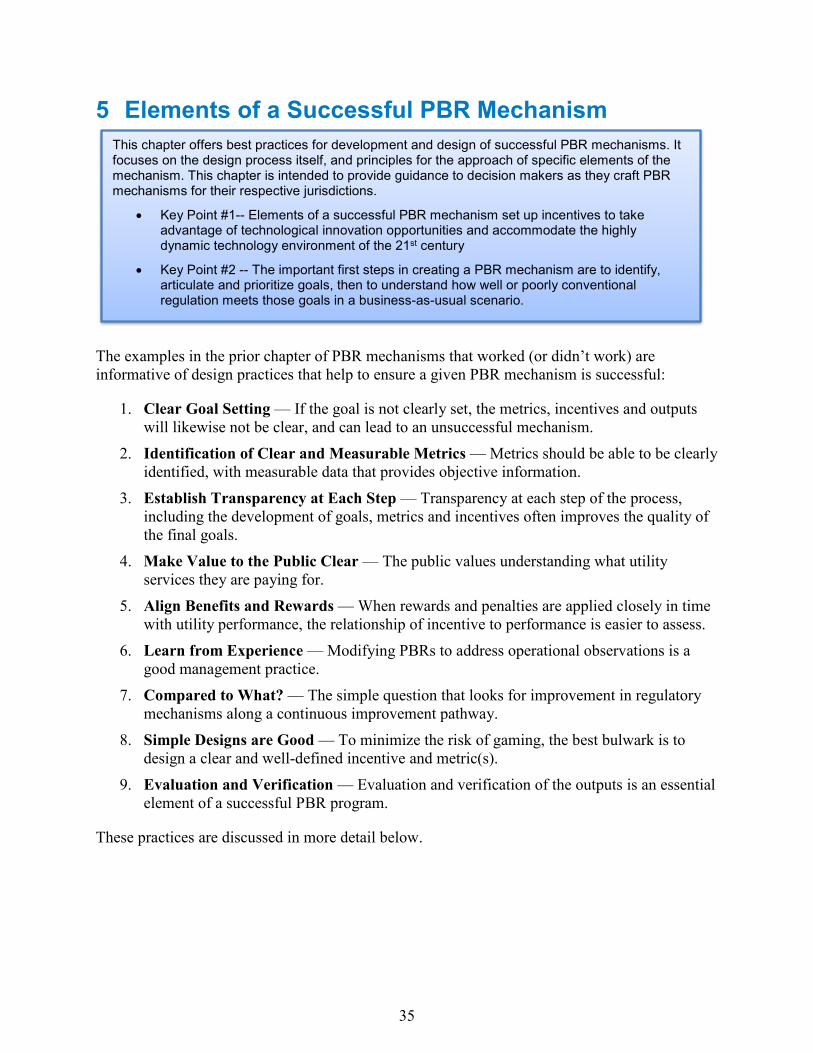
35
5 Elements of a Successful PBR Mechanism
The examples in the prior chapter of PBR mechanisms that worked (or didn’t work) are informative of design practices that help to ensure a given PBR mechanism is successful:
1. Clear Goal Setting — If the goal is not clearly set, the metrics, incentives and outputs will likewise not be clear, and can lead to an unsuccessful mechanism.
2. Identification of Clear and Measurable Metrics — Metrics should be able to be clearly identified, with measurable data that provides objective information.
3. Establish Transparency at Each Step — Transparency at each step of the process, including the development of goals, metrics and incentives often improves the quality of the final goals.
4. Make Value to the Public Clear — The public values understanding what utility services they are paying for.
5. Align Benefits and Rewards — When rewards and penalties are applied closely in time with utility performance, the relationship of incentive to performance is easier to assess.
6. Learn from Experience — Modifying PBRs to address operational observations is a good management practice.
7. Compared to What? — The simple question that looks for improvement in regulatory mechanisms along a continuous improvement pathway.
8. Simple Designs are Good — To minimize the risk of gaming, the best bulwark is to design a clear and well-defined incentive and metric(s).
9. Evaluation and Verification — Evaluation and verification of the outputs is an essential element of a successful PBR program.
These practices are discussed in more detail below.
This chapter offers best practices for development and design of successful PBR mechanisms. It focuses on the design process itself, and principles for the approach of specific elements of the mechanism. This chapter is intended to provide guidance to decision makers as they craft PBR mechanisms for their respective jurisdictions.
• Key Point #1-- Elements of a successful PBR mechanism set up incentives to take advantage of technological innovation opportunities and accommodate the highly dynamic technology environment of the 21st century
• Key Point #2 -- The important first steps in creating a PBR mechanism are to identify, articulate and prioritize goals, then to understand how well or poorly conventional regulation meets those goals in a business-as-usual scenario.

36
5.1 Clear Goal Setting The important first steps in creating a PBR mechanism are to identify, articulate and prioritize goals, then to understand how well or poorly conventional regulation meets those goals in a business-as-usual scenario. An honest assessment is needed and is not trivial since it is a self-assessment by the regulator of its process or an independent governmental or third-party review. If reallocation of risk is being considered (often as between ratepayers and utilities), then the stakeholders must understand who bears the risk now, how a shift in risk will affect investment and operational decisions, reductions in net risk through providing more certainty, and whether there are cost-management implications to shifting risk.64 The outcome of this process could be that guiding principles support renewable development or could support DER adoption. The goals may also focus on cost-cutting or risk shifting.
One helpful way for considering PBR goals is as a set of guiding goals (or guiding incentives) informed by public policy priorities. These guiding goals are honed by more specific directional incentives which specify measurable performance criteria. The directional incentives are sometimes accompanied by a coordinated set of operational goals that also specify measurable performance criteria. Thus, goals can be guiding incentives with more targeted directional incentives using measurable goals/metrics, and/or operational incentives related to guiding goals. While different jurisdictions use different terminology, this report uses consistent methodology recognizing that in actual practice variations on these terms will be encountered.
64 Regulatory Assistance Project. (2000). Performance-Based Regulation for Distribution Utilities. Montpelier, VT: The Regulatory Assistance Project. Retreived from: http://www.raponline.org/wp-content/uploads/2016/05/rap-performancebasedregulationfordistributionutilities-2000-12.pdf, p. 19.
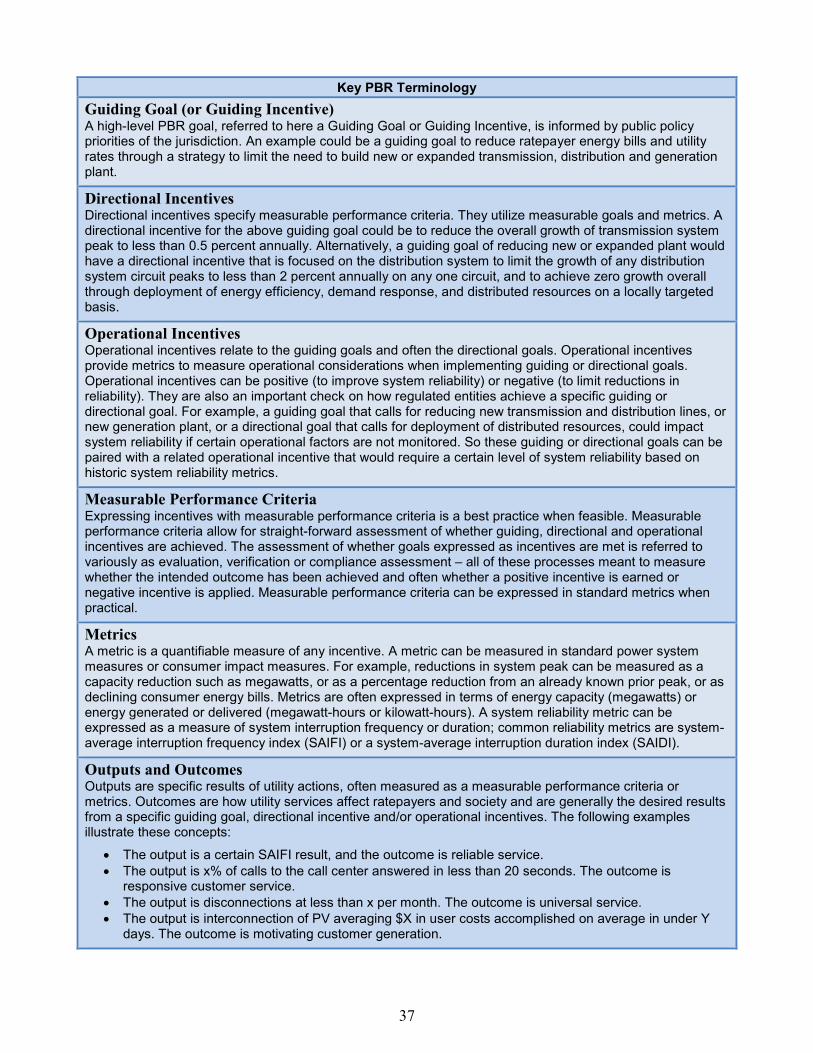
37
Key PBR Terminology Guiding Goal (or Guiding Incentive) A high-level PBR goal, referred to here a Guiding Goal or Guiding Incentive, is informed by public policy priorities of the jurisdiction. An example could be a guiding goal to reduce ratepayer energy bills and utility rates through a strategy to limit the need to build new or expanded transmission, distribution and generation plant.
Directional Incentives Directional incentives specify measurable performance criteria. They utilize measurable goals and metrics. A directional incentive for the above guiding goal could be to reduce the overall growth of transmission system peak to less than 0.5 percent annually. Alternatively, a guiding goal of reducing new or expanded plant would have a directional incentive that is focused on the distribution system to limit the growth of any distribution system circuit peaks to less than 2 percent annually on any one circuit, and to achieve zero growth overall through deployment of energy efficiency, demand response, and distributed resources on a locally targeted basis.
Operational Incentives Operational incentives relate to the guiding goals and often the directional goals. Operational incentives provide metrics to measure operational considerations when implementing guiding or directional goals. Operational incentives can be positive (to improve system reliability) or negative (to limit reductions in reliability). They are also an important check on how regulated entities achieve a specific guiding or directional goal. For example, a guiding goal that calls for reducing new transmission and distribution lines, or new generation plant, or a directional goal that calls for deployment of distributed resources, could impact system reliability if certain operational factors are not monitored. So these guiding or directional goals can be paired with a related operational incentive that would require a certain level of system reliability based on historic system reliability metrics.
Measurable Performance Criteria Expressing incentives with measurable performance criteria is a best practice when feasible. Measurable performance criteria allow for straight-forward assessment of whether guiding, directional and operational incentives are achieved. The assessment of whether goals expressed as incentives are met is referred to variously as evaluation, verification or compliance assessment – all of these processes meant to measure whether the intended outcome has been achieved and often whether a positive incentive is earned or negative incentive is applied. Measurable performance criteria can be expressed in standard metrics when practical.
Metrics A metric is a quantifiable measure of any incentive. A metric can be measured in standard power system measures or consumer impact measures. For example, reductions in system peak can be measured as a capacity reduction such as megawatts, or as a percentage reduction from an already known prior peak, or as declining consumer energy bills. Metrics are often expressed in terms of energy capacity (megawatts) or energy generated or delivered (megawatt-hours or kilowatt-hours). A system reliability metric can be expressed as a measure of system interruption frequency or duration; common reliability metrics are system-average interruption frequency index (SAIFI) or a system-average interruption duration index (SAIDI).
Outputs and Outcomes Outputs are specific results of utility actions, often measured as a measurable performance criteria or metrics. Outcomes are how utility services affect ratepayers and society and are generally the desired results from a specific guiding goal, directional incentive and/or operational incentives. The following examples illustrate these concepts:
• The output is a certain SAIFI result, and the outcome is reliable service. • The output is x% of calls to the call center answered in less than 20 seconds. The outcome is
responsive customer service. • The output is disconnections at less than x per month. The outcome is universal service. • The output is interconnection of PV averaging $X in user costs accomplished on average in under Y
days. The outcome is motivating customer generation.

38
Guiding incentives set high-level goals that may or may not contain specific measurable performance criteria. A guiding incentive can also be a desired outcome such as appropriately balancing benefits and costs, achieving least-cost service in the long run, fairness, equity, minimizing environmental impact, energy independence, economic development or any combination of these. At the guiding incentive level, it is critical to recognize the importance of clear goal setting.
Operational incentives to achieve operational goals can include reliability, customer service, and low-income customer protection. There is substantial experience implementing these traditional operational incentives to govern reliability and customer service. PBR to encourage operational efficiency and low-income customer protection is both more innovative and more subject to trial and error. All PBRs should be designed with sufficient testing of baseline levels of performance and consideration of the costs and benefits of achieving desired outcomes, and then monitored during implementation with attention to whether the PBR is producing the results intended. For example, the NY REV process details each EAM on a utility-specific basis, recognizing that the starting baseline, costs and benefits of desired outcomes may vary across utility service territories and customer bases. So for example, the particular low-income customer protections associated with NY REV are considered for each utility in light of that utility's prior low-income program success and failure, which vary from utility to utility.
It is also important to note that the PBR goals should be long-term. They should address what the regulatory, utility and stakeholders want the energy generation and delivery systems to provide to consumers in 5, 10 and 20 years. Clear goals that are long-term in nature spanning a fifteen to twenty year horizon or greater can provide the overarching guiding principals for a PBR framework.
Text Box 4. Long-term goals and costs are important The length of a goal is important, because the term can affect how costs are evaluated. In the short-run, many utility plant costs are fixed but in the long-run almost all costs are variable. Looking out 15, 20, or more years, capital investments become variable costs and can be assessed as variable costs from a marginal cost perspective. This means that over the long run, capital investments increasingly become choices for system planners and regulators. The system may benefit from grid investments or may benefit more from other actions that may avoid capital such as paying customers for distributed resources like energy efficiency, demand response, customer-sited generation or storage instead of a new power line, or paying a cloud computing company for a subscription service instead of a utility-owned IT system. This shows that in the long run, almost all costs including capital costs are avoidable. The opportunities to use substitutes for capital are growing with technology and increasing ways to use customers as grid resources.
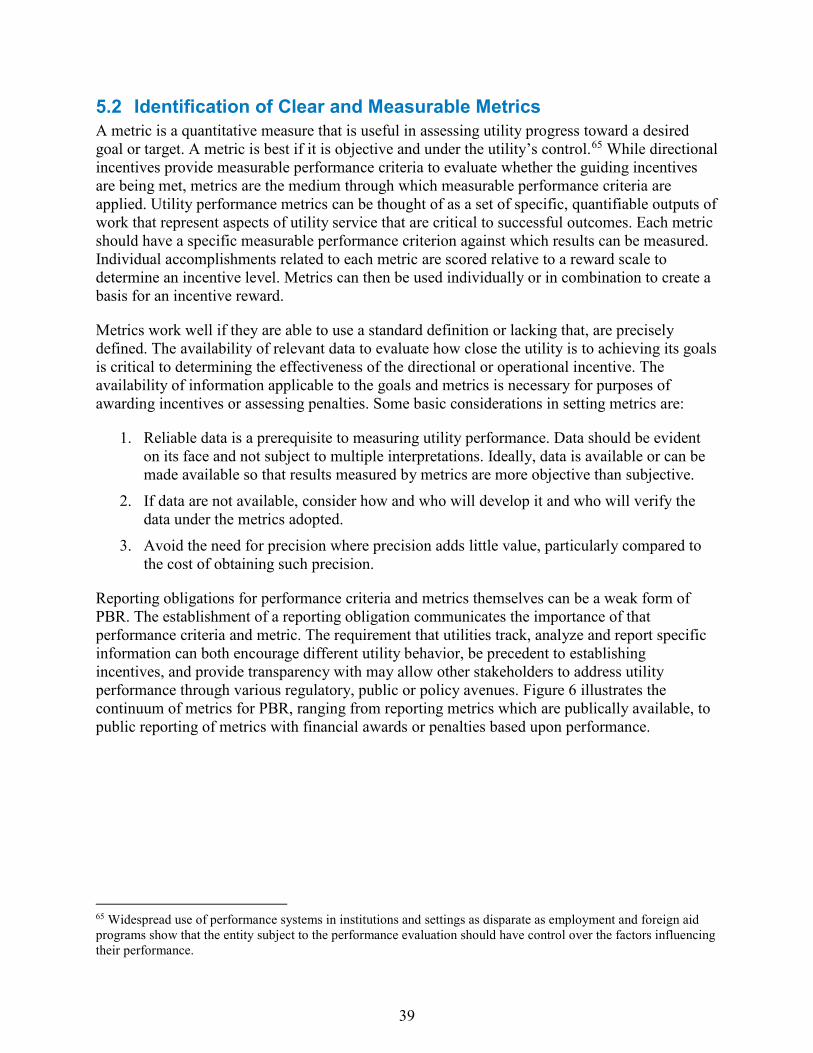
39
5.2 Identification of Clear and Measurable Metrics A metric is a quantitative measure that is useful in assessing utility progress toward a desired goal or target. A metric is best if it is objective and under the utility’s control.65 While directional incentives provide measurable performance criteria to evaluate whether the guiding incentives are being met, metrics are the medium through which measurable performance criteria are applied. Utility performance metrics can be thought of as a set of specific, quantifiable outputs of work that represent aspects of utility service that are critical to successful outcomes. Each metric should have a specific measurable performance criterion against which results can be measured. Individual accomplishments related to each metric are scored relative to a reward scale to determine an incentive level. Metrics can then be used individually or in combination to create a basis for an incentive reward.
Metrics work well if they are able to use a standard definition or lacking that, are precisely defined. The availability of relevant data to evaluate how close the utility is to achieving its goals is critical to determining the effectiveness of the directional or operational incentive. The availability of information applicable to the goals and metrics is necessary for purposes of awarding incentives or assessing penalties. Some basic considerations in setting metrics are:
1. Reliable data is a prerequisite to measuring utility performance. Data should be evident on its face and not subject to multiple interpretations. Ideally, data is available or can be made available so that results measured by metrics are more objective than subjective.
2. If data are not available, consider how and who will develop it and who will verify the data under the metrics adopted.
3. Avoid the need for precision where precision adds little value, particularly compared to the cost of obtaining such precision.
Reporting obligations for performance criteria and metrics themselves can be a weak form of PBR. The establishment of a reporting obligation communicates the importance of that performance criteria and metric. The requirement that utilities track, analyze and report specific information can both encourage different utility behavior, be precedent to establishing incentives, and provide transparency with may allow other stakeholders to address utility performance through various regulatory, public or policy avenues. Figure 6 illustrates the continuum of metrics for PBR, ranging from reporting metrics which are publically available, to public reporting of metrics with financial awards or penalties based upon performance.
65 Widespread use of performance systems in institutions and settings as disparate as employment and foreign aid programs show that the entity subject to the performance evaluation should have control over the factors influencing their performance.
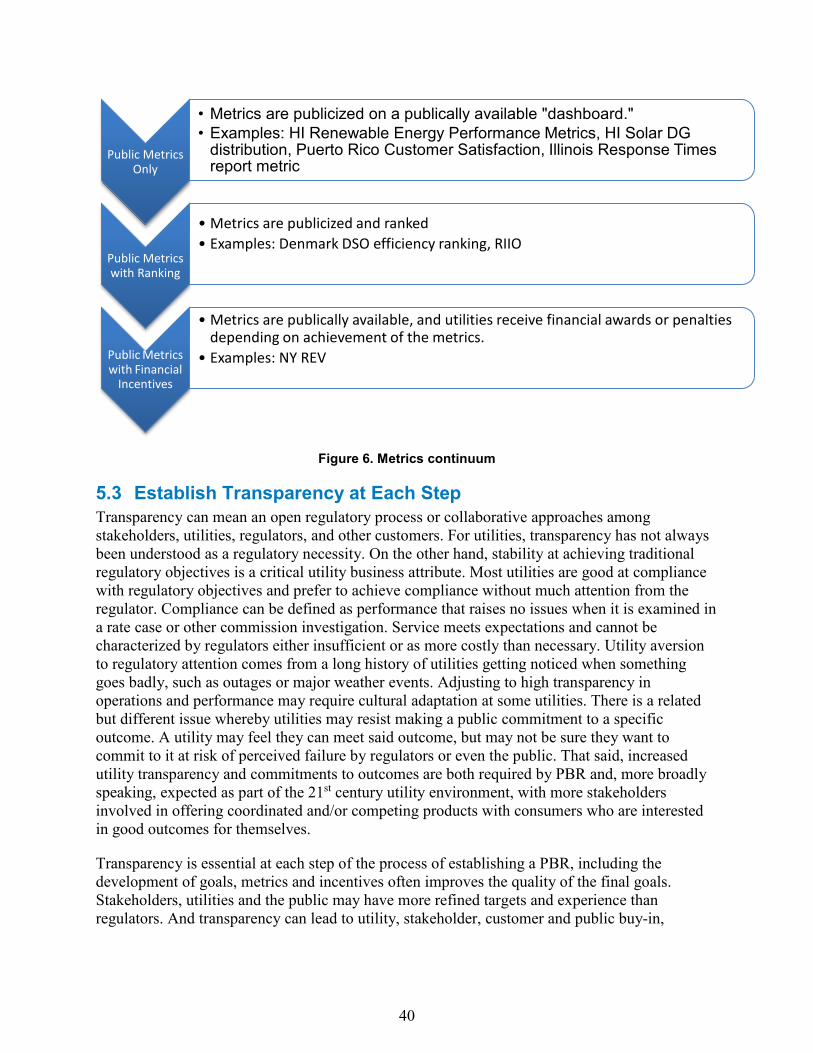
40
Figure 6. Metrics continuum
5.3 Establish Transparency at Each Step Transparency can mean an open regulatory process or collaborative approaches among stakeholders, utilities, regulators, and other customers. For utilities, transparency has not always been understood as a regulatory necessity. On the other hand, stability at achieving traditional regulatory objectives is a critical utility business attribute. Most utilities are good at compliance with regulatory objectives and prefer to achieve compliance without much attention from the regulator. Compliance can be defined as performance that raises no issues when it is examined in a rate case or other commission investigation. Service meets expectations and cannot be characterized by regulators either insufficient or as more costly than necessary. Utility aversion to regulatory attention comes from a long history of utilities getting noticed when something goes badly, such as outages or major weather events. Adjusting to high transparency in operations and performance may require cultural adaptation at some utilities. There is a related but different issue whereby utilities may resist making a public commitment to a specific outcome. A utility may feel they can meet said outcome, but may not be sure they want to commit to it at risk of perceived failure by regulators or even the public. That said, increased utility transparency and commitments to outcomes are both required by PBR and, more broadly speaking, expected as part of the 21st century utility environment, with more stakeholders involved in offering coordinated and/or competing products with consumers who are interested in good outcomes for themselves.
Transparency is essential at each step of the process of establishing a PBR, including the development of goals, metrics and incentives often improves the quality of the final goals. Stakeholders, utilities and the public may have more refined targets and experience than regulators. And transparency can lead to utility, stakeholder, customer and public buy-in,
Public Metrics Only
• Metrics are publicized on a publically available "dashboard." • Examples: HI Renewable Energy Performance Metrics, HI Solar DG
distribution, Puerto Rico Customer Satisfaction, Illinois Response Times report metric
Public Metrics with Ranking
• Metrics are publicized and ranked • Examples: Denmark DSO efficiency ranking, RIIO
Public Metricswith Financial
Incentives
• Metrics are publically available, and utilities receive financial awards or penalties depending on achievement of the metrics.
• Examples: NY REV
41
enhancing the credibility of targets and reducing the risk of (oftentimes very public) disagreements when rewards or penalties are applied.
Transparency is important in the following ways:
Broad stakeholder involvement is critical: Transparency is important for the stakeholder process in two ways: 1) for ensuring that broad stakeholder groups are involved and 2) by including broad viewpoints and incorporating them into the process, consensus is more likely. Regulators have process options for receiving stakeholder views and information—through informal workshops and technical conferences, regulatory dockets with comments, and/or adjudicative proceedings. Irrespective of the process chosen, stakeholder involvement in developing goals, incentives and metrics is essential, especially since what is at stake is changing how regulation is accomplished. Transparency also may provide the benefit of attracting broad stakeholder involvement from companies, investors, and market participants, particularly when they can understand the value proposition. It can also assist with demonstrating to financiers and others how companies will create profits as market participants.
Stakeholder involvement can lead to consensus: Stakeholder involvement can be critical to achieving consensus. By having the stakeholders work together to develop the list of goals, incentives, performance measures and metrics for utility performance improvement and consider how the utility will be rewarded and/or penalized as a result, the stakeholders may set the stage for a higher degree of consensus-building. Working together builds the relationship and opens dialogue among the parties, even when there are substantive disagreements. To the extent that consensus is reached, it reduces the risk of denial of requests for cost recovery. Utilities can have costs denied either in a request to increase rates or in finding that a particular cost or investment was imprudent. Energy efficiency collaboratives are an example of successful stakeholder engagements that many state utility commissions have used to resolve complex issues that emerge during a rate proceeding. Rather than debate the issues through the formality of a commission proceeding, disagreeing parties are sent to discuss issues in a less-formal setting and bring back resolutions to the commission. Collaboratives for energy efficiency are being successfully used in more than half the states in the U.S.66
Reveals the value of the PBR construct: A transparent process with broad participation provides a mechanism for regulators, stakeholders and the utility to understand the value proposition offered by a PBR construct. For example, shared information and discussion can produce a comfort level regarding retail rate design and compensation levels. Consumers can participate in the development of metrics important to them. Utilities and investors may identify opportunities to increase earnings without shouldering the risks of traditional, large construction projects. Utility participation in stakeholder processes also affords utilities a sharper understanding of what is important to other stakeholders, and how achieving the goals of PBR constructs could increase their bottom line.
66 Li, M., and Bryson, J. (2015). Energy Efficiency Collaboratives. State and Local Energy Efficiency Action Network. Retrieved from: https://www4.eere.energy.gov/seeaction/system/files/documents/EECollaboratives-0925final.pdf.
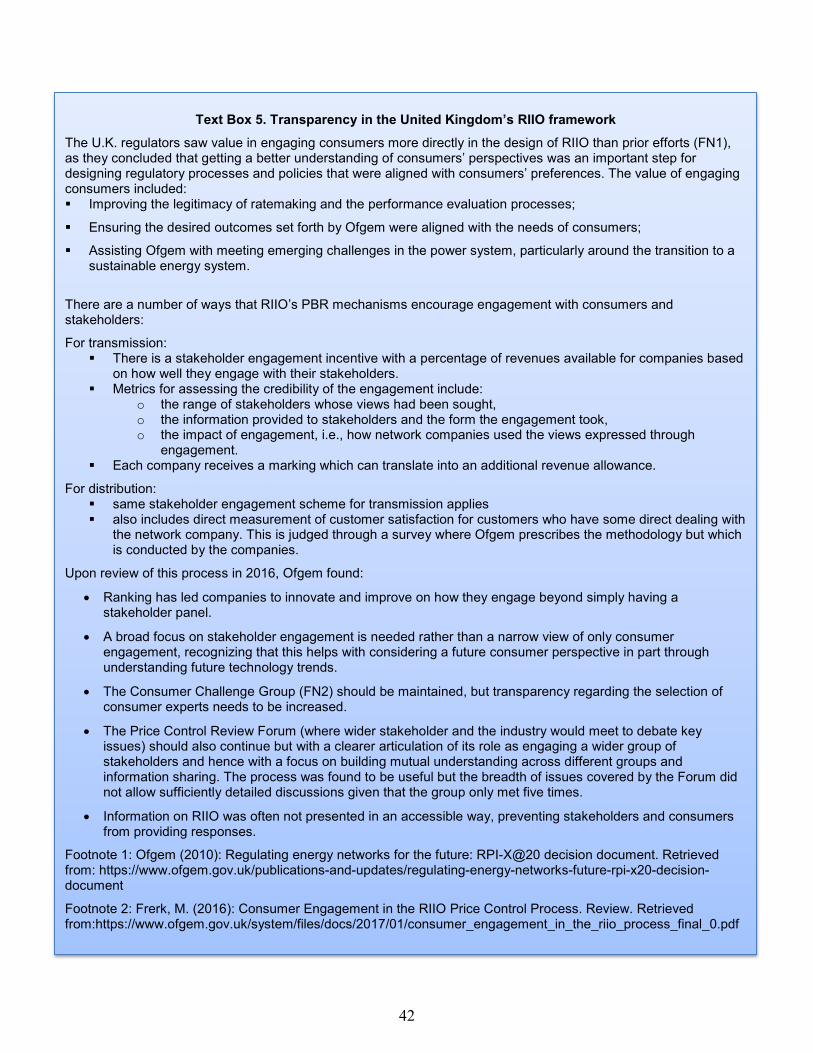
42
Text Box 5. Transparency in the United Kingdom’s RIIO framework The U.K. regulators saw value in engaging consumers more directly in the design of RIIO than prior efforts (FN1), as they concluded that getting a better understanding of consumers’ perspectives was an important step for designing regulatory processes and policies that were aligned with consumers’ preferences. The value of engaging consumers included: Improving the legitimacy of ratemaking and the performance evaluation processes;
Ensuring the desired outcomes set forth by Ofgem were aligned with the needs of consumers;
Assisting Ofgem with meeting emerging challenges in the power system, particularly around the transition to a sustainable energy system.
There are a number of ways that RIIO’s PBR mechanisms encourage engagement with consumers and stakeholders:
For transmission: There is a stakeholder engagement incentive with a percentage of revenues available for companies based
on how well they engage with their stakeholders. Metrics for assessing the credibility of the engagement include:
o the range of stakeholders whose views had been sought, o the information provided to stakeholders and the form the engagement took, o the impact of engagement, i.e., how network companies used the views expressed through
engagement. Each company receives a marking which can translate into an additional revenue allowance.
For distribution: same stakeholder engagement scheme for transmission applies also includes direct measurement of customer satisfaction for customers who have some direct dealing with
the network company. This is judged through a survey where Ofgem prescribes the methodology but which is conducted by the companies.
Upon review of this process in 2016, Ofgem found:
• Ranking has led companies to innovate and improve on how they engage beyond simply having a stakeholder panel.
• A broad focus on stakeholder engagement is needed rather than a narrow view of only consumer engagement, recognizing that this helps with considering a future consumer perspective in part through understanding future technology trends.
• The Consumer Challenge Group (FN2) should be maintained, but transparency regarding the selection of consumer experts needs to be increased.
• The Price Control Review Forum (where wider stakeholder and the industry would meet to debate key issues) should also continue but with a clearer articulation of its role as engaging a wider group of stakeholders and hence with a focus on building mutual understanding across different groups and information sharing. The process was found to be useful but the breadth of issues covered by the Forum did not allow sufficiently detailed discussions given that the group only met five times.
• Information on RIIO was often not presented in an accessible way, preventing stakeholders and consumers from providing responses.
Footnote 1: Ofgem (2010): Regulating energy networks for the future: RPI-X@20 decision document. Retrieved from: https://www.ofgem.gov.uk/publications-and-updates/regulating-energy-networks-future-rpi-x20-decision-document
Footnote 2: Frerk, M. (2016): Consumer Engagement in the RIIO Price Control Process. Review. Retrieved from:https://www.ofgem.gov.uk/system/files/docs/2017/01/consumer_engagement_in_the_riio_process_final_0.pdf
43
It is also important to note that transparency looks different in different contexts. The New York Clean Energy Advisory Council is developing the energy efficiency earnings adjustment mechanism (EE EAM’s) in a collaborative stakeholder process on a utility-specific basis to allow both utility-specific and broader public stakeholders to participate. This is focused utility-specific transparency. Under China’s new T&D pricing reform, the Chinese National Development and Reform Commission (NDRC) asked local governments to seek opinions from stakeholders and shares information with the central government and the public. This is seeking input from local officials in a context of perhaps less direct customer engagement. Both forms of outreach can produce positive stakeholder engagement with stakeholder reflecting the context of each jurisdiction. Consumer satisfaction can also be enhanced via measures intended to communicate directly with utility customers. Under RIIO, customer satisfaction has increased significantly, which seems to be a result of the published rankings as explored in Text Box 5.
5.4 Make Value to the Public Clear The public values understanding what utility services they are paying for. A guiding goal with directional and operational incentives and performance criteria is a transparent commitment from the utility to its customers and the public with an opportunity for reward. PBR can offer a clear “value for money” transaction to the utility, customers and the public. Value comes from exceptional or beyond compliance utility performance, creating tangible value for specific customers or the public. A clear set of goals, performance criteria and metrics that the public and stakeholders can understand the benefit for them. This can be useful in a transition to a new regulatory model based on performance rather than rates.
It is also important that the value to the public be assessed appropriately to ensure clear value. Many regulators now design and implement more objective and verifiable customer satisfaction surveys. Regulators in Massachusetts, for example, found that surveys with very specific questions and yes/no answers allow for more objective measures of customer satisfaction. This is significant because poor performance on customer satisfaction can lead to substantial penalties.67
5.5 Align Benefits and Rewards Aligning customer receipt of benefits through timely payment of rewards and incentives (or imposition of penalties, if negative impacts occur) is advisable to the extent practical and feasible. When rewards and penalties are applied closely in time with utility performance, the relationship of incentive to performance is easier to assess. A close linkage can reduce the probability that regulators over- or under-reward utilities for performance in the eyes of customers. For instance, if consumers have a season of poor service quality, application of reduced utility revenue or penalties is more easily understood and assessed by customers, the public and the utility itself if done close to that season and with direct reference to seasonal service quality.
67 M. Lowry, T. Woolf, L. Schwartz. (2016). Performance-Based Regulation in a High Distributed Energy Resources Future. Lawrence Berkeley National Lab, Rept. No. 3. Retrieved from: https://emp.lbl.gov/publications/performance-based-regulation-high, p. 30.
44
5.6 Learn from Experience Learning from experience and modifying PBRs to address operational observations is a good management practice. The NY-PSC observed in eliminating the penalty provisions of its energy efficiency incentives that the penalties resulted in an increased utility aversion to risk and created an adversarial dynamic between the Commission and the utility. The NY-PSC also observed a drain on staff and utility resources to address these issues that would have been better spent in administering the efficiency program.68
Because some outcomes are driven by influences partially outside of utility control, utilities may be reluctant to accept a pure outcome target or metric. One method to address this is to consider a rolling multi-year average rather than a pure annual target or annual metric. Over time the range of utility performance becomes evident as well as trends in a rolling average. As an example, the UK regulator Ofgem, under the RIIO framework, has implemented a rolling average target for reliability purposes. Specifically, an unplanned outage target is set based on either the minimum of a utility’s 2014/15 outage target or utility’s own four year moving average.69 This is an example of an approach that regulators might employ to implement targets or metrics where utility performance may be subject to appreciable uncertainty.
5.7 Compared to What? It is also helpful in setting PBRs to apply the “compared-to-what” test. PBR discussions can get mired in efforts to reach the perfect set of incentives (in a very imperfect world). It is easy to focus on areas that are not especially important and lose recognition of how a proposal compares to the existing utility system.70 This question is helpful in program design and examination of program improvements. It is a simple question that looks for improvement in regulatory mechanisms along a continuous improvement pathway.
5.8 Simple Designs are Good To minimize the risk of gaming, the best bulwark is to design a clear and well-defined metric. If the metric, as well as the corresponding data required to evaluate it, are difficult to measure, manipulation can be more difficult to detect. This is especially the case if data are collected and analyzed by the utility, because it is potentially expensive or difficult to conduct regulatory or third-party verification of the data accuracy and analysis. Data collection and analysis that is difficult to audit or review should be avoided. Further, third-party experts can be used to collect, analyze and verify data where practical.
68 Whited, M., Woolf, T., and Napoleon, A. (2015). Utility Performance Mechanisms: A Handbook for Regulators. Synapse Energy Economics. Retrieved from: http://www.synapse-energy.com/sites/default/files/Utility%20Performance%20Incentive%20Mechanisms%2014-098_0.pdf, p. 55. 69 Ofgem (2012). Quality of Service Presentaiton. Reliability and Safety Working Group. Retrieved from: https://www.ofgem.gov.uk/sites/default/files/docs/2012/07/rswg_17_may_slides_qos_0.pdf 70 Regulatory Assistance Project. (2000). Performance-Based Regulation for Distribution Utilities. Montpelier, VT: The Regulatory Assistance Project. Retreived from: http://www.raponline.org/wp-content/uploads/2016/05/rap-performancebasedregulationfordistributionutilities-2000-12.pdf, p. 4.
45
So while simple incentive designs are good and clarity for the public is important, that does not mean designing proper goals, incentives, performance criteria and metrics is simple. Indeed, having smart and well-financed regulatory staff is critical for sophisticated PBR design and implementation. The best PBR designs are simple and clear but require substantial expertise, effort, and regulatory competence to achieve and implement successfully.
5.9 Evaluation and Verification Evaluation and verification of the outputs is an essential element of a successful PBR program and is addressed further in Section 6.1.2.
46
6 Steps and Options for Establishing and Implementing Successful PBRs
6.1 Design Elements to Consider in Establishing and Implementing Successful PBRs
Each PBR construct will be unique, as it should be crafted to reflect the specific policy goals of the jurisdiction in which it is implemented. As a result there is no “generic” PBR construct that can be implemented from a “cookbook” of successful PBR programs. However, there are some general design considerations for specific PBR elements if the element is necessary in a specific PBR. To reiterate, not all of the following elements will be in each PBR construct, but if they are considered, consider the following:
6.1.1 How performance levels are set The methods for determining and evaluating reasonable expected utility performance levels vary on a scale that one might call the “public’s ability to understand what they are paying for”. Value should be demonstrable to the public. The public aspect of ensuring ratepayers and stakeholder understand the value of utility performance to the goals set is critical.
From the regulators point of view, getting the foundation of PBR set properly is critical. PBR schemes do not start from scratch – they are tied to a foundation. Incentives and penalties are set on top of a baseline. To get the baseline level right regulators may need to model out and set prices for utilities functioning properly under a cost of service rate structure. PBR does not avoid the need to properly set base rates and can add to the regulatory burden. First regulators must create a baseline, which may be cost of service regulation, then design the incentives around the baseline.
A utility’s performance baseline can be determined from historic data, provided that data was and is collected and maintained. A second method is to use peer utility performance data to determine either a baseline or a performance target. To identify a relevant group of peer utilities, a process known in the regulatory world as “indexing,” statistical and econometric methods are
Chapter 6 provides design options for establishing and implementing successful PBRs. It is intended to provide decision makers with specific design elements within the PBR mechanism.
• Key Point #1: There is no “cookbook” for PBR approaches that can be taken off of a shelf and implemented.
• Key Point #2: While numerous successful PBRs exist to learn from, PBR approaches are continually evolving, and adapting a portfolio of PBRs (and PIMs) is necessarily specific to the context and goals in the jurisdiction.
47
often used. Both methods rely on objective data sets (where available) and methods that are easy for the public to grasp.71
Some methods to establish performance baselines and targets are less easy to grasp in both concept and application, because they rely on statistical and engineering methods.72 A third method is a form of Data Envelopment Analysis (DEA) called frontier analysis. Frontier analysis measures the efficiency of a sample of utilities, in terms of their inputs and outputs in order to identify the most efficient utility operations. There is substantial complexity in the statistical methods to exclude factors outside the utilities’ control, as well as lack of internal validation, misspecification and statistical “goodness-of-fit”, all of which contribute to making this method more difficult for the average customer and even sophisticated customers to follow. The difficulty presented by methods like DEA, and other sophisticated but complex models, is that discussion over the model inputs, method, computations and model results can distract regulators, stakeholders and the utility from a focus on achieving desired utility outputs and outcomes desired by ratepayers and stakeholders. Nonetheless despite these concerns, DEA analysis has been used in Austria, Australia, Germany, the Netherlands and Norway to benchmark and determine retail tariff levels and utility revenue requirements.73
A fourth method is to use utility-specific studies which rely on economic and engineering methods to set baselines or targets. Production cost simulations can model efficient power system dispatch. These models can be used to derive benchmarks for utility performance. California did just this to set generation dispatch performance incentives in the 1990s.74 These latter two methods (DEA and production cost simulation) suffer from a lack of understandability for all but the most sophisticated utility and statistical experts. Moreover, the last two methods, DEA analysis and utility-specific studies, require detailed and sophisticated analysis that can lead to manipulation of a model or analysis to achieve tilted results, with little means available to compare those results unless historic data or peer benchmarking is used as well.
6.1.2 Evaluation, Measurement & Verification Evaluation and verification of the outputs achieved is essential to ensure ratepayers and the public are receiving the value anticipated in a PBR reward scheme. That said, evaluation of compliance and verification of benefits is a topic onto itself, and is outside the scope of this report. It is easier when metrics are clear and data is available and independently verifiable.
71 Whited, M., Woolf, T., and Napoleon, A. (2015). Utility Performance Mechanisms: A Handbook for Regulators. Synapse Energy Economics. Retrieved from: http://www.synapse-energy.com/sites/default/files/Utility%20Performance%20Incentive%20Mechanisms%2014-098_0.pdf, p. 36-37. 72 Statistical methods commonly are used for cost benchmarking for unit costs or productivity indexes and for econometric methods in rate designs. They are less commonly used to derive performance targets beyond traditional industry performance benchmarking. These two methods are state of the art methods for PBR target setting. 73 Whited, M., Woolf, T., and Napoleon, A. (2015). Utility Performance Mechanisms: A Handbook for Regulators. Synapse Energy Economics. Retrieved from: http://www.synapse-energy.com/sites/default/files/Utility%20Performance%20Incentive%20Mechanisms%2014-098_0.pdf, p. 37. 74 Whited, M., Woolf, T., and Napoleon, A. (2015). Utility Performance Mechanisms: A Handbook for Regulators. Synapse Energy Economics. Retrieved from: http://www.synapse-energy.com/sites/default/files/Utility%20Performance%20Incentive%20Mechanisms%2014-098_0.pdf, p. 37 and fn. 17.
48
Beyond these general considerations with establishing a proper baseline and EM&V plan up front, there are specific PBR design considerations.
6.2 Specific design options Depending on the objective and needs of each jurisdiction, there are a variety of PBR and PIM design options. This section focuses on PBR mechanisms that are “tried and true” and which have a track record. Here are ten design options:
1. No Explicit Incentive; 2. Shared Net Benefits; 3. Program Cost Adders and Target Bonuses; 4. Base Return on Equity (ROE) + Performance Incentive Payments to Reach Maximum
ROE Cap; 5. Bonus ROE for Capital; 6. Base Incentives on kWh Targets; 7. Peak Reduction Targets; 8. Penetration Measures for DERs (including electrical vehicles); 9. Evaluation and Verification; 10. Every Employee with a PBR Goal, Target and Metric.
These design options are discussed in more detail below.
6.2.1 No Explicit Incentive “No Explicit Incentive” represents a default scenario. However, it does not mean that the current system in place does not incentivize specific utility behavior. As mentioned earlier, all regulation is incentive regulation, and regulated entities will respond to the inherent incentives that are built into traditional regulation. A desire for no incentives is a position often held by consumer advocates and industrial groups who want the absolute minimal rates, minimal ratepayer risk, and who philosophically believe that it is the utility’s obligation to operate its business as efficiently as possible without any additional remunerations from ratepayers.
There is a variant of no explicit incentives: jurisdictions that rely only on penalty authority. This might extend to regulators who believe than any desired utility output or behavior can be ordered by the regulatory authority. The implicit incentive in a “penalty-only” jurisdiction is to avoid actions which would run afoul of the regulator’s view of utility behaviors, outputs or outcomes worthy of a penalty, which include a serious reliability failure or simply not following regulator orders. Assessing what incentives exist, even in jurisdictions with no explicit incentive structure is important.
49
6.2.2 Shared Net Benefits Under shared net benefit incentives, the utility would share along with ratepayers in the benefits associated with, and identified from, the metric achieved. This can mean sharing in financial benefits between the utility and ratepayers. In the context of EE programs, a “shared savings” approach is often employed in the U.S. to recognize and share the EE savings between ratepayers and the utility.
A shared net benefits approach needs to be carefully thought out and implemented to clearly identify the shared benefits, ensure the utility appropriately controls costs, and that the mechanism can’t be gamed. Implementation of shared savings schemes can be difficult because the focus on evaluation, measurement and verification (EM&V), the concept of shared net-benefit’s inherent imprecision, and translation to dollars can negatively impact a utility-regulatory relationship. This approach relies upon accurate benefit calculations through evaluation and measurement, and a clear EM&V plan based on objective metrics is the best remedy to this issue.
Shared net benefit mechanisms can blunt the incentive for utilities to control costs, which is otherwise a prime motivation for implementing PBR constructs. To ensure that cost control incentives are maintained in a PBR scheme with a shared net benefit construct, the mechanism can be designed to apply only to benefits outside a band where earnings are not affected. A deadband approach adopts a range around a performance level that results in no modification or incentive until the range is exceeded.75
Shared net benefit regimes also need to be carefully designed to avoid the possibility of gaming. For example, in the context of a shared savings mechanism for cost of natural gas, a large U.S. utility was ordered to refund $72 million to ratepayers when it manipulated its gas storage to release gas it had purchased previously at a lower cost. In this case, the gas in storage had a year-vintage, so the utility chose to release gas from very-low priced year to artificially produce a “cost savings” under a shared savings PBR.76 In this case, the ability of the utility to control purchase and sale times with no relevant performance guideline left the system open to manipulation.
75 For example, no sharing of savings from EE may be appropriate within a band of, for example, EE savings of zero to 0.02, which are expected to be produced through market forces such as enhanced appliance efficiency standards. So designed, a sharing mechanism with with a “deadband” operates as a reward for only exemplary performance for marked increases (or decreases) in performance. For more information on shared net benefit mechanisms and deadbands, see Regulatory Assistance Project. (2000). Performance-Based Regulation for Distribution Utilities. Montpelier, VT: The Regulatory Assistance Project. Retreived from: http://www.raponline.org/wp-content/uploads/2016/05/rap-performancebasedregulationfordistributionutilities-2000-12.pdf, p. 4. 76 Whited, M., Woolf, T., and Napoleon, A. (2015). Utility Performance Mechanisms: A Handbook for Regulators. Synapse Energy Economics. Retrieved from: http://www.synapse-energy.com/sites/default/files/Utility%20Performance%20Incentive%20Mechanisms%2014-098_0.pdf, p. 94.
50
6.2.3 Program Costs Adders and Target Bonuses Program cost adders provide a payment to the utility for costs of a particular program. Target bonuses provide a payment for hitting a specified performance metric. Program cost adders and target bonuses can be used when a program has a direct utility cost. The program cost adder can be a simple percentage paid to the utility based on program cost. This type of program cost bonus is often a share of a specific program and administrative costs are tied to achieving a target or goal. Importantly, it is tied to expenditures and not savings. For this reason, there may not been disincentive for the utility to control program costs.
Target bonuses are, simply put, a one-time financial incentive for achieving a specific performance criteria or metric. This approach has been criticized for being discontinuous (meaning that minus one unit of performance gets nothing, the next unit hits the bonus jackpot). Where regulators want to drive a quantum leap in performance, and where more than that specific amount is not useful, then this bonus approach is simple and works.
6.2.4 Base Return on Equity + Performance Incentive Payments to Reach Maximum ROE Cap
Under a base return on equity (ROE) PBR, the utility earns a base ROE, and then that return increases (or goes down) based on a performance incentive structure that rewards (or penalizes) performance with modifications to the ROE. The utility can increase its return on equity through performance incentive adders up to a maximum PBR payment or set of payments. And poor performance can decrease the ROE potentially as well. The regulator assigns a value range for a series of metrics, for which the utility would receive a return if it satisfies the metrics assigned. The incentives can also scale higher or lower if certain values are achieved with the specified range. The adder value may vary from metric to metric based on the value assigned by the regulator. A more complex option is to provide a range that provides a level of incentives for satisfying the target and a higher incentive for exceeding it. In establishing this type of PBR mechanism, a regulator may examine the following:
• At what level should the base return on equity be set in the event the utility meets none of the targets? Should this amount be its approved ROE from its last rate case or some amount lower or higher?
• What level of maximum allowable ROE incentivizes good behavior without causing the utility to over-earn at the expense of ratepayers?
• What metrics should be subject to an incentive adder?
• For the metrics chosen, what value range should be assigned to each?
• How much reward should be given for each metric so that the sum-total of all the metrics equals the maximum cap with the base return on equity?
For example, the NY-PSC in the REV process has allocated 100 basis points of return broadly across all earnings adjustment mechanisms. Each utility then has earnings adjustment mechanisms set in the context of a rate case where those points will be allocated among those mechanisms.
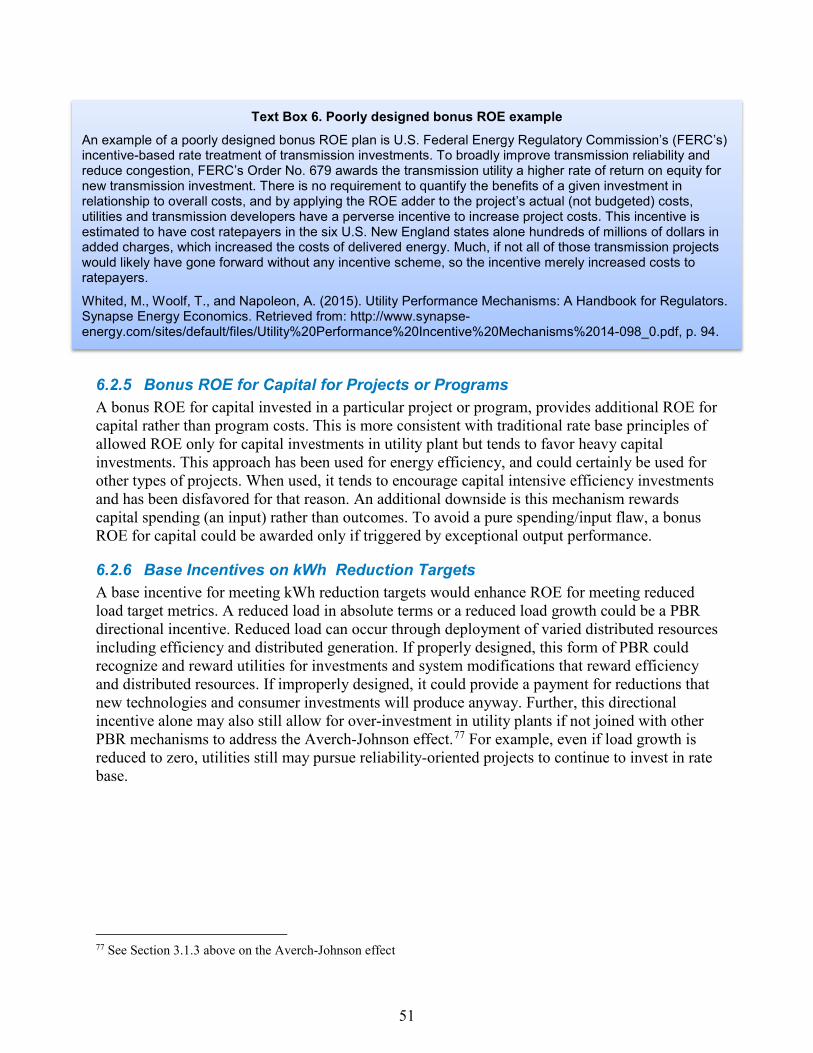
51
6.2.5 Bonus ROE for Capital for Projects or Programs A bonus ROE for capital invested in a particular project or program, provides additional ROE for capital rather than program costs. This is more consistent with traditional rate base principles of allowed ROE only for capital investments in utility plant but tends to favor heavy capital investments. This approach has been used for energy efficiency, and could certainly be used for other types of projects. When used, it tends to encourage capital intensive efficiency investments and has been disfavored for that reason. An additional downside is this mechanism rewards capital spending (an input) rather than outcomes. To avoid a pure spending/input flaw, a bonus ROE for capital could be awarded only if triggered by exceptional output performance.
6.2.6 Base Incentives on kWh Reduction Targets A base incentive for meeting kWh reduction targets would enhance ROE for meeting reduced load target metrics. A reduced load in absolute terms or a reduced load growth could be a PBR directional incentive. Reduced load can occur through deployment of varied distributed resources including efficiency and distributed generation. If properly designed, this form of PBR could recognize and reward utilities for investments and system modifications that reward efficiency and distributed resources. If improperly designed, it could provide a payment for reductions that new technologies and consumer investments will produce anyway. Further, this directional incentive alone may also still allow for over-investment in utility plants if not joined with other PBR mechanisms to address the Averch-Johnson effect.77 For example, even if load growth is reduced to zero, utilities still may pursue reliability-oriented projects to continue to invest in rate base.
77 See Section 3.1.3 above on the Averch-Johnson effect
Text Box 6. Poorly designed bonus ROE example An example of a poorly designed bonus ROE plan is U.S. Federal Energy Regulatory Commission’s (FERC’s) incentive-based rate treatment of transmission investments. To broadly improve transmission reliability and reduce congestion, FERC’s Order No. 679 awards the transmission utility a higher rate of return on equity for new transmission investment. There is no requirement to quantify the benefits of a given investment in relationship to overall costs, and by applying the ROE adder to the project’s actual (not budgeted) costs, utilities and transmission developers have a perverse incentive to increase project costs. This incentive is estimated to have cost ratepayers in the six U.S. New England states alone hundreds of millions of dollars in added charges, which increased the costs of delivered energy. Much, if not all of those transmission projects would likely have gone forward without any incentive scheme, so the incentive merely increased costs to ratepayers.
Whited, M., Woolf, T., and Napoleon, A. (2015). Utility Performance Mechanisms: A Handbook for Regulators. Synapse Energy Economics. Retrieved from: http://www.synapse-energy.com/sites/default/files/Utility%20Performance%20Incentive%20Mechanisms%2014-098_0.pdf, p. 94.
52
6.2.7 Peak Reduction Targets On a system where growth in peak demand is driving generation, transmission or distribution investments, there are potentially system-wide savings available from efforts to reduce system peaks. This can be true on a system-wide basis, and also may be true for individual grid zones or even distribution circuits. Where investments that reduce peak demand can defer or avoid altogether the need for new and more expensive investments, overall system costs can be reduced. PBR mechanisms can be designed to incentivize utilities to pursue these types of cost saving investments.
NY’s Brooklyn-Queens Demand-Management Project is an example of a PBR arrangement that reduces system peak. This project was implemented by Consolidated Edison (Con Edison) with encouragement and ultimately approval of the Commission to avoid the need for an expensive new substation and other load related items totaling over $1 billion, for a less expensive set of DER solutions and a smaller set of traditional grid upgrades.78 Con Edison was allowed a regulated rate of return on its DER investments and an additional 100 basis points based on specific objectives being met. The guiding goals were to achieve “DER animation” and “lower costs to customers” with the 100 basis point incentive tied to specific metrics: 45 basis points tied to achieving performance of 41 MW or more of alternative measures; 25 basis points tied to performance in increasing diversity of DER in the market place (more contracts with a greater number of small DER providers); and 30 basis points tied to the utility’s ability to assemble a portfolio of solutions that achieves a lower $/MW value than the traditional investment solution. For this last metric, such $/MW value was based on the present value of the lifecycle benefits and costs of the portfolio and the traditional investment. For example, if the portfolio includes measures that result in reduced energy usage, or increased renewable energy generation, those benefits can be included in the lifecycle analysis, thereby reducing the resulting $/MW metric.79 In this way, the Commission and Con Edison utilized an complex PBR construction using both ROE on DER investments and additional basis points to achieve 41-MW or more of peak load reduction to avoid a more expensive set of traditional grid investments.
The U.S. States of Arizona and California80 are considering a different version of a peak reduction strategy to encourage development of clean resources through a “clean peak demand standard” implemented through a Renewable Portfolio Standard mechanism.81 This proposal would both increase the renewable energy (renewable portfolio) requirement and then add a requirement that new resources be available to meet the net system peak. The net system peak is
78 See Section 5.1.2. 79 NY PSC (2014, December 12). Order Establishing Brooklyn/Queens Demand Management Program. Case 14-E-0302, pp. 21-22 80 California Assembly. Bill 1405. 2017-2018 Regular Session. An act to amend Sections 454.52 and 9621 of the Public Utilities Code, relating to electricity. Retrieved from: http://leginfo.legislature.ca.gov/faces/billTextClient.xhtml?bill_id=201720180AB1405; and California Senate. Bill 388. 2017-2018 Regular Session. An act to amend Sections 454.52 and 9621 of the Public Utilities Code, relating to electricity. Retrieved from: http://leginfo.legislature.ca.gov/faces/billTextClient.xhtml?bill_id=201720180SB338 81 Trabish, H. (2016, December 9). Arizona Proposal Seeks to Mandate Renewable Generation During Peak Demand Hours. Utility Dive. Retrieved from: http://www.utilitydive.com/news/updated-arizona-proposal-seeks-to-mandate-renewable-generation-during-peak/432031/
53
the time when electricity demand, less wind and solar generation, is highest and it is increasingly moving later in the day when the sun sets due to increased solar generation on the system.82
6.2.8 Every Employee with a PBR Goal, Target and Metric? Historically, PBR mechanisms have traditionally acted on the utility, and not on individuals at a utility. However, PBR can be applied to individuals as well, as examples from China illustrate. The concept is that every utility employee will have at least one metric in the PBR system that applies to their work, and which can be used to evaluate eligibility for performance-based compensation. Achievement of goals and metrics can raise the visibility of program managers and units within a utility. Enhanced visibility of relevant business units for each goal within the utility can create positive incentives with respect to performance in accordance with the goals and targets. This suggestion is in some regards hardly startling, as many utilities use incentive bonuses for managers and sometimes for employees too, including stock options and stock price options. If utility performance influences the stock price, executives or employees benefit and often help meet those performance goals.
For state-owned utilities, these enterprise-wide incentives are typically in the form of employee reviews and promotion opportunities, including opportunities at other state-owned enterprises. Applying PBR on the individual level is being pursued in China. The Chinese grid company evaluation criteria were modified in 2016 when the SASAC (State-owned Assets Supervision and Administration Commission of the State Council) decided to include “social benefit” criteria in the evaluations of SOE grid-companies. These will reflect activities that “serve social objectives” or are “essential to national security and economic operation”. Although details have yet to be decided, these criteria may include outcomes such as improvements to reliability in underserved and rural areas, “green technology development,” and support for philanthropic efforts.
How this 2016 change will affect grid company behavior is yet to be fully evaluated. China’s grid utility revenues were traditionally derived from the difference between administratively set – and rarely revised -- retail and wholesale prices. Transmission and Distribution reform is currently evaluating Chinese grid company revenue.83 Therefore, it is reasonable to say that the overall set of incentives faced by grid company executives is undergoing a significant shift.
82 L. Huber (2016, December 1) Evolving the RPS: A Clean Peak Standard for a Smarter Renewable Future. Strategen Consulting: Berkley, CA. Retrieved from: https://static1.squarespace.com/static/571a88e12fe1312111f1f6e6/t/58405ac4d2b85768c5e47686/1480612551649/Evolving+the+RPS+Whitepaper.pdf 83 China’s power sector reform effort, launched in March 2015 with the issuance of “Document #9”, includes a new approach to gridco regulation called “transmission and distribution (T&D) pricing reform” that, in principle, is similar to revenue regulation. Under the new approach, grid company revenue will be subject to revenue regulation, based on the basic concept that allowed revenue equals “approved costs” plus reasonable return on asset base. The revenue of the grid companies will be approved for three-year periods. All three SOE grid companies in China (State Grid, Southern Grid, and Inner Mongolia Power Company) are to be covered. Chinese officials framed this approach to gridco regulation in an effort to shift away from the status quo with limited regulatory access to gridco financial information and a lack a transparent cost review and price-setting. There is public discussion by Chinese authorities of increased transparency, improved government oversight, and reduced costs.
54
That said, unintended consequences can result from a PBR system on individuals, and can create perverse incentives. For example, when the California Public Utilities Commission (CPUC) required reporting of employee injury data for the purpose of rewarding workplace safety, it found that supervisors encouraged non-reporting, self-treatment, or treatment by personal physicians and other measures in order to avoid the creation of internal utility reports of injuries. Further, the reporting of injury data by group and incentives provided on a group basis within the utility led to employee desires to see their group or unit safety rankings maintained, and thus created a disincentive to report injuries.84 This PBR system intended focus on worker safety improvements was found instead to produce an employee incentive to avoid reporting and a management incentive to falsify data reporting. The lesson from this experience is that careful consideration of internal data management and reporting within the utility may be necessary, particularly when there is a reward and penalty aspect of an incentive that affects individual and group employee compensation. The nature of the safety incentives and group-based incentives in some units created an unintended effect that compromised the purpose of the performance goal itself.85
84 Whited, M., Woolf, T., and Napoleon, A. (2015). Utility Performance Mechanisms: A Handbook for Regulators. Synapse Energy Economics. Retrieved from: http://www.synapse-energy.com/sites/default/files/Utility%20Performance%20Incentive%20Mechanisms%2014-098_0.pdf, p. 31, 63-69. 85Another booby trap is that a focus toward a particular metric may take utility employee attention away from other tasks that do not have a reward or any reported metric, and instead focus their time on tasks that do influence achievement of performance targets, such as the customer experience or societal benefit. Regulators can address this with a broader array of metrics that are reported without reward (a scorecard) such that all utility performance is subject to public disclosure and a likely future correction.
55
7 Innovative Performance-based Regulation Approaches
As illustrated in the sections above, performance-based regulation has evolved greatly since it’s inception over two decades ago. PBR is now being used in a variety of jurisdictions worldwide in innovative and wide-ranging ways. A selection of innovative PBRs and PIMs is examined below by topic area. Unlike the PBR’s listed previously, not all of the mechanisms below have been implemented, nor do they have a lengthy history of implementation. These mechanisms are examples of innovative ways in which PBR is being applied. It is anticipated that like the predecessors examined in previous pages, that experience with the mechanisms listed below will yield further lessons in the future on best practices. This is not an exhaustive list, but should provide an overview and inspiration for the different ways PBR is or could be applied to different aspects of electric utility regulation. Section 7.1 lists areas that could utilize PBR, but which have not yet been proposed. Section 7.2 lists innovative applications of PBR and PIMs.
7.1 Areas ripe for PBR 7.1.1 Incentives for Water Savings There have been significant regulatory responses to water shortages in various jurisdictions. Until very recently, California has been faced with a multi-year drought but its concern with reducing water usage by power plants is long-standing based on desires to reduce ocean and coastal ecosystem impacts. As a result, the state adopted the mandatory retirement of once-through cooling facilities for all its generating plants and required dry cooling on some of its natural gas power generators. Nevada requires dry cooling on all new generation but this is enforced at the water permitting level. None of these requirements is set up as a PBR mechanism but rather as traditional regulatory requirements which is surprising given the power sector’s significant use of cooling water.
To date, a PBR scheme to provide an incentive to conserve or avoid water usage has not been adopted. A PBR for water savings from a baseline year for cooling water usage can be easily envisioned based perhaps on overall water withdrawals, or simply consumptive uses accounting for evaporation, aquatic life impacts from withdrawals and thermal impacts on receiving water bodies. A second approach could apply a benchmark for water consumed (on a consumptive standard) per MWh of electricity generated or purchased, and be applied at the utility level or at
This chapter offers innovative approaches to reach public policy goals. It is intended to provide decision makers with ideas, some of which are in existence, some of which are theoretical, on how to reach specific public policy goals with a PBR mechanism.
• Key Point #1: PBR is an extremely flexible regulatory tool that allows regulators, utilities and stakeholders to pursue desired goals, outputs and outcomes for electric utility performance
• Key Point #2: PBR can pursue goals across an immense spectrum of utility performance to provide appropriate incentives for utilities to change their performance in specified areas of interest or concern for regulators, policy-makers and utility stakeholders.
• Key Point #2
56
the distribution utility level in restructured markets. Performance below the baseline or benchmark could be rewarded, and performance above those levels could be penalized. PBR constructs focused on water savings, while not common in the electricity sector, have been used in the water utility sector to encourage water conservation in areas with water shortages. Southern Nevada Water Authority, for example, has very aggressive pricing and lawn removal programs.
7.1.2 Greenhouse Gas Emissions Performance Greenhouse gas emissions reduction is an area ripe for PBR. The guiding goals, directional incentives, performance criteria, and metrics are readily able to be calculated and tracked. A well designed PBR scheme could allow utilities to select the most cost-effective means of achieving GHG reductions and reward utilities for doing so. In fact, an emissions standard has been put forward as a regulatory standard for states to consider during the Clean Power Plan discussions in the United States. This concept is transferable to a PBR.
At least one jurisdiction has adopted a metric for greenhouse gas emissions reductions in a settlement reached in Illinois in 2013 around cost-justification for advanced metering infrastructure (AMI). This Illinois settlement by parties interested in justifying the cost of AMI requires a performance metric to be developed by the utility Commonwealth Edison to track reductions in greenhouse gas emissions (as measured through load shifting, system peak reductions and reduced meter-reading truck rolls attributable to smart meters and associated time-of-use rate modifications).86 This Illinois settlement also includes metrics to calculate power plant marginal emission changes and changes in generator dispatch due to load shifting of smart meter customers compared to non-AMI customers on an hourly level. Other metrics are to be developed for GHGs to track plant closures that may occur from reductions in system peak, and reductions in fuel consumption from reduced meter reading vehicle rolls broken down by specific operating centers.87 Reporting and development of these metrics may provide sufficient regulator and utility experience, which can then be refined and then used to build goals with incentives and performance criteria in the future. Indeed, developing experience with accurate performance criteria that can be used to set goals and to measure those accurately is one of the prerequisites to successful PBR.
7.1.3 Locational metrics for reliability or High-Cost areas DER deployment For telecommunications systems, locational reliability is often measured by circuit. This is not done for electrical service but could easily be implemented with the advent of smart grid monitoring technologies. Circuit reliability, certain customer service measures (such as circuit specific SAIDI or SAIFI) or power quality could be measured with devices installed at substations, feeders and customer meters. Initially circuits could be selected with a history of service issues, or where high levels of DER penetration are changing circuit characteristics.
86 Whited, M., Woolf, T., and Napoleon, A. (2015). Utility Performance Mechanisms: A Handbook for Regulators. Synapse Energy Economics. Retrieved from: http://www.synapse-energy.com/sites/default/files/Utility%20Performance%20Incentive%20Mechanisms%2014-098_0.pdf, p. 84. 87 Whited, M., Woolf, T., and Napoleon, A. (2015). Utility Performance Mechanisms: A Handbook for Regulators. Synapse Energy Economics. Retrieved from: http://www.synapse-energy.com/sites/default/files/Utility%20Performance%20Incentive%20Mechanisms%2014-098_0.pdf, p. 86.
57
By concentrating DERs in a high-cost utility area (i.e., an area where short-term marginal costs of system improvements are high, and DER investments may help to defer or avoid grid upgrades). Infrastructure and operation cost savings can offset utility revenue losses and make net savings available for a PBR shared savings to reward utilities for cost reductions and innovation.88 This is perhaps most easily accomplished in vertically integrated utilities where savings from DERs in supply and utility plant accrue to the utility itself but also could be quite valuable to a distribution company.
This model of sharing of location energy data can be structured in a PBR system to designate high-cost utility areas for DER development is high value. The structure of the PBR system would incent the utility to provide customers and third-party developers with data on where DERs are most desirable, i.e. have highest system value. This is what New York did with the Brooklyn-Queens project discussed above, the utility provided incentives such as direct payments to DER providers or customers, direct DER investment by the utility where legally authorized, or facilitated competitive procurements among DER providers, with payments to DER vendors capped at the utility savings, to direct DER development to these high-cost areas.89 The utility was allowed to recover the costs of DER assets acquired by it and also an additional ROE adder if it was successful in acquiring adequate demand-side reductions through its DER acquisition process. While this can be described as a shared savings system (and this program is described above in Section 6.2.7), implementation occurred through an ROE adder and allowed recovery of utility costs for direct utility procurement of DER assets in a particular high-cost area. The measurable performance criteria and metrics were for specific load reductions to be achieved through DER procurements by the utility itself.
Utility savings can be calculated using the short-run marginal cost of distribution and electrical supply. So while NY’s Brooklyn-Queens Project incentive was an ROE adder, this structure resulted in shared savings. The shared savings consisted of ratepayers avoiding additional distribution costs and Con Edison receiving some of these savings in the form of a ROE adder. These total savings can be expressed in short run marginal avoided costs of major substation upgrades. Again in theory, the price of a good or service should be equal to its short-run marginal costs under conditions of competition. The NY Brooklyn-Queens Project demonstrated that a short-run marginal cost of avoided distribution system costs could indeed be the costs of acquiring a suite of DERs. Moreover, in efficient markets, the short-run marginal costs should equal the long-run marginal costs.90 The NY Brooklyn-Queens Project demonstrates that under conditions of low load growth, the marginal costs of additional DER infrastructure may indeed represent the short-run and long-run marginal system costs.
88 Regulatory Assistance Project. (2000). Performance-Based Regulation for Distribution Utilities. Montpelier, VT: The Regulatory Assistance Project. Retreived from: http://www.raponline.org/wp-content/uploads/2016/05/rap-performancebasedregulationfordistributionutilities-2000-12.pdf, p. 40. 89 Regulatory Assistance Project, 2000, p. 41. 90 Regulatory Assistance Project, 2000, p. 41, fn. 16.
58
7.1.4 Incentives for EV rate education and charging station deployment Retail EV rates are being adopted or piloted in some jurisdictions. Because these rates are new and little understood by ratepayers, there is a need for better marketing of the availability and design of such rates to various customer classes when they are implemented. This is an area of potential for PBR application, yet the design of an effective PBR system around EVs presents design dilemmas that jurisdictions grapple with: should the focus on educating consumers be about home charging rates or focus on building out public EV charging infrastructure and perhaps include attention to consumer protection for public charging sales? The public charging infrastructure is quite expensive and if allowed in rate base, utilities probably have adequate incentive to build that infrastructure. Rather, the utilization of high-cost charging infrastructure may become the primary concern but the use of charging stations is generally beyond both utility and regulator control. The number of EVs in use may influence use of charging stations, but that is certainly beyond utility and regulator control. For these reasons, focusing on education around home charging rates is riper for utility education and consumer interface. Indeed, modest utility support for home charging infrastructure could increase consumer adoption and load-growth of clean energy.
The multi-year rate plan, an early form of PBR, may provide an approach to incentivize utilities to market new EV rates to customers. Utilities under a multi-year rate plan may be able to retain or share in revenue growth from revenue of EV-based rates between rate cases. Multi-year rate plans would provide an incentive for utilities to market attractive EV rates to ratepayers for home EV charging because utilities would enjoy increased revenue. In this manner, growing consumer usage through home EV charging is entirely consistent with the multi-year rate case model developed in the U.S. In states with multi-year rate plans and where utilities have marketing flexibility, the multi-year rate plan approach has potential to become a powerful driver of EV charging usage and interest among utility customers.
For jurisdictions that have utilities preparing infrastructure for EV charging stations, the utilities work could be considered for PBR in the context of the jurisdiction’s guiding goal. If the guiding goal is to prepare infrastructure for charging station completion, then a measurable performance criteria might be utility make-ready work performed for EV charging station completion. National Grid has proposed such a performance criteria in Massachusetts which will be considered by the Massachusetts Commission. Under the terms of the proposed National Grid program, EV charging sites would be owned by independent vendors with National Grid providing assistance. The Program would include a performance incentive for Grid, with a maximum award representing 5.5% of the total program budget. The incentive would be awarded for each EV charging site developed and activated. The threshold for receiving the minimum award of $750,000 would be activation of 105 sites, or 75% of the program target. The maximum award of $1.2 million would be earned if 175 sites (125% of the program target) are activated. The petition is currently under consideration.91
91 National Grid. (2017, January 20). Petition of National Grid for Pre-Approval of Electric Vehicle Market Development Program, and of Electric Vehicle Program Provision. Docket 17-13. Retrieved from: http://170.63.40.34/DPU/FileRoomAPI/api/Attachments/Get/?path=17-13%2fInitial_Filing.pdf
59
7.1.5 Compliance with Codes of Conduct in Support of Competition Codes of conduct govern how utilities (and their affiliates) interact with companies that compete with them. Historically monopolies did not have competition. In the 21st century, competitive opportunities can emerge through restructuring of the electric industry92 or through energy services companies93. Even in restructured markets, utilities maintain monopoly positions over certain services and will often have superior economic resources and access to customer and market information and system knowledge that competing companies cannot match. If a utility can use its economic and information advantages, there is the risk it can drive out competitors and operate as a deregulated monopoly, exercising market power. While the rules to prevent anti-competitive behavior can be detailed and in certain respect quite distinct among jurisdictions, there are basic principles that govern the establishment of rules:
1. Discrimination in providing access to essential services should be prohibited. 2. There should be no sharing of competitive information among companies affiliated with
the utility. 3. Cross-subsidization by the utility to benefit a competitive enterprise, such as an affiliate,
should be prohibited and carefully monitored.94
Many U.S. states enacted codes of conduct as part of their restructuring procedures.95 Examples of codes of conduct include the New York Public Service Commission’s Order as part of the Reforming the Energy Vision proceedings,96 PEPCO Holdings,97 and Dominion Resources Inc. as between its affiliates in North Carolina and Virginia.98 Texas also has a comprehensive code of conduct addressing the affiliate relationship.99 All of these codes of conduct are fairly similar in substance and put into practice the three basic principles described above. These concepts can be applied to multiple aspects of a utility business in which a regulated utility or its affiliate
92 Seventeen states and the District of Columbia have adopted electric retail choice. US Energy Information Administration. (2012). Electricity Retail Choice 2010. Retrieved from: http://www.eia.gov/todayinenergy/detail.cfm?id=6250 93 See for example, the NY Reforming the Energy Vision proceedings, NY DPU CASE 14-M-0101, Feb.26,2015, among others; DC PSC, Formal Case No.1130, In the Matter of the Investigation into Modernizing the Energy Delivery System for Increased Sustainability; California PUC, Distribution Resource Plan, http://www.cpuc.ca.gov/PUC/energy/drp/ 94 See Migden-Ostrander, J. (2015, November). Power Sector Reform: Codes of Conduct for the Future. Electricity Journal, 28(6), p.4. Retrieved from: https://www.researchgate.net/publication/285216738_Power_Sector_Reform_Codes_of_Conduct_for_the_Future 95An example of a code of conduct filed in Ohio by the Customer Coalition for Choice in Electricity (1999, October 13). In the Matter of the Promulgation of Rules for Electric Transition Plans and of a Consumer Education Plan Pursuant to Chapter 4928 Ohio Revised Code. Case No. 99-1141-EL-ORD. Appendix C. Retrieved from: http://dis.puc.state.oh.us/TiffToPDf/J_YLZ8DECRL5YXDH.pdf 96 State of New York Public Service Commission. (2016, September 15). Order Setting Standards for Codes of Conduct. Case Nos. 15-M-0501 and 14-M-0101. Retrieved from: https://www.energymarketers.com/Documents/utility_code_of_conduct_DER_order.pdf 97 Pepco Holdings. (undated). Codes of Conduct. Retrieved from: http://www.pepcoholdings.com/codes-of-conduct-/ 98 Dominion. (undated). Code of Conduct Governing the Relationships between Dominion North Carolina Power, its Affiliates and the Nonpublic Utiltiy Operations of Virgina Electric and Power Company. Retrieved from: file:///Users/camille/Downloads/codes-of-conduct.pdf 99 Texas PUC (undated). §25.272. Code of Conduct for Electric Utilities and Their Affiliates. Retrieved from: https://www.puc.texas.gov/agency/rulesnlaws/subrules/electric/25.272/25.272.pdf
60
enters the market to offer a competitive service. Table 2 describes various common aspects of utility codes of conduct for interacting with their own affiliate companies, as well as competitors.
Table 2. Utility Code of Conduct Areas
Type Description
Nondiscrimination
Utility provision of the same services and information to all competitors including its own affiliates, without preferential treatment for its affiliate. Utility provision of the same information sharing and disclosure to all competitors including prohibition on sharing information with affiliates that is not shared with competitors
Corporate Identification and Logo
Use of a different name and logo from the parent to eliminate customer confusion and avoid a name-recognition competitive advantage.
Goods and Services Transfer of goods and services to, sharing of facilities with, an affiliate only at market price to the regulated utility for any goods or services received to avoid a subsidy from ratepayers and prevent it from gaining a competitive advantage.
Sharing equipment and costs sharing does not occur between the utility and distribution company except for perhaps corporate services.
Joint Purchases
The utility should not be allowed to make joint purchases with their affiliate that are associated with the marketing of the affiliate’s products and services.
Corporate Support100 Shared corporate support must be priced to prevent subsidies, be recorded and made available for review.
Employees The utility and their affiliate(s) do not jointly employ the same people, with the only exception being shared directors and officers from the corporate parent or holding company.
For codes of conduct to be effective there needs to be regulatory oversight including requirements for compliance plans and audits to ensure that the codes of conduct are being adhered to. The utility should maintain a compliance procedure and log in which it records all informal complaints and their disposition. The regulator needs to have the ability to levy penalties for noncompliance.101
It is unusual for violations of codes of conduct to be adjudicated by regulatory officials. Such investigations are not common and a PBR scheme can incentivize compliance (or incentivize noncompliance) much more efficiently than a regulatory adjudication. Further, the expected 100 Corporate support means overall corporate oversight, governance, support systems, and personnel Any shared corporate support between the utility and the competitive entity should be priced to prevent subsidies and should be recorded and made available for review. The use of combined corporate support should exclude the opportunity to transfer confidential information, provide preferential treatment or an unfair competitive advantage, or lead to customer confusion. 101 See: See Migden-Ostrander, J. (2015, November). Power Sector Reform: Codes of Conduct for the Future. Electricity Journal, 28(6), p.4. Retrieved from: https://www.researchgate.net/publication/285216738_Power_Sector_Reform_Codes_of_Conduct_for_the_Future
61
nature of compliance and violations as deviations from acceptable norms may form the basis for creating a negative incentive or penalty.
A PBR incentive for compliance with codes of conduct would be closely associated in concept with support for competitive DER markets, but be distinct because it would focus on corporate separation and compliance with codes of conduct. The PBR metrics could track the number of complaints of violations made to the utility. Complaints most often go directly to the utility; thus, a requirement to keep a log to document the complaints is necessary. Since competitive companies are dependent on good will and utility relationships, they may be reluctant to file complaints. For that reason, the utility log of complaints can be a useful tool. The logs will indicate the resolution of issues as well as spot recurring problems. Unresolved matters or serious complaints would be addressed at the regulator level through separate complaint processes. The information obtained by the regulator can be used to form the basis of metrics regarding utility interaction with competitive DER providers.
7.2 Innovative PBRs that are in Operation The following PBRs or PIMs are innovative examples that jurisdictions around the world are using performance-based regulation.
7.2.1 Incentives for DER Implementation Performance-based regulatory frameworks are ripe with opportunity to help address the negative incentives utilities face—oftentimes inherent to traditional cost-of-service regulation constructs—to achieving efficient levels of DER deployment. PBR can be used to set incentives for greater distributed energy resource (DER) penetration. PBR for DERs can seek greater system efficiency through specific directional incentives tied to DER provider satisfaction, or DER deployment metrics of other system measures.
Often DER deployment is assessed in terms of number of DER systems deployed, the total installed capacity of DER on a particular system, or, if applicable, total amount of energy produced from DER units. These three fundamental metrics: number of units, capacity measure in kW or MW, and energy measured in kWhs or MWhs are merely the first steps in PBR for DER deployment, and these metrics can be used to establish directional incentives that lead to greater system efficiency through DER deployment. It can be difficult to translate directional incentives to measure utility DER penetration, formulate performance criteria, and set actual metrics for DER performance. DER provider satisfaction assessed through a well-developed survey is a way to develop another set of measures in an innovative manner being implemented in New York. DER incentives are relatively new, and as such are being structured in a variety forms which doubtless will evolve as some are judged successful and other less so.
7.2.1.1 Distributed Energy Resource Provider Satisfaction One leading exemplar of this PBR approach is the New York Reforming the Energy Vision initiative. NY REV is designed to establish coordinated PBR to motivate utilities to look for system efficiencies regardless of whether efficiencies are achieved on the grid through utility grid-level investments or at customer premises through customer and third-party DER solutions. NY REV’s incentives are designed to reward utilities for DER provider satisfaction and customer satisfaction while encouraging strong transparency. The NY REV initiative recognizes
62
that system efficiency can be achieved through either utility investments or customer and third-party DER solutions and attempts to alter utility incentives to allow for an assessment of the most cost-effective and beneficial set of solutions among utility, customer, and third-party providers.
One difficult issue jurisdictions will consider in structuring PBR mechanisms focused on DER is setting an appropriate baseline of expected, business-as-usual (i.e., no utility intervention) DER deployment. DER markets and technologies are rapidly evolving and investment decisions are made by consumers for a variety of reasons which can be difficult to project or model. Notably, many DER deployment drivers are outside the direct control or influence of utilities. This makes it difficult to set a PBR mechanism to determine what DER deployment should be attributed to the utility, and what would have happened without any utility involvement. As a result, directly attributing specific utility activities to DER deployment (i.e., measuring a utility’s value-add) may be a challenge. A baseline must be developed before a PBR mechanism can be created, and it is difficult to start with an ex-ante baseline because DER technologies markets are emerging (see Section 6.1.1 for more on setting baselines). The inability to develop a baseline or predict DER deployment trends poses a challenge in developing directional incentives as well as measurable performance criteria and PBR metrics. If a baseline is developed, any DER deployment in excess of this baseline could in theory be attributed to the utility, for the purposes of PBR. In practice, however, formulating proper baseline assessments against which to create a performance incentive for DERs is challenging. While methodologies to conduct baseline DER deployment estimates are outside the scope of this report, it is important to note that conducting these studies in public, and with sufficient stakeholder review and input, is a good practice that can only increase the validity of the estimates. The approach taken in NY REV of using sophisticated DER provider surveys to assess utility performance in DER facilitation has a significant virtue of avoiding the challenging task of developing a baseline against which to measure utility facilitation of DER deployment.
The NY Commission recognized that establishing a baseline for DER deployment is particularly difficult. Rather than simply track DER interconnection requests with no way of evaluating the quality of the interconnection process, the NY Commission instead focuses its PBR for DER on a survey of DER providers. The sophisticated survey of DER providers, which is still under development in the stakeholder process, is meant to assess how well utilities are working with DER developers on interconnections and identify targeted locations on the grid system where DER may have high value to reduce load.
The use of surveys by New York to assess utility performance on DER deployment goals is particularly innovative. There are at least two problems with simplifying measuring interconnection times, application, or quantity, which New York may be able to avoid by using surveys. The first problem is that simply measuring interconnection times and applications processed can be easily gamed by utilities quickly denying interconnection requests. Measuring interconnection time and applications processed does not measure whether meritorious applications are approved and applications with technical difficulties are denied – and it is very difficult to objectively measure the merits of approvals and denials without detailed knowledge of each distribution circuit. The second problem avoided is that measuring DER quantity in numbers or DER energy generated/avoided may measure outputs or outcomes that are more dependent on exogenous factors than how the utility handles interconnection requests. These
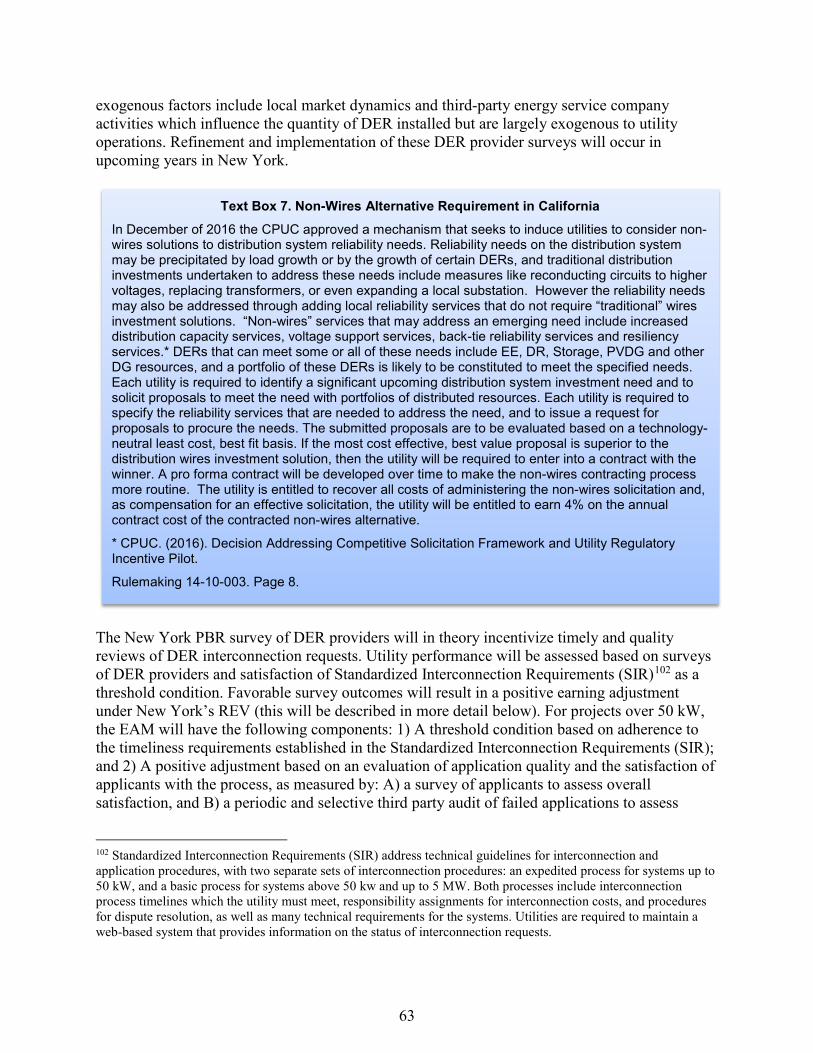
63
exogenous factors include local market dynamics and third-party energy service company activities which influence the quantity of DER installed but are largely exogenous to utility operations. Refinement and implementation of these DER provider surveys will occur in upcoming years in New York.
The New York PBR survey of DER providers will in theory incentivize timely and quality reviews of DER interconnection requests. Utility performance will be assessed based on surveys of DER providers and satisfaction of Standardized Interconnection Requirements (SIR)102 as a threshold condition. Favorable survey outcomes will result in a positive earning adjustment under New York’s REV (this will be described in more detail below). For projects over 50 kW, the EAM will have the following components: 1) A threshold condition based on adherence to the timeliness requirements established in the Standardized Interconnection Requirements (SIR); and 2) A positive adjustment based on an evaluation of application quality and the satisfaction of applicants with the process, as measured by: A) a survey of applicants to assess overall satisfaction, and B) a periodic and selective third party audit of failed applications to assess
102 Standardized Interconnection Requirements (SIR) address technical guidelines for interconnection and application procedures, with two separate sets of interconnection procedures: an expedited process for systems up to 50 kW, and a basic process for systems above 50 kw and up to 5 MW. Both processes include interconnection process timelines which the utility must meet, responsibility assignments for interconnection costs, and procedures for dispute resolution, as well as many technical requirements for the systems. Utilities are required to maintain a web-based system that provides information on the status of interconnection requests.
Text Box 7. Non-Wires Alternative Requirement in California In December of 2016 the CPUC approved a mechanism that seeks to induce utilities to consider non-wires solutions to distribution system reliability needs. Reliability needs on the distribution system may be precipitated by load growth or by the growth of certain DERs, and traditional distribution investments undertaken to address these needs include measures like reconducting circuits to higher voltages, replacing transformers, or even expanding a local substation. However the reliability needs may also be addressed through adding local reliability services that do not require “traditional” wires investment solutions. “Non-wires” services that may address an emerging need include increased distribution capacity services, voltage support services, back-tie reliability services and resiliency services.* DERs that can meet some or all of these needs include EE, DR, Storage, PVDG and other DG resources, and a portfolio of these DERs is likely to be constituted to meet the specified needs. Each utility is required to identify a significant upcoming distribution system investment need and to solicit proposals to meet the need with portfolios of distributed resources. Each utility is required to specify the reliability services that are needed to address the need, and to issue a request for proposals to procure the needs. The submitted proposals are to be evaluated based on a technology-neutral least cost, best fit basis. If the most cost effective, best value proposal is superior to the distribution wires investment solution, then the utility will be required to enter into a contract with the winner. A pro forma contract will be developed over time to make the non-wires contracting process more routine. The utility is entitled to recover all costs of administering the non-wires solicitation and, as compensation for an effective solicitation, the utility will be entitled to earn 4% on the annual contract cost of the contracted non-wires alternative.
* CPUC. (2016). Decision Addressing Competitive Solicitation Framework and Utility Regulatory Incentive Pilot.
Rulemaking 14-10-003. Page 8.
64
accuracy, fairness, and key drivers of failure in order to support continual process improvement. The Commission will also consider on a case-by-case basis negative earning adjustments for failure to meet established standards.
As part of REV, the NY PSC has a separate EAM specifically for DER deployments. A DER Utilization EAM encourages New York’s largest utility, Con Edison, to expand use of DERs, to reduce customer reliance on grid-supplied electricity and for beneficial electrification.103 The DERs falling under this EAM initially are: solar photovoltaic systems, combined heat and power (CHP), fuel cells, battery storage, demand response, thermal storage, heat pumps, and EV charging. DERs will be measured in terms of the annualized MWh produced, consumed, discharged, or reduced from incremental (new to the Rate Year) resources. Because not all DERs are individually metered or measured, MWh produced or consumed by incremental DERs will be counted through default factors for DER energy usage and consumption.
7.2.1.2 Solar Distributed Generation A guiding goal of a PBR regime can be to encourage solar DG or to encourage utility, consumer, and solar DG developer communication and cooperation in effective interconnection. A good first step to this goal is to facilitate transparency on connection levels, including methods to facilitate communication between the utility, customers, developers and the public.
In 2013, Hawaii adopted utility performance metrics for DER deployment. These included measurement of the number of net energy metering (NEM)104 program participants and installed solar DG capacity, as well as enrollment numbers for utility demand response and storage programs. These metrics are to be posted on the utilities’ websites to facilitate transparency of information on DER levels for utility customers. 105 There are no incentives associated with these metrics.
To address the customer and stakeholder’s desire for information on DER deployments and application processing, Massachusetts used “dashboards.”106 Dashboards are computerized summaries of key data on specific topics such solar DG deployment presented on a web-based portal. While not an incentive mechanism per se, dashboards can set up very effective communication methods with customers, the public and DER developers. Moreover, presentation of dashboard data in graphic form involves presentation of DER information (number of units, capacity, energy produced, geography) that comprise a number of metrics that set public reporting obligations similar to a specific performance criteria. Dashboard and energy portals transform a set of goals or targets into the reporting, tracking and presentation of
103 Dennis, K., Colburn, K., Lazar, J. (2016, August). Environmentally Beneficial Electrification: The dawn of “emissions efficiency.” Montpelier, VT: The Regulatory Assistance Project. Retrieved from: http://www.raponline.org/knowledge-center/environmentally-beneficial-electrification-dawn-emissions-efficiency/ 104 Hawaii has since terminated solar NEM. 105 Whited, M., Woolf, T., and Napoleon, A. (2015). Utility Performance Mechanisms: A Handbook for Regulators. Synapse Energy Economics. Retrieved from: http://www.synapse-energy.com/sites/default/files/Utility%20Performance%20Incentive%20Mechanisms%2014-098_0.pdf, p. 89. 106 Whited, M., Woolf, T., and Napoleon, A. (2015). Utility Performance Mechanisms: A Handbook for Regulators. Synapse Energy Economics. Retrieved from: http://www.synapse-energy.com/sites/default/files/Utility%20Performance%20Incentive%20Mechanisms%2014-098_0.pdf, p. 32.
65
information that provides the public with an understanding of which metrics are important to assess utility and power system operations.
7.2.2 Incentives for Sharing Utility Data Utilizing real time energy cost and usage data systems is critical to optimize the efficiency of energy production and delivery.107 However utilities are inherently reluctant to do so, as there are barriers to overcome and no incentive to do so. Sharing this data can foster system optimization by facilitating access to utility and customer data that allows for more efficient decisions. Sharing of specific customer data usually requires customer consent; thus data usage systems must also facilitate customer consent. Alternatively, utilities can share anonymized data as part of an evolving platform function.108 If energy cost and usage information becomes more transparent, customers and providers can use this information to make more efficient decisions to reduce their costs and increase the value of their energy systems for their specific needs.
To share data more freely, it is often necessary to address barriers that prevent DER providers from obtaining both utility and customer data. Third-party clean energy technology companies view the lack of a utility incentive to easily share utility and customer data (again with customer consent) as problematic, particularly since this data would provide opportunities for them to offer alternative solution sets to consumers, lower costs of customer acquisition, and to compete with utilities for certain services.109 The need for utility performance incentives and corresponding metrics that will motivate utilities to provide data to third-party energy technology companies in order to compete in this space is critical to facilitating a competitive energy services space. NY-REV has focused on addressing these issues by adopting a DER provider survey as part of its earnings adjustment mechanism. The NY REV DER survey is currently under development.
7.2.3 Renewable Energy Performance Metrics Hawaii adopted performance metrics to require utilities to reveal all renewable energy used by each utility, whether utility based or distributed. The Hawaii guiding goals and directional incentives identified for refinement and further consideration include system renewable energy (excluding customer-sited generation), total renewable energy generated (including distributed generation), renewable energy curtailments and RPS compliance. These metrics are to be posted
107 Fox-Penner, P. (2010). Smart Power: Climate Change, the Smart Grid and the Future of Electric Utilities, Island Press; Valochi, et al. Switching perspectives: Creating new business models for a changing world of energy, IBM Inst. for Business Value, 2010. 108 The NY PSC noted the evolving role of the utility and the potential platform services utilities could offer. In the Order Adopting a Ratemaking and Utility Revenue Model Policy Framework, the PSC noted that “utilities will have four ways of achieving earnings: traditional cost-of-service earnings; earnings tied to achievement of alternatives that reduce utility capital spending and provide definitive consumer benefit; earnings from market-facing platform activities; and transitional outcome-based performance measures.” This recognizes the fact that “the traditional provider’s role has evolved to a platform service that enables a multi-sided market in which buyers and sellers interact. The platform [will collect] a fee for this critical market-making service, while the bulk of the capital risk is undertaken by third parties.” State of New York Public Service Commission. (2016, May 19). Case No. 14-M-0101. Order Adopting a Ratemaking and Utility Revenue Model Policy Framework. 109 Elking, E. (2015). Knowledge is Power, How Improved Energy Data Access Can Bolster Clean Energy Technologies & Save Money. Center for Law, Energy & the Environment Publications. Berkley, CA. Retrieved from: http://scholarship.law.berkeley.edu/cgi/viewcontent.cgi?article=1016&context=cleepubs
66
on the utilities’ websites to facilitate customer access and private market decision making and planning. 110
In March of 2015, Hawaii further ordered development of metrics, a website and review process for renewable metrics among others. The Hawaii Public Utilities Commission ordered the utilities to “regularly report, maintain, and promptly periodically update the [renewable energy] performance metrics,” and to “participate in an iterative metrics and website development and review process.”111 This process would establish and post to a website metrics for:
7.2.3.1 Hawaii Renewable Energy Metrics 1. System Renewable Energy Metric (System RE Metric) 2. Renewable Portfolio Standard Compliance 3. Total Renewable Energy Metric (Total RE Metric) 4. Number of NEM program participants and capacity of NEM program.112
The development of these metrics will facilitate transparency with customers, the public, stakeholders and the public.
7.2.4 Operational Incentives: Improved Power Plant Performance There is history of California regulators developing system operational incentives when its utilities were vertically-integrated in the late 1980s and 1990s. During this period of time, nuclear plant costs were so expensive that nuclear plants faced the possibility of sitting idle because rates were not high enough to recover their fixed costs. As a result, in a 1998 settlement California regulators set rates for Diablo Canyon nuclear station based on an avoided cost calculation. This rate was above market rates, and was meant to allow the plant to operate and provide service to ratepayers. The rate was fixed, escalating only for inflation. The performance guiding goal was to achieve increased hours of generation. Under this settlement, this nuclear station was earning more than $0.12/kWh while the Western U.S. wholesale market prices dropped to roughly $0.03/kWh. Hindsight demonstrates that the avoided cost calculation did not predict the future price.
Learning from that error where ratepayers paid far above market rates for generation from a specific nuclear plant, California then set the avoided cost for replacement power payment for the Palo Verde nuclear station at the market-based cost of replacement power. The cost of replacement power was the cost for the California utility to charge to its ratepayers for power to serve the utility’s load, in this case purchased from the Palo Verde nuclear station. Subsequently, the California energy crisis occurred in the summer of 2000, and the cost of replacement power increased ten-fold. The result was utility payments for nuclear power at much higher replacement 110 Whited, M., Woolf, T., and Napoleon, A. (2015). Utility Performance Mechanisms: A Handbook for Regulators. Synapse Energy Economics. Retrieved from: http://www.synapse-energy.com/sites/default/files/Utility%20Performance%20Incentive%20Mechanisms%2014-098_0.pdf, p. 89. 111 HI PUC (2014, February 7) Docket 2013-0141. Order No. 31098. Retrieved from: https://dms.puc.hawaii.gov/dms/DocketSearch 112 HI PUC (2014, February 7) Docket 2013-0141. Order No. 31098. Retrieved from: https://dms.puc.hawaii.gov/dms/DocketSearch
67
power costs than were anticipated.113 Both mechanisms were subsequently modified due to a perception that the utility was overcompensated for the cost of nuclear generation. Both of these California mechanisms were pricing mechanisms intended to incentivize acquisition of low-cost power through pricing of power purchases depending on formulas that did not anticipate future energy market price adequately. To the extent the pricing formulas were intended to incent purchases from these nuclear power plants, they succeed. However, to the extent the formulas were intended to save ratepayers any money, the pricing failed to incorporate mechanisms that ensured ratepayer savings would occur.
Moving forward two decades, there is perhaps an appreciation for testing PBR and metrics first before adopting full fledged and potentially expensive performance incentives. In 2014, Hawaii adopted performance metrics for generator performance. These include equivalent availability factor, equivalent forced outage rate demand, and equivalent forced outage factor. These metrics were ordered to be posted on the utilities’ websites to facilitate stakeholder and customer access. 114 As noted in Section 5.2 above, while reporting obligations for certain performance criteria or metrics is a weak form of PBR, it is PBR nonetheless. The requirement that utilities track, analyze and report specific information can affect utility behavior and may be precedent to establishing incentives. 115
7.2.5 Operational Incentives: Improved Interconnection Request Response Times
Performance-based metrics have been used to incentivize utilities to improve interconnection request responses times for DERs. How these mechanisms are structured varies widely by jurisdiction. An Illinois Commission approved a settlement in 2013 that requires a performance metric be developed by Commonwealth Edison to track time to connect distributed energy
113 Whited, M., Woolf, T., and Napoleon, A. (2015). Utility Performance Mechanisms: A Handbook for Regulators. Synapse Energy Economics. Retrieved from: http://www.synapse-energy.com/sites/default/files/Utility%20Performance%20Incentive%20Mechanisms%2014-098_0.pdf, pp. 53, 63-69. 114 Whited, M., Woolf, T., and Napoleon, A. (2015). Utility Performance Mechanisms: A Handbook for Regulators. Synapse Energy Economics. Retrieved from: http://www.synapse-energy.com/sites/default/files/Utility%20Performance%20Incentive%20Mechanisms%2014-098_0.pdf, p. 89. 115 Prior to 2014, Hawaii had an Energy Cost Adjustment Clause with a heat rate efficiency factor. This clause encouraged dispatch of the most efficient power plants with the lowest heat-rate, meaing the most thermal-energy generated per unit of fuel input. However, concerns were raised that the heat rate target would penalize utilities for integrating higher levels of renewables that might impose a higher ramping requirements and lower capacity factors for thermal power plants balancing renewable loads - which both would negatively impact thermal unit heat rates. To address this disincentive for renewable integration, a dead band of +/- 50 Btu/kWh sales was added to heat rate target. A dead band is a zone of no adjustment around a specific performance criteria or metric; in this case the dead-band is expressed as a meteric around the allowed heat rate so the utility would not lose the benefits of the heat rate efficiency factor if ramping to accommodate renewable resources increased or decreased the heat rate within a range of 50 Btu/kWh. A dead-band thus provides a range where utility revenue is not affected by variation in the metric. Whited, M., Woolf, T., and Napoleon, A. (2015). Utility Performance Mechanisms: A Handbook for Regulators. Synapse Energy Economics. Retrieved from: http://www.synapse-energy.com/sites/default/files/Utility%20Performance%20Incentive%20Mechanisms%2014-098_0.pdf, p. 94.
68
resources to the grid.116 These include reporting on Commonwealth Edison’s response time to DER project applications and time from receipt of an application until energy flows from the project to the distribution grid. A similarly structured metric was implemented for connections to the transmission grid where a generation project would connect at a higher transmission voltage.117 These are report only metrics with no corresponding incentives or penalties.
In its Track 2 Order in 2016, the NY-PSC directed the electric utilities to propose a DER interconnection survey process and associated EAM metrics. The utilities filed these in September 2016. The Commission, in March 2017, issued an order that determined that the utilities’ proposed frameworks for the DG interconnection surveys and performance metrics did not fully address the need for improved interconnection processes, and required the utilities to submit a revised filing. Specifically, the Commission found:118
• The survey metric will use survey results of DG applicants with projects above 50 kW and up to 5 MW.119 Each utility target will be considered in individual utility proceedings. Each utility is required to have a collaborative process to obtain input from stakeholders including DG applicants and developers on the appropriate target and must reflect the collaborative discussions and provide the basis for the target proposed.
• Regarding the survey to assess satisfaction with the interconnection process, utilities are required to survey DER interconnection applicants when the applicants have received preliminary review from the utility (a mid-point survey), and another survey once the DER application is complete. The surveys are to be phone and/or web-based. The survey design and vetting process will be thorough. The survey questions must be vetted through cognitive (how respondents understand the questions and respond) and field testing (to assess responses on survey questions). Finally, these surveys will include a core sequence of questions applicable to all utilities, used to determine the utilities’ eligibility for the EAM.
• Failed applications will not be part of the EAM evaluation criteria. However, utilities must collect data on failed applications for a separate purpose.
• The DG interconnection EAM value will generally be consistent across utilities. Each utility is required to have a collaborative process to obtain input from stakeholders on the appropriate value.
116 Whited, M., Woolf, T., and Napoleon, A. (2015). Utility Performance Mechanisms: A Handbook for Regulators. Synapse Energy Economics. Retrieved from: http://www.synapse-energy.com/sites/default/files/Utility%20Performance%20Incentive%20Mechanisms%2014-098_0.pdf, p. 85. 117 Whited, M., Woolf, T., and Napoleon, A. (2015). Utility Performance Mechanisms: A Handbook for Regulators. Synapse Energy Economics. Retrieved from: http://www.synapse-energy.com/sites/default/files/Utility%20Performance%20Incentive%20Mechanisms%2014-098_0.pdf, p. 85. 118 New York PSC. (2017, March 9). CASE 14-M-0101. Order Directing Modifications to the joint utilities proposed interconnection earning adjustmenet mechanism framework. Retrieved from: http://www3.dps.ny.gov/W/PSCWeb.nsf/All/CC4F2EFA3A23551585257DEA007DCFE2?OpenDocument 119 The NY-PSC declined to apply an EAM to applications for projects under 50 kW.
69
Con Edison received approval for an interconnection EAM in January 2017 as part of a rate case.120 The interconnection EAM covers DG projects between 50 kW and 5 MW, and measures results against three targets:
• Standard Interconnection Requirements (SIR) timeliness; these requirements include specific timelines by which interconnection projects must be approved.
• A survey of customer satisfaction conducted by an independent surveyor.
• An audit of failed applications conducted by an independent auditor.
Con Edison will convene a collaborative121 to seek agreement on the targets for the three EAM measures and other details. Although targets will be established and data collected in 2017, there will be no earning opportunity for Rate Year One. The earning opportunity for Rate Years Two and Three will be five basis points (0.05% of ROE; Con Edison’s ROE is 9%) in each rate year.
The NY-PSC also has a separate EAM specifically for DER deployments.
7.2.6 Operational Incentives: Differing Approaches to Achieving System Efficiency
Operational metrics can and often do focus on achieving system efficiencies. Different jurisdictions identify system efficiency differently based on their particular needs, configurations and priorities, with some focused on load factor improvement and peak reduction and others focused more broadly on reducing system losses, including theft and administrative and operational efficiency.
7.2.6.1 Denmark The Danish TSO, Energinet.dk, a state-owned not-for-profit utility, is subject to non-profit “cost plus” regulation. Energinet.dk is not allowed to build up equity or pay dividends to its owner (Danish Ministry of Energy) and can only recover “necessary costs” by efficient operations and a “necessary return on capital.” Revenues are therefore set to recover the necessary costs of efficient operation plus a modest interest on equity capital. The regulator, Energitilsynet (also known as DERA) can refuse the recovery of non-efficiently incurred costs. The guiding principle or goal is efficient operations.
The goal of the Danish net volume efficiency model is to encourage the most inefficient Distribution System Operators (DSOs) to become as efficient as the top 10% of DSOs within a four-year period. The main feature of the model, which is applied annually, is a cost index measuring the costs of an average DSO running a particular grid. Thus, the metric is the cost index measure, a benchmarking measure. The model allows individual DSO performance to be compared with its peers’ relative performance despite differences in size and characteristics of 120 New York PSC (2017, January 25). CASE 16-E-0060, CASE 16-G-0061, CASE 16-E-0196. Order Approving Electric and Gas Rate Plans (for Con Edison). 121 A collaborative is a stakeholder process that seeks input on various aspects of Commission proceedings. They have historically been used in energy efficiency. For more information, see Li, M., and Bryson, J. (2015). Energy Efficiency Collaboratives. State and Local Energy Efficiency Action Network. Retrieved from: https://www4.eere.energy.gov/seeaction/system/files/documents/EECollaboratives-0925final.pdf.
70
specific grids. By limiting the number of cost elements analyzed to 23, the Danish benchmarking methodology, the “netvolumen” methodology, achieves an acceptable balance between efficiency benchmarking accuracy and the necessary resource requirements from the regulator (DERA) needed to accomplish this.122 The benchmarking attempts to account for utility size and service territories: the net volume and quality of supply models are designed to take account of dissimilarities between DSOs size and the nature of their grids. However, there is little or no identification of areas in the economic benchmarking (the netvolumen model) where the DSO excels or performs particularly well. The measured outcome of the net volume model is an efficiency index comparing the actual cost incurred by a DSO in operating its grid with the costs incurred by an “average” DSO.
7.2.6.2 New York, United States Across the Atlantic Ocean, a recent NY-REV Order mandates EAMs related to peak reduction and load improvement factor:
1. Each utility must propose a peak reduction target and a load factor improvement target. Each utility proposal for this EAM will meet a list of requirements including targets, an analysis based on a benefit-cost analysis (BCA) framework, and a proposed financial incentive for economic savings. These may include complementary strategies to build electric load, improve load factor, and reduce carbon emissions, such as encouraging conversion to electric vehicles, geothermal heat pumps, and other efficient and beneficial uses.
2. Utilities must propose targets for peak reduction and load factor improvement over a period of five years. Individual utility targets may be either annual or cumulative with milestones. Peak reduction targets are required to establish either a specific MW objective for system peak or a percentage reduction from a defined MW amount. Both peak reduction and load factor improvement targets are required to be ambitious in size to encourage a portfolio approach beyond conventional programs. Targets and awards are to be established on a graduated basis that encompasses both moderate levels of achievement and superior results. Only positive earnings adjustments will be used for these initial EAMs, with the size of the adjustment graduated to the extent of achievement. To demonstrate achievement under this EAM, the Commission will examine the contribution of each component of the program, to avoid any incentive to achieve by reducing economic activity. This particular EAM is still under development, at the time of writing this report.
New York is attempting to achieve a more efficient utility electrical grid by improving the load factor and reducing peak demand so electricity usage is more smoothly spread across different
122 In the netvolumen model, each DSO has annually reported its stock of 23 types of grid component. DERA obtains a measure of the DSO’s net volume by multiplying the stock of each component by an estimated cost parameter including both operational cost and depreciation. The net volume effectively measures the cost that an “average” DSO would incur in operating each DSO’s distribution network. Comparing this figure with the DSO’s actual cost gives a cost-index for each DSO. This allows DERA to rank all DSOs in terms of operational efficiency and apply an annual efficiency factor to each DSO, designed to lift efficiency to that of the top 10 % of DSOs within four years.
71
times of the day. The idea behind this improved load factor EAM is that capital infrastructure is utilized more efficiently if the infrastructure is used for more hours than just the peak periods. Implementing these concepts in January 2017, the NY-PSC approved a rate case for Con Edison that included a system efficiency EAM.123 This EAM includes three metrics:
• Incremental system peak reduction; targets have already been set for this metric.
• Customer Load Factor; Con Edison will be further analyzing factors related to this EAM and proposing a metric for it in Rate Year Two.
• DER Utilization; the DERs falling under this metric for Rate Year One are solar PVs, CHP, fuel cells, battery storage, demand response, thermal storage, heat pumps, and EV charging. DERs will be measured in terms of the annualized MWh produced, consumed, discharged, or reduced from incremental resources. Because not all DERs are individually metered or measured, MWh produced or consumed by incremental DERs will be determined on an annualized basis using fixed assumptions.
The maximum earning opportunity for these system efficiency metrics in Rate Year One is 4 basis points which is 0.04% of ROE in would be added to Con Edison’s ROE is 9%.
In January 2017, the NY PSC approved a rate case for Con Edison that included several EAMs, including two energy efficiency metrics.124 The first EE metric is for meeting or exceeding target levels for incremental GWh savings. EE incentives are not a new application of PBR. However, the second metric, developed through a collaborative process, is an energy intensity metric for both the residential and commercial sectors. The energy intensity metric is intended to incentivize efforts to decrease energy intensity beyond recent system trajectories (including energy savings from existing programs). Con Edison will earn this incentive if the decline in energy intensity improves beyond the trend 2010. The performance targets will be set on rate class basis for residential kWh per customer and commercial kWh per employee at the end of rate year one at a declining intensity trajectory.125 Con Edison can earn a maximum of 7.76 basis points in rate year one under this mechanism.
7.2.6.3 Puerto Rico Puerto Rico is focusing on improving system efficiency by mandating performance metrics within its Integrated Resource Planning (IRP) process. The Legislative Assembly of the Commonwealth of Puerto Rico enacted Act 57-2014126, which mandated performance metrics be
123 New York PSC (2017, January 25). CASE 16-E-0060, CASE 16-G-0061, CASE 16-E-0196. Order Approving Electric and Gas Rate Plans (for Con Edison). 124 New York PSC (2017, January 25). CASE 16-E-0060, CASE 16-G-0061, CASE 16-E-0196. Order Approving Electric and Gas Rate Plans (for Con Edison). 125 Con Edison will use averages across the rate classes for the customers and employees. The energy use will tracked on 12-month rolling weather normalized monthly energy sales. 126 Puerto Rico Energy Transformation and RELIEF Act, as amended. This legislation created a regulatory commission, the Puerto Rico Energy Commission (PREC) and included numerous regulatory provisions including an IRP and a timeframe (1 year) for the utility, the Puerto Rico Electric Power Authority (PREPA) to file.
72
adopted as part of the IRP process.127 As the Legislative Assembly described it, “(w)e have been held as hostages of a poorly efficient energy system that excessively depends on oil as a fuel, and that does not provide the tools to promote our Island as a place of opportunities in the global market.”128 Thus, it is in this context, that the Puerto Rico Energy Commission (PREC) established performance metrics in the first set of IRP rules. Because of the significance with which the PREC views the need for the Puerto Rico Electric Power Authority (PREPA) to improve its performance on all fronts, the Commission has now established a separate proceeding to revisit and revise those metrics.129
On November 15, 2016, PREC issued its Notice of Investigation which commenced the process to review performance metrics more comprehensively. The Commission has already received comments from interested stakeholders.130 The process will incorporate three separate components: a Commission investigation into PREPA’s operations to assist in developing final performance metrics which will supersede the metrics set forth in the IRP rules; an independent engineering assessment of PREPA’s operations focusing on the reliability and integrity of the entire transmission, distribution and generating system, especially in light of the extensive outage in September, 2016; and rulemaking to create the new amended metrics. One of the challenges, however is that PREPA is a state-owned entity, making the assessment of rewards or penalties challenging.
A subsequent Order seeking comment from PREPA and interested stakeholders was issued on April 27, 2017.131 In that Order, categories of performance metrics were identified and listed under the following categories: overall system, generation, transmission and distribution, customer service, finance, planning, environmental, operations, IT, human resources, legal, renewable energy and demand-side man agent. Each category has an identified list of potential metrics for which the Commission is seeking comment prior to drafting proposed rules. The operational metrics focus on efficiency in purchasing, warehousing, fleet, and fuel and are designed to improve tracking, reporting and efficiency in these categories as a means to cut costs and eliminate waste. Reporting requirements in other areas such as demand-side management, which measures reductions in peak and energy usage, will also affect system efficiency. Because of the lack of accountability for PREPA prior to being regulated, most of the metrics are focused on reporting information to create a baseline from which to measure progress as new internal
127 Act 57, §6C(h)(iv). Specifically, the law sets out detailed parameters which include: revenue per kilowatt-hour (kWh); operating and maintenance expenses per kWh; operating and maintenance expenses of the distribution system per customer; customer service expenses per customer; general and administrative expenses per customer; energy sustainability; emissions; total amount of energy used annually in Puerto Rico; total amount of energy used annually per capita, for Puerto Rico as a whole and separately for urban and non-urban areas; and total energy cost per capita, for Puerto Rico as a whole and separately for urban and non-urban areas. 128 Act 57, §6C(h)(iv)., Statement of Motives. 129 Puerto Rico Commission Order 8594, May, 2015, IRP Rule, Article V. 130 Energy Commission of Puerto Rico. (2016, November 15). In re: The Performance of the Puerto Rico Electric Power Authority, Case No. CEPR-IN-2016-0002. 131 Energy Commission of Puerto Rico. (2017, April 27). In re: The Performance of the Puerto Rico Electric Authority. Performance Metrics. Case No. CEPR-IN-2016-0002. Retrieved from: http://energia.pr.gov/wp-content/uploads/2017/04/Resolution-Performance-Metrics-CEPR-IN-2016-0002.pdf
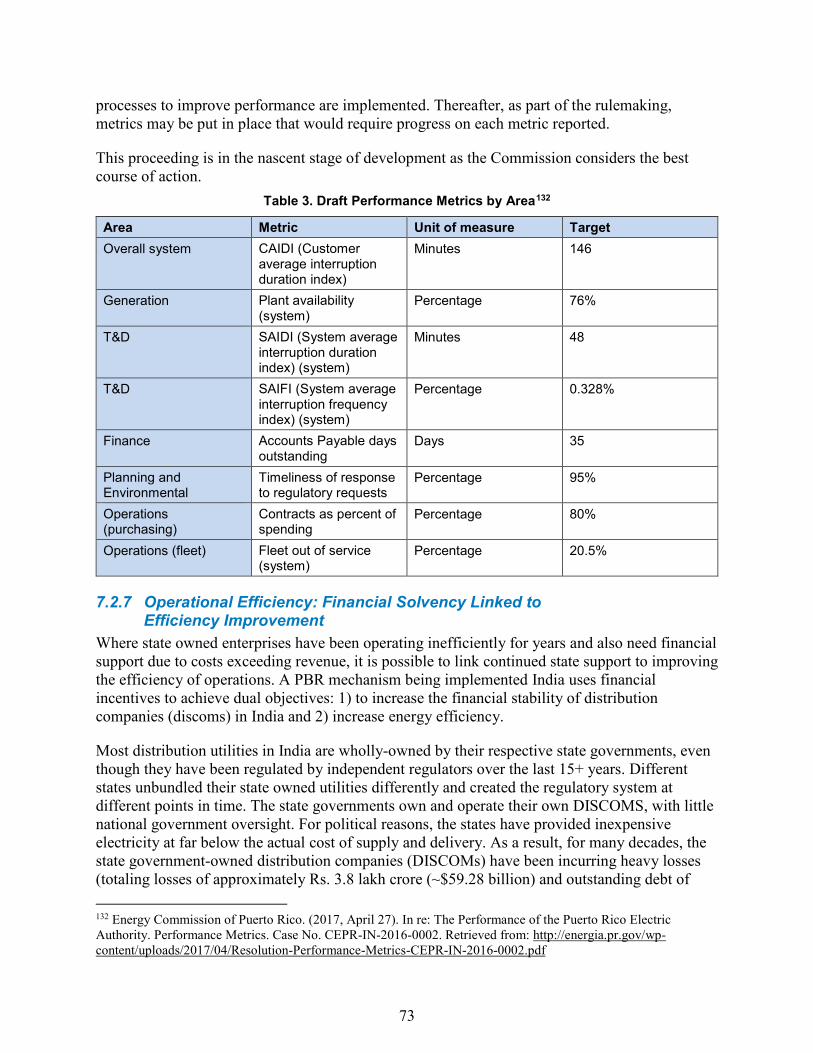
73
processes to improve performance are implemented. Thereafter, as part of the rulemaking, metrics may be put in place that would require progress on each metric reported.
This proceeding is in the nascent stage of development as the Commission considers the best course of action.
Table 3. Draft Performance Metrics by Area132
Area Metric Unit of measure Target Overall system CAIDI (Customer
average interruption duration index)
Minutes 146
Generation Plant availability (system)
Percentage 76%
T&D SAIDI (System average interruption duration index) (system)
Minutes 48
T&D SAIFI (System average interruption frequency index) (system)
Percentage 0.328%
Finance Accounts Payable days outstanding
Days 35
Planning and Environmental
Timeliness of response to regulatory requests
Percentage 95%
Operations (purchasing)
Contracts as percent of spending
Percentage 80%
Operations (fleet) Fleet out of service (system)
Percentage 20.5%
7.2.7 Operational Efficiency: Financial Solvency Linked to Efficiency Improvement
Where state owned enterprises have been operating inefficiently for years and also need financial support due to costs exceeding revenue, it is possible to link continued state support to improving the efficiency of operations. A PBR mechanism being implemented India uses financial incentives to achieve dual objectives: 1) to increase the financial stability of distribution companies (discoms) in India and 2) increase energy efficiency.
Most distribution utilities in India are wholly-owned by their respective state governments, even though they have been regulated by independent regulators over the last 15+ years. Different states unbundled their state owned utilities differently and created the regulatory system at different points in time. The state governments own and operate their own DISCOMS, with little national government oversight. For political reasons, the states have provided inexpensive electricity at far below the actual cost of supply and delivery. As a result, for many decades, the state government-owned distribution companies (DISCOMs) have been incurring heavy losses (totaling losses of approximately Rs. 3.8 lakh crore (~$59.28 billion) and outstanding debt of 132 Energy Commission of Puerto Rico. (2017, April 27). In re: The Performance of the Puerto Rico Electric Authority. Performance Metrics. Case No. CEPR-IN-2016-0002. Retrieved from: http://energia.pr.gov/wp-content/uploads/2017/04/Resolution-Performance-Metrics-CEPR-IN-2016-0002.pdf
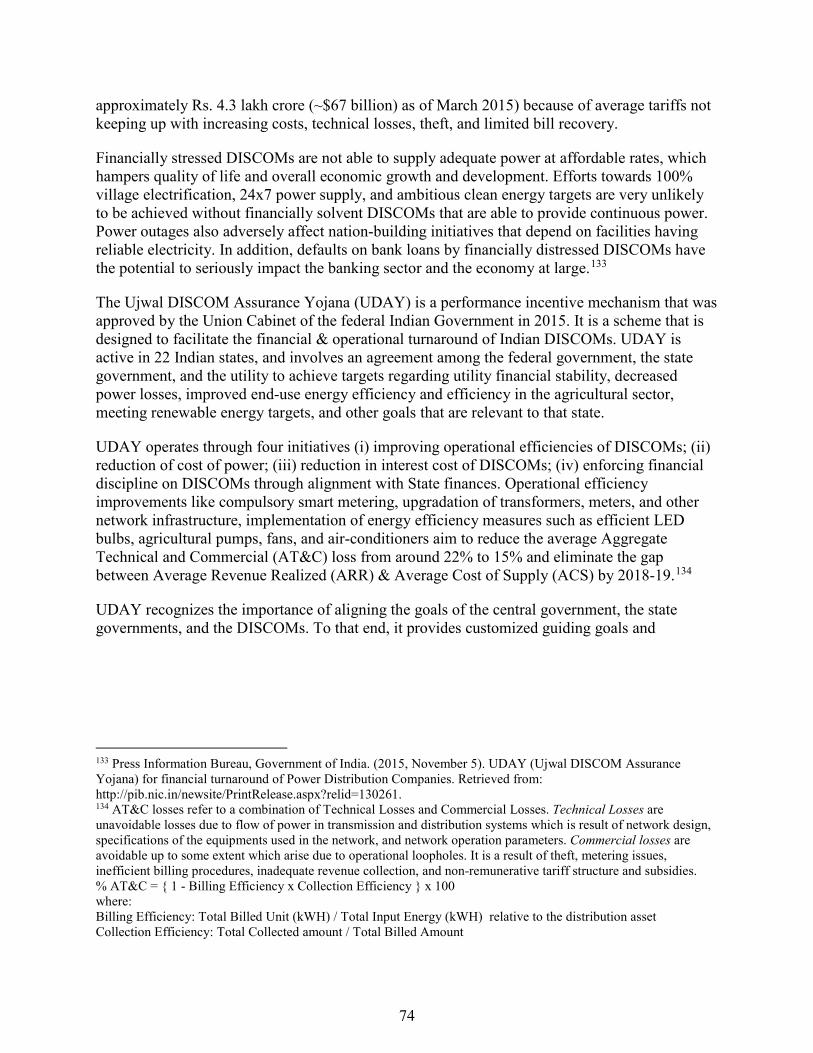
74
approximately Rs. 4.3 lakh crore (~$67 billion) as of March 2015) because of average tariffs not keeping up with increasing costs, technical losses, theft, and limited bill recovery.
Financially stressed DISCOMs are not able to supply adequate power at affordable rates, which hampers quality of life and overall economic growth and development. Efforts towards 100% village electrification, 24x7 power supply, and ambitious clean energy targets are very unlikely to be achieved without financially solvent DISCOMs that are able to provide continuous power. Power outages also adversely affect nation-building initiatives that depend on facilities having reliable electricity. In addition, defaults on bank loans by financially distressed DISCOMs have the potential to seriously impact the banking sector and the economy at large.133
The Ujwal DISCOM Assurance Yojana (UDAY) is a performance incentive mechanism that was approved by the Union Cabinet of the federal Indian Government in 2015. It is a scheme that is designed to facilitate the financial & operational turnaround of Indian DISCOMs. UDAY is active in 22 Indian states, and involves an agreement among the federal government, the state government, and the utility to achieve targets regarding utility financial stability, decreased power losses, improved end-use energy efficiency and efficiency in the agricultural sector, meeting renewable energy targets, and other goals that are relevant to that state.
UDAY operates through four initiatives (i) improving operational efficiencies of DISCOMs; (ii) reduction of cost of power; (iii) reduction in interest cost of DISCOMs; (iv) enforcing financial discipline on DISCOMs through alignment with State finances. Operational efficiency improvements like compulsory smart metering, upgradation of transformers, meters, and other network infrastructure, implementation of energy efficiency measures such as efficient LED bulbs, agricultural pumps, fans, and air-conditioners aim to reduce the average Aggregate Technical and Commercial (AT&C) loss from around 22% to 15% and eliminate the gap between Average Revenue Realized (ARR) & Average Cost of Supply (ACS) by 2018-19.134
UDAY recognizes the importance of aligning the goals of the central government, the state governments, and the DISCOMs. To that end, it provides customized guiding goals and
133 Press Information Bureau, Government of India. (2015, November 5). UDAY (Ujwal DISCOM Assurance Yojana) for financial turnaround of Power Distribution Companies. Retrieved from: http://pib.nic.in/newsite/PrintRelease.aspx?relid=130261. 134 AT&C losses refer to a combination of Technical Losses and Commercial Losses. Technical Losses are unavoidable losses due to flow of power in transmission and distribution systems which is result of network design, specifications of the equipments used in the network, and network operation parameters. Commercial losses are avoidable up to some extent which arise due to operational loopholes. It is a result of theft, metering issues, inefficient billing procedures, inadequate revenue collection, and non-remunerative tariff structure and subsidies. % AT&C = { 1 - Billing Efficiency x Collection Efficiency } x 100 where: Billing Efficiency: Total Billed Unit (kWH) / Total Input Energy (kWH) relative to the distribution asset Collection Efficiency: Total Collected amount / Total Billed Amount
75
directional incentives for each DISCOM in exchange for a financial support package.135 In return for the bailout, the DISCOMs have been given target dates (2017 to 2019) by which they must meet certain efficiency parameters such as reduction in power lost through transmission, theft and faulty metering, installing smart meters and implementing geographic information system (GIS) mapping of areas with high losses. States will also have to ensure that power tariffs are revised regularly, so that the DISCOMs receive enough revenue to cover costs. The central government allows this additional debt on the state government books to not be counted against their fiscal obligations, and will also provide support for DISCOMs through its own schemes (e.g. rural electrification, network upgradation, etc.). The DISCOMs will also need to adopt certain tariff revisions, as prior tariffs were too low to compensate the utility for the actual cost of service, and tariffs were to be revised to reflect the actual costs. It is not clear if the new tariffs do this, or if they can be enforced on consumers.136 Consequences for noncompliance are not clear.
Reductions in the cost of power are being achieved through measures such as increased supply of cheaper domestic coal, sourcing coal from more efficient plants, coal price rationalization based on GCV (Gross Calorific Value), supply of washed and crushed coal, and faster completion of transmission lines.
UDAY represents an innovative way to address larger systemic challenges of financial instability of utilities owned and operated by subnational governments. The innovative part of this scheme is that it recognizes and directly confronts the fact that financial liabilities of DISCOMs are the contingent liabilities of the respective States and need to be recognized as such. Debt of DISCOMs is de facto borrowing of States which is not counted in de jure borrowing. However, credit rating agencies and multilateral agencies are conscious of this de facto debt in their appraisals.
135 Under the scheme, the State governments will take over three-fourths of the debt of their respective DISCOMs. The State governments will then issue ‘UDAY bonds’ to banks and other financial institutions to raise money to pay off the banks. The remaining 25 per cent of the DISCOM debt will be addressed in one of the two ways — conversion into lower interest rate loans by the lending banks, or via issuing DISCOM bonds backed by State government guarantee (which helps bring down interesting rates). Madhu, M. (2016, March 28). All you wanted to know about UDAY. The Hindu Business Line. Retrieved from: http://www.thehindubusinessline.com/opinion/all-you-wanted-to-know-about-uday/article8406121.ece 136 Currently 17 out of the 22 states have reported AT&C losses for this year, and the total losses across all 17 states is 22.49%. The goal is for each state to have 15% AT&C losses or less. https://www.uday.gov.in/atc_india.php. Additionally, tariff revisions were required as part of the MOU for each state, as the utility needs state buy-in to accomplish these tariff revisions. Tariff revisions have been filed in 19 of 22 states. In this respect the MOUs have been a success. Government of India, Ministry of Power. (undated).UDAY National Dashboard. Retreived from:https://www.uday.gov.in/atc_india.php
76
Figure 7. UDAY State/DISCOM Quarterly Performance Ranking137
To date UDAY has been well received by the states that have signed up for it.138 This is encouraging as the states are key stakeholders to the success of UDAY. Figure 7 shows the quarterly rankings for state/DISCOM performance is publicized on the UDAY national dashboard, which encourages state and DISCOM good performance.
7.2.8 Operational Metrics: Reliability As part of a grid modernization initiative in the U.S. State of Illinois, the Illinois Commerce Commission (ICC) adopted a PBR formula rate tariff.139 These tariffs were approved under Illinois’s Energy Infrastructure Modernization Act which authorized $3.2 billion in grid hardening and smart meter investments. The guiding principle of the act and tariff is to achieve increased grid reliability and operational efficiency by offering the utilities increased certainly around capital investments ranging from distribution reclosers, substation improvements, pole reinforcements, undergrounding targeted lines, and vegetation management.140
This Illinois tariff approved formula rates for participating utilities providing greater utility confidence that grid modernization expenses would be found prudent with a set rate of return to be adjusted based on known factors annually. In exchange for this formula rate treatment, participating utilities are required to file multi-year metrics with the ICC to improve performance over a 10-year period, including reliability performance.
After installing grid automation and more intelligent sensors and the range of approved grid hardening and smart grid investments described above, the utilities reported improvements in
137 Government of India, Ministry of Power. (2017). UDAY National Dashboard. Retrieved from: https://www.uday.gov.in/home.php 138 Adebare, A. (2016, January 25). A Closer look at the Ujwal Discom Assurance Yojana Uday Scheme. Mondaq. Retrieved from: http://www.mondaq.com/india/x/460820/Oil+Gas+Electricity/A+Closer+Look+At+The+Ujwal+Discom+Assurance+Yojana+Uday+Scheme 139 Illinois Compiled Statutes. Infrastructure investment and modernization; regulatory reform.220 ILCS 5/16-108.5. 2017. 140 McCabe, A; Ghoshal, O, & Peters B. (2016, May). A Formula for Grid Modernization? Public Utilities Fortnightly. Retrieved from: https://www.fortnightly.com/fortnightly/2016/05/formula-grid-modernization

77
outage frequency and duration.141 But the utilities have failed to meet the 75% improvement performance criteria set by the ICC and been penalized with a 5 basis point reduction in authorized ROE as a result. This reduction of ROE resulted in an approximate $2 million reduction in Commonwealth Edison’s roughly $2.5 billion annual revenue requirement.142 This is a negative incentive scheme which imposes a relatively low penalty reduction in an approved formula rate when reliability criteria are not met.
Setting reliability goals, performance criteria, or metrics can be difficult. It is important not to fall into the “no-amount-of-reliability-is-enough” trap because reliability investments are limitless. The amount of reliability that regulators should require and how to measure it are perennial utility questions: how much reliability should be required or another way to ask the question is how much reliability do customers want to pay for their electricity service? The Canadian Province of Alberta recognized this quandary squarely in its decision rejecting a reward-based PIM for exceeding expected reliability standards:
“. . . in a competitive market, a company may increase its service quality and charge a higher price, but risks losing customers. For monopoly utility companies, there is no risk of losing customers. Customers have no choice but to pay the higher price of service quality levels that they may not want or cannot afford.”143
Norwegian regulators approached the reliability quandary by asking utility customers how much they value reliability using customer surveys to construct a willingness-to-pay curve for different levels of system reliability. The Norwegians then use a PBR scheme to have their utilities internalize the reliability valuation by customers. Norway uses revenue cap regulation to control utility costs. It allows utilities to retain cost savings from operating below approved costs. Because revenue cap regulation can create an incentive to cut costs in ways the impact system reliability, this system adjusts utility revenues each year based on the costs of outages to customers. Thus, if outages increase, utility revenue is reduced, or if outages are reduced below a baseline level, the utility receives higher revenues the next year.144
Under this system, a Norwegian utility seeking to maximize profits will increase expenditures to the point where the marginal cost of increased reliability equals the customers’ willingness to pay (as shown in the customer surveys). The Norwegian reliability PBR is designed to achieve the optimal level of reliability. The optimal reliability level is where marginal utility costs equal marginal customer benefits determined in the customer surveys. Use of the survey instrument to
141 Both utilities, Ameren and Commonwealth Edison report reliability improvments. See Ameren Illinois (2015, June 1). Moderinization Action Plan. Retrieved from: https://www.icc.illinois.gov/downloads/public/edocket/406271.pdf; Commonwealth Edison (2015, April). Multi-Year Performance Metrics. Retrieved from: https://www.icc.illinois.gov/downloads/public/edocket/402546.pdf 142 McCabe, A; Ghoshal, O, & Peters B. (2016, May). A Formula for Grid Modernization? Public Utilities Fortnightly. Retrieved from: https://www.fortnightly.com/fortnightly/2016/05/formula-grid-modernization 143 Whited, M., Woolf, T., and Napoleon, A. (2015). Utility Performance Mechanisms: A Handbook for Regulators. Synapse Energy Economics. Retrieved from: http://www.synapse-energy.com/sites/default/files/Utility%20Performance%20Incentive%20Mechanisms%2014-098_0.pdf, p. 41. 144 Whited, M., Woolf, T., and Napoleon, A. (2015). Utility Performance Mechanisms: A Handbook for Regulators. Synapse Energy Economics. Retrieved from: http://www.synapse-energy.com/sites/default/files/Utility%20Performance%20Incentive%20Mechanisms%2014-098_0.pdf, p. 35.
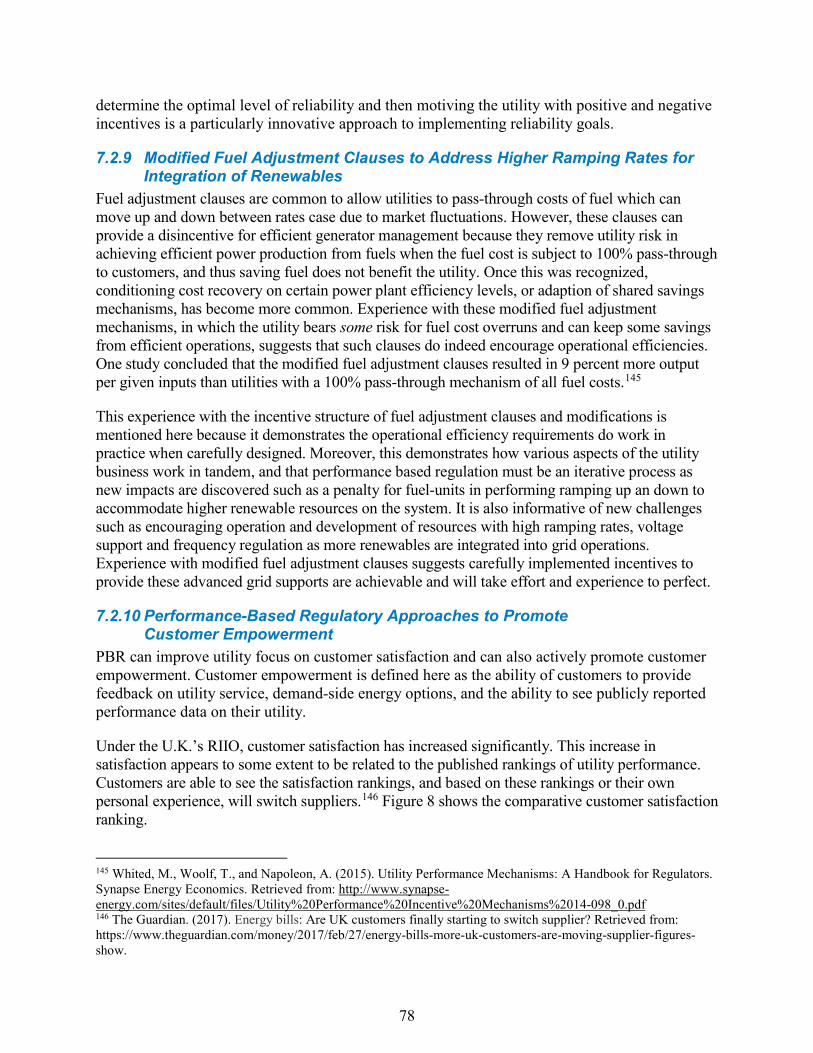
78
determine the optimal level of reliability and then motiving the utility with positive and negative incentives is a particularly innovative approach to implementing reliability goals.
7.2.9 Modified Fuel Adjustment Clauses to Address Higher Ramping Rates for Integration of Renewables
Fuel adjustment clauses are common to allow utilities to pass-through costs of fuel which can move up and down between rates case due to market fluctuations. However, these clauses can provide a disincentive for efficient generator management because they remove utility risk in achieving efficient power production from fuels when the fuel cost is subject to 100% pass-through to customers, and thus saving fuel does not benefit the utility. Once this was recognized, conditioning cost recovery on certain power plant efficiency levels, or adaption of shared savings mechanisms, has become more common. Experience with these modified fuel adjustment mechanisms, in which the utility bears some risk for fuel cost overruns and can keep some savings from efficient operations, suggests that such clauses do indeed encourage operational efficiencies. One study concluded that the modified fuel adjustment clauses resulted in 9 percent more output per given inputs than utilities with a 100% pass-through mechanism of all fuel costs.145
This experience with the incentive structure of fuel adjustment clauses and modifications is mentioned here because it demonstrates the operational efficiency requirements do work in practice when carefully designed. Moreover, this demonstrates how various aspects of the utility business work in tandem, and that performance based regulation must be an iterative process as new impacts are discovered such as a penalty for fuel-units in performing ramping up an down to accommodate higher renewable resources on the system. It is also informative of new challenges such as encouraging operation and development of resources with high ramping rates, voltage support and frequency regulation as more renewables are integrated into grid operations. Experience with modified fuel adjustment clauses suggests carefully implemented incentives to provide these advanced grid supports are achievable and will take effort and experience to perfect.
7.2.10 Performance-Based Regulatory Approaches to Promote Customer Empowerment
PBR can improve utility focus on customer satisfaction and can also actively promote customer empowerment. Customer empowerment is defined here as the ability of customers to provide feedback on utility service, demand-side energy options, and the ability to see publicly reported performance data on their utility.
Under the U.K.’s RIIO, customer satisfaction has increased significantly. This increase in satisfaction appears to some extent to be related to the published rankings of utility performance. Customers are able to see the satisfaction rankings, and based on these rankings or their own personal experience, will switch suppliers.146 Figure 8 shows the comparative customer satisfaction ranking.
145 Whited, M., Woolf, T., and Napoleon, A. (2015). Utility Performance Mechanisms: A Handbook for Regulators. Synapse Energy Economics. Retrieved from: http://www.synapse-energy.com/sites/default/files/Utility%20Performance%20Incentive%20Mechanisms%2014-098_0.pdf 146 The Guardian. (2017). Energy bills: Are UK customers finally starting to switch supplier? Retrieved from: https://www.theguardian.com/money/2017/feb/27/energy-bills-more-uk-customers-are-moving-supplier-figures-show.
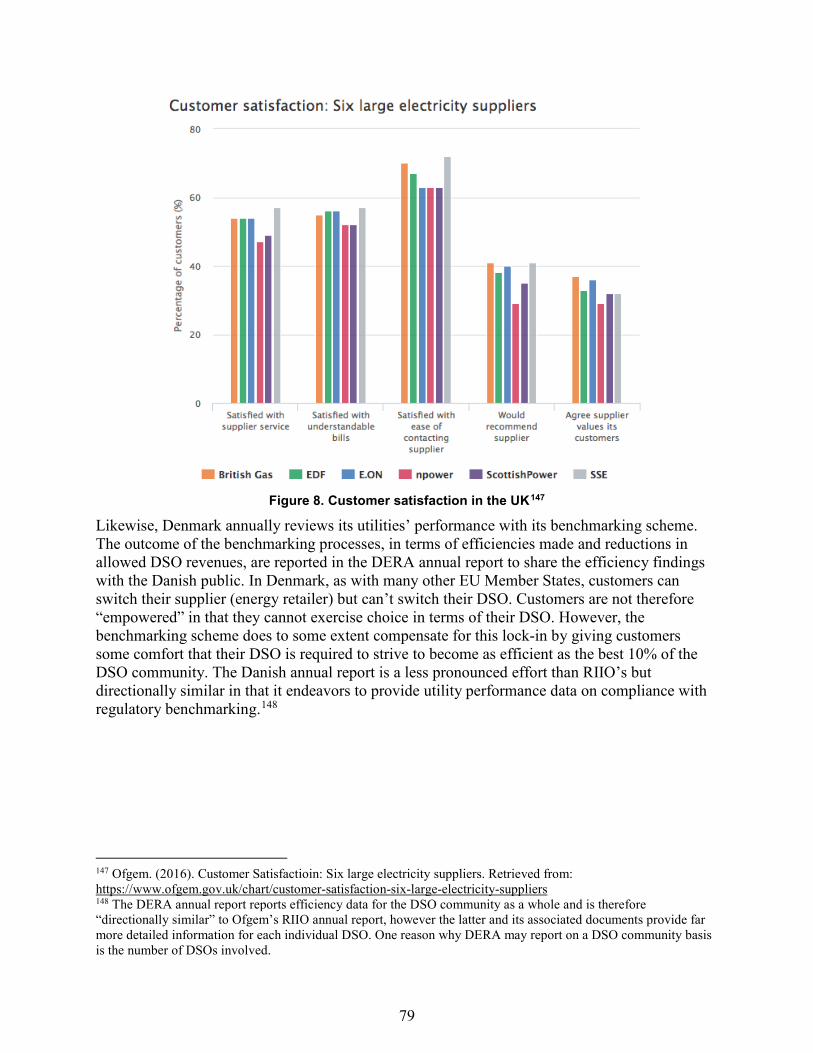
79
Figure 8. Customer satisfaction in the UK147
Likewise, Denmark annually reviews its utilities’ performance with its benchmarking scheme. The outcome of the benchmarking processes, in terms of efficiencies made and reductions in allowed DSO revenues, are reported in the DERA annual report to share the efficiency findings with the Danish public. In Denmark, as with many other EU Member States, customers can switch their supplier (energy retailer) but can’t switch their DSO. Customers are not therefore “empowered” in that they cannot exercise choice in terms of their DSO. However, the benchmarking scheme does to some extent compensate for this lock-in by giving customers some comfort that their DSO is required to strive to become as efficient as the best 10% of the DSO community. The Danish annual report is a less pronounced effort than RIIO’s but directionally similar in that it endeavors to provide utility performance data on compliance with regulatory benchmarking.148
147 Ofgem. (2016). Customer Satisfactioin: Six large electricity suppliers. Retrieved from: https://www.ofgem.gov.uk/chart/customer-satisfaction-six-large-electricity-suppliers 148 The DERA annual report reports efficiency data for the DSO community as a whole and is therefore “directionally similar” to Ofgem’s RIIO annual report, however the latter and its associated documents provide far more detailed information for each individual DSO. One reason why DERA may report on a DSO community basis is the number of DSOs involved.
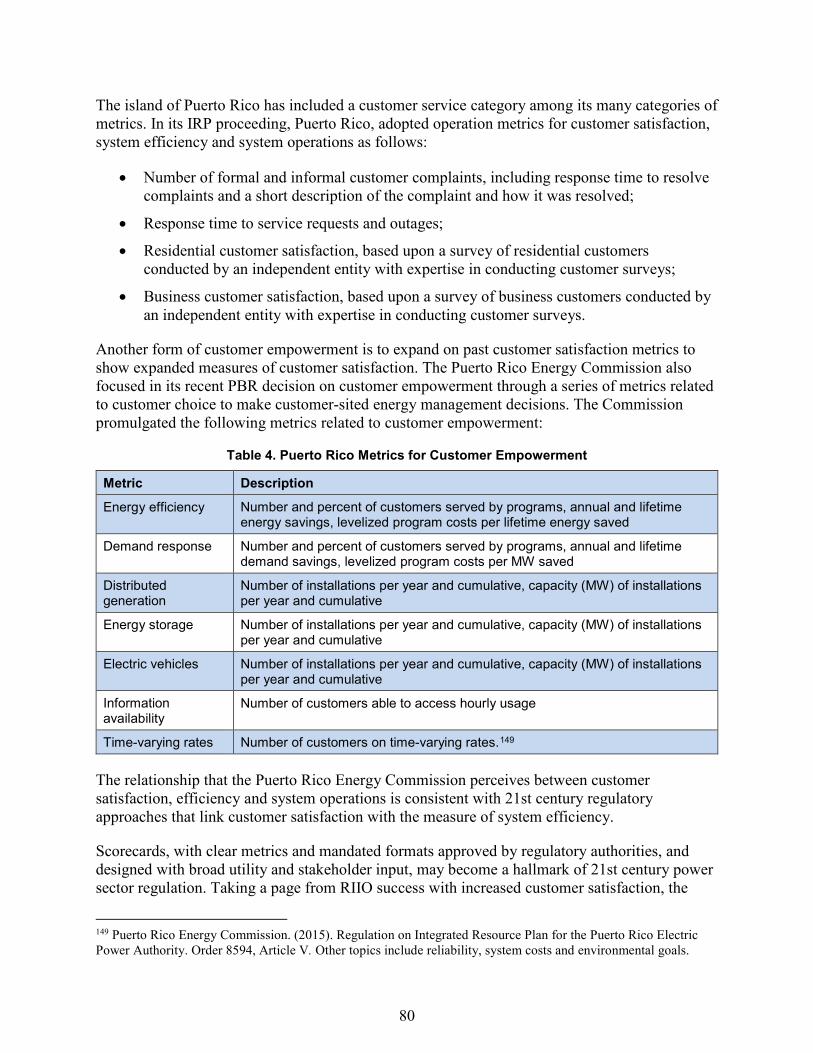
80
The island of Puerto Rico has included a customer service category among its many categories of metrics. In its IRP proceeding, Puerto Rico, adopted operation metrics for customer satisfaction, system efficiency and system operations as follows:
• Number of formal and informal customer complaints, including response time to resolve complaints and a short description of the complaint and how it was resolved;
• Response time to service requests and outages;
• Residential customer satisfaction, based upon a survey of residential customers conducted by an independent entity with expertise in conducting customer surveys;
• Business customer satisfaction, based upon a survey of business customers conducted by an independent entity with expertise in conducting customer surveys.
Another form of customer empowerment is to expand on past customer satisfaction metrics to show expanded measures of customer satisfaction. The Puerto Rico Energy Commission also focused in its recent PBR decision on customer empowerment through a series of metrics related to customer choice to make customer-sited energy management decisions. The Commission promulgated the following metrics related to customer empowerment:
Table 4. Puerto Rico Metrics for Customer Empowerment
Metric Description
Energy efficiency Number and percent of customers served by programs, annual and lifetime energy savings, levelized program costs per lifetime energy saved
Demand response Number and percent of customers served by programs, annual and lifetime demand savings, levelized program costs per MW saved
Distributed generation
Number of installations per year and cumulative, capacity (MW) of installations per year and cumulative
Energy storage Number of installations per year and cumulative, capacity (MW) of installations per year and cumulative
Electric vehicles Number of installations per year and cumulative, capacity (MW) of installations per year and cumulative
Information availability
Number of customers able to access hourly usage
Time-varying rates Number of customers on time-varying rates.149
The relationship that the Puerto Rico Energy Commission perceives between customer satisfaction, efficiency and system operations is consistent with 21st century regulatory approaches that link customer satisfaction with the measure of system efficiency.
Scorecards, with clear metrics and mandated formats approved by regulatory authorities, and designed with broad utility and stakeholder input, may become a hallmark of 21st century power sector regulation. Taking a page from RIIO success with increased customer satisfaction, the
149 Puerto Rico Energy Commission. (2015). Regulation on Integrated Resource Plan for the Puerto Rico Electric Power Authority. Order 8594, Article V. Other topics include reliability, system costs and environmental goals.
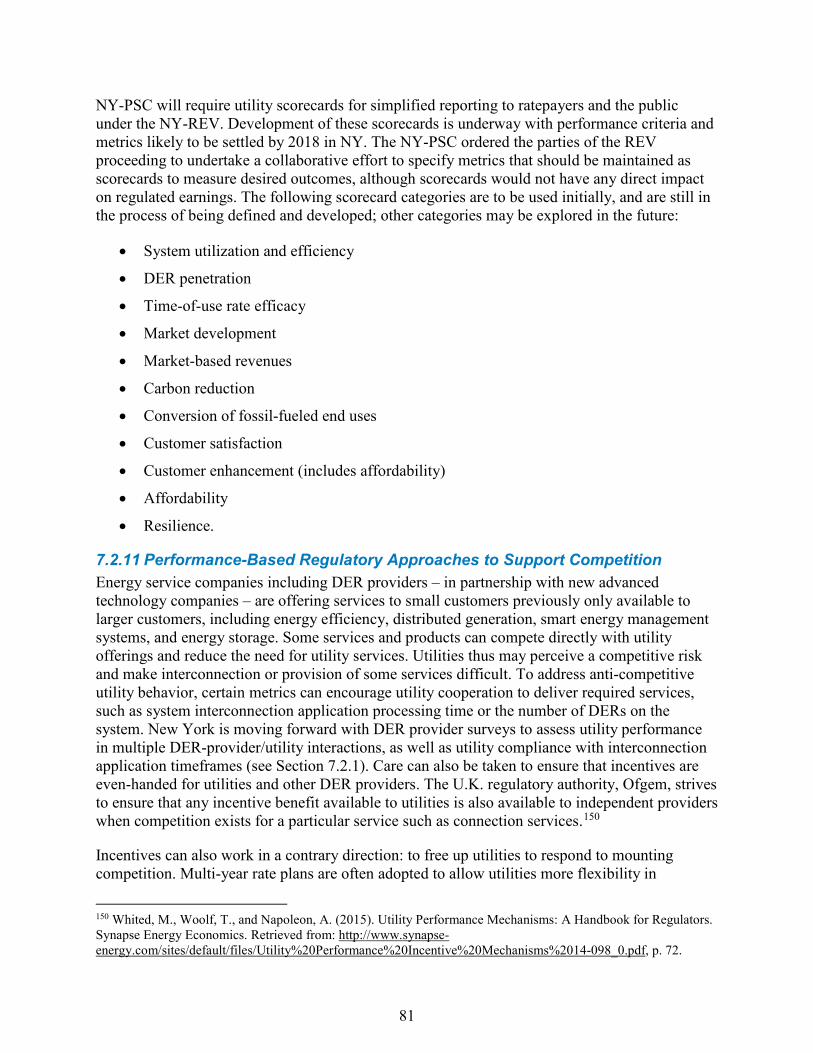
81
NY-PSC will require utility scorecards for simplified reporting to ratepayers and the public under the NY-REV. Development of these scorecards is underway with performance criteria and metrics likely to be settled by 2018 in NY. The NY-PSC ordered the parties of the REV proceeding to undertake a collaborative effort to specify metrics that should be maintained as scorecards to measure desired outcomes, although scorecards would not have any direct impact on regulated earnings. The following scorecard categories are to be used initially, and are still in the process of being defined and developed; other categories may be explored in the future:
• System utilization and efficiency
• DER penetration
• Time-of-use rate efficacy
• Market development
• Market-based revenues
• Carbon reduction
• Conversion of fossil-fueled end uses
• Customer satisfaction
• Customer enhancement (includes affordability)
• Affordability
• Resilience.
7.2.11 Performance-Based Regulatory Approaches to Support Competition Energy service companies including DER providers – in partnership with new advanced technology companies – are offering services to small customers previously only available to larger customers, including energy efficiency, distributed generation, smart energy management systems, and energy storage. Some services and products can compete directly with utility offerings and reduce the need for utility services. Utilities thus may perceive a competitive risk and make interconnection or provision of some services difficult. To address anti-competitive utility behavior, certain metrics can encourage utility cooperation to deliver required services, such as system interconnection application processing time or the number of DERs on the system. New York is moving forward with DER provider surveys to assess utility performance in multiple DER-provider/utility interactions, as well as utility compliance with interconnection application timeframes (see Section 7.2.1). Care can also be taken to ensure that incentives are even-handed for utilities and other DER providers. The U.K. regulatory authority, Ofgem, strives to ensure that any incentive benefit available to utilities is also available to independent providers when competition exists for a particular service such as connection services.150
Incentives can also work in a contrary direction: to free up utilities to respond to mounting competition. Multi-year rate plans are often adopted to allow utilities more flexibility in
150 Whited, M., Woolf, T., and Napoleon, A. (2015). Utility Performance Mechanisms: A Handbook for Regulators. Synapse Energy Economics. Retrieved from: http://www.synapse-energy.com/sites/default/files/Utility%20Performance%20Incentive%20Mechanisms%2014-098_0.pdf, p. 72.
82
marketing when faced with competition and to allow superior utility performance to earn superior returns over a multiple year period. Of course, multi-year plans could encourage anti-competitive behavior as well, if not addressed through other mechanisms such as discussed herein.
7.2.12 Peak Load Reduction Enabled by Demand Response Peak load reduction is a key cost-avoidance opportunity for systems with growing generation, transmission and distribution peaks. If peak load reduction is a policy goal that the jurisdiction seeks to implement, a PBR mechanism that rewards the utility for reducing peak load by a specified means can be designed and implemented. There are many strategies and measures to reduce peak load. One is the use of demand response addressed here. Another is deployment of DERs to reduce peak among other goals for DER deployment addressed above. A third is as a peak reduction system efficiency measure such as pursued under NY REV also addressed above.151
A regulatory decision reached in Illinois in 2013 required a performance metric be developed by Commonwealth Edison to reduce peak load through demand response. This involves load impact reductions measured in MW of peak load reduction from the summer peak due to smart meter enabled demand response programs administered by the utility.152 While these performance metrics do not include any rewards or penalties, they provide valuable information for regulators and stakeholders to monitor whether customers are receiving the full benefit of the multi-billion dollar smart grid infrastructure investment. In addition, these metrics provide valuable information going forward for regulators if it is determined that a financial reward or penalty is warranted.153
7.2.13 Customers Enrolled in Time-Varying Rates Sending an accurate price signal to customers has been an issue in many jurisdictions. Because system costs vary considerably by time of day, and by season for both generating and delivering electricity, the theory is that customers will make more efficient decisions for themselves and the system if they see the relative scarcity or abundance of electricity service reflected in their price. Customers would for instance see that they can save money by running a large appliance on the weekend rather than during the week. However, customers can only adjust their use to reflect pricing and scarcity if the customer’s price accurately reflects the higher cost structure of the generators as well as utility plant during peak hours.154
151 See discussion of NY REV EAM goals for peak reduction in 7.2.1.1 above. 152 Whited, M., Woolf, T., and Napoleon, A. (2015). Utility Performance Mechanisms: A Handbook for Regulators. Synapse Energy Economics. Retrieved from: http://www.synapse-energy.com/sites/default/files/Utility%20Performance%20Incentive%20Mechanisms%2014-098_0.pdf, p. 85-86. 153 Whited, M., Woolf, T., and Napoleon, A. (2015). Utility Performance Mechanisms: A Handbook for Regulators. Synapse Energy Economics. Retrieved from: http://www.synapse-energy.com/sites/default/files/Utility%20Performance%20Incentive%20Mechanisms%2014-098_0.pdf, p. 85-86. 154 It is relatively common for electricity to be priced by peak-hours/intervals where there are wholesale markets for electricity but pricing utility transmission and distribution rates by peak usage (to capture demand on the T&D system) has historically been accomplished with demand charges for larger customers. Now with advanced metering infrastructure, T&D pricing can be done for all customers to approximate demand on the system on intervals as well.
83
For example, a regulatory decision reached in the U.S. state of Illinois in 2013 requires a performance metric be developed by Commonwealth Edison to track customers enrolled in time-varying rates155. This includes at least four different metrics:
1. Number of residential customer on the utility tariff with time-variant or dynamic pricing in each delivery class, and reported as a percentage of customers taking supply from that retail supplier with both numbers and percentage by rate class.
2. Number of residential customers serviced by retail suppliers which have requested monthly data interchange for interval data (meaning the customers accounts will be set up for monthly data transfer of interval usage data) and reported as a percentage of customers taking supply from that retail supplier with both numbers and percentage by rate class.
3 & 4. Then the same two metrics as above for small commercial customers.156
The Illinois reporting metrics illustrate significant interest in Illinois in assuring that customers have accurate pricing signals. Other jurisdictions share this interest as well – for example, Puerto Rico wants its utilities to adopt information availability practices by reporting on the number of customers able to access hourly usage data and the number of customers on time-varying rates.157
7.2.14 PBR for Smart Meter Deployment158 European law requires the “implementation of intelligent metering systems that shall assist the active participation of consumers in the electricity supply market.” France has incorporated this requirement into law and code. In response, the Commission de Regulation de l’energie (CRE) proposed a smart-grid roll out for Électricité Réseau Distribution France (ERDF), one of the distribution system operators in France. The objective of ERDF's project for its low voltage (LV) smart metering system (≤ 36 kVA) is to deploy 35 million smart-meters between the last quarter of 2015 and the end of 2021. The target deployment rate is 90% of all meters. Given the size of the project and the need to guard against any increase in costs or forecasted completion times, a specific regulatory framework has been implemented that gives ERDF incentives to control investment costs, comply with the deployment timetable, and to guarantee performance of the system installed.
The PBR incentive awards ERDF a bonus of 300 basis points to be attributed to assets used in the Linky project between January 1st, 2015 and December 31st, 2021 (excluding those used for
155 Puerto Rico is also looking at reporting metrics of TOU rates. 156 Whited, M., Woolf, T., and Napoleon, A. (2015). Utility Performance Mechanisms: A Handbook for Regulators. Synapse Energy Economics. Retrieved from: http://www.synapse-energy.com/sites/default/files/Utility%20Performance%20Incentive%20Mechanisms%2014-098_0.pdf, p. 85. 157 Puerto Rico Energy Commission. (2015). Regulation on Integrated Resource Plan for the Puerto Rico Electric Power Authority. Order 8594, Article V. Other topics with subtopics include reliability, system costs and environmental goals. 158 Information in this section is from Commission de Régulation de l’Énergie (2014, July 17). Decision determining the incentive-based regulatory framework for ERDF's smart metering system for low voltages (LV) ≤ 36 kVA. English translation. Retrieved from: http://www.cre.fr/en/documents/deliberations/decision/smart-metering-system
84
experimental pilots and standard electronic meters). The bonus is awarded throughout the asset lifetime.
The incentive bonus is comprised of two parts:
• Part one (200 basis points) is calculated based on the performance of ERDF on controlling investment costs and complying with the deployment timetable (points 1 and 2 below);
• Part two (100 basis points) is calculated based on the performance of the smart metering system in meeting the objectives of the project and delivering a high quality of service (point 3 below).
The basis points and incentives for the three components are as follows:
1. Control investment costs: A. ERDF is penalized from the first euro of additional cost because it loses the bonus
of 200 basis points on this additional cost. If the additional costs exceed 5%, any further costs are not remunerated (i.e. no bonus and no base-rate remuneration);
B. From the first euro saved, ERDF keeps a bonus equal in amount to the bonus as it would have been with no saving. Grid users benefit from reduced capital charges (lower depreciation and base-rate remuneration).
2. Comply with the deployment timetable: This incentive focusses on the number of meters that are installed and able to communicate, compared to the forecasted deployment timetable. Monitoring takes place regularly throughout deployment. If the forecasted deployment percentages are not achieved, this generates penalties.
In order to ensure that complying with the deployment timetable does not jeopardize the quality of the installation, the CRE has put in place a financial incentive relating to the percentage of return visits after a Linky meter is installed during the deployment. It will also monitor the percentage of complaints related to deployment.
3. Guarantee the performance level expected from the Linky metering system. The quality of service for the Linky metering system is a key element not only in improving the functioning of the electricity market but also in realizing benefits in terms of technical intervention (estimated at €1.0 billion (2014) at current value) and meter reading (estimated at €0.7 billion (2014) at current value). These benefits are directly proportional to the performance level of the metering system. Poor performance would thus have a significant impact on the economic value of the Linky project.
In this context, the incentive-based regulation mechanism defined by the CRE aims to induce ERDF to reach the performance level necessary to obtain these benefits and improve the functioning of the electricity market, to the benefit of consumers. The CRE thus gives ERDF a bonus of 100 basis points to induce it to maintain a performance level

85
for the metering system that meets expectations over the long term. Conversely, any shortcoming in performance will reduce this bonus.
If the expected performance rates are not reached, penalties are assessed. The metrics prompting penalties are based on poor performance of the following:
• Percentage of successful remote meter readings by day
• Percentage of actual monthly readings published by Ginko4
• Percentage availability of customer internet portal
• Percentage of Linky meters with no remotely-read figures for the last two months
• Percentage of remote services carried out on the day suppliers requested them
• Percentage of meters activated within the defined time following an order for Mobile Peak.
86
Additionally, there is ongoing evaluation of the incentives on the following timescale:
• An annual review of investment costs, with financial incentives (or penalties) if costs drift or are reduced
• A biennial review of compliance with the forecasted deployment timetable, with penalties for late deployment
• A final settlement of the cost and time-scale incentives at the theoretical end of large-scale deployment (i.e. 2021) in order to induce ERDF to make up any delays or cost variances during the large-scale deployment phase; conversely, if ERDF's performance has deteriorated over the deployment period, it will be more heavily penalized.
• An annual review of the system's performance in terms of quality of service delivered from the start of the deployment phase; penalties are payable if the predefined outputs are not achieved.
Utility operating charges affected by the Linky project will be monitored specifically, particularly when the next tariffs are being defined. During each tariff year, the CRE will ensure that the pattern of operating charges presented by ERDF is consistent with the projections both for cost reductions (in reading metering costs, carrying out technical work and reducing line losses) and for the costs of operating the metering system (related mainly to the information systems (IS) and system administration).
87
8 Conclusion As the above examples and text demonstrates, PBR and PIMs have great value for the electric industry in a wide variety of ways, and can be applied to many different situations. However, how exactly PBR mechanisms are most effectively enacted will vary greatly depending upon the utility ownership model, institutional arrangements, and a variety of other local factors.
In many jurisdictions, conventional GENCOs are worried they are losing market share or that they will not be able to pay capital costs of current assets. So what form of incentive regulation would be required for generation owners and which generation owners are necessary to operation a modern grid? Some sort of incentives may be necessary that make certain generation available for services such as ramping to accommodate higher renewable penetrations. Transmission companies may need incentives to build bulk transmission where necessary, while making sure their costs will be recouped regardless of the shifts between distributed and central station generation. Distribution companies need incentives to connect all DER while not losing money from decreased sales volume and revenue. What PBR mechanisms are best for distribution companies? In restructured markets of the 21st century, the 20th century rules of separation and codes of conduct require attention and become more important than ever to align incentives properly and to avoid hidden incentives.
These power sector dynamics and concerns occur as electric utilities are embedded in an increasingly sophisticated technological society. The power sector often represents progress in developing countries. In all cases, they enable achievement of important societal goals. Performance regulation is regulation with which anyone can know how the utilities are delivering on clearly-stated expectations and, in its higher forms, where management is strongly motivated to deliver on public goals as well as internal and fiduciary goals.
Interest in PBR is getting stronger. France just announced a new smart grid related PBR scheme. In the United States, the Rhode Island Public Utility Commission and the Michigan Commission have plans in 2017 to engage stakeholders to consider performance regulation. In Minnesota, the e21 process brought many stakeholders together around performance regulation for the consideration of regulators. Both India and China are trying innovative new ways to use PBR to drive change in state-owned entities.
PBR in the form of cost-cap regulation is proven in multiple jurisdictions to provide cost containment incentives to utilities. There are also examples of poorly designed PBR mechanisms providing debatable benefits. Building on successes and failures of more than two decades of PBR development, leading jurisdictions are now moving to adopt incentives focused on pursuing goals as disparate as peak reductions, power plant efficiency, distributed energy resources integration and interconnection to financial solvency, and smart meter deployments.
As jurisdictions take new approaches and gain experience, refined and successful PBRs approaches will continue to emerge. For jurisdictions adopting and implementing PBR, assessing the incentive level that is “enough” to make a difference in the approach of management, and no more than is necessary to optimize system, consumer, or societal benefits with room for imprecision, can be challenging. Even with no controversy around the guiding and directional incentives, getting the incentive level right takes time, trial and error, and perhaps starting with

88
tracking performance with no incentive to gain experience with reporting and metric tracking initially. Particularly with innovative approaches and new performance criteria and metrics, examining new metrics to assess whether they work and whether they measure the value intended and then improving PBR approaches with incentives that reflect that value is a gradual and smart approach to getting the goals, incentives, performance criteria, and metrics calibrated to reflect the value a PBR scheme is intended to achieve.
With the performance of regulation becoming more multi-faceted along with growth of technology and other diverse public policy considerations, the avenues to more explicitly assess utility performance, and to support innovation, are increasing across multiple jurisdictions.
It is important through this process to distill a narrative on how all customers benefit if a utility receives an incentive for performance. This may involve a description of how all customers and individual customers benefit or are supported by this system. This also may include elucidating the value to stakeholders of augmenting regulatory approaches to reward utility behavior, rather than the tradition cost-of-service model.
Next-generation performance regulation may be a part of the answer to a larger question: what is the role of the next-generation utility? While it is possible to focus just on retooling regulation to better reflect performance, a more fundamental experience may be to reconsider the proper roles for the monopoly utility, including traditional roles like generation and delivery, of course, but also roles associated with "platform services" as described in the NY REV process, or distribution system operator services.159 Just as new technologies confound traditional resource categories and capabilities, the business model utilities have utilized for more than a century will evolve to reflect these changing realities and challenges.
159 Bade, G. (2015, January 28). 6 thought leaders on the future of utility business models & regulation. Utility Dive. Retrieved from: http://www.utilitydive.com/news/6-thought-leaders-on-the-future-of-utility-business-models-regulation/357635/