wind/pv generation for frequency regulation and
TRANSCRIPT
ORNL/TM-2013/587
Wind/PV Generation for Frequency Regulation and Oscillation Damping in the Eastern Interconnection (EI)
December 2013 Prepared by Yong Liu Jose R. Gracia Stanton W. Hadley Yilu Liu

DOCUMENT AVAILABILITY Reports produced after January 1, 1996, are generally available free via US Department of Energy (DOE) SciTech Connect. Website http://www.osti.gov/scitech/ Reports produced before January 1, 1996, may be purchased by members of the public from the following source: National Technical Information Service 5285 Port Royal Road Springfield, VA 22161 Telephone 703-605-6000 (1-800-553-6847) TDD 703-487-4639 Fax 703-605-6900 E-mail [email protected] Website http://www.ntis.gov/support/ordernowabout.htm Reports are available to DOE employees, DOE contractors, Energy Technology Data Exchange representatives, and International Nuclear Information System representatives from the following source: Office of Scientific and Technical Information PO Box 62 Oak Ridge, TN 37831 Telephone 865-576-8401 Fax 865-576-5728 E-mail [email protected] Website http://www.osti.gov/contact.html
This report was prepared as an account of work sponsored by an agency of the United States Government. Neither the United States Government nor any agency thereof, nor any of their employees, makes any warranty, express or implied, or assumes any legal liability or responsibility for the accuracy, completeness, or usefulness of any information, apparatus, product, or process disclosed, or represents that its use would not infringe privately owned rights. Reference herein to any specific commercial product, process, or service by trade name, trademark, manufacturer, or otherwise, does not necessarily constitute or imply its endorsement, recommendation, or favoring by the United States Government or any agency thereof. The views and opinions of authors expressed herein do not necessarily state or reflect those of the United States Government or any agency thereof.
ORNL/TM-2013/587
Electrical and Electronics Systems Research Division
WIND/PV GENERATION FOR FREQUENCY REGULATION AND OSCILLATION DAMPING IN THE EASTERN INTERCONNECTION
Yong Liu Jose R. Gracia
Stanton W. Hadley Yilu Liu
Date Published: December 2013
Prepared by OAK RIDGE NATIONAL LABORATORY Oak Ridge, Tennessee 37831-6283 managed by
UT-BATTELLE, LLC for the
U.S. DEPARTMENT OF ENERGY under contract DE-AC05-00OR22727

iii
CONTENTS
Page
LIST OF FIGURES ...................................................................................................................................... v ACRONYMS .............................................................................................................................................. vii ABSTRACT .................................................................................................................................................. 1 1. INTRODUCTION ................................................................................................................................. 1 2. VARIABLE-SPEED WIND GENERATION CONTROL ................................................................... 3
2.1 FAST ACTIVE POWER CONTROL OF WIND GENERATORS ............................................ 3 2.2 WIND GENERATOR AND POWER SYSTEM MODEL ......................................................... 4
2.2.1 Wind Generator Model ................................................................................................... 4 2.2.2 Power System Model ...................................................................................................... 5 2.2.3 Simulation Scenario Construction .................................................................................. 5
2.3 CONTRIBUTION OF WIND GENERATORS TO FREQUENCY REGULATION ................ 6 2.3.1 Wind Inertia Control ....................................................................................................... 6 2.3.2 Wind Governor Control .................................................................................................. 7 2.3.3 Wind AGC Control ......................................................................................................... 7 2.3.4 Case Study-Generation Trip ........................................................................................... 7 2.3.5 Case Study-Load Shedding........................................................................................... 10 2.3.6 Frequency Regulation Movie Display .......................................................................... 13 2.3.7 Discussion ..................................................................................................................... 13
2.4 CONTRIBTUION OF WIND GENERATORS TO OSCILLATION DAMPING ................... 13 2.4.1 Wind PSS Control ........................................................................................................ 14 2.4.2 Oscillation Damping Using Local Signal ..................................................................... 14 2.4.3 Inter-Area Oscillation Damping Using Wide-Area Signals ......................................... 15 2.4.4 Coordinated Inter-Area Oscillation Damping Using Wide-Area Signal ...................... 16 2.4.5 Inter-Area Oscillation Damping Movie Display .......................................................... 19 2.4.6 Discussion ..................................................................................................................... 19
2.5 SUMMARY .............................................................................................................................. 19 3. PV GENERATION CONTROL.......................................................................................................... 21
3.1 BACKGROUND ....................................................................................................................... 21 3.2 PV GENERATION MODEL .................................................................................................... 21 3.3 CONTRIBUTION OF PV TO FREQUENCY REGULATION ............................................... 22
3.3.1 PV Inertia Control ........................................................................................................ 22 3.3.2 PV Governor Control .................................................................................................... 23 3.3.3 PV AGC Control .......................................................................................................... 23 3.3.4 Case Study-Generation Trip ......................................................................................... 23 3.3.5 Case Study-Load Shedding........................................................................................... 25
3.4 CONTRIBUTION OF PV TO OSCILLATION DAMPING .................................................... 26 3.5 COMPARISON BETWEEN WIND AND PV CONTROL ..................................................... 28
3.5.1 Comparison of Wind and PV Inertia Control ............................................................... 28 3.5.2 Comparison of Wind and PV Governor Control .......................................................... 30 3.5.3 Comparison of Wind and PV AGC Control ................................................................. 31
3.6 CONSTRUCTION OF SIMULATION SCENARIOS WITH HIGH RENEWABLE PENETRATIONS ..................................................................................................................... 33
3.7 SUMMARY .............................................................................................................................. 33 4. CONCLUSIONS ................................................................................................................................. 35 5. REFERENCES .................................................................................................................................... 37

v
LIST OF FIGURES
Figures Page
Fig. 1. Over-speed for variable-speed wind generator. ................................................................................. 4 Fig. 2. Structure of WT3 wind turbine stability model in PSS®E [38]. ....................................................... 5 Fig. 3. Major wind farm locations in the simulated EI system. .................................................................... 6 Fig. 4. Wind inertia control structure. ........................................................................................................... 7 Fig. 5. Wind governor control structure. ....................................................................................................... 7 Fig. 6. Frequency responses of the EI after a generation trip event with different wind generator
controls. ..................................................................................................................................... 8 Fig. 7. Active power outputs of a typical wind farm after a generation trip event with different wind
generator controls. ..................................................................................................................... 9 Fig. 8. Turbine speed deviations of a typical wind farm after a generation trip event with different
wind generator controls. ............................................................................................................ 9 Fig. 9. Reactive power outputs of a typical wind farm after a generation trip event with different
wind generator controls. .......................................................................................................... 10 Fig. 10. Frequency responses of the EI after a load shedding event with different controls. ..................... 11 Fig. 11. Active power outputs of a typical wind farm after a load shedding event with different
controls. ................................................................................................................................... 11 Fig. 12. Turbine speed deviations of a typical wind farm after a load shedding event with different
controls. ................................................................................................................................... 12 Fig. 13. Reactive power outputs of a typical wind farm after a load shedding event with different
controls. ................................................................................................................................... 12 Fig. 14. Movie display of the EI system wind generation control for frequency regulation. ..................... 13 Fig. 15. Wind PSS control structure. .......................................................................................................... 14 Fig. 16. Local frequency response with wind PSS control. ........................................................................ 14 Fig. 17. Active power output with wind PSS control. ................................................................................ 15 Fig. 18. NW-South inter-area oscillation damping using local signals. ...................................................... 15 Fig. 19. NW-South inter-area oscillation damping using wide-area signals. .............................................. 16 Fig. 20. NW-NE inter-area oscillation. ....................................................................................................... 16 Fig. 21. Inter-area oscillation damping using coordinated wide-area wind control. ................................... 17 Fig. 22. Local frequency response and wind generator performance under inter-area oscillation
damping control. ...................................................................................................................... 18 Fig. 23. Movie display of the EI wide-area wind generator control for inter-area oscillation
damping. .................................................................................................................................. 19 Fig. 24. Over-voltage working condition of PV panel. ............................................................................... 21 Fig. 25. PV model connectivity diagram [37]. ............................................................................................ 22 Fig. 26. PV inertia control structure. ........................................................................................................... 23 Fig. 27. PV governor control structure. ...................................................................................................... 23 Fig. 28. Frequency responses of the EI after a generation trip event with different PV generation
controls. ................................................................................................................................... 24 Fig. 29. Active power outputs of a typical PV plant after a generation trip event with different
controls. ................................................................................................................................... 24 Fig. 30. Frequency responses of the EI after a load shedding trip event with different PV generation
controls. ................................................................................................................................... 25 Fig. 31. Active power outputs of a typical PV plant after a load shedding trip event with different
controls. ................................................................................................................................... 26 Fig. 32. Inter-area oscillation damping using coordinated wide-area PV plant control. ............................. 27 Fig. 33. Movie display of the EI wide-area PV plant control for inter-area oscillation damping. .............. 28

vi
Fig. 34. Active power outputs of either wind or PV inertia control. ........................................................... 29 Fig. 35. Frequency response of the EI with either wind or PV inertia control. .......................................... 29 Fig. 36. Active power output of either wind or PV governor control. ........................................................ 30 Fig. 37. Frequency response of the EI with either wind or PV governor control. ...................................... 31 Fig. 38. Active power output of either wind or PV AGC control. .............................................................. 32 Fig. 39. Frequency response of the EI with either wind or PV AGC control. ............................................ 32
vii
ACRONYMS
AGC automatic generation control
DFIG doubly fed induction generator
EI US Eastern Interconnection
FNET/GridEye Frequency Monitoring Network/GridEye
MPPT Maximum Power Point Tracking
NW-NE Northwest-Northeast
NW-South Northwest and South
PMSG permanent-magnet synchronous generator
PSS power system stabilizer
PV photovoltaic

1
ABSTRACT
This report presents the control of renewable energy sources, including the variable-speed wind generators and solar photovoltaic (PV) generators, for frequency regulation and inter-area oscillation damping in the US Eastern Interconnection (EI). In this report, based on the user-defined wind/PV generator electrical control model and the 16,000-bus EI dynamic model, the additional controllers for frequency regulation and inter-area oscillation damping are developed and incorporated. The potential contributions of renewable energy sources to the EI system frequency regulation and inter-area oscillation damping are then evaluated.
1. INTRODUCTION
Today, most of the major power systems around the world are experiencing an increase in wind in their generation mix. This is causing concerns over the stability of the grid and other difficulties in system operation. Though some subjects such as voltage and reactive power control, power quality requirements, and fault ride-through capability have already been carefully examined, some other rising issues still remain to be addressed. For example, conventional synchronous generators play a pivotal role in primary frequency control and all other frequency regulations; however, because of the absence of synchronization torque for variable-speed wind generators, a higher penetration of wind generation might continuously lead to the decrease of overall system inertia as well as the reduction of frequency regulation capabilities [1-5]. Another serious issue is the inter-area oscillation. Many studies have repeatedly shown that replacing conventional generation with doubly fed induction generator (DFIG)-based wind farms has a significant negative effect on the damping of inter-area modes [6-9]. Moreover, for the Eastern Interconnection (EI), the majority of existing and future wind generators are located in the northwestern part of the system, which is far from the load centers in the northeast. Thus, new transmission lines might be necessary to transmit wind energy from western generation centers to eastern load centers, which may introduce new, poorly damped inter-area modes, as well as influence the damping of existing ones.
However, thanks to the development of modern power electronics technology, the answer to the aforementioned problems wind generation causes could lie in wind generation itself. Though the steady-state active power delivered to the grid depends solely on the mechanical energy transferred from the wind turbines, the electrical power of variable-speed wind generators can be effectively controlled by modern electronics converters in a fast manner. As a result, wind generators have significant control capabilities to engage in bulk power system frequency regulation and oscillation damping, especially when the wind penetration is considerably high.
Solar photovoltaic (PV) generation is another important category of renewable energy sources. Originally limited by the low efficiency of silicon solar cells, the capacity of PV systems remained as low as the kilowatt level until quite recently and could only be treated as distributed generation in the local micro-grids [10-14]. However, because of the dramatic enhancement of silicon solar cell technology in recent years, the capacity of a single PV plant can now finally reach the 100 MW-level [15], and thus PV generation is widely expected to be able to reach a high penetration in the future generation mix. In fact, PV generation is gradually approaching electric power market prices and their penetration has been steadily increasing. Especially considering that the amount of solar energy reaching the Earth is more than 10,000 times the current global energy consumption, solar energy has been considered by some people as the ultimate solution to the energy problem.
Similar to variable-speed wind generators, maximum power point tracking (MPPT) operation of PV generation has also been extensively studied by academia to realize the maximum power extraction from PV panels [16-20]. However, under MPPT operation mode PV generation does not participate in any

2
frequency regulation or oscillation damping service for the bulk power grid since the panels’ production is maximized and not coordinated with the grid. With increasing penetration, it could be beneficial to modify PV operations to include it in frequency support and small-signal stability control for bulk power systems.
In this report, fast active power control techniques of wind/PV generators will be discussed, and the application of those controls to the EI system frequency regulation and oscillation damping will be introduced. Chapter 2 investigates the control of variable-speed wind generators, while Chapter 3 focuses on the PV generator control. A summary of the whole report is given in Chapter 4.
3
2. VARIABLE-SPEED WIND GENERATION CONTROL
2.1 FAST ACTIVE POWER CONTROL OF WIND GENERATORS
Variable-speed wind generators mainly refer to permanent-magnet synchronous generators (PMSGs) and DFIGs. A PMSG contains a multi-pole magnetic rotor and a back-to-back AC/DC/AC converter attached to the stator. The energy is transmitted through the converter from the stator to the grid, and, consequently, the generator is fully decoupled from the grid. DFIGs are more common, with rotors connected to the power system through converters that provide AC excitation current, and stators connected directly to the power system for delivery of generated power. During normal conditions, power electronics converters enable the variable-speed wind generators to capture wind energy over a wide range of wind speeds to their maximum extent (MPPT operation), improve power quality, and regulate both active and reactive power.
During transient conditions, additional controllers could be installed on the converters or pitch controllers to achieve fast active power controls [21-28]. In some studies, variable-speed wind generators could transiently support system frequency by implementing kinetic energy-based active power control techniques such as “hidden” inertia emulation, fast power reserve emulation, inertia droop control, etc. These techniques enable wind generators to provide an “artificial” inertial response that behaves in a manner similar to conventional generators [28]. This type of control uses the kinetic energy stored in wind turbines to inject more active power into the power grid within seconds. The active power output is only increased temporally, thus the normal operating point of wind generators remains unchanged. General Electric ® offers a commercial inertia droop control, known as WindINERTIA® based on this concept [29]. Besides the inertial response, the function of power system stabilizers (PSS) in conventional generators could also be emulated by using a kinetic energy-based active power control technique [30-37]. In this manner, variable-speed wind generators could also contribute to the power system small-signal stability. It should be noted that the sustained loss of kinetic energy would cause the rotational speed of a wind turbine to decrease and the turbine to stall if the rotational speed falls too low. Consequently, appropriate limits need to be imposed to avoid removing too much the kinetic energy.
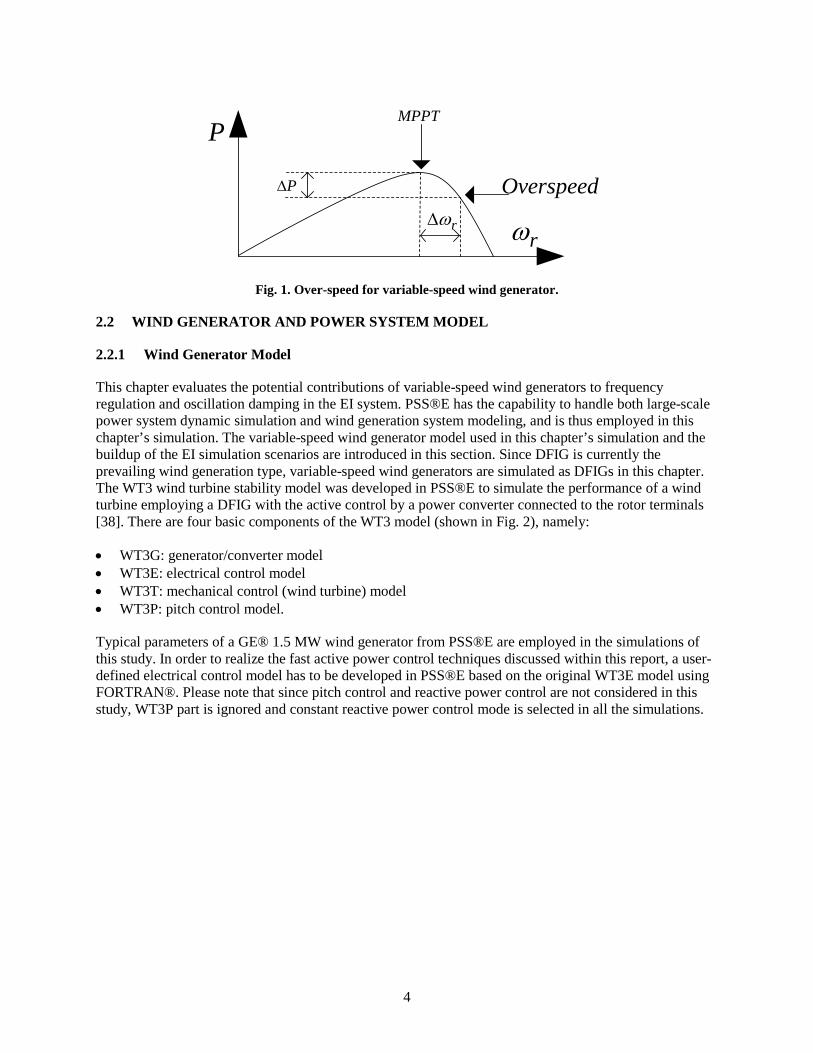
As discussed previously, normally wind generation works on the MPPT curve to use wind power to the fullest extent, since wind energy is both environmentally friendly and low cost. However, if wind turbines operate over de-loading curves rather than MPPT then some of the available power can be saved and used as reserve by pitch control or by increasing the rotational speed from the MPPT value (usually referred to as over-speeding, shown in Fig. 1). These mechanical control techniques could be implemented to enable wind generators to emulate the frequency droop characteristics (“governor response”) of conventional generators. However, the time constant of pitch control is relatively large for these control techniques when implemented in practice, and frequent adjustment of pitch blades could radically reduce their lifetime. So pitch control is neither practical nor economical for fast active power control purposes. Conversely, rotational speed control is provided by the power electronics converter, thus it could act in a considerably fast manner, which makes possible the use of power reserve saved by over-speeding to balance the instantaneous power consumption and provide support for the long-term frequency regulation [21]. Furthermore, wind generation could also perform automatic generation control (AGC) regulation as effectively as conventional generation if reserves exist with the help of fast active power control. However, there does not appear to be any research at this point on the topic of wind generation performing AGC.
In summary, by implementing fast active power control techniques, variable-speed wind generators could emulate the inertial and governor response characteristics of conventional generators to provide frequency regulation service and PSS function to contribute to small-signal stability in bulk power systems.
4
P∆
P
rω
MPPT
rω∆
Overspeed
Fig. 1. Over-speed for variable-speed wind generator.
2.2 WIND GENERATOR AND POWER SYSTEM MODEL
2.2.1 Wind Generator Model
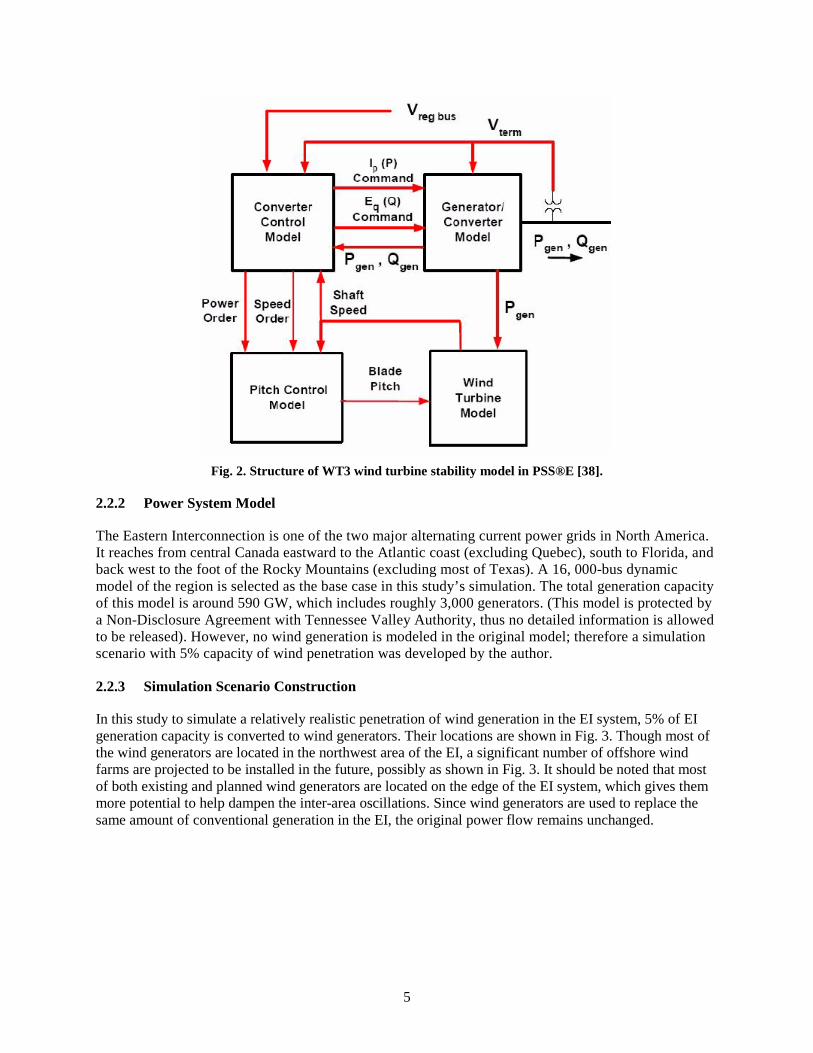
This chapter evaluates the potential contributions of variable-speed wind generators to frequency regulation and oscillation damping in the EI system. PSS®E has the capability to handle both large-scale power system dynamic simulation and wind generation system modeling, and is thus employed in this chapter’s simulation. The variable-speed wind generator model used in this chapter’s simulation and the buildup of the EI simulation scenarios are introduced in this section. Since DFIG is currently the prevailing wind generation type, variable-speed wind generators are simulated as DFIGs in this chapter. The WT3 wind turbine stability model was developed in PSS®E to simulate the performance of a wind turbine employing a DFIG with the active control by a power converter connected to the rotor terminals [38]. There are four basic components of the WT3 model (shown in Fig. 2), namely:
• WT3G: generator/converter model • WT3E: electrical control model • WT3T: mechanical control (wind turbine) model • WT3P: pitch control model.
Typical parameters of a GE® 1.5 MW wind generator from PSS®E are employed in the simulations of this study. In order to realize the fast active power control techniques discussed within this report, a user-defined electrical control model has to be developed in PSS®E based on the original WT3E model using FORTRAN®. Please note that since pitch control and reactive power control are not considered in this study, WT3P part is ignored and constant reactive power control mode is selected in all the simulations.
5
Fig. 2. Structure of WT3 wind turbine stability model in PSS®E [38].
2.2.2 Power System Model
The Eastern Interconnection is one of the two major alternating current power grids in North America. It reaches from central Canada eastward to the Atlantic coast (excluding Quebec), south to Florida, and back west to the foot of the Rocky Mountains (excluding most of Texas). A 16, 000-bus dynamic model of the region is selected as the base case in this study’s simulation. The total generation capacity of this model is around 590 GW, which includes roughly 3,000 generators. (This model is protected by a Non-Disclosure Agreement with Tennessee Valley Authority, thus no detailed information is allowed to be released). However, no wind generation is modeled in the original model; therefore a simulation scenario with 5% capacity of wind penetration was developed by the author.
2.2.3 Simulation Scenario Construction
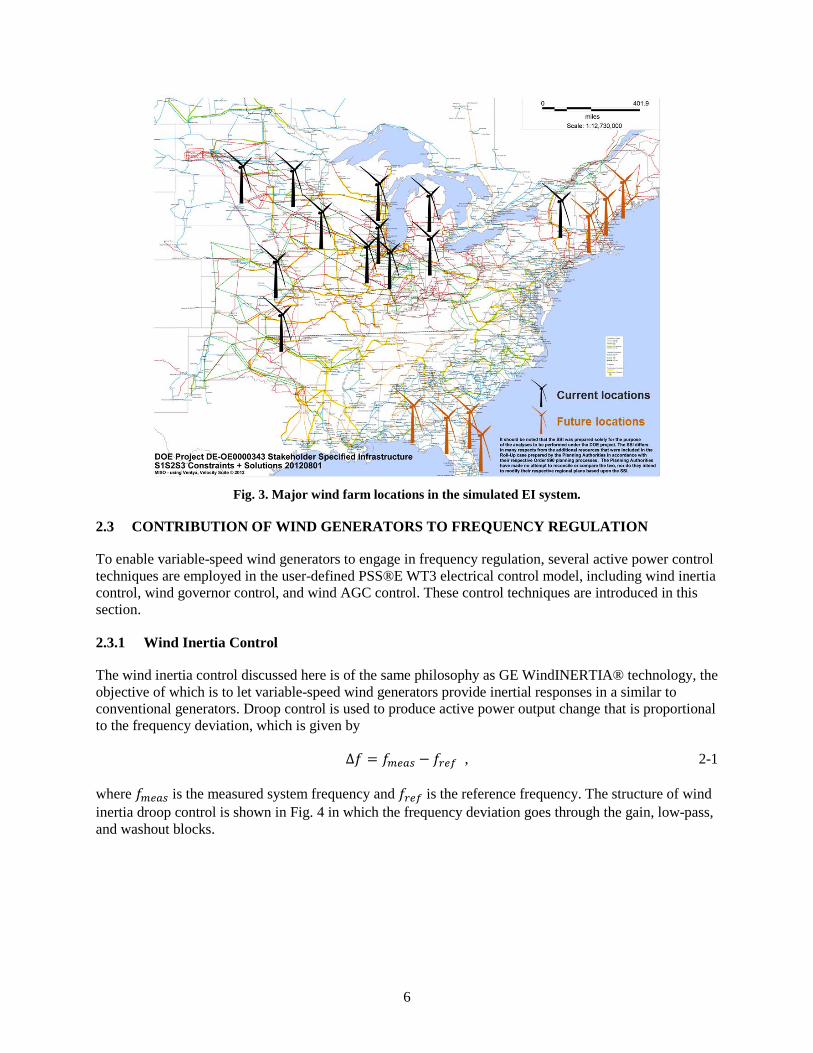
In this study to simulate a relatively realistic penetration of wind generation in the EI system, 5% of EI generation capacity is converted to wind generators. Their locations are shown in Fig. 3. Though most of the wind generators are located in the northwest area of the EI, a significant number of offshore wind farms are projected to be installed in the future, possibly as shown in Fig. 3. It should be noted that most of both existing and planned wind generators are located on the edge of the EI system, which gives them more potential to help dampen the inter-area oscillations. Since wind generators are used to replace the same amount of conventional generation in the EI, the original power flow remains unchanged.
6
Fig. 3. Major wind farm locations in the simulated EI system.
2.3 CONTRIBUTION OF WIND GENERATORS TO FREQUENCY REGULATION
To enable variable-speed wind generators to engage in frequency regulation, several active power control techniques are employed in the user-defined PSS®E WT3 electrical control model, including wind inertia control, wind governor control, and wind AGC control. These control techniques are introduced in this section.
2.3.1 Wind Inertia Control
The wind inertia control discussed here is of the same philosophy as GE WindINERTIA® technology, the objective of which is to let variable-speed wind generators provide inertial responses in a similar to conventional generators. Droop control is used to produce active power output change that is proportional to the frequency deviation, which is given by
∆𝑓 = 𝑓𝑚𝑒𝑎𝑠 − 𝑓𝑟𝑒𝑓 , 2-1
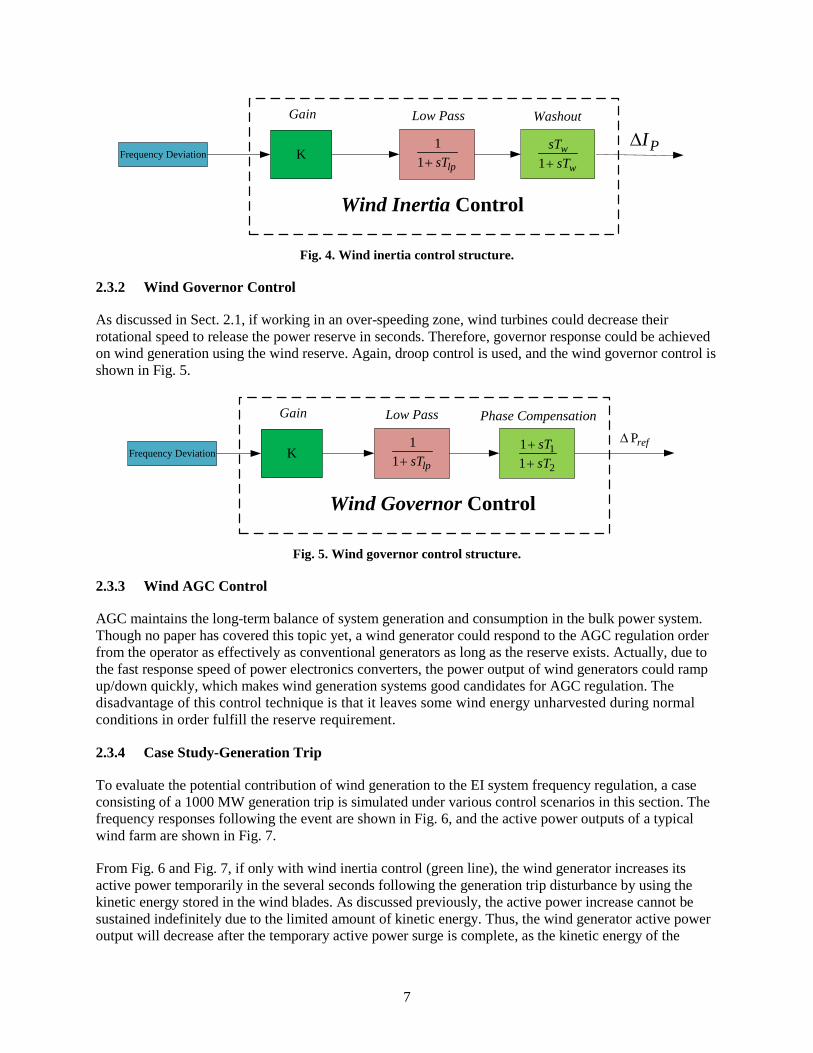
where 𝑓𝑚𝑒𝑎𝑠 is the measured system frequency and 𝑓𝑟𝑒𝑓 is the reference frequency. The structure of wind inertia droop control is shown in Fig. 4 in which the frequency deviation goes through the gain, low-pass, and washout blocks.
7
Wind Inertia Control
K
Gain WashoutLow Pass
11 lpsT+ 1
w
w
sTsT+
Frequency DeviationPI∆
Fig. 4. Wind inertia control structure.
2.3.2 Wind Governor Control
As discussed in Sect. 2.1, if working in an over-speeding zone, wind turbines could decrease their rotational speed to release the power reserve in seconds. Therefore, governor response could be achieved on wind generation using the wind reserve. Again, droop control is used, and the wind governor control is shown in Fig. 5.
Wind Governor Control
K
Gain Low Pass
11 lpsT+
Frequency DeviationPref∆
Phase Compensation
1
2
11
sTsT
++
Fig. 5. Wind governor control structure.
2.3.3 Wind AGC Control
AGC maintains the long-term balance of system generation and consumption in the bulk power system. Though no paper has covered this topic yet, a wind generator could respond to the AGC regulation order from the operator as effectively as conventional generators as long as the reserve exists. Actually, due to the fast response speed of power electronics converters, the power output of wind generators could ramp up/down quickly, which makes wind generation systems good candidates for AGC regulation. The disadvantage of this control technique is that it leaves some wind energy unharvested during normal conditions in order fulfill the reserve requirement.
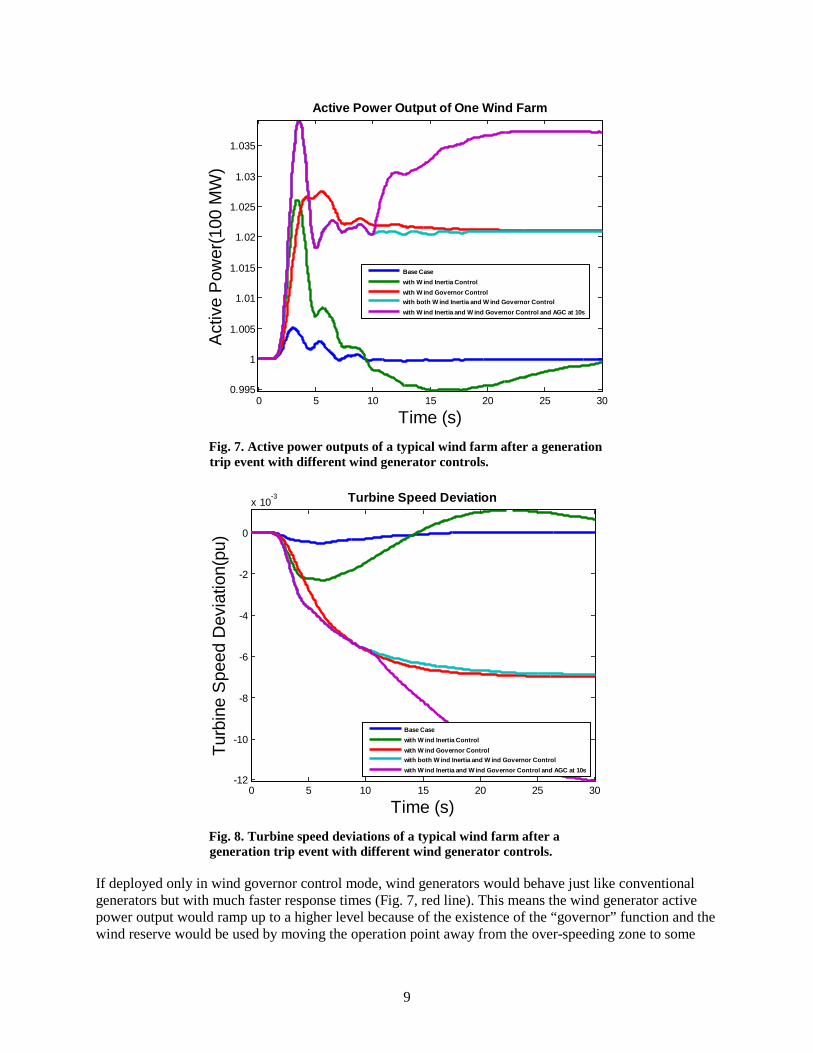
2.3.4 Case Study-Generation Trip
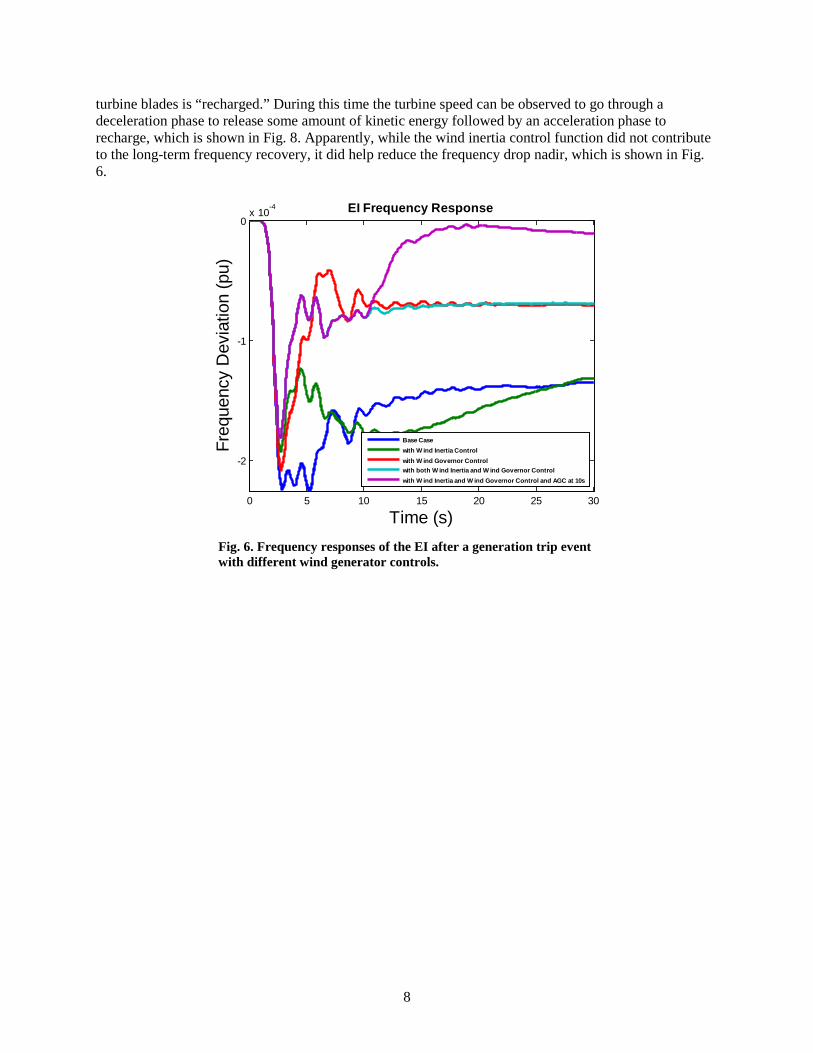
To evaluate the potential contribution of wind generation to the EI system frequency regulation, a case consisting of a 1000 MW generation trip is simulated under various control scenarios in this section. The frequency responses following the event are shown in Fig. 6, and the active power outputs of a typical wind farm are shown in Fig. 7.
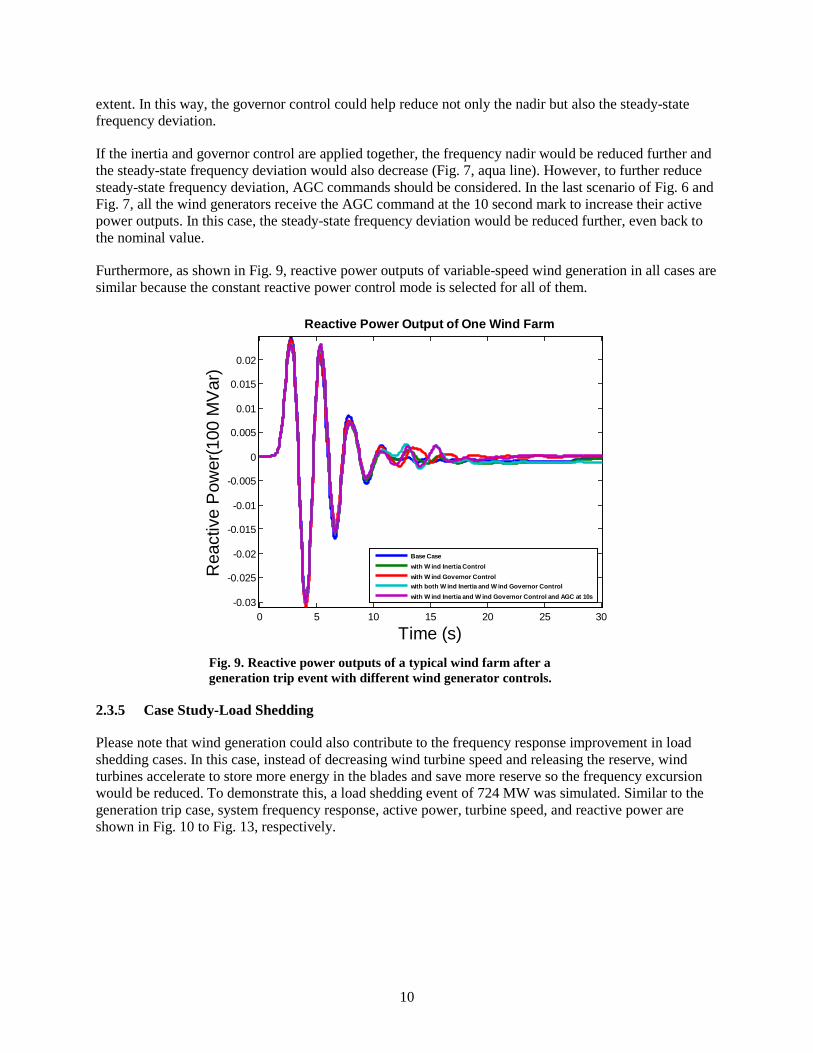
From Fig. 6 and Fig. 7, if only with wind inertia control (green line), the wind generator increases its active power temporarily in the several seconds following the generation trip disturbance by using the kinetic energy stored in the wind blades. As discussed previously, the active power increase cannot be sustained indefinitely due to the limited amount of kinetic energy. Thus, the wind generator active power output will decrease after the temporary active power surge is complete, as the kinetic energy of the
8
turbine blades is “recharged.” During this time the turbine speed can be observed to go through a deceleration phase to release some amount of kinetic energy followed by an acceleration phase to recharge, which is shown in Fig. 8. Apparently, while the wind inertia control function did not contribute to the long-term frequency recovery, it did help reduce the frequency drop nadir, which is shown in Fig. 6.
Fig. 6. Frequency responses of the EI after a generation trip event with different wind generator controls.
0 5 10 15 20 25 30
-2
-1
0x 10
-4 EI Frequency Response
Time (s)
Freq
uenc
y D
evia
tion
(pu)
Base Casewith W ind Inertia Controlwith W ind Governor Controlwith both W ind Inertia and W ind Governor Controlwith W ind Inertia and W ind Governor Control and AGC at 10s
9
Fig. 7. Active power outputs of a typical wind farm after a generation trip event with different wind generator controls.
Fig. 8. Turbine speed deviations of a typical wind farm after a generation trip event with different wind generator controls.
If deployed only in wind governor control mode, wind generators would behave just like conventional generators but with much faster response times (Fig. 7, red line). This means the wind generator active power output would ramp up to a higher level because of the existence of the “governor” function and the wind reserve would be used by moving the operation point away from the over-speeding zone to some
0 5 10 15 20 25 300.995
1
1.005
1.01
1.015
1.02
1.025
1.03
1.035
Active Power Output of One Wind Farm
Time (s)
Act
ive
Pow
er(1
00 M
W)
Base Casewith W ind Inertia Controlwith W ind Governor Controlwith both W ind Inertia and W ind Governor Controlwith W ind Inertia and W ind Governor Control and AGC at 10s
0 5 10 15 20 25 30-12
-10
-8
-6
-4
-2
0
x 10-3 Turbine Speed Deviation
Time (s)
Turb
ine
Spe
ed D
evia
tion(
pu)
Base Casewith W ind Inertia Controlwith W ind Governor Controlwith both W ind Inertia and W ind Governor Controlwith W ind Inertia and W ind Governor Control and AGC at 10s
10
extent. In this way, the governor control could help reduce not only the nadir but also the steady-state frequency deviation.
If the inertia and governor control are applied together, the frequency nadir would be reduced further and the steady-state frequency deviation would also decrease (Fig. 7, aqua line). However, to further reduce steady-state frequency deviation, AGC commands should be considered. In the last scenario of Fig. 6 and Fig. 7, all the wind generators receive the AGC command at the 10 second mark to increase their active power outputs. In this case, the steady-state frequency deviation would be reduced further, even back to the nominal value.
Furthermore, as shown in Fig. 9, reactive power outputs of variable-speed wind generation in all cases are similar because the constant reactive power control mode is selected for all of them.
Fig. 9. Reactive power outputs of a typical wind farm after a generation trip event with different wind generator controls.
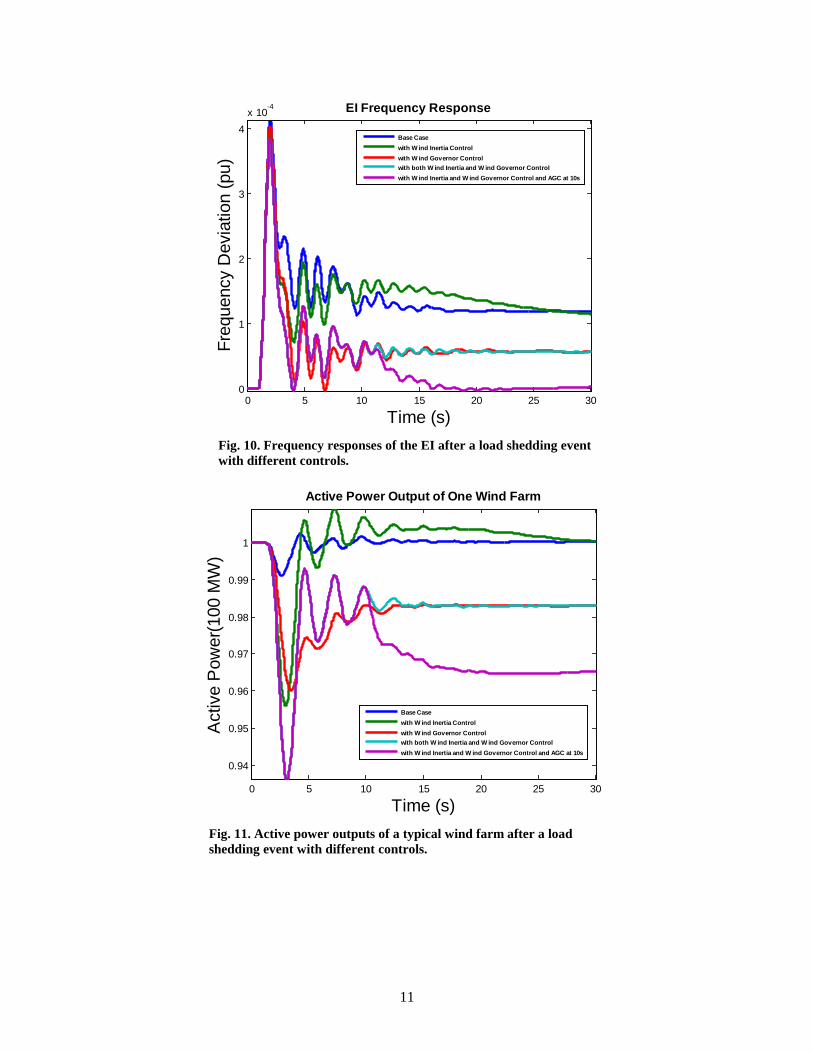
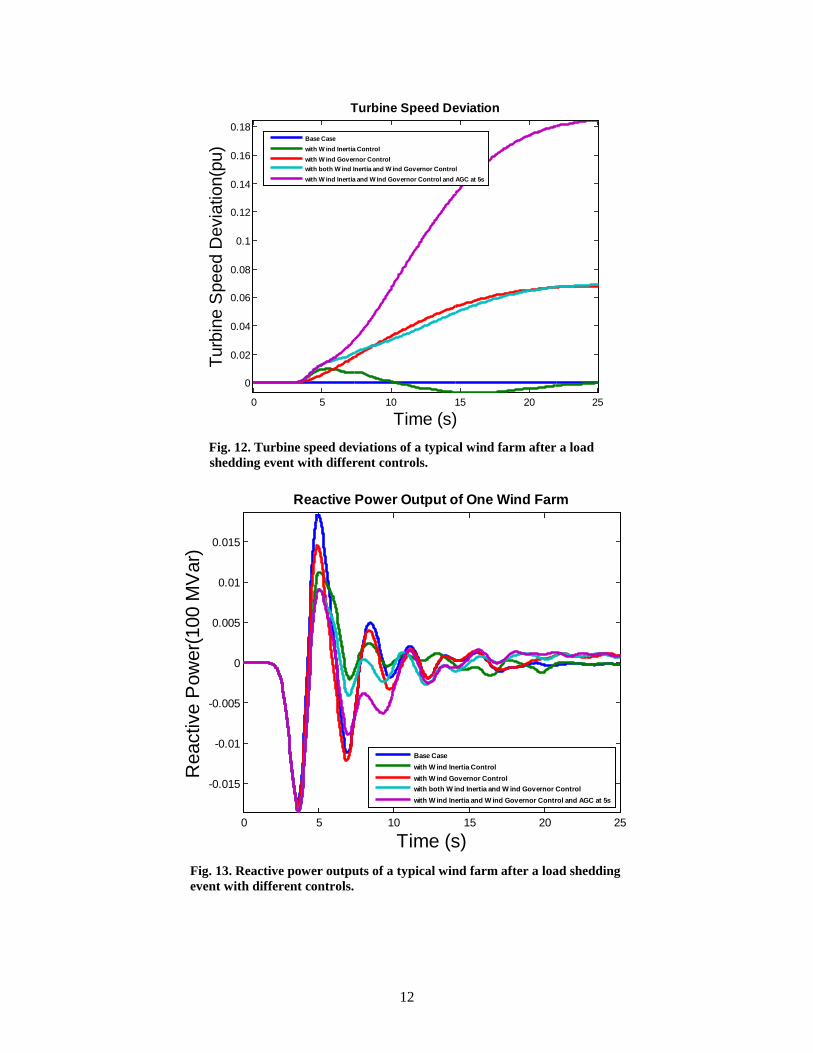
2.3.5 Case Study-Load Shedding
Please note that wind generation could also contribute to the frequency response improvement in load shedding cases. In this case, instead of decreasing wind turbine speed and releasing the reserve, wind turbines accelerate to store more energy in the blades and save more reserve so the frequency excursion would be reduced. To demonstrate this, a load shedding event of 724 MW was simulated. Similar to the generation trip case, system frequency response, active power, turbine speed, and reactive power are shown in Fig. 10 to Fig. 13, respectively.
0 5 10 15 20 25 30-0.03
-0.025
-0.02
-0.015
-0.01
-0.005
0
0.005
0.01
0.015
0.02
Reactive Power Output of One Wind Farm
Time (s)
Rea
ctiv
e P
ower
(100
MV
ar)
Base Casewith W ind Inertia Controlwith W ind Governor Controlwith both W ind Inertia and W ind Governor Controlwith W ind Inertia and W ind Governor Control and AGC at 10s
11
Fig. 10. Frequency responses of the EI after a load shedding event with different controls.
Fig. 11. Active power outputs of a typical wind farm after a load shedding event with different controls.
0 5 10 15 20 25 300
1
2
3
4x 10
-4 EI Frequency Response
Time (s)
Freq
uenc
y D
evia
tion
(pu)
Base Casewith W ind Inertia Controlwith W ind Governor Controlwith both W ind Inertia and W ind Governor Controlwith W ind Inertia and W ind Governor Control and AGC at 10s
0 5 10 15 20 25 30
0.94
0.95
0.96
0.97
0.98
0.99
1
Active Power Output of One Wind Farm
Time (s)
Act
ive
Pow
er(1
00 M
W)
Base Casewith W ind Inertia Controlwith W ind Governor Controlwith both W ind Inertia and W ind Governor Controlwith W ind Inertia and W ind Governor Control and AGC at 10s
12
Fig. 12. Turbine speed deviations of a typical wind farm after a load shedding event with different controls.
Fig. 13. Reactive power outputs of a typical wind farm after a load shedding event with different controls.
0 5 10 15 20 25
0
0.02
0.04
0.06
0.08
0.1
0.12
0.14
0.16
0.18
Turbine Speed Deviation
Time (s)
Turb
ine
Spe
ed D
evia
tion(
pu)
Base Casewith W ind Inertia Controlwith W ind Governor Controlwith both W ind Inertia and W ind Governor Controlwith W ind Inertia and W ind Governor Control and AGC at 5s
0 5 10 15 20 25
-0.015
-0.01
-0.005
0
0.005
0.01
0.015
Reactive Power Output of One Wind Farm
Time (s)
Rea
ctiv
e P
ower
(100
MV
ar)
Base Casewith W ind Inertia Controlwith W ind Governor Controlwith both W ind Inertia and W ind Governor Controlwith W ind Inertia and W ind Governor Control and AGC at 5s
13
2.3.6 Frequency Regulation Movie Display
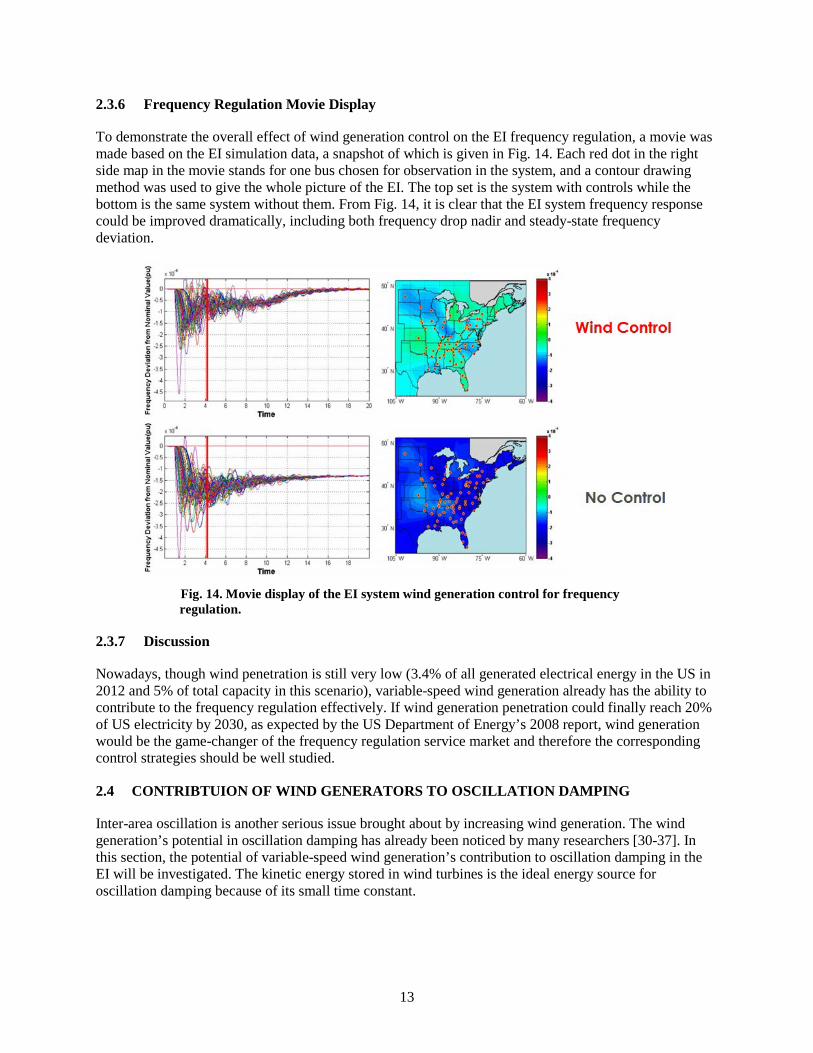
To demonstrate the overall effect of wind generation control on the EI frequency regulation, a movie was made based on the EI simulation data, a snapshot of which is given in Fig. 14. Each red dot in the right side map in the movie stands for one bus chosen for observation in the system, and a contour drawing method was used to give the whole picture of the EI. The top set is the system with controls while the bottom is the same system without them. From Fig. 14, it is clear that the EI system frequency response could be improved dramatically, including both frequency drop nadir and steady-state frequency deviation.
Fig. 14. Movie display of the EI system wind generation control for frequency regulation.
2.3.7 Discussion
Nowadays, though wind penetration is still very low (3.4% of all generated electrical energy in the US in 2012 and 5% of total capacity in this scenario), variable-speed wind generation already has the ability to contribute to the frequency regulation effectively. If wind generation penetration could finally reach 20% of US electricity by 2030, as expected by the US Department of Energy’s 2008 report, wind generation would be the game-changer of the frequency regulation service market and therefore the corresponding control strategies should be well studied.
2.4 CONTRIBTUION OF WIND GENERATORS TO OSCILLATION DAMPING
Inter-area oscillation is another serious issue brought about by increasing wind generation. The wind generation’s potential in oscillation damping has already been noticed by many researchers [30-37]. In this section, the potential of variable-speed wind generation’s contribution to oscillation damping in the EI will be investigated. The kinetic energy stored in wind turbines is the ideal energy source for oscillation damping because of its small time constant.
14
2.4.1 Wind PSS Control
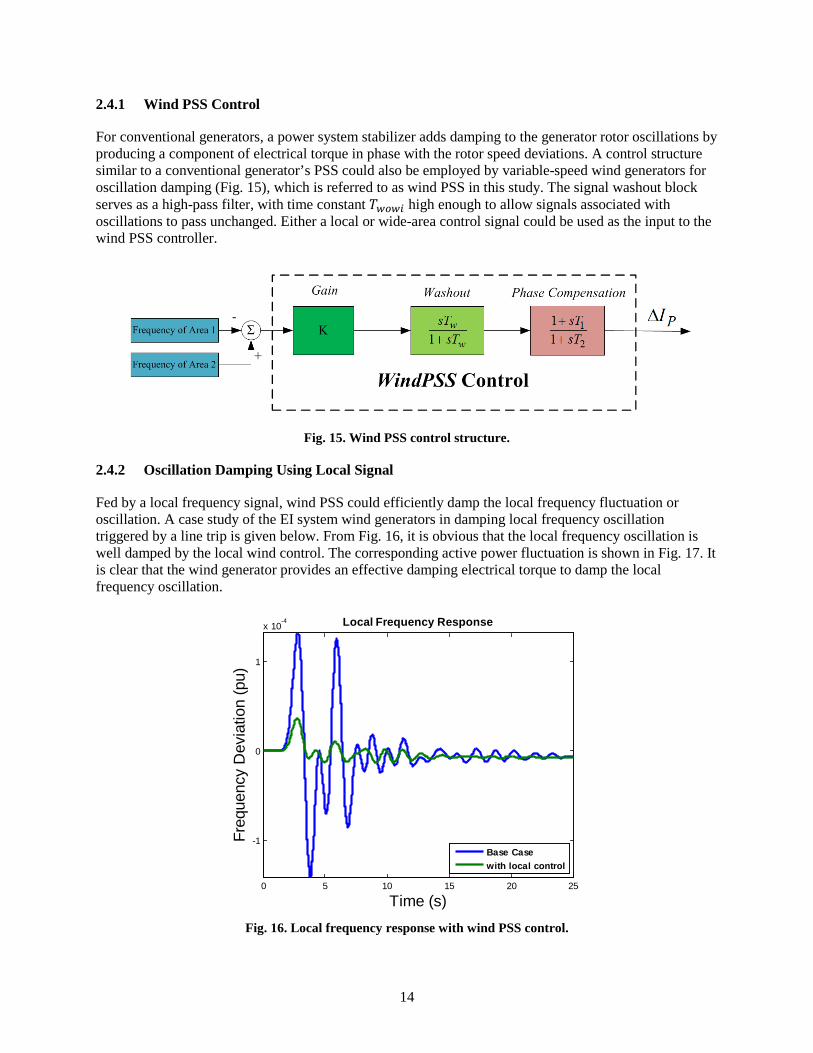
For conventional generators, a power system stabilizer adds damping to the generator rotor oscillations by producing a component of electrical torque in phase with the rotor speed deviations. A control structure similar to a conventional generator’s PSS could also be employed by variable-speed wind generators for oscillation damping (Fig. 15), which is referred to as wind PSS in this study. The signal washout block serves as a high-pass filter, with time constant 𝑇𝑤𝑜𝑤𝑖 high enough to allow signals associated with oscillations to pass unchanged. Either a local or wide-area control signal could be used as the input to the wind PSS controller.
Fig. 15. Wind PSS control structure.
2.4.2 Oscillation Damping Using Local Signal
Fed by a local frequency signal, wind PSS could efficiently damp the local frequency fluctuation or oscillation. A case study of the EI system wind generators in damping local frequency oscillation triggered by a line trip is given below. From Fig. 16, it is obvious that the local frequency oscillation is well damped by the local wind control. The corresponding active power fluctuation is shown in Fig. 17. It is clear that the wind generator provides an effective damping electrical torque to damp the local frequency oscillation.
Fig. 16. Local frequency response with wind PSS control.
0 5 10 15 20 25
-1
0
1
x 10-4 Local Frequency Response
Time (s)
Freq
uenc
y D
evia
tion
(pu)
Base Casewith local control
15
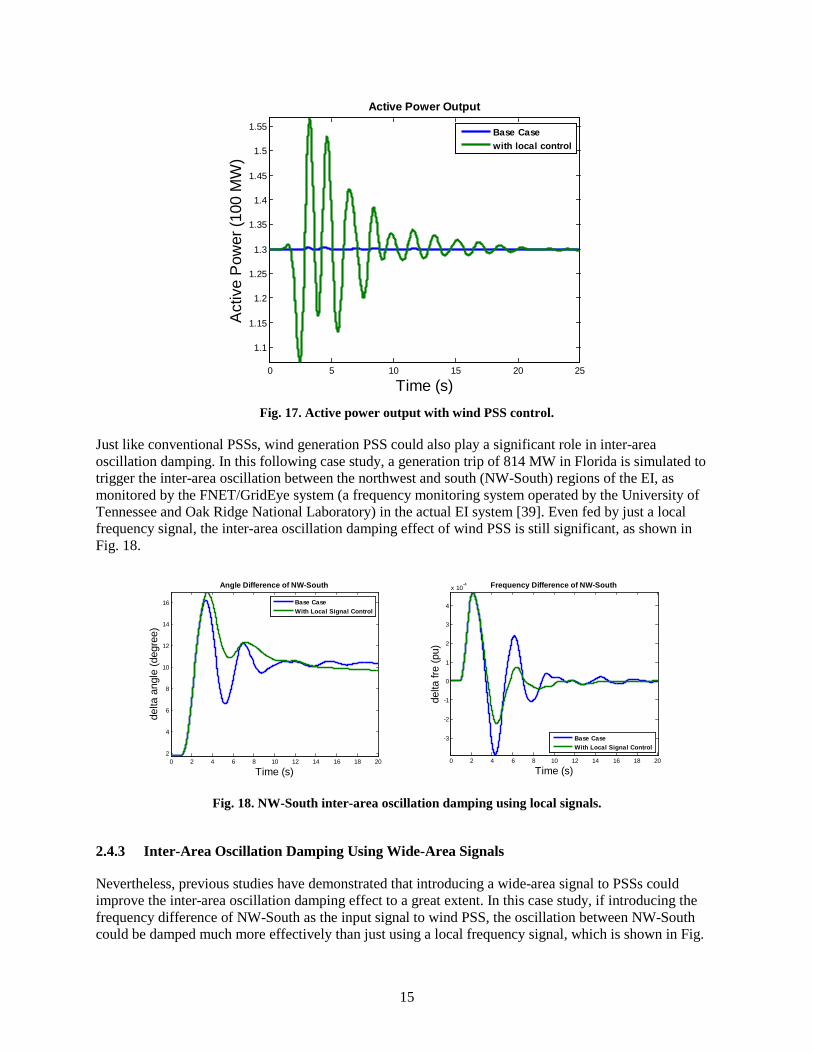
Fig. 17. Active power output with wind PSS control.
Just like conventional PSSs, wind generation PSS could also play a significant role in inter-area oscillation damping. In this following case study, a generation trip of 814 MW in Florida is simulated to trigger the inter-area oscillation between the northwest and south (NW-South) regions of the EI, as monitored by the FNET/GridEye system (a frequency monitoring system operated by the University of Tennessee and Oak Ridge National Laboratory) in the actual EI system [39]. Even fed by just a local frequency signal, the inter-area oscillation damping effect of wind PSS is still significant, as shown in Fig. 18.
Fig. 18. NW-South inter-area oscillation damping using local signals.
2.4.3 Inter-Area Oscillation Damping Using Wide-Area Signals
Nevertheless, previous studies have demonstrated that introducing a wide-area signal to PSSs could improve the inter-area oscillation damping effect to a great extent. In this case study, if introducing the frequency difference of NW-South as the input signal to wind PSS, the oscillation between NW-South could be damped much more effectively than just using a local frequency signal, which is shown in Fig.
0 5 10 15 20 25
1.1
1.15
1.2
1.25
1.3
1.35
1.4
1.45
1.5
1.55
Active Power Output
Time (s)
Act
ive
Pow
er (1
00 M
W)
Base Casewith local control
0 2 4 6 8 10 12 14 16 18 202
4
6
8
10
12
14
16
Angle Difference of NW-South
Time (s)
delta
ang
le (d
egre
e)
Base CaseWith Local Signal Control
0 2 4 6 8 10 12 14 16 18 20
-3
-2
-1
0
1
2
3
4
x 10-4 Frequency Difference of NW-South
Time (s)
delta
fre
(pu)
Base CaseWith Local Signal Control
16
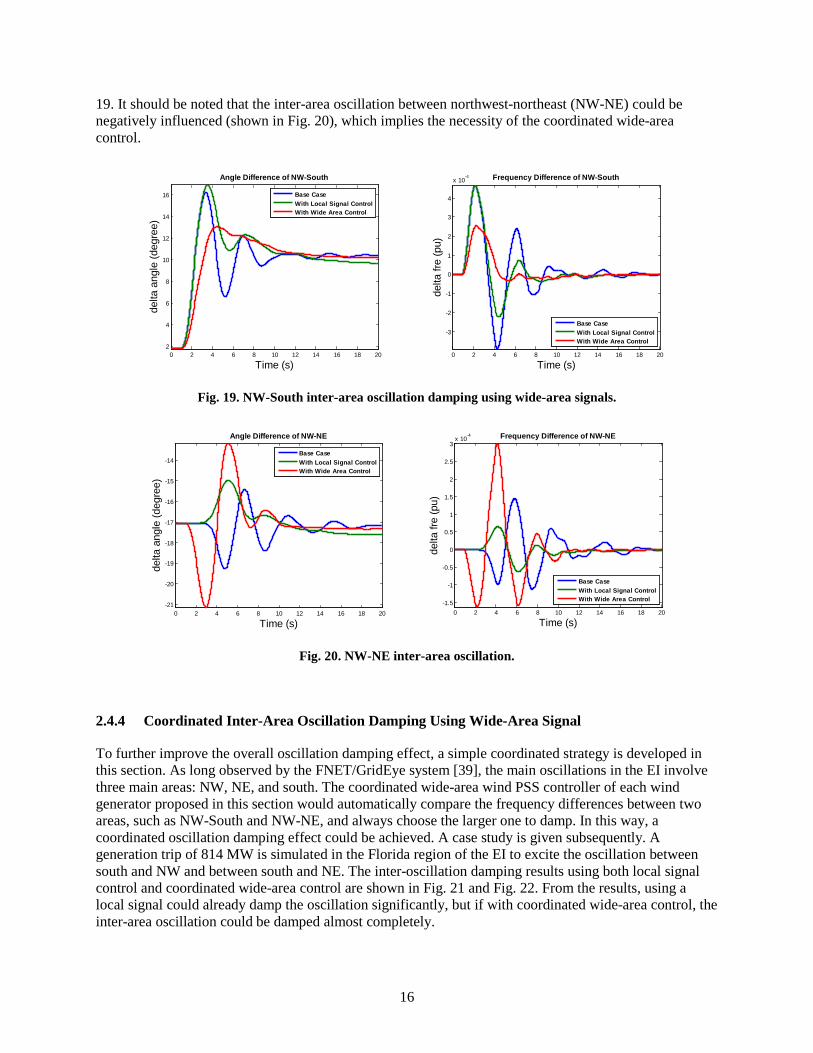
19. It should be noted that the inter-area oscillation between northwest-northeast (NW-NE) could be negatively influenced (shown in Fig. 20), which implies the necessity of the coordinated wide-area control.
Fig. 19. NW-South inter-area oscillation damping using wide-area signals.
Fig. 20. NW-NE inter-area oscillation.
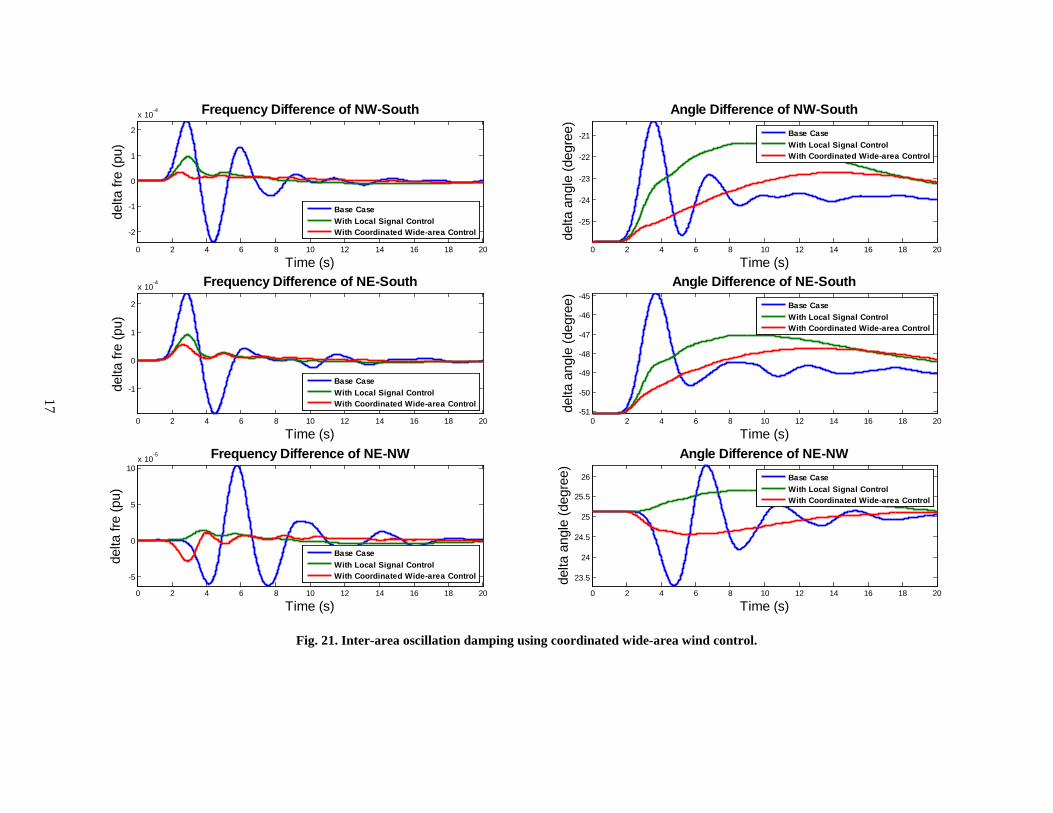
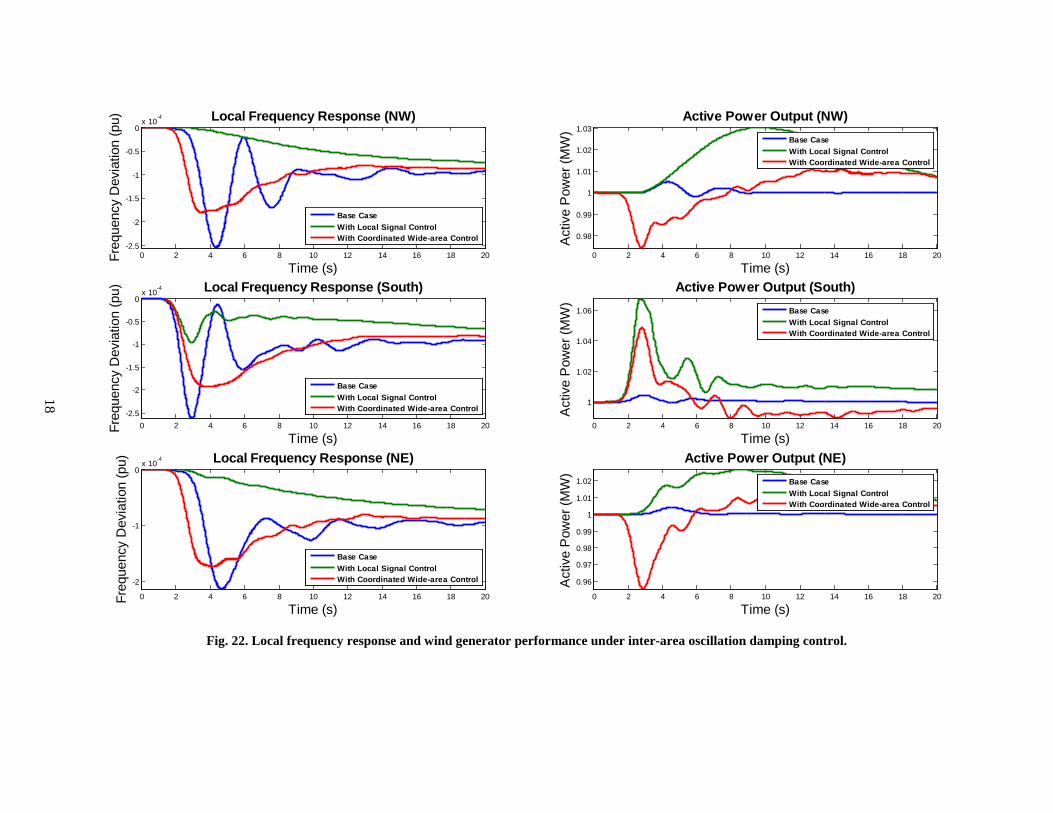
2.4.4 Coordinated Inter-Area Oscillation Damping Using Wide-Area Signal
To further improve the overall oscillation damping effect, a simple coordinated strategy is developed in this section. As long observed by the FNET/GridEye system [39], the main oscillations in the EI involve three main areas: NW, NE, and south. The coordinated wide-area wind PSS controller of each wind generator proposed in this section would automatically compare the frequency differences between two areas, such as NW-South and NW-NE, and always choose the larger one to damp. In this way, a coordinated oscillation damping effect could be achieved. A case study is given subsequently. A generation trip of 814 MW is simulated in the Florida region of the EI to excite the oscillation between south and NW and between south and NE. The inter-oscillation damping results using both local signal control and coordinated wide-area control are shown in Fig. 21 and Fig. 22. From the results, using a local signal could already damp the oscillation significantly, but if with coordinated wide-area control, the inter-area oscillation could be damped almost completely.
0 2 4 6 8 10 12 14 16 18 202
4
6
8
10
12
14
16
Angle Difference of NW-South
Time (s)
delta
ang
le (d
egre
e)
Base CaseWith Local Signal ControlWith Wide Area Control
0 2 4 6 8 10 12 14 16 18 20
-3
-2
-1
0
1
2
3
4
x 10-4 Frequency Difference of NW-South
Time (s)
delta
fre
(pu)
Base CaseWith Local Signal ControlWith Wide Area Control
0 2 4 6 8 10 12 14 16 18 20-21
-20
-19
-18
-17
-16
-15
-14
Angle Difference of NW-NE
Time (s)
delta
ang
le (d
egre
e)
Base CaseWith Local Signal ControlWith Wide Area Control
0 2 4 6 8 10 12 14 16 18 20-1.5
-1
-0.5
0
0.5
1
1.5
2
2.5
3x 10
-4 Frequency Difference of NW-NE
Time (s)
delta
fre
(pu)
Base CaseWith Local Signal ControlWith Wide Area Control
17
Fig. 21. Inter-area oscillation damping using coordinated wide-area wind control.
0 2 4 6 8 10 12 14 16 18 20
-2
-1
0
1
2
x 10-4 Frequency Difference of NW-South
Time (s)
delta
fre
(pu)
0 2 4 6 8 10 12 14 16 18 20
-25
-24
-23
-22
-21
Angle Difference of NW-South
Time (s)
delta
ang
le (d
egre
e)
0 2 4 6 8 10 12 14 16 18 20
-1
0
1
2
x 10-4 Frequency Difference of NE-South
Time (s)
delta
fre
(pu)
0 2 4 6 8 10 12 14 16 18 20-51
-50
-49
-48
-47
-46
-45Angle Difference of NE-South
Time (s)
delta
ang
le (d
egre
e)
0 2 4 6 8 10 12 14 16 18 20
-5
0
5
10x 10
-5 Frequency Difference of NE-NW
Time (s)
delta
fre
(pu)
0 2 4 6 8 10 12 14 16 18 20
23.5
24
24.5
25
25.5
26
Angle Difference of NE-NW
Time (s)
delta
ang
le (d
egre
e)
Base CaseWith Local Signal ControlWith Coordinated Wide-area Control
Base CaseWith Local Signal ControlWith Coordinated Wide-area Control
Base CaseWith Local Signal ControlWith Coordinated Wide-area Control
Base CaseWith Local Signal ControlWith Coordinated Wide-area Control
Base CaseWith Local Signal ControlWith Coordinated Wide-area Control
Base CaseWith Local Signal ControlWith Coordinated Wide-area Control
18
Fig. 22. Local frequency response and wind generator performance under inter-area oscillation damping control.
0 2 4 6 8 10 12 14 16 18 20-2.5
-2
-1.5
-1
-0.5
0x 10
-4 Local Frequency Response (NW)
Time (s)
Freq
uenc
y D
evia
tion
(pu)
Base CaseWith Local Signal ControlWith Coordinated Wide-area Control
0 2 4 6 8 10 12 14 16 18 20
0.98
0.99
1
1.01
1.02
1.03Active Power Output (NW)
Time (s)
Act
ive
Pow
er (M
W)
Base CaseWith Local Signal ControlWith Coordinated Wide-area Control
0 2 4 6 8 10 12 14 16 18 20-2.5
-2
-1.5
-1
-0.5
0x 10
-4 Local Frequency Response (South)
Time (s)
Freq
uenc
y D
evia
tion
(pu)
Base CaseWith Local Signal ControlWith Coordinated Wide-area Control
0 2 4 6 8 10 12 14 16 18 20
1
1.02
1.04
1.06
Active Power Output (South)
Time (s)
Act
ive
Pow
er (M
W)
Base CaseWith Local Signal ControlWith Coordinated Wide-area Control
0 2 4 6 8 10 12 14 16 18 20
-2
-1
0x 10
-4 Local Frequency Response (NE)
Time (s)
Freq
uenc
y D
evia
tion
(pu)
Base CaseWith Local Signal ControlWith Coordinated Wide-area Control
0 2 4 6 8 10 12 14 16 18 20
0.96
0.97
0.98
0.99
1
1.01
1.02
Active Power Output (NE)
Time (s)
Act
ive
Pow
er (M
W)
Base CaseWith Local Signal ControlWith Coordinated Wide-area Control
19
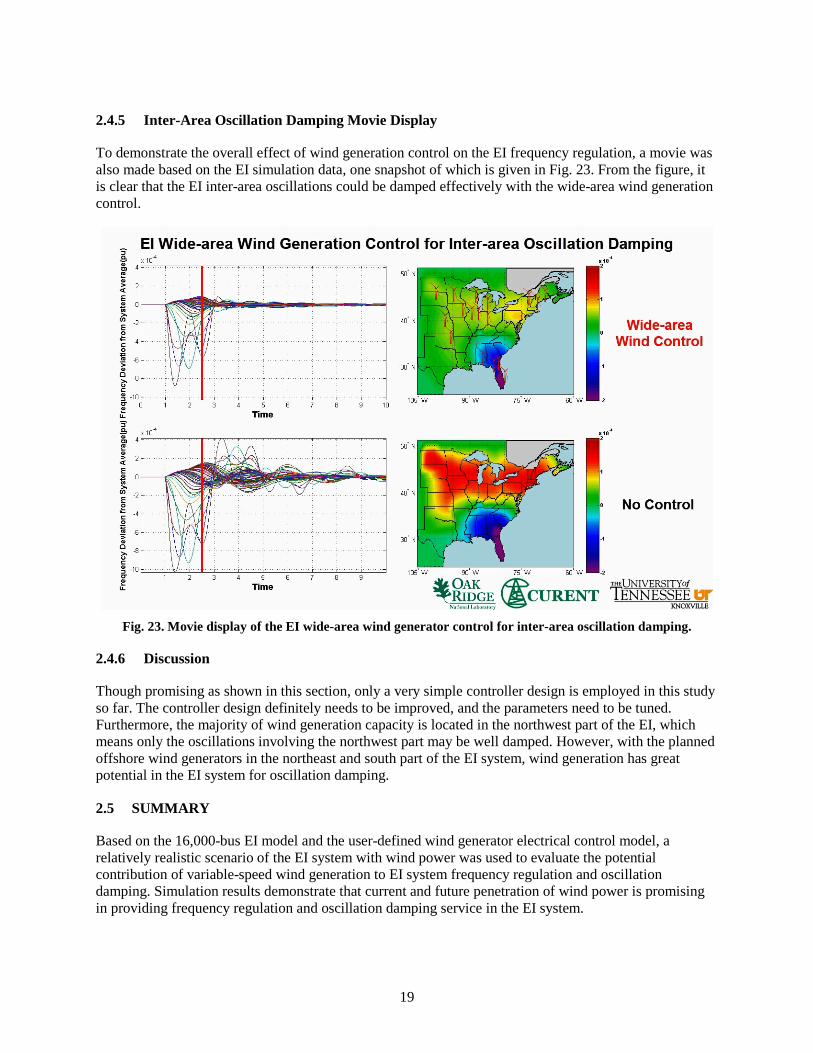
2.4.5 Inter-Area Oscillation Damping Movie Display
To demonstrate the overall effect of wind generation control on the EI frequency regulation, a movie was also made based on the EI simulation data, one snapshot of which is given in Fig. 23. From the figure, it is clear that the EI inter-area oscillations could be damped effectively with the wide-area wind generation control.
Fig. 23. Movie display of the EI wide-area wind generator control for inter-area oscillation damping.
2.4.6 Discussion
Though promising as shown in this section, only a very simple controller design is employed in this study so far. The controller design definitely needs to be improved, and the parameters need to be tuned. Furthermore, the majority of wind generation capacity is located in the northwest part of the EI, which means only the oscillations involving the northwest part may be well damped. However, with the planned offshore wind generators in the northeast and south part of the EI system, wind generation has great potential in the EI system for oscillation damping.
2.5 SUMMARY
Based on the 16,000-bus EI model and the user-defined wind generator electrical control model, a relatively realistic scenario of the EI system with wind power was used to evaluate the potential contribution of variable-speed wind generation to EI system frequency regulation and oscillation damping. Simulation results demonstrate that current and future penetration of wind power is promising in providing frequency regulation and oscillation damping service in the EI system.

21
3. PV GENERATION CONTROL
3.1 BACKGROUND
As discussed in Chapter 2, variable-speed wind generators can work in the over-speed zone instead of MPPT mode to retain power reserve for frequency regulation and oscillation damping. Furthermore, they have great potential to contribute to the EI system frequency regulation and oscillation damping even at a relatively low penetration (5%). Photovoltaic systems may have similar characteristics within the grid. Thus, with the increasing penetration, it may also be beneficial to include PV generation in the bulk power system frequency support and small-signal stability control.
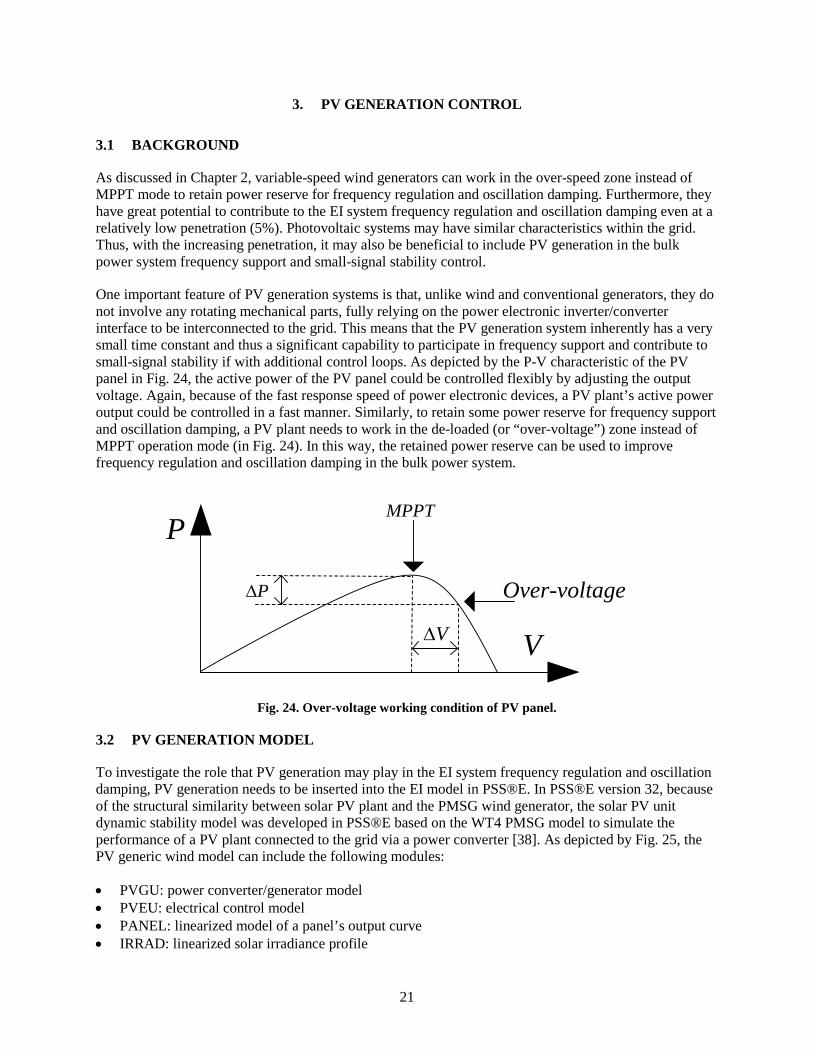
One important feature of PV generation systems is that, unlike wind and conventional generators, they do not involve any rotating mechanical parts, fully relying on the power electronic inverter/converter interface to be interconnected to the grid. This means that the PV generation system inherently has a very small time constant and thus a significant capability to participate in frequency support and contribute to small-signal stability if with additional control loops. As depicted by the P-V characteristic of the PV panel in Fig. 24, the active power of the PV panel could be controlled flexibly by adjusting the output voltage. Again, because of the fast response speed of power electronic devices, a PV plant’s active power output could be controlled in a fast manner. Similarly, to retain some power reserve for frequency support and oscillation damping, a PV plant needs to work in the de-loaded (or “over-voltage”) zone instead of MPPT operation mode (in Fig. 24). In this way, the retained power reserve can be used to improve frequency regulation and oscillation damping in the bulk power system.
P∆
V∆
P
V
MPPT
Over-voltage
Fig. 24. Over-voltage working condition of PV panel.
3.2 PV GENERATION MODEL
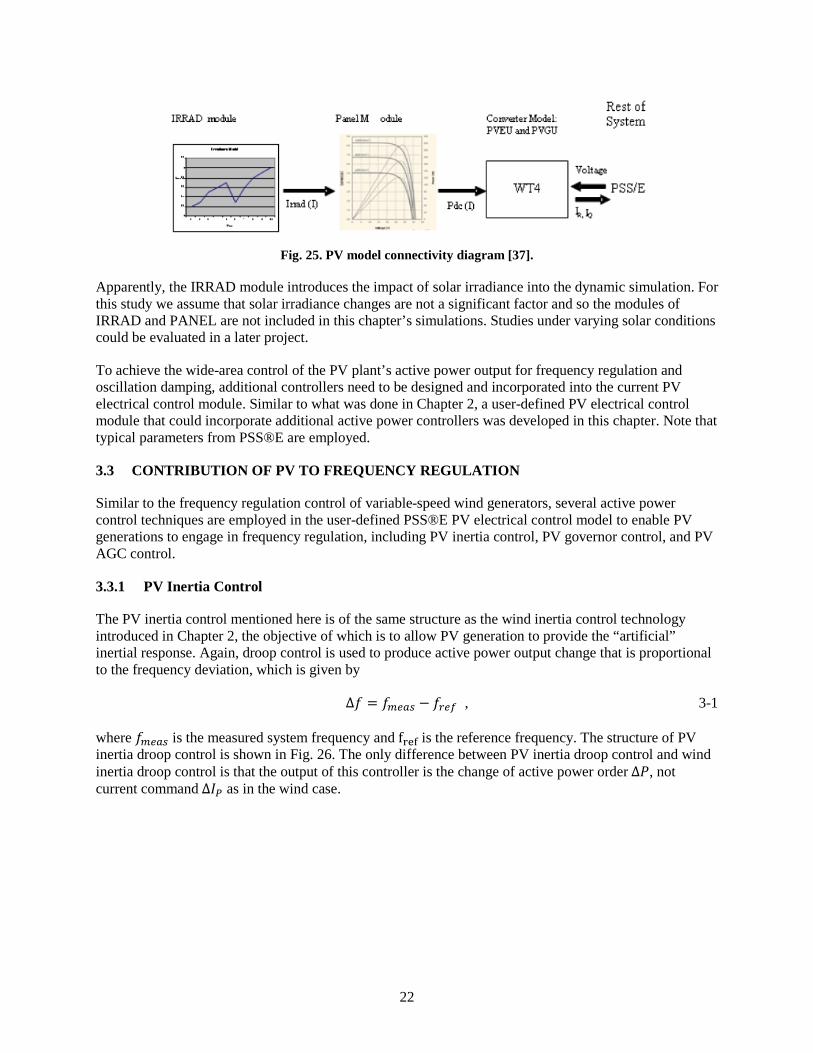
To investigate the role that PV generation may play in the EI system frequency regulation and oscillation damping, PV generation needs to be inserted into the EI model in PSS®E. In PSS®E version 32, because of the structural similarity between solar PV plant and the PMSG wind generator, the solar PV unit dynamic stability model was developed in PSS®E based on the WT4 PMSG model to simulate the performance of a PV plant connected to the grid via a power converter [38]. As depicted by Fig. 25, the PV generic wind model can include the following modules:
• PVGU: power converter/generator model • PVEU: electrical control model • PANEL: linearized model of a panel’s output curve • IRRAD: linearized solar irradiance profile
22
Fig. 25. PV model connectivity diagram [37].
Apparently, the IRRAD module introduces the impact of solar irradiance into the dynamic simulation. For this study we assume that solar irradiance changes are not a significant factor and so the modules of IRRAD and PANEL are not included in this chapter’s simulations. Studies under varying solar conditions could be evaluated in a later project.
To achieve the wide-area control of the PV plant’s active power output for frequency regulation and oscillation damping, additional controllers need to be designed and incorporated into the current PV electrical control module. Similar to what was done in Chapter 2, a user-defined PV electrical control module that could incorporate additional active power controllers was developed in this chapter. Note that typical parameters from PSS®E are employed.
3.3 CONTRIBUTION OF PV TO FREQUENCY REGULATION
Similar to the frequency regulation control of variable-speed wind generators, several active power control techniques are employed in the user-defined PSS®E PV electrical control model to enable PV generations to engage in frequency regulation, including PV inertia control, PV governor control, and PV AGC control.
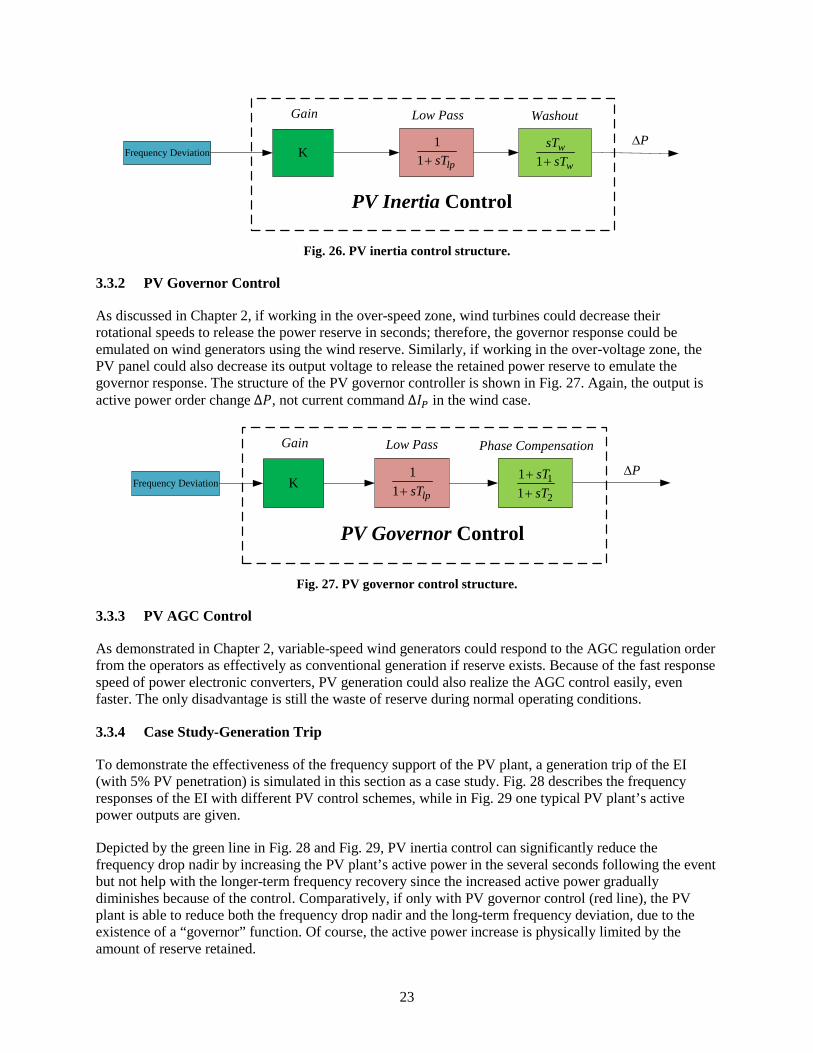
3.3.1 PV Inertia Control
The PV inertia control mentioned here is of the same structure as the wind inertia control technology introduced in Chapter 2, the objective of which is to allow PV generation to provide the “artificial” inertial response. Again, droop control is used to produce active power output change that is proportional to the frequency deviation, which is given by
∆𝑓 = 𝑓𝑚𝑒𝑎𝑠 − 𝑓𝑟𝑒𝑓 , 3-1
where 𝑓𝑚𝑒𝑎𝑠 is the measured system frequency and fref is the reference frequency. The structure of PV inertia droop control is shown in Fig. 26. The only difference between PV inertia droop control and wind inertia droop control is that the output of this controller is the change of active power order ∆𝑃, not current command ∆𝐼𝑃 as in the wind case.
23
PV Inertia Control
K
Gain WashoutLow Pass
11 lpsT+ 1
w
w
sTsT+
Frequency DeviationP∆
Fig. 26. PV inertia control structure.
3.3.2 PV Governor Control
As discussed in Chapter 2, if working in the over-speed zone, wind turbines could decrease their rotational speeds to release the power reserve in seconds; therefore, the governor response could be emulated on wind generators using the wind reserve. Similarly, if working in the over-voltage zone, the PV panel could also decrease its output voltage to release the retained power reserve to emulate the governor response. The structure of the PV governor controller is shown in Fig. 27. Again, the output is active power order change ∆𝑃, not current command ∆𝐼𝑃 in the wind case.
PV Governor Control
K
Gain Low Pass
11 lpsT+
Frequency DeviationP∆
Phase Compensation
1
2
11
sTsT
++
Fig. 27. PV governor control structure.
3.3.3 PV AGC Control
As demonstrated in Chapter 2, variable-speed wind generators could respond to the AGC regulation order from the operators as effectively as conventional generation if reserve exists. Because of the fast response speed of power electronic converters, PV generation could also realize the AGC control easily, even faster. The only disadvantage is still the waste of reserve during normal operating conditions.
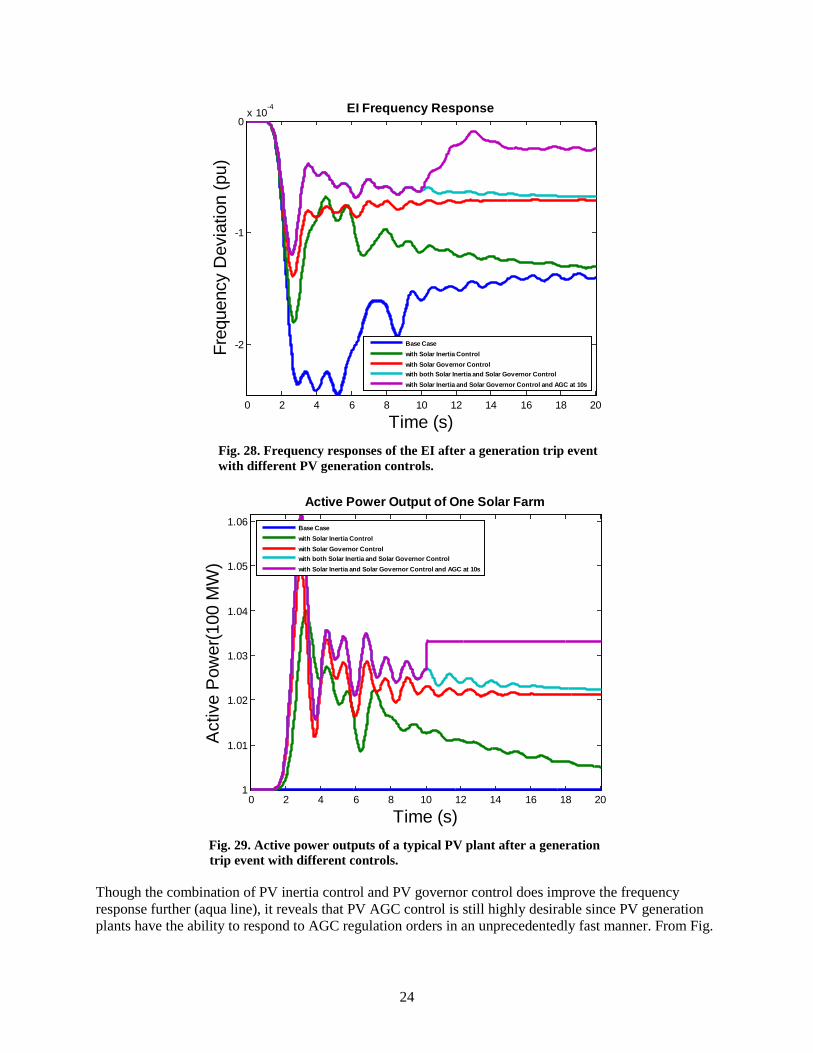
3.3.4 Case Study-Generation Trip
To demonstrate the effectiveness of the frequency support of the PV plant, a generation trip of the EI (with 5% PV penetration) is simulated in this section as a case study. Fig. 28 describes the frequency responses of the EI with different PV control schemes, while in Fig. 29 one typical PV plant’s active power outputs are given.
Depicted by the green line in Fig. 28 and Fig. 29, PV inertia control can significantly reduce the frequency drop nadir by increasing the PV plant’s active power in the several seconds following the event but not help with the longer-term frequency recovery since the increased active power gradually diminishes because of the control. Comparatively, if only with PV governor control (red line), the PV plant is able to reduce both the frequency drop nadir and the long-term frequency deviation, due to the existence of a “governor” function. Of course, the active power increase is physically limited by the amount of reserve retained.
24
Fig. 28. Frequency responses of the EI after a generation trip event with different PV generation controls.
Fig. 29. Active power outputs of a typical PV plant after a generation trip event with different controls.
Though the combination of PV inertia control and PV governor control does improve the frequency response further (aqua line), it reveals that PV AGC control is still highly desirable since PV generation plants have the ability to respond to AGC regulation orders in an unprecedentedly fast manner. From Fig.
0 2 4 6 8 10 12 14 16 18 20
-2
-1
0x 10
-4 EI Frequency Response
Time (s)
Freq
uenc
y D
evia
tion
(pu)
Base Casewith Solar Inertia Controlwith Solar Governor Controlwith both Solar Inertia and Solar Governor Controlwith Solar Inertia and Solar Governor Control and AGC at 10s
0 2 4 6 8 10 12 14 16 18 201
1.01
1.02
1.03
1.04
1.05
1.06
Active Power Output of One Solar Farm
Time (s)
Act
ive
Pow
er(1
00 M
W)
Base Casewith Solar Inertia Controlwith Solar Governor Controlwith both Solar Inertia and Solar Governor Controlwith Solar Inertia and Solar Governor Control and AGC at 10s

25
29, after receiving the AGC order at the 10 second mark, the active power of PV generation rises to its new operating point almost immediately, which indicates the fast speed of power electronic devices.
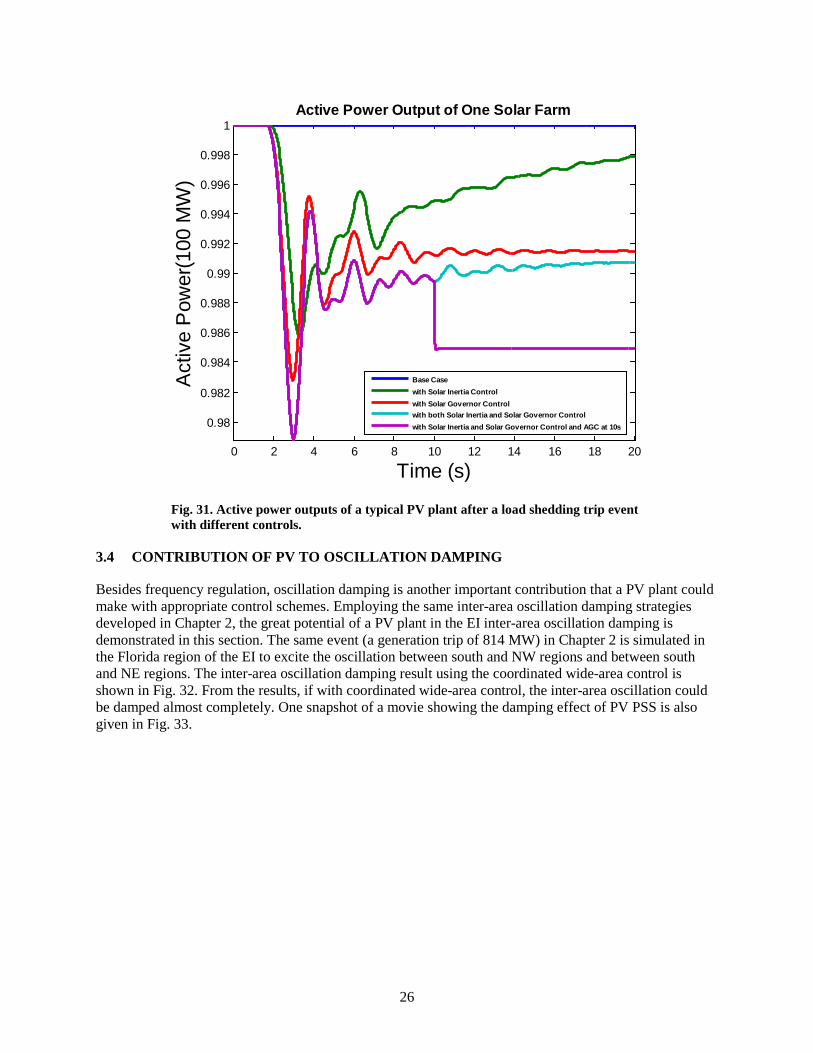
3.3.5 Case Study-Load Shedding
Note that PV plants can also contribute to frequency response improvement in load shedding cases. In this scenario, instead of decreasing PV panel voltage and releasing the reserve, the panel voltage is increased to retain more reserve so that the frequency excursion will be reduced. To demonstrate this, a load-shedding event of 724 MW is simulated in the EI. Similar to the generation trip case, power system frequency response and active power are given in Fig. 30 and Fig. 31, respectively.
Fig. 30. Frequency responses of the EI after a load shedding trip event with different PV generation controls.
0 2 4 6 8 10 12 14 16 18 20
0
1
2
3
4
5
6
7
8
9
x 10-5 EI Frequency Response
Time (s)
Freq
uenc
y D
evia
tion
(pu)
Base Casewith Solar Inertia Controlwith Solar Governor Controlwith both Solar Inertia and Solar Governor Controlwith Solar Inertia and Solar Governor Control and AGC at 10s
26
Fig. 31. Active power outputs of a typical PV plant after a load shedding trip event with different controls.
3.4 CONTRIBUTION OF PV TO OSCILLATION DAMPING
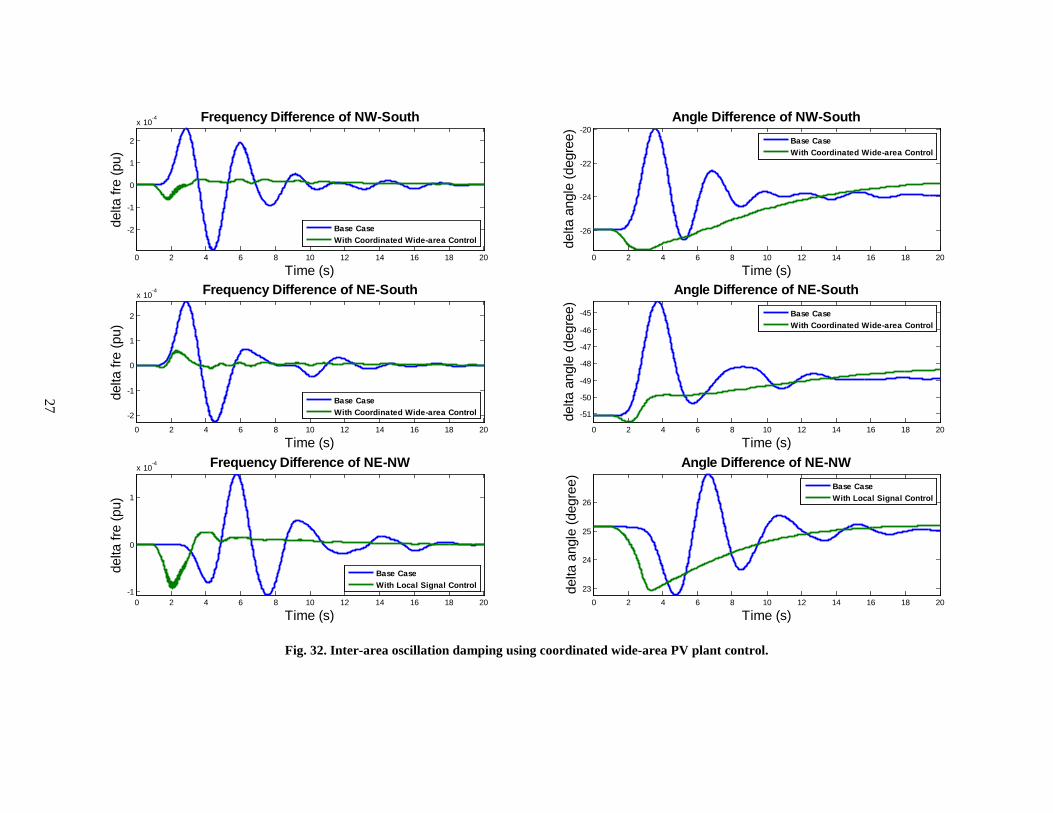
Besides frequency regulation, oscillation damping is another important contribution that a PV plant could make with appropriate control schemes. Employing the same inter-area oscillation damping strategies developed in Chapter 2, the great potential of a PV plant in the EI inter-area oscillation damping is demonstrated in this section. The same event (a generation trip of 814 MW) in Chapter 2 is simulated in the Florida region of the EI to excite the oscillation between south and NW regions and between south and NE regions. The inter-area oscillation damping result using the coordinated wide-area control is shown in Fig. 32. From the results, if with coordinated wide-area control, the inter-area oscillation could be damped almost completely. One snapshot of a movie showing the damping effect of PV PSS is also given in Fig. 33.
0 2 4 6 8 10 12 14 16 18 20
0.98
0.982
0.984
0.986
0.988
0.99
0.992
0.994
0.996
0.998
1Active Power Output of One Solar Farm
Time (s)
Act
ive
Pow
er(1
00 M
W)
Base Casewith Solar Inertia Controlwith Solar Governor Controlwith both Solar Inertia and Solar Governor Controlwith Solar Inertia and Solar Governor Control and AGC at 10s
27
Fig. 32. Inter-area oscillation damping using coordinated wide-area PV plant control.
0 2 4 6 8 10 12 14 16 18 20
-2
-1
0
1
2
x 10-4 Frequency Difference of NW-South
Time (s)
delta
fre
(pu)
Base CaseWith Coordinated Wide-area Control
0 2 4 6 8 10 12 14 16 18 20
-26
-24
-22
-20Angle Difference of NW-South
Time (s)
delta
ang
le (d
egre
e)
Base CaseWith Coordinated Wide-area Control
0 2 4 6 8 10 12 14 16 18 20
-2
-1
0
1
2
x 10-4 Frequency Difference of NE-South
Time (s)
delta
fre
(pu)
Base CaseWith Coordinated Wide-area Control
0 2 4 6 8 10 12 14 16 18 20
-51
-50
-49
-48
-47
-46
-45
Angle Difference of NE-South
Time (s)
delta
ang
le (d
egre
e)
Base CaseWith Coordinated Wide-area Control
0 2 4 6 8 10 12 14 16 18 20-1
0
1
x 10-4 Frequency Difference of NE-NW
Time (s)
delta
fre
(pu)
Base CaseWith Local Signal Control
0 2 4 6 8 10 12 14 16 18 20
23
24
25
26
Angle Difference of NE-NW
Time (s)
delta
ang
le (d
egre
e)
Base CaseWith Local Signal Control
28
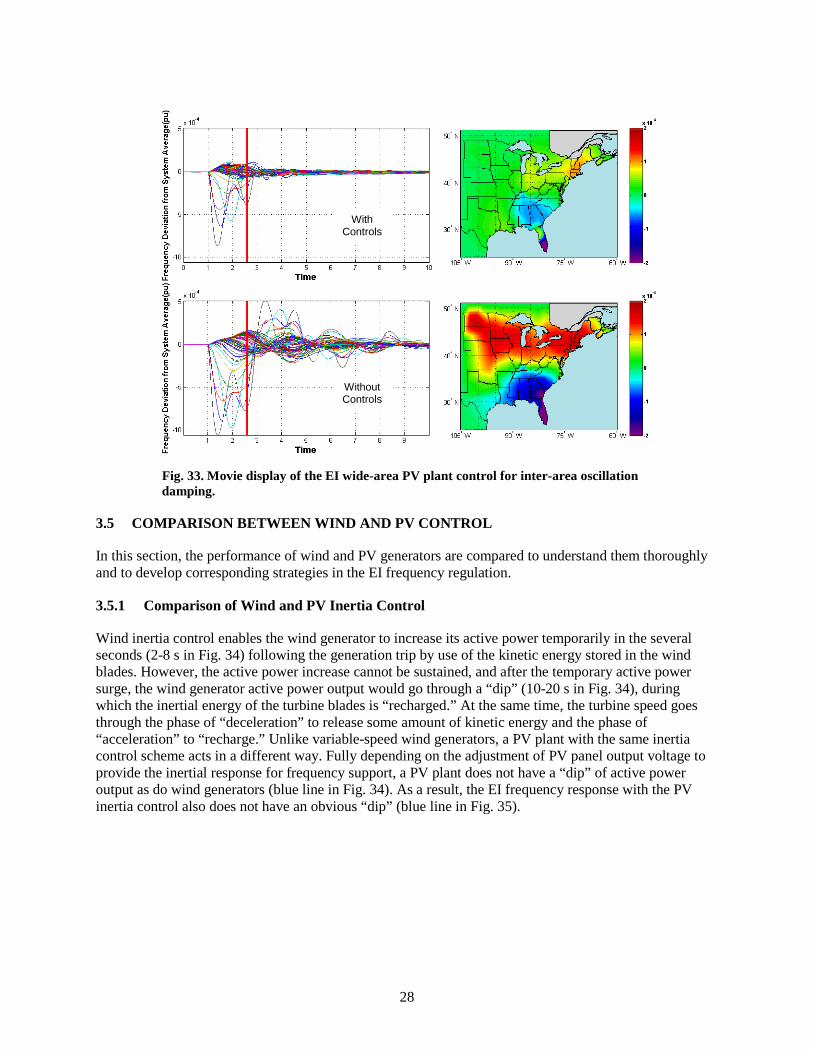
Fig. 33. Movie display of the EI wide-area PV plant control for inter-area oscillation damping.
3.5 COMPARISON BETWEEN WIND AND PV CONTROL
In this section, the performance of wind and PV generators are compared to understand them thoroughly and to develop corresponding strategies in the EI frequency regulation.
3.5.1 Comparison of Wind and PV Inertia Control
Wind inertia control enables the wind generator to increase its active power temporarily in the several seconds (2-8 s in Fig. 34) following the generation trip by use of the kinetic energy stored in the wind blades. However, the active power increase cannot be sustained, and after the temporary active power surge, the wind generator active power output would go through a “dip” (10-20 s in Fig. 34), during which the inertial energy of the turbine blades is “recharged.” At the same time, the turbine speed goes through the phase of “deceleration” to release some amount of kinetic energy and the phase of “acceleration” to “recharge.” Unlike variable-speed wind generators, a PV plant with the same inertia control scheme acts in a different way. Fully depending on the adjustment of PV panel output voltage to provide the inertial response for frequency support, a PV plant does not have a “dip” of active power output as do wind generators (blue line in Fig. 34). As a result, the EI frequency response with the PV inertia control also does not have an obvious “dip” (blue line in Fig. 35).
With Controls
Without Controls

29
Fig. 34. Active power outputs of either wind or PV inertia control.
Fig. 35. Frequency response of the EI with either wind or PV inertia control.
0 2 4 6 8 10 12 14 16 18 200.995
1
1.005
1.01
1.015
1.02
1.025
Active Power Output
Time (s)
Act
ive
Pow
er(1
00 M
W)
PV Inertia ControlWind Inertia Control
0 2 4 6 8 10 12 14 16 18 20
-18
-16
-14
-12
-10
-8
-6
-4
-2
0x 10
-5 EI Frequency Response
Time (s)
Freq
uenc
y D
evia
tion
(pu)
PV inertia ControlWind inertia Control
30
3.5.2 Comparison of Wind and PV Governor Control
In this subsection, the performance of wind and PV generators with governor control is compared. The time constant of wind generators is expected to be much larger than PV because of the involvement of rotating mechanicals such as the wind turbines. This time constant difference can be reflected in the comparison of wind and PV governor control.
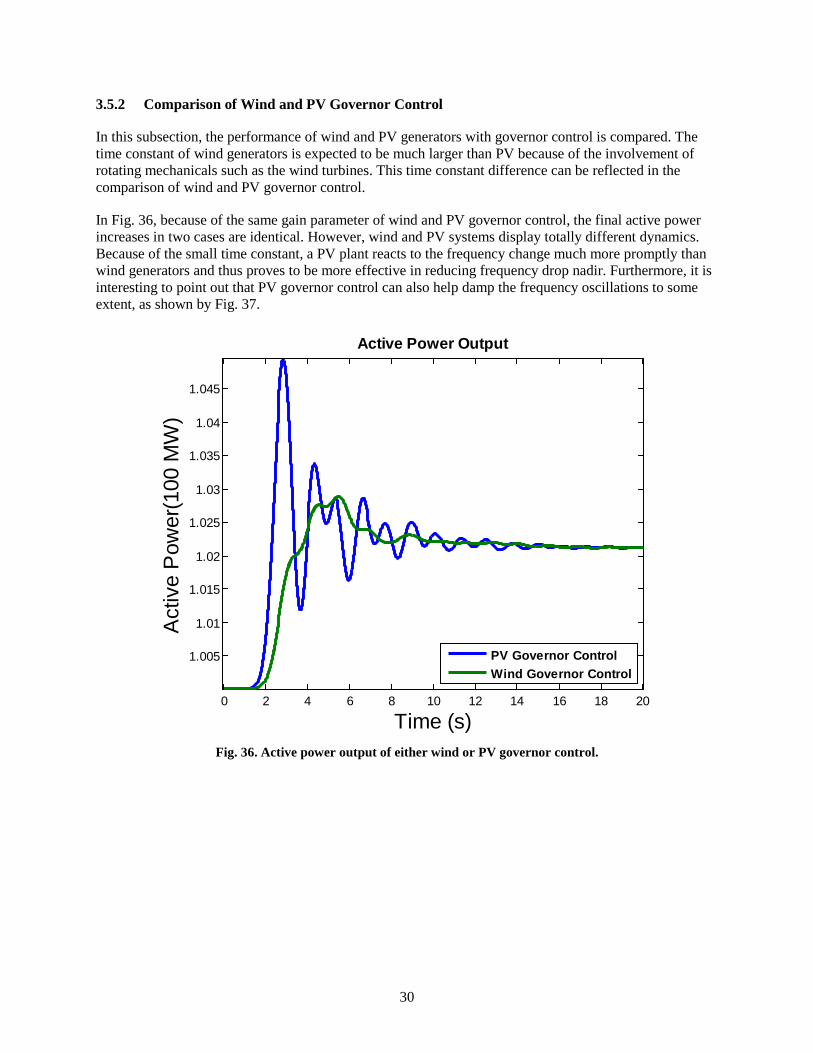
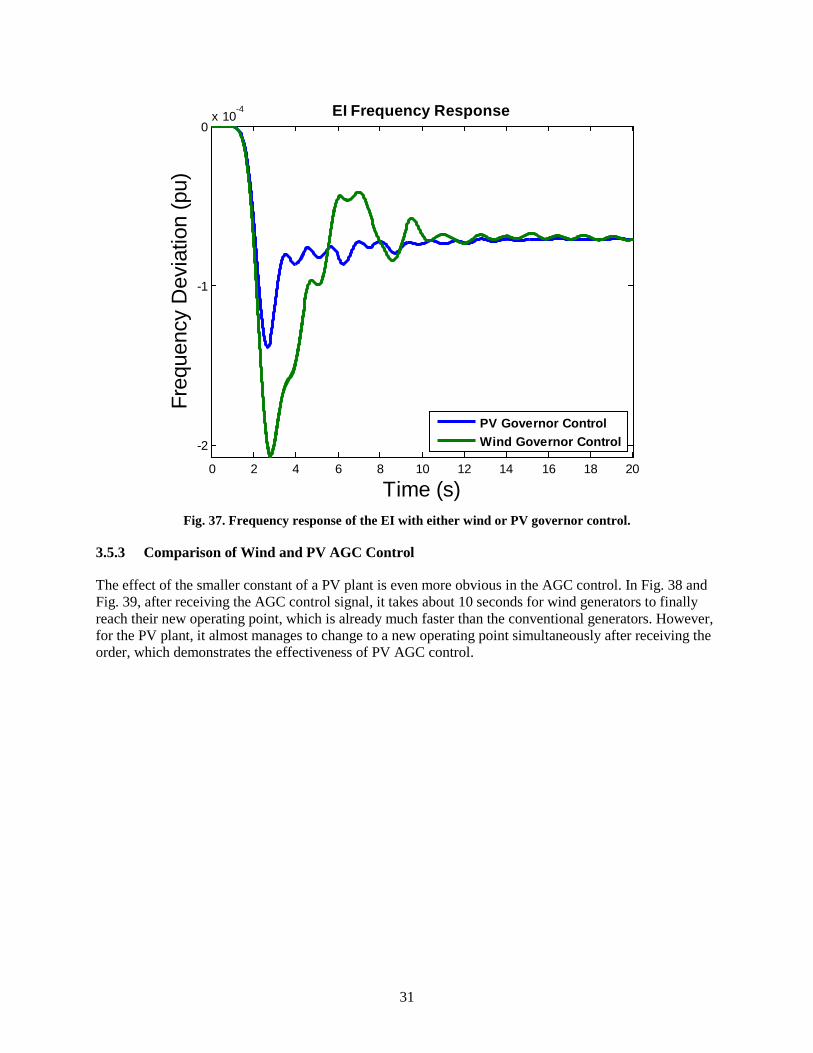
In Fig. 36, because of the same gain parameter of wind and PV governor control, the final active power increases in two cases are identical. However, wind and PV systems display totally different dynamics. Because of the small time constant, a PV plant reacts to the frequency change much more promptly than wind generators and thus proves to be more effective in reducing frequency drop nadir. Furthermore, it is interesting to point out that PV governor control can also help damp the frequency oscillations to some extent, as shown by Fig. 37.
Fig. 36. Active power output of either wind or PV governor control.
0 2 4 6 8 10 12 14 16 18 20
1.005
1.01
1.015
1.02
1.025
1.03
1.035
1.04
1.045
Active Power Output
Time (s)
Act
ive
Pow
er(1
00 M
W)
PV Governor ControlWind Governor Control
31
Fig. 37. Frequency response of the EI with either wind or PV governor control.
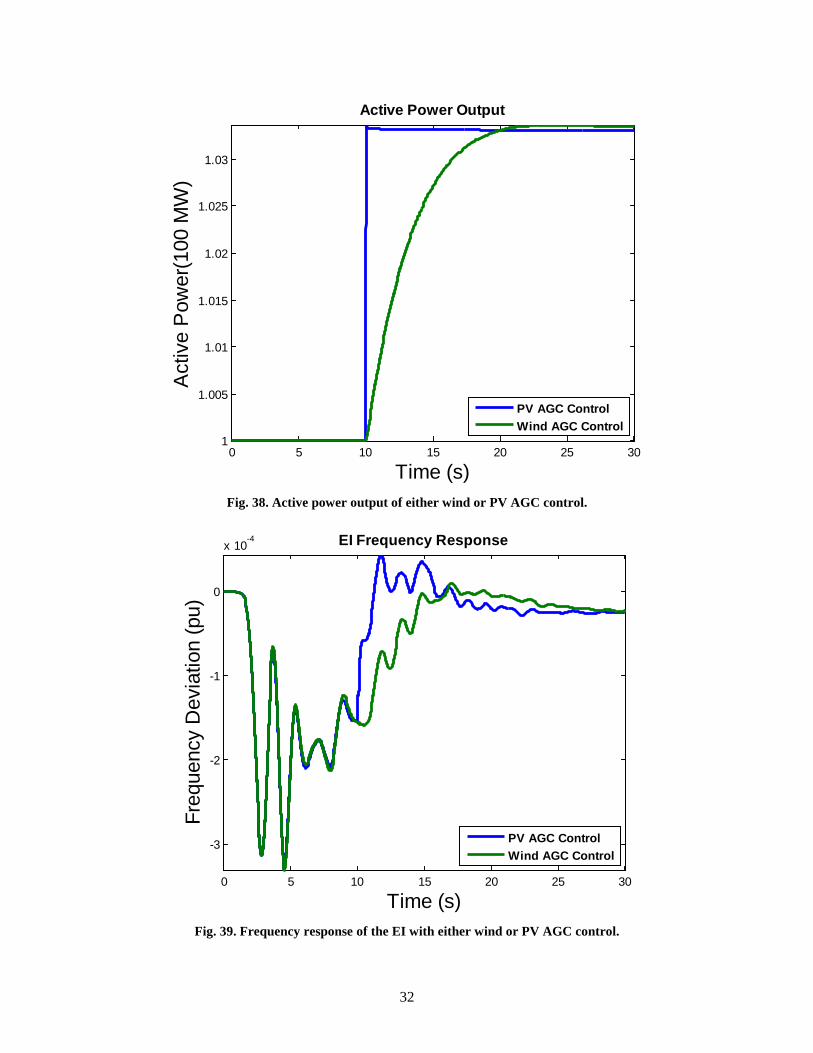
3.5.3 Comparison of Wind and PV AGC Control
The effect of the smaller constant of a PV plant is even more obvious in the AGC control. In Fig. 38 and Fig. 39, after receiving the AGC control signal, it takes about 10 seconds for wind generators to finally reach their new operating point, which is already much faster than the conventional generators. However, for the PV plant, it almost manages to change to a new operating point simultaneously after receiving the order, which demonstrates the effectiveness of PV AGC control.
0 2 4 6 8 10 12 14 16 18 20
-2
-1
0x 10
-4 EI Frequency Response
Time (s)
Freq
uenc
y D
evia
tion
(pu)
PV Governor ControlWind Governor Control
32
Fig. 38. Active power output of either wind or PV AGC control.
Fig. 39. Frequency response of the EI with either wind or PV AGC control.
0 5 10 15 20 25 301
1.005
1.01
1.015
1.02
1.025
1.03
Active Power Output
Time (s)
Act
ive
Pow
er(1
00 M
W)
PV AGC ControlWind AGC Control
0 5 10 15 20 25 30
-3
-2
-1
0
x 10-4 EI Frequency Response
Time (s)
Freq
uenc
y D
evia
tion
(pu)
PV AGC ControlWind AGC Control

33
3.6 CONSTRUCTION OF SIMULATION SCENARIOS WITH HIGH RENEWABLE PENETRATIONS
In all the previous case studies, the EI simulation scenarios with 5% wind or PV penetration have been used to evaluate the potential contributions of variable-speed wind or PV generators to the EI system frequency regulation and oscillation damping. However, in the future the penetration of renewable energy resources in the EI is expected to far exceed 5%. Therefore, EI simulation scenarios with high penetrations of renewable generation are highly desirable.
The same method used in the 5% penetration simulation scenario was also used in this section: a certain portion of active power output of a selected list of conventional generators is converted to wind or PV generators, but the reactive power remains unchanged. In this way, a voltage stability problem is unlikely to occur. Based on the author’s experience with the16,000 bus EI system simulation, there are some other guidelines that should be noted to avoid numerical instability:
• No more than 50% of the active power should be converted to renewables. • Generators whose capacity exceeds 1500 MW should not be converted. • Wind and PV generators should not be attached to the same bus.
Note that the guidelines are based on experience with the 16,000-bus EI model. So far, the simulation scenario with 20% penetration of wind or PV has proved to be numerically stable.
3.7 SUMMARY
Based on the 16,000-bus EI model and the user-defined PV generator electrical control model, a relatively realistic scenario of the EI with PV penetration was used to evaluate the potential contributions of a PV plant to the EI system frequency regulation and oscillation damping. Simulation results demonstrate that current and future penetrations of a PV system are promising in providing frequency regulation and oscillation damping service.


35
4. CONCLUSIONS
This report presents a comprehensive study of the capability of renewable energy sources (including both variable-speed wind generators and PV generators) for frequency regulation and inter-area oscillation damping in the EI system. Specifically, based on the user-defined wind/PV electrical control model developed in this report and the 16,000-bus EI dynamic model, various controllers for frequency regulation and inter-area oscillation damping were developed and the potential contributions of renewable energy sources to the EI system frequency regulation and inter-area oscillation damping were evaluated. Simulation results demonstrate that even at a relatively low penetration level (5% in this report’s simulation) renewable energy resources could already contribute significantly.

37
5. REFERENCES
1. Miller, N. W., et al. 2012. “Frequency Response of California and WECC under High Wind and Solar Conditions.” Proceedings of the 2012 Power and Energy Society General Meeting, 1-8.
2. Ruttledge, L., et al. 2012. “Frequency Response of Power Systems with Variable-Speed Wind Turbines.” IEEE Transactions on Sustainable Energy, 3(4), 683-691.
3. Haan, J., et al. 2011. “Grid Frequency Response of Different Sized Wind Turbines.” Proceedings of the 2011 Universities’ Power Engineering Conference (UPEC), 1-6.
4. Mackin, P., et al. 2013. “Dynamic Simulation Study of the Frequency Response of the Western Interconnection with Increased Wind Generation.” Proceedings of the 2013 International Conference on System Sciences (HICSS), 2222-2229.
5. Villena-Lapaz, J., et al. 2011. “Evaluation of Frequency Response of Variable Speed Wind Farms for Reducing Stability Problems in Weak Grids.” Proceedings of the 2011 Power Electronics and Machines in Wind Applications (PEMWA), 1-5.
6. Slootweg, J .G., and W. L. Kling. 2003. “The Impact of Large Scale Wind Power Generation on Power System Oscillations.” Electric Power Systems Research, 67(1), 9-20.
7. Thakur, D., and N. Mithulananthan. 2009. “Influence of Constant Speed Wind Turbine Generator on Power System Oscillation.” Electric Power Components and Systems 37(5), 478-494.
8. Modi N., et al. 2011. “Effect of Wind Farms with Doubly-fed Induction Generators on Small-signal Stability—A Case Study on Australian Equivalent System.” Proceedings of the 2011 IEEE PES Innovative Smart Grid Technologies Asia (ISGT), 1-7.
9. Vowles, D. J., et al. 2008. “Effect of Wind Generation on Small-signal Stability: a New Zealand Example.” Proceedings of the 2008 IEEE Power Energy Society General Meeting, 1-8.
10. De Haan, S., et al. 1994. “Test results of a 130 W AC module; a modular solar AC power station.” Proceedings of the 1994 Conference Record of the Twenty Fourth IEEE Photovoltaic Specialists Conference, 925-928.
11. Wills, R. H., et al. 1996. “The AC Photovoltaic Module.” Proceedings of the 1996 Conference Record of the Twenty Fifth IEEE Photovoltaic Specialists Conference, 1231-1234.
12. Yatsuki, S., et al., “A Novel AC Photovoltaic Module System Based on the Impedance-admittance Conversion Theory.” Proceedings of the 2001 IEEE 32nd Annual Power Electronics Specialists Conference, 2191-2196.
13. Prapanavarat, C., et al. 2002. “Investigation of the Performance of a Photovoltaic AC Module,” IEEE Proceedings-Generation, Transmission and Distribution 149(4), 472-478.
14. Bzura, J. J., 2010. “The AC Module: An Overview and Update on Self-contained Modular PV Systems,” Proceedings of the 2010 IEEE Power and Energy Society General Meeting, 1-3.
15. List of photovoltaic power stations: en.wikipedia.org/wiki/List_of_photovoltaic_power_stations 16. Hossain, M. I., et al., 2011. “Design and Implementation of MPPT Controlled Grid Connected
Photovoltaic System.” Proceedings of the 2011 IEEE Symposium on Computers & Informatics (ISCI), 284-289.
17. Desai, H. P., and H. K. Patel. 2007. “Maximum Power Point Algorithm in PV Generation: An Overview.” Proceedings of the 2007 7th International Conference on Power Electronics and Drive Systems, 624-630.
38
18. Veerachary, M., et al. 2003. “Neural-network-based Maximum-power-point tracking of Coupled-inductor Interleaved-boost-converter-supplied PV System using Fuzzy Controller.” IEEE Transactions on Industrial Electronics, 50(4), 749-758.
19. Esram, T., and P. L. Chapman. 2007. “Comparison of Photovoltaic Array Maximum Power Point Tracking Techniques.” IEEE Transactions on Energy Conversion 22(2), 439-449.
20. Xiao, W., et al. 2007. “Topology Study of Photovoltaic Interface for Maximum Power Point Tracking,” IEEE Transactions on Industrial Electronics 54(3), 1696-1704.
21. Janssens, N. A., et al. 2007. “Active Power Control Strategies of DFIG Wind Turbines.” Proceedings of the 2007 IEEE Lausanne Power Tech, 516-521.
22. Mauricio, J. M., et al. 2009. “Frequency Regulation Contribution through Variable-speed Wind Energy Conversion Systems.” IEEE Transactions on Power Systems 24(1), 173-180.
23. Conroy, J. F., and R. Watson. 2008. “Frequency Response Capability of Full Converter Wind Turbine Generators in Comparison to Conventional Generation.” IEEE Transactions on Power Systems 23(2), 649-656.
24. Ramtharan, G., et al. 2007. “Frequency Support from Doubly-fed Induction Generator Wind Turbines.” IET Renewable Power Generation 1(1), 3-9.
25. Lalor, G., et al. 2007. “Frequency Control and Wind Turbine Technologies.” IEEE Transactions on Power Systems 20(4), 1905-1913.
26. Almeida, R. G., et al. 2006. “Optimum Generation Control in Wind Parks when carrying out System Operator Requests.” IEEE Transactions on Power Systems 21(2), 718-725.
27. Almeida, R. G., and J. A. Peas Lopes. 2007. “Participation of Doubly-fed Induction Wind Generators in System Frequency Regulation.” IEEE Transactions on Power Systems 22(3), 944-950.
28. Sun, Y.-Z., et al. 2010. “Review on Frequency Control of Power Systems with Wind Power Penetration.” Proceedings of the 2010 International Conference on Power System Technology (POWERCON), 1-8.
29. WindINERTIA Control Fact Sheet, GE Energy, 2009. site.geenery.com/prod_serv/products/renewable_energy/en/downloads/GEA17210.pdf
30. Tsourakis, G., et al. 2009. “Contribution of Doubly-fed Wind Generators to Oscillation Damping.” IEEE Transactions on Energy Conversion 24(3), 783-791.
31. Ledesma, P., and C. Gallardo. 2007. “Contribution of Variable-speed Wind Farms to Damping of Power System Oscillations.” Proceedings of the 2007 Power Tech, 190-194.
32. Zhixin, M., et al. 2008. “Control of DFIG-based Wind Generation to Improve Inter-area Oscillation Damping.” Proceedings of the 2008 Power and Energy Society General Meeting-Conversion and Delivery of Electrical Energy in the 21st Century, 1-7.
33. Liu, X., et al. 2010. “Measurement-based Method for Wind Farm Power System Oscillations Monitoring.” IET Renewable Power Generation 4(2), 198-209.
34. Lingling, F., et al. 2011. “On active/reactive Power Modulation of DFIG-based Wind Generation for Inter-area Oscillation Damping.” IEEE Transactions on Energy Conversion 26(2), 513-521.
35. Knuppel, T., et al. 2011. “Power Oscillation Damping Capabilities of Wind Power Plant with Full Converter Wind Turbines considering its Distributed and Modular Characteristics.” Proceedings of the 2011 IET Conference on Renewable Power Generation, 1-6.

39
36. Knuppel, T., et al. 2011. “Power Oscillation Damping Controller for Wind Power Plant Utilizing Wind Turbine Inertia as Energy Storage.” Proceedings of the 2011 Power and Energy Society General Meeting, 1-8.
37. Tsourakis, G., et al. 2009. “Contribution of Doubly-fed Wind Generators to Oscillation Damping.” IEEE Transactions on Energy Conversion 24(3), 783-791.
38. Siemens Power Technologies International, PSS®E 32.1.1. Program Application Guide Volume 2. 2012.
39. Zhiyong, Y., et al. 2010. “Inter-area Oscillation Analysis Using Wide-area Voltage Angle Measurements from FNET.” Proceedings of the 2010 Power and Energy Society General Meeting, 1-7.
