exploring performance- based regulation
TRANSCRIPT

Exploring Performance-Based Regulation
2
Exploring Performance Based
Regulation (PBR) and Alternative Rate
Making
128th Annual NARUC Meeting La Quinta, CA
Lisa Frantzis,
Advanced Energy Economy November 15, 2016

3
New York is the state that has gone the furthest
on PBR, thus far
• Massachusetts: Energy Efficiency
• New York: REV Proceeding
• Pennsylvania: AEE PBR White Paper
• California: DER pilot in IDER Proceeding
PBR & Alternative Rate Making
State Activities
Other states discussing PBR: MN, MO, IL, MI, NH

4
Performance incentives in MA have been
very effective for Energy Efficiency (EE)
• Every 3 years Energy Efficiency Advisory Council
(EEAC) establishes targets for each utility
• PI based on Savings (kWhs and kWs) and Cost-
Effectiveness/Value
• 2013 – 2015: $80MM PI for MA; 2016 – 2018:
$100MM
• Incentive payouts based on performance:
• Threshold (75% of target), Design (100%), and
Exemplary (125%)
MA Programmatic Performance Incentive
5
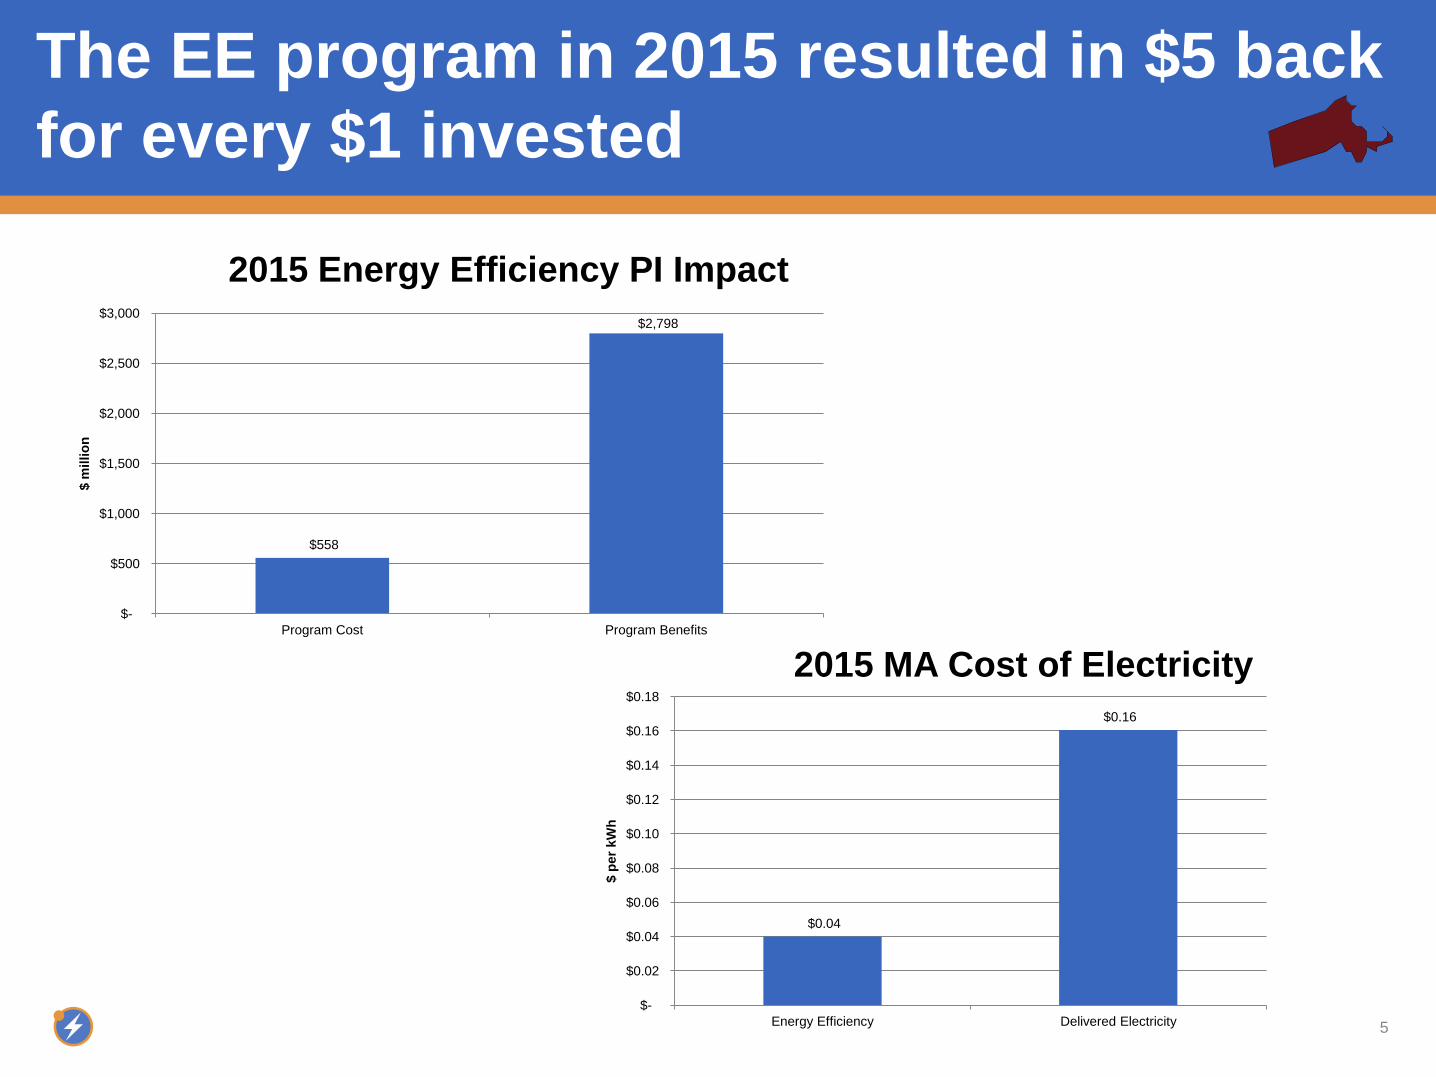
The EE program in 2015 resulted in $5 back
for every $1 invested
$558
$2,798
$-
$500
$1,000
$1,500
$2,000
$2,500
$3,000
Program Cost Program Benefits
$ m
illio
n
2015 Energy Efficiency PI Impact
$0.04
$0.16
$-
$0.02
$0.04
$0.06
$0.08
$0.10
$0.12
$0.14
$0.16
$0.18
Energy Efficiency Delivered Electricity
$ p
er
kW
h
2015 MA Cost of Electricity
6
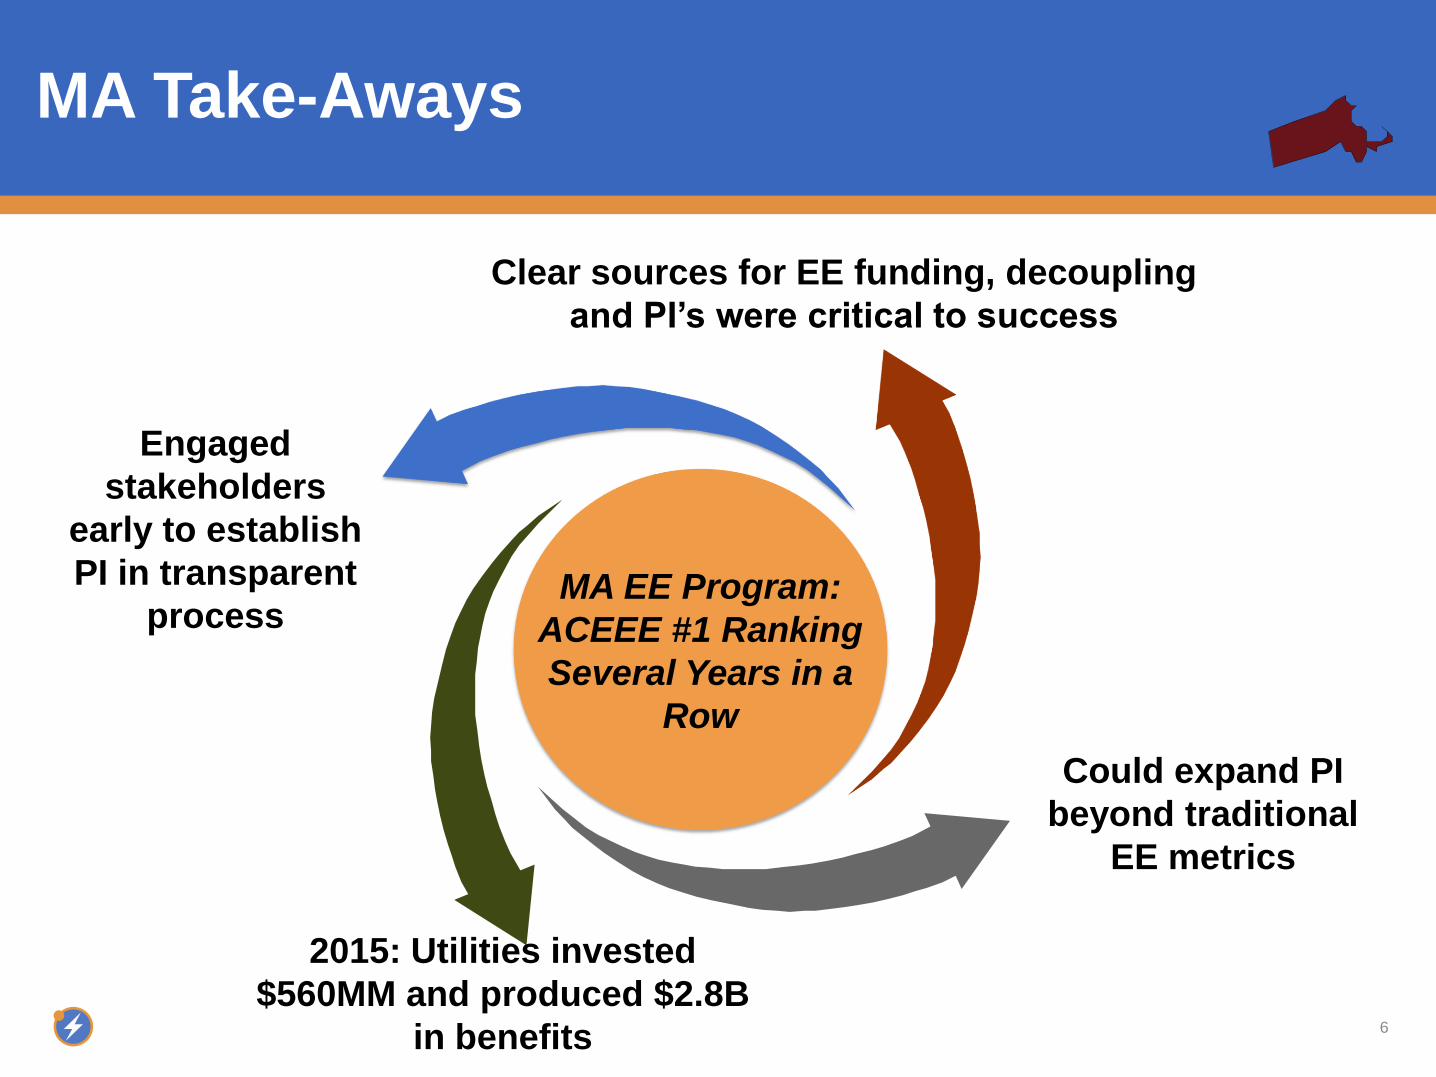
MA Take-Aways
MA EE Program:
ACEEE #1 Ranking
Several Years in a
Row
Engaged
stakeholders
early to establish
PI in transparent
process
Could expand PI
beyond traditional
EE metrics
Clear sources for EE funding, decoupling
and PI’s were critical to success
2015: Utilities invested
$560MM and produced $2.8B
in benefits
7
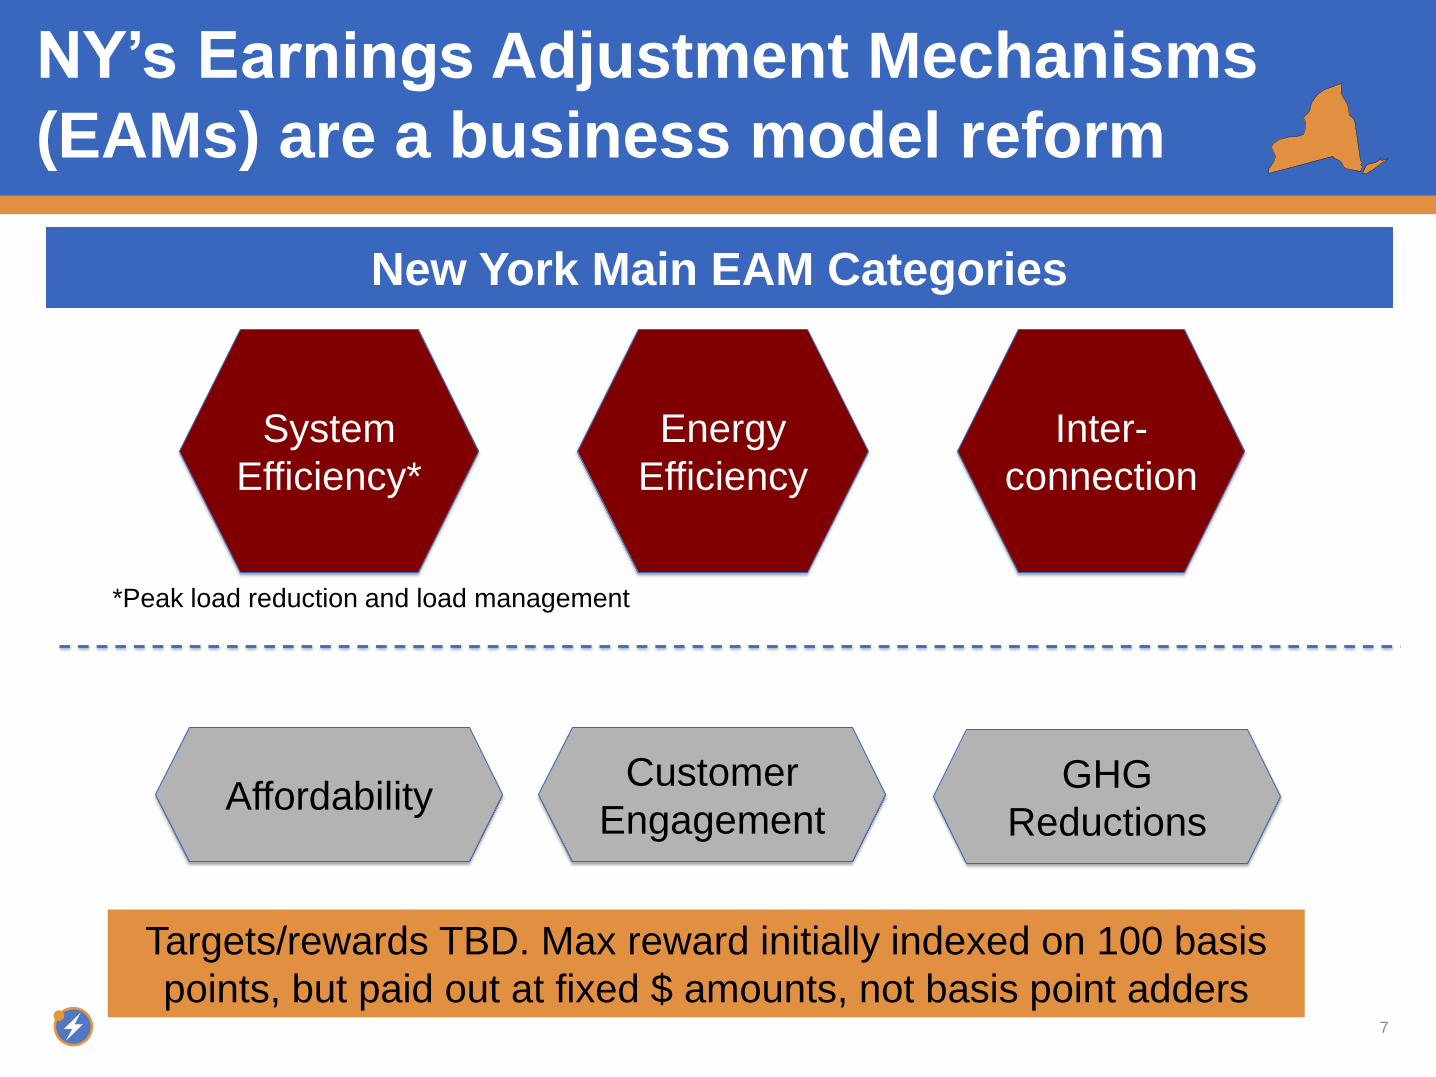
NY’s Earnings Adjustment Mechanisms
(EAMs) are a business model reform
System
Efficiency*
Inter-
connection
Energy
Efficiency
Targets/rewards TBD. Max reward initially indexed on 100 basis
points, but paid out at fixed $ amounts, not basis point adders
Customer
Engagement
New York Main EAM Categories
Affordability
*Peak load reduction and load management
GHG
Reductions
8
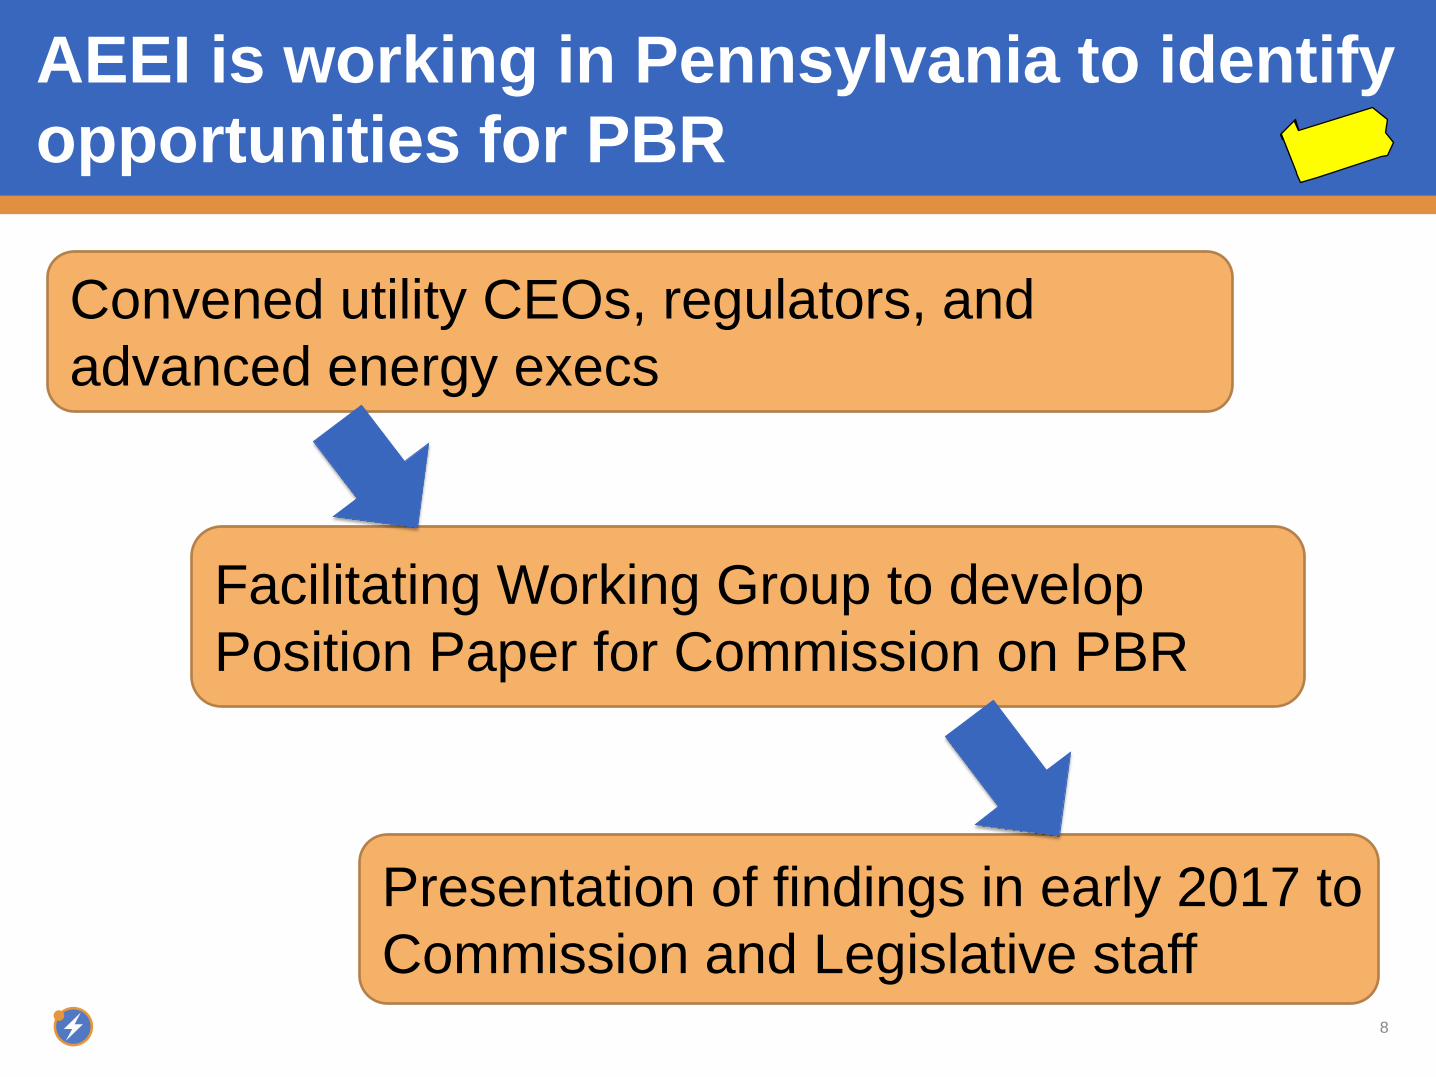
AEEI is working in Pennsylvania to identify
opportunities for PBR
Convened utility CEOs, regulators, and
advanced energy execs
Facilitating Working Group to develop
Position Paper for Commission on PBR
Presentation of findings in early 2017 to
Commission and Legislative staff

9
AEEI and key stakeholders have identified
performance categories for PA
Customer
Empowerment
Operational
Efficiency &
Reliability
AEEI Pennsylvania Initial PBR Categories
Environmental
Sustainability
Market
Innovation
10
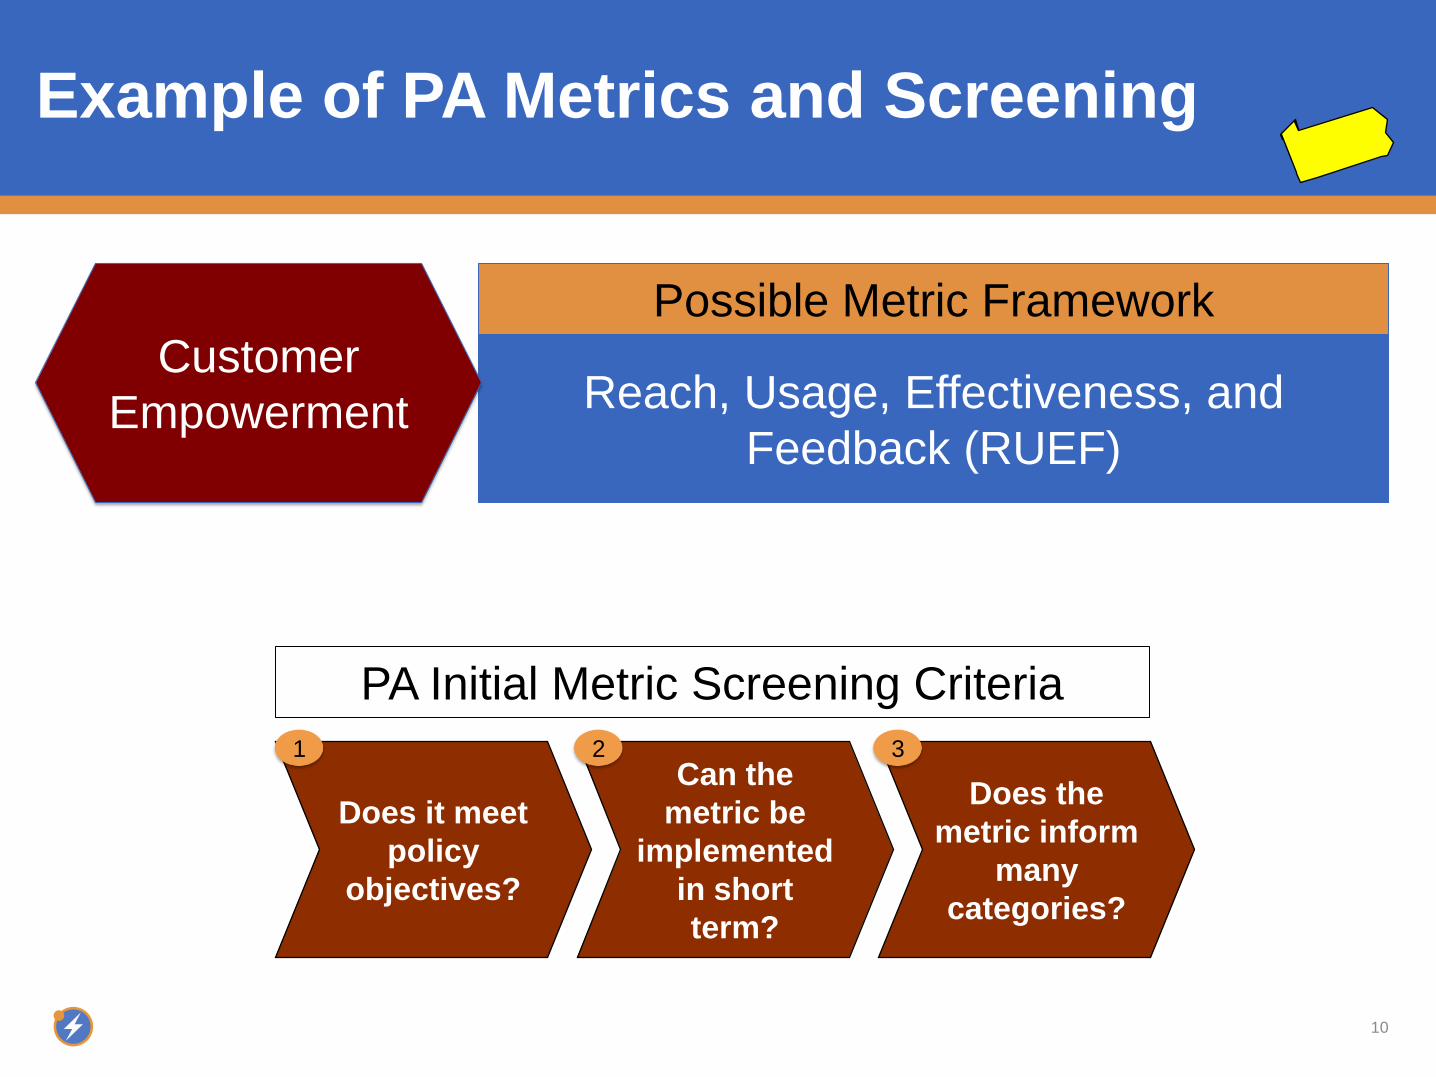
Example of PA Metrics and Screening
Reach, Usage, Effectiveness, and
Feedback (RUEF)
Customer
Empowerment
Possible Metric Framework
Does the
metric inform
many
categories?
Does it meet
policy
objectives?
Can the
metric be
implemented
in short
term?
1 2 3
PA Initial Metric Screening Criteria
11
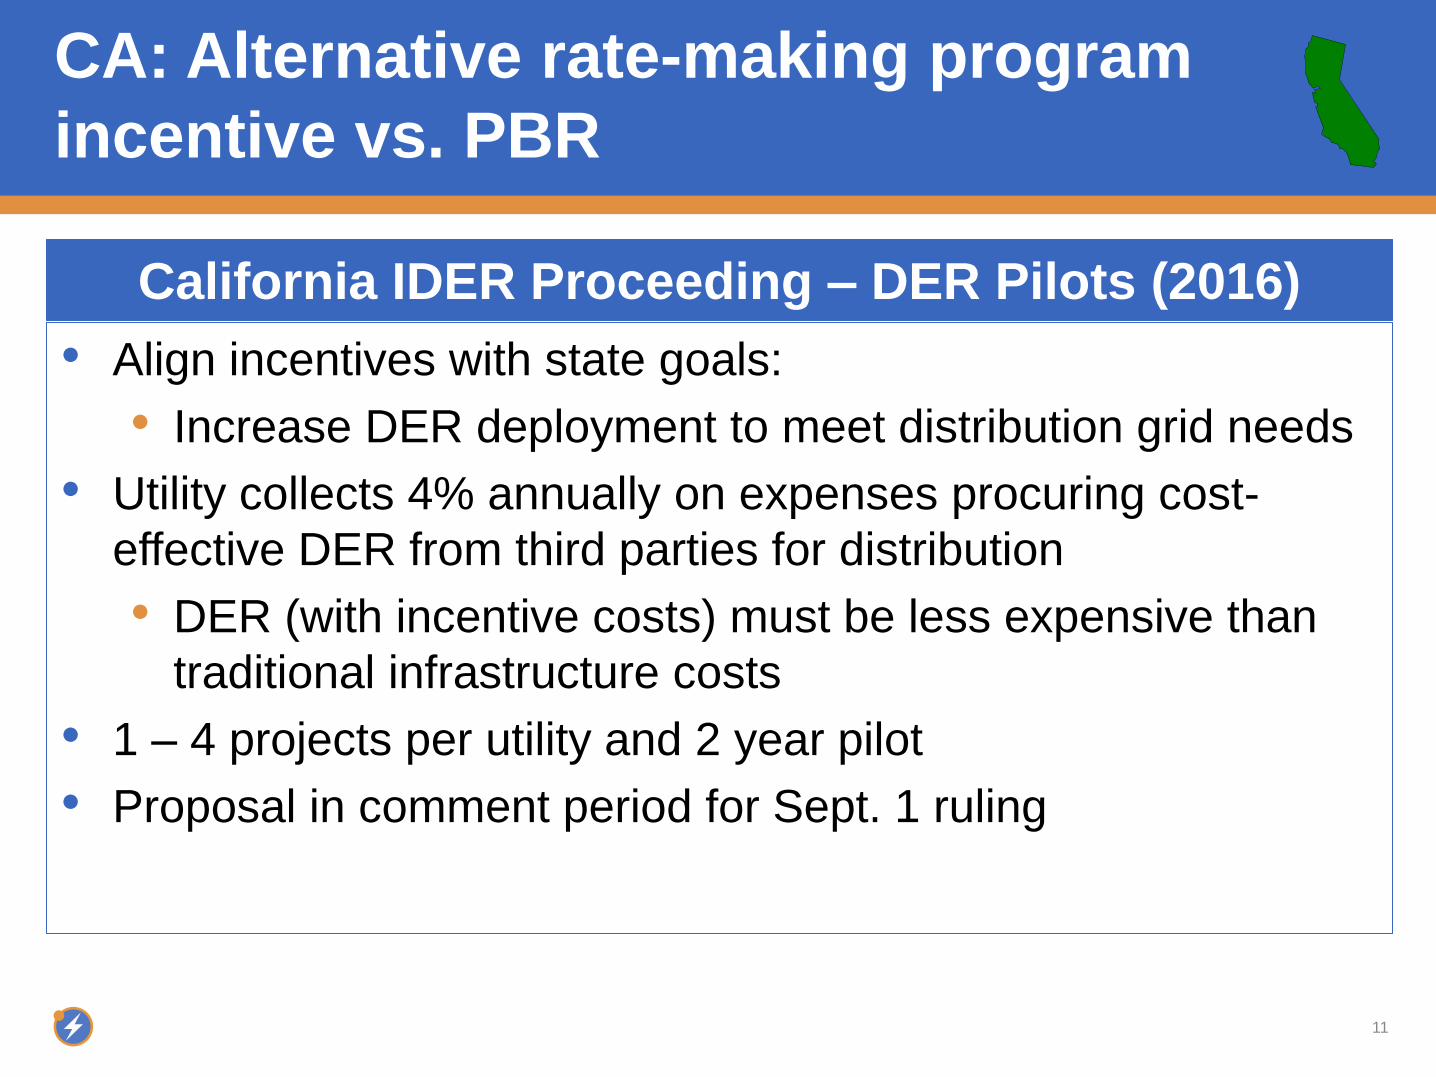
• Align incentives with state goals:
• Increase DER deployment to meet distribution grid needs
• Utility collects 4% annually on expenses procuring cost-
effective DER from third parties for distribution
• DER (with incentive costs) must be less expensive than
traditional infrastructure costs
• 1 – 4 projects per utility and 2 year pilot
• Proposal in comment period for Sept. 1 ruling
California IDER Proceeding – DER Pilots (2016)
CA: Alternative rate-making program
incentive vs. PBR
12
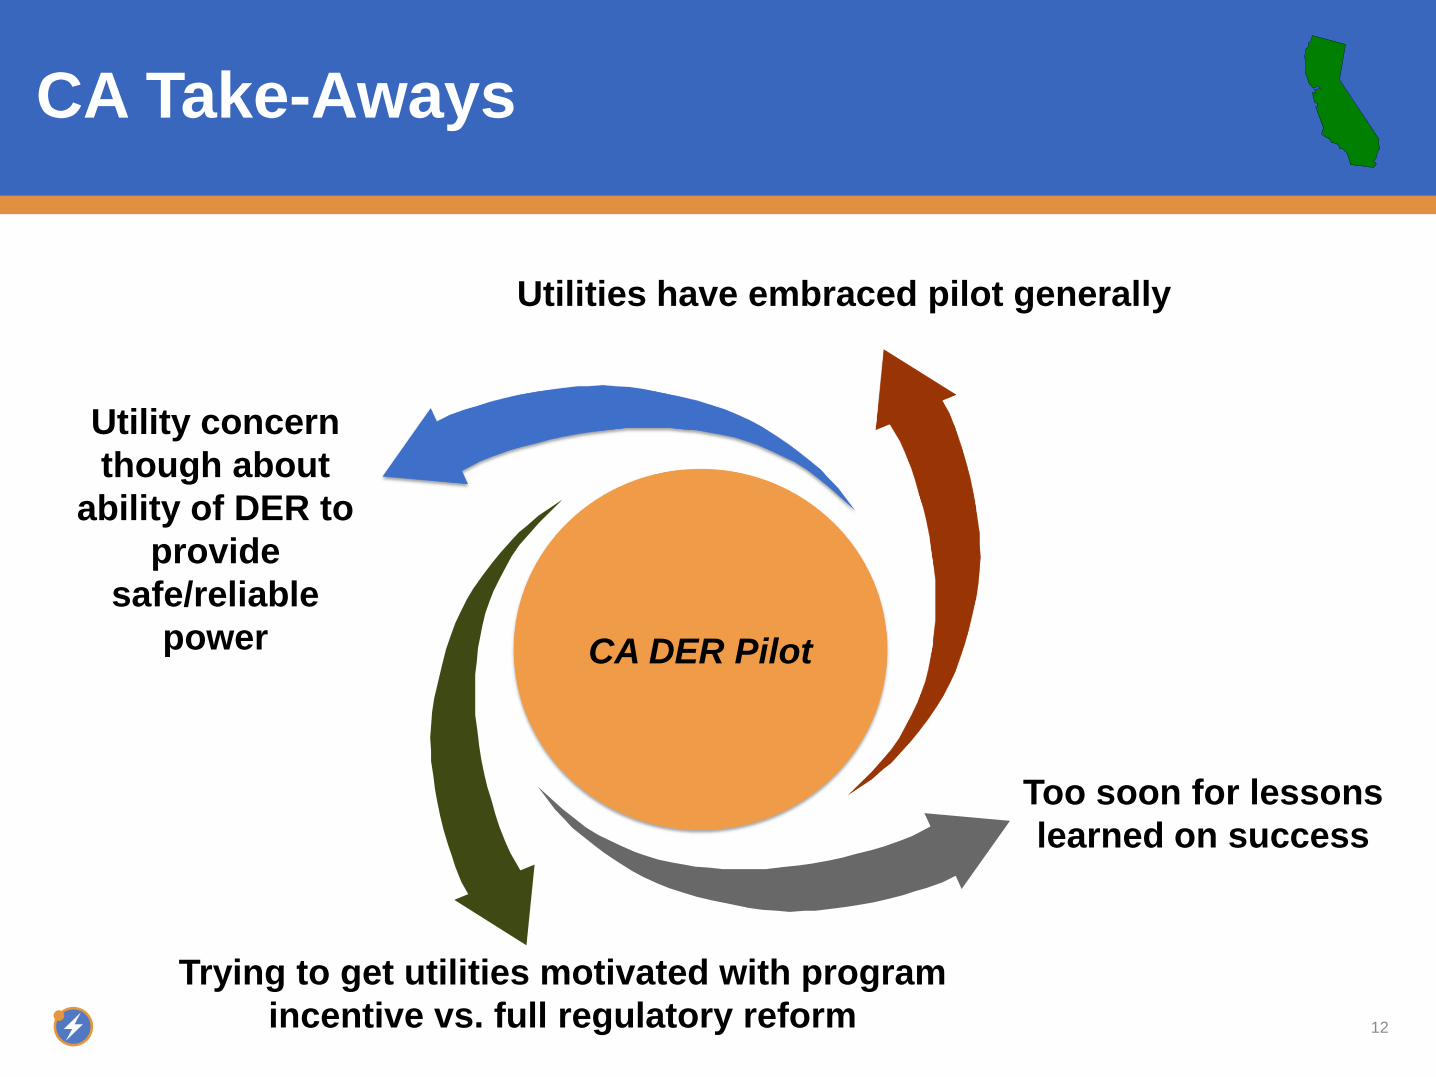
CA Take-Aways
CA DER Pilot
Utility concern
though about
ability of DER to
provide
safe/reliable
power
Too soon for lessons
learned on success
Utilities have embraced pilot generally
Trying to get utilities motivated with program
incentive vs. full regulatory reform

13
PBR enables utilities to choose to spend less
and earn more
• The MA EE experience shows rewarding performance can
work well if designed right
• NY is the only state considering utility wide “PBR reform”
• Not a simple process, a lot of the onus is on the utilities, and
much is still TBD
• PBR offers the potential to achieve policy objectives/improve
public welfare while also improving the viability of the utility
business model
• When considering the challenges to the current utility business
model, AEE expects PBR/alternative rate making will be taken
up by more states
Conclusions

14
AEE: The Power of Many to Transform
Policy
Leaders
hip
Council
Busin
ess C
ouncil
15 www.aee.net / @aeenet / Washington DC San Francisco Boston / powersuite.aee.net
Thank you!
Lisa Frantzis
Senior Vice President
21st Century Energy System

16
PERFORMAN
CE BASED
REGULATION WHY & HOW
Sonia Aggarwal November 15, 2016
17 WWW.AMERICASPOWERPLAN.COM
18
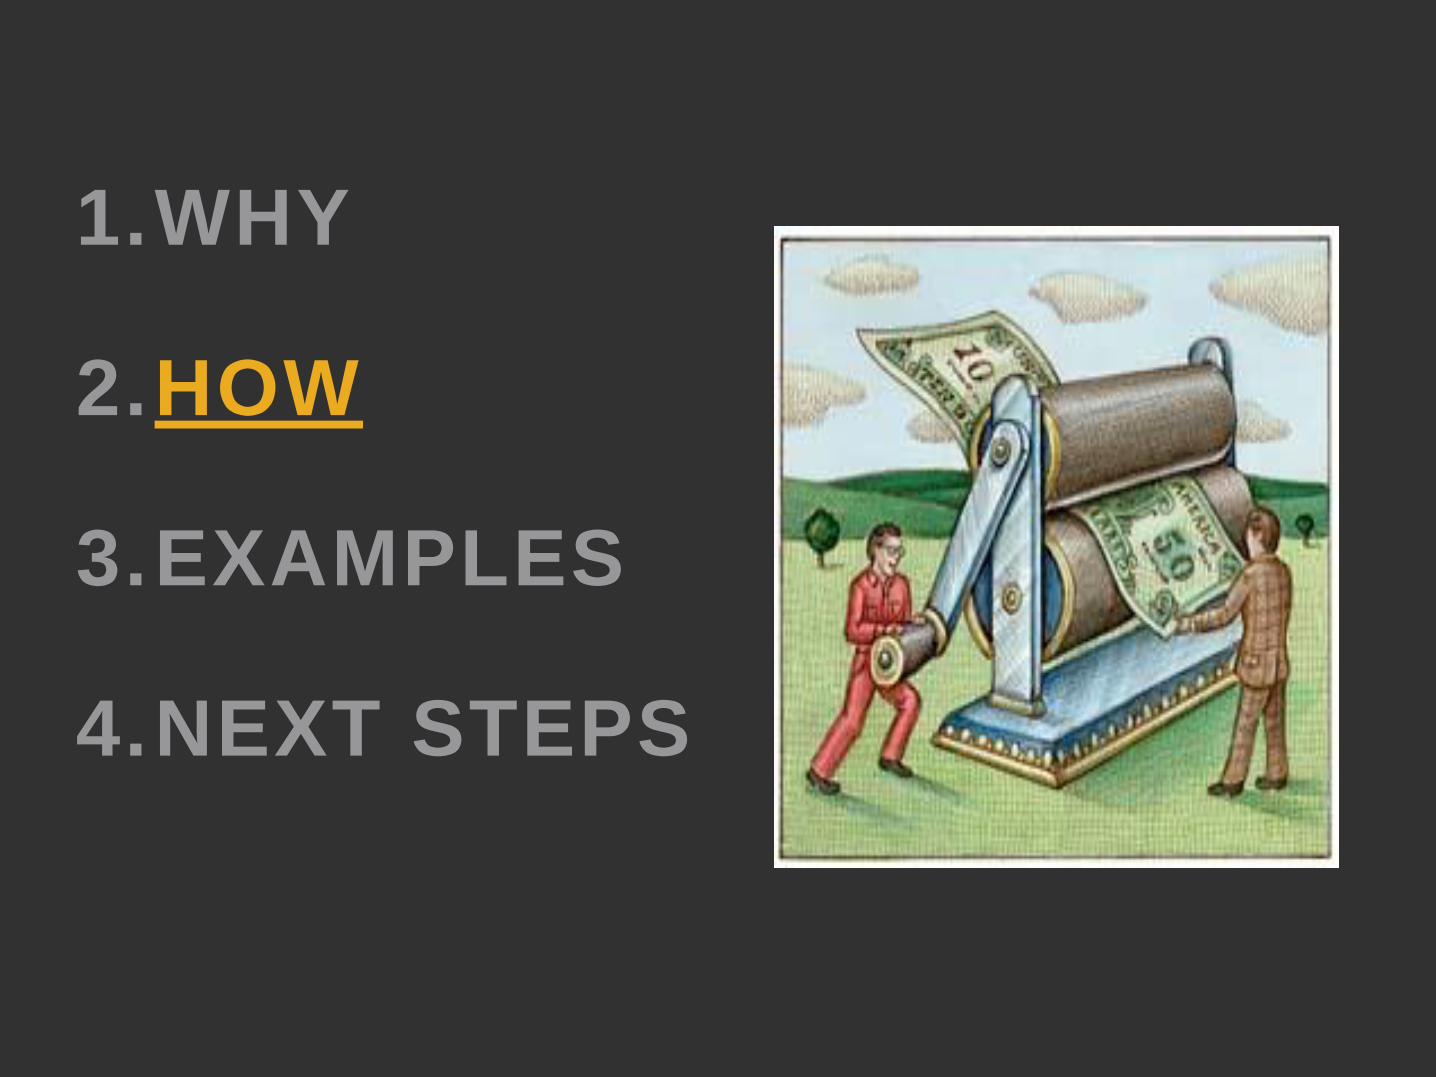
1.WHY
2.HOW
3.EXAMPLES
4.NEXT STEPS
19
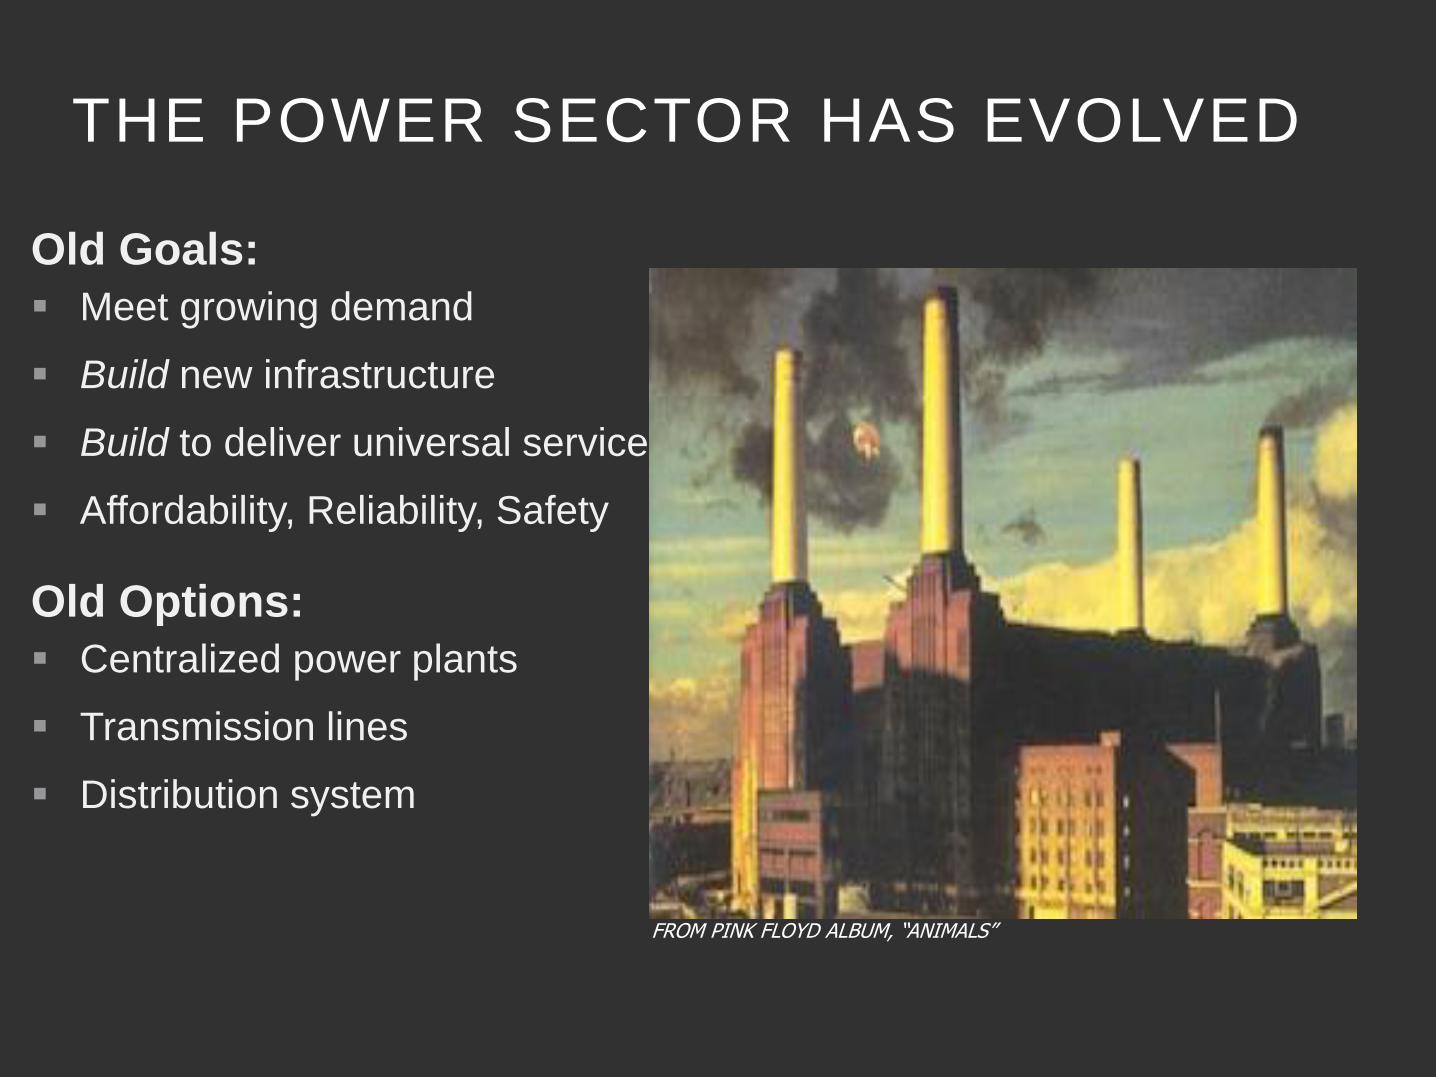
THE POWER SECTOR HAS EVOLVED
Old Goals:
Meet growing demand
Build new infrastructure
Build to deliver universal service
Affordability, Reliability, Safety
Old Options:
Centralized power plants
Transmission lines
Distribution system
FROM PINK FLOYD ALBUM, “ANIMALS”
20
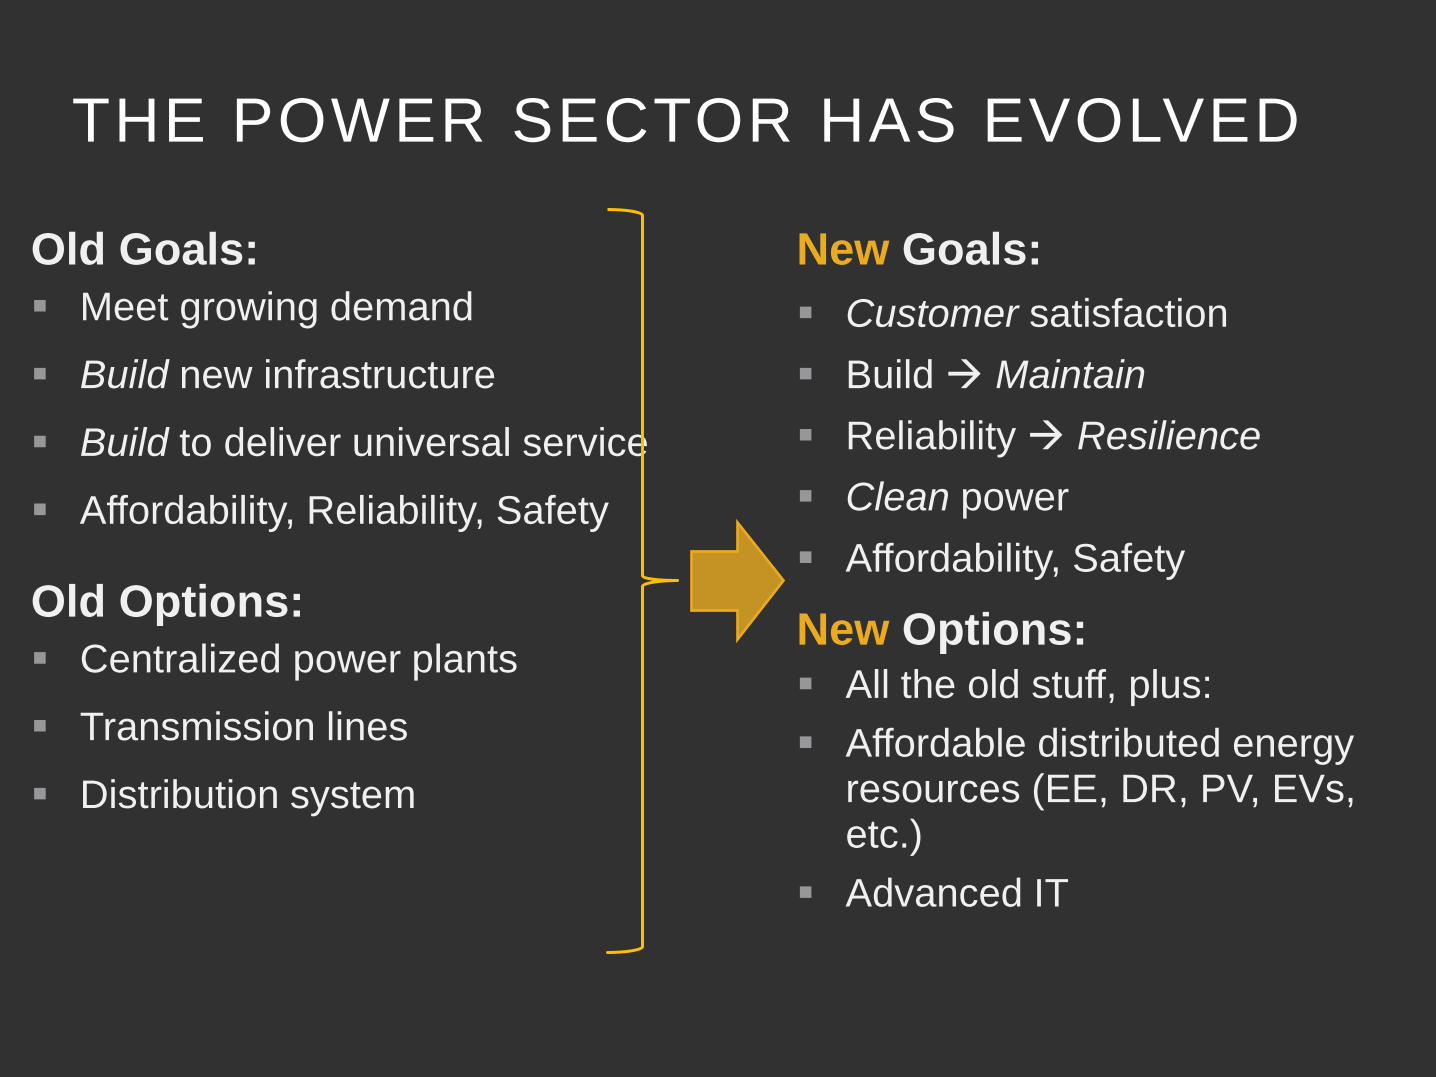
THE POWER SECTOR HAS EVOLVED
Old Goals:
Meet growing demand
Build new infrastructure
Build to deliver universal service
Affordability, Reliability, Safety
Old Options:
Centralized power plants
Transmission lines
Distribution system
New Goals:
Customer satisfaction
Build Maintain
Reliability Resilience
Clean power
Affordability, Safety
New Options:
All the old stuff, plus:
Affordable distributed energy resources (EE, DR, PV, EVs, etc.)
Advanced IT
21
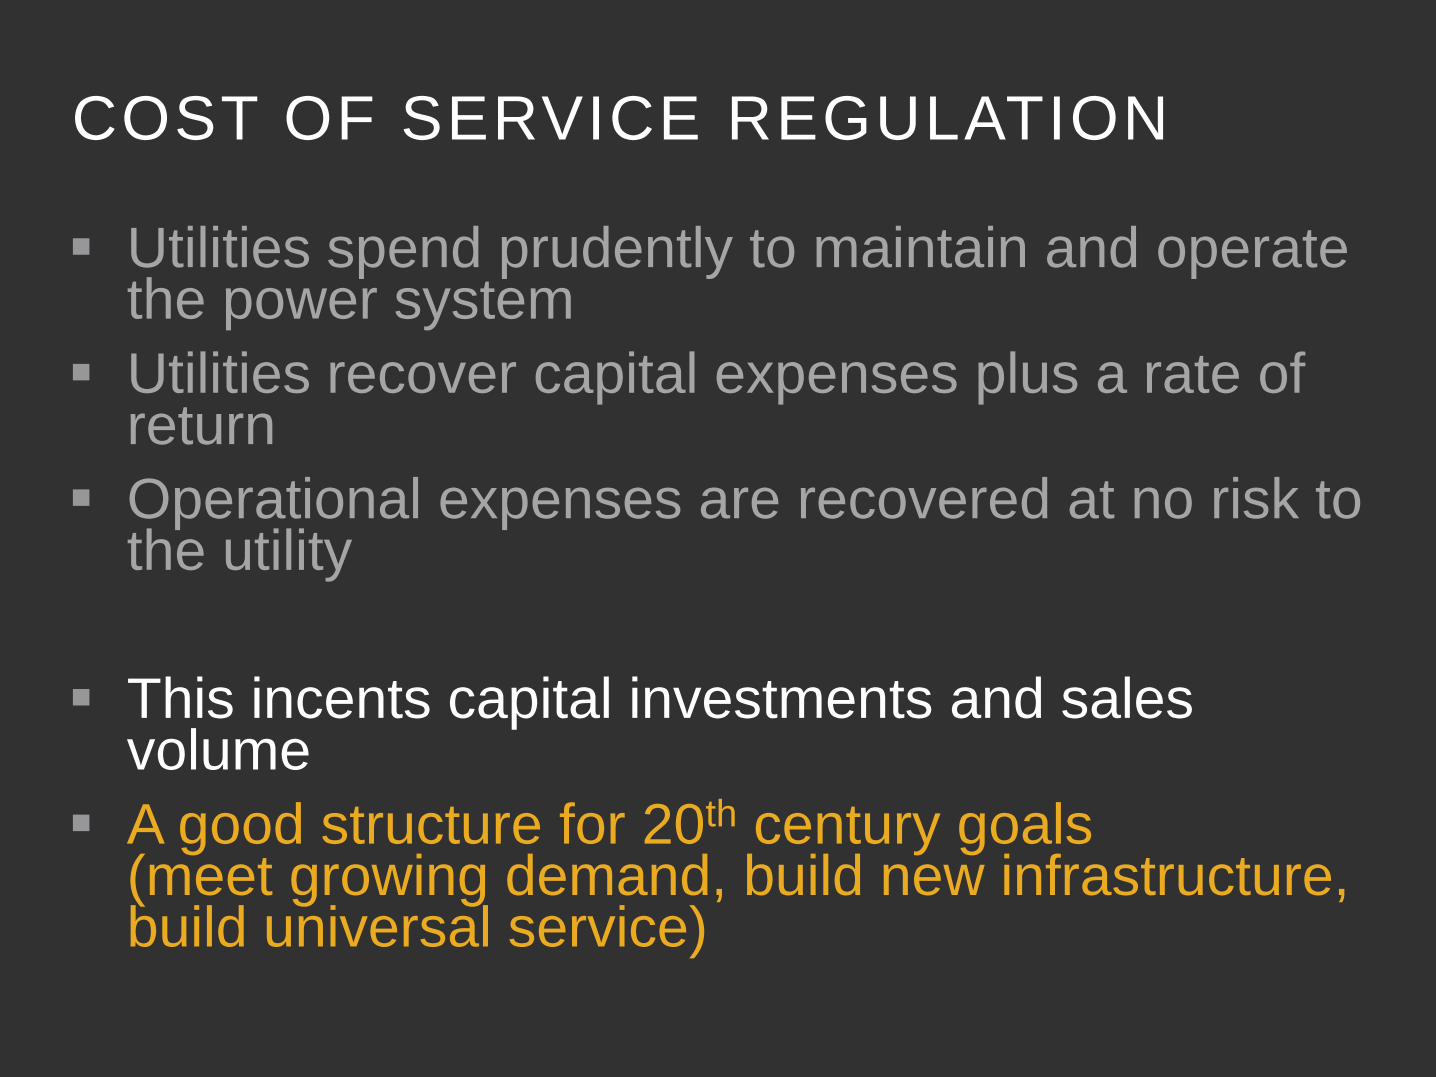
COST OF SERVICE REGULATION
Utilities spend prudently to maintain and operate the power system
Utilities recover capital expenses plus a rate of return
Operational expenses are recovered at no risk to the utility
This incents capital investments and sales volume
A good structure for 20th century goals (meet growing demand, build new infrastructure, build universal service)

22
MODERN GOALS FOR THE POWER
SYSTEM
Affordable
Resilient
Clean
Safe
23
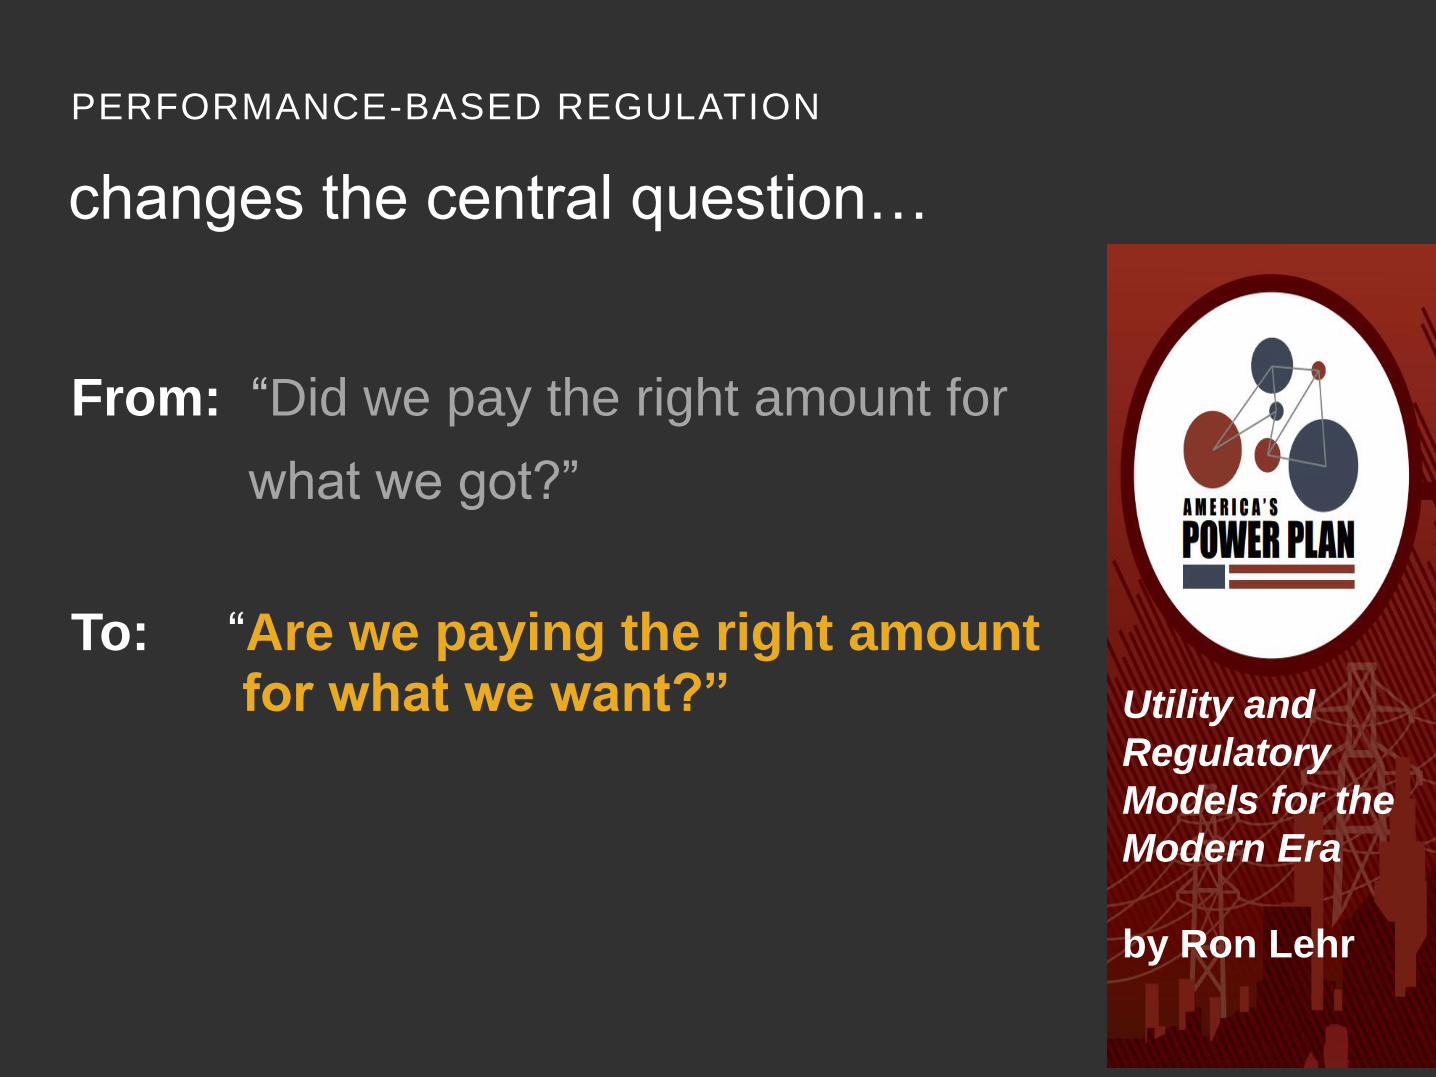
From: “Did we pay the right amount for
what we got?”
To: “Are we paying the right amount for what we want?” Utility and
Regulatory
Models for the
Modern Era
by Ron Lehr
changes the central question…
PERFORMANCE-BASED REGULATION
24
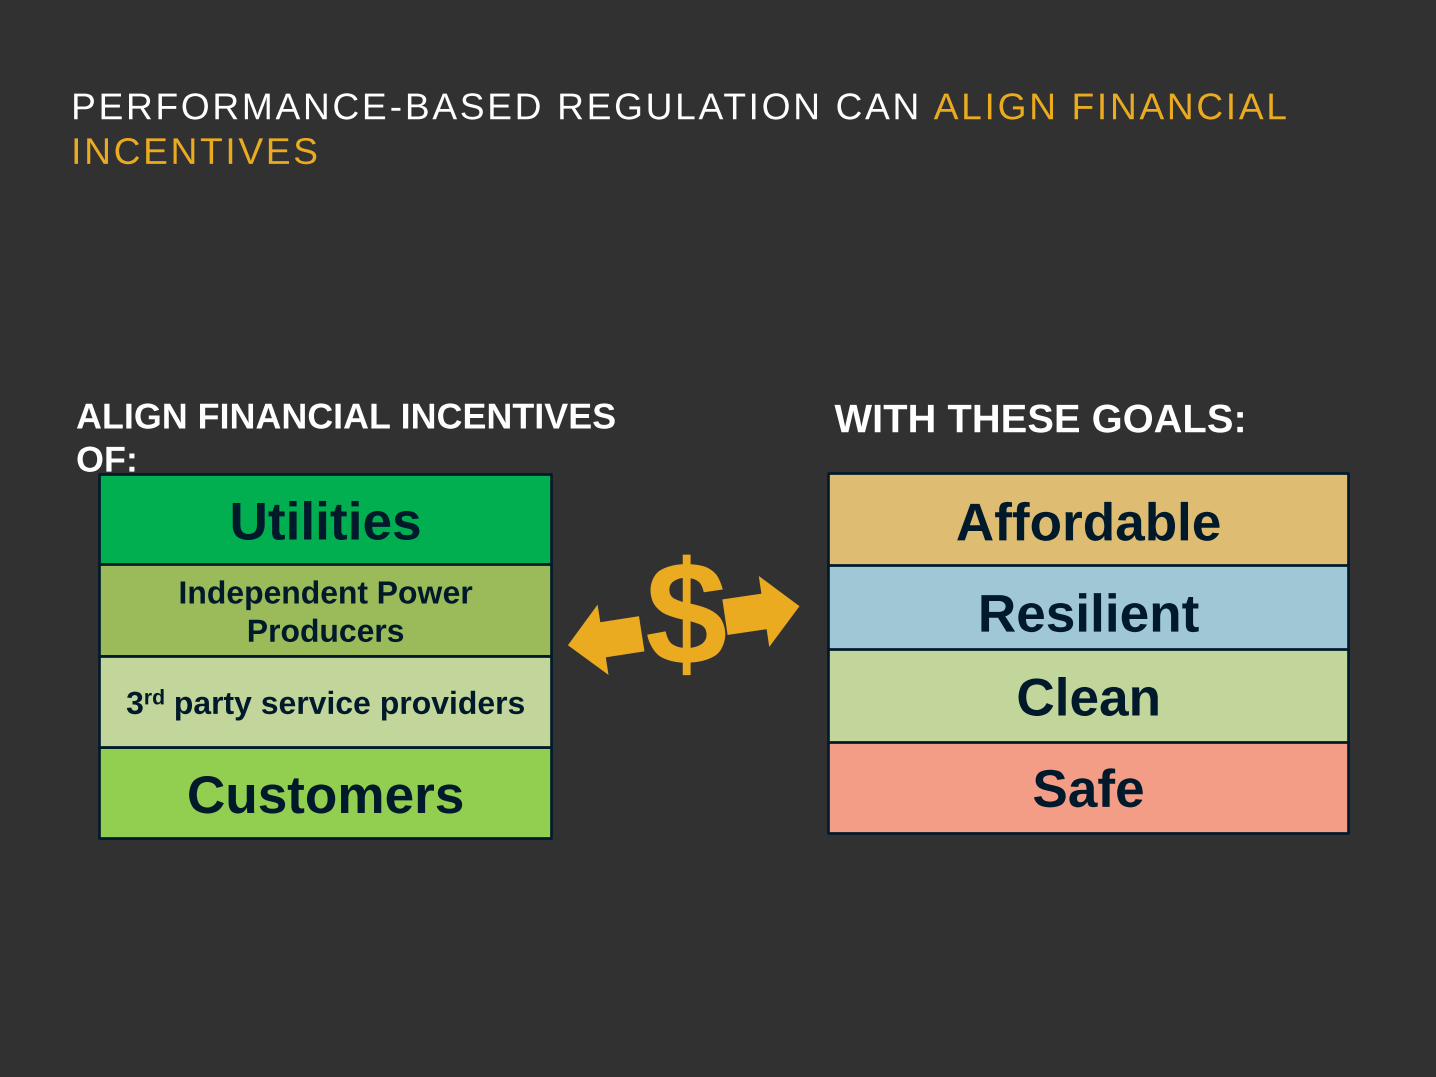
Safe
ALIGN FINANCIAL INCENTIVES
OF:
Utilities
Customers
Independent Power
Producers
3rd party service providers
$ Affordable
Resilient
Clean
WITH THESE GOALS:
PERFORMANCE-BASED REGULATION CAN ALIGN FINANCIAL
INCENTIVES
25
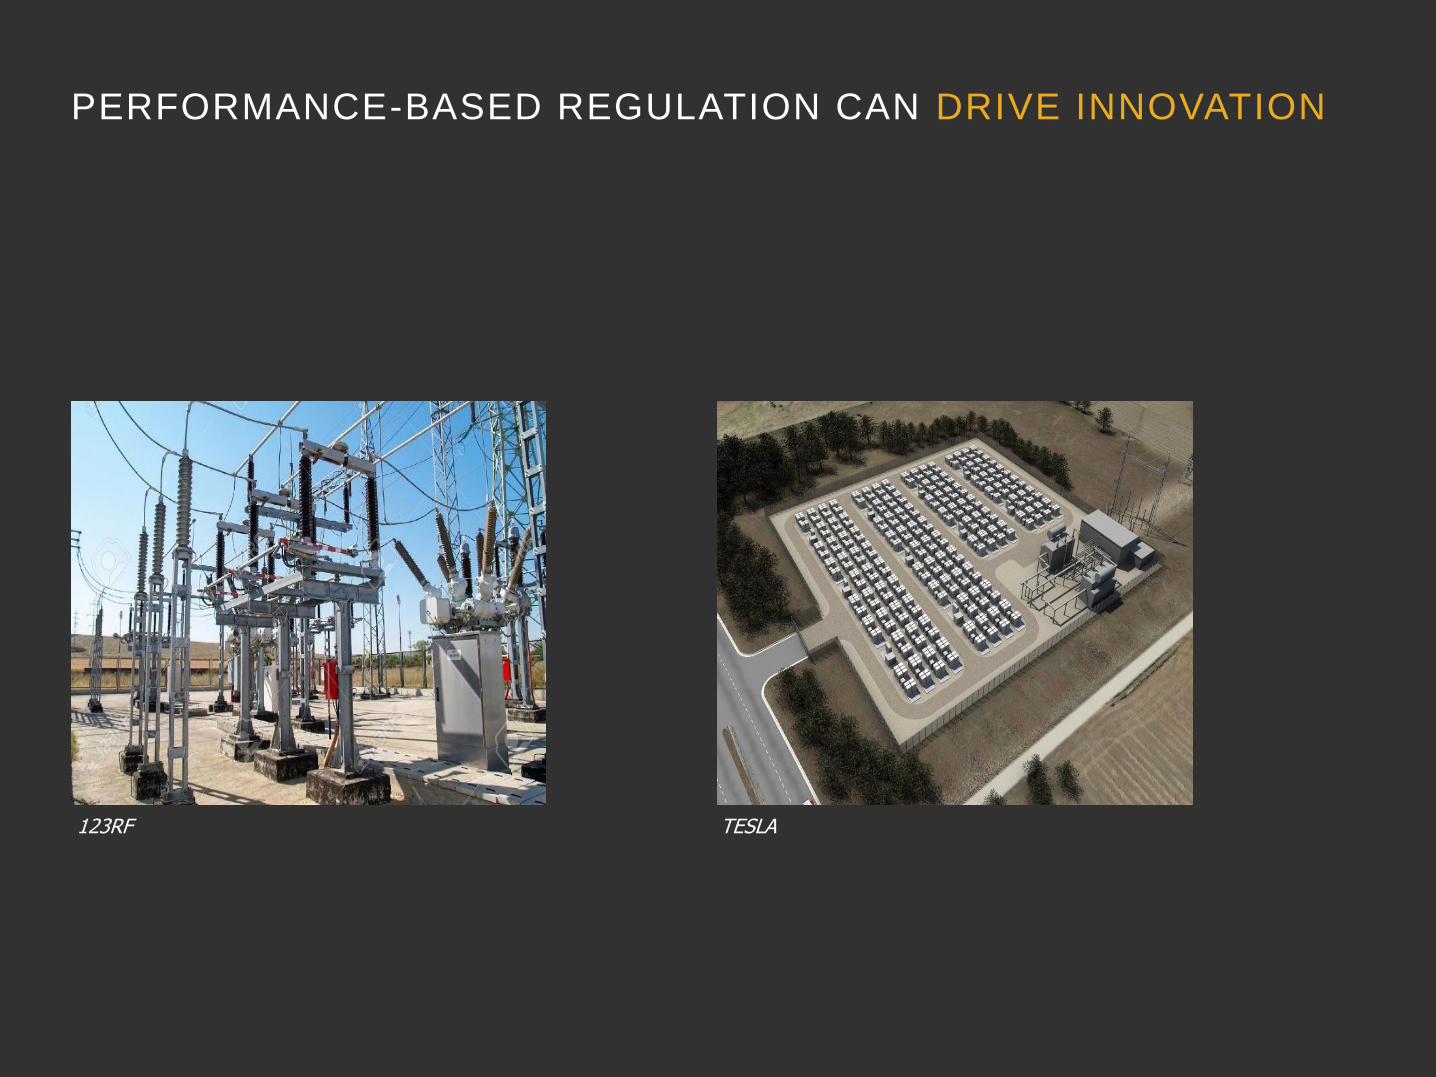
PERFORMANCE-BASED REGULATION CAN DRIVE INNOVATION
123RF TESLA
26
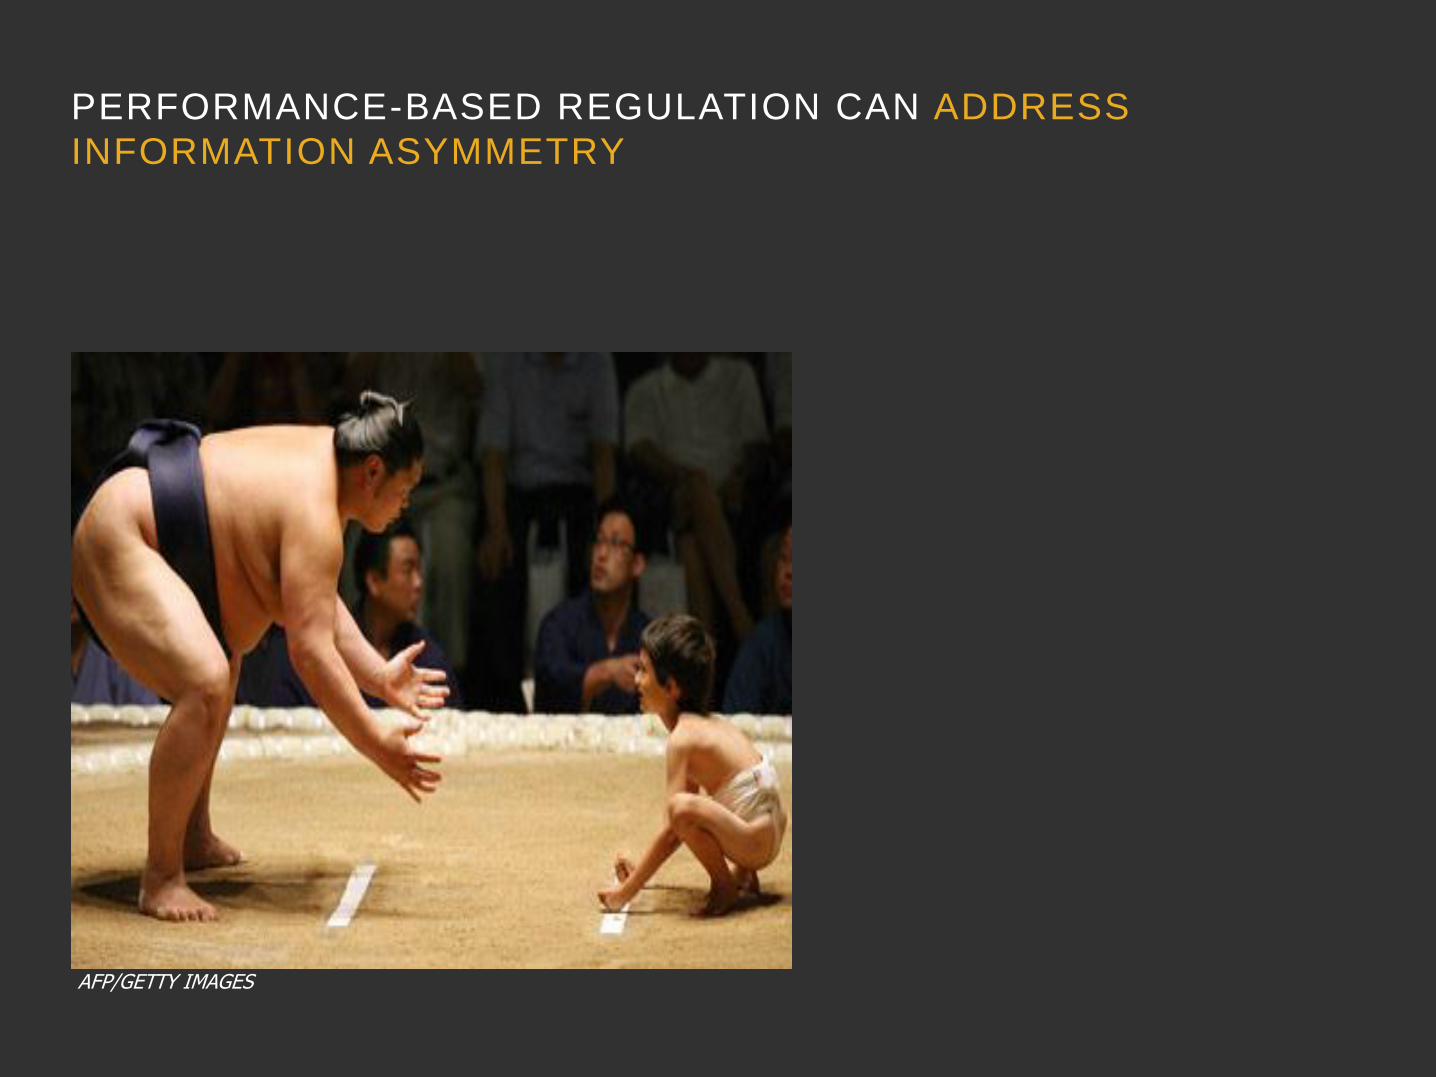
PERFORMANCE-BASED REGULATION CAN ADDRESS
INFORMATION ASYMMETRY
AFP/GETTY IMAGES

27
PERFORMANCE-BASED REGULATION
WORKS FOR THE INVESTOR-OWNED RESIDUAL
MONOPOLY
Works in both
vertically-integrated &
restructured markets!
Holds great potential
but is by no means
the only useful
direction for future
regulation!
28
1.WHY
2.HOW
3.EXAMPLES
4.NEXT STEPS

29
Regulators
Set quantitative
performance
goals
Establish
reward &
penalty
structure
Utilities
Meet goals
Receive
rewards and/or
penalties
• Equity
• Customer
satisfaction
• Affordable bills
• Reliable service
• System-wide least
cost
• Effective facilitation
of open access
• Reliability
• Clean energy
• Innovation
Retail Level, e.g.:
Wholesale Level,
e.g.:
Outcomes Policymakers
Clarify policy
priorities
Work with
regulators
POLICY SOLUTION PERFORMANCE-BASED REGULATION
Already a
standard
s driven
industry

30
PRIORITIZE GOALS, ESTABLISH
METRICS
Affordable bills ($/mo); peak reduction (MW)
Resilient SAIDI/SAIFI for critical feeders
Clean lbs CO2/MWh; kWh/customer
Safe minutes to respond to emergency; days to
repair
Some examples…

31
1.WHY
2.HOW
3.EXAMPLES
4.NEXT STEPS
32
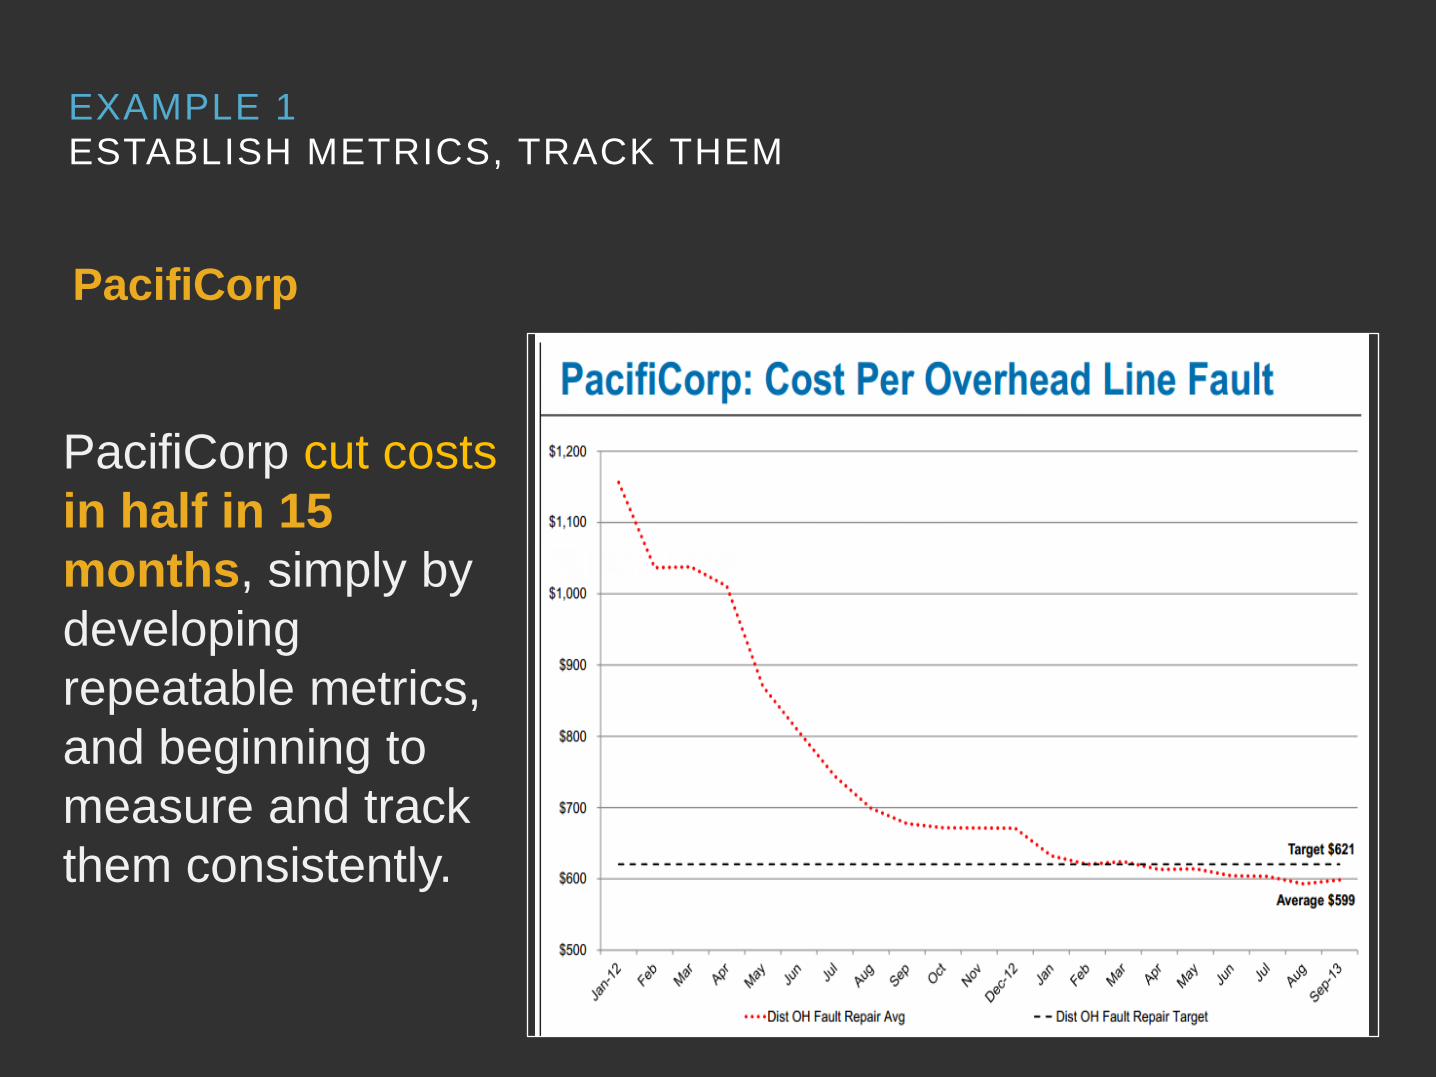
PacifiCorp cut costs
in half in 15
months, simply by
developing
repeatable metrics,
and beginning to
measure and track
them consistently.
EXAMPLE 1
ESTABLISH METRICS, TRACK THEM
PacifiCorp
33
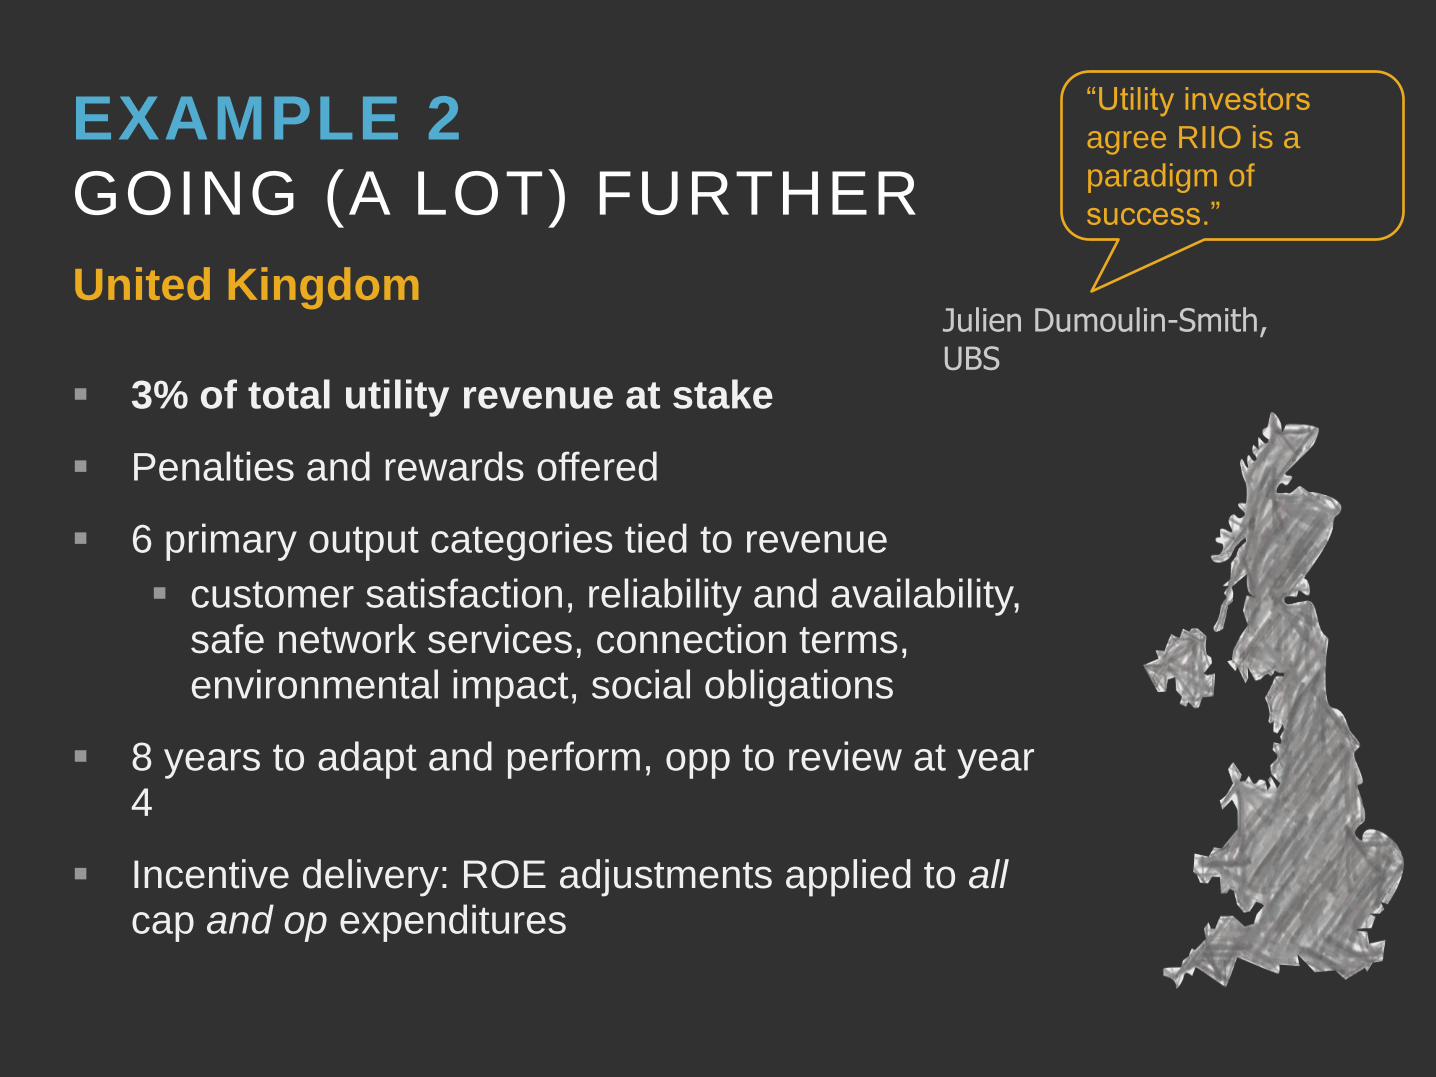
EXAMPLE 2
GOING (A LOT) FURTHER
3% of total utility revenue at stake
Penalties and rewards offered
6 primary output categories tied to revenue
customer satisfaction, reliability and availability, safe network services, connection terms, environmental impact, social obligations
8 years to adapt and perform, opp to review at year 4
Incentive delivery: ROE adjustments applied to all cap and op expenditures
United Kingdom
“Utility investors
agree RIIO is a
paradigm of
success.”
Julien Dumoulin-Smith, UBS

34
1.WHY
2.HOW
3.EXAMPLES
4.NEXT STEPS

35
NEXT STEPS TO CONSIDER
1. Agree on top goals for your state’s power sector. What value can utilities deliver to citizens and customers?
2. Identify appropriate quantitative performance metrics under each goal. Work with the Commission to establish a transparent methodology for calculating performance on each metric.
3. Begin to measure and track performance. Support pilots.
4. Grow the share of utility revenue tied to performance once the metrics and methodologies are well-understood.

36
ALSO….
Come play our GAME to explore utility decision-making under different regulatory models. You will get to hang out with Miles Keogh if you do.
Apply to explore these questions and more via the National Governors’ Association’s policy academy on power sector modernization.
37
THANK
YOU
@USPOWERPLAN
@ENERGYINNOVLLC
@CLEANTECHSONIA
WWW.AMERICASPOWERPLAN.COM
WWW.ENERGYINNOVATION.ORG
38
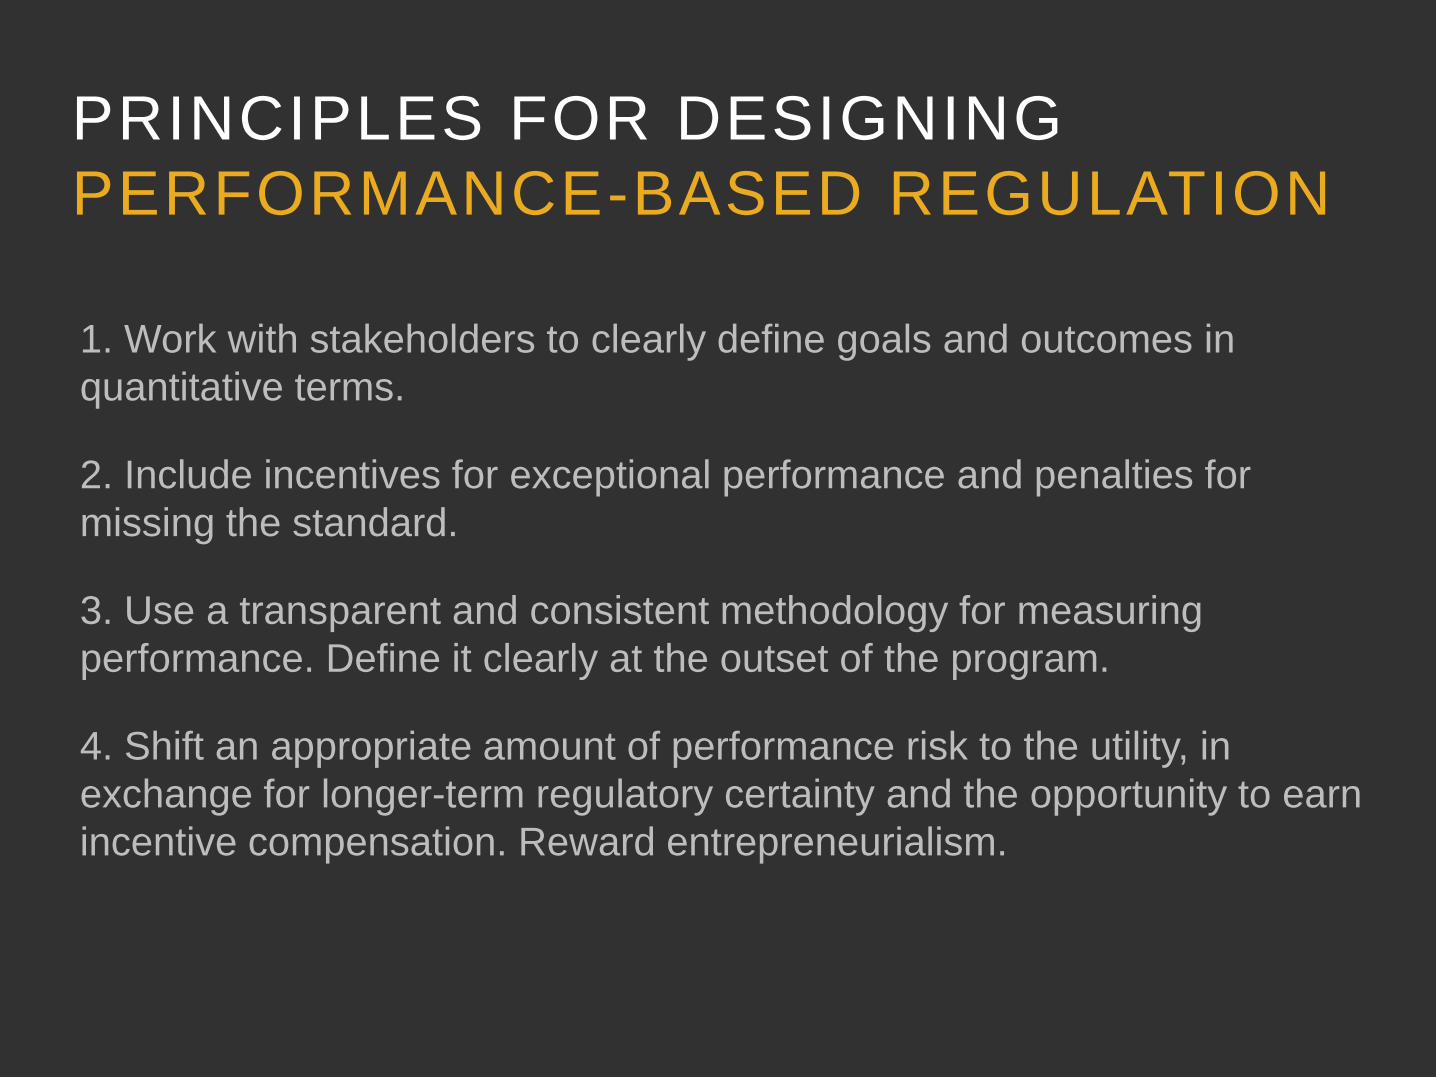
1. Work with stakeholders to clearly define goals and outcomes in
quantitative terms.
2. Include incentives for exceptional performance and penalties for
missing the standard.
3. Use a transparent and consistent methodology for measuring
performance. Define it clearly at the outset of the program.
4. Shift an appropriate amount of performance risk to the utility, in
exchange for longer-term regulatory certainty and the opportunity to earn
incentive compensation. Reward entrepreneurialism.
PRINCIPLES FOR DESIGNING
PERFORMANCE-BASED REGULATION
39
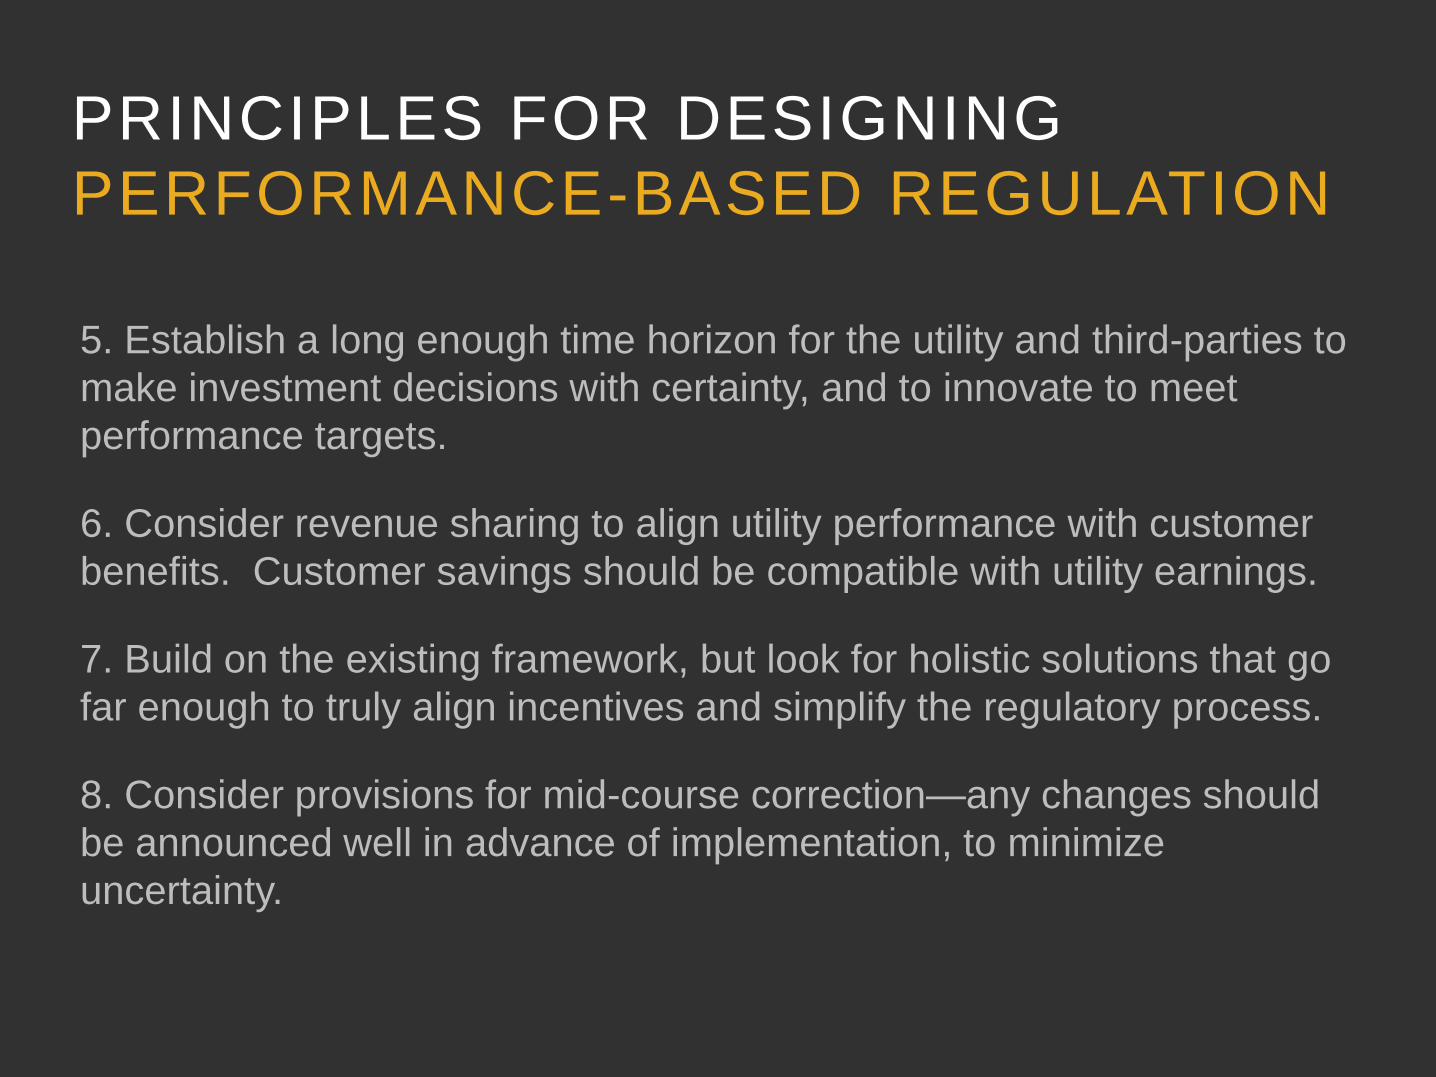
PRINCIPLES FOR DESIGNING
PERFORMANCE-BASED REGULATION
5. Establish a long enough time horizon for the utility and third-parties to
make investment decisions with certainty, and to innovate to meet
performance targets.
6. Consider revenue sharing to align utility performance with customer
benefits. Customer savings should be compatible with utility earnings.
7. Build on the existing framework, but look for holistic solutions that go
far enough to truly align incentives and simplify the regulatory process.
8. Consider provisions for mid-course correction—any changes should
be announced well in advance of implementation, to minimize
uncertainty.
40
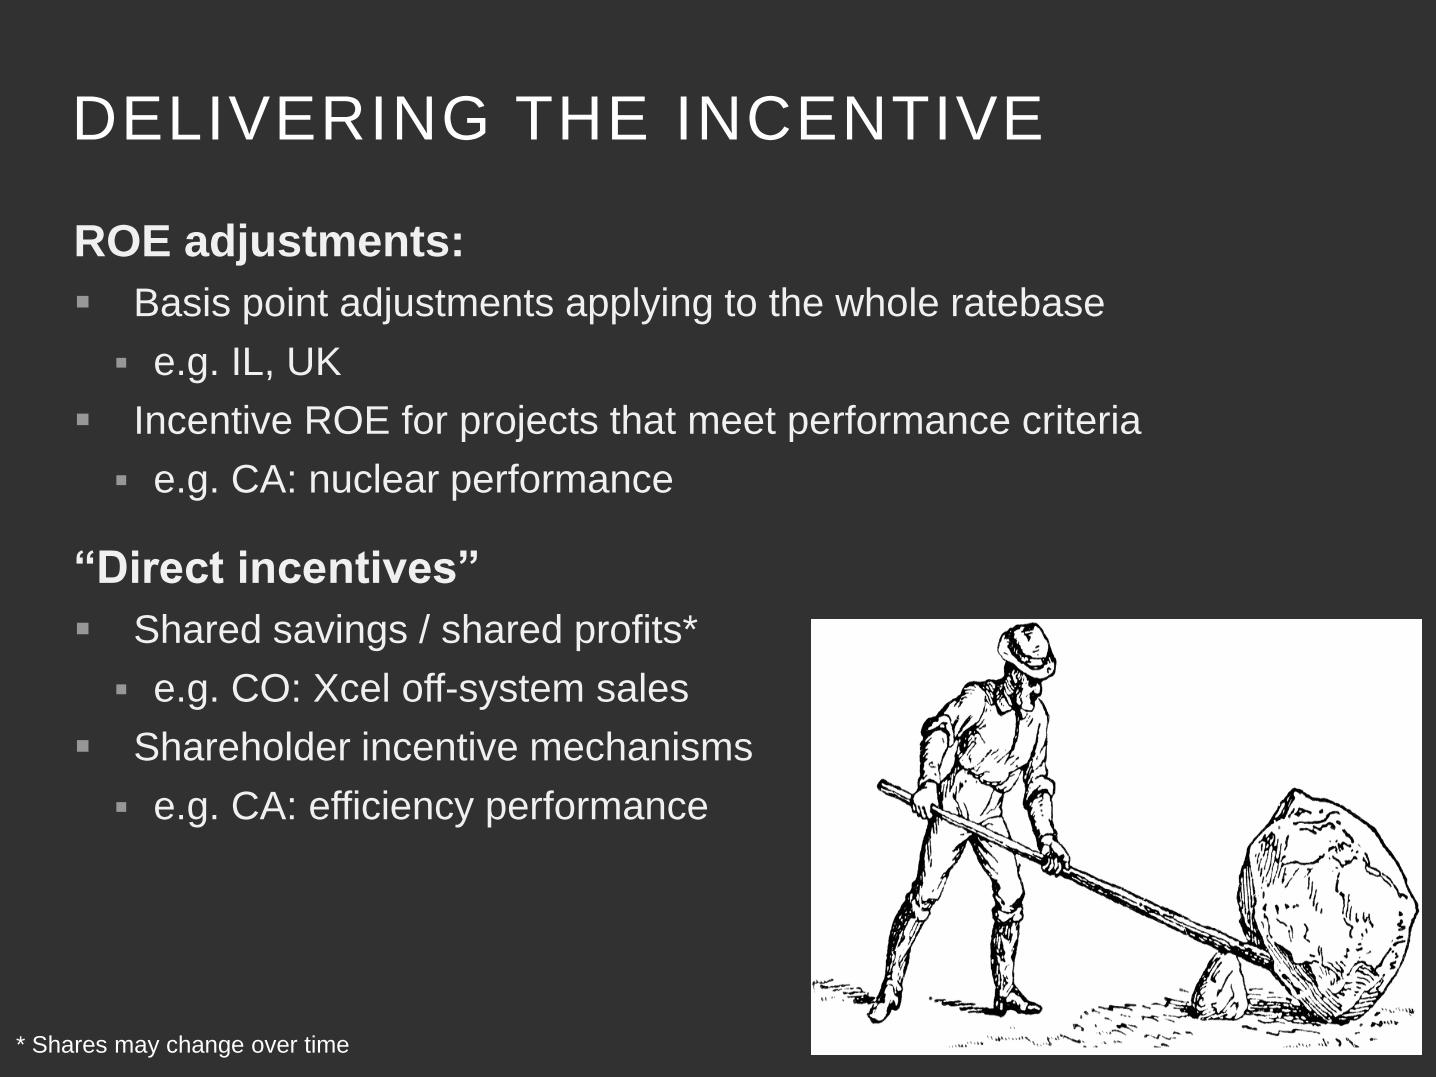
DELIVERING THE INCENTIVE
* Shares may change over time
ROE adjustments:
Basis point adjustments applying to the whole ratebase
e.g. IL, UK
Incentive ROE for projects that meet performance criteria
e.g. CA: nuclear performance
“Direct incentives”
Shared savings / shared profits*
e.g. CO: Xcel off-system sales
Shareholder incentive mechanisms
e.g. CA: efficiency performance

41
ROE adjustments: Basis point adjustments applying to the whole ratebase
e.g. IL, UK
Incentive ROE for projects that meet performance criteria
e.g. NY – Brooklyn Queens Demand Management Project
“Direct incentives” Shared savings / shared profits*
e.g. HI: shared fuel savings
Shareholder incentive mechanisms
e.g. CA: efficiency performance
DELIVERING THE INCENTIVE
* Shares may change over time
42
HERE COMES SOME FINANCE….
Alfred Kahn

43
THE SHAREHOLDER VALUE ENGINE (1)
Neither the absolute level of a company’s revenue, nor its rate of return, directly drive shareholder value.
It’s all about the difference between the ROR and the underlying cost of capital.
This difference creates the value opportunity that drives stock price.
This is the residual income model, a form of the standard discounted cash-flow model.
From Stephen Penman, Accounting for Value, Columbia Business School Press (2010).
44
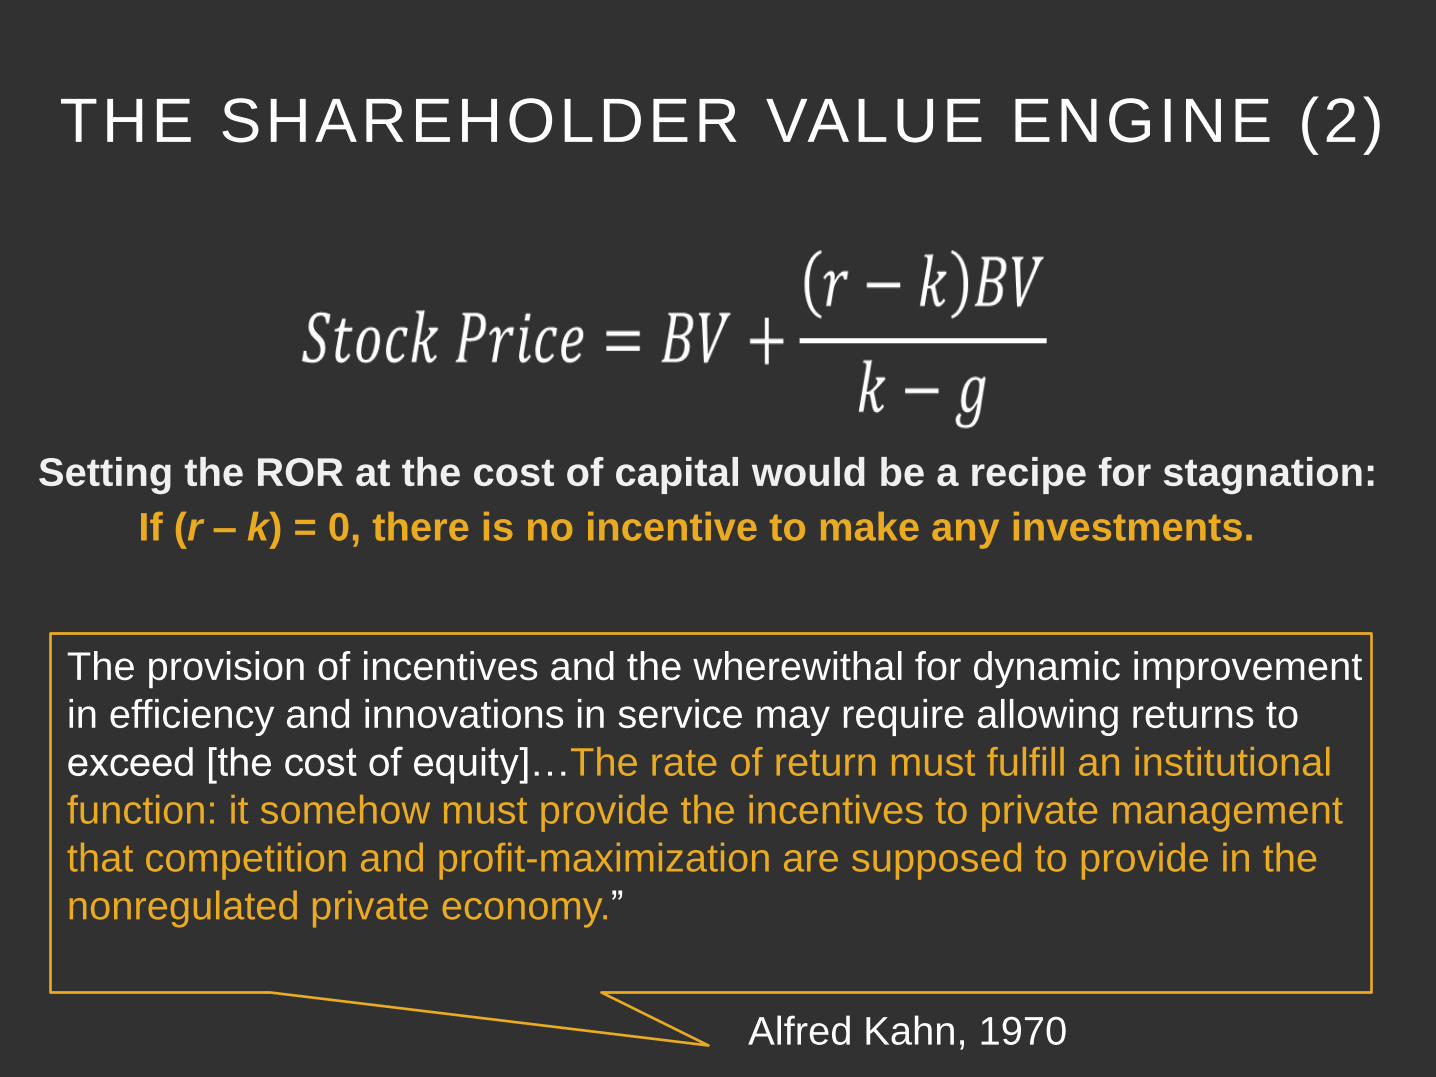
The provision of incentives and the wherewithal for dynamic improvement
in efficiency and innovations in service may require allowing returns to
exceed [the cost of equity]…The rate of return must fulfill an institutional
function: it somehow must provide the incentives to private management
that competition and profit-maximization are supposed to provide in the
nonregulated private economy.”
THE SHAREHOLDER VALUE ENGINE (2)
Setting the ROR at the cost of capital would be a recipe for stagnation:
If (r – k) = 0, there is no incentive to make any investments.
Alfred Kahn, 1970