newfoundland - agriculture and agri-food...
TRANSCRIPT

NEWFOUNDLANDSOIL SURVEY AND LAND USE
PROGRAM1981
it~.., ~ , ~._,.-
.
--
The printing of this publication was funded
jointly by the Canada/Newfoundland Agriculture
Development Subsidiary Agreement.
Copies of this publication
may be obtained from : The Dept. of Rural, Agricultural and
Northern Development,
Soil and Land Management Division,
Provincial Agriculture Building,
Brookfield Rood,
Mount Pearl, Newfoundland.
AIC 5T7

FIGURES
Figure 1 Exploratory Soil Survey Program 6
Figure 2 Current Reconnaissance Soil8Survey Program
Figure 3 Detailed Soil Surveys, PerformanceManagement Surveys, Miscellaneous 13
Surveys
Figure 4 Location of Arricultural17Development Areas
Figure 5 Planning Process for Agricultural21Development Areas
TABLES
Table 1
Table 2
Table 3
NEWFOUNDLAND SOIL SURVEY AND LAND USE PROGRAM 1981
TABLE OF CONTENTS
PAGE
SOIL SURVEY PROGRAM 1
Exploratory Soil Surveys 3
Reconnaissance Soil Survey 7
Detailed Soil Surveys 10
LAND USE PROGRAM 14
Historical Background 14
Farm Land Preservation 15
Farm Land Development Projects 22
Exploratory Soil Survey Program 5
Current Reconnaissance SoilSurvey Program 9
Detailed Soil Surveys, PerformanceManagement Surveys and
Miscellaneous Surveys 12
TABLE OF CONTENTS (con't)
PAGE
AGRICULTURAL DEVELOPMENT AREAS 1981
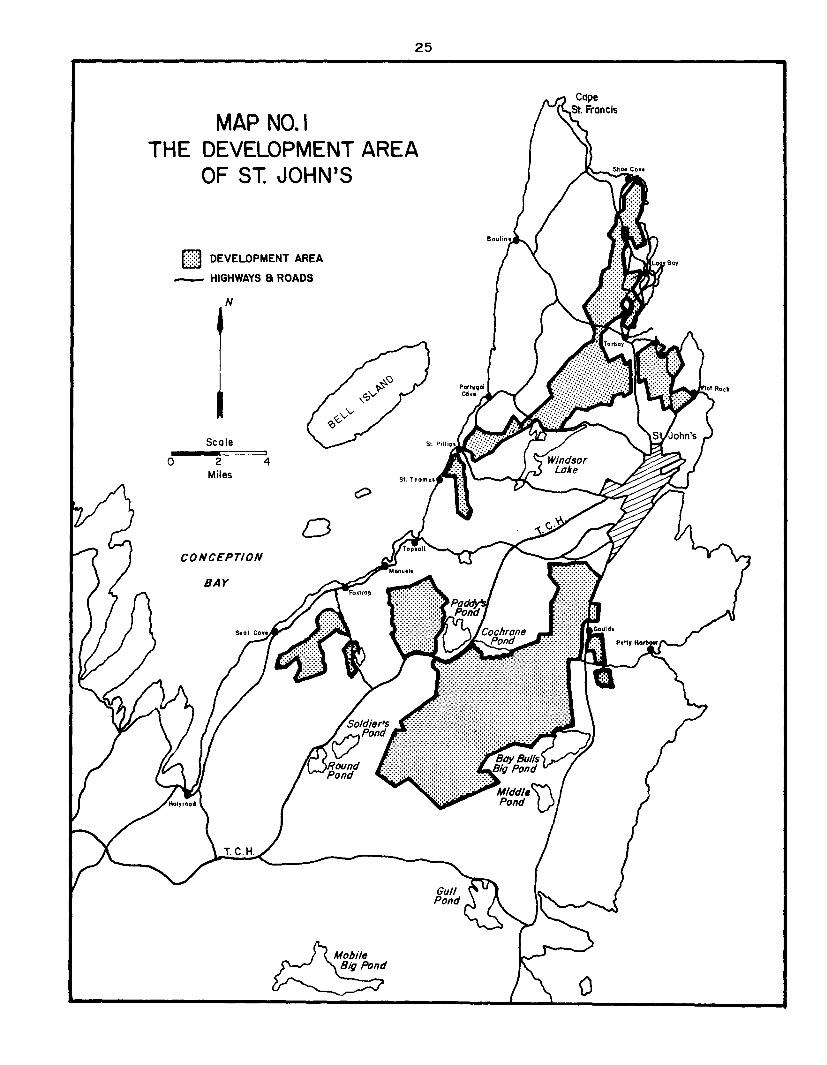
Map 1 ----- St. John's 25
Map 2 ----- Wooddale 26
Map 3 ----- Humber Valley 27
Map 4 ----- Robinson's - St. Fintan's 28
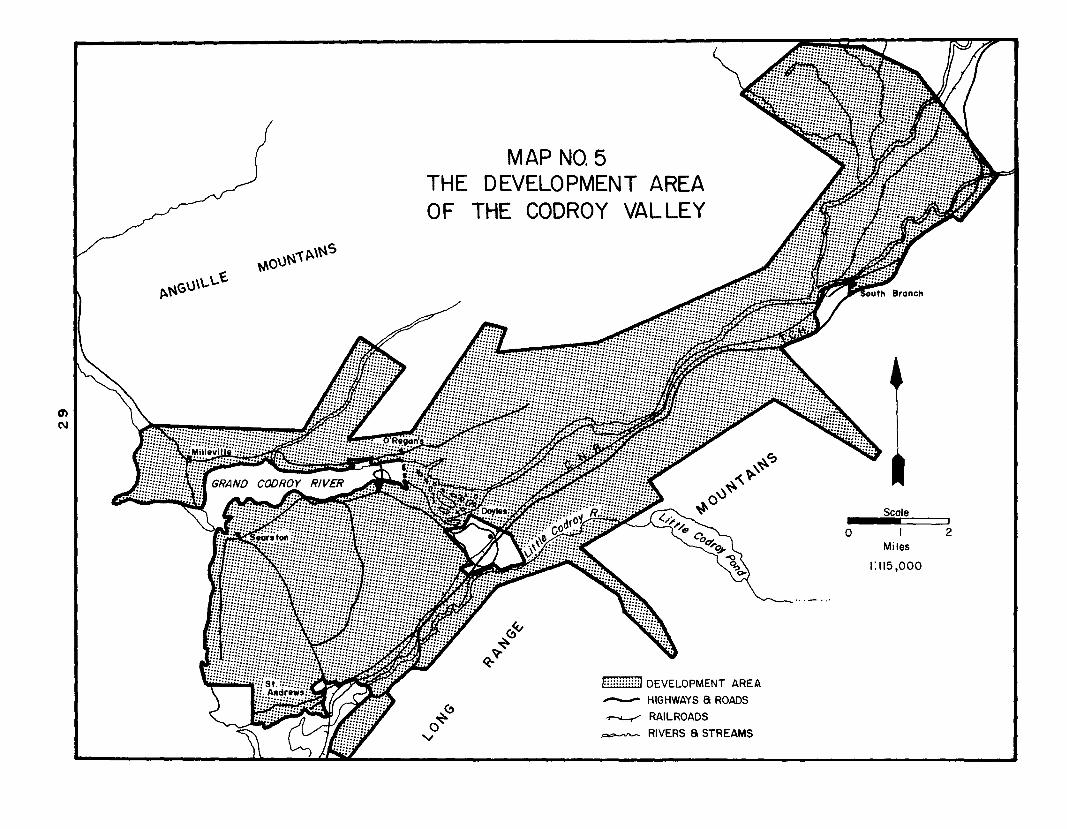
Map 5 ----- Codroy Valley 29
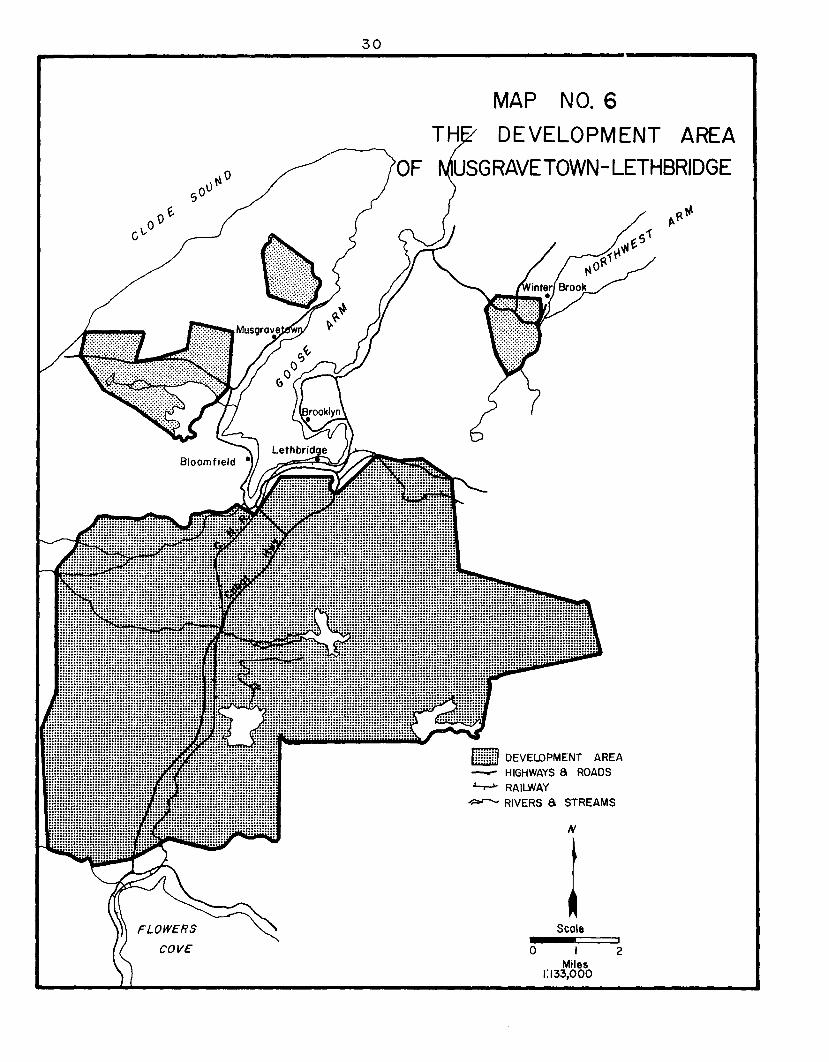
Map 6 ----- Musgravetown 30
Map 7 ----- Green Bay (Halls Bay-Springdale) 31
Map 8 ----- Green Bay (King's Point) 32
Map 9 ----- Green Bay (Indian Pond) 33
Map 10 ----- Port Au Port 34
Map 11 ----- Winter land 35Map 12 ----- Burin 36Map 13 ----- Markland 37Map 14 ----- Lewisporte (Brown's Arm - Botwood) 38
Map 15 ----- Lewisporte (Comfort Cove) 39
Map 16 ----- Gander Lake 40
Map 17 ----- Terra Nova 41
Map 18 ----- Avalon South 42
Map 19 ----- Bay d'Espoir 43
NEWFOUNDLAND SOIL SURVEY AND LAND USE PROGRAM 1981

SOIL SURVEY PROGRAM
The Newfoundland landscape can be best described as a
mixture of bogs, barrens, rock outcrops, water bodies
and mineral soil. Much of the interior of the island
portion of the province is covered by extensive bogs and
barren lands. These sparsely forested heath and moss
barrens result from wind exposure, humid conditions, temp-
erature limitations and soil conditions. The soils found
on these upland barrens are very coarse, usually very stony,
have firm to compact subsoils and are often quite shallow.
The boreal forest which surrounds these interior barrens is
characterized by dominantly coniferous species and b7 21
leaved eciduous trees. This natural vegetation 1~ o£ten
indicative of deeper soils that may be suitable for agricul-
tural use. The more favourable soils and better climatic
conditions for agriculture are usually found on elevated
ridges, along river terraces and on coastal lowlands.
Newfoundland soils are very acid and the dominant soil limita-
tion to crop growth is low fertility. The soils require
regular applications of lime and fertilizers to supplement
elements necessary for plant growth. Numerous other soil
limitations also hinder the development of land for agricul-
tural use. Limitations such as excessive stoniness create
additional management problems and costs for land clearing.
- --. - --
- 2 -
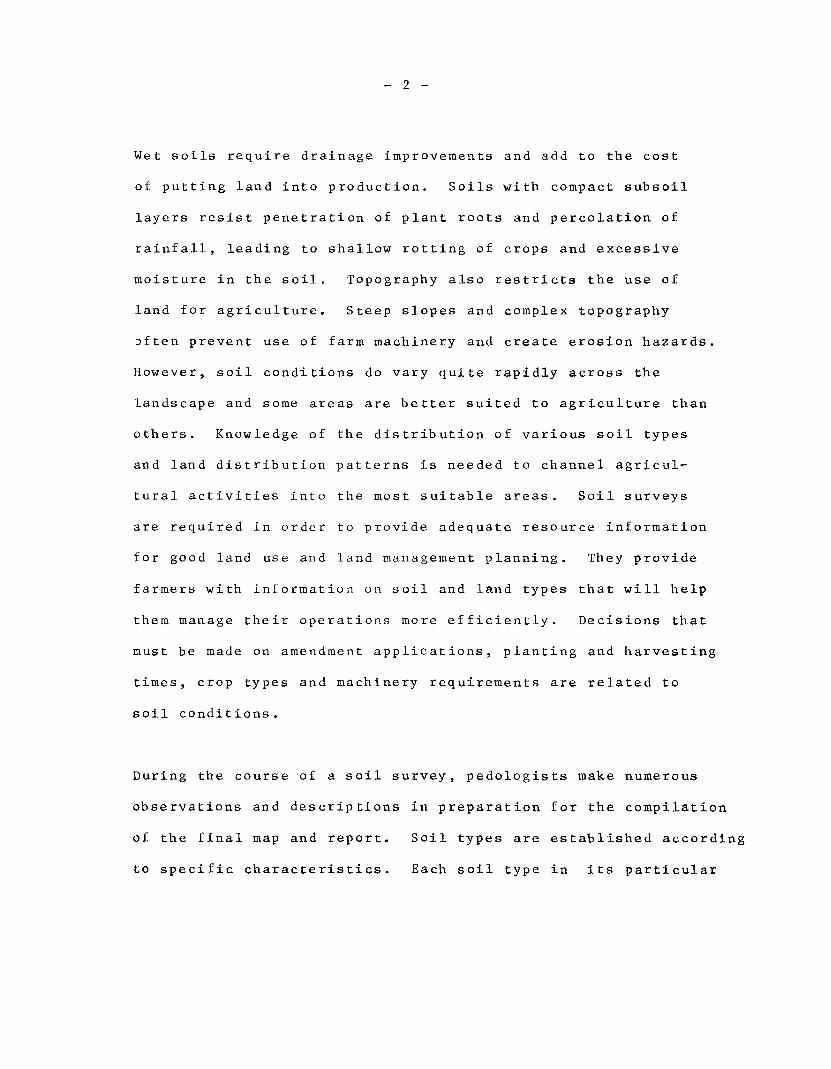
Wet soils require drainage improvements and add to the cost
of putting land into production. Soils with compact subsoil
layers resist penetration of plant roots and percolation of
rainfall, leading to shallow rotting of crops and excessive
moisture in the soil. Topography also restricts the use of
land for agriculture. Steep slopes and complex topography
~ften prevent use of farm machinery and create erosion hazards.
However, soil conditions do vary quite rapidly across the
landscape and some areas are better suited to agriculture than
others. Knowledge of the distribution of various soil types
and land distribution patterns is needed to channel agricul-
tural activities into the most suitable areas. Soil surveys
are required in order to provide adequate resource information
for good land use and land management planning. They provide
farmers with information on soil and land types that will help
them manage their operations more efficiently. Decisions that
must be made on amendment applications, planting and harvesting
times, crop types and machinery requirements are related to
soil conditions.
During the course of a soil survey, pedologists make numerous
observations and descriptions in preparation for the compilation
of the final map and report. Soil types are established according
to specific characteristics. Each soil type in its particular

- 3 -
environment has an expected response to crop suitability,
soil management or engineering uses. Soil maps and technical
grouping of soil types therefore become very important in
classifying land and selecting suitable types of land use.
Good soil survey interpretations will help the soil map user
in evaluating the land for various purposes and serve as a
very succinct educational tool.
As such, the soil survey program has been tailored to coincide
with the needs and prioritier )f the agricultural land and farm
development program. It is designed to provide three levels of
information, each with specific uses and interpretations. The
three levels are Exploratory, Reconnaissance and Detailed.
Each type of survey identifies in a general way the accuracy
of a survey and the overall purpose of the survey. The term
Survey Int~nsity Level is proposed to convey this meaning. Soil
surveys at various survey intensity levels will carry implica-
tions about the appropriate scale of publication, field pro-
cedures and rates of progress. The survey intensity level of
a particular project will also be determined by the objectives
of that survey.
EXPLORATORY SOIL SURVEYS
An Exploratory Soil Survey has a low survey intensity lev~l and
is designed to offer information for broad regional plannin~.
- 4 -
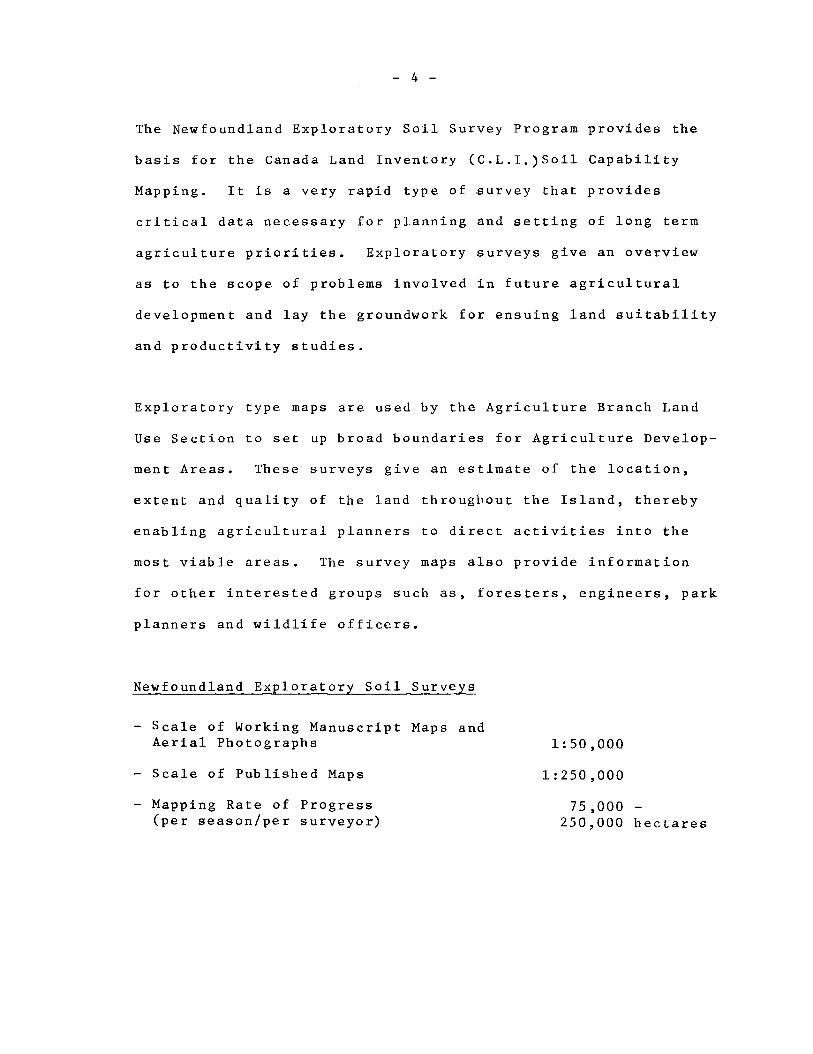
The Newfoundland Exploratory Soil Survey Program provides the
basis for the Canada Land Inventory (C.L.I.)Soil Capability
Mapping. It is a very rapid type of survey that provides
critical data necessary for planning and setting of long term
agriculture priorities. Exploratory surveys give an overview
as to the scope of problems involved in future agricultural
development and lay the groundwork for ensuing land suitability
and productivity studies.
Exploratory type maps are used by the Agriculture Branch Land
Use Section to set up broad boundaries for Agriculture Develop-
ment Areas. These surveys give an estimate of the location~
extent and quality of the land throughout the Island~ thereby
enabling agricultural planners to direct activities into the
most viable areas. The survey maps also provide information
for other interested groups such as~ foresters~ engineers, park
planners and wildlife officers.
Newfoundland Exploratory Soil Surveys
Scale of Working Manuscript Maps andAerial Photographs 1:50~000
Scale of Published Maps 1:250~000
Mapping Rate of Progress(per season/per surveyor)
75~000250,000 hectares

Sandy Lake In(12H) 1:250,000 Preparation 1:250,000 Published
Gander Lake In In(2D) 1:250,000 Preparation 1:250,000 Preparation
Be11eoram In In(1M, L) 1:250,000 Preparation 1:250,000 Preparation
Red Indian In InLake (12A) 1:250,000 Preparation 1:250,000 Preparation
5 -
The Exploratory Soil Survey Program in Newfoundland is nearly
completed. Figu~e 1 and Table 1 show the present status and
on-going schedules for this type of survey.
Table 1
Exploratory Soil Survey Program
(Survey Intensity Level 5)
Numb e r Mapsheet SoilSurve
Status Agr.Capab.
Status
Botwood( 2 E , F) 1:250,000
InPreparation 1:250,000 Published
Stephenville(12B)-Port- 1:250,000aux Basques (110)
InPreparation 1:250,000
InPreparation
Five survey intensity levels are recognized, level 1 to level 5.
Levell represents the more detailed intensive surveys and is
referred to as the highest survey intensity level. Level 5 represents
much more general surveys and is characterized by a low intensity
survey level.

-.-.-. --~--
-.-- -
- h -
!
--.-
.-
I
I
. J\.1 V
FIG.I Exploratory Soil Survey Program
Botwood (2E), Wesleyville(2 F)
Stephenville (12 B), Port aux Basques (II 0)
Sandy Lake (12 H)
Gander Lake (20)
Belleoram (I M), Sf. Lawrence (I L)
Red Indian Lake (12 A), Burgeo (II p)

- 7 -
Reconnaissance Soil Surveys
Reconnaissance soil surveys are of an intermediate intensity
level and provide more information and interpretations than
that gathered in exploratory work. A reconnaissance type of
survey is designed to provide information for planning agri-
cultural activities within Agricultural Development Areas and
identifying areas for farm expansion and establishment of new
farms.
Ideally, reconnaissance surveys are preceeded by general infor-
mation collection and correlation at the exploratory level.
The Reconnaissance Soil Mapping Program is usually based on land
capability information derived from exploratory mapping and
priorities of the Land Use sector. Various parts of the New-
foundland Reconnaissance Program have however been completed
over the years because of the immediate need for more precise
information in some high priority agriculture areas. Present
survey plans call for the completion of reconnaissance soil sur-
vey for all areas that have potential for agriculture.
Information gathered at this survey level is used to formulate
development plans within designated Agricultural Development
Areas. The types and locations of agricultural enterprises
together with the planning of compatible infrastructure, industry
and residential development are also based on this soil survey
r~WF~/D - ~T)i'1R
v -- ~~---- ~J' h'~ r-y -
i ~_ft~y.!/ Vc h:) : ~~~g
'tfJ I) ~[) ~~.'~'B~=1~/j \ ~- I ~}
nV
~~~1----
~"?~)!"~. "' >~~~~\1 i~
..., ~c~ I
n_~(
~- II
-- --- \ r f -
/ .y : I-
I /) i i i,h' {(, Y:\
:_ _~l11ber V
~"I~.. ~~~oy~,n I I Gonde~ Boy i. ' Reg~
;;'1.loits
Riller'1£2.!V V Relionl\.--.-
'-~
I Region --1.0
~<o/rl \ IY~J'"
)...
,. I
Boy cfISlon~~_RegiT L ."'- ...L:0,~
~~oc~ ~vvr-.."JfJ '"~~,t?"- ? ~~Regin
~\~~~ / j onder Gamba RegionPort u PorI Region "'I:;iI:SY
( .Corner! Brook. -
:::/::~~~~~~Bonov
sto
"",,/ Stehenville r.:::. :.':.-:-:-:':-: "- i\. Regl n
~I~~""""--.... ........
R---; .f::
. .................~~~~i"
.....i........ eglOn .. ... .. .. .. .. .. .. . .. .. .~~-- , ~.::)::::::I=7' .:....;:...............
:"'::r~.................... .'\.V\. 'L i.... ........ ", Gander Lake ;J l"-_.n .. .:':-:.... .. .. .. .. .
~~I.--'~I~ :-:-:.' Red In ion Lak RE gian ~l j
'"'.
Regie n ICod'~ ~\
. - ,
~~~R:~Rob_ons- Sf. Finton s
~_Regia!, 'n___ ~c-
~~m~Bay d'ESPOi~ ~Aval nReg on. ~Re(ion rA,
.-..IL~ 1\ .
~)( f$'~ 1/12_ ."In I ~~/''''.~, Joon'.
"- .fi''''V ""-1"1./L. Ivw/ j)~/V,-c--. '_
i' ~::-A/T ~~N"_~~~, BurinPeninsul~ RegioriI ~~I!m ~%/.~
I I\}i b ."-"'"' ~~0v~~0~,
I--- 1-
,13 '" "'""'~'" .
I_nul
I i W,!mr '-
..
8 -
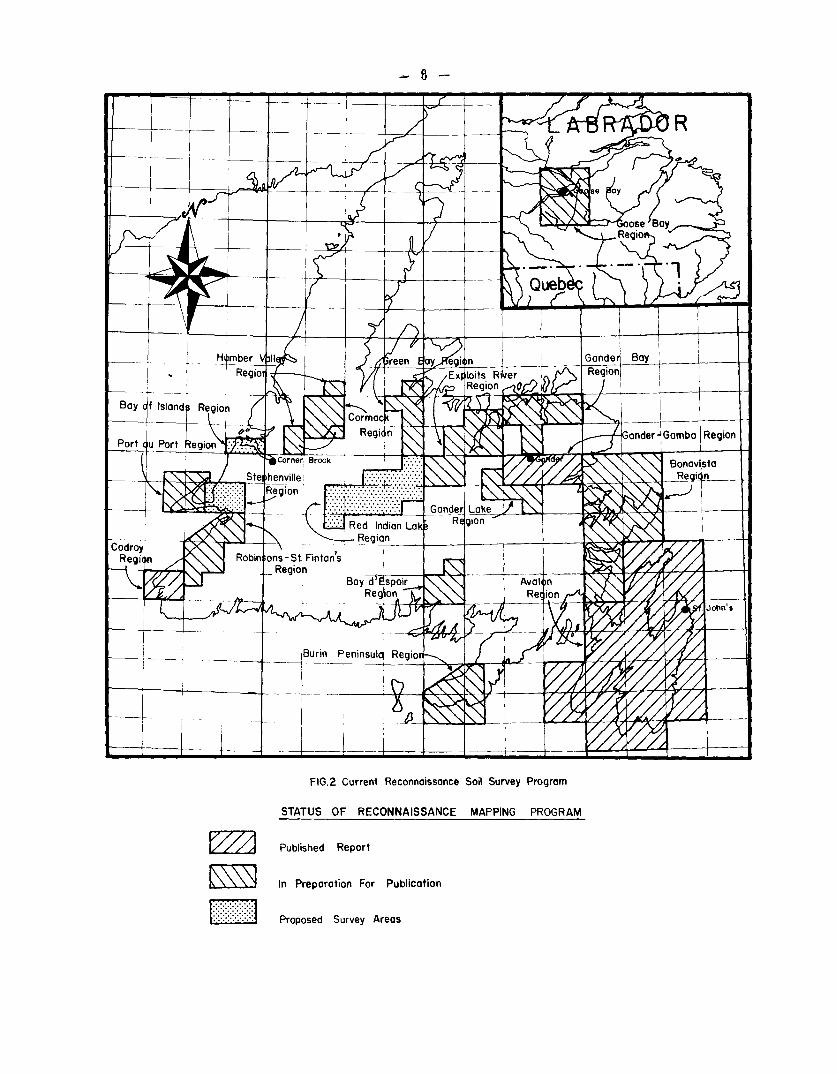
FIG.2 Current Reconnaissance Soil Survey Program
STATUS OF RECONNAISSANCE MAPPING PROGRAM
Published Report
In Preparation For Publication
Proposed Survey Areas

- 9
TABLE 2
CURRENT RECONNAISSANCE SOIL SURVEY PROGRAM
MAPSHEET
SOILSURVEY LEVEL
AGRI.CAPAB.---
Gander-~ambo(2D/15,16) 1:63,360 3 1:63,360
Avalon(IN,K) 3
1:100,0001:250,0001:100,000
Codroy Valley(110/14) J:50,000 3 1:50,000
Port au Port(12B/10,11) 1:50,000 3 1:50,000
Cormack(l2H/3,6) 1:50,000 3 1:50,000
Bonavista(2C) 1:100,000 3 1:100,000
Robinsons &St. Fintans(l2B/2, 7, 8& 110-15) 3
1:25,0001:50,0001:25,000
Humber Valley(12H/3, !~,11)
1:12,5001:25,000
23
1:12,5001:25,000
Exploits River 1:12,500Region (2E/3,6 & 7) 1:25,000
2 1:12,500
3 1:25,000
Green BayRegion (12H/18 & 9) 1:25,000 3 1:25.000
Bay d'EspoirArea (lH/12) 1:12,500 2 1:12,500
BurinPeninsula( 1M / 3, 4 &
lL/13, 14) 1:35,096 3 1:35,096
Goose BayArea(13F/7, 8 & 9) 1:50,000 3 1:50,000
STATUS
Published
Published
Published
InPreparation
InPreparation
InPreparation
InPreparation
InPreparation
InPreparation
InPreparation
InPreparation
InPreparation
InPreparation
Proposed: Red Indian Lake Region - tentative pending ExploratorySoil Survey Results.
Stephenville Region; Gander Lake Region; Gander BayRegion; Bay of Islands Region.

- 10 -
program. Reconnaissance type surveys give major emphasis to
physical attributes of the land and soil such as slopes drainage,
texture, and stoniness. They do not provide a great amount of
detail on such features as soil productivity, fertilizer response
or soil conservation.
Figure 2 and Table 2 show the previous surveys that have been
undertaken and the status of the active and proposed surveys.
Newfoundland Reconnaissance Soil Survey
Scale of Working Manuscript Mapsand Aerial Photographs
1:10,000 to1:50,000
Scale of Published Maps(usual range)
1:25,000 to1:100,000
Mapping Rate of Progress(per season/per surveyor)
6,00C to60,000 hectares.
Detailed Soil Surveys
The final routine soil survey program planned for the province
is Detailed. It is characterized by a higher survey intensity
level and deals with specific land management problems. These
surveys are more time consuming and are usually done over
smaller areas; they supply information for many purposes at the
level of groups of farms down to the level of small farms.

- 11 -
An example of this type of survey, is a detailed mapping project
that was carried out on approximately 1000 acres of Crown Land
within the St. John's Agricultural Development Area. This survey
provided basic soil information for planniQg and management of
this area known as"The Goulds Forage Project".
Detailed soil surveys are usually carried out in prime farming
areas to provide information for increasing productivity and
improving land management. Surveys at the highest survey intensity
level give information on slope, drainage, texture and stoniness
and also relate these to site specific levels of costs and nec-
essary management techniques.
The detailed surveys along with several performance management
and miscellaneous surveys are shown and listed on Figure 3 and
Table 3.
Newfoundland Detailed Soil Surveys
Scale of Working Mapsand Aerial Photographs
1:12,500
Scale of Presentation(most common scale)
1:12,500
Mapping Rate of Progress(per season/per surveyor)
1,500 to3,000 hectares
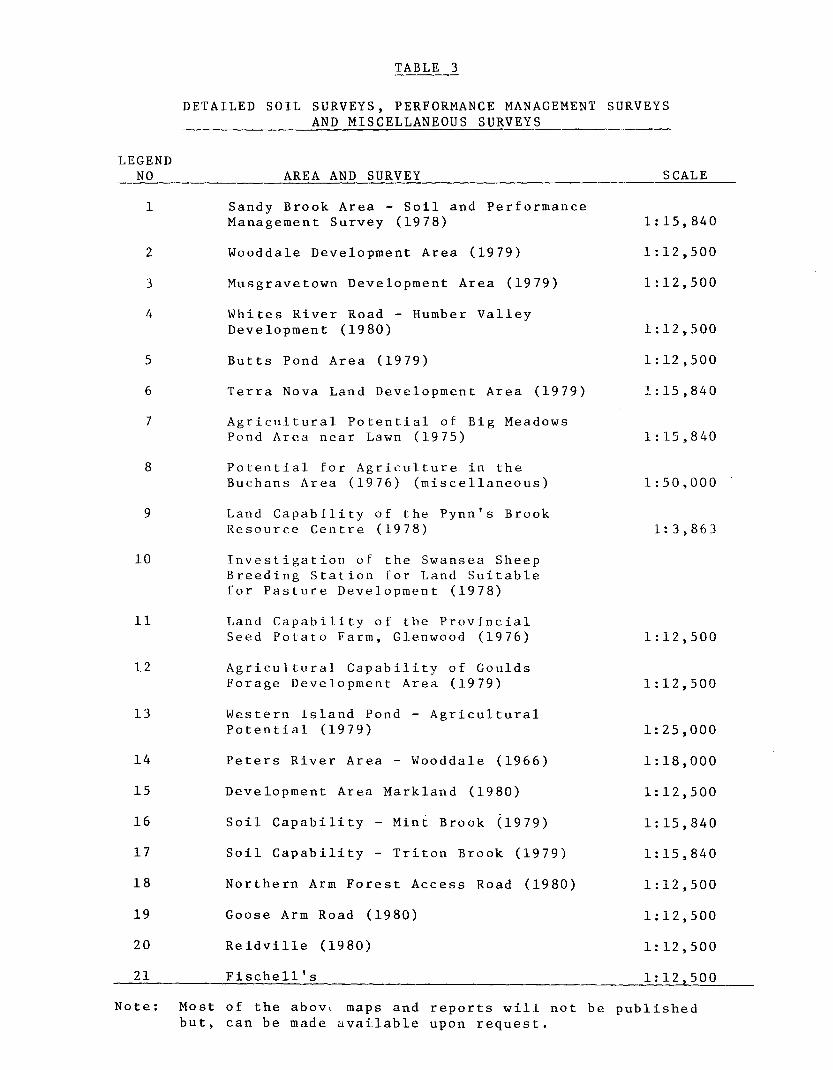
TABLE 3
DETAILED SOIL SURVEYS, PERFORMANCE MANAGEMENT SURVEYSAND MISCELLANEOUS SURVEYS
LEGENDNO AREA AND SURVEY SCALE
1 Sandy Brook Area - Soil and PerformanceManagement Survey (1978) 1:15,840
2 Wooddale Development Area (1979) 1:12,500
3 Musgravetown Development Area (1979) 1:12,500
4 Whites River Road - Humber ValleyDevelopment (1980) 1:12,500
5 Butts Pond Area (1979) 1:12,500
6 Terra Nova Land Development Area (1979) 1:15,840
7 Agricultural Potential of Big MeadowsPond Area near Lawn (1975) 1:15,840
8 Potential for Agriculture in theBuchans Area (1976) (miscellaneous) 1:50,000
.
9 Land Capability of the Pynn's BrookResource Centre (1978) 1:3,863
10 Investigation of the Swansea SheepBreeding Station for Land Suitablefor Pasture Development (1978)
11 Land Capability of the ProvincialSeed Potato Farm, Glenwood (1976) 1:12,500
12 Agricultural Capability of GouldsForage Development Area (1979) 1:12,500
13 Western Island Pond - AgriculturalPotential (1979) 1:25,000
14 Peters River Area - Wooddale (1966) 1:18,000
15 Development Area Markland (1980) 1:12,500
16 Soil Capability Mint Brook (1979) 1:15,840
17 Soil Capability Triton Brook (1979) 1:15,840
18 Northern Arm Forest Access Road (1980) 1:12,500
19 Goose Arm Road (1980) 1:12,500
20 Reidville (1980) 1:12,500
21 Fischel1's 1:12,500
Note: Most of the abov, maps and reports will not be publishedbut, can be made available upon request.

- 13 -
NEWFOUNDLANDSCALE
1'00102030MILES
q N
r:J .
Fioure3 : Detailed Soil Surveys, Performance Managemehf Survey., Miscellaneous Surveys

- 14 -
LAND USE PROGRAM
HISTORICAL BACKGROUND
Traditionally, agriculture has comprised of part-time farms con-
cent rated on small acreages throughout Newfoundland's coastal
regions. Potatoes, cabbage and turnips were grown. Also, small
numbers of cattle and s~eep were raised for home or local use.
Although small in size and number, farms in the province prior to
Confederation were relatively successful. However, following
Confederation and the loss of protective tariffs in 1949, coupled
with improved transportation systems for foodstuffs from the main-
land, the economic position of the farming sector gradually declined.
Local producers hRve not been able to consistently supply well
graded quality products with the result that wholesalers often
purchase in bulk from the mainland. For example, less than one-
third of all vegetables currently being consumed in the province
are produced locally.
Although the actual number of farms in the province appears to
have declined since Confederation, many of the existing and estab-
lishing commercial farmers have had to expand their operations to
meet the changing conditions. Unfortunately, however, much of
this expansion was not well planned. Little consideration was
given to factors such as viable farm size, availability of ser-
vices, and the advantages of clustering farm developments. All

- 15 -
too often, development was left to find its own course with in-
efficient and frequently conflicting land use pacterns evolving.
In addition, much of the prime farmland was being taken out of
production through residential and commercial encroachment, cabin
developments, and other non-farming activities.
The allocation and development of Crown Land was also not always
well planned. Many leases and grants were issued for agricultural
purposes only to have the land farmed for a short period of time,
and then removed from agricultural production. The result has
been the alienation of thousands of acres of good farmland. The
practice of severing granLed land into small non-viable parcels,
coupled with the practice of issuing small leases with little or
no provisions for expansion, has resulted in a very fragmented
land ownership situation.
As a result of these problems, many farmers today are unable to
locate enough iand on which to expand. The most seriously affected
are new entrants in agriculture who require large unified tracts
of suitable land on which to establish a viable commercial operation.
Farm Land Preservation
The soil surveys conducted to date indicate that less than 1% of
the Island, that is, less than 100,000 hectares are actually suitable

- 16 -
for farming. In order to become self-sufficient in agricultural
commodities that can be produced under our soil and climatic con-
dictions, nearly all of the province's suitable land would be
needed. The prospects of reduced supplies from imported sources
and increasing transportation costs will soon mean that the prov-
ince will have to become self-sufficient in those products that
can be grown locally.
In order to ensure that the remaining suitable land base is avail-
able for future food production and to assist in developing it to
its potential, the Government adopted the approach of designating
Agricultural Development Areas. These areas (shown on Figure 4)
have been identified based on criteria such as soil surveys. market
potential, current levels of production and growth potential. They
possess the best potential for a viable agricultural industry
and contain nearly all the land that is suitable for agriculture.
Because of this, most of Government's agricultural programs for
expansion are being directed to these areas.
In most of the development areas, detailed land use plans are
currently being produced. This involves extensive field research
~ncluding the update and revision of land ownership data. an assess-
ment of current land use patterns. and an assessment of human and
economic resources. Fieldwork has been concentrated mainly in the
priority areas of Codroy, Robinson's-St. Fintans', Humber Valley

- I 7 -
NEWFOUNDLAND
100102010IIIU.8
(J
t:J
N
Agure 4 Location of Agriculture Development Areal

- 18 -
Wooddale, Musgravetown and St. John's regions since the program
was initiated in 1978. It is anticipated that much of this work
will be completed by 1982, with work in the remaining areas to
be completed in ensuing years.
Following the preparation of land use plans, it is proposed that
the major agricultural areas be officially designated and regulated
under Chapter 95 of The Development Areas (Lands) Act, 1976. Essen-
tially, this means that land use not compatible with agriculture
would be restricted or tightly controlled. At the present time,
these controls are in place in the St. John's and Wooddale Regions.
Land Use studies conducted to date have identified a need for
similar controls in the Agricultural Development Areas of Codroy,
Robinson's - St. Fintan's, Humber Valley, Springdale, Musgravetown
and Winterland. It is now being proposed that these areas be legis-
lated in the near future. In the remaining agricultural areas,
conflciting pressures are not so great yet as to warrant regulated
controls. A continuing program of monitoring these areas is now
in place.
The control mechanism for areas officially zoned pursuant to the
Development Areas (Lands) Act is through regulations that have been
developed to restrict non-compatible uses. Each set of regulations
has been designed individually to meet the needs of the region to

- 19 -
which they apply. The main intent of the regulations is to pre-
serve and protect land from conflicting uses that irreversibly
remove it from agricultural production. Also, land sub-division
in most instances, and the removal of topsoil and sod is prohibited.
Land may be sold under these regulations, but may only be used for
agricultural purposes.
As with any type of restricting or controlling activity, many
pressures prevail. Land suitable for agriculture is often prime
for other commerciRl or residential development. These multiple
use demands on land, particularly in the St. John's Agricultural
Development Area, have resulted in a great deal of land speculation.
Developers have taken options on land whereby they pay farmers
large sums of money just for the right to purchase. The Govern-
ment's reply to this type of pressure can be summed up in a quote
from its recently published Five Year Development Plan 1980-85,
Managing All Our Resources.
"Land with agricultural potential is too limited in our
Province to allow.. .it to fall into the hands of speculators
operating under tile misapprehension that it will eventually
be re-zoned for non-agricultural development purposes. It
is the firm policy of this Government that "frozen" agricultural
areas will remain frozen".
Not all areas are under the same pressure from conflicting uses
as the St. John's Zone. Several designated areas, particularly
- 20 -
in the west. are grossly underutilized. Land use and land owner-
ship studies have revealed that most of the idle land is owned by non-
farmers who show little interest in putting it into proudction. nor
are they willing to sell or rent the~r land. to active farmers.
Counteracting the idle land situation is of major concern if
Newfoundland is to meet its agricultural land needs. To help
get this land into production the Government's Five Year Develop-
ment Plan emphasizes that "measures will be taken to induce owners
of unused farmland to release that land to farmers. Government
cannot allow this industry to be hampered by idle resources".
The Agricultural Development Areas are shown on the accompanying
set of maps. The boundaries of these units and the development
of agricultural plans to utilize the limited areas of suitable
land have not been prepared by Agriculture's land use planning
staff in isolation. Input has been supplied by agricultural rep-
resentatives and other branches within agriculture. the lands
branch. forestry branch and a variety of other provincial and
local agencies. The progression of events followed in preparation
of development plans is shown in Figure 5. The development plans
will act as co-ordinated agricultural planning guidelines.

PIGUiIB 5. PLANNING PROCESS FOR AGRICULTURAL
DEVELOPMENT AREAS
R.,,1tw of Soil Co iii'Praltmity ~ lkbon
"'--
BroadBOtoIndary
o.crlplionfo<
AQricultural
A....
Soil Capability
ttwrent LtYti of P"roductiort
Pl'OJ;imd)' to MOrket,
Form ConcentratlOft
Potential fOf Growth
Transportotion Rout,.
E__~icolWat.,Soilt
For"'"WlIclIifoTrOMpOf'tGtton a
ComrnunicafioM:
SourCft
""'_'DiatritMttlon
""E",~,-.~oc.., 0I0fic0I
PIG"",,,, C.tidtraMonl
0MtC\UURAL DEVELOPMENTCOMMITTEE
~ltWOl Land Ute PIa...AorlCultwol R~MunleJpot AHair. and HouIintLocoI_'_VartouIGowern"",,'erancha
Worki~ Go...mrnent Depart ent.locol GO\l'ltnmentSodtti.. 0I'Id OrwiDation.CorporoUona Gnd tom,.,...
Detotled Studies of PrOPO"d 0
Pr.liminOt',Devefopment
Plon"i",AJttf'nGtiv..
R.
Public Participation
Draftof FInoI0._-
R,vj'ion
." --..
- .f--

- 22 -
Farm Land Development Projects
Although land preservation has constituted the major thrust in
the Land Use Program, several other aspects are also very
important. The development project concept for example, has
and will continue to playa very significant role in the planning
and allocation of the remaining Crown Land suitable for agricul-
ture. Two significant projects that have been initiated for the
development of large blocks of Crown Land, for new farming acti-
vities are the Goulds Forage and the White's River Road projects.
These have been very successful in establishing adequate land
bases for a number of the province's existing and new farmers.
The White's River Road project area is located within the Humber
Valley Agricultural Development Area. Prior to 1979, numerous
leases, too small for sustained commercial agricultural production
were issued in the vicinity of this project, and several lease
applications within what is now the project area were pending.
In order to preserve the remaining suitable land in this area,
the White's River Road farm land development project was established.
All pending lease applications were cancelled and the Soil and Land
Management Division embarked upon a systematic development scheme.
Detailed soil surveys were conducted during the summers of 1979
and 1980. This soils information was then used to plan out five
units ranging in size from 136 to 240 acres. Also, a road providing
access to several of the units was planned and constructed
under the province's farm access road program. T :1e s e units
were then advertised and successful candidates were selected
- 23 -
from the numerous proposals received. These individuals are
now in the process of clearing and preparing the land for
agricultural production. Hydro electric services will be pro-
vided when development reaches the stage that such development
is required.
The Goulds Forage Project was handled in a similar manner. In
this case, however, the intent was to establish sufficient
forage production areas for several existing dairy farmers
within the St. John's Agricultural Development Area. Here also,
soil surveys were conducted, forage units were established under
lease and access roads were constructed.
In general, the management and handling of land capable for agricul-
ture has greatly improved in the past few years. Hopefully, pro-
grams such as land preservation and farm land development will
result in the maximization of agricultural production and ensure
an adequate land base for agriculture for years to come.

AGRICULTURAL DEVELOPMENT AREAS
1981
- -- --- --- ---
Scale .0 2 4
Miles
c:>
0CONCEPTION
BAY
25
MAP NO. ITHE DEVELOPMENT AREA
OF S1: JOHN'S
- DEVELOPMENT AREA
HIGHWAYS a ROADS
N
o

...........
~ .
<00
MAP NO.2THE DEVELOPMENT AREA
OF WOODDALE
N
DEVELOPMENT AREAHIGHWAYa ROADSRAILROADSRIVERS a STREAMS

[].. DEVELOPMENT AREA- HIGHWAYSa ROADS
--'-T RAILWAYS- RIVERS a STREAMS
01:250,000
Scale
0. .2 4
Miles
27
MAP NO.3
THE DEVELOPMENT AREAOF THE HUMBER VALLEY
HUMBER

MAP NO.4
THE DEVELOPMENT AREAOF ROBINSONS-ST. FINTAN'S
ST. GEORGE'S BAY
I\)
<X>
Scole..
o 1.25Miles
r: 132 ,ODD
2.5
c:::::J DEVELOPMENT AREAHIGHWAYS a ROADS__ RIVERS a STREAMS
en(IJ
MAP NO. 5THE DEVELOPMENT AREAOF THE CODROY VALLEY
2
I::::::::::::) DEVELOPMENT AREA- HIGHWAYS Ii ROADS
~ RAILROADS
~ RIVERS Ii STREAMS
N
IScale
0 I 2Miles
I:133,000
30
MAP NO.6
DEVELOPMENT AREA
USG RAVE TOWN- LETHBRIDGE
--DEVELOPMENT AREAHIGHWAYS a ROADSRAILWAYRIVERS a STREAMS

MAP NO.7THE DEVELOPMENT AREA
OF GREEN BAY
HALLS BAY - SPRINGDALE AREA
N
Scale
o 0.5Miles
[] DEVELOPMENT AREA- HIGHWAYS a ROADS~ RIVERS a STREAMS

MAP NO.8THE DEVELOPMENT AREA (}J
I\)
OF GREEN BAY
KING'S POINT AREA
- DEVELOPMENT AREAHIGHWAYS a ROADSRIVERS 8 STREAMS
Scale
o 0.25 0.5
Miles
0.75
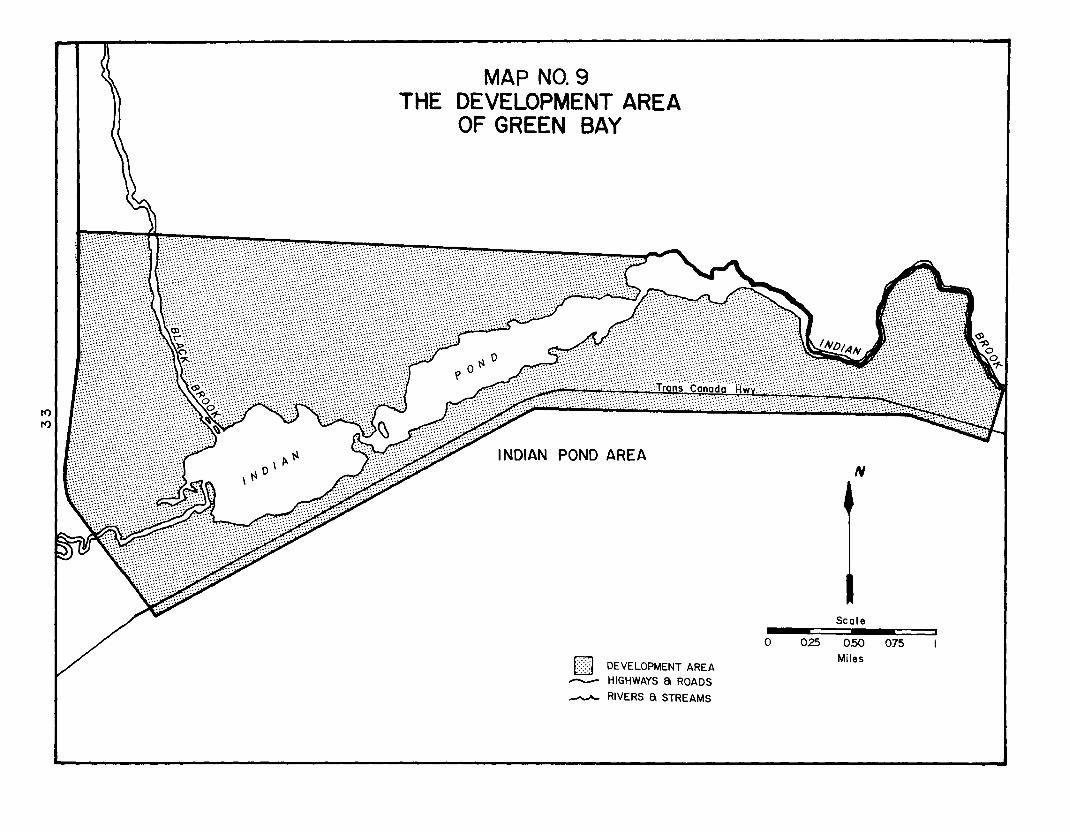
MAP NO.9THE DEVELOPMENT AREA
OF GREEN BAY
INOlAN POND AREAN
Scale
o 0.25 050 015Miles[[] DEVELOPMENT AREA--- HIGHWAYS a ROADS
RIVERS a STREAMS
N
t
IScale
1.5 3Miles
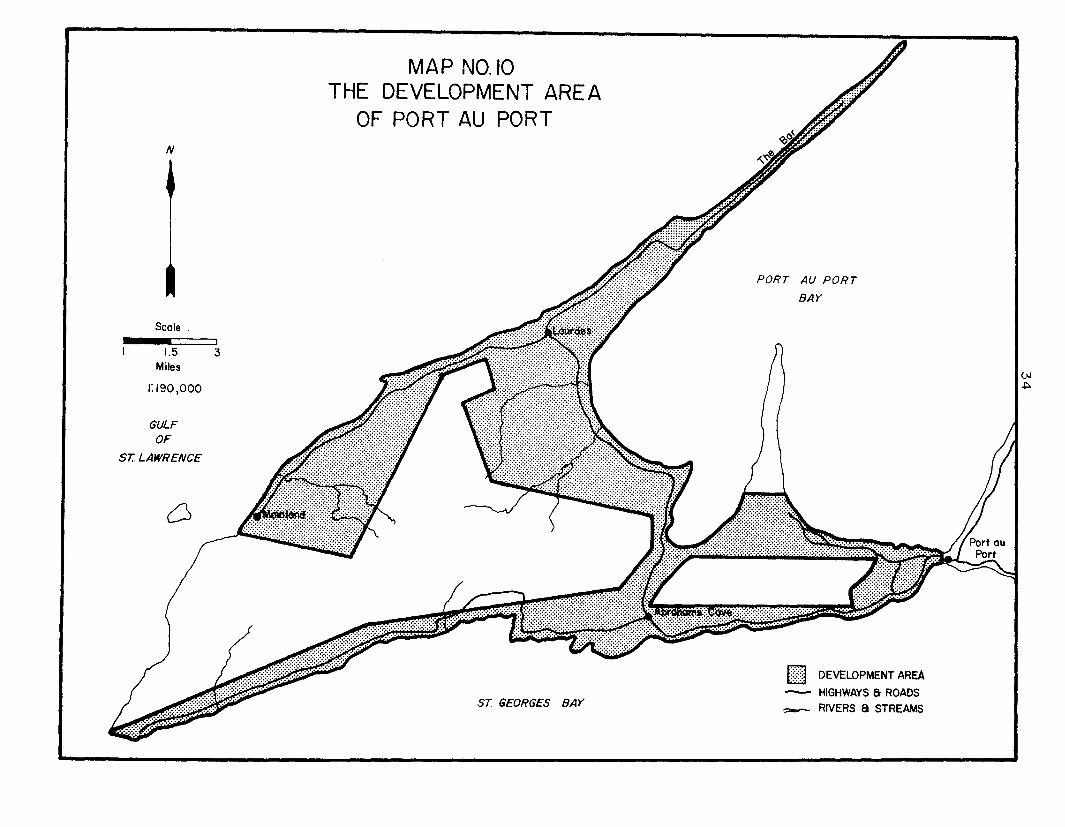
I:190,000
GULFOF
ST. LAWRENCE
0
MAP NO. 10THE DEVELOPMENT AREA
OF PORT AU PORT
PORT AU PORT
BAY
ST GEORGES
DEVELOPMENT AREA
HIGHWAYS a ROADSRIVERS a STREAMSBAY

35
MAP NO. IITHE DEVELOPMENT AREA OF WINTERLAND
N
LEGEND
o DEVElOPMENT AREA
HIGHWAYS a ROADS
~ RAILWAYS~ RIVERS a STREAMS
Scale
o 0.5Miles
1:70,000
Freshwater
Pond

MAP NO.12THE DEVELOPMENT AREA
OF BURIN
LAMALINE AREA
N
Scole
° IMiles
I:125,000
DEVELOPMENTAREA
HIGHWAYS a ROADS
RIVERS a STREAMS

37
LEGEND-o DEVELOPMENi AREA
,HIGHWAYS a ROApS
RAILWAYS
MAP NO. 13THE DEVELOPMENT AREA
OF MARKLANDN
Scale
o,2
Miles

38
MAP No. 14THE DEVELOPMENT AREA
OF LEWISPORTE
Scale
o 4Miles
8
D DEVELOPMENT AREA
BROWN'S ARM - BOTWOOD AREAHIGHWAYS a ROADS
RIVERS a STREAMS
39
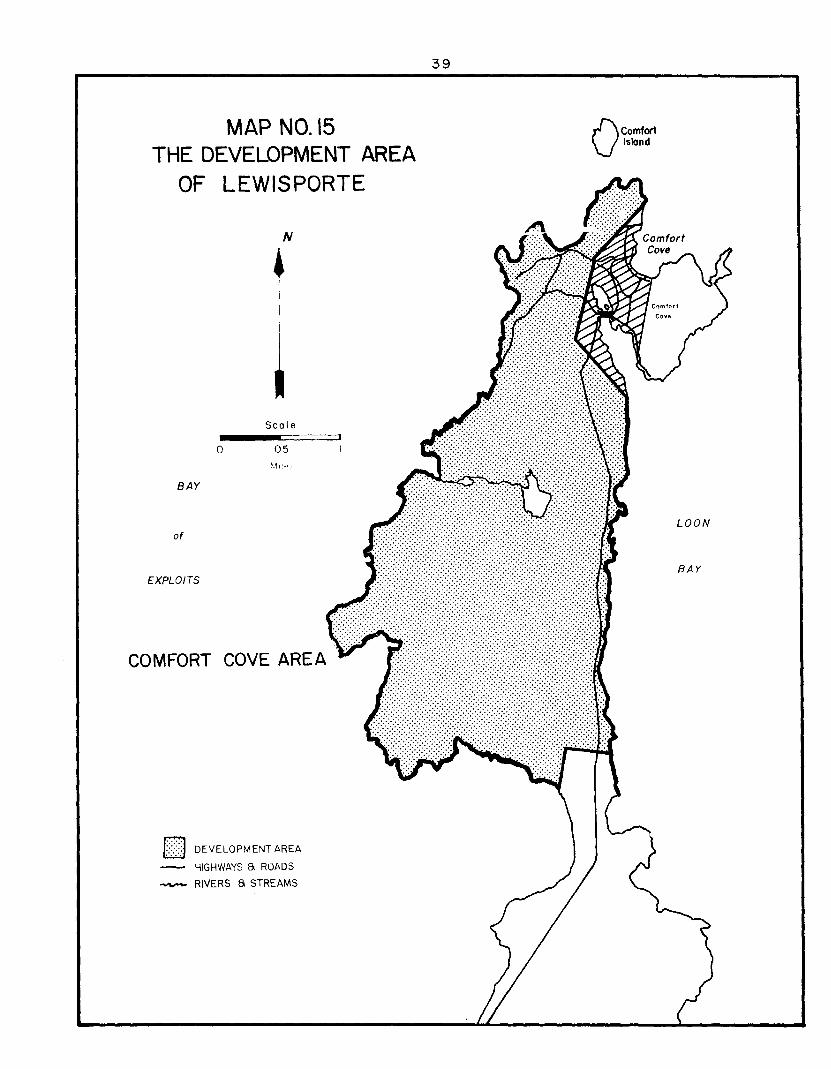
MAP NO. 15
THE DEVELOPMENT AREAOF LEWISPORTE
OComfortIsland
DEVELOPMENT AREA
HIGHWAYS S. ROADS
RIVERS S. STREAMS
N
BAY
LOONof
BAYEXPLOITS
COMFORT
40
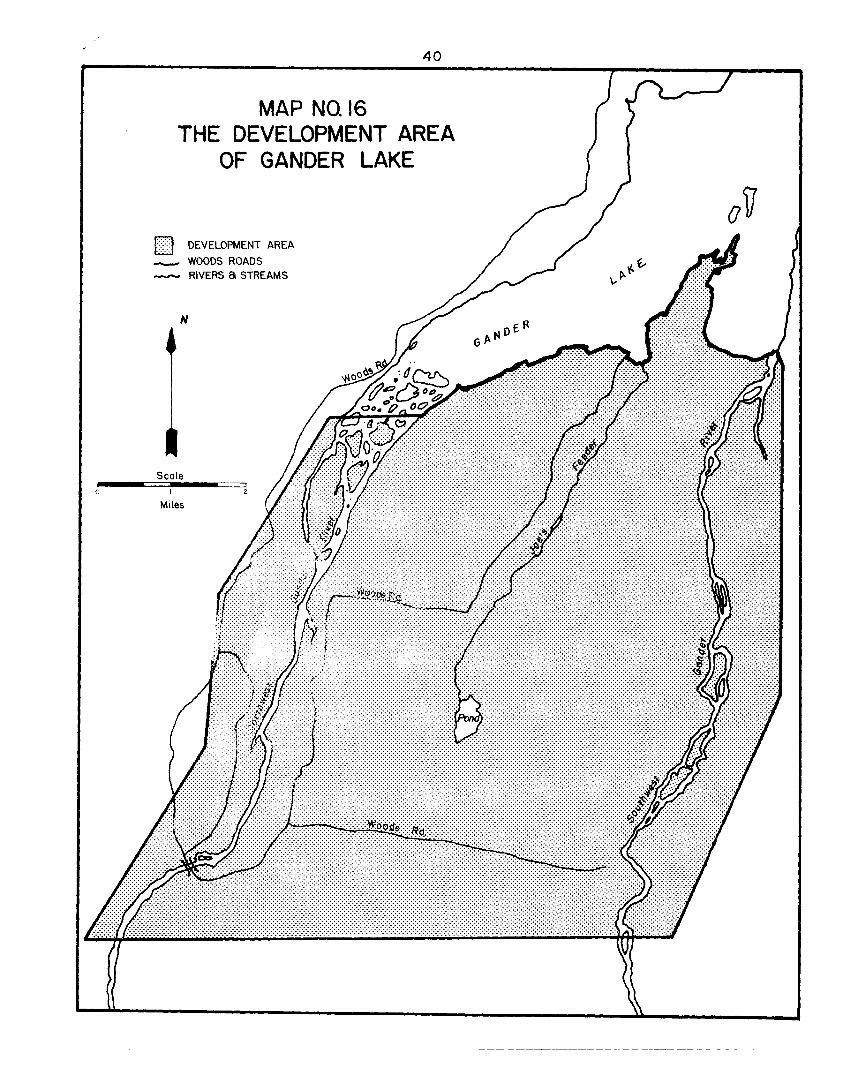
MAP NO. 16
THE DEVELOPMENT AREAOF GANDER LAKE
[J] DEVELOPMENT AREA_ WOODS ROADS
--.".., RIVERS B. STREAMS
N
Scale(J = z
Miles
- ~ - - - --
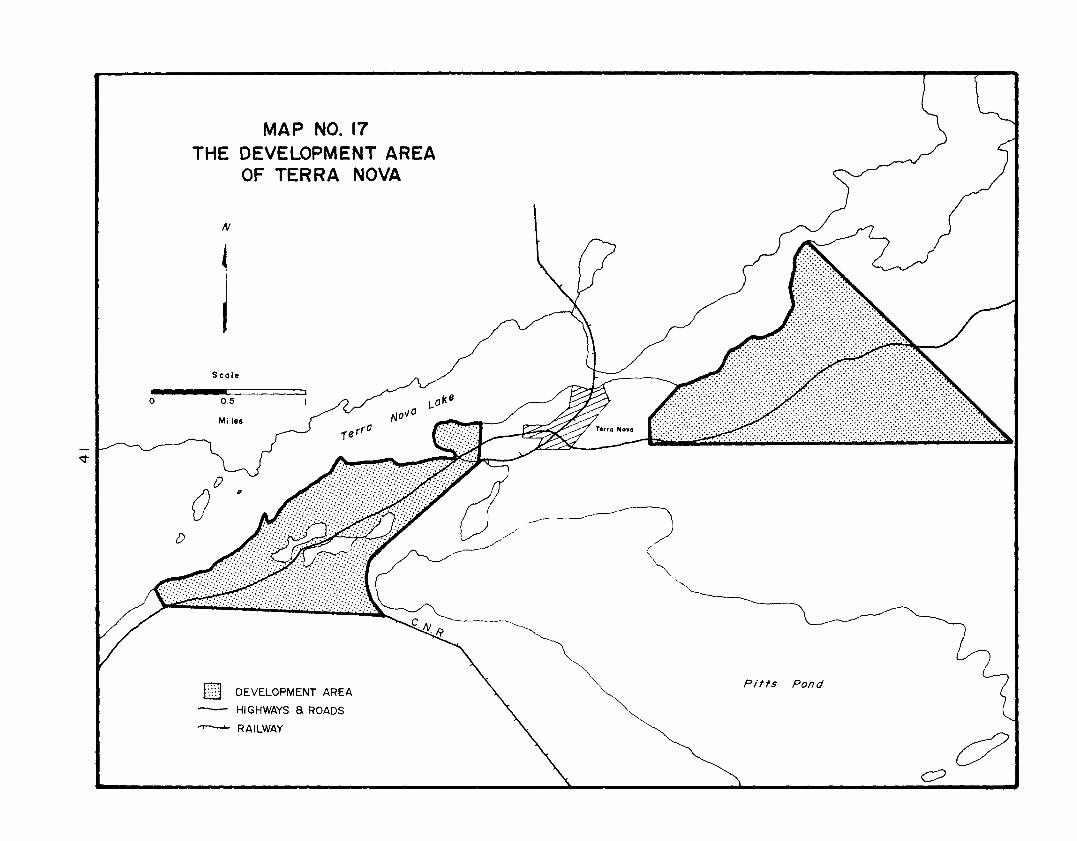
MAP NO. 17THE DEVELOPMENT AREA
OF TERRA NOVA
N
Scale
o 0.5
Mi les
[J] DEVELOPMENT AREA
-- HI GHWAYS a ROADS
RAILWAY
Pitts Pond

MAP NO. 18THE DEVELOPMENT AREA
OF AVALON SOUTH
".)\Mobile Big. Pond
t::::JDEVELOPMENT AREA
- HIGHWAYS Ii ROADSRAILWAY
...Jv- RIVERS Ii STREAMS
N
o 5Miles
aMount CarmelPond
~Frank'SPond
Scale
I: 500 ,000
ST. MARY'S
BAY
TREPASSEYBAY
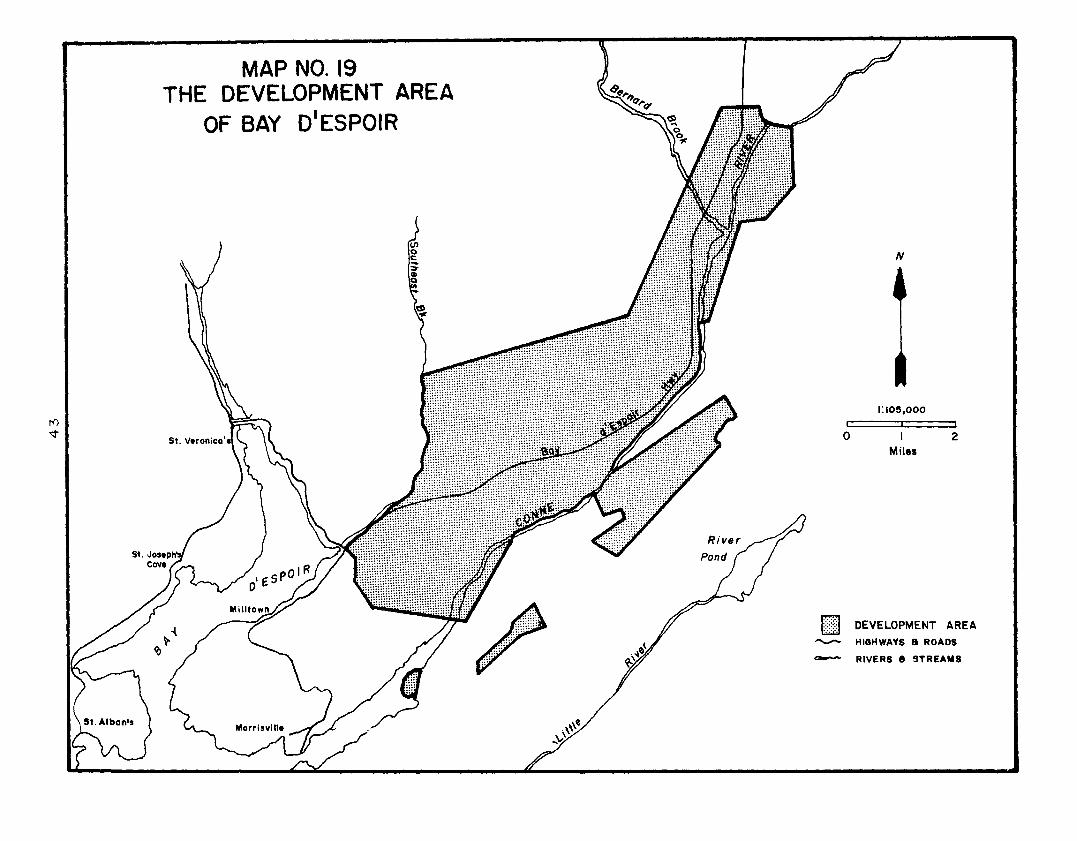
MAP NO. 19THE DEVELOPMENT AREA
OF BAY O'ESPOIR
N
1:I0!5,OOO
o IMiles
2
[ill DEVELOPMENT AREA~ HIGHWAYS a ROADS
RIVERS 8 STREAMS