newer analytical methods for the determination of
TRANSCRIPT

NEWER ANALYTICAL METHODS FOR THE
DETERMINATION OF ROPINIROLE HYDROCHLORIDE IN
BULK DRUG AND ITS FORMULATION
Dissertation Submitted in partial fulfillment of the requirement for the
award of the degree of
MASTER OF PHARMACY
Of
THE TAMILNADU Dr. M.G.R. MEDICAL UNIVERSITY,
CHENNAI
DEPARTMENT OF PHARMACEUTICAL ANALYSIS
K.M.COLLEGE OF PHARMACY
Uthangudi, Madurai - 625107
APRIL – 2012

Certificate
Dept. of pharmaceutical analysis
CERTIFICATE
This is to certify that the project entitled “Newer Analytical Methods for the
Determination of Ropinirole Hydrochloride in Bulk Drug and its Formulations” by
JOTHIBASU K (Reg. No. 26101722) in partial fulfillment of the degree of Master of
Pharmacy in Pharmaceutical Analysis under The Tamil Nadu Dr. M.G.R. Medical
University, Chennai, done at K. M. College of Pharmacy, Madurai - 625107, is a
bonafide work carried out by him under my guidance and supervision during the
academic year 2011-2012. The dissertation partially or fully has not been submitted for
any other degree or diploma of this university or other universities.
GUIDE HOD
Dr. M. Sundarapandian, M. Pharm., Ph.D., Dr. S. Meena, M. Pharm., Ph.D.,
Assistant Professor, Professor,
Dept. of Pharmaceutical Analysis, Dept. of Pharmaceutical Analysis,
K. M. College of Pharmacy, K. M. College of Pharmacy,
Madurai - 625107 Madurai - 625107
PRINCIPAL
Dr. S. Jayaprakash, M. Pharm., Ph.D.,
Professor,
Dept. of pharmaceutics,
K. M. College of Pharmacy,
Madurai - 625107

ABBREVIATION
% - Percentage
µg - Micro gram
µl - Micro litre
µm - Micro metre
ACN - Acetonitrile
Amt - Amount
ATC - Anatomical Therapeutic Chemical Classification
C18 - Octa Decyl Silane column
CAS - Chemical Abstracts Service
Cm - Centimetre
CZE - Capillary Zone Electrophoresis
HPLC - High Performance Liquid Chromatography
HPTLC - High Performance Thin Layer Chromatography
Hr - Hour
IUPAC - International Union of Pure and Applied Chemistry
KH2PO4 - Potassium Dihydrogen Phosphate
LC - Liquid Chromatography
LC-MS - Liquid Chromatography-Mass Spectrophotometry
LOD - Limit of Detection

LOQ - Limit of Quantitation
mg - Milli gram
min - Minute
ml - Millilitre
mm - Milli metre
nm - Nano metre
ODS - Octa Decyl Silane Column
RPLC - Reverse Phase Liquid Chromatography
RSD - Standard Deviation
SD - Standard deviation
SEM - Standard Error Mean
Std - Standard
Tab - Tablet
TLC - Thin Layer Chromatography
UPLC - Ultra Performance Liquid Chromatography
λmax - Absorption maximum

Chapter 1 Introduction
Dept. of pharmaceutical analysis 1
1. INTRODUCTION
1.1 A General Approach to Analytical Chemistry
Analytical Chemistry has been defined in many ways. One of the most widely
accredited definitions is that of the Working Party on Analytical Chemistry of the
Federation of European Chemical Societies: “Analytical Chemistry is a scientific
discipline that develops and applies methods, instruments and strategies to obtain
information on the composition and nature of matter in space and time.” [1]
A complementary definition has recently been issued, according to which
“Analytical Chemistry is a metrological discipline that develops, optimizes and
applies measurement process intended to derive quality bio-chemical or chemical
information of global and partial type from natural and artificial objects or systems in
order to solve analytical problems derived from information need.”
A trend has recently emerged for the systemic use of metrology in chemistry
in order to explain the main field of action of analytical chemistry, namely the
performance of bio-chemical or chemical measurements based on standards with a
view to establishing comparisons in order to produce qualitative, quantitative and
structural results.
1.2 Aims and Objectives of Analytical Chemistry
The intrinsic aim is the attainment of metrological quality, i.e. ensuring full
constancy between the analytical results delivered and the actual value of the
measured parameters; in metrological terms, this translates into producing highly
traceable results subject to very little uncertainty.
The extrinsic aim is solving the analytical problems derived from the bio-
chemical or chemical information needs posed by a variety of clients (e.g. private
companies, social agents and research centers) or in other words providing client
satisfaction.

Chapter 1 Introduction
Dept. of pharmaceutical analysis 2
The main objective of analytical chemistry is to obtain as much bio-chemical
or chemical information and of as high a quality as possible from objects and systems
by using as little material, time and human resources as possible and with minimal
costs and risks. 1
1.3 Classification of Analytical Chemistry
Based on the type of bio-chemical or chemical information delivered
♦ Qualitative Analysis - deals with the identification of elements, ions or
compounds present in a sample.[2]
♦ Quantitative Analysis - deals with the determination of how much of one or
more constituents are present in any compound or mixture of compounds.[3]
Based on the analytical technique used in the analytical process
♦ Classical Analysis (Wet Analysis)
Acid-base titration
Non-aqueous titration
Argentimetric titration
Complexometric titration
Redox titration
Iodometric titration
Diazotization titration [4]

Chapter 1 Introduction
Dept. of pharmaceutical analysis 3
♦ Instrumental Analysis
Spectroscopic Techniques
Ultraviolet and visible spectrophotometry
Fluorescence spectrophotometry
Phosphorescence spectrophotometry
Atomic emission spectrometry
Atomic absorption spectrometry
Infrared spectrophotometry
Raman Spectroscopy
X-ray spectroscopy
Nuclear magnetic resonance spectroscopy
Electron spin resonance spectroscopy [5]
Electrochemical techniques
Potentiometric techniques
Voltametric techniques
Coulometric techniques
Amperometric techniques
Electrogravimetric techniques
Conductance techniques [6]

Chapter 1 Introduction
Dept. of pharmaceutical analysis 4
Separation techniques
High performance liquid chromatography
Gas chromatography
High performance thin layer chromatography
Paper chromatography
Thin layer chromatography
Super critical fluid chromatography
Capillary Electrophoresis
Capillary Electro chromatography
Hyphenated techniques
Gas Chromatography - Mass spectrometry (GC-MS)
Gas Chromatography - Fourier Transform Infrared
Detection (GC-FTIR)
Gas Chromatography - Atomic Emission Detection
(GC-AED)
Liquid Chromatography - Mass Spectrometry (LC-MS)
Liquid Chromatography - Fourier Transform Infrared
Detection (LC-FTIR)
Liquid Chromatography - Nuclear Magnetic Resonance
Detection (LC-NMR)
Miscellaneous techniques
Thermal Analysis
Radio chemical methods [6]

Chapter 1 Introduction
Dept. of pharmaceutical analysis 5
1.4 ULTRAVIOLET AND VISIBLE ABSORPTION
SPECTROPHOTOMETRY
Ultraviolet and visible absorption spectrophotometry is the measurement of
the absorption of monochromatic radiation by solutions of chemical substances in the
range of 185 nm to 380 nm and 380 nm to 780 nm of the spectrum respectively. The
magnitude of the absorption of a solution is expressed in terms of the absorbance (A)
defined as the logarithm to base 10 of the reciprocal of transmittance (T) for
monochromatic radiation:
A = log10 (Io / I)
Where Io is the intensity of the incident radiation and I is the intensity of the
transmitted radiation. The absorbance depends on the concentration of the absorbing
substance in the solution and the thickness of the absorbing layer taken for
measurement. For convenience of reference and for ease in calculations, the specific
absorbance of a 1 per cent w/v solution is adopted in Pharmacopoeia for several
substances unless otherwise indicated and it refers to the absorbance of a 1 per cent
w/v solution in a 1 cm cell and measured at a defined wavelength. It is evaluated by
the expression
A (1 per cent, 1 cm) = A /cl,
Where c is the concentration of the absorbing substance expressed as
percentage w/v and l is the thickness of the absorbing layer in cm. The value of A (1
per cent, 1 cm) at a particular wavelength in a given solvent is a property of the
absorbing substance. Unless otherwise stated, the absorbance should be measured at
the prescribed wavelength using a path length of 1 cm and at 24º to 26º. Unless
otherwise stated, the measurements are carried out with reference to the same solvent
or the same mixture of solvents.

Chapter 1 Introduction
Dept. of pharmaceutical analysis 6
Apparatus
A spectrophotometer suitable for measuring in the ultraviolet and visible
ranges of the spectrum consists of an optical system capable of producing
monochromatic light in the range of 200 nm to 800 nm. The two empty cells used for
the solutions under examination and the reference liquid must have the same spectral
characteristics. Where double-beam-recording instruments are used, the solvent cell is
placed in the reference beam. [7]
Instrument Components
Figure no. 1 depicts a block diagram of the essential components of a typical
UV/Vis instrument. Some instruments position the sample/reference compartment
before the wavelength isolation device. This arrangement permits significantly greater
intensity of incident light falling on the sample and reference but may result in photo
degradation of some thermally sensitive samples, possibly creating baseline problems
with high fluorescent samples.
Figure no. 1 Block diagram of typical instrument for making UV/Vis absorption
measurements

Chapter 1 Introduction
Dept. of pharmaceutical analysis 7
Light source
Incandescent tungsten filament lamp
Quartz – Iodine lamp
Xenon arc lamp
Hydrogen or deuterium arc discharge lamp
Wavelength Isolation Device
The purpose of the wavelength isolation device is to separate the many
wavelengths of light coming from the continuum produced by the light source and
isolate the particular wavelength of interest.
Spectrophotometer monochromators are using either diffraction grating or
prisms as dispersive devices. Diffraction gratings are classified as either classically
ruled or holographic gratings. Prism monochromators are another popular wavelength
isolation device for spectrophotometers. There are many geometric designs of prisms,
but the Cornu (60˚- 60˚- 60˚) and the Liittrow (30˚- 60˚- 90˚) prisms are most widely
used and may be arranged in a variety of configuration.
Sample and reference compartments
Only double-beam instruments have a reference compartment. The double-
beam instrument is usually configured so that monochromatic light from the
wavelength isolation system is divided in by means of an optical beam splitter and
passed through both the sample and reference compartments continuously or rapidly
alternating between the compartments continuously or rapidly alternating between the
compartments. This allows compensation for small variations in the light source and
permits continuous blank corrections. The high stability of modern light sources
coupled with rapid measurement system allows many high-quality instruments to
incorporate a single-beam optical system without significantly sacrificing
measurement stability and without the additional expense of the double-beam optics
system. [8]

Chapter 1 Introduction
Dept. of pharmaceutical analysis 8
Detectors
For the accurate determination of substances by spectrophotometric
techniques, precise determinations of the light intensities are necessary. Photoelectric
detectors are most frequently used for this purpose. They must be employed in such a
way that they give response linearity proportional to the light input and they must
suffer from drift or fatigue.
Barrier-layer cells
Phototubes
Photomultiplier tubes
Photo diodes
Thermocouples
Bolometer
Thermistors
Golay detector [9]
Data Output and Data-Processing Device
Signal output devices can be as simple as an analog absorbance or
transmittance meter where the data are read, recorded and processed by the operator.
Some systems use logic circuitry to provide digital readouts in transmittance,
absorbance or concentration. Most modern spectrophotometers now incorporate
microprocessors for control and monitoring of instrument operation. These systems
commonly provide an interface to a computer system along with software to control
instrument operations, data collection and data processing.[8]

Chapter 1 Introduction
Dept. of pharmaceutical analysis 9
1.5 LIQUID CHROMATOGRAPHY
Liquid chromatography (LC) is a method of chromatographic separation based
on the difference in the distribution of species between two non-miscible phases, in
which the mobile phase is a liquid which percolates through a stationary phase
contained in a column.1
Liquid chromatography is mainly based on mechanisms of adsorption in
liquid-solid chromatography, mass distribution in normal phase liquid
chromatography (NPLC) and reversed-phase chromatography (RPLC), ionic in ion-
exchange chromatography (IEC), size exclusion or stereo chemical interaction in size-
exclusion chromatography (SEC) and affinity in affinity chromatography. [10]
Table no: 1 Classification of liquid chromatographic techniques
Technique Main separation
mechanism
Stationary phase Mobile phase
Adsorption
chromatography
Adsorption Polar material
such as silica or
alumina
Non-polar
solvents
NPLC Distribution/adsorption Polar material Non-polar
solvents
RPLC Distribution Non-polar material Polar solvents
IEC Ion-Exchange Charged solid
phase material
Typical
aqueous buffer
solutions
SEC Size exclusion Porous solid phase
material
Organic or
aqueous
solvents
Chapter 1 Introduction
Dept. of pharmaceutical analysis 10
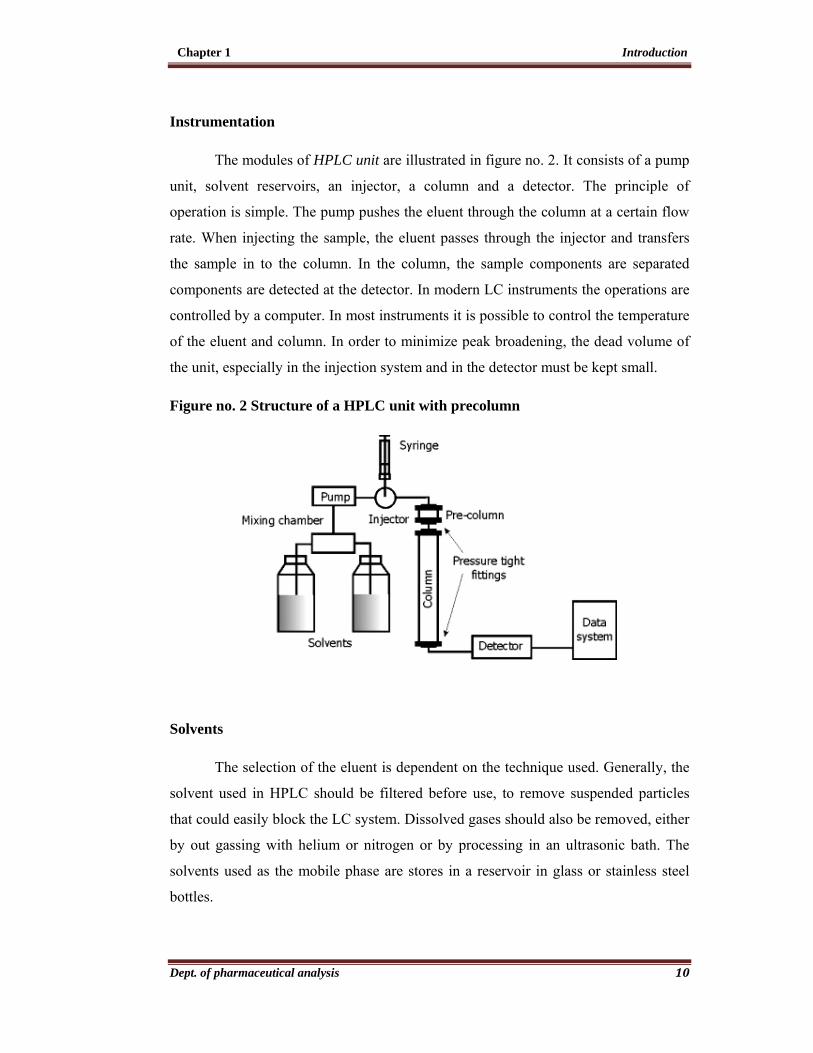
Instrumentation
The modules of HPLC unit are illustrated in figure no. 2. It consists of a pump
unit, solvent reservoirs, an injector, a column and a detector. The principle of
operation is simple. The pump pushes the eluent through the column at a certain flow
rate. When injecting the sample, the eluent passes through the injector and transfers
the sample in to the column. In the column, the sample components are separated
components are detected at the detector. In modern LC instruments the operations are
controlled by a computer. In most instruments it is possible to control the temperature
of the eluent and column. In order to minimize peak broadening, the dead volume of
the unit, especially in the injection system and in the detector must be kept small.
Figure no. 2 Structure of a HPLC unit with precolumn
Solvents
The selection of the eluent is dependent on the technique used. Generally, the
solvent used in HPLC should be filtered before use, to remove suspended particles
that could easily block the LC system. Dissolved gases should also be removed, either
by out gassing with helium or nitrogen or by processing in an ultrasonic bath. The
solvents used as the mobile phase are stores in a reservoir in glass or stainless steel
bottles.

Chapter 1 Introduction
Dept. of pharmaceutical analysis 11
In HPLC, the separation can be achieved by either isocratic or gradient
elution. In the isocratic method, the solvent composition is constant during the
separation. Better separation in shorter analysis time is usually obtained by using
gradient elution, in which the eluent composition is gradually changed during the
analysis. Two or more eluents can be used in gradient elution and the gradient can be
linear, stepwise, concave or convex. Typically, the elution strength of the solvent is
increased in the gradient method. Thus, in RPLC the amount of organic solvent (e.g.
acetonitrile) is increased while the amount of aqueous buffer is decreased.
Pumping systems
The requirements for a HPLC pump are high: The pump should be able to
produce pressures up to 400 bar (40MPa) with a large range of flow rates (0.05 - 10
ml min-1) and the flow should be free of pulsation. Also, the inner volume of the
pump should be small enough to enable a quick change of the eluent composition. In
addition, reproducibility and control of the flow with a relative error of less than 0.5%
should be obtained. The most common pumps in HPLC systems are displacement and
reciprocating pumps.
Stainless steel, Teflon or ceramics are used as materials. The high-pressure
strain is obtained using sapphire valves. One differentiates between reciprocating and
displacement pumps. Displacement pumps works like a syringe. A specific volume
approximately 200 ml of the mobile phase is sucked in and then discharged free of
pulsation in to the HPLC system. A crucial disadvantage however is the interruption
of the delivery process in order to fill or rinse the piston. Displacement pumps are still
used in micro-HPLC, since the composition of mobile phase during one analysis is
small.
Reciprocating pumps are preponderant today. As a rule, they are operated as
double-piston pumps, which work with a phase shift of 180˚ to suppress pulsation.
They are also called oscillating (inverse) displacement pumps. To avoid direct contact
with solvent with the pump valves, the pumps are also available as piston diaphragm
pumps. Here, the piston movement is transferred to a diaphragm using hydraulics. The
operation of the pumps is based on the movement of the piston, when the piston

Chapter 1 Introduction
Dept. of pharmaceutical analysis 12
moves backwards, it sucks eluent from the reservoir and on the forward movement
and it pushes the eluent in to the column.
The advantage of the short piston pump are the small internal volumes of 40 to
400 μl, the high pressure outlet of up to 60 MPa, as well as the constant flow, which is
independent of the back pressure of the column and the solvent viscosity.
Gradients can be produced on the low-pressure or high-pressure side. If one
mixes the two or three compartment solvents of an eluent mixture on the suction side
of a pump, one refers to a low-pressure gradient.
Two pumps are required to produce a high-pressure gradient. A single solvent
constituent or in the case of ternary mixtures, two constituents are presented in a
constant relationship. The third constituent is admixed-in on the pressure side of the
pump after the gradient program.
High-pressure gradients are more precisely composed than low-pressure
gradients. This can be ascribed to the fact that the volume contraction when the
various solvents are mixed can become significant in the low-pressure variant.
To avoid damaging the pump and contaminating the column particles, the
sample solution should be filtered prior to injection e.g. by passing it through a 1 μm
filter.
Injection System
The sample injection system must allow volumes in the range from 1 to 500 μl
to be introduced. In micro-HPLC, the sample volumes are much lower (< 1 μl) and a
different injection system is required than in conventional size HPLC. During the
injection, the pressure should be kept constant in the system. The most commonly
used injection system is presented in fig no. 3. It consists of a six-way valve, to which
a sample loop has been attached. The sample is injected into the loop by means of
micro liter syringe. While the loop is being filled, the eluent flows directly to the
column. By switching the valve, the eluent flow is directed via the sample loop to the
column. After injection, the valve is switched to its original position. The size of the

Chapter 1 Introduction
Dept. of pharmaceutical analysis 13
loop can be varied. In micro-HPLC systems, the sample loop is replaced with a
groove in the valve, because it is difficult to produce sufficiently small loops.
Figure no. 3 Injection valve of HPLC
Automated sample injection systems are preferred for high-precision sample
introduction. These are also based on sample loops and are operated by compressed-
air switching. 1
Columns
For most pharmaceutical analyses, separation is achieved by partition of
compounds in the test solution between the mobile and stationary phases. A system
consisting of polar stationary phases and non-polar mobile phases are described as
normal phase, while the opposite arrangement, polar mobile phases and nonpolar
stationary phases and is called reverse-phase chromatography. Partition
chromatography is almost always used for hydrocarbon-soluble compounds of
molecular weight less than 1000. The affinity of a compound for the stationary phase
and thus its retention time on the column is controlled by making the mobile phase

Chapter 1 Introduction
Dept. of pharmaceutical analysis 14
more or less polar. Mobile phase polarity can be varied by the addition of a second
and sometimes a third or even a fourth component.
Stationary phases for modern reverse-phase liquid chromatography typically
consist of an organic phase chemically bound to silica or other materials. Particles are
usually 3 to 10 μm in diameter, but sizes may range up to 50 μm or more for
preparative columns. Small particles thinly coated with organic phase provide for low
mass transfer resistance and hence rapid transfer of compounds between the stationary
and mobile phases. Column polarity depends on the polarity of the bound functional
groups, which range from relatively non-polar octadecyl silane to very polar nitrile
groups. Liquid non-bound stationary phases must be largely immiscible in the mobile
phase. Even so it is usually necessary to presaturate the mobile phase with stationary
phase to prevent stripping of the stationary phase from the column. Polymeric
stationary phases coated on the support are more durable.
Columns used for analytical separations usually have internal diameters of 2
to 5 mm; larger diameter columns are used for preparative chromatography. Columns
may be heated to give more efficient separations, but only rarely are they used at
temperatures above 60˚ because of potential stationary phase degradation or mobile
phase volatility. Unless otherwise specified in the individual monograph, columns are
used at ambient temperature.
In Size-exclusion chromatography the column is packed with a separation
material that is capable of fractionation in the appropriate range of molecular sizes
and through which the eluent is passed at a constant rate. One end of the column is
usually fitted with a suitable device for applying the sample, such as a flow adaptor, a
syringe through a septum or an injection valve and it may also be connected to a
suitable pump for controlling the flow of the eluent. Alternatively, the sample may be
applied directly to the drained bed surface or where the sample is denser than the
eluent, it may be layered beneath the eluent. The packing material may be a soft
support such as a swollen gel or a rigid support composed of a material such as glass,
silica or a solvent-compatible, cross-linked organic polymer. Rigid supports usually
require pressurized systems giving faster separations. The mobile phase is chosen
according to sample type, separation medium and method of detection.

Chapter 1 Introduction
Dept. of pharmaceutical analysis 15
Ion-exchange chromatography is used to separate water-soluble, ionizable
compounds of molecular weight less than 1500. The stationary phases are usually
synthetic organic resins; cation-exchange resins contain negatively charged active
sites and are used to separate basic substances such as amines, while anion-exchange
resins have positively charged active sites for separation of compounds with
negatively charged groups, such as phosphate, sulfonate or carboxylate groups.
Water-soluble ionic or ionizable compounds are attracted to the resins and differences
in affinity bring about the chromatographic separation. The pH of the mobile phase,
temperature, ion type, ionic concentration and organic modifiers affect the
equilibrium and these variables can be adjusted to obtain the desired degree of
separation.[1]
Detectors
Ultraviolet/visible (UV/Vis) spectrophotometers, including diode array
detectors are the most commonly employed detectors. Fluorescence
spectrophotometers, differential refractometers, electrochemical detectors, mass
spectrometers, light scattering detectors, radioactivity detectors or other special
detectors may also be used. [10]
♦ Absorbance detectors
Many compendial HPLC methods require the use of
spectrophotometric detectors. Such a detector consists of a flow-through cell
mounted at the end of the column. A beam of UV radiation passes through the
flow cell and into the detector. As compounds elute from the column, they
pass through the cell and absorb the radiation, resulting in measurable energy
level changes.
Fixed, variable and multi-wavelength detectors are widely available.
Fixed wavelength detectors - It is operate at a single wavelength typically 254
nm emitted by a low-pressure mercury lamp.

Chapter 1 Introduction
Dept. of pharmaceutical analysis 16
Variable wavelength detectors - It contains a continuous source, such as a
deuterium or high-pressure xenon lamp and a monochromator or an
interference filter to generate monochromatic radiation at a wavelength
selected by the operator. The wavelength accuracy of a variable-wavelength
detector equipped with a monochromator should be checked by the procedure
recommended by its manufacturer; if the observed wavelengths differ by more
than 3 nm from the correct values; recalibration of the instrument is indicated.
Modern variable wavelength detectors - This can be programmed to change
wavelength while an analysis is in progress.
Multi-wavelength detectors - This measure the absorbance at two or more
wavelengths simultaneously.
Diode array multi-wavelength detectors - In this continuous radiation is
passed through the sample cell and then resolved into its constituent
wavelengths, which are individually detected by the photodiode array. These
detectors acquire absorbance data over the entire UV-visible range, thus
providing the analyst with chromatograms at multiple, selectable wavelengths
and spectra of the eluting peaks. Diode array detectors usually have lower
signal-to-noise ratios than fixed or variable wavelength detectors and thus are
less suitable for analysis of compounds present at low concentrations.
♦ RI detector (refractometers)
Differential refractrometer detectors measure the difference between
the refractive index of the mobile phase alone and that of the mobile phase
containing chromatographed compounds as it emerges from the column.
Refractive index detectors are used to detect non-UV absorbing compounds,
but they are less sensitive than UV detectors. They are sensitive to small
changes in solvent composition, flow rate and temperature, so that a reference
column may be required to obtain a satisfactory baseline. [11]

Chapter 1 Introduction
Dept. of pharmaceutical analysis 17
♦ Fluorescence detectors
Compared with UV detectors, up to about 1000-fold higher sensitivity
can be achieved using fluorescence detectors. In fluorescence detectors the
excitation source is most frequently a mercury vapor lamp. Xenon high-
pressure lamps are also employed for more demanding tasks. In addition, the
excitation and emission wavelengths can be selected by monochromators or a
fluorescence spectrometer can be used as a detector. The intrinsic fluorescence
of substances can often be exploited in analysis of drugs, of clinically relevant
compounds or of natural substances. To detect non-fluorescent compounds the
substances to be determined first have to be derivatized. [1]
♦ Electrochemical detectors
Voltammetry, amperometry, coulometry and conductimetry can be
exploited for electrochemical detection.
These detectors are selective, sensitive and reliable, but require
conducting mobile phases free of dissolved oxygen and reducible metal ions.
Pulseless pump must be used and care must be taken to ensure that the pH,
ionic strength and temperature of the mobile phase remain constant. Working
electrodes are prone to contamination by reaction products with consequent
variable responses.
Electrochemical detectors with carbon-paste electrodes may be used
advantageously to measure nanogram quantities of easily oxidized
compounds, notably phenols and catechols. [11]
♦ Evaporative light scattering detector (ELSD)
Detection is based on the scattering of a beam of light by particles of
compound remaining after evaporation of the mobile phase. This detector is of
growing importance; it is a universal and does not require a compound to have
a chromophore for detection. Application includes the analysis of surfactants,
lipids and sugars. Unlike the refractive index detector, which was formerly
used for this analysis, it can be used with gradient elution and is robust enough
Chapter 1 Introduction
Dept. of pharmaceutical analysis 18
to function under a wide range of operating conditions. However, it cannot be
used with in-volatile materials such as buffers in the mobile phase or to detect
very volatile analytes. Typical applications include: analysis of chloride and
sodium ions in pharmaceuticals, lipids used as components in formulations,
sugars and sugar polymers. [4]
♦ Mass spectrometer
The mass spectrometer is a very important HPLC detector because of
its ability to generate structural and molecular weight information about the
eluted solutes. The combination of HPLC and mass spectrometry allows for
both separation and identification in the same step, an advantage none of the
other detectors provide.
The major difficulty in using mass spectrometry is in designing the
interface. The flow rate in HPLC is on the order of 1 ml/min, which are two or
three orders of magnitude larger than the flow that can be taken by the
conventional mass spectrometer vacuum systems. A second problem with
using mass spectrometry is the difficulty of vaporizing non-volatile and
thermally labile molecules without degrading them. [8]
Data Collection Devices
Modern data stations receive and store detector output and print out
chromatograms complete with peak heights, peak areas, sample identification and
method variables. They are also used to program the liquid chromatograph,
controlling most variables and providing for long periods of unattended operation.
Data also may be collected on simple recorders for manual measurement or
on stand-alone integrators, which range in complexity from those providing a printout
of peak areas to those providing chromatograms with peak areas and peak heights
calculated and data stored for possible subsequent reprocessing. [11]

Chapter 2 Drug Profile
Dept. of pharmaceutical analysis 19
2. DRUG PROFILE
2.1 NOMENCLATURE
Structure
CAS Registry number
91374-20-8
ATC Code
N04BC04
IUPAC Name
4-[2-(dipropylamino) ethyl]-1, 3-dihydro-2H-indol-2-one
Molecular Formula
C6H24N2O. HCl
Molecular Weight
296.84 g/mol [12]
Percent Composition of Atoms
C – 64.74 %, H – 8.49 %, N – 9.44 %, O – 5.39 %, Cl – 11 % [13]

Chapter 2 Drug Profile
Dept. of pharmaceutical analysis 20
2.2 PHYSICAL AND CHEMICAL PROPERTIES
Description
White to pale greenish yellow crystalline powder
Distribution coefficient (Octanol/ Water)
Log P = 3.32 in Phosphate buffer at pH 7.4
Dissociation Constant (pKa)
9.5 for tertiary amine
11.6 for indole nitrogen
Solubility
Soluble in water and in dilute Hydrochloric acid
Slightly soluble in ethyl alcohol
Insoluble in methylene chloride
Melting Point
241 to 243 ˚C
Storage
Store at 20 to 25 ˚C, Protected from light.
2.3 PHARMACEUTICAL FORMS:
In India Ropinirole Hydrochloride is available in the range of 0.25 mg, 0.5
mg, 1 mg and 2mg as film coated tablets and 4mg as extended release tablets.

Chapter 2 Drug Profile
Dept. of pharmaceutical analysis 21
2.4 PHARMACOLOGY
Indication
It is used in the management of Parkinson's disease, either alone or as
an adjunct to levodopa.
It is used in the treatment of Restless Leg Syndrome (RLS). [14]
Mechanism of Action
Ropinirole is a non-ergoline dopamine agonist with high relative in
vitro specificity and full intrinsic activity at the D2 and D3 dopamine receptor
subtypes, binding with higher affinity to D3 than to D3 or D4 receptor
subtypes.
Dosage
As monotherapy in Parkinson's disease:
Adult: Initially, 250 μg tid may increase by 750 μg at weekly intervals
for the first 4 week. Subsequent increments can be made in steps of 1.5
mg at weekly intervals up to 9 mg/day, then in steps of 3 mg at weekly
intervals. Usual dose ranges from 3-9 mg daily. Max: 24 mg/day.
Higher dose may be necessary if used in conjunction with levodopa.
Restless leg syndrome:
Adult: Initially, 250 μg daily for 2 days, taken 1-3 hr before bedtime.
May increase to 500 μg daily for the next few days, subsequent
increments may be made in steps of 500 μg at weekly intervals until 3
mg daily is reached. Maximum dose: 4 mg daily. [15]
Contraindication
Contraindicated for patients known to have hypersensitivity reaction
(including urticaria, angioedema, rash, pruritus) [16]

Chapter 2 Drug Profile
Dept. of pharmaceutical analysis 22
Adverse Drug Reactions
Nausea, vomiting, somnolence, insomnia, dyspepsia, dizziness, hallucinations,
tremors, abdominal pain, depression, headache, edema of the legs, ataxia, anxiety and
symptomatic hypotension [17] [18]
Drug - Drug Interactions
Ciprofloxacin : Inhibition of ropinirole metabolism
Antipsychotics : Antagonise the effect of ropinirole
Memantine : Enhancing the effect of ropinirole
Methyldopa : Antagonise the effect of ropinirole
Metoclopramide : Antagonise the effect of ropinirole
Oestrogens : Increase in the plasma concentration of ropinirole [12]
Pharmacokinetics
Absorption : Rapidly absorbed from the GI tract
Bioavailability : About 50%
Distribution : Widely distributed
Plasma protein binding : 10-40%
Metabolism : Extensively metabolized in the liver by CYP1A2
Excretion : Excreted in the urine as inactive metabolites;
less than 10% of the oral dose is excreted unchanged
Elimination half-life : About 6 hours [19] [20] [21]

Chapter 3 Literature review
Dept. of pharmaceutical analysis 23
3. LITERATURE REVIEW
3.1 Spectroscopic Methods
♦ M.V.Kumudhavalli et al. [22] [2011] have developed and reported a validated
spectrophotometric method for the determination of Ropinirole in pharmaceutical
formulation. Distilled water was used as a solvent throughout the study.
Quantitative determination of Ropinirole in pharmaceutical formulation was
carried out by UV spectrophotometric method using λ max at 249.0 nm. The
method showed high specificity in the presence of formulation excipients and
good linearity in the concentration range of 10-30 µg/ml. Percentage recovery
values at 249.0 nm were 96 to 101.30% .The intra and interday precision data
demonstrated that method was precised. The method was validated in terms of
accuracy, precision and specificity. The method could be routinely adopted for
quality control of these drugs in tablet.
♦ Sudarshan Purohit et al. [23] [2010] have reported a simple, sensitive and
selective UV spectroscopy method for the estimation of ropinirole HCl in
pharmaceutical formulation. Estimation of drug was performed in 0.1 N HCl at
230 nm. The validation studies were carried out with reference to ICH
requirements. The developed method was found to be specific, linear, precise
(including both intra- and inter-day), accurate and robust. This proposed method
might represent a valuable aid in the routine quality estimation of ropinirole HCl.
♦ Vishnu P. Choudhari et al. [24] [2010] have described two simple, precise and
economical UV spectrophotometric methods for the estimation of ropinirole in
pharmaceutical dosage form. In Method (A) area under curve (AUC) tool was
applied and in which area under curve was integrated in the wavelength range of
234.36 – 241 nm. Method (B) involved first order derivative spectrum of drug
solution and measurement of derivative amplitude at 262.58 nm. Calibration
curves were plotted for both methods by using instrumental response at selected
wavelength and concentrations of analyte in the solution. Linearity for the detector

Chapter 3 Literature review
Dept. of pharmaceutical analysis 24
response was observed in the concentration range of 4-20 μg/ml for both the
methods. Two tablet formulations were analyzed and percentage assay determined
was 99.79% – 100.68%. Accuracy and precision studies were carried out and
results were satisfactory. The proposed methods were validated as per ICH
analytical method development guidelines. The results of the analysis were
validated statistically. Limit of detection and limit of quantitation were determined
for both methods.
♦ Shete Yogita et al. [25] [2009] have developed and reported a simple, sensitive,
rapid, accurate and precise spectrophotometric method for estimation of ropinirole
hydrochloride in bulk and tablet dosage forms. Ropinirole hydrochloride showed
maximum absorbance at 250 nm with molar absorptivity of 8.703×10 3 l/mol.cm.
Beer's law was obeyed in the concentration range of 5-35 µg/ml. Results of
analysis were validated statistically and by recovery studies.
♦ Aydogmus Zeynep [26] [2008] has reported three sensitive, selective, accurate
spectrophotometric and spectrofluorimetric methods for the determination of
ropinirole hydrochloride in tablets. The first method was based on measuring the
absorbance of drug solution in methanol at 250 nm. The Beer's law was obeyed in
the concentration range 2.5–24 μg ml−1. The second method was based on the
charge transfer reaction of drug, as n-electron donor with 7,7,8,8-
tetracyanoquinodimethane (TCNQ), as π-acceptor in acetonitrile to give radical
anions that were measured at 842 nm. The Beer's law was obeyed in the
concentration range 0.6–8 μg ml−1. The third method was based on derivatization
reaction with 4-chloro-7-nitrobenzofurazan (NBD-Cl) in borate buffer of pH 8.5
followed by measuring the fluorescence intensity at 525 nm with excitation at 464
nm in chloroform. Calibration curve was constructed in the concentration range
0.01-1.3 μg ml−1. The derivatization reaction product of drug with NBD-Cl was
characterized by IR, 1H NMR and mass spectroscopy. The developed methods
were validated by parameters such as the molar absorptivity, limit of detection
(LOD, μg ml−1) and limit of quantitation (LOQ, μg ml−1), precision, accuracy,
recovery, and Sandell's sensitivity. Selectivity was validated by subjecting stock

Chapter 3 Literature review
Dept. of pharmaceutical analysis 25
solution of ropinirole to acidic, basic, oxidative and thermal degradation. No
interference was observed from common excipients present in formulations. The
proposed methods were successfully applied for determination of drug in tablets.
The results of these proposed methods were compared with each other
statistically.
♦ Armagan Onal et al. [27] [2007] have developed simple and reproducible
spectrophotometric methods for the determination of dopaminergic drugs used for
Parkinson's disease, cabergoline (CAB) and ropinirole hydrochloride (ROP), in
pharmaceutical preparations. The methods were based on the reactions between
the studied drug substances and ion-pair agents [methyl orange (MO),
bromocresol green (BCG) and bromophenol blue (BPB)] and yellow colored ion-
pair complexes were produced in acidic buffers; Then the ion-pair complexes
were extracted in dichloromethane and which were spectrophotometrically
determined at the appropriate wavelength of ion-pair complexes. Beer's law was
obeyed within the concentration range from 1.0 to 35 μg ml−1. The developed
methods were applied successfully for the determination of these drugs in tablets.
♦ J. V. Susheel et al. [28] [2007] have described a Ultra Violet Spectroscopy for the
determination of ropinirole hydrochloride in tablet dosage forms. Detection
wavelength was found to be 250 nm using ethanol as a solvent. For this method
the linearity was found to be in the range of 5-30 μg/ml. The developed method
could be applied for routine analysis of ropinirole hydrochloride from tablet
dosage forms.
♦ Mahaki Hanieh et al. [29] [2011] have reported the interaction between ropinirole
hydrochloride and Human serum albumin as binary system by Three-dimensional
Fluorescence Spectroscopy. The emission wavelength was recorded between 300
and 600 nm, the initial excitation wavelength was set to 200 nm with increment of
10 nm. Peak (a) was the Rayleigh scattering peak (=) and peak (b) was the second-
ordered scattering peak (= 2). The fluorescence intensity of peak (a) and peak (b)
was increased with the addition of Ropinirole hydrochloride. The possible reason

Chapter 3 Literature review
Dept. of pharmaceutical analysis 26
was that a RP–HSA complex was formed after the addition of ropinirole
hydrochloride followed by increasing the diameter of the macromolecule which in
turn resulted in an enhanced scattering effect. Peak 1 mainly revealed the spectral
behavior of Tryptophan and Tyrosine residues. The reason was that when HSA
was excited at 280 nm, it mainly revealed the intrinsic fluorescence of Tryptophan
and Tyrosine residues. Beside peak 1, there was another fluorescence peak 2 (=
230.0 nm, = 340.0 nm) that mainly reflected the fluorescence spectral behavior of
the polypeptide backbone structure of HSA. The fluorescence intensity of peak 2
decreased after the addition of ropinirole hydrochloride, which showed that the
peptide strands structure of HSA had been changed.
♦ Hanieh Mahaki [30] [2011] has reported a binding analysis of Ropinirole
Hydrochloride and Aspirin to Human Serum Albumin by Synchronous
Fluorescence. Fluorescence measurements were carried out on a F-2500 (Hitachi,
Japan) with a 150W Xenon lamp spectrofluorimeter. Synchronous fluorescence
gave information about the molecular environment in a vicinity of the
chromophore molecule. The D-value (Δλ) between excitation and emission
wavelengths was stabilized at 15 or 60 nm; the synchronous fluorescence gave the
characteristic information of tyrosine or tryptophan residues. Fluorescence
intensity decreased regularly with the addition of Ropinirole Hydrochloride and
Aspirin. The synchronous fluorescence spectra of Human Serum Albumin with
various amounts of Ropinirole Hydrochloride and Aspirin were recorded at Δλ=60
nm. The tryptophan fluorescence emission of Aspirin was decreased regularly, but
no significant change in wavelength was observed. At the same time, the emission
wavelength of the tryptophan residues was slight blue-shifted in Ropinirole
hydrochloride.

Chapter 3 Literature review
Dept. of pharmaceutical analysis 27
3.2 Chromatographic Techniques
♦ Sundaramurthy Poongothai et al. [31] [2011] have developed a dissolution
test for in vitro evaluation of tablet dosage forms containing 5 mg of ropinirole
by reverse phase high performance liquid chromatography. A discriminatory
dissolution method was established using apparatus basket at a stirring rate of
50 rpm with 500 ml of pH 4.0 deaerated citrate buffer as dissolution medium
and detection was carried out at 250 nm. The retention time of ropinirole
hydrochloride was found to be 3.84 minutes. The proposed method was
validated to meet requirements for a global regulatory filing which included
linearity, specificity, precision, accuracy, ruggedness and robustness and to
evaluate the formulation during an accelerated stability study. The method
could be applied for the quality-control analysis of ropinirole tablets.
Moreover, quantitative analysis was also performed, to compare the
applicability of the RP-LC and the LC-MS/MS methods.
♦ Ch. Krishnaiah et al. [32] [2010] have reported a novel stability-indicating
gradient reverse phase ultra performance liquid chromatographic (RPUPLC)
method for the determination of purity of ropinirole in presence of its
impurities and forced degradation products. The method was developed using
Waters Aquity BEH 100 mm, 2.1 mm, 1.7 μm C-8 column with mobile phase
containing a gradient mixture of solvent A and B. The eluted compounds were
monitored at 250 nm. The run time was within 4.5 min in which ropinirole and
its four impurities were well separated. Ropinirole was subjected to the stress
conditions of oxidative, acid, base, hydrolytic, thermal and photolytic
degradation. Ropinirole was found to degrade significantly in oxidative and
base stress conditions and stable in acid, water, hydrolytic and photolytic
degradation conditions. The degradation products were well resolved from
main peak and its impurities. Thus it proved the stability indicating power of
the method. The developed method was validated as per International
Conference on Harmonization (ICH) guidelines with respect to specificity,
linearity, limit of detection, limit of quantification, accuracy, precision and

Chapter 3 Literature review
Dept. of pharmaceutical analysis 28
robustness. This method was also suitable for the assay determination of
ropinirole in pharmaceutical dosage forms and dissolution studies.
♦ N.Sreekanth et al. [33] [2009] have described a simple and accurate RP-HPLC
method has been developed for the estimation of ropinirole hydrochloride in
bulk and pharmaceutical dosage forms using C18 column 250 x 4.6 mm i.d,
5μm particle size in isocratic mode, with mobile phase comprising of buffer
(pH 6.0) and Acetonitrile in the ratio of 50:50 v/v. The flow rate was
0.5ml/min and detection was carried out by UV detector at 245nm. The
retention time for Ropinirole Hydrochloride was found to be 4.867 min. The
proposed method has permitted the quantification of ropinirole hydrochloride
over linearity in the range of 5-50µg/ml and its percentage recovery was found
to be 99.3-100.4%. The intraday and inter day precision were found 0.27%
and 0.26% respectively.
♦ Saral et al. [34] [2009] have reported a validated RP-HPLC method for the
estimation of Ropinirole hydrochloride in tablet dosage form and its IVIVC
studies. The chromatographic conditions were,
Column : Octadecyl carbon chain bonded silica column
Mobile Phase : Phosphate buffer (pH 6.5): Acetonitrile (70:30)
Flow rate : 1 ml min -1
Detection : UV detection at 250 nm
Linearity was found to be over a range of 25 to 150 % of actual concentration
(r = 0.9999), with limit of detection and quantification of 0.062 and 0.186 µg
ml-1, respectively. The analytical method passed both robustness and
ruggedness tests. In both cases, relative standard deviation was well
satisfactory. The method could be used for quality control assay of ropinirole
hydrochloride. The results obtained from the dissolution in different media
showed that the release was almost similar in all the media but pH 4.0 citrate
buffer was considered to be the discriminating media considering that the
medium showed variation as a result of change in formulation of the drug. The

Chapter 3 Literature review
Dept. of pharmaceutical analysis 29
drug was freely and rapidly soluble in water, so the sink condition was not
mandatory. The volume of dissolution media was selected as 500ml based on
poor absorbance as that of 900ml. After optimizing, the complete method
validation was made with various parameters. The dissolution data i.e.
percentage drug released at 15 minutes which have a close linear relationship
with correlation coefficient as 0.9968 and slope around unity with the
biological property i.e. Cmax.
♦ B. Jancic-Stojanovic et al. [35] [2009] have reported a chemometrical
evaluation of ropinirole and its impurity's (4-[2-(dipropylamino) ethyl]-1H-
indol-2, 3-Dione) chromatographic behavior in systematic and the most
efficient way. Face-centered central composite design (CCD) with 23 full
factorial designs, ±1 star design and four replication in central point was
applied for a response surface study, in order to examine in depth the effects
of the most important factors. Factors—independent variables (acetonitrile
content, pH of the mobile phase and concentration of sodium heptane
sulfonate in water phase) were extracted from the preliminary study and as
dependent variables five responses (retention factor of ropinirole, retention
factor of its impurity, resolution, symmetry of ropinirole peak and symmetry
of impurity peak) were selected. For the improvement of method development
and optimization step, Derringer's desirability function was applied
simultaneously to optimize the five chosen responses. The procedure allowed
deduction of optimal conditions and the predicted optimum was acetonitrile-5
mM of sodium heptane sulfonate (21.6:78.4, v/v), pH of the mobile phase
adjusted at 2.0 with ortho phosphoric acid. By calculating global desirability's
determination coefficients (), as well as by the visual inspection of 3D graphs
for global desirability, robustness of the proposed method was also estimated.
♦ A. Azeem et al. [36] [2008] have disentangled an accurate, sensitive, precise,
rapid, and isocratic reversed phase High performance liquid chromatography
(RP-HPLC) method for analysis of ropinirole in the bulk drug and in
pharmaceutical preparations. The best separation was achieved on a 250 mm ×
4.6 mm i.d, 5-μm particle, C18 reversed-phase column with methanol: 0.05 M

Chapter 3 Literature review
Dept. of pharmaceutical analysis 30
ammonium acetate buffer (pH 7) 80:20 (v/v) as mobile phase, at a flow rate of
1 ml min-1. UV detection was performed at 250 nm. The method was linear
over the concentration range 0.2–100 μg ml-1 (r = 0.9998), with limits of
detection and quantitation of 0.061 and 0.184 μg ml-1, respectively. The drug
was subjected to oxidation, hydrolysis, photolysis, and heat as stress
conditions. Degradation products resulted from the stress did not interfere with
detection and assay of ropinirole and thus the method could be regarded as
stability-indicating. The method could be used for quality-control assay of
ropinirole.
♦ B. Sahasrabuddhey et al. [37] [2007] have isolated three impurities in
ropinirole hydrochloride drug substance at levels 0.06–0.15% were detected
by using reverse-phase high performance liquid chromatography (HPLC).
These impurities were analyzed using reverse-phase HPLC. Based on the
spectral data (IR, NMR and MS), structures of these impurities were
characterized as 4-[2-(propylamino) ethyl]-1,3-dihydro-2H-indol-2-one
hydrochloride (impurity-A), 5-[2-(dipropylamino) ethyl]-1,4-dihydro-3H-
benzoxazin-3-one hydrochloride (impurity-B) and 4-[2-(dipropylamino)
ethyl]-1H-indol-2,3-dione hydrochloride (impurity-C). Synthesis of these
impurities was discussed.
The present study was illustrated the isolation of three process related
unknown impurities of ropinirole hydrochloride by preparative HPLC which
were further characterized using various spectroscopic techniques.
♦ Armagan Onal [38] [2006] have explicated a reversed-phase high-performance
liquid chromatographic (HPLC) method with UV detection for the
determination of ropinirole (ROP) in tablets. The assay utilized UV detection
at 250 nm and a Luna CN column (250 × 4.6 mm I.D, 5 μm). The mobile
phases were comprised of acetonitrile: 10 mM nitric acid (pH 3.0) (75:25,
v/v). Validation experiments were performed to demonstrate linearity,
accuracy, precision, limit of quantitation (LOQ), limit of detection (LOD), and
robustness. The method was linear over the concentration range of 0.5–10.0

Chapter 3 Literature review
Dept. of pharmaceutical analysis 31
μg mL−1. The method showed good recoveries (99.75–100.20%) and the
relative standard deviations of intra and inter-day assays were 0.38–1.69 and
0.45–1.95%, respectively. The method could be used for quality control assay
of ropinirole.
♦ Jeffery Hackett [39] [2006] has evaluated solid-phase sorbents for the analysis
of ropinirole in whole blood. In this method, drug free blood was spiked with
ropinirole (0 to 10 ng) and an internal standard (quinidine). The samples were
buffered with distilled water and centrifuged. The supernatant liquid was
applied to previously conditioned end capped C6, C18 and C8/SCX solid phase
extraction columns. The columns were washed, dried, and eluted with various
solvents systems. The eluants were collected and evaporated. The residue was
dissolved in 100 μl of aqueous 0.1% trifluoroacetic acid and analyzed by
liquid chromatography using a C18 (4.6 × 150 mm, 5-μm particle size) column
and monitored at 250 nm, using diode-array detection. A mobile phase
consisting of methanol/0.1% TFA in distilled water (22:78 v/v) was employed.
The data was collected and appraised. It was found that 3-ml 200-mg CEC06
C6 (Hexyl end capped) solid-phase columns that had been washed with 3 × 3
ml water and 3 × 3 ml acetonitrile and eluted with a solvent system consisting
of 95:5 v/v acetonitrile/ammonia performed best. The linear range for this
analysis was found to be from 0 to 10 ng/ml. The limit of detection was
determined to be 1 ng/ml with a limit of quantification of 2.5 ng/ml.
♦ George Lunn [40] [2005] has reported a liquid chromatographic determination
of ropinirole hydrochloride in rat, dog and human plasma.
Column : 250 × 4.6 5 μm Ultrasphere ODS
Mobile phase : ACN: 70 mM pH 3.8 ammonium formate buffer
(25:75) containing 0.3% EDTA and 0.005% SOS
Flow rate : 1ml/min
Injection volume : 10–100 μl
Detector : UV 250 nm

Chapter 3 Literature review
Dept. of pharmaceutical analysis 32
Retention time : 9.4 min
Internal standard : 4-(2-di-N, N-propylaminoethyl)-7-methoxy-2-(3H)-
Indoline HCl (11.5 min)
Limit of detection : 5 ng/ml
Limit of quantitation : 10 ng/ml
♦ Pavel Coufal et al. [41] [1999] have reported a Capillary liquid
chromatography (CLC) for the separation and quantification of ropinirole and
its five related impurities, potentially formed during its synthesis. A
simultaneous optimization of three mobile phase parameters, i.e., pH, buffer
concentration and acetonitrile content was performed employing an
experimental design approach which proved a powerful tool in method
development. The retention factors of the investigated substances in different
mobile phases were determined. Baseline resolution of the six substances on a
C18 reversed stationary phase was attained using a mobile phase with an
optimized composition [acetonitrile-8.7 mM 2-(N-morpholino) ethanesulfonic
acid adjusted to pH 6.0 (55:45, v/v)]. It was shown that CLC, operated in the
isocratic mode under the mobile phase flow-rate of 4μl/min, could determine
the level of these impurities, down to a level of 0.06% of the main component
within 25 min.
♦ SB Bari et al. [42] [2011] have developed and ratified a TLC/densitometry of
ropinirole hydrochloride as a bulk drug. The separation was achieved on TLC
aluminium plates precoated with silica gel 60F-254 as the stationary phase
using chloroform: acetone: triethylamine (3.5:1.5:0.2 v/v) as mobile phase
and densitometry analysis at 250 nm. The system showed compact spot for
ropinirole hydrochloride (Rf = 0.52 ± 0.02). The drug followed linearity in the
concentration range 300 - 1800 ng per band (r2 = 0.9983 ± 0.0008). Drug was
subjected to hydrolysis, oxidation and thermal degradation which indicate the
drug is susceptible to hydrolysis, oxidation and heat and degraded product did
not interfere with detection and assay of ropinirole hydrochloride. Statistical
analysis proved that the method was repeatable, selective and accurate for the
estimation of ropinirole hydrochloride.

Chapter 3 Literature review
Dept. of pharmaceutical analysis 33
♦ Gulam Mustafa et al. [43] [2011] have developed and validated a stability-
indicating high-performance thin-layer chromatographic (HPTLC) method for
analysis of ropinirole HCl as per the ICH guidelines. The method employed
the mobile phase, toluene-ethyl acetate-6M ammonia solution (5:6:0.5, v/v/v).
Densitometric analysis of ropinirole HCl was carried out in the absorbance
mode at 250 and 254 nm. Compact spots for ropinirole HCl were found at Rf
value of 0.58 ± 0.02. The linear regression analysis data for the calibration
plots showed R2 = 0.9989 ± 0.0053 with concentration range of 100– 3000 ng
spot-1. The method was validated for precision, accuracy, ruggedness,
robustness, specificity, recovery, limit of detection (LOD) and limit of
quantitation (LOQ). The LOD and LOQ were 12.95 and 39.25 ng spot-1
respectively. Drug was subjected to acidic, alkaline, oxidative, dry heat, wet
heat and photo degradation stress. All the peaks of degradation products were
well resolved from the standard drug peak with significantly difference of
retention factor. The acidic and alkaline stress degradation kinetics of
ropinirole, was found to be in first order, showing high stability (t1/2,146.37
hr-1; t0.9, 39.11 hr-1) in acidic medium and low stability (t1/2,97.67 hr-1;
t0.9, 14.87 hr-1) in alkaline environment.
♦ T. K. Ravi et al. [28] [2007] have developed a High Performance Liquid
chromatography (HPTLC) for the determination of ropinirole hydrochloride
in tablet. Solvent system used here was Methanol: Acetonitrile (8: 2 v/v)
Detection wave length was found to be 254 nm. The linearity was found to be
between 40 to 120 μg/ml. Since aripiprazole peak was well resolved from
ropinirole hydrochloride peak and had good peak shape, aripiprazole was
selected as an internal standard. This method could be applied for routine
analysis of ropinirole hydrochloride in tablet dosage forms.

Chapter 3 Literature review
Dept. of pharmaceutical analysis 34
3.3 Electrophoretic techniques:
♦ Pavel Coufal et al. [44] [1998] have reported a Capillary Zone Electrophoresis
(CZE) method for the determination of the dissociation constants of ropinirole
and five structurally related impurities, potentially formed during its synthesis
and for separation and quantification of these substances. The dissociation
constants obtained from the CZE measurements were confirmed by UV
spectrophotometry for some of the test compounds, obtaining a good
agreement between the values. Careful optimization of the running buffer
composition permitted base-line resolution of the six compounds in a borate
buffer containing acetonitrile and magnesium sulfate (a 100 mM borate buffer
containing 30 mM MgSO4 and 20 vol. % of 4 acetonitrile). It was shown that
CZE could determine the level of these impurities, down to a level of 0.05% of
the main component within 15 min.
3.4 Hyphenated Techniques:
♦ D. Vijaya Bharathi et al. [45] [2009] have explicated a highly sensitive, rapid
assay method has been developed and validated for the estimation of
ropinirole (RPR) in human plasma with liquid chromatography coupled to
tandem mass spectrometry with electro spray ionization in the positive-ion
mode. A solid-phase process was used to extract RPR and citalopram (internal
standard, IS) from human plasma. Chromatographic separation was operated
with 0.2% ammonia solution: acetonitrile (20:80, v/v) at a flow rate of 0.50
ml/min on a Hypurity C18 column with a total run time of 3.2 min. The
MS/MS ion transitions monitored were 261.2 → 114.2 for RPR and 325.1 →
209.0 for IS. Method validation and clinical sample analysis were performed
as per FDA guidelines and the results met the acceptance criteria. The lower
limit of quantitation achieved was 3.45 pg/ml and the linearity was observed
from 3.45 to 1200 pg/ml. The intra-day and inter-day precisions were in the
range of 4.71-7.98 and 6.56-8.31%, respectively. This novel method had been
applied to a pharmacokinetic study of RPR in humans.

Chapter 3 Literature review
Dept. of pharmaceutical analysis 35
♦ Erin E. Chambers et al. [46] [2008] have evolved a rapid and sensitive SPE-
UPLC/MS/MS method for the determination of ropinirole hydrochloride in
human plasma. Citalopram is used as an internal standard.
LC Conditions:
Column : C18
Mobile Phase : 10mM NH4COOH (pH 9): CH3OH
Flow Rate : 0.5ml/min
Injection volume : 8.0 μl
Column Temperature : 45˚C
MS Conditions:
Ion Source : Electro spray positive (ESI+)
Desolvation Temperature : 350˚ C
Cone gas flow : 50 L/Hr
Desolvation gas flow : 750 L/Hr
Collision cell pressure : 2.6 × 10(-3) mbar
This method achieved a S/N of over 100: 1 at the required LLOQ of
0.005ng/ml. the method meets the FDA requirements for linearity and
excellent recovery for both analytes. This method enables researchers to
obtain higher quality data faster in order to make critical project decisions.
♦ Ai-Dong Wen et al. [47] [2007] have examined the effect of Madopar on the
pharmacokinetics of ropinirole in healthy Chinese volunteers by using liquid
chromatography tandem mass spectrometry (HPLC/MS/MS). A single dose of
1mg ropinirole was given orally after administration of the placebo or
Madopar (containing 200 mg levodopa and 50 mg benserazide) to six healthy
males and six healthy females in a cross-over randomized study with a

Chapter 3 Literature review
Dept. of pharmaceutical analysis 36
minimum washout period of 8 days. Pharmacokinetic parameters were
calculated for both treatments. Co administration of ropinirole and Madopar
did not result in a notable change in rate or extent of availability of ropinirole,
as shown by the ratios (90% confidence intervals) of 1.045 (0.900, 1.222) for
Cmax (maximum plasma concentration) and 1.167 (1.086, 1.262) for AUC0–inf
(the area under the concentration–time curve). Likewise, no significant
difference in any of the other pharmacokinetic parameters [Tmax (the time
needed to reach the Cmax), MRT (mean residence time), volume of distribution
(V/F), and clearance (CL/F)] was observed between the treatment groups. No
clinically relevant adverse effects were detected under either conditions and
there are no pharmacokinetic grounds for adjusting the dose of ropinirole
when given in combination with Madopar in Chinese patients.
♦ William Edgemond et al. [48] [2007] have elaborated a LC-MS-MS method
for the quantitation of ropinirole in human plasma. The method was validated
with a quantitative range of 10.0 to 1000 pg/ml. EDTA human plasma (0.5 ml)
was fortified with internal standard, ropinirole-D3 prior to extraction. After
addition of sodium carbonate solution, the samples were extracted with ethyl
acetate/cyclohexane, 9:1. After evaporating the solvent, the samples were
reconstituted in mobile phase (A). A Hypersil GOLD PFP (3& [mu], 50x4.6
mm) column was used, yielding a retention time of 1.5 minutes. A step
gradient method was used to clear late eluters (mobile phase A consisted of 10
mM ammonium acetate in 1:1, methanol: water and mobile phase B consisted
of 100% methanol). Detection was carried out on a SCIEX API-5000 LC-MS-
MS in positive Ion Spray MRM mode. The transitions monitored were m/z
261 & [rarr] 114 for ropinirole and m/z 264 & [rarr] 117 for ropinirole-D3.
Three validation runs were performed on separate days. Precision (%CV) and
accuracy (%bias) across all levels of the range were within & [plusmn] 8.0%.
The precision and accuracy at the LLOQ was within & [plusmn] 9.0%.
Extraction recovery ranged from 86% to 93%. No chromatographic
interferences or matrix effects from six different lots of plasma were observed
indicating the specificity of the method. Stability of ropinirole in plasma was
established for 24 hours at room temperature, for 5 cycles of freezing and

Chapter 3 Literature review
Dept. of pharmaceutical analysis 37
thawing, and for 141 hours in the final extract. Long term stability of
ropinirole in plasma was shown to be 80 days at –20 & [deg] C. The step
gradient improved the robustness of the method. This method was successfully
validated. The method proved rugged and sensitive in the determination of the
concentrations of ropinirole in over 3400 samples generated from clinical
trials.
♦ Jignesh Bhatt et al. [49] [2006] have reported a rapid and robust liquid
chromatography-mass spectrometry (LC-MS/MS) method for non-ergoline
dopamine D (2)-receptor agonist, ropinirole in human plasma using Es-
citalopram oxalate as an internal standard. The method involves solid phase
extraction from plasma, reversed-phase simple isocratic chromatographic
conditions and mass spectrometric detection that enables a detection limit at
picogram levels. The proposed method was validated with linear range of 20-
1,200 pg/ml. The extraction recoveries for ropinirole and internal standard
were 90.45 and 65.42%, respectively. The R.S.D. % of intra-day and inter-day
assay was lower than 15%. For its sensitivity and reliability, the proposed
method was particularly suitable for pharmacokinetic studies.

Chapter 4 Aim and Plan of the Work
Dept. of pharmaceutical analysis 38
4. AIM AND PLAN OF THE WORK
4.1 Aim of the Work
The aim of the present study was to develop newer analytical methods for the
estimation of ropinirole hydrochloride in bulk drug and its formulations. Ropinirole
hydrochloride is an indole derivative and has di-alkylated tertiary amine in its side
chain.
Literature survey reveals that only few analytical methods have been
developed and reported for the estimation of ropinirole hydrochloride; they were UV,
UPLC, HPLC, HPTLC, TLC, CZE, LC-MS and SPE-UPLC-MS.
As discussed earlier in drug profile, ropinirole hydrochloride is highly soluble
in aqueous solvents. So the present study aims to develop newer and sensitive
methods for the analysis of ropinirole hydrochloride using simple and economic
aqueous solvents.
4.2 Plan of the Work
Development of newer analytical methods as follows:
♦ UV Spectrophotometric determination of ropinirole hydrochloride
using 0.1 M acetic acid as solvent.
♦ Extractive spectrophotometric estimation of ropinirole hydrochloride
using 0.2 % picric acid in water used as a reagent.
♦ RP - HPLC method for the estimation of ropinirole hydrochloride
using ODS column as stationary phase and potassium dihydrogen
phosphate buffer in 10 % ortho phosphoric acid (pH 3.3): acetonitrile
(70: 30) as mobile phase.

Chapter 5 Methodology
Dept. of Pharmaceutical Analysis 39
5. METHODOLOGY
5.1 UV Spectrophotometric Determination of Ropinirole Hydrochloride using
0.1 M Acetic acid
Apparatus/Instruments Used
UV- Visible double beam Spectrophotometer (Perkin Elmer EZ 301)
Analytical electronic weighing balance (Shimadzu)
Vortex mixer
Solvents Used
Acetic acid - AR Grade
Water - Distilled Water
Reference Standard
Ropinirole hydrochloride was obtained as a gift sample from East West
Pharma Haridwar - 247 667, India.
Tablet Formulations
Ropark film coated tablets – 2 mg (Sun Pharmaceuticals Industries Ltd)
Ropin film coated tablets – 2 mg (East West Pharma)

Chapter 5 Methodology
Dept. of Pharmaceutical Analysis 40
Preparation of 0.1 M Acetic acid in Water
It was prepared by diluting 5.7 ml of concentrated acetic acid in 1000 ml of
distilled water.
Preparation of standard stock solution
Standard stock solution - I
Standard stock solution - I was prepared by dissolving 25 mg of ropinirole
hydrochloride working standard in 25 ml of 0.1 M acetic acid to get a final
concentration of 1 mg/ml.
Standard stock solution - II
2 ml of standard stock solution I was taken and further diluted to 25ml with
same solvent to get the final concentration of 80 μg/ml.
Selection of Wavelength
2.5 ml of standard stock solution - II was pipetted out and diluted to 10ml with
0.1 M acetic acid. Then this solution was scanned in the UV region of 200 - 400 nm to
get absorption maximum (λmax). The drug was found to have a maximum absorbance
at 250 nm in 0.1 M acetic acid and hence this wavelength was selected for further
studies. The absorbance data were presented in table no.2 and absorption spectrum
was shown in figure no.4.

Chapter 5 Methodology
Dept. of Pharmaceutical Analysis 41
Table no: 2 Data for the absorption spectrum of ropinirole hydrochloride using
0.1 M acetic acid
S.No Wavelength Absorbance
1 200 3.000
2 210 3.000
3 220 0.711
4 230 0.328
5 240 0.502
6 250* 0.625
7 260 0.425
8 270 0.140
9 280 0.101
10 290 0.056
11 300 0.008
12 310 0.004
13 320 0.004
14 330 0.003
15 340 0.003
16 350 0.002
17 360 0.003
18 370 0.003
19 380 0.003
20 390 0.004
21 400 0.003

Chapter 5 Methodology
Dept. of Pharmaceutical Analysis 42
Figure no: 4 Absorption spectrum of ropinirole hydrochloride using
0.1 M acetic acid
Table no: 3 System Parameters
Wavelength Scan
Data Mode Absorbance
Start WL (nm) 400.00
Stop WL (nm) 200.00
Scan Speed (nm/min) 100
Slit Width (nm) 1.5
Path Length (nm) 10.0

Chapter 5 Methodology
Dept. of Pharmaceutical Analysis 43
Beer’s law plot
This law states that, when a beam of monochromatic radiation is passed through a
solution of an absorbing substance, the rate of increase of intensity of radiation of
thickness of the absorbing solution proportional to the intensity of incident radiation
as well as the concentration of the solution.
Mathematically, this law was stated as
- dI/dx = k’ Ic
Construction of calibration curve
Aliquots of working standard stock solution - II ranging from (0.5ml to 4ml) were
transferred into a series of 10ml volumetric flasks. Then the volume was made up
with 0.1 M acetic acid. The absorbance of resulting solution of different concentration
was measured at 250nm against the solvent blank. Calibration curve was constructed
by plotting absorbance vs. concentration.
Dilution chart
Dilution chart of calibration curve
25mg of pure Ropinirole HCl * 25 ml (stock solution - I 1 mg/ml)
*
2 ml
*
25 ml (stock solution-II, 80 μg/ml)
0.5 ml 1 ml 1.5 ml 2 ml 2.5 3 ml 3.5 ml 4 ml
* * * * * * * *
10 ml 10 ml 10 ml 10 ml 10 ml 10 ml 10 ml 10 ml
(4μg/ml, 8μg/ml, 12μg/ml, 16 μg/ml, 20 μg/ml, 24 μg/ml, 28 μg/ml, 32 μg/ml)
* 0.1 M Acetic acid

Chapter 5 Methodology
Dept. of Pharmaceutical Analysis 44
Table no: 4 Data for calibration curve of ropinirole hydrochloride using
0.1 M acetic acid
Concentration (μg/ml) Absorbance
4 0.126
8 0.255
12 0.380
16 0.494
20 0.631
24 0.758
28 0.877
32 1.002
Figure no: 5 Calibration curve of ropinirole hydrochloride using
0.1 M acetic acid
Assay

Chapter 5 Methodology
Dept. of Pharmaceutical Analysis 45
Preparation of standard solution
From the working standard stock solution – II 2.5 ml was taken and further diluted to
10ml with same solvent to get the final concentration of 20μg/ml. The absorbance of
final solution was measured at 250nm against the solvent blank.
Dilution chart
25mg of pure Ropinirole HCl * 25 ml (stock solution-I, 1000 μg/ml)
2 ml
*
25 ml (stock solution-II, 80 μg/ml)
2.5 ml
*
10 ml (20μg/ml)
* 0.1 M Acetic acid

Chapter 5 Methodology
Dept. of Pharmaceutical Analysis 46
Preparation of test solution
Twenty tablets (2 mg) of ropinirole hydrochloride were accurately weighed and
grounded to fine powder. Ropinirole hydrochloride tablet powder equivalent to the
label claim was accurately weighed and dissolved in 0.1 M acetic acid using vortex
mixer and then the solution was diluted to 100ml to get a final concentration of
20µg/ml using same solvent. Then the final solution was filtered and the absorbance
of resulting solution was measured at 250nm against the solvent blank.
Dilution chart
2 mg equivalent of ropinirole HCl tablet powder
*
100 ml (20 μg/ml)
* 0.1 M Acetic acid
Calculation:
Using the absorbance of the standard and sample solution, the content of tablet
was calculated as follows.
The content of ropinirole HCl present in each tablet of average weight =

Chapter 5 Methodology
Dept. of Pharmaceutical Analysis 47
Table no: 5 Quantitative estimation of Brand I - Ropark
Label claim - 2 mg Average weight - 0.1431 g
S.No Wt of std
drug (g)
Abs. of std Wt of tab.
powder (g)
Abs. of
test
Amount of
drug/tab
(mg)
% Label
claim
1 0.0245 0.631 0.1196 0.615 2.004 100.20 %
2 0.0245 0.631 0.1283 0.656 1.993 99.65 %
3 0.0245 0.631 0.1352 0.697 2.010 100.50 %
4 0.0245 0.631 0.1380 0.714 2.017 100.85 %
5 0.0245 0.631 0.1298 0.665 1.997 99.85 %
Table no: 6 Quantitative estimation of Brand II- Ropin
Label claim - 2 mg Average weight - 0.1375 g
S.No Wt of std
drug (g)
Abs. of std Wt of tab.
powder (g)
Abs. of
test
Amount of
drug/tab
(mg)
% Label
claim
1 0.0248 0.642 0.1372 0.769 2.040 102 %
2 0.0248 0.642 0.1334 0.749 2.067 103.35 %
3 0.0248 0.642 0.1428 0.781 2.013 100.65 %
4 0.0248 0.642 0.1390 0.776 2.055 102.75 %
5 0.0248 0.642 0.1370 0.762 2.048 102.40 %

Chapter 5 Methodology
Dept. of Pharmaceutical Analysis 48
Interference studies
The interference studies of additives used in the formulation of tablet were
done by distributing them individually in 0.1 M acetic acid and set aside for ten
minutes before filtering. The filtrate was diluted and preceded as per tablet assay. The
absorbance of resulting solution was measured at 250nm against the solvent blank.
This procedure was repeated five times of each additive and the average value
for each additive was given the following table no. 7
Table no: 7 Data for the interference studies
Name of the excipients Absorbance at 250 nm
Talc 0.001
Lactose 0.002
Starch 0.001
Mg. Sterate 0.003
The results show that excipients have no effect in the absorption characteristics of the
drug.

Chapter 5 Methodology
Dept. of Pharmaceutical Analysis 49
Recovery studies (Accuracy)
Procedure
The tablet powder equivalent to about 1 mg of ropinirole hydrochloride was
weighed accurately and transfer to 100 ml volumetric flask. A known volume of
standard stock solution of 1 mg/ml of pure ropinirole hydrochloride was added to the
volumetric flask and 30 ml of 0.1 M acetic acid was added and mixed thoroughly
using vortex mixer. Then it was diluted to 100 ml using same solvent and it was
filtered and absorbance of final solution was measured at 250 nm against the solvent
blank.
The percentage recovery was calculated and the procedure was repeated five
times for each brand of tablet powder. The result of the recovery studies were given in
the table no.8 & 9
Dilution chart
1 mg equivalent of ropinirole HCl tablet
* 1ml of 1mg/ml std drug stock solution
* 0.1 M acetic acid
100 ml (20 μg/ml)

Chapter 5 Methodology
Dept. of Pharmaceutical Analysis 50
Table no: 8 Recovery studies for brand I - Ropark
S.No Wt of tab.
powder (g)
Amt of std drug
added (mg/ml)
Absorbance Amt recovered
(mg)
%
recovery
1 0.07130 0.992 0.676 0.978 98.58 %
2 0.07092 0.992 0.671 0.968 97.58 %
3 0.07395 0.992 0.691 0.984 99.19 %
4 0.07254 0.992 0.685 0.986 99.39 %
5 0.07084 0.992 0.669 0.963 97.07 %
Table no: 9 Recovery studies for brand II - Ropin
S.No Wt of tab.
powder (g)
Amt of std
added (mg/ml)
Absorbance Amt recovered
(mg)
%
recovery
1 0.07081 0.980 0.711 0.961 98.07 %
2 0.06985 0.980 0.702 0.953 97.24 %
3 0.07158 0.980 0.719 0.972 99.18 %
4 0.07237 0.980 0.723 0.971 99.08 %
5 0.07084 0.980 0.709 0.954 97.34 %

Chapter 5 Methodology
Dept. of Pharmaceutical Analysis 51
Precision
The precision of an analytical procedure expresses the closeness of agreement
between a series of measurements obtained from multiple sampling of the same
homogenous sample under prescribed condition.
It is usually expressed as standard deviation. It is a measure of degree of
reproducibility of analytical method under normal operation.
Standard deviation (SD) = √
Where,
SD – Standard deviation
x – Observed value
- Arithmetic mean
n – Number of observations
The square of standard deviation is called variance. The precision is assessed by co-
efficient of variation which is related to standard deviation.
Co-efficient of variation (% RSD) =
Where,
SD – standard deviation
- Arithmetic average
RSD – relative standard deviation

Chapter 5 Methodology
Dept. of Pharmaceutical Analysis 52
Standard Error of Mean (SEM) =
Where,
σM - Standard error of the mean
σ - The standard deviation of the original distribution
N - The sample size
√N - Root of the sample size
The precision study of this method was done by the data obtained from the assay
results shown in the table. 10
Table no: 10 Data for precision study
S.No Name of
tablet
Std
deviation
Co-efficient of
variation (% RSD)
SEM
1 Ropark 0.4840 0.4829 0.2164
2 Ropin 1.013 0.9909 0.4529

Chapter 5 Methodology
Dept. of Pharmaceutical Analysis 53
5.2 Extractive Spectrophotometric Determination of Ropinirole hydrochloride
using 0.2 % Picric acid
Apparatus/Instruments Used
UV- Visible double beam Spectrophotometer (Perkin Elmer EZ 301)
Analytical electronic weighing balance (Shimadzu)
Vortex mixer
Solvents and Reagents Used
Acetic acid - AR Grade
Chloroform - AR Grade
Picric acid - AR Grade
Water - Distilled Water
Reference Standard
Ropinirole hydrochloride was obtained as a gift sample from East West
Pharma Haridwar - 247 667, India.
Tablet Formulations
Ropark film coated tablets – 2 mg (Sun Pharmaceuticals Industries Ltd)
Ropin film coated tablets – 2 mg (East West Pharm

Chapter 5 Methodology
Dept. of Pharmaceutical Analysis 54
Chemistry of Picric acid
Chemical Structure
NO2
OH
NO2
O2N
CAS Registry Number - 88-89-1
Appearance - Bright yellow, crystalline powder or yellow prisms
IUPAC Name - 2, 4, 6 - Trinitrophenol
Molecular Formula - C6H3N3O7
Molar Mass - 229.11 g mol-1
Solubility - Soluble in hot water

Chapter 5 Methodology
Dept. of Pharmaceutical Analysis 55
Preparation of 0.1 M Acetic acid
It was prepared by diluting 5.7 ml of concentrated acetic acid in 1000 ml of
distilled water.
Preparation of 1 % Potassium hydrogen phthalate
It was prepared by dissolving 1 g of potassium hydrogen phthalate in 100 ml
of distilled water.
Preparation of 0.2 % Picric acid
It was prepared by dissolving 0.2 g of picric acid in 100 ml of hot distilled
water
Preparation of standard stock solution
Standard stock solution - I
Standard stock solution - I was prepared by dissolving 40 mg of ropinirole
hydrochloride working standard in 100 ml of 0.1 M acetic acid to get a final
concentration of 400 μg/ml.
Standard stock solution - II
From the standard stock solution - I 5 ml was taken and further diluted to 50ml with
same solvent to get the final concentration of 40 μg/ml.
Absorption spectra of colored species
2 ml of standard stock solution II was pipetted out and transferred in to a
separating funnel followed by the addition of 2 ml of 0.2 % picric acid was added.
The drug dye complex in aqueous phase was extracted with two successive quantities
of chloroform. The combined chloroform extract was diluted to 10 ml with
chloroform. The absorption spectra of the final solution were scanned in the range of
300 to 500 nm against the reagent blank. The absorbance data were presented in table
no. 11 and absorption spectrum was shown in figure no. 6

Chapter 5 Methodology
Dept. of Pharmaceutical Analysis 56
Table no: 11 Data for the absorption spectrum of ropinirole hydrochloride using
0.2 % picric acid
S.No Wavelength Absorbance
1 300 0.115
2 310 0.155
3 320 0.224
4 330 0.302
5 340 0.359
6 350* 0.361
7 360 0.302
8 370 0.228
9 380 0.183
10 390 0.171
11 400 0.175
12 410* 0.175
13 420 0.163
14 430 0.126
15 440 0.075
16 450 0.034
17 460 0.012
18 470 0.004
19 480 0.002
20 490 0.002
21 500 0.002

Chapter 5 Methodology
Dept. of Pharmaceutical Analysis 57
Figure no: 6 Absorption spectrum of ropinirole hydrochloride using
0.2 % picric acid
Table no: 12 System Parameters
Wavelength Scan
Data Mode Absorbance
Start WL (nm) 500.00
Stop WL (nm) 300.00
Scan Speed (nm/min) 100
Slit Width (nm) 1.5
Path Length (nm) 10.0

Chapter 5 Methodology
Dept. of Pharmaceutical Analysis 58
Effect of reagent concentration
Choosing of correct reagent concentration is a significant characteristic
criterion in the colorimetric determination. The optimal concentration was
predetermined by constructing the calibration curve. The calibration curve was
constructed by treating the drug in the concentration range of 2 - 10 μg/ml with 2 ml
of different concentration of reagent i.e. 0.1 %, 0.2 %, 0.3 % picric acid. The readings
were tabulated in the table no: 13 and graphically shown in the figure no: 7
Table no: 13 Data for calibration curve using different reagent concentration
Drug concentration
(μg/ml)
Absorbance at 410 nm
0.1 % 0.2 % 0.3 %
2 0.053 0.057 0.059
4 0.104 0.112 0.121
6 0.152 0.167 0.182
8 0.186 0.218 0.253
10 0.202 0.276 0.317

Chapter 5 Methodology
Dept. of Pharmaceutical Analysis 59
Figure no: 7 Calibration curve for ropinirole hydrochloride using
different concentration of picric acid regent

Chapter 5 Methodology
Dept. of Pharmaceutical Analysis 60
Effect of volume of reagent
Addition of correct volume of reagent was an important aspect in this
experiment. The optimum amount of reagent was fixed by constructing calibration
curve. The calibration curve was prepared by employing the drug in the concentration
range of 2-10 μg/ml with different volume of reagent i.e. 1 ml, 2 ml, 3ml with same
reagent concentration (0.2 % picric acid). The results were recorded in table no. 14
and graphically shown in figure no. 8
Table no: 14 Data for the calibration curve for drug with different volume of
0.2 % picric acid reagent
Drug
Concentration
(μg/ml)
Absorbance at 410 nm
0.5 ml 1 ml 1.5 ml
2 0.052 0.057 0.062
4 0.105 0.112 0.124
6 0.151 0.167 0.180
8 0.184 0.218 0.256
10 0.200 0.276 0.315

Chapter 5 Methodology
Dept. of Pharmaceutical Analysis 61
Figure no: 8 Calibration curve for ropinirole hydrochloride using different volume of 0.2 % picric acid regent

Chapter 5 Methodology
Dept. of Pharmaceutical Analysis 62
Fixation of various parameters
I) λmax (wavelength maximum)
The absorption spectral data showed that the maximum absorbance was
observed at 350 and 410 nm.
II) Construction of calibration curve
Aliquots of working standard stock solution - II ranging from (0.5 ml to 2.5 ml) were
transferred into a series of separating funnel followed by the addition of 2 ml of 0.2 %
picric acid. The drug dye complex in aqueous phase was extracted with two
successive quantities of chloroform. The combined chloroform extract was diluted to
10 ml with chloroform. The absorbance of the final solution was measured at 410 nm
against the reagent blank. Calibration curve was constructed by plotting absorbance
vs. concentration. Data for calibration curve were presented in table no.15 and
calibration curve was shown in figure no.9
Dilution chart of calibration curve
40mg of pure Ropinirole HCl * 100 ml (stock solution - I, 400 μg/ml)
5ml
*
50 ml (stock solution-II, 40 μg/ml)
0.5 ml 1 ml 1.5 ml 2 ml 2.5 ml
** ** ** ** **
10 ml 10 ml 10 ml 10 ml 10 ml
(2 μg/ml) (4 μg/ml) (6 μg/ml) (8 μg/ml) (10 μg/ml)
* 0.1 M acetic acid
** 2 ml of 1 % potassium hydrogen phthalate solution, 1 ml of 0.2 % picric acid & extracted with 5 ml chloroform and volume was made up to 10 ml with chloroform.

Chapter 5 Methodology
Dept. of Pharmaceutical Analysis 63
Table no: 15 Data for calibration curve of ropinirole hydrochloride using 0.2 % picric acid reagent
Concentration (μg/ml) Absorbance
2 0.057
4 0.112
6 0.167
8 0.218
10 0.276
Figure no: 9 Calibration curve of ropinirole hydrochloride using 0.2 % picric acid reagent

Chapter 5 Methodology
Dept. of Pharmaceutical Analysis 64
IV) Stability of color
The stability of the color is one of the aspects that should be considered in
colorimetric determination. The color should be stable for reasonable time.
The color stability of the drug - picric acid complex was studied for the drug
concentration in the range of 2 - 10 μg/ml. The absorption of the final solution was
measured at 410 nm against reagent blank. The readings were taken at 10 minutes
intervals of time up to 60 minutes and results were tabulated in the table no.15
Table no: 16 Data for color stability of drug-picric acid complex
Drug conc. (μg/ml)
Time and Absorption (minutes)
0 10 20 30 40 50 60
2 0.057 0.057 0.055 0.058 0.058 0.061 0.061
4 0.112 0.112 0.111 0.111 0.113 0.114 0.113
6 0.167 0.169 0.168 0.167 0.168 0.170 0.169
8 0.218 0.218 0.217 0.217 0.219 0.220 0.220
10 0.276 0.275 0.277 0.279 0.278 0.281 0.281

Chapter 5 Methodology
Dept. of Pharmaceutical Analysis 65
Assay
Preparation of standard solution
From the working standard stock solution – II 2 ml was taken and transferred
in to a separating funnel followed by the addition of 2 ml of 1 % potassium hydrogen
phthalate solution and 1 ml of 2 % picric acid solution. The drug-picric acid complex
was extracted with two successive quantities of chloroform. Then the combined
chloroform extract was further diluted to 10ml with chloroform to get the final
concentration of 8 μg/ml. The absorbance of final solution was measured at 410 nm
against the reagent blank.
Dilution chart
40 mg of pure Ropinirole HCl * 100 ml (stock solution-I, 400 μg/ml)
5 ml
*
50 ml (stock solution-II, 40 μg/ml)
2 ml
**
10 ml (8μg/ml)
* 0.1 M acetic acid
** 2 ml of 1 % potassium hydrogen phthalate solution, 1 ml of 0.2 % picric acid & extracted with 5 ml chloroform and volume was made up to 10 ml with chloroform.

Chapter 5 Methodology
Dept. of Pharmaceutical Analysis 66
Preparation of test solution
Twenty tablets (1 mg) of ropinirole hydrochloride were accurately weighed
and grounded to fine powder and dissolved in 0.1 M acetic acid using vortex mixer.
Then the solution was diluted to 25 ml to get a drug concentration of 40µg/ml using
0.1 M acetic acid and resulting solution was filtered to remove excipients. From this 2
ml was transferred in to a separating funnel followed by the addition of 2 ml of 1 %
potassium hydrogen phthalate solution and 1 ml of 2 % picric acid. The drug-picric
acid complex was extracted by using two successive quantities of chloroform. The
combined chloroform extract was collected in a 10 ml volumetric flask and volume
was made up with chloroform. Finally the absorbance of resulting solution was
measured at 410nm against the reagent blank.
Dilution chart
1 mg equivalent of ropinirole HCl tablet powder * 25 ml (40 μg/ml)
2 ml
** **
10 ml (8 μg/ml)
* 0.1 M acetic acid
** 2 ml of 1 % potassium hydrogen phthalate solution, 1 ml of 0.2 % picric acid & extracted with 5 ml chloroform and volume was made up to 10 ml with chloroform.

Chapter 5 Methodology
Dept. of Pharmaceutical Analysis 67
Table no: 17 Quantitative estimation of Brand I - Ropark
Label claim - 2 mg Average weight - 0.1431 g
S.No Wt of std
drug (g)
Abs. of std Wt of tab.
powder (g)
Abs. of
test
Amount of
drug/tab
(mg)
% Label
claim
1 0.0402 0.215 0.0695 0.239 2.017 100.85 %
2 0.0402 0.215 0.0681 0.235 2.024 101.20 %
3 0.0402 0.215 0.0693 0.236 1.998 99.90 %
4 0.0402 0.215 0.0704 0.238 1.983 99.15 %
5 0.0402 0.215 0.0691 0.237 2.012 100.60 %
Table no: 18 Quantitative estimation of Brand II- Ropin
Label claim - 2 mg Average weight - 0.1375 g
S.No Wt of std
drug (g)
Abs. of std Wt of tab.
powder (g)
Abs. of
test
Amount of
drug/tab
(mg)
% Label
claim
1 0.0404 0.219 0.0656 0.235 1.996 99.80 %
2 0.0404 0.219 0.0675 0.238 1.961 98.05 %
3 0.0404 0.219 0.0649 0.232 1.988 99.40 %
4 0.0404 0.219 0.0653 0.232 1.976 98.80 %
5 0.0404 0.219 0.0687 0.241 1.951 97.55 %
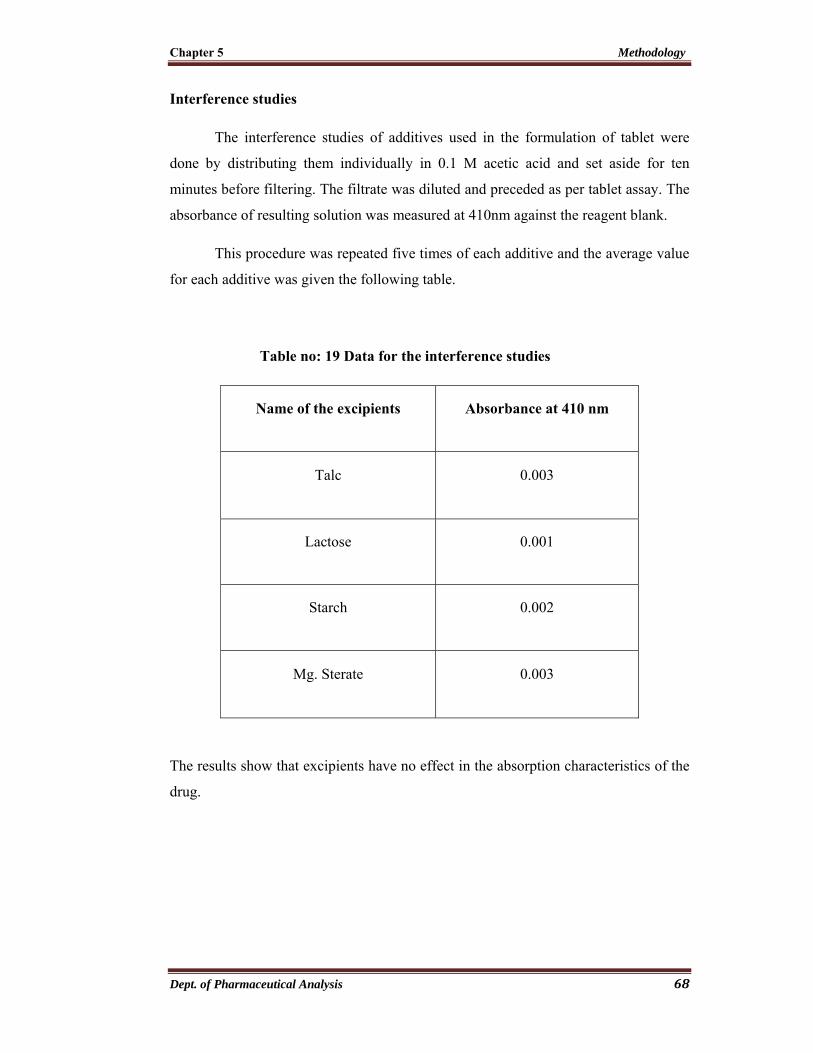
Chapter 5 Methodology
Dept. of Pharmaceutical Analysis 68
Interference studies
The interference studies of additives used in the formulation of tablet were
done by distributing them individually in 0.1 M acetic acid and set aside for ten
minutes before filtering. The filtrate was diluted and preceded as per tablet assay. The
absorbance of resulting solution was measured at 410nm against the reagent blank.
This procedure was repeated five times of each additive and the average value
for each additive was given the following table.
Table no: 19 Data for the interference studies
Name of the excipients Absorbance at 410 nm
Talc 0.003
Lactose 0.001
Starch 0.002
Mg. Sterate 0.003
The results show that excipients have no effect in the absorption characteristics of the
drug.

Chapter 5 Methodology
Dept. of Pharmaceutical Analysis 69
Recovery studies (Accuracy)
Procedure
The tablet powder equivalent to about 1 mg of ropinirole hydrochloride was
weighed accurately and transfer to 50 ml volumetric flask. A known volume of
standard stock solution of 1 mg/ml of pure ropinirole hydrochloride was added to the
volumetric flask and 15 ml of 0.1 M acetic acid was added and mixed thoroughly
using vortex mixer. Then it was diluted to 50 ml using 0.1 M acetic acid and it was
filtered. 2 ml of filtrate was transferred in to a separating funnel. The absorbance of
final solution was measured at 410 nm against the reagent blank.
The percentage recovery was calculated and the procedure was repeated five
times for each brand of tablet powder. The result of the recovery studies was given in
the table no. 20 & 21
Dilution chart
1 mg equivalent of ropinirole HCl tablet powder + 1 ml of 1 mg/ml std stock soln
*
50 ml (40 μg/ml)
2 ml
**
10 ml (8 μg/ml)
* 0.1 M acetic acid
** 2 ml of 1 % potassium hydrogen phthalate solution, 1 ml of 0.2 % picric acid & extracted with 5 ml chloroform and volume was made up to 10 ml with chloroform.

Chapter 5 Methodology
Dept. of Pharmaceutical Analysis 70
Table no: 20 Recovery studies for brand I - Ropark
S. No Wt of tab.
powder
Amt of std
added
(mg/ml)
Absorbance Amt
recovered
(mg)
% recovery
1 0.0734 1.012 0.229 1.006 99.40 %
2 0.0715 1.012 0.226 1.007 99.59 %
3 0.0746 1.012 0.228 0.978 96.64 %
4 0.0718 1.012 0.224 0.984 97.23 %
5 0.0749 1.012 0.232 1.011 99.90 %
Table no: 21 Recovery studies for brand II - Ropin
S. No Wt of tablet
powder
Amt of std
added
(mg/ml)
Absorbance Amt
recovered
(mg)
% recovery
1 0.0687 0.994 0.222 0.953 95.89 %
2 0.0678 0.994 0.221 0.976 98.18 %
3 0.0665 0.994 0.218 0.968 97.38 %
4 0.0696 0.994 0.226 0.993 99.89 %
5 0.0675 0.994 0.221 0.990 99.59 %

Chapter 5 Methodology
Dept. of Pharmaceutical Analysis 71
Precision
The precision study of this method was done by the data obtained from the
assay results shown in the table no. 22
Table no: 22 Data for precision
S. No. Name of tablet Std deviation Co-efficient of
variation (% RSD)
SEM
1 Ropark 0.8181 0.8153 0.3659
2 Ropin 0.9291 0.9411 0.4155

Chapter 5 Methodology
Dept. of Pharmaceutical Analysis 72
5. 3 RP-HPLC Method for the Determination of Ropinirole hydrochloride
Apparatus/Instruments Used
HPLC Separation Module (Perkin Elmer)
Analytical electronic weighing balance (Shimadzu)
Vortex Mixer
Sonicator
Micropipette
pH meter
Membrane filter
Solvents and Reagents Used
Water - HPLC grade
Potassium dihydrogen phosphate - HPLC grade
Acetonitrile - HPLC grade
Reference Standard
Ropinirole hydrochloride was obtained as a gift sample from East West
Pharma Haridwar - 247 667, India.
Tablet Formulations
Ropark film coated tablets - 2 mg (Sun Pharmaceuticals Industries Ltd)
Ropark film coated tablets - 2 mg (East West Pharma)

Chapter 5 Methodology
Dept. of Pharmaceutical Analysis 73
Preparation of 20 mM potassium dihydrogen phosphate buffer
It is prepared by dissolving 2.7218 g in 1000 ml of HPLC grade water and the
pH was adjusted to 3.3 with 10 % ortho phosphoric acid.
Preparation of mobile phase
Mobile phase was prepared by mixing 70:30 ratio volumes of 20 mM
KH2PO4: ACN. This mobile phase was filtered through 0.45 μ membrane filter paper
and degassed in ultrasonicator bath for 10 minutes
Preparation standard stock solutions
Standard stock solution I
Standard stock solution - I was prepared by dissolving 10 mg of ropinirole
hydrochloride working standard in 10 ml of mobile phase mixture to get a final
concentration of 1000 μg/ml.
Standard stock solution II
From the standard solution - I, 1 ml was taken and further diluted to 10 ml
with mobile phase mixture to get the final concentration of 100 μg/ml.
Selection of stationary phase
From the literature survey, it was found that octadecyl silane column (C18) can
be appropriately used for the separation of ropinirole hydrochloride.
Selection of analytical wavelength
From the UV spectrum of the compound, the maximum absorbance of
Ropinirole hydrochloride was found to be 250 nm and this wavelength was suitable
for detection. So the appreciable absorbance for the drug was found at 250 nm.

Chapter 5 Methodology
Dept. of Pharmaceutical Analysis 74
CHROMATOGRAPHIC CONDITIONS:
Optimized conditions for the determination of Ropinirole hydrochloride by developed
HPLC method was shown as follows:
Column : Kromosil C18, [5μ, 250 x 4.60 mm]
Mobile phase : 20 mM KH2PO4: ACN (70: 30) pH 3.3
Flow rate : 1 ml/min
Detector : UV detector
Injection volume : 20 μl
Run time : 7.5 min
Mode of elution : Isocratic
Detection Wavelength : 250 nm
Construction of linearity
The linear concentration range was established for the drug solution in the
concentration range of 4 - 16 μg/ml of ropinirole hydrochloride. 0.4 - 1.6 ml of stock
solution II was pipetted in to 10 ml volumetric flask and diluted to 10 ml to get the
desired concentration range. The calibration curve for ropinirole hydrochloride was
constructed by plotting the peak area against the concentration. Correlation coefficient
(r), y intercept, slope of regression line was calculated. The recorded data were shown
in the table no: 22 and linearity graph was shown in the figure no: 10

Chapter 5 Methodology
Dept. of Pharmaceutical Analysis 75
Dilution chart
10 mg of pure Ropinirole HCl * 10 ml (stock solution - I, 1000 μg/ml)
1 ml
* 20 mM KH2PO4: ACN (70: 30) *
10 ml (100 μg/ml)
0.4 ml 0.8 ml 1.2 ml 1.6 ml
* * * *
10 ml 10 ml 10 ml 10 ml
(4 μg/ml) (8 μg/ml) (12 μg/ml) (16 μg/ml)

Chapter 5 Methodology
Dept. of Pharmaceutical Analysis 76
Table no: 23 Data for linearity curve for Ropinirole hydrochloride
S.No Conc. (μg/ml) Peak area
1 4 135505.22
2 8 270912.44
3 12 404413.65
4 16 539824.88
Figure no: 10 Linearity curve of Ropinirole hydrochloride

Chapter 5 Methodology
Dept. of Pharmaceutical Analysis 77
Chromatogram: 1

Chapter 5 Methodology
Dept. of Pharmaceutical Analysis 78
Chromatogram: 2

Chapter 5 Methodology
Dept. of Pharmaceutical Analysis 79
Chromatogram: 3

Chapter 5 Methodology
Dept. of Pharmaceutical Analysis 80
Chromatogram: 4

Chapter 5 Methodology
Dept. of Pharmaceutical Analysis 81
Chromatogram: 5

Chapter 5 Methodology
Dept. of Pharmaceutical Analysis 82
ASSAY
Preparation of standard solution
From the working standard solution - II, 0.8 ml was pipetted out in to a 10 ml
volumetric flask and the volume was made up with mobile phase mixture containing
20 mM KH2PO4: ACN (70: 30) to get a final concentration of 8 μg/ml.
20 μl of the above solution was injected in triplicate at an interval of 7.5 min
to ensure complete elution of earlier injection. The peak area was measured and
recorded.
Dilution chart
10 mg of pure Ropinirole HCl * 10 ml (stock solution - I, 1000
μg/ml)
1 ml
* 20 mM KH2PO4: ACN (70: 30) *
10 ml (stock soln - II, 100 μg/ml)
0.8 ml
*
10 ml (8 μg/ml)
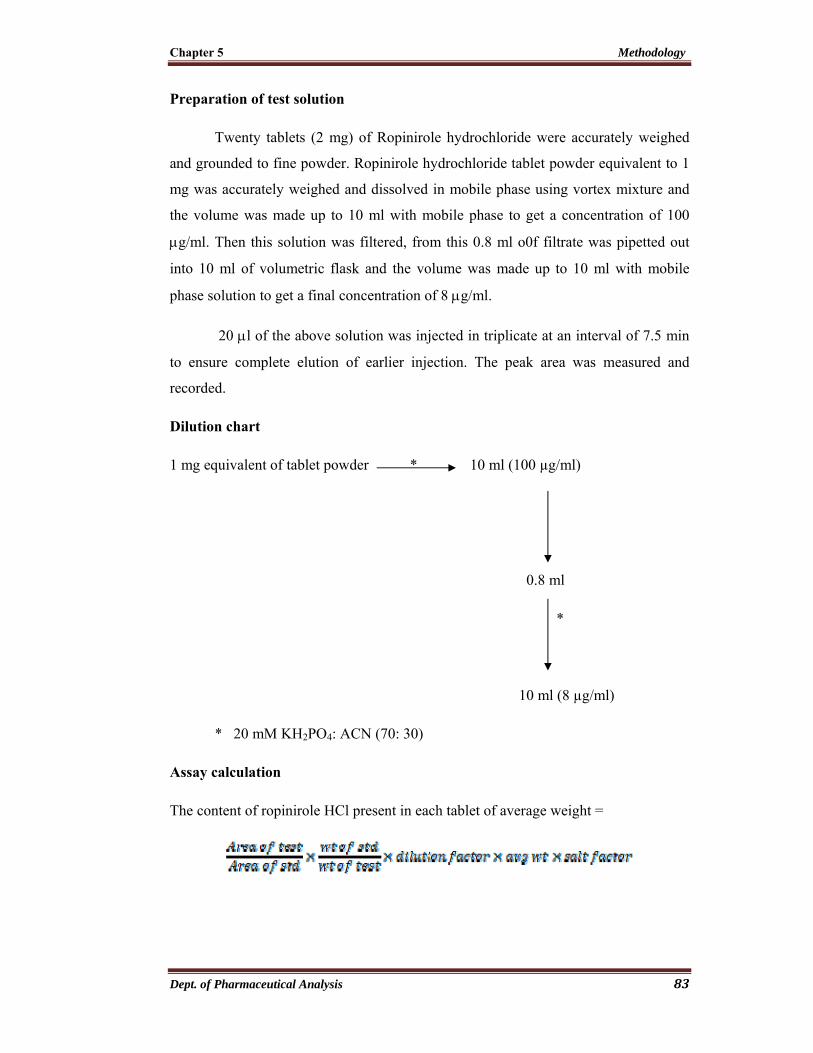
Chapter 5 Methodology
Dept. of Pharmaceutical Analysis 83
Preparation of test solution
Twenty tablets (2 mg) of Ropinirole hydrochloride were accurately weighed
and grounded to fine powder. Ropinirole hydrochloride tablet powder equivalent to 1
mg was accurately weighed and dissolved in mobile phase using vortex mixture and
the volume was made up to 10 ml with mobile phase to get a concentration of 100
μg/ml. Then this solution was filtered, from this 0.8 ml o0f filtrate was pipetted out
into 10 ml of volumetric flask and the volume was made up to 10 ml with mobile
phase solution to get a final concentration of 8 μg/ml.
20 μl of the above solution was injected in triplicate at an interval of 7.5 min
to ensure complete elution of earlier injection. The peak area was measured and
recorded.
Dilution chart
1 mg equivalent of tablet powder * 10 ml (100 µg/ml)
0.8 ml
*
10 ml (8 µg/ml)
* 20 mM KH2PO4: ACN (70: 30)
Assay calculation
The content of ropinirole HCl present in each tablet of average weight =

Chapter 5 Methodology
Dept. of Pharmaceutical Analysis 84
Table no: 24 Quantitative estimation of Brand I - Ropark
Label claim - 2 mg Average weight - 0.1431 g
S.No
Standard Tablet
Amount of drug/tab
(mg)
% Label claim
Wt of Std
drug (mg)
Peak area
Wt of tab.
powder (mg)
Peak area
1 9.8 272512.44 70.7 312426.45 2.003 100.15 %
2 9.8 272512.44 71.6 312916.58 1.988 99.06 %
3 9.8 272512.44 70.9 312469.23 1.997 99.85 %
4 9.8 272512.44 71.2 312522.13 1.989 99.45 %
5 9.8 272512.44 68.3 312389.23 2.042 102.10 %
Table no: 25 Quantitative estimation of Brand II- Ropin
Label claim - 2 mg Average weight - 0.1375 g
S.No
Standard Tablet
Amount of drug/tab
(mg)
% Label claim
Wt of Std
drug (mg)
Peak area
Wt of tab.
powder (mg)
Peak area
1 9.8 272512.44 66.2 311720.35 2.042 102.10 %
2 9.8 272512.44 67.4 312141.18 2.009 100.45 %
3 9.8 272512.44 65.8 311410.18 2.053 102.65 %
4 9.8 272512.44 67.1 312128.30 2.018 100.90 %
5 9.8 272512.44 66.0 311568.24 2.047 102.35 %
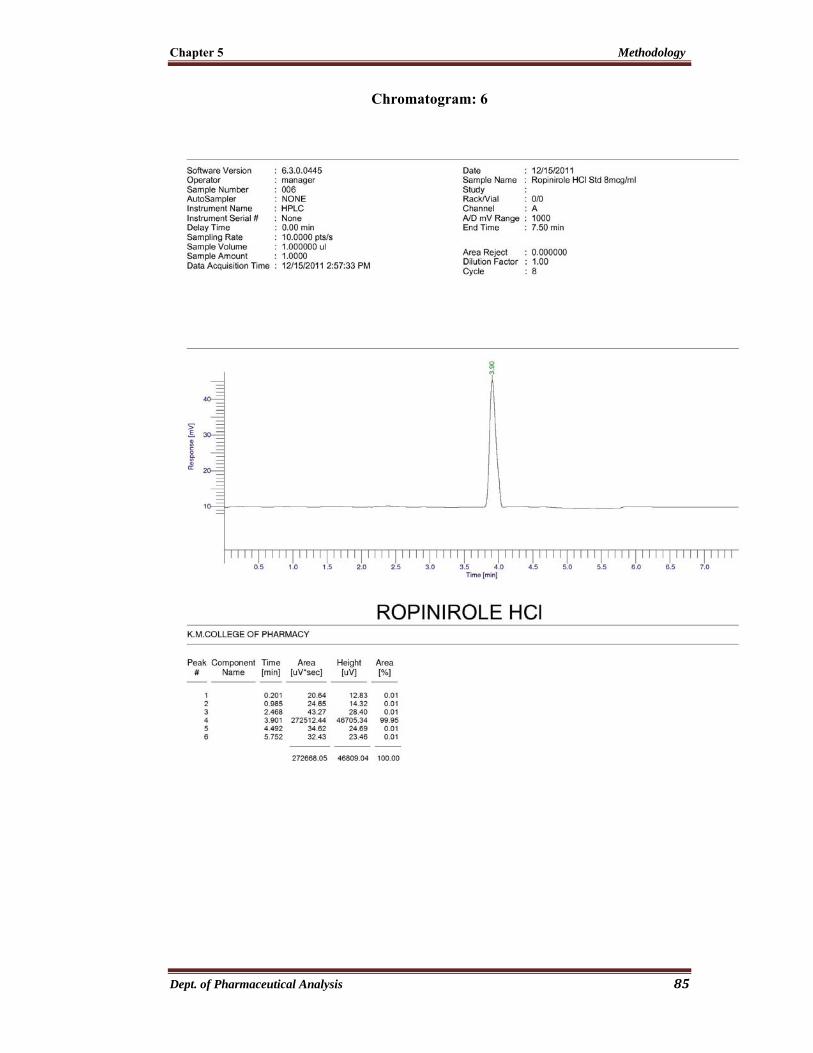
Chapter 5 Methodology
Dept. of Pharmaceutical Analysis 85
Chromatogram: 6

Chapter 5 Methodology
Dept. of Pharmaceutical Analysis 86
Chromatogram: 7

Chapter 5 Methodology
Dept. of Pharmaceutical Analysis 87
Chromatogram: 8
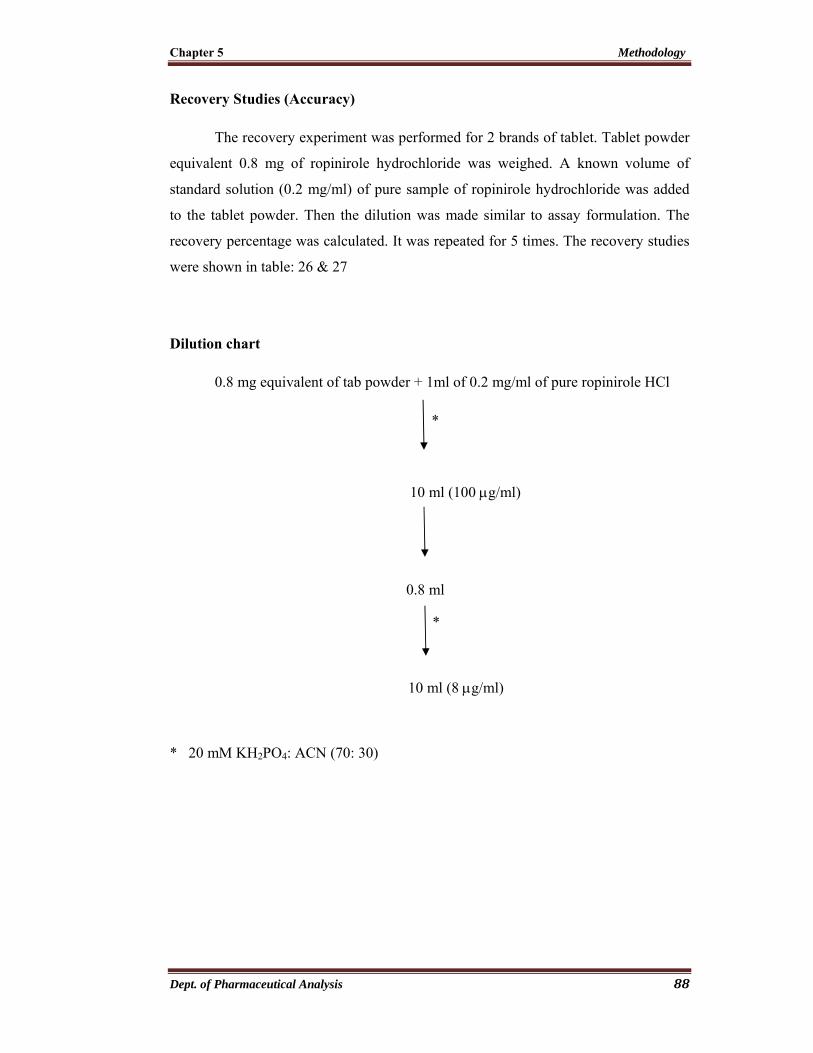
Chapter 5 Methodology
Dept. of Pharmaceutical Analysis 88
Recovery Studies (Accuracy)
The recovery experiment was performed for 2 brands of tablet. Tablet powder
equivalent 0.8 mg of ropinirole hydrochloride was weighed. A known volume of
standard solution (0.2 mg/ml) of pure sample of ropinirole hydrochloride was added
to the tablet powder. Then the dilution was made similar to assay formulation. The
recovery percentage was calculated. It was repeated for 5 times. The recovery studies
were shown in table: 26 & 27
Dilution chart
0.8 mg equivalent of tab powder + 1ml of 0.2 mg/ml of pure ropinirole HCl
*
10 ml (100 μg/ml)
0.8 ml
*
10 ml (8 μg/ml)
* 20 mM KH2PO4: ACN (70: 30)

Chapter 5 Methodology
Dept. of Pharmaceutical Analysis 89
Table no: 26 Recovery studies for brand I - Ropark
S.No Wt of test
(g)
Amt of std
added (mg/ml)
Peak area Amt recovered
(mg)
%
recovery
1 0.05823 0.204 305950.81 0.199 97.54 %
2 0.05778 0.204 304576.25 0.202 99.01 %
3 0.05854 0.204 307563.50 0.200 98.03 %
4 0.05902 0.204 308028.18 0.198 97.05 %
5 0.05867 0.204 308484.09 0.201 98.52 %
Table no: 27 Recovery studies for brand II - Ropin
S.No Wt of test
(g)
Amt of std
added (mg/ml)
Peak area Amt recovered
(mg)
%
recovery
1 0.05498 0.204 305339.98 0.197 96.56 %
2 0.05567 0.204 308225.74 0.196 96.08 %
3 0.05523 0.204 308119.36 0.203 99.50 %
4 0.05492 0.204 306155.43 0.201 98.52 %
5 0.05565 0.204 308951.75 0.199 97.54 %

Chapter 5 Methodology
Dept. of Pharmaceutical Analysis 90
Chromatogram: 9

Chapter 5 Methodology
Dept. of Pharmaceutical Analysis 91
Chromatogram: 10

Chapter 5 Methodology
Dept. of Pharmaceutical Analysis 92
PARAMETERS USED FOR HPLC METHOD VALIDATION
Number of Theoretical Plates (N)
N = 5.54 T / W
The assessment of performance of efficiency of a column is in terms of the number of
theoretical plates.
Where,
T - Retention time
W - Width of peak at half height
Tailing Factor
T = W / 2f
The assessment of peak shape is in terms of symmetry factor.
W - Width of peak at 5 % height
f - Distance from the peak maximum to the leading edge of the peak, the distance
being measured at a point 5 % of the peak height from the baseline (or) width of front
half of the peak at 5 % height.
Limit of Detection
The detection limit of an individual analytical procedure is the lowest amount
of an analyte in a sample which can be detected but not necessarily quantitated as an
exact value. Based on the standard deviation of the response and the slope, the
detection limit (DL) may be expressed as.
LOD = 3.3 σ / S
Where,
σ = the standard deviation of the response
S = the slope of the calibration curve (of an analyte)

Chapter 5 Methodology
Dept. of Pharmaceutical Analysis 93
Limit of Quantitation
The quantitation limit of an analytical procedure is the lowest amount of an
analyte in a sample which can be quantitatively determined with suitable precision
and accuracy. Based on the standard deviation of the response and the slope,
quantitation limit (QL) may be expressed as:
LOQ = 10 σ / S
Where,
σ = the standard deviation of the response
S = the slope of the calibration curve (of an analyte) [50]
Precision
The precision study of this method was done by the data obtained from the
assay results shown in the table.
Table no: 28 Data for precision
S. No. Name of
tablet
Std deviation Co-efficient of
variation (% RSD)
SEM
1 Ropark 1.180 1.1785 0.5276
2 Ropin 0.9601 0.9441 0.4294
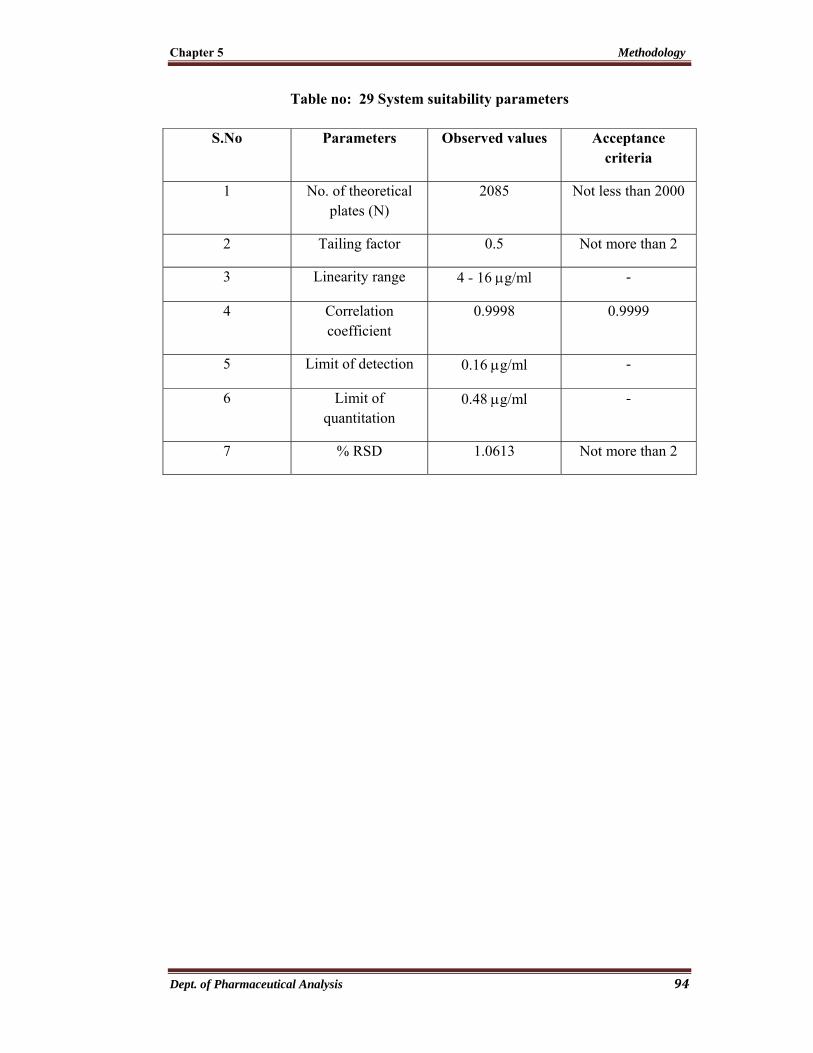
Chapter 5 Methodology
Dept. of Pharmaceutical Analysis 94
Table no: 29 System suitability parameters
S.No Parameters Observed values Acceptance criteria
1 No. of theoretical plates (N)
2085 Not less than 2000
2 Tailing factor 0.5 Not more than 2
3 Linearity range 4 - 16 μg/ml -
4 Correlation coefficient
0.9998 0.9999
5 Limit of detection 0.16 μg/ml -
6 Limit of quantitation
0.48 μg/ml -
7 % RSD 1.0613 Not more than 2

Chapter 6 Results and Discussions
Dept. of pharmaceutical analysis 95
6. RESULTS AND DISCUSSIONS
Method - I
UV Spectrophotometric Determination of Ropinirole Hydrochloride using 0.1 M
Acetic acid
Under the experimental conditions expressed, calibration curve, assay of
tablets and recovery studies (accuracy) were performed.
In this proposed method Beer’s law was obeyed in the concentration range of
4 - 32 μg/ml.
The percentage recovery was found to be 98.36 % for brand I (Ropark) and
98.16 % for brand II (Ropin).
The result of interference studies showed that the excipients present in the
tablet formulations have no effect in the absorbance of drug.
Hence this developed method could be used for routine analysis of ropinirole
hydrochloride in bulk drug and its formulations.
Table no: 30 Optical characteristics and statistical data
λ max 250 nm
Beer’s law limit (µg/ml) 4 - 32 μg/ml
Correlation coefficient (r ) 0.9999
Regression equation* (Y ) 0.0313X+0.0014
Slope (b) 0.0313
Intercept (c) 0.0014
* Y = bX + c, where X is the concentration of drug in μg/ml.

Chapter 6 Results and Discussions
Dept. of pharmaceutical analysis 96
Method - II
Extractive Spectrophotometric Estimation of Ropinirole hydrochloride using 0.2
% Picric acid
Under optimum conditions described, the calibration curves were constructed
for the drug. Assay of tablets and recovery studies (accuracy), stability of colored
species, effect of concentration of picric acid and effect of volume of reagent were
performed.
This method was obeyed Beer’s law in the concentration range of 2 - 10
μg/ml.
The percentage recovery was found to be 98.55 % for brand I (Ropark) and
98.18 % for brand II (Ropin).
The result of interference studies showed that the excipients present in the
tablet formulations have no effect in the absorbance of drug.
Hence this developed method could be used for the routine analysis of
ropinirole hydrochloride.
Table no: 31 Optical characteristics and statistical data
λ max 410 nm
Beer’s law limit (µg/ml) 2 - 10μg/ml
Correlation coefficient (r ) 0.9998
Regression equation* (Y ) 0.0274X+0.0013
Slope (b) 0.0274
Intercept (c) 0.0013
* Y = bX + c, where X is the concentration of drug in μg/ml.

Chapter 6 Results and Discussions
Dept. of pharmaceutical analysis 97
Method - III
RP-HPLC Method for the Estimation of Ropinirole hydrochloride
RP-HPLC method was developed as per ICH guidelines. The system
suitability parameters proved that the proposed method is suitable for the estimation
of ropinirole hydrochloride.
The chromatograms of ropinirole hydrochloride were found to be satisfactory
on chromosil C18, 5μm, 250 mm x 4.6 mm, using mobile phase composition of buffer
and acetonitrile in the ratio of 70:30. The proposed system of stationary phase and
mobile phase was ideally suitable for this estimation as indicated by good number of
theoretical plates. The sensitivity of the method was good and also linearity was
observed over a concentration range of 4 - 16 μg/ml. The accuracy of the method was
determined by recovery studies and it was found to be 98.03 % for brand I (Ropark)
and 97.64 % for brand II (Ropin).
Hence this developed RP-HPLC method could be used for routine analysis of
ropinirole hydrochloride.
Table no: 32 System suitability parameters
S.No Parameters Observed values Acceptance criteria
1 No. of theoretical plates (N)
2085 Not less than 2000
2 Tailing factor 0.5 Not more than 2
3 Linearity range 4 - 16 μg/ml -
4 Correlation coefficient
0.9998 0.9999
5 Limit of detection 0.16 μg/ml -
6 Limit of quantitation
0.48 μg/ml -
7 % RSD 1.0613 Not more than 2
Bibliography
Dept. of Pharmaceutical analysis
BIBLIOGRAPHY
1. R. Kellner, J. M. Mermet, M. Otto, M. Valcarcel, H. M. Widmer. Analytical
chemistry: A modernapproach to analytical science second edition. Weinheim:
WILEY-VCH Verlag GmbH & co. KGaA; 2004. p. 2-3, 559-69.
2. Gary D. Christian. analytical chemistry sixth edition. U.S.A: John Wiley & Sons,
Inc.; 2004. p. 2.
3. William T. Hall. Analytical chemistry volume 1, Qualitative Analysis. New york:
John Wiley & Sons, Inc.; 1916. p. 1.
4. David G. Watson. Pharmaceutical analysis: A text book for pharmacy students
and pharmaceutical chemists. Edinburgh: Churchill Livingstone; 1999. p. 49, 249.
5. Hobart H. Willard, Lynne L. Merritt, John A. Dean, Frank A. Settle. Instrumental
methods of analysis seventh edition. New Delhi: CBS Publishers and Distributors;
1986. p. 3.
6. Douglas A. Skoog, F. James Holler, Timothy A. Nieman. Principles of
instrumental analysis fifth edition. Singapore: Thompson Asia Pte Ltd; 2004. p.
588, 798, 810.
7. Indian Pharmacopoeia Volume 1. In. Ghaziabad: The Indian Pharmacopoeia Commission; 2010. p. 117.
8. Frank A. Settle. Handbook of Instrumental Techniques for Analytical Chemistry.
New Jersey: Prentice Hall, Inc.; 1997. p. 153, 492.
9. A.H. Beckett & J.B. Stenlake. Practical Pharmaceutical Chemistry fourth edition.
New Delhi: CBS Publishers and Distributors; 1997. p. 272.
10. United States Pharmacopoeia - National Formulary. Rockville: The United States Pharmacopoeial Convention; 2006. p. 2644-5
11. British Pharmacopoeia Volume 5. London: British Pharmacopoeia Commission Office; 2011. p. A 190.

Bibliography
Dept. of Pharmaceutical analysis
12. Matrindale the Complete Drug Reference, 36th Edition. London: Royal Pharmaceutical Society of Great Britain; 2009. p. 816.
13. The Merck Index, 14th Edition. Whitehouse Station, NJ, USA: Merck & Co.,Inc; 2006. p. 1425-6.
14. Wolfgang H. Jost & Dieter Angersbach. Ropinirole, a Non-Ergoline Dopamine
Agonist. CNS Drug Reviews. 2005; 11(3): p. 253-72.
15. British National Formulary, Vol 61. London: British Medical Association and the Royal Pharmaceutical Society of Great Britain; 2011. p. 301 & 867.
16. Medicines Compendium. Leatherhead: Data Pharm Communications ltd; 2002. p.
1704.
17. KD Tripathi. Essentials of Medical Pharmacology Sixth Edition. New Delhi: Jaypee Brothers Medical Publishers (P) Ltd; 2008. p. 419-20.
18. Richard D. Howland, Mary J. Mycek. Lippincott’s Illustrated Reviews:
Pharmacology Third Edition. Philadelphia: Lippincott Williams and Wilkins;
2006. p. 99
19. J. V. Ramji, Keogh JP, Blake TJ, Broom C, Chennery RJ, Citerone DR et. al.
Disposition of Ropinirole in Animals and Man. Xenobiotica. 1999; 29(3): p. 311-
25.
20. Clive M. Kaye & Nicholls Briony. Clinical Pharmacokinetics of Ropinirole.
Clinical Pharmacokinetics. 2000; 39(4): p. 243-54.
21. Laurence L. Bruton, John S. Lazo, Keith L. Parker. Goodman and Gilman’s: The
Pharmacological Basis of Therapeutics Eleventh Edition. New York: McGraw-
Hill Medical Publishing Division; 2006. p. 1870.
22. M. V.Kumudhavalli, K. Anand Babu and B.Jaykar. Validated Spectrophotometric
Determination of Ropinirole in Formulation. AJBPR. 2011; 1(3): p. 302 - 6.

Bibliography
Dept. of Pharmaceutical analysis
23. Sudharshan Purohit, Naman Dubey, Ashish Agrawal and Ashish Baldi. Method
Development and Validation for Estimation of Ropinirole Hydrochloride by
UVSpectroscopy. In AICTE Sponsored Two Days National Seminar on
Analytical Method Development and Biomedical Analysis; 2010; Mandsaur,
India: Souvenir. p. 73.
24. Monali S. Sali, Ajay L. Barhate, Vinit D. Patil, Ajay S. Bhadoria, Vishnu P.
Choudhari and Bhanudas S. Kuchekar . Development and Validation of Area
under Curve and First Derivative Spectrophotometric Methods for Ropinirole in
Tablet Dosage Form. Der Pharma Chemica. 2010; 2(3): p. 225 - 9.
25. Yogita Shete, Nayana Pimpodkar, R. S. Nalawade, Y. V. Pore and B. S.
Kuchekar. Spectrophotometric Estimation of Ropinirole Hydrochloride in
Tablets. IJPS. 2009; 71(1): p. 61 - 2.
26. Aydogmus Zeynep. Highly Sensitive and Selective Spectrophotometric and
Spectrofluorimetric Methods for the Determination of Ropinirole Hydrochloride
in Tablets. Spectrochimica Acta Part A. 2008; 70: p. 69 - 78.
27. Armagan Onal and Sena Caglar. Spectrophotometric Determination of
Dopaminergic Drugs Used for Parkinson’s Disease, Cabergoline and Ropinirole,
in Pharmaceutical Preparations. Chem. Pharm. Bull. 2007; 55(4): p. 629 - 31.
28. J. V. Susheel, S. Malathi and T. K. Ravi. Analysis of Ropinirole in Tablet Dosage
Form. IJPA. 2007; 69(4): p. 589 - 91.
29. Mahaki Hanieh, Chamani Jamshid, Saberi Mohamad Reza & Vahidzadeh
Masomeh. Study of the Interaction between Ropinirole Hydrochloride and Human
Serum Albumin as Binary System by Three-Dimensional Fluorescence
Spectroscopy. In 12th Iranian Congress of Biochemistry & 4th International
Congress of Biochemistry and Molecular Biology; 2011; Mashhad, Iran: Elsevier.
p. S282.

Bibliography
Dept. of Pharmaceutical analysis
30. Mahaki Hanieh. Binding Analysis of Ropinirole Hydrochloride and Aspirin to
Human Serum Albumin by Synchronous Fluorescence. In 12th Iranian Congress
of Biochemistry & 4th International Congress of Biochemistry and Molecular
Biology; 2011; Mashhad, Iran: Elsevier. p. S144.
31. A. Sundaramurthy Poongothai, Varadarajan Balaji, Rajasekhar Reddy and Petla Y
Naidu. Development and Validation of a Dissolution Test with Reversed Phase
Liquid Chromatography Analysis for Ropinirole in Tablet Dosage Forms. JPR.
2011; 4(5): p. 1524-7.
32. Ch. Krishnaiah, M. Vishnu Murthy, A. Raghupathi Reddy and Ramesh Kumar.
Development and Validation of Ropinirole Hydrochloride and its Related
Compounds by UPLC in API and Pharmaceutical Dosage Forms. J. Chin. Chem.
Soc. 2010; 57: p. 348-55.
33. N. Sreekanth, CH. Babu Rao and K. Mukkanti. RP-HPLC Method Development
and Validation of Ropinirole Hydrochloride in Bulk and Pharmaceutical Dosage
Forms. IJPPS. 2009; 1(1): p. 186-92.
34. Saral .A, Pratheesh .G, Nirmala .S and Senthil Kumar .S .K. Development and
Validation of RP-HPLC Method for the Estimation of Ropinirole Hydrochloride
in Tablet Dosage Form and its IVIVC. In 61st IPC; 2009; Ahmedabad. p. 585.
35. B. Jancic-Stojanovic, A. Malenovic, D. Ivanovic, T. Rakic and M. Medenica.
Chemometrical Evaluation of Ropinirole and its Impurity’s Chromatographic
Behavior. J. Chromatogr. A. 2009; 1216: p. 1263–69.
36. Azeem, Z. Iqbal, F. J. Ahmad, R. K. Khar and S. Talegaonkar. Development and
Validation of a Stability Indicating Method for Determination of Ropinirole in the
Bulk Drug and in Pharmaceutical Dosage Forms. Acta Chromatographica. 2008;
20(1): p. 95-107.
37. B. Sahasrabuddhey, R. Nautiyal, H. Acharya and S. Khyade. Isolation and
Characterization of Some Potential Impurities in Ropinirole Hydrochloride.
JPBA. 2007; 43: p. 1587-93.

Bibliography
Dept. of Pharmaceutical analysis
38. Armagan Onal. Method Development and Validation of a Rapid Determination of
Ropinirole in Tablets by LC-UV. Chromatographia. 2006; 64: p. 459-61.
39. Jeffery Hackett. Evaluation of Solid-Phase Sorbents for the Analysis of
Ropinirole in Whole Blood. Journal of Analytical Toxicology. 2006; 30: p. 44-49.
40. George Lunn. HPLC Method for Ropinirole. In HPLC Methods for Recently
Approved Pharmaceuticals. Hoboken, New Jersey: John Wiley & Sons, Inc.,
Publication; 2005. p. 565.
41. Pavel Coufal, Karel Stulik, Henk A. Claessens, Martin J. Hardy and Michael
Webb. Separation and Quantification of Ropinirole and Some Impurities using
Capillary Liquid Chromatography. J. Chromatogr. B. 1999; 732: p. 437-44.
42. SB Bari, AR Bakhshi, PS Jain and SJ Surana. Development and Validation of
Stability- Indicating Tlc-Densitometric Determination of Ropinirole
Hydrochloride in Bulk and Pharmaceutical Dosage Form. Pharm Anal Acta.
2011; 2(4).
43. Gulam Mustafa, Alka Ahuja, Sanjula Baboota and Javed Ali. Box-Behnken
Supported Validation of Stability-Indicating High Performance Thin-Layer
Chromatography (HPTLC) Method: An Application in Degradation Kinetic
Profiling of Ropinirole. SPJ. 2011.
44. Pavel Coufal, Karel Stulik, Henk A. Claessens, Martin J. Hardy and Michael
Webb. Determination of the Dissociation Constants of Ropinirole and Some
Impurities and Their Quantification using Capillary Zone Electrophoresis. J.
Chromatogr. B. 1998; 720: p. 197-204.
45. D. Vijaya Bharathi, B. Jegadeesh, S. Sirish Kumar, Revathi Naga Lakshmi,
Kishore Kumar Hotha, A. Naidu et al. Highly Sensitive Method for the
Determination of Ropinirole with a Lower Limit of Quantitation of 3.45 pg/ml in
Human Plasma by LC-ESI-MS/MS: Application to a Clinical Pharmacokinetic
Study. Biomedical Chromatography. 2009; 23(5): p. 557-62.

Bibliography
Dept. of Pharmaceutical analysis
46. Erin E. Chambers, Diane M. Diehl and Jeffrey R. Mazzeo. A Rapid and Sensitive
SPE-UPLC/MS/MS Method for the Determination of Ropinirole in Human
Plasma. Milford, U.S.A: Waters Corporation; 2008.
47. Ai-Dong Wen, Yan-Yan Jia, Xiao- Xing Luo, Lin- Lin Bi, Xiao- Yan Chen and
Da- Fang Zhong. The Effect of Madopar on the Pharmacokinetics of Ropinirole
in Healthy Chinese Volunteers. JPBA. 2007; 43: p. 774-78.
48. W. Edgemond, K. Sowell, C. Bugge, D. Garcia and M. Sullivan. A Sensitive
Method for the Determination of Ropinirole in Human Plasma by LC-MS-MS. In
American Association of Pharmaceutical Scientists (AAPS) Annual Meeting &
Exposition; 2007; San Diego.
49. Jignesh Bhatt, Arvind Jangid, Raghavendra Shetty and Bhavin Shah. Rapid and
Sensitive Liquid Chromatography–Mass Spectrometry Method for Determination
of Ropinirole in Human Plasma. JPBA. 2006; 40: p. 1202–08.
50. Validation of Analytical Procedures: Methodology. Geneva: ICH Harmonised
Tripartite Guideline; 1996. p. 1-8.