analytical methodologies for determination of
TRANSCRIPT

Citation: Bari NM, Khan ZG and Patil DD. Analytical Methodologies for Determination of Methylcobalamin: An Overview. Austin J Anal Pharm Chem. 2016; 3(1): 1062.
Austin J Anal Pharm Chem - Volume 3 Issue 1 - 2016ISSN : 2381-8913 | www.austinpublishinggroup.com Patil et al. © All rights are reserved
Austin Journal of Analytical and Pharmaceutical Chemistry
Open Access
Abstract
Three different form of vitamin B12 are available as methylcobalamin, cyanocobalamin and hydroxocobalamin. Methylcobalamin is considered as an active form of vitamin B12 whereas other two as inactive forms. Methylcobalamin is official in Japanese Pharmacopoeia. This article reviews the analytical methods for identification and quantitative estimation of methylcobalamin in various pharmaceutical formulations. We had reviewed analytical methods published so far for estimation of methylcobalamin in pharmaceutical formulations mainly from 1960 to 2015. The most commonly adopted method for the determination of methylcobalamin was UV–Visible spectrophotometry. There were various other methods reported viz Reversed Phase - High Performance Liquid Chromatography (RP-HPLC), Thin Layer Chromatography (TLC) and liquid chromatography coupled with tandem mass spectrometry. Almost all methods have been developed for estimation of methylcobalamin in tablet (available as combination with another drug). There was a single method reported for quantitative estimation of methylcobalamin injection.
Keywords: UV–Visible Spectrophotometry, TLC, RP-HPLC, LC-MS, Methylcobalamin review, Validation
behaviours in low back pain, diabetic neuropathy, and neuralgia. It inhibits ectopic spontaneous discharges of injured primary sensory neurons and improves nerve conduction, promoted the regeneration of injured nerves [3].
MeCbl is preferred in treatment of glutathione redox status in children with autism [4]. MeCbl is an indispensable component in the deduction of the myelin sheath and in the maintenance of heart function. Myelin sheath can become damaged with deficiency in vitamin B12. Myelin sheath has been regenerated by the aid of MeCbl and restores the function of the nerve in condition of neuropathy [5].
MeCbl can be obtained as bright red crystals soluble in water and
AbbreviationsMeCbl: Methylcobalamin; MBA: Microbiological Assay; DW:
Distilled Water; ACN: Acetonitrile; KH2PO4: Potassium Dihydrogen Phosphate; ODS: Octadecylsilyl Groups; LOD: Limit of Detection; LOQ: Limit of Quantification; NH4OH: Ammonium Hydroxide; ICH: International Conference Harmonization; RSD: Relative Standard Derivation
IntroductionMethylcobalamin (MeCbl) is carbanide; cobalt(3+);[5-(5,6-
dimethylbenzimidazol-1-yl)-4-hydroxy-2-(hydroxymethyl)oxolan-3-yl]-1-[3-[(4Z,9Z,14Z)-2,13,18-tris(2-amino-2oxoethyl)-7,12,17-tris(3-amino-3-oxopropyl)-3,5,8,8,13,15,18,19-octamethyl-2,7,12,17-tetrahydro-1H-corrin-21-id-3-yl] propanoylamino] propan-2-yl phosphate chemically with molecular formula C63H91CON13O14P and official in Japanese Pharmacopoeia (XIV) [1]. Chemical structure of MeCbl is shown in Figure 1. MeCbl is one of the co enzymatically active cobalamin derivative. It is an essential nutrient linked to human growth, cell development and an important component of several enzymes which is involved in the metabolism of certain amino acids. MeCbl had been used to prepared by partial synthesis upto 1962 and was found to be an active constituent in enzymatic synthesis of methionine by extract of an Escherichia coli mutant [2].
MeCbl is an activated form of vitamin B12, used in treatment of Alzheimer’s disease, rheumatoid arthritis, and in various other nutritional diseases. Vitamin B12 is found predominantly in meat and dairy products. MeCbl exerts neuronal protection by enhancing regeneration of injured nerves and also antagonizes glutamate-induced neurotoxicity. It is an auxiliary agent which improving pain
Review Article
Analytical Methodologies for Determination of Methylcobalamin: An OverviewBari NM, Khan ZG and Patil DD*Department of Pharmaceutical Analysis, H. R. Patel Institute of Pharmaceutical Education and Research, Shirpur, India
*Corresponding author: Dipak D Patil, Assistant professor, Head of Department, Department of Pharmaceutical Analysis, H. R. Patel Institute of Pharmaceutical Education and Research, Shirpur, India
Received: March 21, 2016; Accepted: April 13, 2016; Published: April 14, 2016
Figure 1: Structure of Methylcobalamin.

Austin J Anal Pharm Chem 3(1): id1062 (2016) - Page - 02
Patil DD Austin Publishing Group
Submit your Manuscript | www.austinpublishinggroup.com
ethanol. The perspective of coordination chemistry, methylcobalamin contains metal-alkyl bonds. It acts as a cofactor in the enzyme methionine synthase. This enzyme catalyzes the methylation of homocysteine into methionine [6]. MeCbl is applicable in various diseases like diabetic and peripheral neuropathy and also used as a preliminary aid for treatment of amyotrophic lateral sclerosis [7].
Vitamin B12 is used in the body in two forms such as MeCbl and 5-deoxyadenosyl cobalamin. It is used in the treatment of a facial paralysis in Bell’s palsy syndrome and also useful for trigeminal neuralgia, megaloblastic anaemia [8]. MeCbl plays an important role in the formation of RBCs. Deficiency of MeCbl may leads to megaloblastic anemia and nervous system disorders or improper synthesis of DNA [9].
There are various conditions in which MeCbl can be found a best aid as shown in Figure 2.
Vitamin B12 is routinely determined in food products by microbiological assay (MBA), which uses Lactobacillus leishmanii as the test organism. Although the assay is highly sensitive, it lacks specificity in some food matrices as inactive cobalamin could interfere with the growth of the microorganism [10].
Analytical Methods for Estimation of MethylcobalaminUV – Visible spectrophotometry
B. Suhagia et al. had developed simultaneous estimation of epalrestat and MeCbl in bulk and tablet formulation. UV-Visible spectrophotometry method was extensively utilised to quantify MeCbl in pharmaceutical dosage form. The absorption correction method used for determination of epalrestat at 389 nm and MeCbl at 264 nm by correcting the absorbance of the MeCbl at 264 nm by deducting standard absorbance of epalrestat at 264 nm. Method was found to be specific as there was no interference of any excipients and impurities. This method has been validated as per ICH Guidelines [11].
M. Ganesam et al. had reported the UV-Visible spectrophotometric method for estimation of MeCbl in injections, excipients and additives in formulation. The drug has been found stable to oxidation and alkali treatments but not interfering with analysis when unstable to thermal stress and acid treatments. The standard MeCbl (10μg/ml) was scanned between 200-400 nm. The maximum absorption was recorded at 353 nm. The assay result was found to be 98.94%. The percent recovery was found to be 99.05 - 100.50 %. The linearity range and correlation coefficient (r2) value found to be of 10 - 50 μg/ml and 0.9995 respectively [12].
T. Kalyankar et al., had developed UV-Visible spectrophotometric method for simultaneous estimation of duloxetine and MeCbl in combined dosage form. MeCbl was estimated at 351 nm whereas duloxetine was estimated at 289 nm in distilled water. The calibration curves was found to be linear over the concentration range of 10 - 60 μg/ml for duloxetine ( r2 = 0.999) and 1.5 - 9.0 μg/ml for MeCbl ( r2=0.993). The percentage recovery of MeCbl was found to be 99.87 ± 0.34. The LOD values for duloxetine and MeCbl were found to be 0.05 μg/ml and 0.14 μg/ml respectively. LOQ values for duloxetine and MeCbl were found to be 0.166 μg/ml and 0.484 μg/ml respectively [13].
P. P. Goti and P. B. Patel had reported a validated ratio-derivative UV-Visible spectrophotometric method for simultaneous estimation of gabapentin, MeCbl and alpha lipoic acid in tablet formulation. They calculated and plotted zero and first order derivative of the mathematical expression of a spectral curve. The derivative ratio absorbance of gabapentin, MeCbl and alpha lipoic acid was measured at 731.10 nm, 768.53 nm and 242.21 nm respectively. LOD and LOQ for Gabapentin, MeCbl and alpha lipoic acid was found to be 3.09 µg/ml and 9.37 µg/ml; 0.03 μg/ml and 0.10µg/ml; and 4.79 µg/ml and 14.52 µg/ml respectively. The percentage labelled claim for tablet formulation was found to be 98.71, 98.94 and 98.44 respectively. The method was validated as per ICH Guidelines [14].
R. Sengamalam et al. had developed a validated UV-Visible spectrophotometric method for dissolution profile of duloxetine and MeCbl. The combination of duloxetine and methylcobalamin was used as antidiabetic agent. The absorbance of the combinational drug was measured at 288.0 nm for duloxetine and 370.0 nm for MeCbl in water as solvent. The optimized conditions include the use of USP apparatus 2 at a paddle rotation rate of 50 rpm and 900 ml of 0.1 N HCl and phosphate buffer (pH= 7.4) as dissolution medium, at 37.0±0.5°. Capsule and tablet showed to dissolve at the 10 hours and 30 min time point and 11 hours and 30 min respectively. The method was reported for quality control and routine analysis of drugs in pharmaceutical formulations [15].
V. Galande et al. had developed UV-Visible spectrophotometric method for the estimation of gabapentin and MeCbl in tablet dosage form. The absorbance of gabapentin and MeCbl was obtained by reacting with 0.2% ninhydrine in N, N’- dimethyl formamide at 405nm and 351nm respectively. The concentration range of Beer Lambert’s law obeyed as 50 - 300 μg/ml for gabapentin with correlation coefficient 0.9949 and 1 - 7 μg/ml for MeCbl with correlation coefficient 0.9993. The percentage purity of determined tablet was found to be 100.43 ± 0.15 and 100.48 ± 0.18 by standard curve method and 100.58 ± 0.17 and 102.31 ± 1.25 by double point
Figure 2: Treatment with Methylcobalamin.
Austin J Anal Pharm Chem 3(1): id1062 (2016) - Page - 03
Patil DD Austin Publishing Group
Submit your Manuscript | www.austinpublishinggroup.com
standardization of the label claim for gabapentin and MeCbl [16].
C. Karchalia and P. Patel had reported a validated UV-Visible spectrophotometric method for simultaneous estimation of amitriptyline hydrochloride and MeCbl in their tablet dosage formulation. The method utilizes distilled water as solvent. The absorbance of amitriptyline hydrochloride and methylcobalamin was measured at 239 nm and 351nm respectively. The linearity range was found to be 20 - 60 μg/ml with correlation coefficient 0.9998 for amitriptyline hydrochloride and 3-9 μg/ml with correlation coefficient 0.9990 for MeCbl respectively [17].
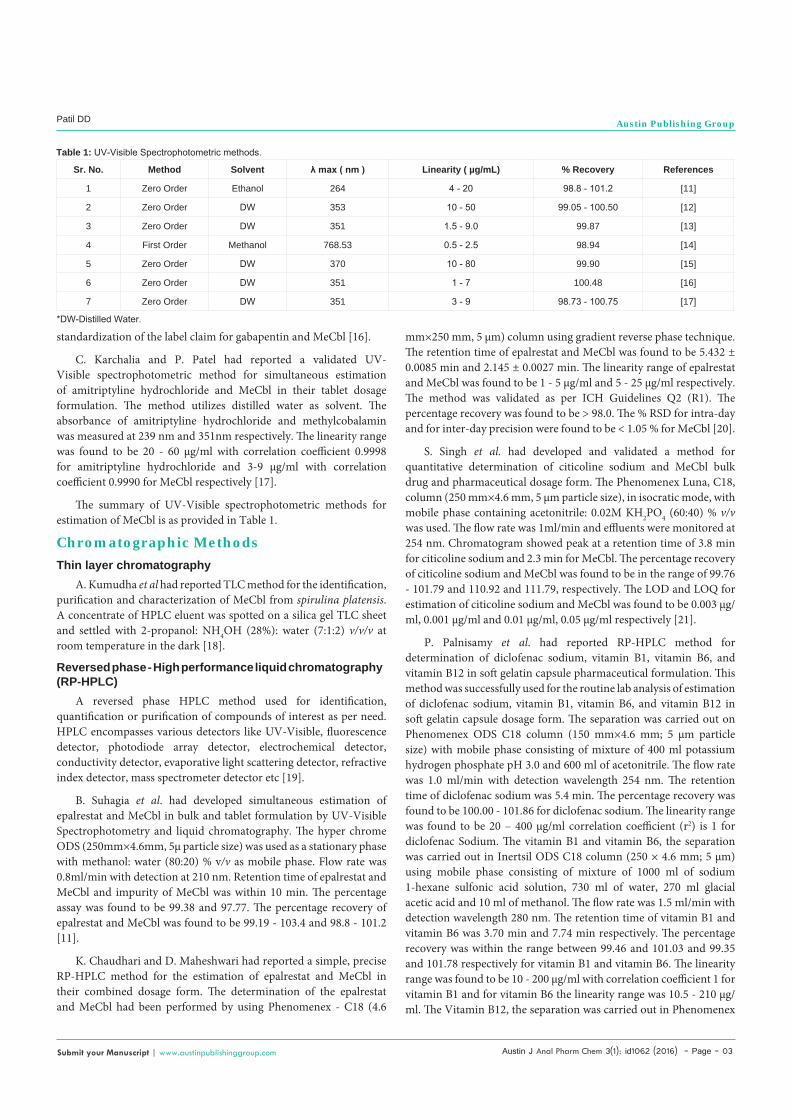
The summary of UV-Visible spectrophotometric methods for estimation of MeCbl is as provided in Table 1.
Chromatographic MethodsThin layer chromatography
A. Kumudha et al had reported TLC method for the identification, purification and characterization of MeCbl from spirulina platensis. A concentrate of HPLC eluent was spotted on a silica gel TLC sheet and settled with 2-propanol: NH4OH (28%): water (7:1:2) v/v/v at room temperature in the dark [18].
Reversed phase - High performance liquid chromatography (RP-HPLC)
A reversed phase HPLC method used for identification, quantification or purification of compounds of interest as per need. HPLC encompasses various detectors like UV-Visible, fluorescence detector, photodiode array detector, electrochemical detector, conductivity detector, evaporative light scattering detector, refractive index detector, mass spectrometer detector etc [19].
B. Suhagia et al. had developed simultaneous estimation of epalrestat and MeCbl in bulk and tablet formulation by UV-Visible Spectrophotometry and liquid chromatography. The hyper chrome ODS (250mm×4.6mm, 5μ particle size) was used as a stationary phase with methanol: water (80:20) % v/v as mobile phase. Flow rate was 0.8ml/min with detection at 210 nm. Retention time of epalrestat and MeCbl and impurity of MeCbl was within 10 min. The percentage assay was found to be 99.38 and 97.77. The percentage recovery of epalrestat and MeCbl was found to be 99.19 - 103.4 and 98.8 - 101.2 [11].
K. Chaudhari and D. Maheshwari had reported a simple, precise RP-HPLC method for the estimation of epalrestat and MeCbl in their combined dosage form. The determination of the epalrestat and MeCbl had been performed by using Phenomenex - C18 (4.6
mm×250 mm, 5 μm) column using gradient reverse phase technique. The retention time of epalrestat and MeCbl was found to be 5.432 ± 0.0085 min and 2.145 ± 0.0027 min. The linearity range of epalrestat and MeCbl was found to be 1 - 5 µg/ml and 5 - 25 µg/ml respectively. The method was validated as per ICH Guidelines Q2 (R1). The percentage recovery was found to be > 98.0. The % RSD for intra-day and for inter-day precision were found to be < 1.05 % for MeCbl [20].
S. Singh et al. had developed and validated a method for quantitative determination of citicoline sodium and MeCbl bulk drug and pharmaceutical dosage form. The Phenomenex Luna, C18, column (250 mm×4.6 mm, 5 μm particle size), in isocratic mode, with mobile phase containing acetonitrile: 0.02M KH2PO4 (60:40) % v/v was used. The flow rate was 1ml/min and effluents were monitored at 254 nm. Chromatogram showed peak at a retention time of 3.8 min for citicoline sodium and 2.3 min for MeCbl. The percentage recovery of citicoline sodium and MeCbl was found to be in the range of 99.76 - 101.79 and 110.92 and 111.79, respectively. The LOD and LOQ for estimation of citicoline sodium and MeCbl was found to be 0.003 μg/ml, 0.001 μg/ml and 0.01 μg/ml, 0.05 μg/ml respectively [21].
P. Palnisamy et al. had reported RP-HPLC method for determination of diclofenac sodium, vitamin B1, vitamin B6, and vitamin B12 in soft gelatin capsule pharmaceutical formulation. This method was successfully used for the routine lab analysis of estimation of diclofenac sodium, vitamin B1, vitamin B6, and vitamin B12 in soft gelatin capsule dosage form. The separation was carried out on Phenomenex ODS C18 column (150 mm×4.6 mm; 5 μm particle size) with mobile phase consisting of mixture of 400 ml potassium hydrogen phosphate pH 3.0 and 600 ml of acetonitrile. The flow rate was 1.0 ml/min with detection wavelength 254 nm. The retention time of diclofenac sodium was 5.4 min. The percentage recovery was found to be 100.00 - 101.86 for diclofenac sodium. The linearity range was found to be 20 – 400 μg/ml correlation coefficient (r2) is 1 for diclofenac Sodium. The vitamin B1 and vitamin B6, the separation was carried out in Inertsil ODS C18 column (250 × 4.6 mm; 5 μm) using mobile phase consisting of mixture of 1000 ml of sodium 1-hexane sulfonic acid solution, 730 ml of water, 270 ml glacial acetic acid and 10 ml of methanol. The flow rate was 1.5 ml/min with detection wavelength 280 nm. The retention time of vitamin B1 and vitamin B6 was 3.70 min and 7.74 min respectively. The percentage recovery was within the range between 99.46 and 101.03 and 99.35 and 101.78 respectively for vitamin B1 and vitamin B6. The linearity range was found to be 10 - 200 μg/ml with correlation coefficient 1 for vitamin B1 and for vitamin B6 the linearity range was 10.5 - 210 μg/ml. The Vitamin B12, the separation was carried out in Phenomenex
Sr. No. Method Solvent λ max ( nm ) Linearity ( µg/mL) % Recovery References
1 Zero Order Ethanol 264 4 - 20 98.8 - 101.2 [11]
2 Zero Order DW 353 10 - 50 99.05 - 100.50 [12]
3 Zero Order DW 351 1.5 - 9.0 99.87 [13]
4 First Order Methanol 768.53 0.5 - 2.5 98.94 [14]
5 Zero Order DW 370 10 - 80 99.90 [15]
6 Zero Order DW 351 1 - 7 100.48 [16]
7 Zero Order DW 351 3 - 9 98.73 - 100.75 [17]
Table 1: UV-Visible Spectrophotometric methods.
*DW-Distilled Water.

Austin J Anal Pharm Chem 3(1): id1062 (2016) - Page - 04
Patil DD Austin Publishing Group
Submit your Manuscript | www.austinpublishinggroup.com
ODS C18 column (150x4.6 mm; 5 μm) using mobile phase consisting of mixture of 25 ml trifluroacetic acid, 870 ml of water and 130 ml of acetonitrile. The flow rate was 1.2 ml/min with detection wavelength 361 nm. The retention time of Vitamin B12 was 6.75 min. The percentage recovery was within the range between 98.86% and 101.94% for Vitamin B12. The linearity range was found to be 1 - 20 μg/ml (r2 =0.9999) for Vitamin B12. The percentage recovery was within the range between 98.86 and 101.94 for vitamin B12 [22].
R. Pai and S. Sawant had developed and validated RP‐HPLC method for the assay determination of MeCbl and alphalipoic acid in soft gelatine capsule formulation. Two separate chromatographic conditions were used for estimation of MeCbl and alphalipoic acid. The Phenomenex Luna C‐18, (250 mm×4.6 mm, 5 μm particle size) column stationary phase. The aqueous mobile phase consisted of 0.02 M phosphate buffer pH 3.5 adjusted with hexane-1-sulphonic acid, sodium salt as ion pairing reagent and acetonitrile for both the methods. After sample preparation immediately transferred in an amber vial and kept at stable temperature, 20°C. Column oven temperature was set at 40°C. The flow rate was 1.0 ml/min for MeCbl and 1.2 ml/min for alphalipoic acid. The detection was carried out using photodiode array detector with wavelength and at 266 nm for MeCbl and 240 nm for alphalipoic acid. The precision is exemplified by RSD of 0.78 % for MeCbl and 0.53 % for alphalipoic acid. The correlation coefficients (r2) was found to be 0.99995 for MeCbl and 0.99941 alphalipoic acid respectively. The mean percentage recovery was found to be 101.43 and 99.43 respectively. The retention time of MeCbl was 8.3 min and alphalipoic acid was 6.5 min respectively [7].
K. Bhatt et al. had developed simultaneous estimation of pregabalin and MeCbl in formulation by using RP-HPLC method
A Phenomenex C18 (250mm×4.6mm, 3 µm particle size), chromatographic column equilibrated with mobile phase water : methanol (60:40) % v/v adjusted to pH 6.5 with triethylamine (1% v/v) was used. The flow rate was maintained at 1ml/min and effluents were monitored at 218 nm. The calibration curve of pregabalin and MeCbl was 50 – 300 μg/ml and 0.5 - 2.0 μg/ml respectively. The limit of quantification was 24.10 μg/ml for pregabalin and 0.40 μg/ml for MeCbl respectively. The retention time of pregabalin and MeCbl was 6.4 min and 7.9 min respectively. The LOD and LOQ for estimation of pregabalin and MeCbl was found to be 8.10 μg/ml, 24.50 μg/ml, and 0.12 μg/ml, 0.40 μg/ml respectively. The % RSD values for pregabalin and MeCbl was found to be 0.56 and 0.86 respectively. The advantages of short run time and the possibility of analysis of a large number of samples, both of which significantly reduce the analysis time per sample [23].
P. Narmada et al. had reported a validated RP-HPLC method for the determination of MeCbl and pregabalin in combined capsule dosage form. Inertsil ODS 3 C-18 (250mm×4.6mm, particle size 3 µm) was used as stationary phase. The mobile phase consisted of 0.01M potassium dihydrogen and dipotassium hydrogen phosphate: methanol (60:40) v/v as solvent. Flow rate was 0.6 ml/min with detection wavelength at 210 nm. The LOD and LOQ for estimation of pregabalin and MeCbl was found to be 75 - 1125 μg/ml and 0.75 - 11.25 μg/ml respectively. The method was validated as per ICH guidelines [24].
S. Muthukumar et al. had reported RP-HPLC method for the quantitative determination of piracetam and MeCbl in pharmaceutical dosage forms. The chromatographic separation was achieved on Phenomenex C-18 (250mm×4.6mm, particle size 5µm) column.
Sr. No Column Dimension
(mm×mm)μm Mobile Phase Detection (nm)
Linearity ( µg/ml)
Flow rate(ml/min)
LOD(µg/ml)
LOQ(µg/ml) References
1Hyper chrome
ODSC-18
( 250×4.6 )5 Methanol: Water (80:20) % v/v 210 20 - 60 0.8 1 3.05 [11]
2 PhenomenexC-18 ( 250×4.6 )5 ACN: Ammonium
Acetate buffer (50:50) % v/v 363 0.05-0.17 0.9 0.17 0.52 [20]
3Phenomenex
LunaC-18
( 250×4.6 )5 ACN : 0.02 M KH2PO4 (60:40) % v/v 254 25-May 1 0.01 0.05 [21]
4Phenomenex
ODSC-18
( 150×4.6 )5 25 ml trifluro acetic acid, 870 ml water, 130 ml ACN 361 20-Jan 1.2 -- -- [22]
5Phenomenex
LunaC-18
( 250×4.6 )50.02 M monobasic
potassium phosphate buffer pH 3.5: ACN (80:20) % v/v
266 15 - 40 1 -- -- [7]
6 Phenomenex C-18 ( 250×4.6 )5 Water : methanol
(60:40) % v/v 218 0.5 - 20 1 0.12 0.4 [23]
7 Inertsil ODS 3C-18 ( 250×4.6 )3
0.01M Pottasium Dihydrogen and
dipotassium hydrogen phosphate : methanol (60 :
40) % v/v
210 0.75-11.25 0.6 0.05 0.15 [24]
8 Waters C-18 ( 250× 4.6)5
Potassium Dihydrogen phosphate buffer pH 6.0
with o-phosphoric acid (A) ACN (B) Methanol (C)
(40:50:10) % v/v/v
251 0.025 - 0.10 1 0.000056 0.00017 [8]
9Waters alliance
2695C-18
( 250× 4.6)3
Ammonium dihydrogen-o- phosphate buffer (A) ACN
(B) Methanol (C)(75:15:10) % v/v/v
210 16 - 24 1 1.33 4.05 [25]
Table 2: Reverse Phase-High Performance Liquid Chromatography methods.
*ACN: Acetonitrile; KH2PO4: Potassium Dihydrogen Phosphate; ODS: Octadecylsilyl Groups; LOD: Limit of Detection; LOQ: Limit of Quantification.

Austin J Anal Pharm Chem 3(1): id1062 (2016) - Page - 05
Patil DD Austin Publishing Group
Submit your Manuscript | www.austinpublishinggroup.com
The mobile phase consist of potassium dihydrogen phosphate buffer (pH 6.0 adjusted with o-phosphoric acid): acetonitrile: methanol (40:50:10) % v/v/v with a flow rate of 1 ml/min with detection at wavelength 251 nm. The retention time of piracetam and MeCbl was found at 2.21 min and 3.68 min respectively [8].
N. Kannapan et al. had reported RP-HPLC method for determination of pregabalin and MeCbl combined in capsule dosage form. Chromatographic separation was achieved isocratically using Waters alliance 2695 separation module, C-18 column (250mm×4.6mm, 5 µm particle size) at temperature 40°C. Mobile phase used was ammonium dihydrogen-o-phosphate (buffer pH 6.0), acetonitrile and methanol in the ratio of (75:15:10)% v/v/v had given better resolution and sensitivity. Flow rate was maintained at 1 ml/min using UV-Visible PDA detector at wavelength 210 nm. The LOD was found to be 47.93 µg/ml for pregabalin and 1.33 µg/ml for MeCbl respectively. The LOQ was found to be 145 µg/ml and 4.05 µg/ml for pregabalin and MeCbl respectively. The linearity range was found to be of 3200 - 4800 µg/ml and 16-24 µg/ml for pregabalin and MeCbl respectively with correlation coefficients (r2) is 0.9938 and 0.9959. The retention time of pregabalin and MeCbl was found at 4.161 min and 7.804 min, respectively [25].
The summary of RP-HPLC methods for estimation of MeCbl alone and in combination with other drug as provided in Table 2.
Hyphenated TechniquesHigh performance liquid chromatography-Mass spectroscopy (HPLC-MS)
A. Szterk et al. had reported in application of the SPE (Solid Phase Extraction) reversed phase HPLC/MS technique to determine vitamin B12 bio-active forms in beef. Precision and accuracy of the method was high. The liquid-liquid extraction and SPE clean-up procedures were inexpensive, simple and fast. A novel method employing solid phase extraction and liquid chromatography mass spectrometric detection to determine vitamin B12 of biologically active forms in beef and beef liver was reported [9].
High performance liquid chromatography- Mass spectroscopy- Mass spectroscopy
A. Kumudha et al. have developed HPLC-MS and MS-MS method for the purification, identification and characterization of MeCbl from spirulina platensis. The presence of methylcobalamin was further confirmed by selected ion recording and product ion spectra [18]. The details of experimental parameters are shown in Table 3.
Chemiluminescence Analysis of Vitamin B12A. Kumudha et al. had developed HPLC-MS and MS-MS
method for the purification, identification and characterization of MeCbl from spirulina platensis. The HPLC fraction was collected and analysed for cobalt-enhanced chemiluminescence. It is reported that cobalt enhances the photon production during the luminol and
Sr.No Sample Name Retention Time(min) Collision Energy (eV) Product Ion Mass Reference
1 Standard 3.943 20 673.65 > 665.76[18]
2 Sample 3.943 20 673.65 > 665.72
Table 3: High Performance Liquid Chromatography- Mass Spectrometry- Mass Spectroscopy techniques use in pure and standard methylcobalamin.
H2O2 reaction during the chemiluminescence reaction; photons are produced that are directly proportional to the vitamin B12 concentration. Chemiluminescence can detect Cobalt of both true and pseudo forms. This assay method has a limitation for distinguishing true and pseudo forms of cobalamin [18].
Conclusion The presented systematic review discusses about various
analytical methods used for the determination of methylcobalamin in pharmaceutical dosage form and biological samples. New trends and advances for quantification of methylcobalamin are based on usuage of HPLC. In this paper, recent review work on methylcobalamin in pharmaceutical formulations mainly from 1960 to 2015 has been covered. The various analytical techniques utilised for estimation of MeCbl were explored. The UV–Visible spectrophotometry, Chromatographic methods mainly HPLC. Thin layer chromatography, Liquid chromatography–mass spectrometry were the main techniques used. More sophisticated techniques like LC-MS, MS-MS and chemiluminescence analysis were also used. UV-Vis spectrophotometry method utilizes economic solvents. All UV-Vis spectrophotometry methods were zero order except the only one method reported was first order derivative. In reported UV–Visible spectrophotometric methods, the % recovery of drug was overall 99.98 % in pharmaceutical dosage form. All RP-HPLC method, have utilised C-18 columns for estimation of MeCbl in combination with other drugs. The developed methods have been validated as per ICH guidelines.
References1. “Japanese Pharmacopoeia XIV Edition”. Page No: 590-591.
2. Lindstrand K. Isolation of methylcobalamin from natural source material. Nature. 1964; 204: 188-189.
3. Zhang M, Han W, Hu S, Xu H. Methylcobalamin: a potential vitamin of pain killer. Neural Plast. 2013; 2013: 424651.
4. SJ James, S Melnyk, G Fuchs, T Reid, S Jernigan, O Pavliv, et al. “Efficacy of methylcobalamin and folinic acid treatment on glutathione redox status in children with autism. “The American journal of clinical nutrition. 2009; 89: 425-430.
5. YU Dongre and OC Swami. “Sustained-release pregabalin with methylcobalamin in neuropathic pain: an Indian real-life experience.” International journal of general medicine. 2013; 6: 413-417.
6. R Kisliuk and D Woods. “Interrelationships between folic acid and cobalamin in the synthesis of methionine by extracts of Escherichia coli.” Biochemical Journal. 1960; 75: 467-477.
7. N Pai and S Sawant. “A simple and validated RP-HPLC method for the estimation of methylcobalamin and Alphalipoic acid in soft gelatine capsule dosage form.” Der Pharmacia Sinica. 2013; 4: 46-53.
8. S Muthukumar, S Reddy, D Selvakumar and D Banji. “Development and Validation of a RP-HPLC method for the quantification of piracetam and mecobalamin.” International Journal of Biological & Pharmaceutical Research. 2013; 4: 681-684.
9. A Szterk, M Roszko, K Malek, M Czerwonka and B Waszkiewicz-Robak. “Application of the SPE reversed phase HPLC/MS technique to determine vitamin B12 bio-active forms in beef.” Meat science. 2013; 91: 408-413.

Austin J Anal Pharm Chem 3(1): id1062 (2016) - Page - 06
Patil DD Austin Publishing Group
Submit your Manuscript | www.austinpublishinggroup.com
10. O Heudi, T Kilinc, P Fontannaz and E Marley. “Determination of vitamin B 12 in food products and in premixes by reversed-phase high performance liquid chromatography and immunoaffinity extraction.” Journal of Chromatography A. 2006; 1101: 63-68.
11. B Suhagia. “Simultaneous Estimation Of Epalrestat And Methylcobalamin In Bulk And Tablet Formulation By Uv Spectrophotometry And Liquid Chromatogaphy.” Indo American Journal of Pharm Research. 2014; 4: 2650-2656.
12. M Ganesam, P Solairaj, S Rajesh, T Sentilkumar, and A Thangathirupathi. “A simple spectrophotometeric method for the estimation of Mecobalamin in injections.” IJPPS. 2012; 4: 559-562.
13. T Kalyankar, P Panchakshari, S Wadher and S Pekamwar. “Simultaneous Estimation of Duloxetine and Methylcobalamin in combined dosage form by Ultra-violet Spectrophotometry”. International Journal of PharmTech Research. 2013; 5: 1572-1580.
14. PP Goti and PB Patel. “Development and validation of ratio-derivative spectrophotometric method for simultaneous estimation of Gabapentin, Methylcobalamin and alpha lipoic acid in tablet formulation.” Journal of Pharmacy Research. 2013; 6: 609-614.
15. R Sengamalam, M Ravindran, M Gunjan and S Meena. “Analytical Method Development and Dissolution Profile of Duloxetine and Methylcobalamin By Vierodt’s Method.” Journal of Pharmacy Research. 2011; 4: 449-451.
16. VR Galande, K Baheti and M Dehghan. “UV-Vis spectrophotometric method for estimation of Gabapentin and Methylcobalamin in bulk and tablet.” International Journal of Chem Tech Research. 2010; 2: 695-699.
17. CV Karchaliya and P Patel. “Development and Validation of Analytical Methods for Simultaneous Estimation of Amitriptyline Hydrochloride and Methylcobalamin in their Tablet Dosage Form by UV Spectrophotometric Method.” Pharma Tutor. 2015; 3: 46-50.
18. Kumudha A, Kumar SS, Thakur MS, Ravishankar GA, Sarada R. Purification, identification, and characterization of methylcobalamin from Spirulina platensis. J Agric Food Chem. 2010; 58: 9925-9930.
19. R Singh. “HPLC method development and validation-an overview.” J Pharm Educ Res. 2013; 4: 26-33.
20. KL Chaudhari and DG Maheshwari. “RP-HPLC method for the estimation of Epalrestat and Methylcobalamin in their combined dosage form.” Ind. Amer. J. Pharma. Res. 2014; 5: 2697-2705.
21. SD Singh, FA Mehta, DA Shah and UK Chhalotiya. “Analytical Rp-Hplc Method for Development and Validation of Citicoline Sodium and Methylcobalamin in Combined Tablet Formulation.” Int.J.Pharm Anal. 2014; 2: 432-438.
22. P Palanisamy, B Jayakar, M Kumar, RM Chandra, B Venkateshwralu, A Pasupathi, et al. “Development Of A Rp-Hplc Method For The Estimation Of Diclofenac Sodium, Vitamin B1, Vitamin B6and Vitamin B12 Insoft Gelatin Capsule Dosage Form.” International Journal. 2014; 5: 1002-1013.
23. K Bhatt, EM Patelia and A Mori. “Simultaneous Estimation of Pregabalin and Methylcobalamine in Pharmaceutical Formulation by RP-HPLC Method.” J Anal Bioanal Techniques. 2013; 4: 1-4.
24. P Narmada, G Vijayalakshmi, G Nali, Y Gowtham, B Subasini and K Jogi. “RP-HPLC method development and validation for the determination of Methylcobalamin and Pregabalin in combined capsule formulation.” International Journal of Research in Pharmaceutical Sciences. 2013; 4: 25-29.
25. N Kannapan, S Nayak, T Venkatachalam and V Prabhakaran. “Analytical RP-HPLC method for development and validation of Pregabalin and Methylcobalamine in combined capsule formulation.” Journal of Applied Chemical Research. 2010; 13: 85-89.
Citation: Bari NM, Khan ZG and Patil DD. Analytical Methodologies for Determination of Methylcobalamin: An Overview. Austin J Anal Pharm Chem. 2016; 3(1): 1062.
Austin J Anal Pharm Chem - Volume 3 Issue 1 - 2016ISSN : 2381-8913 | www.austinpublishinggroup.com Patil et al. © All rights are reserved