analytical method development for the determination of ... · analytical method development for the...
TRANSCRIPT
Analytical method development for the determination of drug
degradation: case studies.Claudio Brunelli
Pfizer Analytical Research and Development
Pfizer Confidential
Amsterdam 14-15Oct2019│ 1
Analytical requirement
- The important requisite for stability studies and forced
degradation study is to submit the stressed samples to
dedicated reliable analytical methods that:
ensure all degradants are captured
ensure all degradants are identified
provide substrate for method development and optimization
- We recommend to full degradation protocol
- We recommend to screen the samples generated at each
degradation condition with a pool of orthogonal analytical
methods
SOS – Amsterdam 14-15Oct2019 │ 2
Case Study 1: method development
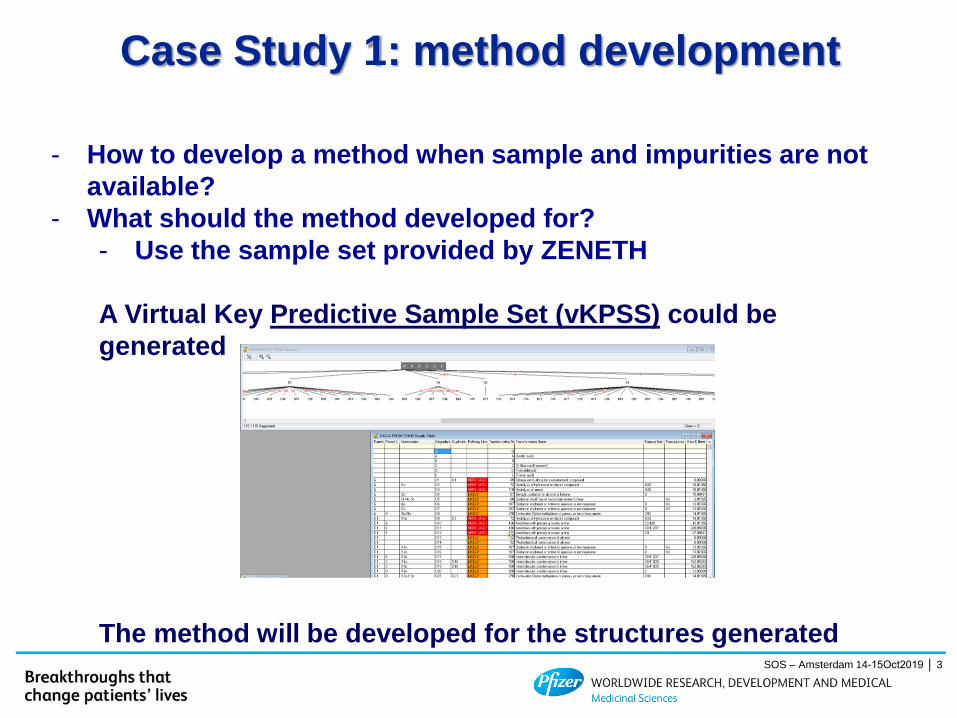
- How to develop a method when sample and impurities are not
available?
- What should the method developed for?
- Use the sample set provided by ZENETH
A Virtual Key Predictive Sample Set (vKPSS) could be
generated
The method will be developed for the structures generatedSOS – Amsterdam 14-15Oct2019 │ 3
Case Study 1: method development
SOS – Amsterdam 14-15Oct2019 │ 4
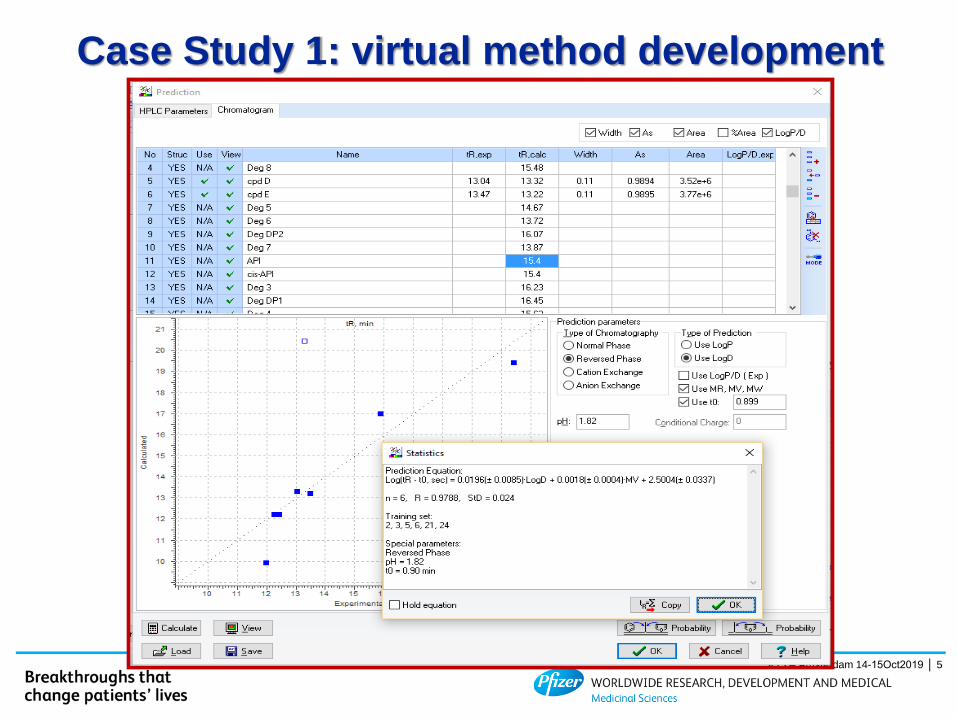
- Generate a virtual chromatogram:
- The retention of all the compounds related to the
synthetic route up to step previous the API were
available.
- Retention data on the most similar compounds it was
possible to predict the retention of the expected
degradation products
- Chromatpgraphy simulation software are becoming
available: LC-simulator (ACD-labs) in prediction mode
SOS – Amsterdam 14-15Oct2019 │ 5
Case Study 1: virtual method development
Structure
PRI 1
PRI 2
PRI 3
API
Structure 1
Structure 2
Structure 3
Structure 4
Structure 5
Structure 6
Structure 7
PRI 4
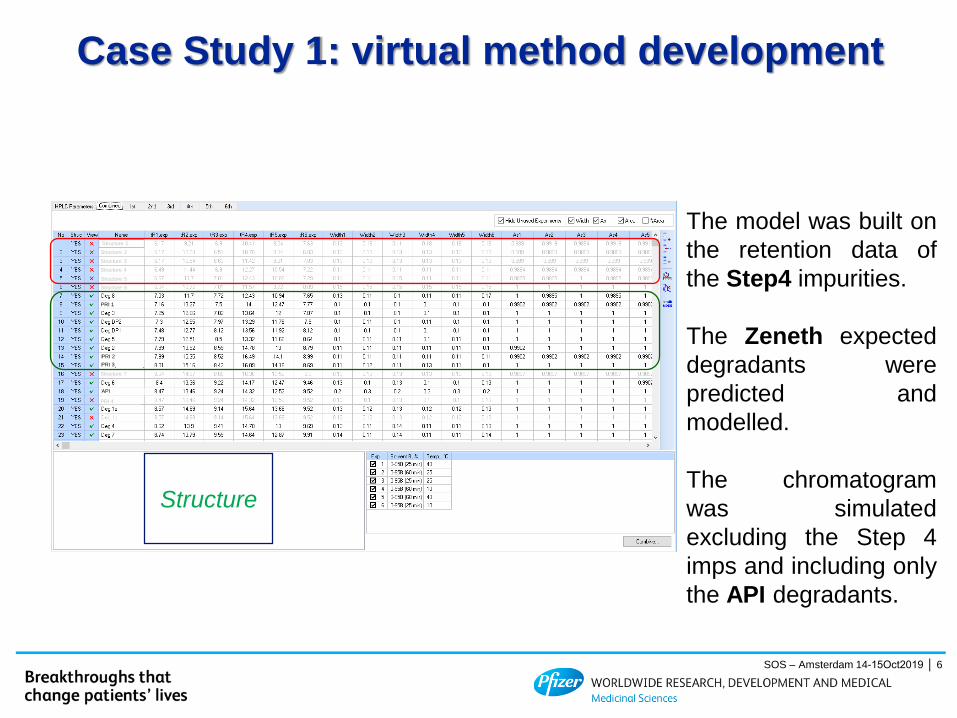
The model was built on
the retention data of
the Step4 impurities.
The Zeneth expected
degradants were
predicted and
modelled.
The chromatogram
was simulated
excluding the Step 4
imps and including only
the API degradants.
Case Study 1: virtual method development
SOS – Amsterdam 14-15Oct2019 │ 6
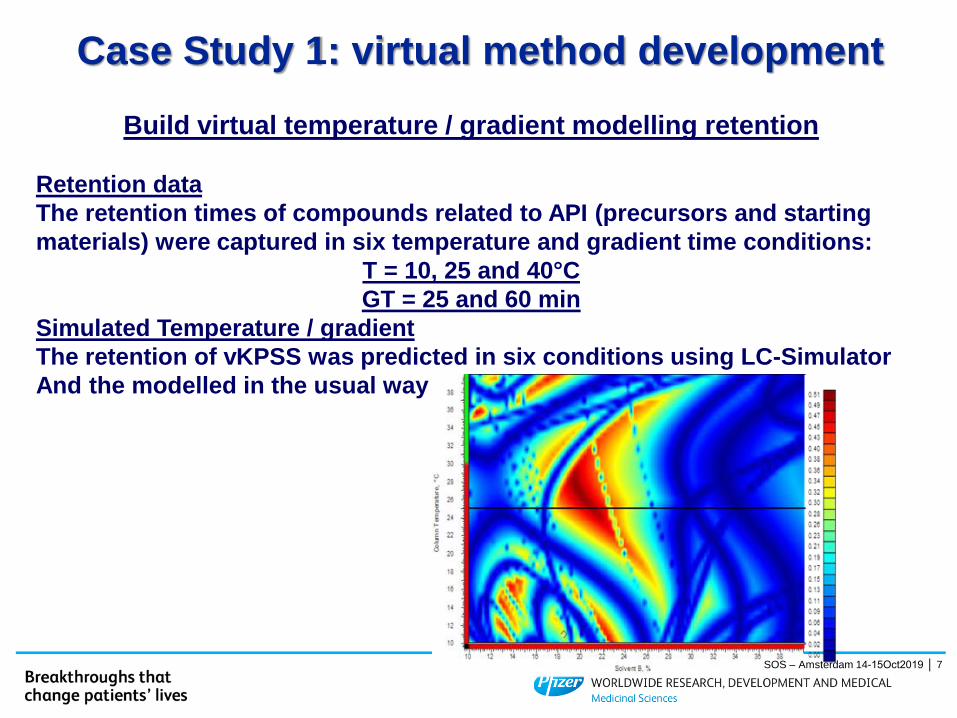
Build virtual temperature / gradient modelling retention
Retention data
The retention times of compounds related to API (precursors and starting
materials) were captured in six temperature and gradient time conditions:
T = 10, 25 and 40°C
GT = 25 and 60 min
Simulated Temperature / gradient
The retention of vKPSS was predicted in six conditions using LC-Simulator
And the modelled in the usual way
Case Study 1: virtual method development
SOS – Amsterdam 14-15Oct2019 │ 7
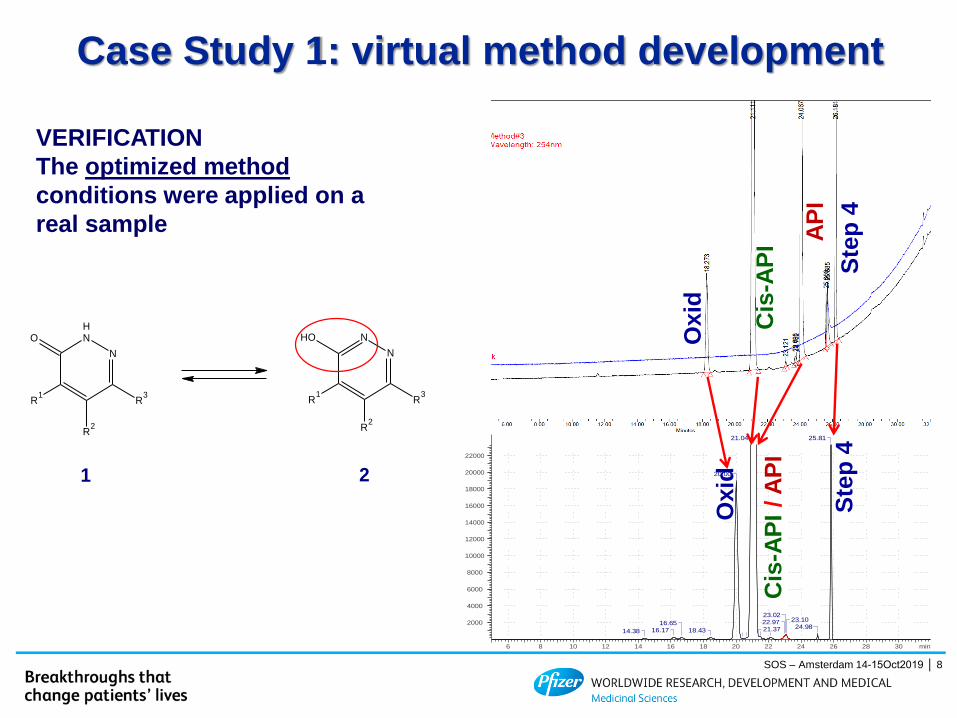
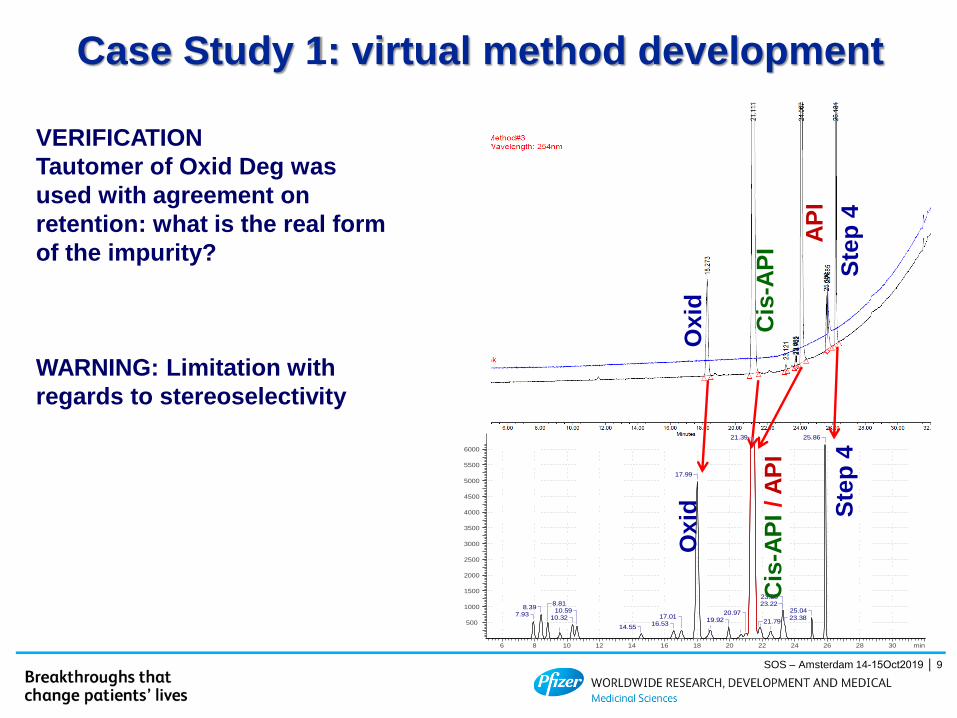
VERIFICATION
The optimized method
conditions were applied on a
real sample
min302826242220181614121086
2000
4000
6000
8000
10000
12000
14000
16000
18000
20000
22000
14.3814.3814.3814.3814.3814.3814.3814.3814.3814.3814.3814.3814.3814.3814.3814.3814.3814.3814.3814.3814.3814.38 16.1716.1716.1716.1716.1716.1716.1716.1716.1716.1716.1716.1716.1716.1716.1716.1716.1716.1716.1716.1716.1716.17
16.6516.6516.6516.6516.6516.6516.6516.6516.6516.6516.6516.6516.6516.6516.6516.6516.6516.6516.6516.6516.6516.6518.4318.4318.4318.4318.4318.4318.4318.4318.4318.4318.4318.4318.4318.4318.4318.4318.4318.4318.4318.4318.4318.43
20.0020.0020.0020.0020.0020.0020.0020.0020.0020.0020.0020.0020.0020.0020.0020.0020.0020.0020.0020.0020.0020.00
21.3721.3721.3721.3721.3721.3721.3721.3721.3721.3721.3721.3721.3721.3721.3721.3721.3721.3721.3721.3721.3721.37
23.0223.0223.0223.0223.0223.0223.0223.0223.0223.0223.0223.0223.0223.0223.0223.0223.0223.0223.0223.0223.0223.02
21.0421.0421.0421.0421.0421.0421.0421.0421.0421.0421.0421.0421.0421.0421.0421.0421.0421.0421.0421.0421.0421.04
23.1023.1023.1023.1023.1023.1023.1023.1023.1023.1023.1023.1023.1023.1023.1023.1023.1023.1023.1023.1023.1023.1022.9722.9722.9722.9722.9722.9722.9722.9722.9722.9722.9722.9722.9722.9722.9722.9722.9722.9722.9722.9722.9722.9724.9824.9824.9824.9824.9824.9824.9824.9824.9824.9824.9824.9824.9824.9824.9824.9824.9824.9824.9824.9824.9824.98
25.8125.8125.8125.8125.8125.8125.8125.8125.8125.8125.8125.8125.8125.8125.8125.8125.8125.8125.8125.8125.8125.81
Oxid
AP
I
Ste
p 4
Oxid
Cis
-AP
I /A
PI
Ste
p 4
Cis
-AP
I
R1
N
NH
O
R2
R3
R1
R3
N
NOH
R2
1 2
Case Study 1: virtual method development
SOS – Amsterdam 14-15Oct2019 │ 8
Oxid
AP
I
Ste
p 4
Oxid S
tep
4
Cis
-AP
I
min302826242220181614121086
500
1000
1500
2000
2500
3000
3500
4000
4500
5000
5500
6000
7.937.937.937.937.937.937.937.937.937.937.937.937.937.937.937.937.937.937.937.937.937.93
8.818.818.818.818.818.818.818.818.818.818.818.818.818.818.818.818.818.818.818.818.818.818.398.398.398.398.398.398.398.398.398.398.398.398.398.398.398.398.398.398.398.398.398.39
10.3210.3210.3210.3210.3210.3210.3210.3210.3210.3210.3210.3210.3210.3210.3210.3210.3210.3210.3210.3210.3210.32
10.5910.5910.5910.5910.5910.5910.5910.5910.5910.5910.5910.5910.5910.5910.5910.5910.5910.5910.5910.5910.5910.59
14.5514.5514.5514.5514.5514.5514.5514.5514.5514.5514.5514.5514.5514.5514.5514.5514.5514.5514.5514.5514.5514.5516.5316.5316.5316.5316.5316.5316.5316.5316.5316.5316.5316.5316.5316.5316.5316.5316.5316.5316.5316.5316.5316.53
17.0117.0117.0117.0117.0117.0117.0117.0117.0117.0117.0117.0117.0117.0117.0117.0117.0117.0117.0117.0117.0117.01
17.9917.9917.9917.9917.9917.9917.9917.9917.9917.9917.9917.9917.9917.9917.9917.9917.9917.9917.9917.9917.9917.99
20.9720.9720.9720.9720.9720.9720.9720.9720.9720.9720.9720.9720.9720.9720.9720.9720.9720.9720.9720.9720.9720.97
23.2223.2223.2223.2223.2223.2223.2223.2223.2223.2223.2223.2223.2223.2223.2223.2223.2223.2223.2223.2223.2223.22
21.7921.7921.7921.7921.7921.7921.7921.7921.7921.7921.7921.7921.7921.7921.7921.7921.7921.7921.7921.7921.7921.7923.3823.3823.3823.3823.3823.3823.3823.3823.3823.3823.3823.3823.3823.3823.3823.3823.3823.3823.3823.3823.3823.38
21.3921.3921.3921.3921.3921.3921.3921.3921.3921.3921.3921.3921.3921.3921.3921.3921.3921.3921.3921.3921.3921.39
23.2523.2523.2523.2523.2523.2523.2523.2523.2523.2523.2523.2523.2523.2523.2523.2523.2523.2523.2523.2523.2523.25
25.0425.0425.0425.0425.0425.0425.0425.0425.0425.0425.0425.0425.0425.0425.0425.0425.0425.0425.0425.0425.0425.04
25.8625.8625.8625.8625.8625.8625.8625.8625.8625.8625.8625.8625.8625.8625.8625.8625.8625.8625.8625.8625.8625.86
19.9219.9219.9219.9219.9219.9219.9219.9219.9219.9219.9219.9219.9219.9219.9219.9219.9219.9219.9219.9219.9219.92
VERIFICATION
Tautomer of Oxid Deg was
used with agreement on
retention: what is the real form
of the impurity?
WARNING: Limitation with
regards to stereoselectivity
Case Study 1: virtual method development
Cis
-AP
I /A
PI
SOS – Amsterdam 14-15Oct2019 │ 9
• Purity and stability methods were required for the analysis of a drug
product in development.
• Minimal knowledge was available and formulations options were still
under evaluation
• A series of samples were analysed with a set of generic
chromatographic conditions (COMET) in order to determine all the
key components
• COMET analysis (Comprehensive Orthogonal Method Evaluation
Technology) consists of a combination of conditions set to maximize the
selectivity space so that all constituents can be detected in at least one
method.
1. Three pH: acidic, neutral and basic
2. Four stationary phases
3. Two organic solvents
Case Study 2: On column degradation
SOS – Amsterdam 14-15Oct2019 │
10
- Question 1: Do we see everything? Did we investigate the
samples with thorough orthogonality?
- Predictive software and chemistry check didn’t anticipate
the possibility of isomers, non ionizable or non
chromophoric impurities, or highly polar or highly
hydrophobic substances or anything not suitable for
reversed phase LC.
Case Study 2: On column degradation
SOS – Amsterdam 14-15Oct2019 │ 11
• With any stationary phase and organic solvent used for method
development screening analyses, the number of peaks differed
depending on the mobile phase pH used. In fact, two different scenarios
were presented:
• At acidic pH (0.1% formic acid, pH = 2.6) one key potential
degradation product was not detected (Scenario 1)
• Only at basic pH (0.1% ammonium hydroxide, pH = 10.8) three high
mw peaks could detected (Scenario 2)
Case Study 2: On column degradation
SOS – Amsterdam 14-15Oct2019 │ 12
5.67
5
5.85
2
6.73
6
7.03
3
7.16
5
7.27
4
7.38
7
9.04
2
AU
0.00
0.05
0.10
0.15
0.20
0.25
0.30
0.35
0.40
0.45
0.50
0.55
0.60
0.65
0.70
0.75
Minutes
5.20 5.40 5.60 5.80 6.00 6.20 6.40 6.60 6.80 7.00 7.20 7.40 7.60 7.80 8.00 8.20 8.40 8.60 8.80 9.00 9.20 9.40 9.60 9.80 10.00
4.1
48
4.9
54
AU
-0.50
-0.40
-0.30
-0.20
-0.10
0.00
0.10
0.20
0.30
0.40
0.50
0.60
0.70
0.80
0.90
1.00
Minutes
0.50 1.00 1.50 2.00 2.50 3.00 3.50 4.00 4.50 5.00 5.50 6.00 6.50 7.00 7.50 8.00 8.50 9.00 9.50 10.00 10.50 11.00 11.50 12.00 12.50 13.00 13.50 14.00 14.50 15.00 15.50
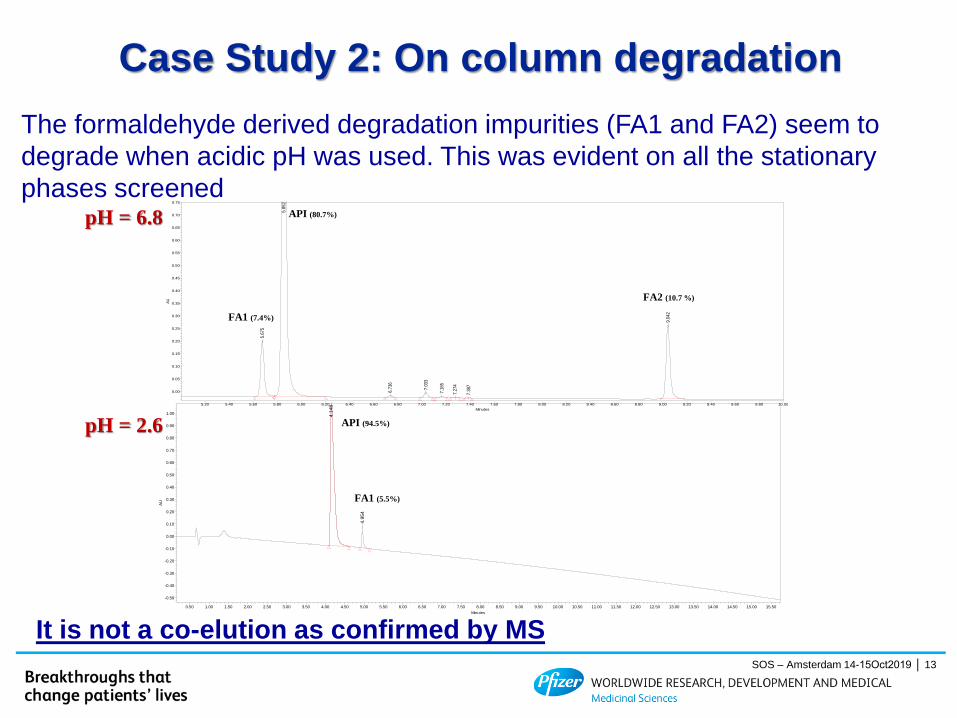
API (80.7%)
FA1 (7.4%)
FA2 (10.7 %)
API (94.5%)
FA1 (5.5%)
pH = 6.8
pH = 2.6
The formaldehyde derived degradation impurities (FA1 and FA2) seem to
degrade when acidic pH was used. This was evident on all the stationary
phases screened
It is not a co-elution as confirmed by MS
Case Study 2: On column degradation
SOS – Amsterdam 14-15Oct2019 │ 13
- Question 2: Do we see too much? Are all the observed
peaks real impurities to be determined or is any of these
artificially generated during the chromatography?
- Co-elution was excluded by mass spectrometry. Analyte could be
reacting or degrade with stationary or mobile phase.
SOS – Amsterdam 14-15Oct2019 │ 14
Case Study 2: On column degradation
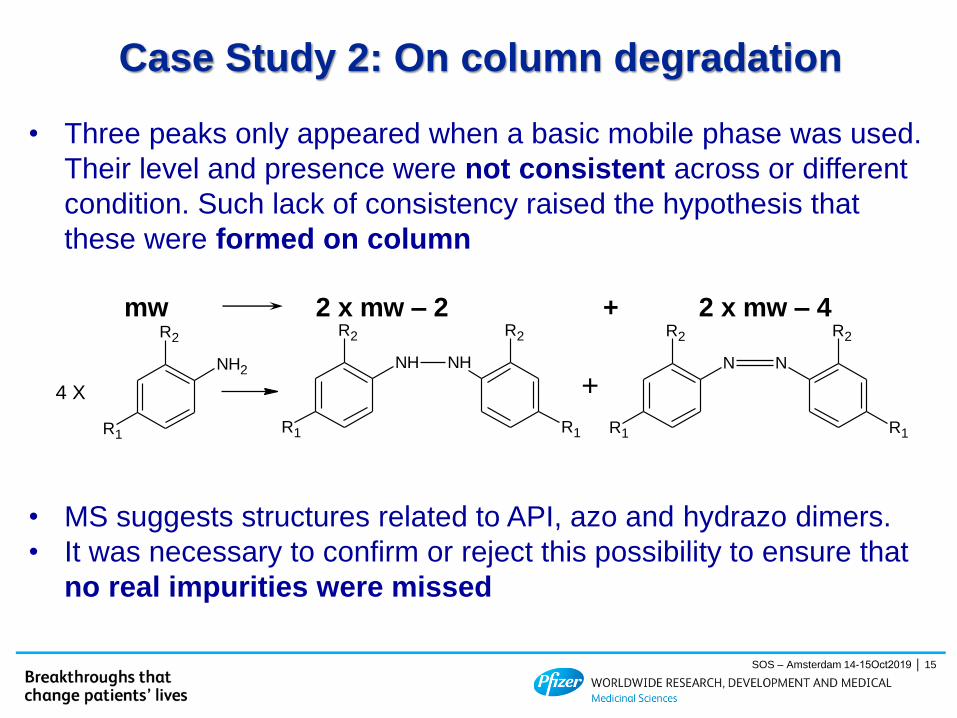
• Three peaks only appeared when a basic mobile phase was used.
Their level and presence were not consistent across or different
condition. Such lack of consistency raised the hypothesis that
these were formed on column
mw 2 x mw – 2 + 2 x mw – 4
• MS suggests structures related to API, azo and hydrazo dimers.
• It was necessary to confirm or reject this possibility to ensure that
no real impurities were missed
R1
NH
R2
R1
NH
R2
R1
N
R2
R1
N
R2
+
R1
NH2
R2
4 X
SOS – Amsterdam 14-15Oct2019 │ 15
Case Study 2: On column degradation
Correct assignment of the observed peaks is of crucial
importance:
• Conditions that can generate artefacts could make the method
unusable.
• Conditions that can degrade critical impurity could compromise the
stability program and eventually compromise the quality and safety of
the final product.
• It was necessary to establish which peaks were artificially
generated on column and differentiate them from the sensitive
ones requiring accurate and precise quantification
SOS – Amsterdam 14-15Oct2019 │ 16
Case Study 2: On column degradation
• Two dimensional LC combines two different separation modes or
methods in the first and second dimension, with selectivity as
orthogonal as possible:
• Heart-cut: is suitable for the re-analysis of defined number of peaks in
order to separate peaks otherwise co-eluting in one dimension taking
advantage of the orthogonal selectivity. Typical setups are:
• acidic - basic reversed phase (RP)
• RP-HILIC
• Normal phase (NP) – RP
• SFC – RP
• NP/RP – chiral…
• Comprehensive mode: each section of the chromatogram in the first
dimension is scrutinized in the second dimension: it increases the peak
capacity several times and becomes and it is best option for the analysis of
very complex matrix (e.g. proteomics, biomarkers, natural extracts etc…)
Case Study 2: On column degradation
SOS – Amsterdam 14-15Oct2019 │ 17
• The first dimension was set up with basic mobile phase reproduce
/ separate the suspect peaks.
• Experiment 2: the second dimension was set up with using same
stationary phase (BEH C18), with same, basic, mobile fractions of
main band were re-analysed in order to regenerate the artefacts.
2D-LC settings:
Columns: on both first and second dimension a BEH C18 was used, 100
mm x 2.1 mm, 1.7 μm ps. A new column was installed in the second
dimension.
Mobile phase:
1D: 0.1 %NH4OH, pH = 10.8
2D: Experiment2: 0.1 %NH4OH, pH = 10.8.
SOS – Amsterdam 14-15Oct2019 │ 18
Case Study 2: On column degradation
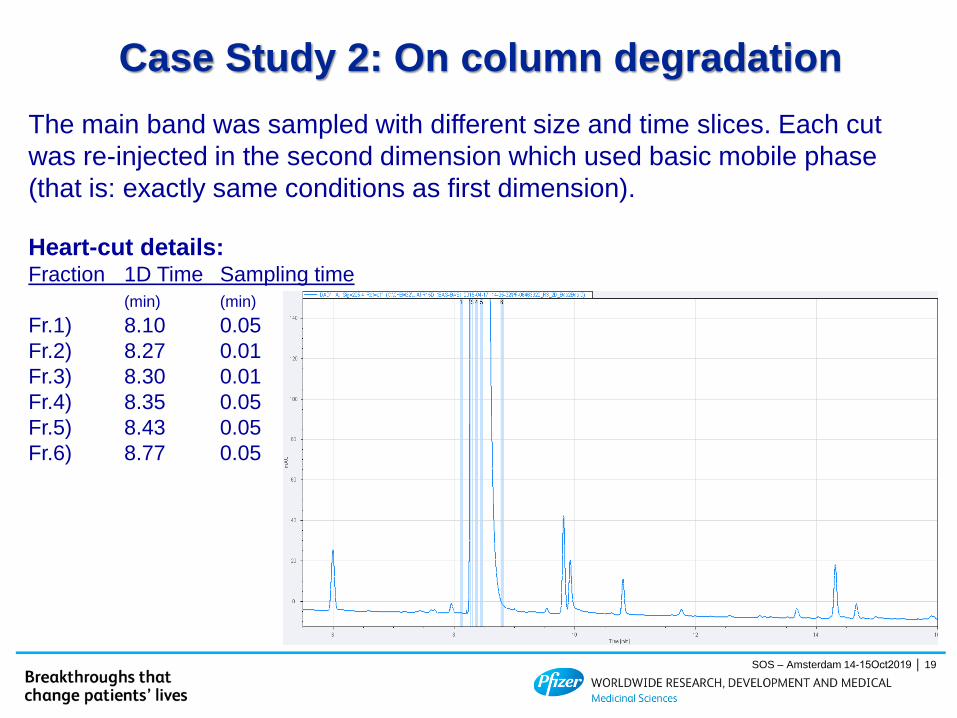
The main band was sampled with different size and time slices. Each cut
was re-injected in the second dimension which used basic mobile phase
(that is: exactly same conditions as first dimension).
Heart-cut details:Fraction 1D Time Sampling time
(min) (min)
Fr.1) 8.10 0.05
Fr.2) 8.27 0.01
Fr.3) 8.30 0.01
Fr.4) 8.35 0.05
Fr.5) 8.43 0.05
Fr.6) 8.77 0.05
SOS – Amsterdam 14-15Oct2019 │ 19
Case Study 2: On column degradation
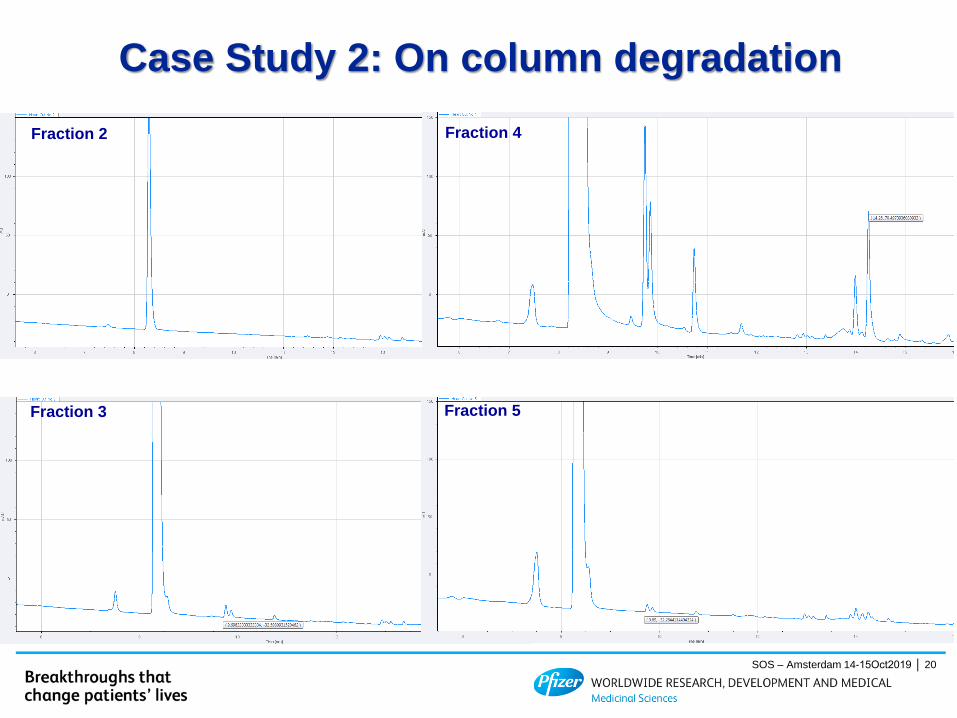
Fraction 2
Fraction 3
Fraction 4
Fraction 5
SOS – Amsterdam 14-15Oct2019 │ 20
Case Study 2: On column degradation
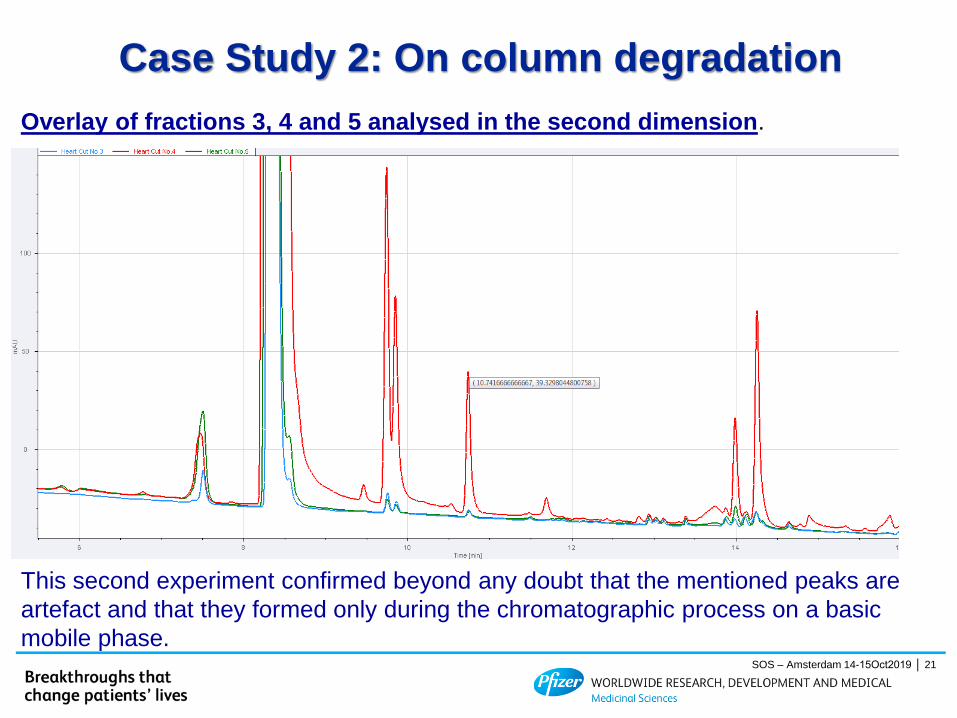
This second experiment confirmed beyond any doubt that the mentioned peaks are
artefact and that they formed only during the chromatographic process on a basic
mobile phase.
Overlay of fractions 3, 4 and 5 analysed in the second dimension.
SOS – Amsterdam 14-15Oct2019 │ 21
Case Study 2: On column degradation
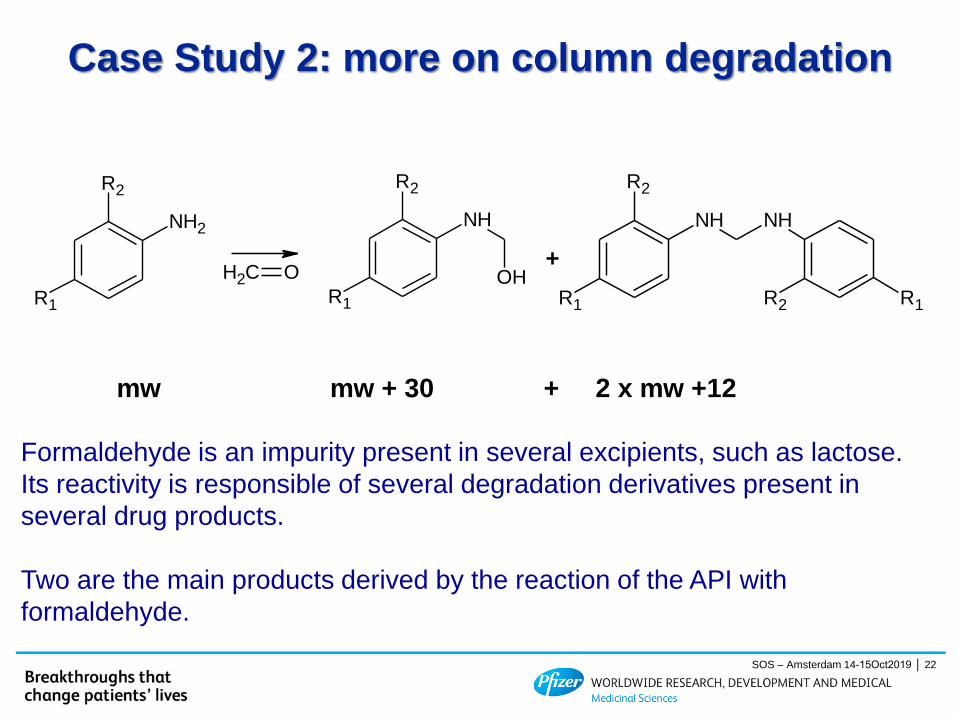
mw mw + 30 + 2 x mw +12
Formaldehyde is an impurity present in several excipients, such as lactose.
Its reactivity is responsible of several degradation derivatives present in
several drug products.
Two are the main products derived by the reaction of the API with
formaldehyde.
R1
NH2
R2
R1
R2
NH
OHCH2 O
R1
R2
NH
R1R2
NH
+
Case Study 2: more on column degradation
SOS – Amsterdam 14-15Oct2019 │ 22

• The neutral pH offered the highest robustness and separation for
most of the KPSS and the method development was continued
using neutral.
• Impurities derived from degradation in excess of formaldehyde were
degrading when acidic pH mobile phase was used.
• The separation between the main band and the one of the main
formaldehyde derived impurities was more than baseline nevertheless
the peculiar shape led to suspect that an on column degradation was
occurring.
• This was investigated and confirmed by use of 2D-LC.
Case Study 2: more on column degradation
SOS – Amsterdam 14-15Oct2019 │ 23
min12 12.25 12.5 12.75 13 13.25 13.5 13.75
mAU
-9
-8
-7
-6
-5
-4
DAD1 A, Sig=225,4 Ref=off (brunec01\P...de degradants\CB_06May15_TM100005211_1D 2015-05-06 11-56-39\FA.D)
Are
a: 5
60.107
13.1
76
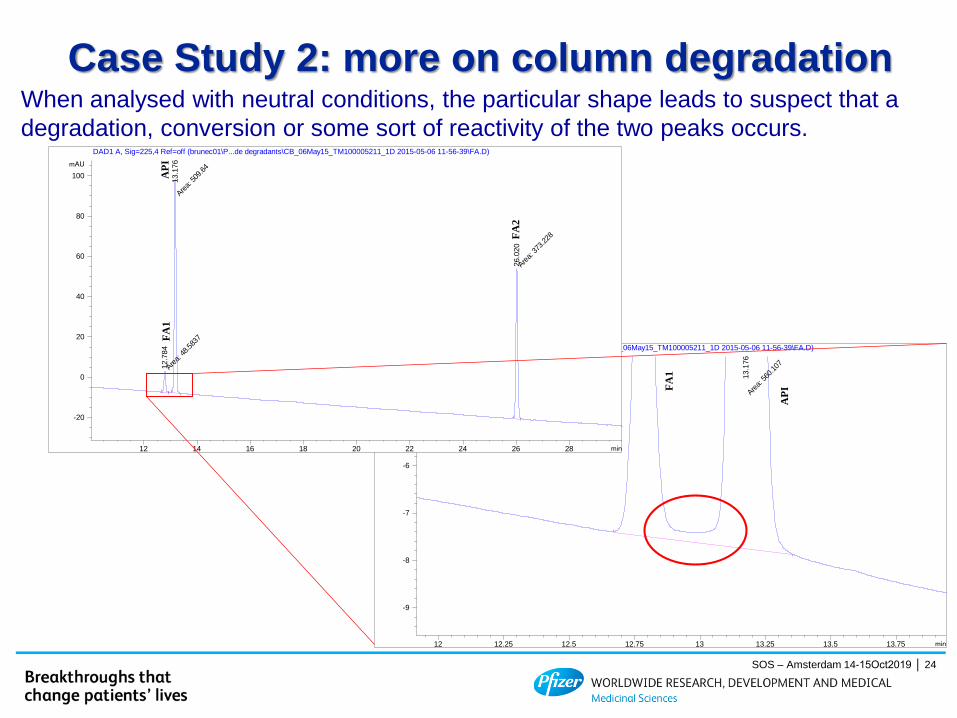
When analysed with neutral conditions, the particular shape leads to suspect that a
degradation, conversion or some sort of reactivity of the two peaks occurs.
min12 14 16 18 20 22 24 26 28
mAU
-20
0
20
40
60
80
100
DAD1 A, Sig=225,4 Ref=off (brunec01\P...de degradants\CB_06May15_TM100005211_1D 2015-05-06 11-56-39\FA.D)
Are
a: 4
8.58
37
12.7
84
Are
a: 5
09.64
13.1
76
Are
a: 3
73.228
26.0
20
AP
I F
A1
FA
2
AP
I FA
1
Case Study 2: more on column degradation
SOS – Amsterdam 14-15Oct2019 │ 24
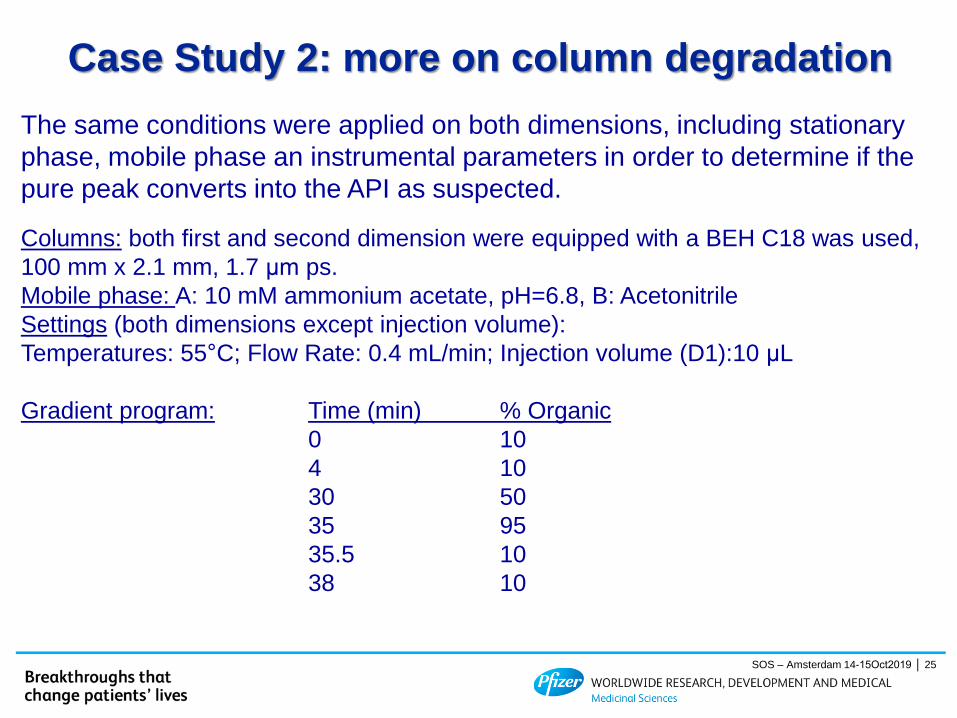
The same conditions were applied on both dimensions, including stationary
phase, mobile phase an instrumental parameters in order to determine if the
pure peak converts into the API as suspected.
Columns: both first and second dimension were equipped with a BEH C18 was used,
100 mm x 2.1 mm, 1.7 μm ps.
Mobile phase: A: 10 mM ammonium acetate, pH=6.8, B: Acetonitrile
Settings (both dimensions except injection volume):
Temperatures: 55°C; Flow Rate: 0.4 mL/min; Injection volume (D1):10 μL
Gradient program: Time (min) % Organic
0 10
4 10
30 50
35 95
35.5 10
38 10
Case Study 2: more on column degradation
SOS – Amsterdam 14-15Oct2019 │ 25
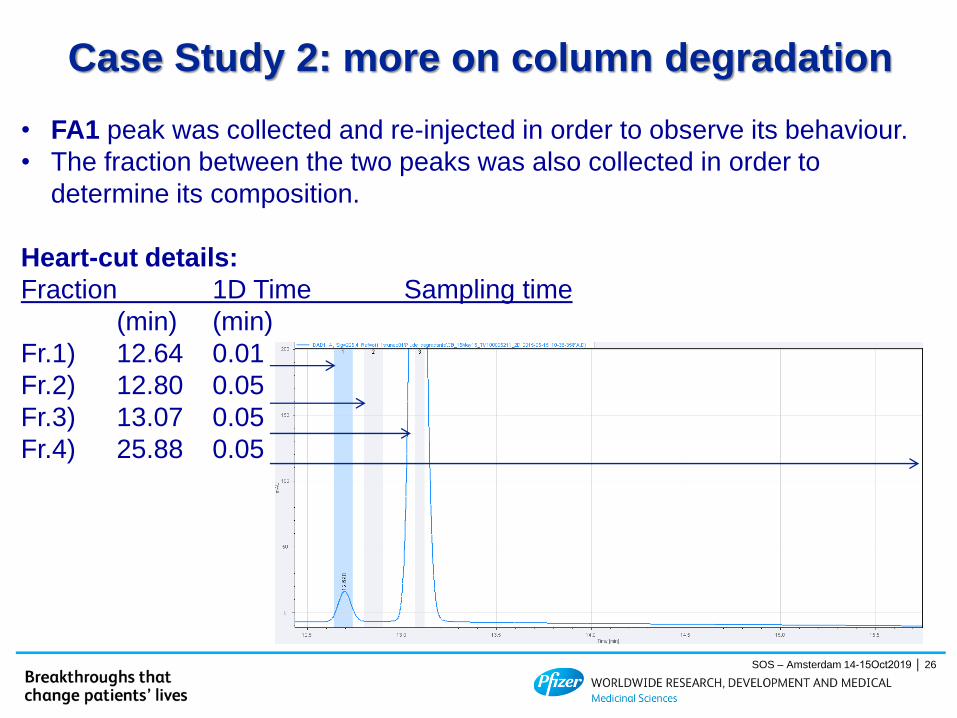
• FA1 peak was collected and re-injected in order to observe its behaviour.
• The fraction between the two peaks was also collected in order to
determine its composition.
Heart-cut details:
Fraction 1D Time Sampling time
(min) (min)
Fr.1) 12.64 0.01
Fr.2) 12.80 0.05
Fr.3) 13.07 0.05
Fr.4) 25.88 0.05
Case Study 2: more on column degradation
SOS – Amsterdam 14-15Oct2019 │ 26
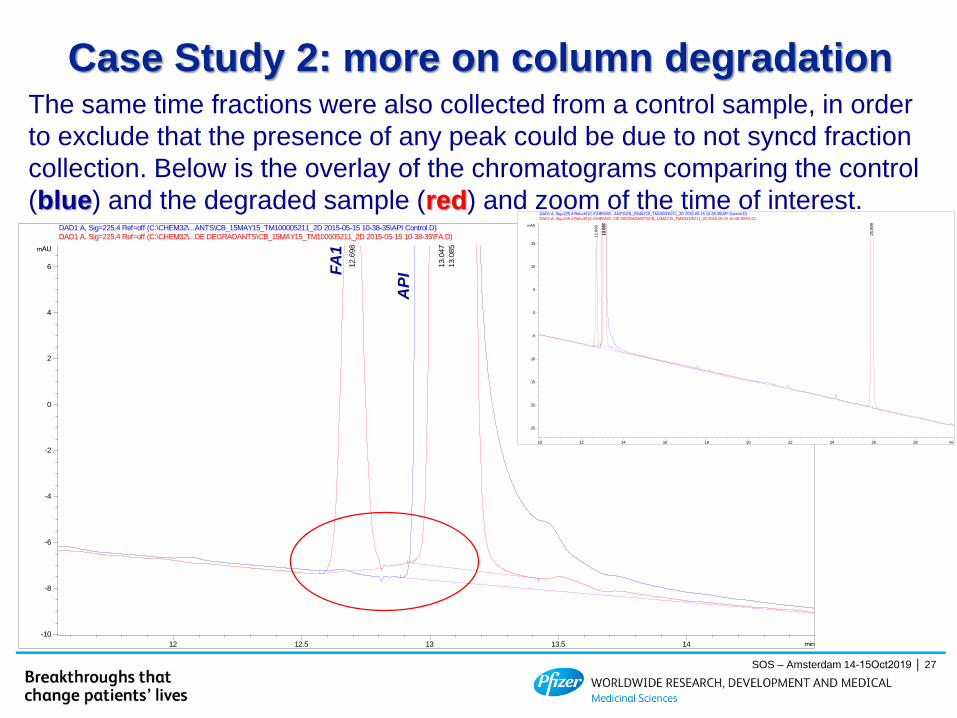
The same time fractions were also collected from a control sample, in order
to exclude that the presence of any peak could be due to not syncd fraction
collection. Below is the overlay of the chromatograms comparing the control
(blue) and the degraded sample (red) and zoom of the time of interest.
min12 12.5 13 13.5 14
mAU
-10
-8
-6
-4
-2
0
2
4
6
DAD1 A, Sig=225,4 Ref=off (C:\CHEM32\...ANTS\CB_15MAY15_TM100005211_2D 2015-05-15 10-38-35\API Control.D)
13.0
47
DAD1 A, Sig=225,4 Ref=off (C:\CHEM32\...DE DEGRADANTS\CB_15MAY15_TM100005211_2D 2015-05-15 10-38-35\FA.D)
12.6
98
13.0
85
min10 12 14 16 18 20 22 24 26 28
mAU
-25
-20
-15
-10
-5
0
5
10
15
DAD1 A, Sig=225,4 Ref=off (C:\CHEM32\...ANTS\CB_15MAY15_TM100005211_2D 2015-05-15 10-38-35\API Control.D)
13.0
47
DAD1 A, Sig=225,4 Ref=off (C:\CHEM32\...DE DEGRADANTS\CB_15MAY15_TM100005211_2D 2015-05-15 10-38-35\FA.D)
12.6
98
13.0
85
25.8
99
AP
IFA
1
Case Study 2: more on column degradation
SOS – Amsterdam 14-15Oct2019 │ 27
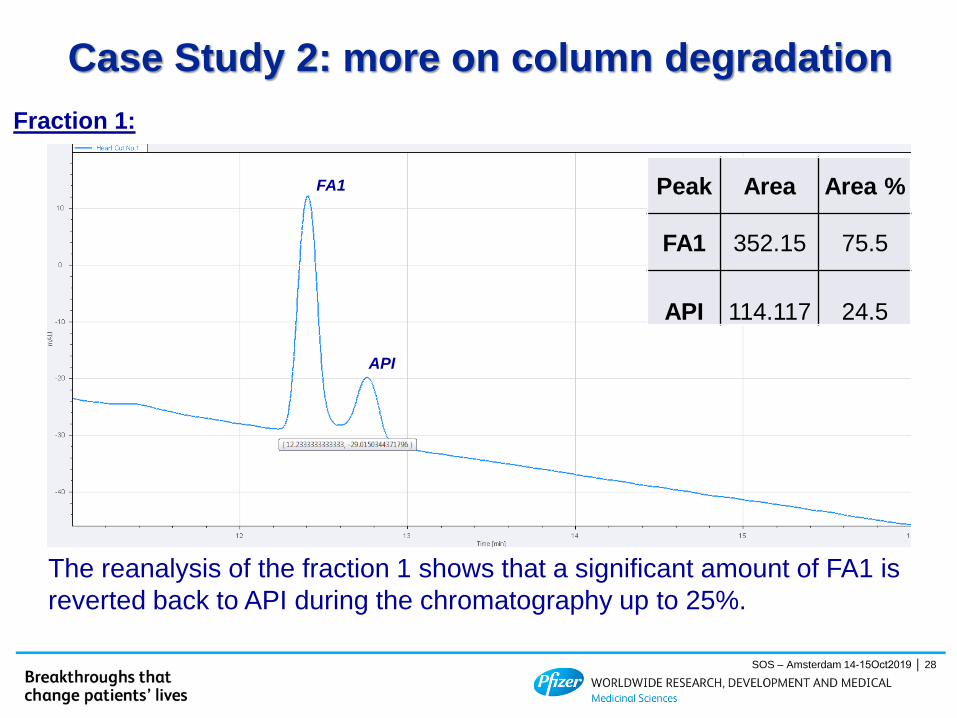
Fraction 1:
The reanalysis of the fraction 1 shows that a significant amount of FA1 is
reverted back to API during the chromatography up to 25%.
Peak Area Area %
FA1 352.15 75.5
API 114.117 24.5
API
FA1
Case Study 2: more on column degradation
SOS – Amsterdam 14-15Oct2019 │ 28
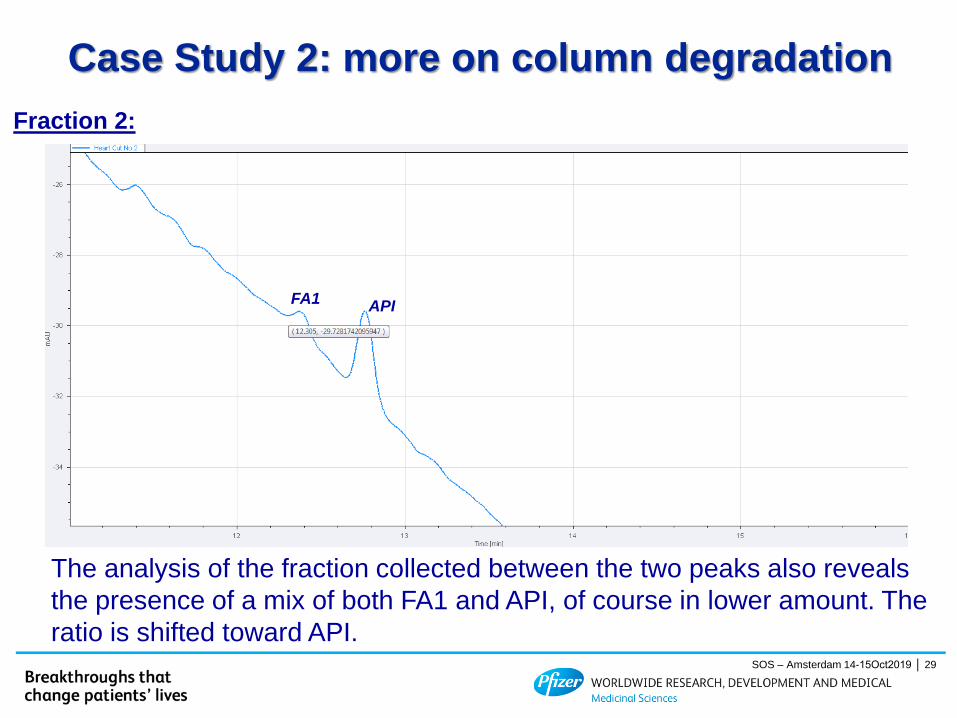
The analysis of the fraction collected between the two peaks also reveals
the presence of a mix of both FA1 and API, of course in lower amount. The
ratio is shifted toward API.
Fraction 2:
APIFA1
Case Study 2: more on column degradation
SOS – Amsterdam 14-15Oct2019 │ 29
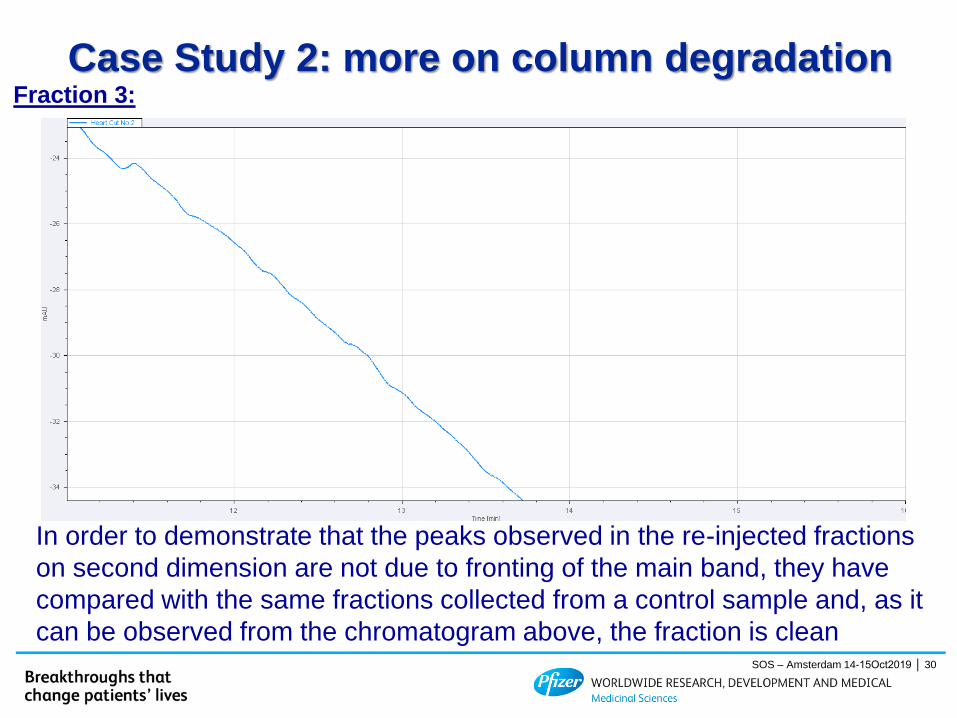
In order to demonstrate that the peaks observed in the re-injected fractions
on second dimension are not due to fronting of the main band, they have
compared with the same fractions collected from a control sample and, as it
can be observed from the chromatogram above, the fraction is clean
Fraction 3:
Case Study 2: more on column degradation
SOS – Amsterdam 14-15Oct2019 │ 30
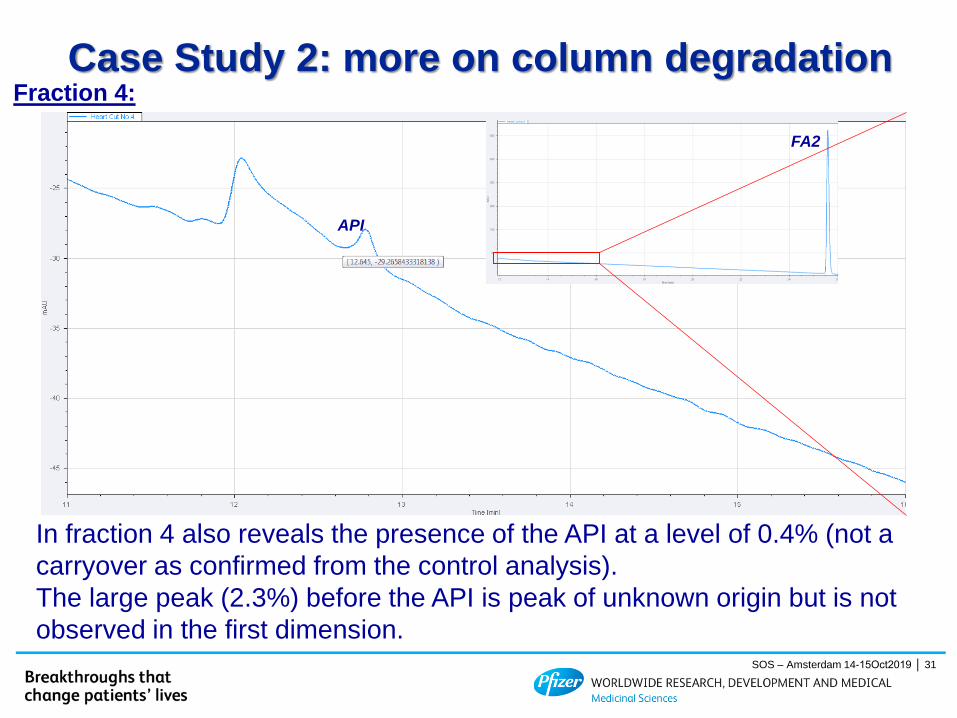
In fraction 4 also reveals the presence of the API at a level of 0.4% (not a
carryover as confirmed from the control analysis).
The large peak (2.3%) before the API is peak of unknown origin but is not
observed in the first dimension.
Fraction 4:
FA2
API
Case Study 2: more on column degradation
SOS – Amsterdam 14-15Oct2019 │ 31
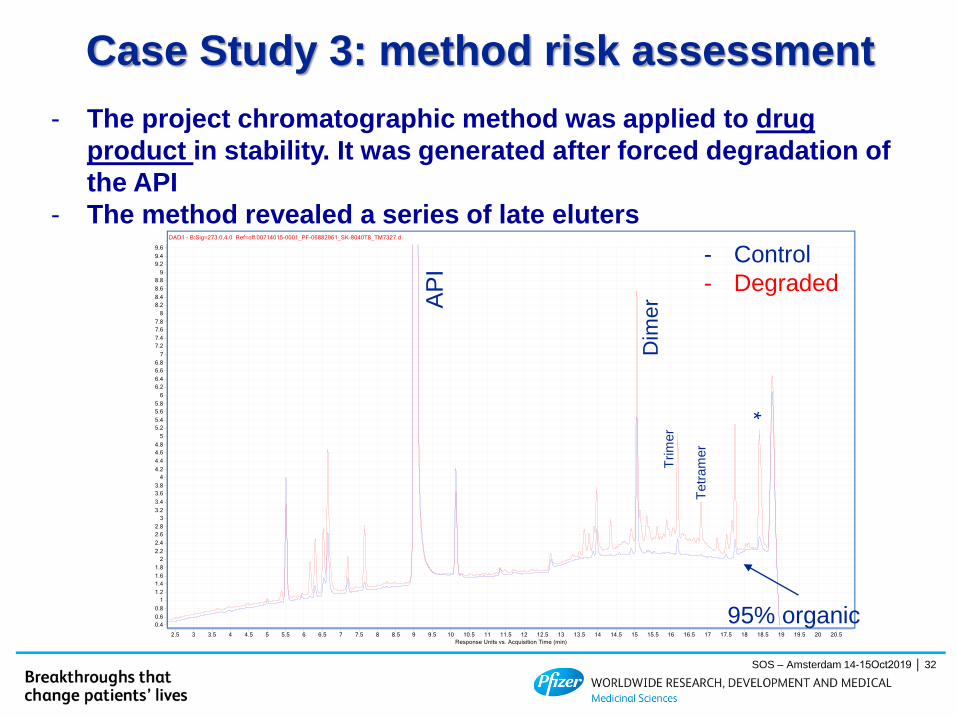
Case Study 3: method risk assessment
- The project chromatographic method was applied to drug
product in stability. It was generated after forced degradation of
the API
- The method revealed a series of late eluters
AP
I
Dim
er
Trim
er
Tetr
am
er
95% organic
- Control
- Degraded
*
SOS – Amsterdam 14-15Oct2019 │ 32
Case Study 3: method risk assessment
- The presence of very apolar components raises the question of
the suitability of the current chromatographic method: the
elution at high organic has to be extended.
- A second question regards the sample preparation: it needs to
ensure that all possible apolar degradants are in fact extracted
- In addition to the known dimer, the presence of a trimer and
tetramer was revealed (Mass Spec).
SOS – Amsterdam 14-15Oct2019 │ 33
Case Study 3: method risk assessment
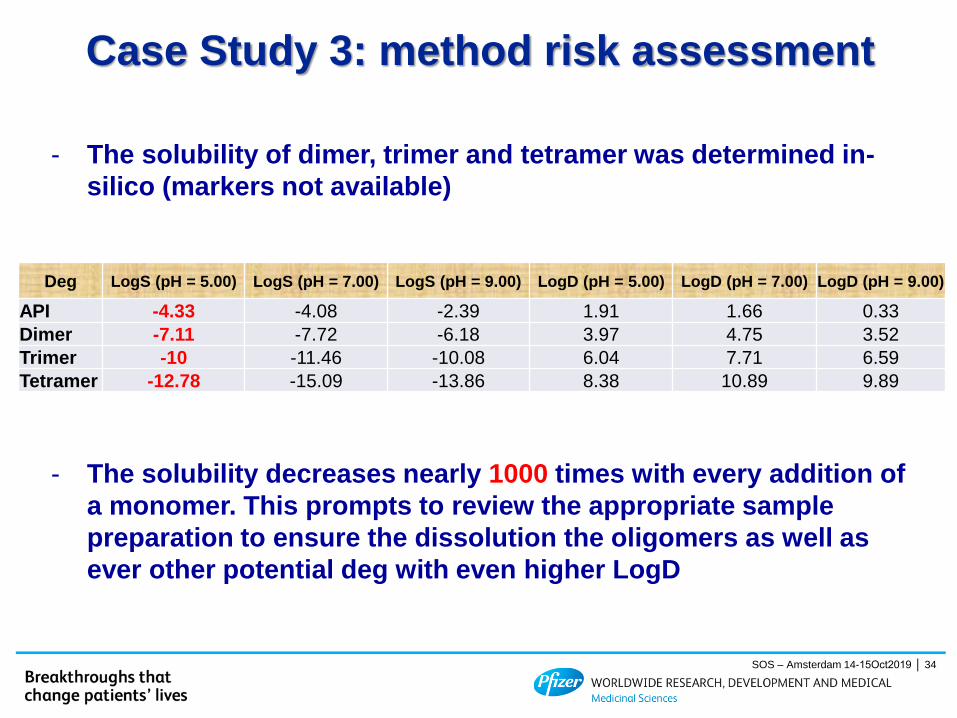
- The solubility of dimer, trimer and tetramer was determined in-
silico (markers not available)
- The solubility decreases nearly 1000 times with every addition of
a monomer. This prompts to review the appropriate sample
preparation to ensure the dissolution the oligomers as well as
ever other potential deg with even higher LogD
Deg LogS (pH = 5.00) LogS (pH = 7.00) LogS (pH = 9.00) LogD (pH = 5.00) LogD (pH = 7.00) LogD (pH = 9.00)
API -4.33 -4.08 -2.39 1.91 1.66 0.33
Dimer -7.11 -7.72 -6.18 3.97 4.75 3.52
Trimer -10 -11.46 -10.08 6.04 7.71 6.59
Tetramer -12.78 -15.09 -13.86 8.38 10.89 9.89
SOS – Amsterdam 14-15Oct2019 │ 34
Case Study 3: method risk assessment
- Although the dimer is the main degradant, and therefore the first
to breach the spec, although newer formulations will likely have
higher loading (expecting therefore lower overall degradation),
we need to ensure the accurate recovery of all degs through
appropriate sample recovery
SOS – Amsterdam 14-15Oct2019 │ 35
- The development of a stability indicating method is one of the highest
priorities in the activities of pharmaceutical laboratories during drug
development and is a re-iterative
- The availability of key degradation components is critical, however the
accurate determination of the degradation products under different stress
conditions is critical and heavily rely on a suitable analytical method.
- The combination of degradation profile prediction with chromatographic
structure-retention modelling and physicochemical properties computation
facilitate method development.
- On-column reactivity can compromise the suitability of a chromatographic
method
Conclusions
SOS – Amsterdam 14-15Oct2019 │ 36