new york state - governor's traffic safety …...new york state ffy 2020 highway safety...
TRANSCRIPT

NEW YORK STATE
FFY 2020 HIGHWAY SAFETY STRATEGIC PLAN
New York State Governor’s Traffic Safety Committee
Andrew M. Cuomo, Governor
Mark J. F. Schroeder, Commissioner
New York State Department of Motor Vehicles Governor’s Traffic Safety Committee
July 1, 2019

NEW YORK STATE HIGHWAY SAFETY STRATEGIC PLAN
FFY 2020
TABLE OF CONTENTS
Page
Highway Safety Program Planning Process ................................................................................................... 1 Evidence-Based Traffic Safety Enforcement Program .................................................................................. 7 Performance Report ..................................................................................................................................... 9 Performance Measures and Targets ................................................................................................ 9 Statewide Performance Measures ................................................................................................ 11 Status of New York’s Highway Safety Program ............................................................................. 13 Performance Plan ........................................................................................................................................ 15 Highway Safety Plan Program Areas Impaired Driving ............................................................................................................................ 17 Police Traffic Services..................................................................................................................... 31 Motorcycle Safety .......................................................................................................................... 43 Non-Motorized (Pedestrians & Bicyclists) ..................................................................................... 55 Occupant Protection ...................................................................................................................... 65 Traffic Records ............................................................................................................................... 83 Community Traffic Safety Programs .............................................................................................. 99 Planning & Administration ........................................................................................................... 109

2020 Highway Safety Strategic Plan Highway Safety Planning Process…Page 1
New York State FFY 2020 Highway Safety Strategic Plan
HIGHWAY SAFETY PLANNING PROCESS Introduction The latest federal transportation authorization legislation Fixing America’s Surface Transportation (FAST) Act, was enacted on December 4, 2015. The FAST Act, which provides a stable stream of funding for state highway safety programs through FFY 2020, includes the Section 402 State and Community Highway Safety grant program and the Section 405 National Priority Safety Program. The Section 405 program consists of a number of incentive grant programs. New York State meets the eligibility requirements to receive funding in the following areas: Occupant Protection, Traffic Records, Impaired Driving, Motorcycle Safety, Alcohol-Ignition Interlock and Non-motorized Safety. Under the FAST Act, a single application for funding is required and must be submitted by July 1. In preparing the FFY 2020 Highway Safety Strategic Plan (HSSP), the Governor’s Traffic Safety Committee (GTSC) continued to use a data-driven approach in identifying problems and setting priorities for the state’s highway safety program. New York’s performance-based planning process is inclusive and takes into account issues and strategies identified by the GTSC member agencies, other state and local agencies, enforcement agencies and not-for-profit organizations that have submitted applications for funding. The University at Albany’s Institute for Traffic Safety Management and Research (ITSMR) provides analytical and technical support for the planning process and works closely with GTSC on the preparation of the HSSP. Data Sources FARS continues to be the official source of data for the core outcome fatality measures. New York’s Accident Information System (AIS) is the source for all injury crash data in the HSSP, including the serious injuries core outcome measure. Much of the AIS data used in the HSSP were accessed through the online Traffic Safety Statistical Repository (TSSR). The AIS is also the source for the performance measures for drugged driving and distracted driving. At the time the FFY 2020 HSSP was prepared, 2017 FARS Annual Report File (ARF) data and 2017 AIS data were the most recent complete data files available. The source for the core behavioral measure, the observed seat belt use rate, is New York’s annual observation survey conducted in June; the rate from the 2018 survey was available for inclusion in the FFY 2020 HSSP. The ticket data included in the HSSP were extracted from two sources: New York’s Traffic Safety Law Enforcement and Disposition (TSLED) and Administrative Adjudication (AA) systems. Final ticket data for 2017 were available from each of these systems, which together cover all of New York State. Data on impaired driving arrests in New York City were received directly from the New York City Police Department; TSLED was the data source for impaired driving arrests that occurred in the rest of the state. Data from New York’s Driver’s License and Vehicle Registration files and population data from the U.S. Census Bureau were also used in the analyses conducted as part of the problem identification process for various program areas in the FFY 2020 HSSP. A final source of data is the survey of drivers conducted each year at Department of Motor Vehicles offices. These surveys are described below.
2020 Highway Safety Strategic Plan Highway Safety Planning Process…Page 2
New York State Driver Behavior and Attitudinal Surveys In addition to the outcome and behavioral measures discussed above, NHTSA encourages states to conduct annual surveys to track driver-reported behaviors, attitudes and perceptions related to major traffic safety issues. Since 2010, New York has conducted annual surveys at five NYS Department of Motor Vehicles offices. The selected offices provide representation from the three major areas of the state. Three of the DMV offices are in the Upstate region: Albany (Albany County), Syracuse (Onondaga County), and Yonkers (Westchester County); one is in New York City (Brooklyn) and one is on Long Island (Medford, Suffolk County). In addition to questions on seat belt use, speeding and alcohol impaired driving, the survey instrument has been modified over the years to include questions on new topics of interest. In order to collect information on the important topic of distracted driving, questions on cell phone use and texting while driving were included beginning with the 2012 survey and a question on drugged driving was added to the survey beginning in 2016. Three more questions on drug use (primarily cannabis) and driving were added to the survey in 2019. Information is also collected on the age, gender and county of residence of the survey participants. A minimum of 300 surveys are conducted at each of the five DMV offices. The results from these annual surveys are reported in the Annual Report submitted to NHTSA at the end of the fiscal year. Data related to driver opinions, perceptions and reported behaviors collected in these surveys are also used in preparing the annual HSSP. Problem Identification Process At GTSC’s request, ITSMR was responsible for conducting the problem identification process used by New York in developing the state’s FFY 2020 data-driven HSSP. The first step in the process was to conduct analyses on data extracted from the sources that have been described. The initial analyses were conducted using the most recent five years of FARS data (2013-2017) to determine the trend in each of the core performance measures related to fatalities. The trend in the number of serious injuries suffered in crashes was analyzed using 2013-2017 data from New York’s AIS. For the core behavioral measure, the results from the five most recent observation surveys (2014-2018) were analyzed to determine the trend in the state’s seat belt use rate. A five-year moving average was calculated for each of these core measures. The trend analyses and status of the following core performance measures are discussed in the Statewide Highway Safety Program section: Fatalities, Fatalities/100M VMT, Rural Fatalities/VMT, Urban Fatalities/VMT and Serious Injuries. The remaining core measures are discussed under the appropriate program area sections. Additional performance measures are established in some program areas. For example, bicyclist and pedestrian injuries are used to assess performance for the Non-motorized (Pedestrians and Bicyclists) Safety Program. The next step in the problem identification process was to conduct additional data analyses to determine the characteristics and factors contributing to the crashes, fatalities and injuries related to each of the program areas addressed in the HSSP. The AIS crash data accessed through the online TSSR provided extensive data for these analyses including who was involved in the crashes, where and when they were occurring and the contributing factors in the crashes. In addition to looking at the trends over time, the analysis strategy was to identify which groups, locations and contributing factors were overrepresented through comparisons with licensed drivers, registrations or population figures and rates, as appropriate. The key results of these analyses are presented and discussed in the problem identification section under each program area; these data were also the basis for the selection of strategies that will enable the state to make progress toward its performance targets.

2020 Highway Safety Strategic Plan Highway Safety Planning Process…Page 3
Process for Setting Performance Targets Performance targets were set for each of the core performance measures and for the additional measures selected by New York for inclusion in the FFY 2020 HSSP. New York’s methodology for setting its FFY 2020 targets used a two-step process. The first step in the process involved a linear trend model. Adhering to the method recommended by the FHWA and used by the NYS DOT in setting its targets, linear trend analysis was conducted using the FORECAST function in Excel. In the model, the 5-year moving average was used as the data point for each year included in the linear trend analysis. The second step in the process involved discussing the targets estimated by this forecasting method with the state’s key stakeholders. Based on their experience and knowledge of current traffic safety-related activities and programs and those that will be conducted over the next few years, the key stakeholders adjusted each of the forecasted targets, where warranted, based on what they thought was reasonable. Selection of Strategies The objective of the strategy selection process is to identify evidence-based countermeasures that are best suited to address the issues identified in the data-driven problem identification process and collectively will lead to improvements in highway safety and the achievement of the performance targets. Traditionally, the major source for the identification of evidence-based strategies has been the publication Countermeasures That Work: A Highway Safety Countermeasure Guide for State Highway Safety Offices. Within each program area, New York recognizes that a comprehensive approach is the most effective way to address the issues that have been identified. In selecting specific strategies, New York assesses the contribution each will make to this comprehensive approach. Funding is allocated to planned activities that will support the strategies to address the problems identified and achieve the performance targets set for the program area. Participants in the Process New York’s performance-based planning process is inclusive and takes into account issues and strategies identified by the GTSC member agencies, other state and local agencies, enforcement agencies and not-for-profit organizations that have submitted applications for funding. GTSC conducts outreach at meetings, conferences and workshops throughout the year to gain input from the traffic safety community on emerging issues and new countermeasures that should be included in the HSSP. The annual GTSC meeting, convened by the GTSC Chair, is also used as an opportunity to review priorities and the status of initiatives undertaken by the GTSC member agencies. At the annual meeting, representatives from each agency report on both ongoing and new traffic safety-related programs implemented by their agencies and through partnerships with other departments. Where appropriate, the information provided by the member agencies on current and proposed efforts to improve highway safety in the state is incorporated into the HSSP. The planning process also provides several opportunities to discuss highway safety priorities with traffic safety partners at the local level. Local grantees are able to offer input for the planning process during monitoring visits and through other forms of contact with their designated GTSC representatives. In addition, GTSC’s program representatives frequently take part in County Traffic Safety Board meetings to discuss local issues and assist with grant planning and management. GTSC’s management, fiscal and program staffs also solicit ideas for the HSSP from several organizations representing local programs that work closely with GTSC. These organizations include the NYS Association of Traffic Safety Boards, NYS STOP-DWI Association, NYS Association of Chiefs of Police, NYS Sheriffs’ Association and the Association of NYS Metropolitan Planning Organizations.

2020 Highway Safety Strategic Plan Highway Safety Planning Process…Page 4
Methods for Project Selection Strategies for Programming Funds GTSC’s strategies for programming the federal funds received by New York are guided by a number of factors. One of the most important considerations is the priority assigned to the highway safety issue that is being addressed and the potential impact the strategy would have on reducing crashes, fatalities and injuries. A second factor taken into account is how the strategy contributes to a comprehensive and balanced highway safety program. A third consideration is the need to comply with federal requirements, such as requirements to maintain funding levels in specific program areas and restrictions placed on the types of activities that can be funded under certain grant programs. GTSC distributes an annual call letter to announce the availability of grant funds and the priority grant programs, including the strategies within each of those programs that are eligible for funding. Programs eligible for funding are based on the analysis of crash data and the input received from GTSC member agencies, groups such as the Traffic Records Coordinating Council (TRCC) and the Impaired Driving Advisory Council, and localities via the NYS Association of Traffic Safety Boards and STOP-DWI. All grant applications are due to GTSC by May 1. Project Selection, Negotiation and Award During the grant application review process, GTSC staff conducts an analysis of crashes, fatalities and injuries in the geographic areas of highest risk that each grant project proposal represents. Each project proposal undergoes a standardized, multi-tiered review that includes a numeric and qualitative evaluation of its problem identification, operational plan, performance targets, evaluation plan and budget. Grantee past performance is also evaluated (if applicable) through a review of progress reports, financial claims and on-site monitoring reports. Proposals must be consistent with the priorities of New York's HSSP and with the evidence-based strategies that have been identified. At a minimum, all project proposals are assessed by a program specialist, financial specialist and the GTSC Director. The project review process involves different elements for different program areas as described below.
• Proposals for Impaired Driving projects are also assessed for their coordination with the direction of NYS’s Advisory Council on Impaired Driving.
• Proposals for Police Traffic Services grants must include evidence-based enforcement strategies that are consistent with the state's evidence-based Traffic Safety Enforcement Program (TSEP).
• Project proposals for Motorcycle Safety are also reviewed to verify that they do not include motorcycle checkpoints and are consistent with the Share the Road message promoted by GTSC and its partners.
• Project proposals for Non-motorized (Pedestrians and Bicyclists) strategies are also assessed for their impact on the targeted population identified in the grant, and consideration is given to focus communities that have been identified in New York’s Pedestrian Safety Action Plan.
• Proposals for Occupant Protection projects are also assessed for their efforts to address the high-risk groups that make up the approximately 7% who do not comply with the state’s laws. GTSC follows the same process described above for the review of Child Passenger Safety mini-grant applications, project selection, and the negotiation and award of grant funds. Proposals for Child Passenger Safety projects are also assessed to determine if the organization has a “Safe Kids” certified technician to carry out grant activities and demonstrates an understanding of their community demographics for effective outreach. Applications for Low-Income Education and Distribution Programs are also assessed to ensure that the populations that are served qualify for the receipt of child safety seats.

2020 Highway Safety Strategic Plan Highway Safety Planning Process…Page 5
• Project proposals for Traffic Records funding are assessed for their impact on one of the New York’s six core traffic safety data systems and the consistency of the proposed strategies with New York’s Traffic Safety Information Systems Strategic Plan. Proposals are also reviewed to verify that they have been previously approved by the state’s Traffic Records Coordinating Council (TRCC).
• Project proposals for Community Traffic Safety Programs are assessed to determine the depth of the agency’s knowledge of the demographics and traffic safety problems in their locality. Program staff also evaluate if the agency is in the best position to address the identified problems.
Coordination of Highway Safety Plan (HSP) and State Strategic Highway Safety Plan (SHSP) Coordination of Data Collection and Information Systems The coordination of the state’s traffic records systems is facilitated through the state’s Traffic Records Coordinating Council (TRCC). The TRCC’s membership includes all of the New York State agencies that house and maintain data systems related to highway safety. The Deputy Director of ITSMR serves as the Traffic Safety Information Systems (TSIS) Coordinator and is responsible for preparing New York’s Traffic Records Strategic Plan and annual updates, organizing and facilitating meetings of the TRCC and ensuring New York’s compliance with NHTSA requirements regarding state traffic records programs. Under contract to GTSC, ITSMR also provides extensive services related to the traffic records systems housed at the NYS Department of Motor Vehicles (DMV). In addition to responding to requests for data and special analyses from GTSC, DMV and their customers, ITSMR is also responsible for the final cleanup of the state’s crash file, the Accident Information System (AIS). In addition to providing analytical support for the performance-based HSSP administered by the GTSC, ITSMR assists the NYS Department of Transportation’s Motor Carrier Safety Assistance Program (MCSAP) with the development of the annual Commercial Vehicle Safety Plan (CVSP). ITSMR’s role in both the HSSP and the CVSP ensures the uniformity of the data used in the planning documents and facilitates the adoption of consistent performance targets. Because of ITSMR’s role in the TRCC and the responsibility ITSMR has been given for preparing the final crash data file, responding to data requests on behalf of DMV and providing analytical support for the HSSP and the CVSP, ITSMR is in a position both to enhance the coordination of the state’s information systems and to ensure the consistency and uniformity of the data used to support the state’s highway safety programs. Coordination with New York’s Strategic Highway Safety Plan The FAST Act continues the requirements initiated under MAP-21 for states to develop a Strategic Highway Safety Plan (SHSP). The SHSP is a comprehensive, data-driven transportation safety plan developed in consultation with a broad range of safety stakeholders that provides strategic direction for the state’s various planning documents, including the HSSP. The SHSP and the state’s other highway safety planning documents should be developed cooperatively and have consistent safety goals and objectives that support a performance-based highway safety program. Under the federal SAFETEA-LU legislation that preceded MAP-21, the NYS Department of Transportation (NYSDOT) was required to develop and implement a data-driven SHSP that identifies key emphasis areas to be addressed to reduce roadway fatalities and serious injuries in New York State. New York’s original SHSP was developed through a collaborative process involving more than 150 representatives from public and private sector safety partners at the local, state and federal levels. The participation of the Federal Highway Administration (FHWA), the National Highway Traffic Safety Administration (NHTSA), the Federal Motor

2020 Highway Safety Strategic Plan Highway Safety Planning Process…Page 6
Carrier Safety Administration (FMCSA) and the state agencies responsible for administering the federal programs within New York State in the development of the SHSP is indicative of the long-established working relationships among the highway safety partners in New York and with their federal partners. NYSDOT again took the lead in the development and preparation of the update to the SHSP that was due in August 2017. A comprehensive planning process was implemented throughout the year involving local, state and federal participants representing a wide range of disciplines to ensure coordination among the planning documents prepared for the various safety programs administered by the USDOT. Coordination of Performance Targets Among Planning Documents States are required to set consistent targets for the three performance measures (fatalities, fatality rate and serious injuries) that are common to the HSSP, the Highway Safety Improvement Program (HSIP) and the Strategic Highway Safety Plan (SHSP). FARS is the source for the fatalities and fatality rate measures and New York’s Accident Information System (AIS) is the source for the serious injuries measure. In spring 2019, state partners met to select consistent targets for fatalities, the fatality rate and serious injuries for inclusion in the FFY 2020 HSSP, SHSP update and other planning documents prepared by NYSDOT.
2020 Highway Safety Strategic Plan Evidence-Based Traffic Safety Enforcement Program…Page 7
EVIDENCE-BASED TRAFFIC SAFETY ENFORCEMENT PROGRAM (TSEP)
A significant portion of New York’s highway safety grant funding is awarded to law enforcement agencies each year. To ensure that enforcement resources are used efficiently and effectively to support the goals of the state’s highway safety program, New York has designed an evidence-based enforcement plan for the state that incorporates data-driven problem identification, deployment of resources based on these analyses and continuous monitoring and adjustment of the plan as warranted. New York’s evidence-based Traffic Safety Enforcement Program (TSEP) includes the enforcement efforts that are planned in all program areas in the state’s Highway Safety Strategic Plan (HSSP), especially Police Traffic Services (PTS). Components of New York’s Evidence-Based TSEP
Data-Driven Problem Identification The statewide data-driven problem identification process focuses on the analysis of crashes, fatalities and injuries to determine what is occurring, where, when, why and how it is occurring and who is involved. Problem identification is conducted on a statewide basis and for each program area and is used to determine which traffic safety issues are to be addressed by GTSC’s grant programs in the upcoming fiscal year. The analysis identifies groups of drivers who are overrepresented in crashes, as well as the locations and times that crashes are occurring, to guide the development of NYS’s enforcement plan. Key results summarizing the problems identified are presented in the statewide and individual program area sections of the HSSP. All local enforcement agencies applying for grant funding must also use a data-driven approach to identify the enforcement issues in their jurisdictions. The Traffic Safety Statistical Repository (TSSR) developed by the Institute for Traffic Safety Management and Research (ITSMR) is available to assist agencies in conducting problem identification at the local level. The TSSR can be accessed through ITSMR’s website and at https://www.itsmr.org/tssr. Users of the TSSR have direct online access to New York’s motor vehicle crash data from the state’s Accident Information System (AIS) for 2009-2017, as well as preliminary data for 2018 and 2019. The site includes reports on motor vehicle crashes statewide and by individual counties; some data by municipalities within counties are also available. Statewide and county reports with ticket data for 2009-2017 and preliminary data for 2018 are also available through the TSSR to support data-driven programs at the local and state levels. Data documenting the local highway safety issues identified must be included in the funding application submitted to GTSC along with the strategies that will be implemented to address the problems. Another tool made available for the first time in FFY 2018 are tables with selected crash and ticket information reflecting the enforcement activity of individual police agencies. To ensure that New York’s traffic safety enforcement grant funds are deployed based on data-driven problem identification, GTSC identifies the statewide geographic and demographic areas of concern through analyses of crash data. GTSC then identifies police agencies with traffic enforcement jurisdiction in the most problematic areas and through its Highway Safety Program Representatives and Law Enforcement Liaisons conducts outreach to encourage agencies to apply for grant funds. Using the state’s priority areas as the framework, GTSC’s Police Traffic Services (PTS) grant program is the primary funding effort to direct traffic enforcement grant funds to New York’s police agencies. Enforcement efforts described under other program areas are planned, implemented and monitored in accordance with the state’s evidence-based Traffic Safety Enforcement Program (TSEP). The PTS grant application form guides agencies through the process of using local crash and ticket data to identify problem areas specific to their communities. Police agencies are required to correlate crash-causing traffic violations or driver behaviors with specific times and locations in their jurisdictions so that officer resources are allocated to details directly related to the identified problems. As part of the PTS application, the

2020 Highway Safety Strategic Plan Evidence-Based Traffic Safety Enforcement Program…Page 8
Institute for Traffic Safety Management and Research (ITSMR) compiles agency-specific spreadsheets with crash and ticket data for the most recent five years of final data, as well as preliminary data for the most recent year, for use by PTS grant applicants. Based on these analyses, applicants complete a data-driven “Work Plan” which presents their proposed countermeasures and enforcement strategies. Implementation of Evidence-Based Strategies To ensure that enforcement resources are deployed effectively, police agencies are directed to implement evidence-based strategies through GTSC’s Highway Safety grant application or the more focused Police Traffic Services (PTS) grant application. The PTS application narrative outlines New York’s broad approach to address key problem enforcement areas and guides the local jurisdictions to examine local data and develop appropriate countermeasures for their own problem areas. Examples of proven strategies include targeted enforcement focusing on specific violations, such as texting, aggressive driving and speeding, or on specific times of day when more violations occur, such as nighttime impaired driving road checks and seat belt enforcement. High visibility enforcement, including broad participation in national seat belt and impaired driving mobilizations, is required. The Data Driven Approaches to Crime and Traffic Safety (DDACTS) model and other strategies that use data to identify high crash locations are also proven strategies. By implementing strategies that research has shown to be effective, more efficient use is made of the available resources and the success of enforcement efforts is enhanced. During the PTS grant review process, GTSC scores applications based on the data and problem identification process, the strength of the work plan, the past performance of the agency, and crash and ticket trends in the jurisdiction. Monitoring and Adjustment of the TSEP Continuous oversight and monitoring of the enforcement efforts that are implemented is another important element of New York’s TSEP. Enforcement agencies’ deployment strategies are routinely evaluated and adjusted to accommodate shifts and changes in their local highway safety problems. Several methods are used to follow-up on programs funded by GTSC: (1) progress report and activity level review, (2) onsite project monitoring and (3) law enforcement subgrantee formal training programs and direct technical assistance. Once a Police Traffic Services (PTS) grant is awarded, GTSC Program Representatives, accompanied by Law Enforcement Liaisons, if requested, conduct on-site monitoring visits to review the grant activities and discuss with grantees the impact the enforcement activities may be having in their jurisdictions. During monitoring contacts, Program Representatives also reinforce the message that enforcement resources should be deployed to areas at times when problems are known to occur. During the grant period, grantees are required to submit two progress reports which include a narrative describing grant activities and data on crashes and tickets issued during the reporting period. GTSC reviews these reports to assess the progress resulting from the agency’s data-driven enforcement activities. This information is used to adjust the agency’s operational plans for subsequent mobilizations and other high visibility enforcement activities and to determine the agency’s eligibility for future awards. High-Visibility Enforcement (HVE)
To qualify for federal funding, states are required to participate in national high-visibility enforcement mobilizations to increase the use of seat belts and reduce alcohol-impaired and drug-impaired driving. New York’s involvement in the annual Click It or Ticket high visibility enforcement campaign is described under the Occupant Protection program area and the state’s participation in HVE national impaired driving mobilizations is discussed under the Impaired Driving program area.

2020 Highway Safety Strategic Plan Performance Report...Page 9
PERFORMANCE REPORT
The Performance Report presents the progress made toward the state’s performance targets established in the previous year’s HSSP.
Core Performance Measures and Targets Status
C-1 Number of traffic fatalities (FARS) In Progress Target for 2015-2019 average: 1,072.1
C-2 Number of serious injuries in traffic crashes (NYS AIS) In Progress Target for 2015-2019 average: 10,987.0
C-3 Fatalities/VMT (FARS, FHWA) In Progress Target for 2016-2020 average: 0.858
C-4 Number of unrestrained passenger vehicle occupant fatalities, Met
all seat positions (FARS) Target for 2015-2019 average: 167.4
C-5 Number of fatalities in crashes involving a driver or motorcycle In Progress operator with a BAC of .08 and above (FARS) Target for 2015-2019 average: 311.0
C-6 Number of speeding-related fatalities (FARS) In Progress
Target for 2015-2019 average: 327.4 C-7 Number of motorcyclist fatalities (FARS) In Progress
Target for 2015-2019 average: 150.7 C-8 Number of unhelmeted motorcyclist fatalities (FARS) Met
Target for 2015-2019 average: 14.3
C-9 Number of drivers age 20 or younger involved in fatal crashes (FARS) Met Target for 2015-2019 average: 109.8
C-10 Number of pedestrian fatalities (FARS) Met
Target for 2015-2019 average: 291.5 C-11 Number of bicyclist fatalities (FARS) In Progress
Target for 2015-2019 average: 39.4 B-1 Observed seat belt use for passenger vehicles, front seat outboard Not Met
occupants (survey) Target for 2015-2019 average: 94.0%
2020 Highway Safety Strategic Plan Performance Report...Page 10
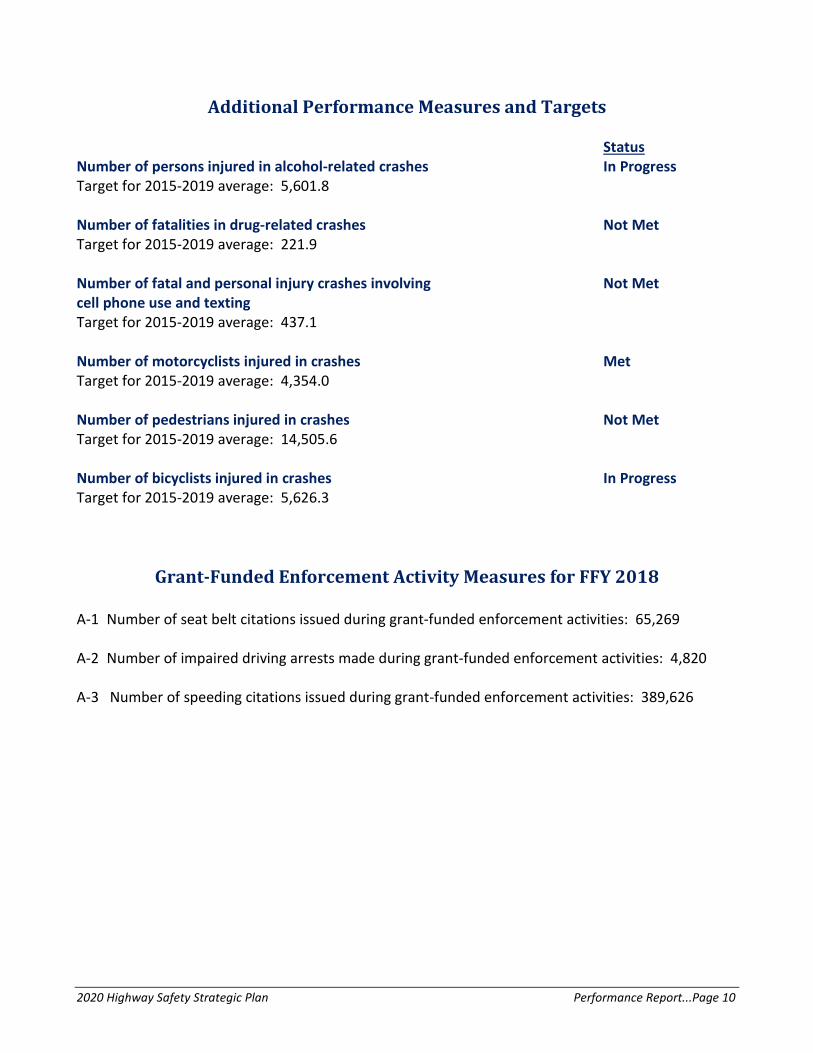
Additional Performance Measures and Targets
Status Number of persons injured in alcohol-related crashes In Progress Target for 2015-2019 average: 5,601.8 Number of fatalities in drug-related crashes Not Met Target for 2015-2019 average: 221.9 Number of fatal and personal injury crashes involving Not Met cell phone use and texting Target for 2015-2019 average: 437.1 Number of motorcyclists injured in crashes Met Target for 2015-2019 average: 4,354.0 Number of pedestrians injured in crashes Not Met Target for 2015-2019 average: 14,505.6 Number of bicyclists injured in crashes In Progress Target for 2015-2019 average: 5,626.3
Grant-Funded Enforcement Activity Measures for FFY 2018 A-1 Number of seat belt citations issued during grant-funded enforcement activities: 65,269 A-2 Number of impaired driving arrests made during grant-funded enforcement activities: 4,820 A-3 Number of speeding citations issued during grant-funded enforcement activities: 389,626

2020 Highway Safety Strategic Plan Performance Report...Page 11
Statewide Performance Measures Several core outcome measures based on FARS data are used to monitor the trends in motor vehicle fatalities in New York State. These include fatalities in motor vehicle crashes, the statewide fatality rate, and the urban and rural fatality rates per 100 million VMT. The state also relies on data from New York’s crash database, the Accident Information System (AIS), maintained by the NYS Department of Motor Vehicles to track serious injuries, another core outcome measure for the state’s highway safety program. The status of the other core performance measures and the additional measures used to track progress are presented under the appropriate program areas Statewide Measures Number of traffic fatalities The 2017 FARS data indicate that the 5-year average number of motor vehicle fatalities in New York decreased from 1,120 to 1,084 between 2016 and 2017, a decline of 3%. This decrease shows good progress toward the target of 1,072.1 set for the 2015-2019 average. Number of serious injuries
Based on data from New York’s AIS, the 5-year moving average for persons seriously injured in crashes was on a consistent downward trend between 2013 and 2017. Between 2016 and 2017, the average number of serious injuries decreased 2% (from 11,445 to 11,242). As a result of this decrease, good progress has been made toward the reduction target of 10,987.0 set for the average of the 5-year period ending in 2019.
1,202
1,0411,136
1,041* 999
1,182 1,159 1,146 1,1201,084
900
1,000
1,100
1,200
1,300
2013 2014 2015 2016 2017
FATALITIES IN MOTOR VEHICLE CRASHES
Fatalities 5 Yr Moving Avg*Revised based on final 2016 FARS dataSource: FARS
11,60910,874 11,077
11,501 11,148
12,31511,892
11,547 11,445 11,242
10,000
11,000
12,000
13,000
2013 2014 2015 2016 2017
SERIOUS INJURIES INMOTOR VEHICLE CRASHES
Serious Injuries 5 Yr Moving AvgSource: NYS AIS / TSSR

2020 Highway Safety Strategic Plan Performance Report...Page 12
Fatalities/100 Million VMT FARS 2017 data are not yet available to update the status of the statewide, urban and rural fatality rates. As shown in the graphs below, the 5-year moving average for the statewide fatality rate declined slightly from 0.91 per 100 million VMT in 2012 to 0.88 in 2016. Between 2015 and 2016, the rural fatality rate increased from 1.47 per 100 million VMT to 1.85, while the urban fatality rate decreased from 0.71 to 0.59. When the 2017 data become available, progress toward reaching the target fatality rate of 0.858 set for 2015-2019 will be able to be assessed.
0.92 0.93 0.81 0.89* 0.85
0.91 0.91 0.90 0.89 0.88
0.00
0.50
1.00
1.50
2012 2013 2014 2015 2016
*Revised based on final 2015 FARS dataSource: FARS
FATALITY RATEPER 100 MILLION VEHICLE MILES
TRAVELED
Fatality Rate 5 Yr Moving Avg
1.88 1.93
1.251.47*
1.85
0.59 0.59 0.66 0.71* 0.59
0.00
0.50
1.00
1.50
2.00
2.50
2012 2013 2014 2015 2016
RURAL AND URBAN FATALITY RATES PER 100 MILLION VEHICLE MILES
TRAVELED
Rural Fatality Rate Urban Fatality Rate
*Revised based on final 2015 FARS dataSource: FARS

2020 Highway Safety Strategic Plan Performance Report...Page 13
Status of New York’s Highway Safety Program
The goals of New York’s comprehensive statewide highway safety program are to prevent motor vehicle crashes, save lives, and reduce the severity of injuries suffered in crashes. The Governor’s Traffic Safety Committee (GTSC) provides leadership and support for the attainment of these goals through its administration of the federal highway safety grant funding awarded to New York by the National Highway Traffic Safety Administration (NHTSA).
The top priorities of the FFY 2020 highway safety program are to address trends of increasing numbers of crashes involving specific highway users and contributing factors while maintaining and expanding on the success in areas where reductions have been achieved. Based on the most recent complete year of FARS fatality data, New York has demonstrated improvement in the number of fatalities overall and in several traffic safety areas. Over the five-year period, 2013-2017, total fatalities, fatalities in alcohol-related and speed-related crashes and motorcyclist fatalities have all been on general downward trends. While pedestrian fatalities fluctuated over the five-year period, there was an overall decline in the five-year moving average from 307 to 292 and a 22% drop in the number of pedestrians killed between 2015 and 2017. The number of drivers under age 21 involved in fatal crashes also trended downward between 2013 and 2017 with the five-year moving average dropping from 144 (2009-2013) to 106 (2013-2017).
One of New York’s greatest achievements has been the level of compliance with the state’s seat belt law; a statewide usage rate of 92.9% was measured in the 2018 seat belt observation survey, only half a percentage point from the all-time high of 93.4% in 2017. The data on restraint use in crashes also show that fewer of the fatalities were unrestrained occupants or unhelmeted motorcyclists.
Based on data from New York’s Accident Information System (AIS), serious injuries in crashes were also on a general downward trend between 2013 and 2017. There have also been reductions in the number of persons injured in crashes involving alcohol and in the number of motorcyclists injured in crashes.
Although progress has been made in many areas of traffic safety, others continue to pose challenges. One of the areas of concern continues to be non-motorists. While the five-year moving averages for both pedestrian fatalities and pedestrians injured in crashes have generally been trending downward, the large fluctuations in the numbers from year to year require monitoring. Furthermore, unlike the number of pedestrian fatalities which declined between 2015 and 2017, the number of pedestrians injured in crashes increased over the same period (from 13,413 to 15,581). Bicyclist fatalities also increased between 2015 and 2017 (from 36 to 46) and the five-year moving average for the number of bicyclists injured in crashes was on an upward trend between 2015 and 2017.
Another traffic safety issue that continues to be a priority is the number of fatalities in drug-related crashes. Despite the decrease in the number of fatalities in drugged driving crashes between 2016 and 2017 (from 267 to 235), the five-year moving average was on an upward trend between 2014 and 2017. There has also been an upward trend in the number of fatal and personal injury cell phone crashes, which increased 21% between 2015 and 2017 (from 435 to 526).
The evidence-based approach to enforcement is reflected in the analyses of the traffic tickets issued. After remaining relatively stable between 2013 and 2016, the total number of tickets issued for traffic violations increased by nearly 150,000 (4%) in 2017. The increases in the numbers of tickets occurred primarily in the downstate areas of New York; increases of 12% and 10% were reported for Long Island and New York City, respectively, while there was a one percent decrease in the number of tickets issued in the Upstate region.
2020 Highway Safety Strategic Plan Performance Report...Page 14
For the state as a whole, speeding tickets, which had been on a consistent upward trend from 2013-2016, declined by 3% in 2017. The overall increase in speeding tickets between 2013 and 2017 was 11%. Over the same period, 2013-2017, seat belt tickets declined by 29%; however, the difference between 2016 and 2017 was only approximately 400 tickets (a decrease of less than 1%) indicating that the level of ticketing may be reaching a plateau. Evidence of efforts directed toward the enforcement of drug-impaired driving is also seen in the analyses of the TSLED ticket data. Between 2013 and 2017, the number of drivers ticketed for drugged driving increased 22%; part of this increase is likely attributable to the better detection and reporting of drug involvement as a result of the ARIDE and Drug Recognition Expert (DRE) training provided for law enforcement officers.
Based on the analyses, New York has identified a number of special emphasis areas for the coming year including drug-impaired driving, texting and other forms of distracted driving, and pedestrian and bicycle safety. In addition, ongoing efforts under all of the program areas will continue to ensure that the gains that have been made are maintained and expanded.
The results of these analyses provide the basis for setting the performance measures, selecting the countermeasure strategies and identifying the planned activities that will be developed into projects to address the specific traffic safety issues that have been identified. These analyses also enable New York to maintain a comprehensive data-driven highway safety program that will lead to further reductions in motor vehicle crashes, fatalities and injuries.

2020 Highway Safety Strategic Plan Performance Plan...Page 15
FFY 2020 PERFORMANCE PLAN The Performance Plan includes the 12 core performance measures selected by NHTSA, the additional measures selected by New York and the targets set for each of these measures in New York’s FFY 2020 Highway Safety Strategic Plan. New York’s methodology for setting its FFY 2020 targets used a two-step process. The first step in the process involved a linear trend model. Adhering to the method recommended by the FHWA and used by the NYS DOT in setting its targets, linear trend analysis was conducted using the FORECAST function in Excel. In the model, the 5-year moving average was used as the data point for each year included in the linear trend analysis. The second step in the process involved discussing the targets estimated by this forecasting method with the state’s key stakeholders. Based on their experience and knowledge of current traffic safety-related activities and programs and those that will be conducted over the next few years, the key stakeholders adjusted each of the forecasted targets, where warranted, based on what they thought was reasonable.
Core Performance Measures and Targets
C-1 Number of traffic fatalities (FARS) Target for 2016-2020 average: 1,040.4
C-2 Number of serious injuries in traffic crashes (NYS AIS)
Target for 2016-2020 average: 11,017.0
C-3 Fatalities/VMT (FARS, FHWA) Target for 2016-2020 average: 0.826
C-4 Number of unrestrained passenger vehicle occupant fatalities, all seat positions (FARS)
Target for 2016-2020 average: 160.5 C-5 Number of fatalities in crashes involving a driver or motorcycle operator with a BAC of .08
and above (FARS) Target for 2016-2020 average: 304.5
C-6 Number of speeding-related fatalities (FARS)
Target for 2016-2020 average: 319.4 C-7 Number of motorcyclist fatalities (FARS)
Target for 2016-2020 average: 149.4 C-8 Number of unhelmeted motorcyclist fatalities (FARS)
Target for 2016-2020 average: 13.2
C-9 Number of drivers age 20 or younger involved in fatal crashes (FARS) Target for 2016-2020 average: 102.1

2020 Highway Safety Strategic Plan Performance Plan...Page 16
C-10 Number of pedestrian fatalities (FARS)
Target for 2016-2020 average: 286.2 C-11 Number of bicyclist fatalities (FARS)
Target for 2016-2020 average: 39.7 B-1 Observed seat belt use for passenger vehicles, front seat outboard occupants (survey)
Target for 2016-2020 average: 94.0%
Additional Performance Measures and Targets Number of persons injured in alcohol-related crashes Target for 2016-2020 average: 5,589.9 Number of fatalities in drug-related crashes Target for 2016-2020 average: 227.8 Number of fatal and personal injury crashes involving cell phone use and texting Target for 2016-2020 average: 459.2 Number of motorcyclists injured in crashes Target for 2016-2020 average: 4,116.3 Number of pedestrians injured in crashes Target for 2016-2020 average: 14,802.7 Number of bicyclists injured in crashes Target for 2016-2020 average: 5,627.1
Grant-Funded Enforcement Activity Measures for FFY 2018 A-1 Number of seat belt citations issued during grant-funded enforcement activities: 65,269 A-2 Number of impaired driving arrests made during grant-funded enforcement activities: 4,820 A-3 Number of speeding citations issued during grant-funded enforcement activities: 389,626

2020 Highway Safety Strategic Plan Impaired Driving…Page 17
IMPAIRED DRIVING Overview For more than three decades, New York has been a national leader in reducing crashes, fatalities and injuries resulting from alcohol and drug impaired driving. At the core of the state’s well-established comprehensive system for addressing impaired driving is a set of strict laws which are supported by effective enforcement, prosecution, adjudication and offender programs.
The Governor’s Traffic Safety Committee (GTSC) plays the central role in the promotion and coordination of multiple components of New York’s Impaired Driving Program. The funds and other resources GTSC invests to reduce impaired driving are complemented by a number of other federal, state, local and private sector activities. While a real dollar amount cannot be accurately estimated for the contributions of each of the partners involved in combating impaired driving, the most significant sources of funding, programming and in-kind support that assist in achieving the performance goals established in the HSSP include the following: New York’s STOP-DWI program; New York’s DRE program; the New York State agencies comprising the Governor’s Traffic Safety Committee, including the Departments of Motor Vehicles (DMV) and Health (DOH), the State Police, the Division of Criminal Justice Services (DCJS) and its Office of Probation and Correctional Alternatives (OPCA), the State Liquor Authority (SLA) and its Alcohol Beverage Control (ABC) Board, the Office of Court Administration (OCA), the Thruway Authority, the Office of Alcoholism and Substance Abuse Services (OASAS), the Department of Corrections and Community Supervision, and the Division of Parole; the State Police and six regional toxicology labs; the NY Prosecutors Training Institute; Impaired Driver Program (IDP) and MADD, SADD and other advocacy groups. A major component of New York’s efforts to address impaired driving is the STOP-DWI program which returns fines collected for impaired driving convictions to the counties where the violations occurred to fund enforcement and other impaired driving programs at the local level. Each year, a total of approximately $19,000,000 in fine monies is returned to the county STOP-DWI programs to support local initiatives. Since the STOP-DWI program is self-sustaining, GTSC is able to use the federal funds received by New York to support a variety of state-level initiatives that complement the local efforts and strengthen the overall impaired driving program. As the organization responsible for the oversight of the STOP-DWI program, GTSC is also in a position to maximize the opportunities for cooperative efforts that encompass all regions of the state. In FFY 2020, GTSC will continue to promote and support the participation of enforcement agencies at the local, county and state level in high visibility impaired driving enforcement efforts. In the coming year, New York will participate in the Labor Day and Holiday Season national mobilizations. In addition, STOP-DWI Crackdowns will be conducted during several other holiday periods throughout the year. Another important component of New York’s efforts to address impaired driving is its participation in the International Drug Evaluation & Classification (DEC) Program. Commonly known in New York as the DRE (Drug Recognition Expert) program, New York has been participating in the program since 1987. Under this program, Drug Recognition Expert (DRE) police officers are trained to observe the signs of drug and/or alcohol impairment. Currently, New York has 303 trained DREs across the state. In its oversight role of the DRE program, GTSC has appointed a DRE State Coordinator to manage all functions of the statewide DRE program. In FFY 2020, GTSC will continue to promote the DRE program and support its efforts to combat the problem of drug-impaired driving.
2020 Highway Safety Strategic Plan Impaired Driving…Page 18
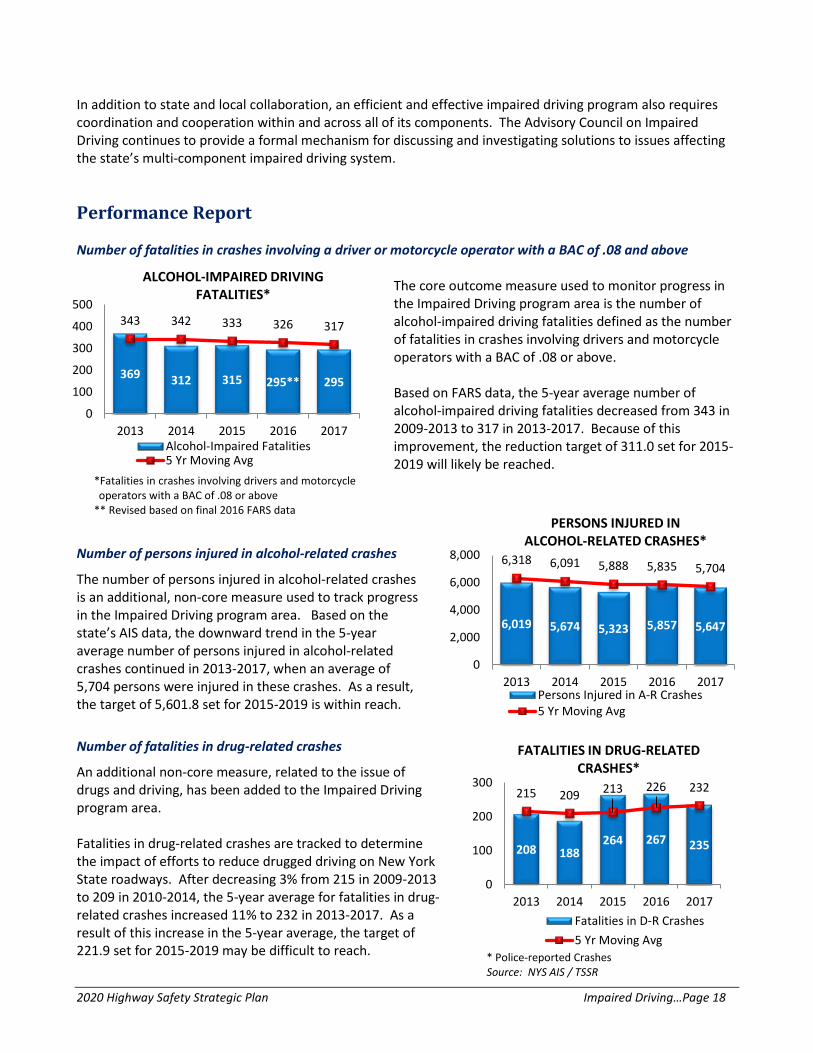
In addition to state and local collaboration, an efficient and effective impaired driving program also requires coordination and cooperation within and across all of its components. The Advisory Council on Impaired Driving continues to provide a formal mechanism for discussing and investigating solutions to issues affecting the state’s multi-component impaired driving system. Performance Report Number of fatalities in crashes involving a driver or motorcycle operator with a BAC of .08 and above
The core outcome measure used to monitor progress in the Impaired Driving program area is the number of alcohol-impaired driving fatalities defined as the number of fatalities in crashes involving drivers and motorcycle operators with a BAC of .08 or above. Based on FARS data, the 5-year average number of alcohol-impaired driving fatalities decreased from 343 in 2009-2013 to 317 in 2013-2017. Because of this improvement, the reduction target of 311.0 set for 2015-2019 will likely be reached.
Number of persons injured in alcohol-related crashes
The number of persons injured in alcohol-related crashes is an additional, non-core measure used to track progress in the Impaired Driving program area. Based on the state’s AIS data, the downward trend in the 5-year average number of persons injured in alcohol-related crashes continued in 2013-2017, when an average of 5,704 persons were injured in these crashes. As a result, the target of 5,601.8 set for 2015-2019 is within reach.
Number of fatalities in drug-related crashes
An additional non-core measure, related to the issue of drugs and driving, has been added to the Impaired Driving program area. Fatalities in drug-related crashes are tracked to determine the impact of efforts to reduce drugged driving on New York State roadways. After decreasing 3% from 215 in 2009-2013 to 209 in 2010-2014, the 5-year average for fatalities in drug-related crashes increased 11% to 232 in 2013-2017. As a result of this increase in the 5-year average, the target of 221.9 set for 2015-2019 may be difficult to reach.
369 312 315 295** 295
343 342 333 326 317
0
100
200
300
400
500
2013 2014 2015 2016 2017
ALCOHOL-IMPAIRED DRIVING FATALITIES*
Alcohol-Impaired Fatalities5 Yr Moving Avg
*Fatalities in crashes involving drivers and motorcycle operators with a BAC of .08 or above
** Revised based on final 2016 FARS data
6,019 5,674 5,323 5,857 5,647
6,318 6,091 5,888 5,835 5,704
0
2,000
4,000
6,000
8,000
2013 2014 2015 2016 2017
PERSONS INJURED IN ALCOHOL-RELATED CRASHES*
Persons Injured in A-R Crashes5 Yr Moving Avg
* Police-reported CrashesSource: NYS AIS / TSSR
208 188264 267 235
215 209 213 226 232
0
100
200
300
2013 2014 2015 2016 2017
FATALITIES IN DRUG-RELATED CRASHES*
Fatalities in D-R Crashes5 Yr Moving Avg
* Police-reported CrashesSource: NYS AIS / TSSR
2020 Highway Safety Strategic Plan Impaired Driving…Page 19
Problem Identification Additional data analyses were conducted to assist GTSC in setting priorities for the Impaired Driving Program and selecting data-driven countermeasure strategies and projects that will enable the state to achieve its performance goals. The key findings from the problem identification component are presented in this section. Impaired Driving Crashes and Arrests
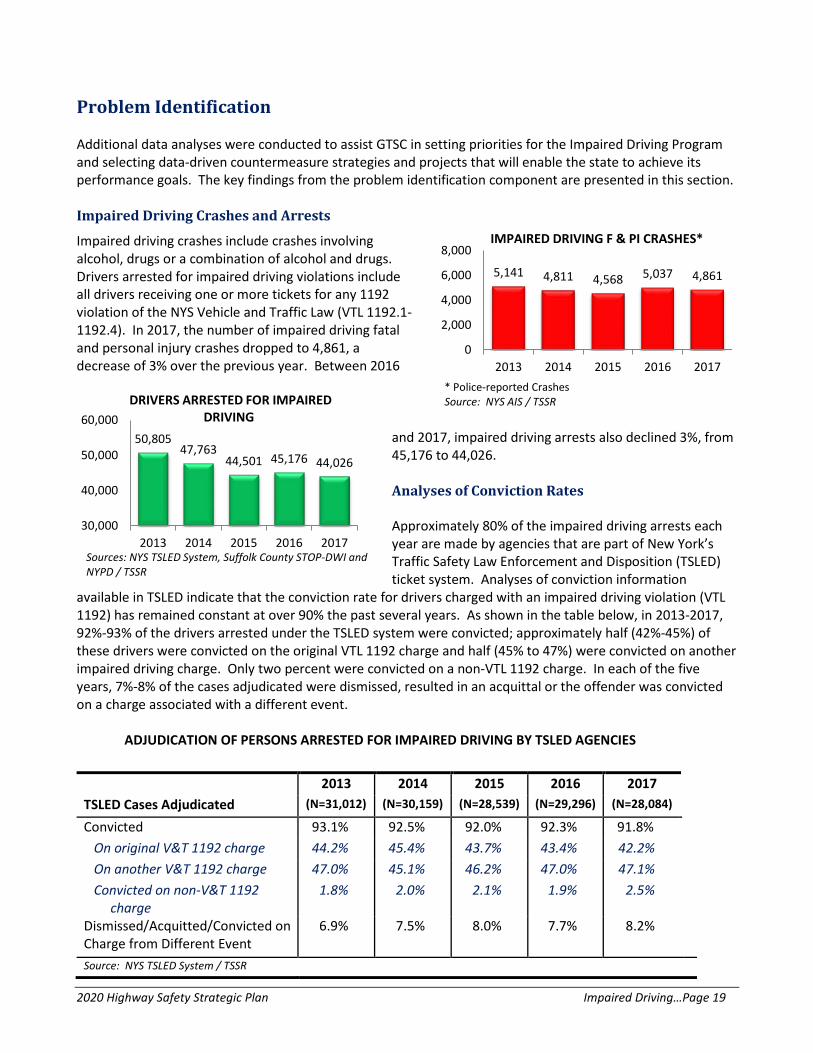
Impaired driving crashes include crashes involving alcohol, drugs or a combination of alcohol and drugs. Drivers arrested for impaired driving violations include all drivers receiving one or more tickets for any 1192 violation of the NYS Vehicle and Traffic Law (VTL 1192.1-1192.4). In 2017, the number of impaired driving fatal and personal injury crashes dropped to 4,861, a decrease of 3% over the previous year. Between 2016
and 2017, impaired driving arrests also declined 3%, from 45,176 to 44,026. Analyses of Conviction Rates Approximately 80% of the impaired driving arrests each year are made by agencies that are part of New York’s Traffic Safety Law Enforcement and Disposition (TSLED) ticket system. Analyses of conviction information
available in TSLED indicate that the conviction rate for drivers charged with an impaired driving violation (VTL 1192) has remained constant at over 90% the past several years. As shown in the table below, in 2013-2017, 92%-93% of the drivers arrested under the TSLED system were convicted; approximately half (42%-45%) of these drivers were convicted on the original VTL 1192 charge and half (45% to 47%) were convicted on another impaired driving charge. Only two percent were convicted on a non-VTL 1192 charge. In each of the five years, 7%-8% of the cases adjudicated were dismissed, resulted in an acquittal or the offender was convicted on a charge associated with a different event.
ADJUDICATION OF PERSONS ARRESTED FOR IMPAIRED DRIVING BY TSLED AGENCIES
2013 2014 2015 2016 2017 TSLED Cases Adjudicated (N=31,012) (N=30,159) (N=28,539) (N=29,296) (N=28,084)
Convicted 93.1% 92.5% 92.0% 92.3% 91.8% On original V&T 1192 charge 44.2% 45.4% 43.7% 43.4% 42.2% On another V&T 1192 charge 47.0% 45.1% 46.2% 47.0% 47.1% Convicted on non-V&T 1192 charge
1.8% 2.0% 2.1% 1.9% 2.5%
Dismissed/Acquitted/Convicted on Charge from Different Event
6.9% 7.5% 8.0% 7.7%
8.2%
Source: NYS TSLED System / TSSR
5,141 4,811 4,568 5,037 4,861
0
2,000
4,000
6,000
8,000
2013 2014 2015 2016 2017
IMPAIRED DRIVING F & PI CRASHES*
* Police-reported CrashesSource: NYS AIS / TSSR
50,80547,763
44,501 45,176 44,026
30,000
40,000
50,000
60,000
2013 2014 2015 2016 2017
DRIVERS ARRESTED FOR IMPAIRED DRIVING
Sources: NYS TSLED System, Suffolk County STOP-DWI and NYPD / TSSR

2020 Highway Safety Strategic Plan Impaired Driving…Page 20
Additional analyses were conducted for alcohol-related crashes and arrests and drug-related crashes and arrests. It should be noted that the results of these two sets of analyses cannot be added together to derive the total impaired driving crashes or arrests. Since a portion of the crashes and the arrests involve both alcohol and drugs, adding them together would result in double counting some of the crashes and arrests. Alcohol-Related Crashes
The status of the two performance measures, alcohol-impaired driving fatalities and the number of persons injured in alcohol-related crashes, was discussed previously. Another measure that is tracked is alcohol-related fatal and personal injury crashes. In 2017, the number of alcohol-related fatal and personal injury crashes decreased 3% from the previous year, from 4,323 to 4,173. Drug-Related Crashes
The involvement of drugs in crashes is an area of growing concern for New York’s highway safety program. Compared to the previous two years, drug-related fatalities in 2015-2017 accounted for larger proportions of the total fatalities. In those three years, one out of four fatalities (24% in 2015 and 2017 and 26% in 2016) occurred in drug-related crashes compared to approximately one out of six (18%) of the fatalities in 2013-2014. The number of persons injured in drug-related crashes fluctuated over the five-year period 2013-2017. Between 2016 and 2017, the number of persons injured in these crashes dropped 3% from 1,303 to 1,261.
4,606 4,244 3,898 4,323 4,173
01,0002,0003,0004,0005,0006,000
2013 2014 2015 2016 2017
ALCOHOL-RELATED FATAL & PI CRASHES*
* Police-reported CrashesSource: NYS AIS / TSSR
18% 18%24%
26%24%
0%
10%
20%
30%
2013 2014 2015 2016 2017
DRUG-RELATED FATALITIES AS A PROPORTION OF TOTAL FATALITIES
Source: NYS AIS / TSSR
976 9881,173
1,303 1,261
0
500
1,000
1,500
2013 2014 2015 2016 2017
PERSONS INJURED IN DRUG-RELATED CRASHES*
* Police-reported CrashesSource: NYS AIS / TSSR

2020 Highway Safety Strategic Plan Impaired Driving…Page 21
Drug-related fatal and personal injury crashes also decreased between 2016 and 2017. In 2017, there were 955 of these crashes compared to 1,041 in the previous year, a decrease of 8%, but higher than the 933 crashes in 2015. It should be noted that better detection of the involvement of drugs in crashes resulting from law enforcement training programs such as ARIDE and Drug Recognition Expert training, is likely to have contributed to better reporting of these crashes.
Alcohol-Related and Drug-Related Fatal and PI Crashes
Analyses by Day of Week As indicated in the charts below, alcohol-related fatal and personal injury crashes were most likely to occur on the weekend (45% on Saturday and Sunday). In contrast, drug-related fatal and personal injury crashes were fairly evenly distributed across the days of the week, ranging from 12% to 16%.
Alcohol-Related Fatal & PI Crashes Drug-Related Fatal & PI Crashes
Day of Week: 2013-2017 Day of Week: 2013-2017
Source: NYS AIS / TSSR Source: NYS AIS / TSSR
Analyses by Time of Day As shown below, the largest proportion of alcohol-related fatal and personal injury crashes occurred between 9pm and 3am (45%), while the largest proportion of drug-related fatal and personal injury crashes occurred between 3 pm and 9pm (36%)
22%
23%
15%
11%
10%
9%
10%
0% 10% 20% 30%
Sunday
Saturday
Friday
Thursday
Wednesday
Tuesday
Monday
13%
16%
16%
15%
14%
14%
12%
0% 5% 10% 15% 20%
Sunday
Saturday
Friday
Thursday
Wednesday
Tuesday
Monday
796 812933
1,041955
0200400600800
1,0001,200
2013 2014 2015 2016 2017
DRUG-RELATED F & PI CRASHES*
* Police-reported CrashesSource: NYS AIS / TSSR

2020 Highway Safety Strategic Plan Impaired Driving…Page 22
Analyses by Location In 2017, the majority of both the alcohol-related (54%) and drug-related (61%) fatal and personal injury crashes occurred in the Upstate region; 30% and 17%, respectively, occurred in New York City, and 16% and 22%, respectively, occurred in Nassau and Suffolk counties on Long Island. Compared to the proportion of all police-reported fatal and personal injury crashes in each region, the Upstate region was overrepresented in both alcohol-related and drug-related fatal and personal injury crashes (54% and 61% vs. 40%). Long Island was slightly overrepresented in drug-related F & PI crashes (22% vs. 19% of all F & PI crashes). Analyses by Driver Gender Three quarters of the drinking drivers involved in alcohol-related fatal and personal injury crashes were men (75% in 2017). Male drivers made up a slightly smaller proportion of the drugged drivers involved in fatal and
personal injury crashes (74%). In comparison, six out of ten drivers involved in all fatal and personal injury crashes in 2017 were men. Compared to their involvement in alcohol-related fatal and personal injury crashes, female drivers account for a slightly larger proportion of the drug-involved drivers in fatal and personal injury crashes (26% vs. 25% of the drinking drivers in alcohol-related crashes in 2017). Four out of ten drivers involved in all fatal and personal injury crashes in 2017 were women.
23%
16%
5%3%4%10%
17%
22%
Alcohol-Related Fatal & PI CrashesTime of Day: 2013-2017
Mid-3am
3am-6am
6am-9am
9am-Noon
Noon-3pm
3pm-6pm
6pm-9pm
9pm-Mid
9%7%
8%
12%
14%19%
17%
14%
Drug-Related Fatal & PI CrashesTime of Day: 2013-2017
Mid-3am
3am-6am
6am-9am
9am-Noon
Noon-3pm
3pm-6pm
6pm-9pm
9pm-Mid
75% 74%61%
25% 26%39%
Alcohol-Involved Drug-Involved All0%
20%
40%
60%
80%
DRIVERS IN FATAL & PI CRASHES BY GENDER: 2017
Male Female
* Police-reported CrashesSources: NYS AIS / TSSR
40% 41%
19%
54%
30%
16%
61%
17%22%
Upstate NYC Long Island0%
15%
30%
45%
60%
75%
ALL, ALCOHOL-RELATED AND DRUG-RELATED FATAL & PI CRASHES*
BY REGION: 2017
All F&PI CrashesA-R F&PI CrashesD-R F&PI Crashes
* Police-reported CrashesSource: AIS / TSSR
2020 Highway Safety Strategic Plan Impaired Driving…Page 23
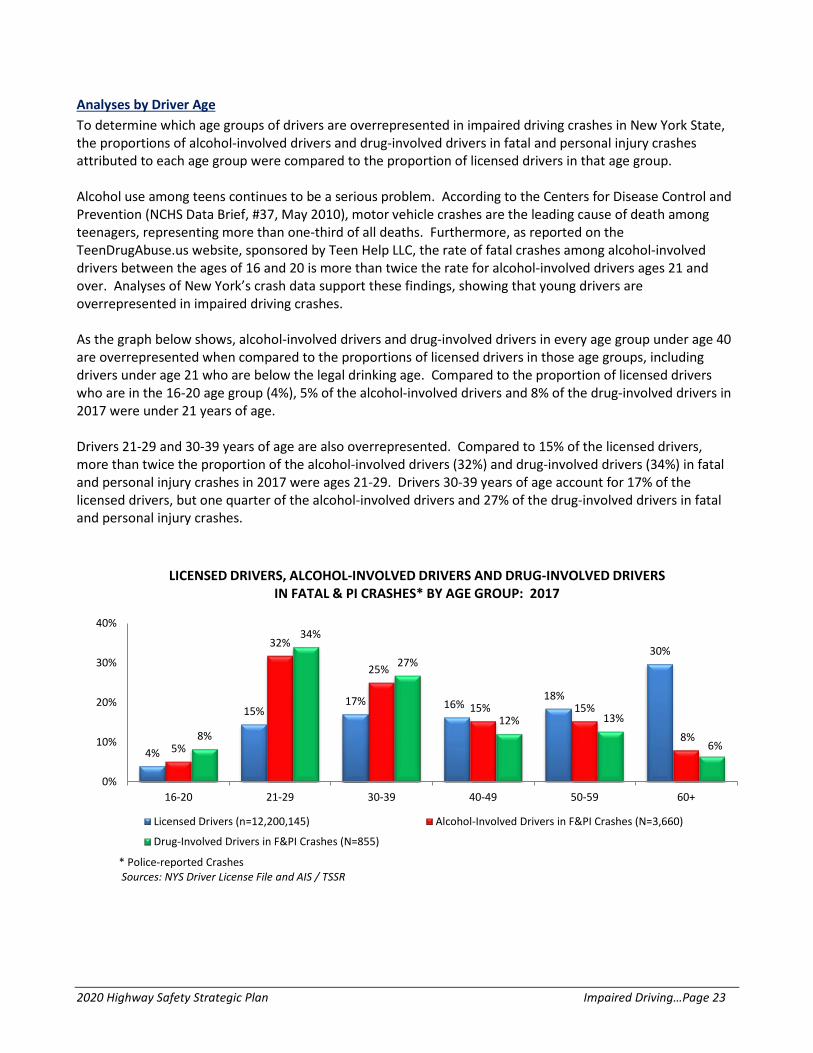
Analyses by Driver Age To determine which age groups of drivers are overrepresented in impaired driving crashes in New York State, the proportions of alcohol-involved drivers and drug-involved drivers in fatal and personal injury crashes attributed to each age group were compared to the proportion of licensed drivers in that age group. Alcohol use among teens continues to be a serious problem. According to the Centers for Disease Control and Prevention (NCHS Data Brief, #37, May 2010), motor vehicle crashes are the leading cause of death among teenagers, representing more than one-third of all deaths. Furthermore, as reported on the TeenDrugAbuse.us website, sponsored by Teen Help LLC, the rate of fatal crashes among alcohol-involved drivers between the ages of 16 and 20 is more than twice the rate for alcohol-involved drivers ages 21 and over. Analyses of New York’s crash data support these findings, showing that young drivers are overrepresented in impaired driving crashes. As the graph below shows, alcohol-involved drivers and drug-involved drivers in every age group under age 40 are overrepresented when compared to the proportions of licensed drivers in those age groups, including drivers under age 21 who are below the legal drinking age. Compared to the proportion of licensed drivers who are in the 16-20 age group (4%), 5% of the alcohol-involved drivers and 8% of the drug-involved drivers in 2017 were under 21 years of age. Drivers 21-29 and 30-39 years of age are also overrepresented. Compared to 15% of the licensed drivers, more than twice the proportion of the alcohol-involved drivers (32%) and drug-involved drivers (34%) in fatal and personal injury crashes in 2017 were ages 21-29. Drivers 30-39 years of age account for 17% of the licensed drivers, but one quarter of the alcohol-involved drivers and 27% of the drug-involved drivers in fatal and personal injury crashes.
4%
15%17% 16%
18%
30%
5%
32%
25%
15% 15%
8%8%
34%
27%
12% 13%
6%
0%
10%
20%
30%
40%
16-20 21-29 30-39 40-49 50-59 60+
LICENSED DRIVERS, ALCOHOL-INVOLVED DRIVERS AND DRUG-INVOLVED DRIVERS IN FATAL & PI CRASHES* BY AGE GROUP: 2017
Licensed Drivers (n=12,200,145) Alcohol-Involved Drivers in F&PI Crashes (N=3,660)
Drug-Involved Drivers in F&PI Crashes (N=855)
* Police-reported CrashesSources: NYS Driver License File and AIS / TSSR
2020 Highway Safety Strategic Plan Impaired Driving…Page 24
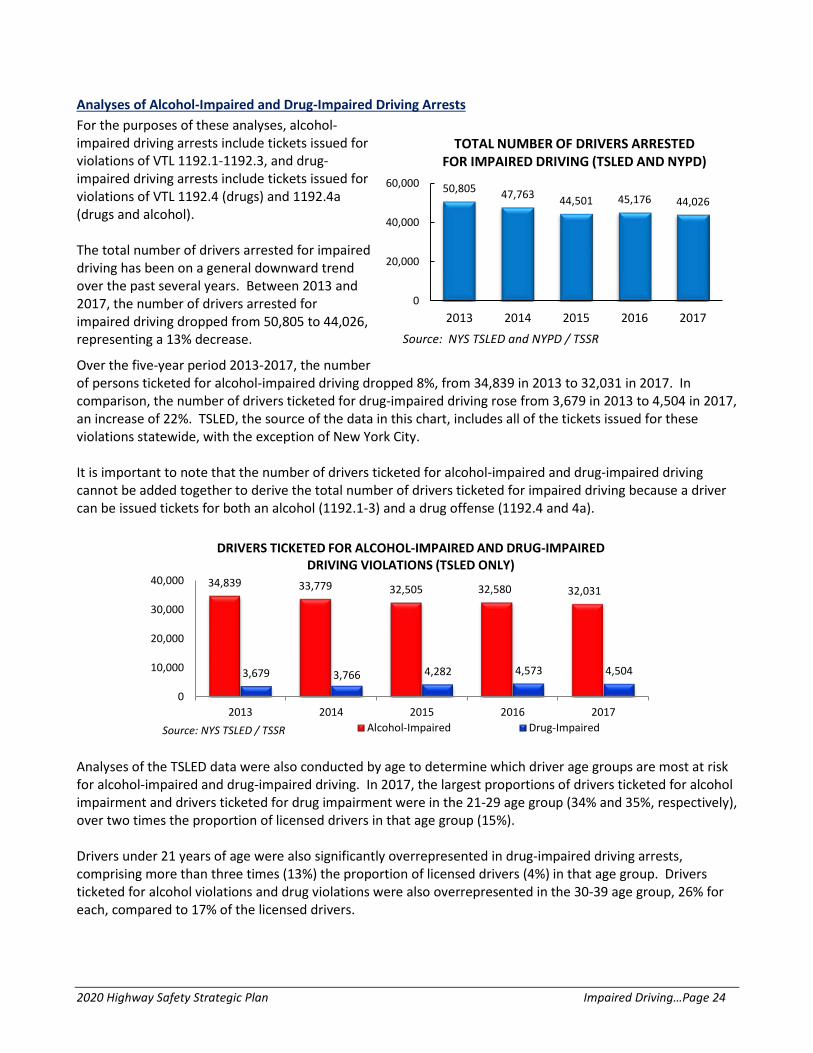
Analyses of Alcohol-Impaired and Drug-Impaired Driving Arrests For the purposes of these analyses, alcohol-impaired driving arrests include tickets issued for violations of VTL 1192.1-1192.3, and drug-impaired driving arrests include tickets issued for violations of VTL 1192.4 (drugs) and 1192.4a (drugs and alcohol). The total number of drivers arrested for impaired driving has been on a general downward trend over the past several years. Between 2013 and 2017, the number of drivers arrested for impaired driving dropped from 50,805 to 44,026, representing a 13% decrease.
Over the five-year period 2013-2017, the number of persons ticketed for alcohol-impaired driving dropped 8%, from 34,839 in 2013 to 32,031 in 2017. In comparison, the number of drivers ticketed for drug-impaired driving rose from 3,679 in 2013 to 4,504 in 2017, an increase of 22%. TSLED, the source of the data in this chart, includes all of the tickets issued for these violations statewide, with the exception of New York City. It is important to note that the number of drivers ticketed for alcohol-impaired and drug-impaired driving cannot be added together to derive the total number of drivers ticketed for impaired driving because a driver can be issued tickets for both an alcohol (1192.1-3) and a drug offense (1192.4 and 4a).
Analyses of the TSLED data were also conducted by age to determine which driver age groups are most at risk for alcohol-impaired and drug-impaired driving. In 2017, the largest proportions of drivers ticketed for alcohol impairment and drivers ticketed for drug impairment were in the 21-29 age group (34% and 35%, respectively), over two times the proportion of licensed drivers in that age group (15%). Drivers under 21 years of age were also significantly overrepresented in drug-impaired driving arrests, comprising more than three times (13%) the proportion of licensed drivers (4%) in that age group. Drivers ticketed for alcohol violations and drug violations were also overrepresented in the 30-39 age group, 26% for each, compared to 17% of the licensed drivers.
50,805 47,763 44,501 45,176 44,026
0
20,000
40,000
60,000
2013 2014 2015 2016 2017
TOTAL NUMBER OF DRIVERS ARRESTED FOR IMPAIRED DRIVING (TSLED AND NYPD)
Source: NYS TSLED and NYPD / TSSR
34,839 33,779 32,505 32,580 32,031
3,679 3,766 4,282 4,573 4,504
0
10,000
20,000
30,000
40,000
2013 2014 2015 2016 2017
DRIVERS TICKETED FOR ALCOHOL-IMPAIRED AND DRUG-IMPAIRED DRIVING VIOLATIONS (TSLED ONLY)
Alcohol-Impaired Drug-ImpairedSource: NYS TSLED / TSSR

2020 Highway Safety Strategic Plan Impaired Driving…Page 25
Strategies Using a data-driven approach, New York has identified a comprehensive set of strategies that collectively will enable the state to reach the performance targets for the Impaired Driving program area. Examples of activities that will be considered for funding are listed under each strategy. Strategy AL-1: Enforcement of Impaired Driving Laws Initiatives to increase high visibility enforcement of the impaired driving laws will continue to be supported at both the state and local levels. All impaired driving enforcement efforts will be planned, implemented and monitored in accordance with requirements of the state’s Evidence-Based Traffic Safety Enforcement Plan or in conjunction with the national impaired driving mobilizations. New York police agencies continue to participate in national crack-downs that coincide with the times large numbers of impaired drivers are likely to be on the highways. Due to the cooperation and support of all county STOP-DWI program coordinators statewide, there was widespread participation by the police agencies across New York State during the crackdowns. The results of the grant-funded crackdown initiatives in FFY 2018 are summarized below:
• Halloween: 19 counties and 62 agencies participated resulting in 13 DWI/DWAI arrests, 1 DWAI-Drug only arrest, 25 other arrests and 339 V&T summonses.
• Thanksgiving: 31 counties and 92 agencies participated resulting in 43 DWI/DWAI arrests, 6 DWAI-Drug only arrests, 38 other arrests and 581 V&T summonses.
• Holiday Season National Mobilization: 37 counties and 110 agencies participated resulting in 63 DWI/DWAI arrests, 5 DWAI-Drug only arrests, 67 other arrests and 729 V&T summonses.
• Super Bowl Crackdown: 30 counties and 86 agencies participated resulting in 38 DWI/DWAI arrests, 0 DWAI-Drug only arrests, 35 other arrests and 422 V&T summonses.
• St. Patrick’s Day Crackdown: 38 counties and 125 agencies participated resulting in 62 DWI/DWAI arrests, 2 DWAI-Drug only arrests, 75 other arrests and 913 V&T summonses.
4%
15%17% 16% 18%
30%
4%
34%
26%
17%13%
6%
13%
35%
26%
13%9%
4%
0%
10%
20%
30%
40%
16-20 21-29 30-39 40-49 50-59 60+
LICENSED DRIVERS AND DRIVERS TICKETED FOR ALCOHOL IMPAIRMENT AND DRUG IMPAIRMENT BY AGE GROUP: 2017 (TSLED ONLY)
Licensed Drivers (n=12,200,145) Drivers Ticketed for Alcohol Impairment (N=32,031)Drivers Ticketed for Drug Impairment (N=4,504)
Sources: NYS Driver License File and TSLED / TSSR

2020 Highway Safety Strategic Plan Impaired Driving…Page 26
• Memorial Day Crackdown: 39 counties and 128 agencies participated resulting in 49 DWI/DWAI arrests, 8 DWAI-Drug only arrests, 94 other arrests and 986 V&T summonses.
• July 4th Crackdown: 39 counties and 121 agencies participated resulting in 54 DWI/DWAI arrests, 4 DWAI-Drug only arrests, 101 other arrests and 1,327 V&T summonses.
• Labor Day National Mobilization: 36 counties and 126 agencies participated resulting in 71 DWI/DWAI arrests, 9 DWAI-Drug only arrests, 124 other arrests and 1,660 V&T summonses.
Impaired Driving Enforcement Grants for Local Police Agencies AL-2020-001 To supplement the funding available from STOP-DWI, GTSC may provide grant funding to support the development and implementation of evidence-based enforcement strategies by local agencies including publicized enforcement programs, such as regional saturation patrols, sobriety checkpoints, roving patrols and sting operations. GTSC will also provide support and coordination for local agency participation in the national impaired driving enforcement mobilizations. Specific enforcement agencies may receive funding to facilitate the coordination of enforcement events and test innovative approaches. For example, certified Drug Recognition Experts may be included at selected enforcement events to assist in the detection of drug impairment. Data from the mobilizations will be compiled by GTSC and provided to the National Highway Traffic Safety Administration (NHTSA). Statewide High Visibility Focused Enforcement Campaigns AL-2020-002 Statewide enforcement campaigns that focus on impaired driving will be supported. To ensure that resources are used efficiently, these campaigns will incorporate evidence-based strategies that are deployed based on a data-driven problem identification process. For example, funding will continue to be provided for impaired driving enforcement programs undertaken by the New York State Police and implemented by the State Police Troops across the state. Each Troop is required to develop a data-driven action plan focusing on the impaired driving issues, high-risk drivers and locations identified for their Troop areas. In addition to participation in the national impaired driving crackdowns, the State Police use dedicated DWI patrols, sobriety checkpoints and other evidence-based enforcement strategies to implement their action plans. Media Support for National Impaired Driving Enforcement Mobilizations AL-2020-003 The National Impaired Driving Enforcement Mobilization will be publicized through press events held in various locations around the state where members of law enforcement and STOP-DWI coordinators will join GTSC in publicizing the crackdown on impaired driving. To ensure that coordinated impaired driving messages are delivered throughout the state, GTSC will provide funding for public information materials through the STOP-DWI Foundation. As in previous years, the national slogan will be adopted for the mobilization. Impaired Driving Enforcement Training for Police Officers AL-2020-004 Effective enforcement requires that adequate resources be available to the state’s police agencies. Training programs for police officers, such as Standardized Field Sobriety Test (SFST) training, enhance enforcement by increasing the knowledge and capabilities of police officers. Effective training programs, as well as innovative delivery approaches such as podcasts and roll call videos, will be funded under this activity. Impaired Driving Enforcement Tools AL-2020-005 In addition to training, police officers must be equipped with the tools necessary to accurately detect impairment and to report that level of impairment in an evidentiary manner. The availability of up-to-date breath testing instruments and other new technology, including expertly maintained equipment, can support the police through evidence preparation and DWI arrest data reporting and is vital to an effective impaired
2020 Highway Safety Strategic Plan Impaired Driving…Page 27
driving enforcement program. This planned activity will be incorporated into the enforcement activities undertaken under the Statewide High Visibility Focused Enforcement Campaigns planned activity (AL-2020-002). The New York State Police must have access to the most up-to-date tools to collect reliable evidence that will uphold impaired driving arrests made during dedicated DWI patrols, sobriety checkpoints and other high visibility enforcement efforts and will lead to convictions in court. Strategy AL-2: Prosecution and Adjudication of DWI Offenders
GTSC will continue to support countermeasures that improve the effectiveness of the prosecution and adjudication of impaired driving offenders. Courtroom Training on Impaired Driving for Police, Probation, Prosecutors & Judges AL-2020-006 Training programs to increase the courtroom skills of officers making DWI arrests and training for probation officers, prosecutors and judges on the techniques of handling impaired driving cases will be supported. These programs will incorporate the latest information on law enforcement practices and judicial decisions in impaired driving cases. Funding will be provided for Traffic Safety Resource Prosecutors and Judicial Outreach Liaisons who are experienced in handling DWI cases and can provide training, education and technical support to prosecutors and other court personnel as well as law enforcement. Court Systems Communication Improvements AL-2020-007 In addition to training for court personnel, efforts to facilitate and promote communication and the exchange of information among the courts in the state, and between the courts and the state’s traffic safety community, are important. GTSC will continue to support a Judicial Outreach Liaison to serve as a conduit between the courts and law enforcement, prosecutors and other criminal justice professionals. The responsibilities of the JOL will include representing the court system on the Impaired Driving Advisory Council; monitoring legislative and regulatory changes and informing judicial and non-judicial personnel of changes that may impact the processing of DWI court cases; designing and implementing education programs for judges and justices to raise awareness of the dangers posed by impaired motorists; and promoting the use of ignition interlocks and other evidence-based and promising practices for sentencing and supervision. Alternative Sanction Programs for Impaired Drivers AL-2020-008 Innovative projects that implement alternative or innovative sanctions for impaired drivers, such as special court programs for convicted alcohol-impaired and drug-impaired offenders and Victim Impact Panels, will also be funded. Improvement of Toxicology Services AL-2020-009 Because the successful prosecution of DWI offenders depends on the strength and quality of the evidence that is presented, projects that improve the availability and quality of evidentiary data, such as toxicology reports used in the adjudication of impaired driving cases, will also be funded. For example, the New York State Police is proposing to develop technological improvements that would enhance the agency’s toxicology lab’s operational efficiency, the communication of results and the ability to provide statistical information to the traffic safety community. Projects that would augment staff and other resources leading to the improvement of toxicology services will also be considered for funding. Strategy AL-3: DWI Offender Treatment, Monitoring, Control Countermeasures that are intended to have an impact on drivers convicted of impaired driving offenses and deter them from driving after drinking in the future are also an important component of New York’s impaired driving program. Projects that assist with the successful implementation and operation of selective deterrence countermeasures or with the monitoring of convicted offenders to ensure compliance are eligible for GTSC

2020 Highway Safety Strategic Plan Impaired Driving…Page 28
funding under this strategy. The Department of Motor Vehicles, the Office of Alcoholism and Substance Abuse Services, and the Division of Criminal Justice Services Office of Probation and Correctional Alternatives also devote significant resources to the treatment, monitoring and control of DWI offenders. Monitoring of Ignition Interlock & Other Alcohol Detection Devices AL-2020-010 The implementation of legislation requiring ignition interlocks for drivers convicted of alcohol-related offenses is a proven countermeasure. Effective August 2010, all drivers convicted of DWI in New York State are required to have an ignition interlock installed in any vehicle they own or operate. A strong monitoring component to determine compliance is critical to the effectiveness of this sanction. Projects that support monitoring activities and other efforts to improve compliance, such as multi-agency surveillance efforts, will be supported. The DCJS Office of Probation and Correctional Alternatives also expends substantial resources on the monitoring of convicted DWI offenders on probation. Other types of monitoring, such as enhanced monitoring of DWI offenders through the use of alcohol detection devices worn on the person coupled with probation or other court-sanctioned supervision, may also be employed by New York courts or prosecutors as a means of preventing DWI recidivism. Impaired Driver Program (IDP) AL-2020-011 The problem of DWI recidivism and persistent drinking drivers will continue to be addressed through the state’s Impaired Driver Program (IDP) and its treatment referral mechanism. In addition to the fee-based services provided by the IDP programs, projects to improve the effectiveness of the program will be considered for GTSC funding. These may include the development of information and reporting systems to facilitate communication or improve tracking and monitoring, training for providers of screening and assessment services, or program improvements such as the development and implementation of a new evidence-based curriculum. Strategy AL-4: Prevention, Communications, Public Information and Educational Outreach Countermeasures that inform the public of the dangers of impaired driving in order to prevent drinking and/or using drugs and then driving also play an important role in New York’s comprehensive program. Statewide Public Awareness Campaign AL-2020-012 Statewide campaigns that use tested messaging to raise public awareness, such as the slogans and themes used in national campaigns, as well as communication and outreach activities that generate publicity for the effective execution of the proven strategy of high visibility enforcement will be funded. Education & Outreach to High-Risk Groups AL-2020-013 Projects that provide education and other outreach efforts at specific types of locations or for specific high-risk groups will be supported. Included are projects that deliver information and education at venues such as sporting events that are popular with persons who have been identified as high-risk for impaired driving, as well as projects that provide training for servers of alcoholic beverages at restaurants, bars and other establishments. Educational efforts that focus on specific groups, such as young drivers, will also be supported. Media campaigns and other public information and education activities conducted by organizations, such as SADD, that raise awareness of the scope and seriousness of underage drinking and driving and complement and enhance the

2020 Highway Safety Strategic Plan Impaired Driving…Page 29
effectiveness of the specific enforcement countermeasures that are implemented are eligible for funding. The promotion of designated drivers or the use of alternate forms of transportation will also be considered for funding. Projects that provide communication and outreach to the general public regarding the dangers of drugged driving, and specifically impairment resulting from prescription drug use, will also be eligible for funding. There is also a need to increase awareness and educate professionals who deal with high-risk populations including treatment professionals, probation officers and other professionals within the state’s impaired driving system. For FFY 2020, New York has received proposals that will address identified high-risk populations with public awareness messaging campaigns. One such grant application is from the NYS STOP-DWI Foundation, which proposes to coordinate impaired driving public awareness initiatives at sporting franchises, college campuses, regional venues and the New York State Fair. Campaign materials will contain consistent prevention messaging intended to enhance the perceived risk of detection for driving while impaired. Campaign efforts will be coordinated with local STOP-DWI law enforcement efforts. The “Have a Plan” message and mobile app will also be incorporated into these public awareness efforts. Strategy AL-5: Underage Drinking and Alcohol-Impaired Driving In addition to general deterrence approaches to reduce impaired driving, countermeasures that focus on specific groups of drivers are needed. Because the data show that drivers under the legal drinking age of 21 are overrepresented in alcohol-related fatal and injury crashes, special efforts are particularly needed to address underage drinking and driving. Compliance with Underage Drinking Laws AL-2020-014 Countermeasures that limit access to alcohol by persons under the legal drinking age of 21 will continue to be supported in FFY 2020. These include projects that focus on preventing vendors from selling alcohol to minors such as sting operations, and projects designed to prevent minors from illegally purchasing alcohol such as checks to identify fraudulent IDs. Resources from the State Liquor Authority, DMV’s Office of Field Investigation and local police agencies are also used in these operations. Also eligible for funding are projects that address the issue of social host liability and parents and other adults who provide minors with access to alcohol.
Enforcement efforts that focus on patrolling areas and specific locations popular with underage drinkers and the
establishment of an underage tip line that the public can use to notify police when drinking by minors is observed are two evidence-based countermeasures that will also be supported. Strategy AL-6: Drugged Driving Recent studies by the Institute for Traffic Safety Management and Research have documented that the involvement of drugs in fatal crashes is a serious issue in New York State. In 2017, 24% of the traffic fatalities in the state occurred in a drug-related crash, up from 18% in 2014. Drivers under 30 years of age are significantly overrepresented among the drug-impaired drivers involved in fatal and personal injury crashes; for drivers under age 21, drugs and driving may be an even more serious issue than drinking and driving. In addition to impairment from illegal drug use, there is increased awareness of the dangers of mixing prescription drugs and driving.

2020 Highway Safety Strategic Plan Impaired Driving…Page 30
Drugged Driving Enforcement Training AL-2020-015 Effective enforcement of drugged driving requires training programs that provide law enforcement with the knowledge and tools to detect and arrest those who operate a motor vehicle while impaired by drugs and provide testimony that will lead to a conviction. Projects that provide training for law enforcement personnel, including the Drug Recognition Expert (DRE) and Advanced Roadside Impaired Driving Enforcement (ARIDE) training programs, are eligible for funding. Impaired driving enforcement efforts that integrate drugged driving enforcement into other enforcement activities by incorporating law enforcement personnel who have completed these special training courses and enforcement efforts that focus on high-risk areas for drugged driving will also be encouraged. Drugged Driving Training for Prosecutors, Judges and Toxicologists AL-2020-016 In addition to law enforcement, the provision of training to other professional groups is important to the successful prosecution and adjudication of drugged driving cases. Projects that provide training for prosecutors, toxicologists who provide expert testimony in court cases, and court personnel will be considered for funding. Programs to increase the sophistication of the screening process at the toxicology labs and the sharing of information from this process with the professional community can be important for detecting impairment caused by prescription, illicit and so-called designer drug use. Strategy AL-7: Cooperative Approaches to Reducing Impaired Driving
Projects that promote coordination and cooperation among all components of the impaired driving system will be supported. Impaired Driving Summits, Symposia & Workshops AL-2020-017 Activities such as workshops, summits and symposia that provide information and offer opportunities for highway safety program managers, law enforcement and other partners to exchange ideas and best practices on topics related to impaired driving are eligible for funding. Interagency Collaborations on Impaired Driving AL-2020-018 Support will be provided for interagency collaborations, such as the Advisory Council on Impaired Driving, that recognize the multi-disciplinary nature of the impaired driving issue and lead to the generation of more effective approaches to reducing crashes, fatalities and injuries resulting from impaired driving. Strategy AL-8: Research, Evaluation and Analytical Support for New York’s Performance-Based Impaired Driving Program Projects that support the state’s comprehensive data-driven Impaired Driving program will be funded under this strategy. The data-driven, performance-based approach to reducing crashes, fatalities and injuries resulting from impaired driving requires access to the appropriate data as well as the technical capabilities to perform the analyses and interpret the results. Research and evaluation studies that assist in the identification and documentation of impaired driving issues and the assessment of the effectiveness of legislative initiatives and other countermeasures that are implemented will be eligible for funding. Impaired Driving Research AL-2020-019 Projects that conduct research and evaluation studies on alcohol and drug impaired driving to support the development of data-driven countermeasures and assessment of their effectiveness will be funded.

2020 Highway Safety Strategic Plan Police Traffic Services…Page 31
POLICE TRAFFIC SERVICES Overview The key objective of the Police Traffic Services (PTS) Program is to prevent fatalities, injuries, crashes and traffic violations in high-risk areas through data-driven high visibility enforcement. Enforcement efforts focus on improving traffic safety by reducing unsafe behaviors including speeding and other types of dangerous driving, failure to wear a seat belt, and distracted driving, in particular texting and talking on hand-held cell phones. Enforcement strategies related to impaired driving, motorcycle safety, pedestrians and bicycle safety are included under their respective sections in the Highway Safety Strategic Plan. The Governor’s Traffic Safety Committee (GTSC) provides expertise to assist in the promotion and coordination of New York’s data-driven enforcement program involving police agencies at the state, county and local levels. The funds and other resources GTSC devotes to reducing traffic violations and the resulting crashes, fatalities and injuries are complemented by a number of other federal, state, local and private sector activities. While a real dollar amount cannot be accurately estimated for the contributions of each of the partners involved in the state’s highway safety enforcement program, the most significant sources of funding, programming and in-kind support that assist in achieving the performance goals established in the HSSP include the following: county and local enforcement agencies; New York State Police; New York State Park Police; NYS Association of Chiefs of Police; NYS Division of Criminal Justice Services; NYS Sheriffs’ Association and New York Association for Pupil Transportation. The combination of high visibility enforcement and sustained traffic safety messaging has proven to be effective in reducing dangerous driving behaviors and is an important component of the Police Traffic Services program area as well as the overall traffic safety program in New York. This enforcement model has been successfully applied to other GTSC funded initiatives that use dedicated traffic enforcement details to address specific types of unsafe driving behaviors. To maximize the effectiveness of the strategies that are implemented, a data-driven approach must be used to identify enforcement priorities and where and when to deploy resources. This program area also encompasses training opportunities for the state’s traffic enforcement community where new skills are acquired and the latest traffic enforcement tactics are shared. The Police Traffic Services program area serves as the primary vehicle for the implementation of the state’s evidence-based Traffic Safety Enforcement Program (TSEP). To ensure that New York’s enforcement grant funds are deployed based on data-driven problem identification, GTSC identifies the statewide geographic and demographic areas of concern through analyses of crash data. GTSC then identifies police agencies with traffic enforcement jurisdiction in the most problematic areas, and through its Highway Safety Program Representatives and Law Enforcement Liaison networks, conducts outreach to encourage agencies to apply for grant funds. Using the state’s priority areas as the framework, GTSC’s Police Traffic Services (PTS) grant program is the primary funding effort to direct traffic enforcement grant funds to New York’s police agencies. Enforcement efforts described under other program areas are planned, implemented and monitored in accordance with the state’s TSEP plan. The PTS grant application form guides agencies through the process of using local crash and ticket data to identify problem areas specific to their communities. Police agencies are required to correlate crash- causing traffic violations or driver behaviors with specific times and locations in their jurisdictions so officer resources

2020 Highway Safety Strategic Plan Police Traffic Services…Page 32
are allocated to details directly related to the identified problems. As part of the FFY 2020 PTS application, the Institute for Traffic Safety Management and Research (ITSMR) compiled agency-specific spreadsheets with crash and ticket data for the years 2013-2017, as well as preliminary 2018 data for each PTS grant applicant. Based on these analyses, applicants complete a data-driven “Work Plan” which presents their proposed countermeasures and enforcement strategies. During the PTS grant review process, GTSC scores applications based on the data and problem identification process, the strength of the work plan, the past performance of the agency, and crash and ticket trends in the jurisdiction. Once a grant is awarded, Program Representatives, accompanied by Law Enforcement Liaisons if requested, conduct on-site monitoring visits to review the grant activities and discuss with grantees the impact the enforcement activities may be having in their jurisdictions. During monitoring contacts, Program Representatives also reinforce the message that enforcement resources should be deployed to areas at times when problems are known to occur. During the grant period, grantees are required to submit two progress reports that include a narrative describing grant activities and data on crashes and tickets issued during the reporting period. GTSC reviews these reports to assess the progress resulting from the agency’s data-driven enforcement activities. This information is used to adjust the agency’s operational plans for subsequent mobilizations and other high visibility enforcement activities and to determine the agency’s eligibility for future awards. Performance Report The core outcome measure for tracking progress in the Police Traffic Services program area is speeding-related fatalities. Because distracted driving is also a focus of this program area warranting specific strategies to reduce violations of the state’s cell phone and texting laws, a new performance measure for distracted driving, fatal and personal injury crashes involving cell phone use and texting, was added to New York’s HSSP starting in FFY 2015. The sources for this measure are the state’s Accident Information System (AIS) and the TSLED and AA ticket systems. Number of speeding-related fatalities
The 5-year moving average for speeding-related fatalities was on a general downward trend in recent years, with the exception of a small increase to 345 in the average for 2011-2015. Because the average for speeding-related fatalities decreased to 330 in 2013-2017, the target of 327.4 set for 2015-2019 is likely to be met.
359 322 347 314 308
352 342 345 341 330
0
100
200
300
400
2013 2014 2015 2016 2017
SPEEDING-RELATED FATALITIES
S-R Fatalities 5 Yr Moving AvgSource: FARS
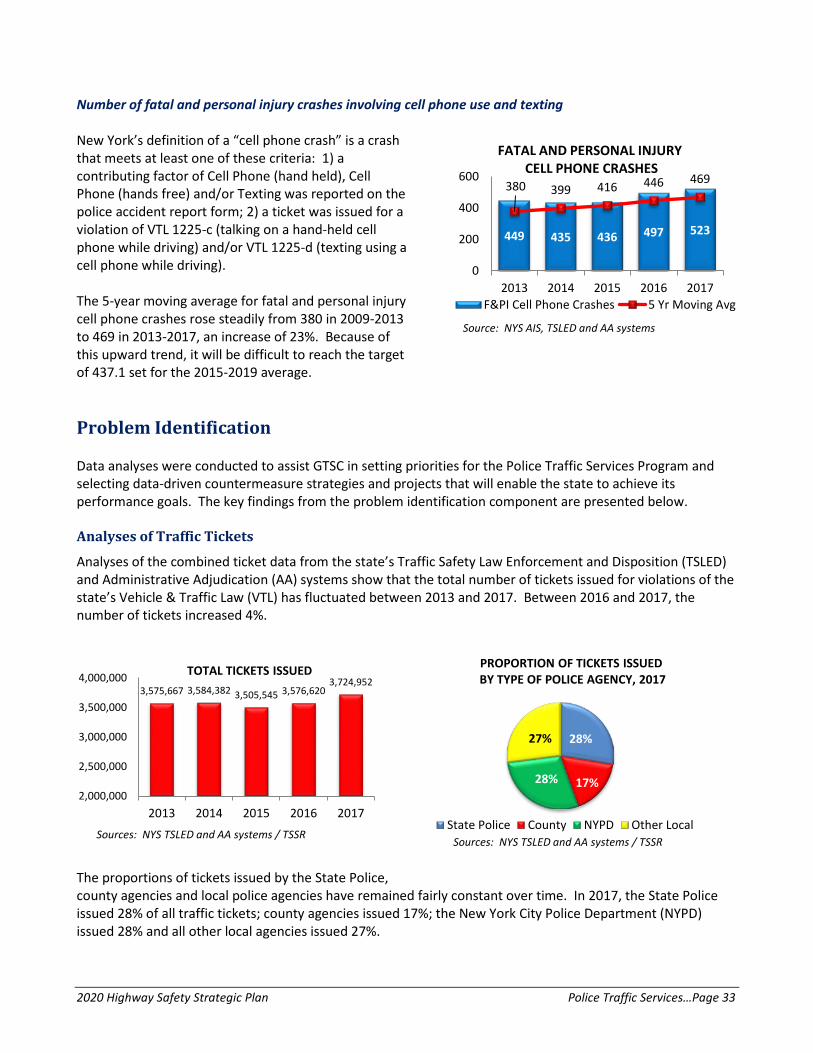
2020 Highway Safety Strategic Plan Police Traffic Services…Page 33
Number of fatal and personal injury crashes involving cell phone use and texting New York’s definition of a “cell phone crash” is a crash that meets at least one of these criteria: 1) a contributing factor of Cell Phone (hand held), Cell Phone (hands free) and/or Texting was reported on the police accident report form; 2) a ticket was issued for a violation of VTL 1225-c (talking on a hand-held cell phone while driving) and/or VTL 1225-d (texting using a cell phone while driving). The 5-year moving average for fatal and personal injury cell phone crashes rose steadily from 380 in 2009-2013 to 469 in 2013-2017, an increase of 23%. Because of this upward trend, it will be difficult to reach the target of 437.1 set for the 2015-2019 average. Problem Identification
Data analyses were conducted to assist GTSC in setting priorities for the Police Traffic Services Program and selecting data-driven countermeasure strategies and projects that will enable the state to achieve its performance goals. The key findings from the problem identification component are presented below. Analyses of Traffic Tickets
Analyses of the combined ticket data from the state’s Traffic Safety Law Enforcement and Disposition (TSLED) and Administrative Adjudication (AA) systems show that the total number of tickets issued for violations of the state’s Vehicle & Traffic Law (VTL) has fluctuated between 2013 and 2017. Between 2016 and 2017, the number of tickets increased 4%.
The proportions of tickets issued by the State Police, county agencies and local police agencies have remained fairly constant over time. In 2017, the State Police issued 28% of all traffic tickets; county agencies issued 17%; the New York City Police Department (NYPD) issued 28% and all other local agencies issued 27%.
3,575,667 3,584,382 3,505,545 3,576,6203,724,952
2,000,000
2,500,000
3,000,000
3,500,000
4,000,000
2013 2014 2015 2016 2017
TOTAL TICKETS ISSUED
Sources: NYS TSLED and AA systems / TSSR
28%
17%28%
27%
PROPORTION OF TICKETS ISSUED BY TYPE OF POLICE AGENCY, 2017
State Police County NYPD Other LocalSources: NYS TSLED and AA systems / TSSR
449 435 436 497 523
380 399 416 446 469
0
200
400
600
2013 2014 2015 2016 2017
FATAL AND PERSONAL INJURYCELL PHONE CRASHES
F&PI Cell Phone Crashes 5 Yr Moving Avg
Source: NYS AIS, TSLED and AA systems

2020 Highway Safety Strategic Plan Police Traffic Services…Page 34
Contributing Factors in Crashes
Driver Inattention/Distraction is consistently the most frequently reported driver-related contributing factor in fatal and personal injury crashes, and its frequency has increased from 22% of fatal and PI crashes in 2013 to 25% in 2017. The next top factors are all related to aggressive driving; in 2017, Following Too Closely was reported for 21% of all police-reported fatal and personal injury crashes. Failure to Yield Right-of-Way was reported for 20%, and Unsafe Speed was reported for 10%.
CONTRIBUTING FACTORS IN FATAL AND PERSONAL INJURY CRASHES*
2013 2014 2015 2016 2017 (N=115,701) (N=109,828) (N=104,031) (N=113,821) (N=114,484) Driver Inattention/Distraction 21.8% 22.1% 22.3% 23.1% 25.1% Following Too Closely 18.1% 19.0% 19.9% 19.5% 21.0% Failure to Yield Right-of-Way 18.6% 18.7% 19.3% 18.5% 20.2% Unsafe Speed 11.2% 11.1% 11.5% 10.6% 10.4% *All data in this table are based on police-reported crashes Source: NYS AIS / TSSR
SPEEDING Analyses of Speed-Related Fatal and Personal Injury Crashes
Additional analyses of speed-related crashes were conducted using data from New York’s AIS; FARS and AIS data may not be strictly comparable due to definitional differences between the two systems. In the AIS, a speed-related crash is defined as a crash with a contributing factor of unsafe speed and/or a speeding ticket was issued to a driver involved in the crash. The number of speed-related fatal crashes has fluctuated over the five-year period 2013-2017. Between 2015 and 2017, these crashes decreased from 292 to 271. Over the five-year period 2013-2017, 28% to 29% of the fatal crashes that occurred in New York State each year involved speed. Between 2013 and 2017, speed-related injury crashes fluctuated from a high of 12,977 in 2013 to a low of 12,113 in 2017. The proportion of personal injury crashes that involved speed remained consistent at about 11% across the five years. Other Contributing Factors
In addition to Unsafe Speed, the top contributing factors associated with speeding drivers in fatal and personal injury crashes in 2017 are listed in the table below. Passing/ Unsafe Lane Changing (18%) and Alcohol Involvement (12%) were the two driver behavior factors most frequently reported for speeding drivers involved in fatal crashes.
SPEED-RELATED FATAL AND PERSONAL INJURY CRASHES* 2013 2014 2015 2016 2017
Fatal Crashes 318 280 292 274 271 % of all fatal crashes 28.7% 29.0% 27.9% 28.3% 29.0%
Injury Crashes 12,977 12,323 12,120 12,291 12,113 % of all injury crashes 11.3% 11.3% 11.8% 10.9% 10.7%
*All data in this table are based on police-reported crashes Source: NYS AIS / TSSR

2020 Highway Safety Strategic Plan Police Traffic Services…Page 35
For speeding drivers involved in personal injury crashes, Following Too Closely was identified as a contributing factor for 14%; Driver Inattention/Distraction and Passing/Unsafe Lane Changing were each reported as a factor for 9%; and Alcohol Involvement was reported for 8% of these drivers.
OTHER TOP CONTRIBUTING FACTORS ASSOCIATED WITH SPEEDING DRIVERS IN FATAL AND PERSONAL INJURY CRASHES: 2017
Analyses of Tickets
The number of tickets issued for speeding violations rose from 622,310 in 2013 to 712,370 in 2016, and then dropped to 693,051 in 2017, an overall 5-year increase of 11%. Over the five-year period 2013-2017, tickets issued for speeding ranged from 17% to 20% of all tickets issued for traffic violations, indicating that speeding continues to be a significant traffic safety problem in New York. Crash and Ticket Analyses by Region
Based on 2015-2017 data, the Upstate region of New York is overrepresented in speeding drivers in fatal and PI crashes (63%) and in drivers ticketed for speeding (73%) when compared with the proportion of licensed drivers in the region (50%). New York City with 32% of the state’s licensed drivers accounted for 20% of the speeding drivers in fatal and PI crashes and 18% of the drivers ticketed for speeding. Long Island was also underrepresented in speeding drivers (17%) and drivers ticketed for speeding (9%) when compared to its proportion of the state’s licensed drivers (18%).
Speeding Drivers in Fatal Crashes
Speeding Drivers in PI Crashes
(N=274) (N=12,233)
Alcohol Involvement 12% 8% Passing/Unsafe Lane Changing 18% 9% Driver Inattention/Distraction 7% 9% Failure to Keep Right 12% 3% Following Too Closely 1% 14% *All data in this table are based on police-reported crashes Source: NYS AIS
50%
32%
18%
63%
20% 17%
73%
18%9%
Upstate NYC Long Island0%
20%
40%
60%
80%
LICENSED DRIVERS, SPEEDING DRIVERS IN FATAL & PI CRASHES AND DRIVERS TICKETED FOR SPEEDING BY
REGION: 2015-2017
Licensed DriversSpeeding Drivers in F&PI CrashesDrivers Ticketed for Speeding
Sources: NYS AIS/TSSR, Driver License, TSLED and AA / TSSR Systems
622,310 661,962 694,180 712,370 693,051
0
200,000
400,000
600,000
800,000
2013 2014 2015 2016 2017
TICKETS ISSUED FOR SPEEDING VIOLATIONS
Sources: NYS TSLED and AA systems / TSSR
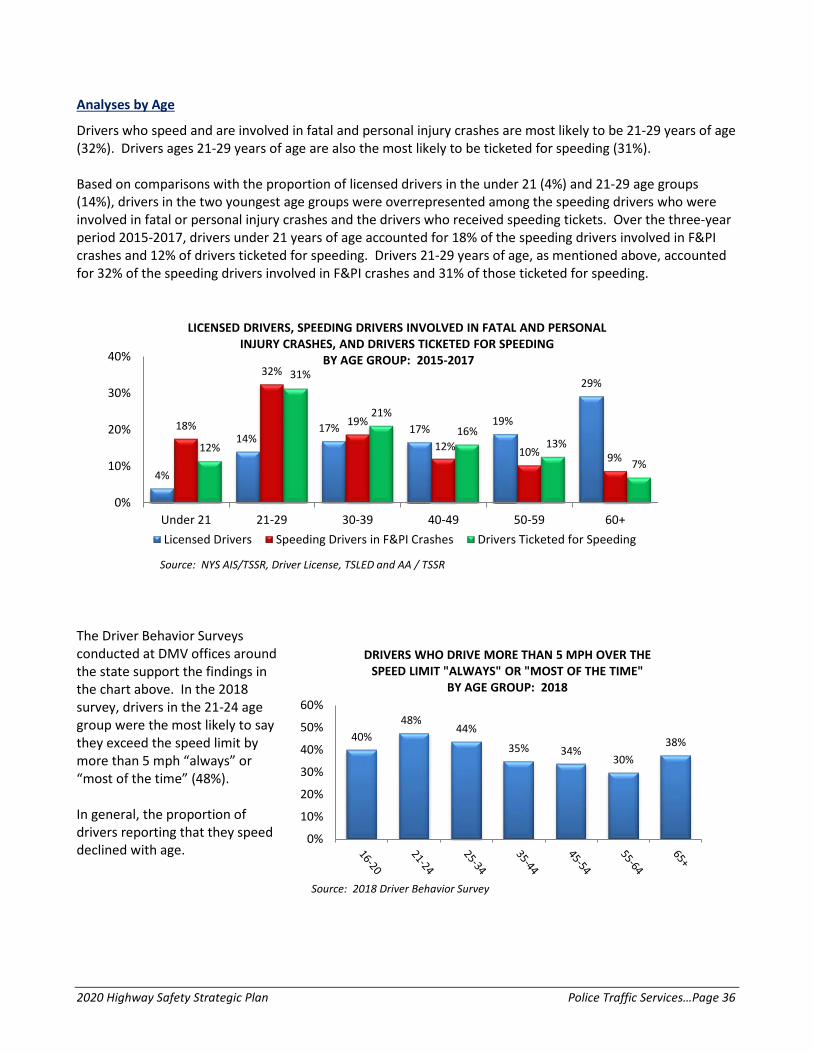
2020 Highway Safety Strategic Plan Police Traffic Services…Page 36
Analyses by Age
Drivers who speed and are involved in fatal and personal injury crashes are most likely to be 21-29 years of age (32%). Drivers ages 21-29 years of age are also the most likely to be ticketed for speeding (31%). Based on comparisons with the proportion of licensed drivers in the under 21 (4%) and 21-29 age groups (14%), drivers in the two youngest age groups were overrepresented among the speeding drivers who were involved in fatal or personal injury crashes and the drivers who received speeding tickets. Over the three-year period 2015-2017, drivers under 21 years of age accounted for 18% of the speeding drivers involved in F&PI crashes and 12% of drivers ticketed for speeding. Drivers 21-29 years of age, as mentioned above, accounted for 32% of the speeding drivers involved in F&PI crashes and 31% of those ticketed for speeding.
The Driver Behavior Surveys conducted at DMV offices around the state support the findings in the chart above. In the 2018 survey, drivers in the 21-24 age group were the most likely to say they exceed the speed limit by more than 5 mph “always” or “most of the time” (48%). In general, the proportion of drivers reporting that they speed declined with age.
40%48%
44%
35% 34%30%
38%
0%
10%
20%
30%
40%
50%
60%
DRIVERS WHO DRIVE MORE THAN 5 MPH OVER THE SPEED LIMIT "ALWAYS" OR "MOST OF THE TIME"
BY AGE GROUP: 2018
Source: 2018 Driver Behavior Survey
4%
14%17% 17%
19%
29%
18%
32%
19%
12% 10% 9%12%
31%
21%16%
13%
7%
0%
10%
20%
30%
40%
Under 21 21-29 30-39 40-49 50-59 60+
LICENSED DRIVERS, SPEEDING DRIVERS INVOLVED IN FATAL AND PERSONAL INJURY CRASHES, AND DRIVERS TICKETED FOR SPEEDING
BY AGE GROUP: 2015-2017
Licensed Drivers Speeding Drivers in F&PI Crashes Drivers Ticketed for Speeding
Source: NYS AIS/TSSR, Driver License, TSLED and AA / TSSR

2020 Highway Safety Strategic Plan Police Traffic Services…Page 37
DISTRACTED DRIVING: CELL PHONE USE AND TEXTING Analyses of Fatal and Personal Injury Crashes
Cell phone use, one of the unsafe driving behaviors frequently associated with driver inattention and distraction, continues to be reported in less than 1% of fatal and personal injury crashes; this could be due to underreporting. In 2017, two fatal crashes were reported to involve cell phone use, similar to previous years. The number of injury crashes involving cell phone use in 2017, including those involving both cell phone use and texting, increased 9% (468 vs. 427 in 2016). Between October 2010 when texting was added to the list of contributing factors on New York’s police crash report and 2017, only four fatal crashes were reported to involve texting. The number of personal injury crashes involving both cell phone use and texting, however, fluctuated during the five-year period, from a low of 47 in 2014 to a high of 69 in 2016. The number of injury crashes involving texting decreased from 70 in 2015 to 55 in 2017.
Analyses of Tickets
The number of tickets issued for violations of New York’s cell phone law continued on a downward trend, dropping 50% from 207,741 in 2013 to 104,786 in 2017. Between 2013 and 2017, the number of tickets issued statewide for texting violations increased more than 100%, from 55,458 to 112,529.
TICKETS ISSUED FOR VIOLATIONS OF THE CELL PHONE AND TEXTING LAWS
2013 2014 2015 2016 2017
Cell Phone Tickets 207,741 164,008 132,125 113,370 104,786
Texting Tickets 55,458 75,617 84,803 92,363 112,529
Source: NYS TSLED and AA Systems / TSSR
POLICE-RELATED FATAL AND PERSONAL INJURY CRASHES INVOLVING CELL PHONE USE AND TEXTING
2013 2014 2015 2016 2017
Fatal Crashes Involving Cell Phone Use 3 3 1 2 2
% of all fatal crashes 0.3% 0.3% 0.1% 0.2% 0.2%
Injury Crashes Involving Cell Phone Use 327 319 310 358 404
% of all injury crashes 0.3% 0.3% 0.3% 0.3% 0.3%
Fatal Crashes Involving both Cell Phone Use and Texting
0 0 0 0 1
Injury Crashes Involving both Cell Phone Use and Texting
48 47 55 69 64
Fatal Crashes Involving Texting 2 0 0 1 0
Injury Crashes Involving Texting 69 66 70 67 55
Total F&PI Cell Phone Crashes 449 435 436 497 526 Source: NYS AIS, TSLED and AA systems
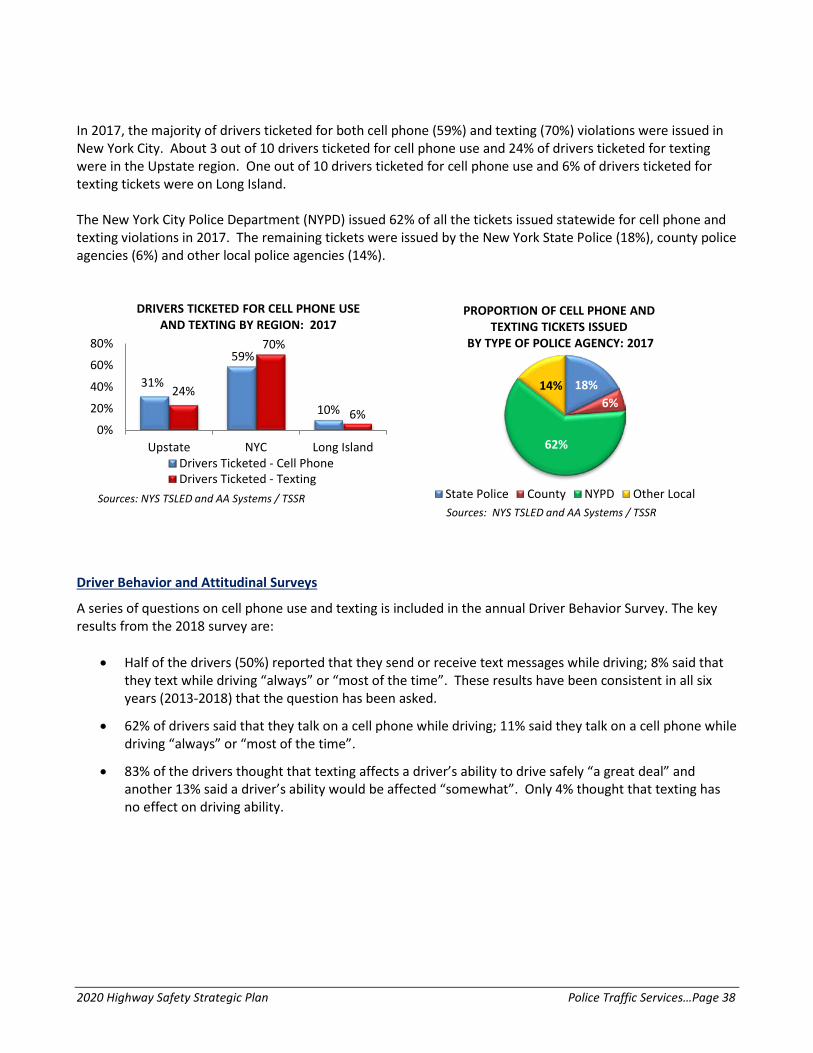
2020 Highway Safety Strategic Plan Police Traffic Services…Page 38
In 2017, the majority of drivers ticketed for both cell phone (59%) and texting (70%) violations were issued in New York City. About 3 out of 10 drivers ticketed for cell phone use and 24% of drivers ticketed for texting were in the Upstate region. One out of 10 drivers ticketed for cell phone use and 6% of drivers ticketed for texting tickets were on Long Island. The New York City Police Department (NYPD) issued 62% of all the tickets issued statewide for cell phone and texting violations in 2017. The remaining tickets were issued by the New York State Police (18%), county police agencies (6%) and other local police agencies (14%).
Driver Behavior and Attitudinal Surveys
A series of questions on cell phone use and texting is included in the annual Driver Behavior Survey. The key results from the 2018 survey are:
• Half of the drivers (50%) reported that they send or receive text messages while driving; 8% said that they text while driving “always” or “most of the time”. These results have been consistent in all six years (2013-2018) that the question has been asked.
• 62% of drivers said that they talk on a cell phone while driving; 11% said they talk on a cell phone while driving “always” or “most of the time”.
• 83% of the drivers thought that texting affects a driver’s ability to drive safely “a great deal” and
another 13% said a driver’s ability would be affected “somewhat”. Only 4% thought that texting has no effect on driving ability.
31%
59%
10%24%
70%
6%
Upstate NYC Long Island0%
20%
40%
60%
80%
DRIVERS TICKETED FOR CELL PHONE USE AND TEXTING BY REGION: 2017
Drivers Ticketed - Cell PhoneDrivers Ticketed - Texting
Sources: NYS TSLED and AA Systems / TSSR
18%6%
62%
14%
PROPORTION OF CELL PHONE AND TEXTING TICKETS ISSUED
BY TYPE OF POLICE AGENCY: 2017
State Police County NYPD Other LocalSources: NYS TSLED and AA Systems / TSSR

2020 Highway Safety Strategic Plan Police Traffic Services…Page 39
Survey responses regarding cell phone use and texting while driving were also analyzed by age.
• In 2018, drivers in the 16-20 age group were the most likely to report that they text while driving
“always” or “most of the time” (18%).
• Drivers in the two age groups under 25 years of age were the most likely to report that they “always/most of the time” talk on a cell phone while driving (15% for ages 16-20 and 17% for ages 21-24).
• Drivers ages 16-20 and over 64 surveyed in 2018 reported that they were more likely to text than to talk on a cell phone while driving. Drivers in every other age group reported that they were more likely to talk on a cell phone than to text while driving.
Strategies Using a data-driven approach, New York has identified a comprehensive set of strategies that collectively will enable the state to reach the performance targets for the Police Traffic Services program area. Examples of activities that will be considered for funding are listed under each strategy. Strategy PTS-1: Enforcement of Traffic Violations Enforcement of violations of the state’s Vehicle and Traffic Law is the basic strategy used to deter and reduce dangerous and illegal driving behaviors that contribute to crashes, fatalities and injuries on the roadway. Pedestrian enforcement efforts in targeted corridors and high-risk areas that focus on both motorists and pedestrians will also be considered for funding. Seat belt enforcement efforts, including participation in the national mobilization in May and the border-to-border initiative, will also be funded under the Police Traffic Services program area. These enforcement efforts will target unsafe and illegal behaviors and will not be limited to drivers of specific types of vehicles. Effective strategies include high visibility enforcement that combines saturation enforcement details and roving patrols; enforcement programs that target specific types of violations; high crash locations, times of day and other factors identified through a data-driven approach; and combined enforcement that increases the efficiency and effectiveness of the resources deployed. These resources will be channeled through the law enforcement community to conduct enforcement details that focus on drivers who exhibit dangerous driving behaviors regardless of the type of vehicle they are operating.
15%17%
11%13%
12%
6%
2%
18%
14%
8%9%
5%
1%3%
0%
5%
10%
15%
20%
16-20 21-24 25-34 35-44 45-54 55-64 65+
DRIVERS WHO "ALWAYS/MOST OF THE TIME" TALK ON A CELL PHONE OR TEXT WHILE DRIVING
BY AGE GROUP: 2018
Talk on Cell Phone TextSource: 2018 Driver Behavior Survey

2020 Highway Safety Strategic Plan Police Traffic Services…Page 40
GTSC will continue to support evidence-based enforcement projects that focus on enforcement of specific unsafe driving behaviors such as speeding, aggressive driving, cell phone use and texting; specific high-risk groups of motorists such as young drivers; specific vehicle types that pose special challenges such as commercial vehicles and school buses; and specific types of roadways or areas of the state overrepresented in crashes such as rural areas. Applications for funding will be required to use a data-driven approach to demonstrate the need for these focused enforcement efforts. The Data Driven Approaches to Crime and Traffic Safety (DDACTS) model and other strategies that use data to identify high crash locations, times of day when violations are most likely to occur, and other information that will lead to more effective deployment of enforcement resources will continue to be encouraged. Police agencies should consider the different areas within their community where crashes most frequently occur. This information will be useful when scheduling enforcement details. Projects that incorporate cooperative efforts among police agencies as well as efforts that target more than one type of violation will also be supported. Police Traffic Services (PTS) PTS-2020-001 Through the Police Traffic Services (PTS) program, GTSC provides resources for law enforcement agencies to address traffic safety issues in their respective jurisdictions. The agencies identify these issues through analyses of crash data that focus on where and when crashes are occurring and the contributing factors to those crashes. A review of these analyses provides law enforcement agencies with the information they need to design and implement traffic safety education and enforcement programs and countermeasures that will be effective in reducing the frequency and severity of crashes in the targeted areas. PTS grants use a variety of enforcement techniques such as stationary or moving patrols, low visibility (low profile) patrol cars for better detection and apprehension, bicycle patrols, police spotters in conjunction with dedicated patrol units at identified problem locations, high visibility patrol cars for prevention and deterrence and safety checkpoints. In FFY 2020, the primary emphasis will continue to be projects that focus on unsafe speed, aggressive driving behaviors and distracted driving. Seat belt enforcement efforts, including participation in the national mobilization in May and the border-to-border initiative, will also be eligible for PTS funding, as will enforcement efforts that focus on special categories of vehicles including commercial vehicles, motorcycles and school buses.
Coordinated special high visibility enforcement mobilizations involving multiple agencies will also be supported. Local agencies will be allowed to use their PTS grant funding to participate in events such as the Speed Week campaigns coordinated by the State Police, the New York State Association of Chiefs of Police and the New York State Sheriff’s Association and programs
such as “Operation Hang-Up” conducted by the New York State Police and the National Distracted Driving Enforcement Campaign to increase compliance with the state’s cell phone and texting laws. Enforcement conducted in conjunction with youth safe driving campaigns such as the “No Empty Chair” campaign will also continue to be funded. In addition, pedestrian enforcement efforts in targeted corridors and high-risk areas that focus on both motorists and pedestrians will be considered for funding. These enforcement efforts will target unsafe and illegal behaviors and will not be limited to drivers of specific types of vehicles.

2020 Highway Safety Strategic Plan Police Traffic Services…Page 41
Support for Operation Safe Stop, a statewide traffic safety education and enforcement event held one day a year to raise awareness and deter the illegal passing of a stopped school bus, will also continue. In FFY 2019, GTSC funded 241 PTS grants; 266 applications for PTS grants were received in FFY 2020. Statewide and New York City High Visibility Focused Enforcement Campaigns PTS-2020-002 Statewide and New York City enforcement campaigns that focus on a single traffic safety issue or unsafe driving behavior will be considered for funding. To ensure that resources are used efficiently, these campaigns will incorporate evidence-based strategies that are deployed based on a data-driven problem identification process. Enforcement campaigns undertaken by the New York State Police that focus on dangerous behaviors that are prevalent statewide, such as speeding or distracted driving, will be supported. One example of this is the GTSC-sponsored Speed Awareness Week – a high-visibility enforcement campaign aimed at reducing incidences of speed-related crashes. Enforcement campaigns implemented by the New York Police Department (NYPD) to address specific high priority issues that affect the five boroughs of New York City are also eligible for funding. For example, the NYPD is requesting funding to conduct pedestrian and bicyclist safety enforcement. Strategy PTS-2: Law Enforcement Training Programs Training and other educational programs that keep law enforcement up-to-date on new laws and emerging traffic safety issues and enhance skills in the detection and enforcement of specific types of violations and vehicles will continue to be funded. These types of programs may be delivered in a number of formats including traditional classroom programs, roll call videos and podcasts. Educational opportunities, such as the annual Empire State Law Enforcement Traffic Safety (ESLETS) Training Symposium, will also continue to be eligible for grant support. Awareness Training for Law Enforcement PTS-2020-003 Training programs that provide police officers with the knowledge and information needed to safely and more effectively enforce traffic violations involving specific types of vehicles, such as motorcycles and commercial vehicles, will be considered for funding. One example is the CMV Law Enforcement Awareness Trainings provided by GTSC in concert with members of the Suffolk County Highway Patrol CMV Enforcement Unit. Since its inception in 2014, GTSC has provided 15 one-day trainings to over 800 police officers representing over 130 agencies. In FFY 2020, there will be a continuation of this training, which provides information and best practices to law enforcement officers as they engage CMV drivers in routine traffic stops. Programs that educate law enforcement on particular safety issues related to specific groups of drivers, such as older drivers and vulnerable roadway users such as pedestrians and bicyclists, will also be supported. One new training program for law enforcement is the officer safety-focused Below 100 Train-the-Trainer Program for 2019. The initiative aims to reduce line-of-duty deaths (LODDs) nationally to below 100 annually. The training specifically focuses on and incorporates five Core Tenets that are changing police culture and saving lives: Wear Your Belt, Wear Your Vest, Watch Your Speed, What’s Important Now (WIN), and Remember, Complacency Kills. In addition to enforcing New York’s Vehicle and Traffic Laws, police agencies play an important role in educating motorists and raising public awareness. For example, law enforcement officers and other educational stakeholders are in a unique position to deliver traffic safety programs to at-risk teen drivers. Projects that provide toolkits and other educational resources for use by police officers and other educators will be considered for funding.

2020 Highway Safety Strategic Plan Police Traffic Services…Page 42
Evidence-Based Traffic Safety Enforcement Training for Law Enforcement PTS-2020-004 Through its Law Enforcement Liaisons, police officer training in the development of an Evidence-Based Enforcement plan will be provided. The training will educate law enforcement officers on the process of using local crash and ticket data to identify problem areas specific to their communities. The data-driven problem identification approach involves the correlation of crash-causing traffic violations or driver behaviors with specific times and locations in their jurisdictions. These analyses are then used to allocate police officer resources to details directly related to the identified problems. To ensure that enforcement resources are deployed effectively, police agencies are trained to implement evidence-based strategies. Police officers are also trained to continuously evaluate and adjust these strategies to accommodate shifts and changes in their local highway safety problems. Traffic Crash Investigation PTS-2020-005 Training programs in traffic crash investigation for the State Police and local enforcement agencies will be eligible for funding. Funding will also be provided to support activities directly related to crash investigations and timely crash reconstruction of serious personal injury and fatal motor vehicle crashes. The NYS Police will be the primary agency providing collision reconstruction of services. Funding will cover materials, supplies, travel and advanced technology to support crash reconstruction. Strategy PTS-3: Communications and Outreach Strong communication among police agencies at all jurisdictional levels is necessary to ensure the coordination and consistency of enforcement and deterrence efforts throughout the state. Through their networks, GTSC’s Law Enforcement Liaisons play a major role in communicating information and coordinating the involvement of law enforcement in the state’s highway safety program. In addition, the involvement of law enforcement in outreach efforts that educate the public and raise awareness of the dangers of behaviors such as texting and driving, failure to use a seat belt and impaired driving, is important in encouraging safe driving behaviors and compliance with the state’s traffic laws. Law Enforcement Liaisons PTS-2020-006 GTSC plays a major role in the coordination of statewide law enforcement efforts through its Law Enforcement Liaisons (LELs) representing the New York State Police, the NYS Sheriffs’ Association and the NYS Association of Chiefs of Police. The LELs provide GTSC with a strong police perspective on traffic safety through their law enforcement background and expertise. In addition, resources, communication networks and other statewide amenities are readily available through their organizations to further engage and promote a statewide coordinated response to traffic safety issues. The LELs are responsible for communicating GTSC’s statewide safety priorities to their enforcement networks and encouraging police agency participation in the Buckle Up New York-Click It or Ticket mobilizations, STOP-DWI Enforcement Crackdowns and many other traffic safety initiatives such as the Operation Safe Stop Campaign. The LELs also participate in the development and delivery of a number of training opportunities for police officers, including programs offered at the Empire State Law Enforcement Traffic Safety (ESLETS) Conference and the annual NY Highway Safety Symposium. Education and Outreach by Police Officers PTS-2020-007 One of the key elements of any traffic safety program is education. In addition to enforcing New York’s Vehicle and Traffic Laws, police agencies play an important role in educating motorists and raising public awareness. For example, law enforcement officers and other educational stakeholders are in a unique position to deliver traffic safety programs to at-risk teen drivers. Projects that provide toolkits and other educational resources for use by police officers and other educators will be considered for funding.

2020 Highway Safety Strategic Plan Motorcycle Safety…Page 43
MOTORCYCLE SAFETY Overview
Improving the safety of motorcyclists continues to be a priority for the state’s highway safety program. Since motorcycles share the road with much larger vehicles, a combination of strategies must be used to ensure safe riding practices and awareness of motorcyclists on our roadways. New York State has a comprehensive motorcycle safety program that supports motorcycle awareness, motorcycle helmet usage, responsible use of alcohol, and rider education, skill development and licensing. New York’s efforts to reduce motorcyclist fatalities and injuries have benefited greatly from the state’s universal motorcycle helmet law, a strategy that has proven to be highly effective in reducing motorcyclist injuries and fatalities. The Governor’s Traffic Safety Committee (GTSC) plays the central role in the coordination of the multiple components of New York’s Motorcycle Safety program area. Assisting with these efforts is the Motorcycle Safety Workgroup which was formed in FFY 2016 to develop new data-driven messaging and other countermeasures to improve the safety of motorcyclists on New York’s roadways. Led by GTSC, the workgroup consists of representatives from the New York State Police, local law enforcement, the NYS Association of Chiefs of Police, DMV, the NYS Department of Health, ITSMR and the Motorcycle Safety Foundation. One of the workgroup’s initiatives that was implemented during the 2019 riding season was a public awareness campaign where motorcycle safety messages were displayed on the top of gas pumps and nozzles at over 150 fuel-filling stations located within specific counties in New York City and Long Island, the counties with the highest number of crashes in New York State involving a motorcycle and another motor vehicle. In 2018, a motorcycle survey was also sent out to a randomly selected sample of registered motorcyclists to garner opinions of New York State’s current motorcycle safety & awareness messaging. In 2019, the workgroup began to analyze the results from this survey. The final results and analyses will be used to inform new messaging and campaign materials for 2020. New York’s motorcycle rider education program, the Motorcycle Safety Program (MSP), is a major component of New York’s comprehensive approach to address and improve motorcycle safety in the state. In existence since 1996, the MSP provides instruction and field training to improve the riding skills of motorcyclists. More than 258,000 motorcyclists have been trained since the program’s inception. The MSP is funded by a portion of the motorcycle license and registration fees collected by the state and disbursed through the Motorcycle Safety Fund. The funds and other resources GTSC invests to improve motorcycle safety are complemented by a number of other federal, state, local and private sector activities. While a real dollar amount cannot be accurately estimated for the contributions of each of the partners involved in reducing motorcycle crashes, fatalities and injuries, the most significant source of funding, programming and in-kind support that assists in achieving the performance goals established in the HSSP is the state funding provided to the Motorcycle Safety Program (MSP) administered by the NYS Department of Motor Vehicles (DMV). Other partners that contribute to the attainment of the state’s performance goals include the following: NYS Department of Transportation; NYS Department of Health; New York State Police; local enforcement agencies; Motorcycle Safety Foundation and Motorcycle Advocacy Groups.
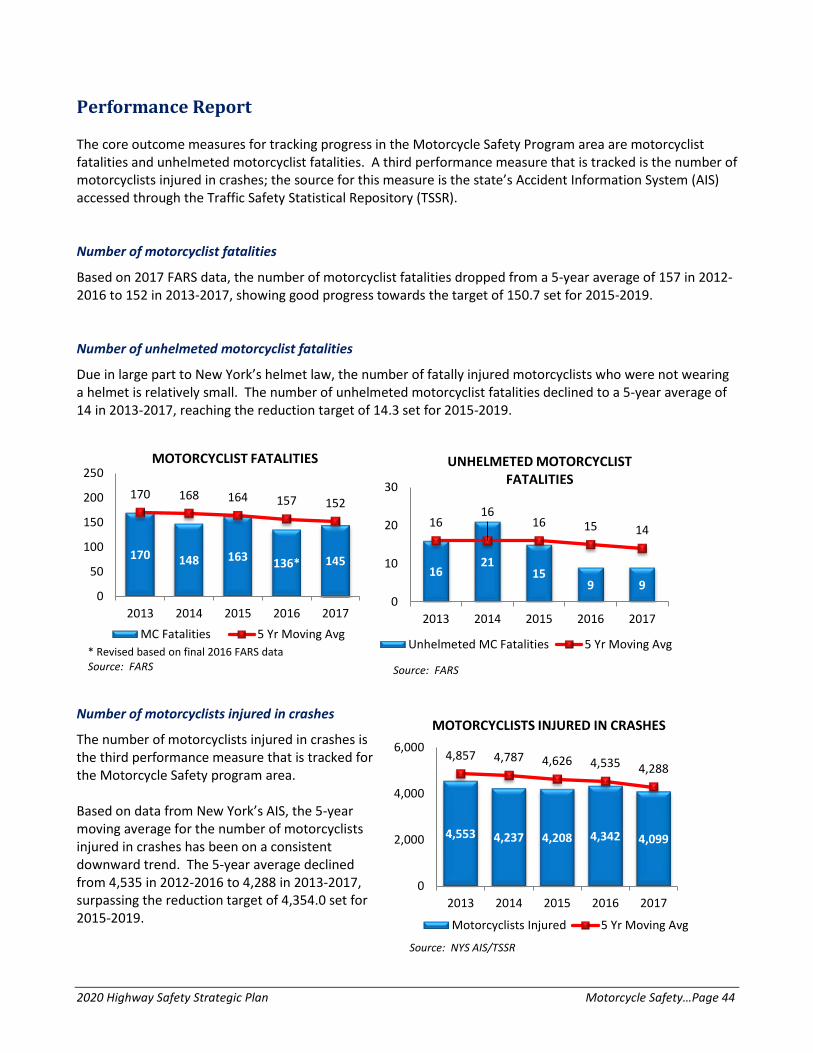
2020 Highway Safety Strategic Plan Motorcycle Safety…Page 44
Performance Report The core outcome measures for tracking progress in the Motorcycle Safety Program area are motorcyclist fatalities and unhelmeted motorcyclist fatalities. A third performance measure that is tracked is the number of motorcyclists injured in crashes; the source for this measure is the state’s Accident Information System (AIS) accessed through the Traffic Safety Statistical Repository (TSSR). Number of motorcyclist fatalities
Based on 2017 FARS data, the number of motorcyclist fatalities dropped from a 5-year average of 157 in 2012-2016 to 152 in 2013-2017, showing good progress towards the target of 150.7 set for 2015-2019. Number of unhelmeted motorcyclist fatalities
Due in large part to New York’s helmet law, the number of fatally injured motorcyclists who were not wearing a helmet is relatively small. The number of unhelmeted motorcyclist fatalities declined to a 5-year average of 14 in 2013-2017, reaching the reduction target of 14.3 set for 2015-2019.
Number of motorcyclists injured in crashes
The number of motorcyclists injured in crashes is the third performance measure that is tracked for the Motorcycle Safety program area. Based on data from New York’s AIS, the 5-year moving average for the number of motorcyclists injured in crashes has been on a consistent downward trend. The 5-year average declined from 4,535 in 2012-2016 to 4,288 in 2013-2017, surpassing the reduction target of 4,354.0 set for 2015-2019.
170 148 163 136* 145
170 168 164 157 152
0
50
100
150
200
250
2013 2014 2015 2016 2017
MOTORCYCLIST FATALITIES
MC Fatalities 5 Yr Moving Avg* Revised based on final 2016 FARS data Source: FARS
1621
159 9
1616
16 15 14
0
10
20
30
2013 2014 2015 2016 2017
Source: FARS
UNHELMETED MOTORCYCLIST FATALITIES
Unhelmeted MC Fatalities 5 Yr Moving Avg
4,553 4,237 4,208 4,342 4,099
4,857 4,787 4,626 4,535 4,288
0
2,000
4,000
6,000
2013 2014 2015 2016 2017
MOTORCYCLISTS INJURED IN CRASHES
Motorcyclists Injured 5 Yr Moving Avg
Source: NYS AIS/TSSR

2020 Highway Safety Strategic Plan Motorcycle Safety…Page 45
Section 405(f) Criterion: Reduction of Fatalities and Crashes Involving Motorcycles To qualify for a Section 405(f) Motorcyclist Safety Grant under 23 CFR Part §1300.25 states must meet two criteria. One of the two criteria New York is applying under is Motorcycle Safety Grant Criterion “g” which requires states to demonstrate reductions in two measures: motorcyclist fatalities and motor vehicle crashes involving motorcycles per 10,000 motorcycle registrations. As indicated in the tables below, New York State qualifies under this criterion by meeting both requirements. A reduction of at least one motorcyclist fatality must be shown between the number that occurred in the most recent year for which final FARS data are available (2016) and the preceding year (2015).
Between 2015 and 2016, motorcyclist fatalities declined from 163 to 136, a difference of 27.
NEW YORK STATE MOTORCYCLIST FATALITIES
2015
2016
2015-2016 # Change
Motorcyclist Fatalities 163 136 -27 Source: FARS
The most recent year of final crash data available from New York State’s crash system, the Accident Information System (AIS), must be used to demonstrate that a reduction of at least one whole number occurred in the motorcycle crash rate compared to the previous year. The most recent year for which final New York State crash data are available is 2017. As shown in the table below, there were 4,905 motorcycle crashes in 2016 and 4,673 in 2017. Based on motorcycle registration data for New York State, the motorcycle crash rate per 10,000 motorcycle registrations declined by 5.73 between 2016 and 2017, from 124.88 to 119.16.
NEW YORK STATE MOTORCYCLE CRASH RATE
2016
2017
2016-2017 # Change
Motorcycle Crashes* 4,905 4,673 -232
Motorcycle Registrations** 392,763 392,178 -585 Motorcycle Crash Rate per 10,000 Motorcycle Registrations
124.88
119.16
-5.73
Sources: * NYS AIS/TSSR; **FHWA State Motorcycle Registration Files
Description of N ew York State’s Data Collec ti on and Analysis Method
Data for the analyses presented in the table above were obtained from two different sources. The number of Motorcycle Crashes was obtained from the Traffic Safety Statistical Repository (TSSR) which provides online access to data from New York State’s Accident Information System (AIS). The TSSR can be accessed at www.itsmr.org/tssr/.
Data on New York State Motorcycle Registrations was obtained from the FHWA website https://www.fhwa.dot.gov/policyinformation/statistics/2017/pdf/mv1.pdf. Microsoft Excel was used to calculate the crash rate per 10,000 registrations for each year and the reduction in the rate of crashes involving motorcycles.

2020 Highway Safety Strategic Plan Motorcycle Safety…Page 46
Problem Identification Data analyses were conducted to assist GTSC in setting priorities for the Motorcycle Safety Program and selecting data-driven countermeasure strategies and activities that will enable the state to achieve its performance goals. The key findings from the problem identification component are presented in this section. Trends in Motorcycle Licenses and Registrations
Since 2010, the number of drivers with motorcycle licenses has increased by 13%, reaching almost 755,000 in 2017. Over the past five years, approximately 70% of all new motorcycle licenses were issued to graduates of the rider training program. After steady increases in motorcycle registrations between 2006 and 2011, the number of registrations leveled off between 2011 and 2014 before increasing to 350,000 in 2015; registrations dropped off slightly to about 348,000 in 2017. Fatal and Personal Injury Motorcycle Crashes
Over the five-year period, 2013-2017, fatal crashes involving motorcycles fluctuated but showed an overall decrease of 13% (from 164 to 143). Between 2016 and 2017, however, fatal motorcycle crashes increased by 7%. Motorcycle crashes involving personal injury also followed an inconsistent pattern over the five years but declined by 10% between 2013 and 2017. In 2017, there were 3,935 motorcycle injury crashes compared to 4,173 in 2016, a decrease of 6%.
Analyses by Region and County
In 2017, 54% of the fatal and personal injury crashes involving motorcycles occurred in the Upstate region, 33% occurred in New York City and 13% occurred on Long Island. When compared with the distribution of licensed motorcyclists and motorcycle registrations by region, New York City was overrepresented in motorcycle crashes (33%) compared to the proportion of the motorcycle licenses (14%) and registrations (13%) in the region. The counties with the greatest number of fatal and personal injury motorcycle crashes in 2017 were Kings (442), Queens (391), Suffolk (313), New York (231), Nassau (228), Bronx (208), Erie (194), Westchester (177), Monroe (174), and Orange (128).
MOTORCYCLE FATAL AND PERSONAL INJURY CRASHES
2013 2014 2015 2016 2017 2013-17 % Change
2016-17 % Change
Fatal Crashes 164 142 155 134 143 -12.8% 6.7% Injury Crashes 4,387 4,055 4,012 4,173 3,935 -10.3% -5.7% Fatal & PI Crashes 4,551 4,197 4,167 4,307 4,078 -10.4% -5.3% Source: NYS AIS/TSSR
72%
14% 14%
72%
13% 15%
54%
33%
13%
Upstate NYC Long Island0%
20%
40%
60%
80%
MOTORCYCLE LICENSES, REGISTRATIONS AND FATAL & PI CRASHES BY REGION: 2017
MC Licenses MC Registrations MC F&PI Crashes
Sources: NYS AIS, Driver License and Vehicle Registration Files / TSSR
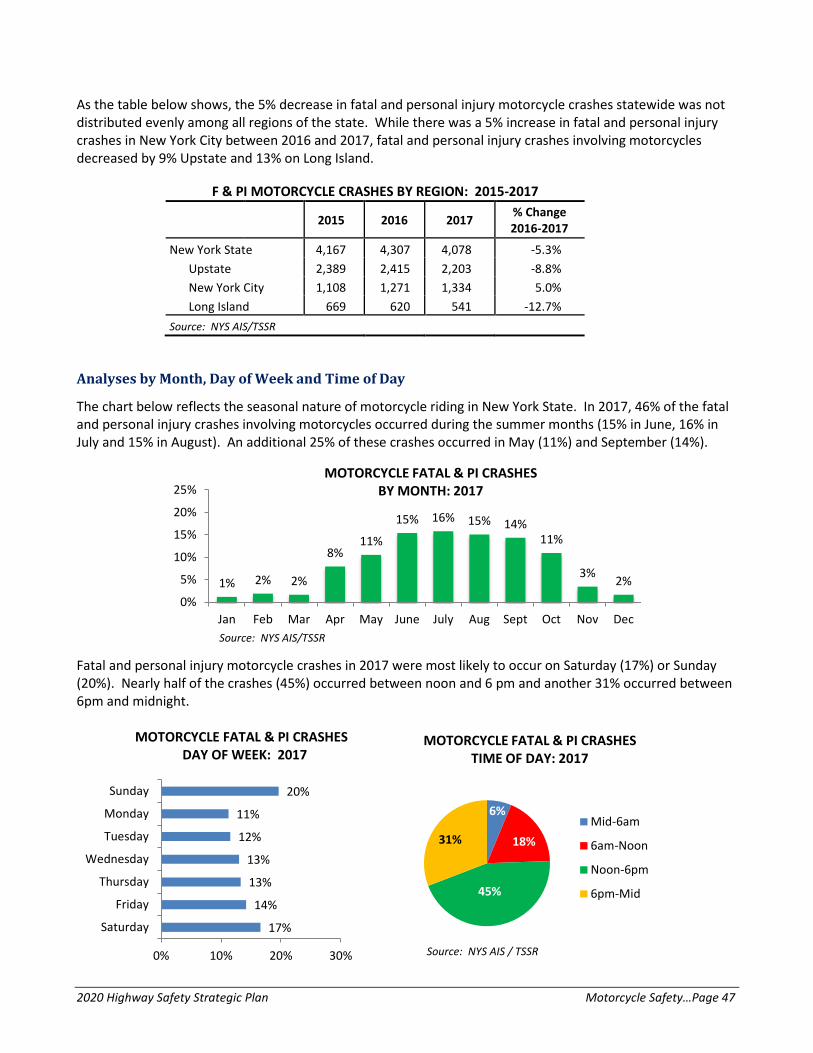
2020 Highway Safety Strategic Plan Motorcycle Safety…Page 47
As the table below shows, the 5% decrease in fatal and personal injury motorcycle crashes statewide was not distributed evenly among all regions of the state. While there was a 5% increase in fatal and personal injury crashes in New York City between 2016 and 2017, fatal and personal injury crashes involving motorcycles decreased by 9% Upstate and 13% on Long Island. Analyses by Month, Day of Week and Time of Day
The chart below reflects the seasonal nature of motorcycle riding in New York State. In 2017, 46% of the fatal and personal injury crashes involving motorcycles occurred during the summer months (15% in June, 16% in July and 15% in August). An additional 25% of these crashes occurred in May (11%) and September (14%). Fatal and personal injury motorcycle crashes in 2017 were most likely to occur on Saturday (17%) or Sunday (20%). Nearly half of the crashes (45%) occurred between noon and 6 pm and another 31% occurred between 6pm and midnight. MOTORCYCLE FATAL & PI CRASHES DAY OF WEEK: 2017
Source: NYS AIS / TSSR
F & PI MOTORCYCLE CRASHES BY REGION: 2015-2017
2015 2016 2017 % Change 2016-2017
New York State 4,167 4,307 4,078 -5.3% Upstate 2,389 2,415 2,203 -8.8% New York City 1,108 1,271 1,334 5.0% Long Island 669 620 541 -12.7%
Source: NYS AIS/TSSR
6%
18%
45%
31%
MOTORCYCLE FATAL & PI CRASHESTIME OF DAY: 2017
Mid-6am
6am-Noon
Noon-6pm
6pm-Mid
17%
14%
13%
13%
12%
11%
20%
0% 10% 20% 30%
Saturday
Friday
Thursday
Wednesday
Tuesday
Monday
Sunday
1% 2% 2%
8%11%
15% 16% 15% 14%11%
3% 2%0%
5%
10%
15%
20%
25%
Jan Feb Mar Apr May June July Aug Sept Oct Nov Dec
MOTORCYCLE FATAL & PI CRASHES BY MONTH: 2017
Source: NYS AIS/TSSR
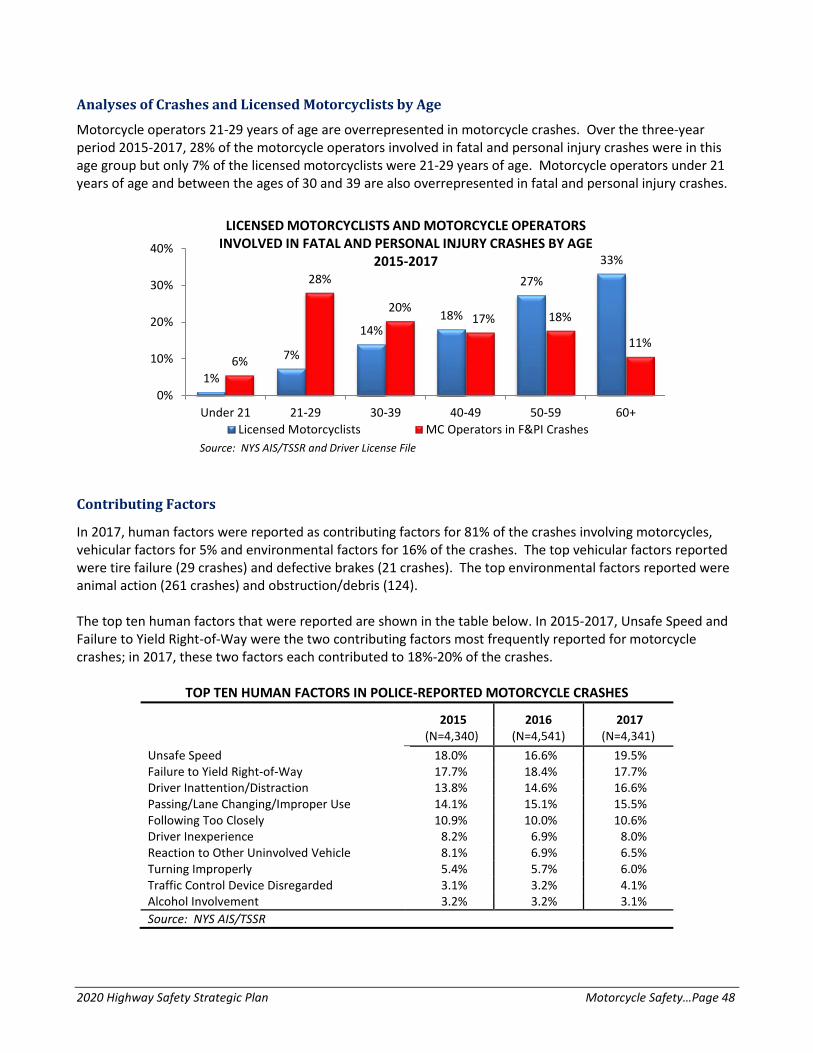
2020 Highway Safety Strategic Plan Motorcycle Safety…Page 48
Analyses of Crashes and Licensed Motorcyclists by Age
Motorcycle operators 21-29 years of age are overrepresented in motorcycle crashes. Over the three-year period 2015-2017, 28% of the motorcycle operators involved in fatal and personal injury crashes were in this age group but only 7% of the licensed motorcyclists were 21-29 years of age. Motorcycle operators under 21 years of age and between the ages of 30 and 39 are also overrepresented in fatal and personal injury crashes.
Contributing Factors
In 2017, human factors were reported as contributing factors for 81% of the crashes involving motorcycles, vehicular factors for 5% and environmental factors for 16% of the crashes. The top vehicular factors reported were tire failure (29 crashes) and defective brakes (21 crashes). The top environmental factors reported were animal action (261 crashes) and obstruction/debris (124). The top ten human factors that were reported are shown in the table below. In 2015-2017, Unsafe Speed and Failure to Yield Right-of-Way were the two contributing factors most frequently reported for motorcycle crashes; in 2017, these two factors each contributed to 18%-20% of the crashes.
TOP TEN HUMAN FACTORS IN POLICE-REPORTED MOTORCYCLE CRASHES
2015 2016 2017 (N=4,340) (N=4,541) (N=4,341) Unsafe Speed 18.0% 16.6% 19.5% Failure to Yield Right-of-Way 17.7% 18.4% 17.7% Driver Inattention/Distraction 13.8% 14.6% 16.6% Passing/Lane Changing/Improper Use 14.1% 15.1% 15.5% Following Too Closely 10.9% 10.0% 10.6% Driver Inexperience 8.2% 6.9% 8.0% Reaction to Other Uninvolved Vehicle 8.1% 6.9% 6.5% Turning Improperly 5.4% 5.7% 6.0% Traffic Control Device Disregarded 3.1% 3.2% 4.1% Alcohol Involvement 3.2% 3.2% 3.1% Source: NYS AIS/TSSR
1%
7%
14%18%
27%
33%
6%
28%
20%17% 18%
11%
0%
10%
20%
30%
40%
Under 21 21-29 30-39 40-49 50-59 60+
LICENSED MOTORCYCLISTS AND MOTORCYCLE OPERATORSINVOLVED IN FATAL AND PERSONAL INJURY CRASHES BY AGE
2015-2017
Licensed Motorcyclists MC Operators in F&PI CrashesSource: NYS AIS/TSSR and Driver License File
2020 Highway Safety Strategic Plan Motorcycle Safety…Page 49
The top contributing factors for motorcyclists involved in crashes with another motor vehicle were Passing/Lane Changing/Improper Use (20%), Unsafe Speed (17%), Following Too Closely (15%) and Driver Inattention/Distraction (14%). For the drivers of other vehicles involved in a crash with a motorcycle, Failure to Yield the Right-of-Way was by far the most frequently cited contributing factor (31%), followed by Driver Inattention/Distraction (20%), Passing/Lane Changing/Improper Use (11%), Turning Improperly (8%) and Following Too Closely (7%).
CONTRIBUTING FACTORS FOR MOTORCYCLISTS AND THE OTHER MOTORISTS IN CRASHES INVOLVING A MOTORCYCLE AND ANOTHER VEHICLE: 2017
Motorcyclist Other Motorist (N=1,696) (N=2,090) Passing/Lane Changing/Improper Use 20.2% 11.1% Unsafe Speed 16.6% 1.8% Following Too Closely 15.3% 7.2% Driver Inattention/Distraction 13.9% 20.4% Failure to Yield Right-of-Way 6.3% 30.5% Driver Inexperience 5.9% 2.7% Traffic Control Device Disregarded 4.0% 3.7% Aggressive Driving/Road Rage 2.0% 0.9% Reaction to Other Uninvolved Vehicle 2.0% 1.8% Alcohol Involvement 1.8% 1.0% Turning Improperly 1.4% 8.2% Source: NYS AIS
Crashes Involving a Motorcycle and Another Motor Vehicle
The number of crashes involving a motorcycle and another motor vehicle that occurred in 2017 are presented by county in the table below. In addition, the number of motorcycle registrations per county are shown for comparison purposes.
CRASHES INVOLVING A MOTORCYCLE AND ANOTHER MOTOR VEHICLE BY COUNTY: 2017 Total Crashes % of Total Cumulative % MC Registrations % of Total TOTAL NYS 2,735 347,536 KINGS 411 15.0% 15.0% 11,801 3.4% QUEENS 337 12.3% 27.3% 14,245 4.1% NEW YORK 227 8.3% 35.6% 7,942 2.3% SUFFOLK 217 7.9% 43.6% 32,288 9.3% BRONX 184 6.7% 50.3% 4,820 1.4% NASSAU 177 6.5% 56.8% 18,455 5.3% WESTCHESTER 118 4.3% 61.1% 13,663 3.9% MONROE 114 4.2% 65.3% 16,269 4.7% ERIE 111 4.1% 69.3% 21,300 6.1% ONONDAGA 66 2.4% 71.7% 11,562 3.3% ORANGE 61 2.2% 74.0% 10,392 3.0% RICHMOND 60 2.2% 76.2% 6,106 1.8% ALBANY 58 2.1% 78.3% 7,225 2.1% DUTCHESS 44 1.6% 79.9% 8,427 2.4% SARATOGA 40 1.5% 81.4% 9,030 2.6%

2020 Highway Safety Strategic Plan Motorcycle Safety…Page 50
Total Crashes % of Total Cumulative % MC Registrations % of Total ROCKLAND 39 1.4% 82.8% 4,839 1.4% ONEIDA 32 1.2% 83.9% 7,551 2.2% NIAGARA 31 1.1% 85.1% 7,707 2.2% SCHENECTADY 30 1.1% 86.2% 5,007 1.4% RENSSELAER 28 1.0% 87.2% 5,671 1.6% ULSTER 28 1.0% 88.2% 7,183 2.1% BROOME 27 1.0% 89.2% 5,815 1.7% WARREN 19 0.7% 89.9% 3,090 0.9% JEFFERSON 16 0.6% 90.5% 4,156 1.2% OSWEGO 16 0.6% 91.1% 5,165 1.5% ST. LAWRENCE 14 0.5% 91.6% 4,348 1.3% CHEMUNG 13 0.5% 92.1% 2,921 0.8% CHAUTAUQUA 12 0.4% 92.5% 5,157 1.5% HERKIMER 12 0.4% 92.9% 2,928 0.8% PUTNAM 12 0.4% 93.4% 3,455 1.0% GENESEE 10 0.4% 93.7% 2,402 0.7% ONTARIO 10 0.4% 94.1% 4,110 1.2% SULLIVAN 10 0.4% 94.5% 3,085 0.9% CHENANGO 9 0.3% 94.8% 2,458 0.7% SENECA 9 0.3% 95.1% 1,314 0.4% STEUBEN 9 0.3% 95.5% 4,298 1.2% FULTON 8 0.3% 95.8% 2,660 0.8% CLINTON 7 0.3% 96.0% 3,466 1.0% MONTGOMERY 7 0.3% 96.3% 2,436 0.7% OTSEGO 7 0.3% 96.5% 2,468 0.7% TOMPKINS 7 0.3% 96.8% 2,870 0.8% WAYNE 7 0.3% 97.0% 4,611 1.3% CATTARAUGUS 6 0.2% 97.3% 3,543 1.0% CORTLAND 6 0.2% 97.5% 1,980 0.6% ESSEX 6 0.2% 97.7% 1,627 0.5% WASHINGTON 6 0.2% 97.9% 3,287 0.9% WYOMING 6 0.2% 98.1% 2,007 0.6% CAYUGA 5 0.2% 98.3% 3,124 0.9% DELAWARE 5 0.2% 98.5% 2,030 0.6% FRANKLIN 5 0.2% 98.7% 1,821 0.5% GREENE 5 0.2% 98.9% 2,849 0.8% MADISON 5 0.2% 99.0% 2,995 0.9% YATES 5 0.2% 99.2% 1,120 0.3% LIVINGSTON 4 0.1% 99.4% 2,825 0.8% TIOGA 4 0.1% 99.5% 1,989 0.6% COLUMBIA 3 0.1% 99.6% 2,606 0.7% SCHUYLER 3 0.1% 99.7% 1,066 0.3% ALLEGANY 2 0.1% 99.8% 1,907 0.5% ORLEANS 2 0.1% 99.9% 1,588 0.5% SCHOHARIE 2 0.1% 100.0% 1,776 0.5% LEWIS 1 0.0% 100.0% 1,399 0.4% HAMILTON 0 0.0% 100.0% 345 0.1%
Sources: NYS AIS, Vehicle Registration File/TSSR

2020 Highway Safety Strategic Plan Motorcycle Safety…Page 51
Strategies Using a data-driven approach, New York has identified a comprehensive set of strategies that collectively will enable the state to reach the performance targets for the Motorcycle Safety program area. Examples of activities that will be considered for funding are listed under each strategy. Strategy MC-1: Motorcycle Rider Training and Education A key component of a comprehensive approach to motorcycle safety is motorcycle rider training and education. In FFY 2020, the NYS Department of Motor Vehicles Motorcycle Safety Program (MSP) will continue to promote the statewide availability of rider education programs and increase the number of sites providing training. There are presently 21 training schools with 41 training ranges that deliver rider training around the state. NYS Motorcycle Safety Program MC-2020-001 The NYS Department of Motor Vehicles contracts with the Motorcycle Safety Foundation (MSF), a national leader in motorcycle safety and education, to deliver the MSF Basic Rider Course throughout the state. A portion of the motorcycle license and registration fees collected by the state is set aside to fund these training programs. Currently, there are 26 counties with training sites where motorcycle rider training courses will be conducted during FFY 2020. As shown in the table below, collectively these counties account for 65% of the motorcycle registrations in the state, demonstrating excellent coverage for the program and compliance with Section 405(f) Motorcyclist Safety Criterion: Motorcycle Riding Training Courses.
NYS MOTORCYCLE REGISTRATIONS & ACTIVE MOTORCYCLE RIDER TRAINING SITES BY COUNTY
Counties with Training Sites Where Courses Will be Conducted in FFY 2020
# of Motorcycle Registrations per County, 2017*
% of All MC Registrations in NYS
NEW YORK STATE 347,536
ALLEGANY 1,907 0.5% BRONX 4,820 1.4% BROOME 5,815 1.7% CHAUTAUQUA 5,157 1.5% CLINTON 3,466 1.0% COLUMBIA 2,606 0.7% DUTCHESS 8,427 2.4% ERIE 21,300 6.1% JEFFERSON 4,156 1.2% KINGS 11,801 3.4% MONROE 16,269 4.7% NASSAU 18,455 5.3% NIAGARA 7,707 2.2% ONEIDA 7,551 2.2%

2020 Highway Safety Strategic Plan Motorcycle Safety…Page 52
Counties with Training Sites Where Courses Will be Conducted in FFY 2020
# of Motorcycle Registrations per County, 2017*
% of All MC Registrations in NYS
ONONDAGA 11,562 3.3% ORANGE 10,392 3.0% QUEENS 14,245 4.1% RENSSELAER 5,671 1.6% RICHMOND 6,106 1.8% ROCKLAND 4,839 1.4% ST LAWRENCE 4,348 1.3% SCHENECTADY 5,007 1.4% SUFFOLK 32,288 9.3% TOMPKINS 2,870 0.8% ULSTER 7,183 2.1% WARREN 3,090 0.9%
TOTAL 227,038 65.3% Sources: NYS DMV Registration File / TSSR; Motorcycle Safety Foundation * Excludes out-of-state motorcycle registrations. The road test waiver offered by New York’s rider training program provides an additional incentive for new motorcyclists to complete a motorcycle rider education course and become licensed operators without having to take a DMV road test. Over the past five years, an average of 70% of all new motorcycle licenses were issued to graduates of the rider training program who waived the DMV road test. The Basic Rider Course 2 (BRC2-LW) and the Three-Wheeled Motorcycle BRC (3WBRC) also qualify for the road test waiver benefit. Maintaining the quality of the instructor cadre in terms of skills, knowledge and motivation is a challenge in every program. To maintain a high-quality program, New York will continue to use a variety of outreach methods to improve the availability of training for providers and instructors and aid in the retention of qualified instructors. A MSF-qualified quality assurance team makes visits to the public training sites every year to ensure the program continues to maintain high standards for course delivery. Strategy MC-2: Communications and Outreach Motorcycle Safety Awareness and Education MC-2020-002 Communication strategies and outreach activities directed toward both motorcyclists and the other drivers who share the road with motorcyclists are also very important for improving motorcycle safety. Projects that raise motorist awareness of the need to watch for motorcycles in traffic and educate the general driving population on how to share the road safely with motorcycles will continue to be supported. These efforts include New York’s participation in the national initiative recognizing May as Motorcycle Safety Awareness Month, the use of variable message signs promoting motorcycle safety and public awareness campaigns, and public information and education (PI&E) materials that promote the Share the Road message. The Motorcycle Safety Workgroup formed by GTSC is also investigating various avenues of communication with the motoring public to create a new motorcycle safety messaging campaign. One approach will be to utilize the results from the 2018 motorcycle survey to inform new messaging and determine the most effective avenues for messaging and outreach. Outreach efforts to enhance driver awareness of motorcycles will also continue to be considered for funding. Examples include attendance at auto shows, fairs and other public events; presentations to driver education

2020 Highway Safety Strategic Plan Motorcycle Safety…Page 53
classes; and the use of social media to reach general and targeted audiences. The development of PI&E materials that can be distributed to various audiences and through other channels will also be supported. The outreach efforts and other activities that focus on raising motorist awareness and educating the general driving public about motorcycle safety will be supported by 405f Motorcyclist Safety Grant funds. Projects that focus on enhancing motorcycle safety through education and outreach to motorcyclists will also continue to be supported. These efforts include the development of educational materials, the promotion of U.S. Department of Transportation-approved helmets and conspicuous protective gear, and outreach to motorcyclists through avenues such as rallies, events or mass mailings. The awareness and educational efforts focusing on motorcyclists will be supported by NHTSA 402 funds. Some specific examples of the motorcycle safety and awareness communications and outreach that will be conducted in FFY 2020 include the following:
• A Motorcycle Safety Awareness Month press event will be held in a county that experiences a high rate of motorcycle crashes, injuries and fatalities.
• Variable Message Signs will be displayed during popular motorcycle-related rallies and events to alert drivers of increased motorcycle traffic.
• A new motorcycle awareness PSA will be developed and aired through various media channels (radio, television, and social media).
• A geotargeting campaign featuring awareness messaging will be deployed to reach motorists in specific areas of the state that experience a high number and/or rate of motorcycle crashes.
• Motorcycle awareness messaging will be affixed to fuel pumps and nozzle toppers at a minimum of 150 fuel filling stations in high crash locations throughout the state.
• GTSC will participate in motorcycle safety and awareness outreach at the International Automobile Show and International Motorcycle Show in New York City, as well as the annual state fair and other relevant events throughout the state.
• GTSC will partner with the Department of Motor Vehicles (DMV) to distribute motorcycle safety and awareness messaging via mass mailings to registered and/or licensed motorists and motorcyclists.
• Motorcycle safety and awareness materials will be distributed at a minimum of three traffic safety events as well as to county DMVs, motorcycle groups, grantees and other traffic safety partners.
• A survey to assess the opinions/perceptions of the current motorcycle awareness campaigns will be sent to a random sample of at least 10,000 licensed drivers of passenger vehicles.
Strategy MC-3: Enforcement
In order to ensure the efficient and effective use of resources to enforce traffic violations, New York’s law enforcement community conducts routine enforcement details that focus on drivers who are engaged in dangerous driving behaviors such as impaired driving, distracted driving and speeding regardless of the type of vehicle they are operating. These traffic enforcement countermeasures are discussed under the Police Traffic Services program area. Although federally-funded motorcycle checkpoints are no longer allowed, some local police agencies continue to conduct this type of enforcement using non-federal monies. Training for law enforcement that is designed to improve the effectiveness of motorcycle enforcement efforts is included under this strategy. All enforcement efforts under the Motorcycle Safety program area will be data-driven and will be planned, implemented and monitored in accordance with the requirements of the state’s Evidence-Based Traffic Safety Enforcement Program (TSEP).
2020 Highway Safety Strategic Plan Motorcycle Safety…Page 54
Motorcycle Safety & Enforcement Training for Law Enforcement MC-2020-003 Training programs for law enforcement that focus on educating officers on motorcycle safety, including the requirements regarding motorcycle safety equipment, enforcement strategies and techniques, identifying impaired riders and other topics related to motorcycle safety will continue to be supported. A minimum of three enforcement trainings will be held in FFY 2020. Decisions on where to hold training programs are data-driven and are based on a region’s overrepresentation in motorcycle crashes. These regional training programs are conducted by a team of subject matter experts from the New York State Police and the New York State Association of Chiefs of Police in cooperation with GTSC, the DMV Motorcycle Safety Program, the Motorcycle Safety Foundation and other law enforcement partners. The development and dissemination of new training resources and materials through websites, podcasts and other delivery mechanisms will also be considered for funding. Potential avenues for the creation of an impaired riding detection video for law enforcement will also be explored. Strategy MC-4: Research, Evaluation and Analytical Support for New York’s Performance-Based Motorcycle Safety Program Research, evaluation and data analysis are essential components of a successful performance-based Motorcycle Safety program. These activities support problem identification, the selection of performance measures for tracking progress, and the selection of evidence-based, data-driven strategies that will contribute to the achievement of the state’s performance goals. Motorcycle Safety Workgroup MC-2020-004 In FFY 2020, the multi-agency Motorcycle Safety Workgroup will continue to develop data-driven strategies and new campaign messaging to reach the varied demographics of the riding population. The results of the 2018 motorcycle survey will inform the development of campaign messaging for the upcoming year and the Workgroup will be instrumental in piloting new campaign messages among the target population. There will be a special focus on reaching motorists from the counties with the highest number of motorcycle/motor vehicle crashes. The Workgroup will continue to meet monthly to carry out the objectives and determine priorities for the year. The Workgroup will conduct outreach to various newspapers and magazines and will publish at least one article to publicize motorcycle safety and awareness issues and/or highlights. The Workgroup will also continue to collect crash data covering a 5-year period to look for trends and develop new countermeasures.

2020 Highway Safety Strategic Plan Non-Motorized (Pedestrians and Bicyclists)…Page 55
NON-MOTORIZED (PEDESTRIANS AND BICYCLISTS) Overview Improving the safety of pedestrians, bicyclists and other wheel-sport enthusiasts who are New York’s most vulnerable roadway users continues to be a priority for the state’s highway safety program. Responsibility for addressing pedestrian, bicycle and wheel-sport safety issues is shared among several agencies in New York. Effective solutions to these issues often require collaborative efforts involving education, engineering and enforcement countermeasures. The Governor’s Traffic Safety Committee (GTSC) plays the central role in the promotion and coordination of multiple components of New York’s Non-motorized (Pedestrians and Bicyclists) program. The funds and other resources GTSC invests to improve pedestrian, bicycle and other wheel-sport safety are complemented by a number of other federal, state, local and private sector initiatives. For instance, GTSC and other governmental agencies collaborated on the development of a five-year Pedestrian Safety Action Plan (PSAP), which outlines engineering, education and enforcement countermeasures designed to better protect our most vulnerable roadway users. Identified in the PSAP are 20 “focus communities” outside of New York City where data indicate pedestrian crashes are the most prevalent. Since implementation of the PSAP in June 2016, GTSC has continued to organize and host law enforcement training sessions across the state designed to educate police officers, especially those from the designated “focus communities”, on pedestrian and bicycle laws and strategies for enforcement. Utilizing resources and training personnel from NHTSA, a new one-day training curriculum was developed in 2017. Armed with these new course materials, the GTSC is actively recruiting in-state law enforcement with an interest in pedestrian safety to act as future course instructors. Pedestrian safety training opportunities for law enforcement will continue to be made available in FFY 2020. Coinciding with the formal announcement of the PSAP in June 2016, the GTSC organized a two-week pedestrian safety enforcement blitz, “Operation See! Be Seen!” During the first week, police officers distributed specially designed warning citations to motorists and pedestrians; this warning period was followed by a week of traditional high-visibility enforcement with ticketing. Similar enforcement details are planned for early summer 2019 and again in 2020. In this program area, in particular, engineering countermeasures play a major role in efforts to improve safety. While a real dollar amount cannot be accurately estimated for the contributions of each of the partners involved in reducing crashes, fatalities and injuries among these special groups of highway users, the most significant sources of funding, programming and in-kind support that assist in achieving the performance goals established in the HSSP include the following: NYS Department of Transportation; NYS Department of Health; NYS Department of State; National Highway Traffic Safety Administration; Federal Highway Administration; NYC Department of Transportation; Metropolitan Planning Organizations; New York Metropolitan Transportation Council; Capital District Transportation

2020 Highway Safety Strategic Plan Non-Motorized (Pedestrians and Bicyclists)…Page 56
Committee; New York State Pedestrian and Bicycle Partnership; Safe Routes to School Program; NYS Association of Chiefs of Police; NYS Association of Traffic Safety Boards; County Traffic Safety Boards; New York Bicycling Coalition and Safe Kids Coalitions.
One of the challenges in this program area is that persons of all ages, from young children to older adults, are part of the at-risk group. Effective public information and education (PI&E) programs and other strategies to reduce deaths and injuries among pedestrians, bicyclists and participants in other wheel-sports must be designed to address both children and adults. Equally important is the need to continue efforts to raise awareness and educate motorists on how to safely share the road with pedestrians and bicyclists. This includes educating motorists, pedestrians and law enforcement on New York State’s Vehicle and Traffic Laws, including the pedestrian crossing laws and the 2010 law requiring drivers overtaking bicycles to pass to the left “at a safe distance” until they safely clear the bicycle. In FFY 2018, GTSC and the NYS Department of Health began partnering in an effort to recruit new health and traffic safety partners for the specific purpose of conducting outreach to the public on the NYS Vehicle and Traffic Laws pertaining to pedestrian safety. These efforts will continue in FFY 2020. The promotion of the use of helmets and other protective gear that have proven to be effective in reducing the severity of injuries suffered in motor vehicle crashes involving bicyclists and participants in other wheel sports is also a priority. New York State has required helmet use for bicyclists under age 14 since 1993 and subsequently extended mandatory helmet use to in-line skaters (1996), non-motorized scooter riders (2002) and skateboarders (2005) under 14 years of age. Compliance with these laws requires the awareness of parents and the availability of helmets to low income families. Performance Report PEDESTRIAN SAFETY Number of pedestrian fatalities
The core outcome measure for tracking progress in pedestrian safety is pedestrian fatalities. Based on FARS data, the average number of pedestrian fatalities fluctuated from a high of 307 in 2009-2013 to a low of 292 in 2013-2017. As a result, the reduction target of 291.5 set for 2015-2019 has already been met.
336
264311 307*
242
307
299 300 304292
200
250
300
350
2013 2014 2015 2016 2017
PEDESTRIAN FATALITIES
Pedestrian Fatalities 5 Yr Moving Avg*Revised based on final 2016 FARS data
Source: FARS
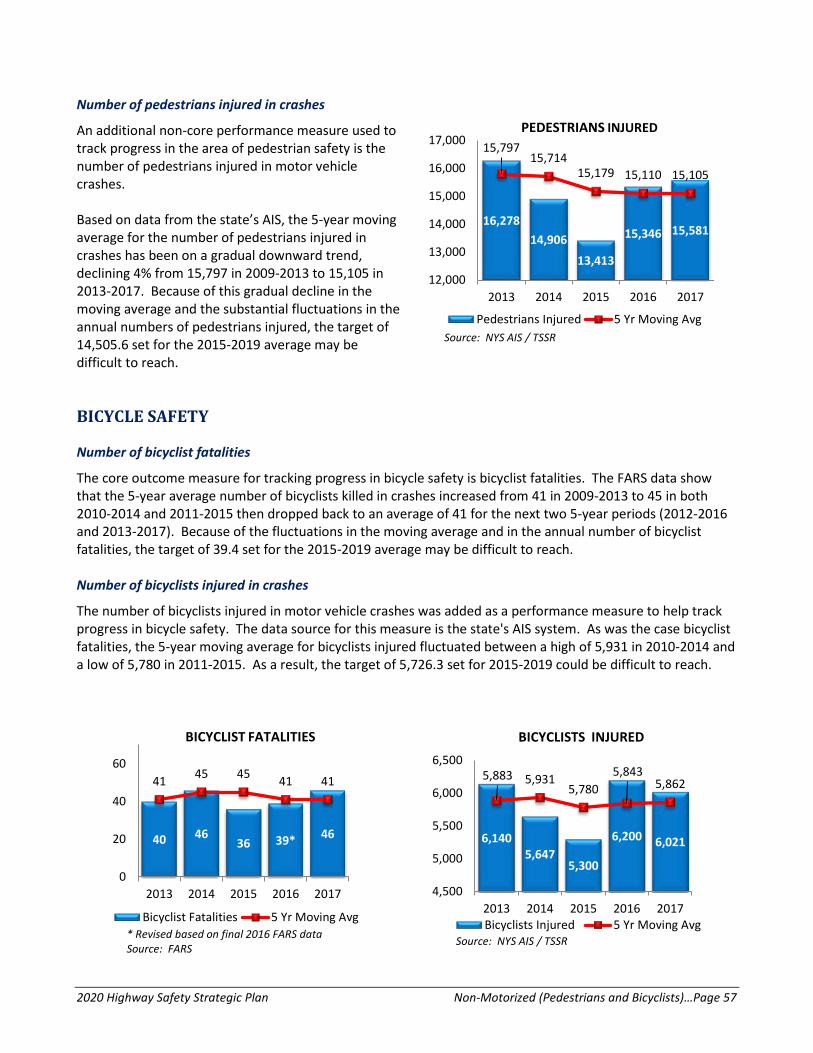
2020 Highway Safety Strategic Plan Non-Motorized (Pedestrians and Bicyclists)…Page 57
Number of pedestrians injured in crashes
An additional non-core performance measure used to track progress in the area of pedestrian safety is the number of pedestrians injured in motor vehicle crashes. Based on data from the state’s AIS, the 5-year moving average for the number of pedestrians injured in crashes has been on a gradual downward trend, declining 4% from 15,797 in 2009-2013 to 15,105 in 2013-2017. Because of this gradual decline in the moving average and the substantial fluctuations in the annual numbers of pedestrians injured, the target of 14,505.6 set for the 2015-2019 average may be difficult to reach. BICYCLE SAFETY Number of bicyclist fatalities
The core outcome measure for tracking progress in bicycle safety is bicyclist fatalities. The FARS data show that the 5-year average number of bicyclists killed in crashes increased from 41 in 2009-2013 to 45 in both 2010-2014 and 2011-2015 then dropped back to an average of 41 for the next two 5-year periods (2012-2016 and 2013-2017). Because of the fluctuations in the moving average and in the annual number of bicyclist fatalities, the target of 39.4 set for the 2015-2019 average may be difficult to reach. Number of bicyclists injured in crashes
The number of bicyclists injured in motor vehicle crashes was added as a performance measure to help track progress in bicycle safety. The data source for this measure is the state's AIS system. As was the case bicyclist fatalities, the 5-year moving average for bicyclists injured fluctuated between a high of 5,931 in 2010-2014 and a low of 5,780 in 2011-2015. As a result, the target of 5,726.3 set for 2015-2019 could be difficult to reach.
40 4636 39* 46
41 45 45 41 41
0
20
40
60
2013 2014 2015 2016 2017
BICYCLIST FATALITIES
Bicyclist Fatalities 5 Yr Moving Avg* Revised based on final 2016 FARS dataSource: FARS
6,1405,647
5,300
6,200 6,021
5,883 5,9315,780
5,8435,862
4,500
5,000
5,500
6,000
6,500
2013 2014 2015 2016 2017
BICYCLISTS INJURED
Bicyclists Injured 5 Yr Moving AvgSource: NYS AIS / TSSR
16,27814,906
13,413
15,346 15,581
15,79715,714
15,179 15,110 15,105
12,000
13,000
14,000
15,000
16,000
17,000
2013 2014 2015 2016 2017
PEDESTRIANS INJURED
Pedestrians Injured 5 Yr Moving AvgSource: NYS AIS / TSSR
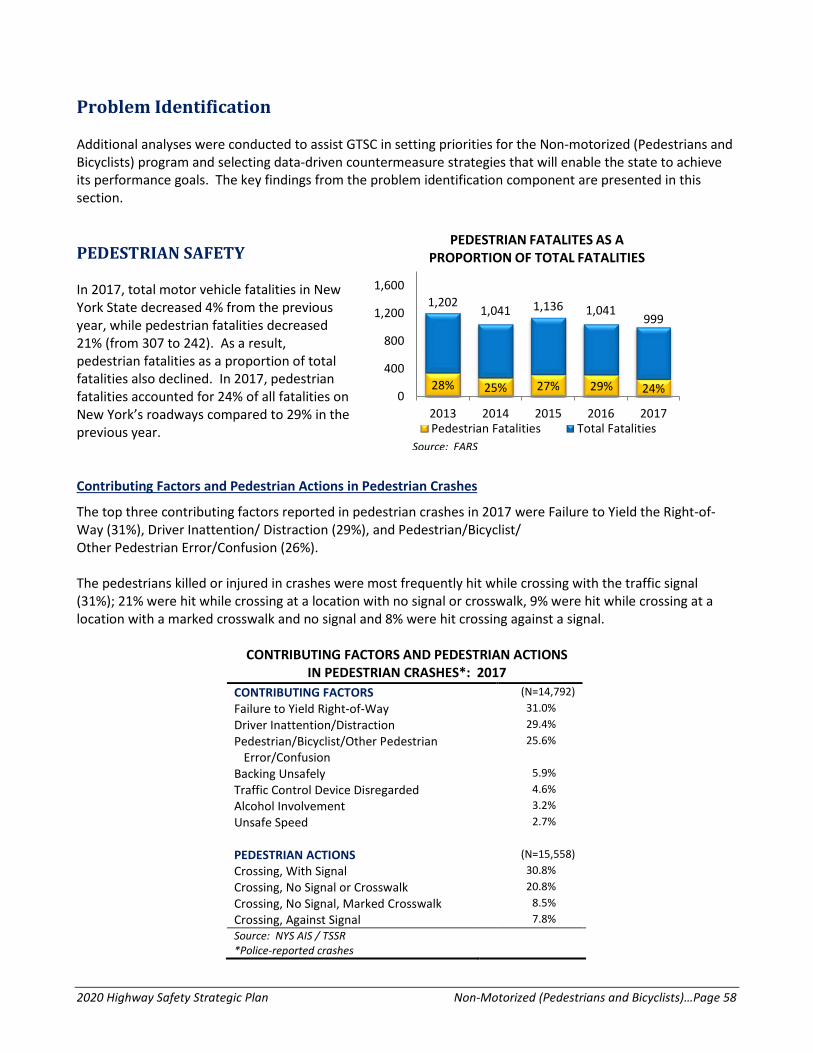
2020 Highway Safety Strategic Plan Non-Motorized (Pedestrians and Bicyclists)…Page 58
Problem Identification Additional analyses were conducted to assist GTSC in setting priorities for the Non-motorized (Pedestrians and Bicyclists) program and selecting data-driven countermeasure strategies that will enable the state to achieve its performance goals. The key findings from the problem identification component are presented in this section.
PEDESTRIAN SAFETY In 2017, total motor vehicle fatalities in New York State decreased 4% from the previous year, while pedestrian fatalities decreased 21% (from 307 to 242). As a result, pedestrian fatalities as a proportion of total fatalities also declined. In 2017, pedestrian fatalities accounted for 24% of all fatalities on New York’s roadways compared to 29% in the previous year. Contributing Factors and Pedestrian Actions in Pedestrian Crashes
The top three contributing factors reported in pedestrian crashes in 2017 were Failure to Yield the Right-of-Way (31%), Driver Inattention/ Distraction (29%), and Pedestrian/Bicyclist/ Other Pedestrian Error/Confusion (26%). The pedestrians killed or injured in crashes were most frequently hit while crossing with the traffic signal (31%); 21% were hit while crossing at a location with no signal or crosswalk, 9% were hit while crossing at a location with a marked crosswalk and no signal and 8% were hit crossing against a signal.
CONTRIBUTING FACTORS AND PEDESTRIAN ACTIONS IN PEDESTRIAN CRASHES*: 2017
CONTRIBUTING FACTORS (N=14,792) Failure to Yield Right-of-Way 31.0% Driver Inattention/Distraction 29.4% Pedestrian/Bicyclist/Other Pedestrian 25.6%
Error/Confusion Backing Unsafely 5.9% Traffic Control Device Disregarded 4.6% Alcohol Involvement 3.2% Unsafe Speed 2.7% PEDESTRIAN ACTIONS (N=15,558) Crossing, With Signal 30.8% Crossing, No Signal or Crosswalk 20.8% Crossing, No Signal, Marked Crosswalk 8.5% Crossing, Against Signal 7.8% Source: NYS AIS / TSSR *Police-reported crashes
28% 25% 27% 29% 24%
1,2021,041 1,136 1,041
999
0
400
800
1,200
1,600
2013 2014 2015 2016 2017
PEDESTRIAN FATALITES AS A PROPORTION OF TOTAL FATALITIES
Pedestrian Fatalities Total FatalitiesSource: FARS

2020 Highway Safety Strategic Plan Non-Motorized (Pedestrians and Bicyclists)…Page 59
Analyses by Region and County
New York City is a particular concern for New York’s pedestrian safety program. In 2017, 39% of the state’s pedestrian fatalities and 72% of the pedestrians injured were the result of crashes in New York City. In comparison, 36% of the fatalities and 19% of the injuries occurred in the Upstate region and 25% of the fatalities and 9% of the injuries occurred on Long Island. When compared with the proportion of the state’s population that reside in the three regions, the New York City region is considerably overrepresented in pedestrians injured (44% of the population vs. 72% of the pedestrians injured); the Long Island region is overrepresented in pedestrian fatalities (14% of the population vs. 25% of the fatalities). To further identify the areas of the state where changes have occurred, additional analyses were conducted on the changes in the numbers of pedestrians killed or injured between 2016 and 2017.
As the table shows, statewide, there was a 1% increase in the number of pedestrians killed or injured in 2017, compared to the previous year. Among the three regions, the only increase in pedestrians killed or injured was in New York City (5%). The Upstate region experienced a decrease of 6%, and Long Island had a decrease of 10%. The five counties listed in the table have consistently ranked among those with the highest numbers of pedestrians killed or injured in crashes. In 2017, more pedestrians were killed or injured in Kings County than in the entire Upstate region (3,733 vs. 3,050); this was also the case in 2016. Between 2016 and 2017, the number of pedestrians killed and injured increased by 11% in Bronx County, by 9% in Queens County and by 6% in Kings County.
New York City
Improving pedestrian safety is a priority for both the NYC Department of Transportation and the New York Police Department which have undertaken a number of activities coinciding with the City’s Vision Zero initiative. Recent data on pedestrian fatalities in New York City indicate that, after dropping sharply from 179 in 2013 to 126 in 2014, the number of pedestrian fatalities in New York City increased slightly in 2015 and 2016, then declined sharply again to 95 in 2017. The proportion of the state’s pedestrian fatalities that occurred in New York City dropped from 53% in 2013 to 39% in 2017.
PEDESTRIANS KILLED OR INJURED BY REGION AND TOP COUNTIES: 2016-2017
2016 2017 % change 2016-2017
NEW YORK STATE 15,666 15,833 1.1% REGION
Upstate 3,260 3,050 -6.4% New York City 10,797 11,334 5.0% Long Island 1,607 1,449 -9.8%
COUNTY
Kings 3,535 3,733 5.6% Queens 2,517 2,736 8.7% New York 2,559 2,451 -4.2% Bronx 1,798 1,993 10.8% Nassau 976 877 -10.1%
Source: NYS AIS/ TSSR
36% 39%25%
19%
72%
9%
42% 44%
14%
Upstate NYC Long Island0%
20%
40%
60%
80%
PEDESTRIANS KILLED OR INJUREDCOMPARED TO POPULATION
BY REGION: 2017
Fatalities Injuries Population
Sources: FARS, NYS AIS/TSSR and U.S. Census Bureau

2020 Highway Safety Strategic Plan Non-Motorized (Pedestrians and Bicyclists)…Page 60
The number of pedestrians injured in New York City rose for the second consecutive year in 2017, increasing 5% from the previous year: from 10,656 to 11,234.
Analyses by Age
Analyses were also conducted to determine the ages of the pedestrians killed or injured in crashes with a motor vehicle. In 2017, pedestrians 14-24 and 25-34 years of age each accounted for 18% of the pedestrians killed or injured. The proportion of pedestrians killed or injured generally declined with each subsequent age group.
When population figures were used to normalize the pedestrian fatality and injury data for each age group, the 14-24 year old age group had the highest rate of pedestrians killed or injured in 2017 (10.1/10,000 population), followed by the 25-34 age group (9.5/10,000 population). After the 14-24 age group, the number of pedestrians killed or injured per 10,000 population declined with each subsequent age group.
11%
18% 18%
13% 14% 13%
8%5%
0%
5%
10%
15%
20%
< 14 14-24 25-34 35-44 45-54 55-64 65-74 75+
PEDESTRIANS KILLED OR INJURED IN CRASHES BY AGE: 2017
Source: NYS AIS / TSSR
5.2
10.1 9.58.2 8.1 7.8
6.85.2
0.0
2.0
4.0
6.0
8.0
10.0
12.0
< 14 14-24 25-34 35-44 45-54 55-64 65-74 75+
PEDESTRIANS KILLED OR INJURED PER 10,000 POPULATION
BY AGE: 2017
Sources: NYS AIS / TSSR and U.S. Census
11,39810,120
8,73110,656 11,234
2013 2014 2015 2016 20170
3,000
6,000
9,000
12,000
PEDESTRIANS INJUREDIN NEW YORK CITY
Source: NYS AIS / TSSR
179
126 131 137
95
2013 2014 2015 2016 20170
50
100
150
200
PEDESTRIAN FATALITIESIN NEW YORK CITY
Source: FARS
53% 48% 42% 45% 39%
313264
311 307242
0
200
400
2013 2014 2015 2016 2017
PEDESTRIAN FATALITES IN NYC AS A PROPORTION OF TOTAL PEDESTRIAN
FATALITIES
Total Pedestrian FatalitiesSource: FARS
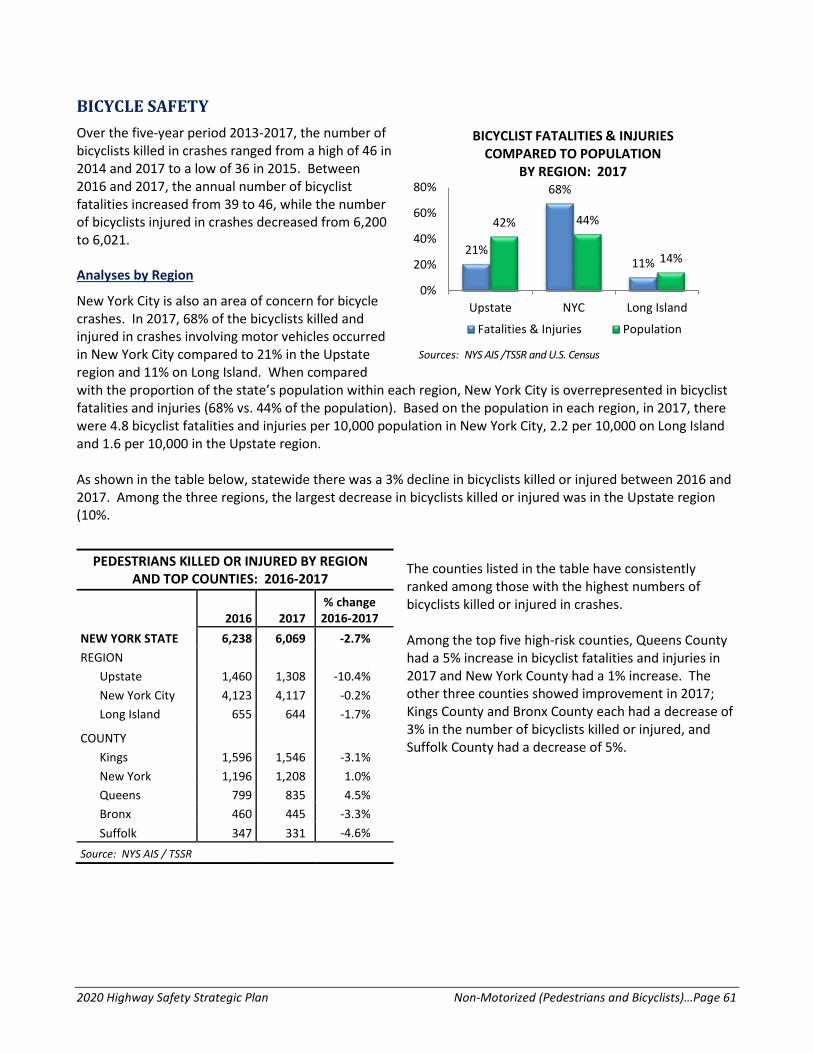
2020 Highway Safety Strategic Plan Non-Motorized (Pedestrians and Bicyclists)…Page 61
BICYCLE SAFETY Over the five-year period 2013-2017, the number of bicyclists killed in crashes ranged from a high of 46 in 2014 and 2017 to a low of 36 in 2015. Between 2016 and 2017, the annual number of bicyclist fatalities increased from 39 to 46, while the number of bicyclists injured in crashes decreased from 6,200 to 6,021. Analyses by Region
New York City is also an area of concern for bicycle crashes. In 2017, 68% of the bicyclists killed and injured in crashes involving motor vehicles occurred in New York City compared to 21% in the Upstate region and 11% on Long Island. When compared with the proportion of the state’s population within each region, New York City is overrepresented in bicyclist fatalities and injuries (68% vs. 44% of the population). Based on the population in each region, in 2017, there were 4.8 bicyclist fatalities and injuries per 10,000 population in New York City, 2.2 per 10,000 on Long Island and 1.6 per 10,000 in the Upstate region. As shown in the table below, statewide there was a 3% decline in bicyclists killed or injured between 2016 and 2017. Among the three regions, the largest decrease in bicyclists killed or injured was in the Upstate region (10%.
The counties listed in the table have consistently ranked among those with the highest numbers of bicyclists killed or injured in crashes. Among the top five high-risk counties, Queens County had a 5% increase in bicyclist fatalities and injuries in 2017 and New York County had a 1% increase. The other three counties showed improvement in 2017; Kings County and Bronx County each had a decrease of 3% in the number of bicyclists killed or injured, and Suffolk County had a decrease of 5%.
PEDESTRIANS KILLED OR INJURED BY REGION AND TOP COUNTIES: 2016-2017
2016 2017 % change 2016-2017
NEW YORK STATE 6,238 6,069 -2.7% REGION
Upstate 1,460 1,308 -10.4% New York City 4,123 4,117 -0.2% Long Island 655 644 -1.7%
COUNTY
Kings 1,596 1,546 -3.1% New York 1,196 1,208 1.0% Queens 799 835 4.5% Bronx 460 445 -3.3% Suffolk 347 331 -4.6%
Source: NYS AIS / TSSR
21%
68%
11%
42% 44%
14%
Upstate NYC Long Island0%
20%
40%
60%
80%
BICYCLIST FATALITIES & INJURIES COMPARED TO POPULATION
BY REGION: 2017
Fatalities & Injuries Population
Sources: NYS AIS /TSSR and U.S. Census

2020 Highway Safety Strategic Plan Non-Motorized (Pedestrians and Bicyclists)…Page 62
Analyses by Age
Analyses were also conducted to determine the ages of the bicyclists killed or injured in crashes with a motor vehicle. In 2017, bicyclists in the 14-24 age group made up the largest proportion of those killed or injured in crashes (31%). Bicyclist fatalities and injuries declined with each subsequent age group.
When population figures were used to normalize the bicyclist fatality and injury data for each age group, the same pattern was seen. The 14-24 year old age group had a substantially higher rate of bicycle fatalities and injuries (6.5/10,000 population) than any other age group in 2017.
Strategies Using a data-driven approach, New York has identified a comprehensive set of strategies that collectively will enable the state to reach the performance targets for the Non-motorized (Pedestrians and Bicyclists) program area. Examples of activities that will be considered for funding are listed under each strategy. Strategy PS-1: Education, Communication and Outreach The Education, Communication and Outreach countermeasure strategy focuses on programs that educate pedestrians, bicyclists, skateboarders, in-line skaters and non-motorized scooter riders on safety issues and ways to avoid crash involvement, as well as initiatives that raise public awareness among motorists who share the road with these user groups. Public Awareness of Pedestrian & Bicycle Safety PS-2020-001 Efforts to heighten the awareness of the motoring public to the behaviors and vulnerabilities of pedestrians, bicyclists and other wheel-sport participants and the dangers motorist traffic violations, such as speeding, distracted driving and failure to yield the right-of-way, pose to these groups will be funded under this activity. These projects may include public awareness campaigns and the distribution of informational materials that promote messages, such as “See! Be Seen!”, “Respect”, “Share the Road” and “Coexist”, among all highway users and encourage compliance with traffic laws relating to pedestrians, bicyclists, in-line skaters, scooter riders and skateboarders.
7%
31%26%
14%10% 8%
3% 1%0%
10%
20%
30%
40%
< 14 14-24 25-34 35-44 45-54 55-64 65-74 75+
BICYCLISTS KILLED OR INJURED IN CRASHES BY AGE: 2017
Source: NYS AISSource: NYS AIS / TSSR
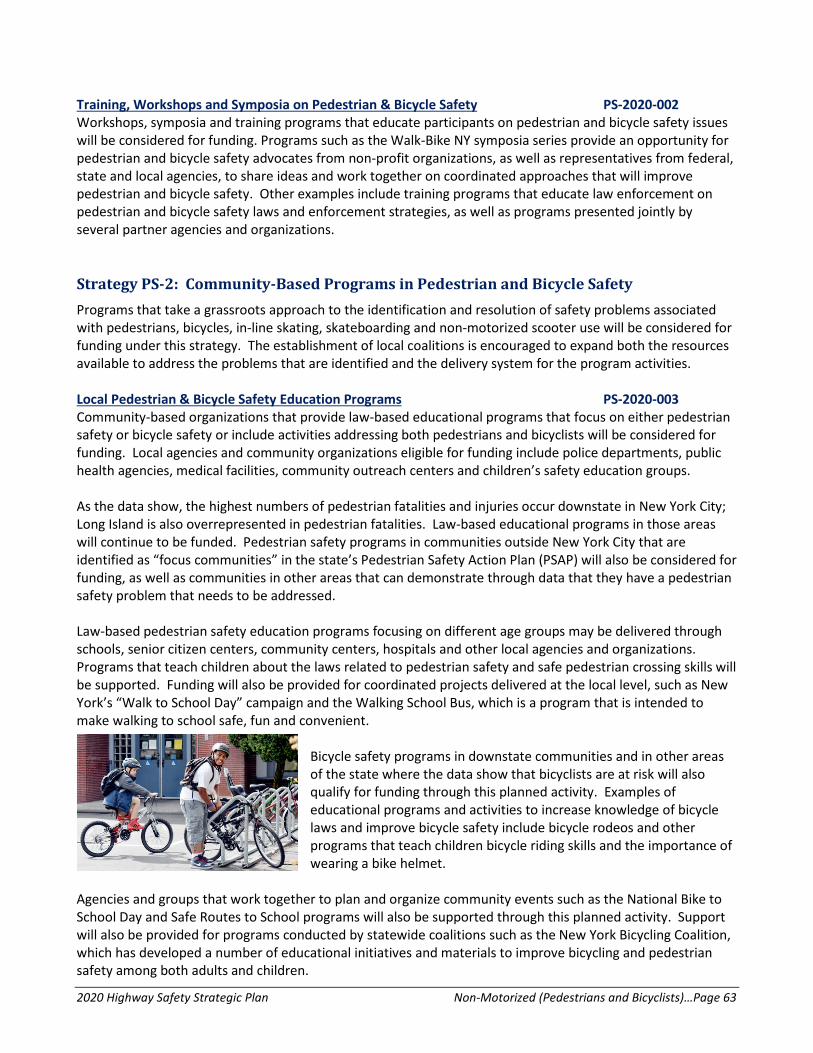
2020 Highway Safety Strategic Plan Non-Motorized (Pedestrians and Bicyclists)…Page 63
Training, Workshops and Symposia on Pedestrian & Bicycle Safety PS-2020-002 Workshops, symposia and training programs that educate participants on pedestrian and bicycle safety issues will be considered for funding. Programs such as the Walk-Bike NY symposia series provide an opportunity for pedestrian and bicycle safety advocates from non-profit organizations, as well as representatives from federal, state and local agencies, to share ideas and work together on coordinated approaches that will improve pedestrian and bicycle safety. Other examples include training programs that educate law enforcement on pedestrian and bicycle safety laws and enforcement strategies, as well as programs presented jointly by several partner agencies and organizations. Strategy PS-2: Community-Based Programs in Pedestrian and Bicycle Safety Programs that take a grassroots approach to the identification and resolution of safety problems associated with pedestrians, bicycles, in-line skating, skateboarding and non-motorized scooter use will be considered for funding under this strategy. The establishment of local coalitions is encouraged to expand both the resources available to address the problems that are identified and the delivery system for the program activities. Local Pedestrian & Bicycle Safety Education Programs PS-2020-003 Community-based organizations that provide law-based educational programs that focus on either pedestrian safety or bicycle safety or include activities addressing both pedestrians and bicyclists will be considered for funding. Local agencies and community organizations eligible for funding include police departments, public health agencies, medical facilities, community outreach centers and children’s safety education groups. As the data show, the highest numbers of pedestrian fatalities and injuries occur downstate in New York City; Long Island is also overrepresented in pedestrian fatalities. Law-based educational programs in those areas will continue to be funded. Pedestrian safety programs in communities outside New York City that are identified as “focus communities” in the state’s Pedestrian Safety Action Plan (PSAP) will also be considered for funding, as well as communities in other areas that can demonstrate through data that they have a pedestrian safety problem that needs to be addressed. Law-based pedestrian safety education programs focusing on different age groups may be delivered through schools, senior citizen centers, community centers, hospitals and other local agencies and organizations. Programs that teach children about the laws related to pedestrian safety and safe pedestrian crossing skills will be supported. Funding will also be provided for coordinated projects delivered at the local level, such as New York’s “Walk to School Day” campaign and the Walking School Bus, which is a program that is intended to make walking to school safe, fun and convenient.
Bicycle safety programs in downstate communities and in other areas of the state where the data show that bicyclists are at risk will also qualify for funding through this planned activity. Examples of educational programs and activities to increase knowledge of bicycle laws and improve bicycle safety include bicycle rodeos and other programs that teach children bicycle riding skills and the importance of wearing a bike helmet.
Agencies and groups that work together to plan and organize community events such as the National Bike to School Day and Safe Routes to School programs will also be supported through this planned activity. Support will also be provided for programs conducted by statewide coalitions such as the New York Bicycling Coalition, which has developed a number of educational initiatives and materials to improve bicycling and pedestrian safety among both adults and children.

2020 Highway Safety Strategic Plan Non-Motorized (Pedestrians and Bicyclists)…Page 64
Strategy PS-3: Cooperative Approaches to Improving Pedestrian and Bicycle Safety GTSC will continue to promote cooperative state and local approaches to addressing pedestrian safety issues by bringing together partners from a variety of disciplines and perspectives to review the data, identify high-risk areas and develop effective countermeasures. Collaborative Approaches to Improving Pedestrian & Bicycle Safety PS-2020-004 State and local agencies may receive funding for cooperative approaches to develop and implement pedestrian and bicycle safety programs. These cooperative efforts may bring together partners from a variety of disciplines and perspectives to review the data, identify high-risk areas and develop effective countermeasures. Examples include the formation of state and local partnerships to address pedestrian safety issues at high-risk corridors through a combination of education, enforcement and engineering solutions. Previous corridor projects supported by GTSC have included Niagara Falls Blvd. in the Towns of Tonawanda and Amherst, State Routes 59 and 45 in the Village of Spring Valley, Hempstead Turnpike on Long Island, State Route 5 in Albany and Schenectady counties and State Route 7 in Troy. These projects are chosen through a data-driven process that may include a special Walk-Bike assessment. Strategy PS-4: Enforcement of Traffic Violations Pedestrians consistently account for one-quarter of the traffic fatalities in New York State each year. Unsafe actions on the part of both motorists and pedestrians often contribute to these crashes. Once pedestrians and motorists are educated on pedestrian safety issues and the behavior changes required for compliance with the law, enforcement may be required to reinforce the need to change behaviors. Targeted Enforcement (Enforcement Efforts to Improve Pedestrian Safety) PS-2020-005 Jurisdictions identified as having high numbers of pedestrian crashes, injuries and fatalities will be eligible for funding to conduct high-visibility pedestrian safety education and enforcement campaigns. Using a data-driven approach, awareness and enforcement efforts that focus on traffic violations by both pedestrians and motorists will be conducted at locations identified by the jurisdiction as having high volumes of pedestrian traffic and pose a high risk for pedestrian and motor vehicle crashes. Identified law enforcement agencies will be asked to participate in the state’s two-week pedestrian safety enforcement mobilization, Operation See! Be Seen! Strategy PS-5: Research, Evaluation and Analytical Support for New York’s Performance-Based Non-motorized (Pedestrians and Bicyclists) Program Research and evaluation activities that support the state’s comprehensive Non-motorized (Pedestrians and Bicyclists) program will be funded under this strategy. The data-driven, performance-based approach to reducing crashes, fatalities and injuries involving these vulnerable groups of highway users requires access to the appropriate data, as well as the technical capabilities to perform the analyses and interpret the results. Research on Pedestrian & Bicycle Safety PS-2020-006 Research and evaluation efforts undertaken to identify trends and potential new problem areas in pedestrian and bicycle safety, assist in defining future program directions and potential countermeasures, and assess program effectiveness will be eligible for funding.

2020 Highway Safety Strategic Plan Occupant Protection…Page 65
OCCUPANT PROTECTION Overview New York’s Occupant Protection Program is built on a foundation of strong laws. In 1984, New York passed the nation’s first seat belt law; the law allowed for primary enforcement and covered all front seat passengers and children up to ten years of age riding in the back seat. In 2000, the law was amended to extend mandatory use to all children under age 16 in any seating position. While universal coverage of all vehicle occupants has not yet been passed by the State Legislature, New York has been progressive in passing legislation that requires the use of child restraint systems that are appropriate for the child’s height, weight, age and developmental ability. Effective November 24, 2009, New York’s “Booster Seat Law” requires children up to the age of eight to be restrained in an appropriate child restraint system. Effective November 1, 2019, children under age two must be in a rear-facing seat. Since the establishment of the Buckle Up New York (BUNY) program in the late 1990s, compliance with the state’s occupant restraint laws has been supported primarily by high visibility enforcement efforts. New York joined the national Click It or Ticket campaign in 2002 and continues to participate in the highly effective national seat belt enforcement mobilizations. The Governor’s Traffic Safety Committee (GTSC) once again promoted statewide participation by law enforcement agencies in the national Click It or Ticket campaign that was conducted in May 2019. Because of New York’s continued commitment to high visibility enforcement of the state’s seat belt laws, a statewide seat belt use rate of 90% or higher has been sustained since 2010; in 2017, the seat belt use rate reached 93%, the highest compliance since the law was enacted in 1984. Because of this high use rate, identifying and directing efforts toward the high-risk groups that comprise the 8%-10% who do not comply with the law will continue to be a major focus of the program in FFY 2020. Improving the safety of children riding in motor vehicles also continues to be a major objective of New York’s Occupant Protection Program. With support from GTSC’s Child Passenger Safety (CPS) mini-grant program, a variety of efforts are undertaken to increase awareness and educate parents and other caregivers on the best way to protect young passengers riding in motor vehicles. Each year, GTSC supports approximately 155 local programs that provide education and instruction in the safe transportation of children and ensures that sufficient numbers of trained and certified CPS technicians are available to provide these services. In FFY 2020, GTSC will continue to promote outreach efforts to ensure that the state’s underserved populations and residents in all geographic areas have access to the information and services they need. GTSC plays the central role in the promotion and coordination of multiple components of New York’s Occupant Protection Program. The funds and other resources GTSC invests to increase the use of occupant restraints are complemented by a number of other federal, state, local and private sector activities. While a real dollar amount cannot be accurately estimated for the contributions of each of the partners involved in increasing compliance with the seat belt law and improving the safety of children riding in vehicles, the most significant sources of funding, programming and in-kind support

2020 Highway Safety Strategic Plan Occupant Protection…Page 66
that assist in achieving the performance goals established in the HSSP include the following: NYS Association of Traffic Safety Boards; New York’s Certified CPS Technicians; New York State Police; New York State Park Police; Local police, fire departments and EMS; Hospitals and clinics; County Health Departments; County Traffic Safety Boards and Safe Kids Worldwide. Performance Report Number of unrestrained passenger vehicle occupant fatalities, all seat positions
The core outcome measure for tracking progress in the Occupant Protection program area is unrestrained passenger vehicle occupant fatalities. Based on FARS data, the 5-year average number of unrestrained passenger vehicle occupant fatalities was on a steady downward trend from 2013 to 2017, declining from 196 to 167. Because of this improvement, the target of 167.4 set for 2015-2019 was met. Observed seat belt use for passenger vehicles, front seat outboard occupants
The core behavioral measure for tracking progress in the Occupant Protection program area is the observed seat belt use rate for front seat occupants. New York has maintained a statewide use rate of 90% or above since 2010. A statewide usage rate of 92.9% was measured in the 2018, only half a percentage point from the all-time high of 93.4% measured in the 2017 survey. Because the 5-year moving average rate for 2014-2018 remained at 92%, the target of 94.0% set for the 2015-2019 average may be difficult to reach.
88%90% 91% 90% 91% 91%
92% 92%93% 93%
86%87%
88%90% 90% 90% 91% 91% 92% 92%
80%
85%
90%
95%
SEAT BELT USE RATES AND 5-YEAR MOVING AVERAGE2009-2018
Seat Belt Use Rate 5-Yr Moving AverageSource: NYS Annual Seat Belt Observation Surveys
186 155 173 153* 169
196 185 181 175 167
0
50
100
150
200
250
2013 2014 2015 2016 2017
UNRESTRAINED PASSENGER VEHICLE OCCUPANT FATALITIES
Unrestrained PV Occ Fatalities5 Yr Moving Avg
* Revised based on final 2016 FARS dataSource: FARS

2020 Highway Safety Strategic Plan Occupant Protection…Page 67
Problem Identification Additional data analyses were conducted to assist GTSC in setting priorities for the Occupant Protection program area and selecting data-driven countermeasure strategies and planned activities that will enable the state to achieve its performance goals. The key findings from the problem identification component are presented in this section. Analyses of Reported Restraint Use in Crashes
Analyses based on the state’s AIS crash data accessed through the Traffic Safety Statistical Repository (TSSR) provide additional information to consider in planning effective programs. Although reported restraint use in crashes is considered less reliable than observed use, the reported use rate in crashes is consistent with the rate of use observed in traffic during New York’s statewide surveys. Over the three-year period, 2015-2017, 91% of the front seat occupants killed or injured in crashes in New York State were reported to be restrained, compared to 92%-93% of front seat occupants observed in traffic. The proportion of young children who were reported to be unrestrained was also low; 4% of the 7,538 children under five years of age killed or injured in crashes over the time period 2015-2017 were not restrained. Seven percent of the children who were killed or injured while riding in the front seat of the vehicle were unrestrained compared to 4% who were riding in the back seat. Instances of the incorrect use of child safety seats, however, remain high. Unrestrained Occupants in Total, Alcohol-Related and Speed-Related Crashes
To aid in developing effective strategies to increase seat belt use, further analyses were conducted to identify the characteristics of the relatively small group of drivers and occupants who do not comply with the law. Based on analyses of restraint use in specific types of crashes, it was determined that occupants who are killed or injured are more likely to be unrestrained when alcohol or speed is involved in the crash. Over the three-year period 2015-2017, the proportion of all occupants killed or injured in alcohol-related crashes who were unrestrained remained steady at 14%. The proportion of occupants killed or injured in speed-related crashes who were not using a safety restraint declined slightly from 9% to 8%. In comparison, the proportion of unrestrained occupants killed or injured in all crashes declined slightly from 6% to 5%.
91% 91% 91%
4% 4% 3%5% 5% 6%0%
20%
40%
60%
80%
100%
2015 2016 2017
RESTRAINT USE OF FRONT SEAT OCCUPANTS KILLED OR INJURED IN CRASHES*
Restraint Used Unrestrained Unknown
*Police-reported CrashesSource: NYS AIS / TSSR
6% 6% 5%
14% 14% 14%
9% 8% 8%
0%
5%
10%
15%
20%
2015 2016 2017
UNRESTRAINED OCCUPANTS KILLED OR INJURED IN TOTAL CRASHES, ALCOHOL-RELATED CRASHES
AND SPEED-RELATED CRASHES*
Total Crashes Alcohol-Related Crashes Speed-Related Crashes*Includes front and back seat occupants in police-reported crashesSource: NYS AIS / TSSR

2020 Highway Safety Strategic Plan Occupant Protection…Page 68
Analyses of Seat Belt Use: Day vs. Night
Reported restraint use in crashes is consistently higher during the day (7 am-6:59 pm) than at night (7 pm-6:59 am). Over the three-year period 2015-2017, 6% of the front seat occupants killed or injured in crashes at night were not using a safety restraint compared to 3% during the day. Analyses of Seat Belt Use by Gender
Differences in restraint use by gender were also found among front seat occupants who were killed or injured in crashes. According to police-reported restraint use in crashes, unrestrained occupants who were killed in crashes were more than three times as likely to be male (77% vs. 23%); among the unrestrained occupants who were killed or injured, 64% were men and 36% were women.
The difference in restraint use among men and women was reinforced in the Driver Behavior Surveys conducted at five DMV offices in 2014-2018. The proportion of male drivers who said they “always” wear a seat belt ranged from 82% to 87%, compared to 88%-91% among female drivers.
Analyses of Seat Belt Use by Age
The unrestrained front seat occupants who were killed in crashes over the three-year period 2015-2017, were most likely to be 60 years of age or older (25%). The greater severity of the injuries suffered by older motorists who are involved in crashes is likely to contribute to their higher fatality numbers. When the unrestrained front seat occupants who are injured are combined with those killed, the largest proportion of these occupants were the 30-39 age group (19%).
77%64%
23%36%
0%20%40%60%80%
100%
Killed Killed or Injured
GENDER OF UNRESTRAINED FRONT SEAT OCCUPANTS KILLED OR INJURED IN
CRASHES: 2015-2017
Men WomenSource: NYS AIS
3%
6%
0%
5%
10%
UNRESTRAINED FRONT SEAT OCCUPANTS KILLED OR INJURED IN CRASHES:DAY VERSUS NIGHT: 2015-2017
Day (7 am-6:59 pm) Night (7 pm-6:59 am)Source: NYS AIS
2%7%
10%14%
16%12% 14%
25%
4%8%
13%15%
19%15%
13% 13%
0%
5%
10%
15%
20%
25%
30%
<18 18-20 21-24 25-29 30-39 40-49 50-59 60+
AGE OF UNRESTRAINED FRONT SEAT OCCUPANTSKILLED OR INJURED IN CRASHES: 2015-2017
Killed Killed or InjuredSource: NYS AIS

2020 Highway Safety Strategic Plan Occupant Protection…Page 69
In the most recent Driver Behavior Survey conducted in 2018, self-reported restraint use increased with age; 92% of the drivers ages 55 and older reported that they always buckle up. The smallest proportion of drivers reporting they always wear their seat belt were drivers under age 21 (70%). Analyses of Tickets
The number of seat belt tickets issued continued on a downward trend in 2017. Compared to 2013 when 229,238 tickets were issued for seat belt violations, 162,076 tickets were issued in 2017, a decrease of approximately 29%. It is likely that the sustained high use rate in New York, reductions in highway safety funding and competing priorities for enforcement resources have all contributed to the decline in the number of tickets issued. In 2017, 47% of the tickets for seat belt violations were issued by the New York City Police Department (NYPD), the State Police issued 29%, and other local and county police agencies issued 17% and 7%, respectively.
Although the downward trend in the number of seat belt tickets issued has continued, results from the annual Driver Behavior Surveys indicate that the perception of risk of getting a seat belt ticket has been sustained. In 2018, 53% of the drivers thought that they would receive a ticket “always” or “most of the time” if they were not wearing a seat belt.
229,238197,986
174,087 162,483 162,076
0
100,000
200,000
300,000
2013 2014 2015 2016 2017
TICKETS ISSUED FOR VIOLATIONS OF THE SEAT BELT LAW
Sources: NYS TSLED and AA Systems / TSSR
70%
83%88%
90% 89%92% 92%
50%
60%
70%
80%
90%
100%DRIVERS WHO REPORT THEY "ALWAYS" WEAR THEIR SEAT BELT
BY AGE GROUP: 2018
Source: 2018 Driver Behavior Survey
29%
7%47%
17%
PROPORTION OF SEAT BELT TICKETS ISSUED BY TYPE OF POLICE AGENCY:
2017
State Police County NYPD Other LocalSources: NYS TSLED and AA Systems / TSSR
51% 53% 53% 54% 53%
0%
25%
50%
75%
2014 2015 2016 2017 2018
DRIVERS WHO THOUGHT THEY WOULD "ALWAYS" OR "MOST OF THE TIME"
RECEIVE A SEAT BELT TICKET
Source: 2014-2018 Driver Behavior Surveys

2020 Highway Safety Strategic Plan Occupant Protection…Page 70
Occupant Protection Strategies Using a data-driven approach, New York has identified a comprehensive set of strategies that collectively will enable the state to reach the performance targets for the Occupant Protection Program. Examples of activities that will be considered for funding are listed under each strategy. Strategy OP-1: Seat Belt Enforcement The effectiveness of high visibility enforcement in increasing compliance with occupant restraint laws has been demonstrated at the national level as well as within New York State. In FFY 2020, GTSC will continue to implement this countermeasure through its Buckle Up New York (BUNY) enforcement program and will participate in the national Click It or Ticket (CIOT) mobilization in May. During the two-week mobilization conducted May 2-June 2, 2018, over 24,000 seat belt tickets and nearly 2,200 child restraint tickets were issued. The total number of tickets issued in the 2018 mobilization was only slightly below the number issued in the previous year.
TICKETS ISSUED DURING THE MAY 2017 AND 2018 BUNY/CIOT MOBILIZATIONS May 22-June 4, 2017 May 21-June 3, 2018
Tickets for Seat Belt Violations 24,257 24,391 Tickets for Child Restraint Violations 2,365 2,184 Total Safety Restraint Tickets Issued 26,622 26,575
All other enforcement efforts under the Occupant Protection Program will be planned, implemented and monitored in accordance with requirements of the state’s evidence-based Traffic Safety Enforcement Program (TSEP). Participation in National Click It or Ticket Mobilization OP-2020-001 New York State participates in the national Click It or Ticket Mobilization each year. During the two-week mobilization conducted May 2-June 2, 2018, over 24,000 seat belt tickets and nearly 2,200 child restraint tickets were issued. The total number of tickets issued in the 2018 mobilization was only slightly below the number issued in the previous year. New York’s Buckle Up New York/Click It or Ticket program will continue to be the state’s primary enforcement strategy for occupant protection. In FFY 2020, the BUNY program will promote the national Click It or Ticket mobilization scheduled for May 18-23, 2020; all police agencies receiving GTSC Police Traffic Services (PTS) grants are required to participate in the May high visibility enforcement campaign. Agencies receiving grant funding are also required to: Have a mandatory seat belt use policy and conduct roll
call video training
Conduct high visibility, zero tolerance enforcement using checkpoints, saturation patrols and, when possible, include nighttime enforcement and collaborative interagency efforts
Focus on low-use groups based on geography, demographics and other factors

2020 Highway Safety Strategic Plan Occupant Protection…Page 71
While grant funding supports the participation of a large number of police agencies, nearly every police agency in the state actively supports the Click It or Ticket campaign and the annual seat belt enforcement mobilization. New York and Vermont also participate in a cooperative “Border to Border” seat belt enforcement effort.
Combined Enforcement OP-2020-002 Another enforcement countermeasure that has been shown to be effective is combining seat belt enforcement with enforcement of other traffic violations. As indicated by the data, occupants are less likely to be restrained in crashes that involve high-risk behaviors such as speeding and impaired driving. These combined efforts provide more opportunities to increase the perception of the risk of receiving a seat belt ticket and can increase the overall productivity of enforcement efforts. For example, combining seat belt enforcement with a DWI checkpoint provides an opportunity to conduct nighttime seat belt enforcement and make more efficient use of resources. A combined enforcement approach enables agencies to conduct sustained enforcement of seat belt use as well as other traffic violations. Strategy OP-2: Communications and Outreach Outreach and communication efforts undertaken in conjunction with seat belt enforcement are essential for an effective seat belt campaign. The publicity generated from earned and paid media coverage of enforcement efforts raises public awareness and the perception of risk of receiving a ticket, resulting in greater compliance among all motorists. Also important are ongoing efforts to promote compliance by educating the public about the importance and correct use of occupant restraints, including seat belts, booster seats and child restraints. PI&E Support for Enforcement Efforts OP-2020-003 GTSC will continue to support communications, outreach and other public information and education efforts to publicize high visibility enforcement mobilizations including those that are directed at the general population in the state and those that target specific groups such as young drivers who have been identified as high-risk, low compliance segments of the population. Education of the General Public and High-Risk Groups OP-2020-004 Projects that include communication and outreach activities to educate the public and specific target groups about the importance of safety restraint use will also be supported. Examples include informational displays at popular venues such as the New York State Fair, the use of Convincer trailers and rollover simulators to demonstrate to various groups the importance of seat belt use in crashes, and special activities for young drivers such as “Battle of the Belts” competitions. The involvement of groups such as medical personnel, educators and law enforcement who regularly interact with the public and are in a position to assist with these educational efforts will continue to be encouraged.

2020 Highway Safety Strategic Plan Occupant Protection…Page 72
Child Passenger Safety Strategies The second major focus of New York’s Occupant Protection Program is the safety of young children riding in vehicles. The emphasis in this area is on educating parents and caregivers on the importance of using the child restraint system that is appropriate for the child’s height, weight, age and developmental ability, as well as providing hands-on instruction on how to properly install child restraints in vehicles. The use of an appropriate child restraint system that is correctly installed and properly adjusted is an important countermeasure for reducing fatalities and the severity of injuries suffered by young passengers in crashes. Ensuring that access to this education and training is available to residents in all areas of New York State, both urban and rural, and to the populations that are most at-risk, including low-income groups and minority populations, are priorities of New York’s program. GTSC’s commitment to maintaining a strong child passenger safety program is demonstrated by the designation of a GTSC staff member to serve as a full-time Statewide CPS Coordinator. New York’s Child Passenger Safety Advisory Board, which is comprised of a representative from each of the state’s 14 designated Child Passenger Safety regions, also plays a major role in all aspects of the program. Funding for local and state entities to provide education and services is made available through GTSC’s Child Passenger Safety (CPS) mini-grant program. Mini-grants are available in the following categories: Child Passenger Safety Inspection Stations; CPS Awareness Classes; Child Safety Seat Check Events; and Child Safety Seat Distribution Programs. In order to receive funding, grantees must agree to comply with stringent guidelines that ensure standards of quality, service and safety are maintained and that certified technicians are available at each inspection station during the posted hours of operation and at each seat check event that is held. In their funding applications, grantees must identify the target population they are addressing supported by data and other documentation and provide an action plan. Local programs must demonstrate that they are providing CPS services to meet the needs of all families within their jurisdictions, including those that may require special attention due to language and cultural differences. GTSC awarded a total of 169 CPS mini-grants throughout the state in FFY 2019, and 172 applications for mini-grants have been received for FFY 2020. Strategy OP-3: Child Passenger Safety Communications and Outreach The protection of young children riding in vehicles requires extensive statewide and community involvement in educating parents and caregivers on the importance of using the correct child restraint system for the child’s height, weight, age and developmental ability. New York State Child Passenger Safety Program Support OP-2020-005 A GTSC staff member serves as New York’s Child Passenger Safety Coordinator and works with the CPS Advisory Board and its regional representatives who provide guidance and support for the statewide CPS network. Information for technicians on scheduled events and classes and updates on child passenger safety issues are posted on the GTSC website and disseminated through the CPS Advisory Board. The CPS Advisory Board also coordinates statewide events such as National Seat Check Saturday held during National Child Passenger Safety Week in September each year.

2020 Highway Safety Strategic Plan Occupant Protection…Page 73
Statewide Child Passenger Safety Public Information and Outreach OP-2020-006 GTSC funds statewide communication and outreach efforts that extend into every county in the state to increase public awareness of child passenger safety issues. These efforts include the Child Passenger Safety Education and Support program provided by the New York State Police and the CPS Statewide Training provided by the NYS Association of Traffic Safety Boards’ and its participation in National CPS Week. GTSC will continue to support and coordinate a statewide public information and education campaign providing educational materials and media messages on the importance of child safety seat, booster seat, and seat belt use; the correct installation and use of the various systems; the types of restraint systems that are appropriate for children of different ages, heights and weights; the importance of having children age 12 and under ride in the rear seat; and the new law effective November 1, 2019 that requires children under age two to ride in rear-facing seats. GTSC will serve as the conduit to disseminate educational materials related to updates and recalls pertaining to child restraints and will as maintain a continuous communications channel for the promotion of public awareness of the state’s mandated occupant protection requirements for children from birth through age sixteen. Child Passenger Safety Awareness Classes OP-2020-007 On the local level, GTSC will continue to enhance Child Passenger Safety education through the availability of CPS mini-grants for local agencies to conduct awareness training sessions that offer educational programs on child passenger safety issues. The major emphasis of these educational programs will be to train parents, caregivers and others who transport children to protect their safety by using the right seat for the child installed the right way. Presentations will be made to various types of groups including members of the public health and medical communities, fire and other emergency response personnel, preschool and other bus drivers, and social service programs. CPS technicians will especially be encouraged to provide CPS awareness classes to expectant parents, child care providers, and members of minority communities. Educating and training parents and members of the various groups who are in regular contact with the public will significantly contribute to the dissemination of child passenger safety information throughout every region of the state and to diverse populations within each region. In FFY 2019, 38 agencies received funding to conduct CPS awareness classes; 35 applications for FFY 2020 funding have been received. Strategy OP-4: Child Safety Seat Inspection Stations New York continues to maintain an active network of child safety seat inspection stations across the state. As of April 12, 2019, there were 333 inspection stations in New York. This includes 225 inspection stations supported through grants awarded by GTSC (137 in FFY 2019). For FFY 2020, GTSC received 129 funding applications for inspection stations. A complete list of inspection stations organized by county is maintained on the GTSC website. Included in the list are 36 operated by the New York State Police. For each inspection station, the location, hours of operation and contact information for questions and scheduling appointments are provided. The listing also identifies those inspection stations with Spanish-speaking technicians available. GTSC contacts all of the inspection stations on an annual basis to verify and update the information posted on the website. These inspection stations, which are located in fire stations, police stations, hospitals and other permanent locations, offer information and instruction on the appropriate restraint system to use based on the age and size of the child and the proper installation of that restraint. GTSC requires that child restraint inspection stations be staffed by CPS Technicians and/or Instructors with current certification status to ensure that the standards of the program are maintained.
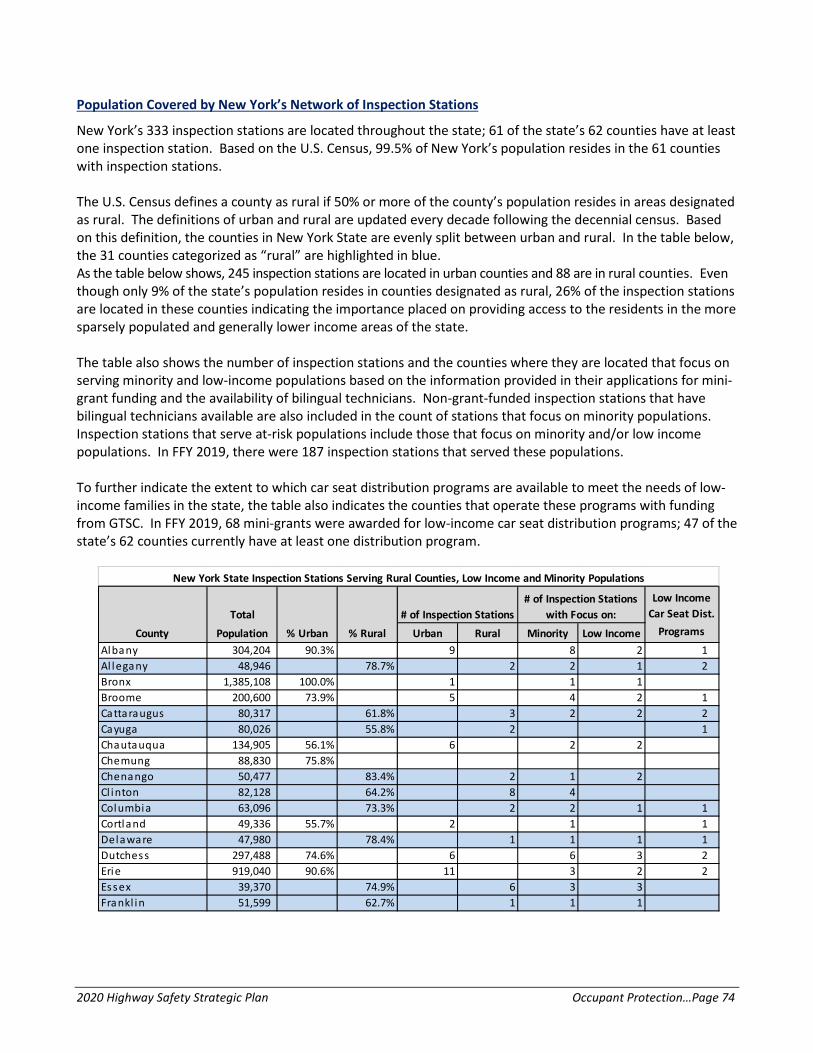
2020 Highway Safety Strategic Plan Occupant Protection…Page 74
Population Covered by New York’s Network of Inspection Stations
New York’s 333 inspection stations are located throughout the state; 61 of the state’s 62 counties have at least one inspection station. Based on the U.S. Census, 99.5% of New York’s population resides in the 61 counties with inspection stations. The U.S. Census defines a county as rural if 50% or more of the county’s population resides in areas designated as rural. The definitions of urban and rural are updated every decade following the decennial census. Based on this definition, the counties in New York State are evenly split between urban and rural. In the table below, the 31 counties categorized as “rural” are highlighted in blue. As the table below shows, 245 inspection stations are located in urban counties and 88 are in rural counties. Even though only 9% of the state’s population resides in counties designated as rural, 26% of the inspection stations are located in these counties indicating the importance placed on providing access to the residents in the more sparsely populated and generally lower income areas of the state. The table also shows the number of inspection stations and the counties where they are located that focus on serving minority and low-income populations based on the information provided in their applications for mini-grant funding and the availability of bilingual technicians. Non-grant-funded inspection stations that have bilingual technicians available are also included in the count of stations that focus on minority populations. Inspection stations that serve at-risk populations include those that focus on minority and/or low income populations. In FFY 2019, there were 187 inspection stations that served these populations. To further indicate the extent to which car seat distribution programs are available to meet the needs of low-income families in the state, the table also indicates the counties that operate these programs with funding from GTSC. In FFY 2019, 68 mini-grants were awarded for low-income car seat distribution programs; 47 of the state’s 62 counties currently have at least one distribution program.
TotalLow Income
Car Seat Dist.
County Population % Urban % Rural Urban Rural Minority Low Income Programs
Albany 304,204 90.3% 9 8 2 1Al legany 48,946 78.7% 2 2 1 2Bronx 1,385,108 100.0% 1 1 1Broome 200,600 73.9% 5 4 2 1Cattaraugus 80,317 61.8% 3 2 2 2Cayuga 80,026 55.8% 2 1Chautauqua 134,905 56.1% 6 2 2Chemung 88,830 75.8%Chenango 50,477 83.4% 2 1 2Cl inton 82,128 64.2% 8 4Columbia 63,096 73.3% 2 2 1 1Cortland 49,336 55.7% 2 1 1Delaware 47,980 78.4% 1 1 1 1Dutchess 297,488 74.6% 6 6 3 2Erie 919,040 90.6% 11 3 2 2Essex 39,370 74.9% 6 3 3Frankl in 51,599 62.7% 1 1 1
New York State Inspection Stations Serving Rural Counties, Low Income and Minority Populations
# of Inspection Stations# of Inspection Stations
with Focus on:

2020 Highway Safety Strategic Plan Occupant Protection…Page 75
Ful ton 55,531 50.4% 1 1Genesee 60,079 59.9% 3 1 1Greene 49,221 73.1% 2 1 1Hami l ton 4,836 100.0% 3 1Herkimer 64,519 51.8% 2 1 1 1Jefferson 116,229 52.0% 3 2 2 1Kings 2,504,700 100.0% 5 3 2Lewis 27,087 86.8% 2 1Livingston 65,393 54.7% 11 10 10 1Madison 73,442 58.9% 1 1Monroe 744,344 93.6% 16 4 1 3Montgomery 50,219 59.1% 1 1Nassau 1,339,532 99.8% 10 4 1 4New York 1,585,873 100.0% 4 2 1Niagara 216,469 77.6% 5 3 1 2Oneida 234,878 67.0% 10 6 5 4Onondaga 467,026 87.4% 12 7 1 1Ontario 107,931 52.5% 7 3 1 1Orange 372,813 77.7% 22 14 5 1Orleans 42,883 60.9% 2 2 2Oswego 122,109 61.8% 6 3 1 1Otsego 62,259 70.6% 3 2 3 1Putnam 99,710 79.5% 5 1 1Queens 2,230,722 100.0% 4 4 1 2Rensselaer 159,429 69.5% 4 2 2 1Richmond 468,730 100.0% 4 2 1Rockland 311,687 99.3% 8 4 2 1Saratoga 219,607 70.0% 12 11 4 1Schenectady 154,727 91.8% 8 3 1 1Schoharie 32,749 82.8% 1 1Schuyler 18,343 81.2% 2 2 1 1Seneca 35,251 58.7% 3 3 3 1St. Lawrence 111,944 62.0% 2 2 1Steuben 98,990 60.4% 4 2 2Suffolk 1,493,350 97.4% 17 7 3 2Sul l ivan 77,547 74.2% 2 1Tioga 51,125 65.7% 2 1Tompkins 101,564 56.7% 3 2 2 1Ulster 182,493 54.0% 16 11 4 3Warren 65,707 66.1% 3 1 1Washington 63,216 67.9% 2 2 1 1Wayne 93,772 60.7% 3 3 2 1Westchester 949,113 96.7% 26 10 1 3Wyoming 42,155 64.1% 3 2 2Yates 25,348 71.2% 1 1TOTAL 19,378,102 87.9% 12.1% 245 88 182 93 68TOTAL Inspection Stations 333 73.6% 26.4%Source: U.S. 2010 Census Urban and Rura l Class i fi cation (https ://www.census .gov/geo/reference/urban-rura l .html)Notes : Counties class i fied as Rura l are highl ighted in blue.Information on inspections s tations that focus on minori ty and low income populations i s only ava i lable for those funded by GTSC.
2020 Highway Safety Strategic Plan Occupant Protection…Page 76
Outreach to Underserved Populations
While the vast majority of New York’s population resides in counties with active child restraint inspection stations and 26% are located in the rural areas of the state, additional efforts to reach the underserved are also an important component of New York’s occupant protection program. One of the outreach strategies to further increase access to education and car seat inspection services to rural, low-income, minority and other underserved populations is to bring the inspection station to them. Each year, GTSC provides funding for storage trailers that double as mobile fitting stations to make child restraint inspections more accessible and convenient for underserved populations in both rural and urban areas.
In addition, efforts are made to conduct CPS Certification Training courses in these areas with underserved populations where warranted and to find agencies to partner with who can provide the space for low-income car seat distribution programs to be established. Where appropriate, several grantees in New York State reach out to the diverse populations that they serve by working with interpreters to assist technicians. Because of New York’s large Spanish-speaking population, many inspection stations have technicians on staff who are bilingual. To date, 60 of the certified technicians in New York State are bilingual in English and Spanish. Another strategy to increase accessibility for diverse groups is to encourage the establishment of inspection stations within specific communities. Examples of these types of outreach programs are described below. Mohawk Valley Resource Center for Refugees (MVRCR)
The MVRCR works with multiple language groups and provides education to a low-income population of primarily refugees and immigrants. Child passenger safety (CPS) education and child restraint distribution services are organized by language groups with support from interpreters. Referrals to the program come from the adult English Language Learners (ELL) school, St Luke's Memorial Hospital, the Oneida County Health Department and other local social services agencies, such as the Neighborhood Center and CareNet. In order to build and sustain a strong team of CPS technicians, the MVRCR has been focusing on ensuring that its existing pool of CPS Technicians completes their recertification requirements and on recruiting additional bilingual technicians. Because of the cultural diversity of the population that is served by the MVRCR, it is essential that the CPS educational services be provided in a context that is relevant to the experience of the refugees and immigrants who are receiving assistance. The MVRCR has developed a unique approach to illustrate the importance of securing children in child safety seats that has proven to be very successful with the population it serves. In FFY 2018, the MVRCR provided 102 child restraints to low-income families; 63 seats were distributed in the first half of FFY 2019.
Albany County Department of Public Works
Albany County has experienced a large increase in the number of refugees and immigrants residing within the county. Much of the increase is the result of the placement of families by agencies including the United States Committee on Refugees and Immigrants which places approximately 300 families per year in the county. Most of these families arrive from countries that do not have strong child passenger safety programs. Many parents do not have child safety seats and those who do often find the training challenging due to language barriers and other factors. In addition, because many immigrant and refugee families share vehicles, education on installing seats in a number of different vehicle models is needed. The Albany County Department of Public Works is providing car seat checks and CPS education that focuses on the needs of this growing population. In addition, car safety seats

2020 Highway Safety Strategic Plan Occupant Protection…Page 77
are provided free of charge to low-income families who do not have an appropriate seat for their child. In FFY 2018, the Albany County Department distributed 445 car seats within its low-income program. At the mid-year mark of FFY 2019, the agency had distributed 242 seats to low-income and primarily refugee families.
Ardent Solutions
Ardent Solutions, Inc., a nonprofit public health program based in western New York State, provides outreach to underserved diverse populations in a number of traffic safety program areas. Activities conducted in the area of child passenger safety include the establishment of a child safety seat inspection station in Salamanca, New York, to provide services to the Seneca Nation of Indians. Ardent distributed 202 child safety seats in FFY2018. In addition to continuing to operate the inspection station, Ardent Solutions began providing occupant protection awareness training in FFY 2019. As of April 16, six training programs have been conducted.
Children with Special Needs
The establishment of additional special needs inspection stations at hospitals with certified CPS technicians on staff who have completed the Riley Children’s Hospital special needs technician training is also a priority. As more certified technicians complete the special needs training, more inspection stations outside of a hospital setting are able to assist families with special needs children. Currently, New York has 62 certified technicians who are special needs certified. Child Safety Seat Inspection Stations OP-2020-008 The projects in this area are funded through mini-grants awarded by GTSC for the operation of inspection stations. To receive funding, grantees must have certified technicians available to staff the inspection station during the hours of operation. CPS grant funds can also be used for mobile fitting stations which bring CPS services to families residing in the more rural areas in the state. The use of mobile fitting stations expands the coverage of the state’s Child Passenger Safety Program into areas where access to CPS education and instruction was previously lacking. Projects that focus on serving high-risk populations within the state such as low-income and minority communities are also important to ensure access throughout the state. In FFY 2019, GTSC awarded 126 mini-grants for the operation of inspection stations; 128 applications have been received for mini-grant funding in FFY 2020. Strategy OP-5: Car Seat Check Events Another type of program that increases access to instruction on the proper installation of child safety seats are seat check events. These events provide an opportunity to educate parents, grandparents and caregivers on the need for booster seats for children up to eight years of age. The trend in New York State has been to conduct fewer car seat check events, but to conduct them with increased publicity. Agencies applying for funding under GTSC’s mini-grant program are encouraged to conduct events in rural areas, low-income communities and areas with diverse populations and to ensure the events are well publicized.

2020 Highway Safety Strategic Plan Occupant Protection…Page 78
Car Seat Check Events OP-2020-009 The projects in this area are funded through mini-grants awarded by GTSC to conduct child passenger safety check events. In FFY 2019, 117 agencies were approved to conduct car seat check events; 121 applications for FFY 2020 funding have been received. Strategy OP-6: Recruitment and Training of Child Passenger Safety Technicians The availability of a large pool of persons with the training, knowledge and skills to identify when a child safety seat is installed incorrectly, determine the correct installation for the seat, and demonstrate the proper installation, including the use of the LATCH system, to parents and other caregivers is essential to sustaining the state’s Child Passenger Safety program. Persons interested in becoming certified child passenger safety technicians must complete a three- or four-day Standardized Child Passenger Safety Technician Course provided by Safe Kids. Persons successfully completing this training are certified for two years; to be recertified after two years, CPS technicians must earn six Continuing Education Units (CEU). GTSC provides support for the delivery of standardized CPS Certification Courses for new technicians, as well as update training classes. Continuing Education Units (CEU) that can be used toward recertification are available for the technicians who attend these update training classes. CPS technicians are also able to earn continuing education units toward their recertification by attending the workshops presented at the Regional Child Passenger Safety Technical and Training Conferences that rotate among Connecticut, New Jersey, New York and Pennsylvania. If a certified technician fails to recertify, GTSC supports the presentation of the Safe Kids mandated one-day Renewal Testing seminars. GTSC covers the recertification fees for technicians and instructors. As a result of these efforts to retain its certified technicians, New York has maintained a recertification rate of 66.6%, which exceeds the national average of 55.7%. Certified CPS technicians are encouraged to participate in car seat check events during the year and to maintain their skills by installing child safety seats in other settings. Technicians are also encouraged to attend additional training that will enable them to work with special populations such as children with special needs. In addition to providing one-on-one instruction in the correct installation and use of child safety seats, the presentation of child passenger safety awareness classes to groups of parents, grandparents, caregivers and others who transport children is another important educational activity supported by New York’s occupant protection program. In 1999, the child passenger safety technician program in New York started with 98 certified technicians and nine instructors. While other states have lost technicians and instructors in recent years, the numbers in New York have remained steady. As of February 11, 2019, New York has a total of 1,889 nationally-certified CPS technicians, 82 of whom are instructors. Every county in New York State has at least one CPS technician. A map showing the distribution of the certified CPS technicians by county in New York State is included below. Westchester County has the highest number of technicians (144), followed by Monroe County (137).

2020 Highway Safety Strategic Plan Occupant Protection…Page 79
New York’s Certified CPS Technicians come from a variety of backgrounds, with 65% representing law enforcement (local police 19%, County Sheriffs 27% and State Police 19%); 11% are from emergency medical services and fire departments and 11% are from health agencies.
CPS Certified Technician Training Classes OP-2020-010 New York State has been successful in maintaining an adequate number of certified CPS technicians to provide statewide coverage of the fitting stations and car seat check events that are scheduled. A major key to the success of the state’s recruitment efforts is making the required standardized CPS technician training available and accessible. To date in FFY 2019, seven Standardized Child Passenger Safety Technician Training classes have been conducted, resulting in 80 new certified technicians. The objectives of New York’s FFY 2020 recruitment and training plan are to 1) maintain the state’s large cadre of technicians through continued support for training programs for new and recertifying technicians and 2) increase the focus on counties with low numbers of technicians and meeting the needs of
19%
27%
19%
11%
11%13%
CPS TECHNICIANS BY AGENCY TYPE Local Police
Sheriffs
State Police
Fire/EMS
Health

2020 Highway Safety Strategic Plan Occupant Protection…Page 80
underserved populations in the state. Through its Child Passenger Safety Coordinator, GTSC will continue to publicize the state’s CPS program and coordinate training programs and other events that support recruitment efforts. The CPS Coordinator works closely with the state’s Child Passenger Safety Advisory Board which is comprised of representatives from 14 regions of the state. In addition to serving as a statewide communication network for the program, these regional representatives assist with technician recruitment and training efforts by identifying areas of their regions where more technicians are needed, organizing training programs and recruiting participants. One of the criteria to qualify for a Section 405 Occupant Protection Grant is to provide a table identifying the number of CPS training classes to be held in FFY 2020, and the estimated number of students needed to not only maintain, but to expand the pool of certified technicians in New York State. Each CPS Advisory Board representative is working with the grantees in their region to schedule two CPS Certification training courses for the coming year. The locations of the 28 CPS Certification courses that are tentatively planned for FFY 2020 appear in the table below; the delivery of these classes depends on the availability of the location and instructors as well as the number of enrollees. A minimum enrollment of 10 is required to hold a course; 25 is the maximum number of students per course.
FFY 2020 CHILD PASSENGER SAFETY TECHNICIAN CERTIFICATION COURSES Region/County Host Organization Students
REGION 1 Genesee City of Batavia Fire Department 10 Erie Cheektowaga Police Department 10 REGION 2 Allegany Ardent Solutions 10 Cattaraugus Ardent Solutions 10 REGION 3 Monroe Monroe County Traffic Safety Board 25 Livingston Cornell Cooperative Extension 15 REGION 4 Cayuga Cayuga County Sheriff ‘s Office 10 Oneida Boonville Police Department 10 REGION 5 Broome Broome County Health Department 20 Chenango Chenango County Sheriff’s Office 20 REGION 6 Saratoga Cornell Cooperative Extension of Saratoga County 10 Washington Washington County Health Dept. 10 REGION 7 Rensselaer Albany County Traffic Safety Board 16 Schenectady Albany County Traffic Safety Board 16 REGION 8 Orange Kingston 20 Dutchess Chester 22

2020 Highway Safety Strategic Plan Occupant Protection…Page 81
Retention of CPS Technicians OP-2020-011 In addition to the recruitment of new technicians, it is equally important to retain CPS technicians who are up for recertification. GTSC supports CPS technical update classes which provide the opportunity for technicians and instructors to update their skills and stay current with new procedures and guidelines. Continuing Education Units (CEU) that can be used toward recertification are available for the technicians who attend these update training classes; six CEUs are needed every two years to recertify. GTSC also covers the recertification fees for technicians and instructors. According to Safe Kids Worldwide, 602 New York State technicians were recertified in 2018. GTSC has previously provided funding for New York’s certified technicians to attend the Regional Child Passenger Safety Technical Conferences hosted on a rotating basis by Connecticut, New Jersey, New York and Pennsylvania. In 2020, New York will host its own Child Passenger Safety Conference in Lake Placid on May 5-7. This conference will provide one of the most important opportunities for CPS technicians to receive continuing education credits to use toward recertification. In FFY 2020, the recertification of technicians will continue to be supported in a number of ways. New York’s CPS program plans to conduct 14 CEU Update Trainings reaching approximately 250 technicians; these programs also provide the opportunity to earn credits toward recertification. Four one-day Certification Renewal testing sessions for an estimated total of 25 technicians are also planned; these sessions are for technicians who let their certification lapse and would like to restore their certification status. In addition, technician recertification fees will continue to be paid and funding will be provided for technicians to attend New York’s CPS Technical Conference where continuing education credits toward recertification can be earned.
Region/County Host Organization Students REGION 9 Westchester Westchester Co. Public Safety 25 Rockland Rockland County Sheriff’s Office 20 REGION 10 New York NYC Dept. of Transportation 15 Brooklyn NYC Dept. of Transportation 12 REGION 11 Queens St. Mary’s Hospital for Children 10 Queens NY Coalition for Safety Belt Use 10 REGION 12 Nassau Long Island Jewish Medical Center 15 Nassau NY Coalition for Safety Belt Use 10 REGION 13 Suffolk Holtsville FD 15 Suffolk TBD 15 REGION 14 Jefferson Jefferson County Sheriff’s Office 20 St. Lawrence St. Lawrence Ambulance 20 Total 421

2020 Highway Safety Strategic Plan Occupant Protection…Page 82
Strategy OP-7: Child Safety Seat Distribution and Education Programs Programs that provide child safety seats to low-income families and education on proper use are an important component of New York’s child passenger safety program. Low-Income Child Safety Seat Distribution Program OP-2020-012 Low-income families are also a segment of the population that need special attention. Child safety seats are given away free of charge to low-income families who have a need. A certified Child Passenger Safety Technician educates each person acquiring a child safety seat in its proper installation, use and maintenance based on the manufacturer’s instructions. Child safety seat distribution and education programs are funded through mini-grants awarded by GTSC. Only agencies that work directly with low-income families, such as health departments, hospitals, childcare councils or social service departments, are eligible to apply. The grantee must determine the income eligibility of the clientele. Low-income families are defined as those who qualify under the New York State WIC Income Eligibility Guidelines or who qualify under a public assistance program. Applicants for funding must have a certified CPS Technician on staff to conduct the program. The CPS Technician is required to conduct a 60- to 90-minute educational component and demonstrate the installation of the appropriate child restraint system for each person requesting a child safety seat. In addition, income eligibility requirements must be met to receive a free child safety seat. In FFY 2019, 68 agencies in New York were awarded funding to operate a child safety seat distribution and education program. A total of 71 applications have been received for mini-grant funding in FFY 2020. . Strategy OP-8: Research, Evaluation and Analytical Support for New York’s Performance-Based Occupant Protection Program Funding will be provided for the preparation of statistical reports and other analyses used to identify trends in seat belt use and the characteristics and factors associated with noncompliance with the seat belt law, and for other types of research, evaluation and analytical support required for New York’s Occupant Protection Program. Statewide Observation Survey of Seat Belt Use OP-2020-013 Funding will also be provided for the implementation of the annual seat belt observational survey conducted in accordance with uniform criteria established by NHTSA. The project will include the recruitment, training and field supervision of data collectors; the selection and scheduling of survey sites; the preparation of all survey materials including maps, data collection forms and instructions for conducting observations of seat belt use; data entry and analysis; and the preparation of the final report. As required by NHTSA’s uniform criteria, new observations sites were selected for the 2018 survey and will be used in the 2019-2022 surveys.
2020 Highway Safety Strategic Plan Traffic Records...Page 83
TRAFFIC RECORDS Overview The extensive use of performance-based program planning conducted by agencies and organizations involved in traffic safety at all jurisdictional levels requires access to a variety of traffic records data. Changes in demographics, traffic patterns and conditions of the highway infrastructure at both the state and local levels present a significant challenge to the state’s highway safety community in identifying the nature and location of traffic safety problems. To develop appropriate countermeasures that meet these challenges, traffic safety professionals need data on crashes and injuries, arrests and convictions for traffic violations, drivers and vehicles involved in crashes and roadway attributes. The need for accurate and timely data, together with an ever-increasing need for data analysis support, is being addressed vigorously by New York through major improvements in the way it maintains and uses its traffic records systems. The Governor’s Traffic Safety Committee (GTSC) plays the central role in the coordination of the multiple components of New York’s traffic records program. New York’s FFY 2020 Traffic Safety Information Systems (TSIS) Strategic Plan, developed by the GTSC with the assistance of the Institute for Traffic Safety Management and Research (ITSMR) and the state’s Traffic Records Coordinating Council (TRCC), reflects the importance the state continues to place on improving the state’s traffic records systems. Using a multi-task process, the GTSC’s traffic records strategic planning process focused on identifying major improvement opportunities for the state's various traffic safety information systems and developing projects to implement those improvements. A copy of the TSIS Strategic Plan is included with the NY FFY 2020 405(c) State traffic safety information system improvements grant application. The funds and other resources GTSC invests to improve the state’s traffic records systems are complemented by a number of other federal, state, local and private sector activities. While a real dollar amount cannot be accurately estimated for the contributions of each of the partners involved in the implementation of traffic records improvements, the most significant sources of funding, programming and in-kind support that assist in achieving the performance goals established in the HSSP are the NYS Department of Motor Vehicles, the NYS Department of Transportation, the New York State Police and the NYS Department of Health that maintain and house the state’s major systems. Performance Report The performance measures used to monitor progress in this area focus on the timeliness of the crash and citation/adjudication data and the completeness of the crash data. With respect to the timeliness of the crash data, the performance measure is the mean number of days from the date a crash occurs to the date the crash report is entered into the AIS (Accident Information System) database. With respect to completeness of the crash data, the performance measure is the percentage of crash records in AIS with no missing data in the data element of Roadway Type. The timeliness measures for the citation and adjudication data are the mean number of days from the 1) date a citation is issued under the TSLED system to the date the citation is entered into the TSLED database, 2) date a citation is adjudicated until the disposition information is entered into the state’s TSLED database, and 3) date a citation is issued under the Administrative Adjudication (AA) system to the date the citation is entered into the AA database.

2020 Highway Safety Strategic Plan Traffic Records...Page 84
The following performance targets were set in the FFY 2019 Highway Safety Strategic Plan: To reduce the mean number of days from the date a crash occurs to the date the crash report is
entered into the AIS (Accident Information System) database from the baseline of 8.64 days (April 1, 2017-March 31, 2018) to 8.21 days (April 1, 2018-March 31, 2019).
To increase the percentage of crash records in AIS with no missing data in the critical data element of
Roadway Type from the baseline of 89.77% (April 1, 2017-March 31, 2018) to 94.26% (April 1, 2018-March 31, 2019).
To reduce the mean number of days from the date a citation is issued to the date the citation is entered into the TSLED database from the baseline of 14.83 days (April 1, 2017- March 31, 2018) to 13.80 days (April 1, 2018-March 31, 2019).
To reduce the mean number of days from the date a citation is adjudicated until the date the disposition information is entered into the state’s TSLED database from the baseline of 24.81 days (April 1, 2017-March 31, 2018) to 23.57 days (April 1, 2018-March 31, 2019).
To reduce the mean number of days from the date a citation is issued to the date the citation is entered into the AA database from the baseline of 12.93 days (April 1, 2017-March 31, 2018) to 12.28 days (April 1, 2018-March 31, 2019).
CRASH AND CITATION/ADJUDICATION INFORMATION SYSTEMS
PERFORMANCE TARGETS
Performance Attributes & Measures Baseline Period
April 1, 2017- March 31, 2018
Performance Period April 1, 2018
March 31, 2019 Crash Information System (AIS)
Timeliness Mean # of days from crash date to date crash report is entered into AIS
8.64 days
9.04 days
Completeness Percentage of crash records with no missing data in the Roadway Type data element
89.77%
86.96%
TSLED System Timeliness – Citations Mean # of days from citation date to date citation is entered into TSLED database
14.53 days
10.50 days
Timeliness –Adjudication Mean # of days from date citation is adjudicated to date disposition info. is entered into TSLED database
24.81 days
22.36 days
AA System Timeliness – Citations Mean # of days from citation date to date citation is entered into the AA database
12.93 days
5.99 days
2020 Highway Safety Strategic Plan Traffic Records...Page 85
The table above shows that progress continues to be made in the timeliness of the TSLED citation and adjudication data. With respect to citations, the timeliness of the TSLED data dropped from 14.53 days during the baseline period to 10.50 days during the performance period, exceeding the goal set in the FFY 2019 strategic plan. This progress can be attributed primarily to the multi-year project TraCS Electronic Crash and Ticketing System. Over the past several years, the TraCS project has increased the number of citations transmitted electronically through TraCS by continuing to expand the electronic capture and transmittal of crash, citation and disposition data at all jurisdictional levels. Currently, more than 90% of the citations issued under TSLED are captured and transmitted to the DMV electronically via TraCS. With regard to the TSLED disposition timeliness measure, the established goal of 23.57 days was also met, with the mean number of days between when the citation is adjudicated until it is entered into TSLED dropping from 24.81 days in the baseline period to 22.36 days in the performance period. The progress that was attained with regard to this adjudication performance measure can be attributed to the more than 1,300 of the state’s 1,400 city, town and village courts that are submitting disposition data to the DMV electronically. The electronic submission of dispositions to the DMV has been supported over the past several years through projects funded by Sections 402, 408 and 405c (e.g., the multi-year TraCS Electronic Crash and Ticketing System project), as well as through projects supported by the DMV and the Office of Court Administration. The table above also shows that progress has been made with respect to the timeliness of the AA citation data, dropping from 12.93 days during the baseline period to 5.99 days during the performance period, far exceeding the goal set in the FFY 2019 strategic plan. The progress attained with regard to this performance measure can be attributed primarily to projects supported by the DMV and the NYPD. The goals established for two of the five performance measures in the table above were not met: the timeliness and completeness of the crash data. As shown in the above table, the goal of 8.21 days set in the FFY 2019 strategic plan for the timeliness measure related to the AIS was not met, with the mean number of days from the crash date to the date the crash report was entered into the AIS database increasing from 8.64 days in the baseline period to 9.04 days in the performance period. This increase likely reflects the fact that many more property damage only crashes are now being captured and reported by police agencies. Similarly, the goal established with regard to completeness related to the AIS was not met. The percentage of crash records with no missing data in the critical data element of Roadway Type dropped from 90% in the baseline period to 87% in the performance period. This decline continues to reflect, in part, changes made in the automated location coding process that no longer allow the option of “Unknown” for the property damage amount, which in turn results in more records with questionable locations. It also reflects the increased volume of crash reports coming in from New York City with questionable locations and from property damage only crashes reported by police agencies. Problem Identification The status of each of the state’s core traffic safety data systems (crashes, citations/adjudication, drivers, injury surveillance, vehicles and roadways) was reviewed by the Traffic Records Coordinating Council (TRCC) and its member agencies to identify opportunities for improvement and assist in selecting countermeasure strategies and projects that will enable the state to achieve its traffic records performance goals. Each system was reviewed with regard to the six attributes of timeliness, accuracy, completeness, uniformity, integration and accessibility. The key findings from the review process which was conducted January-April 2019 are summarized below.

2020 Highway Safety Strategic Plan Traffic Records...Page 86
An additional key finding from the review process highlighted the breadth of the activities being conducted at all jurisdictional levels to improve various traffic records systems. This finding emphasized the need for a systematic and coordinated approach to the development and implementation of traffic records improvement activities. A secondary finding, albeit an important one, arose from the review process. It centered on the recognition that research and evaluation activities play an important role in New York’s traffic records program, underscoring the strengths, limitations and opportunities associated with the state’s six core records systems. Crash Information System
New York’s primary crash information system is the Accident Information System (AIS) maintained by the DMV. With few exceptions, the AIS file contains records of all police-reported motor vehicle crashes and all crashes reported to the DMV by motorists involved in crashes. The file captures all of the data elements found in the police accident report form (MV-104A) and the motorist report form (MV-104).
Timeliness: The mean number of days from the crash date to the date the crash report is entered into
AIS increased slightly from 8.64 days in the baseline period (April 1, 2017-March 31, 2018) to 9.04 days in the performance period (April 1, 2018-March 31, 2019). As of December 2018, approximately 80% of the reportable crashes submitted by the police are being sent electronically. Timeliness could also be improved by increasing the number of police agencies that collect and submit their crash data electronically to the DMV. When the NYPD has the ability to submit its reports electronically, it will further improve the timeliness of the crash data. Timeliness could also be improved by allowing motorists to file their crash reports electronically, and improved dramatically by eliminating the motorist reports and having police agencies report Property Damage Only crashes (PDO).
Accuracy: The implementation of NYS DOT's Accident Location Information System (ALIS) and the on-going improvements to the application have provided better crash location data. Crash location could be further improved if all of the TraCS police agencies used the locator tool within TraCS. Accuracy could also be improved with regard to the identification of crashes involving a commercial motor vehicle (CMV) as CMV crashes are often not identified correctly by the investigating police officer.
Completeness: The crash report forms collect a large volume of data on all reportable crashes which
are then entered into AIS. Completeness did not improve during the past year, with the percentage of crash records with no missing data in the Roadway Type field decreasing from 90% to 87% between the baseline (April 1, 1917-March 31, 2018) and the performance period (April 1, 2018-March 31, 2019). Completeness could be improved by increasing the reporting of crashes involving CMVs. When a crash involves a CMV and the police officer fails to identify the crash as a CMV crash, pertinent data specific to a CMV crash is not collected and reported. Completeness could also be improved by collecting BAC data for all drivers involved in fatal crashes.
Integration: Although crash records can be linked to DMV’s license file and selected DOT files, linking to the DMV registration file cannot be done with precision.
Accessibility: The traffic safety community and general public have access to the crash data on-line
through the TSSR (Traffic Safety Statistical Repository) (www.itsmr.org/TSSR). Maintained by ITSMR, the TSSR provides a variety of crash data and enables users to generate a number of different reports. As of May 1, 2019, crash data are available on the TSSR for the years 2009-2017, with preliminary data for 2018 and the first three months of 2019. The TRCC membership noted that it is important to maintain the TSSR with the most recent crash data possible and ensure that it remains responsive to user needs through the expansion of available data and reports, as warranted.
2020 Highway Safety Strategic Plan Traffic Records...Page 87
Citation/Adjudication Information Systems
The New York State Department of Motor Vehicles maintains the state’s two primary citation and adjudication information systems: 1) Traffic Safety Law Enforcement & Disposition (TSLED) and 2) Administrative Adjudication system (AA). The TSLED system tracks tickets from the time they are printed to their final disposition, recording data and providing management information to police agencies and the courts. Currently, TSLED covers all areas of the state except for New York City. Tickets issued in New York City, with the exception of tickets issued for impaired driving, are covered under the AA system. In addition to capturing the ticket data, the AA system is also used to schedule hearings and account for the collection of traffic fines and surcharges. One uniform traffic ticket is used by both the TSLED and AA systems. Timeliness: With respect to TSLED, the mean number of days from the citation date to the date the
citation is entered into the TSLED database dropped from 14.53 days in the baseline period (April 1, 2017-March 31, 2018) to 10.50 days in the performance period (April 1, 2018-March 31, 2019). Based on the same 12-month time periods, the mean number of days from the date of charge disposition to the date the charge disposition is entered into TSLED database also dropped, from 24.81 days to 22.36 days. Timeliness with regard to TSLED citation/adjudication data could be further improved by increasing the number of police agencies that collect and submit their citation data electronically to the DMV. With respect to the AA system, the mean number of days from the citation date to the date the citation is entered into the AA database dropped dramatically from 12.93 days in the baseline period (April 1, 2017-March 31, 2018) to 5.99 days in the performance period (April 1, 2018-March 31, 2019). This significant improvement can be attributed to projects conducted by the NYPD and the DMV to capture and transmit citation data electronically from the NYPD to the DMV.
Accuracy: The accuracy of both systems could be further improved with the implementation of additional edit checks during the data entry process.
Completeness: Although the AA and TSLED systems use the same uniform ticket to collect the same data, the AA system does not enter all the same information collected as TSLED.
Integration: Although the TSLED and AA data can be integrated with data from other DMV files, there
is a lack of comparability between the TSLED and AA systems that needs to be addressed. This issue will be addressed by a new project being funded under Section 405c in FFY 2020 that will support the modernization of many of the DMV’s records systems, including its citation/adjudication systems. Another issue noted with regard to integration, and to some extent accessibility, is the lack of a link between court adjudication data and data captured by the state’s Impaired Driver System (IDS). Maintained by the state’s Office of Alcoholism and Substance Abuse Services (OASAS), the IDS captures data on drivers convicted of impaired driving from the DMV driver license file. Although the driver license file can provide basic data associated with a driver’s conviction, such as license suspension or revocation, it cannot provide detailed data on the sentence/penalties imposed on the convicted driver. These data are available only on the Office of Court Administration’s Universal Case Management System (UCMS). During this current fiscal year, FFY 2019, the OCA and OASAS are initiating a joint project which will enable a complete report on adjudication outcomes associated with convicted impaired drivers to be captured electronically by the IDS from the UCMS.

2020 Highway Safety Strategic Plan Traffic Records...Page 88
Accessibility: Although outside users such as police agencies and TSLED courts can access data through
a secure signon to view tickets returnable to their individual court, the courts and motorists do not have direct access to the data or the system that would allow them to complete transactions on-line. However, for information and analysis purposes, access to the data is provided on-line through the TSSR (Traffic Safety Statistical Repository) (www.itsmr.org/TSSR). As of May 1, 2019, a variety of citation and adjudication data are available on the TSSR for the years 2009-2017, with preliminary data for 2018 also being available.
With respect to the accessibility of the AA system, the system provides E-plea capability for customers, enabling them to plead guilty or not guilty on-line; it also allows motorists to use major credit cards to pay fines and administrative surcharges on-line. The system has an attorney scheduling ticket management system which enables attorneys to associate themselves with their clients’ tickets, giving them the ability to schedule and reschedule tickets on their behalf. The system also provides the attorneys with a calendar system to manage their cases. With regard to direct access to the raw data, although it is not available to users external to the DMV, DMV generates a variety of reports to provide outside users needed data. In addition, similar to the TSLED data, access to some of the AA data is now available through the TSSR (www.itsmr.org/TSSR). As such, the TRCC and its member agencies agree that it is important to maintain the TSSR with the most recent citation data possible and ensure that it remains responsive to user needs through the expansion of available data and reports.
Driver Information Systems
The core driver information system in New York is the Driver License File maintained by the DMV. It provides detailed information for all drivers who are licensed in New York State and limited information for unlicensed or out-of-state drivers who have been convicted of a moving traffic violation or been involved in a motor vehicle crash in the state. Timeliness: Although many updates to the file are still done in batch mode overnight, DMV has
converted many of the processes to a “real-time” basis. Efforts are being continued to convert additional processes to “real-time” but progress is affected by the fact that some data entry systems are very antiquated and have not been addressed due to intervening priorities. This issue will be addressed by the new project being funded under Section 405c in FFY 2020 that will support the modernization of many of the DMV’s records systems, including its driver information system.
Accuracy: The DMV has a strong identification/authentication process for clients who are issued a driver’s license, which helps ensure the accuracy of the data by eliminating multiple records that exist for some drivers. Accuracy could be further improved by reducing the delays that occur in being notified of drivers who have died, reflecting the difficulty of linking the license file with the DOH’s paper-based vital statistics (death) file. This issue will also be addressed by the new project being funded under Section 405c in FFY 2020 that will support the modernization of many of the DMV’s records systems, including its driver information system.
Integration: Data integration could be improved by promoting the use of common data elements to
allow better linkage to other DMV data as well as data maintained by external agencies (e.g., DOH death file). This is another issue that will be addressed by the new project being funded under Section 405c in FFY 2020 that will support the modernization of many of the DMV’s records systems, including its driver information system.
Accessibility: Electronic access to the Driver License File is limited to selected users, with access to the
2020 Highway Safety Strategic Plan Traffic Records...Page 89
data being provided in compliance with the federal DPPA.
Injury Surveillance Information Systems
The New York State Department of Health (DOH) is the repository agency for the state’s two core injury surveillance systems: 1) Pre-Hospital [Patient] Care Report (PCR) and 2) Crash Outcome Data Evaluation System (CODES). The Pre-Hospital [Patient] Care Report (PCR) captures data using a mix of standardized paper and electronic formats. Designed to capture data from pre-hospital care reports (PCRs) that are submitted by the state’s emergency medical technicians (EMTs), it contains data on patient demographics and care, provider demographics and response times, and the destination of where the person was transported. CODES is a database that is created by integrating data from individual records from the DMV’s AIS file to the DOH’s hospital and emergency department discharge databases. From 1995-2008, CODES also integrated data from the DOH’s Pre-Hospital [Patient] Care Report (PCR) database. Because of problems with incomplete PCR data, the data for the years 2009-2014 have not been linked. Beginning with the 2015 data, the DOH has once again begun to integrate data from the PCR database. The CODES database is used to conduct studies that examine injuries and their associated medical costs in selected types of crashes. Timeliness: About 10% of the PCRs still come into DOH in paper format, causing delays in getting data
into the existing DOH internal electronic repository. The most recent year for which a complete set of PCR data is available and has been linked is 2015; the data for 2016 and 2017 are being prepared for linkage in 2019. With regard to CODES, the latest year for which New York has linked crash, medical and financial outcome data is 2015.
Accuracy & Completeness: The accuracy and completeness of the PCR data need improvement. Since
the EMT’s first responsibility is to treat the patient, the form is often not filled out until later which results in many data fields being left blank. Another issue involves the fact that the regional data entry contractors only have to edit a subset of the data fields contained on the report form. With respect to the CODES file, a series of logic checks has been built into the system to improve the accuracy of the data.
Integration: The newly developed PCR system meets the national NEMSIS (National Emergency
Medical Services Information System) standard and HIPAA confidentiality rules. Currently, the PCR system can be linked with the DOH’s Trauma Registry and CODES. The ability to link recent PCR data and CODES greatly improves the injury surveillance data available for analysis purposes. It should be noted that even though CODES can link crash, pre-hospital care, emergency department, and hospitalization data sets using probability match techniques, it is unable to link 100 percent of the individuals involved in crashes, since DMV collects relatively limited data on vehicle passengers.
Accessibility: While CODES-linked data are available on the DOH website, direct access to PCR data will
continue to be limited until the online repository for PCR data is completed.
Vehicle Information Systems
The DMV is the repository agency for the state’s core vehicle data system, the Vehicle Registration File. The Vehicle Registration File contains a record of every registered vehicle in New York and a history of that registration. The registration file contains approximately 30 million records, of which approximately 12 million are active. The file is sorted by name, DOB and gender of registrant, plate number and class of registration; a complementary plate index file is used to access the registration file using the plate number. Accuracy: Although issues related to the quality and integrity of the data are addressed through the
use of procedures and programs that control the data input process, and through the use of address

2020 Highway Safety Strategic Plan Traffic Records...Page 90
verification software, the system lacks the ability to always distinguish between slight variations in a given person’s name, which can result in a motorist re-registering a vehicle for which the registration has been revoked.
Integration: DMV has the ability to link the registration file with the inspection and insurance files, but
cannot link it with the IRP system or with precision to records in the AIS file. It is expected that integration issues will be addressed by the new project being funded under Section 405c in FFY 2020 that will support the modernization of many of the DMV’s records systems, including its vehicle registration system.
Roadway Information Systems
The New York State Department of Transportation (NYSDOT) is the repository agency for the Roadway Inventory System (RIS), the state’s core roadway data system. The RIS is an Oracle-based database application which contains data on highway features and characteristics, including data on roadway type and physical characteristics, access, functional class, pavement condition, and traffic volumes. Accuracy: While much of the data on highway attributes are accurate and consistent over time, there
are errors in the data related to reference markers. Completeness: In addition to errors in the reference marker data, many of the reference markers are
missing. Uniformity: Uniformity in the data collected for state and local roads is lacking as localities collect only
those local road data that are useful to them, compared to a more comprehensive set of data collected for state roads.
Integration: The current process to link highway features and traffic data with the crash data in SIMS is
a cumbersome manual process. Accessibility: Although users cannot query the database directly, access is available through a data
warehouse using a tool known as Business Objects. To conduct analyses, data need to be exported to an Excel file or other flat file format. The ability to use a GIS component to graphically display roadway elements is limited to the 27,000 miles of state routes and Federal Aid eligible roads out of the total population of approximately 114,000 miles of public roads.
Strategies New York has identified a comprehensive set of strategies that collectively will enable the state to reach the performance targets for the Traffic Records program area. Described below, these strategies reflect the findings from the work undertaken by the state’s TRCC over the past several months to prepare the FFY 2020 Traffic Safety Information Systems Strategic Plan. Projects are listed under each strategy. Strategy TR-1: Implementation of Improvements to TSIS Systems Projects that are intended to improve the timeliness, accuracy, completeness, integration or accessibility of the state’s various traffic records systems will be funded under this strategy. The planned activities that will be considered for funding are described below.

2020 Highway Safety Strategic Plan Traffic Records...Page 91
AIS System Changes for Revised 104S Form TR-2020-001 AIS currently accepts only an outdated version of the 104S form. A MCSAP audit conducted in April 2011 contained five findings requiring changes to the MV-104S in order for DMV to capture additional data elements for Commercial Motor Vehicle crashes and for NYS to remain MCSAP compliant. DMV responded to the audit findings, agreeing to make the changes, and was given a date of 12/31/2014 to have the changes completed. Although DMV’s ITS cluster has made this project a #1 priority project, it has not had the resources to dedicate to completing it. The funds provided under Section 405c may be used to hire an IT consultant to assist the ITS by performing the work necessary in AIS to implement the use of the revised 104S form. This project will allow DMV to remain MCSAP compliant, avoiding a possible loss of approximately $19 million dollars in MCSAP funds. NYPD Electronic Accident Report Submission TR-2020-002 Prior to March 2016, the submission of MV-104ANs (Police Accident Reports) by the NYPD was a paper process, with the DMV receiving approximately 180,000 paper 104ANs each year. These paper reports required extensive handling by staff to open, sort, batch and scan all reportable accident reports, with the cases then being manually processed in both Conversion (AIS) and Location coding (ALIS). In March 2016, the NYPD began submitting the majority of their reports to DMV in PDF form via a nightly FTP process. This is a temporary solution until the DMV is ready to receive the reports electronically. Through its vision zero initiative, the NYPD has completed all of its front end changes, has implemented the electronic capture of crash data and is now waiting for the DMV to be ready to receive their reports electronically via SPIDER. This project is being used to procure consultants to assist in the development of the electronic submission process with the NYPD and make the necessary changes to AIS to accept and, when possible, auto process the data. This includes but is not limited to: PDF form changes, coding changes, workflow changes and batch job changes. When fully implemented, the CRC’s paper mail processing will be reduced by approximately 180,000 reports, which is 40% of its average annual mail count. It will improve the timeliness of receiving the reports; allow for a large volume of reports to be processed automatically; improve data quality by applying the appropriate edits during the front end development; increase the volume of MV-104S forms for Commercial Motor Vehicle crashes submitted by the NYPD; and will improve the timeliness of updating driver license records, allowing for appropriate actions to be taken against unsafe drivers. Fatality Analysis Reporting System (FARS) Supplemental Funding TR-2020-003 The NYS DMV has traditionally provided data to the NHTSA FARS system through five-year contracts with NHTSA. In 2017, the DMV began another five-year (2017-2021) agreement with NHTSA to process fatal crashes into FARS within 30 days of the motor vehicle crash. At that time DMV had three full-time employees (FTEs) assigned to perform this work. In winter 2017, DMV determined that the contract would not provide sufficient Federal funding to support its FARS processing. The shortfall was estimated to be $165,000 for the length of the agreement. Without Section 405c funding, the shortfall in funds would force DMV to reduce the amount of staff assigned to the program and thus impact the timely processing of fatal crash data into FARS. The funds attained through this grant will be used to supplement the NHTSA funding to maintain three FTEs on FARS processing to insure continued timely processing of fatal crash data into FARS. This will allow DMV to continue its excellent record of entering the required data into the FARS system in a timely, accurate, complete and consistent manner. ALIS Upgrade and Integration TR-2020-004 The Accident Location Information System (ALIS) is comprised of three applications. One application, Location Coding Data Entry (LCDE), is used exclusively by the Department of Motor Vehicles to geographically locate
2020 Highway Safety Strategic Plan Traffic Records...Page 92
highway crashes. Another application lets users do more complex queries/analysis involving both geographic features in combination with multiple crash characteristics at the event, vehicle and contributing factor levels. The third application is the Location Editing application which allows select users the ability to correct or improve the accuracy of the location of a crash based on additional information that can sometimes be found in the officer’s notes section. By using this application, NYS DOT can significantly improve the precision/accuracy of where legacy crashes are located. The current system was built with ArcGIS server software that has become outdated and has been superseded by several newer versions of the software. Many of the core GIS functions within the ALIS modules are no longer supported by newer versions of the ArcGIS server software. In addition, the technology behind the User Interface, Microsoft Silverlight, will soon be unsupported and has already been deprecated in some of the popular web browsers such as Chrome. Integration with new Enterprise applications at DOT such as RIS (Roadway Information System) and Roads and Highways (Linear Referencing System) will also require more modern software versions to take full advantage of new functionality and improve performance. This project will upgrade the ArcGIS server software with the latest version of the software. Custom components of the software will be rewritten to use new features in the software that will help speed up the process of location coding and querying crash data. Additional functionality will be built into the application to better utilize the new Milepoint Linear Referencing data that will be captured for each crash. This project will allow users to continue accessing the ALIS application with modern, safe web browsers while improving the data and workflows within the system. The core GIS functions will be converted to allow the application to remain supported and in sync with other GIS applications within the Department. Under this project, new technologies will be used to provide more safety-related data such as average accident rates and statewide analysis results directly to the users. This will result in a more efficient, data driven Safety System which will help in identifying better projects that save more lives and prevents more injuries to the traveling public. TraCS Electronic Crash and Ticketing System TR-2020-005 The TraCS platform facilitates the capture and transmission of electronic data related to a wide range of public safety activities conducted by enforcement and court-related agencies. Designed as a statewide electronic ticket and crash data collection and transfer system, TraCS includes electronic ticket and accident forms, DWI forms, arrest and incident forms, commercial motor vehicle inspection forms, and the use of GPS devices and GIS maps. TraCS includes a universal electronic ticket and accident reporting forms for use throughout the state by all police agencies. TraCS has been designed for use by all of the state’s police agencies and courts, as well as by state agencies such as the NYSP, DMV and NYSDOT. TraCS allows police agencies to send their ticket and crash data electronically to a central repository, which is maintained by the NYS Office of Information Technology Services (ITS). In turn, data are sent electronically from the repository to DMV, NYSDOT and OCA. Because police agencies across the state using TraCS have identified a need for maintenance and support to facilitate their continued use of TraCS, the primary purpose of this project is to provide local TraCS agencies with the ability to continue to use TraCS to submit crash reports and tickets electronically in an efficient manner. Under this project, the specific needs of local agencies for technical support are identified and services are provided to meet those needs. Explore Options for E-Transmittal of Crash Data from NYPD to AIS TR-2020-006 Approximately one-quarter of the motor vehicle crashes in New York State occur each year in New York City. In 2017, according to the AIS, 82,286 of the 309,371 police-reported crashes statewide occurred in New York City. Data on these crashes are captured by the NYPD on a uniform police accident report form (MV-104AN). Prior to mid-2016, the data were entered into a database maintained by the NYPD and the paper forms were then sent to the DMV for entry into the AIS. In mid-2016, the NYPD began submitting the majority of their

2020 Highway Safety Strategic Plan Traffic Records...Page 93
reports to DMV in PDF form via a nightly FTP process. This is a temporary solution to provide DMV time to complete its project to make the necessary changes to receive the reports electronically. In recent years, the NYPD has been developing a system for capturing and transmitting crash data electronically. To meet the needs of the system, the NYPD has 1) equipped 1,200 patrol cars with the necessary hardware and software to capture crash and ticket data electronically, 2) developed an electronic data collection form for crashes and 3) developed the capability to transmit the crash data to the DMV. Although the NYPD is ready to transmit its crash data electronically to the DMV, the DMV is not ready to receive their reports electronically. Since ITS does not have the resources at this time to make the necessary changes, it appears that the electronic submission by the NYPD will likely not be accomplished until the DMV has an approved RFP in place to develop a new AIS; the new AIS is not expected to be available for 3-5 years. The purpose of this project is to explore intermediate options for supporting the NYPD’s electronic transmission of crash data into the AIS database before the new AIS is implemented. Identifying such options will involve working with the NYPD, DMV and ITS to determine the technical capabilities needed at both the front and back ends of the process and assisting with troubleshooting and resolving any problems that arise. The initial step under this project will focus on determining the specific tasks that need to be conducted to identify a viable option, and if one is identified, the second step will involve designing and implementing a strategy to accomplish that option. This project will be conducted in cooperation with the GTSC since the GTSC is responsible for managing the DMV’s Crash Records Center. This project will increase the total volume of reports that are received electronically, further improving the timeliness, accuracy and completeness of the state’s crash data and accessibility to these data. It should also improve the timeliness of updating driver license records, allowing for appropriate actions to be taken against unsafe drivers. DMV Data and Record System Modernization TR-2020-007 The NYS DMV (DMV) issues driver licenses and non-driver IDs; conducts road tests; monitors driver training; and promotes enforcement activities, including ticket and crash reporting. The DMV also issues registration and vehicle ownership documents along with verifying and enforcing NYS insurance requirements. Servicing more than 11 million customers yearly, the DMV houses all the client data captured while providing these services. The data include demographic statistics, law violating and crash-related convictions, ticketing statistics, insurance, and compliance information. These data reside in antiquated file formats located in siloed systems whose connectivity and reliability are consistently failing, requiring extensive repairs to outdated technology and coding languages established over 50 years ago. Because of the importance of the data elements that reside in these systems, the instability of these systems is detrimental to the traffic safety efforts of all NYS traffic safety partners. The DMV is partnering with the New York State Office of Information Technology Services (ITS) in soliciting a vendor to provide a Commercial-Off-the-Shelf (COTS) product to replace the legacy systems. DMV is also working with ITS to identify a Data Quality and System Integration Vendor to ingest DMV’s current data, remedy the irregularities and degradation of data quality and provide compatible and functionally accurate data elements that will become the core of the new modernized system. This will enable the DMV to provide a singular modernized system including a centralized singular repository of driver, vehicle, insurance and ticket data that will be accessible to its traffic safety partners. This project will support the DMV modernization team’s efforts to conduct analyses of the existing systems, identify requirements and deliverables, and begin planning the “To-Be” design for the new singular system. The modernization of DMV’s systems will improve the timeliness, accuracy and accessibility of these various data and enable traffic safety partners to contribute to and access key traffic-safety related data from a centralized system.

2020 Highway Safety Strategic Plan Traffic Records...Page 94
Strategy TR-2: Development and Use of Data Linkages The state’s traffic safety community’s ability to identify problems and develop effective countermeasures is enhanced by the comprehensive information that is often only available through the linkage of data and data files. Continued improvements in data linkages will enhance the development of program initiatives that focus on specific population sub-groups and permit the examination of costs associated with crashes. Incorporating EMS Data into CODES TR-2020-008 The CODES database is created by matching individual records from the NYS DMV AIS to the Department of Health (DOH) Statewide Planning and Research Cooperative System (SPARCS) database of inpatient hospitalizations and emergency department (ED) visits and the NYS Trauma Registry (TR). From 1995 to 2008, Pre-hospital Care Reports (PCR) submitted by NYS certified Emergency Medical Service (EMS) agencies, were included in the linkage. Complete PCR data is not available from 2008 through 2014 due to contract issues for data entry and moving to a statewide electronic PCR system. The linked database creates a more complete picture that describes what occurs before, during and after a crash; the linkage is critical to accurately evaluating the effectiveness of highway safety initiatives. Administered by the NYS Department of Health’s Bureau of Occupational Health and Injury Prevention (BOHIP) since 1998, the CODES database is used to conduct research that examines the contributing factors to motor vehicle injuries, their associated outcomes and medical costs in selected types of crashes, and demographics of those involved. The CODES contains race and ethnicity identifiers, health outcome and health cost data, allowing staff to examine health disparities, types of injuries, and cost of injuries in crashes that could not otherwise be done with police crash records alone. In addition to the ongoing epidemiological research in the DOH, the CODES is used to respond to data requests from other governmental agencies at the federal, state, and local levels, and from the traffic safety and research communities. Police crash reports, ED discharge data, hospitalization discharge data, and TR data are brought together in the CODES linkage. The PCR is a legal medical record used to document patient care provided by an Emergency Medical Technician (EMT). The new PCR system is designed to capture data that are completed by certified PCR providers and submitted through one of 18 regional contractors to the state. Variables of interest to motor vehicle crash data collected in the new PCR data include: seat belt use, extrication required, work-related, patient occupation, patient industry, patient employer, injury severity at scene, place of incident, scene GPS location, cause of injury, intent, mechanism, vehicular injury indicators (risk factor predictors associated with the vehicle involved in the incident), seating position, use of occupant safety equipment, alcohol/drug use indicators, narrative, and National Highway Transportation Safety Administration (NHTSA) Injury Matrix across body regions. The new PCR system is built to meet the National Emergency Medical Services Information System (NEMSIS) standard. As the new NYS PCR system is built upon the NEMSIS standard, it meets or exceeds all recommended data elements to be collected, as well as HIPAA confidentially rules. This project will link PCR data with AIS, ED discharge data, hospitalization discharge data, and TR data, providing more information on the true impact of motor vehicle-related injuries in NYS, and allows EMS data to continue to be part of the larger NYS traffic data system. EMS being NEMSIS compliant allows NYS PCR data to be directly comparable to data from other states that are also NEMSIS compliant. This project will continue to improve data integration in crash and injury data surveillance systems, as well as completeness, accuracy, and accessibility.

2020 Highway Safety Strategic Plan Traffic Records...Page 95
UCMS Automated Drug Conviction Reporting to DMV TR-2020-009 The Unified Court System’s Universal Case Management System (UCMS) is the criminal case management system currently in use in all of the City/District-level courts statewide; implementation in the Supreme/County-level courts began in October 2018. The system has a secure data interface with the Department of Motor Vehicles (DMV) to report traffic-related dispositions, including license suspensions, scofflaws and all other traffic ticket-related outcomes. Thousands of these transmissions are sent daily and this automated interface has improved data accuracy and timeliness in the DMV TSLED program related to driver records. This project was originally designed to expand the UCMS system to electronically transmit drug conviction cases that have a companion license suspension to the DMV, eliminating the need for the court to manually produce and submit MV-510D forms to the DMV. A legislative change passed in April 2019 that will reduce the volume of this specific type of drug conviction reporting has resulted in some modifications to the project. The modifications will now enable the Unified Court System (UCS) to pull traffic ticket data directly from DMV systems, providing UCS with the up-to-date status of the tickets, enabling court staff to review this data and correct transmission errors in a more timely manner. This will result in both a) improved decision-making by the judiciary due to easier access to the motorist record, and, b) a greater number of traffic tickets being accurately represented on the DMV motorist systems due to more timely and complete information being provided to the courts. UCMS Real-time Disposition Reporting to DMV TR-2020-010 The Unified Court System’s Universal Case Management System (UCMS) is the criminal case management system currently in use in all of the City/District-level courts statewide; implementation in the Supreme/County-level courts began in October 2018. The system has a secure data interface with the Department of Motor Vehicles (DMV) to report traffic-related dispositions including license suspensions, scofflaws, and all other traffic ticket-related outcomes. While the current automated interface has improved data accuracy and timeliness over manual reporting, it has several limitations which cause many of the traffic ticket dispositions to be delayed in posting to the driver records, or even rejected from passing the electronic interface edits due to overly restrictive processing rules. Disposition scenarios such as vacating a disposition/bail forfeiture/pre-trial suspension, terminating a scofflaw suspension with fines due, and many error correction transactions are not supported through the current automated interface, requiring both court staff and DMV to process these transactions manually. The existing interface does not provide the courts with the most current status of a traffic ticket, or of the motorist record, requiring court staff to research this information and present it to the judge prior to each court appearance. Additionally, due to the highly restrictive processing rules, an unnecessarily high percentage of automated transactions are rejected by DMV, requiring research by the court staff to determine the cause of the error, and time to reprocess the ticket to potentially clear the error. These manual processes result in delays in updating the DMV records.
This project will allow for expansion of the UCMS system to electronically transmit traffic tickets to DMV in real-time using the new web service interfaces which DMV has developed, and inquire on the current status of tickets and the motorist record without leaving the UCMS system, eliminating the need for the court staff to manually login into DMV systems and search for relevant information. By using these new interfaces, UCMS dispositions will be immediately transmitted to DMV and the courts will receive immediate feedback as to whether a transaction was successfully received, allowing the courts to make any necessary corrections to the UCMS at the time the court case is being processed by the staff. Successful completion of the project will result in more timely, accurate and complete representation of traffic ticket disposition data and driver record information statewide.
2020 Highway Safety Strategic Plan Traffic Records...Page 96
IDS Integration of the UCMS IID and Treatment Data TR-2020-011 The Office of Alcoholism and Substance Abuse Services (OASAS) Impaired Driver System (IDS) automates impaired driver reporting to relicense motorists and monitor compliance with treatment recommendations. OASAS Approved Substance Use Disorder (SUD) screening, assessment, and treatment providers and the DMV’s Impaired Driving Program providers electronically report information about the services that impaired drivers complete as part of their sentences. The system does not currently receive information from the courts related to what sentence(s) judges impose on impaired drivers. This project will allow OASAS to retrieve information about the IID and treatment sentences for impaired drivers by accessing data generated by the Unified Court System’s Universal Case Management System (UCMS). Further, this project will electronically integrate the UCMS data into the IDS system so that there is a full reporting of the events that occur in an impaired driving event from conviction to adjudication. Impaired drivers, with or without a license, who do not complete the sentence(s) imposed by a Judge in a timely manner, pose a serious public safety threat. Electronically integrating the judge’s sentence(s) into the IDS system would minimize these risks. Data Analysis & Integration of UCMS Ignition Interlock (IID) & Treatment Sentence Data TR-2020-012 The OASAS Impaired Driver System (IDS) automates impaired driver reporting to relicense motorists and monitor compliance with treatment recommendations(s). OASAS Approved Substance Use Disorder (SUD) screening, assessment, and treatment providers and DMV’s Impaired Driving Program providers electronically report information about the services that impaired drivers complete as part of their sentence(s) or requirements to maintain a conditional license or obtain a license after it has been suspended or revoked. The IDS allows OASAS, DMV, and Probation to monitor provider and motorist progress through the system to ensure compliance, as applicable. The IDS data is also accessible in OASAS’ Data Warehouse application which is programmed with standardized reports that OASAS staff use to monitor the data and track impaired driving trends, patterns and outcomes. Impaired drivers’ ticketing information and related sentences are available in the Unified Court System’s Universal Case Management System (UCMS). These data are not electronically integrated into the Impaired Driver System and its associated Data Warehouse application. This project will allow the OASAS business analyst (BA) to continue to work with an OASAS application architect and the Office of Court Administration (OCA) IT staff person on integrating the OCA data into the IDS database and plan for the electronic submission of data between OASAS and OCA. They will also develop a plan for the feedback loop from OASAS to UCMS to update the treatment status of impaired drivers in UCMS. The successful completion of this project will result in an integrated database that includes data from both the courts and the impaired driver systems. Strategy TR-3: Use of Technology to Disseminate Data and Information GTSC’s website continues to be a major medium for disseminating information on new developments in traffic safety, research programs and other topics. The website and other technologies, such as podcasts, are important in the communication of data, training and educational messages, and public information relating to highway safety programs that will benefit all of GTSC’s customers and partners, as well as the general public. Maintenance of the Traffic Safety Statistical Repository TR-2020-013 The Traffic Safety Statistical Repository (TSSR) gives the public and the research community direct on-line access to New York State’s crash and ticket data. Crash information is extracted from the NYS DMV Accident Information System (AIS) on a monthly basis. Currently, the TSSR provides access to the finalized crash data for the years 2009-2017 and the preliminary crash data for 2018 and the 2019-to-date crash data. Continuing to be updated on a monthly basis, the 2018 crash data are expected to be finalized in July 2019. The data are presented in both tabular and graphical formats. Ticket data are extracted from the NYS DMV Traffic Safety

2020 Highway Safety Strategic Plan Traffic Records...Page 97
Law Enforcement and Disposition (TSLED) and Administrative Adjudication (AA) ticket systems, and the NYPD ticket system. Currently, the TSSR provides access to the finalized ticket data for the years 2009-2017 and preliminary data for 2018. The ticket data are updated twice a year.
The project will continue to provide to New York’s highway safety community several important improvements regarding access to accurate and timely traffic records data. These include maintenance of the current system, updates of preliminary crash data and ticket data, software upgrades, enhancements and training. This project will enable ITSMR to maintain, update and enhance the TSSR system as follows:
• Develop, maintain & refresh SAS File Storage (AIS, TSLED, AA, NYPD ticket data and demographic data) • Maintain TSSR system at the UAlbany Data Center; apply SAS software patches and upgrades including
security updates as needed • Develop and maintain SAS Data Analytics – new and enhanced reports; tables and charts • Provide TSSR user training • Provide TSSR staff training • In response to ad hoc requests, implement enhancements to the TSSR • Track user activity on the TSSR web page and related web pages
Strategy TR-4: Statewide Coordination of Traffic Records Systems Improvements GTSC will continue to coordinate efforts with other agencies and sources of funding to complete projects that improve traffic records systems, files and programs. Implementation of the FFY 2020 Traffic Safety Information Systems Strategic Plan will begin upon approval of New York’s application for FFY 2020 Section 405c funds. Traffic Records Program Coordination TR-2020-014 Funding will be provided for the coordination and administration of traffic records-related activities in New York State. At GTSC’s request, a member of the Institute for Traffic Safety Management and Research staff serves as the Traffic Safety Information Systems (TSIS) Coordinator. Her responsibilities include scheduling, setting the agenda and facilitating meetings of the Traffic Records Coordinating Council (TRCC); preparing the annual Traffic Safety Information Systems Strategic Plan; identifying and assessing progress in meeting the state’s performance measures; serving as the liaison with NHTSA for the Traffic Records Assessments required every five years and annual follow-up on recommendations from the assessment, as well as assisting GTSC in meeting any other requirements for the receipt of Section 405c funding. Strategy TR-5: Research and Evaluation Research, Evaluation and Analytical Support for Traffic Safety in NYS TR-2020-015 Research and evaluation are essential components of the highway safety planning process, and a variety of research and evaluation initiatives will be supported at both the state and local levels. Competing interests and finite resources make it imperative that there be a consistent, systematic process of problem identification and prioritization. Research will support the development, implementation and evaluation of new initiatives in conjunction with the state's 402 grant program. Projects that support the collection and analyses of data related to various areas of traffic safety will also be supported. Such projects would involve extracting, compiling and analyzing data from the state’s large database systems, including the DMV’s crash, citation/adjudication and driver license databases and the NYSDOT’s SIMS and SAFETYNET databases. In addition, projects that provide data analytic services needed by the DMV and GTSC and their highway safety partners will be supported. Projects that provide analytical

2020 Highway Safety Strategic Plan Traffic Records...Page 98
support to traffic safety agencies and organizations at all jurisdictional levels, including support for the collection, analysis and reporting of data, will be eligible for funding.

2020 Highway Safety Strategic Plan Community Traffic Safety Programs…Page 99
COMMUNITY TRAFFIC SAFETY PROGRAMS Overview Community Traffic Safety Programs are designed to be comprehensive in nature, with opportunities for outreach to a broad spectrum of groups within local areas. Agencies and organizations at the local level are the most knowledgeable about the traffic safety problems in their jurisdictions and are in the best position to develop programs to address those issues. Some of the highway safety issues that counties and other local jurisdictions are encouraged to integrate into their local programs stem from state-level initiatives including outreach programs for younger drivers, older drivers and the many diverse populations residing in the state. The Governor’s Traffic Safety Committee (GTSC) plays the central role in the coordination of local traffic safety programs with state priorities so that collectively Community Traffic Safety Programs that are funded contribute to the achievement of the statewide and program area performance targets set in the HSSP. The funds and other resources GTSC invests in Community Traffic Safety Programs are complemented by a number of other federal, state, local and private sector activities. While a real dollar amount cannot be accurately estimated for the contributions of each of the partners involved in these programs, the most significant sources of funding, programming and in-kind support that assist in achieving the performance goals established in the HSSP include: County Traffic Safety Boards; NYS Department of Motor Vehicles (NYSDMV); NYS Department of Health (NYSDOH); NYS Education Department (NYSED); NYS Department of Transportation (NYSDOT); New York State Police; NYS Association of Chiefs of Police; Safe Kids Coalitions; American Automobile Association (AAA); National Safety Council; Ford Foundation; NY Association of Pupil Transportation; Operation Lifesaver, Inc. and U.S. Department of Veterans Affairs.

2020 Highway Safety Strategic Plan Community Traffic Safety Programs…Page 100
Performance Report Number of drivers age 20 or younger involved in fatal crashes The core outcome measure for tracking progress in the Community Traffic Safety Program is the number of drivers under age 21 involved in fatal crashes. FARS data show that the five-year average for this measure decreased 26% from 144 in 2009-2013 to 106 in 2013-2017. Because of this decline, the target of 109.8 set for 2015-2019 has been met and exceeded. Problem Identification Additional data analyses were conducted to assist GTSC in setting priorities for the Community Traffic Safety Programs area and selecting data-driven countermeasure strategies and activities that will enable the state to achieve its performance goals. The key findings from the problem identification component are presented in this section. Analyses by Region
In 2017, 40% of fatal and personal injury crashes occurred in the Upstate region, and 41% occurred in New York City. The remaining 19% happened on Long Island. Compared to the proportion of licensed drivers in each of the regions, New York City is overrepresented in fatal and personal injury crashes while the Upstate region is underrepresented. Analyses by County
As demonstrated in the analyses presented in other program areas, the priority assigned to different traffic safety issues can vary among the regions. For example, the data show that a greater emphasis on pedestrian safety countermeasures is needed in the downstate areas than upstate. Traffic safety priorities can also differ among individual counties. Local communities applying for grant funding in this program area must provide data documenting the traffic safety issues they plan to address. A number of sources, including county crash summary reports that can be accessed through the Traffic Safety Statistical Repository (TSSR) developed by the Institute for Traffic Safety Management and Research, are available to assist local communities in identifying and documenting their traffic safety problems.
50%
32%
18%
40% 41%
19%
Upstate NYC Long Island0%
20%
40%
60%
LICENSED DRIVERS AND FATAL & PERSONAL INJURY CRASHES BY REGION:
2017
Licensed Drivers F&PI CrashesSources: NYS AIS / TSSR and Driver License File
13197 101 104* 99
144128 119 115 106
0
50
100
150
200
2013 2014 2015 2016 2017
DRIVERS UNDER AGE 21 INVOLVED IN FATAL CRASHES
Drivers 5 Yr Moving Avg* Revised based on final 2016 FARS dataSource: FARS
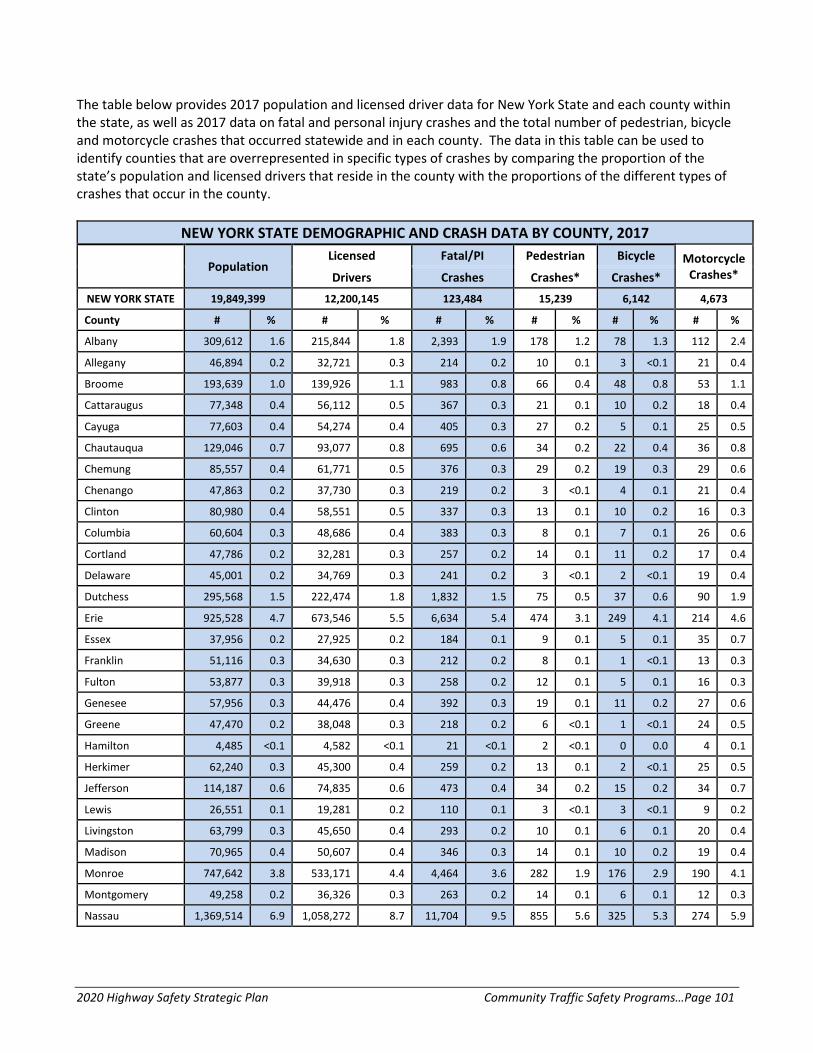
2020 Highway Safety Strategic Plan Community Traffic Safety Programs…Page 101
The table below provides 2017 population and licensed driver data for New York State and each county within the state, as well as 2017 data on fatal and personal injury crashes and the total number of pedestrian, bicycle and motorcycle crashes that occurred statewide and in each county. The data in this table can be used to identify counties that are overrepresented in specific types of crashes by comparing the proportion of the state’s population and licensed drivers that reside in the county with the proportions of the different types of crashes that occur in the county.
NEW YORK STATE DEMOGRAPHIC AND CRASH DATA BY COUNTY, 2017
Population Licensed Fatal/PI Pedestrian Bicycle Motorcycle
Crashes* Drivers Crashes Crashes* Crashes* NEW YORK STATE 19,849,399 12,200,145 123,484 15,239 6,142 4,673
County # % # % # % # % # % # %
Albany 309,612 1.6 215,844 1.8 2,393 1.9 178 1.2 78 1.3 112 2.4
Allegany 46,894 0.2 32,721 0.3 214 0.2 10 0.1 3 <0.1 21 0.4
Broome 193,639 1.0 139,926 1.1 983 0.8 66 0.4 48 0.8 53 1.1
Cattaraugus 77,348 0.4 56,112 0.5 367 0.3 21 0.1 10 0.2 18 0.4
Cayuga 77,603 0.4 54,274 0.4 405 0.3 27 0.2 5 0.1 25 0.5
Chautauqua 129,046 0.7 93,077 0.8 695 0.6 34 0.2 22 0.4 36 0.8
Chemung 85,557 0.4 61,771 0.5 376 0.3 29 0.2 19 0.3 29 0.6
Chenango 47,863 0.2 37,730 0.3 219 0.2 3 <0.1 4 0.1 21 0.4
Clinton 80,980 0.4 58,551 0.5 337 0.3 13 0.1 10 0.2 16 0.3
Columbia 60,604 0.3 48,686 0.4 383 0.3 8 0.1 7 0.1 26 0.6
Cortland 47,786 0.2 32,281 0.3 257 0.2 14 0.1 11 0.2 17 0.4
Delaware 45,001 0.2 34,769 0.3 241 0.2 3 <0.1 2 <0.1 19 0.4
Dutchess 295,568 1.5 222,474 1.8 1,832 1.5 75 0.5 37 0.6 90 1.9
Erie 925,528 4.7 673,546 5.5 6,634 5.4 474 3.1 249 4.1 214 4.6
Essex 37,956 0.2 27,925 0.2 184 0.1 9 0.1 5 0.1 35 0.7
Franklin 51,116 0.3 34,630 0.3 212 0.2 8 0.1 1 <0.1 13 0.3
Fulton 53,877 0.3 39,918 0.3 258 0.2 12 0.1 5 0.1 16 0.3
Genesee 57,956 0.3 44,476 0.4 392 0.3 19 0.1 11 0.2 27 0.6
Greene 47,470 0.2 38,048 0.3 218 0.2 6 <0.1 1 <0.1 24 0.5
Hamilton 4,485 <0.1 4,582 <0.1 21 <0.1 2 <0.1 0 0.0 4 0.1
Herkimer 62,240 0.3 45,300 0.4 259 0.2 13 0.1 2 <0.1 25 0.5
Jefferson 114,187 0.6 74,835 0.6 473 0.4 34 0.2 15 0.2 34 0.7
Lewis 26,551 0.1 19,281 0.2 110 0.1 3 <0.1 3 <0.1 9 0.2
Livingston 63,799 0.3 45,650 0.4 293 0.2 10 0.1 6 0.1 20 0.4
Madison 70,965 0.4 50,607 0.4 346 0.3 14 0.1 10 0.2 19 0.4
Monroe 747,642 3.8 533,171 4.4 4,464 3.6 282 1.9 176 2.9 190 4.1
Montgomery 49,258 0.2 36,326 0.3 263 0.2 14 0.1 6 0.1 12 0.3
Nassau 1,369,514 6.9 1,058,272 8.7 11,704 9.5 855 5.6 325 5.3 274 5.9

2020 Highway Safety Strategic Plan Community Traffic Safety Programs…Page 102
NEW YORK STATE DEMOGRAPHIC AND CRASH DATA BY COUNTY, 2017
Population Licensed Fatal/PI Pedestrian Bicycle Motorcycle
Crashes* Drivers Crashes Crashes* Crashes* County # % # % # % # % # % # %
Niagara 211,328 1.1 161,474 1.3 1,160 0.9 71 0.5 48 0.8 63 1.3
Oneida 231,332 1.2 162,410 1.3 1,191 1.0 73 0.5 40 0.7 69 1.5
Onondaga 465,398 2.3 333,563 2.7 3,034 2.5 213 1.4 108 1.8 135 2.9
Ontario 109,899 0.6 85,364 0.7 556 0.5 16 0.1 13 0.2 36 0.8
Orange 382,226 1.9 268,816 2.2 2,634 2.1 106 0.7 41 0.7 156 3.3
Orleans 40,983 0.2 29,394 0.2 149 0.1 2 <0.1 2 <0.1 12 0.3
Oswego 118,478 0.6 86,090 0.7 532 0.4 36 0.2 11 0.2 43 0.9
Otsego 60,094 0.3 43,560 0.4 244 0.2 8 0.1 4 0.1 18 0.4
Putnam 99,323 0.5 81,669 0.7 624 0.5 21 0.1 4 0.1 30 0.6
Rensselaer 159,722 0.8 117,285 1.0 815 0.7 70 0.5 13 0.2 50 1.1
Rockland 328,868 1.7 221,569 1.8 2,251 1.8 144 0.9 47 0.8 75 1.6
St. Lawrence 109,623 0.6 73,985 0.6 445 0.4 37 0.2 8 0.1 45 1.0
Saratoga 229,869 1.2 185,771 1.5 1,153 0.9 43 0.3 24 0.4 85 1.8
Schenectady 155,565 0.8 116,168 1.0 869 0.7 72 0.5 38 0.6 49 1.0
Schoharie 31,420 0.2 22,801 0.2 144 0.1 2 <0.1 0 <0.1 9 0.2
Schuyler 18,000 0.1 14,598 0.1 116 0.1 1 <0.1 2 <0.1 13 0.3
Seneca 34,498 0.2 24,174 0.2 192 0.2 1 <0.1 4 0.1 16 0.3
Steuben 96,281 0.5 72,890 0.6 455 0.4 16 0.1 8 0.1 39 0.8
Suffolk 1,492,953 7.5 1,159,405 9.5 11,922 9.7 556 3.6 332 5.4 355 7.6
Sullivan 75,485 0.4 55,802 0.5 457 0.4 12 0.1 5 0.1 34 0.7
Tioga 48,578 0.2 39,060 0.3 191 0.2 3 <0.1 1 <0.1 13 0.3
Tompkins 104,802 0.5 64,949 0.5 425 0.3 17 0.1 18 0.3 29 0.6
Ulster 179,417 0.9 139,075 1.1 1,182 1.0 61 0.4 34 0.6 83 1.8
Warren 64,532 0.3 53,986 0.4 397 0.3 16 0.1 10 0.2 49 1.0
Washington 61,620 0.3 45,440 0.4 279 0.2 8 0.1 1 <0.1 24 0.5
Wayne 90,670 0.5 70,808 0.6 389 0.3 13 0.1 10 0.2 24 0.5
Westchester 980,244 4.9 693,723 5.7 5,775 4.7 537 3.5 105 1.7 202 4.3
Wyoming 40,493 0.2 29,849 0.2 193 0.2 4 <0.1 1 <0.1 14 0.3
Yates 24,955 0.1 16,715 0.1 91 0.1 4 <0.1 4 0.1 11 0.2
N Y C Bronx 1,471,160 7.4 494,782 4.1 9,204 7.5 1,893 12.4 440 7.2 226 4.8
Kings 2,648,771 13.3 1,060,686 8.7 15,593 12.6 3,554 23.3 1,551 25.3 488 10.4
New York 1,664,727 8.4 796,738 6.5 8,314 6.7 2,389 15.7 1,230 20.0 289 6.2
Queens 2,358,582 11.9 1,198,118 9.8 15,342 12.4 2,604 17.1 831 13.5 421 9.0
Richmond 479,458 2.4 319,363 2.6 2,604 2.1 400 2.6 83 1.4 68 1.5
Sources: U.S. Census Bureau, NYS Driver License File and NYS AIS/TSSR
*Includes Fatal, Personal Injury and Property Damage crashes

2020 Highway Safety Strategic Plan Community Traffic Safety Programs…Page 103
Analyses by Age Analyses of the demographic characteristics of the drivers involved in crashes are important in determining which age groups are most at risk. As the chart shows, drivers in the younger age groups are overrepresented in fatal and personal injury (F&PI) crashes in New York State. Young Drivers Young drivers, in particular, are at risk of being involved in a crash. Over the three-year period 2015-2017, drivers under 21 years of age were involved in 8% of the fatal and personal injury crashes but accounted for 4% of the licensed drivers. In addition, drivers ages 21-29 were involved in 22% of the F&PI crashes but accounted for only 14% of the licensed drivers. Older Drivers Drivers age 60 and over are the most underrepresented group of drivers in fatal and personal injury crashes; older drivers account for 29% of the licensed drivers but are involved in only 16% of the F&PI crashes. However, analyses show that older drivers who are involved in crashes are more likely to be killed or to suffer more severe injuries than younger drivers. Contributing Factors: Drivers Under 21 Compared to All Drivers When compared with all drivers, drivers under 21 years of age in fatal and personal injury crashes are more likely to have Following Too Closely, Failure to Yield the Right-of-Way, Unsafe Speed and Driver Inexperience reported as contributing factors in their crashes.
1%3%
14%17% 17%
19%
29%
2%6%
22%20%
17% 17% 16%
0%
10%
20%
30%
16-17 18-20 21-29 30-39 40-49 50-59 60+
DRIVERS INVOLVED IN FATAL AND PERSONAL INJURY CRASHES BY AGE: 2015-2017
Licensed Drivers Drivers in F&PI CrashesSource: NYS AIS/TSSR and Driver License File
21%23% 23%
16%
8% 8%
24%20% 19%
11%9%
3%
0%
10%
20%
30%
SELECT CONTRIBUTING FACTORS ASSOCIATED WITH DRIVERS IN FATAL AND PERSONAL INJURY CRASHES: 2015-2017
Drivers 16-20
All Drivers
Source: NYS AIS/TSSR

2020 Highway Safety Strategic Plan Community Traffic Safety Programs…Page 104
Minority and Other Underserved Populations The U.S. Census Department projects that the nation’s population will continue to become more racially and ethnically diverse over the next several decades. By 2042, the multicultural groups that comprised one third of the population in 2008 will become the majority and by 2050 will account for 56% of the population in the United States (Source: An Older and More Diverse Nation by Mid-Century, U.S. Census Department Press Release, August 14, 2008). A comparison of the 2000 and 2010 census data for New York State shows an increase in the state’s minority populations indicating that New York’s population will also continue to become more diverse. Between 2000 and 2010, the Hispanic population in New York State increased from 15% to 18% and the Asian population increased from 6% to 8% while the white population declined from 62% to 57% and the African American population declined from 16% to 14%. The state’s American Indian/Alaska Native population remained constant at less than one percent (0.4%) of the state’s population in 2000 and 2010. The number of state residents in the Census category of Other Races has also grown from 7% of New York’s population in 2000 to 8% in 2010.
As the nation’s population and the population of New York State become more diverse it is important to evaluate the role of race/ethnicity in highway deaths and injuries. The Governor’s Highway Safety Association (GHSA) 2009 publication, Closing the Circle: A Multicultural Primer for State Highway Safety Offices, presents the results of research showing the overrepresentation of certain ethnic groups in motor vehicle crashes. These analyses document the disproportionate number of Native Americans and Hispanics who are killed in motor vehicle crashes, lower seat belt use rates among African Americans, and higher proportions of alcohol-impaired fatally injured drivers among Native Americans. Analyses of FARS data presented in various reports published by NHTSA support the findings presented in the GHSA publication.
Since information on race and ethnicity is not captured on New York’s police crash reports, analyses cannot be conducted on the crash involvement of different racial and ethnic groups. At GTSC’s request, the New York State Department of Health Bureau of Occupational Health and Injury Prevention analyzed race and ethnicity information for persons injured or killed in traffic crashes by examining data sources including vital statistics and multiple causes of death files; hospitalization, outpatient and emergency department discharge records; and the Crash Outcome Data Evaluation System (CODES) which includes crash, hospitalization and emergency department data. GTSC regionalized the data to identify problems and common trends and will continue to work with local traffic safety boards to identify concerns and working together, will continue outreach and education efforts with the underserved populations in the different areas of the state in FFY 2020.

2020 Highway Safety Strategic Plan Community Traffic Safety Programs…Page 105
Strategies Using a data-driven approach, New York has identified a comprehensive set of strategies that collectively will enable the state to reach the performance targets for Community Traffic Safety Programs. Examples of activities that will be considered for funding are listed under each strategy. Strategy CP-1: Community-Based Highway Safety Programs Projects proposed by local agencies and organizations to address traffic safety problems identified in their jurisdictions will be considered for funding under this strategy. The grant proposal must include a description of the problem with supporting data, details of the proposed activities with milestones and an evaluation plan for assessing the success of the project. All applications must address one or more of the program areas included in New York’s Highway Safety Strategic Plan. Community-Based Programs to Improve Traffic Safety CP-2020-001 Local agencies including police, transportation and health departments and non-profit organizations, such as county traffic safety boards and other community-based organizations that develop traffic safety programs at the local level, will be considered for funding under this planned activity. For example, county traffic safety boards that have developed programs tailored to the traffic safety needs of their counties will be supported. Driving in the Safe Lane, a program developed by the Community Parent Center in Nassau County, is also an example of a successful community-based program. The workshop educates teens and parents about driving risks such as inexperience, distractions, seat belt use and impairment, as well as the state’s Graduated Driver Licensing Laws. Roadway Safety Improvements CP-2020-002 Based on the analysis of identified high-crash locations and roadway-related crash information, GTSC will support efforts that contribute to improving the roadway environment. Roadway improvements implemented on a statewide basis will be given priority. Efforts to raise awareness, provide education or conduct training on topics such as work zone safety, traffic incident management (TIM), emergency traffic control and scene management will be supported. GTSC will also provide support for the presentation of a TIMposium involving the appropriate partners and stakeholders. Funding for crash reconstruction training to identify potential factors involved in crashes, including roadway factors, will also be considered for funding, as well as material and equipment to support roadway safety. Strategy CP-2: Statewide Implementation of Traffic Safety Initiatives GTSC will continue to encourage and provide resources and administrative support for the development of traffic safety initiatives by state agencies and not-for-profit organizations for implementation by local organizations and programs or to enhance ongoing local program efforts. The types of support provided by GTSC include public information and education materials for use by agencies and organizations in delivering programs at the local level and training and other educational programs for local project personnel to increase their knowledge of traffic safety issues and help them become more effective program managers. State Level Initiatives to Support Local Traffic Safety Programs CP-2020-003 Programs undertaken by state agencies and not-for-profits to support and enhance the implementation of community-based traffic safety programs will be eligible for funding. One example is the National Safety Council’s Survivor Advocate Speaker Network whose speakers, at the request of local traffic safety programs, are available to provide education and outreach to traffic safety stakeholders and high-risk populations, at

2020 Highway Safety Strategic Plan Community Traffic Safety Programs…Page 106
traffic safety conferences, schools and victim impact panels. Another example of educational programs that can support local traffic safety efforts is the Operation Lifesaver Program that educates the public on rail grade crossing safety. New York State agencies that provide public information materials, coordination and other support for local programs include GTSC, the NYS Department of Health and the NYS Department of Motor Vehicles. For example, GTSC is working with local wine trail associations and other non-traditional partners to develop and deliver traffic safety messaging in New York’s Finger Lakes Region. One initiative is to provide traffic safety tip cards for distribution through local businesses along and around the region’s three major wine trails (Cayuga, Seneca and Keuka). The primary purpose of these tip cards is to remind visitors to the area of the importance of safe, responsible consumption of beverages and to raise awareness of the dangers of impaired driving, distracted driving, failure to use a seat belt and other unsafe behaviors. Another example of a state level initiative focuses on Drowsy Driving. In 2020, efforts to address Drowsy Driving will continue to target younger drivers on college campuses across New York State. Subject matter experts from SUNY Stony Brook Center for Community Engagement & Leadership Development will work with the NYS Department of Health and the National Road Safety Foundation to engage and educate younger drivers. Targeting the high-risk younger driver population, they will help raise awareness of the dangers of drowsy driving as well as offer an opportunity for those younger drivers to develop public service announcements about drowsy driving. Strategy CP-3: Statewide Communications and Outreach Effective, high-visibility public information and education outreach efforts are an essential component of all successful highway safety programs. The primary purpose is to educate the public about the importance of traffic safety in their lives and ultimately to convince the public to change their attitudes and driving behaviors resulting in safer highways for everyone. In FFY 2020, GTSC will continue to coordinate a comprehensive and coordinated PI&E program for New York State that addresses current traffic safety issues and supports traffic safety programs at the state and local levels. Media Support for Traffic Safety Awareness Campaigns CP-2020-004 Support will be provided for the development and delivery of traffic safety messaging through a wide variety of channels including radio, television, billboards, print media and social media networking services such as Facebook, Twitter, LinkedIn and Instagram. Examples of the organizations eligible for funding include the NYS Broadcasters Association, the Cable Telecommunications Association of NY, Inc. and outdoor media vendors. The data-driven approach that New York uses to identify the priority issues to be addressed in the state’s highway safety program also guides the decisions on the selection of topics that will receive media support, the identification of target groups, the messages to be delivered and the type of media most appropriate for the delivery of those messages. In FFY 2020, New York will provide media support at the statewide level to increase public awareness and enhance the effectiveness of enforcement and other strategies undertaken to address the various high-risk groups and unsafe driving priorities that have been identified. These include non-motorized highway users (pedestrians and bicyclists), young drivers, motorcyclists, distracted driving (cell phone use and texting) and impaired driving (drug-impaired and alcohol-impaired). The target audience will be a major factor in determining the message and how it is delivered. For example, television and radio would typically be used to reach a statewide audience with more general messages,

2020 Highway Safety Strategic Plan Community Traffic Safety Programs…Page 107
while social media may be used for messaging targeting teens and young drivers. The placement of spots during programming on cable television will be considered to increase the likelihood of reaching different segments of the population with targeted messaging. Billboards may also be an appropriate delivery system for relaying messages to passing motorists. Various forms of media will also be used to promote traffic safety messages in conjunction with special events. For example, a media campaign is used to publicize the national seat belt enforcement mobilization in May each year and remind motorists to buckle up. Messaging on the dangers of impaired driving also accompanies the enforcement crackdowns during holiday periods throughout the year. Media will also be used during specific time periods such as messaging on the importance of child restraint use during child passenger safety week in September or drowsy driving messages coinciding with changing the clocks in the spring and the fall. It is also recognized that new issues may emerge during the year as the result of an unforeseen event or changes in policy or legislation. When appropriate, media support will be provided to disseminate messaging to raise public awareness of these traffic safety issues. Strategy CP-4: Younger Driver Outreach and Education Analyses of the data conducted in conjunction with several of the program areas in the HSSP have shown that young drivers are consistently overrepresented in crashes involving unsafe driving behaviors. These behaviors include, but are not limited to, speeding, distracted driving, alcohol-impaired driving and drugged driving. In the Driver Behavior surveys conducted at DMV offices, young drivers also reported the lowest compliance with the seat belt law and the highest frequency of texting and driving.
Projects that focus on raising awareness among teens of the dangers of engaging in unsafe driving behaviors will be considered for funding as Community Traffic Safety Programs. Public awareness and educational activities that focus on educating parents about New York's graduated license laws and providing them with the tools to encourage safe driving by their teens will also be funded.
Outreach & Education to Improve Teen Driver Safety CP-2020-005 Local outreach and education programs that focus on young drivers will be considered for funding. Examples include the Town of Brookhaven’s teen driver education presentations and the Town of Orchard Park’s safety program for young and inexperienced drivers. Outreach efforts that focus on educating parents on ways to keep teen drivers safe are also eligible for funding. Coalitions and other groups that engage in teen driving safety outreach and promote the implementation of proven and promising strategies to improve the safety of this high-risk driving population are also eligible for funding.

2020 Highway Safety Strategic Plan Community Traffic Safety Programs…Page 108
Strategy CP-5: Older Driver Outreach and Education While the data indicate that older drivers are underrepresented in fatal and personal injury crashes based on the proportion of the state’s licensed drivers who are in this age group, drivers over 60 who are involved in crashes are more likely to sustain serious injuries or be killed than younger drivers. Furthermore, U.S. Census data indicate that New York’s population is getting older and this high-risk group is expanding. Partnerships, coalitions and other groups that focus on issues related to older or medically at-risk drivers and promote the implementation of proven and promising strategies to improve the safety of this high-risk driving population are eligible for funding. GTSC has begun initial outreach to partner organizations such as Area Agencies on Aging and Municipal Planning Organizations (MPOs) to increase CarFit Events and presentations on the At-Risk Driver Re-Examination process as well as proactive steps seniors can take to continue driving safely as long as possible. In addition, GTSC will update and continue to promote the website www.ny.gov/olderdriversafety, which provides safety and informational resources for older drivers. Improving Traffic Safety for Older Drivers CP-2020-006 Under this activity, partner organizations will continue to work with GTSC to raise awareness about programs and services that are available to assist and support older drivers. Funding to support the training of technicians and the delivery of programs for older motorists will also be considered. To complement and reinforce these efforts, several GTSC staff members are trained as Car Fit technicians and event organizers. The GTSC Older Driver Safety Plan, drafted in FFY 2018, continues to evolve as additional strategies and resources to reach this growing age group are discovered and developed. Strategy CP-6: Outreach to Minority and Other Underserved Populations Ensuring that traffic safety messages and programs not only extend throughout all areas of the state but also reach all segments of the population requires special initiatives that focus on minority communities and other underserved populations. Examples of the diverse populations within the state that have been identified for special outreach efforts include refugee groups, Native Americans, the Amish and Mennonite communities, military veterans and migrant workers. Projects that offer educational programs and other outreach services to improve traffic safety among the state’s underserved populations will be eligible for funding. Minority and Multicultural Traffic Safety Programs CP-2020-007 In FFY 2020, GTSC will continue outreach to the state’s Amish population, resettlement areas for refugees and the eight federally recognized Indian Nation tribes that are eligible for funding and services from the Bureau of Indian Affairs within New York State. GTSC will meet with representatives involved in traffic safety initiatives to discuss ways to develop and strengthen sustainable relationships with the state’s diverse populations. In addition, GTSC will continue to support its partners at the local level who have identified specific traffic safety challenges facing minority and other underserved populations, such as seasonal migrant workers, within their counties. GTSC will continue traffic safety efforts for rural road safety in the Southern Tier and will include the Slow Moving Vehicle Advisory Board in efforts to identify the key safety issues and provide education and outreach to the Amish and agricultural local road users. In addition, programs such as the Mohawk Valley Resource Center for Refugees’ Multi-Cultural Traffic Safety Program and the Erie County Catholic Health Systems, Inc., which provides child passenger safety outreach to refugee populations, will be eligible for funding under this planned activity.

2020 Highway Safety Strategic Plan Planning & Administration…Page 109
PLANNING & ADMINISTRATION Overview The Governor’s Traffic Safety Committee (GTSC) annually processes over 600 grant applications, representing approximately $34.2 million in funding to state, local and not-for-profit agencies. GTSC uses an electronic grants management system, eGrants. GTSC has continued to update eGrants to improve efficiency, reduce staff time and improve management of New York’s Highway Safety Program. GTSC is responsible for coordinating and managing New York State's comprehensive highway safety program. GTSC takes a leadership role in identifying the state's overall traffic safety priorities; provides assistance to its partners in problem identification at the local level; and works with its partners to develop programs, public information campaigns and other activities to address the problems identified. In administering the state’s highway safety program, GTSC takes a comprehensive approach, providing funding for a wide variety of programs to reduce crashes, fatalities and injuries through education, enforcement, engineering, community involvement and greater access to safety-related data. The surface transportation bill known as the Fixing America’s Surface Transportation (FAST) Act was signed into law on December 4, 2015. The Fast Act includes two funding programs: the Section 402 State and Community Highway Safety grant program and the Section 405 National Priority Safety Programs. The Section 405 program consists of incentive programs in the following areas: Occupant Protection, Traffic Records, Impaired Driving, Motorcycle Safety, Alcohol-Ignition Interlock, Distracted Driving, Graduated Driver Licensing, and Non-motorized Safety. States must meet eligibility requirements to receive funding in these areas. Under the FAST Act, a single application for funding is required and must be submitted by July 1. As part of its planning and administration function, GTSC will undertake activities in FFY 2020 to address the following needs and challenges:
Collect and analyze crash data to identify trends and problem areas that will help direct the assignment of the state’s limited resources
Ensure that highway safety resources are allocated in the most efficient manner to effectively address the highway safety problems that have been identified and prioritized
Coordinate multiple programs and partners to enhance the efficient and effective use of resources
Assess training needs to ensure the delivery of relevant and high-quality training programs
Make appropriate, up-to-date and adequate public information and education materials available to the traffic safety community
Monitor grant projects to assess performance and accountability
Provide for the timely and efficient approval of county funding proposals and the allocation and liquidation of funds
Strengthen existing public/private partnerships and build new coalitions to support highway safety efforts
Deliver programs that are effective in changing the knowledge, attitudes and behavior of the state’s roadway users in reducing traffic crashes, fatalities and injuries

2020 Highway Safety Strategic Plan Planning & Administration…Page 110
Strategies Through the strategies selected for Planning & Administration, GTSC provides administrative support and guidance for the implementation of New York’s highway safety program. These strategies form a comprehensive and coordinated set of initiatives that collectively provide the foundation for the state’s performance-based program and enhance efforts at the local and state level that will contribute to the achievement of the state’s performance goals. Activities are listed under each strategy. Strategy PM-1: Planning and Administration Through the planning and administration function, GTSC is responsible for the overall coordination of the state’s highway safety program in compliance with the new requirements established under the FAST Act. The GTSC staff, working with the state’s traffic safety networks, grantees and other partners, will continue to identify highway safety problems in New York and assist in the development of programs to address these problems. The staff also provides support services for the general administration of the highway safety program. Planning and Administration for New York’s Highway Safety Program PM-2020-001 Through the planning and administration function, GTSC is responsible for the overall coordination of the state’s highway safety program in compliance with the new requirements established under the FAST Act. The GTSC staff, working with the state’s traffic safety networks, grantees and other partners, will continue to identify highway safety problems in New York and assist in the development of programs to address these problems. The staff also provides support services for the general administration of the highway safety program. Major activities under the Planning and Administration project are listed below:
Evaluating funding proposals; administering the federal letter of credit; reviewing, monitoring, auditing, accounting and vouchering project components
Analyzing and disseminating new information and technology to the traffic safety community in New York State
Participating in subcommittees and advisory groups, including, for example, the Impaired Driving Advisory Council; NYS Child Passenger Safety Advisory Board; Motorcycle Safety Workgroup; DRE & SFST Steering Committee; Highway Safety Conference Planning Committee; NYS Partnership Against Drowsy Driving; Traffic Records Coordinating Council; Metropolitan Planning Organization (MPOs); Capital District Safe Kids Coalition; and Pedestrian Safety Action Plan (PSAP) Committee
Participating in preparing New York’s Traffic Safety Strategic Plans, including the Highway Safety Strategic Plan (HSSP), which is the principal document, the NYS Strategic Highway Safety Plan (SHSP), the Commercial Vehicle Safety Plan (CVSP), and the Traffic Records Strategic Plan
Conducting an annual driver behavior and attitudinal survey as called for by NHTSA
Conducting a biannual Automated Traffic Enforcement Survey, as required under the FAST Act
Developing a comprehensive and coordinated PI&E program for New York State, which will continue to address current traffic safety issues and support traffic safety programs at the state and local levels. Market research may be incorporated into the development of PI&E campaigns as needed. Periodic surveys may be conducted to assess public awareness of traffic safety issues and track changes in attitudes, perceptions and reported behaviors. The results of these studies will be used to modify and improve future campaigns.

2020 Highway Safety Strategic Plan Planning & Administration…Page 111
Strategy PM-2: Training and Educational Opportunities Training has been identified as a valuable tool to meet the needs of grantees, partners and staff. GTSC will continue to assess the training needs of its highway safety partners, coordinate these needs with the priorities outlined in the HSSP and provide appropriate training and educational opportunities. Highway Safety Training and Educational Opportunities PM-2020-002 Recognizing the value of professional development, GTSC will continue to support participation by its staff and highway safety partners in relevant training and educational opportunities to increase their knowledge and awareness of traffic safety issues and to acquire new or improved skills. Training will be delivered in a variety of formats as appropriate, including conferences, workshops, seminars, classroom settings, podcasts and webinars. Coordinated public education programs for New York State will also continue to address current traffic safety issues and support traffic safety programs at the state and local levels. GTSC also supports a variety of educational programs made available to New York’s traffic safety community. Examples include financial and other forms of support for workshops, forums, symposia and other types of meetings on important traffic safety topics presented by partners, such as the Institute for Traffic Safety Management and Research, the National Sleep Foundation, the National Road Safety Foundation, the Greater New York Automobile Dealers’ Association and other not-for-profit groups.