new south wales state of the environment 2015 · reporting on the state of the environment helps...
TRANSCRIPT
New South Wales
State of the Environment
2015Environment Protection Authority
www.epa.nsw.gov.au


New South Wales
State of the Environment
2015Environment Protection Authority
© State of New South Wales, Environment Protection Authority 2015.
The Environment Protection Authority (EPA) and the State of NSW are pleased to allow this material to be reproduced, for educational or non-commercial use, in whole or in part, provided the meaning is unchanged and its source, publisher and authorship are acknowledged. Specific permission is required for the reproduction of images.
Disclaimer:The EPA has compiled this document in good faith, exercising all due care and attention. The EPA does not accept responsibility for any inaccurate or incomplete information supplied by third parties. No representation is made about the accuracy, completeness or suitability of the information in this publication for any particular purpose. The EPA shall not be liable for any damage which may occur to any person or organisation taking action or not on the basis of this publication. Readers should seek appropriate advice about the suitability of the information to their needs.All content in this publication is owned by the EPA and is protected by Crown Copyright. It is licensed under the Creative Commons Attribution 4.0 International (CC BY 4.0), subject to the exemptions contained in the licence. The legal code for the licence is available at Creative Commons.The EPA asserts the right to be attributed as author of the original material in the following manner: © State of New South Wales and NSW Environment Protection Authority 2015.
Published by:NSW Environment Protection Authority (EPA)59–61 Goulburn Street, SydneyPO Box A290Sydney South NSW 1232
Report pollution and environmental incidents
Environment Line: 131 555 (NSW only) or [email protected] also www.epa.nsw.gov.au/pollution
Phone: +61 2 9995 5000 (switchboard)Phone: 131 555 (NSW only – environment information and publication requests)Fax: +61 2 9995 5999TTY users: phone 133 677, then ask for 131 555Speak and listen users: phone 1300 555 727, then ask for 131 555Email: [email protected]: www.epa.nsw.gov.au
ISSN 1320-6311EPA 2015/0817
December 2015Printed on environmentally sustainable paper
iii
FOREWORD
Nature has both an intrinsic value in and of itself and an instrumental value as the environmental infrastructure that underpins our economy and sustains our community. That is why the state of the environment has a profound effect on our quality of life and the health of our economy. Reporting on the state of the environment helps us to take stock of environmental conditions in our state, to identify emerging issues and to take effective action for ourselves, for future generations and for the environment. I am pleased to present the Environment Protection Authority’s ninth NSW State of the Environment. This report supports the work the EPA already undertakes by outlining the status and condition of major environmental resources and the associated environmental trends and implications for the environment and human health. The report uses the most up-to-date information from a range of government agencies and authorities. This latest report explains the challenges we have overcome, notes the issues we are still working on, and explores emerging challenges.Air quality continues to be generally good overall, with low concentrations of lead, carbon monoxide and sulphur dioxide. Ozone and particle pollution levels require ongoing attention.Industry and household waste disposed of in landfill is decreasing and garden and food waste recycling is increasing. The NSW Government is combating illegal dumping and funding emergency pollution clean-ups, such as those for illegally dumped asbestos.
Since 2012, the area of public land reserved under the National Parks and Wildlife Act 1974 has increased by about 26,600 hectares. This includes significant reservations in the South Coast (Dharawal National Park), Sydney (Berowra Valley), Darling Riverine Plains (Warrambool) and near Moree (the Gwydir wetland). The Conservation Partners Program has helped encourage and support conservation on private land, which is of growing importance to restore connected, resilient landscapes.
There are several challenges that we are working to address, such as the decline of NSW threatened species and our greenhouse gas emissions.The government’s Saving our Species program was established to protect all threatened species over the next century and has been bolstered with $100 million over the next 5 years, and the legislative reform we are undertaking will help safeguard biodiversity at a bioregional scale. The government is also implementing its Renewable Energy Action Plan and the Energy Efficiency Action Plan in order to increase the use of sustainable energy sources and improve energy efficiency, to continue the downward trajectory of NSW emissions.NSW State of the Environment 2015 reminds us that challenges also present opportunities. They present the opportunities to improve our economy, our environment, and our health and amenity at the same time, through ecologically sustainable development. The government is committed to working with communities, industry and other stakeholders to better protect and conserve the environment, to enhance our wellbeing, and to meet the challenges ahead.
Mark Speakman
Minister for the Environment

Environmental resources
8 Air quality 65
9 Contaminated sites
79
10 Soil condition 85
11 Sustainable land management
95
12 Threatened species 103
13 Native vegetation 111
14 Protected areas and conservation
121
15 Invasive species 133
16 Water resources 143
17 River health 153
18 Wetlands 163
19 Ground water 171
20 Coastal, estuarine and marine cosystems
179
v
CONTENTS
Foreword iiiPreface viAcknowledgements viiAbout State of the Environment 2015 viiiSummary xi
Abbreviations and acronyms 194Units 198Glossary 199Index 205
Environmental drivers
1 Population 1
2 Economics and the environment
9
3 Energy consumption 17
4 Transport 29
5 Greenhouse gas emissions
35
6 Urban water 45
7 Waste and recycling 57
vi
PREFACE
In November 2011, the NSW Government passed legislation to strengthen and reinvigorate the Environment Protection Authority (EPA). One of the principal requirements of the reforms to the EPA was to increase its transparency through clear reporting and thus improve the community’s access to information.The New South Wales State of the Environment (SoE) Report is prepared every three years by the EPA in accordance with the requirements of the Protection of the Environment Administration Act 1991. This is the ninth SoE report in NSW and continues to build on the valuable time-series data of previous reports.The NSW State of the Environment 2015 (SoE 2015) provides an overview of the NSW environment using the best information available. As required under section 10 of the Act, the report assesses the status and condition of major environmental resources and examines environmental trends. The report also describes the pressures that affect the environment and the responses to those pressures. SoE 2015 reflects the continuing trend of improvement and refinement of reporting shown over the previous eight iterations of the report. It assembles a wide range of information from a large array of sources into a format that is accessible to the wider community, yet still provides scientific rigour.
For SoE 2015 20 themes are presented in two parts: Environmental Drivers and Environmental Resources. The report provides ratings of the status and trend for 65 indicators across the 20 themes.Preparation of SoE 2015 has relied on extensive contributions from many other NSW Government departments and agencies and within the EPA. The data and information provided was appraised and validated by the contributing organisations through an extensive process of review. My sincere thanks to all of those concerned in providing information and advice during its compilation. I would especially like to express my appreciation to the independent experts listed in the Acknowledgements who provided a range of perspectives, additions and helpful advice.I trust that this report will be a valuable resource for the general community as well as guiding policymakers in determining future priorities and objectives that will lead to the best possible outcomes for the environment.
Barry Buffier AM
Chair and Chief Executive Officer Environment Protection Authority
vii
State of the Environment Reporting Steering Committee
NSW Environment Protection AuthorityDepartment of Planning and EnvironmentDepartment of Primary IndustriesOffice of Environment and HeritageTransport for NSW
Contributors
Australian Bureau of Statistics (NSW office)Balmoral Group Australia (Economics and the
Environment)Department of Industry, Skills and Regional
DevelopmentDepartment of Planning and EnvironmentDepartment of Premier and CabinetDepartment of Primary IndustriesHunter Water CorporationNSW Ministry of HealthNSW Environment Protection AuthorityOffice of Environment and HeritageResources and EnergySydney Water CorporationThe TreasuryTransport for NSWWater NSW
Independent expert reviewers
Associate Professor Paul Adam, University of New South Wales
Dr Michael Battaglia, CSIRODr Martin Cope, CSIRODr Mathew Crowther, University of SydneyDr Mark Diesendorf, University of New South
WalesProfessor Kristine French, University of
WollongongDr Richard Greene, Australian National
UniversityDr Mike McLaughlin, Adelaide UniversityDr Louise Morin, CSIRO Dr Brian Murphy, Visiting Fellow, Australian
National UniversityTony Roper (Ex. Office of Environment and
Heritage)Professor Martin Thoms, University of New
EnglandProfessor Stuart White, Institute for Sustainable
Futures
ACKNOWLEDGEMENTS
viii
ABOUT STATE OF THE ENVIRONMENT 2015
PurposeNSW State of the Environment 2015 (SoE 2015), prepared by the NSW Environment Protection Authority (EPA), reports on the status of the main environmental issues facing NSW. The report has been prepared in accordance with the requirements of section 10 of the Protection of the Environment Administration Act 1991. It is the ninth SoE since 1993. SoE 2015 aims to provide credible, scientifically based, statewide environmental information to assist those involved in environmental policy and decision-making and managing the state’s natural resources.
PreparationAlthough SoE 2015 has been prepared by the EPA, the scope of state of the environment reporting is too broad to be covered by just one agency. SoE 2015 contains extensive input from a wide range of government agencies, other organisations and individual specialists, who provided data, information, analysis and interpretation, and reviewed the assembled content of the report. The EPA relies strongly on the support and contributions from these agencies, as well an inter-agency SoE Steering Committee.The specialist input also includes reviews and advice from a panel of independent experts external to the NSW Government.Section 10(3)(f) of the Protection of the Environment Administration Act 1991 states that the SoE Report is to include a statement on the performance of environmental education programs. This statement is to be prepared by the NSW Council on Environmental Education (s.27). However, the council has not been in existence since 2009 and therefore no such statement is available.
Structure and linkagesSoE 2015 is structured differently from previous SoE reports. To simplify and streamline the report each issue is reported as an independent ‘Theme’ with extensive cross-referencing highlighting the relationships between themes.The report has been produced in two parts:
Environmental drivers
The first part of the report describes key environmental drivers that influence our environment: population growth, economic trends, energy use, transport trends, greenhouse gas emissions, urban water use and waste and recycling. The population of NSW is continually growing and trends in population growth, settlement patterns and residential densities are described in Theme 1: Population. Growth in population helps to drive economic growth and prosperity for the people of NSW. Responding to the environmental challenges presented by a growing NSW economy requires a better understanding of how the economy and the environment interact. New economic instruments and accounting systems are discussed in Theme 2: Economics and the environment. The growth in population and the economy also leads to the consumption of energy, water and land resources and the generation of waste. The production and use of energy has been identified as the largest source of greenhouse gas emissions in NSW, with transport and electricity generation responsible for the majority of these emissions. Energy production and use is described in Theme 3: Energy consumption, while trends in the use of public and private transport are described in Theme 4: Transport. Overall levels and trends in greenhouse gas emissions are described in Theme 5: Greenhouse gas emissions.

ix
Communities, industry, and agriculture require access to reliable sources of water. Drinking water quality and patterns of potable water use are described in Theme 6: Urban water. Trends in waste generation and recycling are described in Theme 7: Waste and recycling.
Environmental resources
The second part of the report describes the condition of important environmental resources such as: air quality, soils and land management, native species, vegetation, and reserves and conservation, and water resources, rivers and wetlands. It also reports on specific issues such as invasive species and contaminated sites.Ensuring that air quality remains at a high level is essential for providing a clean living environment and maintaining the health of the NSW population. While air quality is generally good in NSW the levels of major pollutants and the issues that can arise in some situations are discussed in Theme 8: Air quality.
The contamination of land by pollutants is covered in Theme 9: Contaminated sites. Healthy soils provide the essential ecosystem services and the primary productivity supporting natural ecosystems and the economic prosperity of the state. The health of soils in NSW and changes in condition over time are described in Theme 10: Soil condition, while current land management practices and their effects on soil health are discussed in Theme 11: Sustainable land management.
Ensuring the long-term survival of the species and ecosystems of NSW means that they will persist for the benefit and enjoyment of future generations. Many native species are considered to be threatened in NSW and the current status and trends in threatened species are discussed
in Theme 12: Threatened species. The main threats to the survival of species are habitat destruction through the clearing of native vegetation, discussed in Theme 13: Native vegetation, and competition and predation by invasive species. The preservation of ecosystems and habitats is described in Theme 14: Protected areas and conservation, while invasive species are discussed in Theme 15: Invasive species. One of the greatest challenges facing NSW is continued access to reliable sources of water. Water use needs to be managed to provide an equitable balance between the numerous beneficial uses of water and maintaining the health of rivers and aquatic ecosystems. How water resources are allocated and an increase in the share of water for the environment is described for surface water in Theme 16: Water resources, and for groundwater in Theme 19: Groundwater. The ecological health of rivers and the effects of water availability and extraction are described in Theme 17: River health, and the relationship to wetland health in Theme 18: Wetlands.
Most rivers flow to the sea through estuaries and the final theme in this report covers the health and impacts on estuaries and the coastal and marine environments of NSW, in Theme 20: Coastal, estuarine and marine ecosystems.
Linkages
The linkages introduced above are presented graphically at the beginning of each theme, with the topics most strongly linked to that theme highlighted in the banner; the example below highlights the linkages to Theme 3: Energy consumption.
x
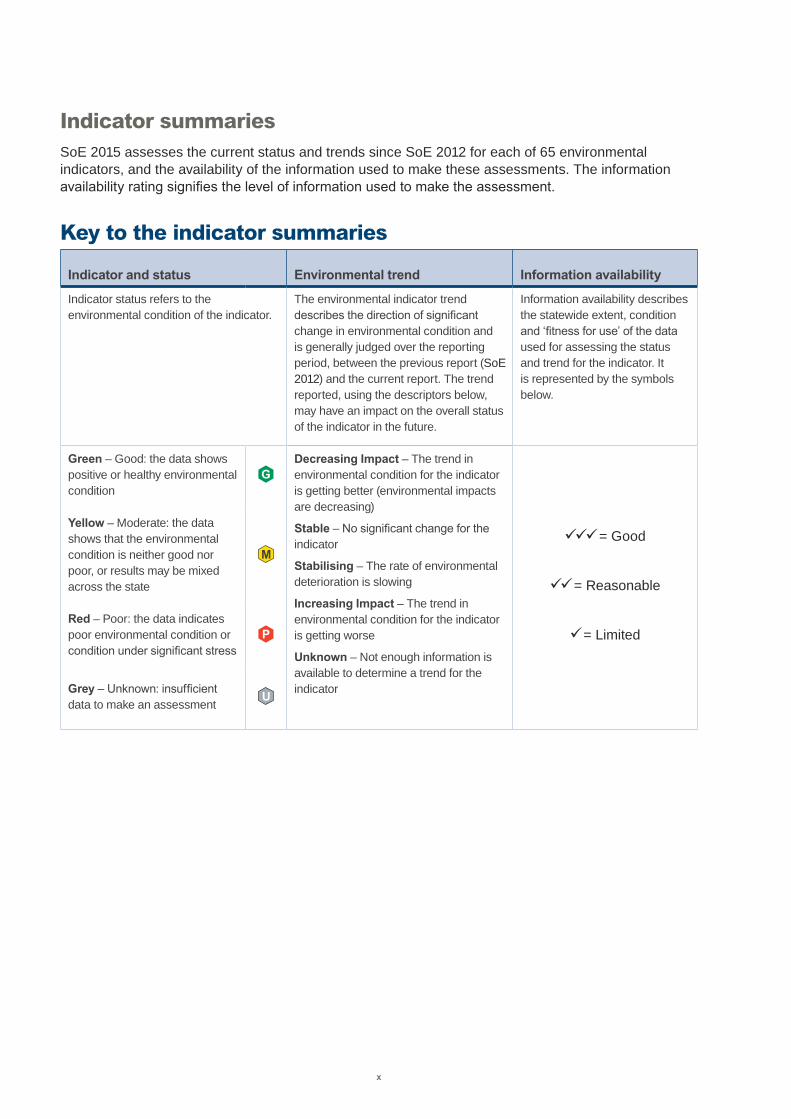
Indicator summariesSoE 2015 assesses the current status and trends since SoE 2012 for each of 65 environmental indicators, and the availability of the information used to make these assessments. The information availability rating signifies the level of information used to make the assessment.
Key to the indicator summaries
Indicator and status Environmental trend Information availability
Indicator status refers to the environmental condition of the indicator.
The environmental indicator trend describes the direction of significant change in environmental condition and is generally judged over the reporting period, between the previous report (SoE 2012) and the current report. The trend reported, using the descriptors below, may have an impact on the overall status of the indicator in the future.
Information availability describes the statewide extent, condition and ‘fitness for use’ of the data used for assessing the status and trend for the indicator. It is represented by the symbols below.
Green – Good: the data shows positive or healthy environmental condition
GDecreasing Impact – The trend in environmental condition for the indicator is getting better (environmental impacts are decreasing)
Stable – No significant change for the indicator
Stabilising – The rate of environmental deterioration is slowing
Increasing Impact – The trend in environmental condition for the indicator is getting worse
Unknown – Not enough information is available to determine a trend for the indicator
= Good
= Reasonable
= Limited
Yellow – Moderate: the data shows that the environmental condition is neither good nor poor, or results may be mixed across the state
M
Red – Poor: the data indicates poor environmental condition or condition under significant stress
P
Grey – Unknown: insufficient data to make an assessment
U
xi
SUMMARY
1: Population
The population of NSW is continually growing and by June 2014 had reached 7.52 million people
As population increases, population density in urban areas has also risen. By June 2014 Greater Sydney had 390 people per square kilometre, 27 more than in 2009. Population has continued to rise in NSW since June 2014 and by March 2015 had increased by about 78,000 people. It is predicted that by 2031 9.23 million people will live in NSW, with the majority of the growth expected to be in Sydney. Increasing population and urbanisation can present environmental challenges through a greater demand for housing, energy and water and increased waste generation.
2: Economics and the environment
Since 1990 the NSW economy has experienced annual growth of around 2.5% per annum
The economy is intrinsically linked to the natural environment. While economic growth may be related to increases in population and increased resource use, the shift to a services based economy and improved efficiencies in the use of resources mean that growth can be achieved without increasing impacts on the environment. Economic instruments such as levies, subsidies, tradeable permits and performance-based regulatory charges are increasingly being used to achieve environmental quality objectives more flexibly and at lower cost.
3: Energy consumption
Environmental benefits from reduced electricity demand and growing renewable electricity supply are being offset by continued strong growth in fossil fuel demand by the transport sector
Over 90% of energy demand is being met by non-renewable sources – mainly coal, gas, and petroleum products. Around one-quarter of final energy demand is met by electricity, but demand for electricity has been falling over the past six years. At the same time supply has experienced strong diversification, with renewable (non-hydro) electricity generation growing five-fold between 2008 and 2014. Diversification of other energy supplies has been limited. Transport has now become the largest sector for final energy demand with strong growth in fossil fuel use, and minor use of renewable energy.
4: Transport
Use of public transport continues to rise; however, the dominant mode of transport for Sydney residents is still the car, accounting for 69% of all trips
The number of trips per person dropped by 4.8% for the decade to 2012–13. Changes in lifestyles and technological advances are likely to have influenced this outcome, with a 148% increase over the decade to 2012–13 in employees who have working from home arrangements in place. Transport is the main source of NOx emissions in the Greater Sydney Region and was responsible for 19% of NSW greenhouse gas emissions.
Environmental driversHumans and their activities have a profound effect upon the landscapes within which they live, as well as the broader environment that surrounds them. The first part of this report describes seven drivers of environmental issues that provide the broad context for assessing the condition of environmental resources in the second part of the report.
xii
5: Greenhouse gas emissions
Annual greenhouse gas emissions in NSW peaked in 2007, and are now 1% below the 1990 baseline. The stationary energy and transport sectors make up 59% of all emissions
Emissions have declined across most economic sectors since 1990. In contrast, emissions from transport have undergone almost uninterrupted growth, with forecasts indicating continued growth. Overall, stationary energy emissions (primarily electricity generation) also rose from 1990, peaking in 2007 and then declining quickly.
6: Urban water
The quality of urban water supplies continues to improve. At the same time demand is continuing to grow slowly, maintaining pressure on the state’s water resources
Overall water use is much lower than in the 1990s. However water demand by NSW cities and large towns over the past seven years has had an annual average growth rate of 1.35% (inclusive of recycled water). Sydney Water and Hunter Water are both maintaining per person water use below water licence targets, while per property consumption from regional water utilities is almost half of 1990 levels. The quality of this water is excellent and in 2013–14 all large water utilities had 100% compliance with microbiological and chemical standards. Demand for urban water is having ongoing impacts on aquatic ecosystems.
7: Waste and recycling
The proportion of waste that is recycled continues to rise and reached 62.5% in 2012–13
In NSW waste generation rose steadily from 2002–03 until 2010–11, but appears to have stabilised over the last two years to 2012–13. Over the same timeframe waste generation per person has decreased by 3%. The uplift in the housing market has led to construction and demolition waste increasing, and the amount of waste being recycled in this sector fell to 69% in 2012–13.

xiii
8: Air quality
Most key air pollutants have remained at low levels, but microscopic particles (e.g. dust) and ozone (a component of smog) continue to impact air quality across metropolitan areas and some regional centres
The concentrations of a number of the most common air pollutants, including carbon monoxide, lead, oxides of nitrogen and sulfur dioxide, are now low (especially compared to the 1980s), as are air toxics. Oxides of nitrogen and volatile organic compounds have reduced, but as these contribute to the formation of ground-level ozone (a key component of photochemical smog) they remain of concern within the Sydney region. There is growing evidence about the adverse health impacts of airborne particles. Depending on the location, bushfires, agricultural burning, dust storms, mine dust and wood heaters can be key sources of particulate pollution.
9: Contaminated sites
More potentially contaminated land continues to be identified with an additional 166 sites reported in the eighteen months to June 2014
The EPA currently regulates 332 contaminated sites and 130 sites have been remediated. In addition 860 sites reported prior to the end of 2014 are still awaiting assessment. To address the backlog the EPA set up a Backlog Program in late 2014.
10: Soil condition
The soil resources of NSW are generally in a moderate condition despite a broad but largely historical decline since the arrival of European settlers
While in a moderate condition overall, some soil degradation issues remain, with 74% of priority soil units being rated as poor or very poor for at least one soil degradation hazard. The loss of organic carbon and topsoil loss due to sheet erosion are the main causes of declines in soil condition over time. The widespread use of conservation farming practices is now helping to maintain soil condition and counteract land-use pressures.
11: Sustainable land management
Current land management practices are broadly sustainable, with only a moderate risk that they will lead to soil degradation
Most land in NSW is being managed within its capacity to support current management practices. However, some localised areas are at risk of soil degradation where land use is marginal for the area. The greatest risk is from soil acidification and wind erosion. Intensifying land use and unpredictable weather extremes are factors increasing these risks.
Environmental resourcesThe second part of this report describes the condition of important environmental resources of NSW: Air quality; Soils and land management; Native species, vegetation and reserves and conservation; Water resources, rivers and wetlands; and some specific issues such as invasive species and contaminated sites.
xiv
12: Threatened species
The number of species considered to be threatened, or at risk of survival over the longer term, continues to rise, but at a slower rate
Native species remain under threat in NSW, with 999 species presently listed as having a threatened status. Ten additional species have been listed as threatened since 2012. The greatest risks to biodiversity are from habitat destruction, in particular the clearing of native vegetation and the impacts of invasive species, particularly predation by foxes and cats. A major process of reform is underway to simplify legislation and improve outcomes for biodiversity.
13: Native vegetation
Clearing rates for native vegetation in NSW have remained relatively stable for most of the past 10 years, but the overall condition of vegetation is deteriorating
Due to new technology that provides a higher resolution for the monitoring of clearing of woody vegetation, the rate of clearing is now recognised to be lower than previously reported, presently at around 11,000 hectares per year. Changes in the condition of vegetation are harder to monitor. While about 61% of the state has not been cleared of native vegetation, its condition is considered to be good in only 9% of the state. The main pressure on vegetation condition is due to land use, but this is increasingly being addressed through better land management practices. Fragmentation due to clearing, weed invasion and climate change are factors maintaining the pressure on vegetation condition.
14: Protected areas and conservation
About 8.9% of NSW is reserved in the public reserve system, and around 3.9% of land in NSW is currently subject to some form of management under a private land conservation program
Since 2012 the area of the reserve system has increased by about 26,600 hectares. This includes significant reservations in the South Coast (Dharawal National Park), Sydney (Berowra Valley) and the Darling Riverine Plains (Warrambool) as well as several thousand hectares of the Gwydir wetland, near Moree. While many ecosystems in NSW are well represented in parks, some ecosystems are poorly protected. To supplement the public reserve system a range of measures has been developed under the Conservation Partners Program to encourage and support conservation on private land.
15: Invasive species
Invasive species, including pest animals and weeds are widespread across NSW and have significant impacts on native species, ecosystems and agriculture
Many invasive species are listed as key threatening processes in NSW, with pest animals and weeds identified as a threat to over 70% of all threatened species. Pathogens and diseases are an emerging threat to both biodiversity and agriculture and are becoming increasingly prevalent. A revised NSW Invasive Species Plan 2015–2022 will provide better guidance to help prevent and manage the introduction and spread of invasive species.
xv
16: Water resources
Much of NSW is returning to drier conditions, so the variability of river flows has been reduced and less surface water is available for use
As conditions become drier across much of NSW, less surface water is available for use and more water is being extracted from rivers. Seventy water sharing plans covering about 95% of water use have now been implemented, with plans for the remaining water sources to be completed soon. Greater amounts of environmental water are being stored and released to maintain or improve the health of rivers and wetlands. Over the past three years, around 600,000 megalitres of water per year, on average, have been targeted to priority aquatic ecosystems.
17: River health
The overall condition of rivers in NSW is moderate, but rivers in the Murray–Darling basin are generally in poorer condition than coastal rivers
While the overall condition of rivers is considered to be moderate, the condition of fish communities remains poor and continues to decline in the Murray–Darling basin. Most major inland river systems are affected by the ongoing impacts of water extraction and altered river flows, so they are in poorer condition overall. Coastal rivers are less affected by these pressures, so with the exception of fish communities, are in better ecological health.
18: Wetlands
Overall waterbird abundance has reduced, but targeted delivery of environmental water has helped maintain the health of some priority wetlands
Over the past three years the return to drier conditions has seen a reduction in the extent of wetland inundation and a decrease in waterbird
abundance and breeding activity. The condition of wetland vegetation and waterbird diversity at some sites that received environmental water has been maintained.
19: Groundwater
Groundwater use has risen over the past three years as conditions dry out in most parts of the state
While use of groundwater has risen, extraction from most groundwater sources is below the long-term sustainable extraction limit. When water sharing plans commenced, extraction was above the sustainable yield for some groundwater sources, but is being reduced to align with long-term sustainable extraction limits over the life of these plans. Water sharing plans have now been completed for all sources in the NSW Murray–Darling Basin and will be completed for all coastal sources by 2016.
20: Coastal, estuarine and marine ecosystems
Although the majority of coastal, estuarine and marine systems in NSW are in moderate or good condition, most have been modified to some extent and continue to come under increasing pressure from coastal development
Overall, the water quality and the ecosystem health of the NSW marine environment are considered to be good, as they are in most coastal waters, although a wide range of threats and risks are present. Conditions in NSW estuaries are typically more variable, generally reflecting the level of disturbance locally and across their catchments, and their level of resilience to change. Recreational water quality is good at most ocean beaches, but water quality is lower in the more enclosed waters of coastal lakes and estuaries.
