supplementary state of the environment report 2005 … · 1.6 soe report structure ... 4.6 vehicle...
TRANSCRIPT
State of the Environment Report 2005 - Supplementary 1
PRINTED ON 100% RECYCLED PAPER
State of the Environment Report 2005 - Supplementary 1

2 State of the Environment Report 2005 - Supplementary
I N D E X
1.0 TOWARDS SUSTAINABILITY ................. 4
1.1 Introduction .................................................... 4
1.2 Objectives .................................................... 4
1.3 Ecologically Sustainable Development .... 4
1.4 Triple Bottom Line reporting ....................... 5
1.5 Environmental Management ...................... 5
1.6 SoE Report Structure ................................... 5
1.7 Environmental Indicators ............................ 5
1.8 Environmental Levy ................................... 6
1.9 Regulatory Environment ............................. 6
1.10 Regional Setting ........................................... 6
1.10.1 Location ......................................................... 6
1.10.2 Climate .......................................................... 7
1.11 Population ..................................................... 8
At a Glance ....................................................... 9
2.0 THE LAND ................................................. 10
2.1 Introduction .................................................. 10
STATE ..................................................................... 10
2.2 Topography .................................................. 10
2.3 Soils and Geology ..................................... 10
2.4 Vegetation ................................................... 10
2.5 Acid Sulfate Soils ....................................... 10
2.6 Land Use ..................................................... 11
2.7 Contaminated Land .................................... 11
2.8 Environmentally Sensitive Land .............. 11
PRESSURES .............................................................. 11
2.9 Development Pressures ............................ 11
2.9.1 Land Clearing ............................................. 12
2.9.2 Rural Residential Development ............... 12
2.10 Land Degradation ........................................ 12
2.10.1 Acid Sulfate Soils ........................................ 12
2.10.2 Agricultural Practices ................................. 12
2.10.3 Extractive Industries .................................. 13
RESPONSE ................................................................ 17
2.11 Planning Controls ....................................... 13
2.12 Acid Sulphate Soils Management ............. 13
2.12.1 Existing Projects ........................................ 13
2.13 Contaminated Land Remediation .............. 13
FUTURE DIRECTIONS ............................................ 14
2.14 Acid Sulfate Soils - Proposed Projects ..... 14
2.15 Comprehensive Vegetation Mapping ....... 14
2.16 Land Degradation Assessment ................. 14
At a Glance ...................................................... 15
3.0 WATER ....................................................... 16
3.1 Introduction .................................................. 16
STATE ..................................................................... 16
3.2 Inland Waters .............................................. 16
3.2.1 Rainfall ......................................................... 16
3.2.2 River Flows ................................................ 16
3.2.3 Water Quality .............................................. 17
3.2.4 Flooding ....................................................... 17
3.2.5 Riparian Vegetation .................................... 18
3.2.6 Aquatic Habitat ............................................ 18
3.2.7 Groundwater ............................................... 18
3.3 Coastal Wetlands, Estuaries and Ocean . 19
3.3.1 Estuarine Habitats ....................................... 19
3.3.2 Coastal Wetlands ........................................ 19
3.3.3 Beach Habitats ............................................ 19
PRESSURE ................................................................ 19
3.4 Surface water Extraction ........................... 19
3.5 Groundwater extraction ............................. 19
3.6 Water Pollution ............................................ 19
3.6.1 Sewage Discharges ................................... 20
3.6.2 On-Site Sewer Management ..................... 20
3.6.3 Stormwater Pollution .................................. 20
3.6.4 Agricultural Practices ................................. 21
3.6.5 Acid Sulfate Soils ........................................ 21
3.7 Recreational Users .................................... 21
3.8 Disturbance of Riparian Zones and
Weed Infestation .......................................... 21
3.9 Loss of Fisheries Habitat and
Wetland Drainage ........................................ 21
3.10 Fishing and Fish Kills ................................ 21
RESPONSE ................................................................ 23
3.11 Integrated Water Management Strategy ... 23
3.12 Stormwater Management .......................... 23
3.12.1 Installation of SQUIDS ................................ 23
3.12.2 Inspection and Maintenance of SQUIDS .. 24
3.13 Sewage and Effluent Disposal
Management ............................................... 24
3.13.1 Water Quality Monitoring ............................ 24
3.13.2 Sewage Infrastructure ................................ 24
3.13.3 Septic Tank Controls .................................. 25
3.14 Groundwater ............................................... 25
3.15 Beachwatch ................................................ 25
3.16 Waterway and Wetland Rehabilitation
and Protection ............................................. 26
3.16.1 Pola Creek Rehabilitation Project ............. 26
3.16.2 Nestle Community Vegetation Project - .......
Jerseyville .................................................. 26
3.16.3 Yarrabee Park Wetland Restoration
Project .......................................................... 26
3.16.4 Boyters Lane – Playing Fields and
Wetland Plan of Management .................... 26
3.17 Estuary Management ................................. 26
3.18 Fisheries and Aquaculture ......................... 26
3.18.1 Key Threatening Processes ..................... 26
3.18.2 Removal of Causeway at McCoys ............
Crossing ...................................................... 27
FUTURE DIRECTIONS ............................................ 27
3.19 Integrated Water Cycle Management ...........
Strategy ....................................................... 27
3.20 Estuary Managment Plan .......................... 27
3.21 Kempsey Shire Urban Stormwater ..............
Management Strategy ................................ 27
At a Glance ...................................................... 28
4.0 THE ATMOSPHERE .................................. 28
4.1 INTRODUCTION ........................................ 29
STATE ..................................................................... 29
4.2 Air Pollution ................................................. 29
4.3 GREEN HOUSE EFFECT ........................ 29
4.4 OZONE LAYER .......................................... 29
PRESSURE ................................................................ 30
4.5 Nuisance ..................................................... 30
4.6 Vehicle Emissions ...................................... 30
4.7 Burning Off .................................................. 30
4.8 Solid Fuel Stoves and Heating .................. 30
4.9 Agriculture ................................................... 30
4.10 Landfilling ..................................................... 30
4.11 Sewer Treatment Plants ............................ 31
4.12 Dust .............................................................. 31
4.13 Bushfires & other Emergency Situations . 31
RESPONSE ................................................................ 31
4.14 Landfilling ..................................................... 31
4.15 Sewer Treatment Plants ............................ 31
FUTURE DIRECTIONS ............................................ 31
At a Glance ...................................................... 32
5.0 BIODIVERSITY .......................................... 33
5.1 Introduction .................................................. 33
STATE ..................................................................... 42
5.2 Habitats within the Shire ............................ 33
5.2.1 Regional Corridors ..................................... 33
5.3 FLORA ........................................................ 33
5.3.1 General ........................................................ 33
5.3.2 Threatened and Rare Flora ....................... 34
5.4 FAUNA ........................................................ 35
5.4.1 General ........................................................ 35
5.4.2 Threatened Fauna ...................................... 35
5.4.3 Endangered Ecological Communities
and Populations .......................................... 36
5.4.4 Migratory Species ...................................... 36
PRESSURES ............................................................. 36
5.5 Land Clearing and Development .............. 36
5.5.1 Significant Development Proposals .......... 36
5.6 Feral Animals And Domestic Pets ............ 37
5.6.1 Feral Animals ............................................. 37
5.7 Exotic Plants ............................................... 37
5.8 Bushfire ....................................................... 38
5.9 Disease ....................................................... 38
RESPONSE ................................................................ 39
5.10 Vegetation and Habitat Management ........ 39
5.10.1 General Existing Management Measures 39
5.11 National Parks, Nature Reserves, State .....
Recreation Areas and Other Reserves ... 39
5.12 Assessments and Restoration Orders ..... 40
5.12.1 Threatened Species Assessments .......... 40
5.13 Exotic Animal Control ................................ 40
5.13.1 Vertebrate Pests ......................................... 40
5.13.2 Companion Animals Act 1998 .................. 40
5.14 Weed Management .................................... 40
5.14.1 Other Agency Weed Management ........... 41
5.17.2 Community Weed Management ............... 41
5.15 Bushfire Management ................................ 41
FUTURE DIRECTIONS ............................................ 41
5.16 Comprehensive Vegetation Mapping ....... 41
5.17 Nothern Rivers Catchment Management ....
Authority ...................................................... 41
5.17.1 Catchment Action Plan .............................. 42
5.18 Kempsey Shire Comprehensive
Koala Management Plan ............................ 42

State of the Environment Report 2005 - Supplementary 3
PRINTED ON 100% RECYCLED PAPER
State of the Environment Report 2005 - Supplementary 3
At a Glance ...................................................... 43
6 HUMAN SETTLEMENTS ......................... 44
6.1 Introduction .................................................. 44
STATE ..................................................................... 44
6.2 Population and Demographics .................. 44
6.2.1 Population Growth ...................................... 44
6.2.2 Population Distribution ................................ 44
6.2.3 Age Distribution ........................................... 44
6.2.4 Local Economy .......................................... 44
6.2.5 Income ......................................................... 45
6.2.6 Employment ................................................ 45
6.2.7 Unemployment Rates ................................ 45
6.3 Transport ..................................................... 45
6.4 Water & Sewage Treatment ...................... 46
6.4.1 Water Consumption .................................... 46
6.5 Waste ........................................................... 46
6.5.1 Solid Waste ................................................. 46
6.5.2 Recycling .................................................... 47
6.6 Stormwater .................................................. 47
PRESSURE ................................................................ 47
6.7 Population Growth ...................................... 47
6.8 Demographics ............................................. 47
6.9 Settlement Patterns ..................................... 47
6.10 Water Accessibility ..................................... 47
6.11 Drinking Water Quality ............................... 47
RESPONSE ................................................................ 47
6.12 Ecologically Sustainable Development Policy 47
6.13 Planning Controls ...................................... 47
6.14 Waste Management Strategy ................... 48
6.15 Urban Stormwater Management Plan ..... 48
6.16 Civic Maintenance Team ......................... 48
FUTURE DIRECTIONS ........................................... 48
6.17 ESD .............................................................. 48
6.18 Integrated Water Management .................. 48
6.19 South West Rocks Proposed
Reclaimed Water Scheme ........................ 48
6.20 Kerbside Recycling ................................... 48
At a Glance ..................................................... 49
7 ABORIGINAL AND NON-ABORIGINAL
HERITAGE .................................................................. 50
7.1 Introduction .................................................. 50
STATE ..................................................................... 50
7.2 Aboriginal Heritage ..................................... 50
7.2.1 Identified Aboriginal Sites, Structures
and Landscapes ........................................ 50
7.3 Non Aboriginal Heritage ............................ 50
7.3.1 Heritage Listed Sites, Structures and ..........
Landscapes ................................................ 50
PRESSURE ............................................................... 53
RESPONSE ............................................................... 53
7.4 Conservation and Planning Controls ...... 53
7.4.1 Protection for Aboriginal Heritage Sites ... 53
7.4.2 Protection for Post European Settlement ....
Heritage Sites ............................................. 53
FUTURE DIRECTIONS ........................................... 53
At a Glance ..................................................... 54
8.0 COUNCIL’S ENVIRONMENTAL ...............
PERFORMANCE ...................................... 55
8.1 Introduction .................................................. 55
STATE ..................................................................... 55
8.2 Energy Consumption ................................ 55
8.3 Water Consumption ................................... 55
8.4 Waste Generation ...................................... 55
8.5 Paper Usage .............................................. 56
8.6 Fuel Consumption ..................................... 56
PRESSURE ............................................................... 57
8.7 Budget ......................................................... 57
8.8 Community Concerns .............................. 57
RESPONSE ............................................................... 57
8.9 Environmental Levy Works Program ..... 57
8.10 Civic Maintenance .................................... 58
8.11 Local Agenda 21 Program ........................ 59
8.12 ESD - Triple Bottom Line Reporting ....... 59
8.13 Environmental Management -
KWR&DF ..................................................... 59
8.14 Recycled Content Purchasing Policy .... 59
FUTURE DIRECTIONS ........................................... 59
REFERENCES .......................................................... 60
LIST OF TABLES
Table 3.1: Major Vegetation Communities
and Their Extent Along the Macleay
River Estuary ............................................................ 18
Table 3.2: Shire STW Effluent Quality .................... 24
Table 3.3: Faecal Coliform Levels (CFU/100ml)
Selected Locations 2004/2005 ................................ 25
Table 3.4: Star Ratings for Selected Locations
2004/2005 ................................................................... 26
Table 4.1: Common Air Pollutants .......................... 29
Table 4.2: Air Pollution Complaints ......................... 30
Table 5.1: Threatened flora known or likely to
occur in the Shire ...................................................... 34
Table 5.2: Number of Fauna Species
Recorded in the Kempsey LGA 2004/2005 .......... 35
Table 5.3: Threatened Fauna Recorded in the
Kempsey LGA ........................................................... 35
Table 5.4: Endangered Ecological
Communities and Populations ................................. 36
Table 5.5: Area of Macleay under formal
conservation areas ................................................... 39
Table 6.1: Road Transport Infrastructure in
Kempsey. ................................................................... 46
Table 7.1: The number and Nature of Aboriginal
sites in the Kempsey Shire ..................................... 50
Table 7.2: Number of Non-Aboriginal
Heritage Sites in the Kempsey Shire ...................... 51
Table 8.1: Council Water Consumption ................. 55
Table 8.2: Councils Vehicle Fleet ........................... 56
Table 8.3: Kempsey Shire Council Budget
Summary ................................................................... 57
Table 8.4: Community Opinion on
Importance of Environmental Projects
to Gain Funding From Environmental Levy ........ 57
Table 8.5: Environmental Projects and
Environmental Levy ................................................. 58
Table 8.6: Compliance Register ............................ 104
LIST OF FIGURES
Figure 1 – Location Plan ............................................ 6
Figure 2 – Average Temperature and
Rainfall for Kempsey .................................................. 7
Figure 3 – Average Annual Rainfall for Selected
Stations Across Kempsey LGA ................................ 7
Figure 4 – Average Maximum and
Minimum Temperature Variation for
Kempsey and South West Rocks ........................... 7
Figure 5 – Projected population, Kempsey LGA,
2001 – 2031 ................................................................. 8
Figure 6 – The Area and Extent of Acid
Sulfate Soils ................................................................ 10
Figure 7 – Number and Value of Development
Applications ................................................................ 12
Figure 8 – Inland Waterway in the
Kempsey Shire LGA ................................................. 16
Figure 9 – Cumulative Annual Rainfall for
Kempsey .................................................................... 16
Figure 10 – Macleay River Flows ......................... 17
Figure 11 – 1:100 year Flood Zones for
the Macleay Catchment ........................................... 18
Figure 12 – Number of Reported
Fish Kills - 1977 to Present ..................................... 22
Figure 13 – Commercial Fish Catches ................. 22
Figure 14 – Population Growth with
Forecast ..................................................................... 44
Figure 15 – Population Distribution within
the Kempsey Shire (ABS, 2001) ............................. 44
Figure 16 – Age Distribution –Total Shire,
Mid North Coast and NSW ....................................... 44
Figure 17 – Weekly Household Income -
Kempsey Shire, Mid North Coast & NSW ............ 45
Figure 18 – Local and Regional Unemployment
Rates ..................................................................... 45
Figure 19 – Total Water Consumption .................... 46
Figure 20 – Volume of Waste to Landfill ................. 46
Figure 21 – Council Fuel Consumption
and Number of Vehicles ........................................... 56
PREPARED FOR KEMPSEY SHIRE COUNCIL BY:-
Nathan HegertyEcologically SustainableDevelopment Officer
Jenni ClarkeGraphic Designer

4 State of the Environment Report 2005 - Supplementary
1.0 TOWARDS SUSTAINABILITY
1.1 INTRODUCTION
The following Supplementary State of the Environment(SoE) Report has been prepared as an ancillary to the 2004Comprehensive SoE Report, for the Kempsey Shire LGAfor the period from 1 July 2004 to 30 June 2005, inaccordance with the requirements of the Local GovernmentAct (1993).
As highlighted in the 2004 Comprehensive SoE Report,Kempsey Shire Council formally adopted an EcologicallySustainable Development (ESD) Policy following the newlyelected Council in 2004. Through this policy Council madea commitment to adopting ESD principles in decision-making and to undertake a Local Agenda 21 program toassist Council in embracing ESD practices and fordeveloping Action Plans and ESD Performance Indicators.
The aim of this SoE Report is to provide an update on the
trends in environmental indicators of the core environmental
sectors; the land, water, atmosphere, biodiversity, human
settlements and aboriginal and non-aboriginal heritage.
While doing so the report will provide a “snapshot” of the
present day environment in Kempsey Shire with that of
previous years and identify any new environmental pressures
since the previous report.
1.2 OBJECTIVES
The objectives of the 2005 Supplementary State of theEnvironment Report are summarised as follows:
To provide a snapshot of the state of the environmentof the Kempsey Shire in the year 2004/2005 to enablemonitoring of Council and the communitiesperformance in moving towards sustainability.
To identify any new environmental pressures andcomment on trends in environmental indicators of thecore environmental sectors; the land, water, atmosphere,biodiversity, human settlements, aboriginal and non-aboriginal heritage.
To provide usable information and data to enable moreeffective environmental decision-making across alldepartments of Council.
To provide open and transparent accountability ofCouncil’s operations and environmental performance.
1.3 ECOLOGICALLY SUSTAINABLE DEVELOPMENT
Ecologically Sustainable Development (ESD) aims toprovide for the social and economic needs of thecommunity of Kempsey Shire, while protecting andenhancing the essential natural life processes for the benefitof future generations. Council is required to consider theprinciples of ESD in all of its activities as is outlined by theLocal Government Act 1993.

State of the Environment Report 2005 - Supplementary 5
PRINTED ON 100% RECYCLED PAPER
State of the Environment Report 2005 - Supplementary 5
LOCAL AGENDA 21 PROGRAM - UPDATE
Kempsey Shire Council has committed to
undertaking a Local Agenda 21 program.
Local Agenda 21 provides an operating framework
for all of Council’s operations and decision-making.
It is about visioning, integrating policy, promoting
innovation and establishing an Action Plan with
targets and goals for achieving sustainable
outcomes. Sustainability can be closely linked to
resource efficiency, cost management and
performance indicators. It involves Council looking
toward the future while considering the principles
of ESD.
In May 2005, Kempsey Shire Council finalised the
appointment of community representatives forming
part of the Agenda 21 team. The first meeting of
this Committee is scheduled for the end of
September 2005, with the objective of providing an
introductory session for all members of the
committee, involving a brief training workshop on
ESD Principles and examples of other Local Agenda
21 Programs. It is envisaged that this committee
will help guide the process of preparing an overall
ESD Strategy for the Shire.
1.4 TRIPLE BOTTOM LINE REPORTING
Kempsey Shire Council has adopted a Triple Bottom Linei.e. Environmental, Social and Economic, reporting templatefor all business paper reports. The aim of the template isto ensure that social, economic and environmentalconsiderations are duly addressed to enable informeddecision making for sustainable outcomes.
1.5 ENVIRONMENTAL MANAGEMENT
Following on from the 2004 Comprehensive State of theEnvironment Report, this year’s report aims to continue toestablish the document as an environmental managementand planning tool. As more data is collected and as thereport develops in coming years, it is envisaged the reportwill take a more strategic environmental focus that establishesperformance targets and goals for future years.
The Northern Rivers Catchment Management Authority(NRCMA), which incorporates the Kempsey Shire area, islargely responsible for the coordination and funding ofNatural Resource Management programs in the region. TheNRCMA is developing a Catchment Action Plan (CAP)for the Northern Rivers Region. The 10 year CAP willguide natural resource management across the Northern
Rivers Region. The CAP will build on the Northern Rivers,Upper North Coast and Mid North Coast CatchmentBlueprints that currently operate across the Northern RiversRegion. The NRCMA is currently conducting consultationon the Draft CAP to gain the northern rivers communitiesinput.
1.6 SOE REPORT STRUCTURE
In keeping consistent with the previous Comprehensive SoEReport, the structure of this Report has been organisedinto the following Chapters:
Chapter 1 – Towards Sustainability
Chapter 2 – The Land
Chapter 3 – Water
Chapter 4 – The Atmosphere
Chapter 5 – Biodiversity
Chapter 6 – Human Settlements
Chapter 7 – Aboriginal and Non-Aboriginal Heritage
Chapter 8 – Council Environmental Performance
All areas required by legislation have been incorporated intothe above headings. Each chapter addresses the State,Pressure and Response as required by NSW legislation andalso offers comments for Future Directions.
1.7 ENVIRONMENTAL INDICATORS
Following a similar reporting style to the 2004Comprehensive SoE Report, environmental indicatorspresented within this report will provide updatedinformation on environmental conditions and trends forthe Kempsey Shire LGA. These indicators include physical,chemical, biological and socio-economic measures of thenatural or built environment in order to assess naturalresources or environmental quality.
The indicators are presented with an explanation to whythey have been chosen and what they demonstrate. A basicconclusion regarding the current state of the indicator hasalso been included in the format provided below to enableongoing monitoring of performance for the indicator infuture State of the Environment Reports.
CONCLUSION: Situation Improving
Steady
Pressure Increasing

6 State of the Environment Report 2005 - Supplementary
1.8 ENVIRONMENTAL LEVY
The collection of an Environmental Levy continuedthroughout the 2004/2005 reporting period. Council firstimplemented the collection of an Environmental Levy in2003/2004, with the purpose of the Levy to supplement aportion of Council’s Environmental programs.
A summary of Council’s Environmental Works Programfor 2004/2005 and proposed future works are presentedin Section 8.11 (Chapter 8 – Councils EnvironmentalPerformance) of this report.
1.9 REGULATORY ENVIRONMENT
This Supplementary State of the Environment (SoE) reporthas been prepared by Kempsey Shire Council in accordancewith the requirements of the Local Government Act 1993and the Local Government (General) Regulation, taking intoaccount the 1997 amendments to the Act.
Figure 1 – Location Plan
1.10 REGIONAL SETTING
1.10.1Location
The Kempsey Shire Local Government Area (LGA) islocated on the Mid-North Coast of NSW, approximately450km north of Sydney and 550km south of Brisbane.Kempsey Shire covers a geographical area of 3,376km2
and is bounded by Nambucca Shire to the north, PortMacquarie Hastings Council to the south and the Walchaand Armidale Dumaresq Shires to the west. The MacleayRiver transects the Shire from west to east from high ruggedcountry at the eastern extent of the New England Tableland,through to the lower floodplain and discharging at thecoastal township of South West Rocks. While the majorityof the Shire is contained within the Macleay River catchmenta smaller area to the southeast drains into the Maria Rivercatchment.

State of the Environment Report 2005 - Supplementary 7
PRINTED ON 100% RECYCLED PAPER
State of the Environment Report 2005 - Supplementary 7
1.10.2Climate
The majority of the Kempsey Shire falls within the warmtemperate climatic zone, however, higher elevations (up to1560m) to the west experience a cooler temperate climate.The climate across Kempsey Shire is strongly influenced bythe range of elevations from sea level to the high country,the distance from the coast and the latitude.
INDICATOR – CLIMATE DATA
Why use this indicator?
Ongoing review of climate data sourced from the Bureauof Meteorology enables the identification of trends andany significant variations in weather patterns. Updated with2004/2005 data, Figure 2 provides the average rainfall andtemperature conditions from 1882 to date, as recorded inKempsey only.
Figure 2 – Average Temperature and Rainfall for
Kempsey
Source: BOM 2005
As recommended by the previous Comprehensive SoEReport, further data was reviewed from weather stationsfrom across the Shire in an attempt to provide a moredetailed picture of the Shire’s Climate. Figure 3 belowprovides mean annual rainfall for selected weather stationsacross the Shire and Figure 4 shows mean monthlymaximum and minimum temperatures for Kempsey andSouth West Rocks.
0.0
5.0
10.0
15.0
20.0
25.0
30.0
35.0
Januar
y
Febru
ary
Mar
chApril
May
June
July
August
Septe
mber
October
Novem
ber
Decem
ber
Tem
per
atu
re (
deg
rees
Cel
siu
s)
0.0
20.0
40.0
60.0
80.0
100.0
120.0
140.0
160.0
180.0
Mea
n M
on
thly
Rai
nfa
ll (
mm
)
Average Precip Average M in Temp Average M ax Temp
0.00
200.00
400.00
600.00
800.00
1000.00
1200.00
1400.00
1600.00
Millbank Bellbrook Kempsey CrescentHead
SWR
Selected Stations
Ave
rag
e A
nn
ual
Rai
nfa
ll (m
m
Figure 3 – Average Annual Rainfall for Selected
Stations Across Kempsey LGA
Source: BOM 2005
0.0
5.0
10.0
15.0
20.0
25.0
30.0
35.0
Janu
ary
Febru
ary
Mar
chApr
ilM
ayJu
ne July
Augus
t
Septe
mbe
r
Octobe
r
Novem
ber
Decem
ber
Month
Tem
per
atu
re (
deg
rees
Cel
ciu
s)
Kempsey Average Max TempKempsey Average Min TempSWR Average Max TempSWR Average Min Temp
Figure 4 – Average Maximum and Minimum
Temperature Variation for Kempsey and South West
Rocks
What does this show?
Approximately 60% of the average annual rainfall occursbetween the months of December to April with highestconcentrations usually between January and March.Temperature is strongly influenced by elevation with higherelevations experiencing considerable lower temperaturesduring winter months.
Figure 3 shows increasing rainfall towards the coast, withthe coastal towns of Crescent Head and South West Rocksexperiencing, on average, approximately 300 to 400 mmmore rainfall per year compared to the inland towns ofMillbank and Bellbrook. There also appears to be a trendof increasing rainfall from south to north across the Shire.
Temperature range also shows a subtle variation whencomparing that experienced on the coast (South West Rocks)and that experienced inland at Kempsey. As expected thedata shows that there is less variation between maximumand minimum temperatures on the coast, with South WestRocks, on average experiencing a 7.5oC variation intemperature, compared with an average 13oC variation forKempsey.
8 State of the Environment Report 2005 - Supplementary
CONCLUSION: Pressure Increasing
1.11 POPULATION
The population of Kempsey Shire from the ABS 2001statistics stands at 26,934. However, the estimated residentialpopulation (ERP) for the Kempsey LGA determined bythe then Planning NSW Department for 2001 was 27, 700.This figure was based on ABS census data, which wasadjusted to include people who live in Australia but werenot counted on census night. It also includes Australianresidents who were overseas at the time and excludesoverseas visitors. The estimated figure of 27,700 for 2001is higher than the actual figure of 26,934 (Basic CommunityProfiles) where overseas visitors have been included.
INDICATOR – POPULATION GROWTH
Why use this Indicator?
Population growth, including population distribution andmigration, combine with high-consumption patterns to putstress on the environment, through increased demandfor land resources and the need to increase infrastructurerequirements to support new and growinghuman settlements.
Figure 5 – Projected population, Kempsey LGA, 2001
– 2031
26,500
27,000
27,500
28,000
28,500
29,000
29,500
2001 2006 2011 2016 2021 2026 2031
Source DIPNR 2004
What does this show?
The population of the Kempsey LGA is predicted to growat a steady rate from 2001 to 2031, reaching just over 29,000in 2031. Population growth is expected to rise over thecoming decades as the area attracts retirees and othersseeking lifestyle changes or wishing to escape the pressureof living in Sydney and other larger urban centres.The coastal town of South West Rocks for example isexpected to experience rapid population growth in theKempsey Shire.
State of the Environment Report 2005 - Supplementary 9
PRINTED ON 100% RECYCLED PAPER
State of the Environment Report 2005 - Supplementary 9
GLANCEAt aTHE LAND
STATE PRESSURE RESPONSE FUTURE DIRECTIONS
Acid Sulphate Soils (ASS) – The lower Macleay flood plain is one of the most significant areas affected by ASS in NSW.
Aid Sulphate Soils Assessment – 11,275ha of low risk ASS and 47,556ha of high risk ASS occur in the Shire. There 364km of drains within the floodplain.
Acid Sulphate Soils Management – 2 ASS Hot Spot remedial projects have been completed and a 2 more are nearing completion in late 2005.
Remedial works undertaken during the reporting period included 30 floodgate and 19 drain modifications
ACID Sulphate Soils –The Second Stage of ASS remediation at Rafferty’s Drain is proposed to take place in 2005 and a funding application for $120,000 has been submitted to the NRCMA to address further acid sulfate soil problems within the Macleay Floodplain.
Land Use – No major change in land use zoning has occurred during the past 12 months.
Contaminated Sites – There are a number of known contaminated sites in the Shire including landfills, fuel depots, stock dips, sewer treatment plants, quarries and mine sites.
Environmentally Sensitive Land – there are 6,706ha of land zoned for protection within the Shire.
A further 313 ha of land in the shire was designated as wildlife refuges within the reporting period.
Development Pressure – Although, overall there has been a significant increase in development within the Shire over the last five years, a slight decrease in the number and value of development applications has been recorded in the past 12 months.
Land Degradation
Soil Erosion –resulting from continued land clearing for development and agriculture, ASS.
Agricultural Practices – can place increased pressure on land through the use chemical sprays, drainage of land, land clearing and inappropriate stock and crop management.
Planning Controls – LEP 2004 to supersede LEP 1987.
Rezoning – Potential rezoning of the former Shell Petroleum Terminal site, South West Rocks to residential land use. A Remediation Action Plan (RAP) has been developed for the site outlining requirements for remediation.
Comprehensive Vegetation Mapping – Kempsey Shire Council plans to undertake Comprehensive Vegetation Mapping in the 2005/2006 financial year.
Land Degradation Assessment – A land degradation assessment is needed to affectively manage this issue.

10 State of the Environment Report 2005 - Supplementary
2.0 THE LAND
2.1 INTRODUCTION
Land development within the Kempsey Shire is puttingincreasing pressure on land resources within parts of theShire. The land is a fundamental part of ecological systemsand is essential to sustaining human existence.
S T A T E
What are the issues for sustainability that are
affecting the Land?
2.2 TOPOGRAPHY
The Kempsey Shire experiences varied topography, rangingfrom the upper reaches of the New England Tablelands(approx. 900-1200m elevation) to the west and easternescarpment gorge country, traversing down to rugged hillcountry, lower hill country and extensive floodplains to theeast. The coastal fringe is characterised by dunefields,estuaries and some elevated headlands.
2.3 SOILS AND GEOLOGY
The general geology is characterised by Carboniferous andPermian rocks of the Hastings Block to the south andKempsey and Nambucca Beds to the north. Soils rangefrom fluvial sediments in the floodplain of the MacleayRiver, including acidic clays, which are dispersive when wetand sometimes sodic, to strongly structured clays soils withlow texture contrast originating from the Tertiary basicvolcanics in the upper reaches of the valley (DWLC 2000).
Refer to the 2004 Comprehensive SoE Report for a moredetailed description of the geology underlaying theKempsey Shire.
2.4 VEGETATION
The Shire has a significant amount and wide range ofvegetative cover due to the large areas of National Parksand State Forests. Vegetation types within the KempseyShire LGA are discussed in detail Chapter 5 – Biodiversity.
2.5 ACID SULFATE SOILS
Acid Sulfate Soils (ASS) are natural soils that form inseawater or brackish water environments. They arecommon in every estuary and estuarine floodplain in NSW.These soils contain iron sulfides that are stable and do notcause a problem when waterlogged. However, when thesenatural occurring sulfides are disturbed and exposed to air,oxidation occurs and sulfuric acid is ultimately produced.This acid can leach into the surrounding area acidifying
neighbouring drains, wetlands, creeks, estuaries and bays,causing severe short and long-term environmental damage.It can affect industries such as fishing and tourism, and canimpact on public and private infrastructure by causing seriousdamage to steel and concrete structures such as thefoundations (footings) of a building, floodgate structuresor bridge pillars (LMCC 2005).
INDICATOR – The Extent And Location Of Acid
Sulfate Soils
Why use this indicator?
It is important to identify the presence of potential ASS toensure any proposed future development does not havethe potential to cause acid generation and runoff.
Figure 6 – The Area and Extent of Acid Sulfate Soils
What does this show?
There are approximately 11,275ha (3.34% of KempseyShire) of low risk ASS and approximately 47,456ha (14.06%of Kempsey Shire) of High Risk ASS.

State of the Environment Report 2005 - Supplementary 11
PRINTED ON 100% RECYCLED PAPER
State of the Environment Report 2005 - Supplementary 11
2.6 LAND USE
INDICATOR – Land Use Zoning
Why use this indicator?
Varying land uses will have differing impacts on the naturalenvironment. Due to the difficulty in accurately identifyingactual land usage, land use zoning is used as a measure ofallowable potential land uses.
What does this Show?
No major change in land use zoning has occurred duringthe past 12 months. However as indicated in the previousComprehensive SoE Report, land use zoning changedsignificantly from the Kempsey LEP 1987 to the draftKempsey LEP 2005, with increases in land uses associatedwith human settlement and significantly more areasdedicated to National Parks and Nature Reserves.
However there are a number of environmental studies inpreparation that are expected to result in rezoning of landfrom 1(d) Urban Investigation to a combination of urbanzones and possibly environmental protection zones. Councilhas commissioned consultants to undertake preparation oftwo Local Environmental Studies (LES) to facilitate therezoning of land at Saltwater and the former Shell petroleumterminal site, South West Rocks. Council has providedcomments to the consultants on both projects with finalsubmission of both reports by the end of 2005, and publicexhibition of each LES in early 2006. A LocalEnvironmental Plan (LEP) will be developed for each siteto manage the sensitive environmental characteristics of thelandscape to which these sites form part.
Preliminary investigations have also begun for the SouthKempsey industrial land rezoning project, which proposesto rezone land from 1(d) Urban Investigation and 1(a1)Rural to 4(a) Industrial General (175ha), to accommodatethe need for further industrial development in the Shire.
2.7 CONTAMINATED LAND
INDICATOR – Contaminated Sites
Why use this indicator?
Information about sites where regulatory action involvingthe NSW EPA has been taken is compiled on a databasekept by the Authority. These sites fall into three categories:
Sites regulated under the Contaminated LandManagement Act 1997;
Sites which are, or were formerly, the subject of noticesissued under sections 35 & 36 of the EnvironmentallyHazardous Chemicals Act 1985; and
Land declared to be unhealthy building land, or beinginvestigated for declaration, under the Unhealthy BuildingLand Act 1990.
Council is also required to identify contaminated lands underSection 79C of the Environmental Planning and AssessmentAct 1979.
What does this show?
As of the 2003/2004 reporting period no sites had beenformally listed as contaminated by the NSW EPA. Updateddata for this reporting period (2004/2005) was not availableat the time of preparation of this report.
No new potentially contaminated sites or unhealthy buildingland were identified within the Kempsey Shire LGA duringthis reporting period. However the previousComprehensive SoE Report indicated that there are anumber of known potentially contaminated sites andunhealthy Building Land in the Kempsey Shire LGAincluding, but not limited to: landfills, fuel depots, stockdips, sewer treatment plants, quarries and mine sites.
2.8 ENVIRONMENTALLY SENSITIVE LAND
There are currently 6,706ha of land within an EnvironmentalProtection Zone (Zones 7(a), 7(d), 7(f1), 7(f2) and 7(h)).Land included in this zoning includes wetlands, scenicprotection, coastal lands and historic lands. Developmentin these zonings is restricted to ensure that any proposeddevelopments do not impact on these sensitiveenvironments.
P R E S S U R E SWhy is it happening?
2.9 DEVELOPMENT PRESSURES
Development pressures impact on all aspects of theenvironment. As populations grow the demand for landand water resources and infrastructure subsequently increases.The growth of human settlement (eg. via subdivision ofland) often displaces other land uses such as nativevegetation, open space or valuable agricultural land.Construction and building place pressure on mineralresources, whilst increasing the potential for degradationof soils though poor management practices. Growingcommunities also increase the output of wastes, placingpressure on water resources and sanitation systems.
INDICATOR – Development Applications
Why use this indicator?

12 State of the Environment Report 2005 - Supplementary
This indicator provides a measure of the pressures ofdevelopment within the Kempsey LGA.
0
100
200
300
400
500
600
700
800
900
2000
/200
1
2001
/200
2
2002
/200
3
2003
/200
4
2004
/200
5
Financial Year
No
. Dev
elo
pm
ent
Ap
pli
cati
on
s A
pp
rove
d
0
10,000,000
20,000,000
30,000,000
40,000,000
50,000,000
60,000,000
70,000,000
80,000,000
90,000,000
100,000,000
Val
ue
($)
No. Approved
Value $
CONCLUSION: Pressure Increasing
What does this show?
This indicator demonstrates that there has been a significantincrease in development up until the period ending 30 June2004. A decrease in the number of developmentapplications being approved and associated reduction inthe value has been experienced over the past 12 months.Although these figures show development pressure taperingoff during the past 12 months, the overall trend indicatesan increase in development pressure, with number and valueof development applications for the last financial year stillconsiderably higher than that just 5 years earlier.
2.9.1 Land Clearing
INDICATOR – Land Clearing
Detailed in Section 5.4 of this report.
2.9.2 Rural Residential Development
INDICATOR – Rural Residential Development Rates
Why use this indicator?
Rural residential development (small rural acreages) is listedas a regional indicator. This type of development isconsidered a pressure as it fragments and modifies naturalhabitat (eg. via loss of understorey for firebreaks etc.), thusadding to the cumulative effect of habitat loss andmodification.
Under Kempsey LEP 2004, zones 1(c) and 1 (g) allow forrural residential development
What does this show?
Rural subdivision data for the 2004/2005 reporting period,indicated that 29 rural properties, containing an average of2 lots were subdivided to an average 4 lots. More specificallythe data showed that of 66 existing lots, 112 lots werecreated, with a net creation of 56 additional lots. Thisindicates a substantial area of rural land has beentransformed into a greater number of smaller rural acreages,further modifying and fragmenting habitats.
2.10 LAND DEGRADATION
Land degradation is the decline in the condition or qualityof land as a result of its use by individuals or society. Somecommon forms of land degradation include: soil erosion,rising water tables, invasion of introduced and feral species,declining soil fertility due to acidification or salinisation, andAcid Sulfate Soils. The full extent or nature of landdegradation in the Kempsey Shire LGA is still yet to befully quantified.
Acid Sulfate Soils (ASS) are the most significant landdegradation issue in the Kempsey Shire, which impact notonly on land and agricultural production, but also on aquaticsystems and biodiversity.
2.10.1Acid Sulfate Soils
The NSW Acid Sulfate Soil (ASS) Strategy identified twoStage 1 Acid Soil Hot Spots in the Kempsey Shire area,Clybucca and Upper Maria River, and five Stage 2 AcidSoil Hot Spots Yarrahapinni, Belmore, Frogmore, Kinchelaand Rafferty’s. Hot Spot areas are areas where landmanagement decisions in relation to ASS have contributedto, and can lead to further, severe soil acidification, poorwater quality, reduction in agricultural productivity andcapability, loss of estuarine habitat and/or degradedvegetation and wildlife (Tulau et al 1999).
Within the floodplain areas in Kempsey Shire there is over364km of drains, of which 94.5km is managed by Counciland 52km is jointly managed between Council and privatelandholders or drainage unions. Council also owns 173floodgates within the drainage system and there are anunknown number of privately owned floodgates.
2.10.2 Agricultural Practices
The Kempsey Shire has had a long association with variousagricultural practices throughout the history of the Shire.Agriculture has historically contributed a considerable
CONCLUSION: Pressure Increasing
Figure 7 – Number and Value of Development
Applications

State of the Environment Report 2005 - Supplementary 13
PRINTED ON 100% RECYCLED PAPER
State of the Environment Report 2005 - Supplementary 13
amount of the Shire’s income. For example, total farmgate value from agriculture in 2001 was $A 24.8M (ABS2001) However, agriculture has also had a considerableimpact on the environment including those associated withland clearing, chemical and pesticide use, weed introductionand drainage of lands.
The most intensive form of agriculture in the Shire is dairyfarming. Dairy farming has become increasingly intensivein order to compete with interstate and overseas producers.
2.10.3Extractive Industries
Quarrying is largely undertaken to provide resource for roadbase and construction needs. An increasing population willplace increased pressure on the environment due to thesubsequent need for more raw materials. Extractiveindustries have a significant impact on land resources aslandform is transformed, vegetation removed and soil androck is displaced from the natural state.
R E S P O N S EWhat are the responses and how effective are they?
2.11 PLANNING CONTROLS
Council regulates development in accordance with relevantlegislation and the land zoning in the Kempsey LEP. Councilundertakes regular and periodic review of LEPs as arequirement under Section 73 of the EnvironmentalPlanning and Assessment Act. The Kempsey LEP 1987 issoon to be replaced, following state approval, withKempsey LEP 2005, which incorporates new planningcontrols and practices.
2.12 ACID SULFATE SOILS MANAGEMENT
2.12.1Existing Projects
Maria Floodplain Project
The Maria Floodplain Project was an extension of theConnection Creek-Upper Maria Acid Sulfate Soils Hot SpotProject, but also incorporated landholders from the PipersCreek area. Works completed included the installation ofa culvert system that incorporated drop-boards to allowthe landholder to maintain higher water levels within aformer lagoon. Preparation for the installation of twofurther water control structures at other sites has alsocommenced.
Upper Belmore River Backswamp Project
The purpose of this project is to address the over-drainageof a backswamp region within the Upper Belmore Riverarea. The project’s methods will be based on those adopted
from other similar projects undertaken. The aim is toposition water retention structure at a strategic location onthe Sillitoe’s and Thurgood Drains to reduce over-drainageand provide for a mechanism to deliver water into the area.
Floodgate Modifications
An auto-tidal floodgate was installed at the Saltwater Inletfloodgates to allow a limited tidal exchange upstream ofthe floodgates to improve water quality and fish passage.
Acid Scald Revegetation
Funding from the Wetland and Drains Voluntary ProjectFund was obtained for the fencing of two acid scald siteslocated at Kinchela and Belmore to restrict stock accessand assist revegetation. Acid scald revegetation works atClybucca that commenced in 2004 have now had significantresults with areas of scalding being reduced by more than40%.
INDICATOR – Number of ASS Remedial Projects
undertaken on Floodplain Drainage Systems
Why use this indicator?
There are approximately 115 floodplain drainage systemsthat discharge into waterways within the KSC area. Theyare in varying conditions and dimensions with 52 managedby KSC, 7 jointly managed and 56 privately managed. 105of the drains are situated in High Risk ASS landscapes,although not all drains require ASS remediation works.
What does it show?
Remedial works to the end of June 2005 included 30floodgate and 19 drain modifications using external andinternal funding. These works have included installation offloodgate lifting devices, placing windows withinfloodgates, installing water control structures in drains toraise drain water levels and drain reshaping to reduce acidgroundwater drainage. Further remediation projects arecontinuing but are always dependant on landholder support.
2.13 CONTAMINATED LAND REMEDIATION
Former Shell Petroleum Terminal – Phillip Drive,South West Rocks
Council is currently involved in assessing the potential forthe former Shell Petroleum Terminal Site, located alongPhillip Drive, South West Rocks, to be rezoned forresidential land use. Part of this rezoning process requires
CONCLUSION: Situation Improving

14 State of the Environment Report 2005 - Supplementary
an assessment of the current condition of the site andproposed remediation measures in regards to any potentialcontamination resulting from the site’s previous land use asfuel depot. The proponent has commissioned a consultantto prepare a Remediation Action Plan (RAP), which outlinedthe requirements for the site to be remediated sufficientlyto allow for residential land use. Likely remediation optionsinclude excavation of contaminated surface soils and on-site treatment and/or offsite disposal to appropriatelylicensed landfill.
F U T U R E D I R E C T I O N SWhat more could be done?
2.14 ACID SULFATE SOILS - PROPOSEDPROJECTS
Rafferty’s Drain
The Second Stage of the Rafferty’s Drain project willcommence in the later half on 2005 and will involvedecommissioning of 3km of the former deep drain. Anew shallow environmentally sensitive design will replacethe old drain and reduce ground water discharge andgenerally improve water quality emanating from the Raffertydrainage area.
Coastal Floodplain and Acid Sulfate SoilManagement Project
A funding application for $120,000 has been submitted tothe Northern Rivers Catchment Management Authority(NRCMA) to address further acid sulfate soil problemswithin the Macleay Floodplain. Discussions and meetingwith landholders in the Belmore and Kinchela areas havecommenced in preparation for this project.
2.15 COMPREHENSIVE VEGETATIONMAPPING
Council has allocated funding for the 2005/2006 financialyear to commence comprehensive vegetation mapping ofthe Kempsey Shire. This will enable improved decisionmaking with regard to achieving ecologically sustainabledevelopment.
2.16 LAND DEGRADATION ASSESSMENT
A comprehensive Land Degradation Assessment shouldbe undertaken to gain a better understanding of thecondition of land resources within the Kempsey Shire. Thiswill enable better short and long term planning for the Shire.

State of the Environment Report 2005 - Supplementary 15
PRINTED ON 100% RECYCLED PAPER
State of the Environment Report 2005 - Supplementary 15
GLANCEAt aTHE WATER
STATE PRESSURE RESPONSE FUTURE DIRECTIONS
Inland Waters
Rainfall/Riverflow –Total rainfall was less than the long-term average in 2004 and the data up until the end of June 2005 suggests a similar trend. This was also reflected in low river flows.
NRCMA Catchment Action Plan (CAP) – The 10 year CAP will guide natural resource management across the Northern rivers Region
River Health – based on macroinvertebrate assemblages the inland waterways in the Shire are generally classified as in good condition, with the exception of Christmas Creek (very poor) and Dungay Creek (poor).
Integrated Water Cycle Management Strategy (IWCMS) – Ongoing review will take place over the coming years, incorporating planning and management of the three main urban water services of water supply, sewerage and stormwater.
Flooding – the most recent significant flooding event occurred in March of 2001.
Riparian Vegetation – 16 vegetation communities have been identified along the riparian zones of the Macleay River.
Water Pollution –
• On-Site Sewer Management;
• Stormwater;
• Agricultural Practices.
Riparian Disturbance
• 66.9% or 232 km having a HIGH degree of disturbance;
• 13.8% or 48 km considered to be INTACT;
• 10.1% or 35 km having a LOW degree of disturbance;
• 9.1 % or 31.6km of the vegetation varying in disturbance from LOW -MODERATE disturbance levels.
Groundwater Borefield Assessment – was undertaken to assist in ensuring sustainable extraction
Stormwater Management – Installation of various stormwater quality improvement devices.
Pollution Reduction Programs (PRP) – Council is undertaking PRPs for West Kempsey STP. A further PRP relating to the Reticulation Overflow Report, is being undertaken on South West Rocks and Crescent Head systems with the remaining systems to be addressed in later 2005 and 2006.
Kempsey Shire Urban Stormwater Management Strategy – Action Plans provide the direction for future planning, education and infrastructure.
Coastal Creeks and Estuaries
Estuarine Habitats – the Macleay Estuary Waterway is approx. 13km2. The lower Macleay (as of 1984) contained 5% of the state Mangrove habitat.
NRCMA Catchment Action Plan – (as above)
Coastal Wetlands – there are over 150km2 of coastal wetlands in the Shire.
Integrated Water Management Strategy– (as above)
Kempsey Shire Urban Stormwater Management Strategy– (as above) Beach Habitats – there is
approx. 80km of coastline forming the eastern boundary of the Shire.
Acid Sulphate Soils – have the potential to result in sulphuric acid leaching into waterways.
Recreational Users – the Shire offers a wide range of aquatic activities.
Fishing and Fish Kills – No fish kills were recorded during this reporting period, however, an increasing trend in the number of fish kills in the Kempsey LGA has been experienced from 1977 to present.
Beach watch – Faecal sampling at 4 locations
Waterway and Wetland Protection and
Rehabilitation Projects
Fisheries and Aquaculture Management
Macleay River Estuary Management Compilation Study
Estuary Management Plan

16 State of the Environment Report 2005 - Supplementary
3.0 WATER
3.1 INTRODUCTION
Water is essential to human life and to the health of theenvironment. It is a valuable natural resource, encompassingmarine, estuarine, freshwater (river and lakes) andgroundwater environments, across coastal and inland areas(NSW EPA 2005). Water resources are crucial for sustainingcommunities, agriculture, industry and most importantly theenvironment. Water has two dimensions that are closelylinked - quantity and quality. This chapter of the SoERaims to bring together information about surface waterand groundwater quality and usage to enable a betterunderstanding of the condition of the aquatic environmentin the Kempsey Shire LGA.
S T A T EWhat are the issues for sustainability? And how are
they changing?
3.2 INLAND WATERS
The majority of the Kempsey Shire is contained within theMacleay River catchment, with the exception of south-eastern corner of the Shire, which drains to the HastingRiver Catchment. There are many sub-catchments thatdrain into these main catchments as is demonstrated onFigure 8 below.
Figure 8 – Inland
Waterway in the
Kempsey Shire LGA
3.2.1 Rainfall
INDICATOR – Cumulative Rainfall
Why use this indicator?
The cumulative annual rainfall gives an indication of rainfalltrends, which can be compared to the long-term averagerainfall. This can be used to identify unusually high or lowrainfall years and spikes relating to significant rainfall periods.
0
200
400
600
800
1000
1200
1400
Jan
Feb Mar Apr
May Ju
n Jul
Aug Sep OctNov Dec
MonthC
um
ula
tive
Rai
nfa
ll (m
m)
Average
2001
2002
2003
2004
2005
Figure 9 – Cumulative Annual Rainfall for Kempsey
What this shows:
The cumulative rainfalls for Kempsey generally indicatessteady to heavy rainfall events through the early part of theyear, up until June, when monthly rainfall totals decreasethrough the winter months, extending into September.From October through to December monthly rainfall totalsincrease once again reflecting spring and early summerstorms.
This data also indicates that total rainfall was less than thelong-term average in 2001, 2002, 2003 and 2004, which isconsistent with draught conditions, experienced in otherareas during this time. The data up until the end of June2005 suggests a similar trend. The noted peak, above thelong-term average, in March 2001 is consistent with theflood event that occurred during this period.
3.2.2 River Flows
INDICATOR – Macleay River Flow
Why use this indicator?
The upper Macleay River flow monitoring data was chosenas an indicator to identify trends that may assist in themanagement of water resources drawn from the river. Thedata is presented on a logarithmic scale to enable the fullrange of flows to be more easily viewed.
CONCLUSION: Pressure Increasing

State of the Environment Report 2005 - Supplementary 17
PRINTED ON 100% RECYCLED PAPER
State of the Environment Report 2005 - Supplementary 17
10
1000
100000
1-Ja
n
1-F
eb
1-M
ar
1-A
pr
1-M
ay
1-Ju
n
1-Ju
l
1-A
ug
1-S
ep
1-O
ct
1-N
ov
1-D
ecDate
Flo
w M
L/D
ay
2005 Flow s 2004 Flow s 2003 Flow s
Figure 10 – Macleay River Flows
Source Macleay Water 2005
What this shows:
River Flow data is consistent with the cumulative rainfalldata. A considerable decrease in flow rates is noted duringthe early part of February 2003. Flow rates up to June2005 show a steady to slightly decreasing trend.
3.2.3 Water Quality
Water quality is commonly defined by its physical, chemical,biological and aesthetic (appearance and smell)characteristics. The quality of water in waterways andgroundwater are generally dependant on the activitiesundertaken in the catchment. Water resources are of majorenvironmental, social and economic value to the KempseyShire and if water quality becomes degraded this resourcewill lose its value. Effective management of water qualityneeds to ensure a sustainable supply of water is availablefor productive and recreational purposes, while sustainingaquatic ecosystems. Therefore, a whole of catchmentapproach is required to achieve sustainable water cyclemanagement.
Water for the Kempsey District Water Supply Scheme isextracted from wells located in alluvial flats adjacent to theMacleay River at Sherwood, and wells immediately next tothe river at Belgrave Falls. Drinking water sources are testedregularly for a variety of potential pollutants. The Kempseysupply is of relatively good quality and generally requiresonly basic treatment.
INDICATOR – River Health (Macleay Catchment)
Why use this indicator?
The importance of using biological criteria, or indicators,to assess the health of aquatic ecosystems, and in general
the need to adopt an ecosystem health perspective inmonitoring and managing our rivers, is increasingly beingrecognised. Aquatic ecosystem health is a much broaderconcept than simple water quality: it aims at a balanced,adaptive community of organisms having a speciescomposition, diversity and functional organisationcomparable to that of natural, or pristine, habitats of theregion.
The NSW EPA assessed the ecological health of runningwaters in 2004, using an interactive computer package,AusRivAS. This package outputs for samples collected fromdifferent stream habitats, and different seasons, at a streamsite, which are used together to provide a more completepicture of the condition of macroinvertebrate communitieswithin the stream at that location. (NSW EPA, 2004)
What this shows:
The data suggested that the overall health of the creek andrivers in the Macleay catchment is quite good, comprising awide diversity and assemblage of macro invertebrates incomparison to ‘pristine’ reference conditions. Two notableexceptions were Christmas Creek (very poor) and DungayCreek (poor). The 2004 Comprehensive SoE Reportprovides a full list of the creeks and rivers assessed withinthe Kempsey LGA and their rating. No updatedinformation regarding ecological health of running waterswas available from NSW EPA for inclusion into this SoEReport.
3.2.4 Flooding
Flooding upstream of Kempsey is confined to areas closeto the river and its tributaries though in the more severeevents quite large areas can be inundated in the Temagog,Mooneba, Sherwood, Turners Flat, Dondingalong andEuroka areas. Much larger areas downstream of Kempseyare liable to flooding. During flood episodes, backwaterflows up the tributary creeks and drains begin to fill theswamps. In larger events, flows also occur over theriverbanks, which in some areas have been augmented bylevee building. The most recent significant flood event inrecent times occurred in March 2001.
CONCLUSION: Steady

18 State of the Environment Report 2005 - Supplementary
The 1:100 year flood zone is shown of Figure 11 below.
Figure 11 – 1:100 year Flood
Zones for the Macleay Catchment
3.2.5 Riparian Vegetation
Riparian vegetation is vegetation on land that adjoins, directlyinfluences or is influenced by, a body of water (NSWFisheries 2005) Riparian vegetation plays an important rolein stabilising the banks of watercourses, providing floraand fauna habitat and filtering out pollutants.
Vegetation Type Length of Riparian
Zone (km)
% of total length of riparian Zone
surveyed
Mangrove Forest and Woodland 81.3 23.4 Maritime Rush and Sand Couch 7.2 2.07 Headland Brushbox 5.5 1.58 River Oak 4.7 1.36 Myrtle – degraded 4.7 1.36 Samphire – Sand Couch 4.1 1.19 Sand-hill Black-butt 4.1 1.17 Tuckeroo 3.9 1.11 Banksia 3.6 1.03 Swamp Oak 1.2 0.34 Grey Gum – Grey Ironbark 0.7 0.21 Brush Box 0.7 0.19 Improved Pasture and Cropland 207.3 59.74 Introduced Scrub 4.9 1.39 Cleared and Partially Cleared 3.3 0.95 Settlements and Roads 2.1 0.6 Breakwall 12.5 3.6 TOTAL 347.1
The draft Macleay River Estuary Data Compilation Study,completed in June 2005, identified 16 vegetationcommunities occurring along the riparian zones of theMacleay River from Belgrave Falls upstream of Kempseyto the entrance into the Ocean at South West Rocks. Table3.1 below summarises the vegetation communities and theirextent along the riparian zone of the Macleay.
3.2.6 Aquatic Habitat
Freshwater systems provide a diverse range of habitats. Thetype of habitat and suitability for different types of faunais dependant on channel substrate, plants, woody debris,water depth, flow velocity and light infiltration.
There has not been a comprehensive survey of fish andaquatic invertebrates within the Macleay catchment.However, surveys have indicted that up to 53 of the 82fish species identified in NSW fresh waters are known tooccupy the north coast drainages, although not necessarilythe Macleay and its tributaries. Approximately 60 speciesof birds and numerous reptiles, animals and frogs occupyor facilitate aquatic habitats in the Macleay.
3.2.7 Groundwater
The Kempsey Shire has two main sources of groundwater:the Macleay River Alluvium and the Macleay Coastal Sands.The Macleay River Alluvium (MRA) is a groundwater sourcelinked to the flow of water in the Macleay River. The amount
Table 3.1: Major Vegetation Communities and Their
Extent Along the Macleay River Estuary
Source GECO Environmental 2005

State of the Environment Report 2005 - Supplementary 19
PRINTED ON 100% RECYCLED PAPER
State of the Environment Report 2005 - Supplementary 19
of water stored in the MRA above Belgrave Falls is small.However, the water available is increased by rain fallingover the aquifer and the recharge (causing water from theriver to flow over the sands of the aquifer) of the alluviumwith river water.
The Macleay Coastal Sands (MCS) are a fresh groundwatersource in the sands below the coastal dune system. Thewater stored in these dunes is recharged by rainfall. Thesefresh water sources are bordered by salty seawater.
3.3 COASTAL WETLANDS, ESTUARIES ANDOCEAN
3.3.1 Estuarine Habitats
The Macleay River estuary waterway occupies approximately18.2 km2 in total area. In 1985 there was 5.201 km2 ofmangrove habitat in the Macleay Estuary, which representedapproximately 5% of estuarine mangrove habitat in NSW.Other estuarine habitats included, 1.097 km2 of seagrass(Zosteraceae family) and 3.652 km2 of saltmarsh. Theestuarine system of Korogoro Creek at Hat Head also hasmangroves, but the extent has not been mapped due itssmall size.
The present extent of these communities has not been ableto be ascertained for this report.
3.3.2 Coastal Wetlands
The Macleay has over 150 km2 of wetlands on thefloodplain, mainly in the Clybucca, South West Rocks,Belmore-Kinchela and Crescent Head areas. SEPP 14wetlands account for 12,951ha of the Kempsey Shire LGA.
The Clybucca Estuary (including the YarrahapinniBroadwater), Belmore swamps and Kinchela swamps arelisted in the Directory of Important Wetlands in Australia (ANCA1996). Significant wetlands are also located in Hat HeadNational Park in dune hind-swamps. Goolawah Lagoon isalso listed as being required to have “Significant Protection”under the Coastal Lakes Strategy (CLS): An Assessment andManagement Framework (2002).
3.3.3 Beach Habitats
The Macleay Valley has approximately 80km of coastlineof which most is beaches extending from south of CrescentHead and north to Grassy Head.
Naturally occurring beach ecosystems are dynamic andconsist of tidal zones, fore dune and hind dune areas. Dunalareas are critical for the protection of beaches, as theyprovide natural ‘buffer zones’ that reduce the impact offluctuations of the shoreline and erosion by the sea. Nativedunal vegetation can provide a significant refuge and sourceof food for local and migratory fauna species.
Many beach habitats across the Macleay Valley coastline havebeen impacted on by the activities of humans. Such activitiesinclude recreational use, establishment of environmentallyinappropriate exotic vegetation, roads, car parks, beachaccess tracks, and mining.
P R E S S U R EWhy is it happening?
3.4 SURFACE WATER EXTRACTION
The extraction of surface water for agricultural, industrialand domestic purposes occurs within the MacleayCatchment. This can place stress on creek and rivers andaquatic ecosystems, particularly during periods of lowrainfall where flows are dramatically reduced.
Updated data regarding surface water licensing was notavailable from the Department of Natural Resources(DNR) at the time of reporting.
INDICATOR – Town Water Consumption
This indicator provides a measure of the pressure on theMacleay Catchments water resources.
See Chapter 6.0 - Human Settlements
3.5 GROUNDWATER EXTRACTION
Water for the Kempsey District Water Scheme is extractedfrom the bores located in the alluvial flats adjacent to MacleayRiver, and from near the river at Bellbrook. This suppliesKempsey and surrounds, Bellbrook, Willawarrin,Frederickton, Smithtown, Gladstone, Clybucca, Kinchela,Belmore River and contingent rural areas.
Water is also extracted from borefields located in coastaldunal areas to supply the coastal townships of South WestRocks, Crescent Head, Stuarts Point and Hat Head.
Updated data regarding groundwater extraction licensingwas not available from DNR at the time of reporting.
3.6 WATER POLLUTION
Water quality of aquatic ecosystems in the region is subjectto degradation from both point source and non-pointsource pollution. The input of chemicals, nutrients,suspended solids, and rubbish into waterways are the mainfactors effecting aquatic ecosystems. Practices and systemsdirectly affecting water quality include:
CONCLUSION: Steady

20 State of the Environment Report 2005 - Supplementary
3.6.1 Sewage Discharges
Leaks in sewage pipes and insufficient treatment of sewagewaters can have the potential to cause delivery of nutrientsand faecal coliform either directly or indirectly intogroundwater or waterways.
During the reporting period Macleay Water submittedEffluent Management Strategies (EMS) for the WestKempsey and Crescent Head Sewerage Treatment Plants(STP) addressing two of the three Pollution ReductionPrograms (PRP) prompted by the NSW EPA in 2004.
Following on from the above, another draft PRP wascreated for an effluent reuse market assessment for WestKempsey STP to identify and bring into operation effluentreuse opportunities in accordance with the followingprogram:
Stage 1 – Submission of a report which identifiesspecific reuse opportunities and short lists interested landowners – December 2005; and
Stage 2 – Submission of a report which detailsrecommended reuse options, including their conceptdesign, costing and confirmation of land owner interest– June 2006
The third PRP required by the NSW EPA in 2004 wasmore general and applied to all centralised sewerage licenceholders and required Council to prepare a Sewage OverflowInvestigations Report for its reticulation networks. The aimof this report was to determine the risk of pollution enteringthe environment from Council sewerage mains and pump-stations. During the reporting period, Council completedthe appropriate studies for the South West Rocks andCrescent Head STP and are currently in the process ofcompleting the studies for South Kempsey and WestKempsey STP. Once finalised, the report will serve as aprecursor to the future sewerage licensing system wherethe entire sewerage system will be licensed rather thanindividual STPs.
INDICATOR – EPA Licensed Point Source
Discharges
Why use this indicator?
The number of point source discharges is an acceptedregional indicator. This provides information on the numberand location of point source discharges and identifiesactivities that can have potential adverse effects on naturalaquatic environment systems.
What this Shows?
At the time of reporting, NSW EPA did not have up todate licensing information available. However, as of 2001,
the NSW EPA, licensed 19 point source discharges,including 7 Council operated STP, 4 other council operatedfacilities (such as the Crescent Head Road Landfill Site andStuart McIntyre Dam) and 8 privately owned operations.
3.6.2 On-Site Sewer Management
The On-site Sewer Management Strategy involved a systemof assessment of areas with a high density of systems.Approvals from these inspections have generally been fora limited period of up to a 3 - 4 years and subsequentlyrequire re-submission. The current strategy implementationis focused on the assessment of systems in higher risk areasthat have not yet been assessed. Another focus is on thefacilitation of noncompliant system remediation.
INDICATOR – On-site Sewer Management (OSM) -
Number and Compliance
Why use this indicator?
High residential densities, high water tables, inappropriatesoil types or a combination of all three at some propertieslocated in Jerseyville, Stuarts Point, Willawarrin, Greenhill,Aldavilla and Bellbrook are resulting in the failure of onsitesewerage disposal. These issues are contributing to poorquality effluent entering the environment and in someinstances could potentially pose a public health risk.
During the 2004/2005 reporting period 529 inspectionshave taken place with 215 reported non-compliances.
What this shows:
Approximately 41% of systems inspected during 2004/2005 were reported as non-compliant. This figure isconsistent with the overall number of non-compliances(40%) reported in the previous years Comprehensive SoEReport, showing a considerable proportion of on-sitesewerage disposal systems potentially contributing to poorwater quality entering the environment.
3.6.3 Stormwater Pollution
Stormwater can cause a variety of impacts depending uponthe source of stormwater. Water quality degradation resultsfrom delivery of the following into waterways:
Sediment, causing turbidity and sedimentation.
Toxins, chemicals and nutrients from roads andinfrastructure, gardens etc.
Faeces from dogs and cats primarily in urban area aswell as livestock in rural area.
CONCLUSION: Pressure Increasing

State of the Environment Report 2005 - Supplementary 21
PRINTED ON 100% RECYCLED PAPER
State of the Environment Report 2005 - Supplementary 21
Litter which potentially carries chemicals etc, and canalso be physically harmful to aquatic organisms.
Vegetation material that increases nutrient levels whilereducing the dissolved oxygen levels.
The level of treatment of stormwater is either none orprimary (bulk screening and pollutant traps).
The Kempsey Shire Stormwater Management Plan 2004-2009 outlines the current and future management actionand strategies for the Kempsey Shire.
3.6.4 Agricultural Practices
Stock access to waterways within the Shire continues tocause a number of problems for the aquatic environment.Most of these problems are caused by loss of riparianvegetation, which results in:
Increased nutrient input to waterways;
Stream bank instability;
Erosion;
Reduced water quality; and
Spread and establishment of weeds.
3.6.5 Acid Sulfate Soils
ASS when disturbed can produce sulphuric acid that candrain into waterways and cause severe short and long-termenvironmental and potential socio-economic impacts. ASSis discussed in detail in Chapter 2 – The Land
3.7 RECREATIONAL USERS
The waterways of the Kempsey Shire provide a wide rangeof recreational opportunities. Recreational users rely ongood water quality for health and safety, aesthetics, and forproductive values (eg. Fishing).
The use of waterways for recreational purposes canpotentially have an adverse impact on natural aquatic systems.Some examples include increase litter loading (includingfishing line and tackle), bank erosion from wave action ofboats and effluent discharge from watercraft.
3.8 DISTURBANCE OF RIPARIAN ZONESAND WEED INFESTATION
The draft Macleay River Estuary Data Compilation Studyidentified the degree of disturbance along the riparian zonesof the Macleay and its major tributaries as:
66.9% or 232 km having a HIGH degree of disturbance;
13.8% or 48 km considered to be INTACT;
10.1% or 35 km having a LOW degree of disturbance;
9.1 % or 31.6km of the vegetation varying in disturbancefrom LOW -MODERATE disturbance levels.
Furthermore, 282.4 km or 81.4% of the mapped riparianzone contains Category 1 Weeds, which are the most seriousenvironmental weeds on the North Coast, capable ofdisplacing native communities. For approximately half ofthis length, 130.1 km, these Category 1 Weeds are rankedas Common – Heavy. Category 2 Weeds account for 24km or 6.9% of the mapped riparian zone, while 40.5 kmor 11.7% of the mapped riparian zone does not containany significant environmental weeds (GECO Environmental2005).
3.9 LOSS OF FISHERIES HABITAT ANDWETLAND DRAINAGE
The following are recognised to have had significant impactsand influences on the Shire’s aquatic systems:
Wetland and Fisheries Habitat Modification:Impacts from drainage for flood mitigation andagricultural extension eg habitat loss, altered inundationcycles, increased sedimentation.
Effects of Acid Sulfate Soils on Aquatic Habitatand Biota: Compounding the impacts of the above,ASS has had major impacts on water quality, habitatand biota directly (eg via mortality and altered growth/development) and indirectly (eg altered water quality andloss of habitat).
3.10 FISHING AND FISH KILLS
INDICATOR – Fish Kills
Why use this indicator?
Identifying fish kills in the Shire may identify potentialharmful activities causing pollution of waterways.
NSW Fisheries have a database per catchment for fish kills.Fish kills have been previously recorded with various causesin Killick Creek, Kinchela Creek, Clybucca Creek, SaltwaterCreek (South West Rocks), the Macleay and Belmore Rivers,and the Golden Hole, South West Rocks. As expected,most records are on the lower reaches, but a few fish killshave occurred outside the Shire (eg Apsley Gorge andWollombi River). Figure 12 below shows the number ofreported fish kills from 1977 until present, as provided byNSW DPI (2005).

22 State of the Environment Report 2005 - Supplementary
0
1
2
3
4
5
6
7
8
9
1977
/197
8
1978
/197
9
1979
/198
0
1980
/198
1
1981
/198
2
1982
/198
3
1983
/198
4
1984
/198
5
1985
/198
6
1986
/198
7
1987
/198
8
1988
/198
9
1989
/199
0
1990
/199
1
1991
/199
2
1992
/199
3
1993
/199
4
1994
/199
5
1995
/199
6
1996
/199
7
1997
/199
8
1998
/199
9
1999
/200
0
2000
/200
1
2001
/200
2
2002
/200
3
2003
/200
4
2004
/200
5
Financial Years
No
. Of
Fis
h K
ills
Figure 12 – Number of Reported Fish Kills - 1977 to
Present
What this shows:
The above figure illustrates increasing trend in the numberof fish kills in the Kempsey from 1977 to present, with asignificant increase in fish kills during the 2000/2001reporting period, following the major flood event in March2001. However, it should be noted that this data mayrepresent an increase in the number of reported cases ratherthan actual number of kills, due to better data recordingprocesses in recent years.
Closer analysis of the data also revealed that fish kills wereconcentrated in the summer months into early autumn, withalmost 41% of all fish kills since 1977 occurring within themonths of February and March.
No fish kills were recorded during this reporting period(2004/2005).
INDICATOR – Fish Catches
Why use this indicator?
This indicator may provide a measure of the health of aquaticecosystems as a result water of quality or overfishing. Figure13 below shows the estimated dollar value and quantity inkilograms of commercial fish catches within the MacleayEstuary over the past 8 financial years as supplied by theNSW DPI (2005).
CONCLUSION: Pressure Increasing
0
100,000
200,000
300,000
400,000
500,000
600,000
700,000
1997/98 1998/99 1999/00 2000/01 2001/02 2002/03 2003/04
Financial Year
0
5
10
15
20
25
30
35
40
45Reported Landings Kg
Est. Value of Landings $
Reporting Fishing Operations
Figure 13 – Commercial Fish Catches
Notes: 1.No data was made available for those creeks and riverswhere less than 5 commercial
fishing fleets operate (South West Rocks, Saltwater, Korogoro andKillick Creeks) due to
privacy/confidentiality agreements.
2. Data for 2004/2005 is not yet completely compiled, and therefore
these figures have not been included within this report.
What this shows:
In general, the quantity (kg) and value ($) of commercialfish catches within the Macleay have fluctuated over thepast 8 financial years, with overall quantity caught per yearremaining steady while experiencing a slight increase in dollarvalue. The number of commercial fishing operations hasdecreased from 33 in 1997-1998 to 22 2003-2004.Preliminary data for 2004/2005 suggests similar trends inthe above data and will be reported on in the next SoEReport when the data has been fully compiled.
Common species caught include:
Sea MulletLuderickLong-fin River EelMud CrabBlack and Yellow-fin Brim;Short-fin River EelMullowaySand MulletDusky FlatheadPink-eyed Mullet
There is no quantitative data on the recreational catch, butgiven the popularity of the sport and numerous areas tofish, the catch is likely to be very significant, especially insmaller watercourses eg Belmore River, Killick Creek andKorogoro Creek.
CONCLUSION: Steady

State of the Environment Report 2005 - Supplementary 23
PRINTED ON 100% RECYCLED PAPER
State of the Environment Report 2005 - Supplementary 23
R E S P O N S EWhat are the responses and how effective are they?
3.11 INTEGRATED WATER MANAGEMENTSTRATEGY
In early 2005 Macleay Water (a business unit of KempseyShire Council) completed an IWCM Strategy as part of itscontinuing pursuit of best-practice management of its watersupply and sewerage businesses.
The IWCMS is based on a number of previous investigationstudies and incorporates planning and management of thethree main urban water services of water supply, sewerageand stormwater. Planning and managing these servicestogether will help to:
Meet customer needs;
Maximise the value of water resources; and
Minimise the impact of water use on the environment
Several major infrastructure items were identified as partof the IWCMS. This included works to be undertaken onthe Crescent Head, Hat Head, Kempsey district, and SouthWest Rocks water supply schemes.
As a result of the Effluent Management Strategy undertakenas part of the IWCMS, new infrastructure to servicepotential irrigation opportunities has been planned for allexisting sewerage schemes. Significant new sewage treatmentworks have been planned for the South Kempsey, SouthWest Rocks, and West Kempsey Schemes. New reticulatedsewerage schemes are planned to replace Onsite SewageManagement Systems at Bellbrook, Willawarrin and StuartsPoint.
Council adopted the IWCM strategy and its preferredintegrated scenarios at its May 2005 meeting. Actions toimplement this plan are incorporated in, but not limited to,the new Macleay Water Strategic Business Plan (SBP). TheSBP is driven by Council’s Corporate Management Plan,and in turn provides supporting information to thecorporate Management Plan. The IWCMS and SBP will bereviewed no less than once every five years.
3.12 STORMWATER MANAGEMENT
Council formally adopted the Kempsey Shire UrbanStormwater Management Plan (SMP) in July 2004. TheSMP focuses on environmental protection throughimproved stormwater management and is based on theprinciples of Ecologically Sustainable Development (ESD)and Total Catchment Management (TCM).
The SMP identified a range of general actions applicableto all of Council’s urban areas and a range of actions specific
to each individual urban catchment. Many of the actionslisted reflect activities already being undertaken or proposedto be undertaken by Council, including aligning existingoperations across all of Council’s departments to ensurethe outcomes meet the objectives of the stormwatermanagement plan.
The urbanised catchments of Crescent Head and SouthWest Rocks were identified as priority areas for stormwatermanagement due to the nature of each of the receivingwater bodies, ie relatively small size and high recreationaluse. A Stormwater Management Plan was prepared forCrescent Head, and a Stormwater Trust Grant was obtainedfor the Saltwater Creek Catchment at South West Rocks.Both of these projects involved a community educationprogramme and a structural (end of line) componentinvolving the installation of gross pollutant traps (GPTs).The community education programmes were completedand a limited number of GPTs installed by early 2004 andreported on in the previous comprehensive SoE Report.A further series of GPTs have been installed throughoutthe current reporting period as outlined below.
3.12.1 Installation of SQUIDs
As part of the SMP, Council has recently providedstormwater quality improvement devices (SQUIDs) at twohigh priority locations, Crescent Head and South West Rocks,with funding provided from Stormwater Trust Grants.Council’s Environmental levy is also funding the installationof SQUIDs in the Spencerville Creek Catchment and thislevy could be used to fund further works in future years.
Crescent Head
Of all the stormwater outlets, the most critical outlets arethose discharging directly into Killick Creek adjacent to thecaravan park. A GPT was previously installed on the largestline that services two-thirds of this catchment, while a secondGTP was installed during this reporting period on thestormwater line that services the CBD area. The purposeof these GPTs is to limit the amount of litter and sedimentdischarging into the Creek and also aid in the reduction offaecal coliform numbers in the receiving water body.
A further SQUID is proposed to be installed at Lee Streetduring the 2005/2006 financial year to service stormwaterfrom the associated urbanised catchment before discharginginto Killick Creek.
Saltwater Creek Catchment – South West Rocks
Stormwater pollution at this location has been identified asa key concern in Council’s Stormwater Management Planand in the Saltwater Creek Estuary Management Plan.

24 State of the Environment Report 2005 - Supplementary
A GPT was previously installed near the entrance ofSaltwater Creek to capture gross pollutants carried instormwater from the South West Rocks CBD. AnotherGPT was installed during the reporting period within theHorseshoe Bay Caravan Park to service the remaining partof the CBD and Caravan Park. The installation of thegross pollutant traps will ensure that under normal conditionsup to ninety percent of all litter emanating from the SouthWest Rocks CBD Catchment will be captured, retained andprevented from entering Horseshoes Bay and the lagoon atthe Saltwater Creek.
A further 3 GPT are proposed for the South West Rocksarea during the 2005/2006 financial year. One of these isto be located on Mitchell Street, north of Paragon Avenueto further service the CBD and urban catchment in thisarea. Two other GTPs are proposed along Lindsay NoonanDrive to service the associated industrial area within theSpencer Creek catchment.
3.12.2 Inspection and Maintenance of SQUIDs
Council has implemented a regular inspection andmaintenance program for each of the stormwater qualityimprovement devices. Each device is inspected on a monthlybasis, noting the percentage of litter and any damage thatmay have occurred. Regular cleaning and maintenance isalso carried out, with the percentage of litter, leaf andsediment within each device recorded, along with the totalvolume of material removed. Regular inspections andmaintenance of thesedevices is vital toensure they operatecorrectly and thusreduce the grosspollutant load to thereceiving waterbodies.
3.13 SEWAGEAND EFFLUENT DISPOSAL MANAGEMENT
3.13.1Water Quality Monitoring
Council continues to operate its water quality monitoringprogram for a number of selected downstream tributariesof the Macleay River. Ten permanent telemetry waterquality stations are installed in Clybucca/Collomatti Creek,Kinchela Creek, Belmore River and Killick Creek. Thestations continually measure dissolved oxygen, pH, electricalconductivity, temperature and water levels, while somestations are capable of recording rainfall data. The recordeddata is transmitted back to Councils central computer every15 minutes. The monitors also have the capability to
physically collect samples for further laboratory analysis ifrequired.
The water quality data from all ten monitoring locations isupdated in real-time (every 15 minutes) and displayed onCouncil’s website: http://www.kempsey.nsw.gov.au/. Thedata is displayed as graphs, in easy to understand formatfor landholders or any other interested parties to view online.
Macleay Water also carries out monitoring at variouslocations within the Shire to ensure wastewater dischargedfrom its STPs to the environment is of acceptable quality.The monitoring points are located at all of Council’s SewageTreatment Works, the Glenrock outfall – Macleay Riverand sand dune disposal points for the South West Rocksand Hat Head Sewage Treatment Works.
INDICATOR – STP Effluent Discharge Quality (%
Compliance)
Why use this indicator?
Monitoring the compliance of effluent discharge quality isan important indicator in as it provides a measure of thequality of a potential pollution source. If a non-complianceis found actions can then be taken to rectify the problem.Table 3.2 below summarises the percentage compliance forthe latest annual licence agreement.
% COMPLIANCE FOR LATEST ANNUAL LICENCE RETURN Site BOD TSS O&G FC NH3 PH TN TP
West Kempsey 100 88 100 100 100 62 70 100 South Kempsey 100 100 100 NR NR NR NR NR
South West Rocks 100 100 100 NR NR NR NR NR Crescent Head 100 100 100 92 100 100 100 100
Gladstone 100 100 100 NR NR NR NR NR Frederickton 100 92 100 NR NR NR NR NR Hat Head*
Table 3.2: Shire STW Effluent Quality
Notes: * Hat was not licensed to Council during thereporting time period. NR – Not Recorded
What this indicator shows:
This indicator shows some parameters exceeding the NSWEPA’s licensing requirements over the past 12 months, mostnotably at West Kempsey STP. Council is continuing toaddress this problem as discussed below.
3.13.2Sewage Infrastructure
The Pollution Reduction Programs (PRPs) for West Kempseyare being addressed in the Integrated Water CycleManagement Plan. The third PRP, which relates to the

State of the Environment Report 2005 - Supplementary 25
PRINTED ON 100% RECYCLED PAPER
State of the Environment Report 2005 - Supplementary 25
Reticulation Overflow Report, is being undertaken on SouthWest Rocks and Crescent Head systems with the remainingsystems to be addressed in later 2005 and 2006 (See Section3.6.1).
In response to current issues in regard to the West KempseySewerage Treatment Works, a strategy report has beencompleted outlining the costs and logistics associated withplant augmentation or total replacement. The decision onworks to be implemented will be decided by Council afterconsidering this report and IWCMS outcomes.
3.13.3Septic Tank Controls
Council is conducting an ongoing inspection process todetermine if existing and new OSMS installations arecompliant.
3.14 GROUNDWATER
During the reporting period, a consultant undertook adetailed Borefields Assessment and Management Strategyfor the coastal borefields that supply South West Rocks,Hat Head and Crescent Head. The purpose of this strategywas to identify locations of observation bores at SouthWest Rocks, Crescent Head and Hat Head and determinethe preliminary location of production bores at CrescentHead and Southwest Rocks. Council is currently reviewingthe outcomes of these studies.
3.15 BEACHWATCH
Kempsey Shire Council continued its faecal coliformmonitoring program throughout the beach season in 2004/2005.
Council collects (as per recommended guidelines developedthrough the NSW EPA’s Pilot Beachwatch Program 2002)and analyses water samples collected at eleven (11) locationswhich include: Killick Creek, Killick Beach (Crescent Head),Horseshoe and Trial Bays (SWR). The samples are collectedweekly. The daily sample program is based aroundcollecting samples at Killick Creek and Killick Beach at anebbing low tide.
INDICATOR – Sewerage Pollution
Faecal coliforms are generally associated with faecal wasteof warm-blooded animals and so, are a useful indicatorof the level of faecal contamination. The number of faecalcoliform recorded is used as a primary indicator of seweragepollution in the environment.
For primary contact (swimming) the median bacterialcontent in samples of fresh or marine waters taken overthe bathing season should not exceed:
150 faecal coliform organisms (CFU)/100mL(minimum of five samples taken at regular intervals notexceeding one month, with four out of five samplescontaining less than 600 CFU/100mL).
For secondary contact (boating/fishing) the median bacterialcontent in fresh and marine waters should not exceed:
1000 CFU/100mL (minimum of five samples taken atregular intervals not exceeding one month, with fourout of five samples containing less than 4000 CFU/100mL).
Council’s Beachwatch Program continued throughout the2004/2005 beach season from October 2004 through toMarch 2005. A summary of results of the faecal coliformtesting during this period, from selected locations, is listedin Table 3.3.
Killick Beach
Killick Creek
Trial Bay Horseshoe Bay
12-Oct-04 <2 4 <2 4
19-Oct-04 <2 82 34 45
26-Oct-04 <2 4 2 <2
1-Nov-04 <2 <2 <2 <2
8-Nov-04 <2 22 <2 <2
16-Nov-04 <2 5 <2 <2
22-Nov-04 42 498 5 92
29-Nov-04 <2 12 4 <2
8-Dec-04 <2 <2 <2 2
15-Dec-04 5 <2 <2 <2
20-Dec-04 2 8 <2 <2
29-Dec-04 2 4 <2 122
5-Jan-05 14 103 6 6
12-Jan-05 - 6 - 60
19-Jan-05 <2 58 <2 4
24-Jan-05 <5 9700 5 10
1-Feb-05 11 18 4 7
9-Feb-05 15 37 50 35
16-Feb-05 6 29 <2 <2
23-Feb-05 <2 4 2 <2
2-Mar-05 20 5 <2 <2
09-Mar-05 0 166 0 0
16-Mar-05 0 16 0 0
Table 3.3: Faecal Coliform Levels (CFU/100ml)
Selected Locations 2004/2005
Star ratings have also been developed to provide anongoing indication of compliance on a weekly basis. Thestar ratings are based on but not identical to the NHMRCguidelines. The ratings are split up into for categories asfollows:
Good – 4 Stars– Passes Beachwatch Guidelines –Suitable for swimming -Fair – 3 Stars – Passes Beachwatch Guidelines – Suitablefor swimmingPoor – 2 Stars – Fails Beachwatch Guidelines – NotSuitable for swimmingBad – 1 Star – Fails Beachwatch Guidelines – NotSuitable for swimming

26 State of the Environment Report 2005 - Supplementary
The following star ratings have been supplied for the periodsas shown for a number of locations across the Shire’s coast:
Period Location Star ratingsHorsehoe Bay 4
Trial Bay 4 Saltwater Creek 4
Killick Beach 4
12/10/2004 to 8/11/04
Killick Creek 4 Horseshoe Bay 4
Trial Bay 4 Saltwater Creek 3
Killick Creek 4
08/11/2004 to 08/12/04
Killick Beach 4 Horseshoe Bay 4
Trial Bay 4 Saltwater Creek 4
Killick Creek 4
29/11/2004 to 29/12/04
Killick Beach 4
Table 3.4: Star Ratings for Selected Locations 2004/
2005
What this indicator shows:
Generally the number of faecal coliforms present at themonitoring locations did not exceed the recommendedconcentration, with all locations (with the exception SaltwaterCreek during the period 08/11/2004 to 08/12/04)receiving a 4 star rating.
The above results are displayed on Council’s website (http://www.kempsey.nsw.gov.au/beachwatch.htm) and updatedregularly throughout the swimming season.
3.16 WATERWAY AND WETLANDREHABILITATION AND PROTECTION
3.16.1Pola Creek Rehabilitation Project.
Stage 1 of the Pola Creek Rehabilitation Project is nowcomplete. Works included the installation of a lifting deviceto allow the opening of one of the Pola Creek floodgatesduring non-flood periods to allow fish passage and increasedexchange of water with the Macleay River. Removal ofweeds from the banks of Pola Creek near South West RocksRoad and their replacement with native riparian species hasalso been completed. Stage 2, which involves furtherriparian revegetation work along the banks of Pola Creek,will commence within the coming months.
3.16.2Nestle Community Vegetation Project -
Jerseyville
Council is currently at Stage 3 of a 4 stage process inrehabilitating a section of Council managed road reserve,off Plummers Lane, near the Jerseyville Bridge. This projectwas a joint initiative between Nestle, Council and the local
community. The project involved the planting of nativeplant species to allow for riparian rehabilitation of thereserve. The construction of a walking path through thereserve was also undertaken, with the finalisation of theproject to include descriptive signs placed next to each speciesof native plants to serve as an educational tool, describingthe importance of native vegetation along riparian zones.
3.16.3Yarrabee Park Wetland Restoration Project
This was a joint project between Kempsey Shire Council,Port Macquarie Hastings Council and a landholder to restorea SEPP 14 wetland that was damaged by illegal drainageworks. The works have included the installation of a weirthat has helped restore wetland water levels and reduce aciddischarge into the Maria River.
3.16.4Boyters Lane Playing Fields and Wetland Plan
of Management
In early 2005, a Plan of Management was completed forthe Boyters Lane playing fields and wetland, South WestRocks. The Plan was undertaken as a result of Council’sproposal to construct sporting fields on land adjoining theWetlands. The Plan of Management recommended thatCouncil call for members for a working group to managethe site, with an adaptive management approach stronglyrecommended. Monitoring and review of works andprocesses over time will ensure a flow of information forthe site manager to adjust management in response to trendsor emerging problems.
3.17 ESTUARY MANAGEMENT
A draft data compilation study for the Macleay Estuary hasrecently been completed and Council is currently in the firststage of the development of the Estuary Management Plan.
In conjunction with consultants, Council is also in the finalstages of producing an Estuary Management Plan and Studyfor Killick Creek at Crescent Head and Saltwater Creekand Lagoon, at South west Rocks. These plans are designedto provide clear directions regarding responsibilities foractions to help achieve sustainable waterways.
3.18 FISHERIES AND AQUACULTURE
3.18.1Key Threatening Processes
The following are formally listed as Key ThreateningProcesses listed by NSW fisheries:
Current shark meshing program in NSW waters.
Hook and line fishing in areas important for the survivalof threatened fish species.
The introduction of fish to fresh waters within a rivercatchment outside their natural range.

State of the Environment Report 2005 - Supplementary 27
PRINTED ON 100% RECYCLED PAPER
State of the Environment Report 2005 - Supplementary 27
The removal of large woody debris.
The degradation of native riparian vegetation along NewSouth Wales water courses.
The installation and operation of in-stream structuresand other mechanisms that alter natural flow regimesof rivers and streams.
No relevant new species (i.e. not likely to occur in the Shire),populations or ecological communities have been listed.
3.18.2Removal of Causeway at McCoys Crossing
Council was selected by the NSW Department of PrimaryIndustries to be part of a trial for its Stream Health – RoadCrossings and Fish Passage Project. The program aims toidentify and prioritise waterway crossings important to fishpassage in the Northern Rivers Catchment ManagementArea, to document remedial options and to assist LocalGovernment with on-ground works at key demonstrationsites.
Willi Willi Road causeway at McCoys Creek was identifiedas an appropriate demonstration site for this programbecause of the high invert restricted water flows impedingthe passage of native fish through the river system. Theexisting causeway was removed in late 2004 and replacedwith a new timber bridge. This has improved the flow ofwater and increased the free passage of fish along the creek.The overall success of the project will become moreobvious over time, as the improved health of the aquaticecosystem creates the right environment for fish populationsto flourish.
F U T U R E D I R E C T I O N SWhat more could be done?
3.19 INTEGRATED WATER CYCLEMANAGEMENT STRATEGY
Ongoing review of the Integrated Water Cycle ManagementStrategy (IWCMS) will take place over the coming years,incorporating planning and management of the three mainurban water services of water supply, sewerage andstormwater. Planning and managing these services togetherwill help to:
• Meet customer needs;
• Maximise the value of water resources; and
• Minimise the impact of water use on the environment.
3.20 ESTUARY MANAGEMENT PLAN
Council is currently in the first stage of the developmentof the Estuary Management Plan (EMP). The focus of the
EMP will be on improving or maintaining the overall healthand functionality of the estuary. Emphasis is placed onmaintaining the integrity of the whole system, including itschemical, physical, and biological properties, as well as itseconomic, recreational, and aesthetic values. It is envisagedthat the EMP will encourage local communities to takeresponsibility for managing their own estuary.
The Estuary Management Plan and Study for Killick Creekand Saltwater Creek and Lagoon are to be finalised andadopted during the 2005/2006 reporting period. Fundinghas also been obtained to develop a similar plan and studyfor Korrogoro Creek at Hat Head.
3.21 KEMPSEY SHIRE URBAN STORMWATERMANAGEMENT STRATEGY
The action plans outlined in the Kempsey UrbanStormwater Management Plan (SMP) provide direction forfuture planning, education and provision of appropriatesustainable stormwater management infrastructure from2004 – 2009. The SMP identifies a range of general actionsapplicable to all of Council’s urban areas and a range ofactions specific to each individual urban catchment. Manyof the actions listed reflect activities already being undertakenor proposed to be undertaken by Council, including aligningexisting operations across all of Council’s departments toensure the outcomes meet the objectives of the stormwatermanagement plan.
Specific actions set to take place during the 2005/2006reporting period include, community education programsand water sensitive planning and design across all urbanareas, upgrade of the stormwater system at Kempsey SaleYards and a review of stormwater treatment at SaltwaterLagoon and Saltwater Creek, South West Rocks.

28 State of the Environment Report 2005 - Supplementary
GLANCEAt aATMOSPHERE
STATE PRESSURE RESPONSE FUTURE DIRECTIONS
Air Pollution - is relatively low in the Kempsey Shire compared to larger urban centres, although smoke and other air borne particles can be prevalent during the bushfire season.
Green House Effect – Kempsey Shire is regarded as a relatively minor producer of greenhouse gases.
Ozone Layer – Kempsey Shire is not regarded a significant potential producer of ozone depleting compounds.
Nuisance – Council recorded 13 Air and 12 Odour complaints during 2004/2005, while the NSW EPA recorded 5 Air complaints.
Vehicle Emissions – impact most on the urban centres of Kempsey and Frederickton due to heavy traffic on the Pacific Highway.
Burning Off – this is often cause for complaint when waste is burnt in urban areas.
Solid Fuel Stoves and Heating
Agriculture – crop and weed spraying, land clearing and methane from stock.
Landfilling – production of methane and other greenhouse gases.
Sewer Treatment Plants – can cause odour problem in urban areas.
Dust – from unsealed roads and unstable development sites
Landfill – there is now only 1 operating landfill site in the Shire as the 3 of the former sites have been capped and transformed into waste transfer stations.
Sewer Treatment Plants – ongoing odour management.
Ecologically Sustainable Development – consideration of alternative technologies, cleaner production, life-cycle analysis and green purchasing, along with native conservation and enhancement.

State of the Environment Report 2005 - Supplementary 29
PRINTED ON 100% RECYCLED PAPER
State of the Environment Report 2005 - Supplementary 29
4.0 THE ATMOSPHERE
4.1 INTRODUCTION
The atmosphere consists of a relatively narrow shell of airencircling the earth that supports animal and plant life.Human activity affects the atmosphere in a variety of ways.Although some of the impacts occur on a global scale,such as ozone depletion and global warming, the sourceof these problems are often occurring on a local scale. Thequality of the air in major urban and regional centres is alsoof concern to the community and may be associated witha range of adverse health effects (NSW EPA 2000).
S T A T EWhat are the issues for sustainability? And how are
they changing?
4.2 AIR POLLUTION
Substances not naturally found in the air or at greaterconcentrations or in different locations from usual arereferred to as ‘pollutants’ (NSW EPA 2005). Air pollutionis caused by many of the activities that are common to ourway of life. The quality of the air we breathe can havesignificant health impacts particularly with regard torespiratory diseases, asthma and cancer. Air pollutants canalso produce odour issues.
Common causes of air pollution can include bushfire,controlled burning, industry, vehicle emissions, solid fuelstoves and heaters. Table 4.1 shows the sources and humanhealth affects of common air pollutants.
Air pollution in the Kempsey Shire LGA is relatively lowcompared to larger urban centres, although smoke and otherair borne particles can be prevalent during the bushfireseason.
4.3 GREEN HOUSE EFFECT
The Kempsey Shire is a relatively minor producer ofGreenhouse gases in comparison to more heavily populatedand industrialised areas, particularly as there are no majorfuel-based power generators in the region. However,significant historical land clearing has reduced the regionscurrent potential as a sink for carbon dioxide. Majorsources of Greenhouse emissions in the area are likely tocome from bushfires, controlled burning, forestry,agriculture, and transport (particularly the Pacific highway).
Council does not currently have any specific measures toreduce Greenhouse gas emissions.
4.4 OZONE LAYER
The historical use of the ozone depleting compounds suchas chlorofluorocarbon compounds (CFCs) within theKempsey Shire is expected to be minimal, with the main
Table 4.1: Common Air Pollutants
Source: CSIRO 2003
Pollutant Sources Health effects
Carbon monoxide
Motor vehicles, burning of fossil fuels.
Blood absorbs carbon monoxide more readily than oxygen, reducing the amount of oxygen being carried through the body. Carbon monoxide can produce tiredness and headaches. People with heart problems are particularly at risk
Sulfur dioxide
Coal and oil burning power stations, mineral ore processing and chemical manufacture.
Attacks the throat and lungs. People with breathing problems can suffer severe illness.
Nitrogen dioxide Fuel combustion. Affects the throat and lungs.
Volatile organic compounds
Motor vehicles, fuel combustion, solvent use.
Some VOCs cause eye and skin irritation, headaches or nausea, while some are classed as carcinogens.
Ozone
Formed from nitrogen oxides and hydrocarbons in sunny conditions. These chemicals are released by motor vehicles and industry.
Ozone attacks the tissue of the throat and lungs and irritates the eyes.
Lead Exhaust gases from motor vehicles that use leaded petrol, smelters.
Particles containing lead in the air can enter the lungs. The lead can then be absorbed into the blood stream. Over a period lead can affect the nervous system and the body's ability to produce blood.
Particles Motor vehicles, burning of plant materials, bushfires.
May cause breathing difficulties and worsen respiratory diseases. Some particles contain cancer-producing materials.

30 State of the Environment Report 2005 - Supplementary
source originating from old household items such as aerosolcans, air conditioning units and refrigerators.
P R E S S U R EWhy is it happening?
Air quality is generally not considered to be a major issuewithin Kempsey Shire in the short term due to the absenceof heavy industry in the Shire, relatively small and dispersedpopulation, good air flow characteristics and large areas ofnative vegetation retained in undeveloped lands.
INDICATOR – Air Pollution Licences for the
Kempsey Shire
Why use this indicator?
Licensing provides an assessment of the number and typesof potential air polluters in the Kempsey Shire.
The NSW EPA did not have current up to date licensinginformation available at the time of reporting.
4.5 NUISANCE
Air pollution can give rise to nuisance issues in urban areas,caused by odours or dust settling on washing etc. Suchissues directly affect the quality of the environment in whichpeople reside. These generally occur where people live inclose proximity to potential sources of air pollution (eg.STPs, landfill, industry, unsealed roads).
INDICATOR – Number of complaints regarding air
pollution
Why use this indicator?
Council and NSW EPA record air complaints on an annualbasis. This allows an assessment to be made of the extentof air pollution issues in the Kempsey Shire.
Table 4.2: Air Pollution Complaints
What this shows:
The current data suggest a slight decrease in the number ofair and odour complaints reported to council in the past 12months, along with the number of air complaints reporteddirectly to the EPA.
Complaints Received Council NSW EPA 2003/2004 2004/2005 2003/2004 2004/2005 Air 18 13 10 5 Odour 17 12 - -
4.6 VEHICLE EMISSIONS
Vehicle emissions are not a major issue for local air quality.However, the increasing amount of traffic and particularlyheavy vehicles using the Pacific Highway directly impactupon the communities located along the highway and theKempsey Business district. Increased vehicle numbers addsto carbon monoxide, volatile organic compounds, lead andother atmospheric particulates in the immediate vicinity ofthe highway.
The proposed Highway bypass will alleviate conditionsthrough much of Kempsey itself, but completion of thisbypass is not expected for sometime yet.
4.7 BURNING OFF
Controlled burning for the purpose of reducing potentialbushfire load, along with backyard or on-farm burning ofvegetative refuse and waste add to pollution load in theatmosphere.
4.8 SOLID FUEL STOVES AND HEATING
Solid fuel stoves and heaters are common in older residentialareas. Weather conditions, inappropriate fuel and poorlylocated, or designed flues can cause smoke nuisance andodour issues. The smoke from burning wood containsvarious pollutants including carbon monoxide, volatileorganic compounds and fine particulates along with a rangeof other toxic and odour causing elements.
4.9 AGRICULTURE
Agricultural activities such as crop and weed spraying canhave a detrimental effect on air quality with potential forhealth issues. A substantial amount of the Macleayfloodplain has been cleared for grazing and other agriculturalpursuits, hence removing potential carbon dioxide sinks.Methane production from intensive stock farming adds tothe Greenhouse effect, while also giving rise to potentialodour issues.
4.10 LANDFILLING
Landfills produce methane and other gases duringdecomposition, which add to the greenhouse effect. TheKempsey Waste Receival & Disposal Facility (KWR&DF)is now the only operational landfill in the Kempsey Shire.Council is required under it’s NSW EPA licence to monitormethane emissions to ensure levels escaping the landfill arenot above threshold levels requiring further action. Landfillgas emissions also create odour problems. Council isrequired to maintain a buffer zone around the landfill siteand cap wastes daily to reduce potential odour problem.

State of the Environment Report 2005 - Supplementary 31
PRINTED ON 100% RECYCLED PAPER
State of the Environment Report 2005 - Supplementary 31
Older non-operational landfills within the Shire would alsobe producing greenhouse gases.
INDICATOR – Total Waste to Landfill
Why use his indicator?
The amount of waste going to landfill is directly related togreenhouse gas producing potential
See Chapter 6 – Human Settlements
4.11 SEWER TREATMENT PLANTS
STPs produce greenhouse gases and can cause potentialodour problems when prevailing winds pass over and directthe odour toward urban areas. The establishment of odourbuffers aims to address this issue.
4.12 DUST
Dust pollution issues can be associated with unsealed roads,un-stabilised development sites, extractive industries andother similar industries.
4.13 BUSHFIRES AND OTHER EMERGENCYSITUATIONS
Bushfires can produce prolonged periods of smoke hazethat can have detrimental health effects for sufferers ofrespiratory disorders such as asthma. Emergency situationssuch as traffic accidents or chemical spills are also of concernin the Shire due to the high traffic load, and particular roadfreight, on the Pacific Highway.
R E S P O N S EWhat are the responses and how effective are they?
4.14 LANDFILLING
Kempsey landfill has reduced its four operating landfillsdown to one central landfill facility located on CrescentHead Road - Kempsey Waste Receival & Disposal Facility(KWR&DF). The three former landfills, located at StuartsPoint, South West Rocks and Bellbrook, have been eitherpermanently or temporarily capped and are currently beingused as waste transfer stations. A large section (2.3ha) ofthe KWR&DF has also been permanently capped includinga passive gas ventilation layer.
4.15 SEWER TREATMENT PLANTS
An oxygen dosing plant was installed on the rising main tothe North Street treatment work some years ago and is
CONCLUSION: Pressure Increasing
generally effective in freshening the sewage sludge andreducing odours. Other steps taken to reduce odours atCouncil’s STPs include reducing sludge levels in sludgelagoons and dosing of the sludge with patent biologicalchemicals for odour and volume reduction.
F U T U R E D I R E C T I O N SWhat more could be done to improve Air Quality?
As previously discussed in this section air pollution is notregarded as a major environmental issue in the Shire.However, any means to reduce air pollution should beconsidered as the Shire moves toward sustainability.
Reducing point source emissions of pollutants such as odourand dust are important for improving local air quality withinthe Shire, but consideration of broader environmental issuessuch as reducing Greenhouse gas emissions should beexplored. This may be achieved, by purchasing moreefficient and renewable energy supplies. One such initiativecould include Council becoming involved in the “GreenPower Education Campaign” which aims to encourage localcouncils and their communities to switch to Green Powerto reduce greenhouse gas emissions.
Other options include using materials that are producedwith minimal to no Greenhouse gas emissions, promotingcar pooling, cycling walking and choosing public transportwhere available as preferred methods of travel andincreasing conservation of vegetated areas and revegetatingcleared lands where possible.

32 State of the Environment Report 2005 - Supplementary
GLANCEAt aBIODIVERSITY
STATE PRESSURE RESPONSE FUTURE DIRECTIONS
Habitats within the Shire –30 of the 77 ecosystems recorded in the Shire have been identified as being of high conservation value. This incorporates 5,038 ha (or 2.25%) of Vulnerable communities and 32,678ha (or 14.31%)
Kempsey Shire Council DRAFT Ecologically Sustainable Development Policy
Extent and Condition of Native Vegetation – Information relating to changes in vegetation since pre-European settlement (1788) has not been described in any significant detail. However, as of 2003, approximately 63% of land within the Kempsey Shire consisted of woody vegetation, with 35% cleared and a further 2% on which there was no data.
Vegetation and Habitat Management
Flora
Threatened Flora Species – There were 7 Vulnerable and 7 Endangered flora species identified in the Shire, which is 1 more of each compared to last year. This total of 14 threatened species (7 Vulnerable and 7 Endangered) represents approximately 1.3% of the species listed in the Shire
National Parks, Nature Reserves, State Recreation Areas and Other Reserves – 99,856 ha of land, representing 29.5% of the total land area in the Shire, is under formal reserve. This represents a slight increase from last years figure, reflecting 313 ha of land designated as a wildlife refuge during the 2004/2005 reporting period.
Fauna
Endangered and Vulnerable Species – There were 86 (72 Vulnerable and 14 Endangered species) threatened fauna species (including marine) recorded to date in the shire, excluding fish and invertebrates. Threatened fauna make up 18.5% of all fauna species recorded in the shire, which is an approximate 3% increase in the past 12 months
Endangered Ecological Communities – there are 9 community types represented in the Shire including rainforest, woodland and saltmarsh.
Migratory Species – there are at least 26 species or species habitats found in the Shire. No new species have been identified during the past 12 months
Land Clearing and Development – the population of Kempsey Shire is growing, particularly in the coastal areas and with rural subdivision.
Feral Animals and Domestic Pets – mainly concerned with feral dogs, dingos, rabbit, fox, cat and pigs, with increasing feral deer problems.
Exotic Plants – of particular concern in the past 12 months:
• Bitou Bush
• Blackberry
• Giant Parramatta Grass
• Lantana
• Groundsel Bush
• Salvinia and Water Hyacinth
• St Johns Wort (Hypericum perforatum)
Bushfire – The total area burnt during reporting period was approximately 523.54 ha Appropriate management is essential to avoid disruption of ecosystems
Exotic Animal Control – concentrated on wild dogs and dingos with rabbit, fox and feral cat management ongoing throughout the shire and small scale pig trapping occurring in the south eastern portion of the Shire.
Weed Management – Macleay Valley Weeds Strategy
Bushfire Management – Mapping of Bushfire Prone Land and Fireguard for Kids Program.
Volunteer Rural Fire Service brigades assisted with a total of 8 hazard reduction burns across the Kempsey Shire totalling 221 hectares of burning
Comprehensive Vegetation Mapping -
Council has allocated funding for the 2005/2006 financial year to undertake comprehensive vegetation mapping of the Kempsey Shire LGA.
NRCMA Catchment Action Plan - The NRCMA is developing a Catchment Action Plan (CAP) for the Northern Rivers Region. The 10 year CAP will guide natural resource management across the Northern rivers Region.
Kempsey Shire Comprehensive Koala Management Plan – is programmed within Council’s 5-year budget.
State of the Environment Report 2005 - Supplementary 33
PRINTED ON 100% RECYCLED PAPER
State of the Environment Report 2005 - Supplementary 33
5.0 BIODIVERSITY
5.1 INTRODUCTION
Biodiversity is the variety of all life forms - the differentplants, animals and microorganisms, the genes they contain,and the ecosystems of which they form a part. The levelof diversity is not fixed, but rather dynamic, increased bygenetic changes and evolutionary processes, and decreasedby extinction and habitat degradation” (DEH 2004).
One of the key aspects of Ecologically SustainableDevelopment is the requirement that the rate of biodiversityloss caused by human activity should not be sufficient tocompromise ecosystem integrity.
S T A T EWhat are the issues for sustainability? And how are
they changing?
5.2 HABITATS WITHIN THE SHIRE
The most detailed assessment to date, describing the typeand extent of habitats within the Kempsey Shire is providedby the Comprehensive, Adequate and Representative (CAR)Assessment, completed in 1999-2000 for the Upper NorthEast and Lower North East study areas (the latterincorporating the Kempsey Shire). The CAR Assessmentidentified the following major vegetation communitiesexisting in the Shire:
sub-tropical, warm temperate and cool temperaterainforest
wet and dry sclerophyll forest
swamp forest
woodland eg Melaleuca, Eucalypt and Casuarina spp
scrubland eg Banksia and Leptospermum spp
grassland (native and modified) and pasture
wetland, aquatic and marine eg saltmarshes, rushlands,mangroves, seagrass, etc.
dunal communities eg littoral rainforest
wet and dry heathland
riparian vegetation
The CAR assessment described 30 of the 77 ecosystemsidentified in the Shire as being of high conservation value.This incorporates 5038 ha (or 2.25%) of Vulnerablecommunities and 32678ha (or 14.31%) described as Rare.A detailed list of these ecosystems is presented in the 2004Comprehensive SoE Report.
Wetlands and littoral rainforests are communities ofparticular importance found in the Shire, meeting the criteriaof SEPP 14 and SEPP 26. SEPP 14 wetlands occupy 12951ha (3.84%) of the shire, with Littoral Rainforestsoccupying 63.57ha (0.02%) of the land use within the Shire.
INDICATOR – Extent and Degree of Change to
Native Vegetation
Why use this indicator?
The extent and condition of each type of native vegetationcorrelates closely to the ecosystems level and ability tomaintain biodiversity. By monitoring this indicator we areable to see how effectively vegetation in the Shire is beingmanaged, and therefore the associated effects onbiodiversity.
What this indicator shows:
Information relating to changes in vegetation since pre-European settlement (1788) has not been described in anysignificant detail. However, as of 2003, approximately 63%of land within the Kempsey Shire consisted of woodyvegetation, with 35% cleared and a further 2% on whichthere was no data.
Although there were no additional areas of land gazettedas National Park Estate during the 2004/2005 reportingperiod, 313 ha of land in the Shire was designated as wildliferefuges.
5.2.1 Regional Corridors
Key vegetation areas in and surrounding the region arecomprised of State Forest, conservation areas, Council land,and private property which are connected and/or a partof a greater network of regional and subregional wildlifecorridors.
No new significant regional corridors have been identifiedduring the 2004/2005 reporting period
5.3 FLORA
5.3.1 General
The broad variety of habitats located in the Kempsey Shireenables this area to support a large variety of species. Asearch on the NPWS Atlas (2005) indicated 1,121 plantspecies have been detected in the Shire, from 155 differentfamilies. This total represents an additional 5 new familiesand 93 new species compared to last years total of 150families and 1,028 species.
In terms of species richness, the families Poaceae (97),Fabaceae (92), Myrtaceae (86) and Asteraceae (75) containthe greatest number of species found in the Shire followedclosely by Cyperaceae (58) and Orchidaceae (42).

34 State of the Environment Report 2005 - Supplementary
This list is considered only to be indicative and notcomprehensive.
5.3.2 Threatened and Rare Flora
INDICATOR- Threatened Flora species
Why use this indicator?
The conservation status of threatened species indicates whichgroups and associated habitat may need special management.Loss of species is best shown by the number of speciesconsidered endangered or vulnerable.
What this indicator shows:
The table above shows there are 7 Vulnerable and 7Endangered flora species presently known to occur in theShire, which is 1 more of each compared to last year. This
Species Listed Act Status Occurrence Acacia chrysotricha TSC E1 recorded Acronychia littoralis TSC/EPBC E1 recorded
Allocasuarina defungens TSC E1 recorded Amorphospermum whitei TSC V recorded
Arthraxon hispidus EPBC V Species or species habitat likely to occur within area
Asperula asthenes TSC/EPBC V recorded Bothriochloa biloba EPBC V Species or species habitat
likely to occur within area Callistemon pungens EPBC V Species or species habitat
likely to occur within area Chamaesyce psammogeton TSC E1 recorded
Cryptostylis hunteriana EPBC V Species or species habitat likely to occur within area
Cynanchum elegans EPBC E1 Species or species habitat likely to occur within area
Diuris disposita TSC E1 recorded Gaultheria viridicarpa J.B.Williams
subsp. Viridicarpa ms. EPBC V Species or species habitat
likely to occur within area Grevillea guthrieana TSC/EPBC E1 recorded Hakea archaeoides EPBC V Species or species habitat
likely to occur within area Haloragis exalata subsp. Velutina TSC/EPBC V recorded
Hydrocharis dubia EPBC V recorded Marsdenia longilobia TSC/EPBC E1 recorded Neoastelia spectabilis TSC/EPBC V Species or species habitat
likely to occur within area Peristeranthus hillii TSC V Species or species habitat
likely to occur within area Parsonsia dorrigoensis TSC/EPBC V recorded
Quassia sp. Mooney Creek (J.King s.n. 1949)
EPBC E1 Species or species habitat likely to occur within area
Sarcochilus fitzgeraldii EPBC V Species or species habitat likely to occur within area
Sarcochilus hartmannii TSC V recorded Styphelia perileuca EPBC V Species or species habitat
likely to occur within area Tasmannia glaucifolia EPBC V Species or species habitat
likely to occur within area Thesium australe TSC V recorded Tylophora woollsii EPBC E1 Species or species habitat
likely to occur within area Zieria lasiocaulis TSC E1 recorded
Table 5.1: Threatened flora known or likely to occur in the Shire
Notes: Species in highlighted in Bold have been added since the previous years record.
total of 14 threatened species (7 Vulnerable and 7Endangered) represents approximately 1.3% of the specieslisted in the Shire. In 2000, only eight species (four vulnerableand four endangered) were listed in the Shire (2000 SoEReport). This difference has resulted from new specieslistings, changes to Shire boundaries and recent studies.Fourteen other species or species habitats are also consideredlikely to occur in the region as shown below.
Conclusion: Pressure Increasing
CONCLUSION: Pressure Increasing

State of the Environment Report 2005 - Supplementary 35
PRINTED ON 100% RECYCLED PAPER
State of the Environment Report 2005 - Supplementary 35
5.4 FAUNA
5.4.1 General
The broad variety of habitats located in the Kempsey Shireenables this area to support a large variety of fauna. Asearch on the NPWS Atlas (2005) shows that 465 faunaspecies from 174 different families (including marine species) havebeen recorded in the shire to date, summarised in Table 5.2.
Number of species Fauna Group 2004 2005
Birds 285 286 Amphibians 35 35 Mammals 94 94 Reptiles 50 50
Total 464 465
Vulnerable Endangered Australasian Bittern Black-necked Stork Barred Cuckoo-shrike Bush Stone-curlew Black Bittern Little Tern Black-breasted Buzzard Painted Snipe Black-tailed Godwit Regent Honeyeater Blue-billed Duck Southern Giant Petrol Brolga Swift Parrot Brown Treecreeper Brush-tailed Phascogale Bush-hen Comb-crested Jacana Diamond Firetail Flesh Footed Shearwater Glossy Black-Cockatoo Grey Ternlet Grass Owl Grey-crowned Babbler (eastern subsp.) Hooded Robin Magpie Goose Marbled Frogmouth Masked Owl Olive Whistler Osprey Painted Honeyeater Pied Oystercatcher Powerful Owl Rose-crowned Fruit-Dove Rufous Scrub-bird Sooty Owl Sooty Oystercatcher Speckled Warbler Square-tailed Kite Superb Fruit Dove
Birds
Wompoo Fruit-Dove Green-thighed Frog Booroolong Frog Grandula Frog Green and Golden Bell Frog Sphagnum Frog Stuttering Frog
Amphibians
Wallum Froglet Giant Barred Frog Australian Fur-seal Eastern Quoll Brush-tailed Phascogale Hastings River Mouse Common Blossom-bat Common Planigale Eastern Bent-wing Bat Eastern Cave Bat Eastern Chestnut Mouse Eastern False Pipistrelle Eastern Freetail-bat Eastern Long-eared Bat Eastern Pygmy-possum Golden-tipped Bat Greater Broad-nosed Bat Grey-headed Flying-fox Hoary Wattled Bat Humpback Whale Koala Large-footed Myotis Little Bentwing-bat Long-nosed Potoroo Parma Wallaby Red-legged Pademelon
Mammals
Rufous Bettong
Table 5.2: Number of Fauna Species Recorded in the
Kempsey LGA 2004/2005
5.4.2 Threatened
Fauna
The following tableprovides an updated listof Threatened FaunaRecorded in the KempseyLGA.
Notes: Species highlighted in
Bold have been added since the
previous years record.
Table 5.3: Threatened
Fauna Recorded in
the Kempsey LGA

36 State of the Environment Report 2005 - Supplementary
INDICATOR - Endangered and Vulnerable Fauna
Species
Why use this indicator?
Loss of species is best measured by the number ofendangered or vulnerable fauna species. It displays theimpacts on species as a result of environmental changes.
What this shows?
There are 86 (72 Vulnerable and 14 Endangered species)threatened fauna species (including marine) recorded to datein the shire, excluding fish and invertebrates. Threatenedfauna make up 18.5% of all fauna species recorded in theShire, which is about a 3% increase in the past 12 months.
CONCLUSION: Pressure Increasing
5.4.3 Endangered Ecological Communities and
Populations
The NPWS (2005) have identified the following asendangered ecological communities and populations asbeing present within the Kempsey Shire LGA.
Coastal Salt Marsh
Freshwater Wetlands on Coastal Floodplain
Littoral Rainforest
Lowland Rainforest on Floodplain
New England Peppermint Woodland on Sediments
Subtropical Coastal Flooplain Forest
Swamp Oak Floodplain Forest
Swamp Sclerophyll Forest on Coastal Floodplain
Endangered Ecological Communities
White Box - Yellow Box - Blakely's Red Gum Woodland
Endangered Populations Emu
Table 5.4: Endangered Ecological Communities and
Populations
5.4.4 Migratory Species
A search of the DEH (2005) EPBC website revealed thatapproximately 26 migratory species or species habitat occuror are likely to occur in the Kempsey Shire. No new specieshave been listed since the previous year.
P R E S S U R E SWhy is it happening?
5.5 LAND CLEARING AND DEVELOPMENT
Population growth in the region, particularly on the coast,continues to result in greater demand for development inthe region. This causes subsequent pressure on biodiversitydue to land clearing for residential and rural residentialdevelopments. The associated need for greater services in
region such as gas pipes, power lines, water supply, sewageand new roads causes further pressure on biodiversity.
Land clearing and modification for rural activities in theregion that apply direct pressure on biodiversity includeagriculture (primarily cattle grazing) and logging. Thepressure applied by such economically driven activities doesnot always occur at an ecologically sustainable rate.
INDICATOR- Native Vegetation Clearing
Why use this indicator?
Loss/modification of habitat is one of the most significantkey threatening processes. This indicator shows the amountand rate of native vegetation, and subsequent habitat, lossin the Shire.
Data relating to areas approved for vegetation was not madeavailable by the DNR at the time of reporting.
What this indicator shows?
At present there is insufficient information available toaccurately quantify this indicator. Clearing informationshould be obtained for future reports so the rate of habitatloss in the Shire can be monitored and managed to reduceany potentially significant impacts on biodiversity. However,as not all clearing requires consent it is difficult to determinethe actual area of habitat loss, thus there may be a need toimplement a reporting system of all vegetation removalgreater than a given minimal amount in order to obtain amore accurate figure on native vegetation and habitat lossin the shire.
5.5.1 Significant Developments Proposals
The following have been development proposals withsignificant issues in the last year:
Waldel Park Subdivision, South West Rocks – Aproposal was put forward to subdivide 2 lots currentlyforming part of Waldel Park, South West Rocks. Theapplicant proposed to subdivide the study site for lowdensity residential development. Stage 1 involved a 23-lot subdivision with future stages subject to developmentconsent. Numerous environmental issues were raisedas a result of the proposal including flora and faunaimpacts, bushfire impacts and stormwater management.
Toorooka Composting Facility - An application wasreceived by Council to erect and operate an organiccomposting and fertilizer facility. The proposal includestransporting liquid animal waste from Fredericktonabattoirs, mixing the animal waste with grass clippingstaken from the subject land and sawdust supplied bythe applicant to make an organic compost. The compostwill be stored on site and used as a fertilizer and spread

State of the Environment Report 2005 - Supplementary 37
PRINTED ON 100% RECYCLED PAPER
State of the Environment Report 2005 - Supplementary 37
over subject land. An environmental management planwas developed for the site addressing the managementof groundwater, surface water, leachate (to DEC licencerequirements), gas and odour, incoming organics, andpest and vermin control. A soil nutrient balance andland capability assessment was also undertaken. Ongoingmonitoring of groundwater, surface water and soils isproposed to be undertaken as part of the managementplan to allow for the detection of potential contaminantsoriginating from the proposed facility.
5.6 FERAL ANIMALS AND DOMESTIC PETS
5.6.1 Feral animals
Feral animals apply a significant amount of pressure onnative fauna in the region as well as having an impact onflora. Some have been listed under the TSC and EPBCActs as Key Threatening Processes (KTPs). KTPs occurring(or likely to be occurring) in the region in relation tointroduced animals include:
Competition and land degradation by feral goats.
Competition and land degradation by feral rabbits.
Predation by feral cats.
Predation by the European Red Fox (Vulpes vulpes).
Predation, Habitat Degradation, Competition andDisease Transmission by Feral Pigs.
Competition from feral honey bees.
Predation by Gambusia holbrooki (Plague Minnow orMosquito Fish).
INDICATOR – Feral Animals Listing
Why use this indicator?
Feral animals apply a significant amount of pressure onnative fauna and flora and therefore the overall biodiversityin the region. By monitoring the extent and number offeral animals inhabiting the Shire we are able to see howeffectively feral animals are being managed, and thereforethe associated effects on biodiversity.
In the 2004/2005 reporting period growing numbers offeral pigs and deer have been reported in the uppertablelands and in the Maria River Region of the KempseyShire. Reports of feral dogs also represented a significantproportion of the feral animals reported to the KempseyRural Lands Protection Board in 2004/2005.
Feral animals of particular significance known to exist inthe Shire, reported in past SoE Reports include; hares,rabbits, foxes, black rat, brown rat, common mouse, feralcats, starlings, indian mynahs, house sparrows, mosquito
fish, goldfish/carp, trout, european honey bees and feraldogs and dingoes.
What this indicator shows:
It is evident that some species of feral animal have beenreported to be increasing in number and, hence, placingincrease pressure on biodiversity in the Shire.
Cane Toads have also been recorded in the area, thoughthe level of establishment is largely unknown.
5.7 EXOTIC PLANTS
Exotic plants threaten nearly all biological communities inAustralia. Although weeds appear to degrade many naturalecosystems, quantitative measures of their impact on thosesystems are relatively rare. Introduced plants that result inweed infestations including noxious weeds and gardenescapees are a major threat to biodiversity in the KempseyShire.
Recognised key biodiversity threatening processes that arecommon in the region are:
Invasion of native plant communities by Bitou Bushand Boneseed (Chrysanthemoides monilifera); whichdominates much of the local coastline, displacing nativeflora, and posing a recognised threat to ecologicalcommunities and threatened flora species.
Invasion of native plant communities by exotic perennialgrasses.
INDICATOR – Introduced Species/Weed Control
(NPWS)
Why use this Indicator?
Exotic species of particular concern especially in riparianzones include Camphor Laurel, Willow, Large-LeavedPrivet, Small-Leaved Privet, Wandering Jew, Blackberry, andparticularly Lantana that was prevalent at all sites surveyedwithin the Shire. Lantana grows in large thickets adjacent toriparian forests, often forming an impenetrable barrier andblocking access to sections of streams (DWR, 1994). Itprovides good habitat for small wildlife, especially birds,but can also harbor pests (eg. rats, cats and foxes).
Exotic species applying the most significant pressure inbiodiversity in high conservation areas of National Parksestate in the region are Bitou Bush and Lantana primarily inthe coastal region.
CONCLUSION: Pressure Increasing

38 State of the Environment Report 2005 - Supplementary
What this Indicator Shows?
The Department of Primary Industries provides a lists ofall the noxious weeds identified in Kempsey Shire. Nonew noxious weed species have been identified to be presentin the Shire in the last 12 months, however existing speciescontinue to cause considerable problems. Refer to the 2004Comprehensive SoE Report for a full list of the identifiednoxious weeds present in the Kempsey Shire.
The Weeds Strategy for the Macleay River Catchmentidentifies the following weeds as a major economic orenvironmental threat in the Macleay River Catchment:
Bitou Bush
Blackberry
Giant Parramatta Grass
Lantana
Nodding Thistle (Carduus nutans)
Small and Large-leaved Privet (Ligustrum sinense andL. lucidum)
Salvinia and Water Hyacinth
St Johns Wort (Hypericum perforatum)
5.8 BUSHFIRE
Fire is a natural process to which native animals and plantshave adapted to. Groups of animals and plants thatconstitute an ecosystem respond similarly to fire accordingto the characteristics of their life-history. Many smallmammals and most birds breed in Spring and Summer(commonly the fire period). As burned areas regenerate,different species find suitable habitat at the various levelsof regeneration. Changing fire regimes have been associatedwith the decline of many biological communities. Thecorrect management of fire is thus essential to avoiddisruption of ecosystems and extinction of species.
The Kempsey Rural Fire Service supplied preliminary dataon an estimated area burnt by bushfires within the KempseyShire during the reporting period. However, it should benoted that this data is not fully complete and is subject tofurther validation which may alter this figure in the future.The total area burnt during the 2004/2005 reporting periodwas approximately 523.54 ha, encompassing three mainbushfires/wildfires occurring from October to December2004.
The Kempsey Rural Fire Service continued to supply aservice to the community and Kempsey Shire Council in
CONCLUSION: Pressure Increasing
line with the service level agreement. This was achieved byparticipating in fire suppression and mitigation, communityeducation and public advice in relation to hazard reductionand development applications.
The community education team completed the Fireguardfor Kids program in a number of schools in the Shire’srural village areas, as well as visiting pre-schools and daycare facilities. Public displays were carried out at localmarkets within Kempsey, Crescent Head and Bellbrook.Public meetings for fire awareness and hazard reductionwere conducted at Hat Head and Stuarts Point.
Staffing levels increased with the employment of a FireMitigation Officer and a Development Control Officer.The Fire Mitigation Officer is based in Nambucca and sharesthe duties over the zone area while the Development ControlOfficer is based in Kempsey with duties shared overNambucca, Kempsey and Hastings. In 2004/2005 the RuralFire Service gave advice to Council on nine 79BA referralsas well as participating in the development of Councils’Bushfire Prone Land maps.
Volunteer Rural Fire Service brigades assisted with a totalof 8 hazard reduction burns across the Kempsey Shiretotalling 221 hectares of burning. Staff received and actedon 14 hazard complaints across the shire and volunteersissued 619 permits during last year’s bushfire danger period.
5.9 DISEASE
Diseases can have a significant impact on biodiversity in theregion. The NSW NPWS (2005) has compiled the followingKey Threatening Processes listed under the TSC Act andEPBC Act related to disease:
1. Infection of frogs by amphibian chytrid fungus causingthe disease chytridiomycosis.
2. Infection and dieback of native plants by root-fungus,Phytophthora cinnamomi
3. Psittacine Circoviral (beak and feather) Disease affectingendangered psittacine species.
Local Koala populations may also be affected by loss offoraging habitat and introduction of threats such as dogsand automobiles, leading to behavioural and nutritional stresson affected members of the local Koala population. MostKoalas are naturally affected with Chlamydia pathogens(Sharp and Phillips 1999, Phillips 1997). This and otherdiseases may develop when Koalas are under stress, ofwhich one major cause is habitat loss and disturbance.
The local Koala Preservation Society (KPS) received fewreports (<10) of Chlamydia in the local koala populationduring the reporting period with only one documented case

State of the Environment Report 2005 - Supplementary 39
PRINTED ON 100% RECYCLED PAPER
State of the Environment Report 2005 - Supplementary 39
at the Koloa Hospital. Three other individuals werebrought to the Hospital, two from motor vehicle hits andone from a dog attack.
R E S P O N S EWhat are the responses and how effective are they?
5.10 VEGETATION AND HABITATMANAGEMENT
5.10.1General Existing Management Measures
In general, habitat and vegetation is managed by varyingauthorities depending on the location of the habitat orvegetation, under provisions of the following main legalinstruments:
Environment Planning and Assessment Act 1978 (EP&AAct)
Threatened Species Conservation Act 1995 (TSC Act)
Native Vegetation Act 1997 (NCV Act)
Commonwealth Environment Protection andBiodiversity Conservation Act 1999 (EPBC Act)
SEPP 44 – Koala Habitat Protection.
SEPP 26 – Littoral Rainforest
SEPP 14 – Coastal Wetlands
SEPP 71 – Coastal Zone
National Parks and Wildlife Service Act 1974. (NPWSAct)
Kempsey Shire Tree Preservation Order (2002)
Depending on the area of land, ownership and/or relevantdevelopment or other proposal (if applicable), local (i.e.Council) or State Government Agencies (eg DIPNR, DECand NPWS) may have jurisdiction for administration ofprovisions under these instruments to ensure effectivemanagement of vegetation. Specific applications of theseinstruments are detailed in subsequent sections.
5.11 NATIONAL PARKS, NATURE RESERVES,STATE RECREATION AREAS AND OTHERRESERVES
The NPWS reserve systems in the Macleay includes severalnature reserves, historic sites, national parks, and stateconservation areas. These areas include:
Hat Head National Park;
Limeburners Creek Nature Reserve;
Willi Willi National Park;
Yessabah Nature Reserve;
Goolawah Nature Reserve; and
The Arakoon State Recreation Area.
The Macleay is also bordered by Werrikimbee, New Englandand Oxley Wild Rivers (over 91 231 ha) National Parks.Wilderness areas are located adjacent to (and including partsof) the latter National Parks. A significant area of the ruggedupper Macleay Valley is now wilderness including theMacleay Gorges wilderness area.
Council reserves also occupy a small area of the region.These reserves are primarily for recreational purposes.
INDICATOR - Effectiveness of Formal Reserve System
(in accordance with its comprehensiveness, adequacy
and representativeness within the region).
Why use this indicator?
This indicator aims to show both the type and area ofhabitat conserved within the reserve system. In Australiathis is identified as the main areas implementing biodiversityconservation. In order to effectively conserve biodiversitythe reserve system must display characteristics ofcomprehensiveness, adequacy and representativeness.
No major areas of land have been adopted by NPWS since2000 and as such the following data remains the same aspreviously reported. However, this report has attemptedto collate information and include land zoned under theKempsey LEP as Environmental Protection, as well as underVoluntary Conservation Agreements, Wildlife Refuges andLand for Wildlife.
Reserve Types Area (ha) Proportion of (%) Crown Reserves 1 1211 1.21 National Park 1 75,930.50 76.04 NPWS Historic Site 1 467.1 0.47 NPWS Nature Reserve 1 13,960.90 13.98 NPWS State Conservation Area 1 1,267.40 1.27 Zoned Environmental Protection (Draft 2004 LEP) 2 6,706 6.72
Voluntary Conservation Agreement 2 0 0.00 Wildlife Refuge 2 313 0.31 Land for Wildlife 2 0 0.00
Total: 99855.9 29.53 *
Table 5.5: Area of Macleay under formal conservation areas
Notes: 1. As at 20002. As at 2005
*. Percentage of total land area in Shire

40 State of the Environment Report 2005 - Supplementary
What this shows:
Currently approximately 99,856 ha of land, representing29.5% of the total land area in the Shire, is under formalreserve. This represents a slight increase from last yearsfigure, reflecting 313 ha of land designated as a wildliferefuge during the 2004/2005 reporting period.
Specific information regarding the type of vegetationmanaged in reserves is not available, as little detailed surveyof conservation areas has been undertaken. Suchinformation should be made available in future State ofEnvironment Reports.
The following NPWS managed reserves in the Shire haveimplemented Plans of Management:
Cooperbung Creek Nature ReserveGads Sugarloaf Nature ReservePee Dee Nature ReserveFifes Knob Nature ReserveYarravel Nature Reserve and Skillion Nature ReserveBoonanghi Nature ReserveMaria National ParkThe Castles Nature ReserveWilli Willi Caves Nature ReserveArakoon State Conservation AreaHat Head National ParkLimeburners Creek Nature Reserve
5.12 ASSESSMENTS AND RESTORATIONORDERS
5.12.1Threatened Species Assessments
For any development proposal that falls under theprovisions of the EP&A Act, Council routinely requestsflora and fauna impact assessments for threatened specieslisted under the TSC Act and EPBC Act, and forconsideration of Matters of National EnvironmentalSignificance (which predominantly relates to migratoryspecies listed under international agreements).
Some significant results detected in studies over the past 12months included, the detection of threatened species suchas the Wallum Froglet, Common Blossom Bat and GreyHeaded Flying Fox, in relatively isolated fragments of openforest and woodlands at South West Rocks.
CONCLUSION: Situation Improving
5.13 EXOTIC ANIMAL CONTROL
5.13.1Vertebrate Pests
Over the past 12 months vertebrate pest control has againconcentrated in the western portion of the district on wilddogs and dingos. The Rural Lands Protection Board(RLPB) continues running a strategic three point baitingprogram, which collaborates:
RLPB aerial baiting on private lands;
Private land owners independent baiting; and
Crown land (eg NPWS, State Forest, etc).
Rabbit, fox and feral cat management throughout the areais ongoing, with small scale pig trapping also occurring,primarily in the south eastern portion of the region.
5.13.2Companion Animals Act 1998
General Provisions and Implementation
The Companions Animals Act came into effect from July1, 1999. Relevant provisions under the Act aim to reducedeleterious impacts that domestic cats and dogs have onnative species via providing regulations that allow penalisationof irresponsible owners.
Under relevant provisions of the Act, Council continues toimplement regulations of its Companion AnimalsManagement Plan. The Plan outlines Council’s objectivesand direction in relation to Companion Animals.
Over the past year, approximately 275 dogs and 45 catswere impounded, which is considerably less than theprevious year that recorded 327 dog and 329 catimpoundments.
The local Koala Preservation Society (KPS) received severalreports of dog attacks on koalas during the reportingperiod, with the Koala Hospital receiving 1 individual as aresult of a dog attack.
5.14 WEED MANAGEMENT
Operational Works and Control Programs
A summary of the weed control programs implementedby Council is as follows:
Eradication of Bitou Bush, Gloriosa, Lantana and Sennacontinues along the coast as part of the Coastal WeedsEradication Program.
Extensive control programs are underway for sprayingof Giant Parramatta Grass with Taskforce on Roadsides.
Several new infestations of Groundsel Bush wereidentified during the reporting period and have beenadded to control programs and letters sent to privateproperty owners.

State of the Environment Report 2005 - Supplementary 41
PRINTED ON 100% RECYCLED PAPER
State of the Environment Report 2005 - Supplementary 41
A significant Water Hyacinth infestation in a large damaffecting three properties was identified. Controlmeasures were discussed with land owners and the needto continually suppress and destroy the weed.
Council was contacted by one of Kempsey’s largeNurseries to inform of their large infestation of SalviniaWeed in their dam (approximately 2 hectares). The damwas treated by a contractor with reasonably successfulresults.
Aerial inspections were carried out in April 05 forGroundsel Bush infestations in the Grassy Head, StuartsPoint, Clybucca, Collombatti and Kinchela areas.Infestations were mapped with the GPS. Inspectionletters have been sent to property owners to notify themthat they have infestations on their land.
Groundsel Bush treatment control program was thenimplemented and is close to completion. Infestationshave been treated on roadsides and reserves. Control isalso being carried out on crown lands in the vicinity ofStuarts Point. Further infestations were treated in theSouth West Rocks area, parts of the Pacific Highway,and other isolated areas of infestation.
A Noogoora Burr infestation in Sid Sutherlands Lanewas sprayed to prevent spreading into other roads,reserves and properties.
Red Lantana infestations were treated on roads andreserves to prevent spreading into adjoining lands. Areasconcentrated on were at Carrai/Warbro Brook Roads,Pipers Creek Road, Nulla Nulla Rd, Mungay CreekRoad, Stuarts Point and Grassy Head Roads, South WestRocks Road and other isolated areas of infestation.
Private Property Inspection Programme
The Private Property Inspection Program has incorporatedthe following works over the last year:
Inspection letters have been sent out to landowners fornew infestations of Giant Parramatta Grass andGroundsel Bush on their properties
Inspections are continually being carried out on privateproperty for Salvinia, Giant Parramatta Grass, GroundselBush, Water Hyacinth, Red Lantana, Blackberry, RiparianVine Weeds and Mother Of Millions as well as otherNoxious Weeds.
Legal Notices
No legal procedures regarding Section 18 Notices, Section20 Notices, Prosecutions or Penalty Notices have been issuedby Council during the reporting period.
5.14.1Other Agency Weed Management
NPWS
NPWS weed management programs continue to beimplemented in areas of high conservation (around SEPP14 and 26) in Arakoon, Limeburners Nature Reserve, HatHead National Park and at the Clybucca historical sites. Theseworks primarily target Lantana and Bitou Bush infestationthrough aerial and ground spraying, and hand removal.
5.14.2Community Weed Management
Weed control and native plant regeneration activities continueto be undertaken by South West Rocks Dune Care, HatHead Dune Care, Grassy Head Dune Care and GoolawahDune Care groups.
These groups have provided follow up weed control inareas on the coastal strip of the Macleay Valley, since theinitial removal of Bitou Bush and other weeds. The MacleayValley Working Group is a loose association of 4 dunecare groups who have been working in conjunction with abush regenerator to target priority areas including littoralrainforest and headland communities along a stretch of themid north coast.
5.15 BUSHFIRE MANAGEMENT
Council finalised its Bushfire Prone Land maps in 2003/2004 to assist in strategic planning and developmentassessment. Following this, Council introduced bushfireplanning guidelines, which will determine the way buildingsare sited, designed and constructed for bushfire prone areas.
Council routinely requires Bushfire Risk Assessments to besubmitted with DAs in areas considered fire prone.
F U T U R E D I R E C T I O N SWhat more could be done?
5.16 COMPREHENSIVE VEGETATIONMAPPING
Council has allocated funding for the 2005/2006 financialyear to undertake comprehensive vegetation mapping ofthe eastern portion of the Kempsey Shire. Gaining a greaterunderstanding of the what types of vegetation communitiesexist and where, will enable improved decision making withregard to protecting ecologically significant areas and aid inachieving ecologically sustainable development.
5.17 NORTHERN RIVERS CATCHMENTMANAGEMENT AUTHORITY
Catchment Management Authorities (CMA) are statutorybodies that are responsible and accountable for engaging

42 State of the Environment Report 2005 - Supplementary
their respective regional communities in the major naturalresource management issues.
The Shire falls under the jurisdiction of the Northern RiversCatchment Management Authority (NRCMA) that extendsfrom the Great Lakes to the Queensland border.
5.17.1Catchment Action Plan
The NRCMA is developing a Catchment Action Plan (CAP)for the Northern Rivers Region. The 10 year CAP willguide natural resource management across the NorthernRivers Region. The CAP will build on the Northern Rivers,Upper North Coast and Mid North Coast CatchmentBlueprints that currently operate across the Northern Riversregion. The NRCMA is currently conducting consultationon the Draft CAP to gain the northern rivers communitiesinput.
5.18 KEMPSEY SHIRE COMPREHENSIVEKOALA MANAGEMENT PLAN
The Kempsey Shire has been identified in the draft KoalaRecovery Plan (NPWS 2003) as a priority area for aComprehensive Koala Management Plan (CKMP).
Council is planning to fund the CKMP via contributionsunder the Environmental Levy and State funding. TheCKMP is projected to be prepared in 2006, and will mostlikely apply to the eastern half of the Shire, with focus onareas of significant Koala populations eg Yarrahappini,Kundabung and Crescent Head.

State of the Environment Report 2005 - Supplementary 43
PRINTED ON 100% RECYCLED PAPER
State of the Environment Report 2005 - Supplementary 43
GLANCEAt aHUMAN SETTLEMENTS
STATE PRESSURE RESPONSE FUTURE DIRECTIONS
Population and Demographics – Estimated residential population (ERP) for the Kempsey LGA determined by the then Planning NSW Department for 2001 was 27, 700
Population Growth – predicted to grow at a steady rate for the next 25 years reaching just over 29,000 in 2031
Age Distribution – Kempsey has an aging population associated with the baby boomers, lower birth rates and a higher percentage of younger people moving out of the Shire for work.
Local Economy – the economy experience 1.5% growth between 1991 and 2001.
Income – The percentage of households with weekly income levels less than $500 is higher in the Kempsey Shire than the Mid North Coast and NSW.
Employment – Wholesale and retail trade and education, health and community services are the biggest employers in the Shire
Population Growth and Development – South West Rocks is experiencing significant growth, as are rural subdivisions.
Aging Population
Settlement patterns – Kempsey is the largest urban centre, followed by South West Rock, while a significant number of people reside in the central rural area of the Shire.
Kempsey Shire Council Ecological Sustainable Development Policy
Transport – No major changes in lengths of roads in the shire, but 4.76 km of cycle ways are present within the shire.
Kempsey Shire Council Ecological Sustainable Development Policy
Planning Controls
Water & Sewage Treatment – is managed by Macleay Water, an arm of Kempsey Shire Council. Annual potable water consumption during 2004/2005 was 3954 Mega Litres (ML), which was slightly less than the previous years (2003/2004) 4044 ML
Waste – there was a slight increase in solid waste going to landfill during the past 12 months.
Waste Management Strategy
Integrated Water Cycle Management
Strategy
South West Rocks Proposed Reclaimed Water Scheme
Recycling – There is currently no kerbside recycling services in the Shire, while 11 drop-off centres located around the Shire receive glass, aluminium and paper only.
Water Accessibility – Macleay Water has identified water efficiency as the key issue.
Drinking Water Quality – Ongoing algae monitoring regime has indicated that for the past year, taste and odour causing algae numbers have been negligible
Civic Maintenance Team
Kerbside Recycling

44 State of the Environment Report 2005 - Supplementary
6.0 HUMAN SETTLEMENTS
6.1 INTRODUCTION
Human settlements are where we live. Cities, country townsand remote rural settlements all form our humanenvironment. The impact that human society has on theenvironment relates to its size, production and consumption,resource use, technology used to supply goods and servicesand our effectiveness in preventing or repairingenvironmental degradation.
In moving toward sustainability in the Kempsey Shire it isimportant to consider the interrelationships with the naturalenvironment in the decision making processes. To assessthe impact that human settlements have on the environment,the following topics will be addressed: population and urbanform, water and energy consumption, waste and transportuse.
S T A T EWhat are the issues for sustainability? And how are
they changing?
6.2 POPULATION AND DEMOGRAPHICS
The population of Kempsey Shire from the ABS 2001 rawstatistics was 26,934, with the estimated resident populationfor 2001 27,700.
6.2.1 Population Growth
INDICATOR – Population Growth
Why use this Indicator?
Population growth, including population distribution andmigration, combine with high-consumption patterns to putstresses on the environment, through increased demand forland resources and the need to increase infrastructurerequirements to support new and growing humansettlements.
26,500
27,000
27,500
28,000
28,500
29,000
29,500
2001 2006 2011 2016 2021 2026 2031
Figure 14 – Population Growth with Forecast
Source: DIPNR, NSW (2004)
What does this show?
The population of the Kempsey LGA is likely to havegrown close to 28,000 in 2005 and is predicted to grow ata steady rate for the next 25 years reaching just over 29,000in 2031. Population growth is expected to rise over thecoming decades as the area attracts retirees and othersseeking lifestyle changes. The coastal town of South WestRocks for example is expected to experience rapidpopulation growth.
6.2.2 Population Distribution
Changes in population distribution over the Shire havesignificant implications for the provision of services (eg.transport, water and sewerage). A breakdown of thepopulation distribution is provided in Figure 15 below.
The above Census information indicates that the majorityof the population within the Shire reside in the townshipof Kempsey (7,984 or 30%) and the coastal township ofSouth West Rocks (4,359 or 6%). The central rural region,encompassing the large hinterland areas to the north andsouth of Kempsey, also represents a large proportion ofthe population accounting for 25% (6,788).
6.2.3 Age Distribution
The following graph shows the percentage of the KempseyShire population within defined age bracket, with regional(Mid North Coast) and State (NSW) comparisons, sourcedfrom (ABS 2001).
CONCLUSION: Pressure Increasing
Inland Rural6%
Crescent Head4%
Frederickton3%
Central Rural25%
South West Rocks16%
Kempsey30%
Coastal Rural8% Hat Head
1%
Stuarts Point3%
Smithtown & Gladstone4%
Figure 15 – Population Distribution within the
Kempsey Shire (ABS, 2001)
0
5
10
15
20
25
30
35
0-14 15-24 25-44 45-64 65+
Age Group
Per
ce
nta
ge
Mid North Coast
NSW
Total Shire
Figure 16 – Age Distribution –Total Shire, Mid North
Coast and NSW

State of the Environment Report 2005 - Supplementary 45
PRINTED ON 100% RECYCLED PAPER
State of the Environment Report 2005 - Supplementary 45
Kempsey Shire has an aging population. The trend isreflected in Figure 16, which shows the Kempsey Shire andMid North Coast having a much higher percentage ofpeople older than 45 years compared to NSW. The reasonsfor this trend includes an influx of retirees, an agingpopulation associated with the baby boomers, lower birthrates and a higher percentage of younger people movingout of the Shire to major centres such as Sydney and otherlarge urban areas for education and work.
6.2.4 Local Economy
The Kempsey Shire annualised growth rate was 1.5% duringthe period 1991 to 2001 (ABS 2001). The 2001 Censusdata for Kempsey Shire revealed that although experiencinga slight decline since 1991, the manufacturing industryrepresented the greatest dollar output in 2001, accountingfor $A 199M dollars. The retail and construction industrywere the next highest dollar earners, accounting for $A 119Mand 98M respectively.
6.2.5 Income
The following chart represents the weekly household incomebrackets and the respective percentage of adults within eachincome bracket for the Kempsey LGA, the Mid NorthCoast and NSW in 2001.
Figure 17 – Weekly Household Income - Kempsey
Shire, Mid North Coast & NSW
0%
5%
10%
15%
20%
25%
30%
35%
40%
45%
50%
<$500 $500 - $1,000 >$1,000
Total Shire
Mid North Coast
NSW
The percentage of households with weekly income levelsless than $500 is higher in the Kempsey Shire than the MidNorth Coast and NSW. Closer analysis of the data revealedthat 46% of households in the Shire earned less than $500per week in 2001. This compares to 28% for the MidNorth Coast and 29% for NSW.
6.2.6 Employment
In the week prior to the Census in 2001, 8,396 people inKempsey were employed. Of these 4,677 were workingfull time and 3,433 were working part time. The workforceis skilled in community services, construction, agriculture,horticulture and manufacturing. The area has a mix of tradeskills and professional skills.
The largest employer in the Kempsey Shire is Wholesaleand retail trade, and education, health and communityservices, employing 43.1 % of the total work force. Thisfigure is similar to those for NSW, where 45 % are employedin the service industry.
These figures may change over the next ten years as tourismcontinues to grow in the Shire. The provision ofinfrastructure services is also expected to grow as townsand villages throughout the Macleay Valley Coast continueto expand and grow.
6.2.7 Unemployment Rates
The following chart illustrates unemployment rates forKempsey and neighbouring LGAs and “like type” rivertowns for comparison. Updated data indicates Kempsey’sunemployment rates continued to decrease from 10.6% inSeptember 2003 reaching a low of 8.8% in June 2004.Unemployment rates have increased during this reportingperiod to 10.7% in March 2005. Similar trends have beenexperienced in all neighbouring LGA’s and “like type’ rivertowns during the past 12 months, as shown Figure 18 below.
Figure 18 – Local and Regional Unemployment Rates
0
2
4
6
8
10
12
14
16
18
Sep-9
8
Sep-9
9
Sep-0
0
Sep-0
1
Sep-0
2
Sep-0
3
Mar
-04
Sep-0
4
Mar
-05
Time (months)
Un
rmp
loym
ent
Rat
e (%
)
Kempsey
Hastings
Grafton
Greater Taree
Nambucca Heads
6.3 TRANSPORT
The NSW Roads and Traffic Authority (RTA) is currentlyin the preliminary stages of designing the proposedKempsey-Fredericton Pacific Highway bypass, including theselection of the preferred route/s. Federal funding has notyet been directed for the construction of the bypass, whichis not expected to be completed for some years. Whencompleted the bypass will remove significant volumes oftraffic from the above-mentioned urban areas, though willalso encourage an increase in the volume of traffic passingthrough the Shire.
No updated information regarding estimated lengths ofcertain road types was available at the time of reporting,however little change is expected from last years figures,presented in the table below, although the estimated lengthof cycle ways has now been calculated.

46 State of the Environment Report 2005 - Supplementary
Table 6.1: Road Transport Infrastructure in Kempsey.
Commercially operated public transport buses operatebetween Kempsey and some outlying villages and facilitatethe transportation of school children. Walking and cyclingnot only represent environmentally sustainable options, butthey also have added potential health benefits.
6.4 WATER & SEWAGE TREATMENT
The centralised urban water supply and wastewater systemsthroughout the Kempsey Shire are the responsibility ofMacleay Water. Macleay Water is a separate business unit ofKempsey Shire Council.
Macleay Water’s short and long-term goal is to providehigh quality water services to Kempsey Shire’s urbancommunities in a cost effective and environmentallysustainable manner.
6.4.1 Water Consumption
INDICATOR – Water Consumption in the Kempsey
Shire
Why use this indicator?
The extraction of water for human consumption andindustry puts pressure on surface and groundwater resources.Population growth and subsequent new development willgenerally increase the need for clean potable water to bedrawn from the environment and as such put an extra strainon surface and groundwater resources.
Figure 19 – Total Water Consumption
Road Classification Estimated Length (km) Regional Roads 142 Urban Roads 161 Non-urban sealed roads 286 Non-urban unsealed roads 574 Bridges and Culverts 7.5 Cycle Ways 4.76
0
1000
2000
3000
4000
5000
6000
93-9
4
94-9
5
95-9
6
96-9
7
97-9
8
98-9
9
99-0
0
00-0
1
01-0
2
02-0
3
03-0
4
04-0
5
Financial Year
To
tal
Co
ns
um
pti
on
(M
L)
Total Water Consumpton (ML)
Linear (Total Water Consumpton (ML))
What this shows?
Annual potable water consumption during 2004/2005 was3,954 Mega Litres (ML), which was slightly less than theprevious years (2003/2004) 4,044 ML. While consumptionrates have trended downwards since 2001/2002 this mayreflect less extraction from the Macleay, following the fillingof the Stuart Macintyre dam, between 2000-2002.However, the linear trend line in the above chart showsannual potable water consumption rates for the KempseyShire are increasing, consistent with current populationgrowth.
6.5 WASTE
6.5.1 Solid Waste
Waste disposal in the Shire has been confined to one facilitywithin the Kempsey Shire; the Kempsey Waste Receival andDisposal Facility (KWRDF), located along Crescent HeadRoad. Three former landfill sites located at Stuarts Point,South West Rocks and Bellbrook have been eitherpermanently or temporarily capped and are currently usedas waste transfer stations. The centralisation of wastedisposal activities rather than having a number ofuncontrolled landfills scattered throughout the Macleayprovides for a more economical and efficient disposal ofwaste for the community that minimises environmentalimpacts.
INDICATOR – Waste to Landfill
Why use this indicator?
Australia is the second highest producer of waste in theworld (second only to the USA) with most landfill sitesfilling at an unprecedented rate. As a result, more and morespace is required to dispose of our waste safely. The volumeof waste going to landfill (excluding green waste andrecyclables) for the past three financial in the Kempsey Shireis shown in Figure 20 below.
Figure 20 – Volume of Waste to Landfill
CONCLUSION: Pressure Increasing
0
4000
8000
12000
16000
20000
24000
2002/2003 2003/2004 2004/2005
Financial Year
Was
te t
o L
and
fill
(To
nn
es)

State of the Environment Report 2005 - Supplementary 47
PRINTED ON 100% RECYCLED PAPER
State of the Environment Report 2005 - Supplementary 47
What this Shows:
Waste going to landfill increased considerably between 2002/2003 and 2003/2004 with a slight increase during the last12 months. The increased waste to landfill is most likelyindicative of population growth and development that hasoccurred over the same time period.
6.5.2 Recycling
There is currently no provision of kerbside recycling servicesto households in the Kempsey Shire. Eleven drop-offcentres are provided in villages throughout the Shireincluding provision for recyclable collection at the transferstation sites and the Kempsey Waste Receival and DisposalFacility (KWR&DF). These centres provide collectionreceptacles for glass containers, aluminium cans and paperand cardboard.
Green waste, steel, timber and rubber tyres and car batteriesare separated where possible at the waste transfer stationsfor recycling. Resalable item are also separated from thewaste stream where possible and on-sold to the public.
6.6 STORMWATER
Stormwater collection, pollution and Management Plansare discussed in detail in Chapter 3.0 – Water.
P R E S S U R EWhy is it happening?
6.7 POPULATION GROWTH
Population growth places increased pressure on essentialservices of water supply, wastewater treatment and wastedisposal and/or reuse. It also places pressure on landresources as is discussed in Section 2.0 – Land, through theneed for new residential subdivisions, industrial land andextractive resources for roads and construction.
6.8 DEMOGRAPHICS
Kempsey Shire’s aging population will increase pressure onproviding services to the aged. Thorough planning isrequired to ensure that such services can be provided, whilestill allowing for the needs of the broader community tobe met, without compromising environmental health.
6.9 SETTLEMENT PATTERNS
As identified in the previous Comprehensive SoE Report,settlement patterns in the Shire appear to have experienced
CONCLUSION: Pressure Increasing
a significant increase in rural/residential development anddevelopment of the coastal fringe, particularly South WestRocks. This increases the pressure on service provision andland resources in these growth areas.
6.10 WATER ACCESSIBILITY
Further development in coastal regions is placing pressureon water resources and the need for more efficient use ofsuch resources is vital to ensuring sustainable water usage.
Water efficiency will become increasingly important becauseof the pressure being applied by the State Governmentthrough the implementation of water sharing plans. Theseplans will spell out how much water (access rights) MacleayWater will be able to extract from a water source. From allcurrent indications, these access rights will be considerablyless than current licence allocations.
6.11 DRINKING WATER QUALITY
Ongoing algae monitoring regime has indicated that forthe past year, taste and odour causing algae numbers havebeen negligible. However, the dam was taken offline from27 September 2004 through to 27 December 2004 due toa large string like algae causing blockage in the reticulationnetwork. The dam came back online again from 18 April2005 to 9 May 2005 to allow for the cleaning of GreenhillReservoir.
While the dam is offline, it impacts on the environment inthat stress on the Macleay River cannot be alleviated duringdry times when dam is offline.
R E S P O N S EWhat are the responses and how effective are they?
6.12 ECOLOGICALLY SUSTAINABLEDEVELOPMENT POLICY
Kempsey Shire Council’s Ecologically SustainableDevelopment Policy as discussed in Chapter 1.0 –Introduction, provides the necessary principles andphilosophies to be used in discission making to futureplanning and development to move towards sustainability.This will be achieved through the full consideration of theSocial, Economic and Environmental elements of proposedplanning of human settlements both in the present and forthe future.
6.13 PLANNING CONTROLS
Planning controls are and will in future be revised and createdto ensure the sustainability of Human Settlements withinthe Kempsey Shire. Table 17 in the previous Comprehensive

48 State of the Environment Report 2005 - Supplementary
SoE Report provides a detailed list of Development ControlPlans (DCPs) directly related to sustainability of HumanSettlements. No new DCPs have been identified to relateto sustainability of Human Settlements within the past 12months.
6.14 WASTE MANAGEMENT STRATEGY
The Kempsey Shire Council Waste Management Strategycontinues to plan, develop, provide and manage anenvironmentally responsible and cost effective wastemanagement system that addresses the needs andexpectations of the community. The Waste ManagementStrategy also aims to act in accordance with the NSW WasteAvoidance and Resource Recovery Strategy 2003 (ResourceNSW) targets for reduction in waste to landfill, increasingthe recovery and reuse of materials from the waste streamand by aiming to reduce litter and illegal dumping.
A range of site improvement works, identified in theprevious Comprehensive SoE Report were completed inmid 2004 at the Kempsey Waste Receival & Disposal Facility(KWR&DF), located on Crescent Head Road. Theseimprovements have enabled Council to remove materialsfrom the waste stream that can be reused and/or recycled.
Kempsey Shire Council continues to be an active memberof MidWaste (Mid North Coast Waste Forum), which isthe forum made up of representatives from eight memberCouncils located on the Mid North Coast of NSW, whosefocus is regional co-operation in waste management andwaste minimisation.
6.15 URBAN STORMWATER MANAGEMENTPLAN
The Kempsey Shire Urban Stormwater Management Planis discussed in detail in Chapter 3 – Water.
6.16 CIVIC MAINTENANCE TEAM
Kempsey Shire Council’s Civic Maintenance Team continuesto actively maintain business centres within the Shire toensure these areas are kept clean and presentable.
F U T U R E D I R E C T I O N SWhat more could be done?
6.17 ESD
As part of Kempsey Shire Council’s ESD Policy, a LocalAgenda 21 program will be undertaken. A key element ofthe program will be the establishment of the ESD WorkingGroup, including Council and public representation, to worktoward setting goals for sustainability.
6.18 INTEGRATED WATER CYCLEMANAGEMENT STRATEGY
Ongoing review of the Integrated Water Cycle ManagementStrategy (IWCMS) will take place over the coming years,incorporating planning and management of the three mainurban water services of water supply, sewerage andstormwater. Planning and managing these services togetherwill help to:
• Meet customer needs;
• Maximise the value of water resources; and
• Minimise the impact of water use on the environment.
6.19 SOUTH WEST ROCKS PROPOSEDRECLAIMED WATER SCHEME
In response to rapid population growth and the sensitiveenvironmental location of
South West Rocks Kempsey Shire Council has proposed areclaimed water scheme be developed. The aim of thisreclaimed water Scheme is to ensure wastewater from thelocal Sewerage Treatment Plant (STP) is treated to a veryhigh quality and then reused in new residential developmentand community irrigation initiatives such as South West Rocksgolf course and sporting fields. The main benefit of thescheme is that it will reduce the amount of effluent beingdischarged into the environment via the existing sand dunedisposal site and also decrease pressure on water supplydemands.
6.20 KERBSIDE RECYCLING
Kempsey Shire Council, through in Waste ManagementStrategy, is continuing to work towards the provision of ahousehold kerbside recycling service for plastics, paper andglass. It is hoped that this can be achieved through resourcesharing initiatives currently being investigated within theMidWaste group of Councils.

State of the Environment Report 2005 - Supplementary 49
PRINTED ON 100% RECYCLED PAPER
State of the Environment Report 2005 - Supplementary 49
GLANCEAt aABORIGINAL AND NON-ABORIGINAL HERITAGE
STATE PRESSURE RESPONSE FUTURE DIRECTIONS
Aboriginal Heritage –Two more sites have been identified during the past 12 months categorised as an ‘artefact’ and ‘stone quarry’. There is now a total 677 sites recoreded in the Shire.
Non-Aboriginal Heritage – There are 87 identified Non-Aboriginal heritage sites in the Shire
The main pressures facing heritage areas are:
• Encroachment by development
• Community attitudes
• Inadequate policy relating to protection of sites
• Development of unregistered sites
• Natural weathering and aging process
• Lack of economic resources for appropriate maintenance
Conservation and Planning Controls -
All Aboriginal areas/structures within the Kempsey Shire LGA sites are protected under the National Parks and Wildlife Act (1974), however, only a small number sites have specific protection measures in place.
Major Non-Aboriginal sites include the Trial Bay Gaol and the Smokey Cape Lighthouse, which are protected under the Environment Protection and Biodiversity Conservation Act 1999 (EPBC Act).
Council continues to update its list of sites as new sites are identified.

50 State of the Environment Report 2005 - Supplementary
7.0 ABORIGINAL AND NON-ABORIGINALHERITAGE
7.1 INTRODUCTION
Heritage is important because it provides cultural identityto communities and nations. It also provided opportunitiesfor future generations to gain knowledge and understandingof their past. By linking our past and present we gain anappreciation of the way we were, where we’ve been andwhere we should be going. Australian history and the historyof the Kempsey Shire can be separated into two distincteras of pre European settlement and post Europeansettlement.
S T A T EWhat are the issues for sustainability? And how are
they changing?
7.2 ABORIGINAL HERITAGE
The Macleay area is part of the territory of the Thunghutti(Dhunghutti), which extends from Point Plomer toMacksville, inland to Kemps Pinnacle. Prior to Europeansettlement, this area supported a large and denselyconcentrated aboriginal population.
7.2.1 Identified Aboriginal Sites, Structures and
Landscapes
The DEC (2005), through the NSW NPWS’ AboriginalHeritage Information Management System (AHIMS),provides a database that records all known aboriginal sitesin NSW, including the Kempsey Shire. However, explicitdetails cannot be provided due to legal requirements.
Council employs an Aboriginal Liaison Officer to assist withestablishing links with the aboriginal community in relationto the identification and protection of sites.
When an aboriginal heritage site is identified or believed tooccur, it must be reported to the NSW National Parks andWildlife Service, so that the appropriate course of actionfor conservation, in consultation with the Land Council,can be undertaken.
INDICATOR – Number and Nature of Aboriginal
Sites
Why use this indicator?
This indicator provides an assessment of the number andtypes of identified aboriginal heritage sites. The followingrecorded sites and structures should be regarded as indicativeas all sites are possibly not known.
Table 7.1: The number and Nature of Aboriginal sitesin the Kempsey Shire
Site Feature Number
Previously Recorded
Number Identified
during 2004/2005
Aboriginal Resource and Gathering 1 0
Aboriginal Ceremony and Dreaming 26 0
Art (Pigment or Engraved) 1 0
Artefact 267 1
Burial 28 0
Ceremonial Ring 25 0
Conflict 5 0
Earth Mound 148 0
Fish trap 1 0
Grinding groove 1 0
Habitation Structure - 0
Hearth 1 0
Non-Human Bone and Organic Material - 0
Ochre Quarry - 0
Potential Archaeological Deposit (PAD) - 0
Shell 150 0
Stone Arrangement 6 0
Stone Quarry 6 1
Modified tree (Carved or Scarred) 9 0
Water Hole - 0
Total 675 2
What this shows:
This shows that there are many significant AboriginalHeritage sites in the Kempsey Shire. Two more sites havebeen identified during the past 12 months categorised as an‘artefact’ and ‘stone quarry’. The total number of sitesrecorded above (677) has increased from 301 recorded inthe 2000 SoE Report.
7.3 NON ABORIGINAL HERITAGE
Items of non Aboriginal heritage refer to those buildings,works, relics or places of historical, scientific, cultural, social,architectural, or aesthetic significance that have occurred inthe Shire post European settlement. It also includes areasof natural significance, such as rainforests that have remainedintact after European settlement.
7.3.1 Heritage Listed Sites, Structures and
Landscapes
INDICATOR – Number of Sites of Heritage
Significance
Why use this indicator?
This indicator provides an assessment of the number and typesof identified of heritage items of non-Aboriginal heritagesignificance and will aid in the protection of these sites forfuture generations to enjoy. The following Table lists the numberof sites of National, State and Local post European and naturalheritage significance occurring in the Shire.
CONCLUSION: Situation Improving

State of the Environment Report 2005 - Supplementary 51
PRINTED ON 100% RECYCLED PAPER
State of the Environment Report 2005 - Supplementary 51
Table 7.2: Number of Non-Aboriginal Heritage Sites in the Kempsey Shire
National Significance
State Significance
Local or Regional
Significance
Site
Reg
iste
r o
f N
atio
nal
Est
ate
Wo
rld
Her
itag
e L
ist
Co
mm
on
wea
lth
H
erit
age
Lis
t
NS
W H
eri
tag
e A
ct
NS
W G
ove
rnm
ent
Gaz
ette
Sta
te G
ove
rnm
ent
Ag
ency
R
egio
nal
E
nvi
ron
men
tal
Pla
n (
RE
P)
Lo
cal
En
viro
nm
enta
l P
lan
(L
EP
)
Natural Arakoon State Recreation Area ?
Banda Banda Flora Reserve ?
Bellbrook Conservation Area ?
Central Eastern Rainforest Reserves (Hastings-Macleay Group)
?
Central Eastern Rainforest Reserves (New England Group)
?
Cybucca Nature Reserve Proposal ?
Hat Head National Park ?
Limeburners Creek Nature Reserve ?
New England National Park (1978 boundary) ? ?
New England National Park (1989 boundary) ? ?
North Eastern Rainforest World Heritage Area ?
The Castles Flora Reserve ?
Willi Willi Caves Nature Reserve ?
Yarravel Nature Reserve ?
Yessabah Caves Area ?
Post European Settlement
All Saints Anglican Church and Grounds ? ?
All Saints Catholic Church and Hall ?
Arakoon House ? ? Bride Over Five Day Creek ? ?
East Kemspey Public School ?
Frederickton Post Office ? ?
Frederickton Public School ? ?
Frederickton School of Arts ? ?
Frederickton Shelter Shed ?
Gladstone Courthouse and Police Station ? ? ?
Gladstone Police Register ?
Headmasters Residence - Frederickton ?
Kempsey Courthouse ? ? ?
Kempsey District Hospital ?
Kempsey Post Office ? ? ?
Kempsey Rail Bridge Over Macleay River ?

52 State of the Environment Report 2005 - Supplementary
Kempsey Railway Station ? ? ?
Kempsey Showground Site (including ring and main pavilion)
?
Kempsey Traffic Bridge ?
Kempsey Police Station, including Police Residence
?
Macleay River Hotel ?
Oddfellows Hall ? ?
Pacific Guest House ? ? ?
Pipers Creek Lime Kilns ? ? ?
Pilots Residence and 3 Boatmen’s Cottages ? ?
Signal Station and Flagstaff, South West Rocks
?
Smokey Cape Lighthouse ? ? ? ? ?
St Andrew’s Presbyterian Church and Hall ? ? ?
The English Scottish and Australian Charted Bank
?
Trial Bay Gaol ? Trial Bay Gaol and German Graves ? ? ?
West Kempsey Post Office ?
West Kempsey Hotel ? ?
Yarrahapinni Primary School ?
National Significance
State Significance
Local or Regional
Significance
Site
Reg
iste
r o
f N
atio
nal
Est
ate
Wo
rld
Her
itag
e L
ist
Co
mm
on
wea
lth
H
erit
age
Lis
t
NS
W H
eri
tag
e A
ct
NS
W G
ove
rnm
ent
Gaz
ette
Sta
te G
ove
rnm
ent
Ag
ency
R
egio
nal
E
nvi
ron
men
tal
Pla
n (
RE
P)
Lo
cal
En
viro
nm
enta
l P
lan
(L
EP
)
Note: There is a considerable degree of overlap between sites, with many being listed on more than 1 register.

State of the Environment Report 2005 - Supplementary 53
PRINTED ON 100% RECYCLED PAPER
State of the Environment Report 2005 - Supplementary 53
What does this show?
This indicator demonstrates that in total there are 34 sitesof post European settlement heritage significance and 16sites of natural heritage significance occurring in the Shire.These sites require appropriate management to maintainhistorical ‘snapshots’ of the Shire.
Closer examination of the National Heritage Registers andLists revealed that a further 5 sites are listed as an ‘indicativeplace’, 3 under the Register of the National Estate and 2under the Commonwealth Heritage List. An indicative placemeans that data has been entered into the relevant Registeror List and the place is at some stage in the assessmentprocess, with a formal decision on whether the place shouldbe entered in the Register or List, yet to be finalised.
Preliminary results of the comprehensive Community BasedHeritage Study has identified numerous other sitesthroughout the Shire recommended to be listed as itemsof environmental heritage.
P R E S S U R EWhy is it happening?
The main activities continuing to place pressure on heritageareas are:
Encroachment by developmentCommunity attitudesInadequate policy relating to protection of sitesDevelopment of unregistered sitesNatural weathering and aging processLack of economic resources for appropriatemaintenance
R E S P O N S EWhat are the responses and how effective are they?
7.4 CONSERVATION AND PLANNINGCONTROLS
7.4.1 Protection for Aboriginal Heritage Sites
All Aboriginal areas/structures within the Kempsey Shireare protected under the National Parks and Wildlife Act(1974), however, only a small number of sites have specificprotection measures in place. Licenses under the NationalParks and Wildlife Act (1974) are required under the Actfor works, which have the potential to impact on AboriginalHeritage either positively or negatively. Licences are requirednot only for activities which may destroy or damage objectsor places, but for conservation works or relocation ofAboriginal heritage objects.
7.4.2 Protection for Post European Settlement
Heritage Sites
A number of post European settlement heritage sites andstructures throughout the Kempsey Shire are protected undervarious Registers and Lists identified in Table 7.2 above.Such examples include, the Smoky Cape Light House, listedon the Commonwealth Heritage List and Trial Bay Gaolon the Register of National Estate. Both these sites areprotected under the Environment Protection andBiodiversity Conservation Act 1999 (EPBC Act), whichrequires that approval is obtained before any action takesplace which has, will have, or is likely to have, a significantimpact on the Commonwealth and/or national heritagevalues of a listed place.
Local Heritage Study
Council is close to finalising the Kempsey Shire CommunityBased Heritage Study. Preliminary results have indicatedthat numerous sites of post European settlement heritagesignificance exist throughout the Shire. The study hasidentified those items which are already listed on variousregisters and those which are recommended to be placedon the relevant registers.
F U T U R E D I R E C T I O N SWhat more could be done?
Council continues to update its lists and maps of aboriginaland non-aboriginal heritage sites. New sites becomeuncovered with new development and redevelopment ofsites. The requirement for inspection of new sites by anarchaeological consultant in conjunction with the localAboriginal Lands Council aims to ensure no sites aredisturbed.

54 State of the Environment Report 2005 - Supplementary
GLANCEAt aCOUNCILS ENVIRONMENTAL PERFORMANCE
STATE PRESSURE RESPONSE FUTURE DIRECTIONS
Energy Consumption – Council’s total electricity consumption for the reporting period was approximately 1,094,743.44 kWh
Environmental Levy Works Program
Water Consumption – Council used 136,825kL of water 2004/2005, accounting for 4.47% of the total water consumed in the Shire.
Regulatory and Planning Assessment and Compliance – Council has established a compliance register to measure the number and types of non-compliances.
Waste Generation – Council produces a wide range of liquid and solid wastes many of which may have untapped potential for recycling or reuse.
Local Agenda 21 Program
Triple Bottom Line Reporting - Council has developed a Triple Bottom Line reporting template for all business paper reports to ensure that social, economic and environmental considerations are duly addressed to enable informed decision making for sustainable outcomes.
Environmental Management - A site Water Management System has been developed for the Kempsey Waste Receival & Disposal Facility (KWR&DF) with regard to the protection of groundwater and surface waters within the vicinity of the site.
Paper Usage – Council used 3,735 reams of non-recycled copying paper (includes coloured & white paper), 31,000 sheets of letterhead paper and 200 memo pads at a total approximate cost of $23,813.
Fuel Consumption – Total fuel consumption (including all vehicles fleets) for Kempsey Shire Council for 2004/2005 was approximately 506,000 litres
Budget – The budget data figures for this year follow a similar trend to previous years with a steady increase in operating expenditure, whilst again a fluctuation in capitol expenditure saw a marked decrease in this figure. The data also indicates there was a budget surplus for the 2004/2005 reporting period. Community Concerns – Community surveys indicate that all environmental projects were rated as ‘important’ to ‘very important’ with water quality programs rated by respondents to be of the highest importance. Other environmental projects the community would like council to consider for future funding, were ‘environmental protection and beautification’, ‘recycling service’, ‘control of weeds’ and ‘river maintenance’ Work Practices – Kempsey Shire Council does not currently have a corporate Environmental Management Plan
Recycled Content Purchasing Policy – Council signed up to the Buy Recycled Business Alliance (BRBA) in late 2004. BRBA is a non-profit pro-Sustainability alliance of businesses that are united by a commitment to promote the purchase and use of recycled content products (RCPs) and materials.
·Purchasing of more environmentally friendly vehicles – Clean Car Benchmarks Purchasing more efficient and renewable energy supplies – Green Power Development of an environmental management plan.

State of the Environment Report 2005 - Supplementary 55
PRINTED ON 100% RECYCLED PAPER
State of the Environment Report 2005 - Supplementary 55
8.0 COUNCIL’S ENVIRONMENTALPERFORMANCE
8.1 INTRODUCTION
Following on from last years Comprehensive Report, thissection of the State of the Environment Report aims toaddress Kempsey Shire Council’s performance in movingtoward sustainability. Many of the issues and environmentalindicators contained within the State of the EnvironmentReport have been quantified for the first time andcomparisons to previous years data may not be possible.However, these indicators will provide a means to measureCouncil’s performance in future reporting years.
S T A T EWhat are the issues for sustainability? And how are
they changing?
8.2 ENERGY CONSUMPTION
While the Kempsey Shire Council is not regarded as a majorproducer of greenhouse gasses, Council needs to lead byexample with regard to reducing greenhouse gasses.
INDICATOR – Council Energy Consumption
Why use this indicator?
Energy consumption in the form of electricity from fossilfuel consuming power plants produces greenhouse gases.For every kilowatt-hour of electricity produced, a proportionof CO
2 is emitted to the atmosphere. Whist electricity
production occurs outside of the Kempsey Shire, the impacton the greenhouse effect directly affects the environmentof the region.
What this shows:
Council’s total electricity consumption, sourced fromCountry Energy 2005, for the reporting period wascalculated to be approximately 1,094,743.44 kWh. Thisfigure includes electricity consumed in all Council ownedbuildings, workshops, and fixtures operated by Council.
The Australian Greenhouse Office annually determines eachState’s Greenhouse coefficient, based on their respectivesources of electricity generation. The NSW Pool Coefficientis an indicator of the average emissions intensity of electricitysourced from the electricity grid in NSW. It represents theemissions of greenhouse gases (in tonnes of carbon dioxideequivalent) per MWh of electricity supplied from the ‘pool’of major power stations (Australian Greenhouse Office2005). Therefore using the NSW 2005 Pool Coefficient of0.913 tonnes/MWh, it can be calculated that Council’s
consumption of 1097.74 MWh of electricity produced1,002.78 tonnes of CO
2 in 2004/2005.
Historical energy consumption data was not available forcomparison but annual electricity consumption totals willcontinue to be collected for future reports, with a view toidentifying areas for improvement in energy efficiency. Onesuch improvement may include purchasing more efficientand renewable energy supplies (eg. promote the purchasingof Green Power).
8.3 WATER CONSUMPTION
Extraction of water from the environment for HumanSettlements put pressure on the natural environment andwater resources as has been discussed in detail in Chapter 3– Water.
INDICATOR – Council’s Water Consumption
Why use this indicator?
Council needs to take a leading role in driving waterefficiency within the Kempsey Shire LGA.
Table 8.1: Council Water Consumption
Water Meters Total Consumption
(kL) Parks, Ovals and Ancillaries 23,799
Water Installations 2 Sewer Installations 71,511
Council Buildings/Public Uses 41,513
Total metered consumption - council operations 136,825
Total shire metered consumption 3,057,902
Where:
WATER INSTALLATIONS - All meters connected to water treatmentplantsSEWER INSTALLATIONS - All meters connected to sewer treatmentprocesses, works, pump stations.COUNCILS BUILDINGS / PUBLIC USES / PARKS, OVALS ANDANCILLARIES - All meters connected to council buildings, civic centre,baby health centres, halls, libraries, community service buildings, publictoilets, swimming pools, parks, sporting fields, cemeteries, fish cleaningtables, BBQ facilities, tennis courts, beach showers.
What this shows:
This indicator demonstrates that during the 2004/2005financial year Council water consumption accounted forapproximately 136, 825 kL or 4.47% of the total waterconsumed in Kempsey Shire. This figure has increased from119,845 kL in 2003/2004 financial year.
8.4 WASTE GENERATION
Kempsey Shires Council operations produce a wide rangeof liquid and solid wastes. Councils revised WasteManagement Strategy aims to quantify generation rates andcomposition of wastes generated in all aspects of Council’sendeavours.

56 State of the Environment Report 2005 - Supplementary
Council is currently looking at individual areas of wastegeneration and determining the best options for reducing,reusing and recycling materials and resources from all counciloperations in conjunction with the Resource RecoveryCoordinator.
8.5 PAPER USAGE
INDICATOR – Office Paper Usage
Why use this indicator?
The use of non-recycled or recycled content office paperimpacts upon the greenhouse effect due to a reliance onforestry resources. Council does not currently have arecycled content purchasing policy with regard to paper.
What this shows:
In the 2004/2005 reporting period, Council usedapproximately 3,735 reams of non-recycled copying paper(includes coloured & white paper), 31,000 sheets ofletterhead paper and 200 memo pads at a total approximatecost of $23,813.
A trial run (approximately 50 reams) of recycled paper waspurchased during the reporting period for general copyingand use in Council minute taking.
8.6 FUEL CONSUMPTION
The large area encompassed by Kempsey Shire Counciloften requires relatively long travel distances between worksites. Despite the fact that air pollution is not regarded as amajor problem in the Shire, there is potential to reducegreenhouse emissions through effective management ofCouncil’s fleet of vehicles. This could range from continuingto ensure vehicles are running efficiently and cleanly (i.e.appropriate servicing), minimising kilometres travelled (i.e.via car pooling, work schedules) or by investigatingalternative technologies.
Fleet Vehicles
General Earth moving equipment, heavy and light commercial vehicles, minibus, 4WD, sedans and wagons, ride on mowers, tractors, trailers and street
sweeper
Garbage Garbage Collecting Trucks and Landfill Compactors
SES 4WD and Utilities
Community Services Minibuses
Water Backhoes, heavy and light commercial vehicles, 4WD and utilities,
sedans and wagons, trailers and motorcycle.
Kempsey Shire Council’s vehicle fleet serves a wide rangeof purposes and therefore includes a variety of vehicles,from heavy machinery through to light commercial 4WD,and council sedans and wagons. Table 8.2 shows thegeneralised categories the vehicle fleet is divided into.
Total fuel consumption (including all vehicle fleets) forKempsey Shire Council for 2004/2005 was approximately506,000 litres. However this figure is considered to berelatively conservative due to human error (ie. incorrect litrereadings during re-fills and missing data regarding fills thatoccurred outside council’s fuel card system). Fuelconsumption data for all fleet categories except “General”was not recorded prior to 2004/2005 and so total fuelconsumption could not be accurately quantified andcompared to previous financial years.
The number of vehicles operated along with recent andhistorical fuel consumption data for Kempsey ShireCouncil’s “General” vehicle fleet only is displayed in Figure21 below.
Figure 21 – Council Fuel Consumption and Number
of Vehicles
What this shows:
Over the past 5 years the number of vehicles in Council’s“General” fleet has increased along with fuel consumption.The reason for this increase can be attributed to an increasein staff numbers and thus vehicles required to resource theneeds of the broader community associated with an increasein population and development pressures as identifiedthroughout this report.Table 8.2: Councils Vehicle Fleet
0
50,000
100,000
150,000
200,000
250,000
300,000
350,000
400,000
2000-2001 2001-2002 2002-2003 2003-2004 2004-2005
Financial Year
Fu
el C
on
sum
pti
on
(lit
res)
0
20
40
60
80
100
120
140
160
No
. V
eh
icle
s (
ge
ne
ral
fle
et)Fuel Consumption (litres)
Number of Vehicles
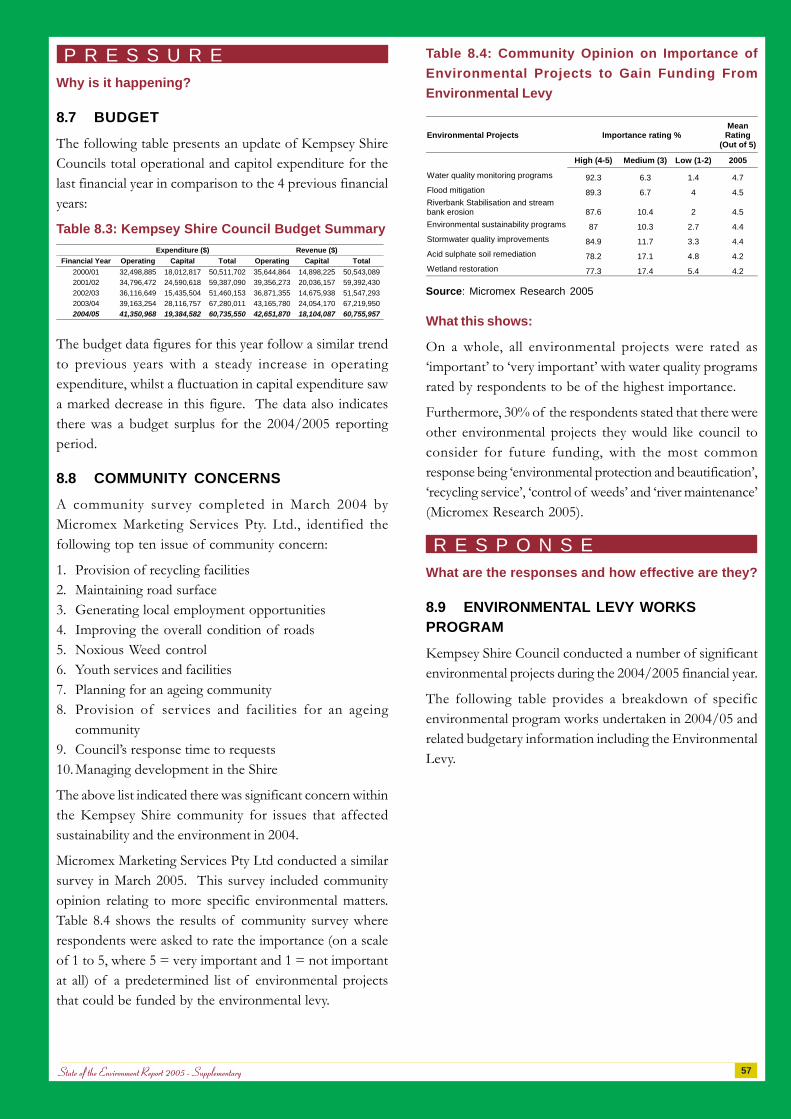
State of the Environment Report 2005 - Supplementary 57
PRINTED ON 100% RECYCLED PAPER
State of the Environment Report 2005 - Supplementary 57
P R E S S U R EWhy is it happening?
8.7 BUDGET
The following table presents an update of Kempsey ShireCouncils total operational and capitol expenditure for thelast financial year in comparison to the 4 previous financialyears:
Table 8.3: Kempsey Shire Council Budget Summary
The budget data figures for this year follow a similar trendto previous years with a steady increase in operatingexpenditure, whilst a fluctuation in capital expenditure sawa marked decrease in this figure. The data also indicatesthere was a budget surplus for the 2004/2005 reportingperiod.
8.8 COMMUNITY CONCERNS
A community survey completed in March 2004 byMicromex Marketing Services Pty. Ltd., identified thefollowing top ten issue of community concern:
1. Provision of recycling facilities2. Maintaining road surface3. Generating local employment opportunities4. Improving the overall condition of roads5. Noxious Weed control6. Youth services and facilities7. Planning for an ageing community8. Provision of services and facilities for an ageing
community9. Council’s response time to requests10. Managing development in the Shire
The above list indicated there was significant concern withinthe Kempsey Shire community for issues that affectedsustainability and the environment in 2004.
Micromex Marketing Services Pty Ltd conducted a similarsurvey in March 2005. This survey included communityopinion relating to more specific environmental matters.Table 8.4 shows the results of community survey whererespondents were asked to rate the importance (on a scaleof 1 to 5, where 5 = very important and 1 = not importantat all) of a predetermined list of environmental projectsthat could be funded by the environmental levy.
Table 8.4: Community Opinion on Importance of
Environmental Projects to Gain Funding From
Environmental Levy
Environmental Projects Importance rating % Mean
Rating (Out of 5)
High (4-5) Medium (3) Low (1-2) 2005
Water quality monitoring programs 92.3 6.3 1.4 4.7
Flood mitigation 89.3 6.7 4 4.5 Riverbank Stabilisation and stream bank erosion 87.6 10.4 2 4.5
Environmental sustainability programs 87 10.3 2.7 4.4
Stormwater quality improvements 84.9 11.7 3.3 4.4
Acid sulphate soil remediation 78.2 17.1 4.8 4.2
Wetland restoration 77.3 17.4 5.4 4.2 Source: Micromex Research 2005
What this shows:
On a whole, all environmental projects were rated as‘important’ to ‘very important’ with water quality programsrated by respondents to be of the highest importance.
Furthermore, 30% of the respondents stated that there wereother environmental projects they would like council toconsider for future funding, with the most commonresponse being ‘environmental protection and beautification’,‘recycling service’, ‘control of weeds’ and ‘river maintenance’(Micromex Research 2005).
R E S P O N S EWhat are the responses and how effective are they?
8.9 ENVIRONMENTAL LEVY WORKSPROGRAM
Kempsey Shire Council conducted a number of significantenvironmental projects during the 2004/2005 financial year.
The following table provides a breakdown of specificenvironmental program works undertaken in 2004/05 andrelated budgetary information including the EnvironmentalLevy.
Expenditure ($) Revenue ($)
Financial Year Operating Capital Total Operating Capital Total
2000/01 32,498,885 18,012,817 50,511,702 35,644,864 14,898,225 50,543,089
2001/02 34,796,472 24,590,618 59,387,090 39,356,273 20,036,157 59,392,430
2002/03 36,116,649 15,435,504 51,460,153 36,871,355 14,675,938 51,547,293
2003/04 39,163,254 28,116,757 67,280,011 43,165,780 24,054,170 67,219,950
2004/05 41,350,968 19,384,582 60,735,550 42,651,870 18,104,087 60,755,957

58 State of the Environment Report 2005 - Supplementary
Item 2004/2005 Income Levy 2004/2005 $401,302.00 Expenditure Revenue Expenditure Pola Creek Rehab $ 4,835.68 Killick/Saltwater Creek $ 11,600.00 Macleay River Floodplain $ 8,482.39 Boyters Lane Wetland Management Plan $ 26,048.35 Acid Sulfate Soils Hot Spot Programme $ 40,825.69 Beachwatch $ 22,000.00 Loan Repayments $202,753.49 $ 316,545.60 Loan Expenditure SWR Drainage (South of Landborough Street) $132,020.41 Flood Mitigation programme 2004/05 $ 22,165.04 Flood Mitigation programme 2003/04 ($694,500) $ 92,157.90 Crescent Head Waste Depot Upgrade $ 73,178.28 Council Depot - EPA Programme $114,870.62 Drainage – Spencerville $ 96,102.36 Saleyards - EPA Programme $394,158.42 Swimming Pools - EPA Programme $179,235.66 $1,103,888.69 Total Expenditure $1,420,434.29
Table 8.5: Environmental Projects and Environmental
Levy
8.10 CIVIC MAINTENANCE
As previously discussed in Chapter 6 – Human Settlements,Kempsey Shire Council established Civic MaintenanceTeams to actively maintain the cleanliness and appearanceof business and public areas.
INDICATOR – Compliance Register
Why us this indicator?
Council has now implemented a compliance register toprovide a measurement of the number and types of non-compliances and development conducted without consent.The total number of non-compliances during the reportingperiod was 16. Table 8.6 lists the number of each non-compliance category.
Non-Compliance Category Number Reported
2004-2005
Unauthorised Development 8 Compliance of Development Consent 5 Unauthorised Land Clearing 2 Quarries 1
Total 16
What this shows:
As this system is in its initial stages, insufficient data hasbeen collected to draw any clear conclusion is respect totrends, however it does indicate that there were a numberof non-compliance issues throughout 2004-2005.
This indicator will be reviewed annually and reported infuture State of the Environment Reports, to determine anyapparent trends.
Table 8.6: Compliance Register

State of the Environment Report 2005 - Supplementary 59
PRINTED ON 100% RECYCLED PAPER
State of the Environment Report 2005 - Supplementary 59
As part of this System the Kempsey Shire Councilundertakes quarterly sampling of groundwater, surfacewater and leachate water both within (onsite) andsurrounding (offsite) the KWR&DF with an annual reportsubmitted to the NSW EPA evaluating the overallperformance of the System. Preliminary results suggestoverall water quality being captured within stormwater andleachate systems is of reasonable quality, with no impactsidentified offsite.
8.14 RECYCLED CONTENT PURCHASINGPOLICY
Council committed up to the Buy Recycled Business Alliance(BRBA) in late 2004. BRBA is a non-profit pro-Sustainability alliance of businesses that are united by acommitment to promote the purchase and use of recycledcontent products (RCPs) and materials. Council is currentlytrying to form a team of staff to develop an aim, missionand set of policies in order to implement a Recycled MaterialContent Purchasing Policy that requires specifications forpurchased products to include a specified recycled materialcontent where they can contain recycled materials (i.e. sayminimum 10% recycled materials).
FUTURE DIRECTIONSWhat more could be done?
Kempsey Shire Council will continue to look to ways toimprove its operations as it moves toward ecologicalsustainability. Particular areas for focus in the next 12 monthsmay include:
Purchasing of more environmentally friendly vehiclesfor the council vehicle fleet based on the NSW CleanCar Benchmarks;
Audit and implementation of an energy savings actionplan; and
Development of an environmental management plan.
Council’s work in the area of policing compliance remainspredominantly reactive in nature (i.e. to communityconcerns). However, Council is planning to conduct moreproactive compliance auditing of industrial and commercialoperation within the Shire along with large developments.
8.11 LOCAL AGENDA 21 PROGRAM
Kempsey Shire Council has committed to undertaking aLocal Agenda 21 program.
Local Agenda 21 provides an operating framework for allof Council’s operations and decision-making. It is aboutvisioning, integrating policy, promoting innovation andestablishing an Action Plan with targets and goals forachieving sustainable outcomes. Sustainability can be closelylinked to resource efficiency, cost management andperformance indicators. It involves Council looking towardthe future while considering the principles of ESD.
During this reporting period, a Local Agenda 21 Team wasestablished and in May 2005, Kempsey Shire Councilfinalised the appointment of community representativesforming part of the committee. The first meeting of thisCommittee is scheduled for the end of September 2005,with the objective of providing an introductory session forall members of the committee, involving a brief trainingworkshop on ESD Principles and examples of other LocalAgenda 21 Programs. It is envisaged that this committeewill help guide the process for preparing an overall ESDStrategy.
8.12 ESD – TRIPLE BOTTOM LINEREPORTING
Kempsey Shire Council has developed a Triple Bottom Line(i.e. Environmental, Social and Economic) reportingtemplate for all business paper reports. The aim of thetemplate is to ensure that social, economic and environmentalconsiderations are duly addressed to enable informeddecision making for sustainable outcomes.
8.13 ENVIRONMENTAL MANAGEMENT –KWR&DF
A Site Water Management System has been developed forthe Kempsey Waste Receival & Disposal Facility(KWR&DF) with regard to the protection of groundwaterand surface waters within the vicinity of the site. On-sitesurface water is channelled via a perimeter spoon drain intoa sedimentation dam prior to being re-irrigated on-site.Leachate is captured on-site separately and is channelledinto a separate holding dam and also used for on-siteirrigation.

60 State of the Environment Report 2005 - Supplementary
9.0 REFERENCES
ABS (2001), Census Data 2000 – Kempsey, NSW, Australian Bureau of Statistics, 2001
ABS (1996), Census Data 1995 – Kempsey, NSW, Australian Bureau of Statistics, 1996
Australian Greenhouse Office (2005) Greenhouse Gas Abatement Scheme Fact Sheet – TheNSW Pool Coefficient, Department of the Environment and Heritage, Canberra Australia,August 2005
BOM (2005) Climate Data Files for Kempsey, South West Rocks, Crescent Head, Bellbrook andMillbank, Bureau of Meteorology - NSW Climate and Consultancy Section, August2005
CSIRO (2003) Urban and Regional Air Pollution, Commonwealth Scientific and IndustrialResearch Organisation, July 2003, http://www.dar.csiro.au/information/urbanpollution.html Accessed 19/08/05
DEC (2005) Provision of Information for State of the Environment Report 2004-2005 KempseyShire Council, Department of Environment and Conservation, August 2005.
DEH (2004). Australian Biodiversity. Department of the Environment and Heritage,Canberra Australia. www.deh.gov.au/biodiversity/. Accessed: 29/08/05.
DEH (2005) Environment Protection and Biodiversity Conservation Act 1999. Departmentof the Environment and Heritage, Canberra Australia, http://www.deh.gov.au/epbc/Accessed 30/08/05
Department of Employment and Workplace Relations (2005) Labour market data forselected SLAs and LGAs in NSW, Labour Market Analysis Team, Labour MarketStrategies Group, Department of Employment & Workplace Relations, August 2005.
DIPNR (2004) NSW SLA Population Projections, Department of Infrastructure, Planningand Natural Resources, 2004
DLG (1999). Environmental Guidelines – State of the Environment Reporting by LocalGovernment. NSW Department of Local Government, http://www.dlg.nsw.gov.au/Files/Information/soe99.pdf
DLWC (1999) Soil Landscapes of the Kempsey 1:100,000 Sheet, Department of Land andWater Conservation, Sydney
DLWC (2000) Soil Landscapes of the Nambucca 1:100,000 Sheet, Department of Landand Water Conservation, Sydney
DPI (2004). Noxious weed declarations in NSW: Kempsey. Agriculture, State of New SouthWales, NSW Department of Primary Industries, 2004. http://www.agric.nsw.gov.auAccessed: 18/8/05.
GECO Environmental (2005) DRAFT Macleay River Estuary Data Compilation Study,GECO Environmental, June 2005
LMCC (2005) Acid Sulphate Soils Advice, Lake Macquarie City Council, 2005, Accessed11/08/05
Kempsey Shire Council (2003) Waste Management Strategy, Kempsey Shire Council 2003
Kempsey Shire Council (2004) State of the Environment Report 2004, Kempsey ShireCouncil 2004
Kempsey Shire Council - Council Minutes and Reports for the year 2004-2005.
Micromex Research (2005) Community Survey 2005: A research report prepared for KempseyShire Council, March 2005

State of the Environment Report 2005 - Supplementary 61
PRINTED ON 100% RECYCLED PAPER
State of the Environment Report 2005 - Supplementary 61
NSW EPA (2004), River Health, Assessed by Macroinvertebrate Assemblages, New SouthWales Environmental Protection Authority, http://soedirect.nsw.gov.au Accessed 16/08/05
NSW EPA (2000) NSW State of the Environment 2000: Chapter 3- Atmosphere, NewSouth Wales Environment Protection Authority, http://www.epa.nsw.gov.au/soe/soe2000/index.htm Accessed 15/08/05
NSW EPA (2003) NSW State of the Environment 2003: Chapter 6 - Biodiversity, NewSouth Wales Environment Protection Authority, http://www.epa.nsw.gov.au/soe/soe2000/index.htm Accessed 30/08/05
NSW DPI (2005) Fish Kill Database, NSW Department of Primary Industries September2005.
NSW DPI (2005) NSW DPI ComCatchLive 20-09-05 extraction, NSW Department ofPrimary Industries, September 2005.
NSW Health (2005) Aboriginal Environmental Health, New South Wales Health, 2005,http://www.health.nsw.gov.au/public-health/ehb/aborig/index.html Accessed 18/08/05
NSW NPWS (2005). Atlas of NSW Wildlife. National Parks Wildlife Services, 2004.www.npws.nsw.gov.au Accessed 29/08/05.
US EPA (2004) Ozone Depletion, 2004, http://www.epa.gov/docs/ozone/science/sc_fact.html, accessed 14 /10/04

62 State of the Environment Report 2005 - Supplementary