new methods for assessing brick resistance to freeze-thaw
TRANSCRIPT

Materiales de ConstruCCión
Vol. 71, Issue 343, July-September 2021, e258ISSN-L: 0465-2746
https://doi.org/10.3989/mc.2021.04421
New methods for assessing brick resistance to freeze-thaw cycles
I. Netinger-Grubešaa , M. Benšićb, M. Vračevićc
a. Faculty of Civil Engineering and Architecture Osijek, University of Osijek, (Osijek, Croatia)b. Department of Mathematics, University of Osijek, (Osijek, Croatia)
c. LabTech, Ulica borova, (Osijek, Croatia) [email protected]
Received 7 March 2021Accepted 20 May 2021
Available on line 17 August 2021
ABSTRACT: The aim of this research is to analyse the reliability of the existing methods, and find new ones, for assessing brick resistance to freeze-thaw cycles. A series of bricks were tested against a range of properties; compressive strength ratios pre- to post-freezing and Maage’s factor, were calculated. Using a database created in this way, an analysis of existing classifiers was carried out and new ones were established based on which bricks could be classified into resistant and non-resistant to freeze-thaw cycles. The median pore radius, the ratio of compressive strengths pre- to post-freezing and the water desorption coefficient at 180–360 minutes proved to be good classifiers with a clearly specified cut-off for the distinction between resistant and non-resistant bricks with an acceptable risk of a wrong decision. The ratio of compressive strengths pre to post freezing and the water desorption coefficient at 180–360 minutes were described using the pore system in the brick.
KEYWORDS: Brick; Freezing/Thawing; Reliable classifiers of brick resistance; ROC Analysis.
Citation/Citar como: Netinger-Grubeša, I.; Benšić, M.; Vračević, M. (2021) New methods for assessing brick resistance to freeze-thaw cycles. Mater. Construcc. 71 [343], e258. https://doi.org/10.3989/mc.2021.04421.
RESUMEN: Nuevos métodos para analizar la resistencia de los ladrillos a ciclos de hielo-deshielo. El objetivo de esta investigación es analizar la fiabilidad de los métodos existentes para evaluar la resistencia de los ladrillos a los ciclos de hielo-deshielo, así como encontrar nuevos métodos. Se analizaron las propiedades de distintos ladrillos; se calculó la variación de la resistencia a compresión antes y después de la congelación, así como el factor de Maage. A partir de una base de datos creada para talfin, se llevó a cabo un análisis de los criterios de clasificación existentes, estableciéndose nuevos criterios para clasificar a los ladrillos entre resistentes y no resistentes a los ciclos de hielo-deshielo. El radio medio de los poros, la relación de la resistencia a compresión antes y después de la congelación y el coeficiente de desorción de agua a 180-360 minutos, demostraron ser útiles para realizar dicha clasificación, mostrando un riesgo aceptable de error. La relación de la resistencia a compresión antes y después de la congelación y el coeficiente de desorción de agua a los 180–360 minutos se describieron utilizando el sistema de poros en el ladrillo.
PALABRAS CLAVE: Ladrillo; Ciclos hielo/deshielo; Criterios fiables para clasificar la resistencia del ladrillo; Análisis ROC.
Copyright: ©2021 CSIC. This is an open-access article distributed under the terms of the Creative Commons Attribution 4.0 International (CC BY 4.0) License.

2 • I. Netinger-Grubeša et al.
Materiales de Construcción 71 (343), July-September 2021, e258. ISSN-L: 0465-2746. https://doi.org/10.3989/mc.2021.04421
1. INTRODUCTION
Even though concrete is the most common mate-rial in construction, bricks/brick wall elements are still frequently used in constructing smaller build-ings and restoring existing ones. As with any other material, bricks are susceptible to systematic break-down when exposed to environmental conditions, which can pose a serious threat to the structure’s stability. Durability is, therefore, one of the main requirements set for bricks as a building material. According to European regulations, brick durability is considered through the initial salt determination according to EN 772-5:2003 (1) and testing of resis-tance to freeze-thaw cycles according to EN 772-22 (2). However, apart from the aforementioned direct method for testing brick resistance to freeze-thaw cycles, international literature sources also contain indirect procedures and cut-off/critical values per individual procedure for assessing brick resistance to freeze-thaw cycles and they prescribe the meth-od to be followed in handling raw material in brick production with the aim of achieving sufficient dura-bility. American and Canadian regulations prescribe cut-off values for a set of parameters that the brick must meet to be regarded as resistant to freeze-thaw cycles due to harsh conditions of exposure (3). This set of parameters includes the minimal required compressive strength, the maximum allowed water absorption, the maximum 5 h boiling water absorp-tion and the maximum allowed saturation coeffi-cient, which each individual brick from a group of five bricks must meet, as well as the maximum/min-imum median values of each listed parameter. Liter-ature sources provide the connection between each parameter contained in this set and brick resistance to freeze-thaw cycles. The material’s compressive strength is indirectly correlated to its resistance to freeze-thaw cycles (4) because stress occurs during the transition of water into ice and the material must be able to resist it by its tensile strength, and a high-er tensile strength corresponds to a higher material compressive strength. An increased water absorp-tion signifies the presence of an increased amount of water in the brick, and consequently, a higher ten-dency towards damage when water freezes and turns into ice. During water absorption testing under nor-mal atmospheric pressure within 24 hours, the easily accessible pores in the brick are filled. Therefore, 5 h boiling water absorption was devised, during which the more difficult to access pores in the brick are filled. The ratio of the amount of absorbed wa-ter in the sample after submerging into water under normal atmospheric pressure for 24 hours and the amount of absorbed water during 5 h boiling water immersion is called the saturation coefficient in the literature. The saturation coefficient determines the ratio of pores that are easily filled with water and the total pore volume, and it is an indicator of emp-
ty space in pore volume that remains after they are filled with water, which can serve as an indicator of the water volume generated by freezing. According to American and Canadian regulations, a brick that does not meet the requirement set for the aforemen-tioned parameters can be subject to testing of direct resistance to freeze/thaw cycles.
The authors in (5) investigated the correlation be-tween the saturation coefficient and the initial wa-ter absorption and concluded that an increase in the saturation coefficient proportionally increases the initial water absorption, which means that the initial water absorption could be one of the parameters that could serve for evaluating brick resistance to freeze-thaw cycles.
The pore size in the brick’s material affects brick resistance to freeze-thaw cycles (5, 6). According to literature sources, pores larger than 1 µm (large pores) are easily filled with water and emptied of it, which leads to an increase in the brick’s durability (5, 7). Ac-cording to (5), small pores (smaller than 0,1 µm) have a low impact on brick resistance to freeze-thaw cy-cles because the water contained in them freezes only at extremely low temperatures, and medium-sized pores are harmful. Maage’s coefficient/factor (Fc) for predicting resistance to freeze-thaw cycles, which is based on experimental results and a statistical model with two main variables, total pore volume (PV) and pore content of a specific diameter, i.e. pores larger than 3 µm (P3) (8-10), speaks in favour of the positive effect of large pores on brick resistance to freeze-thaw cycles. In addition to Maage, an assessment of brick resistance to freeze-thaw cycles by means of features of the pore system in the material has been proposed by some other authors, such as Koroth, Vincenzini, Franke and Bentrup, Litvan, and Nakamura (11, 12). Most of these authors consider larger pores to have beneficial effects on the resistance. Franke and Ben-trup additionally introduced the median pore radius as a parameter for assessing brick resistance to freeze-thaw cycles (11, 13).
Brick resistance to freeze-thaw cycles is a neglect-ed topic in newer literature sources. On the series of aforementioned brick properties that were also test-ed in the course of this study, the authors analysed the reliability of the existing methods and searched for new methods for assessing brick resistance to freeze-thaw cycles, the so-called reliable classifiers. Due to the aforementioned effect of the pore system on brick resistance to freeze-thaw cycles in litera-ture sources, reliable brick classifiers according to freeze-thaw cycles identified in this study were de-scribed using the pore system.
2. EXPERIMENTAL PART
The experimental part of this paper is divided into several units. Section 2.1 provides an overview of

Materiales de Construcción 71 (343), July-September 2021, e258. ISSN-L: 0465-2746. https://doi.org/10.3989/mc.2021.04421
New methods for assessing brick resistance to freeze-thaw cycles • 3
the methods used during the testing of brick proper-ties given in this paper and Section 2.2 contains the results of brick features tested in such a way. Using the results of the tests of brick properties described in Section 2.2 as a database, Section 2.3 provides the descriptive statistics of these results. Section 2.4 deals with determining the potentials of variables/features for classification into resistant and non-re-sistant freeze-thaw cycles. Section 2.5 provides an overview of the procedure and results of the ROC analysis for each variable that proved to be a poten-tial classifier in Section 2.4. Classifiers that proved to be reliable in Section 2.4 are the newly proposed methods for assessing brick resistance to freeze-thaw cycles in comparison with those proposed in literature sources and they were described in Section 2.6 using the pore system of the brick.
2.1. Test methods
A series of properties were tested on a total of 16 different brick types (series); 8 brick series origi-nated from controlled production (S1R1030-1.5h; S1R1030-0.5h; S2R1060-1.5h; S2R1060-0.5h; S1S10300-1.5h; S1S1030-0.5h; S2S1060-1.5h; S2S1060-0.5h) and 8 brick series originated from uncontrolled production (S1-S8). Bricks originated from controlled production were bricks produced in local factories under controlled conditions from raw materials whose chemical and mineral composition are presented in (14). Bricks originated from uncon-trolled production were bricks randomly sampled from building material depots in Croatia, Bosnia and Herzegovina, and Serbia as described in (15). The dimensions of all bricks were 250/120/65 mm.
Direct brick resistance to freeze-thaw cycles, compressive strength (before and after exposure to freeze-thaw cycles), water absorption, 5 h boiling water absorption, saturation coefficient, initial water absorption, pore distribution, median pore radius, total pore content and total pore volume were tested in all the bricks. Their compressive strength ratios pre- to post-freezing and Maage’s factor were cal-culated.
Direct brick resistance to freeze-thaw cycles was determined according to the HRN B.D8.011 stan-dard (16). This standard was chosen for testing brick resistance to freeze-thaw cycles because it requires a smaller number of testing samples in comparison to EN 772-22 (2), which is usually used for testing brick resistance to freeze-thaw cycles. According to this standard, the samples saturated with water were put into a climate chamber and exposed to a temperature of -20±2°C for four hours, after which they were submerged in water at between +15 and 20°C, also for four hours. This cycle was repeated 25 times and samples were checked after each cy-cle. A brick is considered resistant to freeze-thaw
cycles if none of the samples exhibit any signs of damage after 25 freeze-thaw cycles in water. The compressive strengths were determined according to EN 772-1 (17) on a series of each type of brick before and after freezing, and the mean values of compressive strength pre to post freezing were put into a ratio to gain a coefficient as a quantitative indicator of brick resistance to freeze-thaw cycles. The normalised compressive strength was calculat-ed according to Table A.1 of the EN 772-1 standard (17). Water absorption was tested according to EN 772-21 (18), and the 5 h boiling water absorption was tested according to EN 772-7 (19). The satura-tion coefficient is defined as the ratio between wa-ter absorption and 5 h boiling water absorption. The initial water absorption was determined according to EN 772-11 (20). Pore distribution, median pore ra-dius, total pore content and total pore volume were determined by Mercury Intrusion Porosimetry, and Maage’s factor was calculated according to the de-scription in (8-10). Pore distribution for bricks from controlled production is shown in (14) and pore dis-tribution for bricks from uncontrolled production is shown in (15). Studies (14, 15) regarded pores larger than 3 µm as large pores, medium-sized pores where those ranging from 0.1 to 3 µm and small pores are smaller than 0.1 µm.
Furthermore, water absorption and desorption were measured in each brick series for a specific time. For the purpose of measuring water absorp-tion, bricks were completely dried, after which they were submerged in water for 10, 20, 30, 40, 50, 100, 150 and 1440 minutes. After taking each brick out of the water, and before it was weighed, the superficial moisture, i.e. water film on the brick’s surface, was eliminated with a cloth. The amount of the absorbed water at the specific moment is given as a percentage for every brick. For the purpose of measuring water desorption, bricks were submerged in water for 24 hours. After 24 hours, they were taken out of the wa-ter, their surface was wiped with a dry cloth and they were weighed and put into a drying oven at 105 °C. At 0, 180, 360, 540, 720, 900, 1260, and 1440 min-utes, the bricks were taken out of the drying oven, weighed, and their remaining water content percent-age was calculated.
2.2. Results of brick property testing
Water absorption and desorption curves at a spe-cific time are shown in Figure 1 for bricks from con-trolled production and Figure 2 for bricks from un-controlled production. Every point of the curve is an average value of ten measuring results.
Figures 1 and 2 show that each brick has its water absorption and desorption trend at a time and that the biggest differences between brick series in the absorption curves exist for up to 30 minutes and in

4 • I. Netinger-Grubeša et al.
Materiales de Construcción 71 (343), July-September 2021, e258. ISSN-L: 0465-2746. https://doi.org/10.3989/mc.2021.04421
Figure 1. Water absorption and desorption curves for bricks from controlled production: a) water absorption curves; b) water desorp-tion curves.
Figure 2. Water absorption and desorption curves for bricks from uncontrolled production: a) water absorption curves; b) water de-sorption curves.
a)
b)
a)
b)

Materiales de Construcción 71 (343), July-September 2021, e258. ISSN-L: 0465-2746. https://doi.org/10.3989/mc.2021.04421
New methods for assessing brick resistance to freeze-thaw cycles • 5
desorption curves for up to 540 minutes. Special attention was, therefore, given to water absorption rates at 10, 20 and 30 minutes and desorption rates at 180, 360 and 540 minutes and the following ab-sorption [Equation 1] and desorption [Equation 2] coefficients were defined:Ku,t0-t1=(water absorption at t1 - water absorption at
t0)/10 – water absorption coefficient [1]Ko,t0-t1=(water absorbed at t1 - water absorbed at
t0)/180 – water desorption coefficient [2]These coefficients were also researched as param-eters that describe brick resistance to freeze-thaw cycles.
The testing results given in Section 2.1 and the ab-sorption and desorption coefficients at a given mo-ment are provided in Table 1 for bricks from controlled production, and in Table 2 for bricks from uncon-trolled production. Direct resistance to freeze-thaw cycles was determined by observing the damages to the bricks exposed to the freeze-thaw cycles on four
sets of bricks (1 set is comprised of 5 bricks), as pre-scribed by HRN B.D8.011. The compressive strength pre to post freezing given here is the average value of ten individual measured values. The ratio of compres-sive strengths pre- to post-freezing was determined by putting the average values of compressive strength pre- to post-freezing into a ratio. Water absorption; 5 h boiling water absorption; saturation coefficient; initial water absorption coefficient; water absorption coefficient at 10, 10–20 and 20–30 minutes, and wa-ter desorption at 180, 180–360 and 360–540 minutes shown in Tables 1 and 3 are mean values of the ten individual measured values. All the parameters that were determined by Mercury Intrusion Porosimetry (large, medium-sized, and small pore content, medi-um pore radius and total pore volume) are the result of one measurement. The durability factor was cal-culated according to Maage, as described in (8-10). Proportion of pores of a given size, total porosity, me-dian pore radius and total pore volume in the bricks as well as Maage’s factor are given in Tables 2 and 4.
Table 1. Physical, mechanical and durability properties of machine produced and handmade bricks in controlled production.
Sample identification/Tested property
S1R1030-1.5h
S1R1030-0.5h
S2R1060-1.5h
S2R1060-0.5h
S1S10300-1.5h
S1S1030-0.5h
S2S1060-1.5h
S2S1060-0.5h
Direct resistance to freeze-thaw cycles resistant resistant resistant resistant resistant resistant resistant resistant
Normalised compressive strength (N/mm2) 22.5 20.3 26.3 24.8 27 24.8 42 35.4
Compressive strength (N/mm2) 30.0 27.0 35.0 33.0 36.0 33.0 56.0 47.0
Compressive strength after freezing (N/mm2) 22.0 19.5 30.0 28.0 29.0 26.0 43.0 35.0
Ratio of compressive streng-ths pre to post freezing 0.73 0.72 0.86 0.85 0.81 0.79 0.77 0.75
Water absorption (%) 11.9 12.3 11.2 11.4 11.2 11.8 10.0 10.4
5 h boiling water absorption (%) 16.3 16.9 13.0 13.4 13.7 14.7 12.9 13.6
Saturation coefficient 0.69 0.76 0.73 0.75 0.74 0.75 0.83 0.84
Initial absorption coefficient [kg/(m2 x min)] 1.1 2.0 1.0 1.8 2.5 2.8 2.5 2.5
Water absorption coefficient in 10 minutes (%/min) 1.0570 1.1525 0.6350 0.7915 1.0336 1.0800 0.8680 0.8370
Water absorption coefficient in 10–20 minutes (%/min) 0.0880 0.0544 0.2770 0.2230 0.0409 0.0288 0.0440 0.0975
Water absorption coefficient in 20–30 minutes (%/min) 0.0100 0.0075 0.0820 0.0500 0.0036 0.0263 0.0080 0.0075
Water desorption coefficient in 180 minutes (%/min) 0.0387 0.0349 0.0411 0.0391 0.0395 0.0409 0.0362 0.0376
Water desorption coefficient in 180–360 minutes (%/min) 0.0126 0.0128 0.0109 0.0135 0.0153 0.0152 0.0117 0.0121
Water desorption coefficient in 360–540 minutes (%/min) 0.0083 0.0108 0.0065 0.0081 0.0037 0.0062 0.0049 0.0033

6 • I. Netinger-Grubeša et al.
Materiales de Construcción 71 (343), July-September 2021, e258. ISSN-L: 0465-2746. https://doi.org/10.3989/mc.2021.04421
Table 3. Physical, mechanical and durability properties of machine produced brick from uncontrolled production.
Sample identification/Tested property S1 S2 S3 S4 S5 S6 S7 S8
Direct resistance to freeze-thaw cycles non-resis-tant
non-resis-tant
non-re-sistant
non-re-sistant
non-re-sistant
non-re-sistant resistant non-resis-
tant
Normalised compressive strength (N/mm2) 17.7 8.0 28.7 28.4 15.2 27.9 27.7 27.8
Compressive strength (N/mm2) 23.6 10.7 38.2 37.9 20.3 37.2 36.9 37.1
Compressive strength after freezing (N/mm2) 16.1 7.5 27.2 26.2 14.6 25.2 32.8 25.5
Ratio of compressive strengths pre to post freezing 0.68 0.70 0.71 0.69 0.72 0.68 0.89 0.69
Water absorption (%) 18.2 24.2 14.0 14.7 13.4 13.6 12.6 14.1
5 h boiling water absorption (%) 23.6 31.5 18.6 19.6 17.8 17.9 13.6 20
Saturation coefficient 0.77 0.77 0.75 0.75 0.75 0.76 0.93 0.74
Initial absorption coefficient[kg/(m2 x min)] 2.6 6.3 1.4 1.5 1.3 1.5 2.7 1.6
Water absorption coefficient in 10 minutes (%/min) 1.3410 2.3550 0.7560 0.7750 0.6980 0.8190 1.1270 0.6570
Water absorption coefficient in 10–20 minu-tes (%/min) 0.2910 0.0233 0.3504 0.2850 0.2400 0.2860 0.0460 0.2790
Water absorption coefficient in 20–30 minu-tes (%/min) 0.0580 0.0039 0.1504 0.1220 0.1050 0.1260 0.0140 0.1060
Water desorption coefficient in 180 minutes (%/min) 0.0563 0.0686 0.0436 0.0439 0.0437 0.0325 0.0377 0.0359
Water desorption coefficient in 180–360 minutes (%/min) 0.0226 0.0230 0.0254 0.0218 0.0206 0.0283 0.0169 0.0285
Water desorption coefficient in 360–540 minutes (%/min) 0.0104 0.0240 0.0071 0.0108 0.0076 0.0033 0.0136 0.061
Table 2. Proportion of pores of a given size, total pore content, median pore radius, total pore volume and Maage’s factor of machine produced and handmade bricks in controlled production.
Sample identification/Tes-ted property
S1R1030-1.5h
S1R1030-0.5h
S2R1060-1.5h
S2R1060-0.5h
S1S10300-1.5h
S1S1030-0.5h
S2S1060-1.5h
S2S1060-0.5h
Prop
ortio
n of
por
es o
f a
give
n si
ze (%
) Large pores 20.6 11.2 29.4 15.9 17.3 15.8 17.8 2.2
Medium pores 76.2 84.8 65.9 78.7 66.0 72.8 74.3 86.4
Small pores 3.2 4.0 4.7 5.4 16.7 11.4 7.9 11.4
Total pore content (%) 19.4 20.4 17.2 17.8 16.2 19.1 22.2 28.3
Median pore radius (µm) 1.33 1.31 1.67 1.66 1.56 1.47 1.43 1.40
Total pore volume (cm3/g) 0.0961 0.1131 0.1051 0.1093 0.0891 0.1075 0.0964 0.1471
Maage’s durability factor 83 55 100 69 77 68 76 27

Materiales de Construcción 71 (343), July-September 2021, e258. ISSN-L: 0465-2746. https://doi.org/10.3989/mc.2021.04421
New methods for assessing brick resistance to freeze-thaw cycles • 7
Table 4. Proportion of pores of a given size, total pore content, median pore radius, total pore volume and Maage’s factor of machine produced brick from uncontrolled production.
Sample identification/Tested property S1 S2 S3 S4 S5 S6 S7 S8
Prop
ortio
n of
por
es o
f a
give
n si
ze
(%)
Large pores 4.2 15.4 3.8 2.8 13.1 3.9 56.1 2.4
Medium pores 85.9 83.9 71.9 70.4 82.4 67.6 43.2 68.1
Small pores 9.9 0.7 24.3 26.8 4.5 28.5 0.7 29.5
Total pore content (%) 37.7 46.1 30.1 30.8 28.9 33.0 34.4 32.3
Median pore radius (µm) 0.25 1.01 0.26 0.08 0.51 0.09 1.45 0.05
Total pore volume (cm3/g) 0.2325 0.3705 0.1685 0.1712 0.1534 0.1832 0.2075 0.8133
Maage’s durability factor 24 41 42 28 53 19 139 24
2.3. Descriptive statistics
Table 5 shows the descriptive statistics for all the tested parameters. The calculation for each parame-ter was made based on 7 mean values for non-resis-tant bricks and 9 mean values for resistant bricks.
2.4 The potential of variables for discriminating freeze-thaw cycle resistant from non-resistant bricks
In the course of choosing good classifiers for de-termining bricks resistant to freeze-thaw cycles, the Mann–Whitney U test and ROC analysis were used (Receiver operating characteristics, cf. e.g. (21)).
The Mann–Whitney U test is employed with rank-order data in a hypothesis testing situation in-volving a design with two independent samples. If the result of the Mann–Whitney U test is significant, it indicates there is a significant difference between the two sample medians, and it can be concluded that the samples represent populations with different median values. A more-detailed description of this method can be found in (22). ROC analysis is a useful tool for classifier evaluation. It is based on an ROC curve (receiver operating characteristic curve) which is a graph showing the performance of a classification model at all classification thresholds. This curve plots “True Positive Rate” versus “False Positive Rate”. Area under the ROC curve (AUC) measures the entire area underneath the entire ROC curve and is used as an aggregate measure of performance across all pos-sible classification thresholds. One way of interpret-ing AUC is as the probability that the model ranks a random positive example more highly than a random negative example. AUC ranges in value from 0 to 1. A model whose predictions are 100% correct has an
AUC of 1. A more-detailed description of this method can be found in (21).
The results of the Mann–Whitney U test, which tested the existence of a difference between variable distributions in resistant and non-resistant bricks, are given in Table 6.
Since variables that have a p-value lower than 0.05 in Table 6 show the potential for classifying resistant and non-resistant bricks, the following variables can be included in the group of potentially good classifiers: median pore radius, water desorp-tion coefficient at 180–360 minutes, compressive strength ratio pre- to post-freezing, large pore con-tent, total pore volume, water absorption coefficient at 10–20 and 20–30 minutes, total pore content and Maage’s coefficient.
At this level, the following were observed: - Water absorption of the brick is a good classi-
fier since all the resistant bricks in the sample have water absorption values between 10 and 12.6% and all non-resistant bricks have a high-er value, i.e. between 13.4 and 24.2%.
- The median pore radius separates resistant from non-resistant bricks well, in such a way that all non-resistant bricks in the sample have a radius between 0.052 and 1.01 µm, while resistant bricks have a larger radius, between 1.31 and 1.67 µm.
- The water desorption coefficient in 180–360 min proved to be a good classifier since all the values of this variable in non-resistant bricks are higher than those in resistant bricks—non-resis-tant bricks have values between 0.021 and 0.029 %/min and resistant bricks have values between 0.011 and 0.017 %/min. This result is contrary to the expectations presented in (23), in which the authors presume that bricks with higher re-sistance to freeze-thaw cycles absorb and desorb

8 • I. Netinger-Grubeša et al.
Materiales de Construcción 71 (343), July-September 2021, e258. ISSN-L: 0465-2746. https://doi.org/10.3989/mc.2021.04421
Table 5. Descriptive statistics for the results of testing controlled and uncontrolled samples.
Property/Numerical features Mean Median Std. dev. Min Max
Resistance according to HRN B.D8.011 NO YES NO YES NO YES NO YES NO YES
Normalized compressive strength (N/mm2) 22 27.8 27.8 26.3 8.3 6.8 8 20.3 28.7 42
Saturation coefficient 0.754 0.777 0.75 0.75 0.0099 0.0743 0.74 0.69 0.77 0.93
Ratio of compressive strengths pre- to post-freezing 0.696 0.797 0.69 0.79 0.0151 0.0602 0.68 0.72 0.72 0.89
Large pore content (%) 6.51 20.7 3.9 17.3 5.36 15.1 2.4 2.2 15.4 56.1
Medium-sized pore content (%) 75.7 72 71.9 74.3 7.98 13 67.6 43.2 85.9 86.4
Small pore content (%) 17.7 7.27 24.3 5.4 12.3 5.05 0.7 0.7 29.5 16.7
Total pore content (%) 34.1 21.7 32.3 19.4 6 5.97 28.9 16.2 46.1 34.4
Median pore radius (µm) 0.321 1.48 0.25 1.45 0.342 0.13 0.05 1.31 1.01 1.67
Total pore volume (mm3/g) 299 119 183 108 239 37.1 153 89.1 813 208
Maage’s coefficient 33 77.1 28 76 12.4 27.2 19 27 53 139
Water absorption (%) 16 11.4 14.1 11.4 3.95 0.84 13.4 10 24.2 12.6
Initial water absorption coeffi-cient (kg/m2 * min) 2.28 2.1 1.45 2.47 1.81 0.651 1.25 1.03 6.25 2.77
Absorption coefficient in 0–10 (%/min) 1.06 0.954 0.78 1.03 0.617 0.177 0.66 0.64 2.35 1.15
Absorption coefficient in 10–20 (%/min) 0.251 0.1 0.29 0.05 0.105 0.0889 0.02 0.03 0.35 0.28
Absorption coefficient in 20–30 (%/min) 0.0959 0.0233 0.11 0.01 0.0493 0.0262 0 0 0.15 0.08
Desorption coefficient in 0-180 (%/min) 0.0466 0.0386 0.04 0.04 0.0123 0.0021 0.03 0.04 0.07 0.04
Desorption coefficient in 180–360 (%/min) 0.0244 0.0136 0.02 0.01 0.0031 0.0019 0.02 0.01 0.03 0.02
Desorption coefficient in 360–540 (%/min) 0.0099 0.0072 0.01 0.01 0.0068 0.0035 0 0 0.02 0.01
water faster than bricks that have a lower resis-tance to freeze-thaw cycles due to the larger pro-portion of large pores in the bricks with higher resistance. It can be concluded that factors other than pore size, as presumed in (23), play a role in the brick’s water absorption and desorption rate.
- The compressive strength ratio pre- to post-freezing is a good classifier in the sense that all non-resistant bricks have a ratio be-tween 0.68 and 0.72 and resistant bricks have a higher ratio, between 0.72 and 0.89.
- Maage’s coefficient was confirmed as a good classifier and, on average, its value is higher in resistant than in non-resistant bricks. How-ever, in this study, the cut-off value between resistant and non-resistant bricks for this co-efficient was not clearly expressed.
- Large pore content is higher on average in re-sistant than in non-resistant bricks.
- The total pore volume and the total pore con-tent are, on average, lower in resistant than in non-resistant bricks.

Materiales de Construcción 71 (343), July-September 2021, e258. ISSN-L: 0465-2746. https://doi.org/10.3989/mc.2021.04421
New methods for assessing brick resistance to freeze-thaw cycles • 9
- Desorption coefficients in 10–20 and 20–30 minutes are, on average, lower in resistant than in non-resistant bricks.
- The other variables did not prove to be inde-pendently significant for brick classification into resistant or non-resistant classes in terms of freezing-thawing cycles.
As mentioned in the introductory part, Amer-ican and Canadian regulations prescribe cut-off values for a set of parameters that have to be met by the brick to be regarded as resistant to freeze-thaw cycles due to harsh exposure conditions (3) in the sense of the minimum required compressive strength, the maximum allowed water absorption, maximum 5 h boiling water absorption, and the maximum allowed saturation coefficient that the brick must meet. Three out of four parameters were not proven statistically significant in this research. Water absorption was proven as statistically signif-icant, and the upper threshold of this parameter at which a brick can be regarded resistant to freeze-thaw cycles is 12.6%, whereas the upper threshold of this parameter is 8% according to Canadian and American regulations.
2.5. ROC analysis for potential classifiers
A ROC analysis was carried out for each variable that proved to be a potential classifier in Table 6. AUC (area under the curve, cf. e.g. (24)) values were calcu-lated and are shown in Table 7. The calculations were carried out using the R software package ROCR.
Table 7. Results of the ROC analysis for good classifiers of brick resistance to freeze-thaw cycles.
Property/variable AUCWater absorption 1Median pore radius 1Water desorption coefficient in 180–360 1Ratio of compressive strengths pre- to post-freezing 0.992Total pore volume 0.937Maage’s coefficient 0.937Total pore content 0.921Large pore content 0.857Water absorption coefficient in 20–30 0.849Water absorption coefficient in 10–20 0.841
According to the results shown in Table 7, the same variables proved again to be the best classifiers (a very high AUC value), water absorption, median pore radius, desorption coefficient and the compres-sive strength ratio pre- to post-freezing.
To enable the use of these variables for brick clas-sification into resistant and non-resistant, it is very important to define a cut-off for each chosen classi-fier and estimate the risk of a wrong decision. Due to the relatively small sample size, a Monte Carlo study was carried out for this purpose. The values of the selected variable from the estimated distribu-tions were simulated separately for the resistant and non-resistant bricks, assuming normality for each.
Two-dimensional simulations were used in the sense that the expectation and the standard deviation of normal distributions were also simulated from the distributions of the parameter estimators. The sim-ulations and analysis of the results were carried out using the R software package mc2d (25).
The study showed that the median pore radius is a reliable classifier. The cut-off that separates resis-tant from non-resistant bricks can be set to 1.2 µm. Bricks with a median pore radius lower than 1.2 µm can be classified as non-resistant and those with a median pore radius higher than 1.2 µm as resistant. The probability of a wrong decision is lower than 1% if the median pore radius is lower than 1.2 µm, and the probability of a wrong decision is lower than 10E-6 if the median pore radius is higher than 1.2 µm.
Water desorption coefficient in 180–360 minutes is also a reliable classifier. The separation cut-off can be set to 1.019 %/min. Bricks with a water de-sorption coefficient in 180–360 minutes lower than
Table 6. Results of the Mann–Whitney U test for specific brick properties.
Property/variable statistic p-value
Water absorption 0.00 < .001
Median pore radius 0.00 < .001
Water desorption coefficient in 180-360 0.00 < .001
Ratio of compressive strengths pre to post freezing 0.500 0.001
Large pore content 9.00 0.016
Total pore volume 4.00 0.002
Water absorption coefficient in 20–30 9.50 0.022
Water absorption coefficient in 10–20 10.00 0.023
Total pore content 5.00 0.003
Maage’s coefficient 4.00 0.004
Water desorption coefficient in 0–180 16.50 0.123
Small pore content 17.50 0.152
Water desorption coefficient in 360–540 24.00 0.455
Water absorption coefficient in 0–10 24.00 0.470
Initial absorption coefficient 26.00 0.596
Normalized compressive strength 28.00 0.758
Medium-sized pore content 25.00 0.779
Saturation coefficient 28.50 0.791
10 • I. Netinger-Grubeša et al.
Materiales de Construcción 71 (343), July-September 2021, e258. ISSN-L: 0465-2746. https://doi.org/10.3989/mc.2021.04421
1.019 %/min can be regarded as resistant to freeze-thaw cycles and bricks with higher values of this coefficient can be regarded as non-resistant. The probability of a wrong decision is lower than 3% if the coefficient is lower than 1.019 %/min, and the probability of a wrong decision is lower than 1% if the coefficient is higher than 1.019 %/min.
Monte Carlo simulations applied to the variable of compressive strength ratio pre- to post-freezing suggest a cut-off of 0.72 for classification into re-sistant and non-resistant bricks. For that cut-off, the probability of a wrong decision is lower than 5% if the brick, whose value of the ratio variable is greater than or equal to 0.72, is designated as resistant to freeze-thaw cycles and the probability of a wrong decision is lower than 9% if the brick, whose value of the ratio variable is lower than 0.72, is designated as non-resistant to freeze-thaw cycles.
Even though literature sources do not explicit-ly state it, in practice, it is usually believed that bricks with high water absorption are not resistant to freeze-thaw cycles. This study confirmed that, and it is clear that all resistant bricks in the sam-ple have water absorption values between 10 and 12.6%, whereas all non-resistant bricks have higher values, between 13.4 and 24.2%. However, results that could clearly define a water absorption cut-off for separating resistant from non-resistant bricks with an acceptable risk of the wrong decision were not achieved. The standard deviation of water ab-sorption in bricks that are non-resistant to freeze-thaw cycles is high, which, under the assumption of normality of water absorption distribution, allows for low values of water absorption in non-resistant bricks with a not so low probability. Therefore, based on this sample, a reliable cut-off cannot be set for the water absorption value with the aim of classifying bricks according to their resistance to freeze-thaw cycles.
2.6. Description of reliable classifiers for assessing brick resistance to freeze-thaw cycles by the pore system
The median pore radius proved to be an excellent classifier for assessing brick resistance to freeze-thaw cycles, which is in line with Franke and Ben-trup’s results (26). Franke and Bentrup report 1.65 µm as the median pore radius cut-off that separates resistant from non-resistant bricks, and bricks with a median pore radius equal to or higher than 1.65 µm are resistant to freeze-thaw cycles. However, no risk assessment for the wrong decision was made for that cut-off. Our research showed that the cut-off can be set to 1.2 µm with an extremely low risk of a wrong decision.
Since the pore system is regarded as responsible for brick resistance to freeze-thaw cycles in literature
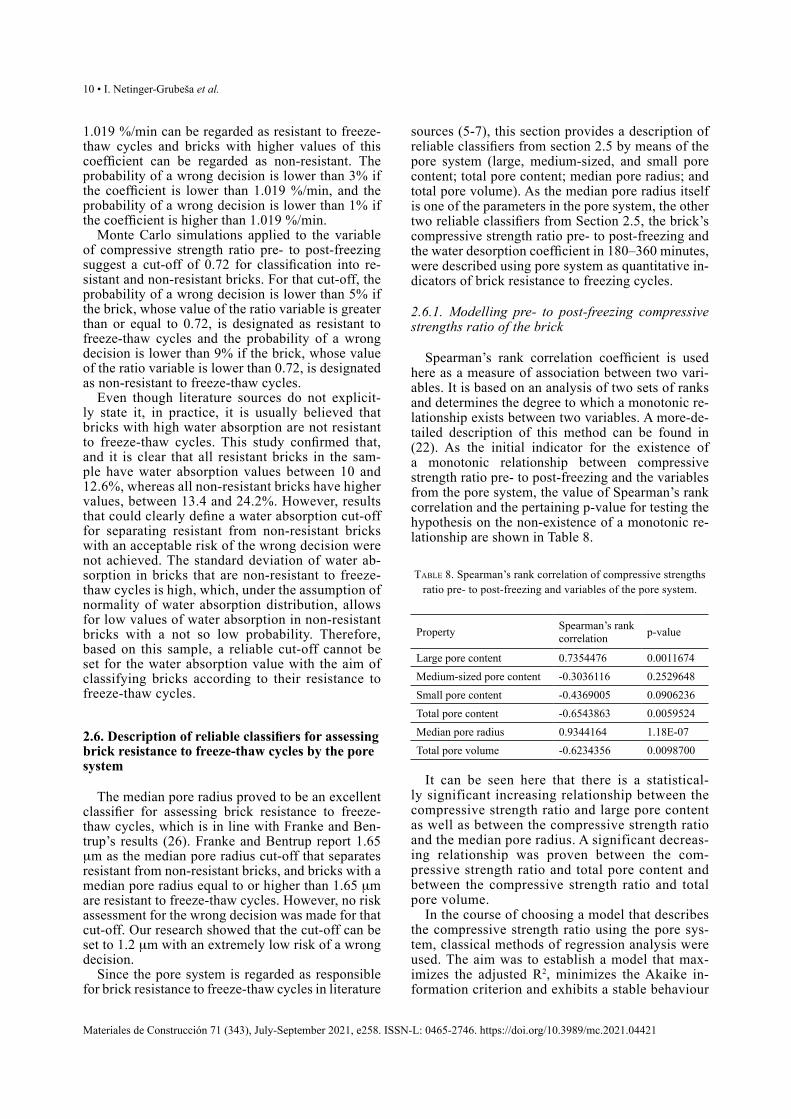
sources (5-7), this section provides a description of reliable classifiers from section 2.5 by means of the pore system (large, medium-sized, and small pore content; total pore content; median pore radius; and total pore volume). As the median pore radius itself is one of the parameters in the pore system, the other two reliable classifiers from Section 2.5, the brick’s compressive strength ratio pre- to post-freezing and the water desorption coefficient in 180–360 minutes, were described using pore system as quantitative in-dicators of brick resistance to freezing cycles.
2.6.1. Modelling pre- to post-freezing compressive strengths ratio of the brick
Spearman’s rank correlation coefficient is used here as a measure of association between two vari-ables. It is based on an analysis of two sets of ranks and determines the degree to which a monotonic re-lationship exists between two variables. A more-de-tailed description of this method can be found in (22). As the initial indicator for the existence of a monotonic relationship between compressive strength ratio pre- to post-freezing and the variables from the pore system, the value of Spearman’s rank correlation and the pertaining p-value for testing the hypothesis on the non-existence of a monotonic re-lationship are shown in Table 8.
Table 8. Spearman’s rank correlation of compressive strengths ratio pre- to post-freezing and variables of the pore system.
Property Spearman’s rank correlation p-value
Large pore content 0.7354476 0.0011674Medium-sized pore content -0.3036116 0.2529648Small pore content -0.4369005 0.0906236Total pore content -0.6543863 0.0059524Median pore radius 0.9344164 1.18E-07Total pore volume -0.6234356 0.0098700
It can be seen here that there is a statistical-ly significant increasing relationship between the compressive strength ratio and large pore content as well as between the compressive strength ratio and the median pore radius. A significant decreas-ing relationship was proven between the com-pressive strength ratio and total pore content and between the compressive strength ratio and total pore volume.
In the course of choosing a model that describes the compressive strength ratio using the pore sys-tem, classical methods of regression analysis were used. The aim was to establish a model that max-imizes the adjusted R2, minimizes the Akaike in-formation criterion and exhibits a stable behaviour

Materiales de Construcción 71 (343), July-September 2021, e258. ISSN-L: 0465-2746. https://doi.org/10.3989/mc.2021.04421
New methods for assessing brick resistance to freeze-thaw cycles • 11
during the bootstrap method. The R software pack-age car (27) was used for model building, and the R software package boot (28, 29) was used for boot-strapping.
The best model achieved in the aforementioned sense is gained using the large pore content and me-dian pore radius variables. The median pore radius does not enter the model linearly, but a piecewise linear function was used. The model coefficients are shown in Table 9.
Table 9. Coefficients of the model for variable description by large pore content and the median pore radius.
Regressor Estimate Std. error p-value of t-test
Free member 0.2970001 0.0604426 0.000461
Large pore content 0.0024181 0.0003549 2.90e-05
Median pore radius 0.3046612 0.0414089 1.43e-05
I (median radius ≤ 1.2) 0.3878672 0.0610214 5.40e-05
median pore radius*I (median radius ≤ 1.2)
-0.3199488 0.0445659 1.80e-05
This model shows that the relationship between variables and compressive strength ratio is described in different ways for bricks with a median pore size of ≤1.2 µm than for bricks with a median pore size of >1.2 µm.
Namely,
- for median pore radius ≤1.2 µm, the relationship can be described as: compressive strength ratio =0.6849+0.0024*large pore con-tent-0.0153*median pore radius
- for median pore radius >1.2 µm, the relationship can be described as: compressive strength ratio =0.297+0.0024*large pore con-tent+0.3047*median pore radius
Even though the assumption of normality and homoscedasticity of the residual in the achieved model is supported (the Shapiro–Wilk test yields a p-value of 0.834, the Non-Constant Variance Score Test yields a p-value of 0.831), due to the relatively small data set, a bootstrap analysis of the suggested model was carried out as well, which shows that the key conclusions are stable. Table 10 provides bootstrapped confidence inter-vals for the adjusted R2 model and the model’s co-efficients.
Table 10. Bootstrapped confidence intervals for the adjusted R2 and the coefficients of the presented model.
Coefficient EstimatePercentile boots-trap confidence interval
Adjusted R2 0.9519899 0.9305, 0.9957
Intercept 0.2970001 0.1374, 0.4485
Large pore content 0.0024181 0.0001, 0.0030
Median pore radius 0.3046612 0.2084, 0.4174
I (median pore radius <= 1.2) 0.3878672 0.2279, 0.5472
Median pore radius* I (median pore radius <=1.2) -0.3199488 -0.4453, -0.1843
Based on the obtained model, it is clear that high values of the median pore radius (higher than 1.2µm) contribute much more to the description of the vari-able ratio than in the case of values lower than 1.2 µm. Spearman’s rank correlation coefficient for ratio and median pore radius, on the data subset for which median pore radius ≤ 1.2 µm, do not point towards the existence of a monotonic relationship (the p-val-ue is 0.17) in that part. The aforementioned is shown in Figure 3.
If compressive strength ratio pre- to post-freezing is accepted as a quantitative indicator of brick re-sistance to freeze-thaw cycles, this model suggests that the median pore radius value, as long as it is lower than 1.2µm, does not significantly contribute to the resistance to freeze-thaw cycles but classifies bricks as non-resistant. As opposed to that, median pore radius values higher than 1.2 µm significantly contribute to resistance to freeze-thaw cycles. This fact is in line with the theory set forth in (5), accord-ing to which small pores have little influence on the brick’s resistance to freeze-thaw cycles. The model also confirms that the information on the large pore content, along with a known median pore radius val-ue, is important for the description of brick resis-tance to cycles and that bricks with a higher large pore content have a better resistance to freeze-thaw cycles, which is, again, in line with the facts provid-ed in literature sources (5, 7).
2.6.2. Modelling of the water desorption coefficient in 180–360 minutes
As the initial indicator of the existence of a mono-tonic relationship between the water desorption co-efficient in 180–360 minutes to the variables in the pore system, the value of Spearman’s rank correla-tion and the pertaining p-value for testing the hy-pothesis on the non-existence of a monotonic rela-tionship are shown in Table 11.

12 • I. Netinger-Grubeša et al.
Materiales de Construcción 71 (343), July-September 2021, e258. ISSN-L: 0465-2746. https://doi.org/10.3989/mc.2021.04421
Table 11. Spearman’s rank correlation for the water desorption coefficient in 180–360 minutes and variables of the pore sys-
tem.
Property Spearman’s rank correlation p-value
Large pore content -0.510326 0.0434094Medium-sized pore content -0.153392 0.5705955Small pore content 0.443870 0.0850169Total pore content 0.707968 0.0021500Median pore radius -0.766965 0.0005266Total pore volume 0.777289 0.0003950
Here, it is noticeable that a statistically signifi-cant increasing relationship exists between the wa-ter desorption coefficient in 180–360 minutes and the total pore content as well as between the water desorption coefficient in 180–360 minutes and the total pore volume. A statistically significant decreas-ing relationship is proven between the water desorp-tion coefficient in 180–360 minutes and large pore content and between water desorption coefficient in 180–360 minutes and median pore radius.
In the procedure of modelling the water desorp-tion coefficient in 180–360 minutes using pore sys-tem variables, the only stable model relates the water desorption coefficient in 180–360 minutes with the classifier based on the median pore radius, i.e. with the indicator of the set (median pore radius <= 1.2 µm). Based on other variables of the pore system, it was not possible to extract a variable that would provide new information on the value of the water desorption coefficient in 180-360 minutes in addi-tion to the one already included by the median pore radius. Since the indicator function of the set (me-dian pore radius <= 1.2 µm) is also a classifier for
resistant and non-resistant bricks, this model does not yield any significant new information that has not been presented in the previous chapters based on the analysis of the water desorption coefficient in 180–360 minutes as a classifier. Therefore, the only important conclusion about that coefficient based in the variables of the pore system is that it is on av-erage 0.01356 (95% confidence interval (0.01211, 0.01500)) if the median pore radius is higher than 1.2 µm and 0.02443 (95% confidence interval (0.02161, 0.027246)) if the median pore radius is lower or equal to 1.2 µm.
3. CONCLUSIONS
During the search for new methods to classify bricks into resistant and non-resistant to freeze-thaw cycles, a variety of properties was tested on a series of bricks, including direct brick resistance to freeze-thaw cycles, compressive strength of bricks (before and after the brick’s exposure to freeze-thaw cycles), water absorption, 5 h boiling water absorption, sat-uration coefficient, initial water absorption, pore distribution, median pore radius, total pore content, total pore volume, compressive strength ratios pre- to post-freezing and Maage’s factor. Furthermore, water absorption and desorption were measured in each brick series for a specific time. The reliabilities of existing methods for classifying bricks into re-sistant and non-resistant to freeze-thaw cycles were analysed using a database generated in this way, and the compressive strength ratio pre- to post-freezing and a water desorption coefficient in 180–360 min-utes were proposed as new qualitative indicators of brick resistance to freeze-thaw cycles.
The median pore radius and the proposed new measures, the water desorption coefficient in the period 180–360 min and the compressive strength ratios pre- to post–freezing, are highly reliable clas-sifiers. For each of them, a cut-off was determined based on which the bricks could be classified as re-sistant and non-resistant. The risk of a wrong con-clusion was also calculated using the proposed cut-off. For water absorption, which, expectedly, proved to be a good classifier into resistant and non-resis-tant to freeze-thaw cycles, no results were achieved based on this database that could clearly define the cut-off for separating resistant and non-resistant bricks with an acceptable risk of a wrong decision. Among all reliable classifiers, the water desorption coefficient in the period 180–360 min would stand out as the simplest and most profitable one.
A model for describing the compressive strength ratio pre- to post-freezing based on the pore system variables was also created. If compressive strengths pre- to post-freezing are accepted as a measure of brick resistance to freeze-thaw cycles, this model confirms that brick resistance in that sense can be
Figure 3. The dependence of compressive strengths pre- to post-brick freezing and the median pore radius for the estimated
large pore content.

Materiales de Construcción 71 (343), July-September 2021, e258. ISSN-L: 0465-2746. https://doi.org/10.3989/mc.2021.04421
New methods for assessing brick resistance to freeze-thaw cycles • 13
very well characterized by the median pore radius and large pore content values.
In the effort to describe the water desorption coef-ficient in 180–360 minutes based on the pore system variables, it was confirmed that it is connected to these variables through its capacity to classify bricks into resistant and non-resistant to freeze-thaw cy-cles, i.e. the only statistically significant predictive variable in the model is the aforementioned classifi-er based on the median pore radius.
This research sheds light on the compressive strength ratio pre- and post-freezing as a reliable and until now completely unresearched classifier that classifies bricks into resistant and non-resistant to freeze-thaw cycles.
ACKNOWLEDGEMENTS
This work is supported by financial support from the Faculty of Civil Engineering and Architecture Osijek as well as by the Croatian Science Founda-tion through research grant IP-2016-06-6545.
AUTHOR CONTRIBUTIONS:
Conceptualization: I. Net inger Grubeša, M. Benšić; Data cura-tion: I. Netinger Grubeša, M. Benšić; Formal analysis: M. Benšić, M. Vračević; Funding acquisition: I. Netinger Grubeša; Inves-tigation: I. Netinger Grubeša, M. Benšić, M. Vračević; Method-ology: I. Netinger Grubeša, M. Benšić; Project ad ministration: I. Netinger Grubeša; Resources: M. Benšić, M. Vračević; Software: M. Benšić; Supervision: I. Netinger Grubeša; Validation: I. Net-inger Grubeša, M. Benšić; Vi sualization: I. Netinger Grubeša, M. Benšić; Roles/Writ ing, original draft: I. Netinger Grubeša, M. Benšić, M. Vračević; Writing, review & editing: I. Netinger Grubeša.
REFERENCES
1. EN 771-1:2011+A1:2015 Specification for masonry units - Part 1: Clay masonry units.
2. EN 772-22:2018 Methods of test for masonry units - Part 22: Determination of freeze/thaw resistance of clay masonry units.
3. Straube, J.; Schumacher, C.; Mensinga, P. (2010) CP-1013: Assessing the freeze-thaw resistance of clay brick for interior insulation retrofit project. Building Science Corporation. Retrieved from https://www.buildingscience.com/documents/reports/rr-1013-freeze-thaw-resistance-clay-brick-interior-insulation-retrofits.
4. Mensinga, P. (2009) Determining the critical degree of saturation of brick using frost dilatometry. A thesis at University of Waterloo. Waterloo, Canada (2009). Retrieved from https://hdl.handle.net/10012/4638.
5. Kung, J.H. (1985) Frost durability of canadian clay bricks. Proceedings of the 7th International Brick Masonry Conference, Melbourne, Australia. [1], 245–251. Retrieved from https://nrc-publications.canada.ca/eng/view/ft/?id=85a8f3ac-6e9e-43a4-aad1-51c6288e929b.
6. Hansen, W.; Kung, J.H. (1988) Pore structure and frost durability of clay bricks. Mater Struct. 21, 443–447. https://doi.org/10.1007/BF02472325.
7. Perrin, B.; Vu, N.A.; Multon, S.; Voland, T.; Ducroquetz, C. (2011) Mechanical behaviour of fired clay materials subjected to freeze-thaw cycles. Constr Build Mater. 25 [2], 1056–1064.
https://doi.org/10.1016/j.conbuildmat.2010.06.072.8. Elert, K.; Culturone, G.; Rodríguez, C.; Pardo, E.S. (2003)
Durability of bricks used in the conservation of historic buildings-influence of composition and microstructure. J. Cult. Herit. 4[2], 91–99. https://doi.org/10.1016/S1296-2074(03)00020-7.
9. Bracka, A.; Rusin, Z. (2012) Comparison of pore characteristics and water absorption in ceramics materials with frost resistance factor, Fc. Struc. Environ. 3 [4], 15–19. Retrieved from http://sae.tu.kielce.pl/12/S&E_NR_12_Art_3.pdf.
10. Korenska, M.; Chobola, Z.; Sokolar R. (2006) Frequency inspection as an assessment tool for the frost resistance of fired roof tiles. Ceram. Silik. 50 [3], 185–192. Retrieved from https://www.irsm.cas.cz/materialy/cs_content/2006/Korenska_CS_2006_0000.pdf.
11. Koroth, S.R. (1997) Evaluation and improvement of frost durability of clay bricks. A thesis in The Centre for Building Studies. Ottawa, Canada (1997). Retrieved from https://spectrum.library.concordia.ca/282/.
12. Šveda, M.; Sokolar, R. (2004) The effect of firing temperature on the irreversible expansion, water absorption and pore structure of a brick body during freeze-thaw cycles. Mater. Sci. 19 [4], 465–470. http://doi.org/10.5755/j01.ms.19.4.2741.
13. Raimondo, M.; Dondi, M.; Ceroni, C.; Guarini, G. (2008) Durability of clay roofing tiles: assessing the reliability of prediction models. 11DBMC International Conference on Durability of Building Materials and Components. Istanbul, Turkey. Retrieved from https://www.irbnet.de/daten/iconda/CIB13184.pdf.
14. Netinger, I.; Vračević, M.; Ranogajec, J.; Vučetić, S. (2020) Influence of pore-size distribution on the resistance of brick to freeze-thaw cycles. Materials. 13 [10], 2364. https://doi.org/10.3390/ma13102364.
15. Netinger, I.; Vračević, M.; Ducman, V.; Marković, B.; Szenti, I.; Kukocz, A. (2020) Influence of the size and type of pores on brick resistance to freeze-thaw cycles. Materials. 13 [17], 3717. https://doi.org/10.3390/ma13173717.
16. HRN B.D8.011:1987 Glinene opeke, blokovi i ploče – metode ispitivanja, točka 9. Provjeravanje postojanosti prema mrazu. Croatian Standards Institute. Zagreb, Croatia.
17. EN 772-1:2011+A1:2015 Methods of test for masonry units - Part 1: Determination of compressive strength.
18. EN 772-21:2011 Methods of test for masonry units - Part 21: Determination of water absorption of clay and calcium silicate masonry units by cold water absorption.
19. EN 772-7:1998 Methods of test for masonry units – Part 7: Determination of water absorption of clay masonry damp proof course units by boiling in water.
20. EN 772-11:2011 Methods of test for masonry units –Part 11: Determination of water absorption of aggregate concrete, autoclaved aerated concrete, manufactured stone and natural stone masonry units due to capillary action and the initial rate of water absorption of clay masonry units.
21. Fawcett, T. (2006) An introduction to ROC analysis. Pattern Recognit. Lett. 27 [8], 861–874. https://doi.org/10.1016/j.patrec.2005.10.010.
22. Sheskin, D.J. (2000) Handbook of parametric and nonparametric statistical procedures. Second Edition, Chapman & Hall/CRC, United States of America (2000). Retrieved from https://fmipa.umri.ac.id/wp-content/uploads/2016/03/David_J._Sheskin_David_Sheskin_Handbook_of_ParaBookFi.org_.pdf.
23. Vračević, M.; Ranogajec, J.; Vučetić S.; Netinger, I. (2014) Evaluation of brick resistance to freeze/thaw cycles according to indirect procedures. Građevinar. 66 [3], 197–209. https://doi.org/10.14256/JCE.956.2013.
24. Pouillot, R.; Delignette-Muller, M.L. (2010) Evaluating variability and uncertainty in microbial quantitative risk assessment using two R packages. Int. J. Food Microbiol. 142 [3], 330–340. https://doi.org/10.1016/j.ijfoodmicro.2010.07.011.
25. Sing, T.; Sander, O.; Beerenwinkel, N.; Lengauer, T. (2005) ROCR: visualizing classifier performance in R. Bioinformatics. 21 [20], 3940–3941. https://doi.org/10.1093/bioinformatics/bti623.
26. Raimondo, M.; Ceroni, C.; Dondi, M.; Guarini, G.; Marsigli,

14 • I. Netinger-Grubeša et al.
Materiales de Construcción 71 (343), July-September 2021, e258. ISSN-L: 0465-2746. https://doi.org/10.3989/mc.2021.04421
M.; Venturi, I.; Zanelli, C. (2009) Durability of clay roofing tiles: the influence of microstructural and compositional variables. J. Eur. Ceram. Soc. 29 [15], 3121–3128. https://doi.org/10.1016/j.jeurceramsoc.2009.06.004.
27. Fox, J.; Weisberg, S. (2019) An R companion to applied regression. Third Edition. Sage, Thousand Oaks CA (2019).
28. Davison, A.C.; Hinkley, D.V. (1997) Bootstrap methods and their applications. Cambridge series in statistical and probabilistic mathematics. Cambridge University Press, Cambridge (1997). https://doi.org/10.1017/CBO9780511802843.
29. Canty, A.; Ripley, B.D. (2019) Boot: Bootstrap R (S-plus) functions. R package version 1.3-24, (2019).