ac freeze-thaw cycles astm c666 apparatusazsce.org/downloads/ac freeze-thaw cycles astm c666...
TRANSCRIPT

AC Freeze-Thaw
Cycles ASTM C666
Apparatus
CHUN-HSING (JUN) HO, PHD, PE
CRISTINA PILAR MARTIN LINARES, MSC CANDIDATE
ASCE ASHE CONFERENCE 2016
NORTHERN ARIZONA UNIVERSITY

INDEX
Introduction
Objectives
Materials and Testing methods
Results and Discussions
Conclusions
Acknowledgement
Questions
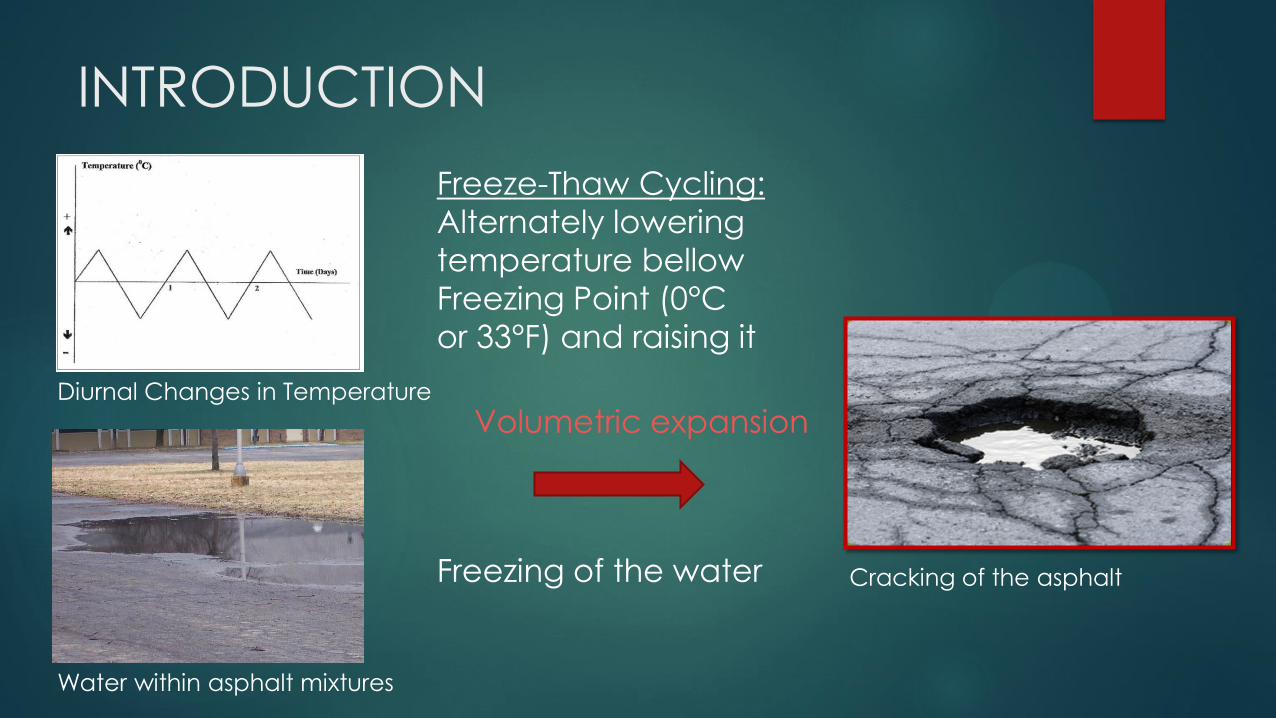
INTRODUCTION
Diurnal Changes in Temperature
Freeze-Thaw Cycling:
Alternately lowering
temperature bellow
Freezing Point (0°C
or 33°F) and raising it
Water within asphalt mixtures
Volumetric expansion
Cracking of the asphalt Freezing of the water

Mean Annual Days of Freeze-Thaw Cycles Northern Arizona: 250 cycles (annual average)

OBJECTIVES
Evaluate feasibility of using ASTM C666 apparatus in asphalt mixtures
Provide a scientific sound material testing procedure to study F-T
cycling in asphalt mixtures (compare to AASHTO T283)
ASTM C666 standard testing standard for pervious concrete

AASHTO T283
Objective: Determine the resistance of asphalt to
stripping
Specimens are compacted to air voids of 6 to 8 %
Specimens undergo Freeze-Thaw cycle and then
are tested in the IDT
Tensile strength ratio (TSR) is calculated
F-T cycle process:
Dry specimens wrapped in plastic bag and placed in a water bath at 25⁰C for 2 h.
Specimens are then placed in a freezer at -18⁰C for
24 h.

AASHTO T283
However…
The method was never intended to simulate F-T cycles
It is difficult to maintain temperature at a constant rate in a water
tank
Specimens are prepared using Marshall mixture test; incompatible
with Superpave mix design
Issues with repeatability and reproducibility and questionable
predictive results
Highly variable due to allowable saturation levels

ASTM C666
Objective: Determine the resistance of concrete to
F-T cycles
Calculate durability factor and weight change;
length change is optional
F-T cycle process:
Simulation using a F-T chamber
Alternately lowering the temperature from 4 to -18⁰C and
raising it from -18 to 4⁰C, in between 2 to 5 h
2 different procedures
300 cycles total

ASTM C666
However…
Method designed for testing pervious concrete but promising for
testing asphalt mixtures, with some modifications.
MATERIALS AND TESTING METHODS
Paving Project
Mix Design Information
Freeze-Thaw Cycle Test
Bending Beam Rheometer

Paving Project
In 2-lanes roadway: overlay project
(136 meters Length x 5.1 meters
Width per lane)
Rubberized modified asphalt (RMA)
and fiber reinforced asphalt (FRA),
on each lane
Samples collected and sent to NAU
lab, where specimens of 150 mm in
diameter and 110 mm in height were
produced in SGC
Layout of asphalt overlay project at NAU

Mix Design Information
Mix Design RMA FRA
Nominal Material Aggregate Size (NMAS) ½” (12.5mm) ½” (12.5mm)
Asphalt Binder PG 64-28 TR PG 58-28
Percent of asphalt binder, % 6.90 5.20
Bulk specific gravity, Gmb 2.43 2.45
Theoretical max. specific gravity, Gmm 2.53 2.55
Percent air void, % 4.20 3.90
Voids in mineral aggregate filled (VMA), % 19.0 14.9
Percent voids filled (VFA), % 77.9 73.9

Freeze-Thaw Cycle Test
ASTM C666 mold: 16.5” x 3.5”
x 4.6” (length x width x
thickness)
Specimens of 4.5” x 2.5” x 4.5”
(length x width x thickness)
100% saturated condition

Freeze-Thaw Cycle Test
Temperature cycling from 4 to -18°C
Ranges of cycles: 0, 100, 150, 200, 250, 300 cycles
F-T cycling range

Bending Beam Rheometer
Thin beams of 12.7 mm x 6.35 mm x 127
mm (width x thickness x length)
Creep compliance data at 60 seconds
Temperature superposition Principle.
Asphalt binder: PG 64-28 TR and PG 58-28. Testing temperatures: -12°C, -18°C, -24°C

RESULTS AND DISCUSSIONS
Stiffness vs. Number of Cycles
ANOVA
Linear Viscoelastic Analysis
Prediction Relaxation Modulus
Field Performance

Stiffness vs. Number of Cycles Objective: Determine the effect of F-T in stiffness
Stiffness drops with the increase in the number of cycles
Exponential correlation
Correlation in RMA mixtures Correlation in FRA mixtures

Stiffness vs. Number of Cycles
1/3 drop in stiffness at 150 cycles
After 150 cycles, stiffness decrease rate diminishes
Stiffness
rate
decrease
A. Mixture Temperature Number of F-T Cycles
100 150 200 250 300
FRA
-12⁰C -20.8% -40.0% -44.1% -51.1% -57.0%
-18⁰C -15.1% -31.3% -37.2% -44.7% -52.4%
-24⁰C -23.5% -37.6% -44.3% -51.3% -60.9%
RMA
-12⁰C -17.0% -29.4% -34.6% -37.0% -42.4%
-18⁰C -28.8% -32.0% -47.9% -56.0% -59.3%
-24⁰C -6.7% -12.2% -17.6% -23.5% -37.4%

ANOVA- ANALYSIS OF VARIANCE
Objective: Statistically determine the significance of that reduction
2 data sets from FRA and RMA
For each temperature: -12°C, -18°C and -24° C
Stiffness difference among all cycles (0, 100, 150, 200, 250, 300) proved to be statistically significant
A. Mixture Temperature (°C) P-value
RMA
-12 3.44 E-07
-18 2.34 E-05
-24 3.76 E-07
FRA
-12 1.75 E-05
-18 9.47 E-06
-24 2.21 E-05

LINEAR VISCOELASTIC ANALYSIS
Objective: Predict Relaxation modulus behavior
Time Temperature Superposition Principle to get a master curve for creep
compliance data (inverse of stiffness)
Power Law function is used to model master curve
Relaxation modulus and creep compliance are related by the
interconversion equation

Prediction Relaxation Modulus
Relaxation modulus in RMA mixtures Relaxation modulus in FRA mixtures
Decrease in relaxation modulus with the increase in the number of cycles
After 150 cycles, decrease in relaxation modulus is less significant

Field Performance
Climatic F-T cycles and field
performance of RMA mixtures for
2 years
Date
Accumulative
length of
cracks (feet)
Accumulative
F-T cycles
Stiffness
decrease rate
at -18°C
Mar-14 16 166 32%
(150 cycles)
Jan-15 58 256 56%
(250 cycles)
Feb-15 127 316 59%
(300 cycles)

CONCLUSIONS
ASTM C666 capable of testing and simulate F-T for asphalt mixtures,
as compare to AASHTO T283 standard
Stiffness and number of F-T cycles have a exponential correlation
ANOVA shows that there are significant differences in stiffness
among the different F-T cycles
Modulus of elasticity and stiffness have a lower rate of decrease
after 150 cycles
Field performance data have close conformity with experimental
data
This research provides positive trend for future research on
F-T cycles durable asphalt mixtures

ACKNOWLEDGMENT
Dr. Shane Underwood at Arizona State University

QUESTIONS?