new financial report - bfas · 2019. 2. 27. · 5 financial report combined with historically low...
TRANSCRIPT

Financial RepoRtSyracuSe univerSity
2010

Table of ConTenTs
2 Message from the Chancellor
4 Financial Report
12 Statement of Responsibility
13 Independent Auditors’ Report
14 Statements of Financial Position
15 Statements of Activities
17 Statements of Cash Flows
18 Notes to Financial Statements
32 2010-2011 Board of Trustees

2
message from the chancellor
The global economy conTinued To challenge all of american higher education this past year. at Syracuse university, in 2010 we once again engaged these challenges directly and decisively, institutionalizing our cost-saving measures and implementing new strategies to strengthen our fiscal position while staying affordable for students and families; reaffirming our commitment to academic excellence and accessibility; and steadfastly maintaining our forward momentum.
in this “new normal” fiscal environment, we worked to manage costs in every major area of our budget while continuing to find ways to support faculty, staff, and, most significantly, our students. We continued administrative cost saving measures that were begun in fall 2008, yielding more than $12 million in savings over the past two fiscal years. We continued to respond aggressively with strategic efforts to remain affordable for students from the range of socioeconomic backgrounds. We increased Su-supported financial aid to lower- and middle-income students and their families—providing a total of $166 million in institutional aid to undergraduate students in 2009-10. in addition, we continued to contain tuition increases down 4.5% in 2009-10 (down from 5.6% in 2008-09) and 4.0% in 2010-11, the latter being our smallest increase in 45 years. The results of these efforts are evident in the record number of applicants we saw this year that has enabled us to enroll a larger, more geographically and economically diverse incoming class with steadily strong qualifications.
Throughout this period of prudent fiscal tightening, we have never lost sight of our primary mission—preparing our students to take on the great challenges of our time and make a real difference in the world. We continue building on our strong forward momentum, making strategic investments in top-notch faculty and key academic initiatives, such as the Student Sandbox, a unique business incubator that fosters the entrepreneurial spirit in our students, some of whom already have drawn national notice. We partnered with JPmorgan chase to open our unique on-campus technology center where students and faculty work side-by-side with industry professionals. We inaugurated a leed-platinum new headquarters for the Syracuse center of excellence for environmental and energy Systems and the ibm green data center, the world’s most energy efficient facility of its kind, which serves as Su’s primary computing facility and as a showcase for energy-efficient computing technologies. our groundbreaking, citywide partnership with Say yes to education drew a visit and praise from Vice President Joe biden l’68 and education Secretary arne duncan, who in a campus “town hall” meeting lauded the collaboration as a potential national model for public school reform. and our sustained and productive local engagement initiatives, including the connective corridor and near West Side initiative, continue to generate expansive opportunities for our faculty to do research and creative work that makes a difference while offering extraordinary opportunities for us to prepare our students for the world, in the world.
Nancy CantorChancellor and President
3
message from the chancellor
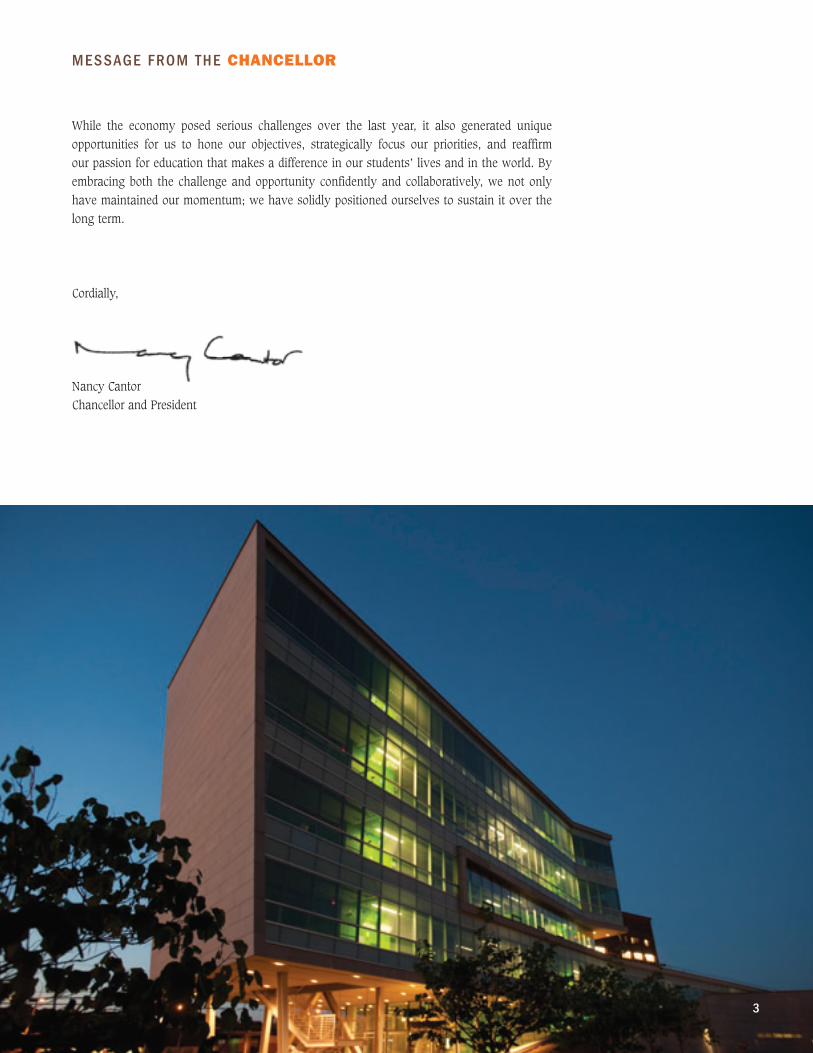
While the economy posed serious challenges over the last year, it also generated unique opportunities for us to hone our objectives, strategically focus our priorities, and reaffirm our passion for education that makes a difference in our students’ lives and in the world. by embracing both the challenge and opportunity confidently and collaboratively, we not only have maintained our momentum; we have solidly positioned ourselves to sustain it over the long term.
cordially,
nancy cantorchancellor and President
3
n cantor

4
f inancial report
Fiscal Year 2010 highlights
SyracuSe uniVerSiTy comPleTed fiScal year 2010 WiTh PoSiTiVe financial groWTh as a result of its continued well planned and controlled financial management. The university remains a major contributor to the economic outlook of central new york, and its students, faculty and staff continue to engage in learning, discovery and engagement by “preparing for the world in the world.”
enrollment trends continue their impressive and steady growth, and the university is maintaining its commitment to being affordable by minimizing tuition increases and by increasing the tuition discount through financial aid awarded to its students. While maintaining its commitment to its students and their families, as well as to the local and global community, the university has continued to address the “new normal” of fiscal constraints that are facing families and businesses world-wide, by proactively and thoughtfully managing its expenditures. The university has also maintained its commitment to promoting and practicing sustainability by re-casting its benefits to be more inclusive of the university community and its needs, by engaging in sustainable construction practices, by expanding its recycling programs, by developing more eco-friendly transportation practices and similar activities that are continually evolving and expanding.
enrollment, tuition and Financial aid
Syracuse university enrollment has grown each fiscal year since fiscal year 2005, while maintaining and improving in academic excellence and diversity. in the past ten fiscal years, enrollment has increased by almost 2,000 students, which is more than a 10% increase. as depicted in the following university enrollment chart, the fiscal year 2011 headcount is expected to surpass 20,000 undergraduate, graduate and law students.
Louis G. MarcocciaExecutive Vice President and Chief Financial Officer
The university continues its dedication to ensuring that Syracuse university degrees remain affordable. achievement of this objective has been enabled through enactment of historically low tuition increases and steadily increasing tuition discount to students. The fiscal year 2011 undergraduate tuition rate increase approved by the board of Trustees was held to 4.0%, down from the fiscal year 2010 undergraduate tuition rate increase of 4.5%. The following chart depicts the undergraduate tuition rate increases since fiscal year 2001.
Stu
den
t H
ead
coun
t

5
f inancial report
combined with historically low tuition rate increases, the university has steadily and consciously been increasing financial aid to better address its affordability, with approximately 80% of its students receiving some type of financial assistance. as depicted in the chart below, since fiscal year 2000, financial aid has increased by over $124 million – more than a 119% increase – to $228.4 million awarded in fiscal year 2010.
financial aid, which is also referred to as tuition discount, has been steadily increasing not only in total dollars but also in terms of its percentage of the university’s total gross tuition and fees revenues. in fiscal year 2000, Syracuse university’s all-students tuition discount was 33.0%, and by fiscal year 2010 the university had increased its tuition discount rate to 37.5%, with the sharpest growth occurring over the past five fiscal years. The chart below graphically displays the tuition discount since fiscal year 2000.
Dis
coun
tFi
nanc
ial A
idP
erce
nt I
ncre
ase
6
f inancial report
statements oF Financial position highlights
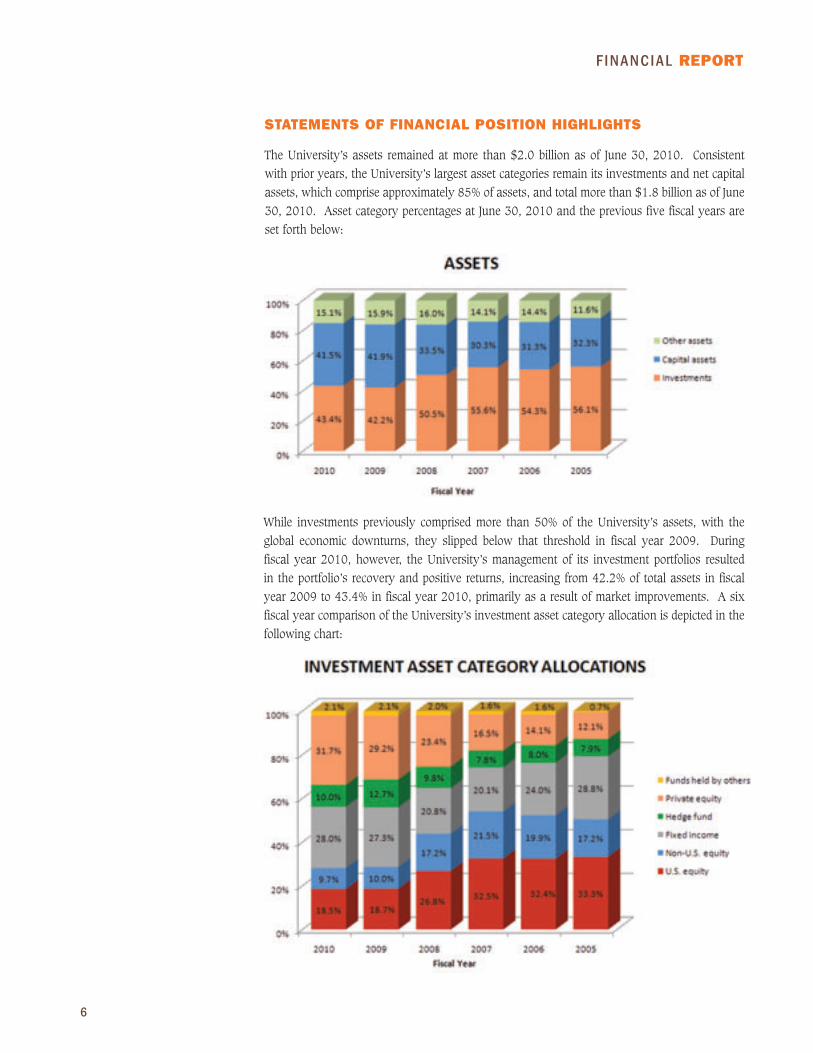
The university’s assets remained at more than $2.0 billion as of June 30, 2010. consistent with prior years, the university’s largest asset categories remain its investments and net capital assets, which comprise approximately 85% of assets, and total more than $1.8 billion as of June 30, 2010. asset category percentages at June 30, 2010 and the previous five fiscal years are set forth below:
While investments previously comprised more than 50% of the university’s assets, with the global economic downturns, they slipped below that threshold in fiscal year 2009. during fiscal year 2010, however, the university’s management of its investment portfolios resulted in the portfolio’s recovery and positive returns, increasing from 42.2% of total assets in fiscal year 2009 to 43.4% in fiscal year 2010, primarily as a result of market improvements. a six fiscal year comparison of the university’s investment asset category allocation is depicted in the following chart:

7
f inancial report
capital assets, which comprise almost 42% of the university’s total assets, increased from $850.4 million as of June 30, 2009 to $896.7 million as of June 30, 2010. in 2007, the university became part of the american college and university President’s climate commitment, and one significant aspect of doing so is the university’s commitment to leadership in energy and environmental design (leed) standards for new buildings and renovations exceeding $10.0 million. leed certification demonstrates sustainable green building and development practices through the creation and implementation of universally understood and adopted tools and performance criteria. it is a nationally accepted benchmark for the design, construction and operation of exceptional achievement in green buildings, and is a points-based system that awards one of four levels: certified, silver, gold, and platinum. The university’s major construction projects during fiscal year 2010 and their associated leed certification ratings or certification status are as follows:
• completion of the center of excellence headquarters built on a three-acre site in downtown Syracuse. it includes spaces for collaboration between and among the academic, public, and private/corporate partners in research and development, education, and public outreach. a platinum leed rating is being sought for the headquarters building.
• completion of construction of the ernie davis residence hall, the university’s first new residence hall in approximately 40 years. The facility, a nine-story structure, includes 60 split doubles units, 120 single units, a 500 seat dining facility, a 10,600 square foot fitness facility, a convenience store, and academic space, is expected to receive a gold leed rating.
• construction of the green data center, which is a first-of-its-kind facility, utilizing a configuration of equipment that has not previously been used in data centers. a silver leed rating is being sought for the center.
• completion of renovations of lawrinson hall, a 21 story student residence building. The renovations included replacement of systems and finishes, as well as functional improvements to enhance the quality of the residential experience by replacing flooring, refinishing walls, upgrading plumbing, heating and electrical systems, adding a new elevator control system, completing exterior and structural repairs, modifying and adding bathroom space for more privacy and capacity, and adding lounge spaces on each floor for study and social activities. leed certification is being sought for this building.
• completion of the carmelo K. anthony basketball Practice center, a 54,000 square foot facility that includes two ncaa regulation-size courts, weight rooms, training rooms, hydro-therapy rooms with state-of-the-art pools, study rooms, coaches suites, film rooms, locker rooms and shower facilities. The center is designed to use 30% less water and 20% less energy than a typical new building. leed certification is being sought for the center.

8
f inancial report
• continuation of renovations to bowne hall, which was originally constructed in 1907, to add a major new interdisciplinary cluster for research in the field of bio-materials. leed certification is being sought for the hall.
as of June 30, 2010, liabilities increased from $648.4 million to $703.8 million, approximately an 8.5% increase from the prior fiscal year. as depicted below in the liabilities chart, long-term debt continued to comprise the largest component of liabilities, growing from approximately 34% in fiscal year 2005 to almost 50% in fiscal year 2010. The outstanding balance of long-term debt increased due to the issuance of onondaga county Trust for cultural resources revenue bonds totaling $111.2 million, inclusive of a bond issuance premium of $3.8 million. unlike previous bond issues, a portion of the Series 2010 bonds were issued as fixed interest rate demand bonds, with interest rates ranging from 3.0% to 5.0%. $75.5 million of the Series 2010 debt was used to redeem a corresponding amount of the Series 1999 city of Syracuse industrial development agency civic facility Variable interest rate revenue bonds.
statements oF activities highlights
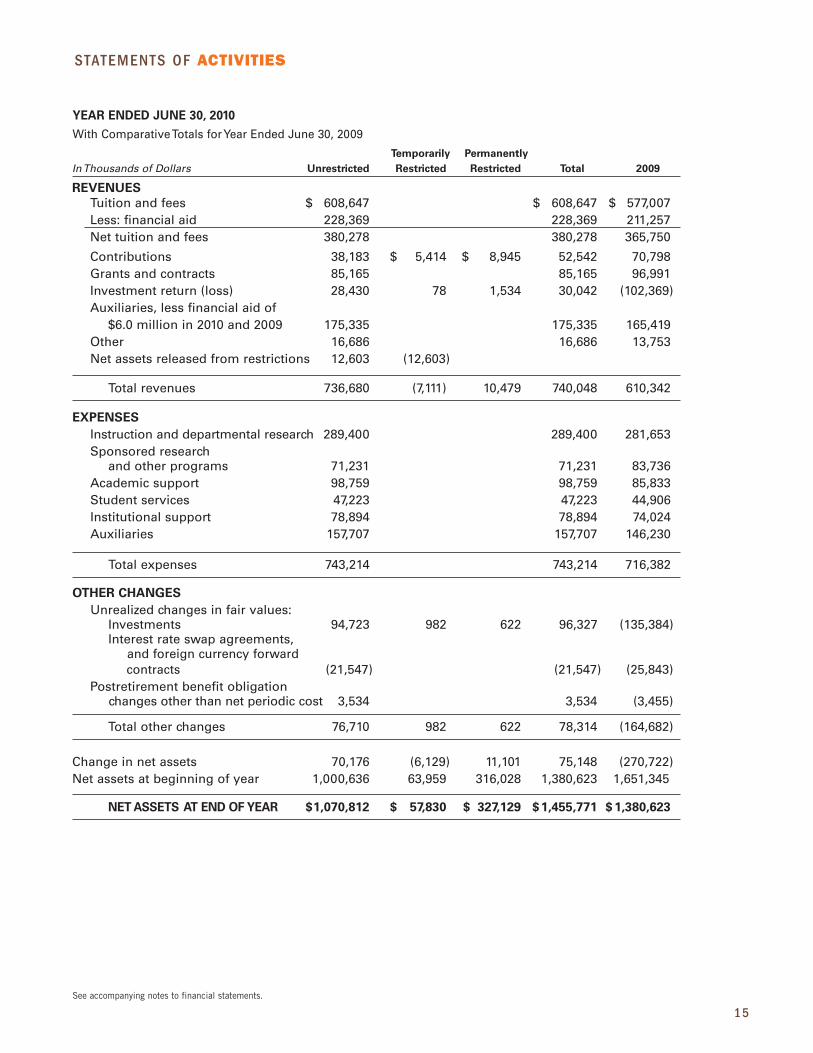
Total revenues for the fiscal year ended June 30, 2010 increased to $740.0 million, a 21.3% increase that resulted principally from positive investment return.
investment return for fiscal year 2010 improved substantially, as is depicted graphically below. While there were both realized and unrealized losses on investments in fiscal year 2009, and unrealized losses in fiscal year 2008, fiscal year’s 2010 performance resulted in both realized and unrealized gains on investments. in fiscal year 2010 the university’s long term investment fund returned 17.2%, which

9
exceeded the policy index return of 14.2% and an endowment and foundations peer group median return of 13.7%. The university’s long term investment fund performance also exceeded the returns of broad market indices, including the S&P 500 index (a return of 14.4%) and the barclay’s aggregate index (a return of 9.5%).
f inancial report
9

1 0
f inancial report
The following revenues chart indicates that the university remains heavily tuition dependent, with net tuition and fees comprising over fifty percent of total revenues in fiscal year 2010. The next most significant revenue component was auxiliaries revenues, which increased from $165.4 million in fiscal year 2009 to $175.3 million in fiscal year 2010.
While revenues increased approximately 21.3%, expenses only increased from $716.4 million to $743.2 million, a 3.7% increase. as a result of the university’s focus on maintaining its academic momentum through its nimble financial planning and execution, that included cost containment initiatives begun in fiscal year 2009, administrative and academic areas continue to examine their operations to identify efficiencies and adopt transformative initiatives to address the “new normal” facing higher education, as well as other business entities and organizations throughout the global community. as depicted in the following expenses chart, instruction and departmental research expenses continued to comprise the majority of university expenses, and over the past five fiscal years has remained at approximately 40% of university expenditures. The next largest component, auxiliaries expenses, comprised between 20% and 23% of total expenses over the past five fiscal years.

11
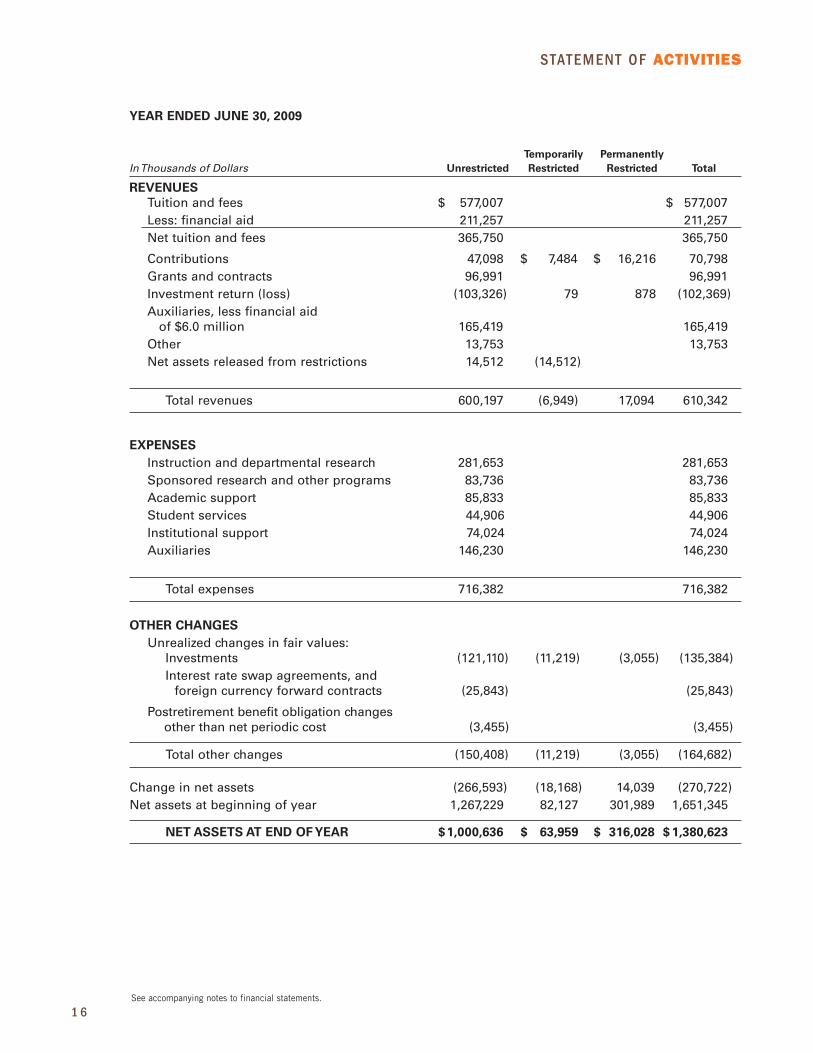
other changes in net assets showed a dramatic improvement, increasing to $78.3 million for the fiscal year ended June 30, 2010 from ($164.7) million for the fiscal year ended June 30, 2009. This substantial improvement was primarily due to the unrealized changes in fair values of investments, which improved from unrealized losses of ($135.4) million for the fiscal year ended June 30, 2009 to unrealized gains of $96.3 million for the fiscal year ended June 30, 2010. This substantial improvement between fiscal years resulted in an overall increase in net assets for the fiscal year ended June 30, 2010 of $75.1 million, compared to an overall decrease in net assets of ($270.7) million for the fiscal year ended June 30, 2009
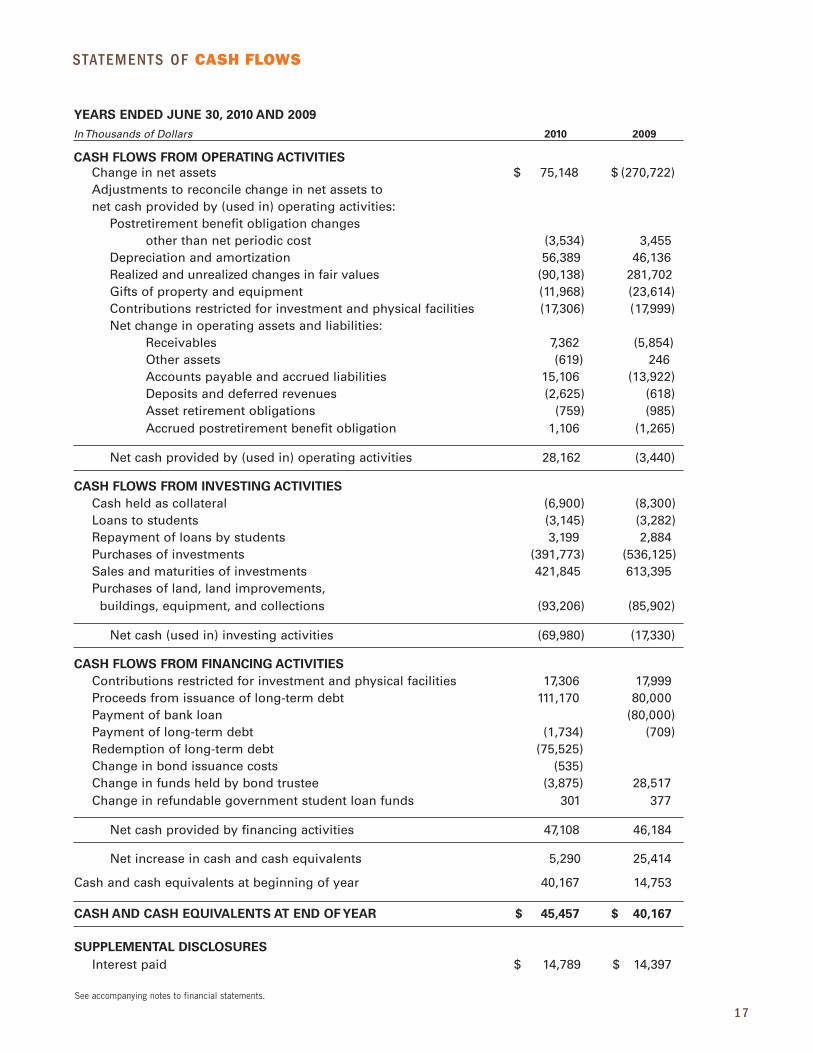
statements oF cash Flows
in fiscal years 2010 and 2009 there were increases in cash and cash equivalents amounts of approximately $5.3 million and $25.4 million, respectively. The components of these changes were net cash amounts provided by and (used in) operating activities of $28.2 million and ($3.4) million in fiscal years 2010 and 2009, respectively; net cash amounts used in investing activities of ($70.0) million in fiscal year 2010 as compared to ($17.3) million in fiscal year 2009; and net cash amounts provided by financing activities of $47.1 million and $46.2 million in fiscal years 2010 and 2009, respectively.
recognition
The university’s business, finance, and administrative Services division continues to conduct its business in a fiscally responsible manner in accordance with best practices and the highest ethical standards. best practice financial planning and management services continue to be important contributors in support of the university’s vision. Principal providers of leadership in achievement and support of those services were comptroller, rebecca l. foote; budget and Planning director, gwenn b. Judge; Treasurer, barbara l. Wells; audit and management advisory Services director, Stephen g. colicci; and administrative assistant to the executive Vice President and chief financial officer, nancy J. freeman.
louis g. marcocciaexecutive Vice President and chief financial officer
f inancial report

1 2
statement of responsibilitY
managemenT iS reSPonSible for The PreParaTion, integrity and objectivity of the financial statements of Syracuse university. The statements have been prepared in accordance with u.S. generally accepted accounting principles, and include certain estimates and judgments that affect the reported amounts of assets and liabilities and disclosures of contingent assets and liabilities at the date of the financial statements. management fulfills its responsibility primarily by establishing and maintaining an internal control structure that is designed to provide reasonable assurance that the university’s assets are safeguarded, transactions are executed in accordance with management’s authorization, and that the university’s financial records may be relied upon for the purpose of preparing financial statements and related disclosures. That system is monitored and assessed by direct management review and by the university’s audit and management advisory Services department. in addition, the university
recognizes its responsibility for conducting its affairs according to the highest standards of personal and corporate conduct. This responsibility is characterized and reflected in key policy statements issued from time to time regarding, among other things, conduct of its business activities, a code of ethics for the university’s senior financial officers, and disclosure and management of potential conflicts of interest by its trustees and employees. accordingly, the university maintains programs to assess compliance with those policies.
The university’s board of Trustees audit committee appointed KPmg llP as its independent auditors to audit the university’s financial statements. Their accompanying report is based on audit procedures conducted in accordance with auditing standards generally accepted in the united States of america, which include the consideration of the university’s internal controls to establish a basis for determining the nature, timing, and extent of audit tests to be applied. The independent auditors were given unrestricted access to financial records and related data, including minutes of trustees meetings.
The audit committee of the board of Trustees, which consists of trustees who are neither officers nor employees of the university, is responsible for the oversight of the work performed by the independent auditors, oversight of the work performed by the audit and management advisory Services department, as well as overseeing the university’s internal control systems and financial reporting processes. The audit committee meets with financial management, the independent auditors, and the director of the audit and management advisory Services department to review financial reporting, internal accounting controls, and auditing matters. both the independent auditors and the director of the audit and management advisory Services department have direct and private access to the audit committee.
nancy cantor louis g. marcocciachancellor and President executive Vice President and chief financial officer
louis g marcoccianancy cantor

13
independent auditors’ report
1 4
statements of Financial position
See accompanying notes to financial statements.
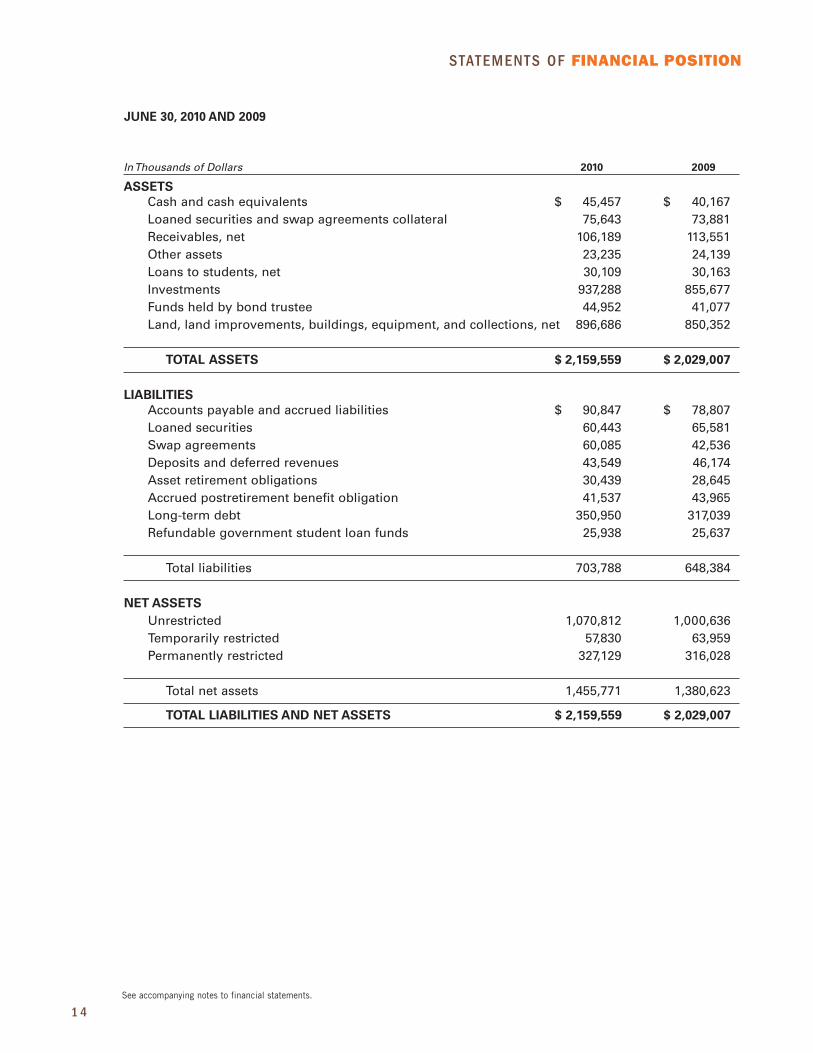
June 30, 2010 and 2009
In Thousands of Dollars 2010 2009
aSSeTS Cashandcashequivalents $ 45,457 $ 40,167 Loanedsecuritiesandswapagreementscollateral 75,643 73,881 Receivables,net 106,189 113,551 Otherassets 23,235 24,139 Loanstostudents,net 30,109 30,163 Investments 937,288 855,677 Fundsheldbybondtrustee 44,952 41,077 Land,landimprovements,buildings,equipment,andcollections,net 896,686 850,352
ToTal aSSeTS $ 2,159,559 $ 2,029,007
liabiliTieS Accountspayableandaccruedliabilities $ 90,847 $ 78,807 Loanedsecurities 60,443 65,581 Swapagreements 60,085 42,536 Depositsanddeferredrevenues 43,549 46,174 Assetretirementobligations 30,439 28,645 Accruedpostretirementbenefitobligation 41,537 43,965 Long-termdebt 350,950 317,039 Refundablegovernmentstudentloanfunds 25,938 25,637
Totalliabilities 703,788 648,384
neT aSSeTS Unrestricted 1,070,812 1,000,636 Temporarilyrestricted 57,830 63,959 Permanentlyrestricted 327,129 316,028
Totalnetassets 1,455,771 1,380,623
ToTal liabiliTieS and neT aSSeTS $ 2,159,559 $ 2,029,007
15
statements of activities
Year ended June 30, 2010WithComparativeTotalsforYearEndedJune30,2009
Temporarily Permanently In Thousands of Dollars unrestricted restricted restricted Total 2009
revenueS Tuitionandfees $ 608,647 $ 608,647 $ 577,007 Less:financialaid 228,369 228,369 211,257 Nettuitionandfees 380,278 380,278 365,750
Contributions 38,183 $ 5,414 $ 8,945 52,542 70,798 Grantsandcontracts 85,165 85,165 96,991 Investmentreturn(loss) 28,430 78 1,534 30,042 (102,369) Auxiliaries,lessfinancialaidof $6.0millionin2010and2009 175,335 175,335 165,419 Other 16,686 16,686 13,753 Netassetsreleasedfromrestrictions 12,603 (12,603)
Totalrevenues 736,680 (7,111) 10,479 740,048 610,342
exPenSeS Instructionanddepartmentalresearch 289,400 289,400 281,653 Sponsoredresearch andotherprograms 71,231 71,231 83,736 Academicsupport 98,759 98,759 85,833 Studentservices 47,223 47,223 44,906 Institutionalsupport 78,894 78,894 74,024 Auxiliaries 157,707 157,707 146,230
Totalexpenses 743,214 743,214 716,382
oTher ChangeS Unrealizedchangesinfairvalues: Investments 94,723 982 622 96,327 (135,384) Interestrateswapagreements, andforeigncurrencyforward contracts (21,547) (21,547) (25,843) Postretirementbenefitobligation changesotherthannetperiodiccost 3,534 3,534 (3,455)
Totalotherchanges 76,710 982 622 78,314 (164,682) Changeinnetassets 70,176 (6,129) 11,101 75,148 (270,722)Netassetsatbeginningofyear 1,000,636 63,959 316,028 1,380,623 1,651,345
neT aSSeTS aT end oF Year $ 1,070,812 $ 57,830 $ 327,129 $ 1,455,771 $ 1,380,623
See accompanying notes to financial statements.
1 6
statement of activities
Year ended June 30, 2009
Temporarily Permanently In Thousands of Dollars unrestricted restricted restricted Total
revenueS Tuitionandfees $ 577,007 $ 577,007
Less:financialaid 211,257 211,257 Nettuitionandfees 365,750 365,750
Contributions 47,098 $ 7,484 $ 16,216 70,798 Grantsandcontracts 96,991 96,991 Investmentreturn(loss) (103,326) 79 878 (102,369) Auxiliaries,lessfinancialaid of$6.0million 165,419 165,419 Other 13,753 13,753 Netassetsreleasedfromrestrictions 14,512 (14,512)
Totalrevenues 600,197 (6,949) 17,094 610,342
exPenSeS Instructionanddepartmentalresearch 281,653 281,653 Sponsoredresearchandotherprograms 83,736 83,736 Academicsupport 85,833 85,833 Studentservices 44,906 44,906 Institutionalsupport 74,024 74,024 Auxiliaries 146,230 146,230
Totalexpenses 716,382 716,382
oTher ChangeS Unrealizedchangesinfairvalues: Investments (121,110) (11,219) (3,055) (135,384) Interestrateswapagreements,and foreigncurrencyforwardcontracts (25,843) (25,843)
Postretirementbenefitobligationchanges otherthannetperiodiccost (3,455) (3,455)
Totalotherchanges (150,408) (11,219) (3,055) (164,682)
Changeinnetassets (266,593) (18,168) 14,039 (270,722)Netassetsatbeginningofyear 1,267,229 82,127 301,989 1,651,345
neT aSSeTS aT end oF Year $ 1,000,636 $ 63,959 $ 316,028 $ 1,380,623
See accompanying notes to financial statements.
17
statements of cash Flows
YearS ended June 30, 2010 and 2009 In Thousands of Dollars 2010 2009
CaSh FlowS From oPeraTing aCTiviTieS Changeinnetassets $ 75,148 $(270,722) Adjustmentstoreconcilechangeinnetassetsto netcashprovidedby(usedin)operatingactivities: Postretirementbenefitobligationchanges otherthannetperiodiccost (3,534) 3,455 Depreciationandamortization 56,389 46,136 Realizedandunrealizedchangesinfairvalues (90,138) 281,702 Giftsofpropertyandequipment (11,968) (23,614) Contributionsrestrictedforinvestmentandphysicalfacilities (17,306) (17,999) Netchangeinoperatingassetsandliabilities: Receivables 7,362 (5,854) Otherassets (619) 246 Accountspayableandaccruedliabilities 15,106 (13,922) Depositsanddeferredrevenues (2,625) (618) Assetretirementobligations (759) (985) Accruedpostretirementbenefitobligation 1,106 (1,265) Netcashprovidedby(usedin)operatingactivities 28,162 (3,440)
CaSh FlowS From inveSTing aCTiviTieS Cashheldascollateral (6,900) (8,300) Loanstostudents (3,145) (3,282) Repaymentofloansbystudents 3,199 2,884 Purchasesofinvestments (391,773) (536,125) Salesandmaturitiesofinvestments 421,845 613,395 Purchasesofland,landimprovements, buildings,equipment,andcollections (93,206) (85,902)
Netcash(usedin)investingactivities (69,980) (17,330)
CaSh FlowS From FinanCing aCTiviTieS Contributionsrestrictedforinvestmentandphysicalfacilities 17,306 17,999 Proceedsfromissuanceoflong-termdebt 111,170 80,000 Paymentofbankloan (80,000) Paymentoflong-termdebt (1,734) (709) Redemptionoflong-termdebt (75,525) Changeinbondissuancecosts (535) Changeinfundsheldbybondtrustee (3,875) 28,517 Changeinrefundablegovernmentstudentloanfunds 301 377
Netcashprovidedbyfinancingactivities 47,108 46,184
Netincreaseincashandcashequivalents 5,290 25,414
Cashandcashequivalentsatbeginningofyear 40,167 14,753
CaSh and CaSh equivalenTS aT end oF Year $ 45,457 $ 40,167
SuPPlemenTal diSCloSureS Interestpaid $ 14,789 $ 14,397
See accompanying notes to financial statements.

1 8
notes to Financial statements
(1)SummaryofSignificantaccountingPolicieS
(a) BasisofPresentation
The accompanying financial statements have been prepared using accrual accounting, and include the accounts of Syracuse university, Syracuse university (uSa) london Program, drumlins, inc., and Syracuse university hotel and conference center llc. effective June 30, 2010, the Syracuse university Press, inc. (the Press), a nonprofit membership company whose sole member was the university, was terminated and its assets and liabilities were assumed by the university. The principal operations of the Press, the publication and sale of academic and educational works to a diverse customer base, will continue as a department of the university. There is no effect on the university’s financial statements as the accounts of the Press previously had been included in the university’s financial statements.
(b) netassetclasses
The accompanying financial statements present information regarding the university’s financial position and activities according to three classes of net assets: unrestricted, temporarily restricted, and permanently restricted.
Unrestricted net assets are not subject to donor stipulations restricting their use, but may be designated for specific purposes by the university or may be limited by contractual agreements with outside parties.
Temporarily restricted net assets are subject to donor stipulations that expire by the passage of time or can be fulfilled by actions pursuant to the stipulations.
Permanently restricted net assets are subject to donor stipulations requiring that they be maintained permanently.
1 8

19
notes to Financial statements
(c) contributions
contributions, including unconditional pledges, are recognized as revenues when donors’ commitments are received. conditional pledges become unconditional and are recognized as revenues when the conditions are substantially met. unconditional pledges, net of an allowance for uncollectible amounts, are reported at their estimated net present values, and are classified as either permanently restricted or temporarily restricted. gifts whose restrictions are met in the same fiscal year as their receipt are reported as unrestricted contributions.
(d)cashandcashequivalents
investments acquired with a maturity date of three months or less are reported as cash equivalents, unless they are part of long-term investment funds.
(e) loanstoStudents
loans to students are reported net of an allowance for doubtful accounts of $1.0 million at June 30, 2010 and June 30, 2009.
(f) investments
investments are recorded at fair value, and the university believes the carrying amounts of these financial instruments are reasonable estimates of fair value. The values of publicly traded fixed income and equity securities are based on quoted market prices and exchange rates. nonmarketable securities include alternative investments in hedge funds and private equity funds, which are valued using current estimates of fair value in the absence of readily determinable public market values. Those valuations consider variables such as financial performance of investments, including comparisons of comparable companies’ earnings multiples, cash flow analyses, recent sales prices of investments, and other pertinent information. The estimates of fair values, because of the inherent uncertainty of valuations for these investments, may differ from the values that would have been used had ready markets existed.
(g)land,landimprovements,Buildings,equipment,andcollections
land, land improvements, buildings, equipment, and the library collection are stated at cost or fair value at date of donation, exclusive of the library’s special collection, which is recorded at the university’s estimate. The art collection is recorded at a capitalized appraised value adjusted for fair value accessions and deaccessions. depreciation is recognized using the straight-line method with useful lives of twenty or forty years for buildings, five years for equipment, ten years for library collections, excluding special collections, and one hundred years for art and library special collections. depreciation expense for buildings and land improvements is allocated to functional classifications based on square footage. depreciation expense for equipment is allocated to functional classifications based on the functional classifications of the departments in which equipment is located, and depreciation expense for collections is allocated to the academic support functional classification.
(h)fairValue
The carrying values of the university’s cash and cash equivalents, receivables, other assets, accounts payable and accrued liabilities, long-term debt, and deposits and deferred revenues approximated their fair values at June 30, 2010 and June 30, 2009.
(i) allocationofcertainexpenses
The statement of activities presents expenses by functional classification. operation and maintenance of plant is allocated based on square footage, and interest expense is allocated based on the functional purpose for which the debt proceeds were used.
2 0
notes to Financial statements
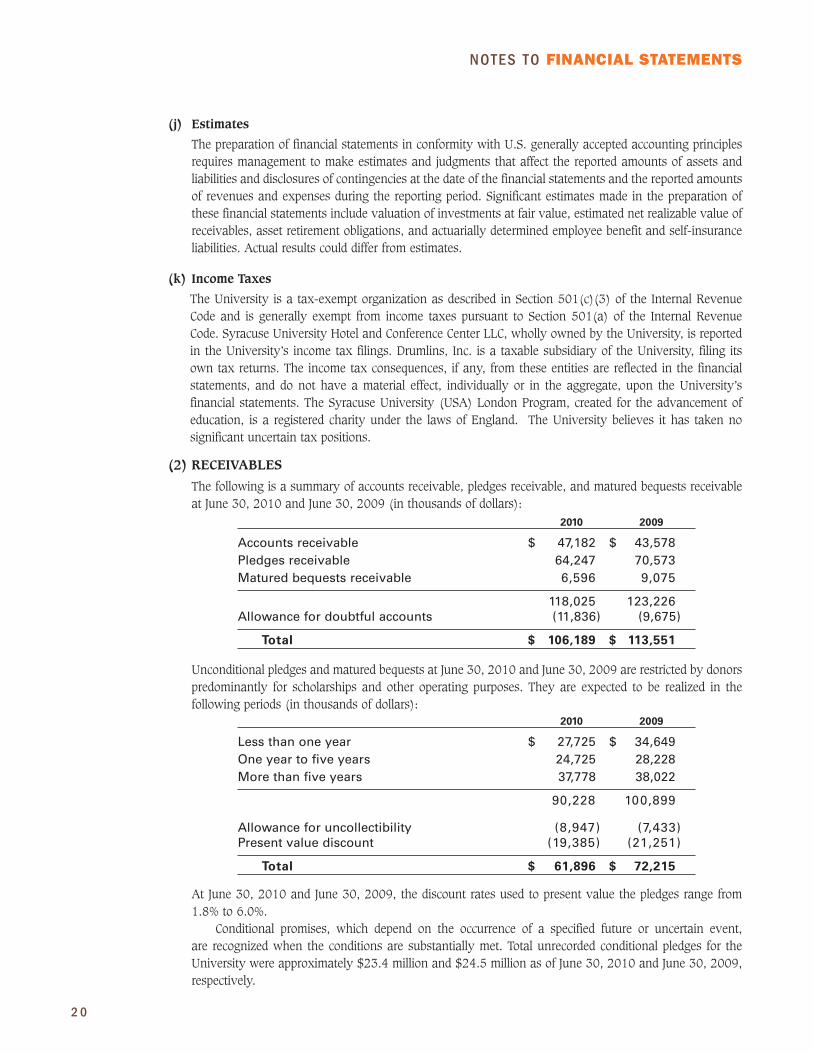
(j) estimates
The preparation of financial statements in conformity with u.S. generally accepted accounting principles requires management to make estimates and judgments that affect the reported amounts of assets and liabilities and disclosures of contingencies at the date of the financial statements and the reported amounts of revenues and expenses during the reporting period. Significant estimates made in the preparation of these financial statements include valuation of investments at fair value, estimated net realizable value of receivables, asset retirement obligations, and actuarially determined employee benefit and self-insurance liabilities. actual results could differ from estimates.
(k)incometaxes
The university is a tax-exempt organization as described in Section 501(c)(3) of the internal revenue code and is generally exempt from income taxes pursuant to Section 501(a) of the internal revenue code. Syracuse university hotel and conference center llc, wholly owned by the university, is reported in the university’s income tax filings. drumlins, inc. is a taxable subsidiary of the university, filing its own tax returns. The income tax consequences, if any, from these entities are reflected in the financial statements, and do not have a material effect, individually or in the aggregate, upon the university’s financial statements. The Syracuse university (uSa) london Program, created for the advancement of education, is a registered charity under the laws of england. The university believes it has taken no significant uncertain tax positions.
(2)receiVaBleS
The following is a summary of accounts receivable, pledges receivable, and matured bequests receivable at June 30, 2010 and June 30, 2009 (in thousands of dollars):
2010 2009
Accountsreceivable $ 47,182 $ 43,578Pledgesreceivable 64,247 70,573Maturedbequestsreceivable 6,596 9,075
118,025 123,226Allowancefordoubtfulaccounts (11,836) (9,675)
Total $ 106,189 $ 113,551
unconditional pledges and matured bequests at June 30, 2010 and June 30, 2009 are restricted by donors predominantly for scholarships and other operating purposes. They are expected to be realized in the following periods (in thousands of dollars):
2010 2009
Lessthanoneyear $ 27,725 $ 34,649Oneyeartofiveyears 24,725 28,228Morethanfiveyears 37,778 38,022
90,228 100,899
Allowanceforuncollectibility (8,947) (7,433)Presentvaluediscount (19,385) (21,251)
Total $ 61,896 $ 72,215
at June 30, 2010 and June 30, 2009, the discount rates used to present value the pledges range from 1.8% to 6.0%.
conditional promises, which depend on the occurrence of a specified future or uncertain event, are recognized when the conditions are substantially met. Total unrecorded conditional pledges for the university were approximately $23.4 million and $24.5 million as of June 30, 2010 and June 30, 2009, respectively.
21
notes to Financial statements
(3)inVeStmentSandfairValue
The investment objective of the university is to invest its assets in a prudent manner to achieve a long-term rate of return sufficient to fund a portion of its spending and to increase investment value after inflation. The university diversifies its investments among asset classes by incorporating several strategies and managers. major investment decisions are authorized by the university’s Trustees investment committee that oversees the university’s investments.
in addition to equity and fixed income investments, the university may also hold shares or units in institutional funds and alternative investment funds involving hedged and private equity strategies. hedged strategies involve funds whose managers have the authority to invest in various asset classes at their discretion, including the ability to invest long and short. funds with hedged strategies generally hold securities or other financial instruments for which a ready market exists, and may include stocks, bonds, put or call options, swaps, currency hedges and other instruments. Private equity funds generally employ buyout, venture capital, and debt related strategies and often require the estimation of fair values by the fund managers in the absence of readily determinable market values.
fair values for shares in mutual funds are based on share prices reported by the funds as of the last business day of the fiscal year. The university’s interests in alternative investment funds are generally reported at the net asset value (naV) reported by the fund managers. naV is used as a practical expedient to estimate the fair value of the university’s interest therein, unless it is probable that all or a portion of the investment will be sold for an amount different from naV. as of June 30, 2010 and June 30, 2009, the university had no specific plans or intentions to sell investments at amounts different than naV.
The three levels of the fair value heirarchy are:
Level 1 - inputs are quoted prices in active markets for identical assets or liabilities that the university has the ability to access at measurement date.
Level 2 - inputs are other than quoted prices included in level 1 that are either directly or indirectly observable for the assets or liabilities.
Level 3 - inputs derived from valuation methodologies, including pricing models, discounted cash flow models and similar techniques, and are not based on market, exchange, dealer, or broker-traded transactions. in addition, level 3 valuations incorporate assumptions and projections that are not observable in the market, and significant professional judgment in determining the fair value assigned to such assets or liabilities.
21
2 2
notes to Financial statements
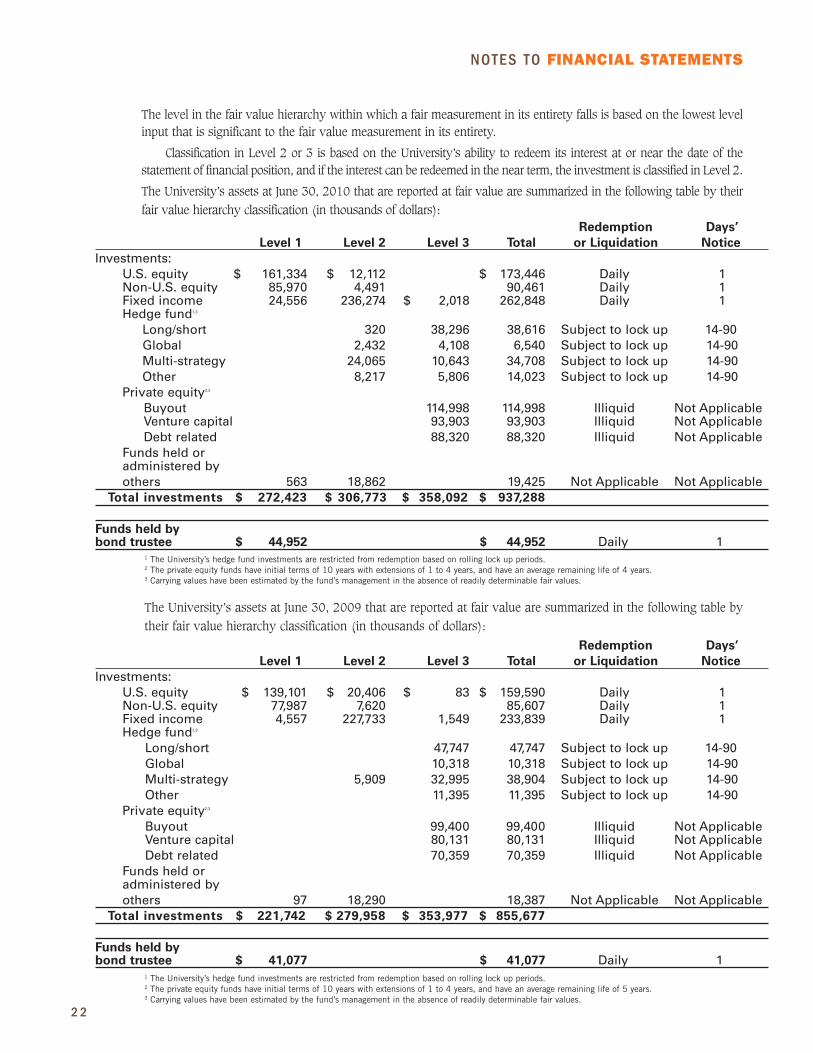
The level in the fair value hierarchy within which a fair measurement in its entirety falls is based on the lowest level input that is significant to the fair value measurement in its entirety.
classification in level 2 or 3 is based on the university’s ability to redeem its interest at or near the date of the statement of financial position, and if the interest can be redeemed in the near term, the investment is classified in level 2.
The university’s assets at June 30, 2010 that are reported at fair value are summarized in the following table by their fair value hierarchy classification (in thousands of dollars):
redemption days’ level 1 level 2 level 3 Total or liquidation notice
Investments: U.S.equity $ 139,101 $ 20,406 $ 83 $ 159,590 Daily 1 Non-U.S.equity 77,987 7,620 85,607 Daily 1 Fixedincome 4,557 227,733 1,549 233,839 Daily 1 Hedgefund1,3
Long/short 47,747 47,747 Subjecttolockup 14-90 Global 10,318 10,318 Subjecttolockup 14-90 Multi-strategy 5,909 32,995 38,904 Subjecttolockup 14-90 Other 11,395 11,395 Subjecttolockup 14-90 Privateequity2,3 Buyout 99,400 99,400 Illiquid NotApplicable Venturecapital 80,131 80,131 Illiquid NotApplicable Debtrelated 70,359 70,359 Illiquid NotApplicable Fundsheldor administeredby others 97 18,290 18,387 NotApplicable NotApplicable Total investments $ 221,742 $ 279,958 $ 353,977 $ 855,677 Funds held by bond trustee $ 41,077 $ 41,077 Daily 1
The university’s assets at June 30, 2009 that are reported at fair value are summarized in the following table by their fair value hierarchy classification (in thousands of dollars):
redemption days’ level 1 level 2 level 3 Total or liquidation notice
Investments: U.S.equity $ 161,334 $ 12,112 $ 173,446 Daily 1 Non-U.S.equity 85,970 4,491 90,461 Daily 1 Fixedincome 24,556 236,274 $ 2,018 262,848 Daily 1 Hedgefund1,3
Long/short 320 38,296 38,616 Subjecttolockup 14-90 Global 2,432 4,108 6,540 Subjecttolockup 14-90 Multi-strategy 24,065 10,643 34,708 Subjecttolockup 14-90 Other 8,217 5,806 14,023 Subjecttolockup 14-90 Privateequity2,3 Buyout 114,998 114,998 Illiquid NotApplicable Venturecapital 93,903 93,903 Illiquid NotApplicable Debtrelated 88,320 88,320 Illiquid NotApplicable Fundsheldor administeredby others 563 18,862 19,425 NotApplicable NotApplicable Total investments $ 272,423 $ 306,773 $ 358,092 $ 937,288 Funds held by bond trustee $ 44,952 $ 44,952 Daily 1
1 The University’s hedge fund investments are restricted from redemption based on rolling lock up periods.2 The private equity funds have initial terms of 10 years with extensions of 1 to 4 years, and have an average remaining life of 4 years.3 Carrying values have been estimated by the fund’s management in the absence of readily determinable fair values.
1 The University’s hedge fund investments are restricted from redemption based on rolling lock up periods.2 The private equity funds have initial terms of 10 years with extensions of 1 to 4 years, and have an average remaining life of 5 years.3 Carrying values have been estimated by the fund’s management in the absence of readily determinable fair values.

23
notes to Financial statements
The following tables present the university’s activity for the fiscal years ended June 30, 2010 and June 30, 2009 for investments measured at fair value on a recurring basis using unobservable inputs (level 3) ( in thousands of dollars): Fixed income Private and u.S. equity hedge Fund equity Total FairvalueatJune30,2009 $ 249,890 $ 102,455 $ 1,632 $ 353,977Transfers (29,376) (29,376)Acquisitions 18,682 22,878 253 41,813Dispositions (21,434) (47,374) (253) (69,061)Investmentreturn(loss) 6,042 (10,382) 3 (4,337)Unrealizedgains 44,041 20,652 383 65,076
Fair value at June 30, 2010 $ 297,221 $ 58,853 $ 2,018 $ 358,092
Fixed income Private and u.S. equity hedge Fund equity Total FairvalueatJune30,2008 $ 278,694 $ 112,385 $ 1,800 $ 392,879Transfers (115) (115)Acquisitions 51,732 27,932 4 79,668Dispositions (29,497) (10,730) (170) (40,397)Investmentreturn(loss) 1,695 (2,817) 59 (1,063)Unrealized(losses)gains (52,734) (24,315) 54 (76,995)
Fair value at June 30, 2009 $ 249,890 $ 102,455 $ 1,632 $ 353,977
1 The University’s hedge fund investments are restricted from redemption based on rolling lock up periods.2 The private equity funds have initial terms of 10 years with extensions of 1 to 4 years, and have an average remaining life of 4 years.3 Carrying values have been estimated by the fund’s management in the absence of readily determinable fair values.

2 4
notes to Financial statements
The unrealized gains and (losses) noted above related to investments held as of June 30, 2010 and June 30, 2009 were $56.2 million and ($76.6) million, respectively.
at June 30, 2010, the university’s outstanding commitments to private equity partnerships totaled $147.3 million. The projected capital call amounts for the next five fiscal years and thereafter are summarized in the table below (in thousands of dollars):
Fiscal Year amount
2011 $ 37,7712012 33,6892013 28,2892014 22,4572015 15,584Thereafter 9,467 Total $ 147,257
The expirations of hedge funds redemption lock up periods are summarized in the table below (in thousands of dollars):
Fiscal Year amount
2011 $ 22,1832012 6,521 Total $ 28,704
investment return (loss) on the university’s investments are detailed in the table below (in thousands of dollars): 2010 Temporarily Permanently unrestricted restricted restricted Total
Investmentincome $ 14,684 $ 14,684Realizedgains 13,746 $ 78 $ 1,534 15,358 Total $ 28,430 $ 78 $ 1,534 $ 30,042
2009 Temporarily Permanently unrestricted restricted restricted Total
Investmentincome $ 18,107 $ 18,107Realized(losses)gains (121,433) $ 79 $ 878 (120,476) Total $ (103,326) $ 79 $ 878 $ (102,369)
netted in investment income are investment management fees of $3.3 million and $4.2 million in fiscal years 2010 and 2009, respectively.
(4)endowmentfundS
The university’s endowment consists of 1,880 individual funds established for a variety of purposes, including both donor restricted endowment funds and funds designated by the university to function as endowments (quasi endowment). at June 30, 2010, the fair values of 415 endowment accounts were less than their original fair value of $124.6 million (“underwater”) by a total of approximately $24.2 million.
The university employs an asset allocation spending model having a seven-year investment horizon, and it manages its long term investments in accordance with the total return concept and the goal of

25
notes to Financial statements
maximizing long term return within acceptable levels of risk. The university’s spending policy is designed to provide a stable level of financial support and to preserve the real value of its endowment. The university compares the performance of its investments against several benchmarks, including its asset allocation spending model policy index.
The university’s Trustee investment and endowment committee approves the annual distribution per unit. The distribution per unit is calculated by multiplying the average of the monthly unit market values during the previous three fiscal years by the percentage approved by the committee each year. The percentages approved for fiscal years 2010 and 2009 were 3.84% and 4.40%, respectively. for fiscal years 2010 and 2009, the distributions per unit were $19.00 and $23.21, respectively. in addition to annual distributions, other distributions of $19.2 million and $27.6 million were made in fiscal years 2010 and 2009, respectively.
The university has interpreted the uniform management of institutional funds act and new york State Trust laws as requiring the preservation of the original gift of the donor restricted endowment fund absent explicit donor stipulations to the contrary. as a result of this interpretation, the university classifies as permanently restricted net assets (a) the original values of gifts donated to permanent endowments, (b) the original values of subsequent gifts to permanent endowments, and (c) accumulations to permanent endowments made in accordance with the directions of the applicable donors’ gift instruments at the times the accumulations are added to the funds.
on July 1, 2010, the new york State assembly and Senate passed uniform Prudent management of institutional funds act of 2006 (uPmifa) legislation, and the bill is awaiting action by the governor.
net assets associated with endowment funds are classified and reported based on the existence or absence of donor imposed restrictions. donor restricted amounts reported below include term endowments reported as temporarily restricted net assets, and appreciation, net of the underwater amount of endowment funds, reported as unrestricted net assets.

2 6
notes to Financial statements
at June 30, 2010 and June 30, 2009, net assets associated with endowment funds consisted of the following (in thousands of dollars):
2010
Temporarily Permanently unrestricted restricted restricted TotalDonorrestricted $ 65,596 $ 6,512 $ 282,026 $ 354,134Quasi(Boarddesignated) 263,084 263,084 Total $ 328,680 $ 6,512 $ 282,026 $ 617,218
2009
Temporarily Permanently unrestricted restricted restricted TotalDonorrestricted $ 37,801 $ 5,594 $ 269,632 $ 313,027Quasi(Boarddesignated) 243,876 243,876 Total $ 281,677 $ 5,594 $ 269,632 $ 556,903
changes in net assets associated with endowment funds for the fiscal years ended June 30, 2010 and June 30, 2009 were (in thousands of dollars):
2010
Temporarily Permanently unrestricted restricted restricted TotalNetassetsJune30,2009 $ 281,677 $ 5,594 $ 269,632 $ 556,903 Investmentreturn(loss),net 19,444 (3) 19,441 Unrealizedgains 83,006 982 83,988 Contributions 2 6 10,881 10,889 Distributions (55,460) 2 1,450 (54,008) Transfers 11 (72) 66 5net assets June 30, 2010 $ 328,680 $ 6,512 $ 282,026 $ 617,218
2009
Temporarily Permanently unrestricted restricted restricted TotalNetassetsJune30,2008 $ 574,724 $ 16,826 $ 256,840 $ 848,390 Investmentloss,net (114,756) (72) (114,828) Unrealizedlosses (116,303) (11,219) (127,522) Contributions 143 6 12,181 12,330 Distributions (62,620) 845 (61,775) Transfers 489 (19) (162) 308net assets June 30, 2009 $ 281,677 $ 5,594 $ 269,632 $ 556,903

27
notes to Financial statements
(5)land,landimProVementS,BuildingS,equiPment,andcollectionS
The following is a summary of land, land improvements, buildings, equipment, and collections at June 30, 2010 and June 30, 2009 (in thousands of dollars):
2010 2009
Landandlandimprovements $ 65,131 $ 63,391Buildingsandbuildingequipment 1,256,792 1,170,567Equipment 77,905 74,462Libraryandartcollections 196,722 196,166 1,596,550 1,504,586
Accumulateddepreciation (699,864) (654,234) Total $ 896,686 $ 850,352
The university has asset retirement obligations arising from regulatory requirements to perform certain asset retirement activities at the time of disposal of certain capital assets. The liability was initially recorded at fair value, and is adjusted for accretion expense and changes in the amount or timing of cash flows. The corresponding asset retirement costs are capitalized as part of the carrying values of the related long-lived assets and depreciated over the useful lives of the assets.
(6)long‑termdeBt
long-term debt outstanding at June 30, 2010 and June 30, 2009 is set forth below (in thousands of dollars):
Fiscal year of maturity 2010 2009
CityofSyracuseIndustrialDevelopmentAgency— CivicFacilityVariableRateRevenueBonds: Series1999Aand1999B(a)(d) 2030 $ 44,475 $ 120,000 Series2005Aand2005B(b) 2036 80,000 80,000 Series2008A-1and2008A-2(c) 2038 69,625 70,000OnondagaCountyIndustrialDevelopmentAgency— CivicFacilityVariableRateRevenueBonds: Series2008B(c) 2038 34,350 35,000OnondageCountyTrustforCulturalResources— RevenueBonds: Series2010A(d) 2030 75,525 Series2010B(e) Various 31,830BankLoan—SyracuseUniversityHotel andConferenceCenterLLC(f) 2022 11,330 11,990Other(g) 2010 49 347,135 317,039
OnondagaCountyTrustforCulturalResources— RevenueBonds: Series2010BUnamortizedPremium(e) Various 3,815 Total $ 350,950 $ 317, 039

2 8
notes to Financial statements
aggregate principal payments of long-term debt are summarized in the table below (in thousands of dollars):
Fiscal Year amount
2011 $ 1,8552012 1,9052013 1,9602014 2,0152015 2,070Thereafter 337,330
Total $ 347,135
for fiscal years 2010 and 2009, capitalized interest was $4.7 million.
(a) Periodic Auction Reset Securities (PARS) bondsthathavetheirinterestratessetatweeklyauctions.The interest ratesatJune30,2010andJune30,2009 were 0.34% and 0.20%, respectively, forSeries1999A,and0.22%and0.27%,respectively,for Series 1999B.The University makes weeklypayments of the interest to the bondholdersthrough the trustee.The University may makeprepaymentsofprincipal,andisrequiredtopayanyremainingprincipalbalanceonDecember1,2029,thematuritydateofthebonds.
(b) As of June 30, 2010, the bonds were variableratedemandbondsthathavetheirinterestratesset weekly. Until March 2009, the bonds werePARS bonds that had their interest rates set atweekly auctions. In March 2008, the Universityrepurchased the PARS bonds, and it continuedto make weekly payments of interest to thetrustee, who paid the interest to the Universityas the holder of the bonds. In March 2009, thebonds were converted to variable rate demandbonds and were reissued.The interest rates atJune30,2010andJune30,2009were0.19%and0.20%, respectively, for both Series 2005A andSeries 2005B. The University currently makesmonthlypaymentsofinteresttothebondholdersthrough the trustee.The University may makeprepaymentsofprincipal,andisrequiredtopayanyremainingprincipalbalanceonDecember1,2035,thematuritydateofthebonds.
(c) Variable rate demand bonds that have theirinterestratessetdailyandweeklyforSeries2008AandSeries2008B,respectively.TheinterestratesatJune30,2010andJune30,2009were0.13%and 0.28%, respectively, for Series 2008A, and0.19%and0.20%,respectively,forSeries2008B.The University makes monthly payments ofinteresttothebondholdersthroughthetrustee.BeginningJuly1,2009,theUniversityissubjecttoannualmandatorysinkingfundredemptions.Inaddition,theUniversityhastheabilitytomakeprepayments of principal, and is required topay any remaining principal balance on Series2008A-1 and Series 2008B on July 1, 2037 andon December 1, 2037 for Series 2008A-2, the
maturitydatesofthebonds.
(d) Variableratedemandbondsthathavetheirinterestrates set weekly. The interest rate at June 30,2010 was 0.20%. The University makes monthlypayments of interest to the bondholders throughthetrustee.TheUniversitymaymakeprepaymentsofprincipal,andisrequiredtopayanyremainingprincipal balance on December 31, 2029, thematuritydateofthebonds.Theproceedsfromthisbondissuewereusedtoredeemaportionof theSeries 1999A and Series 1999B bonds in January2010.
(e) Fixedratedemandbondsthathavetheirinterestrates specified in the bond offering documentranging from 3.0% to 5.0% depending on theunderlyingprincipalmaturitydate. Thesebondswereissuedatapremiumthatisbeingamortizedusing the effective interest method over theremaining life of each of the series of bondsresultinginaneffectiveyieldrangingfrom0.75%to 3.48%. The University makes semi-annualpaymentsofinteresttothebondholdersthroughthe trustee. Beginning December 1, 2010, theUniversityissubjecttoannualmandatorysinkingfund redemptions. The University may makeprepaymentsofprincipal,andisrequiredtopayanyremainingprincipalbalanceonDecember1,2019,thematuritydateofthebonds.
(f) Loan agreement with JPMorgan Chase Bank,N.A., which is guaranteed by the University. Itbears interest at a rate per annum equal to theadjusted LIBOR rate for the applicable interestperiodplus0.40%atJune30,2010andJune30,2009.TheapplicableLIBORmarginperannumisadjusted based on the Moody’s rating assignedto the financial strengthof theUniversityat theonsetofeachinterestperiod.AtJune30,2010andJune30,2009,theinterestrateswere0.76%and0.78%,respectively.ThematuritydateoftheloanisAugust5,2021.
(g) Interest-free loan issued by the New YorkState Power Authority for University energyconservationprojects.
29
notes to Financial statements
(7)intereStrateSwaPagreementSandforeigncurrencyforwardcontractS
The university and the Syracuse university hotel and conference center llc have entered into interest rate swap agreements with two counterparties as a hedge against interest rate fluctuations for variable interest rate debt. as of June 30, 2010 and June 30, 2009 there were requirements to collateralize the obligations under the swap agreements in the amounts of $15.2 million and $8.3 million, respectively. The university received variable payments equal to 68% of the one-month libor rate from two counterparties for six swap agreements. The Syracuse university hotel and conference center llc received variable payments equal to the one-month libor rate plus 0.55% from one counterparty for one swap agreement.
as of June 30, 2010, the university paid two counterparties a weighted average fixed interest rate of 3.690% on a total notional amount of $304.0 million, which related to its variable interest rate revenue bonds. as of June 30, 2009, the university paid two counterparties a weighted average fixed interest rate of 3.691% on a total notional amount of $305.0 million, which related to its variable interest rate revenue bonds. The Syracuse university hotel and conference center llc paid one counterparty a fixed interest rate of 5.303% on notional amounts of $11.3 million and $11.9 million as of June 30, 2010 and June 30, 2009, respectively, that related to its loan with JPmorgan chase bank, n.a..
at June 30, 2010 and June 30, 2009, the fair values of the university’s swap agreements were ($58.4) million and ($41.5) million, respectively, and the Syracuse university hotel and conference center llc swap agreement fair values were ($1.6) million and ($1.0) million, respectively. The swap agreements are classified as level 2 in the fair value hierarchy.
The decreases of $17.5 million and $27.1 million in the fair values of the interest rate swap agreements were included in the unrealized changes in fair values of interest rate swap agreements and foreign currency forward contracts for the years ended June 30, 2010 and June 30, 2009, respectively. The net cash payments of $10.7 million and $8.7 million made under the interest rate swap agreements were included in interest expense during fiscal years 2010 and 2009, respectively.
at June 30, 2010 and June 30, 2009, the university had commitments for foreign currency forward contracts of approximately $49.9 million and $51.6 million, respectively, to hedge foreign exchange rate exposure for its programs abroad. fair values of foreign currency forward contract commitments of ($2.3) million and $1.7 million, respectively, were included in accounts payable and accrued liabilities and other assets, respectively. The foreign currency forward contracts are classified as level 2 in the fair value hierarchy. for the years ended June 30, 2010 and June 30, 2009 the decrease of $4.0 million and the increase of $1.2 million, respectively, in fair values of foreign currency forward contract commitments were included in the unrealized changes in fair values of interest rate swap agreements and foreign currency forward contracts.
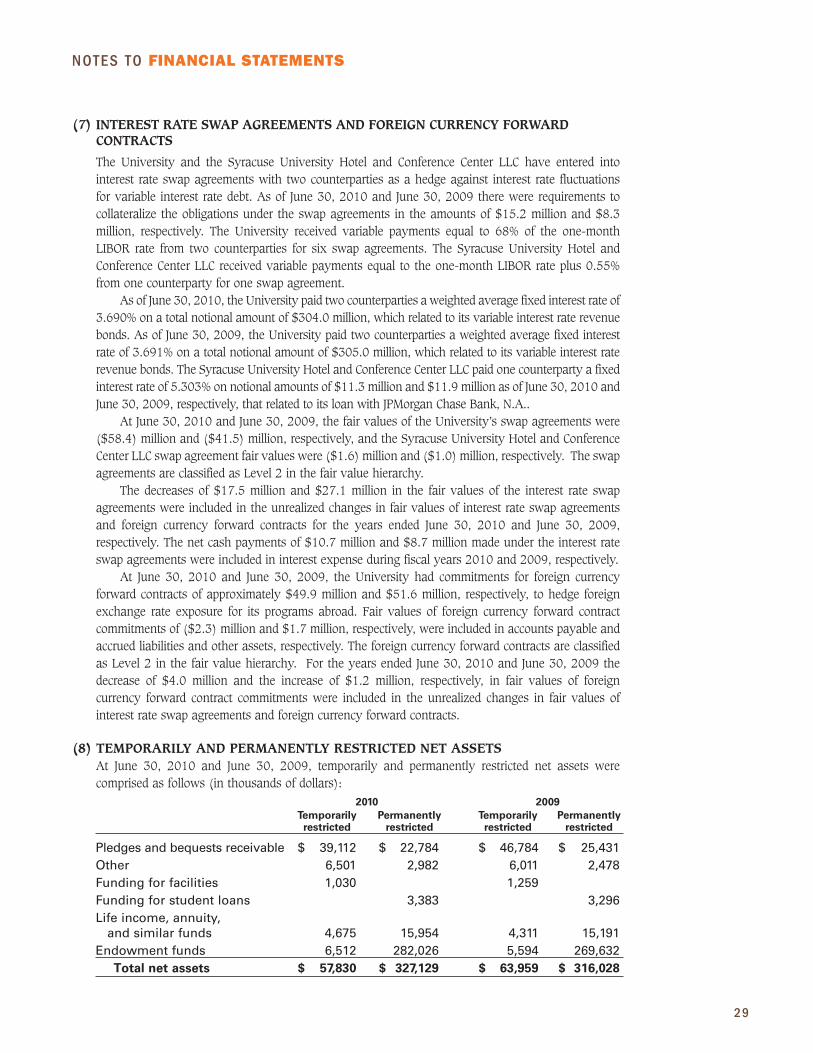
(8)temPorarilyandPermanentlyreStrictednetaSSetSat June 30, 2010 and June 30, 2009, temporarily and permanently restricted net assets were comprised as follows (in thousands of dollars): 2010 2009 Temporarily Permanently Temporarily Permanently restricted restricted restricted restricted
Pledgesandbequestsreceivable $ 39,112 $ 22,784 $ 46,784 $ 25,431Other 6,501 2,982 6,011 2,478Fundingforfacilities 1,030 1,259 Fundingforstudentloans 3,383 3,296Lifeincome,annuity,andsimilarfunds 4,675 15,954 4,311 15,191Endowmentfunds 6,512 282,026 5,594 269,632 Total net assets $ 57,830 $ 327,129 $ 63,959 $ 316,028
3 0
notes to Financial statements
(9)retirementPlanS
certain full-time and regular part-time employees of the university are eligible for the university’s defined contribution plan. The amounts contributed by the university to the Teachers insurance and annuity association and college retirement equities fund in fiscal years 2010 and 2009 were approximately $29.1 million and $28.3 million, respectively.
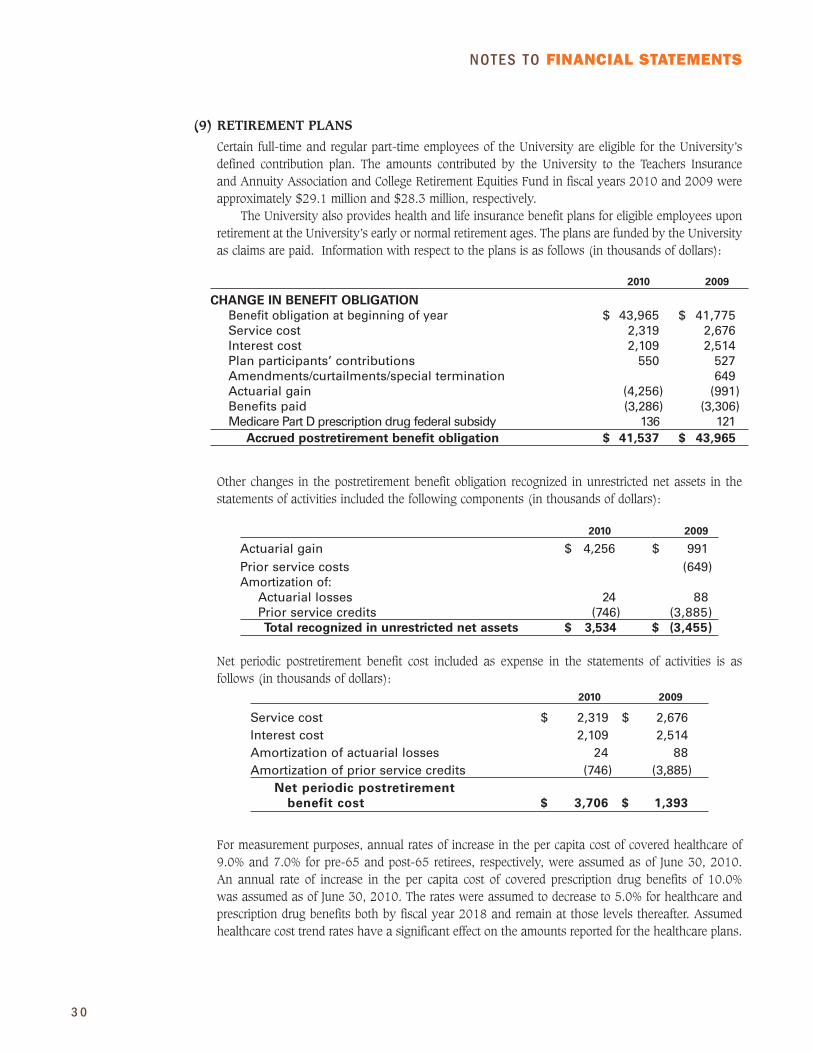
The university also provides health and life insurance benefit plans for eligible employees upon retirement at the university’s early or normal retirement ages. The plans are funded by the university as claims are paid. information with respect to the plans is as follows (in thousands of dollars):
2010 2009
Change in beneFiT obligaTion Benefitobligationatbeginningofyear $ 43,965 $ 41,775 Servicecost 2,319 2,676 Interestcost 2,109 2,514 Planparticipants’contributions 550 527 Amendments/curtailments/specialtermination 649 Actuarialgain (4,256) (991) Benefitspaid (3,286) (3,306) MedicarePartDprescriptiondrugfederalsubsidy 136 121 accrued postretirement benefit obligation $ 41,537 $ 43,965
other changes in the postretirement benefit obligation recognized in unrestricted net assets in the statements of activities included the following components (in thousands of dollars):
2010 2009
Actuarialgain $ 4,256 $ 991Priorservicecosts (649)Amortizationof: Actuariallosses 24 88 Priorservicecredits (746) (3,885) Total recognized in unrestricted net assets $ 3,534 $ (3,455)
net periodic postretirement benefit cost included as expense in the statements of activities is as follows (in thousands of dollars):
2010 2009
Servicecost $ 2,319 $ 2,676Interestcost 2,109 2,514Amortizationofactuariallosses 24 88Amortizationofpriorservicecredits (746) (3,885) net periodic postretirement benefit cost $ 3,706 $ 1,393
for measurement purposes, annual rates of increase in the per capita cost of covered healthcare of 9.0% and 7.0% for pre-65 and post-65 retirees, respectively, were assumed as of June 30, 2010. an annual rate of increase in the per capita cost of covered prescription drug benefits of 10.0% was assumed as of June 30, 2010. The rates were assumed to decrease to 5.0% for healthcare and prescription drug benefits both by fiscal year 2018 and remain at those levels thereafter. assumed healthcare cost trend rates have a significant effect on the amounts reported for the healthcare plans.

31
notes to Financial statements
it is estimated, based on actuarial calculations, that a one percentage point change in the healthcare trend rate would have the following effects (in thousands of dollars):
1-percentage 1-percentage point point increase (decrease)
Effectontotalofserviceandinterest costcomponents $ 472 $ (450)Effectonpostretirementbenefitobligation $ 4,522 $ (3,859)
as of June 30, 2010 and June 30, 2009, the discount rates used in determining the benefit obligations were 5.45% and 6.26%, respectively, and the discount rates used in determining the net periodic postretirement benefit costs were 6.26% and 6.80%, respectively.
contributions to the postretirement benefit plans, net of employee contributions and the medicare subsidy, were $2.6 million in fiscal year 2010 and are estimated to be $2.6 million for fiscal year 2011.
The net benefits expected to be paid in each fiscal year from 2011 through 2020 range from approximately $2.6 million to $3.2 million and the net aggregate expected payments total approximately $29.0 million. The expected benefits are based on the assumptions used to measure the university’s benefit obligation at June 30, 2010, and include estimated future employee service.
in addition to service and interest costs, the components of projected net periodic postretirement benefit cost for fiscal year 2011 are amortization of prior service credit of approximately $0.7 million and amortization of actuarial losses of less than $0.1 million.
(10)contingencieS,commitmentSandSuBSequenteVentSThe university is involved in legal actions arising in the normal course of activities and is subject to periodic audits and inquiries by regulatory agencies. although the ultimate outcome of such matters is not determinable at this time, management, after taking into consideration advice of legal counsel, believes that the resolutions of pending matters will not have a materially adverse effect, individually or in the aggregate, upon the university’s financial statements.
The university has a guaranteed mortgage Program, which facilitates home ownership by university faculty and staff in neighborhoods immediately east and south of the main campus and in a section of downtown Syracuse. The university will guarantee a mortgage loan to qualified faculty or staff in the amount of the purchase price for the home until such time as the loan to value ratio falls below 75%, using the value of the home at the time the loan is closed. mortgages guaranteed by the university at June 30, 2010 and June 30, 2009 had aggregate principal amounts of approximately $7.6 million and $6.8 million, respectively. no lending institution has sought payment from the university on any mortgage guaranteed by the university. however, if the university were to pay on a guaranty, the university would receive an assignment of the note and mortgage.
The Syracuse university (uSa) london Program leases a building in london, england. The lease commenced in fiscal year 2006 and has a term of 20 years. The current annual rent is approximately $1.3 million, and is subject to change at specific times during the lease term. The london Program holds options to extend the lease term for two five-year periods.
The university had letters of credit aggregating $272.5 million and $197.2 million at June 30, 2010 and June 30, 2009, respectively, related to its variable interest rate long-term debt and to potential claims under the university’s workers’ compensation plan. There were no outstanding amounts against the letters of credit.
The university evaluated subsequent events for potential recognition or disclosure through July 29, 2010, the date on which the financial statements were issued.

3 2
BoARd MeMBeRSJohn H. Chapple, ’75, Chair Joanne F. Alper, ’72, Vice ChairMartin N. Bandier, ’62Steven Barnes, ’82Lawrence d. Bashe, ’66, ’68Michael M. Bill, ’58Lee N. Blatt, ’51James V. Breuer, ’72John e. BreyerNancy CantorAngel Collado-Schwarz, ’74John A. Couri, ’63, Hon. ’08 Chair emeritusdaniel A. d’Aniello, ’68Robert e. dineen Jr., ’66Michael A. dritz, ’59 david B. Falk, ’72Winston C. Fisher, ’96Stuart Frankel, ’61Alan GerryLola A. Goldring, ’51Kenneth e. Goodman, ’70Melanie Gray, ’81, Vice ChairRichard L. Haydon, ’66Joshua H. Heintz, ’69Jerrold A. Heller, ’63Joyce Hergenhan, ’63George P. Hicker, ’68Jonathan J. Holtz, ’78Peter A. Horvitz, ’76Sharon H. Jacquet, ’72Bernard R. Kossar, ’53, ’55James d. Kuhn, ’70, ’72Robert R. Light, ’78Arthur Liu, ’66L. Ross Love, ’68donald T. MacNaughton, ’68Arielle Tepper Madover ’94Theodore A. McKee, ’75
donovan J. McNabb, ’98daniel N. Mezzalingua, ’60James R. Miller, ’63Jack W. Milton, ’51Robert J. Miron, ’59James A. Monk, ’80Judith C. Mower, ’66, ’73, ’80, ’84Alexander G. Nason, ’81Joan A. Nicholson, ’71, ’89, ’99Louise B. Palitz, ’44deryck A. Palmer, ’78, Vice Chairdoris L. Payson, ’57Howard G. Phanstiel, ’70, ’71H. John Riley Jr., ’61eric RothfeldJudith G. Seinfeld, ’56Ann Stevenson, ’52Robert P. Taishoff, ’86Richard L. Thompson, ’67, Vice ChairMichael G. Thonis, ’72diane Weathers, ’71Thomas C. Wilmot Sr., ’70Michael d. Wohl, ’72, ’75Abdallah H. Yabroudi, ’78, ’79Samuel J. Zamarripa, ’78
eMeRITuS TRuSTeeS Robert F. AllenWilliam F. Allyn, ’59George H. Babikian, ’53Steven W. Ballentine, ’83H. douglas Barclay, ’61, Hon. ’98J. Patrick BarrettCharles W. Beach, ’58, ’68Walter d. Broadnax, ’75William J. Brodsky, ’65, ’68Wendy H. Cohen, ’70, Hon. ’02 Robert J. CongelW. Carroll Coyne, ’54, ’57Gerald B. Cramer, ’52
Renee Crown, ’50, Hon. ’84douglas d. danforth, ’47Richard dulude, ’54Michael J. Falcone, ’57david M. Flaum, ’75daryl R. Forsythe, ’65, ’79Marshall M. Gelfand, ’50Samuel V. Goekjian, ’52Harry e. Goetzmann Jr., ’59GoH, Kun, Hon. ’01edward S. Green, ’47, ’60 Paul Greenberg, ’65Alfred M. Hallenbeck, ’52Gerald T. Halpin, ’50Richard S. Hayden, ’60G. William Hunter, ’65John L. Kreischer III, ’65Steve Kroft, ’67Joseph o. Lampe, ’53, ’55, Hon. ‘04Vernon L. Lee, ’54Marvin K. Lender, ’63Tarky J. Lombardi Jr., ’51, ’54, Hon. ’87Theodore e. Martin, ’61eric Mower, ’66, ’68 Susan C. Penny, ’70Julius L. PericolaRichard C. Pietrafesa, ’50edwin A. Potter, ’55Alvin I. Schragis, ’51William G. von Berg, ’40Robert e. WarrMorris S. Weeden, ’41Anthony Y.C. Yeh, ’49
HoNoRARY TRuSTeeSAlfred R. Goldstein, Hon. ’85Robert B. Menschel, ’51, Hon. ’91donald e. Newhouse, ’51dorothea Ilgen Shaffer, ’33, Hon. ’90Martin J. Whitman, ’49
2010-2011 board of TrusTees

