new blue sky region hr gap analysisblueskynet.ca/wp-content/uploads/2016/09/hrgapanalysis... ·...
TRANSCRIPT
Blue Sky Region
HR Gap Analysisof four industries
December 5, 2005
Prepared by:
26 Canterbury CrescentNorth Bay, ON Canada P1C 1K7
(705) 495-6814www.precisionfocus.com

Blue Sky – Labour Market Study: HR Gap Analysis © 2005 Precision Management Catalysts Ltd. All rights reserved. 1
Table of Contents
EXECUTIVE SUMMARY................................................................................................................................... 3METHODOLOGY............................................................................................................................................... 5
LITERATURE AND DATA REVIEW ......................................................................................................................... 5KEY INFORMANT INTERVIEWS ............................................................................................................................. 5STATISTICS CANADA DATA ................................................................................................................................. 5
Sampling Errors............................................................................................................................................. 5Random Rounding.......................................................................................................................................... 6
INTRODUCTION TO THE BLUE SKY REGION ............................................................................................ 6POPULATION..................................................................................................................................................... 7
THE BLUE SKY REGION ....................................................................................................................................... 7GLOBAL TREND .................................................................................................................................................. 8UNDERSTANDING POPULATION CHANGES ............................................................................................................ 8FACTORS THAT LEAD TO POPULATION GROWTH .................................................................................................. 9
Fertility ......................................................................................................................................................... 9Immigration................................................................................................................................................... 9
FACTORS THAT DECREASE POPULATION ............................................................................................................ 11Mortality...................................................................................................................................................... 11Emigration................................................................................................................................................... 11
POPULATION SUMMARY .................................................................................................................................... 13AGE AND GENDER.......................................................................................................................................... 14
CANADA'S RISING AGE ..................................................................................................................................... 14BLUE SKY AGING FASTER ................................................................................................................................. 14DEPENDENCY ................................................................................................................................................... 15GENDER DIFFERENCES: WOMEN LIVE LONGER THAN MEN................................................................................ 16GENDER IN THE WORKFORCE ............................................................................................................................ 16AGE AND GENDER SUMMARY............................................................................................................................ 16
ETHNICITY....................................................................................................................................................... 17BLUE SKY IDENTITY MORE FRENCH, MORE CANADIAN................................................................................... 17
Fewer Visible Minorities .............................................................................................................................. 17More Aboriginals......................................................................................................................................... 18
ETHNICITY SUMMARY ....................................................................................................................................... 18LANGUAGE ...................................................................................................................................................... 19
BILINGUALISM HIGH IN BLUE SKY..................................................................................................................... 19BENEFITS OF BILINGUALISM IN THE WORKFORCE............................................................................................... 20LANGUAGE SUMMARY ...................................................................................................................................... 20
EDUCATION ..................................................................................................................................................... 21BLUE SKY......................................................................................................................................................... 21HIGHER TRADES LEVEL THAN ONTARIO ............................................................................................................ 22POST-SECONDARY SPECIALIZATIONS ................................................................................................................. 22EDUCATIONAL ATTAINMENT GAP INCREASING .................................................................................................. 23BLUE SKY SCHOOL ENROLMENT RATES AVERAGE............................................................................................. 24FOCUS ON EDUCATION CHANGED ...................................................................................................................... 24YOUNG WOMEN MAKING EDUCATIONAL GAINS ................................................................................................ 25ABORIGINAL EDUCATION .................................................................................................................................. 25FRENCH-LANGUAGE EDUCATION ...................................................................................................................... 26EDUCATIONAL UPGRADING FOR ADULTS ........................................................................................................... 26EDUCATION SUMMARY ..................................................................................................................................... 26
EMPLOYMENT ................................................................................................................................................ 27EMPLOYMENT SUMMARY .................................................................................................................................. 28
SELF-EMPLOYMENT...................................................................................................................................... 29BLUE SKY......................................................................................................................................................... 29SELF-EMPLOYMENT SUMMARY.......................................................................................................................... 29

Blue Sky – Labour Market Study: HR Gap Analysis © 2005 Precision Management Catalysts Ltd. All rights reserved. 2
INCOMES .......................................................................................................................................................... 30INCREASING INCOME IN BLUE SKY .................................................................................................................... 30SIMILAR WAGES ............................................................................................................................................... 30GOVERNMENT PAYMENTS DECLINING ............................................................................................................... 31INCOME SUMMARY ........................................................................................................................................... 31
OCCUPATIONAL STRUCTURE..................................................................................................................... 32BLUE SKY......................................................................................................................................................... 32
Management Occupations ............................................................................................................................ 34Business, Finance and Administration Occupations...................................................................................... 34Natural and Applied Sciences, and Related Occupations............................................................................... 34Health-care Occupations.............................................................................................................................. 34Social Science, Education, Government Service, and Religion Occupations .................................................. 35Art, Culture, Recreation, and Sport Occupations .......................................................................................... 35Sales and Service Occupations ..................................................................................................................... 35Trades, Transport and Equipment Operators, and Related Occupations........................................................ 35Unique to Primary Industry Occupations...................................................................................................... 36Processing, Manufacturing, and Utilities Occupations.................................................................................. 36
OCCUPATIONAL STRUCTURE SUMMARY ............................................................................................................ 36DEMAND FOR LABOUR ................................................................................................................................. 37
OUTLOOK FOR FOUR BLUE SKY INDUSTRIES ...................................................................................................... 38Health Care .39Forestry....................................................................................................................................................... 40Mining......................................................................................................................................................... 41Information and Communications Technology.............................................................................................. 43
DEMAND SUMMARY.......................................................................................................................................... 44TRENDS............................................................................................................................................................. 45
NORTHERN ONTARIO ........................................................................................................................................ 45BLUE SKY......................................................................................................................................................... 45
FUTURE DIRECTIONS.................................................................................................................................... 46EMPLOYERS SUGGESTIONS .............................................................................................................................. 46
Health Care ................................................................................................................................................. 47Forestry....................................................................................................................................................... 47Mining......................................................................................................................................................... 48Information and Communications Technology.............................................................................................. 49
RECOMMENDATIONS ......................................................................................................................................... 49Continue to Enhance Local Educational Offerings........................................................................................ 49Promote Careers Earlier to Students ............................................................................................................ 50Influence the Influencers .............................................................................................................................. 50Promote Trades to Women ........................................................................................................................... 50Match Skill Sets with Businesses................................................................................................................... 50Attract Businesses Requiring Bilingual Skills................................................................................................ 50Attract Businesses Requiring Higher-Level Skills.......................................................................................... 51Create Migration Strategy............................................................................................................................ 51
CONCLUSION................................................................................................................................................... 51
EXHIBITS 1-10: OCCUPATIONAL PROFILES ..52BIBLIOGRAPHY .............................................................................................................................................. 70
Blue Sky – Labour Market Study: HR Gap Analysis © 2005 Precision Management Catalysts Ltd. All rights reserved. 3
Executive Summary
In terms of labour markets, the Blue Sky Region conveniently located around the TransCanada highway, Highway 11, and many lakes, most notably Lake Nipissing, is home to avariety of profit and not-for-profit employers, supported by a strong and viable workforce. Somedraws for employers and employees alike are the attractive land prices and a rich quality of lifethat includes trail-based, water-based, and outdoor-adventure activities, balanced with urbanamenities. Moreover, employers appreciate the area's location between major centres (withoutthe traffic jams that characterize Southern Ontario) that allows them to draw readily from labourpools in Nipissing, Sudbury, and Parry Sound.
A closer look at Blue Sky’s workforce reveals one that is very appealing to manyemployers. With many Francophone communities, a third of Blue Sky residents have a workingknowledge of both official languages. Moreover, low turnover and low absenteeism alsocharacterize the workforce, providing employers with lower recruitment and selection costs.
Like the rest of Ontario, Blue Sky's population is aging due to low fertility and increasedlife expectancy. Women outlive men and comprise almost half of the workforce. The contrastto provincial averages is that Blue Sky reflects Northern Ontario's trends of higher youth out-migration, fewer visible minorities, and a higher percentage of Aboriginals than Ontario.
Blue Sky’s labour force is strengthened with a strong post-secondary educationalinfrastructure. There are universities, colleges, and other training facilities in the region and inneighbouring Sudbury, and French-language and Aboriginal education is available at all levels.A large segment of Blue Sky’s workforce has trades certification, a rate outperforming Ontariosignificantly. There is also a strong contingent armed with college diplomas, and Blue Sky ratesof high-school completion and school enrolment for youth are similar to Ontario’s.
A highly detailed exhibit of types and numbers of workers in each occupation is providedat study’s end to provide employers with the size of the existing available labour pool for eachjob. Blue Sky surpasses Ontario in percentages of residents working in trades, transport,equipment operations, sales, service, primary industry, health care, social science, education,government service, and religion. In general, service-oriented jobs outnumber all others threeto one in Blue Sky. Construction and manufacturing jobs comprise about 17 percent of theworkforce, and primary industry jobs are about five percent.
Blue Sky workers earn wages in line with other Ontario communities. Blue Sky residentshave lower average household income than Ontario, due in large part to a higher reliance ongovernment transfer payments, particularly to seniors and Aboriginals. However, incomestretches further in Blue Sky with its significantly lower housing costs than Southern Ontario.
Blue Sky’s unemployment rate improved from 1996 to 2001. At 12.3 percent in 2001,Blue Sky’s unemployment rate is somewhat lower than for Northern Ontario; although,workforce participation rates are similar. In self-employment – a proven and growing job creator– Blue Sky outperforms Northern Ontario, and slightly exceeds Ontario.

Blue Sky – Labour Market Study: HR Gap Analysis © 2005 Precision Management Catalysts Ltd. All rights reserved. 4
Demand for labour is driven by industry performance. To that end, four sectors wereanalysed for this study, health care, forestry, mining, and information and communicationstechnology (ICT.) In the process, 112 Blue Sky employers, of varying sizes, were interviewed.In the four sectors, there is currently demand for many types of workers, with the greatestdemand centred on skilled trades, nurses, and senior IT workers. These skills gaps willcontinue to increase with projected growth in the ICT and mining sectors, and the addition of ahospital in 2009. Decline is expected in the forestry industry. After studying the labour marketand interviewing employers who identified labour gaps, we make the followingrecommendations:
n Continue enhancing educational offerings such as increased education for skilled trades;n Provide a better match between skill sets and available jobs (e.g., mail graduate packages
to local employers and create local job-matching web site);n Promote all careers earlier to students;n Promote trades to women;n Influence the influencers: promote careers with parents and teachers;n Attract businesses requiring bilingual skills and higher-level skills; andn Develop an immigration strategy targeting Ontario residents and external immigrants.
Overall, Blue Sky mirrors many labour market trends in Northern Ontario; however, thereare key differences. Blue Sky has a motivated workforce, evidenced by low absenteeism andlow employee-turnover; a high bilingualism rate; a commitment to self-employment; and ahealthy labour-pool exchange with communities outside the region. It is an ideal workforce –one that has made important gains in skills development. Moreover, Blue Sky provides a richquality of life free from the gridlock typical in Southern Ontario. Ultimately, Blue Sky can buildon these attributes to position the community for future growth.

Blue Sky – Labour Market Study: HR Gap Analysis © 2005 Precision Management Catalysts Ltd. All rights reserved. 5
Methodology
Literature and Data ReviewTo begin the process for the Blue Sky study, the Project Team engaged in a review,
the findings of which were used to construct profiles, analyse data, and examine trends.The main source of statistical data is Statistics Canada. Literature and data sources arefootnoted and listed in the Bibliography.
Key Informant InterviewsTo supplement the literature and data review, key informant interviews were
conducted. These interviews were used to confirm or dispute patterns and hypotheses thatflowed from the literature and data review. In addition, the interviews were used to providedata not available in the review and to identify impacts, future trends and emerging issues,and ways to close gaps in education and training. To cover the relevant issues and allowfor personal expression, the interview guide used open-ended questions.
Statistics Canada Data Using Statistics Canada data introduces both sampling errors and errors derived
from a random-rounding technique. For areas with smaller populations these errors may behigher than for large communities.
Sampling Errors Statistics Canada has two census forms; a short one, Form 1 that goes to 100
percent of residences, and Form 2B that goes to 20 percent of residences to obtain asample of total possible responses. As a sample, it may not accurately portray thewhole population. When sample responses differ from what responses would be fromthe entire population, this is called a sampling error. Generally, a larger number ofrespondents will decrease sampling error. The reverse is also true. As a general guideonly, the following table provides approximate measures of the standard error due tosampling. 1
Approximate Standard Error Due to SamplingSample Approximate % of
Standard Error50 or less 30.0% or more
100 20.0%200 15.0%500 9.0%
1,000 6.5%2,000 4.5%5,000 2.8%
10,000 2.0%20,000 1.4%50,000 0.9%
100,000 0.6%500,000 0.3%
1. Statistics Canada, 2001 Census Dictionary, Ottawa: Ministry of Industry, 2002, p. 295, 296.

Blue Sky – Labour Market Study: HR Gap Analysis © 2005 Precision Management Catalysts Ltd. All rights reserved. 6
Random RoundingAnother potential problem with using Statistics Canada census data is the use of
random rounding. In order to ensure confidentiality, Statistics Canada rounds censusdata up or down to the nearest five and in some cases 10. Totals are roundedindependently of cell data, so some differences may exist. Also, minor differences canbe expected in corresponding totals and cell values among various census tabulations.Similarly, percentages calculated on rounded figures do not necessarily add up to 100percent. This has an insignificant effect on large numbers. On very small numbers,however, this process can introduce a significant degree of error. While this does nothave a material effect on numbers for Northern Ontario, it does limit the confidenceabout smaller numbers for the Blue Sky Region. 2
Introduction to the Blue Sky RegionThe Blue Sky Region is an area of Northeastern Ontario centred on the City of North Bay. It iscomposed of all of the District of Nipissing with the exception of the census subdivisions knownas the Nipissing Unorganized South Part (Algonquin Park) and South Algonquin Township. Italso includes most of the District of Parry Sound with the exception of its southwestern part.Finally, Blue Sky includes three townships located in the District of Sudbury: French River, St.Charles, and Markstay-Warren. 3
Figure 1
2. Statistics Canada. "Confidentiality and Random Rounding," 2001 Census Dictionary, Ottawa: Ministry of Industry,2002, p. 296.3. For the District of Parry Sound, Blue Sky communities include Murrich/Monteith (3549012) TP, Perry (3549014)TP, Kearney (3549018) T, Armour (3549019) TP, Burk's Falls (3549022) VL, Ryerson (3549024) TP, Whitestone(3549039) TP, Magnetawan (3549043) TP, Strong (3549046) TP, Sundridge (3549048) VL, Joly (3549051) TP,Machar (3549054) TP, South River (3549056) VL, Powassan (3549060) T, North Himsworth (3549066) TP, Nipissing(3549071) TP, French River 13 (3549076) R, Dokis 9 (3549077) R, Parry Sound, Unorganized, North East Part(3549095) UNO.

Blue Sky – Labour Market Study: HR Gap Analysis © 2005 Precision Management Catalysts Ltd. All rights reserved. 7
Population
The Blue Sky RegionUntil 1966, Northern Ontario's population growth rates
accelerated rapidly as jobs in the resource sector attractedmany new residents. That changed in the following 35 yearsas the population growth became modest in some years andstable in others. More recently, in the past ten years,Northern Ontario’s population has been declining. In theclimate that witnessed material depopulation across NorthernOntario communities, Blue Sky’s population declined by 2.1%between 1996 and 2001 from 112,511 in 1996 to 110,162 in2001. Of Northern Ontario cities, North Bay’s population faredbest by dropping only 2.9 percent from 1996 to 2001. Othersdid not fare as well. Sudbury’s population fell by 6.1 percent,as did Sault Ste. Marie's (-6.9 percent,) Thunder Bay's (-4.1
percent,) and Timmins' (-8.0 percent.) Overall,compared to its neighbours to the north, east, andwest, the Blue Sky region has fared relatively well inits effort to maintain population, even compared toother resource-dependent regions in Canada,charted on Figure 2. 4
Figure 2
Population Change 1996 to 2001
4.0%
-6.8% -5.8%-4.5%
-2.1%-0.8%
0.2%
6.1%
-10%-8%-6%-4%-2%0%2%4%6%8%
10%
% C
hang
e in
Pop
ulat
ion
YukonNorth West TerritoriesNorthern OntarioBlue SkyNorthern ManitobaNorthern SaskatchewanCanadaOntario
Source: Statistics Canada, Census of Canada, 1996 and 2001.
4. Statistics Canada, Census of Canada, 2001, based on Form 1. These figures include adjusted figures for thechange from 1996 to 2001. Chris Southcott. Population Change in Northern Ontario: 1996 to 2001, 2001 CensusResearch Paper Series: Report #1, North Bay: Northern Ontario Training Boards, 2002, p.6. Figures for other censusyears were not adjusted.

Blue Sky – Labour Market Study: HR Gap Analysis © 2005 Precision Management Catalysts Ltd. All rights reserved. 8
Global TrendWithin a larger context, the growing global trend is to increasing populations, noted
on Figure 3. Canada is no exception with a four-percent growth rate from 1996 to 2001,higher than other developed countries. This is good for the Blue Sky region because anincreased national population means greater opportunities to attract new residents.
Figure 3
Five-year Growth Rates: 1996 to 2001
0.4% 0.4%1.3% 1.4% 1.9%
4.0%5.4% 5.9%
7.0%
0%
2%
4%
6%
8%
Italy Germany Japan U.K. France Canada U.S.A. Australia World
% P
opul
atio
n C
hang
e
Source: Statistics Canada, A Profile of the Canadian Population: Where We Live, Ottawa, 2001.
Understanding Population ChangesTo put economic development activities into perspective, it is important to gain an
appreciation of how and why a population grows, how this growth can be managed, andwhy people sometimes move. Population analysis is important because an increasingpopulation puts pressure on a community to grow infrastructure, while the reverse is truefor a population in decline. When a population declines, a decreasing number ofindividuals are left to pay the costs of public infrastructure and administration, often leadingto increasing taxes per capita. Population decline also decreases the number of workersavailable in a labour market, a concern when decline is linked to important age groups,educational levels, or professions.
Figure 4
Factors that bear on populationmovements are well understood. Twofactors grow population: children being born(fertility) and people moving into an area(immigration.) Two factors decreasepopulation: deaths (mortality) and peoplewho move away (emigration or out-migration.) Natural increase consists ofbirths and deaths, and net migrationconsists of immigration and emigration.Figure 4 shows the historical and projectednatural increase and net migration forOntario. 5
5. Ontario Ministry of Finance. Update to Ontario Population Projections 2001-2028, August 2002,http://www.gov.on.ca/FIN/english/demographics/demog02e.htm.
Blue Sky – Labour Market Study: HR Gap Analysis © 2005 Precision Management Catalysts Ltd. All rights reserved. 9
Factors that Lead to Population Growth
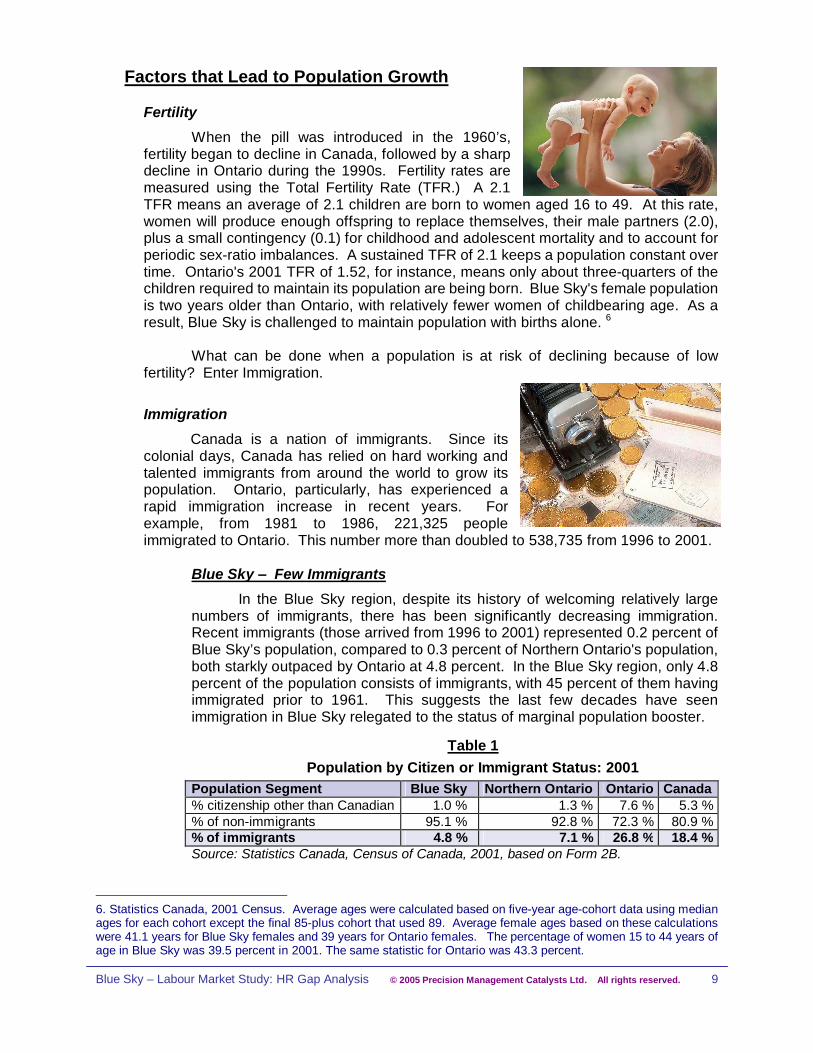
FertilityWhen the pill was introduced in the 1960’s,
fertility began to decline in Canada, followed by a sharpdecline in Ontario during the 1990s. Fertility rates aremeasured using the Total Fertility Rate (TFR.) A 2.1TFR means an average of 2.1 children are born to women aged 16 to 49. At this rate,women will produce enough offspring to replace themselves, their male partners (2.0),plus a small contingency (0.1) for childhood and adolescent mortality and to account forperiodic sex-ratio imbalances. A sustained TFR of 2.1 keeps a population constant overtime. Ontario's 2001 TFR of 1.52, for instance, means only about three-quarters of thechildren required to maintain its population are being born. Blue Sky's female populationis two years older than Ontario, with relatively fewer women of childbearing age. As aresult, Blue Sky is challenged to maintain population with births alone. 6
What can be done when a population is at risk of declining because of lowfertility? Enter Immigration.
ImmigrationCanada is a nation of immigrants. Since its
colonial days, Canada has relied on hard working andtalented immigrants from around the world to grow itspopulation. Ontario, particularly, has experienced arapid immigration increase in recent years. Forexample, from 1981 to 1986, 221,325 peopleimmigrated to Ontario. This number more than doubled to 538,735 from 1996 to 2001.
Blue Sky Few ImmigrantsIn the Blue Sky region, despite its history of welcoming relatively large
numbers of immigrants, there has been significantly decreasing immigration.Recent immigrants (those arrived from 1996 to 2001) represented 0.2 percent ofBlue Sky’s population, compared to 0.3 percent of Northern Ontario's population,both starkly outpaced by Ontario at 4.8 percent. In the Blue Sky region, only 4.8percent of the population consists of immigrants, with 45 percent of them havingimmigrated prior to 1961. This suggests the last few decades have seenimmigration in Blue Sky relegated to the status of marginal population booster.
Table 1Population by Citizen or Immigrant Status: 2001
Population Segment Blue Sky Northern Ontario Ontario Canada% citizenship other than Canadian 1.0 % 1.3 % 7.6 % 5.3 %% of non-immigrants 95.1 % 92.8 % 72.3 % 80.9 %% of immigrants 4.8 % 7.1 % 26.8 % 18.4 %Source: Statistics Canada, Census of Canada, 2001, based on Form 2B.
6. Statistics Canada, 2001 Census. Average ages were calculated based on five-year age-cohort data using medianages for each cohort except the final 85-plus cohort that used 89. Average female ages based on these calculationswere 41.1 years for Blue Sky females and 39 years for Ontario females. The percentage of women 15 to 44 years ofage in Blue Sky was 39.5 percent in 2001. The same statistic for Ontario was 43.3 percent.

Blue Sky – Labour Market Study: HR Gap Analysis © 2005 Precision Management Catalysts Ltd. All rights reserved. 10
Mobility Migration from Other Canadian Census Areas
Internal migration (people who moved from another Canadian Censusarea) is one part of mobility status that indicates whether people have moved ornot. There are two other types of movers: those who moved within the samecensus area (non-migrants) and those who came from another country (externalmigrants.) Traditionally, there has been a lot of internal migration in NorthernOntario and other resource-dependent areas, as people moved to where the jobswere at any given time. As the region started to grow in the 1880s, in-migrationrates were very high and continued for the most part until the 1960s. Small one-industry towns found it hard to keep young male workers in their communities forlong, and expended considerable effort to find ways to do so. 7
Since the 1960s, there has been a noticeable change in NorthernOntario's migration patterns. Northern Ontario had less in-migration in 2001 withonly 13.4 percent of residents having moved from another Canadian censussubdivision over the previous five years. By comparison, Ontario’s populationhad higher in-migration at 19.6 percent. 8
Blue Sky had a 2001 in-migration rate of 19 percent, almost the same asthat of Ontario and considerably higher than Northern Ontario. Interestingly, 86percent of Blue Sky's recent in-migrants were from Ontario. 9
Moving to Blue SkyWhy are such a relatively high
percentage of people moving to the BlueSky region? Many people may bemoving to the region for a number ofreasons such as lifestyle and theopportunity to live in an unspoilednatural environment that is still close tourban amenities. Analysis of migrationdata from the 2001 Census indicatesquite a variety of in-migration ratesamong Blue Sky communities. Theyrange from an in-migration rate of 42.3percent in the McMurrich-MonteithTownship to 10.8 percent in the Papineau-Cameron Township. Generally, itappears that in-migrants are drawn to cottage-country areas that comprise muchof the Blue Sky region.
7. Statistics Canada. "Mobility," 2001 Census Dictionary, April 22, 2002,http://www.statcan.ca/english/census2001/dict/pop079.htm. See also Alex Himelfarb. "The Social Characteristics ofSingle Industry Towns," R.T. Bowles (ed) Little Communities and Big Industry, Toronto, Butterworths, 1982.8. Chris Southcott. A Regional Outlook for Northern Boards: A Northern Approach to Regional Labour ForceDevelopment, Dryden: Training Boards of Northern Ontario, 2000, p. 5.9. Statistics Canada, 2001 Census of Canada, Community Profiles.

Blue Sky – Labour Market Study: HR Gap Analysis © 2005 Precision Management Catalysts Ltd. All rights reserved. 11
Factors that Decrease Population
MortalityDue primarily to advances in universal health care afforded by a relatively high
standard of living, mortality rates have remained quite low. During the recent decade,average life expectancy for Canadian men and women has grown an average of onemonth per calendar year. Also, it has long been the case that women live longer thanmen. Today, Canadian life expectancy at birth is 76.2 years for men and 81.8 years forwomen. With only slightly more people in the 75-and-older age cohort than other areasin Northern Ontario, mortality is likely not a large concern for the Blue Sky region. 10
EmigrationCompared to the rest of Northern Ontario, emigration from Blue Sky is low, with
an economy that is becoming more diversified than in decades past and a job marketthat is not as tied to one or a few industries to supply all the jobs. Adults who live in theBlue Sky region enjoy the area and tend to stay if they have steady employment.
High Youth Out-migration in Northern Ontario
There is, however, an age group in Northern Ontario that is at much higherrisk of moving outside their hometown. Youth out-migration is a problem that haspervaded Northern Ontario for several decades. Some youth leave a community
to pursue post-secondary education,others leave to explore the bright lightsof the city in search of increased jobopportunities. In both cases, the neteffect is a loss of young people at thebeginning of their work-lives who likelywould have raised families in thecommunity had they not departed.Rural areas and resource-dependentregions have good reason to beconcerned with youth out-migration.Research indicates that three-quartersof the youth who leave a rural area donot return within ten years ofdeparting.11
10. World Resources Institute. "Demographics: Life Expectancy at Birth, Males and Females," Earthtrends: TheEnvironmental Portal, on-line available September 9, 2003 at http://earthtrends.wri.org/text/POP/variables/381.htmand http://earthtrends.wri.org/text/POP/variables/380.htm.11. Neil Rothwell, Ray D. Bollman, Juno Tremblay, and Jeff Marshall. Recent Migration Patterns in Rural and SmallTown Canada, Agriculture and Rural Working Paper, Series Working Paper No. 55, Agriculture Division, StatisticsCanada, 2002. Juno Tremblay. Rural youth migration between 1971 and 1996, Working Paper# 44, AgricultureDivision, Statistics Canada, 2001. R.A. Malatest & Associates Ltd., Rural Youth Migration: Exploring the RealityBehind the Myths, Canadian Rural Partnership, 2002 and Richard Dupuy, Francine Mayer, and René Morissette.Rural Youth: Stayers, Leavers and Return Migrants, Canadian Rural Partnership, 2000. See also Richard Dupuy,Francine Mayer, and René Morissette, (2000) Rural Youth: Stayers, Leavers and Return Migrants, No. 152,Research Paper Series, Analytical Studies Branch, Statistics Canada, p.4.
Blue Sky – Labour Market Study: HR Gap Analysis © 2005 Precision Management Catalysts Ltd. All rights reserved. 12
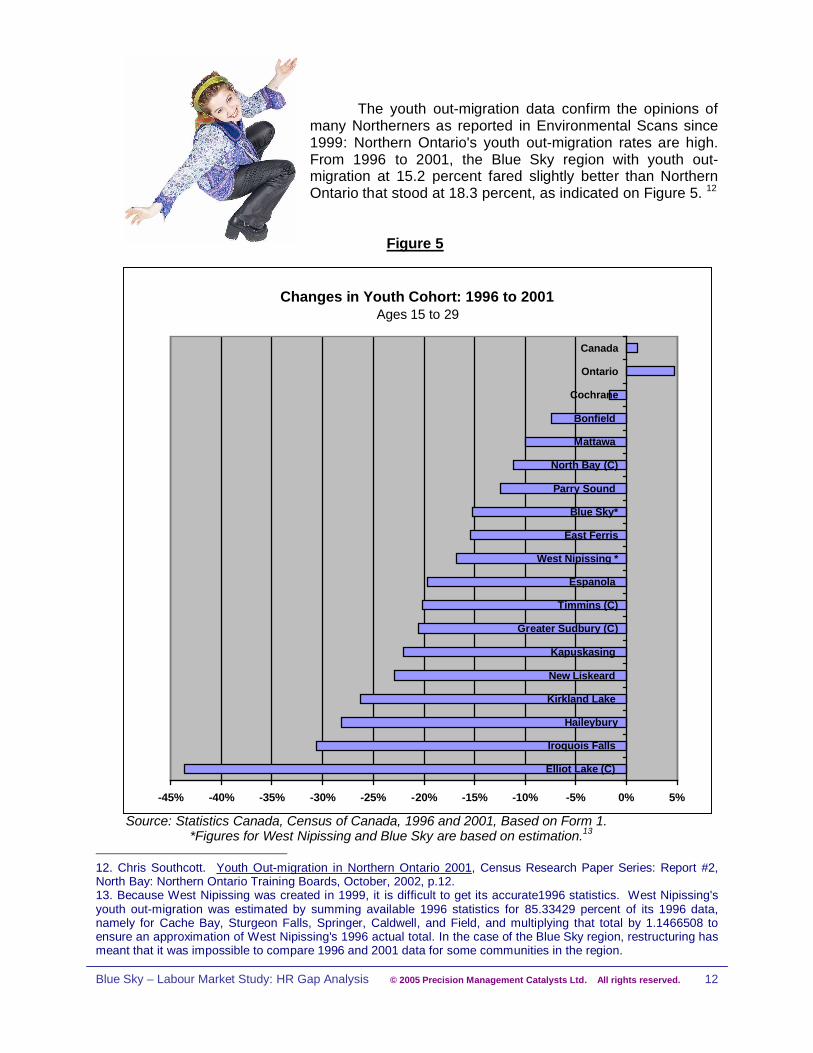
The youth out-migration data confirm the opinions ofmany Northerners as reported in Environmental Scans since1999: Northern Ontario's youth out-migration rates are high.From 1996 to 2001, the Blue Sky region with youth out-migration at 15.2 percent fared slightly better than NorthernOntario that stood at 18.3 percent, as indicated on Figure 5. 12
Figure 5
Source: Statistics Canada, Census of Canada, 1996 and 2001, Based on Form 1.*Figures for West Nipissing and Blue Sky are based on estimation.13
12. Chris Southcott. Youth Out-migration in Northern Ontario 2001, Census Research Paper Series: Report #2,North Bay: Northern Ontario Training Boards, October, 2002, p.12.13. Because West Nipissing was created in 1999, it is difficult to get its accurate1996 statistics. West Nipissing'syouth out-migration was estimated by summing available 1996 statistics for 85.33429 percent of its 1996 data,namely for Cache Bay, Sturgeon Falls, Springer, Caldwell, and Field, and multiplying that total by 1.1466508 toensure an approximation of West Nipissing's 1996 actual total. In the case of the Blue Sky region, restructuring hasmeant that it was impossible to compare 1996 and 2001 data for some communities in the region.
Changes in Youth Cohort: 1996 to 2001Ages 15 to 29
-45% -40% -35% -30% -25% -20% -15% -10% -5% 0% 5%
Elliot Lake (C)
Iroquois Falls
Haileybury
Kirkland Lake
New Liskeard
Kapuskasing
Greater Sudbury (C)
Timmins (C)
Espanola
West Nipissing *
East Ferris
Blue Sky*
Parry Sound
North Bay (C)
Mattawa
Bonfield
Cochrane
Ontario
Canada
Blue Sky – Labour Market Study: HR Gap Analysis © 2005 Precision Management Catalysts Ltd. All rights reserved. 13
During the 1980s and 1990s, fewer people than inprevious decades immigrated to Northern Ontario and otherrural Canadian communities to replace youth leaving. Morerecently, research conducted into the phenomenon of youthout-migration in Northern Ontario revealed the followingimportant findings. 14
• Aboriginal and Francophone youths are less likely tomigrate out of the region;
• Aboriginal communities have higher percentages of youth;• Francophone communities have lower percentages of
youths; and• Out-migration rates vary considerably by regions and age.
Population Summary Because fertility rates are low and BlueSky's youth out-migration rates mirror NorthernOntario's high rates, the Blue Sky region willlikely have to rely more heavily on immigrationin the future to increase its population. Theregion had few immigrants from outside thecountry from 1996 to 2001. It also had fewpeople in-migrating from other parts ofCanada, and of these, 86 percent came fromOntario. Therefore, in contrast to metropolitancentres that rely heavily on immigration fromother countries, the Blue Sky region appears todraw more on in-migration from within Ontario.
Because intra-provincial immigration is often drawn from the larger region around acommunity, the Blue Sky region does not have far to venture to attract prospectiveimmigrants. In addition, Blue Sky draws on people, originally from the region, who areenticed to move back to the area to live and work close to their families.
14. Ontario Ministry of Northern Development and Mines. Youth Migration: Northern Perspectives: The NorthernDevelopment Councils’ Report, Thunder Bay, 1991. See also Chris Southcott. Youth Out-migration in NorthernOntario 2001, Census Research Paper Series: Report #2, North Bay: Northern Ontario Training Boards, October,2002, p.11. A cohort-change analysis was used to examine changes in a group of youth over time. The youth out-migration rate was determined by using the number of original youth left after five years from a specific group. Seealso Suthey Holler Associates, Youth Out-Migration From The FNETB Area, Hearst: Far Northeast Training Board,2001, p. 9.

Blue Sky – Labour Market Study: HR Gap Analysis © 2005 Precision Management Catalysts Ltd. All rights reserved. 14
Age and Gender
Canada's Rising AgeCensus statistics for 2001 indicate that
Canada’s population is aging, due to a combination oflow fertility and increasing life expectancy, a trendmirrored in other wealthy countries, as noted onFigure 6. Canada’s median age has been rising since1966 when the baby boom ended. In 1966, themedian age in Canada was 25.4 years, and it steadilyincreased to 37.6 years by 2001. Compared to otherdeveloped countries, Canada is average in terms of itsmedian age: younger than some, older than others. 15
Figure 6
Median Age: 2000Canada: 2001
26.535.5
24.2
36.9 37.4 37.6 37.6 40.1 40.2 41.2
010203040506070
Lessdeveloped
World UnitedStates
Russia Moredeveloped
Canada(2001)
France Germany Italy Japan
Med
ian
Age
in Y
ears
Source: Statistics Canada. Profile of the Canadian population by age and sex: Canada ages,Catalogue no. 96F0030XIE2001002, 2002, p. 29.
Blue Sky Aging FasterBlue Sky's average age is 40.2 years, 39.3 years for men and 41.1 years for
women, an aging population similar to the rest of Northern Ontario. This compares toOntario average ages of 38 years, 36.9 for men and 39 for women. Both Northern Ontarioand Blue Sky have smaller percentages of younger-age cohorts and greater percentages ofolder-age cohorts, as reflected on Figure 7, as a result of comparatively fewer women ofchildbearing age, a lack of new immigrants, and high youth out-migration. 16
15. Statistics Canada. Profile of the Canadian Population by Age and Sex: Canada Ages, Catalogue no.96F0030XIE2001002, 2002. See also Foot, David K., Boom, Bust and Echo, Macfarlane Walter & Ross, p. 19.16. See Footnote 6 on calculating average age using cohort data. See also Chris Southcott. A Regional Outlook forNorthern Boards: A Northern Approach to Regional Labour Force Development, Dryden: Training Boards of NorthernOntario, 2000, p. 5.

Blue Sky – Labour Market Study: HR Gap Analysis © 2005 Precision Management Catalysts Ltd. All rights reserved. 15
Figure 7
Age Structure: 2001
4
9
14
19
24
0 to 14 15 to 29 30 to 44 45 to 59 60 to 74 75 +
% o
f Pop
ulat
ion
Blue SkyNorthern OntarioOntario
Source: Statistics Canada, Census of Canada, 2001, Based on Form 1.
Almost 67 percent of Blue Sky residents are working age (i.e., those aged 15 to 64.)Out of the 17 communities shown in Figure 8, Blue Sky (which encompasses a few of thoseshown) has the eighth largest percentage of seniors, the fifth largest percentage ofresidents aged 45 to 64, the eighth smallest percent in the 30-to-44-aged cohort, the ninthsmallest percent in the 15-to-29-aged cohort, and the eighth smallest percent in the zero-to-14-aged cohort.
Figure 8
Source: Statistics Canada, Census of Canada, 2001, Based on Form 1.
Figure 9Dependency
A dependency ratio is the proportion ofdependents (children aged 0 to 14 and seniors 65 andover) to working-age population (adults aged 15 to 64,)graphed on Figure 9 for Ontario. Blue Sky’s dependencyrate of 50 contrasts with Ontario's 45.5, and is a furtherindication of its aging population. Blue Sky has relativelyfewer children at 18.1 percent compared to Ontario's24.3 percent, and relatively more seniors at 15.2 percentcompared to 11.7 percent for Ontario. 17
17. Ontario Ministry of Finance. Update to Ontario Population Projections 2001-2028, August 2002,http://www.gov.on.ca/FIN/english/demographics/demog02e.htm.
Age Comparisons: 2001
0%
20%
40%
60%
80%
100%
Elliot L
ake (
C
Parry S
ound
Mattaw
a
New Lisk
eard
Hailey
bury
West N
ipissing
Iroquois
Falls
Blue Sky
Kapusk
asing
North B
ay (C
)
Espan
ola
Blind R
iver
G. Sudb
ury
Cochran
e
Timmins (
C)
Hearst
Bonfield
% o
f Pop
ulat
ion
0-14 yrs.15-29 yrs.30-44 yrs.45-64 yrs.65+

Blue Sky – Labour Market Study: HR Gap Analysis © 2005 Precision Management Catalysts Ltd. All rights reserved. 16
Gender Differences: Women Live Longer than MenBlue Sky mirrors gender statistics for Canada and Ontario.
While Blue Sky had 2,400 more women than men in 2001, most ofthis difference was due to women living longer than men.Confirmation is available on Table 2, which indicates there were1,770 more women than men in the aged 65-and-over category.
Table 2Gender Structure by Age: 2001 (Blue Sky)
Age Cohorts Males Females Males as % ofTotal Population
Females as % ofTotal Population
Totals All Ages 53,895 56,290 48.9% 51.1% 0 14 10,295 9,685 9.3% 8.8% 15 19 4,065 3,835 3.7% 3.5% 20 24 3,100 3,140 2.8% 2.8% 25 54 22,490 23,665 20.4% 21.5% 55 64 6,465 6,720 5.9% 6.1% 65 74 4,875 4,975 4.4% 4.5% 75 + 2,635 4,305 2.4% 3.9%
Source: Statistics Canada, Census of Canada, 2001, Based on Form 1.
Gender in the WorkforceSince the Second World War, the number of women in the workforce has steadily
increased. By 2001, women constituted 47.1 percent of Blue Sky's workforce, while mencomprised 52.9 percent, up from 46.5 percent for women and 53.5 percent for men in 1996.The trend towards more women working may result in part from an aging female populationwith diminishing child/family responsibilities. If the trend continues, the employment gendergap is likely to shrink modestly again by the 2006 Census. 18
Age and Gender SummaryCanada's population is continuing to age due to increased life expectancy and low
fertility rates, and the Blue Sky region is no exception. In fact, Blue Sky’s population has anaverage age over two years older than Ontario, a statistic similar to Northern Ontario. Thismeans that over the next couple of years, the percentage of Blue Sky's and NorthernOntario's working-age population will be slightly less Ontario’s. In terms of gender, BlueSky mirrors Canada's and Ontario's statistics in that most gender differences are due towomen living longer than men. In the labour force, there are nearly as many womenworking as men in the Blue Sky area, a gender gap slowly closing over the last years.
18. Apart from population figures, it is difficult to compare 1996 and 2001 Blue Sky figures. Ontario’s restructuringduring the late ‘90s changed many communities’ geographical boundaries. New jurisdictions were created containingparts of unorganized areas for which earlier figures were difficult to determine. The 1996 Blue Sky figures used hereininclude the following Census sub-divisions: Papineau-Cameron (TP), Mattawan (TP), Mattawa (T), Calvin (TP),Bonfield (TP,) Chisholm (TP,) East Ferris (TP,) North Bay (C), Springer (TP), Sturgeon Falls (T,) Cache Bay (T,)Caldwell (TP,) Field (TP), Temagami (TP,) Bear Island 1 (R,) Nipissing 10 (R,) Nipissing, Unorgorganized North Part(UNO,) McMurrich (TP,) Perry (TP,) Kearney (T,) Armour (TP,) Burk's Falls (VL,) Ryerson (TP,) Hagerman (TP),Chapman (TP,) Magnetawan (VL,) Strong (TP,) Sundridge (VL,) Joly (TP), Machar (TP,) South River (VL,) SouthHimsworth (TP,) Trout Creek (T,) Powassan (T,) North Himsworth TP, Nipissing (TP,) French River 13 (R), Dokis 9(R), Magnetewan 1 (R,) Parry Sound, Unorganized North East Part (UNO,) Cosby, Mason, and Martland (T), Casimir,Jennings, Appleby (TP,) Ratter, Dunnet (TP,) Hagar (TP,) and Sudbury, Unorganized South Par (UNO.)

Blue Sky – Labour Market Study: HR Gap Analysis © 2005 Precision Management Catalysts Ltd. All rights reserved. 17
Ethnicity
Blue Sky Identity More French, More Canadian
In addition to countryof origin, Statistics Canada
asks residents to list theethnicity with which they identify. On
this level, the Blue Sky region differsnotably from Ontario. Blue Sky has a very
high rate of people who identify their heritage asCanadian – almost double the Ontario average. In addition,Blue Sky residents list their ethnicity as French at over threetimes the rate of Ontario residents, at 33.2 percent contrastingwith Ontario's 10.9 percent. Refer to Table 3 for a listing of the largest ethnic groups in theBlue Sky region.
Table 3Ethnic Groups
Blue Sky and OntarioEthnic Groups Blue Sky
(% of Population)Ontario
(% of Population)Canadian - Total responses 52.3% 29.7% - Single responses 24.1% 14.2% - Multiple responses 28.2% 15.5%English - Total responses 26.7% 24.0% - Single responses 5.4% 6.2% - Multiple responses 21.3% 17.8%French - Total responses 33.2% 10.9% - Single responses 6.5% 1.7% - Multiple responses 26.7% 9.3%Scottish - Total responses 16.6% 16.3%Irish - Total responses 18.3% 15.6%German - Total responses 9.7% 8.6%North Amer. Indian - Total responses 5.2% 2.2%Italian - Total responses 3.7% 6.9%Dutch - Total responses 3.1% 3.9%
Source: Statistics Canada, Census of Canada, 2001, Based on Form 2B.
Fewer Visible MinoritiesThere are few visible minorities in the Blue Sky communities – one-twentieth the
rate of Ontario. In Ontario, 19.1 percent of the population is visible minorities. In theBlue Sky region, only 1.1 percent of the population is so classified. This is not surprisingconsidering that almost two-thirds of visible minority adults came to Canada since 1972,a time when Blue Sky's influx of immigrants slowed to a trickle.

Blue Sky – Labour Market Study: HR Gap Analysis © 2005 Precision Management Catalysts Ltd. All rights reserved. 18
More AboriginalsIn contrast, Blue Sky has four
times Ontario's percentage ofAboriginals, as indicated on Figure 10.In Ontario, 1.7 percent of the populationlist themselves as having an Aboriginalidentity. In Blue Sky, Aboriginalsrepresent 6.4 percent of the population.
Figure 10
Source: Statistics Canada, Census of Canada, 2001, based on 20-percent sample data, Form 2B.
Ethnicity SummaryBlue Sky has a large proportion of residents who describe their ethnic heritage as
Canadian. In addition, Blue Sky residents list their ethnicity as French at over three timesthe rate of Ontario residents. Because immigration slowed in the Blue Sky Region by 1971,there are few visible minorities – one-twentieth the rate of Ontario. A significant and moreimportant ethnic difference is Blue Sky's higher proportion of Aboriginals than Ontario.
Aboriginals and Visible Minorities: 2001As Percentage of Population
0%2%4%6%8%
10%12%14%16%18%20%
Mattaw
a
West N
ipissing
Blind R
iver
Cochran
e
Espan
ola
Timmins (
C)
Parry S
ound
Blue Sky
Elliot L
ake (
C)
Kirklan
d Lake
G. Sudbury
North B
ay (C
)
Bonfield
Iroquois
Falls
Hailey
bury
Kapusk
asing
Hearst
Ontario
Aboriginal Identity Visible Minority

Blue Sky – Labour Market Study: HR Gap Analysis © 2005 Precision Management Catalysts Ltd. All rights reserved. 19
Language
Bilingualism High in Blue SkyA distinctive aspect of Blue Sky in terms of language is that 32.7 percent of the
population has a working knowledge of both French and English. This is higher thanNorthern Ontario’s 24.2 percent and considerably higher than Ontario's 11.7 percentaverage, as reflected on Figure 11.
Figure 11
Knowledge of Both Official Languages: 2001
32.7%24.2% 17.7% 11.7%
0%
20%
40%
60%
80%
100%
Popu
latio
n % Blue Sky
Northern OntarioCanadaOntario
Source: Statistics Canada, Census of Canada, 2001, based on 20-percent sample data, Form 2B.
Almost all people in the Blue Sky region can speak one or both official languages,as noted in Table 4. Residents list 38 other languages as mother tongues. In addition tothe official languages, the following languages are spoken by at least 100 people in theBlue Sky region: German, Italian, Dutch, Ojibway, Polish, Ukrainian, Finnish, and Cree.
Table 4Language Characteristics: 2001
Blue Sky
Language MotherTongue
First Languagespoken
Knowledge ofOfficial Language
Total listed by mother tongues 108,660 108,660 108,660 English 78,055 82,955 71,345 French 25,285 25,205 1,700 Both French and English 1,590 460 35,550 English and non-official language 175 Non-official languages 3,490 French and non-official language 50 English, French, and non-official language 10
Source: Statistics Canada, Census of Canada, 2001, based on 20-percent sample data, Form 2B.

Blue Sky – Labour Market Study: HR Gap Analysis © 2005 Precision Management Catalysts Ltd. All rights reserved. 20
Benefits of Bilingualism in the WorkforceTo better serve the many bilingual
residents in the Blue Sky region, manyarea employers hire bilingual employees.In some Blue Sky communities, areaemployers give priority to bilingualcandidates. In general, many companiesin Canada give preference to bilingualcandidates, allowing bilingual employeesto enter the workforce more easily andchange jobs more readily than theirunilingual counterparts. Accordingly, BlueSky's large bilingual workforce gives thecommunity a competitive advantage inenticing new companies to the area. Thisis reinforced by a special tabulation of2001 Census data, prepared by theAssociation of Canadian Studies, thatfound bilingual workers in Ontario earn 10percent more on average than theirEnglish-only counterparts. 19
Language SummaryThe Blue Sky region is distinctive in that a third of the population has a working
knowledge of both of Canada's official languages. As such, the bilingual labour pool issignificant, a potential advantage to prospective employers.
19. Precision Management Catalysts. "Interviews with 112 Blue Sky Profit and Not-for-Profit Employers," July-October, 2005. See also Nova Scotia Department of Education. Bilingualism in the Canadian Labour Market,November 11, 2002, http://cpfns.ednet.ns.ca/data/resource/bilingual.pdf, p. 17. See also Jack Jedwab. It Pays to beBilingual in Canada, Association for Canadian Studies, November, 2005, http://www.acs-aec.ca/Polls/Poll53.pdf, pp.1-4.
Blue Sky – Labour Market Study: HR Gap Analysis © 2005 Precision Management Catalysts Ltd. All rights reserved. 21
Education
During the past 20 years, there has been a dramatic andincreased focus on education. Enrolment levels at universitiesand colleges across Canada demonstrate that more Canadiansthan ever have an appetite for higher education. Individuals withhigher educational levels usually have higher skill levels andhigher levels of employability. Skill levels are also related toearning power; individuals with high skills are regarded as morevaluable by employers, and thus command higher rates of pay.
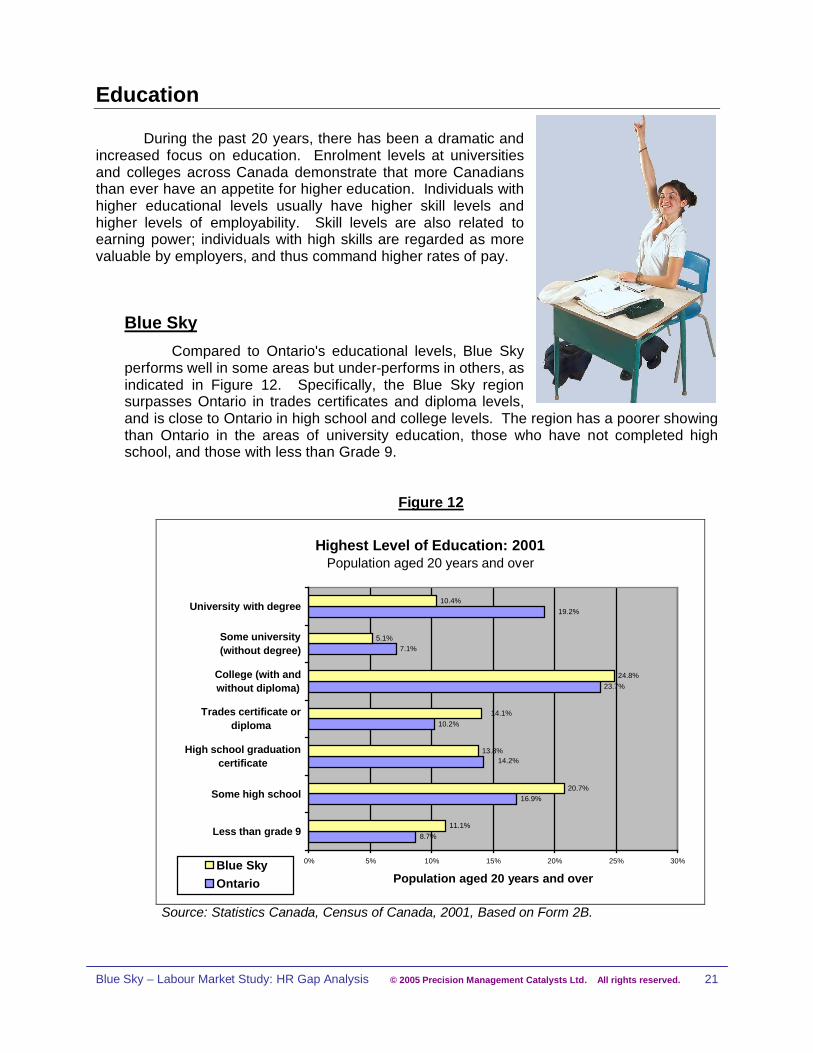
Blue SkyCompared to Ontario's educational levels, Blue Sky
performs well in some areas but under-performs in others, asindicated in Figure 12. Specifically, the Blue Sky regionsurpasses Ontario in trades certificates and diploma levels,and is close to Ontario in high school and college levels. The region has a poorer showingthan Ontario in the areas of university education, those who have not completed highschool, and those with less than Grade 9.
Figure 12
Highest Level of Education: 2001Population aged 20 years and over
8.7%
16.9%
10.2%
23.7%
7.1%
11.1%
20.7%
13.8%
24.8%
10.4%19.2%
14.2%
5.1%
14.1%
0% 5% 10% 15% 20% 25% 30%
Less than grade 9
Some high school
High school graduationcertificate
Trades certificate ordiploma
College (with andwithout diploma)
Some university(without degree)
University with degree
Population aged 20 years and overBlue SkyOntario
Source: Statistics Canada, Census of Canada, 2001, Based on Form 2B.

Blue Sky – Labour Market Study: HR Gap Analysis © 2005 Precision Management Catalysts Ltd. All rights reserved. 22
Higher Trades Level than OntarioCompared to Northern Ontario as a whole, Blue Sky
has a slightly higher percentage of skilled trades workers.Table 5 lists the percentage of trades workers in and aroundthe Blue Sky region. The ranking suggests that Ontariotrades shortages prevalent over the last 10 years may not beas severe in the Blue Sky region.
Table 5Trades Certificate/Diploma: 2001
As Highest Schooling Level Ages 20 and OverCommunity Population % Community Population % Community Population %Iroquois Falls 18.3 % Mattawa 13.4 % Espanola 12.7 %Haileybury 17.0 % Bonfield 13.3 % Cochrane 12.5 %Kapuskasing 16.9 % Elliot Lake 13.1 % Parry Sound 11.6 %West Nipissing 14.7 % North Bay 13.0 % Blue Sky 14.1 %Timmins 14.0 % Kirkland Lake 12.9 % Northern Ont. 13.9 %Greater Sudbury 13.5 % Blind River 12.9 % Ontario 10.2 %Source: Statistics Canada, Census of Canada, 2001, based on 20-percent sample data, Form 2B.
Post-secondary SpecializationsOf the 34,650 people in the Blue Sky area with post-secondary education, over 26.3
percent are specialized in applied science technologies and trades, more favourable thanthe provincial average of 20 percent indicated on Figure 13. Blue Sky also hascomparatively more specializations in health-care professions and related technologies;and educational, recreational, and counselling services. In the other seven specializationcategories, Blue Sky does not meet Ontario levels. This is a concern especially incommerce, management, and business administration qualifications, skills most useful ingrowing a local economy.
Figure 13
Specializations: 2001of Population with Post-secondary Qualifications
9.4%
5.4%
6.7%
11.6%
21.4%
4.1%
5.7%
12.3%
4.5%
3.7%
10.3%
21.1%
3.8%
2.1%
26.3%
14.1%
1.5%4.4%
11.1%
20.0%
0% 5% 10% 15% 20% 25% 30%
Educational, recreational and counselling services
Fine and applied arts
Humanities and related fields
Social sciences and related fields
Commerce, management and business administration
Agricultural, biological, nutritional, and food sciences
Engineering and applied sciences
Applied science technologies and trades
Health professions and related technologies
Mathematics, computer, & physical sciences
Population with Post-secondary Qualifications
Blue SkyOntario
Source: Statistics Canada, Census of Canada, 2001, based on 20-percent sample data, Form 2B.

Blue Sky – Labour Market Study: HR Gap Analysis © 2005 Precision Management Catalysts Ltd. All rights reserved. 23
Educational Attainment Gap IncreasingWhile the percentage of
Blue Sky's population with lessthan Grade 9 or who attendedhigh school without graduating isconsiderably higher than theprovincial average, these lowereducational levels are in largepart due to older individuals.Individuals aged 45 to 64 aretwice as likely to have less thanGrade Nine compared to theirjuniors aged 20-34 years. This issimilar to the situation in Ontarioas a whole. This consistentincrease of youth movingtowards education is cause tocelebrate because it points to an improving educational attainment rate, over time. Despitethis, as Table 6 points out, there is an educational gap between communities in the BlueSky region and the province as a whole. The gap between Blue Sky and Ontario in thepercentage of people with a university degree is higher for the 20-to-34-year-old age groupthan the 45-to-64-year-old age group.
Table 6Highest Educational Attainment: 2001
By age groupsCategory Age
GroupOntario Blue Sky Difference
Less than high school certificate 20 – 34 13.2% 15.2% 2.0%35 – 44 17.3% 17.9% 0.6%45 – 64 27.5% 31.8% 4.3%
High school certificate 20 – 34 13.7% 12.4% -1.3%35 44 15.5% 16.7% 1.2%45 – 64 14.9% 14.1% -0.8%
Trades certificate / diploma 20 34 7.9% 11.5% 3.6%35 44 11.5% 16.6% 5.1%45 64 11.6% 14.8% 3.2%
College certificate/ diploma 20 34 19.5% 24.1% 4.6%35 44 21.2% 25.9% 4.7%45 – 64 16.6% 16.9% 0.3%
Completed university 20 – 34 23.7% 14.1% -9.6%35 – 44 22.1% 11.4% -10.7%45 – 64 18.9% 12.8% -6.1%
Source: Statistics Canada, Census of Canada, 2001, Based on Form 2B.

Blue Sky – Labour Market Study: HR Gap Analysis © 2005 Precision Management Catalysts Ltd. All rights reserved. 24
Blue Sky School Enrolment Rates AverageIn 2001, 63 percent of Blue Sky's youth (aged
15 to 24) attended school full-time or part-time,marginally less than Ontario's average of 64.5percent, as noted in Table 7. These statistics differfrom 1996 when school-enrolment rates for Blue Skywere slightly higher than Ontario at 68.5 percentcompared to 68.3 percent. 20
Overall, there is availability of post-secondaryeducation in the area. In addition to Collège Boréal,an Adult Learning Centre, Canadore College'ssatellites, Nipissing University and Canadore Collegehave full campuses in North Bay. In addition,students can attend Laurentian University andCambrian College in Sudbury, adjacent to the BlueSky region. And 40 kilometres to the north of BlueSky, students can attend co-operative programs forcertified instrumentation engineering technician and mining engineering technician from theHaileybury School of Mines delivered through Northern College. Moreover, students canattend Contact North without travelling outside Blue Sky to access a variety of courses froma variety of colleges and universities across Canada. 21
Table 7School Attendance: 2001
Ages 15 to 24
Blue Sky OntarioPopulationTotal Male Female Total Male Female
Total population 15-24 13,835 7,165 6,975 1,487,835 754,560 733,275Total attending full time 8,270 4,025 4,460 883,020 439,950 443,065Total attending part time 450 260 260 76,625 38,865 37,765Total attending full/part-time 8,720 4,285 4,720 959,645 478,815 480,830% attending full/part-time 63.0% 59.8% 67.7% 64.5 % 63.5 % 65.6 %
Source: Statistics Canada, Census of Canada, 2001, based on 20-percent sample data, Form 2B.
Focus on Education ChangedHistorically, formal levels of education in Northern Ontario were not
in high demand since the largest single group of jobs was trades. That haschanged with jobs in services now outpacing jobs in trades. The new focusis on higher education to meet the demands of service industries such aseducation and health care. 22
20. See earlier note on comparisons between 1996 and 2001.21. Northern College. Haileybury School of Mines Programs, on-line available August 2, 2005 athttp://www.northernc.on.ca/programs/mining.html.22. Chris Southcott. A Regional Outlook for Northern Boards: A Northern Approach to Regional Labour ForceDevelopment, Dryden: Training Boards of Northern Ontario, 2000, pp. 5-6. See also Statistics Canada. Census ofCanada, 2001, based on Form 2B.

Blue Sky – Labour Market Study: HR Gap Analysis © 2005 Precision Management Catalysts Ltd. All rights reserved. 25
Young Women Making Educational GainsIn the past, Northern Ontario women were often not actively
encouraged to further their education in resource-dependentcommunities. Now Blue Sky’s educational gender gap has closed,and even reversed. Of Blue Sky’s 15-to-24-year-old youth, 7.9percent more women than men attended school, closer and even abit higher than Ontario’s female-attendance statistic. This gendergap has changed in part because post-secondary institutionsabound within a short commuting distance in Blue Sky, a majordeterminant of female university participation. 23
Aboriginal EducationThe Aboriginal population is an important part of the Blue Sky region. Recently,
Aboriginals have been able to gain betteraccess to more culturally appropriateeducational experiences. AnishinabekEducational Institute, a First Nationorganization offering programs throughcollege, university, business, andindustry partnerships, formed apartnership with Canadore College in2003 to ensure quality programming andhigh service standards for Anishinabeklearners in Blue Sky. According to GrandCouncil Chief, Vernon Roote, "Canadore
College has always been supportive to Aboriginal people through their fields of studies,support programs and recognition of our unique culture and educational needs." Initialprogramming started September 2003. 24
Nipissing University offers programs focussing on Aboriginals such as the AboriginalTeacher Certification Program, Native Classroom Assistant Diploma Program, and NativeSpecial Education Assistant Diploma Program. Also, Northern Secondary School providesculturally appropriate experiences with Ojibway language classes and an annual AboriginalWeek. Finally, Nipissing First Nation offers co-operative education, summer careerplacement, and adult-literacy training. 25
23. Marc Frenette. Too Far to Go On? Distance to School and University Participation, Catalogue No. 11F0019MIE– No. 191, Statistics Canada, June 19, 2002. Three reasons distance may impact university attendance are: financialcosts, emotional costs associated with leaving home, and not appreciating the educational benefits if few people inthe area hold degrees. Females are more likely than males to attend university but less likely to attend when livingbeyond 80 kilometres from a university. See also Chris Southcott. Single Industry Towns in a Post-Industrial Era:Northwestern Ontario as a Case Study. Research Reports, Centre for Northern Studies, Lakehead University, 2000.See also Alison Gil. Women in Isolated Resource Towns: An Examination of Gender Differences in CognitiveStructures, Geoforum 21(3), pp. 347-358, 1990.24. Anishinabek Educational Institute. "Anishinabek, Canadore College Announce New Partnership," January, 2003,http://www.anishinabek.ca/uoi/aeicc_agree.htm.25. Nipissing University. Dynamic Academic Calendar, Year 2005-2006, November 3, 2005,http://www.nipissingu.ca/calendar/downloads/Cal05-06.pdf.

Blue Sky – Labour Market Study: HR Gap Analysis © 2005 Precision Management Catalysts Ltd. All rights reserved. 26
French-Language EducationSince Franco-Ontarians comprise a significant portion of
Blue Sky's population, it is important for this group to accesseducation in their own language. In addition to a number ofbilingual elementary schools, the region can boast bilingual andFrench secondary schools, and a bilingual college, CollègeBoréal, which provides services for 500 college students. Anotherboon for French-language residents is the availability of French-language university education in Sudbury at Laurentian Universitylocated within commuting distance of many Blue Sky communities.
Educational Upgrading for AdultsFor adults wishing to upgrade skills or work
towards high school equivalency, the Ministry of Training,Colleges, and Universities subsidizes a Collège Boréalprogram. Furthermore, the college builds customizedtraining packages around attendees' skill and educationallevels, and works around participants' schedules toprovide year-round programming. People with learningdisabilities are welcomed. Upgrading for adults is alsoavailable at Nipissing University in North Bay andLaurentian University in Sudbury. 26
Education SummaryOverall, Blue Sky is faring well in terms of
education. Blue Sky has a significantly higherpercentage of workers with trades certificates ordiplomas than Ontario, resulting in fewer trade-worker shortages than other areas. Conversely,Blue Sky’s higher proportion of older people has asignificant negative effect on summary educationalstatistics in the areas of high school and university-attainment levels. Because the populationcomposition is more heavily weighted in favour ofseniors, the effect is even more dramatic. On thepositive side, Blue Sky’s 2001 youth school-attendance level mirrors Ontario's. As well,Aboriginals and French-speaking residents canaccess a wide range of appropriate education at alllevels. Ultimately, strong school enrolment will bolster future educational-attainment rates,while equipping youth in Blue Sky with greater skills for the future labour market.
26. Gianni Ubriaco. "College Boreal Offers Free Upgrading for Adults, " Northern Business Journal, August, 2003, p.18. See also Nipissing University. Dynamic Academic Calendar, Year 2005-2006, November 3, 2005,http://www.nipissingu.ca/calendar/downloads/Cal05-06.pdf. See also Laurentian University. Course Calendar 2005-06, November 3, 2005, http://www.laurentian.ca/?file=calendar/cal_e.php.

Blue Sky – Labour Market Study: HR Gap Analysis © 2005 Precision Management Catalysts Ltd. All rights reserved. 27
Employment
The most reliable data on employment rates for Blue Skyis captured by the Canadian census. The 2001 Census indicatesthe Blue Sky region had 8.9 percent unemployment, lower thanthe 10.6 percent average of selected Northern Ontariocommunities, indicated on Figure 14, yet more than Ontario’s 6.1percent. This is a huge improvement from 1996 when Blue Sky’sunemployment rate was 12.4 percent. 27
More recent employment trends are indicated in StatisticCanada’s monthly Labour Force Survey. Although not as reliableas Census data, it is useful for showing changes in theemployment situation. Northeastern Ontario data indicates theregion’s employment situation has improved over the past fewyears. From January to March 2003, the average unemployment rate was 8.3 percent. By2004, it had declined to 8.2 percent. For the January-to-March period of 2005, theunemployment rate was 7.7 percent. 28
Why are Blue Sky’s unemployment rates higher than Ontario’s average? ExaminingAboriginal population differences provides part of the answer. Blue Sky has almost five percentmore Aboriginals than Ontario. In Canada, Aboriginal unemployment is twice that of non-Aboriginals, and aboriginal unemployment on reserves is three times that of non-Aboriginals. 29
Figure 14
Source: Statistics Canada, Census of Canada, 2001, based on 20-percent sample data, Form 2B.
27. See earlier note on comparisons between 1996 and 2001.28. Labour Force Survey Data for Northern Ontario is weak in reliability compared to the Census because it is basedon estimations and limited sample sizes. Data used herein is for Economic Region 590 (Northeastern Ontarioincluding the Sudbury Regional Municipality and the Districts of Algoma, Cochrane, Sudbury, Manitoulin, Nipissing,Timiskaming, and Parry Sound). See also North Bay Human Resource Centre of Canada Labour Market Bulletin,First Quarter 2004 and First Quarter 2005.29. Statistics Canada, 2001 Census, based on Form 2B. See also Indian and Northern Affairs Canada. Some FastFacts on the Funding of Aboriginal Programs, March, 2000, http://www.ainc-inac.gc.ca/nr/prs/j-a2000/mar7_e.html.See also Precision Management Catalysts. "Interviews with 110 Blue Profit and Not-for-Profit Employers," July-October, 2005.
Unemployment: 2001As Percentage of Population Aged 15+
0%
5%
10%
15%
20%
Mattaw
a
Blind R
iver
Kirklan
d Lake
Iroquois
Falls
Elliot L
ake (
C)
West N
ipissing
Timmins (
C)
Espan
ola
Hailey
bury
Kapusk
asing
Cochran
e
Greater
Sudbury (C
)
Blue Sky
Bonfield
North B
ay (C
)
Parry S
ound
Ontario
New Lisk
eard

Blue Sky – Labour Market Study: HR Gap Analysis © 2005 Precision Management Catalysts Ltd. All rights reserved. 28
Blue Sky's 59 percent participation rate (labour force as a percentage of the populationaged 15 and over) falls below Northern Ontario’s 61.3 percent. Note the seniors' populationparticularly influences this statistic. For example, Elliot Lake has a high seniors population andcorrespondingly low participation rate of 38.0 percent. The same is true for employment rates(ratio of those employed divided by the labour force.) Accordingly, Blue Sky’s 53.7 percentemployment falls predictably below the 55.6 percent Northern Ontario average, shown onFigure 15.
Figure 15
Source: Statistics Canada, Census of Canada, 2001, based on 20-percent sample data, Form 2B.
Employment SummaryBlue Sky’s general employment picture improved from 2001 to 2005. And while
unemployment was higher in 2001 than the average for Ontario, it was lower than theaverage for Northern Ontario. Blue Sky employment rates were lower than Ontario, due inpart to Aboriginal populations. Blue Sky participation rates are lower than Ontario due to ahigher seniors population.
Participation/Employment: 2001as Percentage of Population Aged 15+
0%10%20%30%40%50%60%70%80%
Elliot L
ake (
C)
Mattaw
a
West N
ipissing
Kirklan
d Lake
Iroquois
Falls
Blue Sky
Hailey
bury
Blind R
iver
Espan
ola
Parry S
ound
New Lisk
eard
Northern
Ontar
io
North B
ay (C
)
Greater
Sudbury (C
)
Bonfield
Cochran
e
Timmins (
C)
Ontario
Participation Employment

Blue Sky – Labour Market Study: HR Gap Analysis © 2005 Precision Management Catalysts Ltd. All rights reserved. 29
Self-employment
Self-employment in Canada is growing at a strong pace. By2001, there were 2.3 million self-employed Canadians, representing14.2 percent of the labour force. Similar to wage work, self-employedwork in Canada is heavily weighted in services, at more than two-thirds. In Blue Sky, self-employment has grown at a faster pace thanwage work. 30
Blue SkyAs in Canada, Northern Ontario's self-employment level has
grown substantially, an important trend for Northern Ontario that hastraditionally relied on paid employment in the resource sector. As part
of Northern Ontario, Blue Sky, too, has relatively high self-employment levels. According tothe 2001 census data, 12.8 percent in Blue Sky of people 15 years of age and over areself-employed – higher than Northern Ontario at 10.2 percent and Ontario at 11.4 percent.As Figure 16 indicates, Blue Sky communities clearly rank on the upper end of the self-employment scale compared to other Northern Ontario communities. 31
Figure 16
Source: Statistics Canada, Census of Canada, 2001, based on Form 2B.
Self-employment SummarySelf-employment is a growing job creator in Canada, with nearly two-thirds of self-
employed Canadians working in the service sector. In contrast, paid employment is lessprevalent than it once was in Canada. In this self-employment trend, Blue Sky communitiesare even further advanced than many other Northern Ontario communities.
30. Industry Canada, Overview of Canada’s Service Economy, March 2001, Queen’s Printer, p. 10. See alsoStatistics Canada, CANSIM, table 282-0002, July 31, 2002. For information on self-employment see G. Picot, A.,Heisz and A. Nakamura, Job Tenure, Worker Mobility and the Youth Labour Market During the 1990’s, No. 155,Research Paper Series, Analytical Studies Branch, Statistics Canada, pp. 5,6.31. Statistics Canada. 1986, 1991, 1996, 2001 Census, Form 2B. See also Chris Southcott. A Regional Outlook forNorthern Boards: A Northern Approach to Regional Labour Force Development, Dryden: Training Boards of NorthernOntario, 2000, p. 7.
Self Employed: 2001Population Aged 15 and Over
0%
5%
10%
15%
20%
Blind R
iver
Kapusk
asing
Timmins (
C)
Gr. Sudbury
(C)
Iroquois
Falls
Kirklan
d Lake
Espan
ola
Mattaw
a
Elliot L
ake (
C)
Cochran
e
North B
ay (C
)
Ontario
West N
ipiss
ing
Hailey
bury
New Lisk
eard
Parry S
ound
Blue Sky
Bonfield
% o
f Pop
ulat
ion

Blue Sky – Labour Market Study: HR Gap Analysis © 2005 Precision Management Catalysts Ltd. All rights reserved. 30
Incomes
Increasing Income in Blue SkyAccording to Census data, average Blue Sky household
income climbed from $42,309 to $48,284 from 1996 to 2001 (anincrease of $1,780.06 in real dollars after factoring in inflation.)Compared to selected Northern Ontario communities, Blue Sky'saverage household income was close to average, but lower thanOntario’s average, as reflected in Figure 17. Blue Sky averagehousehold incomes increased by 14.1 percent while Ontario’sincreased by 23.1 percent from 1996 to 2001. This does notmean wages are lower than other communities, but rather thatthe total of all household income is lower. Income includesemployment income, other income, and government transferpayments. The latter pulls the averages of household incomesdown. That means it is difficult to make wage-incomecomparison with Statistics Canada data because of fluctuations in transfer payments. 32
Figure 17
Source: Statistics Canada, Census of Canada, 2001, based on 20-percent sample data, Form 2B.
Similar WagesA comparison of Blue Sky wages to other Ontario communities confirms that local
employers pay similar wages to other Ontario communities. They also report that, as aresult, they have been able to recruit employees from other cities who like the fact thatincome goes further in Blue Sky on many items such as housing. For example, during thefourth quarter of 2004, an average detached bungalow cost $235,000 in Barrie but only$170,000 in North Bay. 33
32. See earlier note on comparisons between 1996 and 2001.33. Economic Partners, Sudbury East-West Nipissing. "Hourly Wage Survey," West Nipissing Community Profile,2003, p. 11. See also Economic Partners, Sudbury East-West Nipissing. "Hourly Wage Survey," Sudbury East –Markstay-Warren Community Profile 2003, p. 15. See also Economic Partners, Sudbury East. Hourly WageSurvey," Sudbury East Community Profile 2003, p. 10. See also Town of Hornepayne. "Hourly Wage Survey,"
Average Household Income: 1996 and 2001
$0$10,000$20,000$30,000$40,000$50,000$60,000$70,000
Mattaw
a
Elliot L
ake (
C)
West N
ipissing
Kirklan
d Lake
Blind R
iver
Parry S
ound
Hailey
bury
Blue Sky
Bonfield
Espan
ola
North B
ay (C
)
New Lisk
eard
Cochran
e
Iroquois
Falls
Timmins (
C)
Kapusk
asing
Gr. Sudbury
(C)
Ontario
19962001
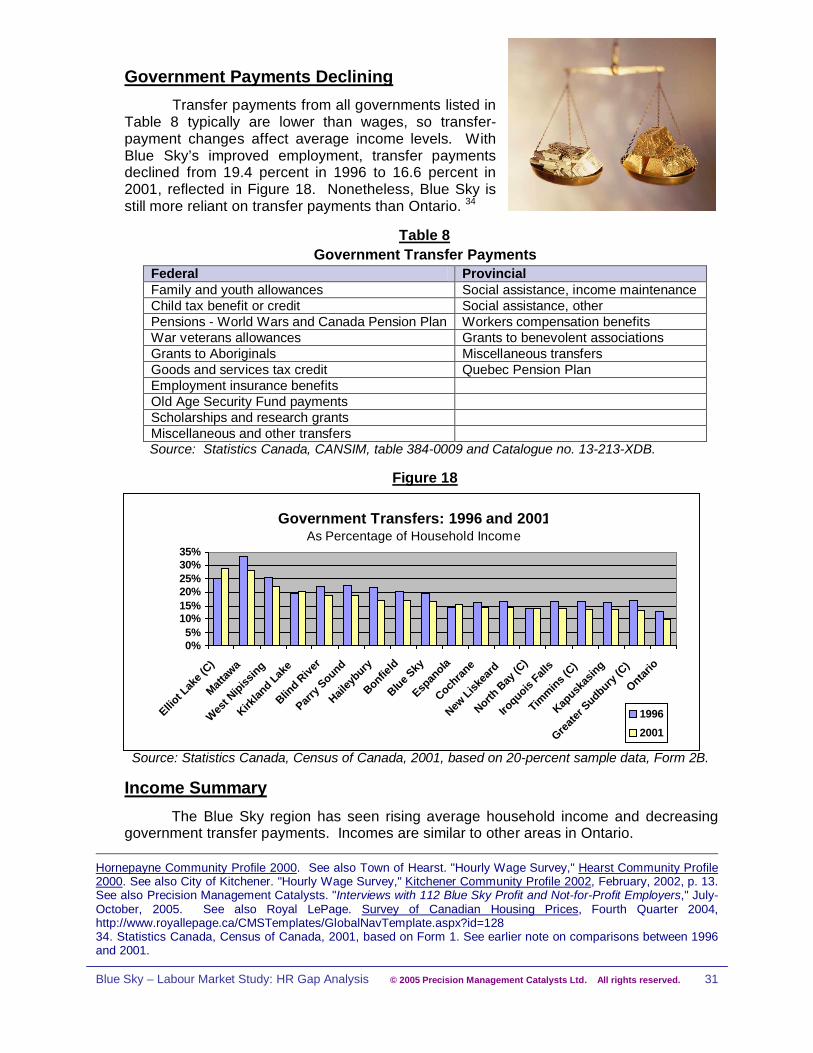
Blue Sky – Labour Market Study: HR Gap Analysis © 2005 Precision Management Catalysts Ltd. All rights reserved. 31
Government Payments DecliningTransfer payments from all governments listed in
Table 8 typically are lower than wages, so transfer-payment changes affect average income levels. WithBlue Sky’s improved employment, transfer paymentsdeclined from 19.4 percent in 1996 to 16.6 percent in2001, reflected in Figure 18. Nonetheless, Blue Sky isstill more reliant on transfer payments than Ontario. 34
Table 8Government Transfer Payments
Federal ProvincialFamily and youth allowances Social assistance, income maintenanceChild tax benefit or credit Social assistance, otherPensions - World Wars and Canada Pension Plan Workers compensation benefitsWar veterans allowances Grants to benevolent associationsGrants to Aboriginals Miscellaneous transfersGoods and services tax credit Quebec Pension PlanEmployment insurance benefitsOld Age Security Fund paymentsScholarships and research grantsMiscellaneous and other transfersSource: Statistics Canada, CANSIM, table 384-0009 and Catalogue no. 13-213-XDB.
Figure 18
Source: Statistics Canada, Census of Canada, 2001, based on 20-percent sample data, Form 2B.
Income SummaryThe Blue Sky region has seen rising average household income and decreasing
government transfer payments. Incomes are similar to other areas in Ontario.
Hornepayne Community Profile 2000. See also Town of Hearst. "Hourly Wage Survey," Hearst Community Profile2000. See also City of Kitchener. "Hourly Wage Survey," Kitchener Community Profile 2002, February, 2002, p. 13.See also Precision Management Catalysts. "Interviews with 112 Blue Sky Profit and Not-for-Profit Employers," July-October, 2005. See also Royal LePage. Survey of Canadian Housing Prices, Fourth Quarter 2004,http://www.royallepage.ca/CMSTemplates/GlobalNavTemplate.aspx?id=12834. Statistics Canada, Census of Canada, 2001, based on Form 1. See earlier note on comparisons between 1996and 2001.
Government Transfers: 1996 and 2001As Percentage of Household Income
0%5%
10%15%20%25%30%35%
Elliot L
ake (
C)
Mattaw
a
West N
ipissing
Kirklan
d Lake
Blind Rive
r
Parry S
ound
Hailey
bury
Bonfield
Blue Sky
Espan
ola
Cochran
e
New Lisk
eard
North B
ay (C
)
Iroquois
Falls
Timmins (
C)
Kapusk
asing
Greater
Sudbury (C
)
Ontario
19962001

Blue Sky – Labour Market Study: HR Gap Analysis © 2005 Precision Management Catalysts Ltd. All rights reserved. 32
Occupational Structure
Blue SkyTo gain an appreciation for the labour pool available to Blue Sky industry, a detailed
occupational profile was prepared for the “Greater Blue Sky Region” and an areaencompassing the Districts of Nipissing, Sudbury, Parry Sound, and the Greater SudburyDivision. This area represents the occupational catchment area for the Blue Sky region.Most of the communities in this area are within 100 kilometers of the Blue Sky region andworkers will travel this distance daily for employment. Comparisons are also made toNorthern Ontario and Ontario. Refer to Exhibits 1 through 10 at the end of this report. 35
The smaller region of Blue Sky proper has a higher percentage of jobs in trades,transport and equipment operators, and related occupations than Ontario. At 18.4 percent,this is the second largest category of occupations in Blue Sky, contrasting with Ontario's13.5 percent. The region has higher sales and services positions at 27.3 percent comparedwith Ontario's 23.7 percent, and has a higher percentage than Ontario in occupationsunique to primary industries, although less than the Northern Ontario average. Blue Skyalso has a higher percentage of health-related occupations. On the other hand, Blue Skyhas a lower percentage of processing, manufacturing, and utilities-based occupations,natural and applied sciences and related occupations, art, culture, recreation and sportrelated occupations, and business, finance, and administration occupations, as indicated onFigure 19, and in more detail on Table 9.
Figure 19
Employment by Occupation: 2001
11.4
18.3
7.1
2.9
2.7
8.8
4.3
7.6
1.7
27.8
18.1
6.0
10.9
4.3
6.0
8.0
1.8
27.3
18.4
3.3
4.8
13.5
23.7
6.8
4.8
4.6
5.7
14.9
9.4
15.4
0 5 10 15 20 25 30
Management
Business, finance, & admin.
Natural/applied sciences & related
Health
Social sci., educ., gov't service, & religion
Art, culture, recreation, & sport
Sales and service
Trades, transport/equip. operators, & related
Unique to primary industry
Unique to processing, manufacturing, & utilities
% of Workers in All Occupations
Blue SkyNorthern OntarioOntario
Source: Statistics Canada, Census of Canada, 2001, based on 20-percent sample data, Form 2B.
35. The profile was prepared from 2001 Census data using the Standard Occupational Classification (historical) withthe most detail available from Statistics Canada, four category levels with multiple sub-categories: the most generalone-digit level with 10 categories, the more specific two-digit level with 49 categories within each one-digit categorylevel, the three-digit level, with 140 sub-categories, and the most specific, four-digit level, with 520 sub-categories.

Blue Sky – Labour Market Study: HR Gap Analysis © 2005 Precision Management Catalysts Ltd. All rights reserved. 33
Table 92001 Occupational Structure
Blue Sky Proper NorthernOntario
OntarioOccupations
Total # ofWorkers
% of alloccup.
% of alloccup.
% of alloccup.
A Management occupations 5,590 10.9 9.4 11.4 A0 Senior managers 475 0.9 0.8 1.4 A1 Specialist managers 865 1.7 1.5 3.1 A2 Retail trade, food, accommodation-services managers 2,410 4.7 4.0 3.2 A3 Other managers, n.e.c. 1,855 3.6 3.0 3.6B Business, finance and administration occupations 7,890 15.4 14.9 18.3 B0 Professional occupations in business and finance 885 1.7 1.3 2.7 B1 Finance and insurance administration occupations 595 1.2 1.3 1.2 B2 Secretaries 1,400 2.7 2.5 2.0 B3 Administrative and regulatory occupations 760 1.5 1.5 2.1 B4 Clerical supervisors 235 0.5 0.5 0.6 B5 Clerical occupations 4,070 7.9 7.8 9.6C Natural and applied sciences and related occupations 2,210 4.3 4.3 7.1 C0 Professional occupations in natural and applied sciences 855 1.7 1.8 4.2 C1 Technical occupations related to natural and applied sciences 1,325 2.6 2.5 2.8D Health occupations 3,070 6.0 5.7 4.8 D0 Professional occupations in health 410 0.8 0.9 1.1 D1 Nurse supervisors and registered nurses 1,150 2.2 2.1 1.5 D2 Technical and related occupations in health 730 1.4 1.4 1.1 D3 Assisting occupations in support of health services 795 1.5 1.2 1.1E Social science, education, government service & religion occupations 4,125 8.0 7.6 6.8 E0 Judges, lawyers, psychologists, social workers, ministers of religion, and policy and program officers
820 1.6 2.1 2.2
E1 Teachers and professors 2,250 4.4 4.1 3.7 E2 Paralegals, social-services workers and occupations in education and religion, n.e.c.
1,055 2.1 2.0 1.8
F Occupations in art, culture, recreation and sport 905 1.8 1.7 2.9 F0 Professional occupations in art and culture 335 0.7 0.6 1.3 F1 Technical occupations in art, culture, recreation and sport 580 1.1 1.1 1.6G Sales and service occupations 14,020 27.3 27.8 23.7 G0 Sales and service supervisors 315 0.6 0.8 0.7 G1 Wholesale, technical, insurance, real estate sales specialists, and retail, wholesale and grain buyers
760 1.5 1.5 2.4
G2 Retail salespersons and sales clerks 2,245 4.4 4.1 3.9 G3 Cashiers 920 1.8 2.0 1.7 G4 Chefs and cooks 910 1.8 1.7 1.2 G5 Occupations in food and beverage service 925 1.8 2.0 1.6 G6 Occupations in protective services 1025 2.0 1.8 1.5 G7 Occupations in travel and accomm., including recreation/ sport attendants 230 0.4 0.8 0.8 G8 Child care and home support workers 1,190 2.3 2.2 1.6 G9 Sales and service occupations, n.e.c. 5,485 10.7 10.3 7.5H Trades, transport & equipment operators & related occupations 9,435 18.4 18.1 13.5 H0 Contractors and supervisors in trades and transportation 620 1.2 1.0 0.8 H1 Construction trades 1,145 2.2 2.5 2.0 H2 Stationary engineers, power station operators and electrical trades and telecommunications occupations
790 1.5 1.6 1.1
H3 Machinists, metal forming, shaping and erecting occupations 635 1.2 1.3 1.5 H4 Mechanics 1,455 2.8 3.2 2.1 H5 Other trades, n.e.c. 305 0.6 0.6 0.8 H6 Heavy equipment and crane operators, including drillers 615 1.2 1.5 0.5 H7 Transportation equipment operators & related workers, excluding labourers 2,500 4.9 4.7 3.1 H8 Trades helpers, construction/ transportation labourers & related occupat’ns 1,345 2.6 2.4 2.2I Occupations unique to primary industry 1,700 3.3 4.6 2.7 I0 Occupations unique to agriculture, excluding labourers 840 1.6 1.2 1.8 I1 Unique to forestry, mining, oil & gas extraction, fishing, excluding labourers 470 0.9 2.1 0.2 I2 Primary production labourers 400 0.8 1.3 0.7J Occupations unique to processing, manufacturing & utilities 2,440 4.8 6.0 8.3 J0 Supervisors in manufacturing 175 0.3 0.6 0.7 J1 Machine operators in manufacturing 1,185 2.3 2.4 3.0 J2 Assemblers in manufacturing 445 0.9 0.6 2.6 J3 Labourers in processing, manufacturing and utilities 590 1.1 1.7 1.9
Source: Statistics Canada, Census of Canada, 2001, based on 20-percent sample data, Form 2B.

Blue Sky – Labour Market Study: HR Gap Analysis © 2005 Precision Management Catalysts Ltd. All rights reserved. 34
The following sections spell out Blue Sky's 2001 employment by occupations.
Management OccupationsBlue Sky has a slightly higher percentage of
management occupations (10.9 percent) than NorthernOntario (9.4 percent) and a slightly lower percentagethan Ontario (11.4 percent.) Differences surface interms of senior managers, of which Blue Sky has fewer.The region has a higher percentage of restaurant, foodservice, and accommodation service managers thanboth Northern Ontario and Ontario.
Business, Finance and Administration OccupationsAs it is in Northern Ontario, Blue Sky has relatively
fewer business, finance, and administration occupations thanOntario, 15.4 percent compared to Ontario's 18.3 percent.Some of these occupations have higher percentages thanOntario, such as secretaries, but averages are lower in all othersubcategories.
Natural and Applied Sciences, and Related OccupationsIn Ontario, natural and applied sciences
and related occupations represent 7.1 percentof all jobs. In Blue Sky, these occupationsconstitute only 4.3 percent of the workforce,almost the same as in Northern Ontario.Whereas most of these occupations areprofessional in Ontario, in Blue Sky, most aretechnical.
Health-care OccupationsBlue Sky has a higher percentage of people
working in health-care occupations (6 percent) thanNorthern Ontario (5.7 percent) and Ontario (4.8 percent.)While, Blue Sky has lower percentages of health-careprofessionals such as physicians compared to Ontario,they have higher percentages of people working asnurses, technical, and related occupations in health, andassisting occupations in support of health-care services.
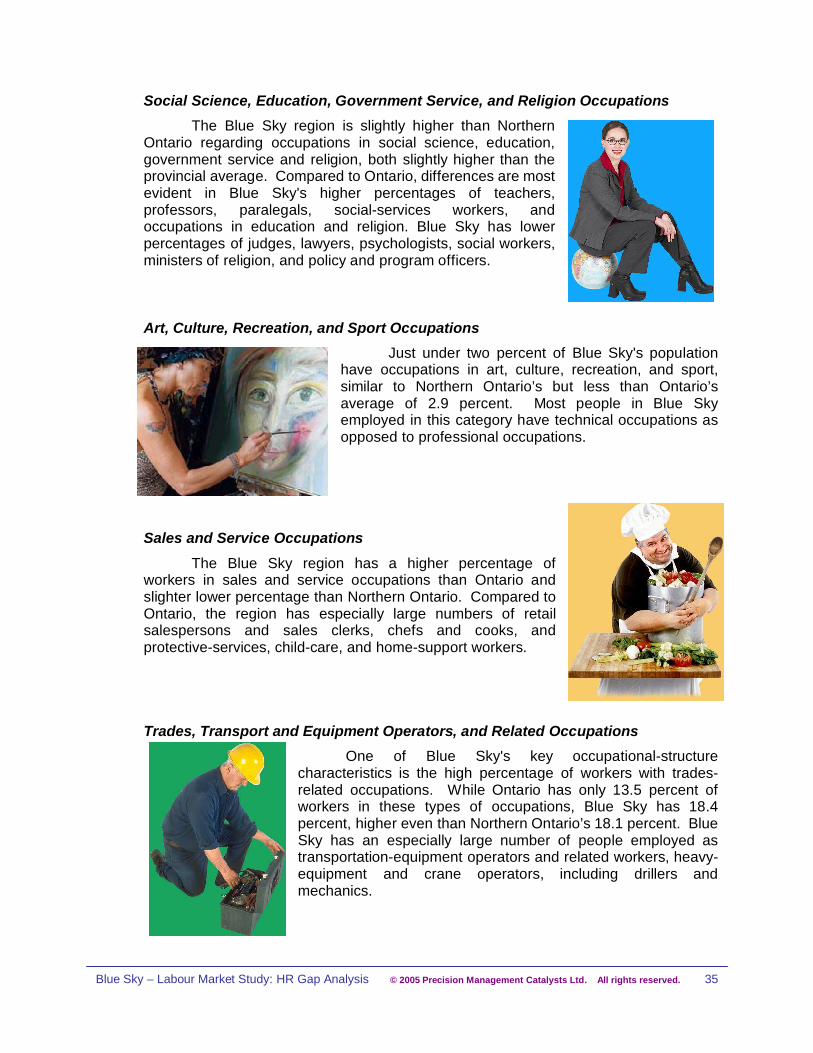
Blue Sky – Labour Market Study: HR Gap Analysis © 2005 Precision Management Catalysts Ltd. All rights reserved. 35
Social Science, Education, Government Service, and Religion OccupationsThe Blue Sky region is slightly higher than Northern
Ontario regarding occupations in social science, education,government service and religion, both slightly higher than theprovincial average. Compared to Ontario, differences are mostevident in Blue Sky's higher percentages of teachers,professors, paralegals, social-services workers, andoccupations in education and religion. Blue Sky has lowerpercentages of judges, lawyers, psychologists, social workers,ministers of religion, and policy and program officers.
Art, Culture, Recreation, and Sport OccupationsJust under two percent of Blue Sky's population
have occupations in art, culture, recreation, and sport,similar to Northern Ontario’s but less than Ontario’saverage of 2.9 percent. Most people in Blue Skyemployed in this category have technical occupations asopposed to professional occupations.
Sales and Service OccupationsThe Blue Sky region has a higher percentage of
workers in sales and service occupations than Ontario andslighter lower percentage than Northern Ontario. Compared toOntario, the region has especially large numbers of retailsalespersons and sales clerks, chefs and cooks, andprotective-services, child-care, and home-support workers.
Trades, Transport and Equipment Operators, and Related OccupationsOne of Blue Sky's key occupational-structure
characteristics is the high percentage of workers with trades-related occupations. While Ontario has only 13.5 percent ofworkers in these types of occupations, Blue Sky has 18.4percent, higher even than Northern Ontario’s 18.1 percent. BlueSky has an especially large number of people employed astransportation-equipment operators and related workers, heavy-equipment and crane operators, including drillers andmechanics.

Blue Sky – Labour Market Study: HR Gap Analysis © 2005 Precision Management Catalysts Ltd. All rights reserved. 36
Unique to Primary Industry OccupationsOccupations in the
broad occupational categoryof unique to primary industryare principally concerned withoperating and supervisingfarms, fishing operations, oiland gas production, andforestry and logging.
Blue Sky has a slightlylarger percentage of theseoccupations than Ontario butconsiderably less than theaverage for Northern Ontario.Respectively for Blue Sky,Northern Ontario, and Ontario, the percentages are 3.3, 4.6, and 2.7 percent. Within thiscategory, Blue Sky has higher levels of occupations in forestry and mining than Ontario.
Processing, Manufacturing, and Utilities OccupationsBlue Sky has a significantly
lower percentage of peopleemployed in occupations unique toprocessing, manufacturing, andutilities than both Northern Ontarioand Ontario. Indeed this is anotherunique characteristic of the region’soccupational structure. This is nodoubt explained by the relativeabsence of manufacturing in thearea.
Occupational Structure SummaryTraditionally, Blue Sky has had more jobs in trades, but now, jobs in services have
inched their way to first position. Compared to Ontario, the region has a higher percentageof jobs in trades, transport and equipment operators, sales and services, unique to primaryindustries, and health care. It has a lower percentage of occupations in processing,manufacturing, utilities-based, natural and applied sciences, art, culture, recreation, sports,business, finance, and administration. Compared to the rest of Northern Ontario, Blue Skyhas less processing, manufacturing, utilities-based, and sales-and-service occupations andmore management, business, finance, and administration occupations.

Blue Sky – Labour Market Study: HR Gap Analysis © 2005 Precision Management Catalysts Ltd. All rights reserved. 37
Blue Sky's Employment by Industry: 2001
Tertiary78.7%
Primary4.6%
Secondary16.7%
Demand for Labour
To determine Blue Sky’s labour demand, it is important to examine the industriesproviding the occupations. In Table 10 and Figure 20, Statistics Canada's three broad industrycategories are highlighted: primary, secondary, and tertiary. Note that employment by industrydiffers from employment by occupation in the previous section. While occupation classificationsfocus on skill sets of Blue Sky residents, industry classifications focus on employer types. Forexample, a mining company may employ a labourer, an electrician, and a bookkeeper. Underoccupation categories, the jobs are listed under three different categories, but under industryclassification, all three jobs are listed under only one, primary industry. Looking at the numbersa second way provides an outlook of what types of industries operate in the Blue Sky region andhow many each employs.
Table 10Employment by Industry, 2001
Blue Sky and OntarioBy Industry # of Jobs in
Blue Sky% of Jobs in
Blue Sky% of Jobsin Ontario
Total All Industries 51,355 100.0 % 100.0 %Primary Total 2,355 4.6 % 3.9 %Agriculture, forestry, fishing/hunting 1,330 2.6 % 2.8 %Mining and oil/gas extraction 480 0.9 % 0.4 %Utilities 545 1.1 % 0.7 %Secondary Total 8,555 16.7 % 22.2 %Construction 3,790 7.4 % 17.6 %Manufacturing 4,765 9.3 % 4.6 %Tertiary Total 40,460 78.7 % 73.9 %Health care and social assistance 6,130 11.9 % 10.2 %Retail 7,105 13.8 % 11.4 %Public administration 4,060 7.9 % 6.3 %Accommodation and food 4,455 8.7 % 6.1 %Education 3,965 7.7 % 6.6 %Transportation and warehousing 3,500 6.8 % 4.7 %Wholesale 1,420 2.8 % 4.6 %Finance and insurance 1,490 2.9 % 3.8 %Professional, scientific, technical 1,770 3.4 % 5.9 %Real estate and rental/leasing 720 1.4 % 1.4 %Other services 5,845 11.4 % 12.9 %
Source: Statistics Canada, Census of Canada, 2001, based on Form 2B.
Figure 20
Source: Statistics Canada, Census of Canada, 2001, based on Form 2B.
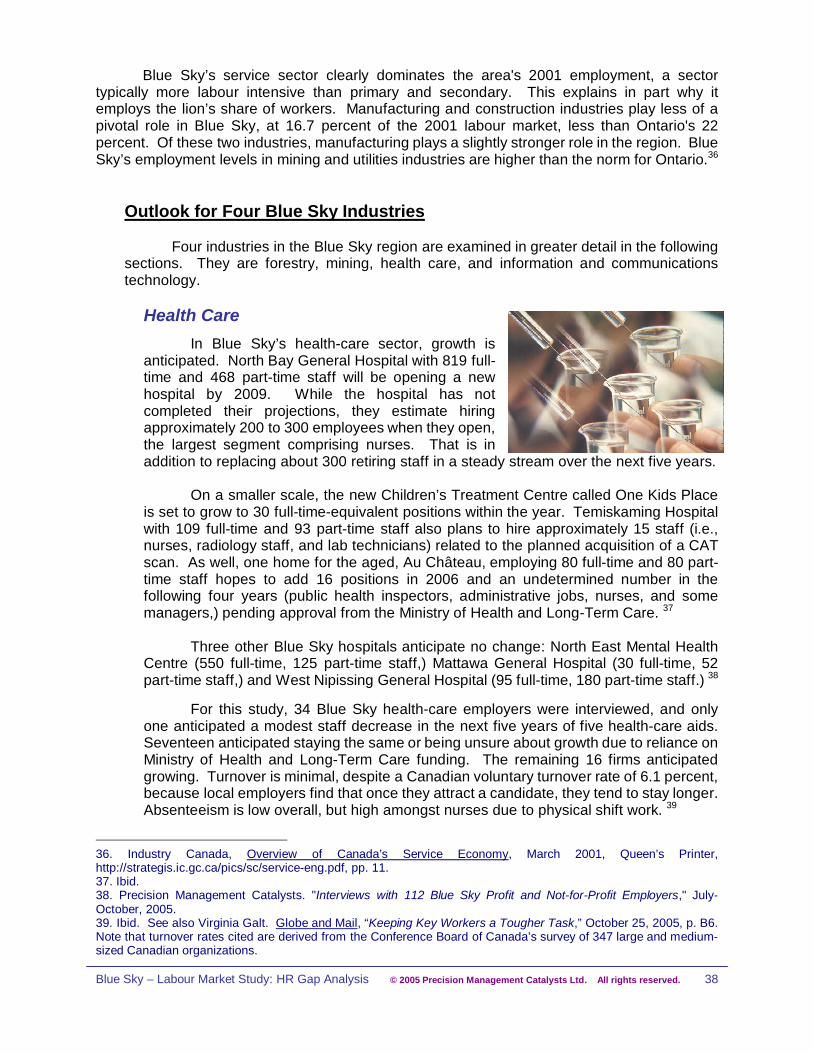
Blue Sky – Labour Market Study: HR Gap Analysis © 2005 Precision Management Catalysts Ltd. All rights reserved. 38
Blue Sky’s service sector clearly dominates the area's 2001 employment, a sectortypically more labour intensive than primary and secondary. This explains in part why itemploys the lion’s share of workers. Manufacturing and construction industries play less of apivotal role in Blue Sky, at 16.7 percent of the 2001 labour market, less than Ontario's 22percent. Of these two industries, manufacturing plays a slightly stronger role in the region. BlueSky’s employment levels in mining and utilities industries are higher than the norm for Ontario.36
Outlook for Four Blue Sky Industries
Four industries in the Blue Sky region are examined in greater detail in the followingsections. They are forestry, mining, health care, and information and communicationstechnology.
Health CareIn Blue Sky’s health-care sector, growth is
anticipated. North Bay General Hospital with 819 full-time and 468 part-time staff will be opening a newhospital by 2009. While the hospital has notcompleted their projections, they estimate hiringapproximately 200 to 300 employees when they open,the largest segment comprising nurses. That is inaddition to replacing about 300 retiring staff in a steady stream over the next five years.
On a smaller scale, the new Children’s Treatment Centre called One Kids Placeis set to grow to 30 full-time-equivalent positions within the year. Temiskaming Hospitalwith 109 full-time and 93 part-time staff also plans to hire approximately 15 staff (i.e.,nurses, radiology staff, and lab technicians) related to the planned acquisition of a CATscan. As well, one home for the aged, Au Château, employing 80 full-time and 80 part-time staff hopes to add 16 positions in 2006 and an undetermined number in thefollowing four years (public health inspectors, administrative jobs, nurses, and somemanagers,) pending approval from the Ministry of Health and Long-Term Care. 37
Three other Blue Sky hospitals anticipate no change: North East Mental HealthCentre (550 full-time, 125 part-time staff,) Mattawa General Hospital (30 full-time, 52part-time staff,) and West Nipissing General Hospital (95 full-time, 180 part-time staff.) 38
For this study, 34 Blue Sky health-care employers were interviewed, and onlyone anticipated a modest staff decrease in the next five years of five health-care aids.Seventeen anticipated staying the same or being unsure about growth due to reliance onMinistry of Health and Long-Term Care funding. The remaining 16 firms anticipatedgrowing. Turnover is minimal, despite a Canadian voluntary turnover rate of 6.1 percent,because local employers find that once they attract a candidate, they tend to stay longer.Absenteeism is low overall, but high amongst nurses due to physical shift work. 39
36. Industry Canada, Overview of Canada’s Service Economy, March 2001, Queen’s Printer,http://strategis.ic.gc.ca/pics/sc/service-eng.pdf, pp. 11.37. Ibid.38. Precision Management Catalysts. "Interviews with 112 Blue Sky Profit and Not-for-Profit Employers," July-October, 2005.39. Ibid. See also Virginia Galt. Globe and Mail, “Keeping Key Workers a Tougher Task,” October 25, 2005, p. B6.Note that turnover rates cited are derived from the Conference Board of Canada’s survey of 347 large and medium-sized Canadian organizations.

Blue Sky – Labour Market Study: HR Gap Analysis © 2005 Precision Management Catalysts Ltd. All rights reserved. 39
Local health-care employers report that while they have been able to successfullyattract employees from the area and even other parts of Canada to fill their needs, themarket for nurses is highly competitive. This may change if the Government of Ontarioimplements its program of providing free tuition to nurses who begin their careers inunder-serviced communities. (The Ministry of Health and Long-Term Care’s Under-serviced Area Program in partnership with the Nursing Secretariat is currentlydeveloping the program.) The following is a list of workers that the 34 Blue Sky health-care employers interviewed for this study find challenging to recruit. 40
Health-care Recruitment Challenges
n registered nurses n personal support workersn registered practical nurses n service managersn nurses with specialties n food-service workersn nursing managers n cooks with papersn doctors n speech-language pathologistsn pharmacists n behavioural-science positionsn managers in all areas n bilingual Masters-level child & family therapistsn technicians n candidates with social work degreesn respiratory therapists n public health inspectorsn nuclear / ultra sound specialists n epidemiologists
Meanwhile, employers expect that the problem will be heightened withretirements creeping up over the next five years due to an aging workforce. Forexample, 30 to 40 percent of North Bay General Hospital’s nurses will retire in the nextfive years (their average age is 47.) There is also a smaller yet noticeable and growinggap between doctor supply and demand, as they too are aging. For example, out of 114North Bay doctors, 64 are over 45 years old, and 19 are 60 and older. While lifestyleattracts some doctors and nurses to the area, the current gap between supply anddemand will likely widen as the hospital comes on board and other employers expand. 41
Training for Health Care
Of the 34 health-care respondents, few reported any training gaps becausemany employers either work with the colleges and universities or offer in-housetraining. One employer requested an increased course frequency in North Bayfor Advanced Cardiac Life Support certification. 42
Overall, with a new hospital and many health-care organizations, Blue Sky’shealth-care industry is anticipated to remain strong. Demand will increase, and while theindustry will grow in some areas; overall, a good part of it will remain in a neutral growthstate due to government funding.
40. Precision Management Catalysts. "Interviews with 112 Blue Sky Profit and Not-for-Profit Employers," July-October, 2005. See also Ministry of Health and Long-term Care. “Tuition Support Program for Nurses,” on-lineavailable at http://www.health.gov.on.ca/english/providers/ministry/recruit/tuition_nurs.html, November 5, 2005.41. Precision Management Catalysts. "Interviews with 112 Blue Sky Profit and Not-for-Profit Employers," July-October, 2005. See also Statistics Canada. Shaping the Nation's Workforce: Immigrants, Demand for Skills, and anAging Population, http://www12.statcan.ca/english/census01/Products/Analytic/companion/paid/canada.cfm#5,October 15, 2005. See also Dave Dale. North Bay Nugget, “Doctor Recruitment Paying Off,” August 8, 2005, pp.A1-A2.42. Precision Management Catalysts. "Interviews with 112 Blue Sky Profit and Not-for-Profit Employers," July-October, 2005.

Blue Sky – Labour Market Study: HR Gap Analysis © 2005 Precision Management Catalysts Ltd. All rights reserved. 40
ForestryThe Canada-U.S. softwood lumber
dispute has been impacting negatively onthe forestry industry. While both partieshave been unshakable in their positions,NAFTA ruled that the U.S. CommerceDepartment must re-calculate wood-importduties. Nonetheless, the path to resolutionis not clear since the heart of the dispute,Canada's system of stumpage fees forCrown land, is not anticipated to change.As a result of this ongoing dispute, salesrevenue has decreased, leading to anoversupply of lumber in Canada and,therefore, to reduction of operations, suchas Tembec's five-week shut down at threemills in 2003 and Abitibi’s recentlyannounced shut down of a Newfoundlandmill and reduction of Ontario newsprintmanufacturing. Currently, Tembec isspearheading a campaign to convince thefederal government to assist industry with loan guarantees. The Ontario Governmentalso provides this assistance and announced $330-million in aid to Columbia ForestProducts in Rutherglen. Nevertheless, the company still scaled back to two shifts andlaid off approximately 90 workers in October, 2005. 43
Blue Sky forestry employers find it particularly challenging to entice new workersinto the sector. In particular, the 17 forestry employers of various sizes interviewed forthis study have a challenge finding the following workers. 44
Forestry Recruitment Challenges
n candidates with field experience n forestry-product marketing skillsn accountants n wood-science technology personn trades people n lumber gradern millwrights n shippersn electricians n certified operatorsn mechanical harvest operators n delimber operatorsn heavy-equipment operators n feller bunchersn architectural designers n machine maintenance workers
43. See also Jonathan Fowlie. The Globe and Mail, "Stumpage at Heart of Dispute," August 14, 2003, p. B4. Seealso Karole Dumont-Beckett. "Five-week Shut Down at Some Tembec Mills," Labour Market Bulletin, HumanResource Centre of Canada, North Bay, May, 2003, p. 2. See also Society of American Foresters. “NAFTA RulesUnited States Not Harmed by Canadian Softwood,” from October 2004 issue of The Forestry Source, on-lineavailable November 6, 2005 at http://www.safnet.org/archive/1004_nafta.cfm. See also Liz Cowan. BusinessJournal. “Support Sought for Softwood Fight,” November, 2005, pp. 1-2. See also Gord Young. North Bay Nugget,“Columbia to Lay Off 90 Workers,” August 11, 2005, pp. A1-A2. See also Gord Young. North Bay Nugget, “ForestryAid Package Not Enough,” September 30, 2005, pp. A1, A4. See also Bertrand Marotte, Globe and Mail, “AbitibiAnnounces Shutdowns as Forestry Slump Drags On,” July 28, 2005, pp. B1, B4. See also Daniel Leblanc. Globeand Mail, “Martin Takes Trade Message to Radio Airwaves,” October 31, 2005, p. A6. See also Ministry of NaturalResources. Loan Guarantee Program, on-line available November 6, 2005 athttp://ontariosforests.mnr.gov.on.ca/sector.cfm.44. Precision Management Catalysts. "Interviews with 112 Blue Sky Profit and Not-for-Profit Employers," July-Oct.,2005.
Image Source: Doug Page, USDA Forest Service,www.forestryimages.org

Blue Sky – Labour Market Study: HR Gap Analysis © 2005 Precision Management Catalysts Ltd. All rights reserved. 41
Of the 17 Blue Sky forestry respondents, one laid off 90 workers this fall(Columbia as noted earlier.) Over the next five years, another one may lay off four tofive labourers, one will reduce staff through attrition, one will lay off about eight workers,and one may close due to succession. Of the group, eight anticipated remaining thesame or being unsure about growth due to the industry’s environment. Only fourorganizations anticipated growth, and that was minimal. Hiring due to retirements will beminimal because most respondents report a range of ages for their staff. Hiring due toturnover will also be minimal since most respondents report low voluntary turnovercompared to the already low 4.1 percent industry average. Absenteeism is also low. 45
Training for Forestry
Of the 17 forestry respondents, only two reported training gaps betweenwhat they want to offer their staff and what is available locally, and that was for acourse in mechanical harvesting and one for lumber grader. 46
Overall, the Blue Sky forestry outlook is not expected to improve until a resolutionto the current softwood dispute is found. In the meantime, it is likely to decline slightlywhile the market continues to adjust to the dispute.
MiningThere are a number of Blue
Sky employers in the miningindustry. One of the largest,Cementation (600 full-time staff,named Business of the Year in2005 by the North Bay and DistrictChamber of Commerce) anticipatessteady hiring of 60 to 90 staff overthe next five years. Other largeemployers include Boart Longyear(255 full-time staff,) Atlas CopcoCanada (119 full-time staff,)McIntosh Engineering Ltd. (150 full-time staff,) ETI (100 full-time staff,)and Redpath Group (100 full-timestaff.) 47
45. Precision Management Catalysts. "Interviews with 112 Blue Sky Profit and Not-for-Profit Employers," July-Oct.,2005. See also Virginia Galt. Globe and Mail, “Keeping Key Workers a Tougher Task,” October 25, 2005, p. B6.Note that the turnover rates cited are derived from the Conference Board of Canada’s survey of 347 large andmedium-sized Canadian organizations.46. Precision Management Catalysts. "Interviews with 112 Blue Sky Profit and Not-for-Profit Employers," July-Oct.,2005.47. Ibid. See also Brandi Cramer. North Bay Nugget, “Cementation Named Business of the Year,” November 19,2005, p. A3.

Blue Sky – Labour Market Study: HR Gap Analysis © 2005 Precision Management Catalysts Ltd. All rights reserved. 42
In all, 32 Blue Sky mining organizations of various sizes were interviewed for thisstudy, and only one anticipated some layoffs. Of the group, 13 anticipated remaining thesame or being unsure about growth. One small company surveyed, J&J Machine Worksthat concentrates on the mining industry has plans to expand service into the forestryindustry by rebuilding and refurbishing chipper wheels. The remaining 18 organizationsanticipated growing over the next five years. 48
Examples of this growth include Cementation that hopes to add 60 to 90 staff toits roster of 600 full-time employees (five to 10 administrative staff, 40 to 60 tradespeople such as electricians and miners, and 15 to 25 designers and engineers.) G & PWelding & Iron Works, with 65 full-time staff, hopes to hire 10 to15 welder fitters andwelders. And, Redpath (100 full-time staff) hopes to hire 10 people for office work,electrical, and heavy-duty mechanical work. Other potential hires collectively include 19to 27 machinists, 20 engineers and heavy-structural designers, 10 untrained orapprenticing youths, 10 technical and skilled workers for the field, 9 to 12 sales oradministrative workers, 10 to 12 trades people, and three to five labourers. 49
Most of the mining respondents reported exceptionally low voluntary turnoverwith a number of them reporting none, and one reporting only one percent. Only oneemployer reported average turnover (Canadian average 4.1 percent.) Absenteeism isalso very low. Respondents also reported a low number of expected retirements in thenext five years, with age not becoming a factor for 10 to 15 years. The challenges forBlue Sky mining employers include recruiting the following types of workers. 50
Mining Recruitment Challenges
n welders n skilled tradesn Auto CAD draftsman n skilled instrument techniciansn engineers n hydraulic/pneumatic knowledgeable staffn machinists n computer numeric-controlled machining skillsn mechanics n senior management engineersn fabricators n professional mechanical engineern drillers n customer-service with technical backgroundn prospectors n civil and mechanical engineersn stakers n heavy-structural designersn line cutters n blasting techniciansn geologists n general maintenancen accountants n heavy-duty mechanicsn electricians
48. Ibid.49. Ibid.50. Brandi Cramer. North Bay Nugget, “Broadening the Scope,” September 20, 2005, p B1. See also Osprey NewsNetwork. Business Journal, “J&J Machine Works has Plans to Grow,” November, 2005, p. 27. See also VirginiaGalt. Globe and Mail, “Keeping Key Workers a Tougher Task,” October 25, 2005, p. B6. Note that the turnoverrates cited are derived from the Conference Board of Canada’s survey of 347 large and medium-sized Canadianorganizations. See also Precision Management Catalysts. "Interviews with 112 Blue Sky Profit and Not-for-ProfitEmployers," July-Oct., 2005.

Blue Sky – Labour Market Study: HR Gap Analysis © 2005 Precision Management Catalysts Ltd. All rights reserved. 43
Training for Mining
Of the 32 mining respondents, 21 report no training gaps between whatthey want to offer their staff and what is available locally. Ten train staff in-house, and six send staff out of town for training. To fill the gaps, respondentsmade the following suggestions: add Auto CAD courses and electrical programsto the college’s offerings. One employer also asked for mechanical and electricalengineering training locally. Note that Canadore College announced inNovember, 2005 the addition of a state-of-the-art electrical and plumbinglaboratory, which will soon address some of these needs. 51
Overall, Blue Sky’s mining industry is tied to the state of the economy and isanticipated to remain strong and grow in a healthy economy.
Information and Communications TechnologyCanadian’s information and
communications technology (ICT)sector is a powerful driver to theCanadian economy, ubiquitous inbusinesses, schools, and homes.(ICT encompasses three sectors:computer and electronicmanufacturing, computer-systemsdesign and related services, andtelecommunications services.)Despite the tech-bubble burst of2000, ICT is starting to surgeahead. For example, theConference Board of Canada noted considerable improvement in the last two years, withthe industry reporting double-digit growth in real exports. 52
In the last couple of years, ICT firms moved into a sustainable growth stage.Real output for Canadian ICT has surpassed its 2000 peak, with a healthy 4.6 percentgrowth rate. And with this growth, has come a renewed demand for skilled IT workers.In turn, this demand has created competition for staff, evidenced by a high 7.9 percentvoluntary-turnover rate for Canada’s high technology sector. (The rate is lower forCanadian communications and telecommunications at 4.3 percent.) 53
51. Ibid. See also Brandi Cramer. North Bay Nugget, “Canadore to Build New Electrical and Plumbing Lab,”November 9, 2005, p. A3.52. Michael Burt. Canada’s Information Technology Communications Industry: Industrial Outlook, Ottawa, TheConference Board of Canada, Spring 2005, pp.1-2.53. Derek Sankey. North Bay Nugget, “Tech Rebound Spurs Demand for IT Expertise,” September 24, 2005, p. C1.See also Virginia Galt. Globe and Mail, “Keeping Key Workers a Tougher Task,” October 25, 2005, p. B6. Note thatthe turnover rates cited are derived from the Conference Board of Canada’s survey of 347 large and medium-sizedCanadian organizations. See also Software Human Resource Council Expert Panel. Canada’s InformationTechnology Labour Market 2005: Issues and Opinions, June 2005, p. 1, on-line available October 15, 2005 athttp://www.shrc.ca/lmi/expert_panel/index.html#1.

Blue Sky – Labour Market Study: HR Gap Analysis © 2005 Precision Management Catalysts Ltd. All rights reserved. 44
Unlike the Canadian average, 29 of Blue Sky ICT firms interviewed for this studyhave low turnover and very low absenteeism. Once employees are hired, they tend tostay in their positions for a long time. However, Blue Sky employers report growthacross the board, so there is a growing need for new staff in addition to their existingchallenges of recruiting the following types of workers. 54
ICT Recruitment Challenges
n IT certified candidates n sales peoplen senior IT professionals n electronics techniciansn basic programmers n workers with voice over Internet protocol skillsn high-end programmers n workers with expertise in higher mathn Unix and Linux skilled workers n workers with run-time expertisen design engineers n workers with computer language expertise
Not one of the ICT respondents anticipated layoffs. Of the group, 13 anticipatedremaining the same or being unsure about growth. The remaining 16 organizationsanticipated growing. Projected growth rates ranged from 15 to 50 percent, withcompanies such as Cutsey Business Systems with a full-time staff of 40 hoping toincrease staff by 25 to 50 percent, and Stroma Consulting looking at a 50-percentincrease, with the addition of 17 senior-level IT professionals. 55
Training for ICT
Of the 29 ICT respondents, 12 report no training gaps between what theywant to offer their staff and what is available locally. Six send staff to Toronto fortraining, two more use on-line and CD training, and seven train their own staff.Only four suggested adding courses locally: programming in different computerlanguages, software training (e.g., flash,) and network courses. 56
Demand SummaryBlue Sky has more employment in primary industry than
Ontario, but that segment is smaller than other Blue Sky industries.Blue Sky’s service sector accounts for approximately three-quarters of all employment. Four industries were analysed for thisstudy: health care, forestry, mining, and information and
communications technology. Within these sectors, there is great demand for skilled trades,nurses, doctors, senior IT employees, and other workers. Future Blue Sky labour demandwill be dictated in part by the local industry outlooks as noted below.
Blue Sky s Outlook for 4 Industries• Health care: Growth (supply limited by Ministry funding)• Mining: Growth• ICT: Growth• Forestry: Decline
54. Precision Management Catalysts. "Interviews with 112 Blue Sky Profit and Not-for-Profit Employers," July-Oct.,2005.55. Ibid.56. Ibid.
Blue Sky – Labour Market Study: HR Gap Analysis © 2005 Precision Management Catalysts Ltd. All rights reserved. 45
Trends
Northern OntarioThe following long-term trends in Northern Ontario
have been identified in previous research, most of themthrough the use of census data. 57
• Slow population growth• High youth out-migration• Aging population• Lower education and literacy levels• Decline in industrial employment• Increase in service-sector employment• Increase in self-employment, part-time, and contract work
Initial analyses from a series of 2001 census reports indicate many of these trendsare continuing in Northern Ontario. 58
Blue SkyFor Blue Sky, specifically, the following trends have been identified through Census
2001 data and interviews with area employers:
• Slow population growth• High youth out-migration• Aging population• Decline in primary employment• Increase in service-sector employment• Increase in educational levels amongst youth• Low education amongst older residents• High rate of bilingualism• Low turnover• Low absenteeism (points to motivated workforce)
Additionally, Blue Sky trades some of its workforce with neighbouring communities.For example, some smaller Blue Sky communities indicate they are bedroom communitiesfor North Bay and Sudbury with skilled workers commuting across the region’s boundaries.The hospitals provide one good example of the labour-pool exchange. Forty-two of NorthBay General Hospital's employees live in West Nipissing and further west while 26 of WestNipissing General Hospital's employees live outside West Nipissing. Convenientgeography allows for a two-way exchange of labour. 59
57. Chris Southcott. A Regional Outlook for Northern Boards: A Northern Approach to Regional Labour ForceDevelopment, Northwest Training and Adjustment Board, Dryden, Ontario, 2000.58. Chris Southcott. Social and Economic Change in the Muskoka, Nipissing, and Parry Sound Regions: 2001Census Summary, January 5, 2004.59. Corporate Affairs International. West Nipissing Positioning Plan, May, 2003, Montreal, pp. 37, 38. See alsoPrecision Management Catalysts. "Interviews with 112 Blue Sky Profit and Not-for-Profit Employers," July-October,2005.

Blue Sky – Labour Market Study: HR Gap Analysis © 2005 Precision Management Catalysts Ltd. All rights reserved. 46
Many Blue Sky labour-market trends are mirrored inother parts of Northern Ontario. The differences lay in itscontinued motivated workforce, its trend to maintaining a highrate of bilingualism, its growing school-enrolment rates, andits growing labour-pool exchange with Sudbury, one ofNorthern Ontario's five major centres, located conveniently onthe west side of the region. Ultimately, this adds up to astrong workforce, all in a community that marries lifestyle andliving in an unspoiled natural environment with the creaturecomforts of urban amenities close by.
Future Directions
"Obstacles are those frightful things you see when you take your eyes off your goal." – Henry Ford
Employers SuggestionsBlue Sky employers in the four industries studied were asked what suggestions they
had to improve their recruitment and selection efforts over the next five years. Someemployers were satisfied and had no suggestions. Feedback for each of the four Blue Skyindustries studied is listed on the following pages. 60
60. Precision Management Catalysts. "Interviews with 112 Blue Sky Profit and Not-for-Profit Employers," July-October, 2005.

Blue Sky – Labour Market Study: HR Gap Analysis © 2005 Precision Management Catalysts Ltd. All rights reserved. 47
Health CareOf the 34 respondents, 12 had the following suggestions:
n Pitch health-care careers earlier in high school and even to elementary-school students.
n Prepare people for workforce by teaching them work ethics and work responsibility, taking initiative,and the basics such as knowing to arrive ten minutes before work, not the minute the clock starts.
n Offer a public-health-inspection degree at Nipissing University.
n Offer masters degrees in social work & behavioural science and undergraduate degree for the latter.
n Emphasize native studies in social-service and health-care programs at the college and university.
n Provide us with lists of college graduates interested in working here.
n Send us college students from dietary and medical programs.
n Increase the number of graduating pharmacists and doctors, and continue Ministry of Health’sprogram for Northern Ontario allowance for doctors, occupational therapists, and clinical staff.
n Offer free nursing tuition. Registered practical nurses would upgrade to registered nurse with thatincentive.
n Offer municipal incentives for doctor recruitment (e.g., housing, secretary, and office.) Examineprovincial calculations for what constitutes under-serviced areas; apparently, we have too manydoctors for our population, but we can’t even vacation without unloading work on the other three.
n Cater class times and workloads to suit people who work full time, especially shift work.
n Support an on-line program for people in the field to submit resumes.
ForestryOf the 17 respondents, six had the following suggestions.
n Partner with us for university and college program design so courses fit our industry and needs.
n Increase research funding to develop value-added wood products because we ship a lot of lumberout of the area.
n Ease up on workmen’s compensation allowances.
n Teach basic accounting skills directly in our town.
n Increase Canadore College’s wood-technology curriculum. Also, encourage governments such asMNR, WSIB to work together because separate government regulations kill small business.
n Sponsor a couple of people to take lumber grader courses.

Blue Sky – Labour Market Study: HR Gap Analysis © 2005 Precision Management Catalysts Ltd. All rights reserved. 48
MiningOf the 32 respondents, 14 did not have any suggestions. The remaining 12 had
the following comments:
n Promote the trades better.
n Emphasize the trades more at the junior high-school level.
n Promote benefits of trades to children when they make career choices. Trades are viewed as non-glamorous careers, despite six-figure incomes. Also mirror southern college programs’ intensityhere.
n Promote trades skills to women and earlier to students in general. Introduce a local engineeringschool. Also, streamline government labour programs. Governments should communicate witheach other, candidate-approval process should be easier and quicker, and repayments should berepaid promptly. We would also like to partner with the college.
n Continue emphasizing trades. Also keep the tax credit to train people in trades. Other fundingsystems are onerous because reporting is prohibitive (e.g., very time consuming.)
n Provide classes in trades such as electrical, machining, welding, and other apprenticeship programs.
n Offer electrical courses at the college as they do for other trades.
n Introduce Auto CAD more regularly and provide general computer skills.
n Add computer numeric controlled training to Canadore College’s in-shop machinists program.
n Offer courses that teach heavy-structural designers what to expect in the field.
n Offer more language courses to address our global markets.
n Re-institute Canadore College’s robotics computer technicians program.
n Bring back Canadore College’s blaster training similar to mining-field operations like Sir SanfordFleming College so we can access new recruits.
n We would be willing to partner with the local college to work on drafting and welding programs.
n Offer GIS computer skills and Auto CAD. Also, reverse government land-use restrictions so that wekeep our geologists and other trained mining labour. Mines are clean, safe, and environmentallysound now. We are world leaders in mining technology – lots of our people work around the world.
n Teach life skills (how to talk to people such as co-workers, management, subordinates, clients,) in-depth safety skills, and attitude skills (how to work at being a good employee.)
n The college should work with us to engineer some of our products (e.g., testing, material analysis.)
n Give welders and mechanics hands-on experience while they attend school.

Blue Sky – Labour Market Study: HR Gap Analysis © 2005 Precision Management Catalysts Ltd. All rights reserved. 49
Information and Communications TechnologyOf the 29 respondents, only eight provided the following comments:
n Increase IT and network training to update IT graduates.
n Provide courses for computer languages that address database-driven web sites rather than HTMLskills, and stop competing with us by providing student IT services from college professor’s businessand University of Nipissing’s research services.
n Allow us to influence college and university curriculum more appropriately by sharing student-qualification information under the business and IT programs.
n Improve CTS’s mandate (they won the HRSDC job-service contract) to allow us to postadvertisements and allow us to provide workshops.
n Provide more in depth IT courses locally, and approach me to take on co-op students.
n Provide a list of potential candidates when I recruit.
n Develop a specialized course under the electrical apprenticeship for telecommunications and datacommunications.
n Implement the electronics engineering technician course.
RecommendationsThe findings of this study help to identify the types of jobs where there are current
and will be future gaps in Blue Sky’s labour market. After examining these gaps in tandemwith listening to local employers’ needs, we make the following recommendations to helppoint Blue Sky towards the road to improving its labour market and local economy.
Continue to Enhance Local Educational OfferingsGovernments and education recognize the need to address skills gaps with
education and have been putting their money to work. For example, the FederalGovernment announced $3.7 million in spending to address these issues and promotetraining for skilled trades in sectors such as mining and Canadian wood manufacturing.Further development of skilled trades includes Canadore College’s announcement of aplanned state-of-the-art electrical and plumbing laboratory. Continue this good work byconsidering addressing employers’ requests for training and education listed previously,such as adding courses for Auto CAD, machinist, and different computer-programminglanguages. 61
61. Shirley Won. Globe and Mail, “Wanted: More Skilled Labour, and Quick,” November 7, 2005, pp. B1, B13. Seealso Gord Young. North Bay Nugget, “Natural Resources Backbone of Economy ,” September 22, 2005, pp. A1, A3.

Blue Sky – Labour Market Study: HR Gap Analysis © 2005 Precision Management Catalysts Ltd. All rights reserved. 50
Promote Careers Earlier to StudentsA recurring theme amongst Blue
Sky employers is the request to promotecareers not only early in secondary schoolbut also at the elementary-school level.Many employers believe that once studentsare in high school, their paths are set interms of the background courses they needto enter certain fields. Providing morecareer information and promotion toyounger students, who are not necessarilyuniversity bound, may address thisinequity.
Influence the InfluencersIn tandem with pitching careers to elementary-school students, employers have
suggested focussing efforts on parents and teachers. No matter how interested a childmay be in a potential career, teachers, and parents in particular, have significantinfluence in their children’s direction.
Promote Trades to WomenWith skilled trades being in particular short supply,
employers have expressed interest in non-traditional sources oflabour. One untapped market has been women. Blue Skyemployers believe that the myth of a dirty, low-paying job mustbe dispelled. One employer reported that all his skilled tradesworkers earned six figures, something that would surprise manylocal residents.
Match Skill Sets with BusinessesBlue Sky employers are interested in a better match of skill
sets to available jobs. Nipissing University and Canadore Collegecould team up to send out graduate-information packages annuallyto businesses, big and small, and also consider partnering withBlue Sky municipal governments to create a web site with on-lineresources matching people to positions.
Attract Businesses Requiring Bilingual SkillsBlue Sky has an exceptionally high bilingualism rate in
some areas. Many businesses value this asset; in fact, they maypay more for it. Blue Sky should consider targeting thesebusinesses in its economic-development efforts. Organizationsrequiring these skills include those dealing with global markets ormarkets such as Quebec.

Blue Sky – Labour Market Study: HR Gap Analysis © 2005 Precision Management Catalysts Ltd. All rights reserved. 51
Attract Businesses Requiring Higher-Level SkillsBlue Sky youth attend school at high rates, but after they
complete post-secondary education, there are few jobs to keepthem in the community. To take advantage of this potential labourpool and drive Blue Sky’s economy forward, the community shouldcontinue its work in attracting small-to-medium-sized businessesthat require graduates with these educational levels.
Use the first part of this study as a tool to promote BlueSky’s motivated and educated workforce, (with low absenteeismand low employee-turnover,) its high bilingualism rate; and itshealthy labour-pool exchange with communities outside the region.Blue Sky has an ideal workforce. Moreover, it provides a richquality of life free from the gridlock typical in Southern Ontario.
Create Migration StrategyBecause fertility rates are low and youth out-migration is high, Blue Sky has
experienced a small population decline. Internal migration (those emigrating fromwithin Canada) can help stem this decline and grow the population. Accordingly, it isimportant to prepare and roll out strategy to increase the local population. In preparingthis type of strategy, Blue Sky should seek to re-attract former residents, who can beenticed to move back to the area to live and work close to their families. These are thetypes of people who already understand the high quality of life in Blue Sky.
On a broader scale, Blue Sky has not received any significant numbers ofimmigrants directly from other countries since the 1960’s. To address this issue,consider entertaining a forum held in partnership with Canadore College, NipissingUniversity, and Citizenship and Immigration Canada to address direct externalmigration strategies as well. Focus marketing efforts on the rich quality of life that isbalanced with the availability of urban amenities.
Conclusion"Only those who dare to fail greatly can ever achieve greatly."
– Robert Francis Kennedy
The rationale for pursuing the foregoing suggestions is simple – it makes sense from theperspective of building sustainability into Blue Sky’s economy. The population will bemaintained, and that will help to maintain the community's infrastructure. Better yet, there willbe an improved match between labour and industry, and that will translate into an environmentwhere residents and business alike can thrive. Ultimately, Blue Sky can build upon the assetsof its labour market to develop a strategy that will position Blue Sky for continuing prosperity.

Blue Sky – Labour Market Study: HR Gap Analysis © 2005 Precision Management Catalysts Ltd. All rights reserved. 52
Exhibit 1: Occupational Profile Management
The Greater Blue SkyRegion*
NorthernOntario
OntarioManagement Occupations
Total # ofWorkers
% of alloccup.
% of alloccup.
% of alloccup.
A Management occupations 14,655 10.19 9.39 11.44 A0 Senior management occupations 1,230 0.86 0.82 1.43 A01 Legislators and senior management 1,235 0.86 0.82 1.43 A011 Legislators 80 0.06 0.10 0.03 A012 Senior government managers and officials 310 0.22 0.19 0.15 A013 Senior managers - Financial, communications carriers and other business services
180 0.13 0.09 0.41
A014 Senior managers - Health, education, social and community services and membership organizations
200 0.14 0.14 0.11
A015 Senior managers - Trade, broadcasting and other services, n.e.c.
195 0.14 0.11 0.34
A016 Senior managers - Goods production, utilities, transportation and construction
275 0.19 0.19 0.38
A1 Specialist managers 2,620 1.82 1.50 3.13 A11 Administrative services managers 975 0.68 0.57 1.02 A111 Financial managers 340 0.24 0.24 0.47 A112 Human resources managers 265 0.18 0.15 0.25 A113 Purchasing managers 20 0.01 0.02 0.07 A114 Other administrative services managers 355 0.25 0.17 0.24 A12 Managers in engineering, architecture, science and information systems
290 0.20 0.16 0.59
A121 Engineering, science and architecture managers 125 0.09 0.07 0.18 A122 Information systems and data processing managers 175 0.12 0.10 0.41 A13 Sales, marketing and advertising managers 700 0.49 0.39 1.13 A131 Sales, marketing and advertising managers 705 0.49 0.39 1.13 A14 Facility operation and maintenance managers 635 0.44 0.37 0.39 A141 Facility operation and maintenance managers 635 0.44 0.37 0.39 A2 Managers in retail trade, food and accommodation services
6,145 4.27 4.04 3.24
A21 Managers in retail trade 4,105 2.86 2.59 2.25 A211 Retail trade managers 4,105 2.86 2.59 2.25 A22 Managers in food service and accommodation 2,040 1.42 1.45 1.00 A221 Restaurant and food service managers 1,280 0.89 0.87 0.83 A222 Accommodation service managers 760 0.53 0.58 0.17 A3 Other managers, n.e.c. 4,660 3.24 3.03 3.63 A30 Managers in financial and business services 620 0.43 0.40 0.80 A301 Insurance, real estate and financial brokerage managers
120 0.08 0.08 0.23
A302 Banking, credit and other investment managers 395 0.27 0.26 0.47A303 Other business services managers 115 0.08 0.06 0.11A31 Managers in communication (except broadcasting) 125 0.09 0.07 0.16A311 Telecommunication carriers managers 70 0.05 0.05 0.12 A312 Postal and courier services managers 50 0.03 0.02 0.04 A32 Managers in health, education, social and communityservices
730 0.51 0.59 0.50
A321 Managers in health care 215 0.15 0.17 0.15 A322 Administrators in post-secondary education and vocational training
125 0.09 0.07 0.08
A323 School principals and administrators of elementary and secondary education
285 0.20 0.23 0.18
A324 Managers in social, community and correctionalservices
115 0.08 0.12 0.09
A33 Managers in public administration 225 0.16 0.15 0.13 A331 Government managers in health and social policy development and program administration
65 0.05 0.04 0.04
A332 Government managers in economic analysis, policy development and program administration
115 0.08 0.06 0.05
Source: Statistics Canada, Census of Canada, 2001, Custom Tabulation.* Includes Districts of Nipissing, Sudbury, Parry Sound, and the Greater Sudbury Division.

Blue Sky – Labour Market Study: HR Gap Analysis © 2005 Precision Management Catalysts Ltd. All rights reserved. 53
The Greater Blue SkyRegion*
NorthernOntario
OntarioManagement Occupations cont d
Total # ofWorkers
% of alloccup.
% of alloccup.
% of alloccup.
A333 Government managers in education policy development and program administration
0 0.00 0.01 0.00
A334 Other managers in public administration 50 0.03 0.04 0.04 A34 Managers in art, culture, recreation and sport 190 0.13 0.14 0.19 A341 Library, archive, museum and art gallery managers 40 0.03 0.02 0.03 A342 Managers in publishing, motion pictures, broadcasting and performing arts
70 0.05 0.05 0.09
A343 Recreation and sport program and service directors 85 0.06 0.07 0.07 A35 Managers in protective services 185 0.13 0.10 0.13 A351 Commissioned police officers 50 0.03 0.03 0.02 A352 Fire chiefs and senior fire-fighting officers 60 0.04 0.03 0.01 A353 Commissioned officers, armed forces 75 0.05 0.04 0.10 A36 Managers in other services 350 0.24 0.18 0.20 A361 Other services managers 350 0.24 0.18 0.20 A37 Managers in construction and transportation 1,415 0.98 0.82 0.77 A371 Construction managers 740 0.51 0.44 0.37 A372 Residential home builders and renovators 415 0.29 0.22 0.23 A373 Transportation managers 250 0.17 0.16 0.17 A38 Managers in primary production (except agriculture) 235 0.16 0.18 0.03 A381 Primary production managers (except agriculture) 230 0.16 0.19 0.03 A39 Managers in manufacturing and utilities 575 0.40 0.38 0.72 A391 Manufacturing managers 475 0.33 0.31 0.66 A392 Utilities managers 95 0.07 0.07 0.06
Source: Statistics Canada, Census of Canada, 2001, Custom Tabulation. * Includes Districts of Nipissing, Sudbury, Parry Sound, and the Greater Sudbury Division.

Blue Sky – Labour Market Study: HR Gap Analysis © 2005 Precision Management Catalysts Ltd. All rights reserved. 54
Exhibit 2: Occupational Profile Business, Finance, Administration
The Greater Blue SkyRegion
NorthernOntario
OntarioBusiness, Finance, Administration Occupations
Total # ofWorkers
% of alloccup.
% of alloccup.
% of alloccup.
B Business, finance and administrative occupations 23,795 16.55 14.86 18.32 B0 Professional occupations in business and finance 2,265 1.58 1.32 2.70 B01 Auditors, accountants and investment professionals 1,740 1.21 1.01 2.04 B011 Financial auditors and accountants 1,105 0.77 0.65 1.11 B012 Financial and investment analysts 140 0.10 0.09 0.35 B013 Securities agents, investment dealers and traders 110 0.08 0.07 0.21 B014 Other financial officers 405 0.28 0.21 0.37 B02 Human resources and business service professionals 515 0.36 0.31 0.65 B021 Specialists in human resources 355 0.25 0.20 0.28 B022 Professional occupations in business services to management
155 0.11 0.11 0.38
B1 Finance and insurance administrative occupations 1900 1.32 1.33 1.24 B11 Finance and insurance administrative occupations 1900 1.32 1.33 1.24 B111 Bookkeepers 1355 0.94 1.04 0.73 B112 Loan officers 135 0.09 0.09 0.14 B113 Insurance adjusters and claims examiners 150 0.10 0.10 0.15 B114 Insurance underwriters 60 0.04 0.02 0.11 B115 Assessors, valuators and appraisers 180 0.13 0.08 0.07 B116 Customs, ship and other brokers 20 0.01 0.00 0.04 B2 Secretaries 3,840 2.67 2.51 1.99 B21 Secretaries, recorders and transcriptionists 3,835 2.67 2.51 1.99 B211 Secretaries (except legal and medical) 2,780 1.93 1.87 1.36 B212 Legal secretaries 390 0.27 0.24 0.30 B213 Medical secretaries 570 0.40 0.35 0.28 B214 Court recorders and medical transcriptionists 90 0.06 0.05 0.05 B3 Administrative and regulatory occupations 2,280 1.59 1.46 2.14 B31 Administrative and regulatory occupations 2,280 1.59 1.46 2.14 B311 Administrative officers 1,240 0.86 0.80 1.13 B312 Executive assistants 150 0.10 0.09 0.19 B313 Personnel and recruitment officers 110 0.08 0.05 0.14 B314 Property administrators 205 0.14 0.16 0.22 B315 Purchasing agents and officers 185 0.13 0.13 0.19 B316 Conference and event planners 115 0.08 0.06 0.10 B317 Court officers and justices of the peace 45 0.03 0.04 0.03 B318 Immigration, unemployment insurance and revenue officers
240 0.17 0.13 0.14
B4 Clerical supervisors 855 0.59 0.47 0.61 B41 Clerical supervisors 855 0.59 0.47 0.61 B411 Supervisors, general office and administrative support clerks
260 0.18 0.12 0.14
B412 Supervisors, finance and insurance clerks 110 0.08 0.07 0.17B413 Supervisors, library, correspondence and related information clerks
245 0.17 0.11 0.10
B415 Supervisors, recording, distributing and scheduling occupations
150 0.10 0.10 0.15
B5 Clerical occupations 12,650 8.80 7.76 9.65 B51 Clerical occupations, general office skills 3,365 2.34 2.30 2.76 B510 General office clerks 2,190 1.52 1.47 1.82 B513 Records and file clerks 190 0.13 0.15 0.16 B514 Receptionists and switchboard operators 975 0.68 0.68 0.79 B52 Office equipment operators 960 0.67 0.44 0.51 B522 Data entry clerks 770 0.54 0.33 0.41 B523 Typesetters and related occupations 75 0.05 0.03 0.04 B524 Telephone operators 105 0.07 0.07 0.06
Source: Statistics Canada, Census of Canada, 2001, Custom Tabulation.* Includes Districts of Nipissing, Sudbury, Parry Sound, and the Greater Sudbury Division.

Blue Sky – Labour Market Study: HR Gap Analysis © 2005 Precision Management Catalysts Ltd. All rights reserved. 55
The Greater Blue SkyRegion
NorthernOntario
OntarioBusiness, Finance, Administration Occupations cont d
Total # ofWorkers
% of alloccup.
% of alloccup.
% of alloccup.
B53 Finance and insurance clerks 2,555 1.78 1.65 2.22 B531 Accounting and related clerks 1,280 0.89 0.74 1.00 B532 Payroll clerks 330 0.23 0.19 0.20 B533 Tellers, financial services 755 0.53 0.58 0.60 B534 Banking, insurance and other financial clerks 100 0.07 0.10 0.30 B535 Collectors 55 0.04 0.04 0.12 B54 Administrative support clerks 730 0.51 0.46 0.56 B541 Administrative clerks 580 0.40 0.37 0.47 B542 Personnel clerks 110 0.08 0.06 0.07 B543 Court clerks 45 0.03 0.03 0.02 B55 Library, correspondence and related information clerks 2,475 1.72 1.19 1.42 B551 Library clerks 130 0.09 0.10 0.09 B552 Correspondence, publication and related clerks 35 0.02 0.02 0.05 B553 Customer service, information and related clerks 1,855 1.29 0.88 1.14 B554 Survey interviewers and statistical clerks 465 0.32 0.20 0.15 B56 Mail and message distribution occupations 1,075 0.75 0.64 0.63 B561 Mail, postal and related clerks 465 0.32 0.25 0.28 B562 Letter carriers 185 0.13 0.14 0.16 B563 Couriers and messengers 415 0.29 0.24 0.19 B57 Recording, scheduling and distributing occupations 1,480 1.03 1.06 1.56 B571 Shippers and receivers 535 0.37 0.36 0.79 B572 Storekeepers and parts clerks 250 0.17 0.22 0.16 B573 Production clerks 145 0.10 0.08 0.13 B574 Purchasing and inventory clerks 275 0.19 0.18 0.26 B575 Dispatchers and radio operators 295 0.21 0.23 0.19 B576 Transportation route and crew schedulers 20 0.01 0.01 0.03
Source: Statistics Canada, Census of Canada, 2001, Custom Tabulation. * Includes Districts of Nipissing, Sudbury, Parry Sound, and the Greater Sudbury Division.

Blue Sky – Labour Market Study: HR Gap Analysis © 2005 Precision Management Catalysts Ltd. All rights reserved. 56
Exhibit 3: Occupational Profile Natural and Applied Science and Related
The Greater Blue SkyRegion
NorthernOntario
OntarioNatural /Applied Science and Related Occupations
Total # ofWorkers
% of alloccup.
% of alloccup.
% of alloccup.
C Natural and applied sciences and related occupations 6,225 4.33 4.33 7.05 C0 Professional occupations in natural and applied sciences
3,315 2.31 2.14 5.04
C01 Physical science professionals 370 0.26 0.20 0.19 C011 Physicists and astronomers 10 0.01 0.01 0.02 C012 Chemists 55 0.04 0.03 0.12 C013 Geologists, geochemists and geophysicists 255 0.18 0.15 0.03 C014 Meteorologists 0 0.00 0.01 0.00 C015 Other professional occupations in physical sciences 30 0.02 0.01 0.01 C02 Life science professionals 185 0.13 0.23 0.11 C021 Biologists and related scientists 65 0.05 0.08 0.07 C022 Forestry professionals 75 0.05 0.14 0.02 C023 Agricultural representatives, consultants and specialists
50 0.03 0.02 0.02
C03 Civil, mechanical, electrical and chemical engineers 605 0.42 0.45 0.83 C031 Civil engineers 245 0.17 0.18 0.24 C032 Mechanical engineers 135 0.09 0.11 0.27 C033 Electrical and electronics engineers 140 0.10 0.09 0.26 C034 Chemical engineers 65 0.05 0.05 0.07 C04 Other engineers 540 0.38 0.29 0.28 C041 Industrial and manufacturing engineers 30 0.02 0.04 0.14 C042 Metallurgical and materials engineers 20 0.01 0.03 0.02 C043 Mining engineers 420 0.29 0.18 0.02 C044 Geological engineers 15 0.01 0.01 0.01 C045 Petroleum engineers 0 0.00 0.00 0.00 C046 Aerospace engineers 35 0.02 0.02 0.04 C048 Other professional engineers, n.e.c. 20 0.01 0.01 0.05 C05 Architects, urban planners and land surveyors 175 0.12 0.14 0.18 C051 Architects 10 0.01 0.02 0.09 C052 Landscape architects 10 0.01 0.01 0.02 C053 Urban and land use planners 40 0.03 0.04 0.04 C054 Land surveyors 115 0.08 0.07 0.03 C06 Mathematicians, systems analysts and computer programmers
0 0.00 0.01 0.05
C061 Mathematicians, statisticians and actuaries 10 0.01 0.01 0.05 C07 Computer and information systems occupations 1,455 1.01 0.83 3.39 C070 Computer and information systems occupations 1,455 1.01 0.83 3.39 C1 Technical occupations related to natural and applied sciences
2,900 2.02 2.19 2.01
C11 Technical occupations in physical sciences 325 0.23 0.24 0.18 C111 Applied chemical technologists and technicians 110 0.08 0.08 0.14 C112 Geological and mineral technologists and technicians 190 0.13 0.14 0.03 C113 Meteorological technicians 10 0.01 0.01 0.00 C12 Technical occupations in life sciences 355 0.25 0.42 0.16 C121 Biological technologists and technicians 50 0.03 0.04 0.04 C122 Agricultural and fish products inspectors 0 0.00 0.03 0.01 C123 Forestry technologists and technicians 140 0.10 0.23 0.02 C124 Conservation and fishery officers 60 0.04 0.05 0.02 C125 Landscape and horticultural technicians and specialists
110 0.08 0.08 0.07
C13 Technical occupations in civil, mechanical and industrial engineering
325 0.23 0.21 0.33
C131 Civil engineering technologists and technicians and construction estimators
190 0.13 0.12 0.11
Source: Statistics Canada, Census of Canada, 2001, Custom Tabulation.* Includes Districts of Nipissing, Sudbury, Parry Sound, and the Greater Sudbury Division.

Blue Sky – Labour Market Study: HR Gap Analysis © 2005 Precision Management Catalysts Ltd. All rights reserved. 57
The Greater Blue SkyRegion*
NorthernOntario
OntarioNatural/Applied Science and Related Occupations cont d
Total # ofWorkers
% of alloccup.
% of alloccup.
% of alloccup.
C132 Mechanical engineering technologists and technicians 75 0.05 0.05 0.08 C133 Industrial engineering and manufacturing technologists and technicians
70 0.05 0.04 0.14
C14 Technical occupations in electronics and electrical engineering
925 0.64 0.60 0.70
C141 Electrical and electronics engineering technologists and technicians
315 0.22 0.18 0.26
C142 Electronic service technicians (household and business equipment)
415 0.29 0.29 0.33
C143 Industrial instrument technicians and mechanics 130 0.09 0.11 0.06 C144 Aircraft instrument, electrical and avionics mechanics, technicians and inspectors
60 0.04 0.03 0.04
C15 Technical occupations in architecture, drafting, surveying and mapping
425 0.30 0.26 0.32
C151 Architectural technologists and technicians 35 0.02 0.02 0.04 C152 Industrial designers 30 0.02 0.02 0.08 C153 Drafting technologists and technicians 265 0.18 0.13 0.17 C154 Survey technologists and technicians 60 0.04 0.04 0.02 C155 Mapping and related technologists and technicians 50 0.03 0.04 0.03 C16 Other technical inspectors and regulatory officers 340 0.24 0.22 0.18 C161 Non-destructive testers and inspectors 0 0.00 0.01 0.02 C162 Engineering inspectors and regulatory officers 30 0.02 0.02 0.03 C163 Inspectors in public and environmental health and occupational health and safety
205 0.14 0.11 0.08
C164 Construction inspectors 95 0.07 0.07 0.05 C17 Transportation officers and controllers 225 0.16 0.24 0.13 C171 Air pilots, flight engineers and flying instructors 135 0.09 0.17 0.08 C172 Air traffic control occupations 80 0.06 0.05 0.03 C173 Deck officers, water transport 15 0.01 0.01 0.01 C174 Engineer officers, water transport 0 0.00 0.00 0.01 C175 Railway & marine traffic controllers 10 0.01 0.01 0.01
Source: Statistics Canada, Census of Canada, 2001, Custom Tabulation. * Includes Districts of Nipissing, Sudbury, Parry Sound, and the Greater Sudbury Division.
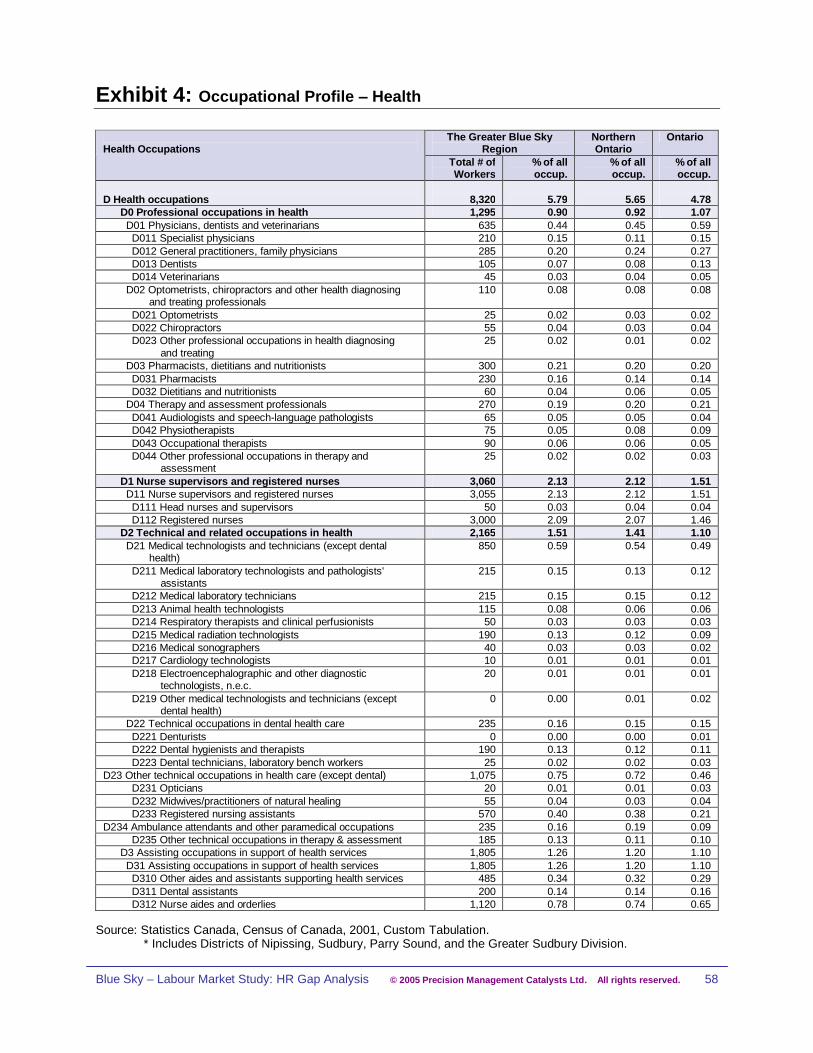
Blue Sky – Labour Market Study: HR Gap Analysis © 2005 Precision Management Catalysts Ltd. All rights reserved. 58
Exhibit 4: Occupational Profile Health
The Greater Blue SkyRegion
NorthernOntario
OntarioHealth Occupations
Total # ofWorkers
% of alloccup.
% of alloccup.
% of alloccup.
D Health occupations 8,320 5.79 5.65 4.78 D0 Professional occupations in health 1,295 0.90 0.92 1.07 D01 Physicians, dentists and veterinarians 635 0.44 0.45 0.59 D011 Specialist physicians 210 0.15 0.11 0.15 D012 General practitioners, family physicians 285 0.20 0.24 0.27 D013 Dentists 105 0.07 0.08 0.13 D014 Veterinarians 45 0.03 0.04 0.05 D02 Optometrists, chiropractors and other health diagnosing and treating professionals
110 0.08 0.08 0.08
D021 Optometrists 25 0.02 0.03 0.02 D022 Chiropractors 55 0.04 0.03 0.04 D023 Other professional occupations in health diagnosing and treating
25 0.02 0.01 0.02
D03 Pharmacists, dietitians and nutritionists 300 0.21 0.20 0.20 D031 Pharmacists 230 0.16 0.14 0.14 D032 Dietitians and nutritionists 60 0.04 0.06 0.05 D04 Therapy and assessment professionals 270 0.19 0.20 0.21 D041 Audiologists and speech-language pathologists 65 0.05 0.05 0.04 D042 Physiotherapists 75 0.05 0.08 0.09 D043 Occupational therapists 90 0.06 0.06 0.05 D044 Other professional occupations in therapy and assessment
25 0.02 0.02 0.03
D1 Nurse supervisors and registered nurses 3,060 2.13 2.12 1.51 D11 Nurse supervisors and registered nurses 3,055 2.13 2.12 1.51 D111 Head nurses and supervisors 50 0.03 0.04 0.04 D112 Registered nurses 3,000 2.09 2.07 1.46 D2 Technical and related occupations in health 2,165 1.51 1.41 1.10 D21 Medical technologists and technicians (except dental health)
850 0.59 0.54 0.49
D211 Medical laboratory technologists and pathologists' assistants
215 0.15 0.13 0.12
D212 Medical laboratory technicians 215 0.15 0.15 0.12 D213 Animal health technologists 115 0.08 0.06 0.06 D214 Respiratory therapists and clinical perfusionists 50 0.03 0.03 0.03 D215 Medical radiation technologists 190 0.13 0.12 0.09 D216 Medical sonographers 40 0.03 0.03 0.02 D217 Cardiology technologists 10 0.01 0.01 0.01 D218 Electroencephalographic and other diagnostic technologists, n.e.c.
20 0.01 0.01 0.01
D219 Other medical technologists and technicians (except dental health)
0 0.00 0.01 0.02
D22 Technical occupations in dental health care 235 0.16 0.15 0.15 D221 Denturists 0 0.00 0.00 0.01 D222 Dental hygienists and therapists 190 0.13 0.12 0.11 D223 Dental technicians, laboratory bench workers 25 0.02 0.02 0.03D23 Other technical occupations in health care (except dental) 1,075 0.75 0.72 0.46 D231 Opticians 20 0.01 0.01 0.03 D232 Midwives/practitioners of natural healing 55 0.04 0.03 0.04 D233 Registered nursing assistants 570 0.40 0.38 0.21D234 Ambulance attendants and other paramedical occupations 235 0.16 0.19 0.09 D235 Other technical occupations in therapy & assessment 185 0.13 0.11 0.10 D3 Assisting occupations in support of health services 1,805 1.26 1.20 1.10 D31 Assisting occupations in support of health services 1,805 1.26 1.20 1.10 D310 Other aides and assistants supporting health services 485 0.34 0.32 0.29 D311 Dental assistants 200 0.14 0.14 0.16 D312 Nurse aides and orderlies 1,120 0.78 0.74 0.65
Source: Statistics Canada, Census of Canada, 2001, Custom Tabulation.* Includes Districts of Nipissing, Sudbury, Parry Sound, and the Greater Sudbury Division.

Blue Sky – Labour Market Study: HR Gap Analysis © 2005 Precision Management Catalysts Ltd. All rights reserved. 59
Exhibit 5: Occupational Profile Social Science, Education, Government Service, Religion
The Greater Blue SkyRegion
NorthernOntario
OntarioSocial Science, Education, Government Service, and ReligionOccupations Total # of
Workers% of alloccup.
% of alloccup.
% of alloccup.
E Occupations in social science, education, government service and religion 10,385 7.22 7.60 6.81 E0 Judges, lawyers, psychologists, social workers, ministers of religion, policy/program officers
2,565 1.78 2.11 2.15
E01 Judges, lawyers and Quebec notaries 295 0.21 0.24 0.46 E011 Judges 35 0.02 0.02 0.01 E012 Lawyers and Quebec notaries 255 0.18 0.21 0.44 E02 Psychologists, social workers, counsellors, clergy and probation officers
1,400 0.97 1.17 0.76
E021 Psychologists 65 0.05 0.05 0.08 E022 Social workers 680 0.47 0.59 0.32 E023 Family, marriage and other related counsellors 340 0.24 0.27 0.15 E024 Ministers of religion 200 0.14 0.19 0.18 E025 Probation and parole officers and related occupations 110 0.08 0.08 0.04 E03 Policy and program officers, researchers and consultants 865 0.60 0.70 0.93 E031 Natural and applied science policy researchers, consultants and program officers
85 0.06 0.07 0.09
E032 Economists and economic policy researchers and analysts
45 0.03 0.03 0.09
E033 Economic development officers and marketing researchers and consultants
135 0.09 0.13 0.28
E034 Health and social policy researchers, consultants and program officers
315 0.22 0.24 0.25
E035 Education policy researchers, consultants and program officers
115 0.08 0.08 0.06
E036 Recreation/sports program supervisors and consultants
110 0.08 0.10 0.08
E037 Program officers unique to government 10 0.01 0.01 0.05 E038 Other professional social science occupations, n.e.c. 30 0.02 0.03 0.03 E1 Teachers and professors 6,060 4.22 4.12 3.66 E11 University professors and assistants 760 0.53 0.35 0.57 E111 University professors 555 0.39 0.24 0.29 E112 Post-secondary teaching/research assistants 205 0.14 0.12 0.28 E12 College and other vocational instructors 750 0.52 0.43 0.38 E121 College and other vocational instructors 755 0.53 0.43 0.38 E13 Secondary and elementary school teachers and counsellors
4,540 3.16 3.33 2.71
E131 Secondary school teachers 1,670 1.16 1.29 1.02 E132 Elementary school and kindergarten teachers 2,760 1.92 1.93 1.61 E133 School and guidance counsellors 110 0.08 0.11 0.07 E2 Paralegals, social services workers and occupations in education and religion, n.e.c.
1,760 1.22 1.37 1.00
E21 Paralegals, social services workers and occupations in education and religion, n.e.c.
1,765 1.23 1.37 1.00
E211 Paralegal and related occupations 230 0.16 0.13 0.24 E212 Community and social service workers 905 0.63 0.82 0.41 E213 Employment counsellors 135 0.09 0.09 0.07 E214 Instructors/teachers of disabled persons 180 0.13 0.14 0.08 E215 Other instructors 240 0.17 0.14 0.16 E216 Other religious occupations 75 0.05 0.05 0.04
Source: Statistics Canada, Census of Canada, 2001, Custom Tabulation. * Includes Districts of Nipissing, Sudbury, Parry Sound, and the Greater Sudbury Division.

Blue Sky – Labour Market Study: HR Gap Analysis © 2005 Precision Management Catalysts Ltd. All rights reserved. 60
Exhibit 6: Occupational Profile Art, Culture, Recreation, and Sport
The Greater Blue SkyRegion
NorthernOntario
OntarioArt, Culture, Recreation, and Sport Occupations
Total # ofWorkers
% of alloccup.
% of alloccup.
% of alloccup.
F Occupations in art, culture, recreation and sport 2,525 1.76 1.74 2.87 F0 Professional occupations in art and culture 940 0.65 0.62 1.26 F01 Librarians, archivists, conservators, curators 80 0.06 0.07 0.10 F011 Librarians 80 0.06 0.05 0.08 F012 Conservators and curators 0 0.00 0.01 0.02 F013 Archivists 0 0.00 0.00 0.01 F02 Writing, translating, public relations jobs 510 0.35 0.30 0.61 F021 Writers 130 0.09 0.06 0.16 F022 Editors 50 0.03 0.03 0.10 F023 Journalists 100 0.07 0.07 0.08 F024 Professional occupations in public relations and communications
150 0.10 0.10 0.19
F025 Translators, terminologists, interpreters 80 0.06 0.03 0.07 F03 Creative and performing artists 345 0.24 0.25 0.55 F031 Producers, directors, choreographers and related occupations
45 0.03 0.03 0.13
F032 Conductors, composers and arrangers 10 0.01 0.01 0.02 F033 Musicians and singers 185 0.13 0.12 0.20 F034 Dancers 40 0.03 0.03 0.05 F035 Actors 10 0.01 0.01 0.06 F036 Painters, sculptors, other visual artists 50 0.03 0.05 0.09 F1 Technical occupations in art, culture, recreation, sport 1,580 1.10 1.12 1.61 F11 Technical occupations in libraries, archives, museums, galleries
185 0.13 0.13 0.10
F111 Library / archive technicians, assistants 130 0.09 0.09 0.08 F112 Technical occupations related to museums and galleries
40 0.03 0.03 0.02
F12 Photographers, graphic arts technicians and technical occupations in motion pictures, broadcasting and the performing arts
195 0.14 0.13 0.33
F121 Photographers 60 0.04 0.03 0.08 F122 Film and video camera operators 25 0.02 0.01 0.03 F123 Graphic arts technicians 40 0.03 0.02 0.04 F124 Broadcast technicians 10 0.01 0.02 0.02 F125 Audio and video recording technicians 30 0.02 0.01 0.06 F126 Other technical occupations in motion pictures, broadcasting and the performing arts
10 0.01 0.01 0.05
F127 Support and assisting occupations in motion pictures, broadcasting, performing arts
20 0.01 0.01 0.04
F13 Announcers and other performers 115 0.08 0.09 0.08 F131 Announcers and other broadcasters 95 0.07 0.07 0.05 F132 Other performers 25 0.02 0.02 0.03 F14 Creative designers and craftspersons 455 0.32 0.30 0.62 F141 Graphic designers and illustrating artists 165 0.11 0.12 0.34 F142 Interior designers 80 0.06 0.03 0.09 F143 Theatre, fashion, Exhibit, creative designers 30 0.02 0.02 0.06 F144 Artisans and craftspersons 170 0.12 0.12 0.12 F145 Patternmakers, textile, leather, fur 10 0.01 0.00 0.01 F15 Athletes, coaches, referees, related occup. 625 0.43 0.48 0.48 F151 Athletes 15 0.01 0.02 0.02 F152 Coaches 60 0.04 0.04 0.06 F153 Sports officials and referees 135 0.09 0.05 0.03
Source: Statistics Canada, Census of Canada, 2001, Custom Tabulation. * Includes Districts of Nipissing, Sudbury, Parry Sound, and the Greater Sudbury Division.

Blue Sky – Labour Market Study: HR Gap Analysis © 2005 Precision Management Catalysts Ltd. All rights reserved. 61
Exhibit 7: Occupational Profile Sales and Service
The Greater Blue SkyRegion
NorthernOntario
OntarioSales and Service Occupations
Total # ofWorkers
% of alloccup.
% of alloccup.
% of alloccup.
G Sales and service occupations 40,870 28.43 27.79 23.68 G0 Sales and service supervisors 1,055 0.73 0.78 0.73 G01 Sales and service supervisors 1,055 0.73 0.78 0.73 G011 Retail trade supervisors 620 0.43 0.42 0.35 G012 Food service supervisors 265 0.18 0.18 0.21 G013 Executive housekeepers 30 0.02 0.05 0.02 G014 Dry cleaning and laundry supervisors 20 0.01 0.01 0.01 G015 Cleaning supervisors 60 0.04 0.07 0.08 G016 Other service supervisors 60 0.04 0.05 0.07 G1 Wholesale, technical, insurance, real estate sales specialists, and retail, wholesale and grain buyers
2,225 1.55 1.45 2.39
G11 Sales representatives, wholesale trade 905 0.63 0.54 0.98 G111 Sales representatives, wholesale trade (non-technical) 900 0.63 0.54 0.98 G12 Technical sales specialists, wholesale trade 390 0.27 0.25 0.47 G121 Technical sales specialists, wholesale trade 375 0.26 0.25 0.47 G13 Insurance and real estate sales occupations and buyers 930 0.65 0.66 0.93 G131 Insurance agents and brokers 445 0.31 0.32 0.35 G132 Real estate agents and salespersons 400 0.28 0.26 0.43 G133 Retail and wholesale buyers 90 0.06 0.08 0.15 G134 Grain elevator operators 0 0.00 0.01 0.00 G2 Retail salespersons and sales clerks 6,505 4.52 4.11 3.95 G21 Retail salespersons and sales clerks 6,505 4.52 4.11 3.95 G211 Retail salespersons and sales clerks 6,500 4.52 4.11 3.95 G3 Cashiers 2,875 2.00 1.97 1.67 G31 Cashiers 2,875 2.00 1.97 1.67 G311 Cashiers 2,875 2.00 1.97 1.67 G4 Chefs and cooks 2,460 1.71 1.70 1.18 G41 Chefs and cooks 2,460 1.71 1.69 1.18 G411 Chefs 200 0.14 0.15 0.21 G412 Cooks 2,260 1.57 1.55 0.97 G5 Occupations in food and beverage service 2,485 1.73 1.98 1.59 G51 Occupations in food and beverage service 2,475 1.72 1.98 1.59 G511 Maîtres d'hôtel and hosts 105 0.07 0.09 0.12 G512 Bartenders 375 0.26 0.35 0.25 G513 Food and beverage servers 1,980 1.38 1.54 1.22 G6 Occupations in protective services 2,485 1.73 1.79 1.50 G61 Police officers and fire-fighters 1,015 0.71 0.75 0.56 G611 Police officers (except commissioned) 820 0.57 0.57 0.39 G612 Fire-fighters 190 0.13 0.18 0.17 G62 Other occupations in protective service 825 0.57 0.51 0.42 G621 Sheriffs and bailiffs 20 0.01 0.02 0.01 G622 Correctional service officers 255 0.18 0.21 0.09 G623 By-law enforcement & other regulatory officers, n.e.c. 70 0.05 0.06 0.04G624 Other ranks, armed forces 405 0.28 0.16 0.20 G625 Other protective service occupations 70 0.05 0.05 0.08 G63 Security guards and related occupations 650 0.45 0.53 0.52 G631 Security guards and related occupations 655 0.46 0.53 0.52G7 Occupations in travel and accommodation including attendants in recreation and sport
745 0.52 0.83 0.82
G71 Occupations in travel and accommodation 310 0.22 0.39 0.48G711 Travel counsellors 100 0.07 0.11 0.21 G712 Pursers and flight attendants 10 0.01 0.02 0.08 G713 Airline sales and service agents 30 0.02 0.04 0.07 G714 Ticket/cargo agents and related clerks (except airline) 30 0.02 0.03 0.03 G715 Hotel front desk clerks 155 0.11 0.19 0.09
Source: Statistics Canada, Census of Canada, 2001, Custom Tabulation.* Includes Districts of Nipissing, Sudbury, Parry Sound, and the Greater Sudbury Division.
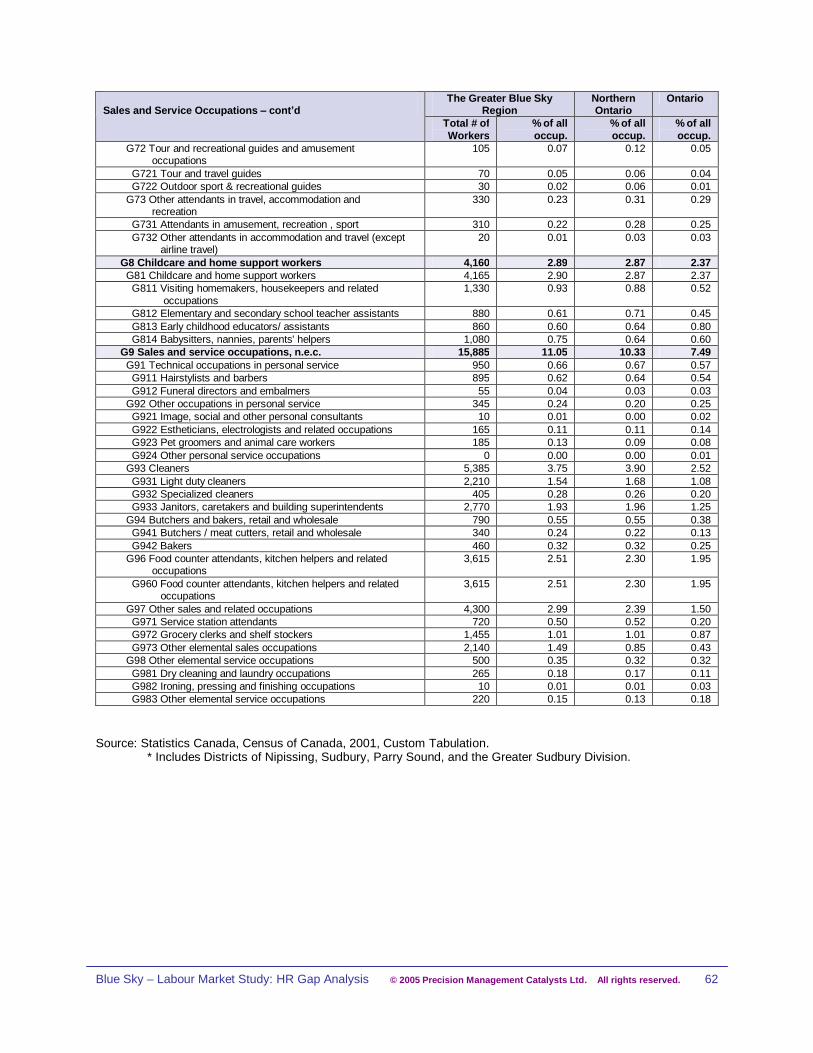
Blue Sky – Labour Market Study: HR Gap Analysis © 2005 Precision Management Catalysts Ltd. All rights reserved. 62
The Greater Blue SkyRegion
NorthernOntario
OntarioSales and Service Occupations cont d
Total # ofWorkers
% of alloccup.
% of alloccup.
% of alloccup.
G72 Tour and recreational guides and amusement occupations
105 0.07 0.12 0.05
G721 Tour and travel guides 70 0.05 0.06 0.04 G722 Outdoor sport & recreational guides 30 0.02 0.06 0.01 G73 Other attendants in travel, accommodation and recreation
330 0.23 0.31 0.29
G731 Attendants in amusement, recreation , sport 310 0.22 0.28 0.25 G732 Other attendants in accommodation and travel (except airline travel)
20 0.01 0.03 0.03
G8 Childcare and home support workers 4,160 2.89 2.87 2.37 G81 Childcare and home support workers 4,165 2.90 2.87 2.37 G811 Visiting homemakers, housekeepers and related occupations
1,330 0.93 0.88 0.52
G812 Elementary and secondary school teacher assistants 880 0.61 0.71 0.45 G813 Early childhood educators/ assistants 860 0.60 0.64 0.80 G814 Babysitters, nannies, parents' helpers 1,080 0.75 0.64 0.60 G9 Sales and service occupations, n.e.c. 15,885 11.05 10.33 7.49 G91 Technical occupations in personal service 950 0.66 0.67 0.57 G911 Hairstylists and barbers 895 0.62 0.64 0.54 G912 Funeral directors and embalmers 55 0.04 0.03 0.03 G92 Other occupations in personal service 345 0.24 0.20 0.25 G921 Image, social and other personal consultants 10 0.01 0.00 0.02 G922 Estheticians, electrologists and related occupations 165 0.11 0.11 0.14 G923 Pet groomers and animal care workers 185 0.13 0.09 0.08 G924 Other personal service occupations 0 0.00 0.00 0.01 G93 Cleaners 5,385 3.75 3.90 2.52 G931 Light duty cleaners 2,210 1.54 1.68 1.08 G932 Specialized cleaners 405 0.28 0.26 0.20 G933 Janitors, caretakers and building superintendents 2,770 1.93 1.96 1.25 G94 Butchers and bakers, retail and wholesale 790 0.55 0.55 0.38 G941 Butchers / meat cutters, retail and wholesale 340 0.24 0.22 0.13 G942 Bakers 460 0.32 0.32 0.25 G96 Food counter attendants, kitchen helpers and related occupations
3,615 2.51 2.30 1.95
G960 Food counter attendants, kitchen helpers and related occupations
3,615 2.51 2.30 1.95
G97 Other sales and related occupations 4,300 2.99 2.39 1.50 G971 Service station attendants 720 0.50 0.52 0.20 G972 Grocery clerks and shelf stockers 1,455 1.01 1.01 0.87 G973 Other elemental sales occupations 2,140 1.49 0.85 0.43 G98 Other elemental service occupations 500 0.35 0.32 0.32 G981 Dry cleaning and laundry occupations 265 0.18 0.17 0.11 G982 Ironing, pressing and finishing occupations 10 0.01 0.01 0.03 G983 Other elemental service occupations 220 0.15 0.13 0.18
Source: Statistics Canada, Census of Canada, 2001, Custom Tabulation. * Includes Districts of Nipissing, Sudbury, Parry Sound, and the Greater Sudbury Division.
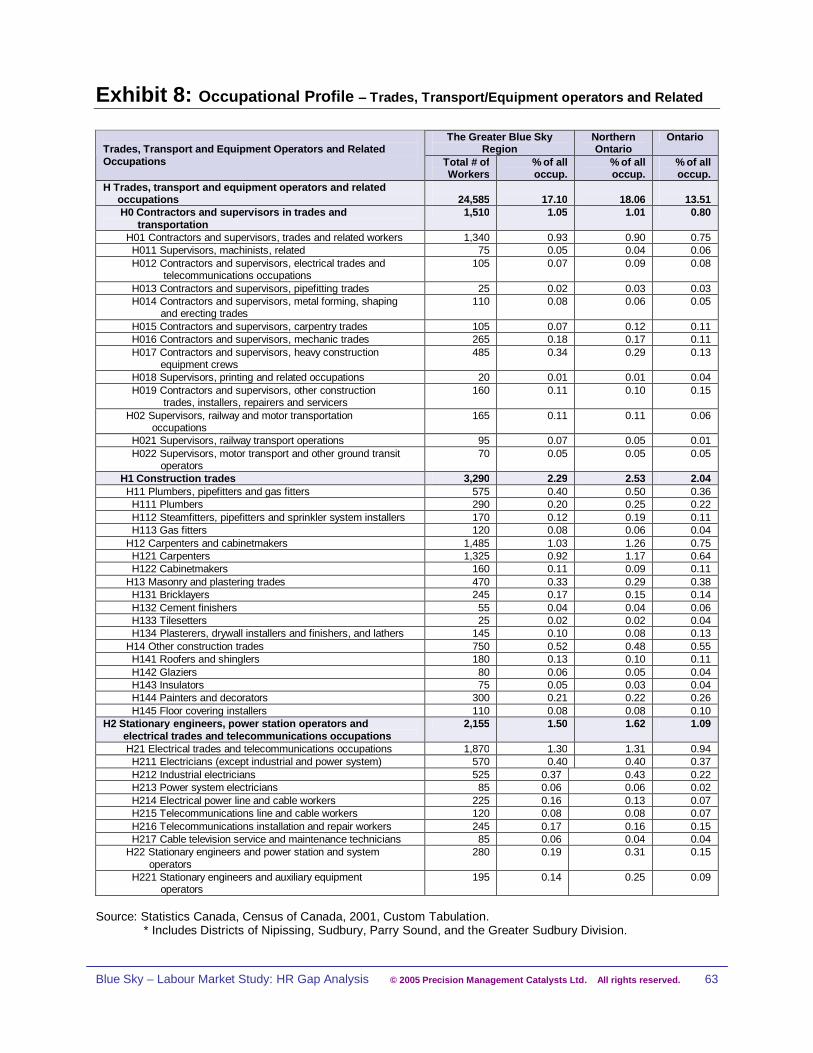
Blue Sky – Labour Market Study: HR Gap Analysis © 2005 Precision Management Catalysts Ltd. All rights reserved. 63
Exhibit 8: Occupational Profile Trades, Transport/Equipment operators and Related
The Greater Blue SkyRegion
NorthernOntario
OntarioTrades, Transport and Equipment Operators and RelatedOccupations Total # of
Workers% of alloccup.
% of alloccup.
% of alloccup.
H Trades, transport and equipment operators and related occupations 24,585 17.10 18.06 13.51 H0 Contractors and supervisors in trades and transportation
1,510 1.05 1.01 0.80
H01 Contractors and supervisors, trades and related workers 1,340 0.93 0.90 0.75 H011 Supervisors, machinists, related 75 0.05 0.04 0.06 H012 Contractors and supervisors, electrical trades and telecommunications occupations
105 0.07 0.09 0.08
H013 Contractors and supervisors, pipefitting trades 25 0.02 0.03 0.03 H014 Contractors and supervisors, metal forming, shaping and erecting trades
110 0.08 0.06 0.05
H015 Contractors and supervisors, carpentry trades 105 0.07 0.12 0.11 H016 Contractors and supervisors, mechanic trades 265 0.18 0.17 0.11 H017 Contractors and supervisors, heavy construction equipment crews
485 0.34 0.29 0.13
H018 Supervisors, printing and related occupations 20 0.01 0.01 0.04 H019 Contractors and supervisors, other construction trades, installers, repairers and servicers
160 0.11 0.10 0.15
H02 Supervisors, railway and motor transportation occupations
165 0.11 0.11 0.06
H021 Supervisors, railway transport operations 95 0.07 0.05 0.01 H022 Supervisors, motor transport and other ground transit operators
70 0.05 0.05 0.05
H1 Construction trades 3,290 2.29 2.53 2.04 H11 Plumbers, pipefitters and gas fitters 575 0.40 0.50 0.36 H111 Plumbers 290 0.20 0.25 0.22 H112 Steamfitters, pipefitters and sprinkler system installers 170 0.12 0.19 0.11 H113 Gas fitters 120 0.08 0.06 0.04 H12 Carpenters and cabinetmakers 1,485 1.03 1.26 0.75 H121 Carpenters 1,325 0.92 1.17 0.64 H122 Cabinetmakers 160 0.11 0.09 0.11 H13 Masonry and plastering trades 470 0.33 0.29 0.38 H131 Bricklayers 245 0.17 0.15 0.14 H132 Cement finishers 55 0.04 0.04 0.06 H133 Tilesetters 25 0.02 0.02 0.04 H134 Plasterers, drywall installers and finishers, and lathers 145 0.10 0.08 0.13 H14 Other construction trades 750 0.52 0.48 0.55 H141 Roofers and shinglers 180 0.13 0.10 0.11 H142 Glaziers 80 0.06 0.05 0.04 H143 Insulators 75 0.05 0.03 0.04 H144 Painters and decorators 300 0.21 0.22 0.26 H145 Floor covering installers 110 0.08 0.08 0.10H2 Stationary engineers, power station operators and electrical trades and telecommunications occupations
2,155 1.50 1.62 1.09
H21 Electrical trades and telecommunications occupations 1,870 1.30 1.31 0.94 H211 Electricians (except industrial and power system) 570 0.40 0.40 0.37 H212 Industrial electricians 525 0.37 0.43 0.22 H213 Power system electricians 85 0.06 0.06 0.02 H214 Electrical power line and cable workers 225 0.16 0.13 0.07 H215 Telecommunications line and cable workers 120 0.08 0.08 0.07 H216 Telecommunications installation and repair workers 245 0.17 0.16 0.15 H217 Cable television service and maintenance technicians 85 0.06 0.04 0.04 H22 Stationary engineers and power station and system operators
280 0.19 0.31 0.15
H221 Stationary engineers and auxiliary equipment operators
195 0.14 0.25 0.09
Source: Statistics Canada, Census of Canada, 2001, Custom Tabulation.* Includes Districts of Nipissing, Sudbury, Parry Sound, and the Greater Sudbury Division.
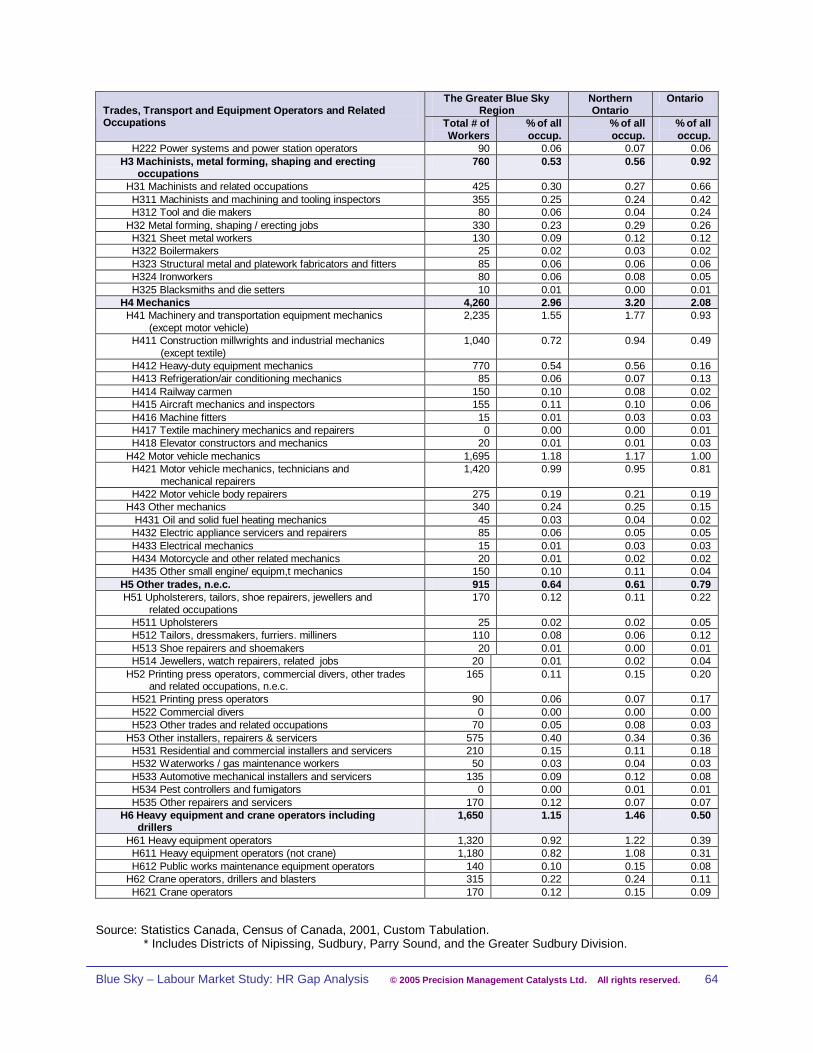
Blue Sky – Labour Market Study: HR Gap Analysis © 2005 Precision Management Catalysts Ltd. All rights reserved. 64
The Greater Blue SkyRegion
NorthernOntario
OntarioTrades, Transport and Equipment Operators and RelatedOccupations Total # of
Workers% of alloccup.
% of alloccup.
% of alloccup.
H222 Power systems and power station operators 90 0.06 0.07 0.06 H3 Machinists, metal forming, shaping and erecting occupations
760 0.53 0.56 0.92
H31 Machinists and related occupations 425 0.30 0.27 0.66 H311 Machinists and machining and tooling inspectors 355 0.25 0.24 0.42 H312 Tool and die makers 80 0.06 0.04 0.24 H32 Metal forming, shaping / erecting jobs 330 0.23 0.29 0.26 H321 Sheet metal workers 130 0.09 0.12 0.12 H322 Boilermakers 25 0.02 0.03 0.02 H323 Structural metal and platework fabricators and fitters 85 0.06 0.06 0.06 H324 Ironworkers 80 0.06 0.08 0.05 H325 Blacksmiths and die setters 10 0.01 0.00 0.01 H4 Mechanics 4,260 2.96 3.20 2.08 H41 Machinery and transportation equipment mechanics (except motor vehicle)
2,235 1.55 1.77 0.93
H411 Construction millwrights and industrial mechanics (except textile)
1,040 0.72 0.94 0.49
H412 Heavy-duty equipment mechanics 770 0.54 0.56 0.16 H413 Refrigeration/air conditioning mechanics 85 0.06 0.07 0.13 H414 Railway carmen 150 0.10 0.08 0.02 H415 Aircraft mechanics and inspectors 155 0.11 0.10 0.06 H416 Machine fitters 15 0.01 0.03 0.03 H417 Textile machinery mechanics and repairers 0 0.00 0.00 0.01 H418 Elevator constructors and mechanics 20 0.01 0.01 0.03 H42 Motor vehicle mechanics 1,695 1.18 1.17 1.00 H421 Motor vehicle mechanics, technicians and mechanical repairers
1,420 0.99 0.95 0.81
H422 Motor vehicle body repairers 275 0.19 0.21 0.19 H43 Other mechanics 340 0.24 0.25 0.15 H431 Oil and solid fuel heating mechanics 45 0.03 0.04 0.02 H432 Electric appliance servicers and repairers 85 0.06 0.05 0.05 H433 Electrical mechanics 15 0.01 0.03 0.03 H434 Motorcycle and other related mechanics 20 0.01 0.02 0.02 H435 Other small engine/ equipm,t mechanics 150 0.10 0.11 0.04 H5 Other trades, n.e.c. 915 0.64 0.61 0.79 H51 Upholsterers, tailors, shoe repairers, jewellers and related occupations
170 0.12 0.11 0.22
H511 Upholsterers 25 0.02 0.02 0.05 H512 Tailors, dressmakers, furriers. milliners 110 0.08 0.06 0.12 H513 Shoe repairers and shoemakers 20 0.01 0.00 0.01 H514 Jewellers, watch repairers, related jobs 20 0.01 0.02 0.04 H52 Printing press operators, commercial divers, other trades and related occupations, n.e.c.
165 0.11 0.15 0.20
H521 Printing press operators 90 0.06 0.07 0.17 H522 Commercial divers 0 0.00 0.00 0.00 H523 Other trades and related occupations 70 0.05 0.08 0.03 H53 Other installers, repairers & servicers 575 0.40 0.34 0.36 H531 Residential and commercial installers and servicers 210 0.15 0.11 0.18 H532 Waterworks / gas maintenance workers 50 0.03 0.04 0.03 H533 Automotive mechanical installers and servicers 135 0.09 0.12 0.08 H534 Pest controllers and fumigators 0 0.00 0.01 0.01 H535 Other repairers and servicers 170 0.12 0.07 0.07 H6 Heavy equipment and crane operators including drillers
1,650 1.15 1.46 0.50
H61 Heavy equipment operators 1,320 0.92 1.22 0.39 H611 Heavy equipment operators (not crane) 1,180 0.82 1.08 0.31 H612 Public works maintenance equipment operators 140 0.10 0.15 0.08 H62 Crane operators, drillers and blasters 315 0.22 0.24 0.11 H621 Crane operators 170 0.12 0.15 0.09
Source: Statistics Canada, Census of Canada, 2001, Custom Tabulation.* Includes Districts of Nipissing, Sudbury, Parry Sound, and the Greater Sudbury Division.

Blue Sky – Labour Market Study: HR Gap Analysis © 2005 Precision Management Catalysts Ltd. All rights reserved. 65
The Greater Blue SkyRegion
NorthernOntario
OntarioTrades, Transport and Equipment Operators and RelatedOccupations Total # of
Workers% of alloccup.
% of alloccup.
% of alloccup.
H622 Drillers and blasters - Surface mining, quarrying and construction
130 0.09 0.08 0.01
H623 Water well drillers 10 0.01 0.02 0.01 H7 Transportation equipment operators and related workers, excluding labourers
6,655 4.63 4.68 3.08
H71 Motor vehicle and transit drivers 5,770 4.01 4.04 2.91 H711 Truck drivers 3,290 2.29 2.50 1.56 H712 Bus drivers and subway and other transit operators 1,200 0.83 0.70 0.46 H713 Taxi / limousine drivers and chauffeurs 360 0.25 0.26 0.26 H714 Delivery drivers 925 0.64 0.58 0.63 H72 Train crew operating occupations 490 0.34 0.36 0.07 H721 Railway and yard locomotive engineers 235 0.16 0.19 0.04
H722 Railway conductors and brakemen250 0.17 0.17 0.03
H73 Other transport equipment operators and related workers 395 0.27 0.28 0.11 H731 Railway yard workers 55 0.04 0.04 0.01 H732 Railway track maintenance workers 300 0.21 0.14 0.02 H733 Deck crew, water transport 10 0.01 0.01 0.01 H734 Engine room crew, water transport 10 0.01 0.01 0.00 H735 Lock/cable ferry operators, and related 20 0.01 0.02 0.01 H736 Boat operators 0 0.00 0.01 0.00 H737 Air transport ramp attendants 10 0.01 0.05 0.06H8 Trades helpers, construction and transportation labourers and related occupations
3,405 2.37 2.40 2.20
H81 Longshore workers and material handlers 1,275 0.89 0.86 1.28 H811 Longshore workers 20 0.01 0.05 0.01 H812 Material handlers 1,265 0.88 0.82 1.26 H82 Trades helpers and labourers 1,725 1.20 1.27 0.80 H821 Construction trades helpers / labourers 1,575 1.10 1.15 0.73 H822 Other trades helpers and labourers 140 0.10 0.12 0.07 H83 Public works and other labourers, n.e.c. 420 0.29 0.27 0.13 H831 Public works /maintenance labourers 305 0.21 0.21 0.11 H832 Railway and motor transport labourers 115 0.08 0.06 0.02
Source: Statistics Canada, Census of Canada, 2001, Custom Tabulation. * Includes Districts of Nipissing, Sudbury, Parry Sound, and the Greater Sudbury Division.
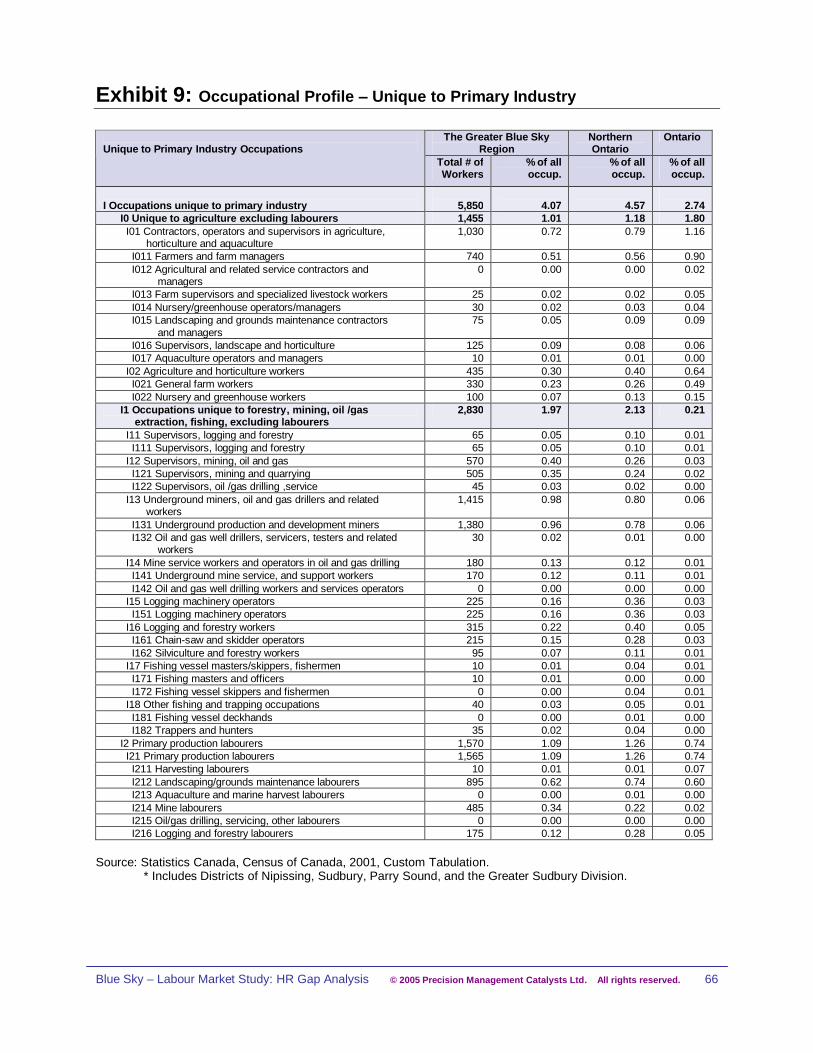
Blue Sky – Labour Market Study: HR Gap Analysis © 2005 Precision Management Catalysts Ltd. All rights reserved. 66
Exhibit 9: Occupational Profile Unique to Primary Industry
The Greater Blue SkyRegion
NorthernOntario
OntarioUnique to Primary Industry Occupations
Total # ofWorkers
% of alloccup.
% of alloccup.
% of alloccup.
I Occupations unique to primary industry 5,850 4.07 4.57 2.74 I0 Unique to agriculture excluding labourers 1,455 1.01 1.18 1.80 I01 Contractors, operators and supervisors in agriculture, horticulture and aquaculture
1,030 0.72 0.79 1.16
I011 Farmers and farm managers 740 0.51 0.56 0.90 I012 Agricultural and related service contractors and managers
0 0.00 0.00 0.02
I013 Farm supervisors and specialized livestock workers 25 0.02 0.02 0.05 I014 Nursery/greenhouse operators/managers 30 0.02 0.03 0.04 I015 Landscaping and grounds maintenance contractors and managers
75 0.05 0.09 0.09
I016 Supervisors, landscape and horticulture 125 0.09 0.08 0.06 I017 Aquaculture operators and managers 10 0.01 0.01 0.00 I02 Agriculture and horticulture workers 435 0.30 0.40 0.64 I021 General farm workers 330 0.23 0.26 0.49 I022 Nursery and greenhouse workers 100 0.07 0.13 0.15 I1 Occupations unique to forestry, mining, oil /gas extraction, fishing, excluding labourers
2,830 1.97 2.13 0.21
I11 Supervisors, logging and forestry 65 0.05 0.10 0.01 I111 Supervisors, logging and forestry 65 0.05 0.10 0.01 I12 Supervisors, mining, oil and gas 570 0.40 0.26 0.03 I121 Supervisors, mining and quarrying 505 0.35 0.24 0.02 I122 Supervisors, oil /gas drilling ,service 45 0.03 0.02 0.00 I13 Underground miners, oil and gas drillers and related workers
1,415 0.98 0.80 0.06
I131 Underground production and development miners 1,380 0.96 0.78 0.06 I132 Oil and gas well drillers, servicers, testers and related workers
30 0.02 0.01 0.00
I14 Mine service workers and operators in oil and gas drilling 180 0.13 0.12 0.01 I141 Underground mine service, and support workers 170 0.12 0.11 0.01 I142 Oil and gas well drilling workers and services operators 0 0.00 0.00 0.00 I15 Logging machinery operators 225 0.16 0.36 0.03 I151 Logging machinery operators 225 0.16 0.36 0.03 I16 Logging and forestry workers 315 0.22 0.40 0.05 I161 Chain-saw and skidder operators 215 0.15 0.28 0.03 I162 Silviculture and forestry workers 95 0.07 0.11 0.01 I17 Fishing vessel masters/skippers, fishermen 10 0.01 0.04 0.01 I171 Fishing masters and officers 10 0.01 0.00 0.00 I172 Fishing vessel skippers and fishermen 0 0.00 0.04 0.01 I18 Other fishing and trapping occupations 40 0.03 0.05 0.01 I181 Fishing vessel deckhands 0 0.00 0.01 0.00 I182 Trappers and hunters 35 0.02 0.04 0.00 I2 Primary production labourers 1,570 1.09 1.26 0.74 I21 Primary production labourers 1,565 1.09 1.26 0.74 I211 Harvesting labourers 10 0.01 0.01 0.07 I212 Landscaping/grounds maintenance labourers 895 0.62 0.74 0.60 I213 Aquaculture and marine harvest labourers 0 0.00 0.01 0.00 I214 Mine labourers 485 0.34 0.22 0.02 I215 Oil/gas drilling, servicing, other labourers 0 0.00 0.00 0.00 I216 Logging and forestry labourers 175 0.12 0.28 0.05
Source: Statistics Canada, Census of Canada, 2001, Custom Tabulation.* Includes Districts of Nipissing, Sudbury, Parry Sound, and the Greater Sudbury Division.

Blue Sky – Labour Market Study: HR Gap Analysis © 2005 Precision Management Catalysts Ltd. All rights reserved. 67
Exhibit 10: Occupational Profile Unique to Processing, Manufacturing, Utilities
The Greater Blue SkyRegion
NorthernOntario
OntarioProcessing, Manufacturing, and Utilities Occupations
Total # ofWorkers
% of alloccup.
% of alloccup.
% of alloccup.
J Occupations unique to processing, manufacturing and utilities 6,555 4.56 6.00 8.81 J0 Supervisors in manufacturing 465 0.32 0.58 0.68 J01 Supervisors, processing occupations 370 0.26 0.52 0.35 J011 Supervisors, mineral and metal processing 65 0.05 0.13 0.07 J012 Supervisors, petroleum, gas and chemical processing and utilities
75 0.05 0.06 0.07
J013 Supervisors, food, beverage and tobacco processing 15 0.01 0.01 0.08 J014 Supervisors, plastic and rubber products manufacturing
10 0.01 0.00 0.07
J015 Supervisors, forest products processing 215 0.15 0.32 0.04 J016 Supervisors, textile processing 10 0.01 0.00 0.02 J02 Supervisors, assembly and fabrication 95 0.07 0.06 0.33 J021 Supervisors, motor vehicle assembling 20 0.01 0.01 0.09 J022 Supervisors, electronics manufacturing 0 0.00 0.00 0.04 J023 Supervisors, electrical products manufacturing 10 0.01 0.01 0.02 J024 Supervisors, furniture and fixtures manufacturing 10 0.01 0.00 0.03 J025 Supervisors, fabric, fur and leather products manufacturing
0 0.00 0.00 0.02
J026 Supervisors, other mechanical and metal products manufacturing
20 0.01 0.02 0.07
J027 Supervisors, other products manufacturing and assembly
35 0.02 0.01 0.05
J1 Machine operators in manufacturing 3,690 2.57 3.16 3.64 J11 Central control and process operators in manufacturing and processing
285 0.20 0.32 0.11
J111 Central control and process operators, mineral and metal processing
120 0.08 0.10 0.04
J112 Petroleum, gas and chemical process operators 95 0.07 0.04 0.05 J113 Pulping control operators 10 0.01 0.04 0.00 J114 Papermaking and coating control operators 60 0.04 0.14 0.02 J12 Machine operators and related workers in metal and mineral products processing
365 0.25 0.32 0.36
J121 Machine operators, mineral and metal processing 140 0.10 0.15 0.12 J122 Foundry workers 90 0.06 0.08 0.09 J123 Glass forming and finishing machine operators and glass cutters
20 0.01 0.02 0.05
J124 Concrete, clay, stone forming operators 90 0.06 0.05 0.06 J125 Inspectors and testers, mineral and metal processing 25 0.02 0.03 0.05 J13 Machine operators and related workers in chemical, plastic and rubber processing
335 0.23 0.19 0.47
J131 Chemical plant machine operators 70 0.05 0.03 0.09 J132 Plastics processing machine operators 95 0.07 0.04 0.26 J133 Rubber processing machine operators and related workers
50 0.03 0.03 0.08
J134 Water and waste plant operators 120 0.08 0.10 0.04 J14 Machine operators and related workers in pulp and paper production and wood processing
715 0.50 1.04 0.21
J141 Sawmill machine operators 230 0.16 0.30 0.04 J142 Pulp mill machine operators 85 0.06 0.16 0.02 J143 Papermaking and finishing machine operators
55 0.04 0.15 0.03
J144 Other wood processing machine operators 220 0.15 0.23 0.04 J145 Paper converting machine operators 30 0.02 0.05 0.07 J146 Lumber graders and other wood processing inspectors and graders
120 0.08 0.15 0.02
Source: Statistics Canada, Census of Canada, 2001, Custom Tabulation.* Includes Districts of Nipissing, Sudbury, Parry Sound, and the Greater Sudbury Division.
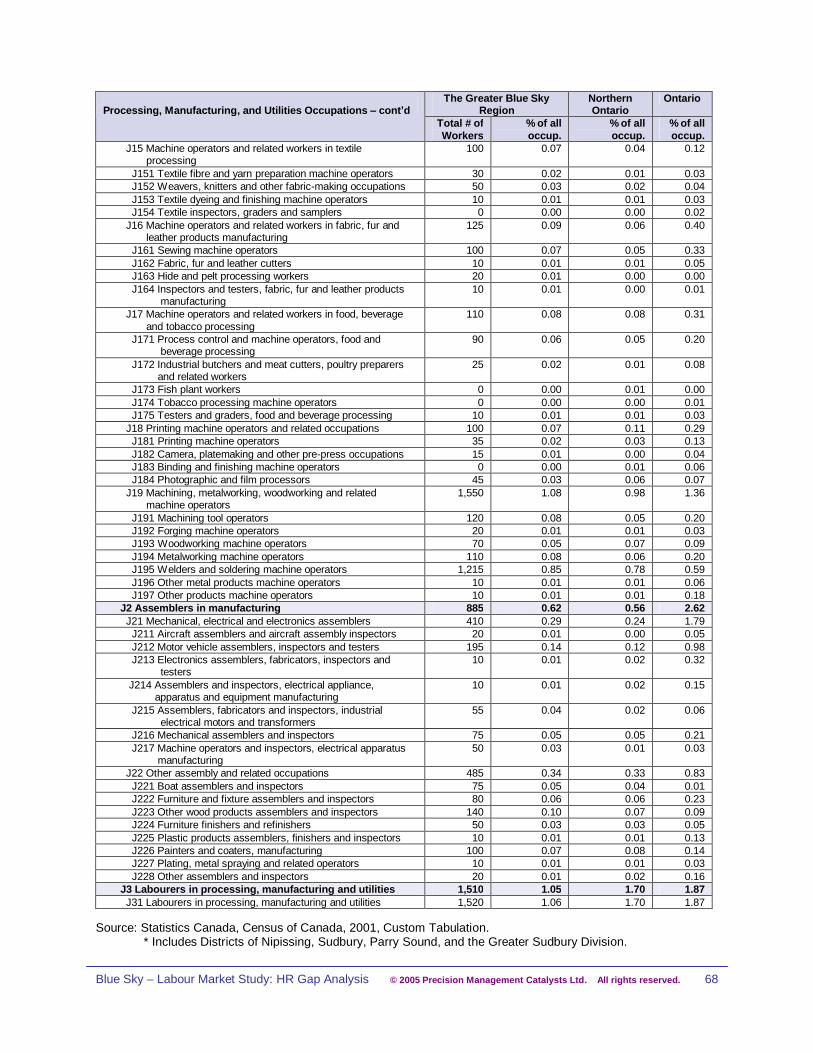
Blue Sky – Labour Market Study: HR Gap Analysis © 2005 Precision Management Catalysts Ltd. All rights reserved. 68
The Greater Blue SkyRegion
NorthernOntario
OntarioProcessing, Manufacturing, and Utilities Occupations cont d
Total # ofWorkers
% of alloccup.
% of alloccup.
% of alloccup.
J15 Machine operators and related workers in textile processing
100 0.07 0.04 0.12
J151 Textile fibre and yarn preparation machine operators 30 0.02 0.01 0.03 J152 Weavers, knitters and other fabric-making occupations 50 0.03 0.02 0.04 J153 Textile dyeing and finishing machine operators 10 0.01 0.01 0.03 J154 Textile inspectors, graders and samplers 0 0.00 0.00 0.02 J16 Machine operators and related workers in fabric, fur and leather products manufacturing
125 0.09 0.06 0.40
J161 Sewing machine operators 100 0.07 0.05 0.33 J162 Fabric, fur and leather cutters 10 0.01 0.01 0.05 J163 Hide and pelt processing workers 20 0.01 0.00 0.00 J164 Inspectors and testers, fabric, fur and leather products manufacturing
10 0.01 0.00 0.01
J17 Machine operators and related workers in food, beverage and tobacco processing
110 0.08 0.08 0.31
J171 Process control and machine operators, food and beverage processing
90 0.06 0.05 0.20
J172 Industrial butchers and meat cutters, poultry preparers and related workers
25 0.02 0.01 0.08
J173 Fish plant workers 0 0.00 0.01 0.00 J174 Tobacco processing machine operators 0 0.00 0.00 0.01 J175 Testers and graders, food and beverage processing 10 0.01 0.01 0.03 J18 Printing machine operators and related occupations 100 0.07 0.11 0.29 J181 Printing machine operators 35 0.02 0.03 0.13 J182 Camera, platemaking and other pre-press occupations 15 0.01 0.00 0.04 J183 Binding and finishing machine operators 0 0.00 0.01 0.06 J184 Photographic and film processors 45 0.03 0.06 0.07 J19 Machining, metalworking, woodworking and related machine operators
1,550 1.08 0.98 1.36
J191 Machining tool operators 120 0.08 0.05 0.20 J192 Forging machine operators 20 0.01 0.01 0.03 J193 Woodworking machine operators 70 0.05 0.07 0.09 J194 Metalworking machine operators 110 0.08 0.06 0.20 J195 Welders and soldering machine operators 1,215 0.85 0.78 0.59 J196 Other metal products machine operators 10 0.01 0.01 0.06 J197 Other products machine operators 10 0.01 0.01 0.18 J2 Assemblers in manufacturing 885 0.62 0.56 2.62 J21 Mechanical, electrical and electronics assemblers 410 0.29 0.24 1.79 J211 Aircraft assemblers and aircraft assembly inspectors 20 0.01 0.00 0.05 J212 Motor vehicle assemblers, inspectors and testers 195 0.14 0.12 0.98 J213 Electronics assemblers, fabricators, inspectors and testers
10 0.01 0.02 0.32
J214 Assemblers and inspectors, electrical appliance, apparatus and equipment manufacturing
10 0.01 0.02 0.15
J215 Assemblers, fabricators and inspectors, industrial electrical motors and transformers
55 0.04 0.02 0.06
J216 Mechanical assemblers and inspectors 75 0.05 0.05 0.21 J217 Machine operators and inspectors, electrical apparatus manufacturing
50 0.03 0.01 0.03
J22 Other assembly and related occupations 485 0.34 0.33 0.83 J221 Boat assemblers and inspectors 75 0.05 0.04 0.01 J222 Furniture and fixture assemblers and inspectors 80 0.06 0.06 0.23 J223 Other wood products assemblers and inspectors 140 0.10 0.07 0.09 J224 Furniture finishers and refinishers 50 0.03 0.03 0.05 J225 Plastic products assemblers, finishers and inspectors 10 0.01 0.01 0.13 J226 Painters and coaters, manufacturing 100 0.07 0.08 0.14 J227 Plating, metal spraying and related operators 10 0.01 0.01 0.03 J228 Other assemblers and inspectors 20 0.01 0.02 0.16 J3 Labourers in processing, manufacturing and utilities 1,510 1.05 1.70 1.87 J31 Labourers in processing, manufacturing and utilities 1,520 1.06 1.70 1.87
Source: Statistics Canada, Census of Canada, 2001, Custom Tabulation.* Includes Districts of Nipissing, Sudbury, Parry Sound, and the Greater Sudbury Division.

Blue Sky – Labour Market Study: HR Gap Analysis © 2005 Precision Management Catalysts Ltd. All rights reserved. 69
The Greater Blue SkyRegion
NorthernOntario
OntarioProcessing, Manufacturing, and Utilities Occupations con t
Total # ofWorkers
% of alloccup.
% of alloccup.
% of alloccup.
J311 Labourers in mineral and metal processing 210 0.15 0.20 0.14 J312 Labourers in metal fabrication 155 0.11 0.11 0.20 J313 Labourers in chemical products processing and utilities 45 0.03 0.03 0.08 J314 Labourers in wood, pulp and paper processing 565 0.39 1.04 0.16 J315 Labourers in rubber / plastic products manufacturing 90 0.06 0.05 0.16 J316 Labourers in textile processing 45 0.03 0.01 0.06 J317 Labourers in food, beverage and tobacco processing 215 0.15 0.12 0.44 J318 Labourers in fish processing 0 0.00 0.00 0.01 J319 Other labourers in processing, manufacturing & utilities 210 0.15 0.14 0.61
Source: Statistics Canada, Census of Canada, 2001, Custom Tabulation. * Includes Districts of Nipissing, Sudbury, Parry Sound, and the Greater Sudbury Division.

Blue Sky – Labour Market Study: HR Gap Analysis © 2005 Precision Management Catalysts Ltd. All rights reserved. 70
Bibliography
Anishinabek Educational Institute. Anishinabek, Canadore College Announce New Partnership, January,2003, http://www.anishinabek.ca/uoi/aeicc_agree.htm.
Cowan, Liz. Business Journal. “Support Sought for Softwood Fight,” November, 2005, pp. 1-2.
Cramer, Brandi. North Bay Nugget, “Broadening the Scope,” September 20, 2005, p B1.
Cramer, Brandi. North Bay Nugget, “Cementation Named Business of the Year,” November 19, 2005, p.A3.
Cramer, Brandi. North Bay Nugget, “Canadore to Build New Electrical and Plumbing Lab,” November 9,2005, p. A3.
Burt, Michael. Canada’s Information Technology Communications Industry: Industrial Outlook, Ottawa,The Conference Board of Canada, Spring 2005, pp.1-2.
Dale, Dave. North Bay Nugget, “Doctor Recruitment Paying Off,” August 8, 2005, pp. A1-A2.
Dumont-Beckett, Karole. "Five-week Shut Down at Some Tembec Mills," Labour Market Bulletin, HumanResource Centre of Canada, North Bay, May, 2003, p. 2.
Dupuy, Richard, Mayer, Francine, and Morissette, René. Rural Youth: Stayers, Leavers and ReturnMigrants, Canadian Rural Partnership, 2000, No. 152, Research Paper Series, Analytical Studies Branch,Statistics Canada, p.4.
Economic Partners, Sudbury East. "Hourly Wage Survey," Sudbury East Community Profile 2003,http://www.economicpartners.com/PDF/Community%20Profile%202003%20-%20Sudbury%20East%20-%20SE.pdf, p. 10.
Economic Partners, Sudbury East-West Nipissing. "Hourly Wage Survey," Sudbury East –Markstay-Warren Community Profile 2003,http://www.economicpartners.com/PDF/Community%20Profile%202003%20-%20Markstay-Warren%20-%20SE.pdf, p. 15.
Economic Partners, Sudbury East-West Nipissing. "Hourly Wage Survey," West Nipissing CommunityProfile 2003, p. 11.
Education, Nova Scotia Department of. Bilingualism in the Canadian Labour Market,http://cpfns.ednet.ns.ca/data/resource/bilingual.pdf, p. 17.
Foot, David K., Boom, Bust and Echo, Macfarlane Walter & Ross, p. 19.
Fowlie, Jonathan. "Stumpage at Heart of Dispute," The Globe and Mail, August 14, 2003, p. B4.
Frenette, Marc. "Too Far to Go On? Distance to School and University Participation," Catalogue No.11F0019MIE – No. 191, Statistics Canada, June 19, 2002.
Galt, Virginia. Globe and Mail, “Keeping Key Workers a Tougher Task,” October 25, 2005, p. B6.
Gill, Alison, Women in Isolated Resource Towns: An Examination of Gender Differences in CognitiveStructures, Geoforum 21(3), pp. 347-358, 1990.
Hearst, Town of. "Hourly Wage Survey," Hearst Community Profile 2000,http://www.nordaski.com/fhearst1.htm
Himelfarb, Alex. "The Social Characteristics of Single Industry Towns," R.T. Bowles (ed) LittleCommunities and Big Industry, Toronto, Butterworths, 1982.
Blue Sky – Labour Market Study: HR Gap Analysis © 2005 Precision Management Catalysts Ltd. All rights reserved. 71
Hornepayne, Town of. "Hourly Wage Survey," Hornepayne Community Profile 2000,http://www.nordaski.com/fhorn1.htm#Income.
Indian and Northern Affairs Canada. Some Fast Facts on the Funding of Aboriginal Programs, March,2000, http://www.ainc-inac.gc.ca/nr/prs/j-a2000/mar7_e.html.
Industry Canada, Overview of Canada’s Service Economy, March 2001, Queen’s Printer, pp. 11.
Jedwab, Jack. It Pays to be Bilingual in Canada, Association for Canadian Studies, http://www.acs-aec.ca/Polls/Poll53.pdf, November, 2005, pp. 1-4.
Kitchener, City of. "Hourly Wage Survey," Kitchener Community Profile 2002,http://www.city.kitchener.on.ca/pdf/city_profile_2002.pdf, February, 2002, p. 13.
Laurentian University. Course Calendar 2005-06, November 3, 2005.
Leblanc, Daniel. Globe and Mail, “Martin Takes Trade Message to Radio Airwaves,” October 31, 2005, p.A6.
Marotte, Bertrand. Globe and Mail, “Abitibi Announces Shutdowns as Forestry Slump Drags On,” July 28,2005, pp. B1, B4.
Ministry of Health and Long-term Care. “Tuition Support Program for Nurses,” on-line available athttp://www.health.gov.on.ca/english/providers/ministry/recruit/tuition_nurs.html, November 5, 2005.
Ministry of Natural Resources. “Loan Guarantee Program,” on-line available November 6, 2005 athttp://ontariosforests.mnr.gov.on.ca/sector.cfm.
Nipissing University. Dynamic Academic Calendar, Year 2005-2006, November 3, 2005,http://www.nipissingu.ca/calendar/downloads/Cal05-06.pdf.
North Bay Human Resource Centre of Canada. Labour Market Bulletin, First Quarter 2004 and FirstQuarter 2005.
Northern College. Haileybury School of Mines Programs, on-line available August 2, 2005 athttp://www.northernc.on.ca/programs/mining.html.
Ontario Ministry of Northern Development and Mines, Ministry of. Youth Migration: NorthernPerspectives: The Northern Development Councils’ Report, Thunder Bay, 1991.
Ontario Ministry of Finance. Update to Ontario Population Projections 2001-2028, August 2002,http://www.gov.on.ca/FIN/english/demographics/demog02e.htm.
Osprey News Network. Business Journal, “J&J Machine Works has Plans to Grow,” November, 2005, p.27.
Finance, Ontario Ministry of. Update to Ontario Population Projections 2001-2028, Queen's Printer,August 2002, pp. 6, 12, and 15.
Picot, G., Heisz, A., and Nakamura, A. Job Tenure, Worker Mobility and the Youth Labour Market Duringthe 1990’s, No. 155, Research Paper Series, Analytical Studies Branch, Statistics Canada, pp. 5-6.
Precision Management Catalysts. "Interviews with 112 Blue Sky Profit and Not-for-Profit Employers,"July-Oct, 2005.
R.A. Malatest & Associates Ltd., Rural Youth Migration: Exploring the Reality Behind the Myths,Canadian Rural Partnership, 2002.
Rothwell, Neil, Bollman, Ray D.,Tremblay, Juno and Marshall, Jeff. Recent Migration Patterns in Ruraland Small Town Canada, Agriculture and Rural Working Paper, Series Working Paper No. 55, AgricultureDivision, Statistics Canada, 2002.
Blue Sky – Labour Market Study: HR Gap Analysis © 2005 Precision Management Catalysts Ltd. All rights reserved. 72
Royal LePage. Survey of Canadian Housing Prices, Fourth Quarter 2004, on-line available September14, 2004 http://www.royallepage.ca/CMSTemplates/GlobalNavTemplate.aspx?id=128
Sankey, Derek. North Bay Nugget, “Tech Rebound Spurs Demand for IT Expertise,” September 24,2005, p. C1.
Society of American Foresters. “NAFTA Rules United States Not Harmed by Canadian Softwood,” fromOctober 2004 issue of The Forestry Source, on-line available November 6, 2005 athttp://www.safnet.org/archive/1004_nafta.cfm.
Software Human Resource Council Expert Panel. Canada’s Information Technology Labour Market2005: Issues and Opinions, June 2005, p. 1, on-line available October 15, 2005 athttp://www.shrc.ca/lmi/expert_panel/index.html#1.
Southcott, Chris. Population Change in Northern Ontario: 1996 to 2001, 2001 Census Research PaperSeries: Report #1, North Bay: Northern Ontario Training Boards, 2002, p.6.
Southcott, Chris. Single Industry Towns in a Post-Industrial Era: Northwestern Ontario as a Case Study.Research Reports, Centre for Northern Studies, Lakehead University, 2000.
Southcott, Chris. Social and Economic Change in the Muskoka, Nipissing, and Parry Sound Regions:2001 Census Summary, January 5, 2004.
Southcott, Chris. Youth Out-migration in Northern Ontario 2001, Census Research Paper Series: Report#2, North Bay: Northern Ontario Training Boards, October, 2002, pp.11-12.
Southcott, Chris. A Regional Outlook for Northern Boards: A Northern Approach to Regional LabourForce Development, Dryden: Training Boards of Northern Ontario, 2000, p. 5-7.
Statistics Canada, CANSIM, Table 282-0002, July 31, 2002.
Statistics Canada, 1986, 1991, 1996, 2001 Census of Canada, data from Forms 1 and 2B.
Statistics Canada, 2001 Census of Canada, Community Profiles.
Statistics Canada. "Confidentiality and Random Rounding," 2001 Census Dictionary, Ottawa: Ministry ofIndustry, 2002, pp. 295-296.
Statistics Canada. "Mobility," 2001 Census Dictionary, April 22, 2002, on-line available athttp://www.statcan.ca/english/census2001/dict/pop079.htm.
Statistics Canada. Labour Force Survey, 1996 to 2005.
Statistics Canada. Occupational Profiles, Custom Tabulation, September, 2005.
Statistics Canada. Profile of the Canadian Population by Age and Sex: Canada Ages, Catalogue no.96F0030XIE2001002, 2002.
Statistics Canada. Shaping the Nation's Workforce: Immigrants, Demand for Skills, and an AgingPopulation, 2001 Census, October 15, 2005,http://www12.statcan.ca/english/census01/Products/Analytic/companion/paid/canada.cfm#5.
Statistics Canada. A Profile of the Canadian Population: Where We Live, Ottawa, 2001.
Suthey Holler Associates, Youth Out-Migration From The FNETB Area, Hearst: Far Northeast TrainingBoard, 2001, p.9.
Tremblay, Juno. Rural Youth Migration Between 1971 and 1996, Working Paper# 44, Agriculture Division,Statistics Canada, 2001.
Ubriaco, Gianni. Northern Business Journal, "College Boreal Offers Free Upgrading for Adults," August,2003, p. 18.

Blue Sky – Labour Market Study: HR Gap Analysis © 2005 Precision Management Catalysts Ltd. All rights reserved. 73
Won, Shirley. Globe and Mail, “Wanted: More Skilled Labour, and Quick,” November 7, 2005, pp. B1,B13.
World Resources Institute. "Demographics: Life Expectancy at Birth, Males and Females," Earthtrends:The Environmental Portal, on-line available September 9, 2003 athttp://earthtrends.wri.org/text/POP/variables/381.htm andhttp://earthtrends.wri.org/text/POP/variables/380.htm.
Young, Gord. North Bay Nugget, “Columbia to Lay Off 90 Workers,” August 11, 2005, pp. A1-A2.
Young, Gord. North Bay Nugget, “Forestry Aid Package Not Enough,” September 30, 2005, pp. A1, A4.
Young, Gord. North Bay Nugget, “Natural Resources Backbone of Economy ,” September 22, 2005, pp.A1, A3.