neutron transmutation doping in hanaro reactor...1. neutron transmutation doping . in hanaro...
TRANSCRIPT

1
Neutron Transmutation Doping in HANARO Reactor
IAEA Technical Meeting on “Products and Service of Research Reactors”
28 June- 2 July 2009, IAEA, Vienna, Austria
Sang-Jun [email protected]

2
INTRODUCTION
3
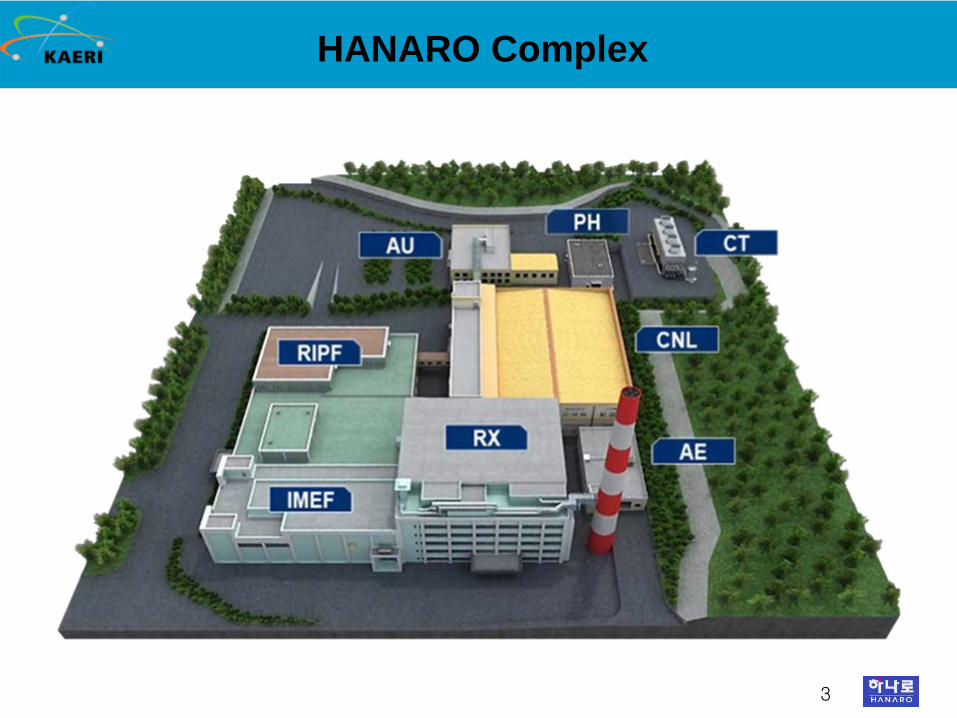
HANARO Complex

4
HANARO, Past and Present
5
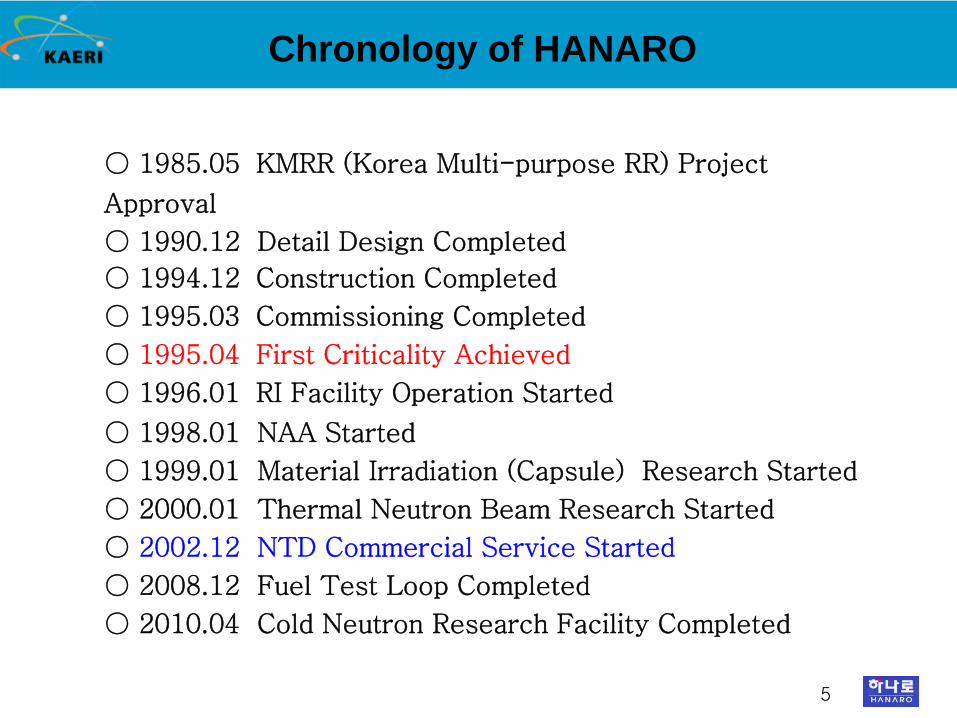
Chronology of HANARO
1985.05
KMRR (Korea Multi-purpose RR) Project
Approval
1990.12 Detail Design Completed
1994.12
Construction Completed
1995.03
Commissioning Completed
1995.04
First Criticality Achieved
1996.01
RI Facility Operation Started
1998.01 NAA Started
1999.01 Material Irradiation (Capsule) Research Started
2000.01 Thermal Neutron Beam Research Started
2002.12 NTD Commercial Service Started
2008.12 Fuel Test Loop Completed
2010.04 Cold Neutron Research Facility Completed

6
Reactor Type Open-tank-in-pool
Power 30 MWt
FuelLEU(19.75 % Enrichment)(U3Si-Al )
Coolant H2O
Moderator H2O/D2O
Reflector D2O
AbsorberHafnium
(4 SOR + 4 CAR)
Core CoolingUpward Forced Convection Flow
Secondary Cooling Cooling Tower
Reactor Building Confinement
HANARO Specification
7
NTD at HANARO

8
Irradiation Holes for NTD
NTD-1 NTD-2
Inner Dia. 220 mm 180 mm
Heighttotal 1200 mm (D2 O)
effective 700 mm (Fuel)
th
empty ~5.2×10¹³
with Si 3.5 ~ 3.8 ×10¹³
Cd Ratio (by Au) ~20max. ingot size
D 8 inch 6 inch
H 605 mm
Status6, 8 inch
in service5, 6 inch
in service
Two vertical holes in the D2 O reflector region (NTD1, NTD2)
NTD1
NTD2

9
‘01 ‘02 ‘03 ‘04 ‘05 ‘06 ‘07 ‘08 ‘09
1st feasibility study5” irradiation facility
(NTD2)
NTD Development Project
Start 5” irradiation service at NTD2
Test irradiation at NTD1
Start 6, 8” irradiation service
from 2009
Start 6” irradiation service at NTD2
study on NTD1 utilization6” irradiation facility
(NTD2)
full scale study on NTD16 & 8 inch irradiation facilities
(NTD1)
10
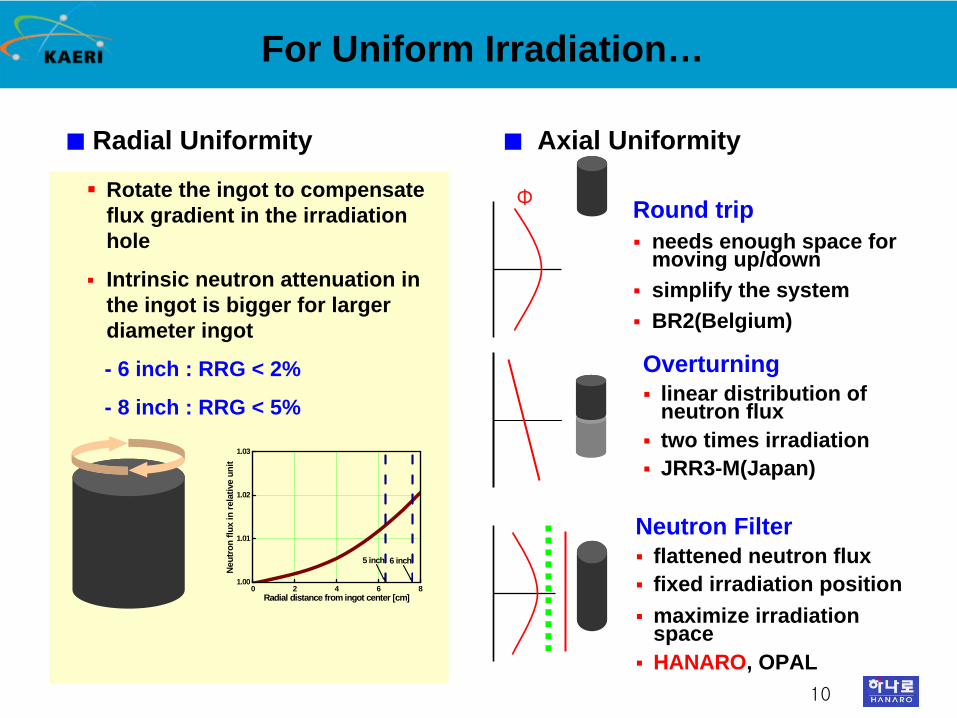
Rotate the ingot to compensate flux gradient in the irradiation hole
Intrinsic neutron attenuation in the ingot is bigger for larger diameter ingot
- 6 inch : RRG < 2%
- 8 inch : RRG < 5%
0 2 4 6 81.00
1.01
1.02
1.03
6 inch5 inch
Neu
tron
flux
in re
lativ
e un
it
Radial distance from ingot center [cm]
Axial Uniformity
Round trip
needs enough space for moving up/down
simplify the system
BR2(Belgium)
Φ
Overturning
linear distribution of neutron flux
two times irradiation
JRR3-M(Japan)
Neutron Filter
flattened neutron flux
fixed irradiation position
maximize irradiation space
HANARO, OPAL
Radial Uniformity
For Uniform Irradiation…
11
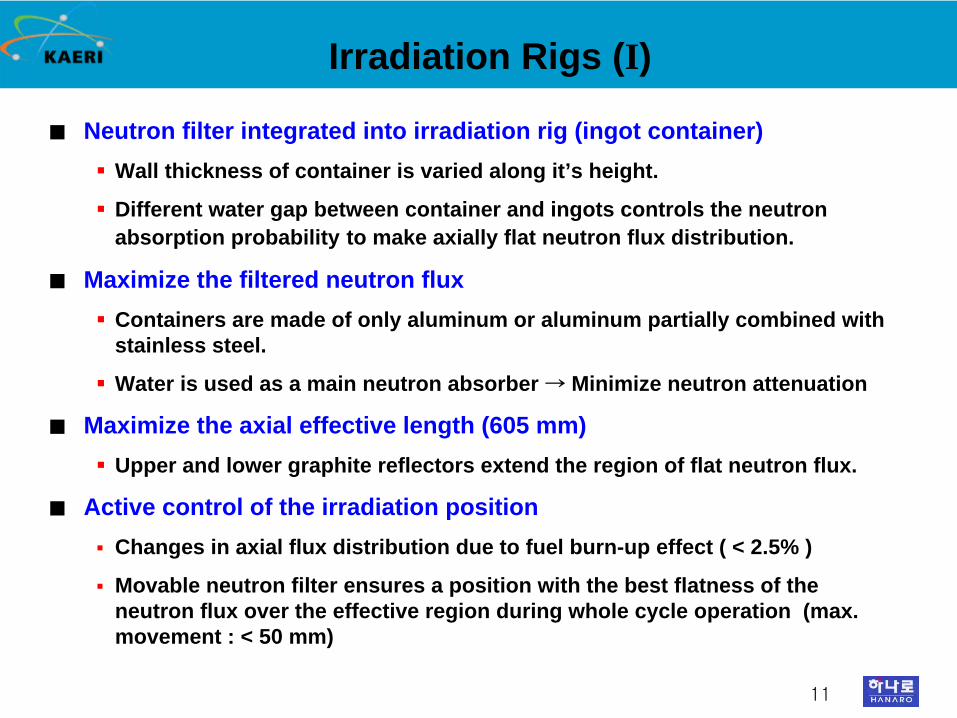
Irradiation Rigs (I)
Neutron filter integrated into irradiation rig (ingot container)
Wall thickness of container is varied along it’s height.
Different water gap between container and ingots controls the neutron absorption probability to make axially flat neutron flux distribution.
Maximize the filtered neutron flux
Containers are made of only aluminum or aluminum partially combined with stainless steel.
Water is used as a main neutron absorber → Minimize neutron attenuation
Maximize the axial effective length (605 mm)
Upper and lower graphite reflectors extend the region of flat neutron flux.
Active control of the irradiation position
Changes in axial flux distribution due to fuel burn-up effect ( < 2.5% )
Movable neutron filter ensures a position with the best flatness of the neutron flux over the effective region during whole cycle operation (max. movement : < 50 mm)
12
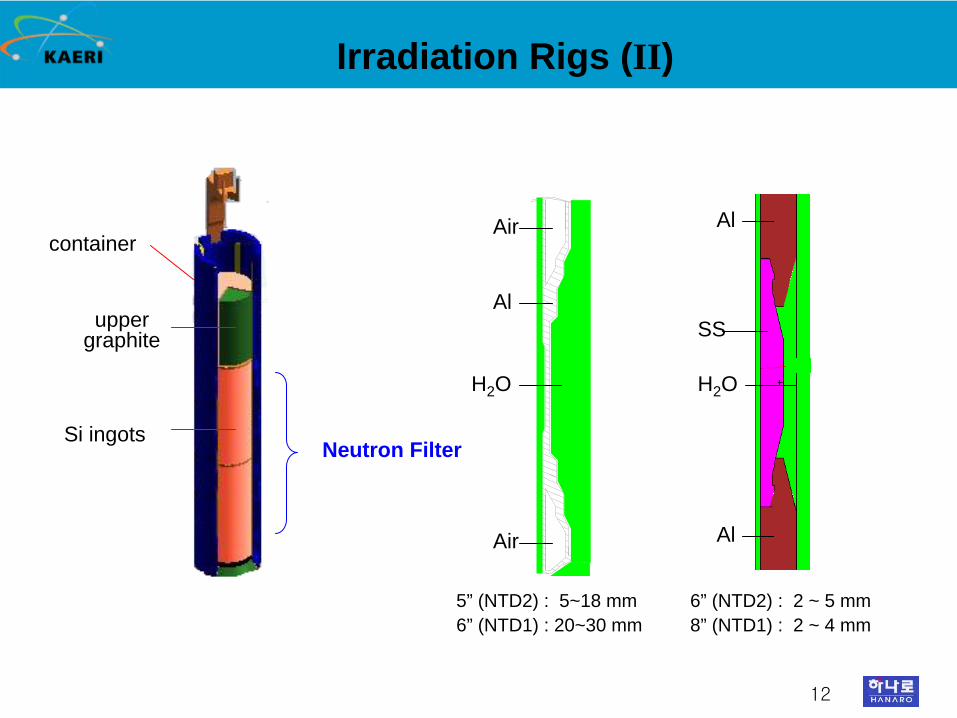
Irradiation Rigs (II)
container
Si ingots
upper graphite
Neutron Filter
Air
Air
Al
5” (NTD2) : 5~18 mm6” (NTD1) : 20~30 mm
H2 O
Al
Al
SS
6” (NTD2) : 2 ~ 5 mm8” (NTD1) : 2 ~ 4 mm
H2 O
13
5 inch(NTD2)
6 inch(NTD2)
8 inch(NTD1)
6 inch(NTD1)
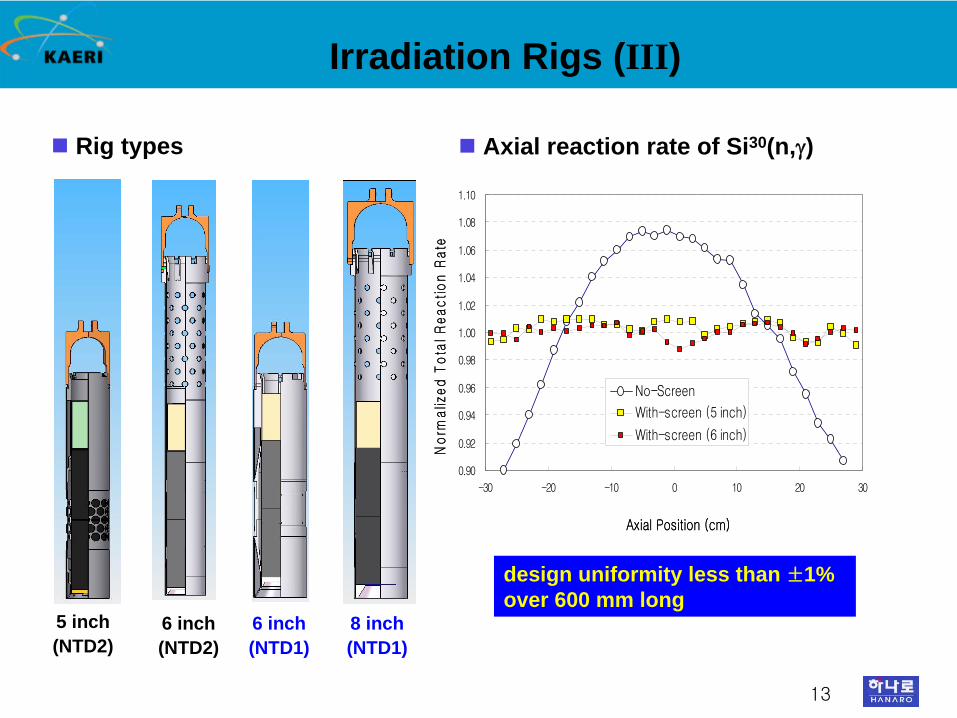
Rig types
Irradiation Rigs (III)
Axial reaction rate of Si30(n,)
0.90
0.92
0.94
0.96
0.98
1.00
1.02
1.04
1.06
1.08
1.10
-30 -20 -10 0 10 20 30
No-Screen
With-screen (5 inch)
With-screen (6 inch)
Axial Position (cm)
No
rma
lize
d T
ota
l R
ea
cti
on
Ra
te
0.90
0.92
0.94
0.96
0.98
1.00
1.02
1.04
1.06
1.08
1.10
-30 -20 -10 0 10 20 30
No-Screen
With-screen (5 inch)
With-screen (6 inch)
Axial Position (cm)
No
rma
lize
d T
ota
l R
ea
cti
on
Ra
te
design uniformity less than ±1% over 600 mm long

14
Sleeve & Floater
Sleeve
Protect inner wall of irradiation hole from the frictional wear due to rotating container (D2 O leakage)
Accommodate neutron monitors (Rh-SPND)
Floater
An empty can moving by buoyancy carrying a lower graphite reflector on the top
Prevent sudden neutron flux change at surroundings
Cooling the ingots by pumping coolant upward
Lower graphite
Floater
sleeve
SPND
15
NTD OPERATION

16
Neutron Fluence Monitoring
Reference monitor
Two Rh-SPND at each irradiation hole
Real time monitoring the accumulated neutron dose (fluence) during the irradiation
Determine the time the container is automatically drawing out
Activation neutron monitor
Mount Zr foils top and bottom of each ingots in a container
Measure the actual neutron fluence at the region of ingots
Induced radioactivity from Zr → absolute fluence → resistivity expectation
Correction of SPND’s signal
SPNDs do not represent the actual neutron dose of the ingots due to their position.
Position change of a container also affects the neutron flux of the SPNDs.
Correlations between the average fluxes by SPNDs and by Zr foils for every irradiation during the cycle are used for the reference to the next cycle.

17
1.3E+13
1.5E+13
1.7E+13
1.9E+13
2.1E+13
300 350 400 450 500 550 600
Control Rod Position (mm)
Ratio o
f Flu
x and S
PN
D
SPND-1
SPND-26 inch at NTD2
1.3E+13
1.5E+13
1.7E+13
1.9E+13
2.1E+13
300 350 400 450 500 550 600
Control Rod Position (mm)
Ratio o
f Flu
x and S
PN
D
SPND-1
SPND-26 inch at NTD2
Correction of SPND’s signal at every irradiation positions are updated every cycle by irradiation hole and by ingot diameter.
18
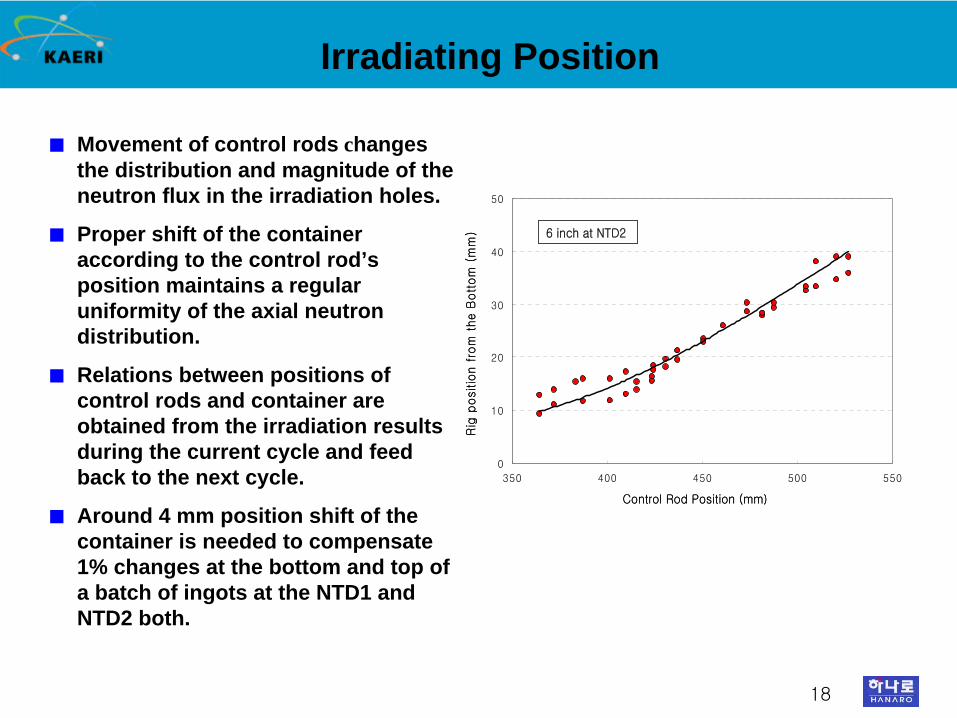
Irradiating Position
Movement of control rods changes the distribution and magnitude of the neutron flux in the irradiation holes.
Proper shift of the container according to the control rod’s position maintains a regular uniformity of the axial neutron distribution.
Relations between positions of control rods and container are obtained from the irradiation results during the current cycle and feed back to the next cycle.
Around 4 mm position shift of the container is needed to compensate 1% changes at the bottom and top of a batch of ingots at the NTD1 and NTD2 both.
0
10
20
30
40
50
350 400 450 500 550
Control Rod Position (mm)
Rig
positio
n f
rom
the B
ott
om
(m
m) 6 inch at NTD2
0
10
20
30
40
50
350 400 450 500 550
Control Rod Position (mm)
Rig
positio
n f
rom
the B
ott
om
(m
m) 6 inch at NTD2

19
PERFORMANCE

20
Irradiation capacity
Based on 200 days/year operationNTD2 : ~ 20 tons (5 & 6 inch)NTD1 : ~ 30 tons (6 & 8 inch)
Target Res.
(Ω-cm)
Net Irradiation Time (Hour)
5 inch 6 inch
20 8.6 9.6
30 5.7 6.3
40 4.2 4.7
50 3.4 3.8
100 1.6 1.8
300 0.5 0.5
500 0.3 0.3
1000 0.1 0.1
Irradiation Capacity
Acceptable ingot dimension
length : 605 mm (max.)
diameter : 5, 6, 8 inch
resistivity : 5 ~ 1,000 Ohm-cm
Thermal neutron flux (n/cm2sec)
NTD1 : ~ 3.9×10¹³ (6 inch), ~ 3.6×10¹³ (8 inch)
NTD2 : ~ 3.8×10¹³ (5 inch), ~ 3.5×10¹³ (6 inch)
21
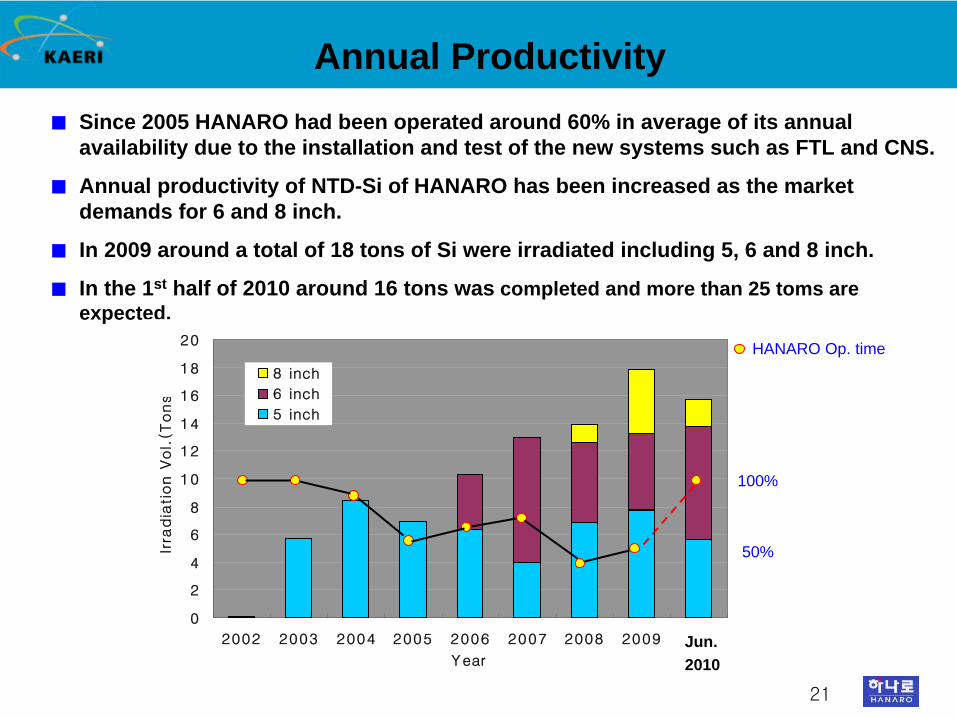
Annual Productivity
Since 2005 HANARO had been operated around 60% in average of its annual availability due to the installation and test of the new systems such as FTL and CNS.
Annual productivity of NTD-Si of HANARO has been increased as the market demands for 6 and 8 inch.
In 2009 around a total of 18 tons of Si were irradiated including 5, 6 and 8 inch.
In the 1st half of 2010 around 16 tons was completed and more than 25 toms are expected.
0
2
4
6
8
10
12
14
16
18
20
2002 2003 2004 2005 2006 2007 2008 2009 2010
Year
Irra
dia
tion V
ol.
(Tons
8 inch
6 inch
5 inch
HANARO Op. time
100%
50%
Jun.2010
22
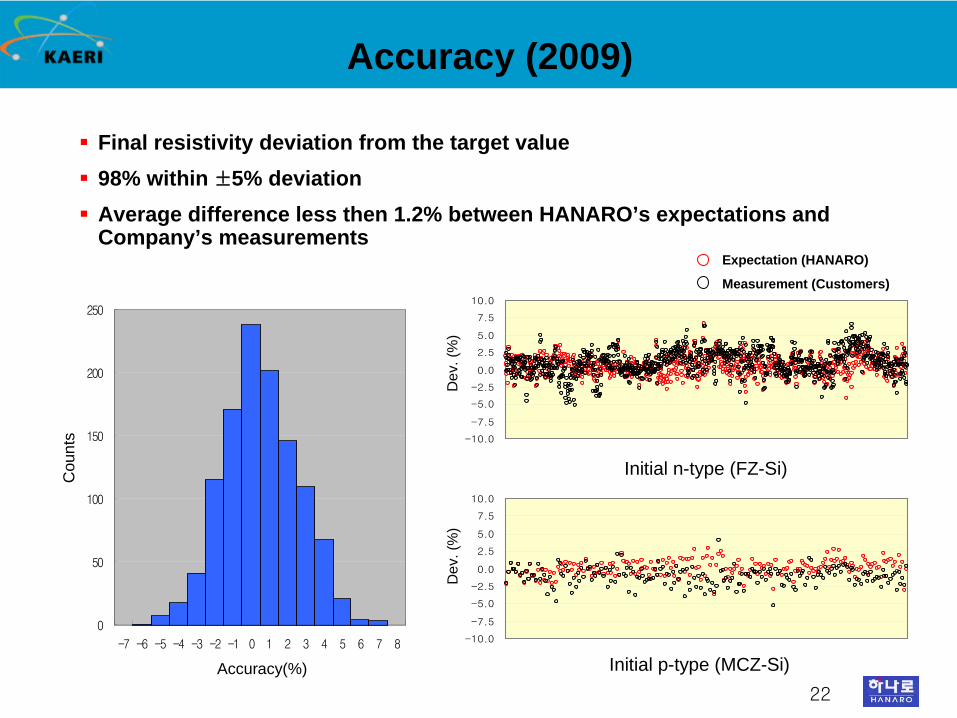
Accuracy (2009)
0
50
100
150
200
250
-7 -6 -5 -4 -3 -2 -1 0 1 2 3 4 5 6 7 8
Accuracy(%)
Cou
nts
Final resistivity deviation from the target value
98% within ±5% deviation
Average difference less then 1.2% between HANARO’s expectations and Company’s measurements
-10.0
-7.5
-5.0
-2.5
0.0
2.5
5.0
7.5
10.0
-10.0
-7.5
-5.0
-2.5
0.0
2.5
5.0
7.5
10.0
Initial n-type (FZ-Si)
Initial p-type (MCZ-Si)
Dev
. (%
)D
ev. (
%)
Expectation (HANARO)
Measurement (Customers)
23
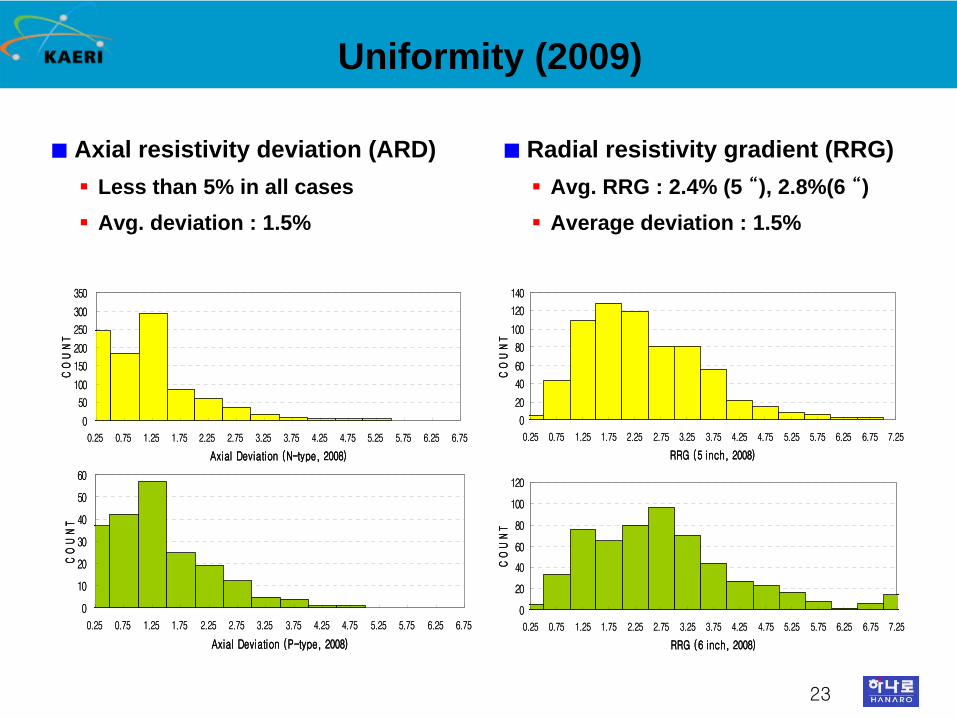
Uniformity (2009)
0
50
100
150
200
250
300
350
0.25 0.75 1.25 1.75 2.25 2.75 3.25 3.75 4.25 4.75 5.25 5.75 6.25 6.75
Axial Deviation (N-type, 2008)
CO
UN
T
0
10
20
30
40
50
60
0.25 0.75 1.25 1.75 2.25 2.75 3.25 3.75 4.25 4.75 5.25 5.75 6.25 6.75
Axial Deviation (P-type, 2008)
CO
UN
T
0
50
100
150
200
250
300
350
0.25 0.75 1.25 1.75 2.25 2.75 3.25 3.75 4.25 4.75 5.25 5.75 6.25 6.75
Axial Deviation (N-type, 2008)
CO
UN
T
0
10
20
30
40
50
60
0.25 0.75 1.25 1.75 2.25 2.75 3.25 3.75 4.25 4.75 5.25 5.75 6.25 6.75
Axial Deviation (P-type, 2008)
CO
UN
T
0
20
40
60
80
100
120
140
0.25 0.75 1.25 1.75 2.25 2.75 3.25 3.75 4.25 4.75 5.25 5.75 6.25 6.75 7.25
RRG (5 inch, 2008)
CO
UN
T
0
20
40
60
80
100
120
0.25 0.75 1.25 1.75 2.25 2.75 3.25 3.75 4.25 4.75 5.25 5.75 6.25 6.75 7.25
RRG (6 inch, 2008)
CO
UN
T
0
20
40
60
80
100
120
140
0.25 0.75 1.25 1.75 2.25 2.75 3.25 3.75 4.25 4.75 5.25 5.75 6.25 6.75 7.25
RRG (5 inch, 2008)
CO
UN
T
0
20
40
60
80
100
120
0.25 0.75 1.25 1.75 2.25 2.75 3.25 3.75 4.25 4.75 5.25 5.75 6.25 6.75 7.25
RRG (6 inch, 2008)
CO
UN
T
Axial resistivity deviation (ARD)
Less than 5% in all cases
Avg. deviation : 1.5%
Radial resistivity gradient (RRG)
Avg. RRG : 2.4% (5 “), 2.8%(6 “)
Average deviation : 1.5%

24
NTD Market
25
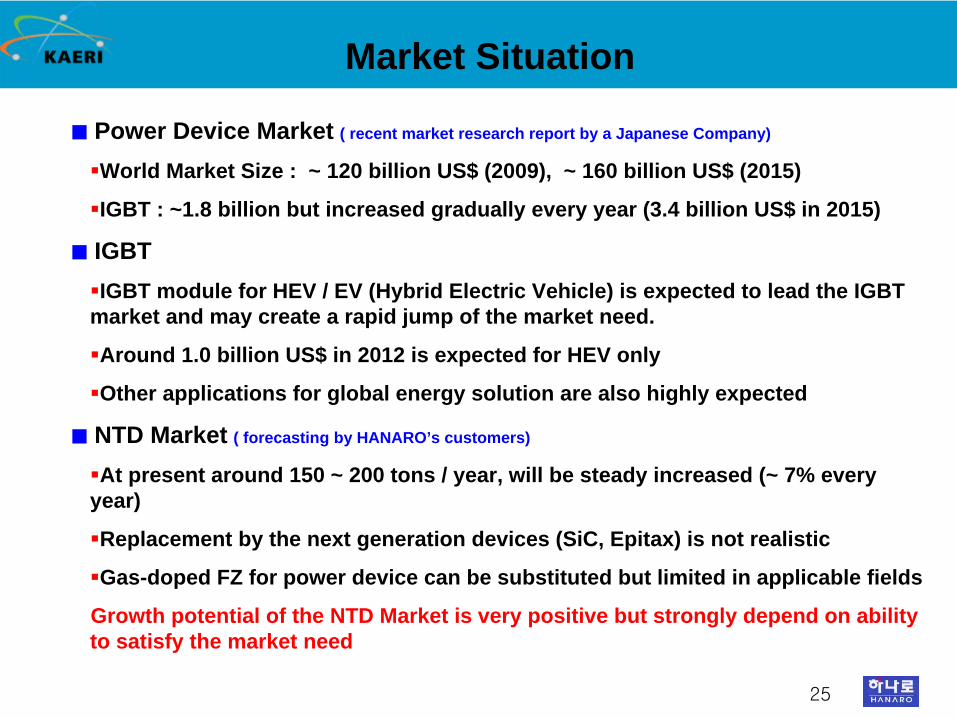
Market Situation
Power Device Market ( recent market research report by a Japanese Company)
World Market Size : ~ 120 billion US$ (2009), ~ 160 billion US$ (2015)
IGBT : ~1.8 billion but increased gradually every year (3.4 billion US$ in 2015)
IGBTIGBT module for HEV / EV (Hybrid Electric Vehicle) is expected to lead the IGBT market and may create a rapid jump of the market need.
Around 1.0 billion US$ in 2012 is expected for HEV only
Other applications for global energy solution are also highly expected
NTD Market ( forecasting by HANARO’s customers)
At present around 150 ~ 200 tons / year, will be steady increased (~ 7% every year)
Replacement by the next generation devices (SiC, Epitax) is not realistic
Gas-doped FZ for power device can be substituted but limited in applicable fields
Growth potential of the NTD Market is very positive but strongly depend on ability to satisfy the market need

26
International Efforts
1976 : The 1st international symposium on NTD
Biannual
Last symposium was in 1982
1985 : IAEA consultant meeting on NTD
2007 – 2008 : IAEA-RCA Project (RAS/4/026)
“Adding Value to Materials through Neutron Irradiation”
Focused on NTD, Gemstone colorization, Membrane filer
Regional training course on NTD in HANARO (2008)
2008 : 6th International Conference on Isotopes (Seoul, Korea)
Prepared a special session for NTD
Papers from a wafer company (TOPSIL) aw well as HANARO, FRM-II, SAFARI-I, JRR-3

27
The first application of NTD was started from the early 1970s, but not highly regarded in research reactor utilizations.
Recently the application of NTD-Si wafers becomes more widespread as the energy issues attract worldwide attention.
The world NTD-Si market size is only 150~200 tons per year now, but a rapid growth is expected near future due to global interest in green energy and energy savings, especially due to increase of HEV / EV.
However, the productivity would not be increased enough to meet the increasing market demands because almost RRs in the world are not NTD-dedicated and many of them already become superannuated.
Surely NTD is the one of the most competitive commercial means for RRs.
More lively exchanges of information and experience among the RRs are required for the stable service to the market.
It’s the time to give a serious consideration for the cooperative meeting with wafer companies.
Conclusion

28
Thank you….