neural activity within area v1 reflects unconscious visual...
TRANSCRIPT

Neural Activity within Area V1 Reflects UnconsciousVisual Performance in a Case of Blindsight
Petya D. Radoeva, Sashank Prasad, David H. Brainard,and Geoffrey K. Aguirre
Abstract
& Although lesions of the striate (V1) cortex disrupt consciousvision, patients can demonstrate surprising residual abilitieswithin their affected visual field, a phenomenon termed blind-sight. The relative contribution of spared ‘‘islands’’ of function-ing striate cortex to residual vision, versus subcortical pathwaysto extrastriate areas, has implications for the role of early visualareas in visual awareness and performance. Here we describethe behavioral and neural features of residual cortical function inPatient M.C., who sustained a posterior cerebral artery stroke atthe age of 15 years. Within her impaired visual field, we foundpreserved visual abilities characteristic of blindsight, includingsuperior detection of motion, and above-chance discrimination
of shape, color, and motion direction. Functional magneticresonance imaging demonstrated a retinotopically organizedrepresentation of M.C.’s blind visual field within the lesionedoccipital lobe, specifically within area V1. The incongruity of awell-organized cortex and M.C.’s markedly impaired vision wasresolved by measurement of functional responses within herdamaged occipital lobe. Attenuated neural contrast-responsefunctions were found to correlate with M.C.’s impaired psycho-physical performance. These results demonstrate that the be-havioral features of blindsight may arise in the presence ofresidual striate responses that are spatially organized and sen-sitive to contrast variation. &
INTRODUCTION
Although damage to the primary visual cortex (V1)produces contralesional blindness, patients occasionallydemonstrate residual visual abilities within the otherwiseblind field (Riddoch, 1917). In most such cases, movingstimuli are better detected than stationary (Riddoch,1917). Further, some patients can also localize targets atabove-chance levels within their scotoma through sac-cades (Poppel, Held, & Frost, 1973), pointing (Weiskrantz,Warrington, Sanders, & Marshall, 1974), or verbal report(Wessinger, Fendrich, & Gazzaniga, 1999), and discrimi-nate target displacements (Blythe, Bromley, Kennard, &Ruddock, 1986), direction of motion (Morland, Le, Carroll,Hoffmann, & Pambakian, 2004), color (Morland et al.,1999), and shape (Wessinger et al., 1999) (for reviews,see Cowey, 2004; Stoerig & Cowey, 1997). The degreeof conscious perception in the affected visual field (VF)varies across patients. Some must be induced to ‘‘guess’’to demonstrate their residual capabilities (Tomaiuolo,Ptito, Marzi, Paus, & Ptito, 1997) (a phenomenon alsotermed Blindsight Type I; Weiskrantz, 1996), whereasothers describe vague sensations (Blindsight Type II),although invariably the patients insist that they do not‘‘see’’ within the affected VF (Cowey, 2004; Riddoch,1917).
The notion that visual awareness may be dissociatedfrom visual performance has been a provocative onewithin the philosophy of cognitive neuroscience. Fol-lowing standard neuropsychological inference, the strik-ing loss of awareness in blindsight has been taken asevidence that the primary visual cortex is the site ofconscious visual perception (see Tong, 2003, for a re-view). This inference is dependent, however, upon thetotality of damage to area V1.
Some studies in humans and in animal models supportthe assertion that visual performance can be mediated bysubcortical pathways that bypass the lesioned primaryvisual cortex and project directly to extrastriate areas(Weiskrantz, 1996; Weiskrantz, Cowey, & Passingham,1977). Neuroanatomical studies in macaques have dem-onstrated direct projections from the superior colliculus,and the pulvinar, to the extrastriate cortex (including areaMT, the middle temporal area) (Standage & Benevento,1983). Electrophysiologic studies of macaques with eitherpartial or total ablations of the striate cortex have shownthat striate cortex removal did not abolish the visual re-sponsiveness of the majority of MT cells. These residualresponses were generally much weaker, although di-rection selectivity and binocularity were still present(Rodman, Gross, & Albright, 1989). Lesions of both thestriate cortex and the superior colliculus abolished theseMT visual responses (Rodman, Gross, & Albright, 1990).Combined lesions had similar effects upon the superiorUniversity of Pennsylvania
D 2008 Massachusetts Institute of Technology Journal of Cognitive Neuroscience 20:11, pp. 1927–1939

temporal polysensory area (STP) in macaques (Bruce,Desimone, & Gross, 1986). Additionally, multiple studiesof hemianopic patient(s) have shown residual visual ca-pabilities after occipital lesions (e.g., for a review, seeStoerig & Cowey, 1997).
Despite this persuasive evidence, a persistent alterna-tive explanation for the phenomenon of blindsight is thatsmall ‘‘islands’’ of preserved V1 may mediate spared vi-sion (Scharli, Harman, & Hogben, 1999a, 1999b; Wessingeret al., 1999; Kasten, Wuest, & Sabel, 1998; Wessinger,Fendrich, & Gazzaniga, 1997; Fendrich, Wessinger, &Gazzaniga, 1992). Using an image stabilizer to ensureaccurate retinal positioning, Fendrich et al. (1992) per-formed dense VF mapping in a patient with hemia-nopia (Patient C.L.T.) (Fendrich et al., 1992). Theyfound an isolated 18 island of residual vision within theaffected VF. Stimuli presented to this island could bedetected and discriminated above chance, although thepatient stated that he ‘‘never saw anything’’ despitea sense that ‘‘something happened there’’ (BlindsightType II). Additional psychophysical studies of C.L.T. andother hemianopic patients demonstrated ‘‘islands’’ ofspared vision in the scotomata of four out of sevenpatients (Wessinger et al., 1999). Notably, there wasconsiderable variability between and within the subjects.For example, two patients demonstrated localizationabilities (F.N. and J.C.) within the islands, two hadwavelength discrimination (C.L.T. and J.C.), one hadmotion detection (F.N.), and one had shape discrimina-tion abilities (C.L.T.) (Wessinger et al., 1999). Theauthors argued that this variability is not consistent witha subcortical pathway underlying blindsight in thesepatients, as such a pathway would predict an orderlydistribution of abilities throughout the affected VF.Importantly, the anatomical magnetic resonance imag-ing (MRI) scans of the blindsight patients also revealedremnants of the spared visual cortex within the occipitallesions, which likely mediated the patchy ‘‘island-like’’residual vision.
Several neuroimaging studies have examined visualcortex responses in blindsight. Studies of one patient,G.Y., have demonstrated activation in extrastriate areas,without detectable activation in the primary visual cortexfor a range of visual stimuli, including pattern-reversal(Kleiser, Wittsack, Niedeggen, Goebel, & Stoerig, 2001)and moving stimuli (Zeki & Ffytche, 1998), picturesof objects (Goebel, Muckli, Zanella, Singer, & Stoerig,2001), and emotional faces (producing amygdalar re-sponses; Morris, DeGelder, Weiskrantz, & Dolan, 2001,although see Baseler, Morland, & Wandell, 1999). In astudy of seven hemianopic patients, Morland et al.(2004) identified two hemianopes who could discrimi-nate the direction of a drifting grating at above-chancelevels (Morland et al., 2004). One of the two patients(Patient G.Y.) showed no activation within the striatecortex, whereas the other patient (R.A.) had calcarinesulcus activation in response to moving and flickering
stimuli, consistent with the hypothesis of spared ‘‘is-lands’’ within R.A.’s occipital lesion. It seems that for atleast some patients with the neuropsychological phe-nomenon of blindsight, striate cortex responses to visualstimulation may be observed. The relationship of theseresidual V1 responses to visual performance, however,remains unclear.
In our current study, we used functional MRI (fMRI)to explore the retinotopic organization and contrast sen-sitivity of early visual areas of a patient with blindsight(Patient M.C.). We demonstrate that the early visualcortex, including a portion of V1 that appears atrophicon high-resolution MRI scanning, shows preserved retino-topic organization. The visual areas in M.C.’s affectedhemisphere also show sensitivity to variations of stimuluscontrast, but these responses are attenuated, mirroringM.C.’s psychophysical performance. These results dem-onstrate that neural responses in V1 can be associatedwith the behavioral features of blindsight, suggesting thatV1 activity does not lead invariably to a perceptual stateassociated with normal vision.
We should note at the outset that we, along withothers (Stoerig & Cowey, 2007; Fendrich, Wessinger, &Gazzaniga, 2001; Scharli et al., 1999a, 1999b; Wessingeret al., 1997, 1999; Kasten et al., 1998; Fendrich et al.,1992), take blindsight to be a description of a behavioralphenomenon, and thus, regard the question of its neuralbasis as open to experimental investigation. Readerswho reserve the term blindsight only for cases whereresidual visual function exists in the demonstrated ab-sence of functioning V1 may object to our use of theterm, but may still find our study of interest in thebroader context of the neural basis of residual visualfunction in cases of perimetric hemianopia.
METHODS
Subject
Patient M.C. suffered a left posterior cerebral arterystroke at the age of 15 years as a consequence of arterialcompression from a traumatic occipital subdural collec-tion. Surgical drainage of an additional, left, frontal sub-dural collection was required. In addition to her visualimpairments, she has a mild hemiparesis and dystonia.
Informed consent was obtained and procedures fol-lowed institutional guidelines and the Declaration ofHelsinki.
Perimetry
Humphrey’s automated perimetry was conducted 3 monthspoststroke using standard clinical equipment (HumphreyInstruments, Field Analyzer Model 750, Serial Number:7501342). Goldmann’s manual perimetry was performed2 years poststroke (Haag-Streit International, Perimeter940). The VF is defined by the most peripheral point at
1928 Journal of Cognitive Neuroscience Volume 20, Number 11

which M.C. was able to detect a stimulus [a disc of318 cd/m2 luminance, and an area of 0.25 (I4e) or 64(V4e) mm2] moving slowly toward fixation on multipleperipheral-to-central paths.
Behavioral Testing
Detection of the Onsets/Offsets of Moving vs.Stationary Stimuli
The stimuli were moving or stationary 100% contrastsquare-wave gratings, windowed in a circle with a diam-eter of 4.28, centered 198 horizontally from fixation (a 0.38dot), presented on a background of uniform gray with aluminance equal to the average of that of the gratings.The spatial frequency of all gratings was 0.7 c/deg andtemporal frequency for the moving gratings was 4 c/sec.M.C. pressed a button to initiate each trial. This resultedin a change of the color of the fixation point from greento red, which alerted M.C. to the start of the trial. Stimuliappeared after a variable interval (of 2 to 6 sec) and werepresented for 3 or 5 sec. M.C. indicated stimulus onsetand offset with separate button presses; only the detec-tion of onset performance is reported here. Responseswere recorded only if they occurred within 6 sec of theonset or offset of the stimulus. The trials were subject-initiated to allow for resolution of perceptual afterimage.Data were collected in two sessions, separated by amonth, 2 years poststroke. Each block of trials lasted for7 min, and because it was subject-advanced, had a variablenumber of trials (ranging between 21 and 37). Fourblocks (a total of 89 trials) were presented in the affectedVF, and three blocks (a total of 109 trials) were presentedin the unaffected VF. This study was conducted whileM.C. was lying in the scanner and functional scans wereacquired, although the fMRI data are not presented here.The remainder of behavioral testing was conducted out-side of the scanner.
Detection of Moving Stimuli of VariableContrast Levels
The stimuli were concentric rings expanding and con-tracting at 2 c/sec, with a square-wave profile, spatialfrequency of 0.6 c/deg, windowed in a circle with adiameter of 8.68, with the center of the rings 14.78 awayfrom a fixation point (a 0.38 red dot), presented on abackground of uniform gray with a luminance equal tothe average of that of the rings. Eight different levels ofcontrast (1%, 3%, 6%, 12%, 25%, 50%, 75%, and 100%)were presented in two types of blocks: higher contrastrange (including 6.25%, 12.5%, 25%, 50%, 75%, and100%), or lower contrast range (1%, 3%, 6%, 12%,25%, and 100%). The rings were presented on thescreen for 2.5 sec. Every 3 sec either a ring or a blankscreen appeared, and the central fixation point flickered.The order of presentation of contrast levels was deter-
mined by the same pseudorandom sequence used in thefMRI study of contrast sensitivity (see below). M.C. wasinstructed that whenever the fixation point flickeredeither a new stimulus would appear, or the screenwould be blank. She was to press the spacebar whenshe detected the presence of a new stimulus. Four test-ing sessions were conducted over a period of 7 months,3 to 4 years poststroke. A total of 840 and 404 trials werepresented in the affected and in the unaffected VF,respectively.
Direction of Motion Discrimination
Rings of 100% contrast were presented in the samesetting as in the Detection of Moving Stimuli experiment(see above). On every trial, the stimulus would eitherexpand or contract within the stimulus window. Therewere no null trials. M.C. indicated by keypress whetherthe rings were moving ‘‘in’’ or ‘‘out,’’ and pressed anadditional key to advance to the next stimulus. Threeblocks of trials (2 of 48 and 1 of 35 trials) were presentedin the affected VF, and two blocks (1 of 48 and 1 of 10trials) were presented in the unaffected VF. The datawere collected 4 years poststroke.
Shape and Color Discrimination
Discrimination of shape and color was performed inseparate blocks during one testing session, 4 yearspoststroke. All stimuli were 9.08 of visual angle and werepresented on a white background, with the center of thestimuli 14.78 away from a central fixation point (an ‘‘x’’).The stimuli flickered at 10 Hz (50 msec on and 50 msecoff ) for 800 msec. After the stimuli disappeared fromthe screen, the central fixation point turned into a ‘‘?’’,prompting M.C. to respond. She indicated by keypressthe shape or color of the stimulus and pressed anadditional key to advance to the next stimulus. A circle,triangle, or square was presented during shape dis-crimination. These stimuli were black on a white back-ground; as all had the same maximal width/heightthey did not have equivalent areas. One block of48 trials was presented in the healthy VF, and two blocks(of 48 trials each) were presented in the affected VF.Red, blue, or green circles (on white background) werepresented for color discrimination. These stimuli werenot matched in luminance. One block of 48 trials waspresented in the healthy VF, and two blocks (one of82 trials and one of 48 trials) were presented in theaffected VF.
Stimulus Presentation
During Behavioral Testing
The shape and color discrimination experiments wereprogrammed in E-Prime (E-Prime, 1.1.4.4) and run on a
Radoeva et al. 1929
PC laptop (Dell, Latitude, D600). The other behavioralexperiments were programmed in Matlab and run on aMacintosh laptop (PowerBook G4, model number A1025,with operating system Mac OS 9.2.2). All stimuli weredisplayed on a CRT monitor (Trinitron, Multiscan 210GS,Sony), at a viewing distance of approximately 59 cm.A chin rest was used to stabilize M.C.’s head position.For experiments where contrast was varied, the spectralpower distributions of the monitor’s phosphors, as wellas the nonlinear input–output relations, were character-ized using a PhotoResearch PR-650 spectral radiometer,and these data were incorporated into calculations ofthe digital RGB values required to produce stimuli of de-sired contrasts. During pilot testing sessions, eye move-ments were monitored with a Red-II infrared cameraand iView 3.01.23 analysis software (SensoMotoric Instru-ments). In over 200 trials with monitored eye movements,there were no trials in which M.C. made significantexcursions (>28). Eye-tracking data were not collectedfor subsequent behavioral experiments.
During MRI Scanning
The visual stimuli were projected (Epson 8100 LCDprojector equipped with a Buhl long-throw lens) ontoa mylar screen at the rear of the magnet. The subjectviewed the stimulus through a mirror mounted on thehead coil (the field of view was 228 horizontal � 178vertical). The video signals were transmitted to theprojector using an optical fiber interface (LightwaveCommunications, PC FiberLynx Transmitter). The spec-tral power distributions of the three channels of theprojector, as well as the nonlinear input–output relation(gamma functions) for each channel, were characterizedin situ using a PhotoResearch PR-650 spectral radiome-ter. The measured input–output relations were incorpo-rated into calculations of the digital RGB values requiredto produce stimuli of desired contrasts. Contrast valuesspecified for these experiments are nominal, as actualcontrasts deviated slightly from the nominal values dueto quantization in the digital-to-analog and analog-to-digital conversions performed by the computer’s graph-ics board, the FiberLynx interface, and the LCD projectoritself.
MR Scanning Protocol
Structural and functional data were collected on a 3.0-Tesla Siemens Trio scanner using either an eight-channelhead coil or a standard quadrature coil. High-resolutionT1-weighted structural images were collected in 160axial slices and near-isotropic voxels (0.9766 mm �0.9766 mm � 1.0000 mm; TR = 1620 msec, TE = 3 msec,TI = 950 msec). An additional series of T2-weightedcoronal images through the occipital lobe were acquiredwith 0.4 mm in-plane and 2 mm through-plane resolu-
tion for better visualization of the lesioned cortex. Func-tional blood oxygenation level-dependent (BOLD) echo-planar data were acquired in 3 mm isotropic voxels (TR =3000, TE = 30). BOLD data were acquired in 42 axialslices (for the retinotopic mapping scans and 4 of thecontrast sensitivity scans) or in 30 coronal slices coveringthe posterior portion of the brain (for the remainingcontrast sensitivity scans), and in an interleaved fashionwith 64 � 64 in-plane resolution. The first 6 sec of eachscan consisted of ‘‘dummy’’ gradient and radio-frequencypulses to allow for steady-state magnetization duringwhich no stimuli were presented and no fMRI data werecollected.
Neuroimaging Stimuli and Task
In both studies, M.C. monitored a fixation point and wasasked to press a key whenever the dot flickered. Thiswas done to ensure accurate fixation.
Standard retinotopic mapping stimuli were used (Engel,Glover, & Wandell, 1997) to map the eccentricity andpolar angle representation, and to determine the bordersbetween visual areas. An expanding ring (2 Hz flickering,black-and-white checkerboard presented on a gray back-ground) was used to map the eccentricity representation.M.C. fixated on a red dot, presented 0.048 from the left orright of the edge of the screen, while the ring expandedinto the periphery of the left or the right hemifield, in 16eccentricity steps, each lasting 3 sec (one TR). The ringwidth varied exponentially with eccentricity and rangedfrom 0.68 to 6.78 of visual angle. The annulus completed10 cycles of expansion during each scan (scan time = 10 �48 sec = 8 min). A rotating 22.58 wedge (also 2 Hzflickering checkerboard) was used to map the polar angle.The wedge stimulus rotated clockwise and traversed onehemifield in 48 sec (16 steps of 3 sec/1 TR).
Retinotopic mapping data were acquired during eightscanning sessions over a period of 3 months. Eachscanning session consisted of two to four 8-minute-longscans (160 TRs), and an anatomical MP-RAGE scan. Eightscans (4 right VF [RVF] and 4 left VF [LVF] scans) wereexcluded because of visible motion artifacts that werepresent even after the standard motion correction pro-cedures had been applied. A total of 16 scans wereincluded in the final analysis (2 for LVF eccentricity, 7for RVF eccentricity, 3 for LVF polar angle, and 4 for RVFpolar angle). More data were acquired for the affectedVF (RVF) to increase our sensitivity for signal from the af-fected left hemisphere. Additionally, the LVF and theRVF were studied in separates scans to (1) maximize thevisual angle of stimulation within each VF and (2) avoidhead and eye motion induced by shifts of the fixationpoint during each scan.
To measure neural contrast sensitivity, stimuli andtiming parameters similar to those of the Detection ofMoving Stimuli experiment (see above) were used,although there were several differences. Namely, the
1930 Journal of Cognitive Neuroscience Volume 20, Number 11
stimulus had a diameter of 8.58, with the center of therings 13.88 away from the fixation point (a 0.38 red dot).Additionally, M.C. was asked to detect the flickering ofthe central fixation point (rather than the appearance ofa new stimulus in the periphery). The data were ac-quired during nine scanning sessions over a period of7 months. Each scanning session consisted of two tofour scans of 168 TRs, and an anatomical MP-RAGE scan.Eleven scans (5 RVF and 6 LVF scans) were excluded dueto visible motion artifacts that were present even afterthe standard motion correction procedures had been ap-plied. A total of 19 scans were included in the final analy-sis (7 for LVF and 12 for RVF). The order of stimuluspresentation was determined using the Optseq2 routine(http://surfer.nmr.mgh.harvard.edu/optseq/).
M.C. showed good accuracy rates for the fixationvigilance task. For the scans included in the analysis,she detected 96.1 ± 2.6% [SD] of the flickers during theretinotopy scans (95 ± 2.6% for RVF scans and 98 ±0.8% for LVF scans), and 74 ± 15.6% during the contrastsensitivity scans (76 ± 16% for RVF scans and 71 ± 16%for LVF scans). A more challenging central fixation taskwas used during most of the contrast sensitivity scans(27 of 30 scans), in which the flicker was smaller andbriefer, accounting for the lower performance accuracy.Brain volumes acquired during periods when M.C. failedto detect the flicker were excluded from the contrast-response analysis.
Image Preprocessing
Off-line data analysis was performed using VoxBo(www.voxbo.org) and SPM2 (www.fil.ion.ucl.ac.uk/) soft-ware. Data were sinc interpolated in time to correctfor the slice acquisition sequence, motion correctedwith a six-parameter, least squares, rigid-body realign-ment routine using the first functional image as a ref-erence, coregistered to the anatomical image, and thennormalized in SPM2 to a standard template in MontrealNeurological Institute (MNI) space. Normalization main-tained 3 mm isotropic voxels and used 4th degreeB-spline interpolation. The fMRI data were smoothedin space with a 0.3-voxel full-width half-maximum iso-tropic Gaussian kernel. For each dataset, the averagepower spectrum across voxels and across scans wasobtained, and the (square root) of the power spectrumfit with a 1/frequency function (Zarahn, Aguirre, &D’Esposito, 1997). This model of intrinsic noise wasused during regression analyses with the Modified Gen-eral Linear Model (Worsley & Friston, 1995) to informthe estimation of intrinsic temporal autocorrelation.
Anatomical data from the subject were processedusing the FMRIB Software Library (FSL) toolkit (www.fmrib.ox.ac.uk/fsl/ ) to correct for spatial inhomogene-ity and to perform nonlinear noise reduction. The aver-age of four separate MP-RAGE images was used tocreate a high-precision anatomical image. The borders
of the lesioned cortex were defined on this averagedMP-RAGE scan by a neurologist not affiliated with thisstudy. The anatomical image was also processed with-in the BrainVoyager package (BrainInnovation; www.brainvoyager.de/) to identify the gray–white corticalboundary and produce flattened cortical surfaces for datapresentation.
Image Statistical Analysis
Statistical analysis of the data was conducted within themodified general linear model (Worsley & Friston,1995). For the retinotopic mapping data, covariates ofinterest were modeled as sines and cosines at thefundamental and harmonic frequencies of the task. Forthe contrast-response dataset, covariates of interestwere created as delta functions modeling the differentcontrast levels, convolved with a standard hemodynamicresponse function (Aguirre, Zarahn, & D’Esposito, 1998).Covariates of no interest included global signals, scansession, and spikes. The last of these were modeledas impulses, aligned with large transients in the dataidentified by automated analysis and visual inspection,thought to represent head motion.
The areas of retinotopic response were identifiedusing an F test applied to the conjoint explanatorypower of the sine and cosine covariates at the funda-mental task frequency, and thresholded at F > 2, with atleast 5 contiguous voxels. These maps were createdseparately for the eccentricity and polar angle data,and any voxels present in both maps (the intersection)identified for further analysis. Only regions of responsegreater than 100 voxels in size were retained for thecombined map. Eccentricity and polar angle phasevalues were calculated for each voxel by taking the arctangent of the ratio of the sine and cosine component.
The statistical results from the contrast-response fMRIdata were evaluated using the comparison of the 100%contrast condition with the null trials. The resulting mapwas thresholded at t of 3 with a cluster requirement ofgreater than 3 voxels, with 1019 effective degrees offreedom for the affected VF and 489 effective degreesof freedom for the unaffected VF. Mapwise significancewas evaluated using random field theory (Worsley et al.,1996), as extended for cluster thresholding (Cao, 1999).Intrinsic map smoothness was estimated from the modelresiduals (Kiebel, Poline, Friston, Holmes, & Worsley,1999). Evaluated within the region of interest definedby the retinotopic mapping protocol for each hemi-sphere (�1800 voxels), our threshold corresponds to amapwise alpha <.03 for clusters of 4 or more voxels(calculated with stat_threshold; www.math.mcgill.ca/keith/fmristat). The neural contrast-response functionplots were first obtained from the lesioned hemispherewithin the clusters of active voxels identified at thisthreshold. Within the healthy hemisphere, the equiva-lent number of voxels with the highest statistical value
Radoeva et al. 1931
was identified in each corresponding visual area. Thedata points on the resulting plots were fit with a Naka–Rushton function (Naka & Rushton, 1966).
RESULTS
Patient M.C. has Residual Visual FunctionCharacteristic of Blindsight
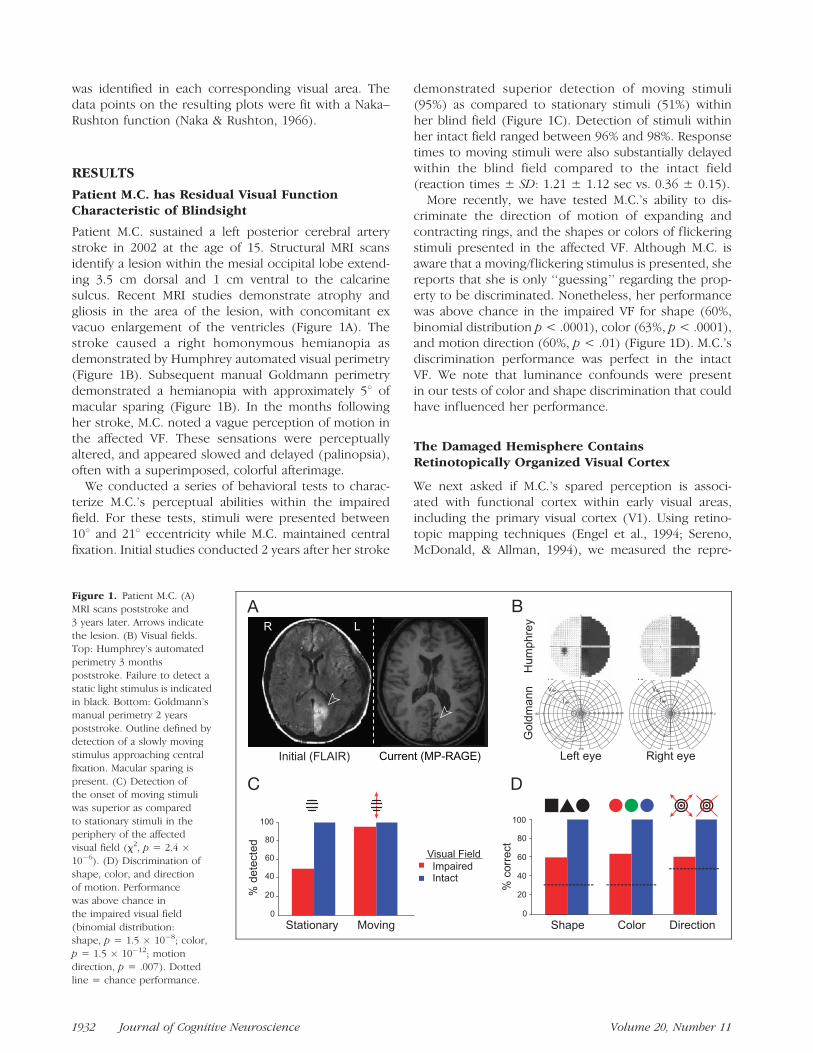
Patient M.C. sustained a left posterior cerebral arterystroke in 2002 at the age of 15. Structural MRI scansidentify a lesion within the mesial occipital lobe extend-ing 3.5 cm dorsal and 1 cm ventral to the calcarinesulcus. Recent MRI studies demonstrate atrophy andgliosis in the area of the lesion, with concomitant exvacuo enlargement of the ventricles (Figure 1A). Thestroke caused a right homonymous hemianopia asdemonstrated by Humphrey automated visual perimetry(Figure 1B). Subsequent manual Goldmann perimetrydemonstrated a hemianopia with approximately 58 ofmacular sparing (Figure 1B). In the months followingher stroke, M.C. noted a vague perception of motion inthe affected VF. These sensations were perceptuallyaltered, and appeared slowed and delayed (palinopsia),often with a superimposed, colorful afterimage.
We conducted a series of behavioral tests to charac-terize M.C.’s perceptual abilities within the impairedfield. For these tests, stimuli were presented between108 and 218 eccentricity while M.C. maintained centralfixation. Initial studies conducted 2 years after her stroke
demonstrated superior detection of moving stimuli(95%) as compared to stationary stimuli (51%) withinher blind field (Figure 1C). Detection of stimuli withinher intact field ranged between 96% and 98%. Responsetimes to moving stimuli were also substantially delayedwithin the blind field compared to the intact field(reaction times ± SD: 1.21 ± 1.12 sec vs. 0.36 ± 0.15).
More recently, we have tested M.C.’s ability to dis-criminate the direction of motion of expanding andcontracting rings, and the shapes or colors of flickeringstimuli presented in the affected VF. Although M.C. isaware that a moving/flickering stimulus is presented, shereports that she is only ‘‘guessing’’ regarding the prop-erty to be discriminated. Nonetheless, her performancewas above chance in the impaired VF for shape (60%,binomial distribution p < .0001), color (63%, p < .0001),and motion direction (60%, p < .01) (Figure 1D). M.C.’sdiscrimination performance was perfect in the intactVF. We note that luminance confounds were presentin our tests of color and shape discrimination that couldhave influenced her performance.
The Damaged Hemisphere ContainsRetinotopically Organized Visual Cortex
We next asked if M.C.’s spared perception is associ-ated with functional cortex within early visual areas,including the primary visual cortex (V1). Using retino-topic mapping techniques (Engel et al., 1994; Sereno,McDonald, & Allman, 1994), we measured the repre-
Figure 1. Patient M.C. (A)
MRI scans poststroke and
3 years later. Arrows indicate
the lesion. (B) Visual fields.Top: Humphrey’s automated
perimetry 3 months
poststroke. Failure to detect astatic light stimulus is indicated
in black. Bottom: Goldmann’s
manual perimetry 2 years
poststroke. Outline defined bydetection of a slowly moving
stimulus approaching central
fixation. Macular sparing is
present. (C) Detection ofthe onset of moving stimuli
was superior as compared
to stationary stimuli in theperiphery of the affected
visual field (x2, p = 2.4 �10�6). (D) Discrimination of
shape, color, and directionof motion. Performance
was above chance in
the impaired visual field
(binomial distribution:shape, p = 1.5 � 10�8; color,
p = 1.5 � 10�12; motion
direction, p = .007). Dottedline = chance performance.
1932 Journal of Cognitive Neuroscience Volume 20, Number 11

sentation of the intact and impaired VFs within striateand extrastriate cortical areas. Visual stimulation of eachhemifield was performed separately to allow unam-biguous attribution of responses within the damagedhemisphere to the impaired VF. Additionally, we ob-tained over 3 hours of retinotopic mapping data fromM.C. (acquired during multiple scanning sessions) tomaximize statistical power, and thus, our ability to detectattenuated neural signals.
The polar angle of visual stimulation was used todefine the borders of visual areas by phase reversal(Engel et al., 1994). Within M.C.’s healthy hemisphere,the normal arrangement of visual areas was found(Wandell, Brewer, & Dougherty, 2005) (Figure 2). With-in the damaged hemisphere, a retinotopically organizedvisual cortex was seen, also with the normal arrange-ment of visual areas including responses from theprimary visual cortex. Notably, these responses werefound even in the cortex that appears lesioned onstructural imaging, including area V1. Examination ofcortical responses to varying eccentricity of stimulation(Figure 3) demonstrated that parts of the lesionedcortex responded to stimulation of M.C.’s perimetricallyblind field. These responses were present within visualarea V1 (Figure 4). Thus, meaningful fMRI responses
were obtained from some voxels that contained dam-aged, but clearly not dead, neural tissue.
Neural and Behavioral Responses to StimulusContrast are Attenuated in Blindsight
A puzzle posed by the well-organized retinotopy seen inM.C.’s lesioned hemisphere is the relatively poor qualityof her visual perception. If a retinotopically organizedcortex (including V1) is present, why is M.C.’s percep-tion of the contralesional hemifield so impaired? Weasked if the response properties of the damaged andhealthy hemispheres differ, by obtaining neural andpsychophysical response functions to moving stimuliover a range of contrast levels. We presented a movingstimulus at the horizontal meridian in the periphery ofM.C.’s intact and impaired VF. The stimulus (expanding/contracting concentric rings) was presented at eightdifferent levels of contrast (ranging from 1% to 100%),along with null trials (0% contrast) in a pseudorandom-ized order. M.C. performed a detection task duringbehavioral testing and a vigilance task at central fixationduring fMRI scanning.
Within M.C.’s healthy hemisphere, cortical responsesto peripherally presented, moving stimuli were observed
Figure 2. Representation of
visual field polar angle. Polar
angle representation across thef lattened cortical hemispheres,
coded by color. The borders
of visual areas are indicated
by white lines; an asteriskmarks the center of the foveal
confluence. Gyri are in light
and sulci in dark gray; lesionarea as defined by anatomical
imaging indicated by black
hatching. Top inset: Cortical
unfolding with the calcarinesulcus in red.
Radoeva et al. 1933

Figure 3. Representation
of visual field eccentricity.
Eccentricity representation
across the f lattened corticalhemispheres, coded by color.
Labeling conventions are as
indicated for Figure 2. Notethat ‘‘blind’’ portions of the
visual field (>58 eccentricity,
indicated by the dotted,
white line on the color-codedlegend) are represented within
area V1 and extrastriate areas.
Figure 4. Neuroimaging data
from area V1, displayed on
inf lated but not f lattened
cortex. The panels presentthe data from Figures 2, 3,
and 5. Label conventions are
as specified for those figures.
1934 Journal of Cognitive Neuroscience Volume 20, Number 11
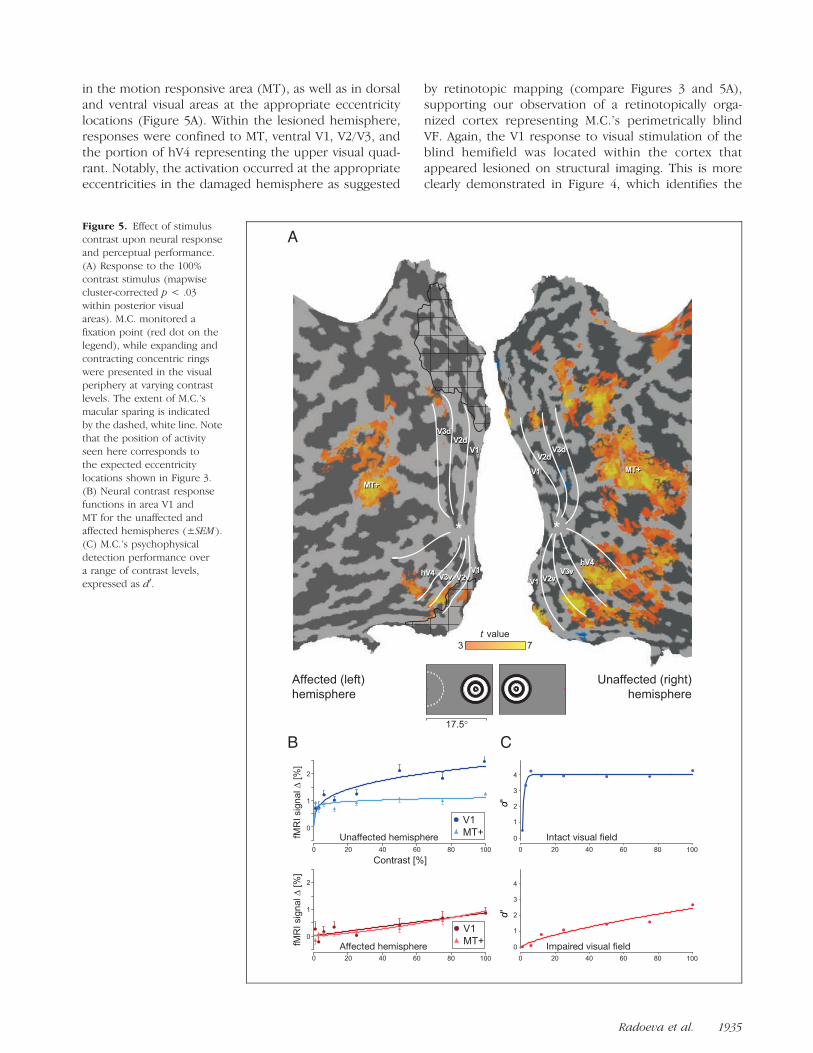
in the motion responsive area (MT), as well as in dorsaland ventral visual areas at the appropriate eccentricitylocations (Figure 5A). Within the lesioned hemisphere,responses were confined to MT, ventral V1, V2/V3, andthe portion of hV4 representing the upper visual quad-rant. Notably, the activation occurred at the appropriateeccentricities in the damaged hemisphere as suggested
by retinotopic mapping (compare Figures 3 and 5A),supporting our observation of a retinotopically orga-nized cortex representing M.C.’s perimetrically blindVF. Again, the V1 response to visual stimulation of theblind hemifield was located within the cortex thatappeared lesioned on structural imaging. This is moreclearly demonstrated in Figure 4, which identifies the
Figure 5. Effect of stimuluscontrast upon neural response
and perceptual performance.
(A) Response to the 100%
contrast stimulus (mapwisecluster-corrected p < .03
within posterior visual
areas). M.C. monitored a
fixation point (red dot on thelegend), while expanding and
contracting concentric rings
were presented in the visualperiphery at varying contrast
levels. The extent of M.C.’s
macular sparing is indicated
by the dashed, white line. Notethat the position of activity
seen here corresponds to
the expected eccentricity
locations shown in Figure 3.(B) Neural contrast response
functions in area V1 and
MT for the unaffected andaffected hemispheres (±SEM ).
(C) M.C.’s psychophysical
detection performance over
a range of contrast levels,expressed as d0.
Radoeva et al. 1935

responsive voxels within area V1 in relation to the le-sioned cortex.
To determine the relationship between neural re-sponse and contrast, we obtained the average fMRIsignal change for each contrast level in each visual area(Figure 5B; responses from additional visual areas arepresented in the Supplementary Figure). Within thehealthy hemisphere, the contrast-response functionswere comparable to those seen in previous studies ofnormal control subjects (Liu & Wandell, 2005): Area MTshowed little sensitivity to changes in contrast level,whereas V1 responses were modulated over a two- tothree-fold range. The contrast-response functions mea-sured in the lesioned hemisphere, however, were mark-edly attenuated with a greater dependence uponcontrast level. Of note, the maximal fMRI signal changeobserved within the lesioned V1 cortex was approxi-mately one-third that seen in the intact hemisphere.
How were these attenuated neural responses relatedto M.C.’s visual performance? We evaluated M.C.’s abilityto detect the stimuli across a range of contrast levels(Figure 5C). Although performance in the unaffected VFwas nearly perfect for all but the lowest contrast level,detection performance within the impaired VF wasmarkedly diminished, with a psychometric function thatwas far more dependent upon contrast than seen inthe intact VF. The perceptual performance within theintact and impaired VFs mirrored the neural responsefunctions obtained from the lesioned and healthy hemi-spheres, respectively.
Responses from Lesioned Cortex
To further evaluate the position of cortical responses tovisual stimulation in the damaged hemisphere, we ob-
tained high-resolution, T2-weighted structural imagesthrough M.C.’s occipital lobe. Figure 6 presents thelocation of voxels that were significantly activated bymoving stimuli presented in the nominally blind field. Ascan be seen, responses were present within the lesionedand atrophic cortex, including a remnant of the inferiorbank of the calcarine sulcus, corresponding both ana-tomically and on retinotopic mapping to area V1.
DISCUSSION
Patient M.C. is Phenomenologically Similar toOther Blindsight Cases
Cases of clinical blindsight are fairly infrequent. As aconsequence, the few patients with residual visual abil-ities after V1 lesion have been studied intensively. Ourpatient, M.C., is similar in many respects to these priorcases. Patient G.Y., for example, had a striate lesion aftertraumatic brain injury at a young age (8 years old), re-sulting in a perimetric hemianopia with macular sparing.Within his impaired field, he demonstrates a stato-kinetic dissociation (Sahraie et al., 1997) and an above-chance discrimination of color, shape, and direction ofmotion (Benson, Guo, & Blakemore, 1998). G.Y. hassome conscious awareness for visual stimuli (Stoerig &Barth, 2001), although he denies ‘‘seeing’’ objects andreports ‘‘guessing’’ in forced-choice paradigms. LikeM.C., Patient G.Y.’s perceptual abilities correlate withstimulus contrast (Stoerig, Zontanou, & Cowey, 2002).Other patients with lesions in the occipital cortex haveexhibited above-chance discrimination of motion direc-tion (Schoenfeld et al., 2002; Perenin, 1991) and shape(Marcel, 1998; Stoerig & Cowey, 1997), and some degreeof conscious awareness of stimulation in the affected
Figure 6. Cortical responses
to moving stimuli displayed on
a high-resolution anatomical
scan. The areas of significantcortical response to peripheral
stimulation of the impaired
visual field (Figure 5A) are
displayed atop high-resolution,coronal T2-weighted images.
The location of the area V1
response (as determinedby retinotopic mapping) is
indicated (arrows). The
lesioned cortex is atrophied
with altered white mattersignal. The indicated area of
activation is on the lower bank
of the calcarine sulcus, which
itself is distorted and enlargedfrom the surrounding loss of
cerebral volume. (Structural
image gray scale inverted forease of viewing).
1936 Journal of Cognitive Neuroscience Volume 20, Number 11

field. Therefore, M.C. is characteristic of other patientswith the neuropsychological phenomenon of blindsight.
V1 Activity in Blindsight
Studies of residual vision in monkeys with V1 lesions(Weiskrantz et al., 1977) have shown that subcorticalpathways to extrastriate areas can support visual func-tion. There is also evidence, however, that patients canhave residual vision in small portions of the blind VF,suggesting that spared ‘‘islands’’ of the V1 cortex medi-ate vision in some cases of blindsight (Wessinger et al.,1999; Fendrich et al., 1992). Additionally, moving orpattern-reversal stimuli presented to the affected VF elic-ited striate cortex responses in two out of four blind-sight patients (Morland et al., 2004; Kleiser et al., 2001).Therefore, there is the intriguing possibility that whatappears to be the same behavioral phenotype (low con-fidence but accurate detection of moving stimuli in aperimetrically blind field) may be mediated by differentneural mechanisms in different patients.
In our current study, we not only confirmed thatresponses in the early visual cortex (including V1) canaccompany the behavioral signature of blindsight per-formance but also described the properties and organi-zation of these visual areas. Within the cortex thatappears lesioned on anatomical imaging, we identifiedresponses from area V1 that are retinotopically orga-nized to represent M.C.’s perimetrically blind field andmanifest an attenuated contrast-response function thatmirrors her psychometric performance.
Although responses from the damaged cortex mightbe dismissed initially as artifact or the consequence ofaltered neurovascular coupling following ischemia andstroke (Roc et al., 2006; Marshall, 2004), several featuresof the response we observed demonstrate its functionalsignificance. The location of activity produced by pre-sentation of a moving stimulus was concordant with as-signed eccentricity calculated by retinotopic mapping.Moreover, the response of this region was appropriatelymodulated by stimulus contrast. Just as a patient neednot only be normally ‘‘sighted’’ or ‘‘blind,’’ a contin-uum of cortical damage following ischemic injury exists(Mitsias et al., 2004). In the case of M.C., the cortex inthe area of her stroke was atrophied and gliotic, leavingthe possibility of residual function. In other cases, dam-age results in a cystic region in which no neurons maybe reasonably expected to remain. Patients with blind-sight vary in this regard as well (Stoerig et al., 2002).
Could poor control of eye movements explain ourfindings? During initial behavioral testing, eye move-ments were tracked and M.C. demonstrated excellentcooperation with central fixation. During scanning, M.C.performed a constant vigilance task at central fixation.Her performance was generally high, and scanning pe-riods during which performance was lower were exclud-ed from the contrast-response analysis. It is, nonetheless,
possible that M.C. made covert eye movements duringtesting. Eye movements may be responsible for betterperformance on behavioral testing, although the alteredshape of her psychometric contrast-response functionwould be difficult to explain on this basis. Additionally,a tendency to directly view the retinotopic mappingstimuli during scanning would not be expected to alterthe shape of the observed map, but instead create areasof nonresponsive cortex (as the stimulus would be nowstimulating the foveal confluence). Thus, although im-perfect control of eye movements may have contributedto an inflation of measured behavioral performance, theycannot easily explain our neuroimaging findings.
A Functional Role for V1 and MT
In our study, we measured both M.C.’s behavioral andneural contrast-response functions. We found that theobserved responses in areas V1 and MT are modulatedby stimulus contrast in both hemispheres, although theshapes of these responses in the affected hemisphereare altered relative to the intact hemisphere, and reflectM.C.’s impaired psychometric performance.
What may we conclude regarding the functional roleof these visual areas in her spared vision? Although thecorrespondence between her perceptual performanceand the neural responses within V1 might be taken ini-tially as evidence that V1 is necessary for her sparedvision, this is not required to be the case. It remainspossible that M.C.’s vision within the blind field is sup-ported by direct projections from subcortical areas. Theneural contrast sensitivity plots (Figure 5B) reveal thatthe MT responses in the two hemispheres are very sim-ilar in magnitude for 100% stimulus contrast, whereasthe V1 response in the affected hemisphere is one-thirdthat observed in the unaffected hemisphere. It may bethe case that, at the highest contrast level, input fromsubcortical pathways to MT (despite or in addition toan attenuated V1 input) is sufficient to generate close-to-normal levels of MT activation. For lower contraststimuli, the signal from V1 may predominate. The ideathat cortical and subcortical projections differ in therange of transmitted contrast information is supportedby findings in a macaque with complete ablation of V1showing that residual vision is preserved for high- ratherthan low-contrast stimuli (Stoerig et al., 2002).
Furthermore, we might consider the extreme case thatthe observed V1 activity is driven entirely in a top–downmanner from MT. The contrast-response functions ofV1 and MT within the affected hemisphere (Figure 5B)are similar in shape and amplitude. In addition, top–down modulation of early visual areas by MT has beenobserved by magnetoencephalography in another blind-sight patient (Schoenfeld et al., 2002). Techniques withhigher temporal resolution (such as magnetoencephalog-raphy and/or ERP) would be required to explore whetherthe peak activation within V1 occurs prior to or after
Radoeva et al. 1937

the peak activation within MT, and could be the focusof further studies with Patient M.C. There are, however,limits to the extent to which responses in V1 might beexplained by top–down input. For example, it would bedifficult to explain the presence of well-organized retino-topic maps in early visual areas (V1, V2, V3) of the af-fected hemisphere, given the relatively coarse retinotopicorganization observed in area MT (Van Essen, Maunsell,& Bixby, 1981, however, see Huk, Dougherty, & Heeger,2002).
In our study, it was necessary to combine data fromseveral sessions, acquired at high field strength and withsurface coil techniques, to reliably identify responses fromthe striate cortex. Given that the magnitude of maximalresponse in the lesioned V1 was one-third that of theintact hemisphere, we might have failed to identify thisactivation if less data had been acquired. Notably, theattenuation of neural response in M.C.’s damaged hemi-sphere was much greater in striate than in extrastriateareas. It is therefore possible that an imaging study withless data might detect extrastriate responses but fail toresolve a weak striate signal.
In summary, we have demonstrated the presence ofretinotopically organized, functionally responsive V1 cor-tex representing the nominally blind field of a patientwith blindsight. Attenuated neural contrast-response func-tions were found to correlate with M.C.’s impaired psy-chophysical performance. These results demonstrate thatgraded performance is associated with graded neural re-sponses in V1, even in the absence of conscious visualperception.
Acknowledgments
We thank Patient M.C. for her patience and cooperation, Dr.Grant Liu for his clinical insights, and Dr. Anjan Chatterjee forhis guidance in our initial studies. G. K. A. is supported by aBurroughs-Wellcome Career Development Award. D. H. B. issupported by NEI EY10016. Support was also provided by NEIP30 EY001583.
Reprint requests should be sent to Geoffrey K. Aguirre, Depart-ment of Neurology, Hospital of the University of Pennsylvania,3400 Spruce Street, Philadelphia, PA 19104, or via e-mail:[email protected].
REFERENCES
Aguirre, G. K., Zarahn, E., & D’Esposito, M. (1998). Thevariability of human, bold hemodynamic responses.Neuroimage, 8, 360–369.
Baseler, H. A., Morland, A. B., & Wandell, B. A. (1999).Topographic organization of human visual areas inthe absence of input from primary cortex. Journal ofNeuroscience, 19, 2619–2627.
Benson, P. J., Guo, K., & Blakemore, C. (1998). Directiondiscrimination of moving gratings and plaids and coherencein dot displays without primary visual cortex (V1). EuropeanJournal of Neuroscience, 10, 3767–3772.
Blythe, I. M., Bromley, J. M., Kennard, C., & Ruddock, K. H.(1986). Visual discrimination of target displacement remains
after damage to the striate cortex in humans. Nature, 320,619–621.
Bruce, C. J., Desimone, R., & Gross, C. G. (1986). Bothstriate cortex and superior colliculus contribute to visualproperties of neurons in superior temporal polysensoryarea of macaque monkey. Journal of Neurophysiology,55, 1057–1075.
Cao, J. (1999). The size of the connected components ofexcursion sets of x2, t and f fields. Advances in AppliedProbability, 31, 579–595.
Cowey, A. (2004). The 30th Sir Frederick Bartlett lecture:Fact, artefact, and myth about blindsight. QuarterlyJournal of Experimental Psychology, Section A:Human Experimental Psychology, 57, 577–609.
Engel, S. A., Glover, G. H., & Wandell, B. A. (1997). Retinotopicorganization in human visual cortex and the spatialprecision of functional MRI. Cerebral Cortex, 7, 181–192.
Engel, S. A., Rumelhart, D. E., Wandell, B. A., Lee, A. T.,Glover, G. H., Chichilnisky, E. J., et al. (1994). fMRI ofhuman visual cortex. Nature, 369, 525.
Fendrich, R., Wessinger, C. M., & Gazzaniga, M. S. (1992).Residual vision in a scotoma: Implications for blindsight.Science, 258, 1489–1491.
Fendrich, R., Wessinger, C. M., & Gazzaniga, M. S. (2001).Speculations on the neural basis of islands of blindsight.Progress in Brain Research, 134, 353–366.
Goebel, R., Muckli, L., Zanella, F. E., Singer, W., & Stoerig, P.(2001). Sustained extrastriate cortical activation withoutvisual awareness revealed by fMRI studies of hemianopicpatients. Vision Research, 41, 1459–1474.
Huk, A. C., Dougherty, R. F., & Heeger, D. J. (2002). Retinotopyand functional subdivision of human areas MT and MST.Journal of Neuroscience, 22, 7195–7205.
Kasten, E., Wuest, S., & Sabel, B. A. (1998). Residual visionin transition zones in patients with cerebral blindness.Journal of Clinical and Experimental Neuropsychology,20, 581–598.
Kiebel, S. J., Poline, J. B., Friston, K. J., Holmes, A. P., &Worsley, K. J. (1999). Robust smoothness estimation instatistical parametric maps using standardized residualsfrom the general linear model. Neuroimage, 10, 756–766.
Kleiser, R., Wittsack, J., Niedeggen, M., Goebel, R., & Stoerig, P.(2001). Is V1 necessary for conscious vision in areas ofrelative cortical blindness? Neuroimage, 13, 654–661.
Liu, J., & Wandell, B. A. (2005). Specializations for chromaticand temporal signals in human visual cortex. Journal ofNeuroscience, 25, 3459–3468.
Marcel, A. J. (1998). Blindsight and shape perception: Deficitof visual consciousness or of visual function? Brain, 121,1565–1588.
Marshall, R. S. (2004). The functional relevance of cerebralhemodynamics: Why blood flow matters to the injuredand recovering brain. Current Opinion in Neurology, 17,705–709.
Mitsias, P. D., Ewing, J. R., Lu, M., Khalighi, M. M., Pasnoor, M.,Ebadian, H. B., et al. (2004). Multiparametric iterativeself-organizing MR imaging data analysis technique forassessment of tissue viability in acute cerebral ischemia.AJNR, American Journal of Neuroradiology, 25, 1499–1508.
Morland, A. B., Jones, S. R., Finlay, A. L., Deyzac, E., Le, S.,& Kemp, S. (1999). Visual perception of motion,luminance and colour in a human hemianope. Brain,122, 1183–1198.
Morland, A. B., Le, S., Carroll, E., Hoffmann, M. B., &Pambakian, A. (2004). The role of spared calcarine cortexand lateral occipital cortex in the responses of humanhemianopes to visual motion. Journal of CognitiveNeuroscience, 16, 204–218.
1938 Journal of Cognitive Neuroscience Volume 20, Number 11
Morris, J. S., DeGelder, B., Weiskrantz, L., & Dolan, R. J.(2001). Differential extrageniculostriate and amygdalaresponses to presentation of emotional faces in acortically blind field. Brain, 124, 1241–1252.
Naka, K. I., & Rushton, W. A. (1966). S-potentials fromcolour units in the retina of fish (Cyprinidae). Journalof Physiology, 185, 536–555.
Perenin, M. T. (1991). Discrimination of motion direction inperimetrically blind fields. NeuroReport, 2, 397–400.
Poppel, E., Held, R., & Frost, D. (1973). Residual visual functionafter brain wounds involving the central visual pathwaysin man. Nature, 243, 295–296.
Riddoch, G. (1917). Dissociation of visual perceptionsdue to occipital injuries, with especial reference toappreciation of movement. Brain: A Journal ofNeurology, 40, 15–57.
Roc, A. C., Wang, J., Ances, B. M., Liebeskind, D. S., Kasner,S. E., & Detre, J. A. (2006). Altered hemodynamicsand regional cerebral blood flow in patients withhemodynamically significant stenoses. Stroke, 37,382–387.
Rodman, H. R., Gross, C. G., & Albright, T. D. (1989).Afferent basis of visual response properties in area MT ofthe macaque: I. Effects of striate cortex removal. Journalof Neuroscience, 9, 2033–2050.
Rodman, H. R., Gross, C. G., & Albright, T. D. (1990).Afferent basis of visual response properties in area MT ofthe macaque: II. Effects of superior colliculus removal.Journal of Neuroscience, 10, 1154–1164.
Sahraie, A., Weiskrantz, L., Barbur, J. L., Simmons, A., Williams,S. C., & Brammer, M. J. (1997). Pattern of neuronal activityassociated with conscious and unconscious processing ofvisual signals. Proceedings of the National Academy ofSciences, U.S.A., 94, 9406–9411.
Scharli, H., Harman, A. M., & Hogben, J. H. (1999a). Blindsightin subjects with homonymous visual field defects. Journalof Cognitive Neuroscience, 11, 52–66.
Scharli, H., Harman, A. M., & Hogben, J. H. (1999b). Residualvision in a subject with damaged visual cortex. Journal ofCognitive Neuroscience, 11, 502–510.
Schoenfeld, M. A., Noesselt, T., Poggel, D., Tempelmann, C.,Hopf, J. M., Woldorff, M. G., et al. (2002). Analysis ofpathways mediating preserved vision after striate cortexlesions. Annals of Neurology, 52, 814–824.
Sereno, M. I., McDonald, C. T., & Allman, J. M. (1994). Analysisof retinotopic maps in extrastriate cortex. CerebralCortex, 4, 601–620.
Standage, G. P., & Benevento, L. A. (1983). The organizationof connections between the pulvinar and visual area MTin the macaque monkey. Brain Research, 262, 288–294.
Stoerig, P., & Barth, E. (2001). Low-level phenomenal vision
despite unilateral destruction of primary visual cortex.Consciousness and Cognition, 10, 574–587.
Stoerig, P., & Cowey, A. (1997). Blindsight in man and monkey.Brain, 120, 535–559.
Stoerig, P., & Cowey, A. (2007). Blindsight. Current Biology,17, R822–R824.
Stoerig, P., Zontanou, A. H., & Cowey, A. (2002). Aware orunaware: Assessment of cortical blindness in four menand a monkey. Cerebral Cortex, 12, 565–574.
Tomaiuolo, F., Ptito, M., Marzi, C. A., Paus, T., & Ptito, A.(1997). Blindsight in hemispherectomized patientsas revealed by spatial summation across the verticalmeridian. Brain, 120, 795–803.
Tong, F. (2003). Primary visual cortex and visual awareness.Nature Reviews Neuroscience, 4, 219–229.
Van Essen, D. C., Maunsell, J. H., & Bixby, J. L. (1981).The middle temporal visual area in the macaque:Myeloarchitecture, connections, functional properties,and topographic organization. Journal of ComparativeNeurology, 199, 293–326.
Wandell, B. A., Brewer, A. A., & Dougherty, R. F. (2005).Visual field map clusters in human cortex. PhilosophicalTransactions of the Royal Society of London, Series B,Biological Sciences, 360, 693–707.
Weiskrantz, L. (1996). Blindsight revisited. Current Opinionin Neurobiology, 6, 215–220.
Weiskrantz, L., Cowey, A., & Passingham, C. (1977). Spatialresponses to brief stimuli by monkeys with striate cortexablations. Brain, 100, 655–670.
Weiskrantz, L., Warrington, E. K., Sanders, M. D., & Marshall, J.(1974). Visual capacity in the hemianopic field followinga restricted occipital ablation. Brain, 97, 709–728.
Wessinger, C. M., Fendrich, R., & Gazzaniga, M. S. (1997).Islands of residual vision in hemianopic patients. Journalof Cognitive Neuroscience, 9, 203–221.
Wessinger, C. M., Fendrich, R., & Gazzaniga, M. S. (1999).Variability of residual vision in hemianopic subjects.Restorative Neurology and Neuroscience, 15, 243–253.
Worsley, K. J., & Friston, K. J. (1995). Analysis of fMRItime-series revisited—Again. Neuroimage, 2, 173–182.
Worsley, K. J., Marrett, S., Neelin, P., Vandal, A. C., Friston, K. J.,& Evans, A. C. (1996). A unified statistical approach fordetermining significant signals in images of cerebralactivation. Human Brain Mapping, 4, 58–73.
Zarahn, E., Aguirre, G. K., & D’Esposito, M. (1997). Empiricalanalyses of bold fMRI statistics: I. Spatially unsmootheddata collected under null-hypothesis conditions.Neuroimage, 5, 179–197.
Zeki, S., & Ffytche, D. H. (1998). The Riddoch syndrome:Insights into the neurobiology of conscious vision.Brain, 121, 25–45.
Radoeva et al. 1939