near-real-time processing of a ceilometer network assisted ... · 11862 a. cazorla et al.:...
TRANSCRIPT

Atmos. Chem. Phys., 17, 11861–11876, 2017https://doi.org/10.5194/acp-17-11861-2017© Author(s) 2017. This work is distributed underthe Creative Commons Attribution 3.0 License.
Near-real-time processing of a ceilometer network assisted withsun-photometer data: monitoring a dust outbreakover the Iberian PeninsulaAlberto Cazorla1,2, Juan Andrés Casquero-Vera1,2, Roberto Román1,2, Juan Luis Guerrero-Rascado1,2,Carlos Toledano3, Victoria E. Cachorro3, José Antonio G. Orza4, María Luisa Cancillo5,6, Antonio Serrano5,6,Gloria Titos7, Marco Pandolfi7, Andres Alastuey7, Natalie Hanrieder8, and Lucas Alados-Arboledas1,2
1Andalusian Institute for Earth System Research, IISTA-CEAMA, University of Granada, Junta de Andalucía, Granada, Spain2Department of Applied Physics, University of Granada, Granada, Spain3Grupo de Óptica Atmosférica (GOA), Universidad de Valladolid, Valladolid, Spain4SCOLAb, Física Aplicada, Universidad Miguel Hernández, Elche, Spain5Department of Physics, University of Extremadura, Badajoz, Spain6Institute of Water Research, Climate Change and Sustainability, IACYS, University of Extremadura, Badajoz, Spain7Institute of Environmental Assessment and Water Research (IDAEA-CSIC), Barcelona, Spain8German Aerospace Center (DLR), Institute of Solar Research, Plataforma Solar de Almería, Almería, Spain
Correspondence to: Alberto Cazorla ([email protected])
Received: 16 February 2017 – Discussion started: 12 April 2017Revised: 11 August 2017 – Accepted: 7 September 2017 – Published: 9 October 2017
Abstract. The interest in the use of ceilometers for opticalaerosol characterization has increased in the last few years.They operate continuously almost unattended and are alsomuch less expensive than lidars; hence, they can be dis-tributed in dense networks over large areas. However, dueto the low signal-to-noise ratio it is not always possible toobtain particle backscatter coefficient profiles, and the vastnumber of data generated require an automated and unsuper-vised method that ensures the quality of the profiles inver-sions.
In this work we describe a method that uses aerosol op-tical depth (AOD) measurements from the AERONET net-work that it is applied for the calibration and automated qual-ity assurance of inversion of ceilometer profiles. The methodis compared with independent inversions obtained by co-located multiwavelength lidar measurements. A differencesmaller than 15 % in backscatter is found between both in-struments. This method is continuously and automaticallyapplied to the Iberian Ceilometer Network (ICENET) anda case example during an unusually intense dust outbreakaffecting the Iberian Peninsula between 20 and 24 Febru-ary 2016 is shown. Results reveal that it is possible to obtainquantitative optical aerosol properties (particle backscatter
coefficient) and discriminate the quality of these retrievalswith ceilometers over large areas. This information has agreat potential for alert systems and model assimilation andevaluation.
1 Introduction
Atmospheric aerosol is one of the main responsible factors ofclimate radiative forcing through multiple processes includ-ing aerosol–radiation and aerosol–cloud interactions (IPCC,2014). The aerosol direct effects depend on the optical prop-erties and spatial and vertical distribution of the aerosol inthe atmosphere. In spite of the recent advances on instru-mentation that has improved the ability of characterizing keyaerosol properties and increase the spatial resolution, the as-sociated uncertainties are still considered to be one of themajors in climate forcing (Boucher et al., 2013).
In this sense, the implementation of observational net-works is crucial for spatial characterization of aerosol prop-erties. Ground-level aerosol measurement networks repre-sent key tools in the study of aerosol radiative forcing.These observational networks provide surface measurements
Published by Copernicus Publications on behalf of the European Geosciences Union.
11862 A. Cazorla et al.: Near-real-time processing of ceilometer network
distributed over large areas, e.g., the Global AtmosphericWatch, GAW (GAW, 2011), and ACTRIS (www.actris.eu)for Europe. In addition, one of the recognized instrumentsfor the retrieval of column-integrated aerosol properties isthe robotic sun and sky photometer that is used in the globalAerosol Robotic NETwork (AERONET; Holben et al., 1998;Dubovik et al., 2006). Lidar systems are well-known ac-tive remote sensing instruments for the vertically resolvedcharacterization of aerosol optical and microphysical prop-erties (Winker et al., 2003). GAW Atmospheric Lidar Ob-servation Network (GALION) has emerged as an initiativeof the GAW aerosol program (GAW, 2008). Its main objec-tive is to provide the vertical component of the aerosol distri-bution through advanced laser remote sensing in a networkof ground-based stations. Among other networks, GALIONincludes the European Aerosol Research Lidar Network(EARLINET) that provides vertical aerosol profile observa-tions over Europe based on 27 instruments in 16 countries(Pappalardo et al., 2014), the Micro-Pulse Lidar Network,MPLNET (Welton et al., 2001), and the Latin American Li-dar Network, LALINET (Guerrero-Rascado et al., 2016).
In order to obtain a larger spatial coverage than ground-based networks, in the last few years some space missionshave been promoted focusing on aerosol measurements fromsatellites, e.g the Lidar in Space Technology Experiment,LITE (McCormick, 1997), and the Cloud-Aerosol Lidar andInfrared Pathfinder Satellite Observation, CALIPSO (Winkeret al., 2003). The main disadvantage of measurements fromspaceborne platforms is the low temporal resolution, sincethe measurements are limited to the satellite passes over aregion.
The usefulness of vertically resolved aerosol characteri-zation has been proven by monitoring dust outbreaks (e.g.,Guerrero-Rascado et al., 2008, 2009; Cordoba-Jabonero etal., 2011; Bravo-Aranda et al., 2015; Preißler et al., 2011,2013, 2017; Granados-Muñoz et al., 2016), biomass burningplumes (e.g., Alados-Arboledas et al., 2011; Ortiz-Amezcuaet al., 2017) or the volcanic ash plume from the Eyjafjalla-jökull eruption on April 2010 (Navas-Guzmán et al., 2013;Pappalardo et al., 2013; Sicard et al., 2012). Precisely, thissingular event caused aviation problems and drew the atten-tion to the use of ceilometers for vertically resolved aerosolcharacterization (Flentje et al., 2010).
The complexity of lidar systems requires staff to be trainedin their operation, and the analysis procedures are not fullyautomated in many stations. In this sense, continuous opera-tion of lidar systems is not feasible for most stations. In addi-tion, economic and operational costs hinder the implementa-tion of dense lidar networks. On the other hand, ceilometersare one-wavelength (near infrared) lidars with simple techni-cal specifications (eye-safe low pulse energy and high pulserepetition frequencies) allowing for unattended and contin-uous operation. Originally designed for cloud base determi-nation, their performance has been improved in the last fewyears. Their capabilities have been shown for determining
planetary boundary layer (e.g., Wiegner et al., 2006; Münkelet al., 2007; Haeffelin et al., 2012; Pandolfi et al., 2013), de-tection and forecast of fog (Haeffelin et al., 2016), and recentefforts have been conducted to quantify the aerosol opticalinformation that can be derived from ceilometers (Frey et al.,2010; Heese et al., 2010, Wiegner et al., 2014).
The main advantage of the use of ceilometers for aerosolcharacterization is, on the one hand, the automatic and muchsimpler operation compared to lidars and, on the other hand,the possibility of installing them distributed over large ar-eas. Meteorological services such as those in Germany,France, the Netherlands or the United Kingdom are deploy-ing ceilometers networks to cover their national territorieswith the objective of reaching a spatial density of nearly onedevice every 100 km (e.g., de Haij and Klein-Baltink, 2007;Flentje et al., 2010). Due to a dense number of instrumentsand continuous measurements, operative networks need anautomated processing and a protocol that ensures the qualityof the data.
In this sense, two programs in Europe are dealing withthe use of automated lidars and ceilometers for aerosol andcloud properties characterization. The COST Action ES1303TOPROF (TOwards operational ground based PROFilingwith ceilometers, doppler lidars and microwave radiometersfor improving weather forecasts) aims in one of its work-ing groups at better characterizing the parameters that canbe derived from ceilometer measurements and related uncer-tainties. At the same time, E-PROFILE, a program of EU-METNET (EUropean METeorological services NETwork),focuses on the harmonization of ceilometer measurementsand data provision across Europe.
In this study we present the implementation of proceduresto manage a regional ceilometer network for aerosol char-acterization over the Iberian Peninsula, the Iberian Ceilome-ter Network (ICENET). An automatic calibration procedureis applied to the ceilometers and this calibration is used tovalidate the elastic inversion automatically applied to theprofiles. This method uses additional aerosol optical depth(AOD) information during the calibration for the quality as-surance of the data.
All processes can be performed unattended and in near-real time with the objective of obtaining reliable verticallyresolved aerosol optical properties. This information is es-pecially useful for strong events, such as mineral dust out-breaks, volcanic plumes, severe biomass burning episodes orcontamination episodes. Thus, the aerosol information ob-tained can be potentially used as an alert system for aviationor weather services or to feed models for assimilation andvalidation in near-real time.
The capabilities of this distributed network are exploredby characterizing an unusually intense dust outbreak affect-ing the Iberian Peninsula on 20–24 February 2016 and amulti-wavelength (MW) Raman lidar is used to validate theretrievals from ceilometers.
Atmos. Chem. Phys., 17, 11861–11876, 2017 www.atmos-chem-phys.net/17/11861/2017/

A. Cazorla et al.: Near-real-time processing of ceilometer network 11863
The next section describes the Iberian Ceilometer Net-work and related instrumentation used in this study. Sec-tion 3 presents the methodology, including the calibrationof ceilometers (Sect. 3.1) and the use of the calibration forinversion validation, as well as a validation with an inde-pendent lidar system (Sect. 3.2). The results are presentedin Sect. 4, with a description of the dust event (Sect. 4.1 and4.2) and retrievals from ceilometers (Sect. 4.3). Finally, con-clusions are presented in Sect. 5.
2 Instrumentation: the Iberian Ceilometer Network
An initiative of the Atmospheric Physics Group of the Uni-versity of Granada has been the coordination of a network ofceilometers (ICENET) combined with sun photometers forthe characterization of atmospheric aerosol with the objec-tive of obtaining reliable vertically resolved aerosol opticalproperties in near-real time. The first goal is obtaining the to-tal attenuated backscatter for all ceilometers in the network,i.e., to obtain calibrated output from ceilometers, and the sec-ond one is applying an inversion algorithm to the ceilometerprofiles in order to obtain the particle backscatter coefficient.All sites of this new network have a co-located AERONETCE318 sun–sky photometer (Cimel Electronique) that isused to constrain the ceilometers calibration and inversionretrievals. In addition, the high-performance lidar systemMULHACEN, located at the EARLINET Granada station,is used as an independent validation of the inversions. Thisnested approach combining high-performance systems likethose operated in EARLINET and the distributed ceilometerplus sun photometer is an example of synergy among activeand passive remote sensing observations in the ACTRIS re-search infrastructure (www.actris.eu).
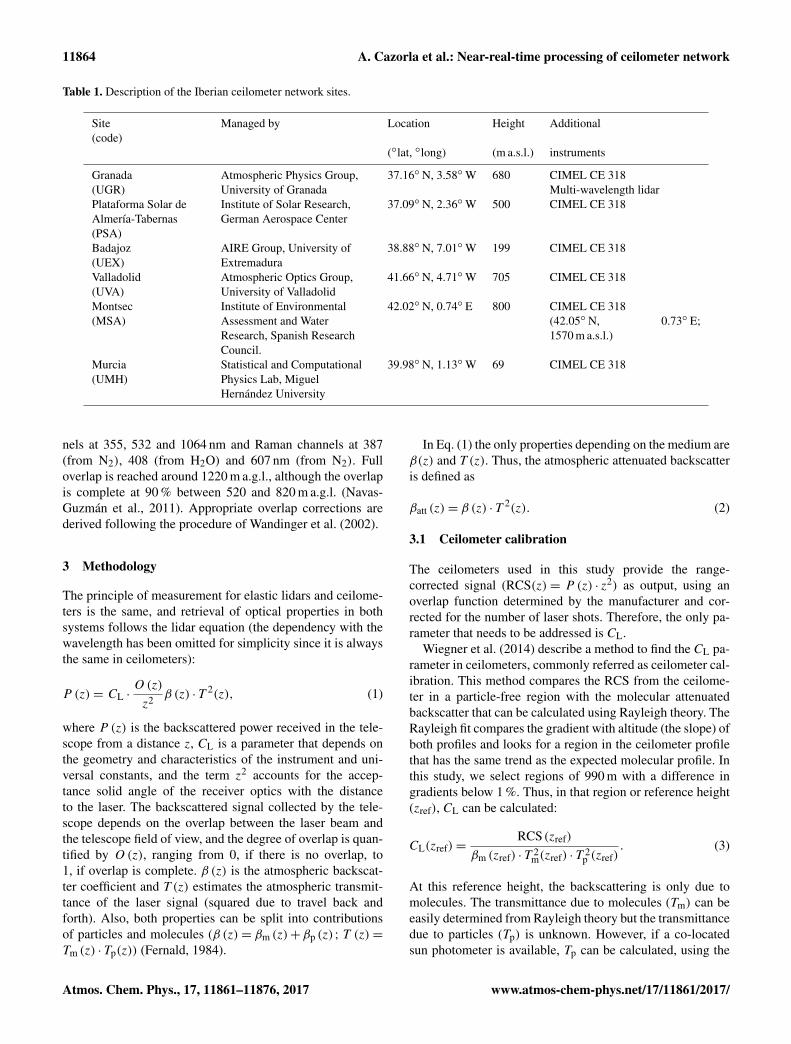
Figure 1 shows a map of the ceilometer distribution overthe Iberian Peninsula, and Table 1 presents the characteristicsof each site.
All sites operate a Jenoptik (now Lufft) CHM15k-Nimbusceilometer and have a co-located AERONET sun photome-ter, except Montsec station (MSA), which has the photome-ter 770 m above the ceilometer and at a horizontal distanceof 2 km approximately (Titos et al., 2017). The ceilometer atMurcia (UMH) was not operative during the outbreak studiedin this work.
The CHM15k is a ceilometer that operates with a pulsedNd : YAG laser emitting at 1064 nm. The energy per pulse is8.4 µJ with a repetition frequency in the range of 5–7 kHz.The laser beam divergence is less than 0.3 mrad and the laserbackscattered signal is collected on a telescope with a fieldof view of 0.45 mrad. The signal is detected by an avalanchephotodiode in photon-counting mode. Complete overlap ofthe telescope and the laser beam is found about 1500 m abovethe instrument (Heese et al., 2010). According to the over-lap function provided by the manufacturer, the overlap is90 % complete between 555 and 885 m a.g.l. The vertical
Figure 1. Map of the Iberian Peninsula showing the location of theceilometers. At Granada station (circled in red) a co-located multi-wavelength Raman lidar is also available.
resolution used is 15 m and the maximum height recordedis 15360 m a.g.l. Ceilometers at Granada (UGR), Tabernas(PSA) and Valladolid (UVA) operate at a temporal resolutionof 15 s, while ceilometers at Montsec (MSA) and Badajoz(UEX) operate at a temporal resolution of 1 min.
The process of calibration for ceilometers described onthe next section is assisted with AOD data from co-locatedAERONET stations. All sun photometers near the ceilome-ters belong to the Iberian network for aerosol measurements(RIMA), a regional network associated with AERONET.This means that all instruments are routinely calibrated fol-lowing the same protocol and the data are quality-controlled.The sun photometer provides solar extinction measurementsat 340, 380, 440, 675, 870, 936 and 1020 nm, allowing forcomputing the AOD at these wavelengths (except 936 nm).The AOD uncertainty ranges from ±0.01 in the infrared–visible to ±0.02 in the ultraviolet channels (Holben et al.,1998). For comparison with the ceilometers the AOD isextrapolated to 1064 nm by the Ångström law (Ångström,1964) using the AOD measurements at 870 and 1020 nm.Level 1.5 AERONET data, which are automatically cloud-screened and delivered in near-real time, are used in this anal-ysis.
At UGR station a multi-wavelength Raman lidar system(MULHACEN) is used for validation of the ceilometer in-versions. The upgraded LR331-D400 (Raymetrics Inc.) op-erated at IISTA-CEAMA (Andalusian Institute for Earth Sys-tem Research) has been part of EARLINET since April 2005.This lidar system is a ground-based, six-wavelength systemwith a pulsed Nd : YAG laser. The emitted wavelengths are355, 532 and 1064 nm with output energies per pulse of 60,65 and 110 mJ, respectively. It has elastic backscatter chan-
www.atmos-chem-phys.net/17/11861/2017/ Atmos. Chem. Phys., 17, 11861–11876, 2017
11864 A. Cazorla et al.: Near-real-time processing of ceilometer network
Table 1. Description of the Iberian ceilometer network sites.
Site(code)
Managed by Location Height Additional
(◦lat, ◦long) (m a.s.l.) instruments
Granada(UGR)
Atmospheric Physics Group,University of Granada
37.16◦ N, 3.58◦W 680 CIMEL CE 318Multi-wavelength lidar
Plataforma Solar deAlmería-Tabernas(PSA)
Institute of Solar Research,German Aerospace Center
37.09◦ N, 2.36◦W 500 CIMEL CE 318
Badajoz(UEX)
AIRE Group, University ofExtremadura
38.88◦ N, 7.01◦W 199 CIMEL CE 318
Valladolid(UVA)
Atmospheric Optics Group,University of Valladolid
41.66◦ N, 4.71◦W 705 CIMEL CE 318
Montsec(MSA)
Institute of EnvironmentalAssessment and WaterResearch, Spanish ResearchCouncil.
42.02◦ N, 0.74◦ E 800 CIMEL CE 318(42.05◦ N, 0.73◦ E;1570 m a.s.l.)
Murcia(UMH)
Statistical and ComputationalPhysics Lab, MiguelHernández University
39.98◦ N, 1.13◦W 69 CIMEL CE 318
nels at 355, 532 and 1064 nm and Raman channels at 387(from N2), 408 (from H2O) and 607 nm (from N2). Fulloverlap is reached around 1220 m a.g.l., although the overlapis complete at 90 % between 520 and 820 m a.g.l. (Navas-Guzmán et al., 2011). Appropriate overlap corrections arederived following the procedure of Wandinger et al. (2002).
3 Methodology
The principle of measurement for elastic lidars and ceilome-ters is the same, and retrieval of optical properties in bothsystems follows the lidar equation (the dependency with thewavelength has been omitted for simplicity since it is alwaysthe same in ceilometers):
P (z)= CL ·O (z)
z2 β (z) · T 2(z), (1)
where P (z) is the backscattered power received in the tele-scope from a distance z, CL is a parameter that depends onthe geometry and characteristics of the instrument and uni-versal constants, and the term z2 accounts for the accep-tance solid angle of the receiver optics with the distanceto the laser. The backscattered signal collected by the tele-scope depends on the overlap between the laser beam andthe telescope field of view, and the degree of overlap is quan-tified by O (z), ranging from 0, if there is no overlap, to1, if overlap is complete. β (z) is the atmospheric backscat-ter coefficient and T (z) estimates the atmospheric transmit-tance of the laser signal (squared due to travel back andforth). Also, both properties can be split into contributionsof particles and molecules (β (z)= βm (z)+βp (z) ; T (z)=
Tm (z) · Tp(z)) (Fernald, 1984).
In Eq. (1) the only properties depending on the medium areβ(z) and T (z). Thus, the atmospheric attenuated backscatteris defined as
βatt (z)= β (z) · T2(z). (2)
3.1 Ceilometer calibration
The ceilometers used in this study provide the range-corrected signal (RCS(z)= P (z) · z2) as output, using anoverlap function determined by the manufacturer and cor-rected for the number of laser shots. Therefore, the only pa-rameter that needs to be addressed is CL.
Wiegner et al. (2014) describe a method to find the CL pa-rameter in ceilometers, commonly referred as ceilometer cal-ibration. This method compares the RCS from the ceilome-ter in a particle-free region with the molecular attenuatedbackscatter that can be calculated using Rayleigh theory. TheRayleigh fit compares the gradient with altitude (the slope) ofboth profiles and looks for a region in the ceilometer profilethat has the same trend as the expected molecular profile. Inthis study, we select regions of 990 m with a difference ingradients below 1 %. Thus, in that region or reference height(zref), CL can be calculated:
CL(zref)=RCS(zref)
βm (zref) · T 2m(zref) · T 2
p (zref). (3)
At this reference height, the backscattering is only due tomolecules. The transmittance due to molecules (Tm) can beeasily determined from Rayleigh theory but the transmittancedue to particles (Tp) is unknown. However, if a co-locatedsun photometer is available, Tp can be calculated, using the
Atmos. Chem. Phys., 17, 11861–11876, 2017 www.atmos-chem-phys.net/17/11861/2017/
A. Cazorla et al.: Near-real-time processing of ceilometer network 11865
AOD at 1064 nm:
T 2p (zref)= e
−2×AOD. (4)
When trying to automate the calibration process, the mainproblem is that zref must be a particle-free region and, due tothe low signal-to-noise ratio, finding zref is not always possi-ble. In some cases, the region might be a non-particle-free re-gion that, on average, follows the molecular trend (they havea similar gradient). Also, we might find several regions thatmeet the criteria, but it is complicated to discriminate auto-matically which one is the most appropriate. A way to ensurethat the zref selected is a molecular region is by applying theKlett–Fernald inversion algorithm (Klett, 1981, 1985; Fer-nald et al., 1972; Fernald, 1984) as follows.
First, we need to determine the zref. Thus, after finding zref,the Klett–Fernald inversion is applied. Heese et al. (2010)and Wiegner et al. (2012, 2014) showed the capabilities ofceilometers by applying this inversion algorithm to study afew cases. Using the AOD measurements, the lidar ratio (Lr)of the inversion can be adjusted. This can be done by match-ing the integral of the particle extinction coefficient profile(i.e., particle backscatter coefficient profile multiplied by theLr) with the AOD. Wiegner et al. (2012) applied this proce-dure to a Jenoptik CHM15kx ceilometer, obtaining reason-able values for the Lr.
In summary, the calibration process is carried out as fol-lows:
1. First, temporal averaging of the profiles is performed(hourly averages are used for the calibration). The first300 m of the profile are assigned to the value at 300 mto avoid large overlap correction.
2. Second, for each profile a set of potential zref is obtainedby comparing the profiles of the RCS and βm, which isobtained from a standard atmosphere profile scaled toground temperature and pressure. The slopes are calcu-lated over a 990 m window. All regions with slope dif-ferences below 1 % are selected.
3. For each zref, and Lr from 20 to 80 sr, Klett–Fernaldinversion is applied and the resulting profile for thebackscattering coefficient is integrated and multipliedby the Lr and compared to the AOD. The pair zref andLr that minimizes the difference between the integralof the particle extinction coefficient profile (i.e., parti-cle backscatter coefficient profile multiplied by the Lr)with the AOD is selected.
4. Finally, CL is calculated using Eq. (3) if the minimumdifference calculated in step 3 is below 10 %.
CL calculated with this method uses Eq. (4) to calculateT 2
p . In the case of MSA the sun photometer is 770 m abovethe ceilometer and the T 2
p calculated would not be represen-tative of the entire column. However, MSA is a remote moun-tain site and the effect of accounting for T 2
p values obtained
Table 2. Mean calibration factors for ceilometers in ICENET forthe period 1 May 2014 to 1 May 2016.
Site code CL (m3 sr)
UGR (1.6± 0.4)× 1011
PSA (3.3± 0.7)× 1011
UEX (3.7± 0.9)× 1011
UVA (3.8± 0.5)× 1011
MSA (3.1± 0.7)× 1011
UMH (4.4± 0.9)× 1011
using the AOD measured from 770 m above the ceilometercan be considered negligible.
Thus, the total attenuated backscatter can be calculated byapplying the following equation:
βatt(z)=RCS(z)CL(zref)
. (5)
Calibration values can be used individually or averaged overa period of time. Table 2 shows a mean calibration factor(± standard deviation) calculated using this method for allsites in ICENET for the period 1 May 2014 to 1 May 2016.
3.2 Ceilometer inversion
Total attenuated backscatter obtained by applying the cal-ibration factor allows the comparison between ceilometerssince the signal is corrected for instrument characteristics.Also, a long time series of the calibration allows determin-ing possible problems or degradation of the systems. How-ever, the total attenuated backscatter is influenced by trans-mission, so in order to be able to monitor and compare sin-gular events at multiple sites, the backscattering coefficientis more appropriate. Section 3.1 showed that it is possibleto apply the Klett–Fernald inversion to ceilometer data, butthe challenge is to determine automatically, without humansupervision, whether the inversion is correct or not.
A common step between the calibration proposed inSect. 3.1 and Klett–Fernald inversion is finding a referenceheight (Zref). At the Zref selected for the inversion withRayleigh fit, applying Eq. (3), we can obtain a value thathas to be close to the CL calculated for the instrument on alonger period of time. If a simultaneous AOD measurement isavailable, the calibration process itself provides the invertedbackscattering coefficient profile (steps 3 and 4 of the cali-bration process) and the inversion can be marked as valid orinvalid based on the value of the CL compared to a long-termCL value. If no simultaneous AOD measurement is available(e.g., during nighttime or partially cloudy skies), an approxi-mation of the AOD needs to be used in order to apply Eq. (4).In this case, an interpolated value or an averaged value canbe used.
www.atmos-chem-phys.net/17/11861/2017/ Atmos. Chem. Phys., 17, 11861–11876, 2017
11866 A. Cazorla et al.: Near-real-time processing of ceilometer network
The next section quantifies the differences between thesebackscattering coefficient inversions and the inversions cal-culated independently with a multi-wavelength Raman lidar.
Lidar – ceilometer comparison
During the dust outbreak affecting the Iberian Peninsula be-tween 20 and 24 February 2016, the multi-wavelength lidaroperated on 22 February between 07:30 and 14:00 UTC andon 23 February between 08:00 and 13:30 UTC. Elastic inver-sions using the Klett–Fernald method were applied to 30 minaverage profiles at 1064 nm using a fixed lidar ratio of 50 sr.Thus, a total of 24 particle backscatter coefficient profileswere obtained. Coherence of the inversion at 1064 nm waschecked against the Klett–Fernald and Raman methods at355 and 532 nm. The resolution of the multi-wavelength li-dar (7.5 m) has been downscaled to 15 m for the comparisonwith the ceilometer.
The ceilometer elastic inversion, using the Klett–Fernaldmethod, was also applied to 30 min average profiles for thesame period; a total of 15 profiles were successfully inverted(a reference height was found automatically). The calibra-tion factor at the reference height was calculated using theaverage AOD for the entire dust event. If negative CL valuesare discarded, a total of 11 profiles are comparable with lidarinversions.
Each one of the derived CL values at the reference heightselected for the inversion is compared with long-term CL cal-culated for the Granada station ceilometer over a long periodof time (see Table 2), classifying the situation according tostatistical parameters measuring the agreement between theceilometer and lidar retrievals. The normalized mean bias(NMB) in particle backscatter of the ceilometer and lidar pro-file is calculated following Eq. (6). The center of mass of theprofiles is calculated with Eq. (7), as is the relative differencebetween ceilometer and lidar center of mass. Finally, the co-efficient of correlation (R) of the profiles is determined.
NMB=βceil−β lidar
β lidar(6)
Cmass =
∫ zmaxzmin
z ·β(z)dz∫ zmaxzmin
β(z)dz(7)
In Eq. (6), βceil and β lidar are the mean particle backscat-ter coefficient from ceilometer and lidar, respectively, for theentire retrieved profile, and β in Eq. (7) may refer to ceilome-ter or lidar particle backscatter coefficient depending on thecase.
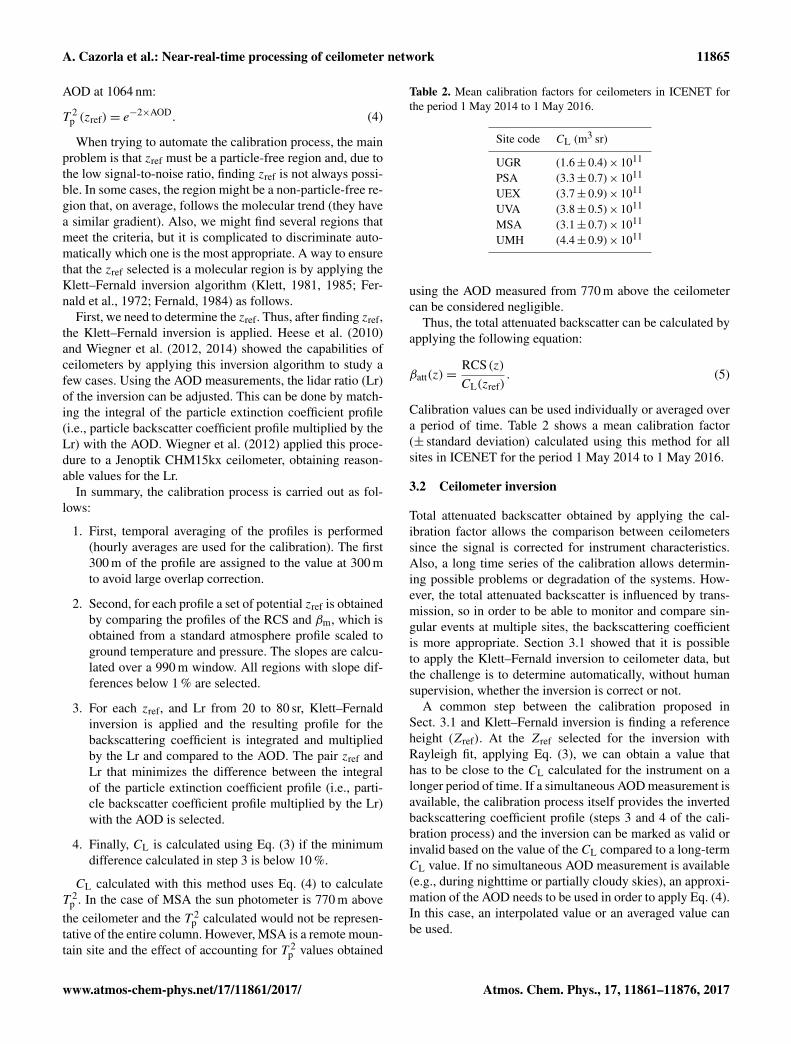
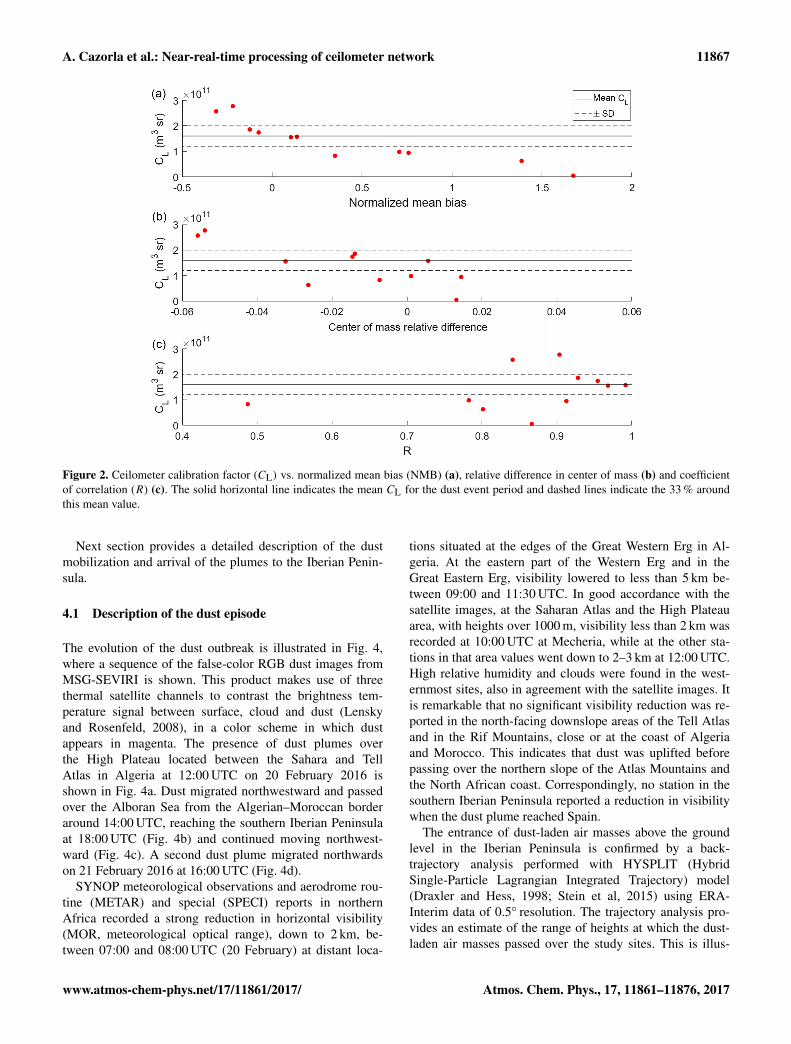
Figure 2 shows for the 11 comparable profiles, the re-trieved calibration factors at the reference height on theceilometer profile versus the NMB (panel a), center of massrelative differences (panel b) and R (panel c). It is evidentthat ceilometer profiles with a calibration factor closer to themean calibration factor have inversions closer to the lidar in-versions. Figure 2 also shows that, for the statistics NMB
and R, the difference between the calibration factor and themean calibration factor is related, and the farther the pro-file calibration factor is from the mean value, the worse thementioned statistics. Thus, it seems feasible to determine thequality of the profiles by selecting an appropriate thresholdfor this difference. Considering a maximum discrepancy be-tween the particular calibration factor and the long-term cali-bration factor equal to 1 standard deviation of the mean valueof the calibration factor (dotted lines in Fig. 2), we obtainfour profiles that have a NMB smaller than 15 %; the centerof mass of the profiles is practically the same, with a relativedifference smaller than 2 %, and finally R of the profiles isabove 0.92.
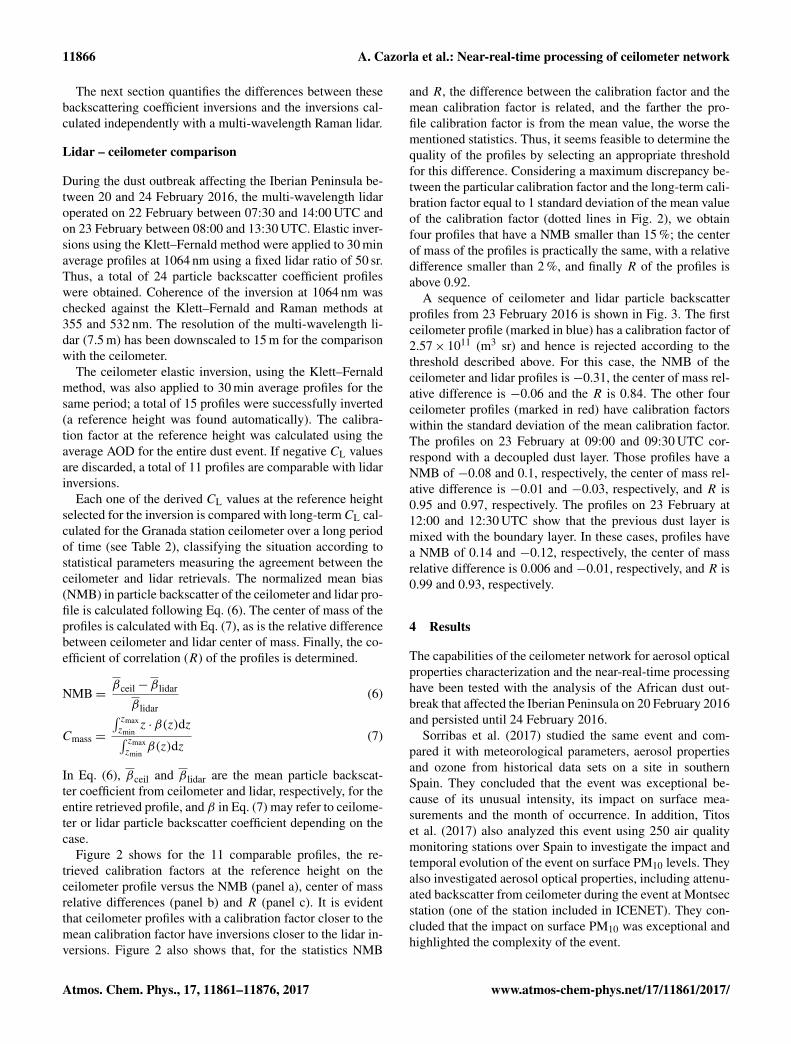
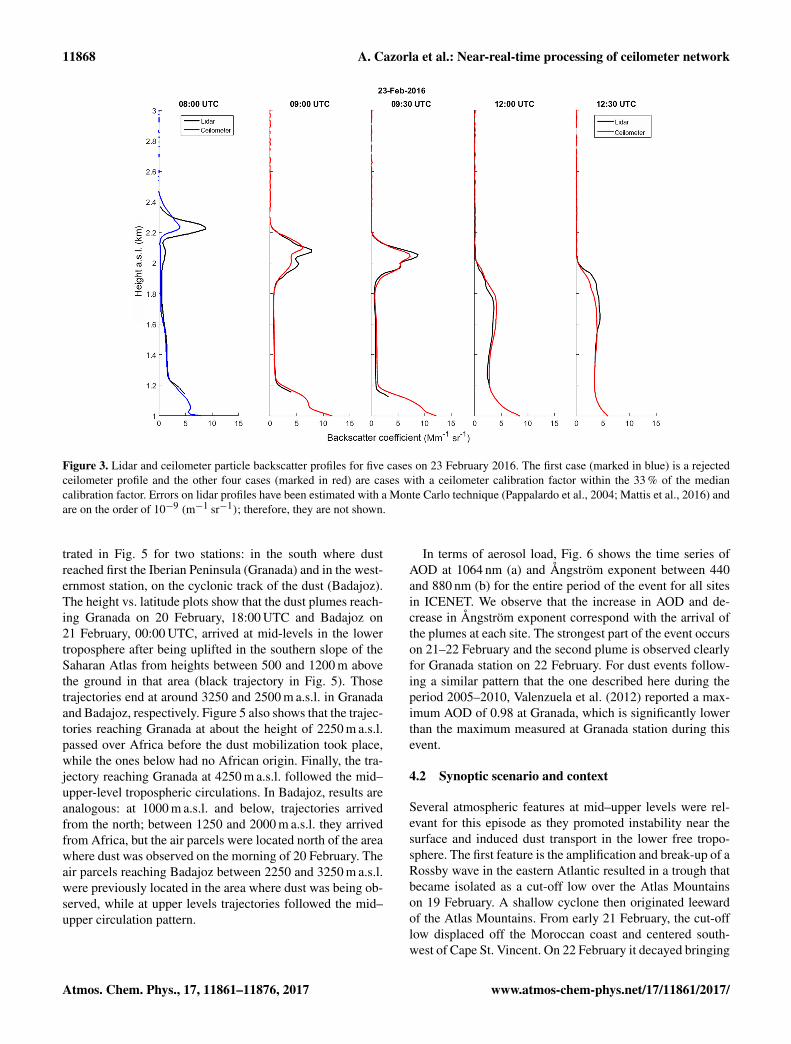
A sequence of ceilometer and lidar particle backscatterprofiles from 23 February 2016 is shown in Fig. 3. The firstceilometer profile (marked in blue) has a calibration factor of2.57× 1011 (m3 sr) and hence is rejected according to thethreshold described above. For this case, the NMB of theceilometer and lidar profiles is −0.31, the center of mass rel-ative difference is −0.06 and the R is 0.84. The other fourceilometer profiles (marked in red) have calibration factorswithin the standard deviation of the mean calibration factor.The profiles on 23 February at 09:00 and 09:30 UTC cor-respond with a decoupled dust layer. Those profiles have aNMB of −0.08 and 0.1, respectively, the center of mass rel-ative difference is −0.01 and −0.03, respectively, and R is0.95 and 0.97, respectively. The profiles on 23 February at12:00 and 12:30 UTC show that the previous dust layer ismixed with the boundary layer. In these cases, profiles havea NMB of 0.14 and −0.12, respectively, the center of massrelative difference is 0.006 and −0.01, respectively, and R is0.99 and 0.93, respectively.
4 Results
The capabilities of the ceilometer network for aerosol opticalproperties characterization and the near-real-time processinghave been tested with the analysis of the African dust out-break that affected the Iberian Peninsula on 20 February 2016and persisted until 24 February 2016.
Sorribas et al. (2017) studied the same event and com-pared it with meteorological parameters, aerosol propertiesand ozone from historical data sets on a site in southernSpain. They concluded that the event was exceptional be-cause of its unusual intensity, its impact on surface mea-surements and the month of occurrence. In addition, Titoset al. (2017) also analyzed this event using 250 air qualitymonitoring stations over Spain to investigate the impact andtemporal evolution of the event on surface PM10 levels. Theyalso investigated aerosol optical properties, including attenu-ated backscatter from ceilometer during the event at Montsecstation (one of the station included in ICENET). They con-cluded that the impact on surface PM10 was exceptional andhighlighted the complexity of the event.
Atmos. Chem. Phys., 17, 11861–11876, 2017 www.atmos-chem-phys.net/17/11861/2017/
A. Cazorla et al.: Near-real-time processing of ceilometer network 11867
Figure 2. Ceilometer calibration factor (CL) vs. normalized mean bias (NMB) (a), relative difference in center of mass (b) and coefficientof correlation (R) (c). The solid horizontal line indicates the mean CL for the dust event period and dashed lines indicate the 33 % aroundthis mean value.
Next section provides a detailed description of the dustmobilization and arrival of the plumes to the Iberian Penin-sula.
4.1 Description of the dust episode
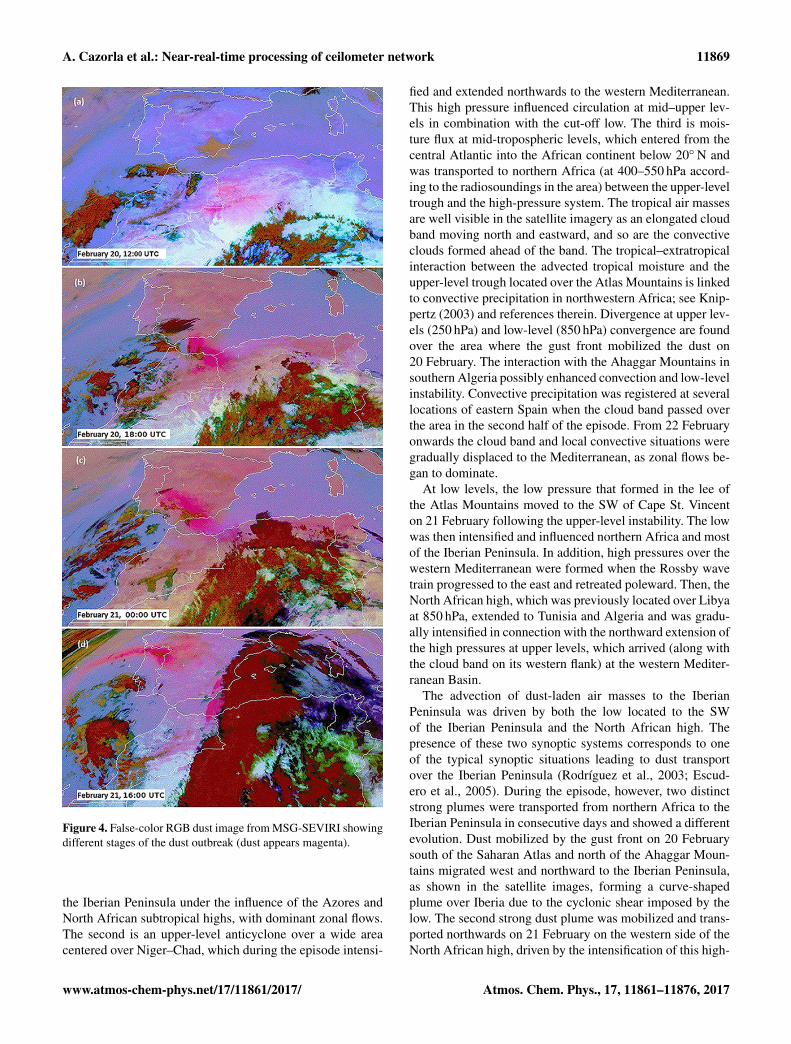
The evolution of the dust outbreak is illustrated in Fig. 4,where a sequence of the false-color RGB dust images fromMSG-SEVIRI is shown. This product makes use of threethermal satellite channels to contrast the brightness tem-perature signal between surface, cloud and dust (Lenskyand Rosenfeld, 2008), in a color scheme in which dustappears in magenta. The presence of dust plumes overthe High Plateau located between the Sahara and TellAtlas in Algeria at 12:00 UTC on 20 February 2016 isshown in Fig. 4a. Dust migrated northwestward and passedover the Alboran Sea from the Algerian–Moroccan borderaround 14:00 UTC, reaching the southern Iberian Peninsulaat 18:00 UTC (Fig. 4b) and continued moving northwest-ward (Fig. 4c). A second dust plume migrated northwardson 21 February 2016 at 16:00 UTC (Fig. 4d).
SYNOP meteorological observations and aerodrome rou-tine (METAR) and special (SPECI) reports in northernAfrica recorded a strong reduction in horizontal visibility(MOR, meteorological optical range), down to 2 km, be-tween 07:00 and 08:00 UTC (20 February) at distant loca-
tions situated at the edges of the Great Western Erg in Al-geria. At the eastern part of the Western Erg and in theGreat Eastern Erg, visibility lowered to less than 5 km be-tween 09:00 and 11:30 UTC. In good accordance with thesatellite images, at the Saharan Atlas and the High Plateauarea, with heights over 1000 m, visibility less than 2 km wasrecorded at 10:00 UTC at Mecheria, while at the other sta-tions in that area values went down to 2–3 km at 12:00 UTC.High relative humidity and clouds were found in the west-ernmost sites, also in agreement with the satellite images. Itis remarkable that no significant visibility reduction was re-ported in the north-facing downslope areas of the Tell Atlasand in the Rif Mountains, close or at the coast of Algeriaand Morocco. This indicates that dust was uplifted beforepassing over the northern slope of the Atlas Mountains andthe North African coast. Correspondingly, no station in thesouthern Iberian Peninsula reported a reduction in visibilitywhen the dust plume reached Spain.
The entrance of dust-laden air masses above the groundlevel in the Iberian Peninsula is confirmed by a back-trajectory analysis performed with HYSPLIT (HybridSingle-Particle Lagrangian Integrated Trajectory) model(Draxler and Hess, 1998; Stein et al, 2015) using ERA-Interim data of 0.5◦ resolution. The trajectory analysis pro-vides an estimate of the range of heights at which the dust-laden air masses passed over the study sites. This is illus-
www.atmos-chem-phys.net/17/11861/2017/ Atmos. Chem. Phys., 17, 11861–11876, 2017
11868 A. Cazorla et al.: Near-real-time processing of ceilometer network
Figure 3. Lidar and ceilometer particle backscatter profiles for five cases on 23 February 2016. The first case (marked in blue) is a rejectedceilometer profile and the other four cases (marked in red) are cases with a ceilometer calibration factor within the 33 % of the mediancalibration factor. Errors on lidar profiles have been estimated with a Monte Carlo technique (Pappalardo et al., 2004; Mattis et al., 2016) andare on the order of 10−9 (m−1 sr−1); therefore, they are not shown.
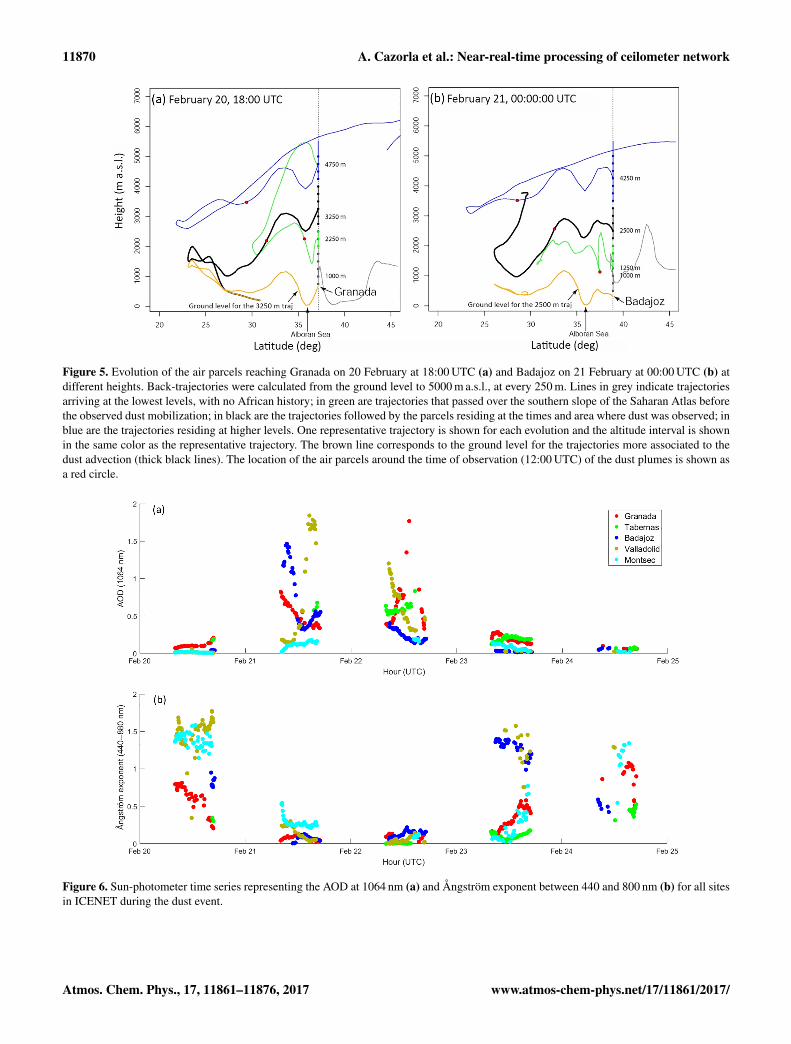
trated in Fig. 5 for two stations: in the south where dustreached first the Iberian Peninsula (Granada) and in the west-ernmost station, on the cyclonic track of the dust (Badajoz).The height vs. latitude plots show that the dust plumes reach-ing Granada on 20 February, 18:00 UTC and Badajoz on21 February, 00:00 UTC, arrived at mid-levels in the lowertroposphere after being uplifted in the southern slope of theSaharan Atlas from heights between 500 and 1200 m abovethe ground in that area (black trajectory in Fig. 5). Thosetrajectories end at around 3250 and 2500 m a.s.l. in Granadaand Badajoz, respectively. Figure 5 also shows that the trajec-tories reaching Granada at about the height of 2250 m a.s.l.passed over Africa before the dust mobilization took place,while the ones below had no African origin. Finally, the tra-jectory reaching Granada at 4250 m a.s.l. followed the mid–upper-level tropospheric circulations. In Badajoz, results areanalogous: at 1000 m a.s.l. and below, trajectories arrivedfrom the north; between 1250 and 2000 m a.s.l. they arrivedfrom Africa, but the air parcels were located north of the areawhere dust was observed on the morning of 20 February. Theair parcels reaching Badajoz between 2250 and 3250 m a.s.l.were previously located in the area where dust was being ob-served, while at upper levels trajectories followed the mid–upper circulation pattern.
In terms of aerosol load, Fig. 6 shows the time series ofAOD at 1064 nm (a) and Ångström exponent between 440and 880 nm (b) for the entire period of the event for all sitesin ICENET. We observe that the increase in AOD and de-crease in Ångström exponent correspond with the arrival ofthe plumes at each site. The strongest part of the event occurson 21–22 February and the second plume is observed clearlyfor Granada station on 22 February. For dust events follow-ing a similar pattern that the one described here during theperiod 2005–2010, Valenzuela et al. (2012) reported a max-imum AOD of 0.98 at Granada, which is significantly lowerthan the maximum measured at Granada station during thisevent.
4.2 Synoptic scenario and context
Several atmospheric features at mid–upper levels were rel-evant for this episode as they promoted instability near thesurface and induced dust transport in the lower free tropo-sphere. The first feature is the amplification and break-up of aRossby wave in the eastern Atlantic resulted in a trough thatbecame isolated as a cut-off low over the Atlas Mountainson 19 February. A shallow cyclone then originated leewardof the Atlas Mountains. From early 21 February, the cut-offlow displaced off the Moroccan coast and centered south-west of Cape St. Vincent. On 22 February it decayed bringing
Atmos. Chem. Phys., 17, 11861–11876, 2017 www.atmos-chem-phys.net/17/11861/2017/
A. Cazorla et al.: Near-real-time processing of ceilometer network 11869
Figure 4. False-color RGB dust image from MSG-SEVIRI showingdifferent stages of the dust outbreak (dust appears magenta).
the Iberian Peninsula under the influence of the Azores andNorth African subtropical highs, with dominant zonal flows.The second is an upper-level anticyclone over a wide areacentered over Niger–Chad, which during the episode intensi-
fied and extended northwards to the western Mediterranean.This high pressure influenced circulation at mid–upper lev-els in combination with the cut-off low. The third is mois-ture flux at mid-tropospheric levels, which entered from thecentral Atlantic into the African continent below 20◦ N andwas transported to northern Africa (at 400–550 hPa accord-ing to the radiosoundings in the area) between the upper-leveltrough and the high-pressure system. The tropical air massesare well visible in the satellite imagery as an elongated cloudband moving north and eastward, and so are the convectiveclouds formed ahead of the band. The tropical–extratropicalinteraction between the advected tropical moisture and theupper-level trough located over the Atlas Mountains is linkedto convective precipitation in northwestern Africa; see Knip-pertz (2003) and references therein. Divergence at upper lev-els (250 hPa) and low-level (850 hPa) convergence are foundover the area where the gust front mobilized the dust on20 February. The interaction with the Ahaggar Mountains insouthern Algeria possibly enhanced convection and low-levelinstability. Convective precipitation was registered at severallocations of eastern Spain when the cloud band passed overthe area in the second half of the episode. From 22 Februaryonwards the cloud band and local convective situations weregradually displaced to the Mediterranean, as zonal flows be-gan to dominate.
At low levels, the low pressure that formed in the lee ofthe Atlas Mountains moved to the SW of Cape St. Vincenton 21 February following the upper-level instability. The lowwas then intensified and influenced northern Africa and mostof the Iberian Peninsula. In addition, high pressures over thewestern Mediterranean were formed when the Rossby wavetrain progressed to the east and retreated poleward. Then, theNorth African high, which was previously located over Libyaat 850 hPa, extended to Tunisia and Algeria and was gradu-ally intensified in connection with the northward extension ofthe high pressures at upper levels, which arrived (along withthe cloud band on its western flank) at the western Mediter-ranean Basin.
The advection of dust-laden air masses to the IberianPeninsula was driven by both the low located to the SWof the Iberian Peninsula and the North African high. Thepresence of these two synoptic systems corresponds to oneof the typical synoptic situations leading to dust transportover the Iberian Peninsula (Rodríguez et al., 2003; Escud-ero et al., 2005). During the episode, however, two distinctstrong plumes were transported from northern Africa to theIberian Peninsula in consecutive days and showed a differentevolution. Dust mobilized by the gust front on 20 Februarysouth of the Saharan Atlas and north of the Ahaggar Moun-tains migrated west and northward to the Iberian Peninsula,as shown in the satellite images, forming a curve-shapedplume over Iberia due to the cyclonic shear imposed by thelow. The second strong dust plume was mobilized and trans-ported northwards on 21 February on the western side of theNorth African high, driven by the intensification of this high-
www.atmos-chem-phys.net/17/11861/2017/ Atmos. Chem. Phys., 17, 11861–11876, 2017
11870 A. Cazorla et al.: Near-real-time processing of ceilometer network
Figure 5. Evolution of the air parcels reaching Granada on 20 February at 18:00 UTC (a) and Badajoz on 21 February at 00:00 UTC (b) atdifferent heights. Back-trajectories were calculated from the ground level to 5000 m a.s.l., at every 250 m. Lines in grey indicate trajectoriesarriving at the lowest levels, with no African history; in green are trajectories that passed over the southern slope of the Saharan Atlas beforethe observed dust mobilization; in black are the trajectories followed by the parcels residing at the times and area where dust was observed; inblue are the trajectories residing at higher levels. One representative trajectory is shown for each evolution and the altitude interval is shownin the same color as the representative trajectory. The brown line corresponds to the ground level for the trajectories more associated to thedust advection (thick black lines). The location of the air parcels around the time of observation (12:00 UTC) of the dust plumes is shown asa red circle.
Figure 6. Sun-photometer time series representing the AOD at 1064 nm (a) and Ångström exponent between 440 and 800 nm (b) for all sitesin ICENET during the dust event.
Atmos. Chem. Phys., 17, 11861–11876, 2017 www.atmos-chem-phys.net/17/11861/2017/

A. Cazorla et al.: Near-real-time processing of ceilometer network 11871
pressure system, which was the dominating feature in thesecond half of the episode. In this second case, dust was ad-vected mostly below the cloud band and affected the easternpart of the Iberian Peninsula as well as most of the westernMediterranean Basin.
The low-pressure system weakened on early 22 Februaryand the region was increasingly dominated by the Azores andthe North African highs. As a consequence, zonal flow sweptthe first dust plume along northern Spain from west to eastin subsequent days. The second dust plume, which was mov-ing northward along eastern Iberia, was also displaced to theMediterranean. The study region was then under high pres-sures and the event ended.
4.3 Ceilometer data analysis
The vertical structure of the dust event described above hasbeen monitored with ICENET: firstly, by obtaining the totalattenuated backscatter profiles using the calibration factorsfrom Table (2) and, secondly, by applying the inversion andobtaining particle backscatter profiles. In addition, the inte-gral of the backscatter profiles multiplied by the lidar ratiois used to estimate the AOD during the event and the centerof mass of the backscatter profiles is considered as an in-dicator of the presence of a decoupled aerosol layer (a dustplume in this case) or the entrainment of the aerosol layerinto the boundary layer. All these products were calculatedin near-real time and serve as an example of the promisingcapabilities for real-time characterization of singular eventswith a network of distributed ceilometers.
Figure 7 shows time series of total attenuated backscat-ter profiles, i.e., calibrated profiles, for the five ceilometersused in this study. From top to bottom the series correspondto Granada, Tabernas, Badajoz, Valladolid and Montsec sta-tions, respectively. Tabernas station is covered by clouds dur-ing most of the event and Montsec station is also affected byclouds during part of the event.
Dust arrives first at the stations in Granada and Tabernas(on 20 February at 18:00 UTC). As the dust plume movesnorthwestward we observe the dust plume in Badajoz (on21 February at 00:00 UTC) and Valladolid (on 21 Febru-ary at 06:00 UTC). At Montsec, the dust plume is detectedon 21 February at 12:00 UTC). The second plume bringsthe cloud band and this is visible at Tabernas station around12:00 UTC on 21 February and a bit later at 21:00 UTC on21 February at Montsec station. Finally, the displacement ofthe dust from west to east at the end of the event, when thecut-off low weakens, appears as a dust plume at Valladolid on22 February at 15:00 UTC, at Badajoz station on 22 Febru-ary at 21:00 UTC, and at Granada station on 23 February at06:00 UTC. Tabernas and Montsec are influenced by the sec-ond dust plume and the cloud band, and this is not as clearlyvisible as at the other stations. Another feature that is ob-served in Fig. 7 is that the dust plumes, especially the firstone, are entrained into the boundary layer rapidly.
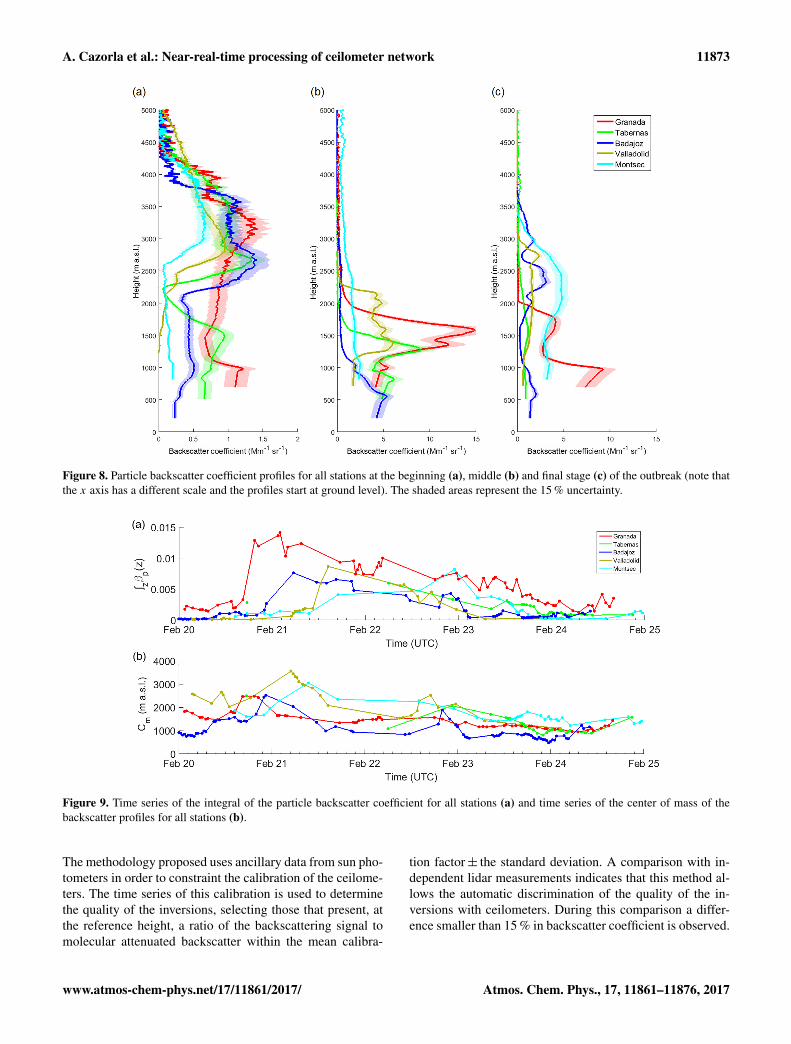
After applying the inversion, a quantitative comparison ofstations is possible, as shown in Fig. 8, for different stages ofthe dust outbreak (the specific times are shown on the verticallines in Fig. 7). The beginning of the outbreak, when the firstplume arrives at the different stations, is shown in Fig. 8a.The center of mass of the dust plumes is about 3000 m a.s.l.for all stations. Additionally, for Granada and Badajoz, weobserve that the height of the peak in particle backscatter co-efficient is in accordance with the backward trajectory anal-ysis shown in Sect. 4.1. The arrival of the second plume isshown in Fig. 8b for all sites on 22 February at 06:00 UTC.At this stage, we observe that Granada and Tabernas sta-tions (which are only 100 km apart) show very different be-havior in particle backscatter and also in the height of thedust plume. Finally, Fig. 8c shows the final part of the out-break when dust is mobilized eastwards to the MediterraneanSea. In this case, dust is below 2000 m a.s.l. for Granada andTabernas, whereas for the rest of the stations it is still ob-served above 3000 m a.s.l. In general, the particle backscattercoefficient profiles indicate a stronger intensity of the eventat this stage of the event, after the second plume arrives, es-pecially for Granada and Tabernas.
For the entire dust outbreak period and all stations the in-tegral of the backscatter profiles is shown in Fig. 9a. Thisparameter allows identifying the beginning of the dust eventfor each station. Thus, an increase is observed in the inte-gral of the backscatter in Granada around 20 February at19:30 UTC, at Badajoz it is detected around 21 February at05:30 UTC, and at Valladolid and Montsec it is observed at16:30 UTC and 17:00 UTC, respectively. Due to clouds, thisincrease in the integral of the backscatter is not observed inTabernas. The influence of the dust load after the first plumemasks the arrival of the second plume, but the dust mobi-lization towards the Mediterranean sea is observed again atBadajoz (around 22 February at 20:00 UTC) and in Montsecat 23:00 UTC. The change in the integral of backscatter tolarger values is coincident with the starting time observedin the total attenuated backscatter temporal series, and itis in accordance with the satellite observations and back-trajectory analysis. Additionally, the center of mass of theparticle backscatter coefficient profiles is used to monitor theevolution of the profile region with more predominance ofaerosol particles. Thus, in Fig. 9b for Granada before theevent, the center of mass is about 1500 m a.s.l., and when thedust arrives the center of mass is elevated to 2500 m. After9 h the center of mass is about the same as before the event,indicating that, possibly, the dust plume is no longer decou-pled, and it is entrained into the boundary layer. A similarbehavior is observed for Badajoz, Valladolid and Montsecstations. Again, the second plume is not observed in changesin the center of mass, but the mobilization of dust towards theMediterranean Sea is observed as an increase in the center ofmass of the profiles for Badajoz, Valladolid and Tabernas.
www.atmos-chem-phys.net/17/11861/2017/ Atmos. Chem. Phys., 17, 11861–11876, 2017

11872 A. Cazorla et al.: Near-real-time processing of ceilometer network
Figure 7. Ceilometer time series of total attenuated backscatter representing the evolution of the dust outbreak between 20 and 24 Febru-ary 2016 (the color scale is logarithmic). Red vertical lines indicate the time of the profiles in Fig. 8: the first line of each site indicates thetimes for Fig. 8a, second line those for Fig. 8b, and third line those for Fig. 8c.
5 Conclusions
The use of ceilometers for the characterization of opticalaerosol properties is possible but, due to the weak signal, it
is important to screen out profiles in order to ensure the qual-ity of the inversion. In addition, due to the vast number ofdata, it is important to perform all these operations in an au-tomated, unsupervised way and, preferably, in near-real time.
Atmos. Chem. Phys., 17, 11861–11876, 2017 www.atmos-chem-phys.net/17/11861/2017/
A. Cazorla et al.: Near-real-time processing of ceilometer network 11873
Figure 8. Particle backscatter coefficient profiles for all stations at the beginning (a), middle (b) and final stage (c) of the outbreak (note thatthe x axis has a different scale and the profiles start at ground level). The shaded areas represent the 15 % uncertainty.
Figure 9. Time series of the integral of the particle backscatter coefficient for all stations (a) and time series of the center of mass of thebackscatter profiles for all stations (b).
The methodology proposed uses ancillary data from sun pho-tometers in order to constraint the calibration of the ceilome-ters. The time series of this calibration is used to determinethe quality of the inversions, selecting those that present, atthe reference height, a ratio of the backscattering signal tomolecular attenuated backscatter within the mean calibra-
tion factor± the standard deviation. A comparison with in-dependent lidar measurements indicates that this method al-lows the automatic discrimination of the quality of the in-versions with ceilometers. During this comparison a differ-ence smaller than 15 % in backscatter coefficient is observed.
www.atmos-chem-phys.net/17/11861/2017/ Atmos. Chem. Phys., 17, 11861–11876, 2017

11874 A. Cazorla et al.: Near-real-time processing of ceilometer network
Thus, it is feasible to routinely provide particle backscattercoefficient profiles with ceilometers.
The inverted profiles obtained with ceilometers could beused for elevated aerosol layer alert by setting a threshold onthe particle backscatter coefficient values of the profile andare potentially useful for model assimilation and evaluationsince all the processing is automated and in near-real time.
This method has been applied to a group of ceilometers(ICENET) and tested during a dust outbreak reaching Spainon 20 February 2016 and lasting until 24 February 2016.This dust event affected all ICENET stations, with two dis-tinct plumes reaching the Iberian Peninsula following differ-ent paths and a final stage where zonal flows swept the dusttowards the Mediterranean Sea. This scheme of dust mobi-lization is unusual for this season of the year, and the in-tensity, spatial coverage and duration of the event make itperfect as a test for monitoring purposes with the ceilometernetwork. The calibration of the ceilometers allows a quali-tative monitoring of the event, while the inversions providequantitative information. Thus, ceilometers can complementlidar stations that, in principle, would operate intermittentlyand with less spatial density. It is worth noting that differ-ences have been observed on profiles 100 km apart. This re-inforces the need for providing vertical profiles of aerosoloptical properties with a dense spatial resolution.
Parameters extracted from the particle backscatter coeffi-cient profiles such as the integral or the center of mass canalso give a quantitative idea of the presence of an elevatedaerosol layer. These parameters are expected to increase withan elevated aerosol layer, and the second one can be used asa rough indicator for the deposition velocity of an elevatedaerosol layer by comparing a time series of these values.
Data availability. Sun-photometer data have been downloadedfrom the AERONET website (http://aeronet.gsfc.nasa.gov). All rawand processed lidar and ceilometer data are available from the cor-responding author upon request.
Competing interests. The authors declare that they have no conflictof interest.
Acknowledgements. This work was supported by the Spanish Min-istry of Economy and Competitiveness through projects CGL2012-39623-C02-01, CGL2013-45410-R, CGL2014-56255-C2-1-R,CMT2015-66742-R, CGL2015-70741-R, CGL2015-73250-JINand CGL2016-81092-R; by the regional government of Andalusiathrough project P12-RNM-2409; by the regional governmentof Castilla y Leon through project VA100U14; by the Junta deExtremadura (Ayuda a Grupos de Investigación GR15137); andby the European Union’s Horizon 2020 research and innovationprogram through project ACTRIS-2 (grant agreement no. 654109).The authors thankfully acknowledge the FEDER program for theinstrumentation used in this work. This work was also partially
funded by the University of Granada through the contract “PlanPropio. Programa 9. Convocatoria 2013”. Marco Pandolfi is fundedby a Ramón y Cajal Fellowship (RYC-2013-14036) awarded by theSpanish Ministry of Economy and Competitiveness. The authorswould like to acknowledge the valuable contribution through thediscussions in the working group meetings organized by COSTAction ES1303 (TOPROF).
Edited by: Bernhard VogelReviewed by: two anonymous referees
References
Alados-Arboledas, L., Müller, D., Guerrero-Rascado, J. L., Navas-Guzmán, F., Pérez-Ramírez, D., and Olmo, F. J.: Optical andmicrophysical properties of fresh biomass burning aerosol re-trieved by Raman lidar, and star-and sun-photometry, Geophys.Res. Lett., 38, L01807, https://doi.org/10.1029/2010GL045999,2011.
Ångström, A.: The parameters of atmospheric turbidity, Tellus, 16,64–75, 1964.
Boucher, O., Randall, D., Artaxo, P., Bretherton, C., Feingold, G.,Forster, P., Kerminen, V.-M., Kondo, Y., Liao, H., Lohmann, U.,Rasch, P., Satheesh, S. K., Sherwood, S., Stevens B., and Zhang,X. Y.: Clouds and Aerosols, in: Climate Change 2013: The Phys-ical Science Basis. Contribution of Working Group I to the FifthAssessment Report of the Intergovernmental Panel on ClimateChange, edited by: Stocker, T. F., Qin, D., Plattner, G.-K., Tig-nor, M., Allen, S. K., Boschung, J., Nauels, A., Xia, Y., Bex, V.,and Midgley, P. M., Cambridge University Press, Cambridge, UKand New York, NY, USA, 2013.
Bravo-Aranda, J., Titos, G., Granados-Muñoz, M., Guerrero-Rascado, J., Navas-Guzmán, F., Valenzuela, A., Lyamani,H., Olmo, F., Andrey, J., and Alados-Arboledas, L.: Studyof mineral dust entrainment in the planetary boundarylayer by lidar depolarization technique, Tellus B, 67, 1–13,https://doi.org/10.3402/tellusb.v67.26180, 2015.
Córdoba-Jabonero, C., Sorribas, M., Guerrero-Rascado, J. L.,Adame, J. A., Hernández, Y., Lyamani, H., Cachorro, V., Gil,M., Alados-Arboledas, L., Cuevas, E., and de la Morena, B.:Synergetic monitoring of Saharan dust plumes and potential im-pact on surface: a case study of dust transport from Canary Is-lands to Iberian Peninsula, Atmos. Chem. Phys., 11, 3067–3091,https://doi.org/10.5194/acp-11-3067-2011, 2011.
de Haij, M., Wauben, W., and Klein-Baltink, H.: Continuous mixinglayer height determination using the LD-40 ceilometer: a feasi-bility study. KNMI Scientific Report WR 2007-01, 98 pp., 2007.
Draxler, R. R. and Hess, G. D.: An Overview of the HYSPLIT_4Modelling System for Trajectories, Dispersion, and Deposition,Aust. Meteorol. Mag., 47, 295–308, 1998.
Dubovik, O., Sinyuk, A., Lapyonok, T., Holben, B.N., Mishchenko,M., Yang, P., Eck, T.F., Volten, H., Muñoz, O., Veihelmann, B.,van der Zande, W.J., Leon, J.-F., Sorokin, M., and Slutsker, I.:Application of spheroid models to account for aerosol particlenonsphericity in remote sensing of desert dust, J. Geophys. Res.,111, D11208, https://doi.org/10.1029/2005JD006619, 2006.
Escudero, M., Castillo, S., Querol, X., Avila, A., Alarcón,M., Viana, M. M., Alastuey, A., Cuevas, E., and Ro-
Atmos. Chem. Phys., 17, 11861–11876, 2017 www.atmos-chem-phys.net/17/11861/2017/

A. Cazorla et al.: Near-real-time processing of ceilometer network 11875
dríguez, S.: Wet and dry African dust episodes overeastern Spain, J. Geophys. Res.-Atmos., 110, D18S08,https://doi.org/10.1029/2004JD004731, 2005.
Fernald, F. G.: Analysis of atmospheric lidar observations: somecomments, Appl. Optics, 23, 652–653, 1984.
Fernald, F. G., Herman, B. M., and Reagan, J. A.: Determinationof Aerosol Height Distributions by Lidar, J. Appl. Meteorol., 11,482–489, 1972.
Flentje, H., Heese, B., Reichardt, J., and Thomas, W.: Aerosolprofiling using the ceilometer network of the GermanMeteorological Service, Atmos. Meas. Tech. Discuss.,https://doi.org/10.5194/amtd-3-3643-2010, 2010.
Frey, S., Poenitz, K., Teschke, G., and Wille, H.: Detection ofaerosol layers with ceilometers and the recognition of the mixedlayer depth, ISARS, 3646/3647, 1–4, 2010.
GAW report 178: Plan for the implementation of the GAW AerosolLidar Observation Network GALION (Hamburg, Germany, 27–29 March 2007) (WMO TD No. 1443), 52 pp., 2008.
GAW report 197: World Meteorological Organization Global At-mospheric Watch, Addendum for the period 2012–2015 to theWMO Global Atmospheric Watch (GAW) Strategic Plan 2008–2015, 63 pp., 2011.
Granados-Muñoz, M. J., Bravo-Aranda, J. A., Baumgardner, D.,Guerrero-Rascado, J. L., Pérez-Ramírez, D., Navas-Guzmán, F.,Veselovskii, I., Lyamani, H., Valenzuela, A., Olmo, F. J., Titos,G., Andrey, J., Chaikovsky, A., Dubovik, O., Gil-Ojeda, M., andAlados-Arboledas, L.: A comparative study of aerosol micro-physical properties retrieved from ground-based remote sensingand aircraft in situ measurements during a Saharan dust event,Atmos. Meas. Tech., 9, 1113–1133, https://doi.org/10.5194/amt-9-1113-2016, 2016.
Guerrero-Rascado, J. L., Ruiz, B., and Alados-Arboledas, L.: Multi-spectral Lidar characterization of the vertical structure of Saha-ran dust aerosol over southern Spain, Atmos. Environ., 42, 2668–2681, 2008.
Guerrero-Rascado, J. L., Olmo, F. J., Avilés-Rodríguez, I., Navas-Guzmán, F., Pérez-Ramírez, D., Lyamani, H., and Alados Ar-boledas, L.: Extreme Saharan dust event over the southernIberian Peninsula in september 2007: active and passive remotesensing from surface and satellite, Atmos. Chem. Phys., 9, 8453–8469, https://doi.org/10.5194/acp-9-8453-2009, 2009.
Guerrero-Rascado, J. L., Landulfo, E., Antuña, J. C., Barbosa, H.M. J., Barja, B., Bastidas, A. E., Bedoya, A. E., da Costa, R.,Estevan, R., Forno, R. N., Gouveia, D. A., Jimenez, C., Lar-roza, E. G., Lopes, F. J. S., Montilla-Rosero, E., Moreira, G. A.,Nakaema, W. M., Nisperuza, D., Alegria, D., Manera, M., Otero,L., Papandrea, S., Pallota, J. V., Pawelko, E., Quel, E. J., Ris-tori, P., Rodrigues, P. F., Salvador, J., Sanchez, M., and Silva, A.:Latin American Lidar Network (LALINET): diagnosis on net-work instrumentation, J. Atmos. Sol.-Terr. Phys., 138/139, 112–120, https://doi.org/10.1016/j.jastp.2016.01.001, 2016.
Haeffelin, M., Angelini, F., Morille, Y., Martucci, G., Frey, S.,Gobbi, G. P., Lolli, S., O’Dowd, C. D., Sauvage, L., Xueref-Rémy, I., Wastine, B., and Feist, D. G.: Evaluation of Mixing-Height Retrievals from Automatic Profiling Lidars and Ceilome-ters in View of Future Integrated Networks in Europe, Bound.-Lay. Meteorol., 143, 49, 49–75, https://doi.org/10.1007/s10546-011-9643-z, 2012.
Haeffelin, M., Laffineur, Q., Bravo-Aranda, J.-A., Drouin, M.-A.,Casquero-Vera, J.-A., Dupont, J.-C., and De Backer, H.: Radia-tion fog formation alerts using attenuated backscatter power fromautomatic lidars and ceilometers, Atmos. Meas. Tech., 9, 5347–5365, https://doi.org/10.5194/amt-9-5347-2016, 2016.
Heese, B., Flentje, H., Althausen, D., Ansmann, A., and Frey,S.: Ceilometer lidar comparison: backscatter coefficient retrievaland signal-to-noise ratio determination, Atmos. Meas. Tech., 3,1763–1770, https://doi.org/10.5194/amt-3-1763-2010, 2010.
Holben, B. N., Eck, T. F., Slutsker, I., Tanre, D., Buis, J. P., Set-zer, A., Vermote, E., Reagan, J. A., Kaufman, Y. J., Nakajima,T., Lavenu, F., Jankowiak, I., and Smirnov, A.: AERONET – Afederated instrument network and data archive for aerosol char-acterization, Remote Sens. Env., 66, 1–16, 1998.
IPCC, 2014: Climate Change 2014: Synthesis Report, Contributionof Working Groups I, II and III to the Fifth Assessment Report ofthe Intergovernmental Panel on Climate Change, edited by: CoreWriting Team, Pachauri, R. K., and Meyer, L. A., IPCC, Geneva,Switzerland, 151 pp. 2014.
Klett, J. D.: Stable analytic inversion solution for processing lidarreturns, Appl. Optics, 20, 211–220, 1981.
Klett, J. D.: Lidar inversion with variable backscatter/extinction ra-tios, Appl. Optics, 24, 1638–1643, 1985.
Knippertz, P.: Tropical-extratropical interactions caus-ing precipitation in Northwest Africa: Statisti-cal analysis and seasonal variations, Mon. WeatherRev., 131, 3069–3076, https://doi.org/10.1175/1520-0493(2003)131<3069:TICPIN>2.0.CO;2, 2003.
Lensky, I. M. and Rosenfeld, D.: Clouds-Aerosols-PrecipitationSatellite Analysis Tool (CAPSAT), Atmos. Chem. Phys., 8,6739–6753, https://doi.org/10.5194/acp-8-6739-2008, 2008.
Mattis, I., D’Amico, G., Baars, H., Amodeo, A., Madonna, F., andIarlori, M.: EARLINET Single Calculus Chain – technical – Part2: Calculation of optical products, Atmos. Meas. Tech., 9, 3009–3029, https://doi.org/10.5194/amt-9-3009-2016, 2016.
McCormick, M. P.: The Flight of the Lidar In-Space TechnologyExperiment (LITE), in: Advances in Atmospheric Remote Sens-ing with Lidaredited by: Ansmann, A., Neuber, R., Rairoux, P.,and Wandinger, U., Springer, Berlin, Heidelberg, 1997.
Münkel, C., Eresmaa, N., Räsänen, J., and Karppinene, A.: Re-trieval of mixing height and dust concentration with lidarceilometer, Bound.-Lay. Meteorol., 124, 117–128, 2007.
Navas-Guzmán, F., Guerrero-Rascado, J. L., and Alados-Arboledas,L.: Retrieval of the lidar overlap function using Raman signals,Óptica Pura y Aplicada, 44, 71–75, 2011.
Navas-Guzmán, F., Müller, D., Bravo-Aranda, J. A., Guerrero-Rascado, J. L., Granados-Muñoz, M. J., Pérez-Ramírez, D.,Olmo, F. J. and Alados-Arboledas, L.: Eruption of theEyjafjallajökull Volcano in spring 2010: MultiwavelengthRaman lidar measurements of sulphate particles in thelower troposphere, J. Geophys. Res.-Atmos., 118, 1804–1813,https://doi.org/10.1002/jgrd.50116, 2013.
Ortiz-Amezcua, P., Guerrero-Rascado, J. L., Granados-Muñoz, M.J., Benavent-Oltra, J. A., Böckmann, C., Samaras, S., Stach-lewska, I. S., Janicka, L., Baars, H., Bohlmann, S., and Alados-Arboledas, L.: Microphysical characterization of long-rangetransported biomass burning particles from North America atthree EARLINET stations, Atmos. Chem. Phys., 17, 5931–5946,https://doi.org/10.5194/acp-17-5931-2017, 2017.
www.atmos-chem-phys.net/17/11861/2017/ Atmos. Chem. Phys., 17, 11861–11876, 2017

11876 A. Cazorla et al.: Near-real-time processing of ceilometer network
Pandolfi, M., Martucci, G., Querol, X., Alastuey, A., Wilsenack,F., Frey, S., O’Dowd, C. D., and Dall’Osto, M.: Continuous at-mospheric boundary layer observations in the coastal urban areaof Barcelona during SAPUSS, Atmos. Chem. Phys., 13, 4983–4996, https://doi.org/10.5194/acp-13-4983-2013, 2013
Pappalardo, G., Amodeo, A., Pandolfi, M., Wandinger, U., Ans-mann, A., Bösenberg, J., Matthias, V., Amiridis, V., De Tomasi,F., Frioud, M., Larlori, M., Komguem, L., Papayannis, A., Roca-denbosch, F., and Wang X.: Aerosol lidar intercomparison in theframework of the EARLINET project, 3. Raman lidar algorithmfor aerosol extinction, backscatter, and lidar ratio, Appl. Optics,43, 5370–5385, https://doi.org/10.1364/AO.43.005370, 2004.
Pappalardo, G., Mona, L., D’Amico, G., Wandinger, U., Adam, M.,Amodeo, A., Ansmann, A., Apituley, A., Alados Arboledas, L.,Balis, D., Boselli, A., Bravo-Aranda, J. A., Chaikovsky, A., Com-eron, A., Cuesta, J., De Tomasi, F., Freudenthaler, V., Gausa,M., Giannakaki, E., Giehl, H., Giunta, A., Grigorov, I., Groß,S., Haeffelin, M., Hiebsch, A., Iarlori, M., Lange, D., Linné,H., Madonna, F., Mattis, I., Mamouri, R.-E., McAuliffe, M. A.P., Mitev, V., Molero, F., Navas-Guzman, F., Nicolae, D., Pa-payannis, A., Perrone, M. R., Pietras, C., Pietruczuk, A., Pisani,G., Preißler, J., Pujadas, M., Rizi, V., Ruth, A. A., Schmidt, J.,Schnell, F., Seifert, P., Serikov, I., Sicard, M., Simeonov, V.,Spinelli, N., Stebel, K., Tesche, M., Trickl, T., Wang, X., Wag-ner, F., Wiegner, M., and Wilson, K. M.: Four-dimensional dis-tribution of the 2010 Eyjafjallajökull volcanic cloud over Europeobserved by EARLINET, Atmos. Chem. Phys., 13, 4429–4450,https://doi.org/10.5194/acp-13-4429-2013, 2013.
Pappalardo, G., Amodeo, A., Apituley, A., Comeron, A., Freuden-thaler, V., Linné, H., Ansmann, A., Bösenberg, J., D’Amico,G., Mattis, I., Mona, L., Wandinger, U., Amiridis, V., Alados-Arboledas, L., Nicolae, D., and Wiegner, M.: EARLINET: to-wards an advanced sustainable European aerosol lidar network,Atmos. Meas. Tech., 7, 2389–2409, https://doi.org/10.5194/amt-7-2389-2014, 2014.
Preißler, J., Wagner, F., Pereira, S. N., and Guerrero-Rascado, J. L.:Multi-instrumental observation of an exceptionally strong Saha-ran dust outbreak over Portugal, J. Geophys. Res., 116, D24204,https://doi.org/10.1029/2011JD016527, 2011.
Preißler, J., Wagner, F., Guerrero-Rascado, J. L., and Silva, A.M.: Two years of free-tropospheric aerosol layers observed overPortugal by lidar, J. Geophys. Res.-Atmos., 118, 3676–3686,https://doi.org/10.1002/jgrd.50350, 2013.
Rodríguez, S., Querol, X., Alastuey, A. Viana, M. M., andMantilla, E.: Events Affecting Levels and Seasonal Evolu-tion of Airborne Particulate Matter Concentrations in theWestern Mediterranean, Environ. Sci. Technol., 37, 216–222,https://doi.org/10.1021/es020106p, 2003.
Sicard, M., Guerrero-Rascado, J. L., Navas-Guzmán, F., Preißler,J., Molero, F., Tomás, S., Bravo-Aranda, J. A., Comerón,A., Rocadenbosch, F., Wagner, F., Pujadas, M., and Alados-Arboledas, L.: Monitoring of the Eyjafjallajökull volcanicaerosol plume over the Iberian Peninsula by means of fourEARLINET lidar stations, Atmos. Chem. Phys., 12, 3115–3130,https://doi.org/10.5194/acp-12-3115-2012, 2012.
Sorribas, M., Adame, J. A., Andrews, E., and Yela, Y.: Ananomalous African dust event and its impact on aerosolradiative forcing on the Southwest Atlantic coast of Eu-rope in February 2016, Sci. Total Environ., 583, 269–279,https://doi.org/10.1016/j.scitotenv.2017.01.064, 2017.
Stein, A. F., Draxler, R. R., Rolph, G. D., Stunder, B. J. B., Co-hen, M. D., and Ngan, F.: NOAA’s HYSPLIT AtmosphericTransport and Dispersion Modeling System, Bull. Am. Me-teor. Soc., 96, 2059–2077, https://doi.org/10.1175/BAMS-D-14-00110.1, 2015.
Titos, G., Ealo, M., Pandolfi, M., Pérez, N., Sola, Y., Sicard,M., Comerón, A., Querol, X., and Alastuey, A.: Spa-tiotemporal evolution of a severe winter dust event inthe western Mediterranean: Aerosol optical and physi-cal properties, J. Geophys. Res.-Atmos., 122, 4052–4069,https://doi.org/10.1002/2016JD026252, 2017.
Valenzuela, A., Olmo, F.J., Lyamani, H., Antón, M., Quirantes,A., and Alados-Arboledas, L.: Classification of aerosol radiativeproperties during African desert dust intrusions over southeast-ern Spain by sector origins and cluster analysis, J. Geophys. Res.,117, D06214, https://doi.org/10.1029/2011JD016885, 2012.
Valenzuela, A., Costa, M. J., Guerrero-Rascado, J. L., Bortoli, D.,and Olmo, F. J.: Solar and thermal radiative effects during the2011 extreme desert dust episode over Portugal, Atmos. Envi-ron., 148, 16–29, 2017.
Wandinger, U., Müller, D., Böckmann, C., Althausen, D., Matthias,V., Bösenberg, J., Weiß, V., Fiebig, M., Wendisch, M., Stohl, A.,and Ansmann, A.: Optical and microphysical characterizationof biomass-burning and industrial-pollution aerosols from mul-tiwavelength lidar and aircraft measurements, J. Geophys. Res.,107, 1–20, https://doi.org/10.1029/2000JD000202,2002
Welton, E. J., Campbell, J. R., Spinhirne, J. D., and Scott, V. S.:Global monitoring of clouds and aerosols using a network ofmicro-pulse lidar systems, in: Lidar Remote Sensing for Industryand Environmental Monitoring, edited by: Singh, U. N., Itabe, T.,and Sugimoto, N., Proc. SPIE, 4153, 151–158, 2001.
Wiegner, M. and Geiß, A.: Aerosol profiling with the Jenop-tik ceilometer CHM15kx, Atmos. Meas. Tech., 5, 1953–1964,https://doi.org/10.5194/amt-5-1953-2012, 2012.
Wiegner, M., Emeis, S., Freudenthaler, V., Heese, B., Junkermann,W., Munkel, C., Schafer, K., Seefeldner, M., and Vogt, S.: Mix-ing layer height over Munich, Germany: Variability and compar-isons of different methodologies, J. Geophys. Res., 111, D13201,https://doi.org/10.1029/2005JD006593, 2006.
Wiegner, M., Madonna, F., Binietoglou, I., Forkel, R., Gasteiger, J.,Geiß, A., Pappalardo, G., Schäfer, K., and Thomas, W.: Whatis the benefit of ceilometers for aerosol remote sensing? Ananswer from EARLINET, Atmos. Meas. Tech., 7, 1979–1997,https://doi.org/10.5194/amt-7-1979-2014, 2014.
Winker, D. M., Pelon, J. R., and McCormick, M. P.: CALIPSO mis-sion: spaceborne lidar for observation of aerosols and clouds,Proc. SPIE 4893, Lidar Remote Sensing for Industry andEnvironment Monitoring III, (21 March 2003), 4893, 1–11,https://doi.org/10.1117/12.466539, 2003.
Atmos. Chem. Phys., 17, 11861–11876, 2017 www.atmos-chem-phys.net/17/11861/2017/