nazemoon reddy, j. global trends pharm sci, 2021; 12 (3
TRANSCRIPT

Nazemoon Reddy, J. Global Trends Pharm Sci, 2021; 12 (3): 9607 - 9617
9607 © Journal of Global Trends in Pharmaceutical Sciences
PREPARATION OF LERCANIDIPINE SOLID DISPERSIONS BY VARIOUS
POLYMERS, IN VITRO AND IN VIVO COMPARATIVE PHARMACOKINETICS
STUDY IN RABBITS
Nazemoon Reddy1*, Swarnalatha Dugasani2, Devanna Nayakanti3
1*Research scholar, Research and Development, Jawaharlal Nehru Technological University Anantapur, Andhra Pradesh, India.
2 Department of Pharmacognosy, Annamacharya College of Pharmacy, Rajampet, Kadapa, Andhra Pradesh. India.
3Director, Jawaharlal Nehru Technological University-oil Technological and Pharmaceutical Research Institute, Anantapuram Andhra Pradesh, India.
*Corresponding author: E-mail: [email protected]
ARTICLE INFO ABSTRACT
Key words: Lercanidipine,
polymer blend, solid dispersions, solubility
This research aimed to prepare Lercanidipine solid dispersions with polymer blend
equal portion of poly vinyl pyrrolidine (PVP) K-30, poloxamer-188, and hydroxy
propyl methyl cellulose (HPMC) K4M. Various ratios of Lercanidipine Polymer
blend in the ratios (1:3 and 1:7) were fabricated as solid dispersions by melting and
solvent evaporation methods, later compressed into tablets. The solid dispersions
were tested for physicochemical, and release constraints impressed with the
increase in the solubility. Among them formulation with a 1:7 ratio found to be the
best proportion for enhancing the solubility and release rate of Lercanidipine from
the solid dispersions. LSD-4 was selected for the In vivo study Cmax was increased
by 3.37 times, T max values of the formulations LSD-4 was equivalent, the AUC
(0-8h) was ~4 folds more and the AUC (0-∞) was marginal increase i.e., 4.12 folds
more than LCD pure drug. These fallouts suggest that the absorption rate and
bioavailability of SD formulation is more when compare to pure
INTRODUCTION
The oral route is preferred, as they are easy
to handle and take by patients of all age
groups. Lercanidipine (LCD) is an
antihypertensive drug (Talluri MK, et al
2012) belongs to BCS-class II drug and low
solubility results in low bioavailability
(~45%) (Yang L, et al 2014) Among the
various techniques of solubility enhancing,
solid dispersion (SD) technique (LeunerC, et
al 2000). stands on the top priority as it is a
simple, easy and efficient approach.
Water-soluble polymers viz., Poly Vinyl
Pyrrolidone (PVP) K-30 (BhiseS, et al.,
2011) Poloxamer-188 and Hydroxy Propyl
Methyl Cellulose (HPMC) K4M (Zhong L,
et al 2013) were employed with a promising
role in increasing the solubility of drugs. In
the present examination, the SD were
prepared by melting and solvent evaporation
techniques. The pharmacokinetic
parameters of the prepared systems were
ISSN- 2230-7346
Journal of Global Trends in Pharmaceutical Sciences
Access this article online Website:
https://www.jgtps.com/ Quick Response Code:
Nazemoon Reddy, J. Global Trends Pharm Sci, 2021; 12 (3): 9607 - 9617
9608 © Journal of Global Trends in Pharmaceutical Sciences
calculated after oral administration to rabbits
as model animal
MATERIALS AND METHODS
Materials: Lercanidipine was gifted by
Cipla Ltd, Bengaluru. PVP K30, Poloxamer-
188, HPMC K4M, Microcrystalline
Cellulose, Talc, and Magnesium stearate
were procured from SD Fine chemicals
India. Double distilled water was used
whenever appropriate.
Methods
Preparation of solid dispersions
Melting: The polymers were melted based
on their decreasing melting points (HPMC-
K4M, PVP K-30 then Poloxamer-188) in a
china dish, then LCD was dispersed in the
molten mass with continual thrilling. The
mixture was permitted to solidify at room
temperature. The product was stored in a
desiccator (ABG Initiatives, Hyderabad,
Telangana) for 24 h and then crushed in a
mortar (Aruna Scientific, Hyderabad,
Telangana). Later the powder was allowed
through # 60 sieve (ASTM E 11, Hyderabad,
Telangana) to get uniform particle size
(Mahmah O, et al., 2013).
Preparation of solid dispersion tablets:
The SD equivalent to 40 mg of LCD was
made by direct compression into tablet form,
after blending (Liberman HA,1980) with
constituents as described in table 2 by using
8 station tablet compression machines
(Karnavati, India).
Evaluation:
Melting point: The purity of LCD pure
sample was confirmed by measuring melting
point. The temperature at which LCD melts
was recorded using melting point apparatus
(kaur M, et al.,2014). (MT934).
Solubility studies: Lercanidipine (LCD)
pure drug was tested for solubility in 0.1N
HCl, water, pH 4.5 Acetate buffer, pH 6.8
and pH 7.4 Phosphate buffers (Fraczek J, et
al.,2007)
Drug-excipients compatibility studies: The
DSC and FTIR studies were performed to
find the interaction among the LCD and
carriers used in the study.
Differential Scanning Calorimetry (DSC):
Pure LCD and 1:1 ratio of LCD: Polymer
mix were exposed to the analysis. About 10
mg sample was taken in a DSC crucible and
scanned at 50-300°C (DSC-50, Shimadzu,
Japan).
Fourier-transform infrared (FTIR)
spectroscopic study: The interactions
between components of the SD were
investigated using FTIR spectroscopy. The
FTIR spectra of the LCD alone and in
combination with carriers were documented
by the FTIR spectrometer (Bruker) by
scanning at 4000-400 cm−1 range.
Scanning Electron Microscopy: The
surface topography of SD was confirmed by
scanning the surface of SD by scanning
electron microscopy [25] (Perkin Elmer,
USA). An accelerating voltage of 20KV was
used and the images obtained at the
magnification of x500.
Evaluation Lercanidipine Solid
Dispersions
The subsequent results were examined for
LCD-SD.
Flow properties
The LCD-SD were evaluated for flow
constraints (Wong AC. Teal.,2000).
(Bergstrom CA et al., 2003). viz., angle of
Ingredients Quantity per tablet
Solid dispersions
equivalent to 40 mg of
Lercanidipine 150
Lactose 75
Starch 15
Micro Crystalline
Cellulose
50
Magnesium stearate 5
Talc 5
Weight of the tablets 300
Nazemoon Reddy, J. Global Trends Pharm Sci, 2021; 12 (3): 9607 - 9617
9609 © Journal of Global Trends in Pharmaceutical Sciences
repose, true and tapped densities, Carr’s
Index, Hausner’s ratio.
Yield: The % recovery (Juppo AM, et al.,
2003). Comprises the weight of dried SD to
the total weight of LCD and polymers used
in making the SD.
Actual weight of the SD
% Yield = Actual weight of the SD/ Total
weight of drug and excipients × 100
Evaluation Lercanidipine Solid
Dispersion tablets
The LCD-SD tablets were exposed to the
following assessments.
Uniformity in size and shape: The tablets
were examined under a dissection
microscope (DM-100) for their morphology.
Thickness: The LCD-SD tablets were
firmed between the jaws of Vernier Calipers
(Qumos Enterprises, India) and thickness is
examined in triplicate. (Patel S, et al.,2016).
Uniformity in weight: Every batch of LCD-
SD tablets (20 quantity) was individually
weighed with an electronic digital balance
(Citizen, CY-104, Mumbai, India) and mean
measured and related to the individual tablet
weights. The deviation in weights was
premeditated and then crisscross with IP
specifications (Limit ± 7.5% of mean
weight) (Cruz J et al.,2011).
Hardness
LCD-SD tablets were pressed with the
spindle of Monsanto tablet hardness tester
(Vinsyst Technologies, Mumbai). The force
needs to break the tablets were recorded in
triplicates (Patel S, et al.,2016).
Friability
Surface erosion may happen while tablet
handling can be elucidated by Roche
Friabilator. Pre-weighed (10 tablets) (W
initial) and placed and rotated for 4 min at
25 rpm and the final weight of tablets (W
final) was dogged. The loss on friability was
calculated by the following equation Bushra
R et al,.2008).
Calibration curve
100mg of LCD dissolves in pH 1.2 of 0.1 M
HCl. A series of dilutions (2, 4, 6, 8 and
10µg/ml) were prepared scanned
spectrophotometrically at 291nm then the
measured the absorbance vs. concentrations
which gives a calibration curve (Pandey A,
et al., 2011).
Uniformity of drug content: 5 tablets of
each batch weighed and powdered. 40mg of
LCD dissolved in 100ml of 0.1 N HCl (pH
1.2). From this 0.5ml was diluted to 5ml
with pH 1.2 of 0.1 N HCl. The absorbance
was estimated at 291nm using a double
beam UV-Visible spectrophotometer (Lab
India, Mumbai). The content uniformity was
calculated from Lercanidipine standard
calibration graph (Chaudhari P et al., 2013).
In-vitro drug release studies: The
dissolution specifications were as below
Patei B et al., 2012).
• Apparatus used: USP-II dissolution
test apparatus
• Dissolution medium: 0.1M HCl
• volume of dissolution medium:
900ml
• Temperature: 37±0.5°C
• Speed of basket paddle: 50rpm
• Sampling intervals: 5 min
• Sample withdraws: 10ml
• Absorbance measured: 291nm
In vivo studies
All the experimental procedures used in the
present study were conducted according the
protocol for utilization of experimental
animals set has been approved by the
IAEC/ANCP/2018-19 and CPCSEA.
Healthy rabbits of either sex (weighing 1.5 –
2.5 kg) fasted overnight. LCD and its SDs
were administered at a dose equivalent to
1.4mg/kg of LCD. Each product was
repeated 6 times (n = 6). The in vivo
experiments were conducted as a crossover
study.

Nazemoon Reddy, J. Global Trends Pharm Sci, 2021; 12 (3): 9607 - 9617
9610 © Journal of Global Trends in Pharmaceutical Sciences
Estimation of Lercanidipine in serum
samples: LCD in serum samples were
estimated according to High Performance
Liquid Chromatographic (HPLC) method.
Preparation of standard solution and
plotting calibration curves
The Stock solutions of LCD and Nifedipine
were prepared in acetonitrile at a free base
strength of 1000 µg/ml. Secondary and
working standard solutions were made with
water: acetonitrile (50:50 v/v). Blank rabbit
plasma was screened before spiking to
ensure it was free of endogenous
interference at retention times of LCD and
the internal standard Nifedipine. The
calibration curve ranged from 5.0-250.0
ng/ml. Quality control samples were
prepared at 20, 100 and 200 ng/mL for LCD.
The samples were vortexed and stored at –
70±2oC until processing.
Sample preparation
A 0.5 ml aliquot of animal plasma sample
was mixed with 0.1 ml of internal standard
working solution (2000.0 ng mL-1 of
Nifedipine) and 500 µL of 10 % Perchloric
acid (precipitating agent). Later vortexed for
5 min and centrifuged at 4000 rpm for 10
min. Supernatants from the above solutions
were separated and used for the analysis.
20μL of the eluent was injected into the
HPLC system.
Preparation of spiked plasma sample
250µl of rabbit plasma, 50µl of internal
standard, a 10µl of LCD was pipette into
10ml centrifuge tube and to this 2ml of
Acetonitrile was added. 10μl of the
supernatant layer was collected (after
centrifugation at 3200 rpm for 10min) and
injected into HPLC. A typical chromatogram
is achieved from a sample solution.
RESULTS AND DISCUSSION
Melting point: The melting point of pure
LCD was observed as 197.1 ±0.50C,
indicates the purity of the LCD sample. The
LCD shown good solubility in 0.1N HCl
(0.325±0.001µg/ml) compared in contrast to
Water, Acetate buffer (pH4.5), Phosphate
buffer (pH6.8) and Phosphate buffer
(pH7.4).
Drug-excipients compatibility studies: The
DSC thermograms of LCD with polymer
mix were lifted to lesser temperature
representing good impregnation of LCD
with polymers used (figure 1). The FTIR
study discovered that the typical peaks and
stretches of LCD pure drug were also found
in LCD – polymer blend, indicates no
negative incompatibility of LCD with
carriers used. The FTIR spectra of LCD pure
and polymers were shown in figure 2 and
Figure 1: DSC thermograms of LCD A)
Pure drug B) with PVP K C) with
Poloxamer 188 D) with HPMC K4M
Figure2: FTIR spectrum of Lercanidipine
pure drug
Figure 3. FTIR spectrum of Lercanidipine
with a polymer blend

Nazemoon Reddy, J. Global Trends Pharm Sci, 2021; 12 (3): 9607 - 9617
9611 © Journal of Global Trends in Pharmaceutical Sciences
Table 4: Physical Characteristics (Optimized formulation with Lercanidipine)
Values in mean ±SD; trials made (n=3)
Figure 4. Solubility of optimized formulations of
Table 5: Solubility studies of LCD optimized formulation
Values in mean ±SD; trials made (n=3)
Formulation
Flow properties
Angle of
repose (0)
Bulk Density Tapped Density Carr’s
Index
Hausner Ratio
LSD-1 25.45±0.45 0.549 0.563 2.4866 1.0255
LSD-2 26.08±0.14 0.598 0.632 5.3797 1.0568
LSD-3 26.95±0.25 0.562 0.599 6.1769 1.0658
LSD-4 25.51±0.84 0.528 0.549 3.8251 1.0397
Physical parameter
Formulation Uniformity of weight
(mg)
Hardness
(cm2)
Thickness
(mm)
Friability
(%)
Yield
(%)
Assay
(%)
LSD-1 302.5±3.25 6.3±0.02 4.50±0.04 0.18±0.01 94.65±1.59 98.06±1.65
LSD-2 300.2±1.23 6.2±0.04 4.51±0.03 0.44±0.02 95.79±1.62 97.69±1.12
LSD-3 301.8±1.45 5.8±0.11 4.52±0.06 0.65±0.03 96.65±1.53 95.46±1.06
LSD-4 301.1±2.16 7.4±0.15 4.50±0.02 0.49±0.02 97.15±1.16 98.51±1.71
Solvent
Solubility in different media (µg/mL)
Solid dispersion
LCD LSD-1 LSD-2 LSD-3 LSD-4
Water 0.195±0.002 0.295±0.01 0.426±0.01 0.728±0.01 0.925±0.01
0.1N HCl 0.311±0.001 0.957±0.03 2.195±0.03 2.610±0.05 3.459±0.02
AB (pH 4.5) 0.212±0.002 0.469±0.01 0.821±0.01 1.259±0.01 1.848±0.04
PBS (pH 6.8) 0.167±0.006 0.702±0.03 0.984±0.03 1.298±0.03 1.615±0.03
PBS (pH 7.5) 0.182±0.001 0.606±0.04 0.907±0.01 1.349±0.01 1.745±0.01
Nazemoon Reddy, J. Global Trends Pharm Sci, 2021; 12 (3): 9607 - 9617
9612 © Journal of Global Trends in Pharmaceutical Sciences
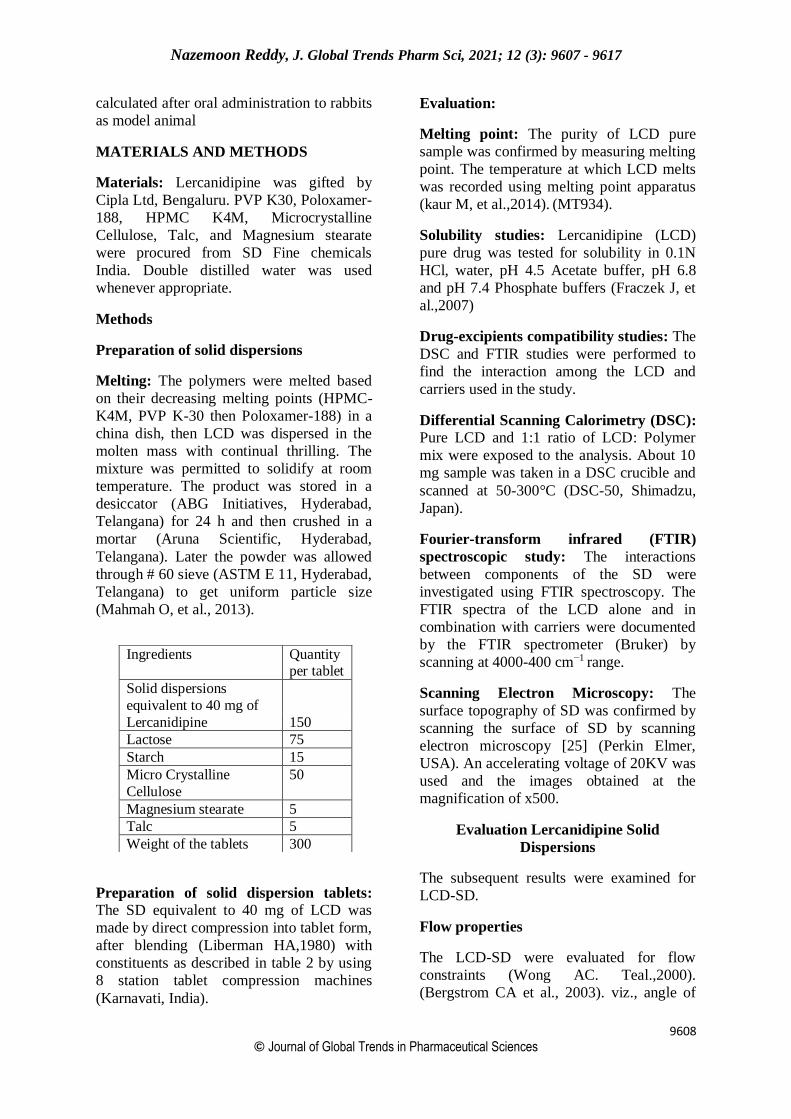
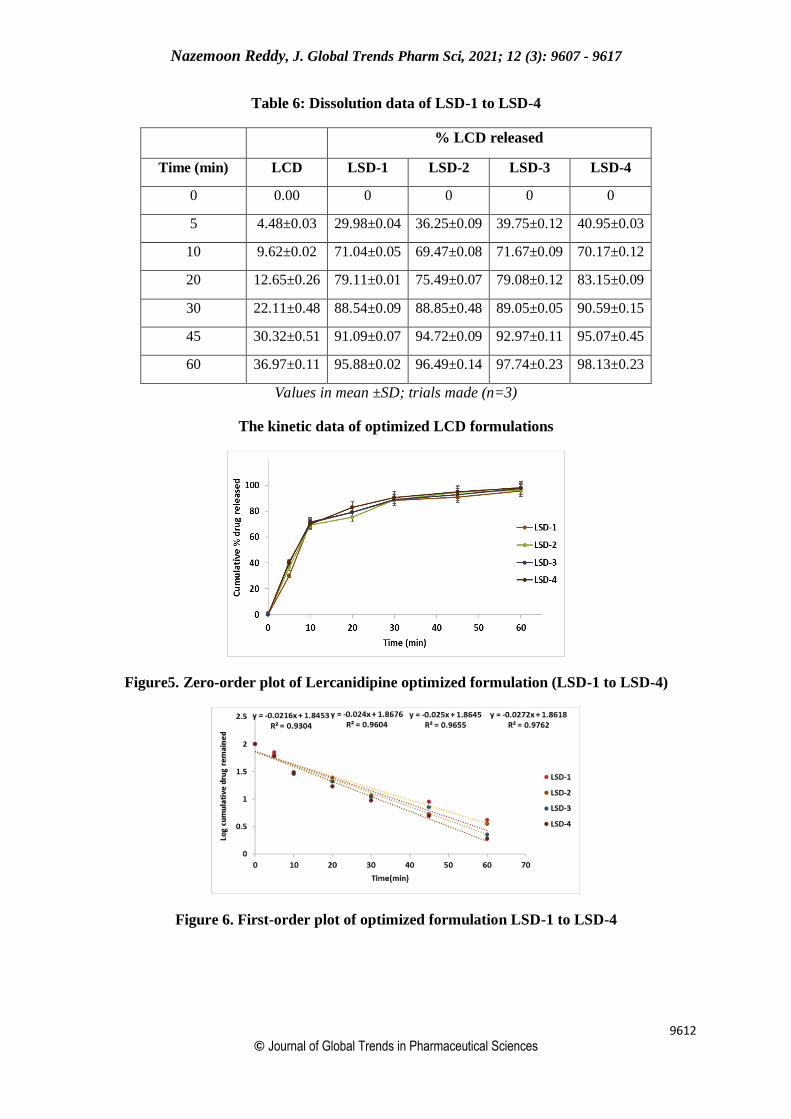
Table 6: Dissolution data of LSD-1 to LSD-4
% LCD released
Time (min) LCD LSD-1 LSD-2 LSD-3 LSD-4
0 0.00 0 0 0 0
5 4.48±0.03 29.98±0.04 36.25±0.09 39.75±0.12 40.95±0.03
10 9.62±0.02 71.04±0.05 69.47±0.08 71.67±0.09 70.17±0.12
20 12.65±0.26 79.11±0.01 75.49±0.07 79.08±0.12 83.15±0.09
30 22.11±0.48 88.54±0.09 88.85±0.48 89.05±0.05 90.59±0.15
45 30.32±0.51 91.09±0.07 94.72±0.09 92.97±0.11 95.07±0.45
60 36.97±0.11 95.88±0.02 96.49±0.14 97.74±0.23 98.13±0.23
Values in mean ±SD; trials made (n=3)
The kinetic data of optimized LCD formulations
Figure5. Zero-order plot of Lercanidipine optimized formulation (LSD-1 to LSD-4)
Figure 6. First-order plot of optimized formulation LSD-1 to LSD-4
Nazemoon Reddy, J. Global Trends Pharm Sci, 2021; 12 (3): 9607 - 9617
9613 © Journal of Global Trends in Pharmaceutical Sciences
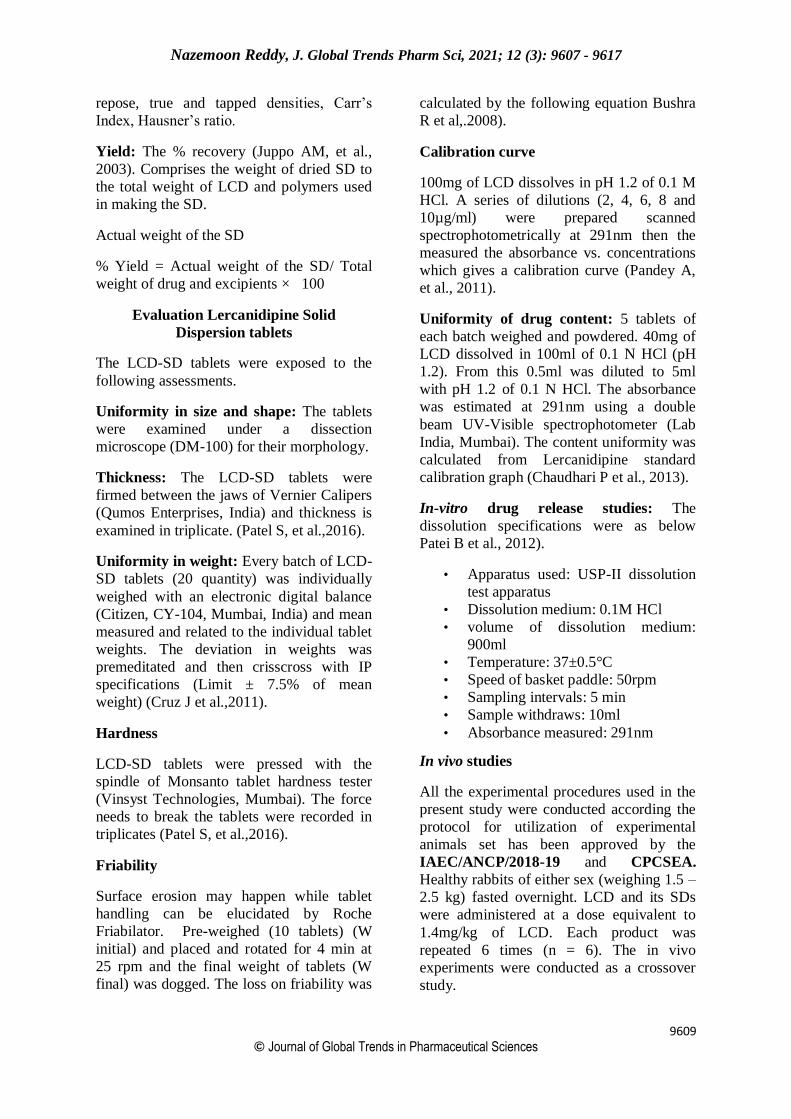
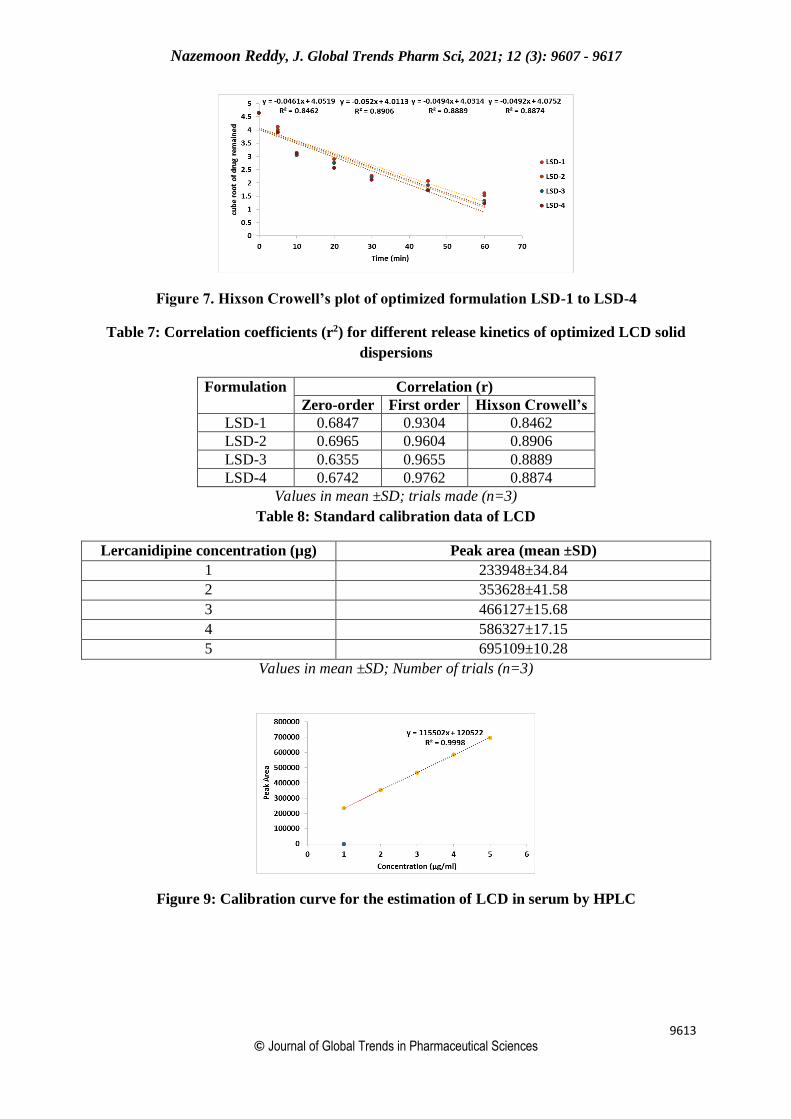
Figure 7. Hixson Crowell’s plot of optimized formulation LSD-1 to LSD-4
Table 7: Correlation coefficients (r2) for different release kinetics of optimized LCD solid
dispersions
Formulation Correlation (r)
Zero-order First order Hixson Crowell’s
LSD-1 0.6847 0.9304 0.8462
LSD-2 0.6965 0.9604 0.8906
LSD-3 0.6355 0.9655 0.8889
LSD-4 0.6742 0.9762 0.8874
Values in mean ±SD; trials made (n=3)
Table 8: Standard calibration data of LCD
Lercanidipine concentration (µg) Peak area (mean ±SD)
1 233948±34.84
2 353628±41.58
3 466127±15.68
4 586327±17.15
5 695109±10.28
Values in mean ±SD; Number of trials (n=3)
Figure 9: Calibration curve for the estimation of LCD in serum by HPLC

Nazemoon Reddy, J. Global Trends Pharm Sci, 2021; 12 (3): 9607 - 9617
9614 © Journal of Global Trends in Pharmaceutical Sciences
Figure 8: SEM Images of LSD
Figure 10: HPLC chromatogram of the serum sample (TSD-4) showing retention time of
(4.894 min). Estimation of drugs by RP-HPLC
Table 9: Concentration of LCD in Serum with pure LCD and SDs (LSD-4) by p.o
Time (h)
Concentration of LCD in Serum
Pure drug SDs (LSD-4)
0 0.00 0.00
0.5 0.29±0.01 1.56±0.01
1.0 0.52±0.01 2.95±0.01
2.0 1.06±0.04 4.87±0.08
4.0 0.62±0.03 2.28±0.07
6.0 0.29±0.01 0.88±0.02
8.0 0.11±0.01 0.32±0.01
Values in mean ±SD; trials made (n=3)
0 2 4 6 8 100
2
4
6LCD
Solid dispersion (LSD-4)
Time (h)
Ser
um
LC
D c
on
cen
trat
ion
(µ
g/m
l)
Figure 11: Serum concentration of LCD and its SDs (LSD-4) in Rabbits (p.o)
Nazemoon Reddy, J. Global Trends Pharm Sci, 2021; 12 (3): 9607 - 9617
9615 © Journal of Global Trends in Pharmaceutical Sciences
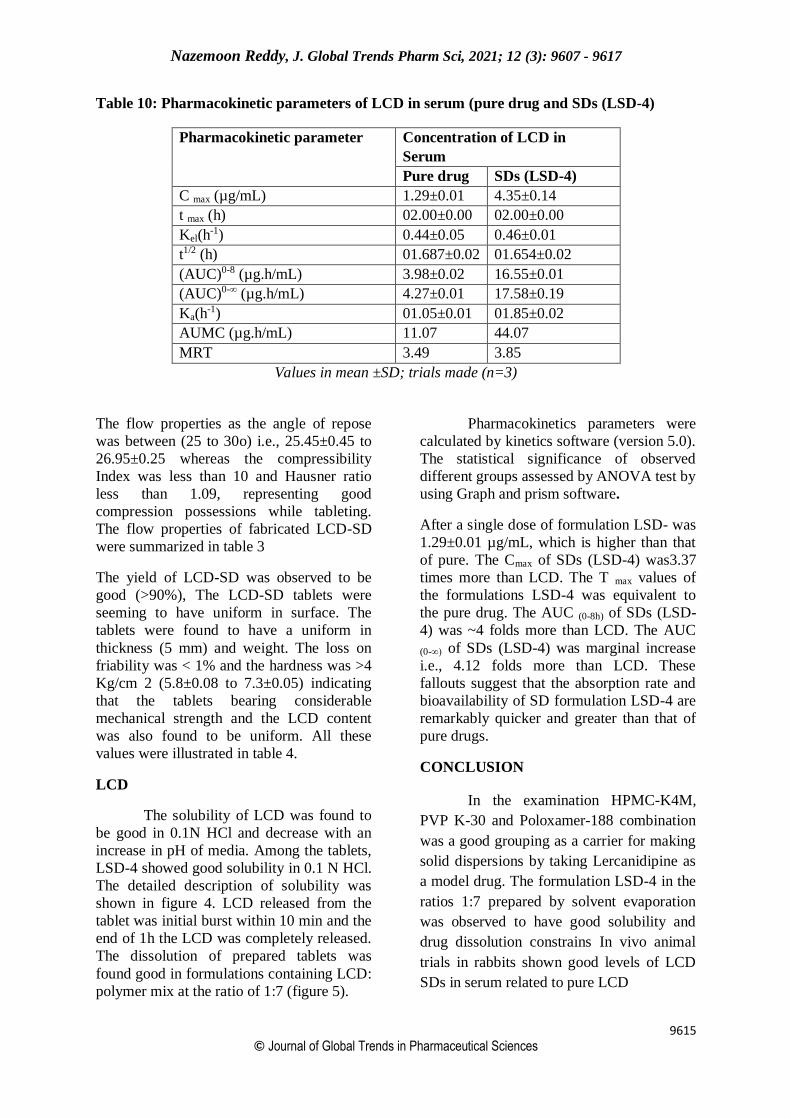
Table 10: Pharmacokinetic parameters of LCD in serum (pure drug and SDs (LSD-4)
Pharmacokinetic parameter Concentration of LCD in
Serum
Pure drug SDs (LSD-4)
C max (µg/mL) 1.29±0.01 4.35±0.14
t max (h) 02.00±0.00 02.00±0.00
Kel(h-1) 0.44±0.05 0.46±0.01
t1/2 (h) 01.687±0.02 01.654±0.02
(AUC)0-8 (µg.h/mL) 3.98±0.02 16.55±0.01
(AUC)0-∞ (µg.h/mL) 4.27±0.01 17.58±0.19
Ka(h-1) 01.05±0.01 01.85±0.02
AUMC (µg.h/mL) 11.07 44.07
MRT 3.49 3.85
Values in mean ±SD; trials made (n=3)
The flow properties as the angle of repose
was between (25 to 30o) i.e., 25.45±0.45 to
26.95±0.25 whereas the compressibility
Index was less than 10 and Hausner ratio
less than 1.09, representing good
compression possessions while tableting.
The flow properties of fabricated LCD-SD
were summarized in table 3
The yield of LCD-SD was observed to be
good (>90%), The LCD-SD tablets were
seeming to have uniform in surface. The
tablets were found to have a uniform in
thickness (5 mm) and weight. The loss on
friability was < 1% and the hardness was >4
Kg/cm 2 (5.8±0.08 to 7.3±0.05) indicating
that the tablets bearing considerable
mechanical strength and the LCD content
was also found to be uniform. All these
values were illustrated in table 4.
LCD
The solubility of LCD was found to
be good in 0.1N HCl and decrease with an
increase in pH of media. Among the tablets,
LSD-4 showed good solubility in 0.1 N HCl.
The detailed description of solubility was
shown in figure 4. LCD released from the
tablet was initial burst within 10 min and the
end of 1h the LCD was completely released.
The dissolution of prepared tablets was
found good in formulations containing LCD:
polymer mix at the ratio of 1:7 (figure 5).
Pharmacokinetics parameters were
calculated by kinetics software (version 5.0).
The statistical significance of observed
different groups assessed by ANOVA test by
using Graph and prism software.
After a single dose of formulation LSD- was
1.29±0.01 µg/mL, which is higher than that
of pure. The Cmax of SDs (LSD-4) was3.37
times more than LCD. The T max values of
the formulations LSD-4 was equivalent to
the pure drug. The AUC (0-8h) of SDs (LSD-
4) was ~4 folds more than LCD. The AUC
(0-∞) of SDs (LSD-4) was marginal increase
i.e., 4.12 folds more than LCD. These
fallouts suggest that the absorption rate and
bioavailability of SD formulation LSD-4 are
remarkably quicker and greater than that of
pure drugs.
CONCLUSION
In the examination HPMC-K4M,
PVP K-30 and Poloxamer-188 combination
was a good grouping as a carrier for making
solid dispersions by taking Lercanidipine as
a model drug. The formulation LSD-4 in the
ratios 1:7 prepared by solvent evaporation
was observed to have good solubility and
drug dissolution constrains In vivo animal
trials in rabbits shown good levels of LCD
SDs in serum related to pure LCD

Nazemoon Reddy, J. Global Trends Pharm Sci, 2021; 12 (3): 9607 - 9617
9616 © Journal of Global Trends in Pharmaceutical Sciences
Acknowledgments
Nazemoon Reddy conceived the
presented idea, developed the theory and
performed the computations, we are thankful
to my supervisor Swarnalatha Dugasani and
my co-supervisor Devanna Nayakanti how
verified and corrected my manuscript. All
authors discussed the results and contributed
to final manuscript.
Conflict of interest: No conflict of interest
was declared by the authors.
REFERENCES:
1. Bushra R, Shoaib MH, Aslam N,
Hashmat D, Rehman M.
Formulation development and
optimization of ibuprofen tablets by
direct compression method. Pak.
J. Pharm. Sci. 2008 Apr 1;
21(2):113-20.
2. Bergstrom CA, Norinder U,
Luthman K, Artursson P. Molecular
descriptors influencing melting point
and their role in classification of
solid drugs. Journal of Chemical
Information and Computer Sciences.
2003 Jul 21; 43(4):1177-85.
3. Cruz J, Blanco M. Content
uniformity studies in tablet by NIR-
C Journal of pharmaceutical and
Biomedical analysis. 2011 Sep 10;
56(2):408-12.
4. Dressman J. Improving drug
solubility for oral delivery using
solid dispersions. European journal
of Pharmaceutics and
Biopharmaceutics. 2000 Jul 3; 50(1):
5. Frączek J, Złobecki A, Zemanek J.
Assessment of angle of repose of
granular plant material using
computer image analysis. Journal of
Food Engineering. 2007 Nov 1;
83(1):17-22.
6. Hearnden V, Shankar V, Hull K,
Juras DV, Greenberg M, Kerr AR,
Lockhart PB, Patton LL, Porter S,
Thorn hill MH. New developments
and oppurturtunities in oral mucosal
drug delivery for Local and systemic
disease. Advanced drug delivery
reviews. 2012 Jan 1; 64(10):16-28
7. Juppo AM, Boissier C, Khoo C.
Evaluation of solid dispersion
particles prepared with SEDS.
International Journal of
Pharmaceutics. 2003 Jan 16;
250(2):385-401.
8. Kaur M, Bhatia RK, Pissurlenkar
RR, Coutinho EC, Jain UK, Katare
OP, Chandra R, Madan J.
Lercanidipine complex augments
solubility, dissolution and drug
delivery in prostate cancer cells.
Carbohydrate Polymers. 2014 Jan
30; 101:614-22.
9. Lieberman HA, Lachman L, editors.
Pharmaceutical Dosage Forms:
Tablets: 1980. Marcel Dekker; 1980.
10. Mahmah O, Tabbakh R, Kelly A,
Paradkar A. A comparative study of
the effect of spray drying and
hot‐melt extrusion on the properties
of amorphous solid dispersions
containing felodipine. Journal of
Pharmacy and Pharmacology. 2014
Feb; 66(2):275-84.
11. Park J, Cho W, Cha KH, Ahn J, Han
K, Hwang SJ. Solubilization of the
poorly water soluble drug,
Lercanidipine, using supercritical
anti-solvent (SAS) process.
International Journal of
Pharmaceutics. 2013 Jan 30;
441(12):50-5.
12. Patel S, Sun CC. Macroindentation
hardness measurement—
modernization and applications.
International Journal of
Pharmaceutics. 2016 Jun 15; 506(1-
2):262-7.
13. Pandey A, Sawarkar H, Singh M,
Kashyap P, Ghosh P. UV

Nazemoon Reddy, J. Global Trends Pharm Sci, 2021; 12 (3): 9607 - 9617
9617 © Journal of Global Trends in Pharmaceutical Sciences
spectrophotometric Method for
estimation of Lercanidipine in Bulk
and Tablet Dosage form.
International Journal of Chem Tech
Rting Tablet of Lercanidipine.
Inventi Impact: Pharm Tech. 2013
Jul 15.
14. Patel B, Parikh RH, Swarnkar D.
Enhancement of dissolution of
TLercanidipine through use of solid
dispersion technique-surface solid
dispersion. Journal of Pharmacy &
Bioallied Sciences. 2012 Mar;
4(Suppl 1): S64.
15. Talluri MK, Kalyankar A,
Ragampeta S. Synchronized
separation of atorvastatin—an
antihyperlipidemic drug with
antihypertensive, antidiabetic,
antithrombotic drugs by RP-LC for
determination in combined
formulations. Journal of
Pharmaceutical Analysis. 2012 Aug
1; 2(4):285-92.
16. Won DH, Kim MS, Lee S, Park JS,
Hwang SJ. Improved
physicochemical characteristics of
felodipine solid dispersion particles
by supercritical antisolvent
precipitation process. International
Journal of Pharmaceutics. 2005 Sep
14; 301(1-2):199-208.
17. Wong AC. Characterisation of the
flowability of glass beads by bulk
densities ratio. Chemical
Engineering Science. 2000 Sep 15;
55(18):3855-9.
18. Yang L, Shao Y, Han HK. Improved
pH-dependent drug release and oral
exposure of Lercanidipine, a poorly
soluble drug through the formation
of drug-aminoclay complex.
International Journal of
Pharmaceutics. 2014 Aug 25; 471(1-
2):258-63.
19. Zhong L, Zhu X, Luo X, Su W.
Dissolution properties and physical
characterization of Lercanidipine–
chitosan solid dispersions prepared
by mechanochemical activation.
AAPS Pharm Sci Tech. 2013 Jun 1;
14(2):541-50.