nature template - pc word 97€¦ · web viewlog-linear regression ... we therefore expected that...
TRANSCRIPT

1
Supplementary InformationTable of contents
1. Trial areas.....................................................................................................................2Land area....................................................................................................................2Proactive culling operations.......................................................................................4Consent.......................................................................................................................7Measures of badger activity before the first proactive cull........................................8
2. Cattle TB incidence data...............................................................................................9Surveillance among herds in land neighbouring trial areas......................................11
3. Historical badger culling.............................................................................................154. Historic cattle TB incidence.......................................................................................155. Statistical analysis.......................................................................................................16
Overdispersion..........................................................................................................16Paired t-tests.............................................................................................................17Log-linear regression models, estimated treatment effects and predicted incidence
.........................................................................................................................................18P-values....................................................................................................................19
6. Detailed results for confirmed breakdowns and all breakdowns................................207. The search for systematic variation in the effect associated with proactive culling...318. Robustness of results to different measures of the size of the population at risk.......359. Interpretation of analyses from different time periods...............................................3810. Effects of widespread culling in previous studies......................................................4011. Literature cited............................................................................................................43
2
1. Trial areas
Land area
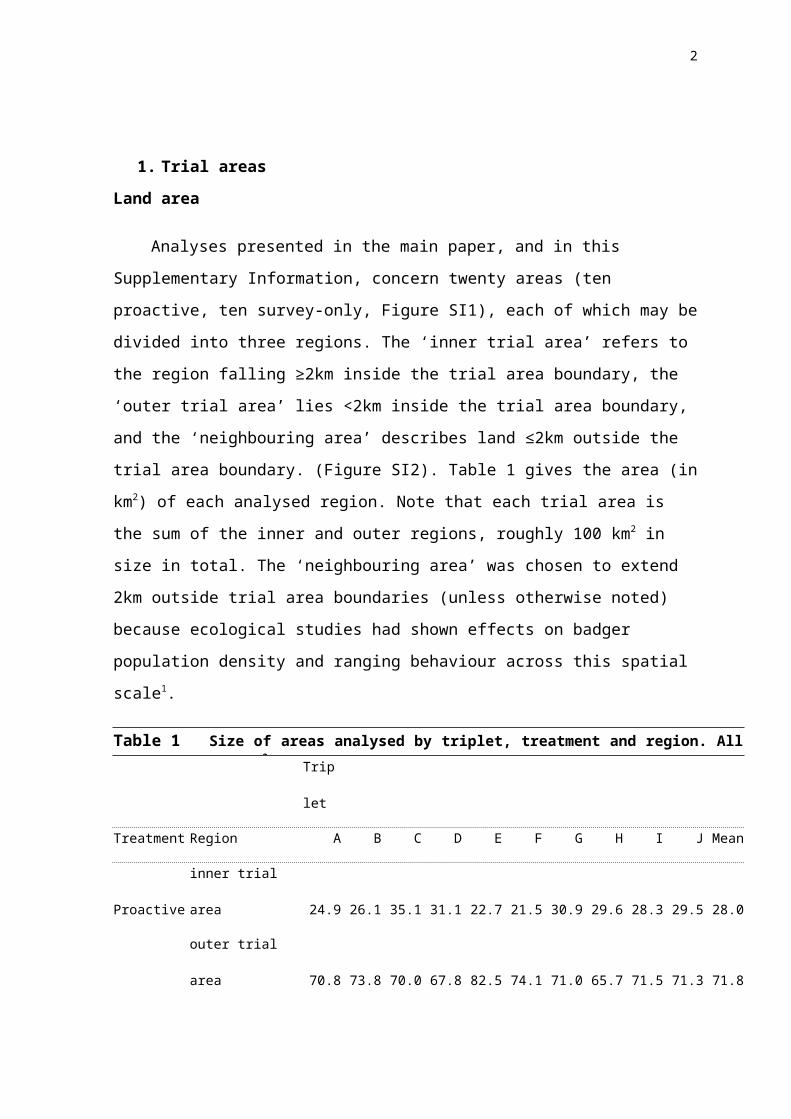
Analyses presented in the main paper, and in this Supplementary Information,
concern twenty areas (ten proactive, ten survey-only, Figure SI1), each of which may be
divided into three regions. The ‘inner trial area’ refers to the region falling ≥2km inside the
trial area boundary, the ‘outer trial area’ lies <2km inside the trial area boundary, and the
‘neighbouring area’ describes land ≤2km outside the trial area boundary. (Figure SI2).
Table 1 gives the area (in km2) of each analysed region. Note that each trial area is the sum
of the inner and outer regions, roughly 100 km2 in size in total. The ‘neighbouring area’
was chosen to extend 2km outside trial area boundaries (unless otherwise noted) because
ecological studies had shown effects on badger population density and ranging behaviour
across this spatial scale1.
Table 1 Size of areas analysed by triplet, treatment and region. All figures are in km2
Triplet
Treatment Region A B C D E F G H I J Mean
Proactive inner trial area 24.9 26.1 35.1 31.1 22.7 21.5 30.9 29.6 28.3 29.5 28.0
outer trial area 70.8 73.8 70.0 67.8 82.5 74.1 71.0 65.7 71.5 71.3 71.8
neighbouring area 103.5 104.0 101.8 98.7 106.1 53.4* 99.8 97.5 102.5 103.3 97.1
Survey-Only inner trial area 27.6 15.9 30.2 32.0 18.4 32.3 28.1 25.8 28.5 33.0 27.2
outer trial area 71.8 80.6 75.4 67.6 83.5 70.0 71.0 75.2 71.8 66.9 73.4
neighbouring area 102.9 75.0 105.6 98.0 105.6 79.8 109.1 104.8 103.6 94.2 97.8
*The proactive trial area in triplet F borders on the sea and hence the neighbouring area is substantially smaller than those of other trial areas.

3
Figure SI1 Map of proactive (shaded), reactive (hatched) and survey-only (open) trial
areas of the RBCT. Grey shading indicates parish testing intervals, which give an
approximate index of local TB incidence; parishes with the lowest incidence are assigned
four yearly testing (white) and parishes with the highest incidence are assigned annual
testing (dark grey). Testing was conducted annually inside all trial areas. Data from
reactive areas were not included in the analyses presented here; however the locations of
these areas are shown because this influenced the inclusion of herds in ‘neighbouring
areas’ (Figure SI2).

4
Figure SI2 Simplified map of proactive and survey-only areas of Triplet A, showing the
size and disposition of the inner and outer trial areas, and neighbouring areas, relative to
the area culled and possible geographical barriers to badger movement.
Proactive culling operations
Table 2 gives the date of each proactive cull to date. Table 3 gives the number of
badgers proactively culled (to September 2005) by triplet and culling year. The numbers of
badgers taken on particular culls will reflect both the numbers of badgers present in the
culling area at the time, and the efficiency of badger capture. At any one time, the size of
the badger population available for capture will be affected by prior culling, immigration
of badgers into the culled area, and survival and reproduction of badgers not captured on
previous culls. Populations are particularly large at the start of the culling year (May-June)
because cubs first emerge from their setts in spring. Capture success is known to vary
seasonally2, and was also influenced by weather conditions and disruption. In seven of the

5
trial areas, the largest numbers of badgers captured was on the initial cull, probably
reflecting the initially large numbers of badgers available for capture. The three trial areas
for which this was not the case (A, D and H) all received their initial culls in mid-winter
when capture success is known to be lowest2; for these areas the largest numbers of
badgers were captured on the first follow-up culls (which took place in early summer when
capture success is usually high2). We therefore expected that the proactive culling
treatment might be more thoroughly applied following the first follow-up cull, rather than
the initial cull. Partly for this reason, we conducted analyses of cattle TB incidence from
the dates of completion of the first follow-up culls, as well as from completion of the initial
culls (see Section 9 below).

6
Table 2 Dates of proactive culling by triplet and cull number. Shaded areas indicate culls that occurred before the 2001 epidemic of foot-and-mouth disease
Cull numberTriplet 1 2 3 4 5 6 7A Jan 2000 May 2002 Nov 2003 May 2004 Oct 2005B Dec 1998 Nov-Dec 1999 Aug 2000 - Jan 2001* Nov-Dec 2002* Jun 2003 Jul-Aug 2004 Oct 2005C Oct 1999 Jan 2001 Aug-Nov 2002* Oct 2003 Jun 2004 Sep 2005D Dec 2002 May 2003 Sep 2004 May 2005E May 2000 Jan 2001 Jun 2002 - Jan 2003* Jun 2003 Jul 2004 Sep 2005F Jul 2000 May 2002 Dec 2003 Sep 2004 Jun 2005G Oct-Nov 2000 Jul 2002 Jul 2003 Jun 2004 Jun 2005H Dec 2000 Jun-Jul 2002 Sep 2003 May 2004 Jul-Aug 2005I Sept-Oct 2002 Sep-Oct 2003 Oct-Nov 2004 Jul 2005J Oct 2002 Jul-Aug 2003 Oct-Nov 2004 May 2005
*Culling was performed in sectors between these times; all other culls were carried out simultaneously across the entire trial area
Table 3 Summary of badgers culled within proactive culling areas to November 2005Culling year* 1998-1999 1999-2000 2000-2001 2002-2003 2003-2004 2004-2005 2005-2006 TotalTripletA 55 149 52 58 48 362B 238 85 74 49 172 111 58 787C 246 111 126 132 187 162 964D 293 369 211 179 1052E 744** 96 258 213 148 1459F 451 248 103 220 155 1177G 427 205 144 103 117 996H 162 231 71 73 53 590I 219 175 93 172 659J 441 187 109 109 846Total 238 386 1969 2057 1663 1378 1201 8892
*Culling years run from 1st May-31st January, with a closed season 1st February-30th April to avoid killing mothers with unweaned cubs. No badgers were culled during May 2001-January 2002 due to the suspension of fieldwork during the 2001 epidemic of foot-and-mouth disease.**Combined total for initial and follow-up cull completed in the same year

7
Consent
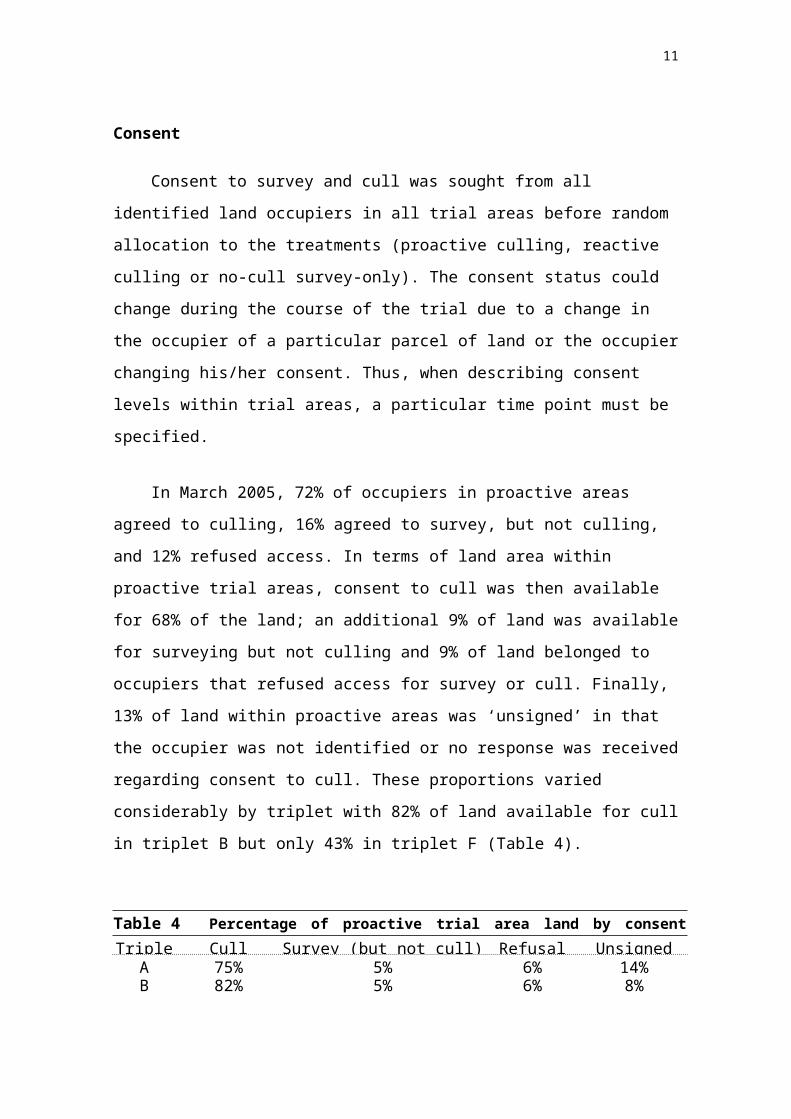
Consent to survey and cull was sought from all identified land occupiers in all
trial areas before random allocation to the treatments (proactive culling, reactive culling
or no-cull survey-only). The consent status could change during the course of the trial
due to a change in the occupier of a particular parcel of land or the occupier changing
his/her consent. Thus, when describing consent levels within trial areas, a particular
time point must be specified.
In March 2005, 72% of occupiers in proactive areas agreed to culling, 16% agreed
to survey, but not culling, and 12% refused access. In terms of land area within
proactive trial areas, consent to cull was then available for 68% of the land; an
additional 9% of land was available for surveying but not culling and 9% of land
belonged to occupiers that refused access for survey or cull. Finally, 13% of land within
proactive areas was ‘unsigned’ in that the occupier was not identified or no response
was received regarding consent to cull. These proportions varied considerably by triplet
with 82% of land available for cull in triplet B but only 43% in triplet F (Table 4).
Table 4 Percentage of proactive trial area land by consent status
Triplet Cull Survey (but not cull) Refusal UnsignedA 75% 5% 6% 14%B 82% 5% 6% 8%C 73% 6% 11% 9%D 75% 4% 5% 16%E 66% 10% 4% 19%F 43% 19% 20% 18%G 67% 9% 6% 19%H 65% 9% 19% 6%I 65% 12% 7% 16%J 80% 9% 6% 5%

8
Measures of badger activity before the first proactive cull
Surveys of badger activity were conducted prior to treatment allocation, on all
land for which consent was granted. To ensure consistency of data collection, surveys
were carried out without reference to survey maps prepared in the course of badger
removal operations that occurred prior to the RBCT. Surveys in Triplets A, B, C, D, E,
and F were carried out by the Defra (Department of Environment, Food and Rural
Affairs) Wildlife Unit; those in Triplets G, H, I and J were wholly or partly performed
by outside contractors due to resource constraints with the Wildlife Units. To ensure
comparability of data, trial areas within a triplet were surveyed simultaneously, by the
same Wildlife Unit or contractor.
Survey teams worked on foot, in one or more pairs. In agricultural land, they
walked all field boundaries, and in woodland they walked regularly spaced transects; in
all cases, surveyors followed any badger paths that they located. The locations of all
signs of badger activity (setts, latrines, and paths) were recorded in the field on 1:10,000
maps and later transferred to a geographical information system (GIS; Arcview,
www.esri.com). Surveyors also assessed the activity of each sett, recording the number
of active and inactive holes, and the presence of fresh digging, bedding, and tracks.
Surveyors used these data to reach a subjective assessment of whether each sett was a
‘main sett’ (the centre of activity for a territorial social group). Field surveys were
subjected to independent audit3.
For each trial area, we calculated indices of badger activity prior to the random
allocation of treatments, based on the numbers of (i) setts; (ii) active setts; (iii) main
setts; (iv) active holes; and (v) latrines recorded. Each of these indices gives a measure
of badger density, albeit a very approximate one4-6. Based on log-linear regressions of
these outcome variables, adjusting for triplet and (log transformed) area available for

9
surveying, there were no significant pre-treatment allocation differences in recorded
survey results between proactive and survey-only areas prior to treatment allocation (p-
values: 0.23, 0.31, 0.10, 0.38 and 0.39, respectively).
2. Cattle TB incidence data
Cattle herds are subject to regulations made under the Animal Health Act7 and
EU legislation which require regular surveillance by TB testing. Cattle TB tests are
arranged by the State Veterinary Service (SVS) and conducted by veterinarians. Great
Britain is divided into counties and parishes. Each parish is assigned a parish testing
interval of between four years and one year, where parishes with the lowest incidence
are assigned four yearly testing and parishes with the highest incidence are assigned
annual testing. Routine whole herd tests are carried out in accordance with the parish
test interval and additional tests can be conducted at any time, for example, in response
to slaughterhouse checks or breakdowns in neighbouring herds. All herds within the
RBCT have been required to have annual whole herd tests for TB throughout the trial.
Cattle are given the single intradermal comparative tuberculin test, which
involves injecting purified protein derivative (PPD) from M. bovis into the skin of the
animal at one site on the neck, and injecting PPD from M. avium at another. Three days
later the test is interpreted based on the size of reaction in the skin. If the reaction to M.
bovis is more than 4mm (under so-called standard interpretation) or more than 2mm
(under severe interpretation) larger than the reaction to M. avium, then the animal is
categorised as a ‘reactor’. The herd is put under movement restrictions, all reactors are
compulsorily slaughtered and subject to post-mortem, and tissue samples cultured for
M. bovis. If either lesions characteristic of TB are identified at post-mortem or the M.
bovis organism is cultured, the breakdown is classified as ‘confirmed’ and the severe
interpretation of the skin test applied to remaining members of the herd. Otherwise

10
breakdowns are classed as ‘unconfirmed’. In addition, the Meat Hygiene Service
inspects all cattle sent for slaughter and any suspected cases of TB are reported to the
SVS. These incidents contribute to the recorded incidence of TB breakdowns. During
the 2001 foot and mouth disease (FMD) epidemic, few routine cattle TB tests were
conducted, delaying the detection of infected herds.
The data from cattle TB tests are managed within the Defra animal health
information system VETNET, operated and maintained by the SVS. The Veterinary
Laboratories Agency receives these cattle data on a 6-weekly basis, which provide
information on TB tests and breakdowns throughout Great Britain.
The observed numbers of breakdowns (confirmed and unconfirmed) are
available in the associated Excel spreadsheet. These are broken down by triplet and
allocated treatment. One set of analyses used point locations of herds, available from
VETNET, to identify herds located inside trial areas and to allocate them to the ‘inner’
and ‘outer’ regions of trial areas (Figure SI2). For a second set of analyses, based on the
RBCT database, the allocation of herds to either the inner or outer trial area was
performed using GIS data which attributed land parcels within trial areas to herds. The
location of each herd was calculated as the point location of the centre of the largest
land parcel, and these point locations were used to allocate herds to regions within trial
area boundaries. The GIS data files used to allocate land parcels to inner and outer
regions were amended to reflect changes in occupancy noted during the course of field
work. As such, if a new occupier took over a land parcel, the link between the land
parcel and the previous occupier (and any associated herds) was removed. Hence, whilst
it is known that the herd associated with the previous occupier was within a trial area,
retrospective allocation of such herds to either inner or outer regions was not possible
on the basis of current data. For this reason there are 43 additional baseline or new herds
identified as being in the whole trial area which could not be allocated to the inner or
11
outer regions. These additional herds were associated with six confirmed breakdowns
and nine unconfirmed breakdowns since the initial culls (six confirmed and seven
unconfirmed since the first follow-up cull).
This paper presents analyses of the cattle TB incidence data up to 4 September
2005. Incidence data from reactive culling areas were excluded from these analyses
because this treatment was discontinued in November 2003 and any effects on cattle TB
incidence could be inconsistent over the period under study. Thus, data from 20 trial
areas (10 proactively culled and 10 survey-only) were analysed in all cases.
Surveillance among herds in land neighbouring trial areas
Herds in the land neighbouring trial areas could only be systematically identified
through VETNET location data, since the RBCT database did not aim to include herds
as far as 2km from the boundaries of trial areas. Although, as previously mentioned, all
herds within RBCT areas are required to have annual whole herd tests for TB
throughout the trial, herds on neighbouring land will be tested according to their parish
testing interval. Because trial areas were specifically chosen to be located in areas of
high TB incidence in cattle, we expected that most herds on land neighbouring trial
areas would also be in high risk areas and thus be on annual testing. However, we
examined data on testing intervals to determine whether, within a triplet, the herds
neighbouring the proactive trial area were on similar testing intervals to the herds
neighbouring the survey-only trial areas.
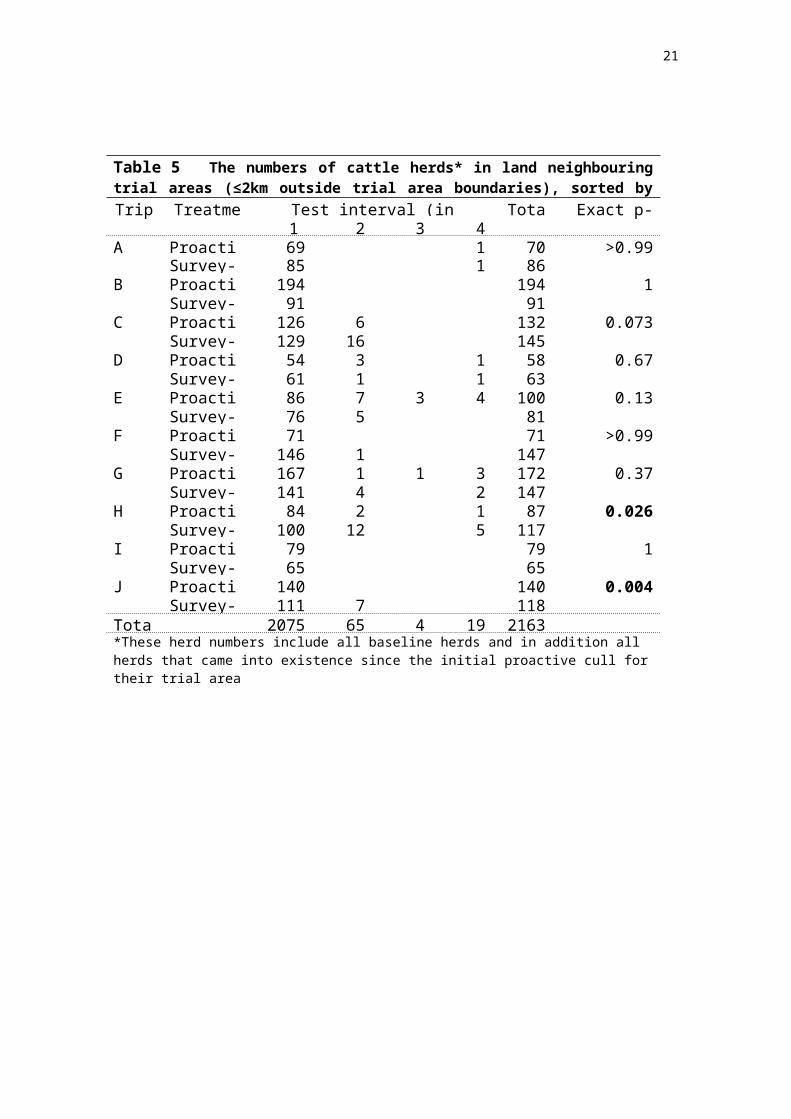
The current test interval data revealed that the large majority (96%, 2075 of 2163)
of herds living on land neighbouring trial areas are tested annually, 3% (65 of 2163) are
tested every two years, 0.2% (4 of 2163) are tested every three years and 0.9% (19 of
2163) are tested every four years. All herds located on land up to 2km outside proactive

12
and survey-only trial areas were included in the analyses regardless of their recorded
testing interval.
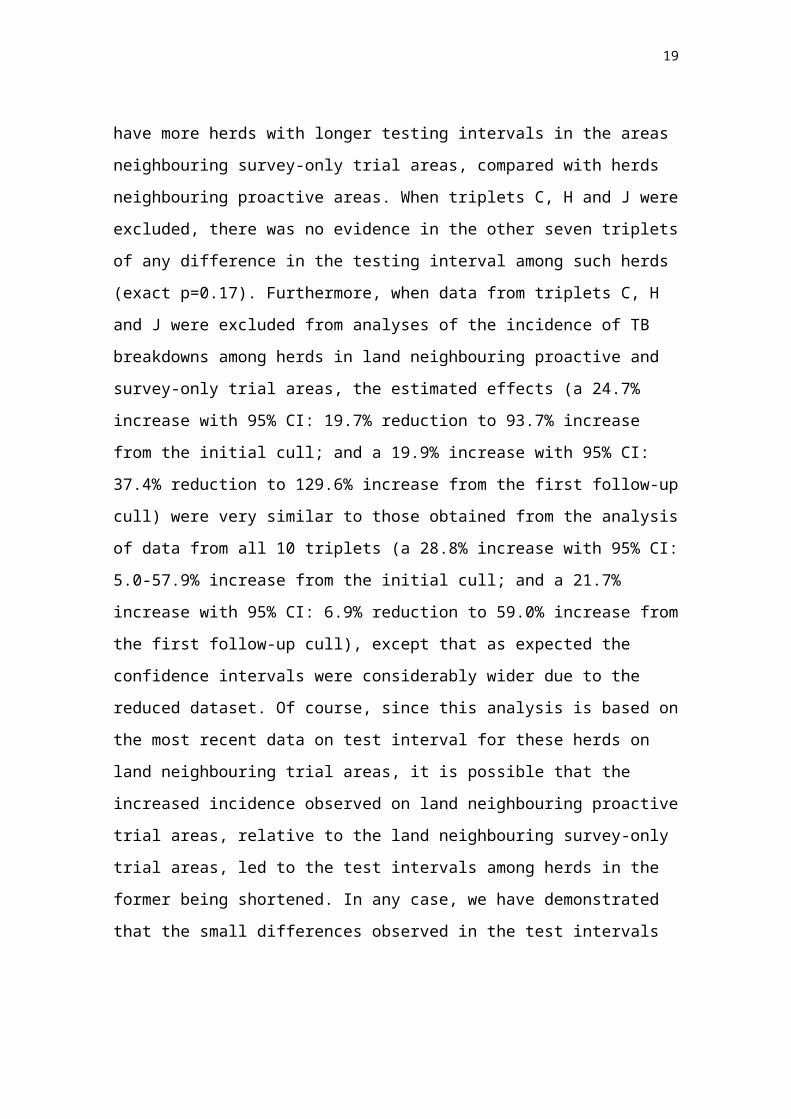
There was a significant tendency overall (exact p<0.001) and in two of the ten
triplets (H and J with a similar non-significant trend in triplet C, see Table 5) to have
more herds with longer testing intervals in the areas neighbouring survey-only trial
areas, compared with herds neighbouring proactive areas. When triplets C, H and J were
excluded, there was no evidence in the other seven triplets of any difference in the
testing interval among such herds (exact p=0.17). Furthermore, when data from triplets
C, H and J were excluded from analyses of the incidence of TB breakdowns among
herds in land neighbouring proactive and survey-only trial areas, the estimated effects (a
24.7% increase with 95% CI: 19.7% reduction to 93.7% increase from the initial cull;
and a 19.9% increase with 95% CI: 37.4% reduction to 129.6% increase from the first
follow-up cull) were very similar to those obtained from the analysis of data from all 10
triplets (a 28.8% increase with 95% CI: 5.0-57.9% increase from the initial cull; and a
21.7% increase with 95% CI: 6.9% reduction to 59.0% increase from the first follow-up
cull), except that as expected the confidence intervals were considerably wider due to
the reduced dataset. Of course, since this analysis is based on the most recent data on
test interval for these herds on land neighbouring trial areas, it is possible that the
increased incidence observed on land neighbouring proactive trial areas, relative to the
land neighbouring survey-only trial areas, led to the test intervals among herds in the
former being shortened. In any case, we have demonstrated that the small differences
observed in the test intervals were not responsible for the estimated increased incidence
among herds on land neighbouring proactive trial areas.
13
Table 5 The numbers of cattle herds* in land neighbouring trial areas (≤2km outside trial area boundaries), sorted by their routine testing intervalTriple
t
Treatment Test interval (in years) Total Exact p-value1 2 3 4
A Proactive 69 1 70 >0.99 Survey-
only
85 1 86B Proactive 194 194 1 Survey-
only
91 91C Proactive 126 6 132 0.073 Survey-
only
129 16 145D Proactive 54 3 1 58 0.67 Survey-
only
61 1 1 63E Proactive 86 7 3 4 100 0.13 Survey-
only
76 5 81F Proactive 71 71 >0.99 Survey-
only
146 1 147G Proactive 167 1 1 3 172 0.37 Survey-
only
141 4 2 147H Proactive 84 2 1 87 0.026 Survey-
only
100 12 5 117I Proactive 79 79 1 Survey-
only
65 65J Proactive 140 140 0.004 Survey-
only
111 7 118Total 2075 65 4 19 2163*These herd numbers include all baseline herds and in addition all herds that came into existence since the initial proactive cull for their trial area

14
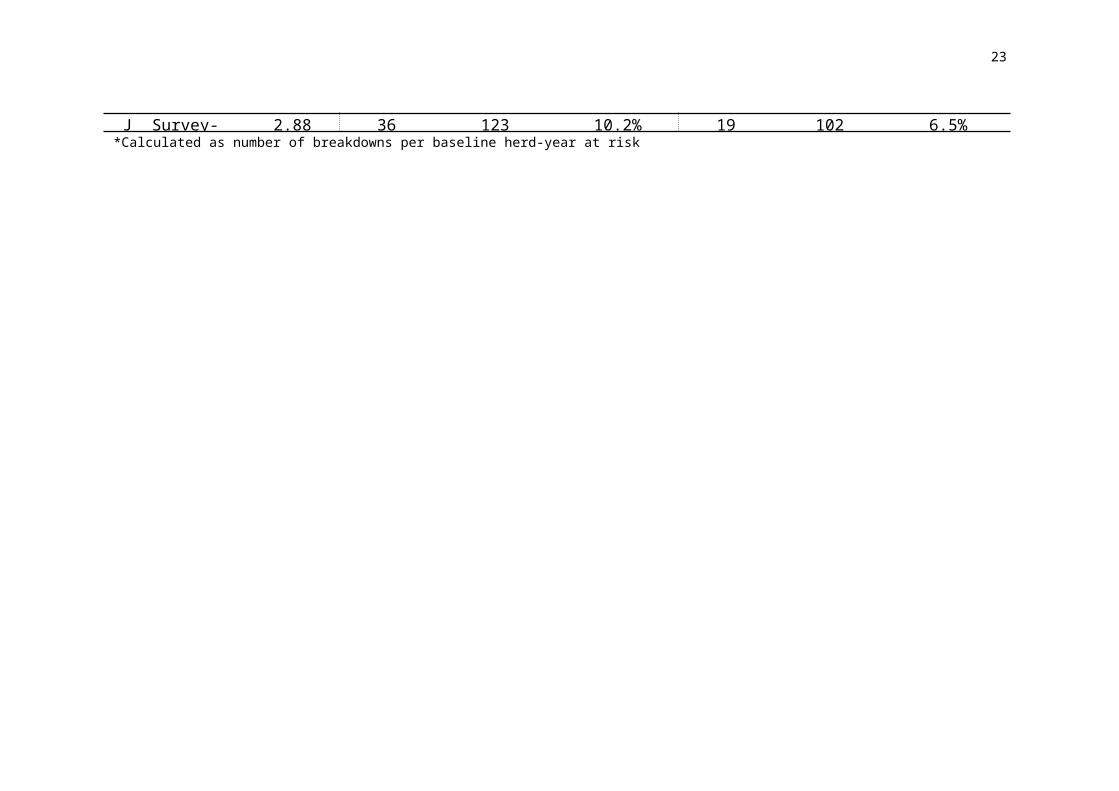
Table 6 Incidence, baseline herds and incidence rates by triplet and treatment for trial areas and neighbouring areas. Figures are using the VETNET database and are for confirmed breakdowns from initial cull
Whole trial area Neighbouring area
Triplet TreatmentYears since initial cull Incidence Baseline herds Incidence rate* Incidence Baseline herds Incidence rate*
A Proactive 5.60 37 71 9.3% 24 60 7.1%A Survey-only 5.60 52 86 10.8% 20 68 5.2%B Proactive 6.73 87 152 8.5% 65 154 6.3%B Survey-only 6.73 61 132 6.9% 44 68 9.6%C Proactive 5.85 29 105 4.7% 35 117 5.1%C Survey-only 5.85 84 174 8.2% 37 121 5.2%D Proactive 2.72 36 97 13.7% 17 47 13.3%D Survey-only 2.72 40 106 13.9% 15 57 9.7%E Proactive 5.28 36 116 5.9% 26 94 5.2%E Survey-only 5.28 56 97 10.9% 31 72 8.2%F Proactive 5.13 15 138 2.1% 13 61 4.2%F Survey-only 5.13 61 191 6.2% 32 127 4.9%G Proactive 4.82 72 245 6.1% 30 154 4.0%G Survey-only 4.82 40 131 6.3% 29 129 4.7%H Proactive 4.72 31 63 10.4% 46 73 13.3%H Survey-only 4.72 27 130 4.4% 27 94 6.1%I Proactive 2.91 27 100 9.3% 19 70 9.3%I Survey-only 2.91 21 98 7.4% 9 60 5.2%J Proactive 2.88 34 114 10.3% 32 123 9.0%J Survey-only 2.88 36 123 10.2% 19 102 6.5%
*Calculated as number of breakdowns per baseline herd-year at risk

15
3. Historical badger culling
Badger culling has formed a component of British TB control policy since the
1970’s8-10. Because the trial areas were placed in areas of high TB risk to cattle, most
had been subject to some form of badger culling under previous policies. The ‘gassing
strategy’ (1975-1981) killed badgers on land surrounding breakdown herds, primarily
by pumping hydrogen cyanide into their setts. In the wake of concerns about welfare
aspects of gassing, the ‘clean ring strategy’ was introduced in 1981. This involved cage
trapping badgers on land occupied by affected cattle herds, then on adjoining land,
expanding outwards until no further infected animals were captured. In 1986 this
approach was replaced by the ‘interim strategy’ which involved culling badgers only on
land occupied by affected cattle herds. The last ‘interim’ culls were performed in 1998,
prior to the start of the RBCT. Capture methods used under the interim strategy were
similar to those used in the RBCT, except that no closed season was in operation;
instead, lactating females were immediately released8 and in some cases the operations
would be suspended until later in the year to avoid capture of further lactating females.
The numbers of badgers culled under the interim strategy in each trial area are
shown in Table 7.
Table 7 The numbers of badger culled under the “interim strategy” (between 1986 and 1998) on land that subsequently fell inside RBCT areas Triplet Treatment A B C D E F G H I J TotalProactive 115 399 199 67 203 480 0 55 385 78 1,981Survey-Only 186 342 319 14 239 240 0 31 38 0 1,409
4. Historic cattle TB incidence
Unless stated otherwise, the historic incidence of cattle TB was calculated for
each trial area, for the three-year period before the initial proactive cull, except in
triplets D, I and J where it was calculated for the three years prior to the start of the

16
2001 epidemic of foot and mouth disease which resulted in the suspension of all field
activity and most routine cattle testing for TB. We also considered historic incidence
over periods of one and ten years.
An analysis restricted to survey-only trial areas (excluding both proactive and
reactive trial areas) comparing the incidence of confirmed breakdowns (since the
completion of the initial proactive cull within that triplet) in inner trial areas, outer trial
areas and neighbouring areas found no significant differences (p=0.18) between these
three unculled regions when triplet, baseline herds and historic TB incidence (calculated
over three years) were adjusted for. This result demonstrates the comparability of the
survey-only control areas during the RBCT.
The numbers of historic breakdowns (over one- and three-year periods) are
presented in the associated Excel spreadsheet. As described in section 2, there are
discrepancies between the numbers of herds in the whole trial area and the total of the
herds in the inner and outer trial areas which will have given rise to discrepancies in the
historic incidence data from the RBCT database. The 43 additional herds were
associated with three confirmed breakdowns and five unconfirmed breakdowns in the
one-year period and seven confirmed and six unconfirmed in the three-year period.
5. Statistical analysis
Overdispersion
The differences between proactive and survey-only areas sometimes varied
significantly more than would have been expected, had breakdowns occurred at random
in each trial area (p<0.05 for a test based on the magnitude of the model deviance
allowing for the residual degrees of freedom). Such unexplained variation is known as
extra-Poisson overdispersion. Standard errors, and therefore confidence intervals and p-
values from log-linear regression models, were adjusted for overdispersion by using an

17
overdispersion-adjustment factor (or inflation factor), which is the square root of the
model deviance divided by the degrees of freedom. For most of the analyses the
inflation factor was relatively small, less than 1.5, and frequently non-significant;
however, in the interests of caution this factor has been used to inflate standard errors,
widen confidence limits and hence inflate p-values in all cases where its value was
greater than 1.
Paired t-tests
The simplest method of analysis for the incidence data is the paired t-test. Because
the data are in the form of counts, the logarithm is taken of the number of breakdowns
for each proactive and each survey-only area (denoted nP and nS, respectively). The
within-triplet difference between these logarithms (D=ln(nP)-ln(nS)) has approximate
variance 1/nP + 1/nS. The t-test is performed on the ten within-triplet differences. For
example, in the case of confirmed TB breakdowns from the initial cull (within whole
trial areas using VETNET location data) the mean within-triplet difference was -0.208,
which corresponds to a 18.8% reduction, 100%*(exp(-0.208)-1), in confirmed TB
breakdowns associated with proactive culling within whole trial areas. The p-value from
the t-test was 0.32. It is noteworthy that this estimated 18.8% reduction is almost
identical in magnitude to the significant (p=0.005) estimate obtained from the log-linear
regression model (explained below) after adjustment for the number of baseline herds
and historic incidence (calculated over three years). Furthermore, the overdispersion
factor obtained from the log-linear regression model with no adjustment for historic
incidence, 2.32 as reported in Table 9, is similar to that obtained from the paired t-test
(the square route of the observed variance, 0.394, divided by the mean over the ten
triplets of the expected variance (1/nP + 1/nS), 0.055, was equal to 2.67). Thus, it was
clear that there was substantial variation left unexplained by this simple analysis.

18
Similar results for other comparisons led to the conclusion that more detailed modelling,
through the use of log-linear regression models, was required.
Log-linear regression models, estimated treatment effects and predicted incidence
Log-linear regression was used to analyse the incidence data and predictions, such
as those plotted in Figure 1 of the main text. Table 8 presents the fitted log-linear model
for confirmed breakdowns in whole trial areas (inner and outer trial areas combined)
since the initial proactive cull, based on the VETNET location data.
Table 8 Log-linear regression model fitted to confirmed breakdowns in whole trial areas (inner and outer regions combined), since the initial proactive cull, based on VETNET location data. Parameter Estimate Overdispersion-
adjusted SEOverdispersion-adjusted p-value
Intercept -0.362 0.932 0.70Treatment Proactive -0.207 0.073 0.005
Survey-only - - -Triplet A -0.269 0.234
B 0.156 0.166C 0.432 0.161D -0.304 0.190E -0.026 0.175F -0.159 0.186G 0.482 0.195H -0.248 0.189I -0.502 0.197J - - -
Log of baseline herds 0.047 0.248 0.85Log historic incidence* 1.241 0.213 <0.001* Historic incidence was calculated over a three-year period, and was restricted to confirmed breakdowns because the model was analysing confirmed breakdowns.
We calculate the estimated impact of proactive culling as:
exp(-0.207)-1 = -0.187 = -18.7%
and the 95% confidence bounds are calculated as:
19
exp(-0.207 – 1.96*0.073)-1 = -0.295 = -29.5% and
exp(-0.207 + 1.96*0.073)-1 = -0.062 = -6.2%.
Furthermore, we can calculate the predicted number of breakdowns in a proactive
trial area, had that area received no culling. For example, the triplet B proactive trial
area had 152 baseline herds and 42 historic breakdowns. Thus, the predicted incidence
in this trial area, had that area received no culling, would be:
exp(- 0.362 + 0 + 0.156 + 0.047 ln (152) + 1.241 ln (42)) = exp(4.670) = 106.7
confirmed breakdowns since the initial proactive cull in triplet B. This value was plotted
against the observed value, 87, in Figure 1 of the main text.
For comparison, the predicted incidence in the triplet B proactive trial area,
having received proactive culling would be
exp(- 0.362 – 0.207 + 0.156 + 0.047 ln (152) + 1.241 ln (42)) = exp(4.463) = 86.8
(18.7% lower than the prediction had the area received no culling) which is very
similar to the observed value, 87.
P-values
All p-values for tests of effects associated with proactive culling are two-sided.
All p-values for tests of overdispersion are one-sided in that significant results will
emerge only if significantly more variation (than expected) is observed.

20
6. Detailed results for confirmed breakdowns and all breakdowns
The estimated beneficial effect of culling was stronger inside ‘inner trial areas’
(≥2km inside trial area boundaries (Figure SI2)), which showed a 20% reduction
following initial culls (p=0.25, 95% CI: a 46% reduction to an 17% increase (Figure
SI3b)), than in ‘outer trial areas’ (<2km inside) which showed a 13% reduction (p=0.30,
95% CI: a 34% reduction to a 14% increase (Figure SI3c)). This gave a non-significant
(p=0.72) suggestion that the effects of proactive culling might increase as one moves
deeper inside trial area boundaries. However, if the adjustment for historical incidence
is based on one year, rather than three years, of data, then the estimated beneficial effect
was weaker inside ‘inner trial areas’ (≥2km inside trial area boundaries), which showed
a 20% reduction (p=0.32, 95% CI: a 48% reduction to a 24% increase), than in ‘outer
trial areas’ (<2km inside) which showed a 25% reduction (p=0.007, 95% CI: 7.5-38%
reduction), giving a non-significant (p=0.80) suggestion that the effects of proactive
culling decreased as one moves deeper inside trial area boundaries. This limited, and
indeed contradictory, evidence of a within-trial-area trend will be the subject of further
analysis.
We performed analyses only adjusting for the population at risk (in terms of the
number of baseline herds) but found considerable overdispersion (Table 9 and Table
10). This unexplained variation was considerably reduced, to the extent that
overdispersion was generally no longer significant, after adjusting for each trial area’s
historic cattle TB incidence (calculated over three years). Adjustments based on historic
cattle TB incidence calculated over 10 years were less successful, with overdispersion
remaining significant in most cases. Adjustments based on historic cattle TB incidence
calculated over one year performed similarly to the adjustment based on three years of
historic data, though the primary comparison of incidence in whole trial areas from the
initial proactive cull had the lowest overdispersion when the calculations were based on
VETNET location data and adjustment was made for historic TB incidence calculated
21
over three years. Thus, we present detailed results (adjusting for historic cattle TB
incidence calculated over three years and over one year) for confirmed breakdowns
(Table 11and Table 13 respectively) and all (confirmed and unconfirmed) breakdowns
(Table 12 and Table 14 respectively) for whole trial areas, inner trial areas, outer trial
areas, and neighbouring areas. The key difference between the results obtained for the
three- and one-year-based adjustments is that (as described above) the reduction in the
incidence of confirmed breakdowns observed in outer trial areas is greater after
adjustment for one-year historic TB incidence, making it similar to the reduction
observed in the inner trial areas. The increased incidence observed in neighbouring
areas is similar whether the adjustment for historic incidence is based on three or one
year’s data.
We also tested for a time-trend in the effect of proactive culling on TB incidence
by stratifying the data by year (since the initial cull in each triplet, rather than calendar
year) and fitting log-linear models allowing for an interaction between a linear time
effect and the proactive treatment effect. These tests revealed no significant time trends.
However, it was noteworthy that the estimates suggested a trend of increasing positive
effects of proactive culling within trial areas (an estimated 5.2% greater reduction in TB
incidence for each year since the initial cull, 95%CI: 16.1% greater to 7.0% less, p=0.39
for confirmed TB breakdowns in whole trial areas based on VETNET location data),
whereas the estimates suggested a trend of decreasing negative effects of proactive
culling within neighbouring areas (an estimated 3.7% smaller increase in TB incidence
for each year since the initial cull, 95% CI: 17.3% smaller to 12.1% greater, p=0.63 for
confirmed TB breakdowns in whole trial areas based on VETNET location data).
The ‘neighbouring area’ was chosen to extend 2km outside trial area boundaries
because ecological studies had shown effects on badger population density and ranging
behaviour across this spatial scale1. We also analysed incidence in a 3km-wide

22
‘neighbouring area’ (omitting any herds falling within 3km of more than one trial area).
We found a non-significant trend of increased incidence on land neighbouring proactive
areas (within 3km), relative to land neighbouring survey-only areas (within 3km),
(11.4% increase, 95% CI: 15.7% reduction to 47.1% increase, p=0.45) based on
confirmed TB breakdowns from the initial proactive cull. Furthermore, no evidence was
found of an effect in this 3km-wide neighbouring area from the first follow-up cull
(2.7% increase near proactive areas, 95% CI: 23.0% reduction to 36.9% increase,
p=0.86). These reduced estimates (although in the same direction as the analysis of the
2km band) and correspondingly non-significant p-values lend support to our choice of
2km as the likely distance across which perturbation effects would be likely to operate.
Results for all breakdowns (both confirmed and unconfirmed) are qualitatively
similar to those for confirmed breakdowns, but effects are weaker. Results using herd
locations calculated from the RBCT database are likewise qualitatively similar although
they tend to show greater overdispersion than analyses based on VETNET locations,
thus we consider the VETNET-based results, after adjustment for historic incidence
calculated over three years, as our key results.
23
Table 9 Overdispersion factors* and their significance levels for models estimating treatment effects based on confirmed TB breakdowns adjusted for triplet, baseline herds and varying durations of historic TB incidence. Higher overdispersion factors (and greater significance in the tests of overdispersion) indicate poorer model fit.
Incidence adjusted for**3 years 1 year 10 years No historic
incidenceFactor P-value Factor P-value Factor P-value Factor P-value
Whole trial area1 Using VETNET location dataFrom initial proactive cull 0.90 0.58 1.37 0.069 1.87 0.001 2.32 <0.001From first follow-up 1.15 0.24 1.24 0.15 1.70 0.005 1.90 <0.001Using the RBCT location dataFrom initial proactive cull 1.26 0.14 1.52 0.023 2.01 <0.001 2.19 <0.001From first follow-up 1.34 0.082 1.36 0.075 1.84 0.001 1.83 0.001
Inner trial area2 Using VETNET location dataFrom initial proactive cull 1.44 0.044 1.64 0.009 1.59 0.014 1.70 0.003From first follow-up 1.36 0.075 1.46 0.037 1.37 0.067 1.50 0.022Using the RBCT location dataFrom initial proactive cull 0.75 0.79 1.15 0.23 1.01 0.42 1.35 0.070From first follow-up 0.83 0.69 1.18 0.21 0.84 0.66 1.18 0.19
Outer trial area3 Using VETNET location dataFrom initial proactive cull 1.59 0.013 1.07 0.34 2.09 <0.001 2.08 <0.001From first follow-up 1.26 0.14 0.86 0.64 1.65 0.008 1.63 0.007Using the RBCT location dataFrom initial proactive cull 1.66 0.007 1.41 0.053 1.93 <0.001 1.87 <0.001From first follow-up 1.43 0.044 1.27 0.13 1.64 0.009 1.55 0.014
Neighbouring area4 Using VETNET location dataFrom initial proactive cull 1.03 0.38 0.94 0.52 1.24 0.15 1.44 0.034From first follow-up 1.15 0.24 1.20 0.19 1.21 0.17 1.29 0.10
1 Inner and outer regions combined; 2 More than or equal to 2km inside the boundary; 3 Up to 2km inside the trial area boundary; 4 Outside the trial area but within 2km of the boundary*The overdispersion factor was estimated as the square-root of the deviance divided by the degrees of freedom.**Significant effects are shown in bold type.

24
Table 10 Overdispersion factors* and their significance levels for models estimating treatment effects based on all (confirmed and unconfirmed) TB breakdowns adjusted for triplet, baseline herds and varying durations of historic TB incidence. Higher overdispersion factors (and greater significance in the tests of overdispersion) indicate poorer model fit.
Incidence adjusted for**3 years 1 year 10 years No historic
incidenceFactor P-value Factor P-value Factor P-value Factor P-value
Whole trial area1 Using VETNET location dataFrom initial proactive cull 1.52 0.023 1.62 0.011 1.92 0.001 2.00 <0.001From first follow-up 1.50 0.028 1.52 0.024 1.64 0.008 1.66 0.005Using the RBCT location dataFrom initial proactive cull 1.74 0.003 1.72 0.004 2.06 <0.001 1.97 <0.001From first follow-up 1.67 0.007 1.67 0.007 1.82 0.002 1.71 0.003
Inner trial area2 Using VETNET location dataFrom initial proactive cull 1.52 0.023 2.01 <0.001 1.89 0.001 1.96 <0.001From first follow-up 1.70 0.005 1.91 0.001 1.74 0.003 1.79 0.001Using the RBCT location dataFrom initial proactive cull 0.88 0.61 1.50 0.027 1.47 0.034 1.41 0.043From first follow-up 1.24 0.15 1.42 0.050 1.46 0.037 1.37 0.061
Outer trial area3 Using VETNET location dataFrom initial proactive cull 1.41 0.051 1.13 0.26 1.66 0.007 1.67 0.004From first follow-up 1.08 0.32 0.93 0.53 1.28 0.12 1.33 0.077Using the RBCT location dataFrom initial proactive cull 1.49 0.029 1.24 0.15 1.61 0.011 1.51 0.019From first follow-up 1.22 0.16 1.14 0.24 1.34 0.083 1.26 0.12
Neighbouring area4 Using VETNET location dataFrom initial proactive cull 1.21 0.17 0.86 0.64 1.37 0.069 1.52 0.018From first follow-up 1.08 0.32 0.94 0.52 1.14 0.25 1.27 0.11
1 Inner and outer regions combined; 2 More than or equal to 2km inside the boundary; 3 Up to 2km inside the trial area boundary; 4 Outside the trial area but within 2km of the boundary*The overdispersion factor was estimated as the square-root of the deviance divided by the degrees of freedom.**Significant effects are shown in bold type.

25
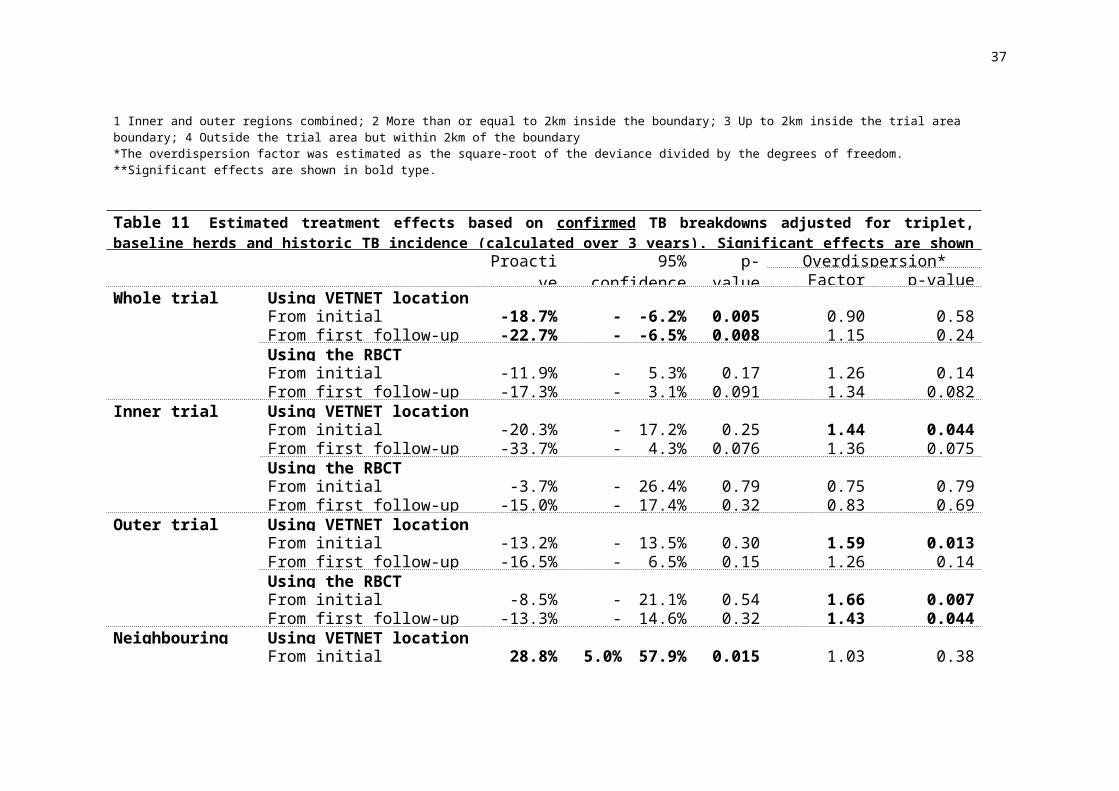
Table 11 Estimated treatment effects based on confirmed TB breakdowns adjusted for triplet, baseline herds and historic TB incidence (calculated over 3 years). Significant effects are shown in bold type.
ProactiveEffect
95% confidence bounds**
p-value for effect
Overdispersion*Factor p-value
Whole trial area1 Using VETNET location dataFrom initial proactive cull -18.7% -29.5% -6.2% 0.005 0.90 0.58From first follow-up -22.7% -36.1% -6.5% 0.008 1.15 0.24Using the RBCT location dataFrom initial proactive cull -11.9% -26.2% 5.3% 0.17 1.26 0.14From first follow-up -17.3% -33.6% 3.1% 0.091 1.34 0.082
Inner trial area2 Using VETNET location dataFrom initial proactive cull -20.3% -45.8% 17.2% 0.25 1.44 0.044From first follow-up -33.7% -57.9% 4.3% 0.076 1.36 0.075Using the RBCT location dataFrom initial proactive cull -3.7% -26.6% 26.4% 0.79 0.75 0.79From first follow-up -15.0% -38.4% 17.4% 0.32 0.83 0.69
Outer trial area3 Using VETNET location dataFrom initial proactive cull -13.2% -33.6% 13.5% 0.30 1.59 0.013From first follow-up -16.5% -34.6% 6.5% 0.15 1.26 0.14Using the RBCT location dataFrom initial proactive cull -8.5% -30.8% 21.1% 0.54 1.66 0.007From first follow-up -13.3% -34.5% 14.6% 0.32 1.43 0.044
Neighbouring area4 Using VETNET location dataFrom initial proactive cull 28.8% 5.0% 57.9% 0.015 1.03 0.38From first follow-up 21.7% -6.9% 59.0% 0.15 1.15 0.24
1 Inner and outer regions combined; 2 More than or equal to 2km inside the boundary; 3 Up to 2km inside the trial area boundary; 4 Outside the trial area but within 2km of the boundary* The overdispersion factor was estimated as the square-root of the deviance divided by the degrees of freedom.**Reported confidence intervals are adjusted for the overdispersion factor (if it was >1).

26
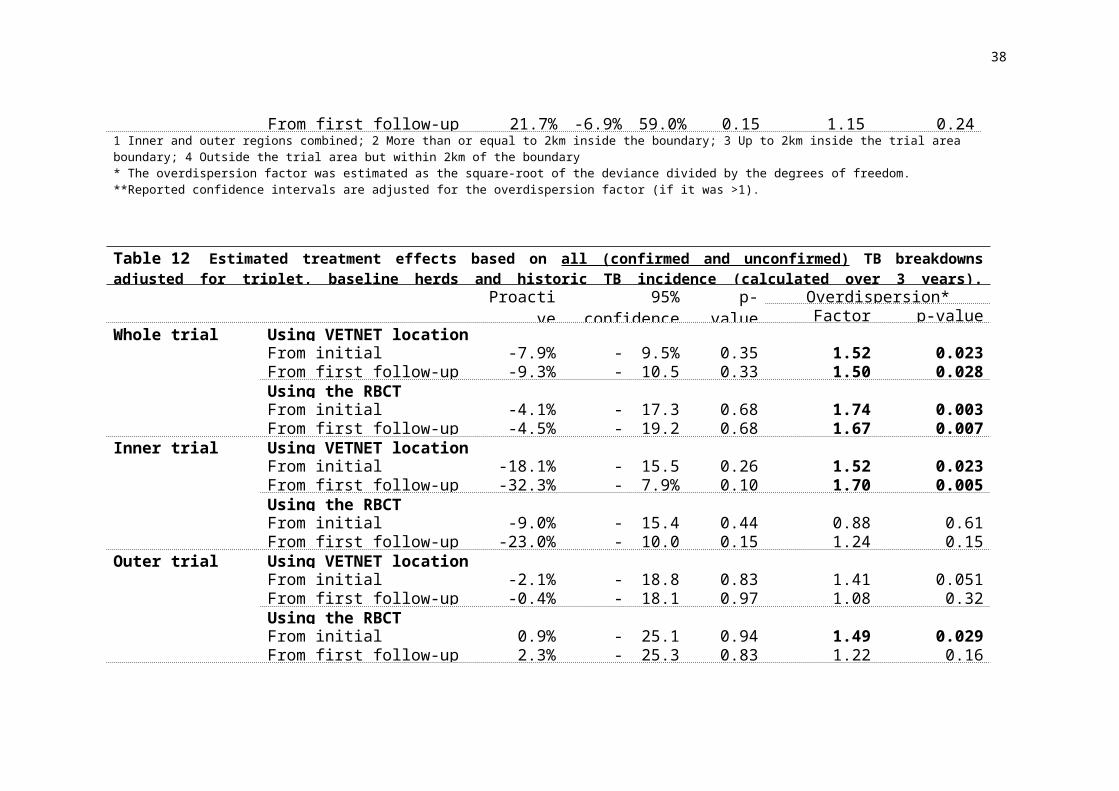
Table 12 Estimated treatment effects based on all (confirmed and unconfirmed) TB breakdowns adjusted for triplet, baseline herds and historic TB incidence (calculated over 3 years). Significant effects are shown in bold type.
ProactiveEffect
95% confidence bounds**
p-value for effect
Overdispersion*Factor p-value
Whole trial area1 Using VETNET location dataFrom initial proactive cull -7.9% -22.6% 9.5% 0.35 1.52 0.023From first follow-up -9.3% -25.5% 10.5% 0.33 1.50 0.028Using the RBCT location dataFrom initial proactive cull -4.1% -21.6% 17.3% 0.68 1.74 0.003From first follow-up -4.5% -23.5% 19.2% 0.68 1.67 0.007
Inner trial area2 Using VETNET location dataFrom initial proactive cull -18.1% -41.9% 15.5% 0.26 1.52 0.023From first follow-up -32.3% -57.6% 7.9% 0.10 1.70 0.005Using the RBCT location dataFrom initial proactive cull -9.0% -28.3% 15.4% 0.44 0.88 0.61From first follow-up -23.0% -46.1% 10.0% 0.15 1.24 0.15
Outer trial area3 Using VETNET location dataFrom initial proactive cull -2.1% -19.3% 18.8% 0.83 1.41 0.051From first follow-up -0.4% -15.9% 18.1% 0.97 1.08 0.32Using the RBCT location dataFrom initial proactive cull 0.9% -18.6% 25.1% 0.94 1.49 0.029From first follow-up 2.3% -16.5% 25.3% 0.83 1.22 0.16
Neighbouring area4 Using VETNET location dataFrom initial proactive cull 14.1% -6.2% 38.9% 0.19 1.21 0.17From first follow-up 10.3% -9.9% 34.9% 0.34 1.08 0.32
1 Inner and outer regions combined; 2 More than or equal to 2km inside the boundary; 3 Up to 2km inside the trial area boundary; 4 Outside the trial area but within 2km of the boundary* The overdispersion factor was estimated as the square-root of the deviance divided by the degrees of freedom.**Reported confidence intervals are adjusted for the overdispersion factor (if it was >1).

27
Table 13 Estimated treatment effects based on confirmed TB breakdowns adjusted for triplet, baseline herds and historic TB incidence (calculated over 1 year). Significant effects are shown in bold type.
Proactive
Effect
95% confidence bounds**
p-value for effect
Overdispersion*Factor p-value
Whole trial area1 Using VETNET location dataFrom initial proactive cull -16.4% -31.0% 1.3% 0.067 1.37 0.069From first follow-up -21.0% -35.4% -3.4% 0.021 1.24 0.15Using the RBCT location dataFrom initial proactive cull -13.1% -30.2% 8.2% 0.21 1.52 0.023From first follow-up -19.3% -35.7% 1.4% 0.066 1.36 0.075
Inner trial area2 Using VETNET location dataFrom initial proactive cull -19.8% -48.2% 24.1% 0.32 1.64 0.009From first follow-up -32.8% -58.6% 9.1% 0.11 1.46 0.037Using the RBCT location dataFrom initial proactive cull -11.6% -34.8% 19.7% 0.42 1.15 0.23From first follow-up -23.8% -47.0% 9.7% 0.14 1.18 0.21
Outer trial area3 Using VETNET location dataFrom initial proactive cull -24.5% -38.4% -7.5% 0.007 1.07 0.34From first follow-up -25.7% -40.2% -7.7% 0.007 0.86 0.64Using the RBCT location dataFrom initial proactive cull -21.4% -40.8% 4.3% 0.095 1.41 0.053From first follow-up -24.5% -43.9% 1.6% 0.063 1.27 0.13
Neighbouring area4 Using VETNET location dataFrom initial proactive cull 36.1% 10.0% 68.3% 0.005 0.94 0.52From first follow-up 23.4% -8.5% 66.5% 0.17 1.20 0.19
1 Inner and outer regions combined; 2 More than or equal to 2km inside the boundary; 3 Up to 2km inside the trial area boundary; 4 Outside the trial area but within 2km of the boundary* The overdispersion factor was estimated as the square-root of the deviance divided by the degrees of freedom.**Reported confidence intervals are adjusted for the overdispersion factor (if it was >1).

28
Table 14 Estimated treatment effects based on all (confirmed and unconfirmed) TB breakdowns adjusted for triplet, baseline herds and historic TB incidence (calculated over 1 year). Significant effects are shown in bold type.
ProactiveEffect
95% confidence bounds**
p-value for effect
Overdispersion*Factor p-value
Whole trial area1 Using VETNET location dataFrom initial proactive cull -7.0% -22.7% 12.0% 0.45 1.62 0.011From first follow-up -8.7% -25.2% 11.5% 0.37 1.52 0.024Using the RBCT location dataFrom initial proactive cull -4.6% -21.9% 16.5% 0.64 1.72 0.004From first follow-up -5.3% -24.2% 18.4% 0.63 1.67 0.007
Inner trial area2 Using VETNET location dataFrom initial proactive cull -18.3% -49.2% 31.4% 0.40 2.01 <0.001From first follow-up -36.0% -63.5% 12.3% 0.12 1.91 0.001Using the RBCT location dataFrom initial proactive cull -20.1% -42.9% 11.8% 0.19 1.50 0.027From first follow-up -32.0% -53.3% -0.9% 0.045 1.42 0.050
Outer trial area3 Using VETNET location dataFrom initial proactive cull -3.8% -17.6% 12.3% 0.63 1.13 0.26From first follow-up -2.1% -16.5% 14.7% 0.79 0.93 0.53Using the RBCT location dataFrom initial proactive cull -3.1% -19.5% 16.5% 0.74 1.24 0.15From first follow-up -0.6% -18.5% 21.1% 0.95 1.14 0.24
Neighbouring area4 Using VETNET location dataFrom initial proactive cull 24.1% 3.9% 48.3% 0.017 0.86 0.64From first follow-up 17.6% -4.4% 44.6% 0.12 0.94 0.52
1 Inner and outer regions combined; 2 More than or equal to 2km inside the boundary; 3 Up to 2km inside the trial area boundary; 4 Outside the trial area but within 2km of the boundary* The overdispersion factor was estimated as the square-root of the deviance divided by the degrees of freedom.**Reported confidence intervals are adjusted for the overdispersion factor (if it was >1).

29
Figure SI3 Observed and predicted (in the absence of culling) confirmed
breakdowns in proactive areas, following the initial proactive culls, in (a) whole trial
areas (total observed = 404, total predicted = 496.7); (b) inner trial areas (≥2km inside)
(observed = 107, predicted = 134.3); (c) outer trial areas (<2km inside) (observed = 297,
predicted = 342.1); and (d) neighbouring areas (≤2km outside) (observed = 307,
predicted = 238.4). If the herd incidence rates in or near the proactive areas matched
those in or near the survey-only areas (after adjustment for triplet, baseline herds and
historic TB incidence), the points would fall on the solid lines. The dashed lines
correspond to the reductions or increases in incidence recorded in or near the proactive
areas. The prediction for each proactive area was obtained based on the specific features
of that trial area, replacing the parameter associated with proactive culling for that
associated with survey-only.
a b
c d
B
ACD E
F
G
H I J
0
20
40
60
80
100
120
0 20 40 60 80 100 120Predicted
B
A
C
DE
F
GH IJ
0
5
10
15
20
25
30
0 5 10 15 20 25 30Predicted
B
A C
D E
F
G
HI J
0
10
20
30
40
50
60
70
0 10 20 30 40 50 60 70Predicted
B
A
C
DE
F
G
H
IJ
0
10
20
30
40
50
60
70
0 10 20 30 40 50 60 70Predicted
Obs
erve
dO
bser
ved
Obs
erve
dO
bser
ved
a b
c d
B
ACD E
F
G
H I J
0
20
40
60
80
100
120
0 20 40 60 80 100 120Predicted
B
A
C
DE
F
GH IJ
0
5
10
15
20
25
30
0 5 10 15 20 25 30Predicted
B
A C
D E
F
G
HI J
0
10
20
30
40
50
60
70
0 10 20 30 40 50 60 70Predicted
B
A
C
DE
F
G
H
IJ
0
10
20
30
40
50
60
70
0 10 20 30 40 50 60 70Predicted
a b
c d
B
ACD E
F
G
H I J
0
20
40
60
80
100
120
0 20 40 60 80 100 120Predicted
B
A
C
DE
F
GH IJ
0
5
10
15
20
25
30
0 5 10 15 20 25 30Predicted
B
A C
D E
F
G
HI J
0
10
20
30
40
50
60
70
0 10 20 30 40 50 60 70Predicted
B
A
C
DE
F
G
H
IJ
0
10
20
30
40
50
60
70
0 10 20 30 40 50 60 70Predicted
Obs
erve
dO
bser
ved
Obs
erve
dO
bser
ved

30
Figure SI4 Observed and predicted (as survey only) confirmed breakdowns in
survey only areas, in (a) whole trial areas (total observed = total predicted = 478); (b)
inner trial areas (≥2km inside) (observed = predicted = 132); (c) outer trial areas (<2km
inside) (observed = predicted = 346); and (d) neighbouring areas (≤2km outside)
(observed = predicted = 263). If the herd incidence rates in or near the survey-only areas
matched the model predictions (which depend on the triplet, the number of baseline
herds and historic TB incidence), the points would fall on the solid lines. The prediction
for each survey-only area was obtained based on the specific features of that trial area.
B
A
C
D
EFG
H
I
J
0
10
20
30
40
50
0 10 20 30 40 50Predicted
Obs
erve
d
B
AC
DE
FG
HI
J
0
5
10
15
20
25
0 5 10 15 20 25Predicted
Obs
erve
d
BA
C
D
EF
G
HI
J
0
20
40
60
80
0 20 40 60 80Predicted
Obs
erve
d
a b
c dB
A
C
D
EF
G
HIJ
0
10
20
30
40
50
60
70
0 10 20 30 40 50 60 70Predicted
Obs
erve
d

31
7. The search for systematic variation in the effect associated with proactive culling
We investigated whether the effect associated with proactive culling varied
systematically between different triplets. By systematic, we mean that the variation can
be explained in terms of a feature of the triplet or of the implementation of the strategy.
In statistical terms, this would appear as an interaction between the so-called proactive
treatment effect and the feature in question. An intensive search for such interactions
has been made based on covariates including historic cattle TB incidence and other
variables described in Table 15.

32
Table 15 Covariates tested for interaction with the treatment comparisonsCovariate Description1. Historical variablesNumber of badgers culled in interim badger removal operations*
Number of badgers caught during the interim strategy (April 1 1986 to December 12 1998)
Number of interim badger removal operations*
Number of culling operations conducted during the interim strategy (April 1 1986 to December 12 1998)
Badger M. bovis prevalence in badger removal operations
Percentage of M. bovis positive badgers caught during the interim strategy
2. Time related variablesTriplet duration Total number of years since the end of the initial proactive
cull in the triplet3. Trial badger variablesDensity of setts* Number of setts identified during initial surveys before the
random allocation of treatments divided by the estimated size of the surveyed trial area in km2
Density of active setts* Number of active setts identified during initial surveys before the random allocation of treatments divided by the estimated size of the surveyed trial area in km2
Density of main setts* Number of main setts identified during initial surveys before the random allocation of treatments divided by the estimated size of the surveyed trial area in km2
Density of active holes* Number of active holes identified during initial surveys before the random allocation of treatments divided by the estimated size of the surveyed trial area in km2
Density of latrines* Number of latrines identified during initial surveys before the random allocation of treatments divided by the estimated size of the surveyed trial area in km2
Number of badgers caught* Number of badgers caught in initial and first follow-up proactive culls
Proactive badger M. bovis prevalence
Percentage of M. bovis positive badgers caught at initial and first follow-up proactive culls
Permeability of trial area boundary for badgers
Percentage of the trial area boundary considered likely to substantially reduce badgers’ ability to enter the area; barriers comprised coastline, major rivers, and motorways
4. Other trial variablesNumber of baseline herds* Baseline herds must have had a whole herd test in the five
years before the initial proactive cull or during the RBCT and also have been in existence on VETNETTrap opportunities Percentage of all cage traps set to catch, which were available to catch badgers, i.e. that were not damaged or removed, and did not catch non-target species etc.
Occupier compliance Percentage of occupiers agreeing to cull and survey in August 2004
Wildlife Unit The two Defra Wildlife Unit bases, which undertook trial fieldwork including culling operations.
*Values for these variables were log-transformed for the purposes of these analyses, with a value of 0.0001 when a value of 0 required log-transformation.

33
Table 16 presents results from tests for interactions between features of trial areas
and the impact of the proactive treatment. The only significant interactions for the effect
of the proactive treatment were those with the number of interim badger removal
operations, and with the number of badgers culled in interim badger removal operations,
for the analysis of all (confirmed and unconfirmed) breakdowns based on the VETNET
location data. Proactive areas with higher numbers of interim badger removal operations
were associated with a greater reduction in TB incidence, with the median number of
operations (18) predicted to give rise to a 15% reduction in all TB breakdowns, from the
initial proactive cull, whereas triplet B with the highest number of operations (54) was
predicted to experience a 21% reduction in all TB breakdowns over this period and
triplet G with no operations was predicted to experience a 54% increase, though this
was the only triplet predicted to experience any increase. Similarly, proactive areas with
higher numbers of badgers culled under the interim strategy were associated with a
greater reduction in TB incidence, with the median number culled (157) predicted to
give rise to a 14% reduction in all TB breakdowns, from the initial proactive cull,
whereas triplet F with the highest number culled (480) was predicted to experience a
19% reduction in all TB breakdowns over this period and triplet G with no badgers
culled was predicted to experience a 48% increase, though, once again, this was the
only triplet predicted to experience any increase. The lack of any such effects among the
confirmed breakdowns, which in most analyses were the most affected by proactive
culling, suggests that these results should be regarded with great caution.

34
Table 16 P-values for the tests of interactions between treatments and the other covariates on the incidence of TB herd breakdowns in proactive versus survey-only whole trial areas. Significant effects are shown in bold type.
Confirmed breakdowns
All (confirmed and unconfirmed)
breakdowns
Covariate
Using the
RBCT location
data
Using VETNET
location data
Using the
RBCT location
data
Using VETNET
location data
Number of historical breakdowns 0.74 0.71 0.43 0.93Number of badgers culled in interim badger removal operations 0.095 0.25 0.34 0.047Number of interim badger removal operations 0.062 0.21 0.23 0.019Badger M. bovis prevalence in badger removal operations 0.80 0.16 0.98 0.36Triplet duration 0.67 0.85 0.67 0.97Density of setts 0.89 0.81 0.97 0.82Density of active setts 0.96 0.61 0.80 0.71Density of main setts 0.39 0.83 0.40 0.68Density of active holes 0.70 0.81 0.88 0.94Density of latrines 0.29 0.33 0.83 0.39Number of badgers caught 0.94 0.58 0.79 0.71Proactive badger M. bovis prevalence
0.90 0.97 0.80 0.98Permeability of trial area boundary for badgers 0.94 0.75 0.83 0.97Number of baseline herds 0.49 0.44 0.32 0.94Occupier compliance 0.68 0.72 0.70 0.92Trap opportunity 0.59 0.71 0.97 0.83Wildlife Unit 0.56 0.98 0.47 0.84

35
8. Robustness of results to different measures of the size of the population at risk
Table 17 (for confirmed breakdowns) and Table 18 (for all – confirmed and
unconfirmed – breakdowns) demonstrate the robustness of the estimated treatment
effects to different measures of the size of the population at risk. (In all other analyses
“baseline herds” is the measure of population size used.)

36
Table 17 Estimated treatment effects based on confirmed TB breakdowns adjusted for triplet and historic TB incidence and a measure of population size (a, b, c, or d as specified and defined in the table). Significant effects are shown in bold type.
ProactiveEffect
95% confidence bounds**
p-value for effect
Overdispersion*Factor p-value
Using the VETNET location data
From initial proactive cull(a) baseline herds -18.7% -29.5% -6.2% 0.005 0.90 0.58(b) baseline cattle -20.8% -32.7% -6.8% 0.005 0.88 0.61(c) number of herd tests -18.8% -29.5% -6.4% 0.004 0.90 0.58(d) number of cattle tested -20.2% -31.2% -7.4% 0.003 0.87 0.62From first follow-up(a) baseline herds -22.7% -36.1% -6.5% 0.008 1.15 0.24(b) baseline cattle -24.5% -39.5% -5.6% 0.014 1.17 0.21(c) number of herd tests -23.1% -36.4% -7.0% 0.007 1.16 0.22(d) number of cattle tested -24.7% -38.3% -8.2% 0.005 1.16 0.22
Using RBCT location data
From initial proactive cull(a) baseline herds -11.9% -26.2% 5.3% 0.17 1.26 0.14(b) baseline cattle -16.1% -30.3% 1.0% 0.063 1.29 0.12(c) number of herd tests -11.5% -25.0% 4.4% 0.15 1.18 0.20(d) number of cattle tested -14.7% -29.6% 3.3% 0.10 1.33 0.089From first follow-up(a) baseline herds -17.3% -33.6% 3.1% 0.091 1.34 0.082(b) baseline cattle -21.6% -37.5% -1.7% 0.035 1.38 0.066(c) number of herd tests -17.1% -32.5% 1.9% 0.075 1.28 0.12(d) number of cattle tested -20.4% -36.9% 0.4% 0.055 1.41 0.052
* The overdispersion factor was estimated as the square-root of the deviance divided by the degrees of freedom**Reported confidence intervals are adjusted for the overdispersion factor (if it was >1)
37
Table 18 Estimated treatment effects based on all (confirmed and unconfirmed) TB breakdowns adjusted for triplet and historic TB incidence and a measure of population size (a, b, c, or d as specified and defined in the table). Significant effects are shown in bold type Proactive
Effect95% confidence
bounds**p-value for
effectOverdispersion*
Factor p-value Using the VETNET location data
From initial proactive cull(a) baseline herds -7.9% -22.6% 9.5% 0.35 1.52 0.023(b) baseline cattle -6.0% -25.7% 18.9% 0.61 1.91 0.001(c) number of herd tests -8.3% -23.0% 9.1% 0.33 1.53 0.021(d) number of cattle tested -7.8% -26.5% 15.8% 0.48 1.94 <0.001From first follow-up(a) baseline herds -9.3% -25.5% 10.5% 0.33 1.50 0.028(b) baseline cattle -5.7% -27.0% 21.9% 0.65 1.81 0.002(c) number of herd tests -10.3% -26.7% 9.9% 0.30 1.55 0.019(d) number of cattle tested -9.4% -29.9% 17.0% 0.45 1.91 0.001
Using RBCT location data
From initial proactive cull(a) baseline herds -4.1% -21.6% 17.3% 0.68 1.74 0.003(b) baseline cattle -8.6% -29.1% 17.8% 0.49 2.20 <0.001(c) number of herd tests -4.4% -19.4% 13.4% 0.60 1.50 0.028(d) number of cattle tested -7.2% -27.5% 18.9% 0.56 2.14 <0.001From first follow-up(a) baseline herds -4.5% -23.5% 19.2% 0.68 1.67 0.007(b) baseline cattle -9.6% -31.5% 19.3% 0.47 2.12 <0.001(c) number of herd tests -5.5% -21.8% 14.3% 0.56 1.45 0.039(d) number of cattle tested -8.2% -29.9% 20.2% 0.53 2.05 <0.001
* The overdispersion factor was estimated as the square-root of the deviance divided by the degrees of freedom**Reported confidence intervals are adjusted for the overdispersion factor (if it was >1)
38

39
9. Interpretation of analyses from different time periods
The main text presents analyses from two time periods, one dating from the
completion of the initial cull (which shows statistically significant effects both inside
and outside trial areas), and one dating from completion of the first follow-up cull
(which shows a significant effect inside, but a non-significant trend outside). The
reasons for considering these two time periods, and their implications for the
interpretation of our findings, merit further comment.
We used incidence from the date of the initial cull as our primary analysis, mainly
because this measure is the most relevant to policy: the effects detected reflect what one
could expect to achieve from a proactive culling policy implemented on the timescale
measured. As described briefly in the main text, there were two reasons for performing
secondary analyses which excluded data from before the first follow-up cull. First, this
excluded breakdowns that might have originated prior to the onset of culling, even
though (given annual testing) they were not detected until after culling had begun. Such
breakdowns would lead to under-estimation of culling-induced effects on incidence in
the first year – essentially this would bias estimates of increases or reductions toward no
effect. Our findings of statistically significant effects dating from completion of the
initial cull, both inside and outside trial areas, therefore indicate the strength of both
positive and negative effects of culling.
An additional reason for performing the secondary analyses was that a more
complete badger removal would have been achieved from the date of the first follow-up
cull (see Section 1 above). This more complete cull would be expected to generate a
greater reduction in cattle TB inside trial areas, and the results of the secondary analysis
are indeed consistent with this prediction, albeit with a wider confidence interval due to
the smaller dataset.

40
In contrast with the situation inside trial areas, however, the circumstances of
incomplete badger removal that would have occurred between the initial cull and the
first follow-up could be expected to increase any detrimental effects of culling, if such
effects were caused by disruption of badger territorial organisation at artificially
reduced population densities. The frequency of potentially infectious contacts between
cattle and badgers will be related to both the density of badgers, and the ranging
behaviour of those badgers. We have hypothesised1 that, where densities are
substantially reduced, contact rates will be reduced despite expanded ranging behaviour,
but that smaller reductions in density will generate increased contact rates if (as
observed) they are also accompanied by expanded ranging. In this scenario, we would
expect detrimental effects to be particularly marked following the initial cull since
densities were probably reduced to a lesser extent during this period. Our secondary
analysis excluded this potentially important time period and this, along with the reduced
sample size, helps to explain why the culling effect in ‘neighbouring areas’ was found
to be weaker.
An important component of this argument is the time taken for badger culling to
generate additional cases of TB in cattle. If, as hypothesised, these effects are caused by
disruption of badgers’ spatial organisation at reduced population densities, this process
would entail three steps: (i) culling triggers expansion of badger ranging behaviour and
consequently contact with additional cattle herds; (ii) contact leads to infection in cattle;
and (iii) infected cattle become responsive to the tuberculin test. Behavioural data show
that local reductions in badger density cause badgers to alter their ranging behaviour
within a few days or weeks11-13, suggesting that step (i) could occur rapidly. The time
taken for step (ii) to occur is unknown. Step (iii), the acquisition of responsiveness to
the tuberculin test following exposure, takes approximately three weeks (personal
communication from C. Howard, Institute for Animal Health, cited in Le Fevre
(2005)14. Hence, if badgers can infect susceptible cattle rapidly on

41
contact, increased cattle incidence would be detectable 2-3 months after badger culling. Thus, breakdowns initiated following the initial cull should be detectable well before completion of the first follow-up cull about a year later.
This scenario assumes that detrimental effects of culling reflect greater contact between badgers and cattle as a consequence of expanded badger movement. An alternative scenario is that expanded movement might lead to greater transmission of infection among badgers, with consequently higher prevalence, ultimately causing greater transmission to cattle15, 16. In this scenario, detrimental effects of culling might indeed arise slowly because an additional (badger-badger) transmission stage is involved. The simpler scenario is, however, well supported by ecological data1 and is more parsimonious.
10. Effects of widespread culling in previous studies
To facilitate comparison with our findings, we used published data10-12 to
estimate the effects of widespread badger culling on the incidence of cattle TB in
previous studies. Table 19 and Table 20 present rates of cattle herd breakdowns in areas
subjected to either intensive or localised culling (‘removal’ and ‘reference’ areas
respectively) in two studies conducted in the Republic of Ireland17, 18. Data are presented
only for the years when culling occurred, to ensure comparability with our study.
Estimates presented in Table 19 of the reductions in cattle TB incidence associated with
widespread culling are based on direct comparisons of incidence in reference and
removal areas, without adjustment for any covariates. When log-linear regression
models were fitted to the ‘four areas’ data (Table 19) adjusting for the (log-transformed)

42
average number of herds at risk, the estimated reductions in TB incidence in intensively
culled areas were a 58% (95% CI: 41% to 70%) reduction from the start of culling and a
71% (95% CI: 55% to 81%) reduction from one year after the start of culling. There
was no significant overdispersion in either model, and there was no improvement in the
model with further adjustment for historic TB incidence.
The quantitative impact of badger culling in Britain’s Thornbury area cannot
meaningfully be compared with our results since the primary comparison was before
and after culling19. During the culling period, the average incidence of cattle TB was
higher in the removal area than in a nearby comparison area19. This difference almost
certainly reflected background variation in historical incidence in the two areas.
Although incidence later declined in the removal area, the published data preclude a
comparison in the timeframe equivalent to the one used in the current study.
None of these studies investigated effects of culling on neighbouring areas. We
would expect such effects to be weak in Ireland’s ‘four areas’ trial18 and at Thornbury19,
because culled areas were isolated from neighbouring cattle and badger populations by
geographic barriers. The East Offaly study17 compared data from herds ≥1.6km inside a
single culling zone (roughly equivalent to our inner trial areas), with herds in an 8km
wide ‘control zone’ immediately outside the culled area. By excluding data from the
intervening (culled) ‘buffer zone’ and incorporating herds adjacent to the culled area in
the large ‘control zone’, this study would fail to detect locally detrimental effects of
nearby culling. However, since any such effects would occur inside the control zone, the
beneficial effects of culling might have been somewhat over-estimated.
43
Table 19 Numbers of cattle herds experiencing confirmed TB breakdowns, and numbers of herds at risk, in the ‘Four Areas Trial’ carried out in the Republic of Ireland 10. Data are presented only from years during which badger culling occurred.
Cork Donegal Kilkenny MonaghanYear reference remova
lreference
removal
reference removal
reference removal1997-8 30/272 29/288 4/361 3/375 20/230 14/230 57/554 19/6871998-9 45/271 22/285 5/349 6/375 28/222 4/230 62/565 32/7011999-2000
33/271 11/282 5/343 3/375 25/214 6/229 42/565 24/6812000-01 12/274 2/270 4/334 1/370 12/213 6/225 38/559 24/6612001-02 13/269 3/259 18/320 1/365 16/206 4/214 29/545 13/644IncidenceAll years 133/135
767/1384
36/1707 14/1860
101/1085
34/1128
228/2788 112/33749.80% 4.84% 2.11% 0.75% 9.31% 3.01% 8.18% 3.32%
Reduction
51% 64% 68% 59%First year excluded
103/1085
38/1096
32/1346 11/1485
81/855 20/898 171/2234 93/26879.49% 3.47% 2.38% 0.74% 9.47% 2.23% 7.65% 3.46%
Reduction
63% 69% 76% 55%
Table 20 Numbers of individual cattle showing evidence of TB exposure, and numbers of cattle tested, in the East Offaly study carried out in the Republic of Ireland 11. Data are presented only from years during which badger culling occurred.
Year reference removal1989 982/294,088 362/103,0321990 904/286,425 299/103,3321991 979/218,813 194/72,2021992 594/234,888 89/65,8031993 404/212,382 54/67,0861994 443/210,339 54/68,527IncidenceAll years 4306/1,456,935 1052/479,982
0.296% 0.219%Reduction 26%First year excluded 3324/1,162,847 690/376,950
0.286% 0.183%Reduction 36%

44
11. Literature cited