natural expectations macroeconomic fluctuations - welcome to q group
TRANSCRIPT

1
Natural Expectations and
Macroeconomic Fluctuations
Andreas Fuster, David Laibson, and Brock Mendel
Forthcoming: Journal of Economic Perspectives Andreas Fuster is a Ph.D. candidate in Economics, David Laibson is the Robert I. Goldman Professor of Economics , and Brock Mendel is a Ph.D. candidate in Economics, all at Harvard University, Cambridge, Massachusetts. Laibson is also a Research Associate, National Bureau of Economic Research, Cambridge, Massachusetts. The e‐mail address for the corresponding author is <[email protected]>.

2
In recent decades, research in economics and finance has largely focused on the rational
actor model, in which economic agents process all available information perfectly. In contrast to an older perspective represented by Keynes and Pigou, the rational model rules out unjustified optimism or pessimism as an amplifying force for aggregate fluctuations. Consequently, the rational model struggles to explain some of the most prominent facts we observe in macroeconomics, such as large swings in asset prices, in other words “bubbles”, as well as credit cycles, investment cycles, and other mechanisms that contribute to the length and severity of economic contractions.
Relaxing the assumption of perfect rationality is a potential way of explaining aggregate volatility. Unfortunately, economists lack a consensus on how to do this. Economists often point out that psychological concepts like Keynesian “animal spirits” (Keynes, 1936) are vague and potentially even untestable (for instance, Fama, 1998). If a sample of macroeconomists were forced to write down a formal model of animal spirits, most wouldn’t know where to start and the rest would produce models that had little in common. In contrast, the rational actor model is conceptually elegant, disciplined, and parsimonious.
However, even the assumption of perfect rationality is not sufficient for modeling discipline. Creative assumptions about technology, preferences, information, and market frictions can offset the parsimony purchased with rational beliefs. If the methodological goal is modeling discipline, formal quasi‐rational models with a small number of free parameters should also be serious contenders. The methodological litmus tests should be parsimony, portability, and explanatory power (Gabaix and Laibson, 2008 propose a list of seven properties of good models). Rational models are only one potential means to these ends.
In this paper, we make the case that quasi‐rational models deserve greater attention. We begin by discussing a large body of empirical evidence which suggests that beliefs systematically deviate from perfect rationality. Much of the evidence implies that economic agents tend to form forecasts that are excessively influenced by recent changes – in other words, some form of “extrapolation bias.”
We then present a parsimonious quasi‐rational model that we call natural expectations, which falls between rational expectations and (naïve) intuitive expectations. Intuitive expectations are formed by running growth regressions with a limited number of right‐hand‐side variables. As we will see, this leads to excessively extrapolative beliefs in certain classes of environments.
Next, we show empirically that many U.S. macroeconomic time series have hump‐shaped dynamics ‐‐ in other words, they exhibit momentum in the short run and (partial) mean

3
reversion in the long run. Natural expectations turn out to be sophisticated enough to capture the short‐run momentum but fail to fully reflect the more subtle long‐run mean reversion. Hence, when the true dynamics are hump‐shaped, natural expectations overstate the long‐run persistence of economic shocks. In other words, agents with natural expectations turn out to form beliefs that don’t sufficiently account for the fact that good times (or bad times) won’t last forever.
Finally, we embed natural expectations in a simple dynamic macroeconomic model and compare the simulated properties of the model to the available empirical evidence. The model’s predictions match many patterns observed in macroeconomic and financial time series, such as high volatility of asset prices, predictable up‐and‐down cycles in equity returns, and a negative relationship between current consumption growth and future equity returns. We also discuss the model’s shortcomings, how these can be alleviated, and other potential directions for research in this area.
The Prevalence of Extrapolation Bias
The rational agent of standard economic models is assumed to use all available information in order to make statistically optimal forecasts. However, studies in a wide variety of contexts suggest that actual people’s forecasts place too much weight on recent changes, like the most recent quarterly growth rate in variables such as portfolio values or home prices.
As one example, excessive extrapolation has been empirically documented in the portfolio choices of individual investors. Chevalier and Ellison (1997), Sirri and Tufano (1998), find that mutual fund investors chase recent past performance. Benartzi (2001) and Choi et al (2004) report that 401(k) contributions to employer stock also chase historical returns. In subsequent work, Choi et al (2009) show that 401(k) participants increase their total contribution rate in response to recent idiosyncratic excess returns in their 401(k) account. Upon entering retirement, the share of individuals choosing an annuity over a lump‐sum payout is strongly negatively correlated with recent stock returns (Chalmers and Reuter, 2009; Previtero 2010). Malmendier and Nagel (forthcoming) show that an investor’s equity allocation is driven by the stock market’s weighted past performance with linearly declining weights from the present to the investor’s date of birth. In Finnish data, investors who participate in initial public stock offerings with high returns are more likely to subscribe to future stock offerings (Kaustia and Knupfer, 2008), and individuals whose local peers have experienced more positive recent returns are more likely to start participating in the stock market (Kaustia and Knupfer,

4
2010).1 In these cases, past performance has little predictive power for future performance, so from the standpoint of the rational actor model, the observed behavior appears to be a mistake.
It is theoretically possible that such findings do not matter for aggregate asset pricing, because investors with extrapolative beliefs hold relatively little wealth. However, Vissing‐Jorgensen (2003) finds that in survey data, even wealthy investors expected stock returns to remain high at the peak of the market in 2000‐2001, and that they appear to extrapolate based on their own personal investment returns. Additional evidence from the period of the tech bubble indicates that at least relatively inexperienced mutual fund managers exhibited trend‐chasing behavior (Greenwood and Nagel, 2009). Finally, a large literature in behavioral finance has accumulated evidence on cross‐sectional stock return patterns that can parsimoniously be explained with models in which (at least some) investors have extrapolative beliefs: for example, DeBondt and Thaler (1985, 1989) provide empirical evidence along these lines, and DeLong et al. (1990b) and Barberis, Shleifer, and Vishny (1998) offer models. Using a framework that motivates our own, Barsky and DeLong (1993) study the historical returns of equities, and show that returns are well‐described by a model in which agents are assumed to excessively extrapolate recent dividend growth. Choi (2006) shows that extrapolation can explain the high equity premium.
Another asset market of fundamental importance for the macroeconomy is the residential housing market, which has arguably gone through a bubble over the past decade and was at the center of the recent financial crisis. Various pieces of evidence point to the idea that extrapolative expectations, or the belief that the recent growth in home values is going to continue, led to “irrational exuberance” (Shiller, 2005) and played an important role fueling the bubble. For instance, Goetzman, Peng and Yen (2009) find that cities with higher past price increases experienced higher demand for mortgages, and, at least for subprime loans, higher approval probabilities. Relatedly, Gerardi et al. (2008) show that many mortgage market participants in 2005 and 2006 were aware that, if house prices fall, many mortgage borrowers would default. However, market participants only assigned a very low probability to such an event. Other authors who provide direct or indirect evidence for the importance of extrapolative expectations in housing markets include Abraham and Hendershott (1996), Muellbauer and Murphy (1997), Case and Shiller (2003), and Piazzesi and Schneider (2009).
1 Interestingly, this effect appears to be asymmetric, as negative returns of one’s neighbors do not reduce one’s probability of entering the stock market. Kaustia and Knupfer (2010) hypothesize that this may be due to selective communication, meaning that people are more likely to talk about positive investment experiences than about negative ones. Such sociological factors are omitted from the model in this paper, though they can certainly contribute to financial and macroeconomic fluctuations (see Akerlof and Shiller, 2009)
5
Apart from asset markets, other macroeconomic expectations may also be influenced by extrapolation. Ball (2000) applies a model similar to the one that we discuss below to explain differential degrees of inflation persistence in two monetary regimes. Tortorice (2010) looks at unemployment expectations in the Michigan Survey of households, and finds that consumers appear too optimistic at the beginning of recessions and too pessimistic at the end. Further, he shows that a model with extrapolative expectations is best at explaining these facts.
Finally, laboratory experiments offer some suggestive evidence. DeBondt (1993) presents subjects with historical financial time series, like stock price indices or exchange rates, and asks them to predict the value of the series at different points in the future. He finds that a majority of his subjects are “trend followers” who expect recent trends to continue. Hey (1994) has subjects forecast the next draw from an autoregressive process. He finds that subjects' forecasts are best modeled as extrapolative (rather than rational or adaptive), with a coefficient on past growth that depends on the persistence of the particular process. Dwyer et al. (1993) test whether subjects' forecasts of a random walk series (in which growth has no persistence) deviate systematically from the rational expectations forecast, and find that this is not the case. As we will discuss, our model is consistent with the findings of both of these studies. Haruvy, Lahav, and Noussair (2007) and Hommes et al. (2008) examine experimental asset markets and find that subjects’ expectations are primarily based on past trends. This is inconsistent with rational expectations and appears to play an important role in generating the well‐documented bubbles in such experiments.
These studies show that excessive extrapolation is present in many different settings. While it is possible to explain any finding with a combination of rational expectations and a more‐or‐less elaborate surrounding story, introducing extrapolative features into models of expectation formation may provide a more parsimonious and general explanation for various empirical phenomena.
Natural Expectations
To illustrate the predictive power of models with quasi‐rational beliefs, we present a parsimonious ‐‐ one‐free‐parameter ‐‐ formulation which we will then embed in a simple dynamic macroeconomic model.
Consider a time‐series of economic interest, ,tx expressed in levels or logs depending on
the absence or presence of exponential growth. The subscript t represents the time period.
Assume that an agent’s intuition about future changes in tx is described by an autoregressive
process that includes a small number of lags of historical changes and/or a small number of
6
moving average terms. To illustrate ideas, we study the case in which intuitions are based on a regression of growth2 on lagged growth,
1 1.t t tx xφ ε+ +Δ = Δ + (Intuitive model)
The parameter φ is pinned down using historical data – for instance a regression using ordinary
least squares ‐‐ so φ is not a free parameter. This simple growth‐regression is used to form
what we call intuitive expectations of what will happen at time t+1.
To demonstrate how this works with a concrete example, assume that the true data
generating process for tx is,
1 1 1t t t tx x xα β η+ − += + + . (True model)
Here α is the effect of tx on 1tx + , and β is the effect of 1tx − on 1.tx + For simplicity, we focus
on the case where the true model is stationary – in other words, the effect of a shock dies out completely over time ‐‐ but the qualitative results that follow are not dependent on the true model being selected from the class of stationary models. Campbell and Deaton (1989) point out that the processes that we have called the Intuitive Model and the True Model are difficult to statistically distinguish.
If the simple growth‐regression ‐‐ the intuitive model ‐‐ were estimated on a large data set generated by the true model, then the coefficient in the simple growth‐regression would be
1.
2α β
φ− −
= 3
Expectations that are based upon the (mis‐specified) intuitive model are called intuitive expectations. Expectations based upon the true model are called rational expectations. We define natural expectations to be a weighted average of the two, with weight 0 1λ≤ ≤ on the intuitive expectations. The weighting parameter, ,λ is an index of imperfection. When 1,λ =
the agent relies only on her intuition. When 0,λ = the agent is completely rational.
We think of natural expectations as an as if process. Agents do not consciously calculate intuitive expectations and then separately calculate rational expectations, before weighting the two components to form natural expectations. Instead, agents unconsciously combine many insights and end up with natural expectations as the conscious output of their deliberations. 2 If x is the natural log of a variable X , then 1t t tx x x −Δ ≡ − is a difference in logs, so that txΔ is equivalent to
the growth rate of X between period 1t − and period t . 3 We refer interested readers to an appendix, available at <http://e‐jep.org>, where all of our derivations are provided.

7
For example, agents might begin with intuitive expectations and then adjust toward rational expectations. This adjustment process is incomplete, so that intuitive expectations retain some weight in the final beliefs. Psychologists call this anchoring bias. Moreover, salient pieces of information ‐‐ like one’s own intuition ‐‐ tend to be overweighted when people form beliefs about the world. This is referred to as availability bias. Many psychological mechanisms jointly explain why agents’ intuitions get at least some weight in their final beliefs (Kahneman and Tversky, 1973a, 1973b, 1974).
It is helpful to visualize the properties of natural expectations using an impulse response function, which describes the response of a time series to an exogenous, one‐unit shock. Using our notation, an impulse response reports expectations that would arise right now if lagged
values of x were all zero, but the current value, 0x , were equal to 1 (implying that a one‐unit
shock has occurred in the current period, period 0). In this scenario, the impulse response function shows what the agent currently expects the value of x to be in periods 1, 2, 3, etc. Since the equations that we are studying are dynamic, the value of 0x affects the value of 1x ,
which in turn affects the value of 2x , and so on.
Exhibit 1 plots the impulse response function associated with three illustrative values of λ . It plots the path of natural expectations that emerge after a one unit shock realized in the current period, which is normalized to be t = 0. When 1,λ = natural expectations are equal to
intuitive expectations, which implies that the forecast rises and plateaus. When 0,λ = natural
expectations are equal to rational expectations, and therefore correspond to the true model.
An intermediate case with 12
λ = is an average of the two extremes.
Exhibit 1 plots the specific case 1.16α = and 0.24β = − . These numbers are chosen
because they are the estimates based on the true model that we will use later in this paper. This process is stationary, and therefore mean reverting at long horizons, since 1α β+ < , but the
associated intuitive expectations, with 0.20φ = , are not mean reverting. In this example,
natural expectations ( 0λ > ) deviate from rational expectations more clearly at longer horizons. However, at one quarter, the two expectations are nearly indistinguishable.
Natural expectations are not fully rational in the sense that one component – the intuitive expectations —may not be consistent with the true model. However, the agent’s intuitions are sophisticated and empirically disciplined since the intuitive model is estimated “correctly,” using historical data (cf. Sargent, 1993).4 Hence, empirical regularities pin down
4 Hong, Stein, and Yu (2007) and Branch and Evans (2010) also present models in which agents correctly estimate the coefficients of oversimplified models.

8
the parameters in the intuitive model, and extrapolation bias is not baked in. For instance, if the true model were a random walk, then the resulting natural expectations would be equivalent to rational expectations. Agents hold extrapolative beliefs only to the extent that: (1) extrapolative dynamics are implied by the empirically estimated parameters in the intuitive model and (2) the agent incompletely adjusts intuitive expectations towards rational expectations.
Hump‐Shaped Dynamics
Many macroeconomic time series have long‐horizon hump‐shaped dynamics – processes that show momentum in the short run and some degree of mean reversion in the long run. Such dynamics will generally not be captured by simple growth‐regressions. Hence, agents with natural expectations will make approximately accurate forecasts at short horizons, but poor forecasts at long horizons, because the economy has more long‐run mean reversion than the agents impute from their intuitive models. In other words, agents with natural expectations will overestimate the long‐term persistence of good news or bad news.
To illustrate the existence of hump‐shaped dynamics in macroeconomic data, we report impulse response functions for four macroeconomic variables for the U.S.: real GDP, unemployment, a proxy for real corporate earnings, and excess stock returns. For each variable, we calculate the effect of a one‐unit impulse on intuitive expectations and rational expectations. Intuitive expectations are generated by estimating the same intuitive model presented earlier: a regression of growth on lagged growth. In the current analysis, we use a moving average process with three years of lags as our true model. This is a highly flexible statistical model that is able to capture complicated dynamics.5
5 The terminology “true model” is chosen for expositional simplicity. We are not implying that a univariate time series model is the optimal way of forecasting economic variables, or even that three years of lags are necessarily able to capture all of the low‐frequency mean reversion. We discuss statistical caveats regarding our choice of the true model in the on‐line appendix available with this paper at <http://e‐jep.org>. For moving average specifications with many lags, the long‐run values of the impulse response function have large standard errors. In addition, the most popular model‐selection criteria, namely the AIC (Akaike information criterion) and BIC (Bayesian information criterion), generally do not support the use of statistical models with many lags (Campbell and Mankiw 1987). However, we place some faith in the specifications with many lags for the following reasons. Monte Carlo analyses suggest that low‐order ARIMA(p,1,q) processes (p,q≤3) have properties that are generally well‐captured by high‐order ARIMA(0,1,Q) models, but not vice versa. More generally, we find that hump‐shaped dynamics are difficult for low‐order models to capture. Nevertheless, it is frequently the case that model‐selection criteria mistakenly recommend the use of low‐order ARIMA models. The appendix also reports regression coefficients and standard errors for the ARIMA models described in this section, as well as additional specifications.

9
GDP and the net operating surplus of private enterprises are both reported quarterly, so in this case three years of lags implies a specification with 12 moving average terms. Unemployment and excess stock returns are tabulated monthly, so in this case we estimate a model with 36 moving average terms.
Exhibit 2a plots the quarterly impulse response functions for the natural log of real U.S. GDP. Intuitive expectations feature an impulse response function that rises and then flattens. The flexible specification with 12 moving average terms implies a hump‐shaped pattern with a comparatively lower long‐run value. This analysis is related to a literature measuring the long‐run persistence of a unit shock to GDP (see e.g. Campbell and Mankiw 1987, 1989; Cochrane 1988). In terms of this debate, all that matters for our argument is that the flexible impulse‐response function exhibits short‐run momentum and then (partial) mean reversion.
Exhibit 2b plots the monthly impulse response functions for the U.S. unemployment rate. The intuitive expectation is nearly the same as the expectations generated by a random walk. In other words, after the initial shock, there is very little additional movement predicted by the specification. Other growth regressions with a small number of lags imply an increasing impulse response function with a plateau well above the level of the original shock. In contrast, the flexible specification based on 36 moving average terms implies a clear hump‐shaped pattern.
Exhibit 2c plots the impulse response functions for the natural logarithm of the real U.S. net operating surplus of private enterprises. This is a proxy for the profitability of businesses, including proprietor’s income. Intuitive expectations feature an impulse response function that rises monotonically, but at a decreasing rate. The flexible specification based on 12 moving average terms implies a hump‐shaped pattern with substantial long‐run mean reversion.
Exhibit 2d plots the monthly impulse response functions for cumulative excess returns for U.S. equities. Again, intuitive expectations feature a slightly rising impulse response function. The flexible specification with 36 moving average terms implies a hump‐shaped pattern with a small degree of long‐run mean reversion. This pattern reflects the evidence on weak negative autocorrelation in stock returns at long horizons (Cutler, Poterba, and Summers 1991; Campbell and Shiller 1988a, b).
The four panels of Exhibit 2 illustrate the difference between simple growth‐regressions and a more sophisticated and flexible statistical model. In all four cases, a positive shock and intuitive expectations jointly generate an irrationally persistent view of the future. Macroeconomic activity has humps or cycles, but agents who place a reasonable weight on intuitive expectations fail to fully appreciate the transitory nature of good and bad news. For example, simple growth regressions imply that unemployment is roughly a random walk, but a

10
century of observation and theory belies that inference. A moving average model with many lags is needed to recognize the tendency of unemployment to show significant long‐run mean reversion. Expectations that are biased towards the intuitive forecast will often have important economic consequences. For instance, at the beginning of recessions agents will underestimate the ultimate rise of unemployment, while at the peak of unemployment they will overestimate how long it will persist (Tortorice, 2010). As their consumption and savings decisions are influenced by their expectations, these biased forecasts will act as an amplifying force of the business cycle.
An Illustrative Macroeconomic Model
We have argued that macroeconomic time series have short‐run momentum and long‐run (partial) mean reversion. If agents have natural expectations, they will fail to fully forecast the long‐run mean reversion. We now explore the consequences of this mistake in a dynamic macroeconomic model.
We study a one‐good endowment economy (cf. Lucas, 1978) with two sources of income. These are referred to as “Lucas trees,” because they provide a consumption good, like “fruit,” without having a production sector with physical investment.6 An equity tree generates
time‐varying dividends, ,tx and a labor tree generates a constant stream of labor income, .y
Dividends can be decomposed into a fixed component, ,μ and a component generated by the
specification that we earlier called the true model. Rational expectations for the future path of dividends are consistent with the true model.
Building on our earlier examples, we assume that the representative agent makes forecasts about future dividends using a weighted average of intuitive expectations and rational expectations. Intuitive expectations about the future path of dividends are generated by the specification that we earlier called the intuitive model, in other words a regression of current dividend growth on lagged dividend growth. The dynamics of the intuitive model and the true model are both summarized in Exhibit 1.
For this application, we set the weighting parameter between intuitive expectations and rational expectations to 1/ 2.λ = In other words, intuitive expectations and rational expectations are equally weighted in calculating natural expectations for the future path of dividends. 6 A rigorous presentation of the model, together with closed‐form solutions, appears in the on‐line appendix which is available at <http://e‐jep.org>.
11
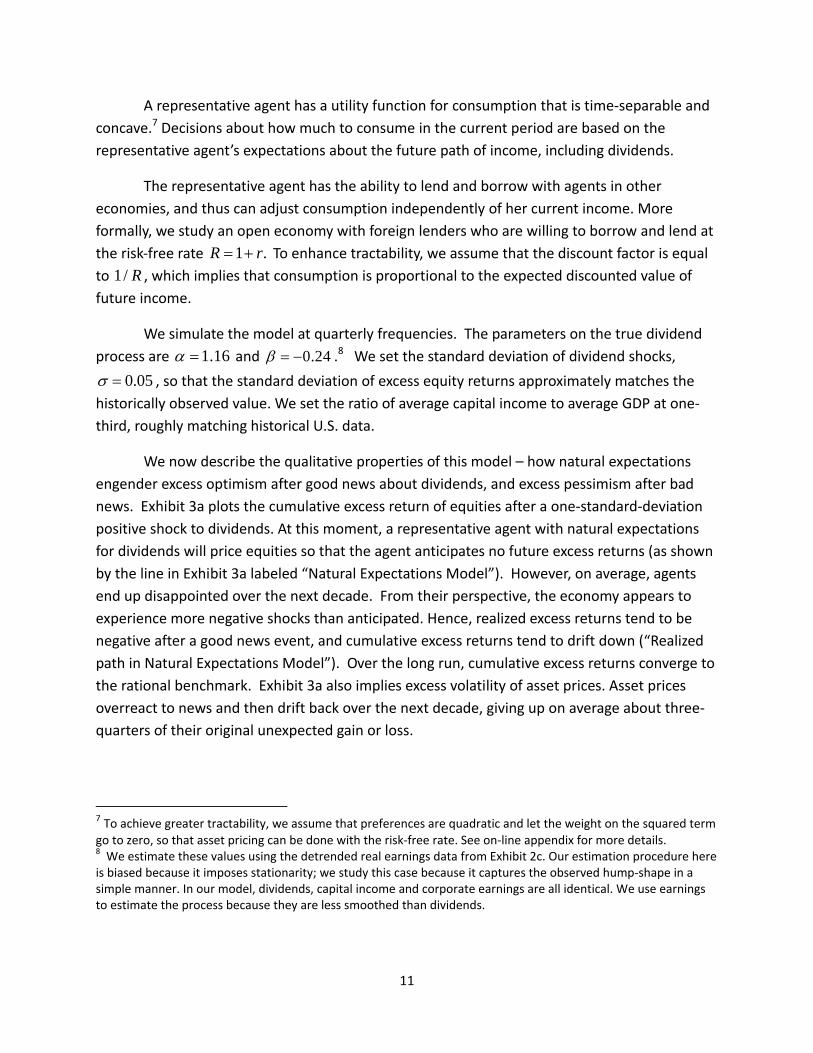
A representative agent has a utility function for consumption that is time‐separable and concave.7 Decisions about how much to consume in the current period are based on the representative agent’s expectations about the future path of income, including dividends.
The representative agent has the ability to lend and borrow with agents in other economies, and thus can adjust consumption independently of her current income. More formally, we study an open economy with foreign lenders who are willing to borrow and lend at the risk‐free rate 1 .R r= + To enhance tractability, we assume that the discount factor is equal to 1/ R , which implies that consumption is proportional to the expected discounted value of future income.
We simulate the model at quarterly frequencies. The parameters on the true dividend process are 1.16α = and 0.24β = − .8 We set the standard deviation of dividend shocks,
0.05σ = , so that the standard deviation of excess equity returns approximately matches the historically observed value. We set the ratio of average capital income to average GDP at one‐third, roughly matching historical U.S. data.
We now describe the qualitative properties of this model – how natural expectations engender excess optimism after good news about dividends, and excess pessimism after bad news. Exhibit 3a plots the cumulative excess return of equities after a one‐standard‐deviation positive shock to dividends. At this moment, a representative agent with natural expectations for dividends will price equities so that the agent anticipates no future excess returns (as shown by the line in Exhibit 3a labeled “Natural Expectations Model”). However, on average, agents end up disappointed over the next decade. From their perspective, the economy appears to experience more negative shocks than anticipated. Hence, realized excess returns tend to be negative after a good news event, and cumulative excess returns tend to drift down (“Realized path in Natural Expectations Model”). Over the long run, cumulative excess returns converge to the rational benchmark. Exhibit 3a also implies excess volatility of asset prices. Asset prices overreact to news and then drift back over the next decade, giving up on average about three‐quarters of their original unexpected gain or loss.
7 To achieve greater tractability, we assume that preferences are quadratic and let the weight on the squared term go to zero, so that asset pricing can be done with the risk‐free rate. See on‐line appendix for more details. 8 We estimate these values using the detrended real earnings data from Exhibit 2c. Our estimation procedure here is biased because it imposes stationarity; we study this case because it captures the observed hump‐shape in a simple manner. In our model, dividends, capital income and corporate earnings are all identical. We use earnings to estimate the process because they are less smoothed than dividends.

12
Exhibit 3b plots the consumption response to a one‐standard‐deviation positive shock to dividends. The representative agent immediately raises consumption and anticipates no average future changes (as shown by the line in Exhibit 3b labeled “Natural Expectations Model”). But then, the representative agent will tend to be disappointed by equity returns over the next decade. Hence, consumption changes tend to be negative after a good news event (“Realized path in Natural Expectations Model”). Over the long run, consumption undershoots the rational benchmark, since agents need to “pay back” the overconsumption that occurred when they were over‐optimistic about the economy’s prospects. Exhibit 3b also implies excess volatility of consumption. Consumption overreacts to news and then drifts back over the next decade, giving up on average more than three‐quarters of the original change. In the concluding section, we discuss extensions that smooth out consumption dynamics – like habits and other sources of slow adjustment.
The predictions of this model quantitatively match a number of empirical relationships. For example, the model correctly predicts that the excess equity return is weakly negatively auto‐correlated at lags of 2‐8 quarters, (e.g., Cutler, Poterba and Summers, 1991). The model correctly predicts that the ratio of equity prices to historical earnings is negatively correlated with future excess equity returns (e.g., Campbell‐Shiller, 1988a, b). The model also correctly predicts that high current consumption growth is negatively correlated with future excess returns (Moller, 2008). The calibrated model gets the signs of these relationships right, as well as the magnitudes. The appendix reports tables with these correlations.
Finally, it is useful to compare these predictions to those that would be observed if bias were eliminated ‐‐ that is, if 0λ = . In this case, the standard deviation of asset returns would drop by 75 percent and the standard deviation of consumption changes would drop by nearly as much. Hence, natural expectations about dividends raise volatility in aggregate economic variables. The predictability of returns and consumption also vanishes when 0λ = . In this case, asset values and consumption are both random walks.
Conclusion
We have analyzed an economy in which agents form intuitions as if they were estimating growth regressions with a small number of lagged variables. We call these simple growth regressions the intuitive model. When the true data generating process – the true model ‐‐ has hump‐shaped dynamics, the oversimplified intuitive model generates expectations characterized by excess extrapolation at long horizons. Rather than completely overriding these intuitions and adopting fully rational beliefs, agents form beliefs that give some partial weight to their intuitions. We call these beliefs ‐‐ partway between intuition and full rationality ‐‐ natural expectations.

13
Agents with natural expectations will overestimate persistence, which leads them to overreact to news about corporate earnings/dividends. Consequently, asset prices will fluctuate too much. In our simple model, asset price volatility leads to excess volatility in consumption, which is empirically counterfactual (see Campbell and Deaton, 1989). Hence, the model needs to be augmented with familiar mechanisms that smooth consumption changes, including habits (e.g., Campbell and Cochrane 1999), discrete adjustment costs (Grossman and Laroque, 1990), or additional psychological mechanisms that cause consumption to respond slowly to changes in asset prices (Lynch, 1996; Gabaix and Laibson, 2002). In the on‐line appendix we study a version of our model with slow adjustment in consumption.
We view the macroeconomic model discussed in this paper as illustrative and a “proof of concept”; it is deliberately kept simple and omits investment or financial intermediation. In models with capital formation, asset price volatility will generate excess volatility of investment (Lansing ,2009 offers an example along those lines). Debt cycles will also follow from volatile asset price movements, since agents will borrow to fund consumption and investment. If financial institutions hold beliefs with similar biases, they will be willing to finance the borrowing. Indeed, after positive shocks, financial institutions will perceive a reduction in risk because of their excessively optimistic views of income growth and asset price appreciation.
Future work incorporating quasi‐rational expectations into macroeconomic analysis could move forward along several paths. In the simulation in this paper, we fixed the balance between intuitive and rational expectations at one‐half. However, this parameter should be estimated. This would make it possible to test the null hypothesis of perfect rationality ( 0λ = ). Estimating bias parameters would also enable economists to have a quantitative discussion about the magnitude of bias, instead of focusing exclusively on the question of whether the bias is exactly zero or not. An early example along those lines is Muellbauer and Murphy (1997), who estimate a model of the UK housing market in which expectations are partly forward‐looking and partly extrapolative, with relative weights determined by the data. They find evidence for an important extrapolative component in expectations.
Another path forward would be to study forecasting biases in other settings. With an eye to recent events, a useful starting point might be the residential and commercial real estate markets (cf. Glaeser et al 2010). During the boom, forecasting biases affected expectations about long‐run price trajectories. If real estate prices have short‐run momentum and long‐run partial mean reversion, then agents with natural expectations will form strongly extrapolative beliefs about housing price dynamics and fail to recognize the mean reversion.
More generally, models of forecasting bias should be disciplined by a wide range of empirical data, including economic markets as well as laboratory experiments where

14
researchers have the advantage of controlling the stochastic processes that subjects observe (as in Hey, 1994).
Of course, the natural expectations model is only one possible way of relaxing the rational expectations assumption underlying traditional macro and finance models. A burgeoning literature in macroeconomics and finance, surveyed in Evans and Honkapohja (2001, 2009) and Pastor and Veronesi (2009), retains the assumption of rationality (in the sense of economic agents thinking like highly sophisticated statisticians), but assumes that the agents do not have full knowledge of their economic environment and must learn over time. These models can generate asset price dynamics that are similar to the ones produced by our model (for a recent example, see Adam and Marcet, 2010).
Yet another alternative, exemplified by the agent‐based literature, assumes that agents (probabilistically) select among different forecasting models based on past performance of the models (for example, LeBaron et al., 1999; Tesfatsion and Judd, 2006; De Grauwe, 2010). Such models are usually analyzed computationally and can give rise to very complex dynamics. An advantage of this modeling approach is that it directly gives rise to heterogeneity in beliefs, which our model has omitted.9
We hope that researchers will explore a range of models that relax the assumption of perfectly rational expectations. Such alternatives can help us understand both micro behavior, for instance, household investment decisions, as well as aggregate outcomes like asset market volatility or “bubbles.” The natural expectations model is illustrative of the kinds of models that are candidates for analysis. Empirical analysis should be used to identify models that are parsimonious, portable, and empirically valid across a wide range of economic environments.
9 The literature has studied markets that include both rational agents and “noise traders.” In such models, a range
of mechanisms can prevent a minority of perfectly rational agents from bidding prices all the way to their fundamental levels. One mechanism is risk aversion (for example, DeLong et al 1990a, 1990b; Choi 2006; Kogan et al. 2006). When a small pool of rational agents, who initially hold the world portfolio, buy or sell mispriced assets, they reduce their portfolio diversification. There are also institutional limits to arbitrage arising from the limited horizons of asset managers and their investors (for example, Shleifer and Vishny 1997).

15
Acknowledgements
The authors gratefully acknowledge Yeguang Chi and Jung Sakong for excellent research assistance. The authors acknowledge extraordinarily helpful comments from the editors ‐‐ David Autor, Chad Jones, and Timothy Taylor ‐‐ as well as John Campbell, James Choi, Benjamin Friedman, Edward Glaeser, Philipp König, Matthew Rabin, Robert Shiller, Andrei Shleifer, Jeremy Stein, Richard Thaler, Paul Willen and seminar participants at the University of Cambridge, and the WZB Berlin. Laibson acknowledges financial support from the National Science Foundation (DMS‐0527518) and the National Institute on Aging at the National Institutes of Health (R01‐AG‐021650, P01‐AG‐005842). Mendel acknowledges financial support from the National Science Foundation.

16
References
Abraham, Jesse M., and Patric H. Hendershott. 1996. “Bubbles in Metropolitan Housing Markets.” Journal of Housing Research, 7(2): 191-207.
Adam, Klaus, and Albert Marcet. 2010. “Booms and Busts in Asset Prices.” Bank of Japan Institute for Monetary and Economic Studies IMES Discussion Paper Series 2010-E-2.
Akerlof, George A., and Robert J. Shiller. 2009. Animal Spirits: How Human Psychology Drives the Economy, and Why It Matters for Global Capitalism. Princeton: Princeton University Press.
Ball, Laurence. 2000. “Near-Rationality and Inflation in Two Monetary Regimes.” NBER Working Paper 7988.
Barberis, Nicholas C., Andrei Shleifer, and Robert W. Vishny. 1998. “A Model of Investor Sentiment.” Journal of Financial Economics, 49(3): 307-343.
Barsky, Robert B., and J. Bradford De Long. 1993. “Why Does the Stock Market Fluctuate?” The Quarterly Journal of Economics, 108(2): 291-311.
Benartzi, Shlomo. 2001. “Excessive Extrapolation and the Allocation of 401(k) Accounts to Company Stock.” The Journal of Finance, 56(5): 1747-1764.
Branch, William A., and George W. Evans. 2010. “Asset Return Dynamics and Learning.” Review of Financial Studies, 23(4):1651-1680
Campbell, John Y., and Angus Deaton. 1989. “Why is Consumption So Smooth?” The Review of Economic Studies, 56(3): 357-373.
Campbell, John Y., and John H. Cochrane. 1999. “By Force of Habit: A Consumption-Based Explanation of Aggregate Stock Market Behavior.” Journal of Political Economy, 107: 205-251.
Campbell, John Y., and N. Gregory Mankiw. 1987. “Are Output Fluctuations Transitory?” The Quarterly Journal of Economics, 102(4): 857-880.
Campbell, John Y., and N. Gregory Mankiw. 1989. “International Evidence on the Persistence of Economic Fluctuations.” Journal of Monetary Economics, 23(2): 319-333.
Campbell, John Y., and Robert J. Shiller. 1988a. “The Dividend-Price Ratio and Expectations of Future Dividends and Discount Factors.” The Review of Financial Studies, 1(3): 195-228.
Campbell, John Y., and Robert J. Shiller. 1988b. “Stock Prices, Earnings, and Expected Dividends.” The Journal of Finance, 43(3): 661-676.
Case, Karl E., and Robert J. Shiller. 2003. “Is There a Bubble in the Housing Market?” Brookings Papers on Economic Activity, 2003(2): 299-342.

17
Chalmers, John, and Jonathan Reuter. 2009. “How Do Retirees Value Life Annuities? Evidence from Public Employees.” NBER Working Paper 15608.
Chevalier, Judith A., and Glenn Ellison. 1997. “Risk Taking by Mutual Funds as a Response to Incentives.” The Journal of Political Economy, 105(6): 1167-1200.
Choi, James J. 2006. “Extrapolative Expectations and the Equity Premium.” Yale University mimeo.
Choi, James J., David I. Laibson, Brigitte C. Madrian, and Andrew Metrick. 2004. “Employees' Investment Decisions About Company Stock.” In Pension Design and Structure: New Lessons from Behavioral Finance, ed. Olivia S. Mitchell and Stephen P. Utkus, 121-136. New York: Oxford University Press.
Choi, James J., David I. Laibson, Brigitte C. Madrian, and Andrew Metrick. 2009. “Reinforcement Learning and Savings Behavior.” The Journal of Finance, 64(6): 2515-2534.
Cochrane, John H. 1988. “How Big is the Random Walk in GNP?” Journal of Political Economy, 96(5): 893-920.
Cutler, David M., James M. Poterba, and Lawrence H. Summers. 1991. “Speculative Dynamics.” The Review of Economic Studies, 58(3): 529-546.
De Bondt, Werner F. M. 1993. “Betting on Trends: Intuitive Forecasts of Financial Risk and Return.” International Journal of Forecasting, 9(3): 355-371.
De Bondt, Werner F. M., and Richard H. Thaler. 1985. “Does the Stock Market Overreact?” The Journal of Finance, 40(3): 793-805.
De Bondt, Werner F. M., and Richard H. Thaler. 1989. “Anomalies: A Mean-Reverting Walk Down Wall Street.” Journal of Economic Perspectives, 3(1): 189-202.
De Grauwe, Paul. 2010. “Top-Down versus Bottom-Up Macroeconomics.” CESifo Working Paper 3020.
De Long, J. Bradford, Andrei Shleifer, Lawrence H. Summers, and Robert Waldmann. 1990a. “Noise Trader Risk in Financial Markets.” The Journal of Political Economy, 98(4): 703-738.
De Long, J. Bradford, Andrei Shleifer, Lawrence H. Summers, and Robert Waldmann. 1990b. “Positive Feedback Investment Strategies and Destabilizing Rational Speculation.” The Journal of Finance, 45(2): 379-395.
Dwyer, Gerald P., Arlington W. Williams, Raymond C. Battalio, Timothy I. Mason. 1993. "Tests of Rational Expectations in a Stark Setting." The Economic Journal, 103(418): 586-601.
Evans, George W., and Seppo Honkapohja. 2001. Learning and Expectations in Macroeconomics. Princeton: Princeton University Press.
Evans, George W., and Seppo Honkapohja. 2009. “Learning and Macroeconomics.” Annual Review of Economics, 1: 421-451.

18
Fama, Eugene F. 1998. “Market Efficiency, Long-Term Returns, and Behavioral Finance.” Journal of Financial Economics, 49: 283-306.
Gabaix, Xavier and David I. Laibson. 2002. “The 6D Bias and the Equity Premium Puzzle” NBER Macroeconomics Annual, 16:257-311.
Gabaix, Xavier, and David I. Laibson. 2008. “The Seven Properties of Good Models.” In The Foundations of Positive and Normative Economics, ed. Andrew Caplin and Andrew Schotter, 292-299. New York: Oxford University Press.
Gerardi, Kristopher S., Andreas Lehnert, Shane M. Sherlund, and Paul S. Willen. 2008. “Making Sense of the Subprime Crisis.” Brookings Papers on Economic Activity, 2008: 69-145.
Glaeser, Edward L., Joshua D. Gottlieb, Joseph Gyourko. 2010. “Can Cheap Credit Explain the Housing Boom?” NBER Working Paper 16230.
Goetzmann, William N., Liang Peng, and Jacqueline Yen. 2009. “The Subprime Crisis and House Price Appreciation.” NBER Working Paper 15334.
Greenwood, Robin, and Stefan Nagel. 2009. “Inexperienced Investors and Bubbles.” Journal of Financial Economics, 93(2): 239-258.
Grossman, Sanford J., and Guy Laroque. 1990. “Asset Pricing and Optimal Portfolio Choice in the Presence of Illiquid Durable Consumption Goods.” Econometrica, 58(1): 25-51.
Haruvy, Ernan, Yaron Lahav, and Charles N. Noussair. 2007. “Traders’ Expectations in Asset Markets: Experimental Evidence.” The American Economic Review, 97(5): 1901-1920.
Hey, John D. 1994. “Expectations Formation: Rational or Adaptive or …?” Journal of Economic Behavior and Organization, 25(3): 329-349.
Hommes, Cars, Joep Sonnemans, Jan Tulnstra, and Henk van de Velden. 2008. “Expectations and Bubbles in Asset Pricing Experiments.” Journal of Economic Behavior and Organization, 67(1): 116-133.
Hong, Harrison, Jeremy C. Stein, and Jialin Yu. 2007. “Simple Forecasts and Paradigm Shifts.” The Journal of Finance, 62(3): 1207-1242.
Kahneman, Daniel, and Amos N. Tversky. 1973a. “Availability: A Heuristic for Judging Frequency and Probabilities.” Cognitive Psychology, 5: 207-232.
Kahneman, Daniel, and Amos N. Tversky. 1973b. “On the Psychology of Prediction.” Psychological Review, 80(4): 237-251.
Kahneman, Daniel, and Amos N. Tversky. 1974. “Judgment under Uncertainty: Heuristics and Biases.” Science, 185(4157): 1124-1131.
Kaustia, Markku, and Samuli Knüpfer. 2008. “Do Investors Overweight Personal Experience? Evidence from IPO Subscriptions.” The Journal of Finance, 63(6): 2679-2702.

19
Kaustia, Markku, and Samuli Knüpfer. 2010. “Peer Performance and Stock Market Entry.” Working paper available at http://ssrn.com/abstract=1359006
Keynes, John M. 1936. The General Theory of Employment, Interest and Money. London: Macmillan. 2007.
Kogan, Leonid, Stephen Ross, Jiang Wang, and Mark M. Westerfield. 2006. “The Price Impact and Survival of Irrational Traders.” Journal of Finance, 61(1): 195-229.
Lansing, Kevin J. 2009. “Speculative Growth, Overreaction, and the Welfare Cost of Technology-Driven Bubbles.” Federal Reserve Bank of San Francisco Working Paper 2008-08.
LeBaron, Blake, W. Brian Arthur, and Richard G. Palmer. 1999. “Time Series Properties of an Artificial Stock Market.” Journal of Economic Dynamics and Control, 23(9): 1487-1516.
Lucas, Robert E. 1978. “Asset Prices in an Exchange Economy.” Econometrica, 46(6): 1429-1445. Lynch, Anthony W. 1996. “Decision frequency and synchronization across agents: Implications for aggregate consumption and equity returns.” Journal of Finance, 51 (4): 1479-97.
Malmendier, Ulrike M., and Stefan Nagel. Forthcoming. “Depression Babies: Do Macroeconomic Experiences Affect Risk Taking?” The Quarterly Journal of Economics.
Møller, Stig Vinther (2008). “Consumption growth and time-varying expected stock returns.” Finance Research Letters, 5: 129-136.
Muellbauer, John N., and Anthony Murphy. 1997. “Booms and Busts in the UK Housing Market.” The Economic Journal, 107(445): 1701-1727.
Pastor ,Lubos,and Pietro Veronesi. 2009. “Learning in Financial Markets.” Annual Review of Financial Economics, 1: 361-381.
Piazzesi, Monika, and Martin Schneider. 2009. “Momentum Traders in the Housing Market: Survey Evidence and a Search Model.” American Economic Review, 99(2): 406-411.
Previtero, Alessandro. 2010. “Stock Market Returns and Annuitization.” http://personal.anderson.ucla.edu/alessandro.previtero/Job_Market_Paper.html.
Sargent, Thomas J. 1993. Bounded Rationality in Macroeconomics: The Arne Ryde Memorial Lectures. New York: Oxford University Press.
Shiller, Robert J. 2005. Irrational Exuberance: Second Edition. Princeton: Princeton University Press.
Shleifer, Andrei and Robert W. Vishny. 1997. “Limits of Arbitrage.” The Journal of Finance, 52(1): 35-55.
Sirri, Erik R., and Peter Tufano. 1998. “Costly Search and Mutual Fund Flows.” The Journal of Finance, 53(5): 1589-1622.

20
Tesfatsion, Leigh S., and Kenneth L. Judd, ed. 2006. Handbook of Computational Economics: Agent-Based Computational Economics. Vol. 2. Amsterdam: North-Holland Publishing Company.
Tortorice, Daniel L. 2010. “Unemployment Expectations and the Business Cycle.” http://people.brandeis.edu/~tortoric/Research.htm.
Vissing-Jørgensen, Annette. 2003. “Perspectives on Behavioral Finance: Does ‘Irrationality’ Disappear With Wealth? Evidence from Expectations and Actions.” NBER Macroeconomics Annual, 18(1): 139-194.

21
0.00
0.20
0.40
0.60
0.80
1.00
1.20
1.40
0 1 2 3 4 5 6 7 8 9 10 11 12 13 14 15 16
Exhibit 1: Impulse response functions following a one‐unit shock at time zero
Intuitive Expectations
Natural Expectations (λ = 0.5)
Rational Expectations
Quarters after initial shock
Caption for Exhibit 1: Impulse response functions are plotted for intuitive expectations,
1 1t t tx xφ ε+ +Δ = Δ + , rational expectations, 1 1 1t t t tx x xα β η+ − += + + , and natural expectations, which is
the equally weighted average. We assume that 1.16α = ,and 0.24,β = − which implies that 0.20φ =
.

22
Exhibit 2: Impulse Response Functions for four Macroeconomic Time Series
Exhibit 2a: Real GDP(Quarterly data)
0
0.2
0.4
0.6
0.8
1
1.2
1.4
1.6
1.8
0 4 8 12 16Arima(1,1,0) Arima(0,1,4) Arima(0,1,8) Arima(0,1,12)
Intuitive Expectations
Rational Expectations
Quarters after initial shock
Caption for Exhibit 2a: Plots impulse response functions for the natural log of real U.S. Gross Domestic Product (Bureau of Economic Analysis, 1947:1 to 2009:4). Intuitive Expectations are calculated by estimating the intuitive model. Rational Expectations are calculated by modeling growth as a moving average with 12 lags.

23
Exhibit 2b: Unemployment(Monthly data)
0
0.5
1
1.5
2
2.5
1 3 5 7 9 11 13 15 17 19 21 23 25 27 29 31 33 35 37 39 41 43 45 47 49
Arima(1,1,0) Arima(0,1,12) Arima(0,1,24) Arima(0,1,36)
Intuitive Expectations
Rational Expectations
Months after initial shock0 12 24 36 48
Caption for Exhibit 2b: Plots the impulse response functions for the U.S. unemployment rate (Labor Department, 1947:1 to 2009:12). Intuitive Expectations are calculated by estimating the intuitive model. Rational Expectations are calculated by modeling the change in unemployment as a moving average model with 36 lags.

24
Exhibit 2c: Real earnings(Quarterly data)
0
0.2
0.4
0.6
0.8
1
1.2
1.4
0 4 8 12 16Arima(1,1,0) Arima(0,1,4) Arima(0,1,8) Arima(0,1,12)
Intuitive Expectations
Rational Expectations
Quarters after initial shock
Caption for Exhibit 2c: Plots impulse response functions for ARIMA models estimated on the natural log of real net operating surplus of private enterprises as reported in the U.S. National Income and Product Accounts (Bureau of Economic Analysis, 1947:1 to 2009:4). The net operating surplus of private enterprises is reported in NIPA Table 1.10, line 12. This definition is net of capital depreciation. To adjust for inflation, we use the GDP deflator. Intuitive Expectations are calculated by estimating the intuitive model. Rational Expectations are calculated by modeling growth in real earnings as a moving average process with 12 lags.

25
Exhibit 2d: Cumulative excess return for U.S. equities(Monthly data)
0
0.2
0.4
0.6
0.8
1
1.2
1.4
0 12 24 36 48Arima(1,1,0) A rima(0,1,12) Arima(0,1,24) Arima(0,1,36)
Intuitive Expectations
Rational Expectations
Months after initial shock
Caption for Exhibit 2d: Plots impulse response functions for excess returns (1926:9 to 2010:3). Excess returns come from Kenneth French's website; they are calculated as "the value‐weighted return on all NYSE, AMEX, and NASDAQ stocks (from CRSP) minus the one‐month Treasury bill rate (from Ibbotson
Associates).” Intuitive Expectations are calculated by estimating the intuitive model, where txΔ is
replaced with the excess return for period t. Rational Expectations are calculated by regressing the excess return on a moving average process with 36 lags.

26
Exhibit 3a: Cumulative Excess Equity Return Following a One‐Standard‐Deviation Shock to Dividend Process
0%
2%
4%
6%
8%
0 4 8 12 16 20 24 28 32 36 40 44 48
Natural Expectation
Rational Expectation
Realized path withNatural Expectations
Quarters after initial shock
Cumulative excess equity return
Caption for Exhibit 3a: After a positive dividend shock, agents expect no future excess returns (see the line “Natural Expectations Model”). However, on average agents end up disappointed. From their perspective, the economy appears to experience more negative shocks than anticipated. Hence, realized excess returns tend to be negative, and cumulative excess returns tend to drift down (“Realized path in Natural Expectations Model”). Over the long run, cumulative excess returns converge to the rational benchmark. (See the online appendix for our definition of cumulative excess returns.)

27
Exhibit 3b: Consumption Dynamics Following a One‐Standard‐Deviation Shock to Dividends
0.00%
0.50%
1.00%
1.50%
2.00%
2.50%
0 4 8 12 16 20 24 28 32 36 40 44 48
Natural Expectation
Rational Expectation
Realized path withNatural Expectations
Quarters after initial shock
Change from baseline consumption
Caption for Exhibit 3b: After a positive dividend shock, agents immediately raise consumption and anticipate that no future increases will occur (“Natural Expectations Model”). On average agents tend to be disappointed by equity returns over the next decade. Hence, consumption changes tend to be negative after a good news event (“Realized path in Natural Expectations Model”). Over the long run, consumption undershoots the rational benchmark, since agents need to “pay back” the overconsumption that occurred when they were over‐optimistic about the economy’s prospects.