macroeconomic developments in serbia - nbs.rs 1 cpi and inflation expectations developments ......
TRANSCRIPT

June 2018
Macroeconomic Developments
in Serbia
Sustained Macroeconomic Stability
2
• In six years, Serbia transformed itself from an economy characterised by stagnant growth, high
unemployment rate and twin deficits - to a low inflation and stable growing economy, with erased fiscal
deficit, declining public debt, significantly reduced external imbalances and labor market recovery.
• Inflation slowed in early 2018 – from 3.0% in December 2017 to 2.1% in May, and is expected to remain
within the lower half of the target tolerance band in the short run, gradually approaching central target in
2019. Inflation expectations are anchored around the target of 3.0%.
• Government budget turned into a surplus in 2017 (1.2% of GDP), and this trend continued in early 2018
(0.4% of GDP in Q1). After sharp fall in public debt in 2017 of more than 10% of GDP, in early 2018 it has
dropped further to 58.6% of GDP (April 2018).
• These results were acknowledged by improved credit ratings (S&P, Fitch and Moody’s) during 2017 and
the successful completion of the stand-by precautionary arrangement with the IMF and, quite importantly,
led to a sharp decline in the country risk premium, to historical low in January.
• Macroeconomic stabilization contributed to stronger FDI growth, of 27.1% y-o-y in 2017 (reaching 6.6% of
GDP), and favourable trends have been continuing from the beginning of 2018.
• GDP growth accelerated to 4.6% y-o-y in Q1, on the back of robust investment activity - both private and
government.
• After strengthening of the Dinar against the euro in 2017 by 4.2%, appreciation pressures continued during
2018, while the NBS net bought EUR 1 bn since the beginning of the year (up to June 14th).
• Due to low inflationary pressures policy rate was cut in March and April, both times by 25bp, to its current
level of 3.0%. Led by demand and supply factors, lending activity increased by 7.6% y-o-y in April 2018
(14.1% excluding the effects of NPLs write-offs and sales since 2016).
• Serbian banking sector stability has been preserved and further reinforced. Encouraged by the NBS
measures, the share of NPLs in total loans plummeted to 8.8% at end-April 2018 which is the lowest level
since 2008 when this indicator of portfolio quality was introduced. Capital adequacy indicators are even
stronger after the adoption of Basel III standards in Serbia.
• All of the above created a favourable environment for growth acceleration in the coming period.

Low Inflationary Pressures
As expected, inflation returned within the
target tolerance band in May…
…and will continue to move within the target
throughout the forecast horizon…
• Slowing down of inflation, and its temporary drop below the
lower target bound in early 2018 was mainly due to dropout
of early-2017 price hikes (food, telecom, firewood,
petroleum products) from y-o-y calculation.
• Inflation returned to the target band in May, with part of this
movement coming from seasonally unexpected higher
prices of vegetables.
• Core inflation in May remained at historically low level of
0.8% y-o-y, for the third month in a row.
• Inflation expectations are anchored around the target, in the
longer period.
• Inflation will remain closer to the lower bound of the target
until end-2018, while gradually approaching central target
level during 2019.
• The main inflationary impact in the short-run will come
from the oil price hike and waning of the effects of past
appreciation of the dinar, while increase in aggregate
demand will work in the medium-term. High base effect
for fruit and vegetable prices will act as a damper.
• Risks to the projected inflation path are related to future
developments in the global commodity and financial
markets, and, to a certain degree, to administered price
growth and outcome of this year’s agricultural season.
Chart 1 CPI and inflation expectations developments
(y-o-y rates, in %)
Chart 2 Inflation projection (from May 2018 IR)
(y-o-y rates, in %)
2.1
0.8
2.8
0
2
4
6
8
10
12
14
16
12009
4 71012010
4 71012011
4 71012012
4 71012013
4 71012014
4 71012015
4 71012016
4 71012017
4 71012018
4
CPI InflationCore Inflation*Inflation expectations of the financial sector (Bloomberg)
*CPI excl. Food, Energy, Alcohol and Tobacco
-2
-1
0
1
2
3
4
5
6
7
32016
6 9 12 32017
6 9 12 32018
6 9 12 32019
6 9 12 32020
3

Inflation Expectations Strongly Anchored Within Inflation Target
Short-term inflation expectations are moving
within the target band…
… which is also the case with medium-term
inflation expectations
• Short-term inflation expectations of financial sector and
corporates are strongly anchored, hovering just below the
central target. Their recent slight reduction was largely
driven by current inflation developments.
• According to Ipsos survey from May, one-year ahead
inflation expectations of financial sector were at 2.5% (same
as a month earlier), while corporates expectations fell to
2.7% (April 2.8%).
• According to Bloomberg survey, financial sector expects
inflation of 2.8% in June 2019 (for the third month in a row).
• Medium-term expectations of the financial and corporate
sector are firmly anchored.
• Medium-term inflation expectations of financial sector
equal 3.0% for the fourth month in a row, while corporates
expectations fell to 2.8% (April 3.0%).
Chart 3 One year ahead Inflation Expectations
(in %)
Chart 4 Two year ahead Inflation Expectations
(in %)
3.0
2.8
0
2
4
6
8
10
12
32014
6 9 12 32015
6 9 12 32016
6 9 12 32017
6 9 12 3
Financial Sector Corporate Sector
Source: Ipsos
4
2.7
2.5
2.8
0
2
4
6
8
10
12
12012
4 7 10 12013
4 7 10 12014
4 7 10 12015
4 7 10 12016
4 7 10 12017
4 7 10 12018
4
Financial Sector (Ipsos) Corporate Sector
Financial Sector (Bloomberg)
Sources: Gallup, Ninamedia, Ipsos, Bloomberg

Diversified Growth Supported by Investments, Exports and Labour Market Recovery
GDP growth picked up in Q1 2018 to 4.6% y-o-y
backed by investments
Economic growth will remain strong in the
coming years
• Higher than expected Q1 growth (4.6% y-o-y) was
dominantly led by investment activity (14.9% y-o-y, +2.7 pp),
both government and private, followed by higher
consumption and supported by strong export growth.
• Robust investment activity is confirmed by major
construction indicators, imports of equipment, strong net FDI
inflows and expanding domestic sources of financing.
• On the production side, strong growth in construction
(26.4% y-o-y), pushed GDP growth beyond expectations. All
other sectors also gave positive contribution to growth, with
industrial production and private sector services on the top.
• Strong private and public investments, expansion in
exports and sustainable rise in consumption will be the
main drivers of GDP growth of 3.5% in 2018 and 2019.
• Factors to support sustainable medium-term growth
include macroeconomic stability, improved business
environment (due to structural reforms), investments in
infrastructure and effects of past monetary easing.
• Investments share in GDP has been increasing steadily
over the past 3 years, and is set to exceed 21.5% in 2018.
• Domestic factors, mostly related to investment, indicate
upside potential to growth in the near term, while
headwinds might come from Eurozone slowdown.
Chart 5 GDP developments
(seasonally adjusted, Q1 2006=100)
Chart 6 GDP growth projection (from May 2018 IR)
(y-o-y rates, in %)
70
75
80
85
90
95
100
105
110
115
120
106
108
110
112
114
116
118
120
122
Q3 Q12011
Q3 Q12012
Q3 Q12013
Q3 Q12014
Q3 Q12015
Q3 Q12016
Q3 Q12017
Q3 Q12018
GDP Manufacturing
*NBS estimate
-5
-4
-3
-2
-1
0
1
2
3
4
5
6
7
8
Q12016
Q3 Q12017
Q3 Q12018
Q3 Q12019
Q3 Q12020
5

Improved Business Environment Supporting High FDI Inflow
Macroeconomic stability combined with
structural reforms has created a more
favourable climate for FDIs…
…which are well-diversified and contributing
to the country’s export potential
• During four months of 2018 net FDI inflow amounted to EUR
870 mn (+12.7% y-o-y), further building on high base from
2017. Inflows were mostly concentrated in export industries.
• Improvement of the business environment is evidenced by
advancement on the WB Doing Business list - Serbia moved
up from rank 91 (2015) to 47 (2017) and 43 (2018).
• According to FT (August 2017), Serbia has the best global
performance index for greenfield FDI.
• In 2018, we expect a continuance of strong performance,
with net FDI inflows standing at EUR 2.6 bn (6.6% of GDP).
• Over a five-year period, a large share of FDI inflows were
directed to export-oriented sectors.
• Within manufacturing, most FDI inflows were directed to
the auto industry, base metals, rubber and plastics,
pharmaceuticals and chemicals. They are driving growth
trends in manufacturing employment, output and exports.
• FDI inflows are diversified by region of origin as well, with
a greater share of countries from the Asia Pacific and
Middle East regions, alongside the major investment
partner - the European Union.
Chart 7 Net FDI
(EUR bn)
Chart 8 FDI composition by sector
(% of inflow)
2.5 2.5 2.1 1.1 3.3 0.8 1.3 1.2 1.8 1.9 2.4 2.6 2.5
0,0
0,5
1,0
1,5
2,0
2,5
3,0
3,5
2007 2008 2009 2010 2011 2012 2013 2014 2015 2016 2017 2018* 2019*
7.4%
6.7%
3.8%
9.9%
* NBS forecast
2.4%
3.8%
5.4%
3.7%
8.6%of GDP
5.5%
6.6%6.6%
5.8%
1726
3411
2113
35
23 20
176 15
21 2419
0
20
40
60
80
100
2005-2008 2009-2012 2013-2017
Other Construction & real estate Finance Trade Manufacturing
6

CAD More Than Fully Covered by FDI
Export growth in line with expectations... …but investment-related imports will keep
CAD unchanged in 2018
• During four months of 2018, goods exports retained their
momentum, with the highest contribution coming from
manufactured goods.
• Manufacturing exports growth of 11.0% y-o-y was diversified
among all branches (22 of 23 branches recorded growth).
• Services expansion continued, as their exports growth
accelerated to 16.4% y-o-y, led by ICT and business
services, followed by tourism and transportation.
• Due to ongoing investment cycle, imports of goods
outpaced exports, growing 13.2% y-o-y, of which about ¾ is
accounted for imports of capital and intermediate goods.
• Last year saw an increase in CAD / GDP ratio, due to
imports of capital and intermediate goods related to
investment activity, as well as due to supply-side shocks
in energy sector and agriculture.
• In 2018 we expect CAD share in GDP to remain on the
same level as in 2017, which is in line with accelerating
investments, consumption recovery, further exports
growth, as well as higher oil price.
• In the medium term, we expect the CAD to be around 4-
5% of GDP, while FDI inflows will remain more than
sufficient to cover the CAD.
Chart 9 Exports and imports
(seasonally adjusted, 2008=100)
Chart 10 Current account deficit, FDI and remittances
(% share in GDP)
40%
50%
60%
70%
80%
90%
60
80
100
120
140
160
180
200
220
240
12008
4 71012009
4 71012010
4 71012011
4 71012012
4 71012013
4 71012014
4 71012015
4 71012016
4 71012017
4 71012018
4
Exports, lhs
Imports, lhs
X/M coverage (12M MA), rhs
*12-month moving average
7

Favorable Fiscal Trends Continuing in 2018
Strong fiscal adjustment since 2015 of around
8pp …
…resulted in a decline in the public debt-to-
GDP ratio and its stable downward path
• Fiscal balance switched to a surplus of 1.2% of GDP in
2017 (the first surplus on record since 2005), with a primary
surplus of 3.9% of GDP.
• A surplus of 0.4% of GDP was posted for Q1 2018 on the
back of continued growth in tax revenues, while CAPEX
also saw strong growth in line with government intention to
support economic growth.
• Public investments in Q1 grew at a triple digit growth rate,
doubling its share in GDP and adding 1.6pp to GDP growth
in Q1. Further increasing the share of public investments
remains a top priority of fiscal policy in the coming period.
• Central government debt amounted to 58.6% of GDP at
end-April 2018 (compared to 61.5% at end-2017).
• Measures to continue the structural adjustment include
reforms of public enterprises and further improvements in
efficiency of the Tax Administration.
• The Government’s Fiscal Strategy for the coming years
entails a medium-term deficit target of 0.5% of GDP,
consistent with steady debt reduction path, job creation,
and policies to enhance growth through structural reforms
and further improvement of business environment.
Chart 11 Fiscal revenues, expenditures and result
(% share in GDP)
Chart 12 Public debt (central government)
-1.9-2.6
-4.4 -4.6 -4.8
-6.8
-5.5
-6.6
-3.7
-1.3
1.20.4
-9
-7
-5
-3
-1
1
3
5
7
30
35
40
45
50
55
2007 2008 2009 2010 2011 2012 2013 2014 2015 2016 2017 2018Q1
Primary balance, rhs Fiscal balance, rhs
Revenues, lhs Expenditures, lhs
overall balance:
0
10
20
30
40
50
60
70
80
0
2
4
6
8
10
12
14
16
Q12014
Q2 Q3 Q4 Q12015
Q2 Q3 Q4 Q12016
Q2 Q3 Q4 Q12017
Q2 Q3 Q4 Q12018
External, lhs Internal, lhs
% of GDP, rhs
EUR bn in % of GDP
8

Improved Structural Competitiveness Provided Additional Boost to Overall Macroeconomic Performance
Key deliverables:
Law on Planning and Construction (2014) and Law on Investment (2015) – streamlined construction permit procedures (one-stop-shop and
electronic construction permits), doubling the number of construction permits and increasing the share of construction in GDP. Construction
sector was the main contributor to faster than expected GDP growth in Q1 2018.
New Labor Law (2014) – improved flexibility and job creation. On top of that, the National Employment Strategy & Reform Program improved
job matching services and training and provided subsidies to disadvantaged people and self-employment. Reforms resulted in an increase in
private sector employment by around 170 thousand people (12.7%), almost half of which in manufacturing industry, followed by private sector
services and recently in construction sector as well..
Tax Administration reform – led to a significant increase in revenue collection and better than planned fiscal results.
NPL Resolution Strategy (NBS and government action plans) – the share of NPLs declined two and a half times (from 22.2% in August 2015
to 8.8 % in April 2018). Narrowing was most evident with corporates – the share of NPLs was reduced from 25.9% in 9.6% in the same period.
Private bailiff system (2013) and New Bankruptcy Law (2014).
Key reform areas in the last three years:
Construction sector;
Labor market;
Tax administration;
Financial sector;
Contract enforcement and resolving insolvency.
9
0
50
100
150
200Overall rank
Starting a business
Dealing with constructionpermits
Getting electricity
Registering property
Getting creditProtecting minority
investors
Paying taxes
Trading across borders
Enforcing contracts
Resolving insolvency
2015. 2016. 2017. 2018
Source: World Bank, Doing Business Report
Chart 13 Indicators on business regulation
(rank, lower value means rank improvement)

Key Policy Rate Unchanged After Easing in March and April
The key policy rate kept on hold in June FX required reserve ratio has remained
unchanged since early 2016
• NBS kept the key policy rate at 3% in May and June, guided
by the expected movement in inflation, its underlying factors
going forward, and the effects of past monetary policy
easing.
• Uncertainty in global commodity markets, primarily in terms
of oil prices and prices of agricultural commodities, diverging
policies of the Fed and ECB, as well as geopolitical tensions,
mandates caution in the conduct of monetary policy.
• NBS pointed out that the resilience of the Serbian economy
to potential adverse effects from the international
environment has increased, owing to improved
macroeconomic fundamentals and a more favorable outlook
for the period ahead.
• Last time FX RR ratio was reduced in early 2016 aiming
to support lending activity (to 20%/13%, for liabilities up
to/over 2Y).
• RR is important monetary policy tool (in May 2018 RR
amounted to EUR 1.7 bn and RSD 159.8bn).
• NBS uses RR as an important macroprudential tool within
dinarisation strategy:
- by applying lower RR ratio on dinar vs FX sources,
- by applying remuneration at higher rate on dinar RR vs
FX RR (i.e. 1.25% on RSD RR, while no remuneration is
applied on FX RR).
Chart 14 Interest rates
(y-o-y rates, in %)
Chart 15 Reserve requirement ratios
(in %)
9.0
3.02.4
0
2
4
6
8
10
12
14
16
18
20
22
24
26
12009
4 71012010
4 71012011
4 71012012
4 71012013
4 71012014
4 71012015
4 71012016
4 71012017
4 71012018
4
Private Sector* (3 months moving average)Policy RateDeposit FacilityLending FacilityBELIBOR 1W
*weighted interest rate on non-indexed RSD loans (up to September 2010 the data was exclusively used for research purposes of NBS)
26.0
29.0
20.0
5.0
22.019.0
13.0
0.00
10
20
30
40
50
12011
3 5 7 91112012
3 5 7 91112013
3 5 7 91112014
3 5 7 91112015
3 5 7 91112016
3 5 7 91112017
3 5 7 91112018
3 5
FX <2y
RSD <2y
FX >2y
RSD >2y
10
The Effects of the NBS Monetary Policy are Reflected in Credit Growth
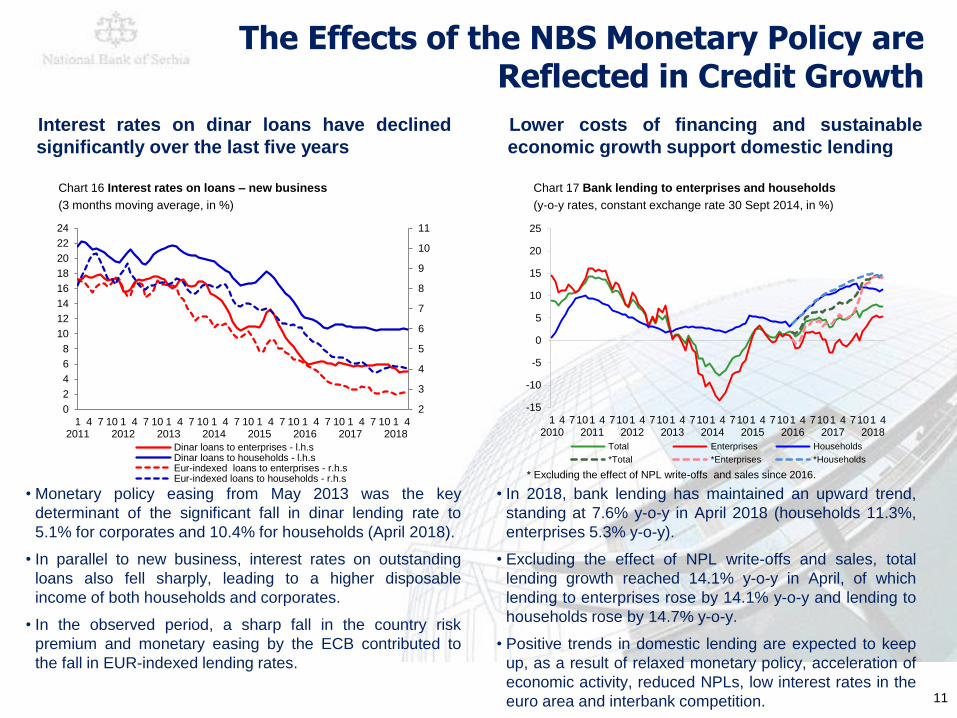
Interest rates on dinar loans have declined
significantly over the last five years
Lower costs of financing and sustainable
economic growth support domestic lending
• Monetary policy easing from May 2013 was the key
determinant of the significant fall in dinar lending rate to
5.1% for corporates and 10.4% for households (April 2018).
• In parallel to new business, interest rates on outstanding
loans also fell sharply, leading to a higher disposable
income of both households and corporates.
• In the observed period, a sharp fall in the country risk
premium and monetary easing by the ECB contributed to
the fall in EUR-indexed lending rates.
• In 2018, bank lending has maintained an upward trend,
standing at 7.6% y-o-y in April 2018 (households 11.3%,
enterprises 5.3% y-o-y).
• Excluding the effect of NPL write-offs and sales, total
lending growth reached 14.1% y-o-y in April, of which
lending to enterprises rose by 14.1% y-o-y and lending to
households rose by 14.7% y-o-y.
• Positive trends in domestic lending are expected to keep
up, as a result of relaxed monetary policy, acceleration of
economic activity, reduced NPLs, low interest rates in the
euro area and interbank competition.
Chart 16 Interest rates on loans – new business
(3 months moving average, in %)
Chart 17 Bank lending to enterprises and households
(y-o-y rates, constant exchange rate 30 Sept 2014, in %)
2
3
4
5
6
7
8
9
10
11
0
2
4
6
8
10
12
14
16
18
20
22
24
12011
4 7 10 12012
4 7 10 12013
4 7 10 12014
4 7 10 12015
4 7 10 12016
4 7 10 12017
4 7 10 12018
4
Dinar loans to enterprises - l.h.sDinar loans to households - l.h.sEur-indexed loans to enterprises - r.h.sEur-indexed loans to households - r.h.s
-15
-10
-5
0
5
10
15
20
25
12010
4 71012011
4 71012012
4 71012013
4 71012014
4 71012015
4 71012016
4 71012017
4 71012018
4
Total Enterprises Households
*Total *Enterprises *Households
* Excluding the effect of NPL write-offs and sales since 2016.
11
Sustainable Economic Prospects Confirmed by Serbia’s Improved Rating
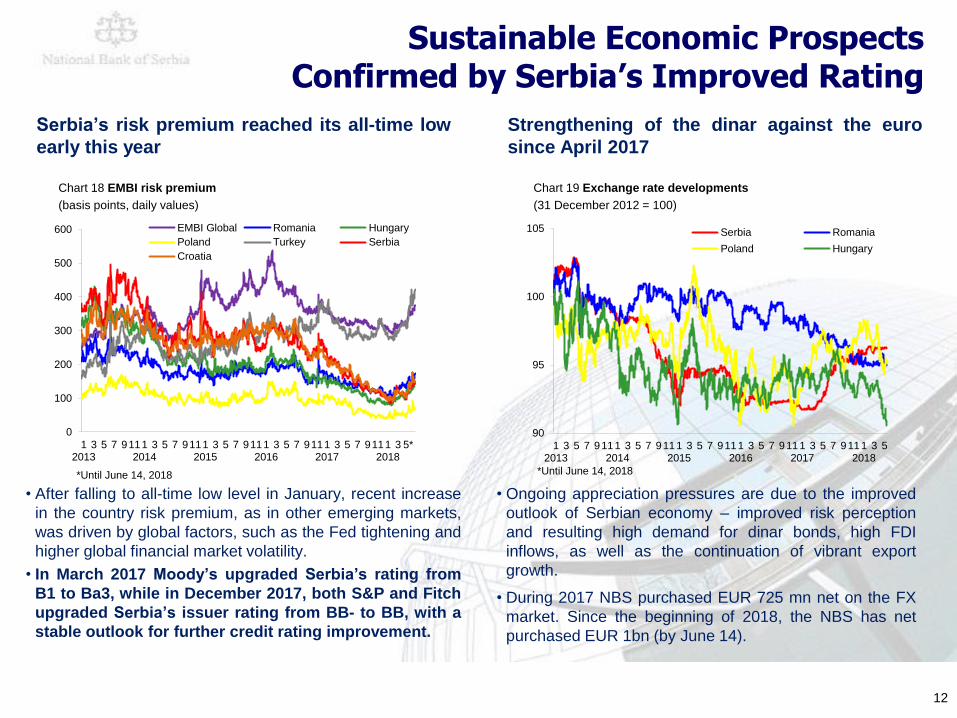
Serbia’s risk premium reached its all-time low
early this year
Strengthening of the dinar against the euro
since April 2017
• After falling to all-time low level in January, recent increase
in the country risk premium, as in other emerging markets,
was driven by global factors, such as the Fed tightening and
higher global financial market volatility.
• In March 2017 Moody’s upgraded Serbia’s rating from
B1 to Ba3, while in December 2017, both S&P and Fitch
upgraded Serbia’s issuer rating from BB- to BB, with a
stable outlook for further credit rating improvement.
• Ongoing appreciation pressures are due to the improved
outlook of Serbian economy – improved risk perception
and resulting high demand for dinar bonds, high FDI
inflows, as well as the continuation of vibrant export
growth.
• During 2017 NBS purchased EUR 725 mn net on the FX
market. Since the beginning of 2018, the NBS has net
purchased EUR 1bn (by June 14).
Chart 18 EMBI risk premium
(basis points, daily values)
Chart 19 Exchange rate developments
(31 December 2012 = 100)
12
0
100
200
300
400
500
600
12013
3 5 7 91112014
3 5 7 91112015
3 5 7 91112016
3 5 7 91112017
3 5 7 91112018
3 5*
EMBI Global Romania Hungary
Poland Turkey Serbia
Croatia
*Until June 14, 2018
90
95
100
105
12013
3 5 7 91112014
3 5 7 91112015
3 5 7 91112016
3 5 7 91112017
3 5 7 91112018
3 5
Serbia Romania
Poland Hungary
*Until June 14, 2018

Dinarisation of Corporate and Household Sector is on the Rise
Macroeconomic stability contributing to
dinarisation process
Dinar loans have been issued to household
sector to a greater extent
• NBS stimulates the dinarisation process by delivering low
and stable inflation, preserving stability of dinar exchange
rate, enhancing management of foreign currency risks and
exposures in the private sector, and using other measures.
• The Government contributes to dinarisation through tax
policy, by developing the dinar securities market (dinar debt
share rose from 2.5% in 2008 to 24.4% in April 2018), and
by extending maturity of dinar yield curve to 10 years.
• Dinarisation of the corporate and household sector deposits
currently stands at 30.5% (up by 11.2 pp compared to end-
2012). Dinarisation of the corporate and household sector
receivables stands at 32.7% (up by 4.7 pp).
• Over the past several years, dinarisation of household
receivables had a firm upward trend – an upsurge from
35.1% (2012) to 52.3% (April 2018). This positive trend is
a result of a sharp drop in dinar interest rates, low and
stable inflation, as well as other NBS measures aimed to
support dinarisation.
• Dinarisation process is additionally supported by the
issuance of the first dinar bond by EBRD (December
2016).
Chart 20 Dinarisation of the corporate and household sector
receivables and deposits, and dinar share of public debt
(in %)
Chart 21 Dinarisation of corporate and household sector
(outstanding amounts in %)
30.5
32.7
24.4
15
20
25
30
35
12013
4 7 10 12014
4 7 10 12015
4 7 10 12016
4 7 10 12017
4 7 10 12018
4
Corporate and household sector deposits, outstanding amounts
Corporate and household sector receivables, outstanding amounts
Dinar share of public debt
0
20
40
60
Corporate sectordeposits
Household sectordeposits
Corporate andhousehold sector
deposits
Corporate sectorreceivables
Household sectorreceivables
Corporate andhousehold sector
receivables
2013 2015 2017 April 2018
13

Traditional Banking Mostly Financed by Domestic Deposits
Adequate structure of banking sector assets
Improving the quality of the banking sector
assets
• The risk aversion during the crisis led to more intensive
investments in low-risk state securities, which after 2015.
stabilized at around of one-fifth of the total banking sector
net assets (19.4% at the end of April 2018).
• In spite of the historical low levels of deposit rates, stability
of retail and corporate deposits in funding mix is present,
with share in total liabilities of 48% and 25%, respectively at
the end of April 2018.
• Despite high euroization of the loan portfolio, currency
matching of assets and liabilities is present, with net open
position of 3.9% of regulatory capital at end-April 2018.
• Implementation of NPLs resolution measures together
with the growth of credit activity led to a significant
improvement of banks portfolio quality. The share of NPLs
decreased to the lowest level since the 2008 when the
definition and reporting requirements were introduced.
• At the end of April 2018, the NPL ratio was 8.8%, with the
maintenance of relatively high coverage by both, IFRS
provisions (61.4%) and regulatory reserves (141.4%).
• The main channels for the NPLs reduction remained the
write-off and transfer (sale) to third parties, with increasing
contribution of repayment.
Chart 22 Structure of banking sector assets
(RSD bn)
Chart 23 Asset quality – Non-performing loans (NPL)
(RSD bn, %)
14.7%
19.4%
61.7%
4.1%
0
500
1.000
1.500
2.000
2.500
3.000
3.500
2011 2012 2013 2014 2015 2016 2017 (2018)Apr
Cash and assets with central bank Securities Loans Other
47%
68%
61%
273.5
345.8
185.0
16.9%
17.0%
8.8%
0%
5%
10%
15%
20%
25%
0
100
200
300
400
500
600
700
2010 2011 2012 2013 2014 2015 2016 2017 2018(Apr)
IFRS coverage Gross NPL NPL ratio, rhs
14
Source: NBS Source: NBS

Conservative Framework Contributed to the Banking Sector Resilience to Shocks
High banking sector capitalisation as a result
of strong prudential measures
Serbian banking sector is highly liquid
• Banks possess significant capital reserves, which enable
them to successfully deal with credit risk even in the case of
worst-case stress scenario.
• In addition to the high level, the capitalization of the banking
sector is characterized by a strong structure, with CET1
over 95% of total capital.
• The high solvency of the banking sector is also indicated by
the leverage ratio, introduced in regulatory framework of the
Republic of Serbia with Basel III implementation, which at
the end of March 2018 amounted 11.1%.
• Liquidity ratios are constantly at levels significantly higher
than the regulatory minimum.
• Liquid assets account for around 36.8% of the total assets
of the banking sector in April 2018.
• The loan to deposit ratio that at the end of April 2018
amounted 93.8%, indicates stability of funding and in
general the liquidity of the banking sector.
Chart 24 Capitalization of the Serbian banking sector
(%)
Chart 25 Liquidity indicators of the Serbian banking sector
22.7121.78
21.71
0
5
10
15
20
25
2011 2012 2013 2014 2015 2016 2017 2018(Mar)
Total capital ratio Tier 1 to RWA CET1 ratio
15
Source: NBS Source: NBS

16
Structural slides

Fall in the Headline Inflation in Early 2018 Driven Mainly by High-Base Effect in Food and Energy Prices
Chart 26 Contributions of CPI components to y-o-y inflation
(y-o-y rates, pp)
• Historically, short-term volatility of headline inflation was mainly driven by food prices.
• Core inflation is at level of 0.8% for the third consecutive month, which is all-time low.
17
2.1
0.8
-4
0
4
8
12
16
12010
3 5 7 9 11 12011
3 5 7 9 11 12012
3 5 7 9 11 12013
3 5 7 9 11 12014
3 5 7 9 11 12015
3 5 7 9 11 12016
3 5 7 9 11 12017
3 5 7 9 11 12018
3 5
Energy ServicesIndustrial products excl. food and energy Processed foodUnprosessed food CPI InflationTolerance Band Inflation Target

GDP Growth More Sustainable than Pre-Crisis
Pre-crisis GDP growth was driven by
consumption, the trend reversed after the
crisis in favour of investments and exports
GDP composition has shifted towards less
consumption and more net exports and
investments
• Prior to the crisis, high capital inflows led to consumption-
based growth which resulted in increased external
imbalances. With the first wave of the crisis, this trend
reversed. Growth was slower, but more sustainable and
driven by net exports and investments.
• Large-scale investments in the automobile and oil industries
(2011–2012) have helped the economy to rebalance.
• The new investment cycle that began in 2015 is more
diversified, and is leading to further rebalancing of the
economy and sustainable growth.
• As a consequence of the crisis, the share of private
consumption in GDP is declining, bringing painful but
necessary adjustments.
• The EU accession process and euro area recovery, as
well as improvement of the investment and business
climate, led to an increase in tradable sector FDIs,
contributing to a more favourable GDP composition.
• Successful fiscal consolidation and structural reforms
created a foundation for healthy growth and freed up
growth potential.
Chart 27 Contributions to real GDP growth
(y-o-y rates, pp)
Chart 28 GDP composition
(share in GDP)
5.54.9
5.9
5.4
-3.1
0.61.4
-1.0
2.6
-1.8
0.82.8 1.9
3.5
-16
-12
-8
-4
0
4
8
12
16
20
2005 2006 2007 2008 2009 2010 2011 2012 2013 2014 2015 2016 2017 2018*
NX G
I C
CII GDP
* NBS forecast
73.2%
76.9%74.6%
75.0% 74.7%73.4% 73.4%
-15.6%
-17.5%-12.4% -13.3%
-14.0%
-13.5%-15.1%
-40%
-20%
0%
20%
40%
60%
80%
100% C I G CII NX
* NBS forecast
18

Further Recovery in the Labour Market
Growth in participation rate marked overall
labor market movements in Q1 2018
Growth in productivity of the total economy
continued in Q1 in 2018
• According to the Labour Force Survey for Q1 2018,
employment rate was 45.1%, up by 0.9 pp compared to Q1
2017. Largest employment gains were recorded in industry.
• Such movements were enabled by participation rate which
grew from 64.0% in Q1 2017, to 65.8% in the first quarter of
this year. Unemployment rate stood at 14.8%.
• Favourable trends in the formal segment of the labour
market in the previous period came from private sector
employment which grew by 12.7% (April 2018 / April 2014).
This increase in number of employees came, by and large,
from manufacturing, followed by private sector services and
most recently by construction.
• GDP growth in Q1 2018 (4.6% y-o-y) exceeded average
growth of employment (3.3% y-o-y), leading to a further
increase in productivity of the overall economy.
• In the last three years, the highest growth in productivity
has been recorded in manufacturing branches with the
largest FDI inflows - steel, chemical and pharmaceutical
industries, as well as in rubber and plastics industry.
• Productivity growth in the same period is also noticeable
in production of machinery and equipment, as well as in
production of beverages.
Chart 29 Labour market indicators according to the Labour
Force Survey, (in %)
Chart 30 Developments of productivity in total economy
(growth rates, in %)
-4
-2
0
2
4
6
8
2001 - 2008 2009 - 2012 2013 - 2014 2015 - 2017 Q12018Total economy production movement
Formal employment in total economyProductivity in total economy
Source: Statistical Office Republic of Serbia, Central Registry of Compulsory Social Insurance, NBS calculation.
19

20
Chart 31 Imports by country in Jan - Apr 2018
(EUR mn)
Chart 32 Exports by country in Jan - Apr 2018
(EUR mn)
Chart 33 External Demand Indicator
(long-term average = 100)
Chart 34 Real Effective Exchange Rate
(2005=100)
Improved External Position Owing to the Recovery of External Demand and Improved Supply of Exports
13.1% of totalimports
9.7%
8.7% 8.2%
5.3%
4.0% 3.7%3.0% 2.9% 2.7%
0
100
200
300
400
500
600
700
800
900
1000
GER ITA RUS CHN HUN TUR PL RO FRA SLO
14.1% of totalexports
12.5%
7.8%
4.7%
5.7%
4.2%3.8% 3.8% 3.7% 3.6%
0
100
200
300
400
500
600
700
800
ITA GER BH RUS ROM MNE BUG HUN SLO MKD
100
105
110
115
120
125
130
135
140
12010
4 71012011
4 71012012
4 71012013
4 71012014
4 71012015
4 71012016
4 71012017
4 71012018
4
*Growth indicates appreciation.
60
70
80
90
100
110
120
71012009
4 71012010
4 71012011
4 71012012
4 71012013
4 71012014
4 71012015
4 71012016
4 71012017
4 71012018
4
Source: European Commission,NBS

Legal Framework for Banking Supervision
Domestic regulatory framework for banking supervision is based on Basel III standards:
Set of by-laws implementing these standards on individual and consolidated level are applied as of 30
June 2017;
Since July 2017 further steps on harmonization of domestic legal framework with Basel III were made;
The main goals of implementing these standards are to increase the resilience of the banking sector
by enhancing the quality of capital and introducing capital buffers, to increase the efficiency of
monitoring and controlling banks’ exposure to liquidity risk, further strengthening of the market
discipline and transparency of banks’ operation in the Republic of Serbia by publishing all relevant
information on bank operation, as well as to bring the reporting system in line with the new regulatory
arrangements
So far no issues have been identified in the application of Basel III standards;
NBS will continue to take regulatory activities in order to ensure alignment with EU acquis.
In December 2017 regulation governing risk management by banks was amended with aim to improve
the way bank deals with risks and enhance its Internal Capital Adequacy Assessment Process (ICAAP).
Accounting and prudential regulations were timely adjusted in order to enable the implementation of IFRS
9 in banks from 1st of January 2018.
Additionally, cooperation with supervisors of the home countries of banks present in Serbia is continuously
developing and strengthening and regular communication with the ECB and EBA is maintained.
21
Efforts on NPL Resolution
On 13 August 2015, the Government adopted the national NPL Resolution Strategy. In addition, both the
Government and the National Bank of Serbia adopted action plans in order to fulfil strategic objectives
In the previous period, the NBS carried out all activities envisaged by its Action Plan aimed primarily at the
enhancement of banks’ capacities to resolve NPLs. In line with this plan, the NBS:
Published the Guidelines for implementation of IAS 39;
Enhanced the reporting of NPLs by banks;
Conducted an analysis regarding NPL market obstacles and limitations;
Established a database on real estate collateral valuations and loans approved based on reported
collateral;
Introduced additional requests for banks regarding monitoring of collateral and engagement of persons that
evaluate that collateral;
Strengthened the regulatory treatment of restructured receivables in order to encourage sustainable
restructuring practices and prevent the unsustainable refinancing practices (evergreening);
The distressed asset management in banks has been improved by introducing additional requirements for
banks in the context of strategic planning;
Published the Guidelines for Disclosure of Bank Data and Information Related to the Quality of Assets for
Banks
Other activities envisaged by the Strategy are under the competence of ministries (finance, economy, justice and
construction), as well as the Deposit Insurance Agency.
Although NBS Action Plan was accomplished, NBS undertakes additional regulatory steps aiming to encourage
the banks to resolve NPLs more efficiently and to establish a system that will prevent the accumulation of NPLs:
Introducing the obligatory write-offs of NPLs which are fully impaired;
Prescribing regulatory treatment of particular undesirable transactions related to NPLs.
Taking in account specificities of the domestic market and carefully considering activities of EU bodies and
institutions in this field NBS will continue to make regulatory efforts on NPL resolution.
22

NPL Resolution Required a Systemic Approach – and, as Such, Gave Results
• NPL development after the adoption of the NPL
Resolution Strategy, especially in 2017,
confirmed the soundness of the inter-
institutional and coordinated approach
envisaged by the Strategy.
• After 2017 record drop in share of NPLs of 7.2
pp, noticeable downward trend continued in
2018, resulting at end of April 2018 with two
and a half times lower NPL ratio than it was at
the time of Strategy adoption.
• Fall was widespread and recorded in all
sectors, of which most prominent was within the
construction.
• The continuation of NPL resolution efforts by
banks together with the recovery of credit
activity, should further stimulate the decrease in
the share of NPLs.
23
Gross
loans
(EUR bn)
Gross
NPL
(EUR bn)
NPL
ratio
(%)
Corporates 8.0 0.8 9.6
Households 7.9 0.4 5.4
of which:
natural persons7.1 0.4 5.2
Corporates in
bankruptcy
proceedings
0.3 0.3 98.8
Other 1.8 0.4 20.9
Total 17.7 1.6 8.8
NPL data,
April 2018

Capital Buffers – Implementation of Macroprudential Policy Measures
24
• Capital buffers increase the resilience of banks to losses, reduce excessive or underestimated exposures
and restrict the distribution of capital.
• These macroprudential instruments should limit systemic risks in the financial system, which can be
cyclical (capital conservation buffer and countercyclical capital buffer) or structural (capital buffer for a
systemically important bank and systemic risk buffer).
• The following capital buffers are used in the Republic of Serbia:
– Capital conservation buffer;
– Countercyclical capital buffer , in order to mitigate and prevent excessive credit growth;
– Capital buffer for a systemically important bank, with the objective to limit the systemic impact of
misaligned incentives in terms of favoring certain financial institutions;
– Systemic risk buffer, introduced to limit the risk of euroisation, one of the key structural non-cyclical
systemic risks to the stability of the financial system of the Republic of Serbia.
• The capital conservation buffers may consist only of Common Equity Tier 1 capital equal to 2.5% risk-
weighted assets for capital conservation buffer, 1% or 2% risk-weighted assets for capital buffer for
systemically important banks, depending on the systemic importance level and 3% of total foreign
currency and foreign currency-indexed placements of a bank approved to corporates and households in
the Republic of Serbia for systemic risk buffer. Countercyclical buffer rate is set at 0%.
• Capital buffers apply as of 30 June 2017.

Serbia’s Economic Outlook
25
2008 2009 2010 2011 2012 2013 2014 2015 2016 2017 2018 2019
Real GDP, y-o-y % 5,4 -3,1 0,6 1,4 -1,0 2,6 -1,8 0,8 2,8 1,9 3,5 3,5
Private consumption, in % 6,1 -0,2 -0,5 0,9 -2,0 -0,6 -1,3 0,5 1,0 1,8 3,3 2,9
Private investment,1 in % 14,6 -23,7 -7,9 7,3 14,3 -7,7 -5,8 4,3 2,2 8,7 7,3 3,9
Government, in % -0,4 -4,4 0,1 -0,5 2,8 -6,4 0,9 0,3 4,9 -0,2 4,1 2,7
Exports, in % 9,4 -6,9 15,0 5,0 0,8 21,3 5,7 10,2 12,0 9,8 10,7 9,5
Imports, in % 12,0 -19,6 4,4 7,9 1,4 5,0 5,6 9,3 9,0 10,7 9,9 7,5
Unemployment Rate, in %4 13,6 16,1 19,2 23.0 23.9 22.1 19,2 17,7 15,3 13,5 n/a n/a
Nominal Wages, in %5 18,0 9,0 7,6 11,2 9,0 6,2 1,4 -0,2 3,7 3,9 n/a n/a
Money Supply (M3), in % 9,8 21,5 12,9 10,3 9,4 4,6 7,6 6,6 11,6 3,6 n/a n/a
CPI,2 in % 8,6 6,6 10,3 7,0 12,2 2,2 1,7 1,5 1,6 3,0
National Bank of Serbia Key Policy Rate,3 in % 17,8 9,5 11,5 9,75 11,25 9.5 8,0 4,5 4,0 3,5 n/a n/a
Current Account Deficit BPM-6 (% of GDP) 21,2 6,6 6,8 10,9 11,6 6,1 6,0 3,7 3,1 5,7 5,7 5,0
¹ Excluding the effect of change in inventories
² Inflation f igures in the table represent Dec on Dec inflation: (Pt/Pt-12)*100-100
³ End of period data4 Labour Force Survey. Since 2014, data are revised according to the new LFS methodology. 5 Nominal w ages by the old methodology (Survey RAD-1).
Serbia
Chart 2
NBS forecast

Banking Sector Overview
26
April
2010 2011 2012 2013 2014 2015 2016 2017 2018
Number of banks1 33 33 32 30 29 30 31 29 28
Employees 29,887 29,228 28,394 26,380 25,106 24,257 23,847 23,055 23,125
Branches 2,487 2,383 2,243 1,989 1,787 1,730 1,719 1,627 1,615
HHI Assets 629 664 678 741 794 796 813 813 816
Share of foreign banks, % 73.5 74.1 75.2 74.3 74.5 76.1 76.7 76.9 76.0
Assets (net), EUR m 24,015 25,211 25,322 24,827 24,545 25,059 26,253 27,993 28,807
Capital, EUR m 4,720 5,104 5,198 5,186 5,074 5,090 5,122 5,631 5,624
Loans (gross), EUR m 15,324 17,204 17,273 16,140 16,170 16,175 16,442 17,565 17,687
Of which gross NPL, EUR m 2,592 3,275 3,217 3,448 3,483 3,491 2,800 1,730 1,565
Gross NPL ratio, % 16.9 19.0 18.6 21.4 21.5 21.6 17.0 9.8 8.8
IFRS impairment of NPLs 47.2 51.0 50.0 50.9 54.9 62.3 67.8 58.1 61.4
Deposits, EUR m 14,263 14,584 14,936 15,067 15,637 16,523 18,242 19,926 20,292
Pretax Income2, EUR m 241.0 12.0 102.5 -18.0 29.0 80.0 172.0 579.8 205.6
CAR3, % 19.9 19.1 19.9 20.9 20.0 20.9 21.8 22.6 22.7
CET1 ratio3,4, % - - - - - - - 21.6 21.8
Leverage4, % - - - - - - - 10.1 11.1
Liquidity ratio 1.0 2.2 2.1 2.4 2.2 2.1 2.1 2.0 2.2
Liquidity coverage ratio4, % - - - - - - - 239.5 228.4
FX ratio, % 3.9 6.2 5.5 4.4 3.9 4.4 2.7 2.9 3.9
ROA2, % 1.1 0.0 0.4 -0.1 0.1 0.3 0.7 2.1 2.2
ROE2, % 5.4 0.2 2.0 -0.4 0.6 1.6 3.4 10.6 11.0
Net interest margin5, % 4.6 4.6 4.3 4.2 4.3 4.3 3.9 3.7 3.7
5 Net interest margin to average total asset
Serbia
1 The NBS revoked operating licence from Nova Agrobanka on 27 October 2012, from Razvojna banka Vojvodine on 6 April 2013, from Privredna banka Beograd on 26 October 2013, from
Univerzal banka Beograd on 31 January 2014 and from Jugobank Jugbank Kosovska Mitrovica on 2 April 2018. The NBS issued operating licence to Mirabank on 16 December 2014 and the
bank started its operations in April 2015. The NBS issued operating licence to Bank of China Srbija on 20 December 2016. The Findomestic bank w as merged to Direktna bank on 1 July, 2017.
Jubanka ad Beograd w as merged to AIK banka on 23 Decembar, 2017.
2 Without Agrobanka at the end of 2011: Pretaxprofit€296m; ROA 1.2; ROE 6.0. Without Razvojna banka Vojvodina at the end of 2012: Pretaxprofit€230m; ROA 1.0; ROE 4.7
3 Thеlast available data of 31 March 20184 Introduced by the implementation of Basel 3 and monitored from 30 June 2017