national reporting through my school delivering … performers and successful...please cite this...
TRANSCRIPT
Please cite this publication as:
OECD (2012), Delivering School Transparency in Australia: National Reporting through My School, Strong Performers and Successful Reformers in Education, OECD Publishing. http://dx.doi.org/10.1787/9789264175884-en
This work is published on the OECD iLibrary, which gathers all OECD books, periodicals and statistical databases. Visit www.oecd-ilibrary.org, and do not hesitate to contact us for more information.
isbn 978-92-64-17563-1 98 2012 07 1 P -:HSTCQE=V\Z[XV:
strong Performers and successful Reformers in Education
Delivering school Transparency in AustralianATionAl REPoRTing ThRough My school
This case study describes the policy-making process in Australia leading to the public release of information on every school in Australia through the My School website. Policy lessons are described to provide insight for OECD member countries which may be grappling with similar issues in developing school accountability systems, particularly those working within federal-state contexts.
While some of the lessons from this policy development and implementation process relate specifically to Australia’s circumstances, there are general policy prescriptions of broader interest to other countries seeking to improve school education through measurement and reporting of key factors of school operations and performance.
contentsChapter 1. The policy challenge of delivering school transparency
Chapter 2. Policy background
Chapter 3. Decision making
Chapter 4. My School website launched
Chapter 5. Conclusion
stro
ng
Perfo
rmers an
d s
uccessfu
l Refo
rmers in E
du
cation D
elivering
sch
oo
l Transp
arency in A
ustralia
strong Performers and successful Reformers in Education
Delivering school Transparency in AustralianATionAl REPoRTing ThRough My school
982012071cov.indd 1 21-Jun-2012 2:25:51 PM


DELIVERING SCHOOL TRANSPARENCYIN AUSTRALIA
NatioNal reportiNg throughMy School
Photo credits: Fotolia.com © Ainoa Getty Images © John Foxx
Corrigenda to OECD publications may be found on line at: www.oecd.org/publishing/corrigenda.
© OECD 2012
You can copy, download or print OECD content for your own use, and you can include excerpts from OECD publications, databases and multimedia products in your own documents, presentations, blogs, websites and teaching materials, provided that suitable acknowledgment of OECD as source and copyright owner is given. All requests for public or commercial use and translation rights should be submitted to [email protected]. Requests for permission to photocopy portions of this material for public or commercial use shall be addressed directly to the Copyright Clearance Center (CCC) at [email protected] or the Centre français d’exploitation du droit de copie (CFC) at [email protected].
This work is published on the responsibility of the Secretary-General of the OECD. The opinions expressed and arguments employed herein do not necessarily reflect the official views of the Organisation or of the governments of its member countries.
Please cite this publication as: OECD (2012), Delivering School Transparency in Australia: National Reporting through My School, OECD Publishing.http://dx.doi.org/10.1787/9789264096660-en
ISBN 978-92-64-17563-1 (print)ISBN 978-92-64-17588-4 (PDF)
Foreword
DELIVERING SCHOOL TRANSPARENCY IN AUSTRALIA: NATIONAL REPORTING THROUGH MY SCHOOL © OECD 2012 3
The launch of the My School website (www.myschool.edu.au) on 28 January 2010 forms part of a set of major reforms to Australia’s national education system. The federal distribution of responsibility for schooling, and the Australian Government’s role in this, historically, has imposed significant limitations on the supply by government of genuinely national data about Australian schools to ministers and to the community. My School and full population national student assessments in literacy and numeracy have dramatically closed this data gap.
Several key factors were critical in achieving national school reporting through My School. Ministerial leadership and negotiation across federal-state lines was pivotal in gaining agreement from all states and territories to this Australian Government initiative. The Australian Government clearly articulated the rationale for making nationally comparable school information publicly available, and promoted greater flexibility for education expenditure in return for more accountability and transparency of outcomes through agreements which tied reporting of these outcomes to funding. Drawing on expertise in schooling and school performance from outside of ministers’ departments was critical. Identifying and researching models developed here and overseas enabled a key set of principles to be developed that drew on the strengths of different models but represented what would be suitable for the Australian system. By ensuring the policy details were based on scientific evidence provided by independent experts, political interests were prevented from driving the agenda. Agreement at the highest levels of government and a long-term vision for progressing this initiative, including through well-defined and adhered-to processes, also contributed to the success of My School. The preparedness to commit to a long term development process and manage opposition to the policy remains essential.
School transparency has also placed the broader community in the same position as education officials in having access to this new national data. My School presents school data in a way that places each school at the centre of the reports and is designed to avoid the misinterpretation that often arises with school league tables. Each school report on My School contains national data in three key areas: school operating context; school performance; and school resources. This policy design is aimed at providing the community with a complete set of information on each school that enables proper interpretation of school achievement. The only comparative performance data supplied are for groups of schools whose students come from similar family background, in recognition that family background influences school results as much as the school itself.


Table of Contents
DELIVERING SCHOOL TRANSPARENCY IN AUSTRALIA: NATIONAL REPORTING THROUGH MY SCHOOL © OECD 2012 5
Chapter 1 The policy challenge of delivering school Transparency ...............................................................7
Chapter 2 policy background ..........................................................................................................................................................................11• The Australian education system .............................................................................................................................................................................12• Introduction of the National Assessment Programme - Literacy and Numeracy ....................................................................12• Political support for better public access to comparative information about schools ........................................................14• Public debate about transparency ..........................................................................................................................................................................14
Chapter 3 decision making ...................................................................................................................................................................................21• Australia’s school reform agenda ............................................................................................................................................................................22• Mandate from the Council of Australian Governments .........................................................................................................................22• Education Ministers determined the policy details .....................................................................................................................................24• The key factors in policy making ............................................................................................................................................................................29
Chapter 4 my school websiTe launched...............................................................................................................................................33• Key features ...........................................................................................................................................................................................................................35• My School 2.0 .....................................................................................................................................................................................................................36• The future of My School ................................................................................................................................................................................................38
Chapter 5 conclusion ................................................................................................................................................................................................39• Policy lessons .......................................................................................................................................................................................................................40• My School underpins other school reforms .....................................................................................................................................................40
aNNeX a my school 2.0 page by page ..........................................................................................................................................................43
aNNeX B reporT on The generaTion of The 2010 index of communiTy socio-educaTional advanTage (icsea) .....................................................................................................................................................................................59

Table of ConTenTs
6 © OECD 2012 DELIVERING SCHOOL TRANSPARENCY IN AUSTRALIA: NATIONAL REPORTING THROUGH MY SCHOOL
BoxesBox 2.1 Managing opposition: Challenges and responses .................................................................................................................15
Box 3.1 My School: Australian Government and COAG Involvement .......................................................................................................................23
Box 3.2 My School: MCEECDYA Involvement ...................................................................................................................................................................24
Box 3.3 My School: Establishing the delivery capability for national school reporting ........................................................................................25
Box 3.4 School Profile ...............................................................................................................................................................................................................26
Box 3.5 Similar Schools ............................................................................................................................................................................................................26
Box 3.6 School Finances Full-time equivalent (FTE) enrolments (2009) ....................................................................................................................27
Box 3.7 NAPLAN Summary .....................................................................................................................................................................................................28
Box 3.8 Development of Australian System ........................................................................................................................................................................30
Box 4.1 Communication Strategy ..........................................................................................................................................................................................34
Box 4.2 Data released on the first, second, third and future versions of My School...........................................................................37
FIGUResFigure B1 ICSEA versus performance for Australian secondary schools ........................................................................................................................69
Figure B2 Histogram of the differences between direct and indirect parent data ICSEA values ............................................................................75
TABLesTable B1 Average school percentage response rates ..........................................................................................................................................................63
Table B2 Required response rates for a 95% confidence level, a population proportion of 25% and a confidence level of 3% .............64
Table B3 Confidence interval cut-off values .........................................................................................................................................................................65
Table B4 Proportions of parents in occupation, education categories and school performance - School average ........................................65
Table B5 Correlations between proportions of parents in occupation and education categories and school performance .......................66
Table B6 Variance explained by sets of parent variables with different average confidence intervals ...............................................................66
Table B7 Alternative regression solutions for direct parent data variables ..................................................................................................................67
Table B8 Alternative regression solutions for indirect parent data variables ..............................................................................................................68
Table B9 Comparison of absolute residuals about direct data and indirect data regression lines .......................................................................70
Table B10 Numbers and percentages of schools with confidence intervals equal to or less than 3.0% .............................................................70
Table B11 Medians for indirect and direct parent data scale deciles ..............................................................................................................................71
Table B12 Adjustment factors used to re-scale indirect scale values between adjacent decile medians ............................................................72
Table B13 Variance explained by direct, indirect and combined parent data scales ................................................................................................73
Table B14 Additional and total variance explained as additional variables are added .............................................................................................73
Table B15 Variables used in the construction of ICSEA in 2010 ......................................................................................................................................74
Table B16 Variables used in the construction of ICSEA in 2009 ......................................................................................................................................74
Table B17 ICSEA 2009-10 difference deciles .........................................................................................................................................................................75
Table B18 Average difference between direct and indirect parent data ICSEA values by school sector ..............................................................76
The Policy Challengeof Delivering School
Transparency
1
DELIVERING SCHOOL TRANSPARENCY IN AUSTRALIA: NATIONAL REPORTING THROUGH MY SCHOOL © OECD 2012 7
1The Policy challenge of delivering school TransParency
8 © OECD 2012 DELIVERING SCHOOL TRANSPARENCY IN AUSTRALIA: NATIONAL REPORTING THROUGH MY SCHOOL
This case study describes the policy-making process in Australia leading to the public release of information on every school in Australia through the My School website.
Policy lessons are described to provide insight for OECD member countries which may be grappling with similar issues in developing school accountability systems, particularly those working within federal-state contexts.
While some of the lessons from this policy development and implementation process relate specifically to Australia’s circumstances, there are general policy prescriptions of broader interest to other countries seeking to improve school education through measurement and reporting of key factors of school operations and performance.
The area of school accountability is notable for arousing strong opinions and producing strongly contested empirical findings from scientific work on what makes a difference to school outcomes. There is no way to avoid this in staking out a policy reform that has as its purpose the publication of sensitive information about schools.
This case study shows that difficult policy problems can be solved by marshalling the evidence, articulating a clear case for policy change, investing resources in improved measurement to provide high quality comparable data, understanding the broader public interest in better information, and providing strong political leadership to overcome what can be formidable opposition.
Australia historically has delivered high quality education to children in schools. This has continued to today with international benchmarking consistently showing Australia among the top performers. On average, and compared with other OECD countries, most Australian school children are performing well.
The performance of Australian schools in the Programme for International Student Assessment (PISA) has however dropped in recent times relative to that of other OECD countries:
•In the period between 2003 and 2006, Australia declined in both its absolute and relative performance in reading literacy. The 2009 results show that no further decline has occurred but the lost ground has not yet been regained.
•Australia has too long a “tail” of underperformance linked to disadvantage. The PISA results indicate that over the last nine years, the percentage of students who are less than proficient at reading or maths has not reduced.
•International testing also shows that the reading performance of Australian students at the high end of the achievement scale has declined between 2003 and 2006, and again between 2006 and 2009.
The “tail” of underperformance in Australian schools is concentrated amongst students from low socio-economic status (SES) families and Indigenous students. For example, the difference between Indigenous and non-Indigenous students in PISA mathematics and reading literacy is equivalent to more than two years of formal schooling. The difference between students from the lowest SES quartile and those in the highest is also more than two years of schooling in both reading literacy and mathematics. Australian students in schools in remote locations achieve at a level equivalent to a year and a half lower than their metropolitan counterparts in all PISA assessment areas.
Similarly, the 2009 National Assessment Programme - Literacy and Numeracy (NAPLAN) results showed that the majority of Australian students in Years 3, 5, 7 and 9 achieved or exceeded the national minimum standards in reading, writing and numeracy. However, levels of achievement amongst Indigenous students, and students living in very remote regions, remain significantly lower than the overall standard.
For example, the NAPLAN results for Indigenous very remote students in Year 7 numeracy showed that less than half met or exceeded the minimum standards in 2009. Forty-two per cent of Indigenous very remote students achieved the minimum standards in Year 7 numeracy compared to 58.7% of Indigenous remote students.
The international scientific literature shows that clear accountability for school results helps create a learning environment that encourages innovation and excellence from school leaders, teachers and students. Publishing school information also means that students, parents and teachers have the evidence they need to make informed decisions about student learning.
There is good evidence, primarily from the United States and PISA, that the publication of school-level test scores tends to improve the performance of all schools. The information permits the community to influence the quality of delivery of schooling.

1The Policy challenge of delivering school TransParency
DELIVERING SCHOOL TRANSPARENCY IN AUSTRALIA: NATIONAL REPORTING THROUGH MY SCHOOL © OECD 2012 9
Prior to the advent of My School, parents of school children were unable to understand the operations and achievements of their schools on common national definitions and measures. While ultimate responsibility for determining the standards and content of schooling rests with government, the families who fund and use the services (through taxes and private household contributions) play a key role in setting expectations. Without quality national data on delivery of schooling, this influence over delivery standards is constrained.
In addition to the needs of families who have children at school, there has been a long-term issue in Australia confronting successive federal education Ministers who lacked good data for policy. These ministers routinely received representations from different school system stakeholders presenting conflicting or inconsistent data to support claims for extra funding. There was no nationally-comparable data or single source of data on all schools to provide a basis for analysis for policy options and rational and equitable distribution of national resources.

Policy Background2
DELIVERING SCHOOL TRANSPARENCY IN AUSTRALIA: NATIONAL REPORTING THROUGH MY SCHOOL © OECD 2012 11
• The Australian education system ................................................................................... 12• Introduction of the National Assessment Programme - Literacy and Numeracy ............. 12• Political support for better public access to comparative information about schools ...... 14• Public debate about transparency ................................................................................. 14

2 Policy Background
12 © OECD 2012 DELIVERING SCHOOL TRANSPARENCY IN AUSTRALIA: NATIONAL REPORTING THROUGH MY SCHOOL
The AusTrAliAn educATion sysTem
Australia has a federal system of government comprising the Australian Government at the national level and eight state and territory governments. Under the Australian constitution, the state and territory governments are responsible for the delivery of schooling to all children of school age.
The Australian Government has limited legislative authority for schools under the Australian constitution. It does not own or operate any schools nor employ any teachers. The Australian Government’s role in school education is to provide national policy leadership to set delivery standards, drive school reform, fund innovation, ensure national performance measurement and reporting, and represent Australia in international school projects.
The states and territories own, operate and regulate around 6 800 schools. Non-government schools (Catholic and independent schools) operate under conditions determined by state and territory government registration authorities. The Catholic system operates approximately 1 700 schools and there are about 1 020 independent schools.
The eight state and territory education systems traditionally have each managed their own curricula and assessment and reporting procedures.
Funding for schools is provided by the Australian Government, state and territory governments, and households. The proportional distribution of funding for each school from these sources varies across school sectors.
Based on data published in the My School dataset, on average 80% of funding for government schools comes from the state government and 14% from the Australian Government, with 6% from private sources. For Catholic schools, 20% comes from the state government, 60% from the Australian Government and 20% from private sources including households. For independent schools, on average 13% comes from the state government, 34% from the Australian Government and 53% from private sources including households.
Two key intergovernmental forums exist in the Australian context that provided the formal mechanisms for policy making for My School:
•The Council of Australian Governments (COAG) - is the peak intergovernmental forum in Australia and comprises the Prime Minister, state Premiers, territory Chief Ministers and the President of the Australian Local Government Association.
•The Ministerial Council for Education, Early Childhood Development and Youth Affairs (MCEECDYA1) comprises Australian, state and territory and New Zealand education Ministers, and is the principal forum for developing national priorities and strategies for schooling.
inTroducTion of The nATionAl AssessmenT ProgrAmme - liTerAcy And numerAcy
Historically, each state and territory operated their own curriculum and assessments including their own literacy and numeracy tests. These were used to report against the national benchmarks by statistically aligning the state test results with a nominal national scale.
The Australian Government commenced in 2004 a concerted effort to develop national performance measures and reporting for the school system, with the inclusion in the Schools Assistance Act 2004 of requirements on schools and school systems and the state and territory governments to participate in the development and implementation of a variety of school and student performance measures and reports. The required level of reporting at this point was for each jurisdiction and for important sub-populations nationally such as SES groups and Indigenous students.
Education Ministers endorsed a common equating method to be used by all jurisdictions and a common standardised process for calculating and reporting of student achievement against the national benchmarks. While there was still no national curriculum or assessment at this stage, there were sufficient common elements in state curriculum to develop a national measurement framework.

2Policy Background
DELIVERING SCHOOL TRANSPARENCY IN AUSTRALIA: NATIONAL REPORTING THROUGH MY SCHOOL © OECD 2012 13
Australian Government legislation that provided funding to the states and territories for schooling required all government and non-government schools to participate in national common literacy and numeracy assessments at Years 3, 5, 7 and 9 by 1 January 2008. Receipt of funding was conditional upon participation in the national testing programme.
Education Ministers agreed in Council in 2005 that Australia would have genuinely national, rather than separate state and territory, full population literacy and numeracy assessments. Ministers agreed that the 2006-07 period be devoted to developing the national assessment instruments and the reporting scales, and the establishment of the model of operation to support the full implementation of the national testing regime in 2008 - to be called the National Assessment Programme - Literacy and Numeracy (NAPLAN).
This included the appointment of a group of assessment and measurement experts to provide advice on and guide the psychometric work. While each state and territory had expertise of this kind for their own assessment programmes, an important factor in the development of a high quality national assessment was that this expert advisory group was comprised of the very best scientists from Australia’s universities who had both a national and international reputation in the field.
This expert group developed the scales for each domain assessed, a key feature of which for each was a common assessment scale consisting of ten reported bands representing the increasing complexity of the skills and understandings assessed by NAPLAN from Years 3 to 9. This would allow the tracking of students’ progress in literacy and numeracy as they advanced through their schooling years.
The first NAPLAN tests were conducted in May 2008. For the first time a truly national picture for Years 3, 5, 7 and 9 showed the full range of student achievement and provided results by sex, Indigenous status, language background other than English, parental occupation and education, and geo-location (metropolitan, provincial, remote and very remote). These results provided valuable information to all education stakeholders from individual parents through to governments, policy makers and researchers, and an important and robust mechanism for highlighting where educational disadvantage existed most prominently.
Since then, NAPLAN has been conducted in the month of May each year. Reports are provided to parents on each student assessed, and a variety of national reports are released by ministers. More information is available at www.naplan.edu.au.
The development of NAPLAN provided some key policy lessons which informed the later move to national school level reporting, as well as the main performance data that would populate each school’s profile and allow comparisons between schools with students from similar backgrounds2 when the My School website was launched.
A defining feature of the success of the programme was the establishment of a group of independent experts to advise senior officials on the options for instrument development and the process for trialling test items and calibrating the national scale. This was crucial in an environment where each state and territory had a pre-existing test programme developed with advice from their own experts.
In 2007, nominations were sought from Australian Education System Officials Committee (AESOC) members and the peak non-government education bodies for the establishment of an independent Expert Advisory Group (EAG). The EAG was to provide expert research knowledge and technical advice on educational assessment and measurement to the steering group which was set up to oversee the introduction of national literacy and numeracy testing. Nominations were predominantly for people from universities, with areas of expertise ranging across psychometrics, educational assessment and measurement, and a number had internationally recognised work and/or international experience.
The EAG comprised five members who were independent of state and territory literacy and numeracy testing, which preceded the move to national testing. Most jurisdictions had a psychometric practitioner who managed their own test programme, including test development, marking, analysis and reporting of test results, either in-house or through contractors. An expert panel of preeminent educational measurement advisors was required to develop the achievement scale, check the tests for measurement validity, and ensure valid and reliable equating processes were used.

2 Policy Background
14 © OECD 2012 DELIVERING SCHOOL TRANSPARENCY IN AUSTRALIA: NATIONAL REPORTING THROUGH MY SCHOOL
Long lead times were necessary along with sustained ministerial leadership from the Australian Government to keep the eight state and territory governments invested in the process. The commitment of senior state and territory officials played a pivotal role in delivering the new national assessments. Both government and non-government systems had representation in the NAPLAN steering group to ensure that the implementation of the new programme was supported in all sectors.
PoliTicAl suPPorT for beTTer Public Access To comPArATive informATion AbouT schools
The Schools Assistance Act 2004 led to a number of innovations in performance measurement and reporting. The national performance reports, however, were limited to state and territory and sub-population aggregates, with no national reports on individual schools. Reports are required by schools themselves to their local communities on a number of national indicators.
Another important innovation was the requirement for each school to provide “plain English” reports to parents on each subject studied by their children on a five point A to E or equivalent scale. This ensures that parents receive information about how well their children are doing at school in comparison with their peers, rather than simply being told that their children are “doing well”.
Australia held a federal election in 2007. The incoming government’s commitments included a policy to ensure greater accountability through the introduction of annual reports comparing the performance of schools. This represented a major policy change that would:
•publish results of individual primary and secondary schools on Years 3, 5, 7 and 9 NAPLAN results;
•include trend line improvements or decline in like schools (that is schools enrolling students from similar family backgrounds);
•reflect challenges faced by each school;
•allow more to be done to improve a school’s performance; and
•allow additional resources to be directed to where they were most needed.
The strength of the Australian Government’s drive to improve transparency and accountability, and in particular to facilitate performance comparisons of schools, was a new and uncertain concept not only to the states and territories, but also to the non-government sector, for whom the exposure of school characteristics and performance in this way would also be a first.
A key factor in building their trust and support came through a commitment to move data responsibility away from committees of the ministerial council, having committee membership drawn primarily from Ministers’ departments, to an independent body. The intention for such a body was to ensure a separation of responsibility for scientific advising on performance measurement from policy concerns relating to performance reporting.
Public debATe AbouT TrAnsPArency
The 2007 announcement precipitated a robust public debate marked by strongly polarised views on the merit of school performance reports. Internationally, there had been much debate about school league tables. Some opponents of school performance reports characterised schooling as a service best monitored by teachers, who were promoted as the sole rightful custodians of student progress and, for some, the moral guardians of the self esteem of students. On this view, students would suffer social stigma from being at a school reported as having poor results. These views were generally not shared by parents.
In December 2008, ministers declared in the Melbourne Declaration on Educational Goals for Young Australians (www.mceetya.edu.au/mceecdya/melbourne_declaration,25979.html) that parents should have access to data on

2Policy Background
DELIVERING SCHOOL TRANSPARENCY IN AUSTRALIA: NATIONAL REPORTING THROUGH MY SCHOOL © OECD 2012 15
student outcomes and data that allows them to assess a school’s performance overall and in improving student outcomes.
During 2008 and 2009, intense public debate continued with ongoing opposition from teacher unions. Considerable correspondence went to the federal education Minister, and to the Prime Minister, totalling in the thousands.
Much of the concern centred around the belief that providing school performance information nationally would lead to unfair league tables comparing schools. It was also felt that Australian policy was simply following in the footsteps of international practices such as those of the United Kingdom and some areas of the United States. The Australian Government was clear in its communication that it was not adopting overseas practices but rather, was tailoring national school reporting to suit Australia’s unique circumstances.
Box 2.1 managing opposition: challenges and responses
Challenge Response
The validity of comparing schools on the basis of their academic results.
Education Ministers agreed that a range of information should be published to provide a context for understanding student outcomes:
•Information about each school’s student population, including information about the social background of students, and the proportions Indigenous, students with disabilities, and students with a language background other than English.
•Information about a school’s capacity or capability, including school income, and teacher workforce.
•Information from parent, student and teacher satisfaction surveys.
•Information about the type of school, student and staff numbers, and its location (such as metropolitan or remote).
The notion of comparing one school with another given each school’s unique characteristics.
Each school can be defined using elements which are unique to its setting, while still characterised by similarities such as the socio-economic background of the student population, remoteness and Indigenous population.
All of these have been shown to be significant factors in determining educational achievement.
It is important that we use each element or subsets of these elements in appropriate ways when we are making decisions about further support, setting future directions or introducing new programmes.
2 Policy Background
16 © OECD 2012 DELIVERING SCHOOL TRANSPARENCY IN AUSTRALIA: NATIONAL REPORTING THROUGH MY SCHOOL
Challenge Response
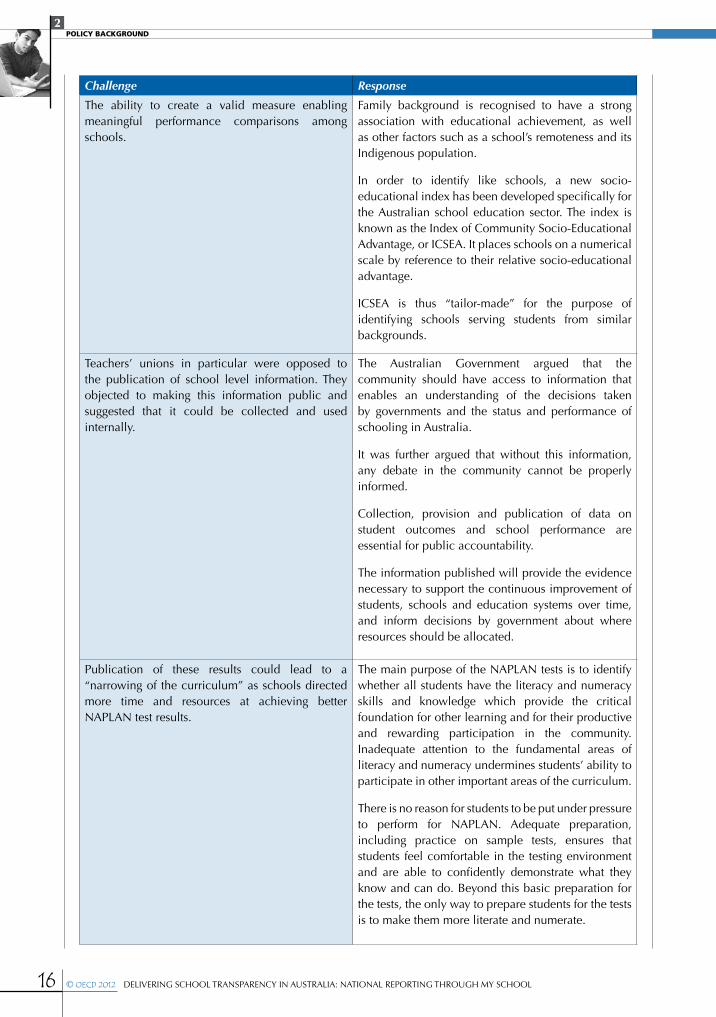
The ability to create a valid measure enabling meaningful performance comparisons among schools.
Family background is recognised to have a strong association with educational achievement, as well as other factors such as a school’s remoteness and its Indigenous population.
In order to identify like schools, a new socio-educational index has been developed specifically for the Australian school education sector. The index is known as the Index of Community Socio-Educational Advantage, or ICSEA. It places schools on a numerical scale by reference to their relative socio-educational advantage.
ICSEA is thus “tailor-made” for the purpose of identifying schools serving students from similar backgrounds.
Teachers’ unions in particular were opposed to the publication of school level information. They objected to making this information public and suggested that it could be collected and used internally.
The Australian Government argued that the community should have access to information that enables an understanding of the decisions taken by governments and the status and performance of schooling in Australia.
It was further argued that without this information, any debate in the community cannot be properly informed.
Collection, provision and publication of data on student outcomes and school performance are essential for public accountability.
The information published will provide the evidence necessary to support the continuous improvement of students, schools and education systems over time, and inform decisions by government about where resources should be allocated.
Publication of these results could lead to a “narrowing of the curriculum” as schools directed more time and resources at achieving better NAPLAN test results.
The main purpose of the NAPLAN tests is to identify whether all students have the literacy and numeracy skills and knowledge which provide the critical foundation for other learning and for their productive and rewarding participation in the community. Inadequate attention to the fundamental areas of literacy and numeracy undermines students’ ability to participate in other important areas of the curriculum.
There is no reason for students to be put under pressure to perform for NAPLAN. Adequate preparation, including practice on sample tests, ensures that students feel comfortable in the testing environment and are able to confidently demonstrate what they know and can do. Beyond this basic preparation for the tests, the only way to prepare students for the tests is to make them more literate and numerate.

2Policy Background
DELIVERING SCHOOL TRANSPARENCY IN AUSTRALIA: NATIONAL REPORTING THROUGH MY SCHOOL © OECD 2012 17
The Prime Minister addressed the National Press Club in August 2008 on the Australian Government “Education Revolution”. He stated in explicit terms that the Government would be seeking agreement at COAG to national school performance reporting on individual schools. Later that year Mr. Joel Klein, then the Chancellor of New York City Education Department, visited Australia at the request of the then education Minister, the Hon Julia Gillard MP. In November 2009, the education Minister held a principals’ forum at which the participants made their concerns about the Government’s agenda known.
The concerted union campaign gained strength when the resolve of the Government to proceed with school reporting became more strongly apparent. Final policy authority for new school performance reports was provided during
Challenge Response
Publication of results could lead to the stigmatisation of schools that did not perform well on NAPLAN tests.
Through the publication of school contextual information, it was acknowledged that student performance on NAPLAN tests is influenced by a number of factors both inside and outside the classroom, including the educational attainment and occupation of parents, for example, which are strong predictors of student performance.
My School was designed to encourage parents and members of the community to engage in meaningful conversation with school principals and education officials about the direction and resourcing of schools in their community and beyond.
Concern that the website would allow the media and others to publish school league tables.
It was argued that the media has always been able to publish information about schools and that prior to My School, this was in the absence of sophisticated transparency measures. The best way of ensuring an honest comprehensive public debate is to ensure accurate, clear information is publicly available rather than placing limitations on what can be published.
Strong protocols for data collection and reporting were agreed to by education Ministers to support meaningful and comparable reporting of school data, and the responsible use of this information. These protocols include the protection of individual student privacy, not publishing comparative data without contextual information, and the publication of error margins, caveats and explanatory notes to ensure accurate interpretation.
Ministers also agreed that: “the Australian Curriculum Assessment and Reporting Authority (ACARA) will be supported in providing strong and active management of information it provides to prevent the identification of individual students and to promote the meaningful use of data by third parties. ACARA will work actively with the media to explain the information published and how to properly interpret it, and will take steps to counter unfair or inaccurate reporting.”
2 Policy Background
18 © OECD 2012 DELIVERING SCHOOL TRANSPARENCY IN AUSTRALIA: NATIONAL REPORTING THROUGH MY SCHOOL
2009 through COAG and MCEECDYA, and included authority to establish the Australian Curriculum Assessment and Reporting Authority (ACARA).
Continuing through to 2010, with My School launched in January, the initial media commentary with school performance tables strengthened the teacher union’s opposition and prompted the national teacher union body to call for a boycott of the NAPLAN tests to be held in May that year. This is further explored later in the case study.
Throughout this period and through to the present, despite the loud protestations of some segments of the community, there was and is also clear support from the general community with the balance overall appearing to favour transparency of school performance information nationally.

2Policy Background
DELIVERING SCHOOL TRANSPARENCY IN AUSTRALIA: NATIONAL REPORTING THROUGH MY SCHOOL © OECD 2012 19
Notes
1. During much of the lead-up to the introduction of My School, this group was called MCEETYA (Ministerial Council on Education, Employment, Training and Youth Affairs), however for ease of reference it is called MCEECDYA throughout this case study.
2. On My School, similar schools are schools serving students from statistically similar backgrounds. Factors used to determine a group of similar schools are the socio-educational backgrounds of the students’ parents, whether the school is remote, the proportion of Indigenous students, the proportion of students from a language background other than English, or a combination of these factors. These factors are used to create an Index of Community Socio-Educational Advantage (ICSEA) value for each school. A school may have up to 60 similar schools, but it is possible that a school has no similar schools. Special schools do not have an ICSEA value and therefore do not have similar schools. A school will have similar schools if it has an ICSEA value.


Decision Making3
DELIVERING SCHOOL TRANSPARENCY IN AUSTRALIA: NATIONAL REPORTING THROUGH MY SCHOOL © OECD 2012 21
• Australia’s school reform agenda ................................................................................... 22• Mandate from the Council of Australian Governments ................................................. 22• Education Ministers determined the policy details ......................................................... 24• The key factors in policy making ................................................................................... 29
3Decision Making
22 © OECD 2012 DELIVERING SCHOOL TRANSPARENCY IN AUSTRALIA: NATIONAL REPORTING THROUGH MY SCHOOL
Implementation of reform to school performance reporting in Australia requires the authority of nine education Ministers, both collectively in council and individually within their own governments to set policy and direct its implementation. Some of this can be achieved by education Ministers themselves. On occasion, the task requires the attention of heads of government. When the opportunity arises to include education in a broader review of intergovernmental service delivery, this can be pivotal to the achievement of major reforms.
AustrAliA’s school reform AgendA
The Australian Government’s “Education Revolution” involves a sharper focus on improving outcomes as students move through school. The transparency and accountability mechanisms are aimed at improving outcomes and equity for all students by using nationally comparable school performance data to build a substantive evidence base to support future improvements.
In May 2008, the federal budget included funding provision for a National Schools Assessment and Data Centre (NSADC). The federal Education Department had formed the view that the continued handling of national school performance measurement and reporting by an inter-governmental committee of Education Department officials was unlikely to deliver hard reforms. The Australian Government decided to direct its resources instead to an independent body and to require state and territory support as part of the funding obligations attached to federal grants. The data centre would act as an independent source of advice on performance measurement and collection point for school data.
Subsequently a report commissioned under the COAG process, A New National Architecture for School Curriculum, Assessment and Reporting, recommended that a new national statutory body be established with a legislative mandate to report to the Ministerial Council for Education, Early Childhood Development and Youth Affairs (MCEECDYA) and to be tasked by MCEECDYA to execute its policy decisions in relation to curriculum, assessment and reporting. Bringing together these three linked elements of national school system governance was an important policy innovation and laid the foundations for the establishment of ACARA.
mAndAte from the council of AustrAliAn governments (coAg)
In 2008, at the highest levels of government in both the federal and state spheres, COAG undertook the most significant reform of Australia’s federal-state financial relations in decades through the introduction of an Intergovernmental Agreement (IGA).
This was a broad-ranging reform of shared funding and responsibility for key areas of service delivery including health and education. In addition to a major rationalisation of the number of payments to the states and territories by the Australian Government, the IGA also involved a changing focus from inputs to outcomes - in exchange for more flexibility in how states and territories spent their funding, they would be required to undertake enhanced, transparent reporting.
As noted above, in August 2008 the then Prime Minister gave an address at the National Press Club which announced the government’s plan for an “Education Revolution”, including the transparency agenda. The Prime Minister stated specifically that individual school performance reporting would be a condition of future funding arrangements. At the same time, the Australian Government released a booklet which reinforced the transparency and accountability message given by the Prime Minister in his speech. This and other instances of public advocacy by the Australian Government were important in reinforcing the right of parents and the community to have transparent information on all schools.
At the COAG meeting of 29 November 2008, the Council agreed:
•that greater transparency and accountability for the performance of schools is essential to ensure that every Australian child receives the highest quality education and opportunity to achieve through participation in employment and society;
•to national reporting on the performance of individual schools to inform parents and carers and for evaluation by governments of school performance; and

3Decision Making
DELIVERING SCHOOL TRANSPARENCY IN AUSTRALIA: NATIONAL REPORTING THROUGH MY SCHOOL © OECD 2012 23
•that a new body, ACARA - the independent body referred to above - would be supplied with the information necessary to enable it to publish relevant, nationally comparable information on all schools to support accountability, school evaluation, collaborative policy development and resource allocation.
Box 3.1 my school: Australian government and coAg involvement
Federal Government
November 2007 - Federal Labor party election commitment to Lift School Standards, focussing on greater accountability through the introduction of annual reports comparing the performance of schools.
August 2008 - the Australian Government launched its policy paper “Quality Education: The Case for an Education Revolution in our Schools”.
Intergovernmental Agreement on Federal Financial Relations(IGA) - March 2008
Outlines the Australian Government’s financial commitments to state and territory governments and overall policy objectives for each key service sector.
Includes Specific Purpose Payments to states and territories for the provision of services in key service delivery sectors.
Schools Specific Purpose Payment.
National Education Agreement (NEA)1 January 2009
Sets out objectives, outcomes, outputs, performance indicators and state and federal roles and responsibilities relating to the provision of school education.
Details reporting requirements under the performance reporting framework, including national reporting on individual schools.
Schools Assistance Act and Regulations
Details the Australian Government’s financial assistance to non-government schools for 2009-12.
Provides a legislative basis for placing the same NEA reporting requirements on non-government schools.
Outlines performance and transparency requirements consistent with the performance reporting framework in the NEA.
Productivity Agenda Working Group (PAWG)
One of the seven working groups established by COAG to deliver election commitments and progress work on the productivity component of the national reform agenda.
Chaired by Julia Gillard MP, Deputy Prime Minister with senior public servants from the Commonwealth, state and territory Governments.
Tasked with delivering implementation plans for election commitments (including the Digital Education Revolution, universal access to early childhood education, delivery of a National Curriculum) and determining key priorities to support the Productivity Agenda.
Developed a nationally agreed Participation and Productivity framework, endorsed by COAG March 2008 and which outlined key aspirations, outcomes, progress measures and future policy directions for early childhood development, schooling, skilling and training.
Council of Australian Governments (COAG)(peak intergovernmental forum comprising the Prime Minister, state Premiers, territory Chief Ministers and the President of the Australian Local Government Association)
20 December 2007 -Agreed to a new reform agenda across health and aging, productivity, climate change and water, infrastructure, business regulation and competition, housing and indigenous reform. Agenda initially driven by the implementation of federal election commitments.
Agreed to improve funding arrangements and a more collaborative Australian Government - state relationship.
Established seven working groups to progress this work.
September 2008Commissioned a report to review the governance arrangements for national curriculum, assessment and reporting.
November 2008COAG agreed on the need for greater educational transparency and accountability.
Gained jurisdictional support for a new school performance reporting framework, including national reporting on the performance of individual schools.
Endorsed the establishment of the Australian Curriculum Assessment and Reporting Authority (ACARA).
Agreed ACARA would be supplied with the information necessary to enable it to publish relevant, nationally comparable information on all schools to support accountability, school evaluation, collaborative policy development and resource allocation.

3Decision Making
24 © OECD 2012 DELIVERING SCHOOL TRANSPARENCY IN AUSTRALIA: NATIONAL REPORTING THROUGH MY SCHOOL
The Australian Government recommended to COAG that it would be important to accompany school performance information with two other categories of information - the context in which a school operates (student background, for example) and the resources available to a school. This is a key design feature of My School. The release of school income data for each school for the first time in March 2011 confirmed that the public is much better placed to understand and discuss school performance with this additional element.
The policy authority for current education reforms, including My School, is set out in the NEA which forms a schedule to the Intergovernmental Agreement on Federal Financial Relations reached by COAG in 2008.
Service delivery schedules to the IGA locked in the requirement for both government and non-government schools for national reporting on the performance of individual schools for the purposes of accountability, school evaluation and resource allocation. Getting agreement at this high level laid the foundations for where national school level reporting was headed. COAG then tasked education Ministers (MCEECDYA) with determining the details of how this would be achieved for all schools across the country.
educAtion ministers determined the policy detAilsThe Australian Government led MCEECDYA’s consideration of how the transparency agenda should be delivered. Similarly to the development of NAPLAN, ministers decided to form an expert working group to provide them with advice. The group comprised members of the states and territories, the non-government sector and the Australian Council for Educational Research (ACER).
Box 3.2 my school: mceecdyA involvement
School Reporting Working Group
Developed indicators for school evaluation, accountability and resource allocation and possible methods for nationally comparable reporting for individual schools.
National Assessment Programme – Literacy and Numeracy (NAPLAN) TESTING
2006-07 Development of national assessment instruments, reporting scales, and implementation procedures.
2008 First year of NAPLAN testing.
Melbourne Declaration
Includes commitment to strengthening accountability and transparency for schools and their student, parents and families, the communities and government.
MCEECDYA four-year Action Plan
Outlines key strategies and initiatives to achieve goals and target identified in the Declaration.Principals and Protocols
for Reporting on Schooling in Australia
Informs the use and publication of data generated in the process of measuring the performance of schooling in Australia.
Ministerial Council on Education, Early Childhood Development and Youth Affairs (MCEECDYA)(Principal forum for developing national educational priorities and strategies comprising federal, state and territory and New Zealand education Ministers)
2005Agreed to the development of nationally comparable full population literacy and numeracy assessments.
2008September - Gave in-principle support for a joint national body for the collection and reporting of school information. Agreed to a work programme for the School Reporting Working Group (SRWG).
October - approved report recommendation to establish a new statutory authority under the Commonwealth Authorities and Companies Act, 1997 (CAC Act).
December - Release of the Melbourne Declaration on Educational Goals for Young Australians and the MCEECDYA four year Action Plan 2009-12.
2009April - education Ministers agreed on what national school level data would be collected by the Australian Curriculum Assessment and Reporting Authority (ACARA) and reported on the My School website.
June - Ministers finalised agreement that the cost of funding ACARA would be shared equally between the Australian Government and the states and territories. Released the Principals and Protocols for Reporting on Schooling in Australia.
November/December - Ministers signed off on reporting formats for My School. Developed a detailed communication strategy for the launch of the My School website.

3Decision Making
DELIVERING SCHOOL TRANSPARENCY IN AUSTRALIA: NATIONAL REPORTING THROUGH MY SCHOOL © OECD 2012 25
Ministers asked the expert working group to provide advice on the indicators and data needed for school evaluation, accountability and resource allocation, together with possible methods for reporting information on individual schools. They did this with the assistance of a report on reporting and comparing school performances commissioned from ACER (see references).
Some of the key recommendations from the ACER analysis were that:
•nationally-comparable data should be collected on students’ literacy and numeracy skills using NAPLAN, and on tertiary entrance results of students in each senior secondary school;
•nationally-comparable data should be collected on sources and amounts of funding received by each school, and on the numbers and qualifications of teaching staff in each school;
•nationally-comparable data should be collected on the socio-economic background of students in each school, preferably based on information collected at the individual student level using at least parental occupation and possibly parental education levels;
•in reporting student outcome data, data for like-schools should be provided as a point of comparison and that in determining like-schools, account should be taken of the percentage of students from Indigenous backgrounds and language backgrounds other than English, and the socio-economic backgrounds of students in the school;
•for purposes of providing public information about schools, a common national website should be used to provide parents and the public with access to rich information about individual schools, and that this website should provide information about each school’s programmes, philosophies, values and purposes, provided by the school itself, as well as nationally-comparable data provided centrally; and
•nationally-comparable student outcome data should, wherever possible, provide information about current levels of attainment, gain/growth across the years of school, and improvement in a school over time.
Box 3.3 my school: establishing the delivery capability for national school reporting
Budget funding for independent data collection and reporting
• Funding received in 2008-09 federal budget for new independent collection agency for school data.
• COAG commissioned report A new national architecture for school curriculum, assessment and reporting, recommended that a single new national statutory body be established to implement curriculum, assessment and reporting policy (Sept 2008). Budget funding directed towards this.
• Adopting this recommendation and linking the three elements of national school system governance - curriculum, assessment and reporting - was the basis for establishing ACARA.
Australian Curriculum, Assessment and Reporting Authority (ACARA)
• Established under the ACARA Act 2008 tabled in Parliament October 2008.
• Independent authority responsible for the development of a national curriculum, a national assessment programme and the collection and reporting of national school performance data.
• Became fully operational May 2009.
• Legislated to perform its functions and exercise its powers in accordance with the Charter and under direction of MCEECDYA.
• Developed a website to present publicly, for the first time, nationally comparable school performance information for all Australian schools.
MY SCHOOL (launched 28/1/2010)
3Decision Making
26 © OECD 2012 DELIVERING SCHOOL TRANSPARENCY IN AUSTRALIA: NATIONAL REPORTING THROUGH MY SCHOOL
Box 3.4 school profile
2010 2009 2008
School comments 2010
Mylocal school is a large comprehensive co-educational high school in the north western suburbs of NSW Although it is located in an area well known for its highly regarded schools, including selective, single-sex and non-government schools, Mylocal school has experienced a steadily increasing enrolment during the last few years. The school prides itself on academic, vocational, cultural and sporting success. With a focus on Quality Teaching, it aims to meet the needs of students in a technology rich enviroment. For the last four years Extension classes have been established in our Stage 4 curriculum and Extension courses are available in Stage 6 across a broad curriculum range for our talented students. There are high expectations for student learning, behaviour and school uniform. Sixty-eight per cent of students are from a language background other than English. Mylocal school’s mission is to develop considerate, responsible people who can learn independently to achieve personal excellence. The school aims to develop in its students, the skills, knowledge, attitudes and values necessary for participation in society.
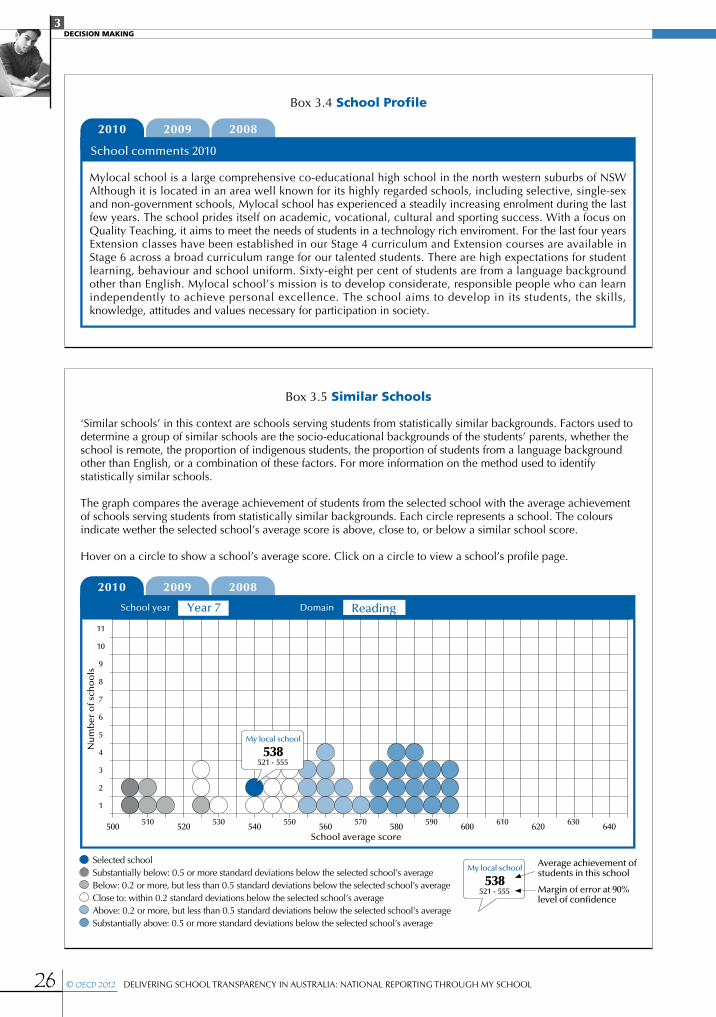
Box 3.5 similar schools
Selected schoolSubstantially below: 0.5 or more standard deviations below the selected school’s averageBelow: 0.2 or more, but less than 0.5 standard deviations below the selected school’s averageClose to: within 0.2 standard deviations below the selected school’s averageAbove: 0.2 or more, but less than 0.5 standard deviations below the selected school’s averageSubstantially above: 0.5 or more standard deviations below the selected school’s average
Average achievement of students in this school
Margin of error at 90% level of confidence
2010 2009 2008
Nu
mb
er o
f sch
oo
ls
School average score
School year Domain
1
2
3
4
5
6
7
8
9
10
11
510 530 550 570 590 610 630500 520 540 560 580 600 620 640
521 - 555
My local school
538
‘Similar schools’ in this context are schools serving students from statistically similar backgrounds. Factors used to determine a group of similar schools are the socio-educational backgrounds of the students’ parents, whether the school is remote, the proportion of indigenous students, the proportion of students from a language background other than English, or a combination of these factors. For more information on the method used to identify statistically similar schools.
The graph compares the average achievement of students from the selected school with the average achievement of schools serving students from statistically similar backgrounds. Each circle represents a school. The colours indicate wether the selected school’s average score is above, close to, or below a similar school score.
Hover on a circle to show a school’s average score. Click on a circle to view a school’s profile page.
Year 7
521 - 555
My local school
538
Reading

3Decision Making
DELIVERING SCHOOL TRANSPARENCY IN AUSTRALIA: NATIONAL REPORTING THROUGH MY SCHOOL © OECD 2012 27
Box 3.6 school finances: full-time equivalent (fte) enrolments (2009)
Interpreting school financial information
The following table and charts summarise the recurrent and other income of the selected school together with its capital expenditure for the 2009 calendar year. Caution should be taken in using the information presented below when making direct funding comparisons between schools. The financial resources available to schools are directly influenced by the nature of the school (including its location and profile), its programmes and its operations. For further information on the methods used and on the comparability of the date.
Net recurrent income 2009 Total Per studentAustralian Government recurrent funding 1 921 049 1 546
State/Territory Government recurrent funding 9 714 561 7 817
Fees, charges and parent contributions 1 136 115 914
Other private sources 91 944 74
Total gross income AUD 12 863 669 AUD 10 351(excluding income from government capital grants)
Deductions
Income allocated to current capital projects 140 329 113
Income allocated to future capital projects and diocesan capital funds 0 0
Income allocated to debt servicing 0 0
(including principal repayments and interest on loans)
Subtotal AUD 140 329 AUD 113
Total net recurrent income AUD 12 723 340 AUD 10 238
Capital expenditure 2009 Total
Australian Government capital expenditure 584 946
State/Territory Government capital expenditure 1 508 149
New school loans 0
Income allocated to current capital projects 140 329
Other 0
Total capital expenditure AUD 2 233 423
Total gross income 2009(excluding income from government capital grants)
Note: Percentages are rounded and may not add up to 100.
Total capital expenditure 2009
26%15%
76% 68%
6%9%
1%
3Decision Making
28 © OECD 2012 DELIVERING SCHOOL TRANSPARENCY IN AUSTRALIA: NATIONAL REPORTING THROUGH MY SCHOOL
The value of commissioning advice from internationally recognised experts in the field cannot be over-estimated, especially in a federal system of government where each government will have its own expertise. If the national minister is able to bring to the table carefully considered propositions informed by experts who are independent of government, the discussion with other ministers can be based on ideal outcomes more than entrenched interests.
Throughout 2009, ministers considered the advice of the School Reporting Working Group (a sub-group of MCEECDYA) and reached agreement on each aspect of national school level reporting:
•that reporting on individual schools would cover the three key areas endorsed by COAG - a school’s context (for example, the type and number of students), capacity (such as financial resources and teaching levels of expertise) and outcomes (including NAPLAN performance and senior secondary outcomes);
•that the most effective channel of reporting would be via a national website;
•that the format of the website and the way data was presented would place the school at the centre of the report;
•that socio-economic information for each school would be displayed to provide context for interpreting a school’s performance;
•that the construction of an index and details of the methodology for grouping like schools based on socio-economic status and other variables - later known as the Index for Community Socio-Educational Advantage (ICSEA) - be developed. This was vital in addressing state and territory sensitivities to the possibility of unfair comparisons between schools and would provide the first ever capacity of Australia to determine the relative levels of educational advantage or disadvantage of all schools; and
•that all states and territories and the non-government sector would provide full data sets to ACARA. As mentioned above, the establishment of an independent authority was integral in gaining the support of the states and territories, and ensured their comfort in providing data direct to an independent body rather than to the Australian Government.
In June 2009, education Ministers finalised agreement that the cost of funding ACARA would be shared equally between the Australian Government and the states and territories. ACARA was established under Commonwealth
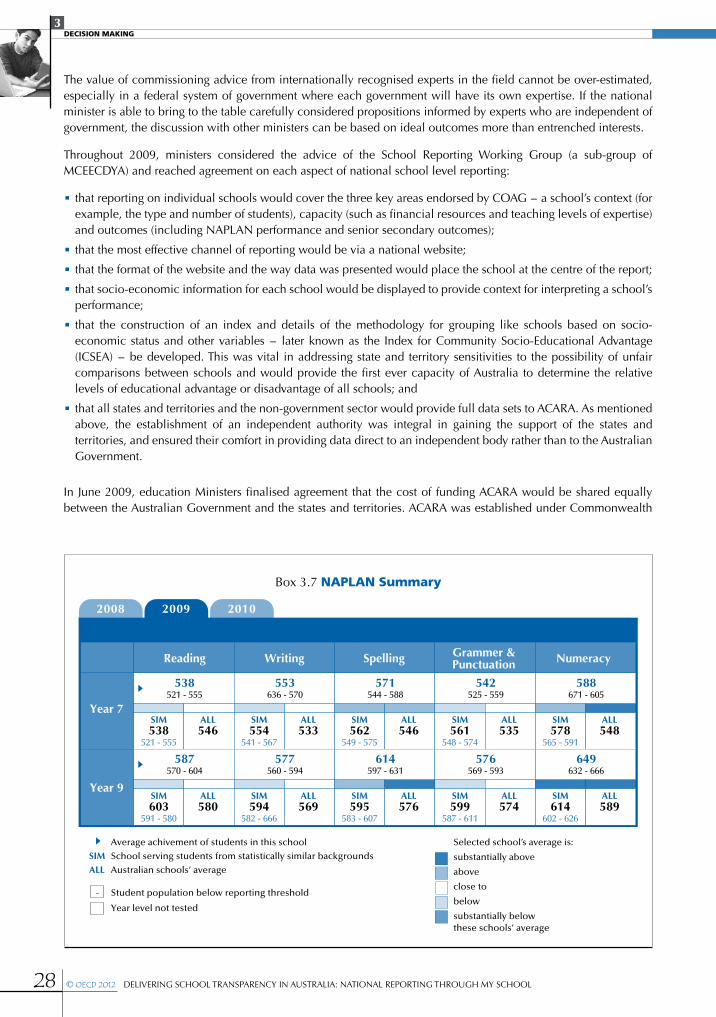
Box 3.7 nAplAn summary
Year 7
Year 9
Average achivement of students in this school Selected school’s average is:
substantially above
above
close to
below
substantially belowthese schools’ average
School serving students from statistically similar backgrounds
Australian schools’ average
SIMALL
Student population below reporting threshold
Year level not tested
-
Reading Writing Spelling Grammer &Punctuation Numeracy
538 553 571 542 588
587 577 614 576 649
521 - 555 636 - 570 544 - 588 525 - 559 671 - 605
570 - 604 560 - 594 597 - 631 569 - 593 632 - 666
521 - 555 541 - 567 549 - 575 548 - 574 565 - 591
591 - 580 582 - 666 583 - 607 587 - 611 602 - 626
SIM ALL SIM ALL SIM ALL SIM ALL SIM ALL
SIM ALL SIM ALL SIM ALL SIM ALL ALLSIM
538 546 554 533 562 546 561 535 578 548
603 580 594 569 595 576 599 574 614 589
2008 2009 2010

3Decision Making
DELIVERING SCHOOL TRANSPARENCY IN AUSTRALIA: NATIONAL REPORTING THROUGH MY SCHOOL © OECD 2012 29
legislation with a Board comprising nominees from each state and territory, the National Catholic Education Commission, the Independent Schools Council of Australia and the Australian Government, and is answerable to MCEECDYA. ACARA’s work to develop the My School website was written into their Charter and work plan, and was also made a condition of their funding.
Education Ministers agreed to proceed with the available national data for the inaugural My School, and agreed an ambitious work programme to add further data as it became available. With My School first launched in January 2010, the Government delivered the first set of national school performance reports in Australia’s history.
These were very well received by parents, who to that point had no means of comparing schools on a national basis irrespective of the jurisdiction the schools are in or who owns and operates them.
In particular, a key feature of My School that was accessed by parents was the summary table of NAPLAN performance. Here a user can see at a glance a school’s performance in all domains and year levels compared to the national average and the statistically similar schools average. The table is also colour coded to show if the school’s performance is substantially above (dark green), above (light green), close to (white), below (light red) or substantially below (dark red), that of the similar school groups.
In relation to reporting of school income, the inherent differences in the way schools are resourced and managed across jurisdictions and sectors create challenges for ensuring comparability of financial data. A phased approach with collaborative work between ACARA, the Australian Government, states and territories and non-government sector ensured comparable financial information was published when My School 2.0 was released in March 2011.
The other addition to the website that was only possible for the first time in My School 2.0 is growth data on literacy and numeracy, which shows overall improvement of student cohorts that remained in each school between 2008 and 2010. This provides a measure of the influence of the school itself on student progress, the value schools have added to their students’ learning over a two-year period.
the key fActors in policy mAking
strong leadershipFrom the outset, years before My School was released, there was strong national leadership by the Australian Government and strong political leadership by both the then Prime Minister and the then Deputy Prime Minister, who was also the Minister for Education. School reporting was clearly a centrepiece of the Government’s broader education reforms.
The strong view expressed repeatedly, over time, by the Australian Government, particularly by the Deputy Prime Minister, was that parents want and have a right to public information about all schools, that the nation needs this information and that it is certainly in the interests of every Australian school child.
Having adopted this view, a number of challenges presented immediately. Chief among them was significant criticism from some of the key stakeholders.
preparedness to manage oppositionInitially, there was resistance from the states and territories whose paramount concern was that national reporting would lead to unfair comparisons being made between schools. The resistance of the states and territories was not trivial because, without their agreement, it would not be possible to access the data they held. There is no constitutional capacity for the Australian Government to override or mandate what the states and territories must do. Rather, it had to lead and negotiate to gain agreement, which it did over a period of years.
Secondly, there was vigorous criticism from teacher unions, particularly the federal body representing government school teachers, the Australian Education Union (AEU). The Deputy Prime Minister was frequently challenged by the unions. In the face of a concerted campaign of correspondence and media comment, the Deputy Prime Minister patiently reiterated the case for transparency in the public interest.
3Decision Making
30 © OECD 2012 DELIVERING SCHOOL TRANSPARENCY IN AUSTRALIA: NATIONAL REPORTING THROUGH MY SCHOOL
The My School story shows the importance of policy makers considering conflicting stakeholder interests and views regarding empowering parents with potentially sensitive information. The balance of judgement formed by the Australian Government was that it was more in the public interest to publish the information than not. Moreover, the fact of a Labor government Minister disagreeing with the federal teachers’ union demonstrated the strength of the Government’s resolve to support the right of the community to have this information and not allow unions to control public access to school information.
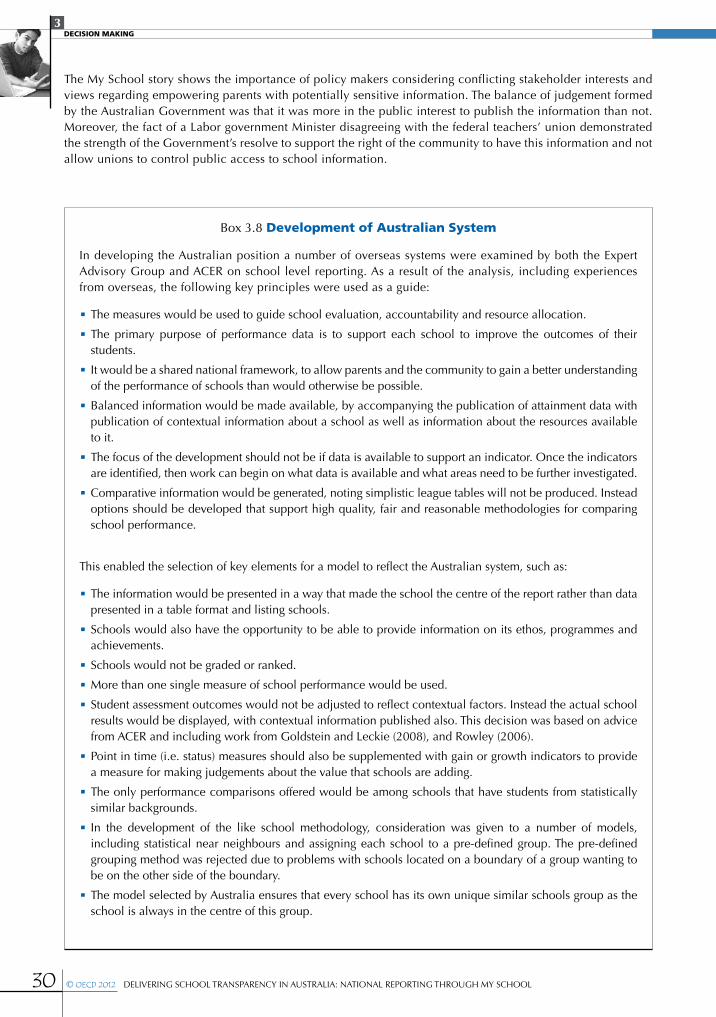
Box 3.8 development of Australian system
In developing the Australian position a number of overseas systems were examined by both the Expert Advisory Group and ACER on school level reporting. As a result of the analysis, including experiences from overseas, the following key principles were used as a guide:
•The measures would be used to guide school evaluation, accountability and resource allocation.
•The primary purpose of performance data is to support each school to improve the outcomes of their students.
•It would be a shared national framework, to allow parents and the community to gain a better understanding of the performance of schools than would otherwise be possible.
•Balanced information would be made available, by accompanying the publication of attainment data with publication of contextual information about a school as well as information about the resources available to it.
•The focus of the development should not be if data is available to support an indicator. Once the indicators are identified, then work can begin on what data is available and what areas need to be further investigated.
•Comparative information would be generated, noting simplistic league tables will not be produced. Instead options should be developed that support high quality, fair and reasonable methodologies for comparing school performance.
This enabled the selection of key elements for a model to reflect the Australian system, such as:
•The information would be presented in a way that made the school the centre of the report rather than data presented in a table format and listing schools.
•Schools would also have the opportunity to be able to provide information on its ethos, programmes and achievements.
•Schools would not be graded or ranked.
•More than one single measure of school performance would be used.
•Student assessment outcomes would not be adjusted to reflect contextual factors. Instead the actual school results would be displayed, with contextual information published also. This decision was based on advice from ACER and including work from Goldstein and Leckie (2008), and Rowley (2006).
•Point in time (i.e. status) measures should also be supplemented with gain or growth indicators to provide a measure for making judgements about the value that schools are adding.
•The only performance comparisons offered would be among schools that have students from statistically similar backgrounds.
•In the development of the like school methodology, consideration was given to a number of models, including statistical near neighbours and assigning each school to a pre-defined group. The pre-defined grouping method was rejected due to problems with schools located on a boundary of a group wanting to be on the other side of the boundary.
•The model selected by Australia ensures that every school has its own unique similar schools group as the school is always in the centre of this group.

3Decision Making
DELIVERING SCHOOL TRANSPARENCY IN AUSTRALIA: NATIONAL REPORTING THROUGH MY SCHOOL © OECD 2012 31
marshalling the evidence Other key factors in the policy-making phase centred around grounding the policy in evidence from international experiences and from this, building a model suited to Australia’s needs. Feeding into this at key stages in the process was advice from experts in performance measurement and reporting. This provided the scientific basis for taking sound decisions and ensuring that the political and government stance was persuasive and carried credibility on the broader community. The use of experts continues to be an on-going practice in developing future iterations of the website.
effective decision makingThe related major reform to service delivery performance monitoring through COAG placed an emphasis on collection and reporting of delivery and outcomes data. This afforded the Australian Government an ideal means for securing the authority needed for the public provision of national school performance reporting. Through the COAG funding agreements, the Australian Government was able to make judicious use of a major funding injection to schools by making provision of national data on every school in Australia a condition of federal funding.
The process managed by the education Ministers to develop and implement the details of school reporting entailed careful consideration of the options and the issues, with intensive scientific and policy analysis drawing on a variety of conceptual propositions and empirical testing of these, with well-documented outcomes and follow up from meetings. In a federal system of government, rigorous processes are particularly important to keep track of the decision making and ensure that the analytical work needed between decision points is carried out.
long-term planningThe success of My School is as much a function of exercising the discipline needed to scope the project and keep track of progress through project monitoring and reporting to ministers as it is a function of the merit of the policy. This kind of reform cannot be achieved in the short term.
Good planning over a long time period contributed to the success of getting the initiative off the ground, as did flexibility on the part of all governments in being prepared to publish what data was available initially, rather than wait until all data was perfect before launching My School.


My School Website Launched4
DELIVERING SCHOOL TRANSPARENCY IN AUSTRALIA: NATIONAL REPORTING THROUGH MY SCHOOL © OECD 2012 33
• Key features .................................................................................................................. 35• My School 2.0 .............................................................................................................. 36• The future of My School ................................................................................................ 38

4My School webSite launched
34 © OECD 2012 DELIVERING SCHOOL TRANSPARENCY IN AUSTRALIA: NATIONAL REPORTING THROUGH MY SCHOOL
In the lead up to and following launch day on 28 January 2010, ACARA undertook a comprehensive communications campaign to inform the community of this new public information service.
Information was disseminated firstly to school communities, with principals gaining access to their school’s page on the website 24 hours prior to launch. Principals also received written information packs and supporting material including a DVD. This was particularly aimed at providing a plain language explanation of how the ICSEA was developed and what its intended purpose was.
The information provided to the public was in the form of television commercials and a range of online fact sheets and Frequently Asked Questions. The television commercials were short-lived, perhaps demonstrating that the force of the Australian Government’s and ACARA’s public advocacy of the reporting agenda had itself provided substantial publicity.
Box 4.1 Communication Strategy
ACARA was responsible for developing a communication strategy to inform stakeholders of the purpose and functionality of the My School website in the lead up to the launch.
Key elements of the strategy included:
•identifying different audiences and their relationship to/interaction with My School, e.g. schools, parents, unions, media, the general community;
•identifying key stakeholders - Director Generals, School Principals, Peak Body representatives, education Ministers, Federal education department (DEEWR);
•developing key communication media, including media releases, press advertising, fact sheets, brochures, booklets, DVDs;
•identifying communication channels, e.g. Government and departmental websites, the ACARA website, press and television advertising;
•identifying key spokespersons;
•identifying key messages and tailoring these according to the audience;
•developing an issues and risk register;
•appointing a public relations advisor; and
•developing timelines and key activities and launch and final release dates.
Activities undertaken by ACARA and stakeholders leading up to the launch included:
•preview of My School landing page;
•My School presentation by the Deputy Prime Minister (DPM) at the principals’ forum;
•promotion of My School and broader transparency and accountability policy through related forums, such as the DEEWR website, DPM media conferences;
•email to principals and teachers providing support materials and key messages;
•media interviews with key spokespeople;
•newsletter articles for School education bodies and education reports;
•development of key communication media, including brochures, FAQs, a DVD, fact sheets, etc;
•briefing of peak bodies;
•implementation of e-Alerts relating to the development and launch of the My School website accessed through a registration facility on the ACARA website; and
•provision of advance copies of communication material to state and territory education authorities.

4My School webSite launched
DELIVERING SCHOOL TRANSPARENCY IN AUSTRALIA: NATIONAL REPORTING THROUGH MY SCHOOL © OECD 2012 35
The Chair of ACARA and the then Deputy Prime Minister held media briefings and toured to some schools to launch the website. At the time of the launch and in the days and months following it, there was significant media reaction, much of it positive, particularly in the theme of this kind of public information for parents being long overdue.
Key featureSThe principal design elements of My School merit some repeating. For some policy analysts, it goes without saying that the school indicators used in public reports should be formed to permit direct comparisons between schools without regard to jurisdiction or ownership differences. My School also by design places schools in the centre of the scheme, rather than giving prominence to the indicators and listing all the schools in rank order under each one. And from the outset, the key design feature of My School has been to accompany school results with not just a suite of contextual indicators such as the influence of family background on school results, but also school income data. With these three kinds of data, any user of the website would be able to consider for themselves the key factors governing each school’s services.
The main features can be summarised as these:
•It is the first time Australia has had a data repository of rich and detailed information on all schools in the country (some of which may be used for government and research purposes as distinct from the public reporting use).
•It provides a facility to publicly report nationally comparable information on all schools at the same time and in the same location.
•It allows comparison of schools which educate students from similar backgrounds through the ICSEA which for the first time shows the level of educational advantage or disadvantage for every school based on the same scale.
•It provides clear information on schools that are doing better or worse than would be expected based on their ICSEA value.
Through colour coding of NAPLAN results (green/dark green to indicate performing above/substantially above average of similar schools and all Australian schools, and red/dark red to indicate performing below/substantially below average of similar schools and all Australian schools), it highlights immediately and obviously instances of educational disadvantage where governments can target assistance and resources.
When the first version of My School was launched, the Australian Government identified and provided extra funding to 110 schools that were below both the national average and statistically similar schools but which were not already in receipt of additional funding assistance. In this way, the capacity of My School to provide the type of data that had been missing for successive federal education Ministers upon which to assess claims for additional funding can be seen.
There was an unprecedented and unanticipated demand for the website. The number of page views for My School for launch day was 30 million which, in Australia, is comparable to the number of pages served for the large news sites and popular reality television shows for a month.
In the early days following the launch of the site, some media outlets and other organisations copied the data from My School to create “league tables” ranking schools on their performance. There was considerable concern expressed by some in the schools sector that this reporting would damage school reputations.
While the Australian Government does not support the publication of simplistic league tables, it also does not support the use of legal controls to restrict the public, including the media, from publishing data obtained from the My School website.
A threat to the capacity of My School to report school performance outcomes came when the Australian Education Union (representing teachers) proposed a boycott of the NAPLAN tests scheduled to be administered in May 2010. While there is very strong support in the Australian community for NAPLAN, there remained concern by some stakeholders regarding the use of NAPLAN for the purpose of public reporting of the results via My School. A widespread boycott would have seriously impacted the efficacy of the information on My School, particularly in relation to the capacity with the 2010 data to calculate student growth in comparison to the 2008 school results for the same student cohorts.

4My School webSite launched
36 © OECD 2012 DELIVERING SCHOOL TRANSPARENCY IN AUSTRALIA: NATIONAL REPORTING THROUGH MY SCHOOL
Most states and territories sought orders or directions for the teachers’ union to desist from taking industrial action from their relevant industrial tribunal. In addition, the then Deputy Prime Minister was in regular contact with state and territory ministers to discuss progress on contingency planning to ensure that if the proposed bans went ahead, the tests could still be administered. This involved significant effort and resourcing by state and territory authorities in devising alternative implementation arrangements and ensuring that students would be given the opportunity to participate in the tests. In the end, the situation was avoided with the teachers’ union calling off the proposed boycott.
The then Deputy Prime Minister also asked ACARA to form the My School Working Party with representation from the teachers’ union plus a range of other stakeholders such as principals’ organisations and literacy and numeracy specialists. The Working Party was in operation until August 2010 and provided advice on possible enhancements to My School.
My SChool 2.0Following on from the initial website launch in early 2010, the second version of the website was released on 4 March 2011.
The updated website contained some significant reporting innovations and included for the first time comparable national data on school finances. Information on each school’s recurrent income and capital expenditure, broken down by funding source, provides parents, teachers and governments with a clear picture of the resources provided to schools to support the education of students. To ensure that this information is robust and comparable, ACARA commissioned a detailed validation process, undertaken by a leading Australian accounting firm, Deloitte. Deloitte also reviewed the methodology for reporting school financial information. The methodology and assurance reports for the school income data are available at www.acara.edu.au/myschool/more_information.
The other major addition to My School 2.0 was school results showing student gain in literacy and numeracy measured through the NAPLAN tests. This was the first opportunity to present student progress information for students who undertook NAPLAN in both 2008 and 2010. This information provided an understanding of how the gain made by a school is related to its students’ starting level of performance in 2008, thereby providing a measure of the influence of the school itself on student results.
The gain made by students in each school was displayed by averaging the 2008 and 2010 results for the following cohorts:
•Year 5 students who also sat NAPLAN in the same school in Year 3.
•Year 7 students who also sat NAPLAN in the same school in Year 5.
•Year 9 students who also sat NAPLAN in the same school in Year 7.
For My School 2.0, ACARA developed also a more accurate method of calculating ICSEA. Where available, school ICSEA values are based on direct student level data - that is, data collected directly from parents at the school, rather than national Census data. Modelling by ACARA has found that using direct student level data gives a 7% increase in the explanatory power of ICSEA. See Annex B for more information.
My School 2.0 featured new graphical methods of displaying NAPLAN data. NAPLAN results were moved from a school’s profile page to separate pages to make room for extra information on the school profile, while a set of icons at the bottom of each screen provided easy access to the rest of the site.
Also in this update to the website, there were enhanced security features to ensure that data is used appropriately by those who access the site.
An explanation of each page of the website may be found in Annex A.

4My School webSite launched
DELIVERING SCHOOL TRANSPARENCY IN AUSTRALIA: NATIONAL REPORTING THROUGH MY SCHOOL © OECD 2012 37
The third update to My School was released on 24 February 2012. The update made available four years of NAPLAN assessments (2008-11) and 2010 school funding information for every school.The key additions were a revised depiction of student gain in literacy and numeracy allowing for fair comparisons of schools based on the same starting NAPLAN score (that is, between students who achieved the same result when they sat NAPLAN two years previously); and additional Vocational Education and Training (VET) measures relating to course enrolments and completed qualifications by level and industry area. The new VET measures boost the secondary schooling indicators and provide a complement to NAPLAN results as additional outcomes indicators on the website.
Box 4.2 Data released on the first, second, third and future versions of My School
OUTCOMES CONTEXT CAPACITY
Student learningStudent home and personal
backgroundWorkforce
• NAPLAN+ Status by domain and year level
- National and like school means - Distribution in bands
+ Like school comparisons+ Student gain (for matched cohorts)+ Student gain comparisons by school+ Participation
• VET in school numbers• VET in school enrolments and completions by level and industry area• Senior secondary*• Post school destinations*• Tertiary entrance scores
• SES of family+ ICSEA score+ School family SES distribution+ ICSEA to be based on direct parent data
• Student+ Indigenous+ With a disability+ With a language back-ground other than English
• Numbers of teaching and non-teaching staff • Numbers/proportions of teachers by level of expertise under new National Professional Standards for Teachers
School culture School profile Finance
• Student, parent, teacher satisfaction, e.g.+ Student wellbeing+ Parent engagement + Teacher development
• Enrolments • Student attendance• School statement• School type
+ Primary, secondary+ Year range+ Government, non-government+ Location
• School recurrent income and capital expenditure
Black - data released on My SchoolDark blue - data included in My School 2012 release Light blue - data to be included in future releases* These indicators are currently not nationally comparable
4My School webSite launched
38 © OECD 2012 DELIVERING SCHOOL TRANSPARENCY IN AUSTRALIA: NATIONAL REPORTING THROUGH MY SCHOOL
the future of My SChoolAnnual updates to My School are planned. As well as what is currently on the website ACARA is working with education authorities to develop further additional indicators including the numbers of students with disabilities, satisfaction of parents, students and teachers, and levels of teacher expertise.
Over time, the website will continue to evolve and expand as new and additional data becomes available. This will mean My School is able to continually enhance the richness of the information it makes available to parents, schools and the community.
Conclusion5
DELIVERING SCHOOL TRANSPARENCY IN AUSTRALIA: NATIONAL REPORTING THROUGH MY SCHOOL © OECD 2012 39
• Policy lessons ................................................................................................................ 40• My School underpins other school reforms ................................................................... 40
5ConClusion
40 © OECD 2012 DELIVERING SCHOOL TRANSPARENCY IN AUSTRALIA: NATIONAL REPORTING THROUGH MY SCHOOL
Policy lessons
In concluding, this section now seeks to draw out the key points and lessons from the Australian experience for the benefit of member countries, particularly those who may be in similar federal-state contexts:
•The road to My School commenced and was secured by agreement at the highest levels of government in the Australian Government (the Prime Minister) and the states and territories (the Premiers and Chief Ministers). Determining the details for the reporting agenda was then delegated to the education Ministers.
•The significant political task can be seen by considering that each of the nine governments had to gain internal agreement before agreement could be reached by COAG.
•A significant injection of additional funds by the Australian Government at the same time as giving the states and territories more flexibility to use funding as they saw fit in return for outcomes and greater levels of reporting.
•Strong ministerial leadership by both the then Prime Minister and Deputy Prime Minister in the face of opposition gradually achieved complete agreement by all governments. Once agreement was reached with the other ministers, they provided public support for the initiative.
•At the same time, the Australian Government, despite not owning or running schools, maintained its momentum in advocating to the community about their rights to have public information about the performance of schools.
•Particularly given the complexities of operating in a federal-state system, long lead times were necessary with the outcome of My School worked towards over a number of years.
•Marshalling independent expertise in both the development of NAPLAN and the development of indicators for school-level reporting added weight and authority to government policy directions.
•Establishing an independent authority allowed the states and territories a level of comfort they would not otherwise have felt in providing their data for national access.
My school underPins other school reforMs
For the first time in Australia’s history, the policy challenge of delivering equitable funding to schools irrespective of the sector they are in can be informed by comprehensive national data on each school that not only provides a rich dataset for policy makers, but also places the same data into the hands of the public.
A number of key policy reforms can now be informed by this new data, including a major review of Australian Government funding that is underway and efforts to implement in schools the kinds of governance arrangements and teaching practices that international analysis like that from PISA shows make a difference including school autonomy and school evaluation practices.
In August 2010, the Prime Minister announced a suite of further school reform initiatives. School Reform - Making Every School a Great School announced nine reform programmes, some of which build on the new national school data and My School.
The key initiatives in this package that rest in some way on My School are:
•Rewards for Great Teachers - initiative will recognise and reward quality teachers in Australia through a reward payment scheme linked to the National Professional Standards for Teachers. Teachers who become certified at the highest levels of the Standards will be rewarded with a one-off payment to acknowledge their skills and commitment in achieving this level of certification. The first reward payments will be made in 2014.
•Online diagnostic tools - progressively from 2011, will provide access to tools that enable individualised assessments, provide feedback on areas for development, and link to learning activities tailored to each student’s needs. Tools will be progressively linked to the national curriculum and national assessment programmes.
•Reward for school improvement - reward payments to individual schools who show the most improvement in a range of areas.

5ConClusion
DELIVERING SCHOOL TRANSPARENCY IN AUSTRALIA: NATIONAL REPORTING THROUGH MY SCHOOL © OECD 2012 41
References
rePorting and coMParing school PerforMances
Masters, G. N., G. Rowley, J. Ainley, and S. T Khoo. (2008), Reporting and Comparing School Performances, Assessment and Reporting Projects.
http://research.acer.edu.au/ar_misc/8
Abstract: This report provides advice on the collection and reporting of information about the performances of Australian schools. The focus is on the collection of nationally comparable data. Two purposes are envisaged: use by education authorities and governments to monitor school performances and, in particular, to identify schools that are performing unusually well or unusually poorly given their circumstances; and use by parents/caregivers and the public to make informed judgements about, and meaningful comparisons of, schools and their offerings. Our advice is based on a review of recent Australian and international research and experience in reporting on the performances of schools. This is an area of educational practice in which there have been many recent developments, much debate and a growing body of relevant research.
rePort on the generation of the 2010 index of coMMunity socio-educational advantage (icsea)
Barnes, G. (2010), Report on the Generation of the 2010 Index of Community Socio-Educational Advantage (ICSEA), ACARA Technical Paper. www.acara.edu.au/verve/_resources/2010_Index_of_Community_Socio-Educational_Advantage_Generation_Report.pdf
Abstract: At the request of Ministers of Education, ACARA investigated the possibility of using student-level data to compute ICSEA as opposed to indirect census collection district data. The modelling indicated that using direct student-level parent occupation
and education data submitted as part of NAPLAN testing, it is possible to obtain a more accurate measure of SES in most cases.


Annex AMy School 2.0 Page by Page

ANNEX A my school 2.0 page by page
44 © OECD 2012 DELIVERING SCHOOL TRANSPARENCY IN AUSTRALIA: NATIONAL REPORTING THROUGH MY SCHOOL
Landing pageThis is the first page users come to when typing in the web address www.myschool.edu.au. The main purpose of the page is to allow users to search for the profile of a particular school, or to search by suburb, town or postcode to locate the profile pages of schools in a particular area. There is a message from Professor Barry McGaw, Chair of ACARA, introducing the site and outlining its purpose.
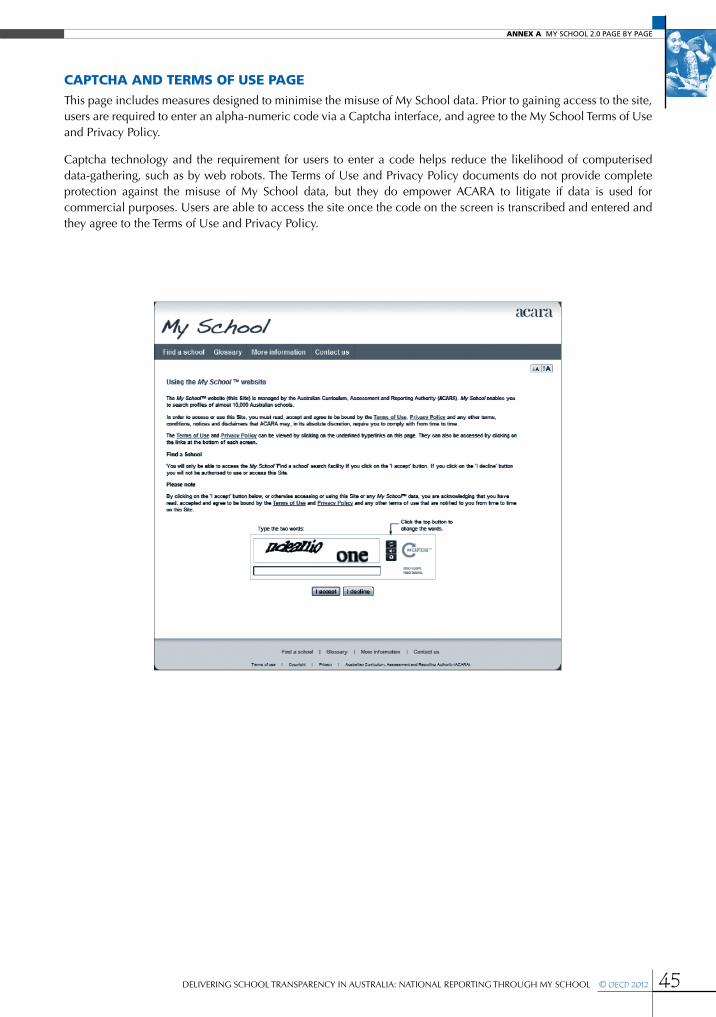
ANNEX A my school 2.0 page by page
DELIVERING SCHOOL TRANSPARENCY IN AUSTRALIA: NATIONAL REPORTING THROUGH MY SCHOOL © OECD 2012 45
CaptCha and terms of Use pageThis page includes measures designed to minimise the misuse of My School data. Prior to gaining access to the site, users are required to enter an alpha-numeric code via a Captcha interface, and agree to the My School Terms of Use and Privacy Policy.
Captcha technology and the requirement for users to enter a code helps reduce the likelihood of computerised data-gathering, such as by web robots. The Terms of Use and Privacy Policy documents do not provide complete protection against the misuse of My School data, but they do empower ACARA to litigate if data is used for commercial purposes. Users are able to access the site once the code on the screen is transcribed and entered and they agree to the Terms of Use and Privacy Policy.
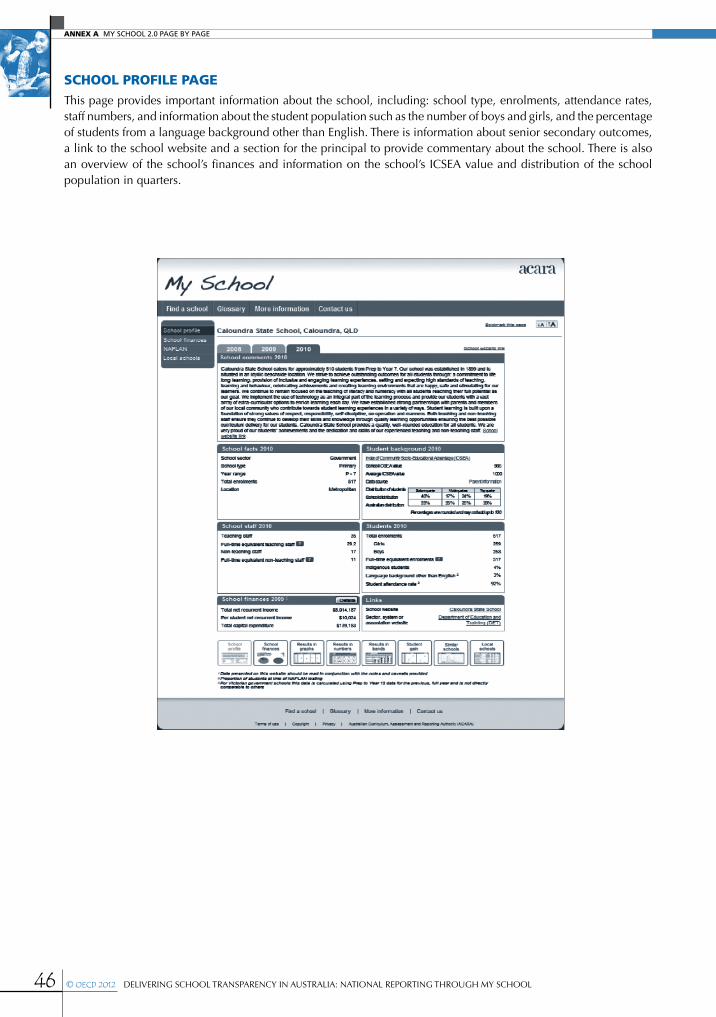
ANNEX A my school 2.0 page by page
46 © OECD 2012 DELIVERING SCHOOL TRANSPARENCY IN AUSTRALIA: NATIONAL REPORTING THROUGH MY SCHOOL
sChooL profiLe pageThis page provides important information about the school, including: school type, enrolments, attendance rates, staff numbers, and information about the student population such as the number of boys and girls, and the percentage of students from a language background other than English. There is information about senior secondary outcomes, a link to the school website and a section for the principal to provide commentary about the school. There is also an overview of the school’s finances and information on the school’s ICSEA value and distribution of the school population in quarters.

ANNEX A my school 2.0 page by page
DELIVERING SCHOOL TRANSPARENCY IN AUSTRALIA: NATIONAL REPORTING THROUGH MY SCHOOL © OECD 2012 47
sChooL finanCes pageInformation on this page provides details about the resources available to individual schools to support the education of their students. The information provided is comparable across all schools in Australia.
The page includes an overview of the gross and net recurrent income received by a school over a given calendar year. It also provides details of the number of full-time equivalent students enrolled at the school and the capital expenditure for the relevant year. Figures are presented in categories according to the source of income and the source of funding used for capital expenditure. The net recurrent income figure for each school is provided both as a lump sum and a per student amount.
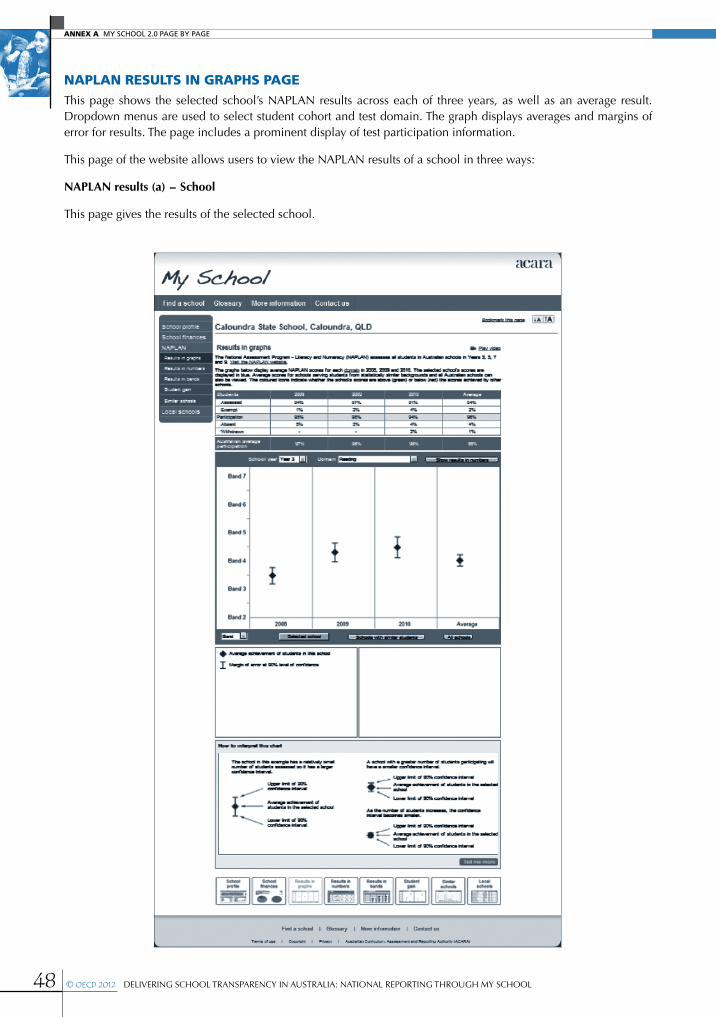
ANNEX A my school 2.0 page by page
48 © OECD 2012 DELIVERING SCHOOL TRANSPARENCY IN AUSTRALIA: NATIONAL REPORTING THROUGH MY SCHOOL
napLan resULts in graphs pageThis page shows the selected school’s NAPLAN results across each of three years, as well as an average result. Dropdown menus are used to select student cohort and test domain. The graph displays averages and margins of error for results. The page includes a prominent display of test participation information.
This page of the website allows users to view the NAPLAN results of a school in three ways:
NAPLAN results (a) - School
This page gives the results of the selected school.
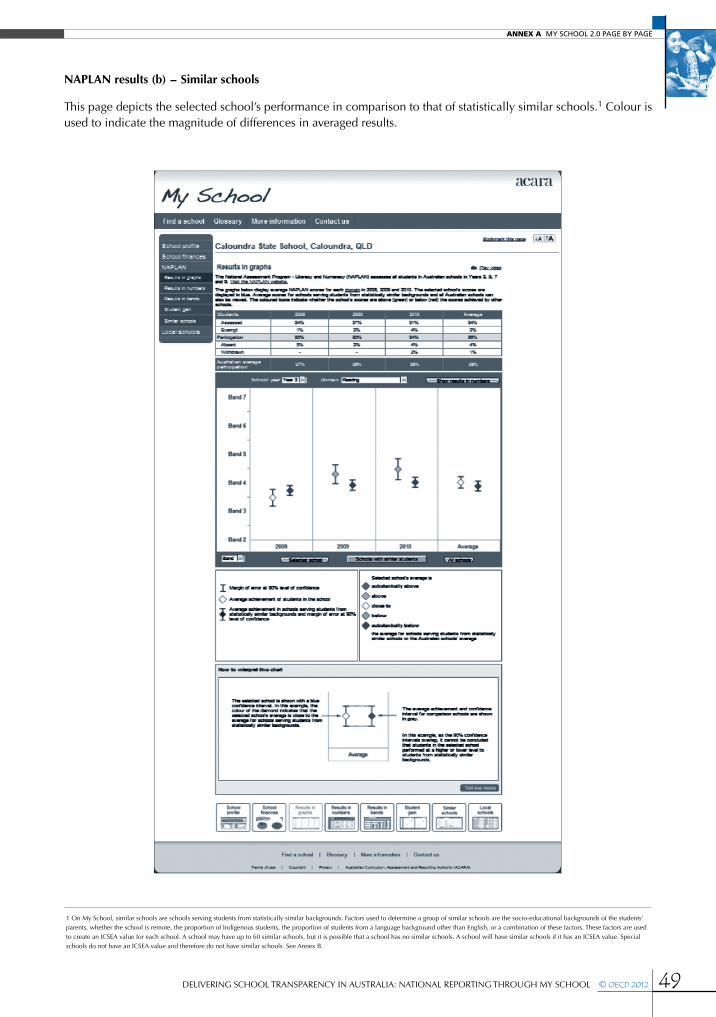
ANNEX A my school 2.0 page by page
DELIVERING SCHOOL TRANSPARENCY IN AUSTRALIA: NATIONAL REPORTING THROUGH MY SCHOOL © OECD 2012 49
NAPLAN results (b) - Similar schools
This page depicts the selected school’s performance in comparison to that of statistically similar schools.1 Colour is used to indicate the magnitude of differences in averaged results.
1 On My School, similar schools are schools serving students from statistically similar backgrounds. Factors used to determine a group of similar schools are the socio-educational backgrounds of the students’ parents, whether the school is remote, the proportion of Indigenous students, the proportion of students from a language background other than English, or a combination of these factors. These factors are used to create an ICSEA value for each school. A school may have up to 60 similar schools, but it is possible that a school has no similar schools. A school will have similar schools if it has an ICSEA value. Special schools do not have an ICSEA value and therefore do not have similar schools. See Annex B.

ANNEX A my school 2.0 page by page
50 © OECD 2012 DELIVERING SCHOOL TRANSPARENCY IN AUSTRALIA: NATIONAL REPORTING THROUGH MY SCHOOL
NAPLAN results (c) - All schools
This page demonstrates the selected school’s performance in comparison to that of all schools in Australia. Colour is used to indicate the magnitude of the differences in averaged results.
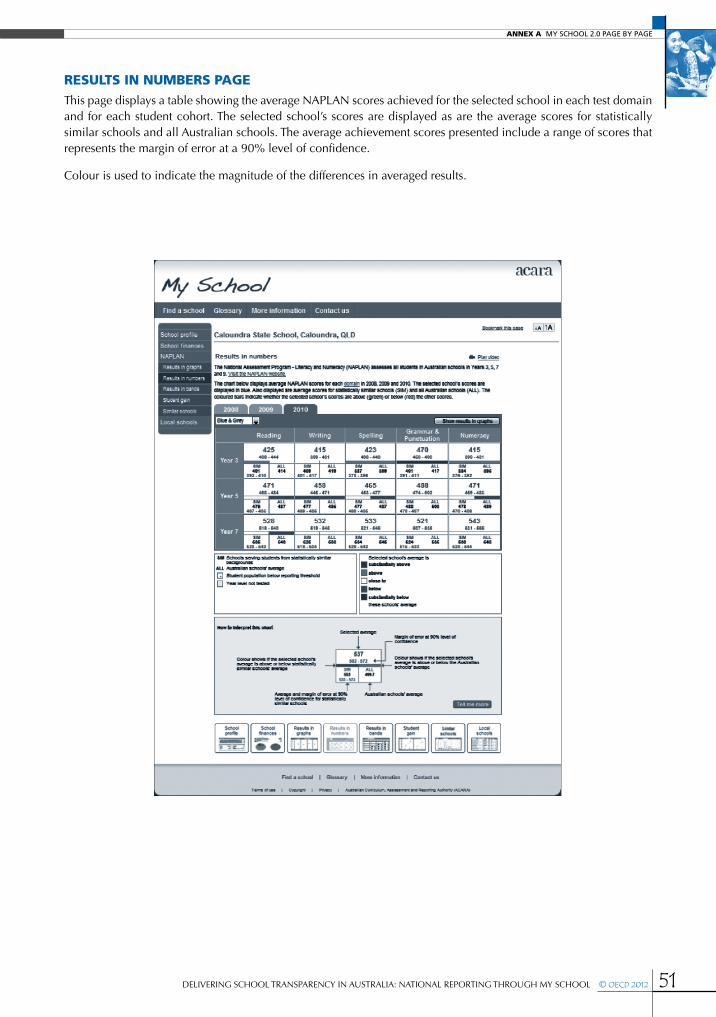
ANNEX A my school 2.0 page by page
DELIVERING SCHOOL TRANSPARENCY IN AUSTRALIA: NATIONAL REPORTING THROUGH MY SCHOOL © OECD 2012 51
resULts in nUmbers pageThis page displays a table showing the average NAPLAN scores achieved for the selected school in each test domain and for each student cohort. The selected school’s scores are displayed as are the average scores for statistically similar schools and all Australian schools. The average achievement scores presented include a range of scores that represents the margin of error at a 90% level of confidence.
Colour is used to indicate the magnitude of the differences in averaged results.

ANNEX A my school 2.0 page by page
52 © OECD 2012 DELIVERING SCHOOL TRANSPARENCY IN AUSTRALIA: NATIONAL REPORTING THROUGH MY SCHOOL
resULts in bands pageThe page shows the spread of a school’s student achievement results in each of the five NAPLAN test domains for each student cohort and compares these to results achieved at statistically similar schools and all Australian schools. The page also displays NAPLAN participation information.
Users are able to select which school results they wish to view by selecting the required NAPLAN test domain and calendar year.
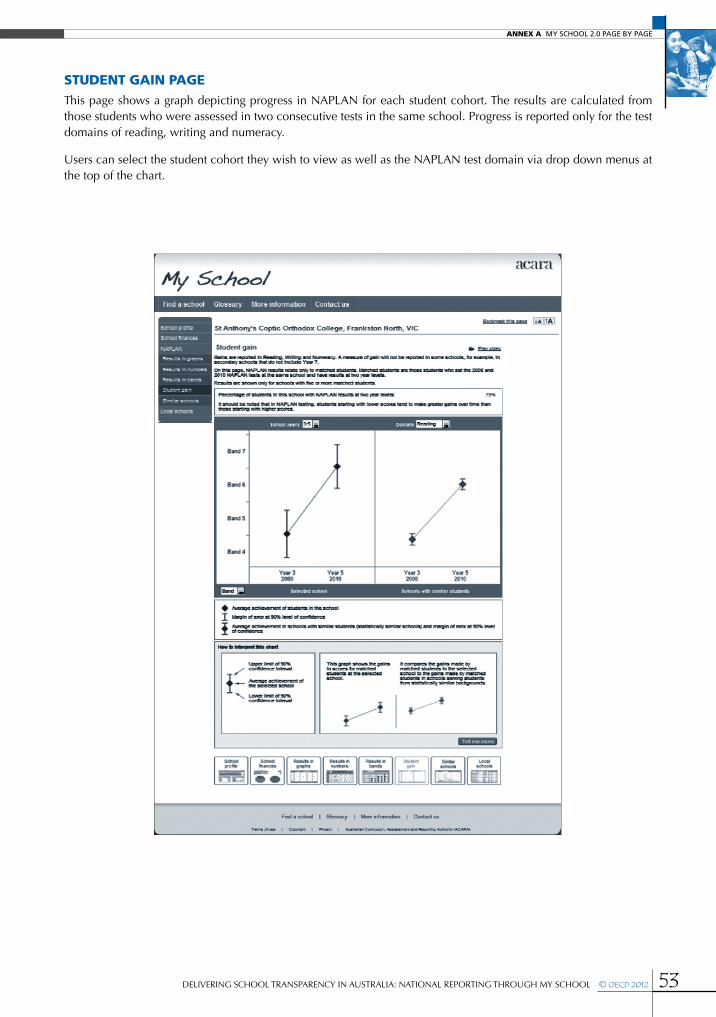
ANNEX A my school 2.0 page by page
DELIVERING SCHOOL TRANSPARENCY IN AUSTRALIA: NATIONAL REPORTING THROUGH MY SCHOOL © OECD 2012 53
stUdent gain pageThis page shows a graph depicting progress in NAPLAN for each student cohort. The results are calculated from those students who were assessed in two consecutive tests in the same school. Progress is reported only for the test domains of reading, writing and numeracy.
Users can select the student cohort they wish to view as well as the NAPLAN test domain via drop down menus at the top of the chart.
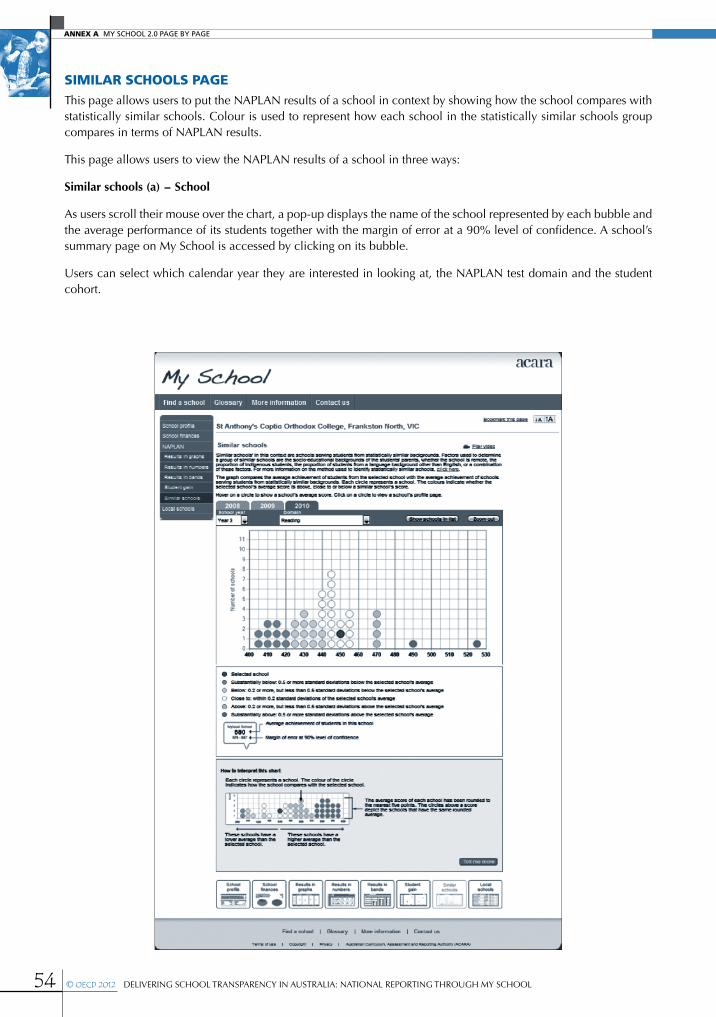
ANNEX A my school 2.0 page by page
54 © OECD 2012 DELIVERING SCHOOL TRANSPARENCY IN AUSTRALIA: NATIONAL REPORTING THROUGH MY SCHOOL
simiLar sChooLs pageThis page allows users to put the NAPLAN results of a school in context by showing how the school compares with statistically similar schools. Colour is used to represent how each school in the statistically similar schools group compares in terms of NAPLAN results.
This page allows users to view the NAPLAN results of a school in three ways:
Similar schools (a) - School
As users scroll their mouse over the chart, a pop-up displays the name of the school represented by each bubble and the average performance of its students together with the margin of error at a 90% level of confidence. A school’s summary page on My School is accessed by clicking on its bubble.
Users can select which calendar year they are interested in looking at, the NAPLAN test domain and the student cohort.
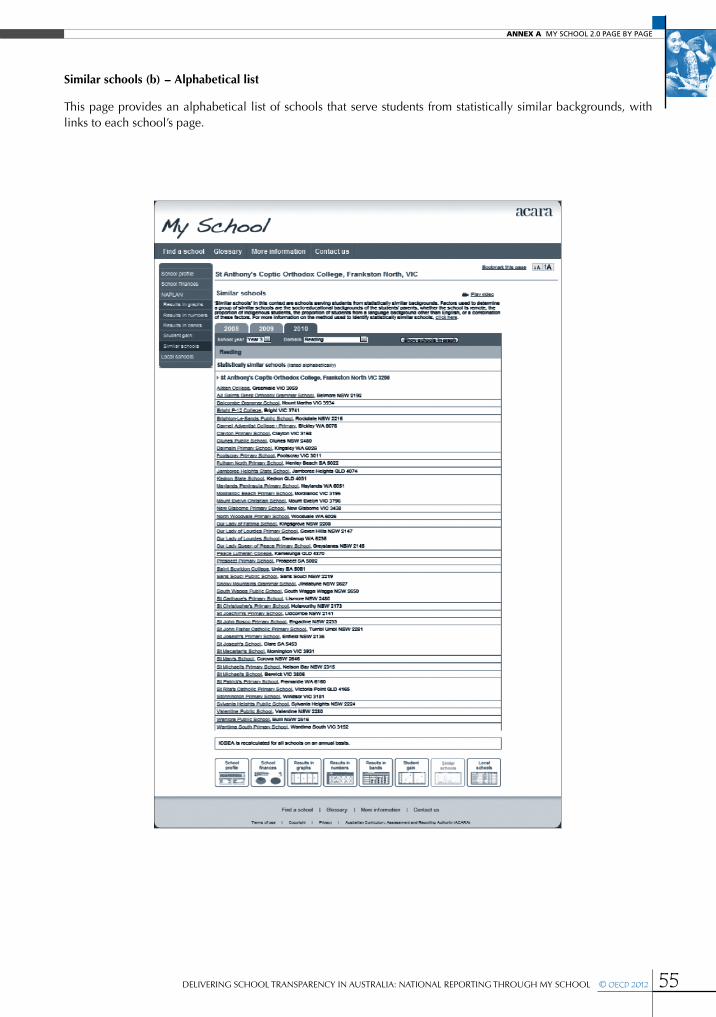
ANNEX A my school 2.0 page by page
DELIVERING SCHOOL TRANSPARENCY IN AUSTRALIA: NATIONAL REPORTING THROUGH MY SCHOOL © OECD 2012 55
Similar schools (b) - Alphabetical list
This page provides an alphabetical list of schools that serve students from statistically similar backgrounds, with links to each school’s page.

ANNEX A my school 2.0 page by page
56 © OECD 2012 DELIVERING SCHOOL TRANSPARENCY IN AUSTRALIA: NATIONAL REPORTING THROUGH MY SCHOOL
Similar schools (c) - Relative distribution
This page allows users to view a chart of the distribution of all schools’ average results with the selected school shown as a vertical line and its statistically similar schools group shown in a rectangular box. The page indicates to users the relative position of the selected school and its similar schools group in relation to all the schools for that calendar year, NAPLAN test domain and student cohort.
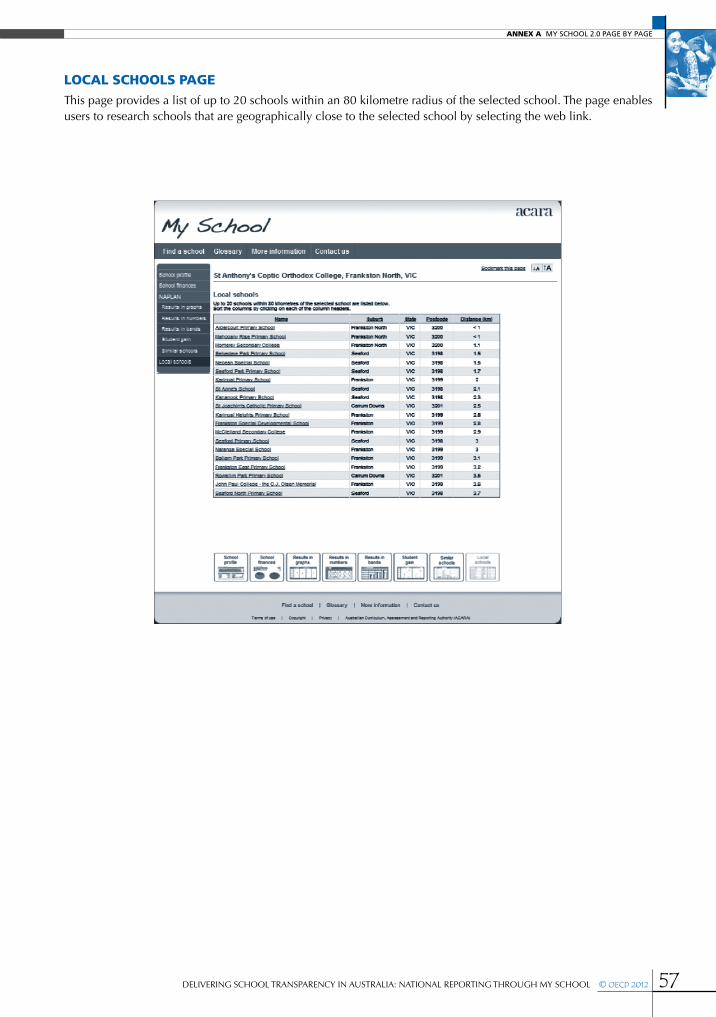
ANNEX A my school 2.0 page by page
DELIVERING SCHOOL TRANSPARENCY IN AUSTRALIA: NATIONAL REPORTING THROUGH MY SCHOOL © OECD 2012 57
LoCaL sChooLs pageThis page provides a list of up to 20 schools within an 80 kilometre radius of the selected school. The page enables users to research schools that are geographically close to the selected school by selecting the web link.

Annex BRepoRt on the geneRation ofthe 2010 index of Community
SoCio-eduCational advantage (iCSea)
ANNEX B RepoRt on the geneRation of the 2010 index of Community SoCio-eduCational advantage (iCSea)
60 © OECD 2012 DELIVERING SCHOOL TRANSPARENCY IN AUSTRALIA: NATIONAL REPORTING THROUGH MY SCHOOL
Parent socioeconomic data
The parent Socio-Educational Advantage (SEA) scale used in the construction of the 2010 Index of Community Socio-Educational Advantage is based on two alternative data sources:
•Information relating to parent occupation, school education, non-school education and language background obtained from student enrolment records
•Australian Bureau of Statistics (ABS) census data
Throughout the report the parent background data obtained from enrolment records is referred to as ‘direct parent data’ and the census data is referred to as ‘indirect parent data’.
Direct parent data was available for students enrolled in Kindergarten to Year 12 in government schools and most non-government systemic schools. For some non-government systemic schools and most Independent schools direct data was only available for students who participated in NAPLAN in 2009 and 2010. So, for these schools, and for states with Year 7 in secondary schools, data was available for students in Years 3, 4, 5 and 6 for primary schools and Years 7, 8, 9 and 10 for secondary schools. For Queensland, South Australia and Western Australia data was available for Years 3 to 7 for primary schools and Years 9 and 10 for secondary schools.
Not all states and sectors provided updated address data for the generation of indirect parent data. Where 2010 address data was not available the most recent available data was used.
The construction of the ICSEA involves two stages. The first stage involves the construction of an overall measure of school performance using the technique of factor analysis. In stage two the technique of regression analysis is used to derive an equation describing the relationship between a range of community variables and the school performance measure. This equation is then used to construct the ICSEA.
constructing the school Performance scale
A school performance scale was constructed using 2009 NAPLAN data. A primary performance scale was constructed using school mean scores for:
•Year 3 reading
•Year 3 numeracy
•Year 5 reading
• Year 5 numeracy
A junior secondary performance scale was constructed using mean scores for:
•Year 7 reading *
•Year 7 numeracy *
•Year 9 reading
• Year 9 numeracy
(* For jurisdictions which include Year 7 in primary school, performance scales for junior secondary schools were based on Year 9
results only. This has a negligible impact on the modelling as the relative weights of the Year 7 and Year 9 means are very similar.)
The sets of primary and secondary NAPLAN means produced strong factors that both explained 86.1% of the variance in the sets of means used to construct them.
A single performance scale was then constructed from the separate primary and secondary ones by standardising the two scales and merging them. In this combined performance scale each school’s overall performance is expressed in terms of the number of standard deviations above or below the national mean; the primary mean for primary schools and the secondary mean for secondary schools.
ANNEX B RepoRt on the geneRation of the 2010 index of Community SoCio-eduCational advantage (iCSea)
DELIVERING SCHOOL TRANSPARENCY IN AUSTRALIA: NATIONAL REPORTING THROUGH MY SCHOOL © OECD 2012 61
All factor analyses and regression analyses were carried out with schools with combined Year 3/Year 5 or Year 7/Year 9 cohorts of 20 or more students. The relationship between school average outcomes and community factors is often much weaker for small schools because they are much more susceptible to the influence of small numbers of students achieving at the top or bottom of the academic spectrum. The relationship between outcomes and community factors for small schools is not necessarily indicative of the general relationship between these variables.
Parent background dataWhen enrolling a child in school parents in all jurisdictions and sectors are asked which of the following five options best describes their occupation.
•Senior management in large business organisation, government administration and defence, and qualified professionals
•Other business managers, arts/media/sportspersons and associate professionals
•Tradesmen/women, clerks and skilled office, sales and service staff
•Machine operators, hospitality staff, assistants, labourers and related workers
•Not in paid work in last 12 months
For convenience these five categories are referred to throughout the report as professional, semi- professional, skilled non-professional, low-skilled and unemployed.
Parents are also asked which of the following four options best describes the school education level they achieved.
•Year 12 or equivalent
•Year 11 or equivalent
•Year 10 or equivalent
•Year 9 or equivalent or below
Parents are also asked which of the following four options best describes their non-school education status.
•Bachelor degree or above
•Advanced diploma/Diploma
•Certificate I to IV (including trade certificate)
•No non-school qualification
Parents are also asked to indicate whether they speak a language other than English at home and if so, which one.
direct Parent data variablesJurisdictions and sectors provided data for one or both parents depending on availability.
School-level occupation and education variables were constructed by dividing the number of parents in each response category by the number responding to the relevant question. For example, the school ‘Professional’ variable was constructed by dividing the number of parents indicating that this was their occupation category by the number of parents providing a response to one of the five occupation categories.
Even though the parent background data is collected at enrolment and is unlikely to be updated during the time that a student is enrolled in a school it should remain reasonably accurate. The school education level of parents will only change for the very few parents that undertake further secondary-level schooling through TAFE or an equivalent. The non- school education level will only change for the relatively small proportion of parents who undertake formal post-school education. Although many parents are likely to change jobs during the time that their children are enrolled in a school they are likely to remain within the same occupation category.
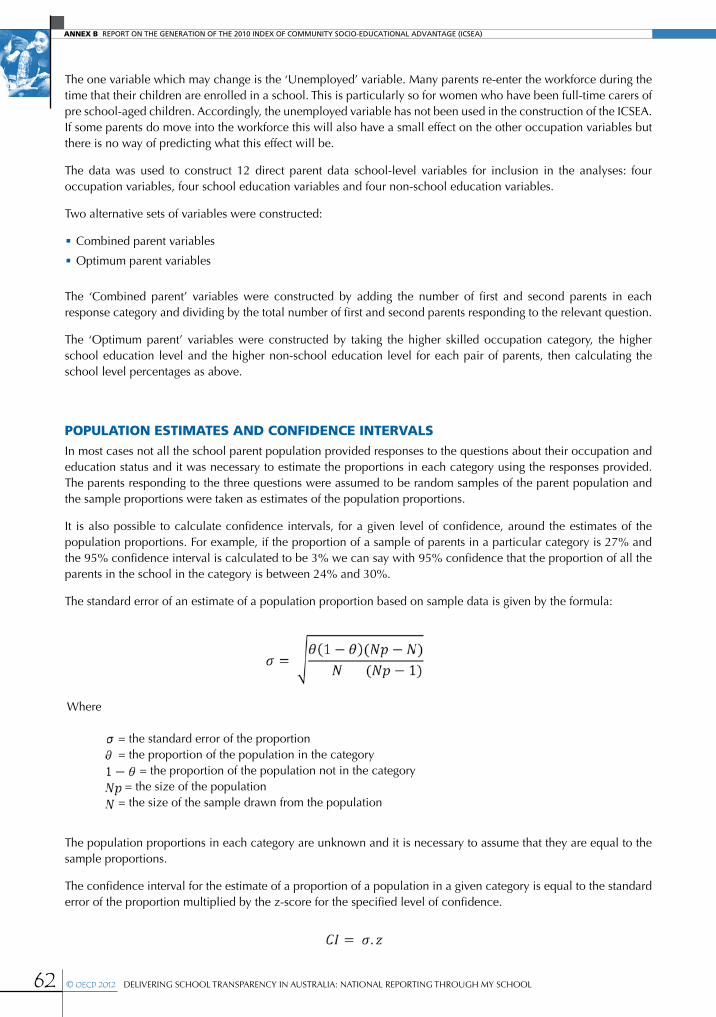
ANNEX B RepoRt on the geneRation of the 2010 index of Community SoCio-eduCational advantage (iCSea)
62 © OECD 2012 DELIVERING SCHOOL TRANSPARENCY IN AUSTRALIA: NATIONAL REPORTING THROUGH MY SCHOOL
The one variable which may change is the ‘Unemployed’ variable. Many parents re-enter the workforce during the time that their children are enrolled in a school. This is particularly so for women who have been full-time carers of pre school-aged children. Accordingly, the unemployed variable has not been used in the construction of the ICSEA. If some parents do move into the workforce this will also have a small effect on the other occupation variables but there is no way of predicting what this effect will be.
The data was used to construct 12 direct parent data school-level variables for inclusion in the analyses: four occupation variables, four school education variables and four non-school education variables.
Two alternative sets of variables were constructed:
•Combined parent variables
•Optimum parent variables
The ‘Combined parent’ variables were constructed by adding the number of first and second parents in each response category and dividing by the total number of first and second parents responding to the relevant question.
The ‘Optimum parent’ variables were constructed by taking the higher skilled occupation category, the higher school education level and the higher non-school education level for each pair of parents, then calculating the school level percentages as above.
PoPulation estimates and confidence intervalsIn most cases not all the school parent population provided responses to the questions about their occupation and education status and it was necessary to estimate the proportions in each category using the responses provided. The parents responding to the three questions were assumed to be random samples of the parent population and the sample proportions were taken as estimates of the population proportions.
It is also possible to calculate confidence intervals, for a given level of confidence, around the estimates of the population proportions. For example, if the proportion of a sample of parents in a particular category is 27% and the 95% confidence interval is calculated to be 3% we can say with 95% confidence that the proportion of all the parents in the school in the category is between 24% and 30%.
The standard error of an estimate of a population proportion based on sample data is given by the formula:
Where
= the standard error of the proportion = the proportion of the population in the category = the proportion of the population not in the category = the size of the population = the size of the sample drawn from the population
The population proportions in each category are unknown and it is necessary to assume that they are equal to the sample proportions.
The confidence interval for the estimate of a proportion of a population in a given category is equal to the standard error of the proportion multiplied by the z-score for the specified level of confidence.
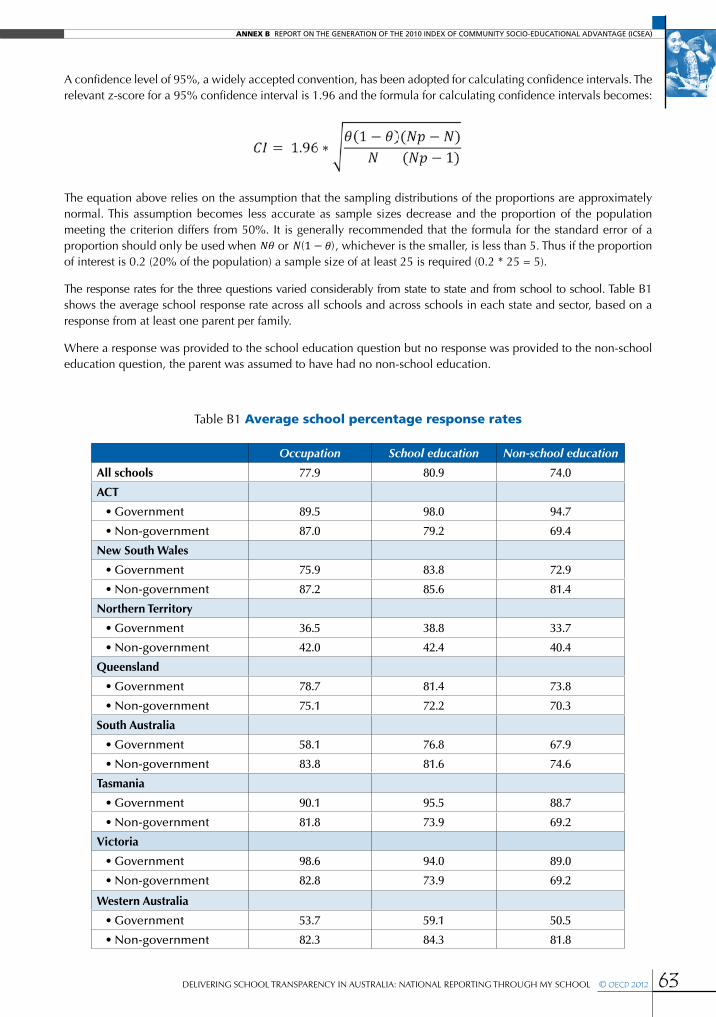
ANNEX B RepoRt on the geneRation of the 2010 index of Community SoCio-eduCational advantage (iCSea)
DELIVERING SCHOOL TRANSPARENCY IN AUSTRALIA: NATIONAL REPORTING THROUGH MY SCHOOL © OECD 2012 63
A confidence level of 95%, a widely accepted convention, has been adopted for calculating confidence intervals. The relevant z-score for a 95% confidence interval is 1.96 and the formula for calculating confidence intervals becomes:
The equation above relies on the assumption that the sampling distributions of the proportions are approximately normal. This assumption becomes less accurate as sample sizes decrease and the proportion of the population meeting the criterion differs from 50%. It is generally recommended that the formula for the standard error of a proportion should only be used when or ( ), whichever is the smaller, is less than 5. Thus if the proportion of interest is 0.2 (20% of the population) a sample size of at least 25 is required (0.2 * 25 = 5).
The response rates for the three questions varied considerably from state to state and from school to school. Table B1 shows the average school response rate across all schools and across schools in each state and sector, based on a response from at least one parent per family.
Where a response was provided to the school education question but no response was provided to the non-school education question, the parent was assumed to have had no non-school education.
Occupation School education Non-school education
All schools 77.9 80.9 74.0
ACT
• Government 89.5 98.0 94.7
• Non-government 87.0 79.2 69.4
New South Wales
• Government 75.9 83.8 72.9
• Non-government 87.2 85.6 81.4
Northern Territory
• Government 36.5 38.8 33.7
• Non-government 42.0 42.4 40.4
Queensland
• Government 78.7 81.4 73.8
• Non-government 75.1 72.2 70.3
South Australia
• Government 58.1 76.8 67.9
• Non-government 83.8 81.6 74.6
Tasmania
• Government 90.1 95.5 88.7
• Non-government 81.8 73.9 69.2
Victoria
• Government 98.6 94.0 89.0
• Non-government 82.8 73.9 69.2
Western Australia
• Government 53.7 59.1 50.5
• Non-government 82.3 84.3 81.8
Table B1 average school percentage response rates

ANNEX B RepoRt on the geneRation of the 2010 index of Community SoCio-eduCational advantage (iCSea)
64 © OECD 2012 DELIVERING SCHOOL TRANSPARENCY IN AUSTRALIA: NATIONAL REPORTING THROUGH MY SCHOOL
The size of the confidence intervals around the population estimates are determined by the school response rate in conjunction with the size of the school population. The response rate required to obtain estimates with confidence intervals of a given size increases sharply as the size of the school population decreases. Table B2 shows how the required response rates for schools of different sizes vary for a 95% confidence level, a population proportion of 25% and a confidence level of 3%.
The data in Table B2 illustrates that for medium to large schools the required response rates are quite low and well within what is presently being achieved by most schools. However, it is often difficult for small schools to achieve the required response rates.
The direct parent data for many non-government schools related only to parents of students who were NAPLAN candidates in 2009 and 2010. In calculating the confidence intervals for these schools the students in the NAPLAN cohorts were assumed to be the entire school population. If the actual school populations were used the maximum possible response rate these schools could achieve, assuming yearly cohorts of equal size, would be 66%. This would make it virtually impossible for small and medium-sized schools to achieve acceptable confidence intervals. Note that this assumption does not affect the population estimates themselves, just the confidence intervals around them and, as is shown below, whether the direct or indirect parent data is used to calculate the school ICSEA values.
The accuracy of the school population estimates is critical in assessing the relative merits of the direct and indirect parent data for calculating the ICSEA. Accordingly, for each school the confidence intervals for each of the 12 population estimates were calculated and the average confidence interval was determined. For a given school the response rates to the three questions may vary, as will the proportions themselves, so the confidence intervals will vary. However, the average confidence interval provides a convenient indication of the overall accuracy of the school’s data.
Table B3 shows the cut-off values for the average confidence interval deciles for the two alternative sets of parent variables. Table 5 shows, for example, that 10% of schools had an average confidence interval less than 0.8% for the combined parent data; for 10% of schools we can assume with 95% confidence that, on average, the estimates of the population proportions provided by the combined parent data are accurate to within 0.8%. Similarly we can assume that the estimates for 20% of schools are within 1.0%.
Table B2 required response rates for a 95% confidence level, a population proportion of 25% and a confidence level of 3%
School population Required sample Required response rate
25 24 96%
50 47 94%
75 69 92%
100 89 89%
150 126 84%
200 160 80%
500 308 62%
1000 445 45%
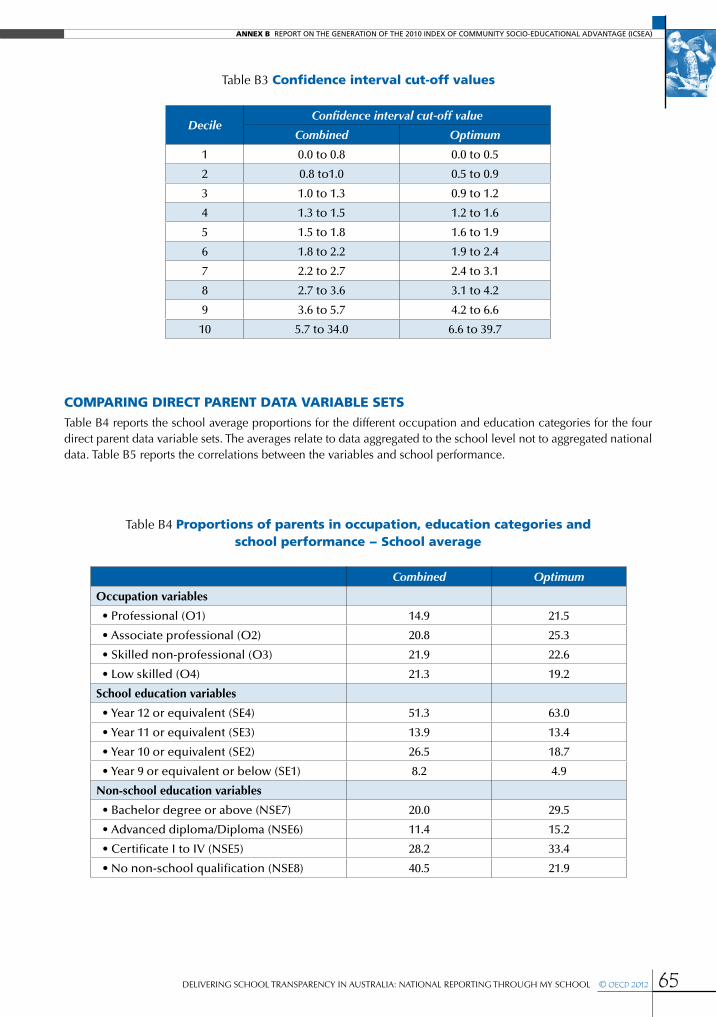
ANNEX B RepoRt on the geneRation of the 2010 index of Community SoCio-eduCational advantage (iCSea)
DELIVERING SCHOOL TRANSPARENCY IN AUSTRALIA: NATIONAL REPORTING THROUGH MY SCHOOL © OECD 2012 65
Table B3 confidence interval cut-off values
Table B4 Proportions of parents in occupation, education categories and school performance - school average
comParing direct Parent data variable setsTable B4 reports the school average proportions for the different occupation and education categories for the four direct parent data variable sets. The averages relate to data aggregated to the school level not to aggregated national data. Table B5 reports the correlations between the variables and school performance.
DecileConfidence interval cut-off value
Combined Optimum
1 0.0 to 0.8 0.0 to 0.5
2 0.8 to1.0 0.5 to 0.9
3 1.0 to 1.3 0.9 to 1.2
4 1.3 to 1.5 1.2 to 1.6
5 1.5 to 1.8 1.6 to 1.9
6 1.8 to 2.2 1.9 to 2.4
7 2.2 to 2.7 2.4 to 3.1
8 2.7 to 3.6 3.1 to 4.2
9 3.6 to 5.7 4.2 to 6.6
10 5.7 to 34.0 6.6 to 39.7
Combined Optimum
Occupation variables
• Professional (O1) 14.9 21.5
• Associate professional (O2) 20.8 25.3
• Skilled non-professional (O3) 21.9 22.6
• Low skilled (O4) 21.3 19.2
School education variables
• Year 12 or equivalent (SE4) 51.3 63.0
• Year 11 or equivalent (SE3) 13.9 13.4
• Year 10 or equivalent (SE2) 26.5 18.7
• Year 9 or equivalent or below (SE1) 8.2 4.9
Non-school education variables
• Bachelor degree or above (NSE7) 20.0 29.5
• Advanced diploma/Diploma (NSE6) 11.4 15.2
• Certificate I to IV (NSE5) 28.2 33.4
• No non-school qualification (NSE8) 40.5 21.9
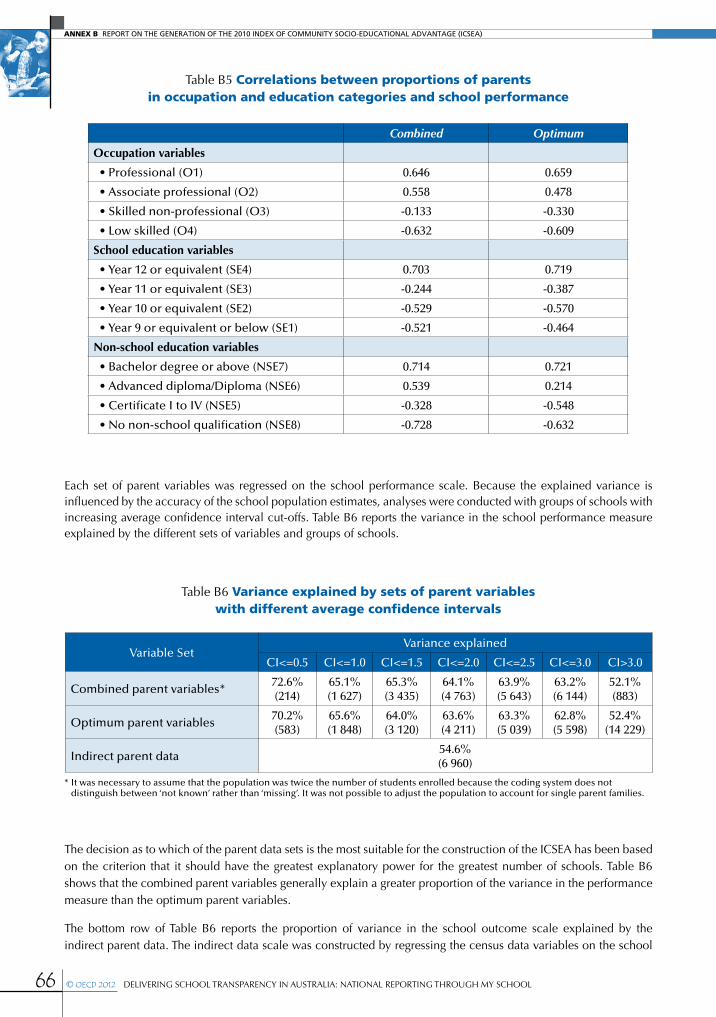
ANNEX B RepoRt on the geneRation of the 2010 index of Community SoCio-eduCational advantage (iCSea)
66 © OECD 2012 DELIVERING SCHOOL TRANSPARENCY IN AUSTRALIA: NATIONAL REPORTING THROUGH MY SCHOOL
Table B5 correlations between proportions of parents in occupation and education categories and school performance
Combined Optimum
Occupation variables
• Professional (O1) 0.646 0.659
• Associate professional (O2) 0.558 0.478
• Skilled non-professional (O3) -0.133 -0.330
• Low skilled (O4) -0.632 -0.609
School education variables
• Year 12 or equivalent (SE4) 0.703 0.719
• Year 11 or equivalent (SE3) -0.244 -0.387
• Year 10 or equivalent (SE2) -0.529 -0.570
• Year 9 or equivalent or below (SE1) -0.521 -0.464
Non-school education variables
• Bachelor degree or above (NSE7) 0.714 0.721
• Advanced diploma/Diploma (NSE6) 0.539 0.214
• Certificate I to IV (NSE5) -0.328 -0.548
• No non-school qualification (NSE8) -0.728 -0.632
Each set of parent variables was regressed on the school performance scale. Because the explained variance is influenced by the accuracy of the school population estimates, analyses were conducted with groups of schools with increasing average confidence interval cut-offs. Table B6 reports the variance in the school performance measure explained by the different sets of variables and groups of schools.
The decision as to which of the parent data sets is the most suitable for the construction of the ICSEA has been based on the criterion that it should have the greatest explanatory power for the greatest number of schools. Table B6 shows that the combined parent variables generally explain a greater proportion of the variance in the performance measure than the optimum parent variables.
The bottom row of Table B6 reports the proportion of variance in the school outcome scale explained by the indirect parent data. The indirect data scale was constructed by regressing the census data variables on the school
Table B6 variance explained by sets of parent variables with different average confidence intervals
Variable SetVariance explained
CI<=0.5 CI<=1.0 CI<=1.5 CI<=2.0 CI<=2.5 CI<=3.0 CI>3.0
Combined parent variables*72.6%(214)
65.1%(1 627)
65.3%(3 435)
64.1%(4 763)
63.9%(5 643)
63.2%(6 144)
52.1%(883)
Optimum parent variables70.2%(583)
65.6%(1 848)
64.0%(3 120)
63.6%(4 211)
63.3%(5 039)
62.8%(5 598)
52.4%(14 229)
Indirect parent data54.6%(6 960)
* It was necessary to assume that the population was twice the number of students enrolled because the coding system does not distinguish between ‘not known’ rather than ‘missing’. It was not possible to adjust the population to account for single parent families.
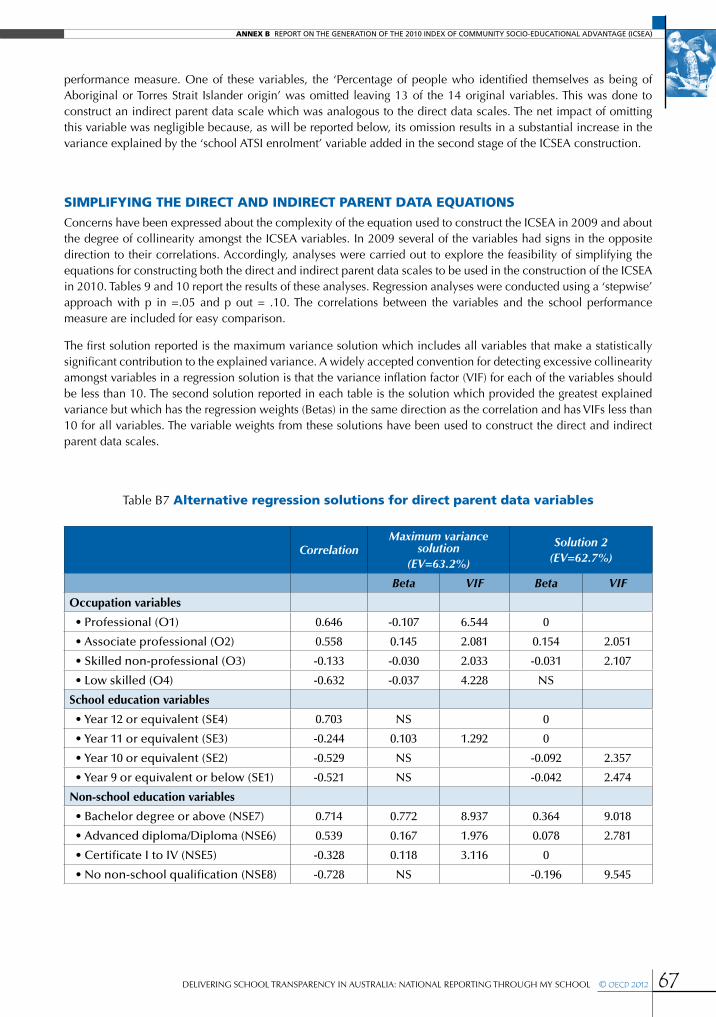
ANNEX B RepoRt on the geneRation of the 2010 index of Community SoCio-eduCational advantage (iCSea)
DELIVERING SCHOOL TRANSPARENCY IN AUSTRALIA: NATIONAL REPORTING THROUGH MY SCHOOL © OECD 2012 67
performance measure. One of these variables, the ‘Percentage of people who identified themselves as being of Aboriginal or Torres Strait Islander origin’ was omitted leaving 13 of the 14 original variables. This was done to construct an indirect parent data scale which was analogous to the direct data scales. The net impact of omitting this variable was negligible because, as will be reported below, its omission results in a substantial increase in the variance explained by the ‘school ATSI enrolment’ variable added in the second stage of the ICSEA construction.
simPlifying the direct and indirect Parent data equationsConcerns have been expressed about the complexity of the equation used to construct the ICSEA in 2009 and about the degree of collinearity amongst the ICSEA variables. In 2009 several of the variables had signs in the opposite direction to their correlations. Accordingly, analyses were carried out to explore the feasibility of simplifying the equations for constructing both the direct and indirect parent data scales to be used in the construction of the ICSEA in 2010. Tables 9 and 10 report the results of these analyses. Regression analyses were conducted using a ‘stepwise’ approach with p in =.05 and p out = .10. The correlations between the variables and the school performance measure are included for easy comparison.
The first solution reported is the maximum variance solution which includes all variables that make a statistically significant contribution to the explained variance. A widely accepted convention for detecting excessive collinearity amongst variables in a regression solution is that the variance inflation factor (VIF) for each of the variables should be less than 10. The second solution reported in each table is the solution which provided the greatest explained variance but which has the regression weights (Betas) in the same direction as the correlation and has VIFs less than 10 for all variables. The variable weights from these solutions have been used to construct the direct and indirect parent data scales.
Table B7 alternative regression solutions for direct parent data variables
CorrelationMaximum variance
solution(EV=63.2%)
Solution 2(EV=62.7%)
Beta VIF Beta VIF
Occupation variables
• Professional (O1) 0.646 -0.107 6.544 0
• Associate professional (O2) 0.558 0.145 2.081 0.154 2.051
• Skilled non-professional (O3) -0.133 -0.030 2.033 -0.031 2.107
• Low skilled (O4) -0.632 -0.037 4.228 NS
School education variables
• Year 12 or equivalent (SE4) 0.703 NS 0
• Year 11 or equivalent (SE3) -0.244 0.103 1.292 0
• Year 10 or equivalent (SE2) -0.529 NS -0.092 2.357
• Year 9 or equivalent or below (SE1) -0.521 NS -0.042 2.474
Non-school education variables
• Bachelor degree or above (NSE7) 0.714 0.772 8.937 0.364 9.018
• Advanced diploma/Diploma (NSE6) 0.539 0.167 1.976 0.078 2.781
• Certificate I to IV (NSE5) -0.328 0.118 3.116 0
• No non-school qualification (NSE8) -0.728 NS -0.196 9.545
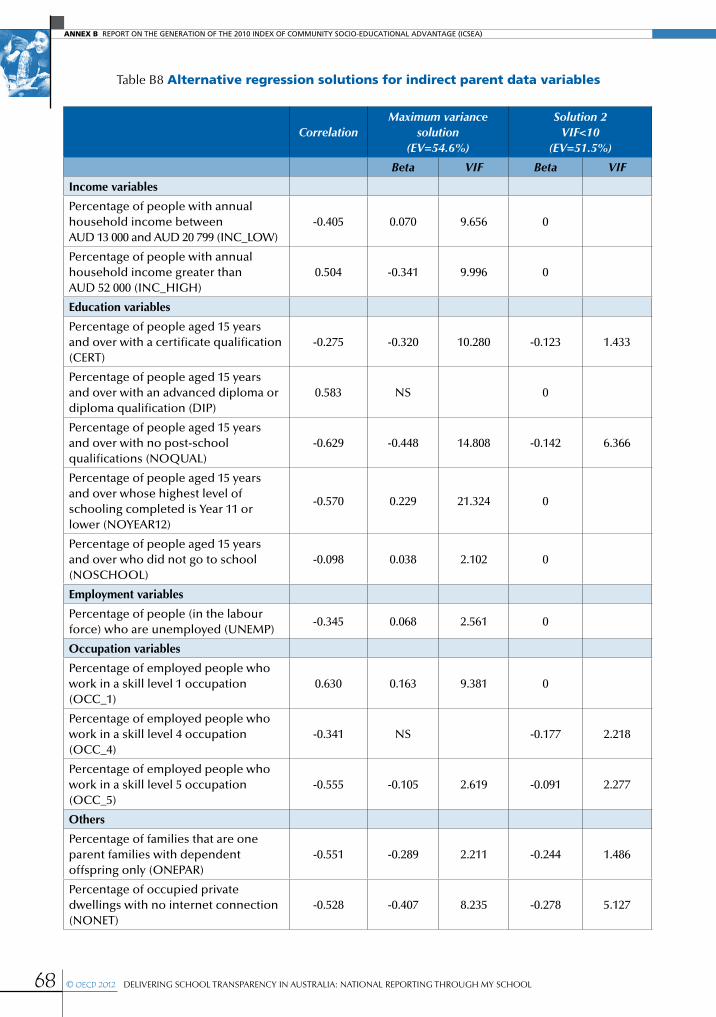
ANNEX B RepoRt on the geneRation of the 2010 index of Community SoCio-eduCational advantage (iCSea)
68 © OECD 2012 DELIVERING SCHOOL TRANSPARENCY IN AUSTRALIA: NATIONAL REPORTING THROUGH MY SCHOOL
Table B8 alternative regression solutions for indirect parent data variables
CorrelationMaximum variance
solution(EV=54.6%)
Solution 2VIF<10
(EV=51.5%)
Beta VIF Beta VIF
Income variables
Percentage of people with annualhousehold income betweenAUD 13 000 and AUD 20 799 (INC_LOW)
-0.405 0.070 9.656 0
Percentage of people with annualhousehold income greater thanAUD 52 000 (INC_HIGH)
0.504 -0.341 9.996 0
Education variables
Percentage of people aged 15 years and over with a certificate qualification (CERT)
-0.275 -0.320 10.280 -0.123 1.433
Percentage of people aged 15 years and over with an advanced diploma or diploma qualification (DIP)
0.583 NS 0
Percentage of people aged 15 years and over with no post-school qualifications (NOQUAL)
-0.629 -0.448 14.808 -0.142 6.366
Percentage of people aged 15 years and over whose highest level of schooling completed is Year 11 or lower (NOYEAR12)
-0.570 0.229 21.324 0
Percentage of people aged 15 years and over who did not go to school (NOSCHOOL)
-0.098 0.038 2.102 0
Employment variables
Percentage of people (in the labour force) who are unemployed (UNEMP)
-0.345 0.068 2.561 0
Occupation variables
Percentage of employed people who work in a skill level 1 occupation (OCC_1)
0.630 0.163 9.381 0
Percentage of employed people who work in a skill level 4 occupation (OCC_4)
-0.341 NS -0.177 2.218
Percentage of employed people who work in a skill level 5 occupation (OCC_5)
-0.555 -0.105 2.619 -0.091 2.277
Others
Percentage of families that are one parent families with dependent offspring only (ONEPAR)
-0.551 -0.289 2.211 -0.244 1.486
Percentage of occupied private dwellings with no internet connection (NONET)
-0.528 -0.407 8.235 -0.278 5.127
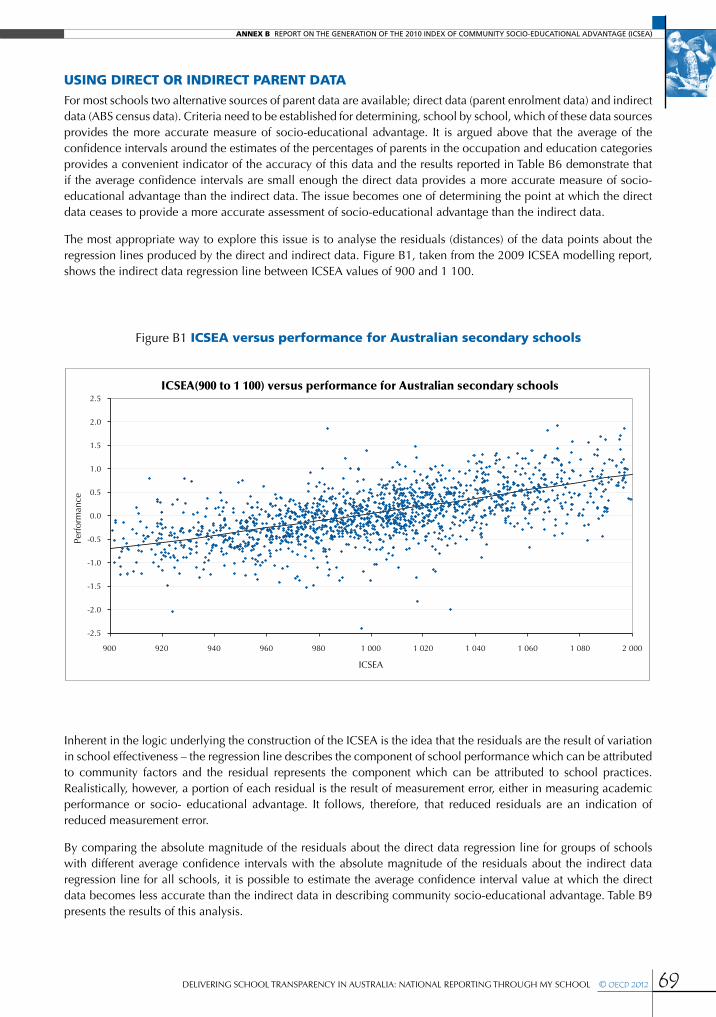
ANNEX B RepoRt on the geneRation of the 2010 index of Community SoCio-eduCational advantage (iCSea)
DELIVERING SCHOOL TRANSPARENCY IN AUSTRALIA: NATIONAL REPORTING THROUGH MY SCHOOL © OECD 2012 69
using direct or indirect Parent dataFor most schools two alternative sources of parent data are available; direct data (parent enrolment data) and indirect data (ABS census data). Criteria need to be established for determining, school by school, which of these data sources provides the more accurate measure of socio-educational advantage. It is argued above that the average of the confidence intervals around the estimates of the percentages of parents in the occupation and education categories provides a convenient indicator of the accuracy of this data and the results reported in Table B6 demonstrate that if the average confidence intervals are small enough the direct data provides a more accurate measure of socio-educational advantage than the indirect data. The issue becomes one of determining the point at which the direct data ceases to provide a more accurate assessment of socio-educational advantage than the indirect data.
The most appropriate way to explore this issue is to analyse the residuals (distances) of the data points about the regression lines produced by the direct and indirect data. Figure B1, taken from the 2009 ICSEA modelling report, shows the indirect data regression line between ICSEA values of 900 and 1 100.
Inherent in the logic underlying the construction of the ICSEA is the idea that the residuals are the result of variation in school effectiveness – the regression line describes the component of school performance which can be attributed to community factors and the residual represents the component which can be attributed to school practices. Realistically, however, a portion of each residual is the result of measurement error, either in measuring academic performance or socio- educational advantage. It follows, therefore, that reduced residuals are an indication of reduced measurement error.
By comparing the absolute magnitude of the residuals about the direct data regression line for groups of schools with different average confidence intervals with the absolute magnitude of the residuals about the indirect data regression line for all schools, it is possible to estimate the average confidence interval value at which the direct data becomes less accurate than the indirect data in describing community socio-educational advantage. Table B9 presents the results of this analysis.
Figure B1 icsea versus performance for australian secondary schools
ICSEA(900 to 1 100) versus performance for Australian secondary schools
-2.5
900 920 940 960 980 1 000
ICSEA
1 020 1 040 1 060 1 080 2 000
-2.0
-1.5
-1.0
-0.5
0.0
Perf
orm
ance
0.5
1.0
1.5
2.0
2.5
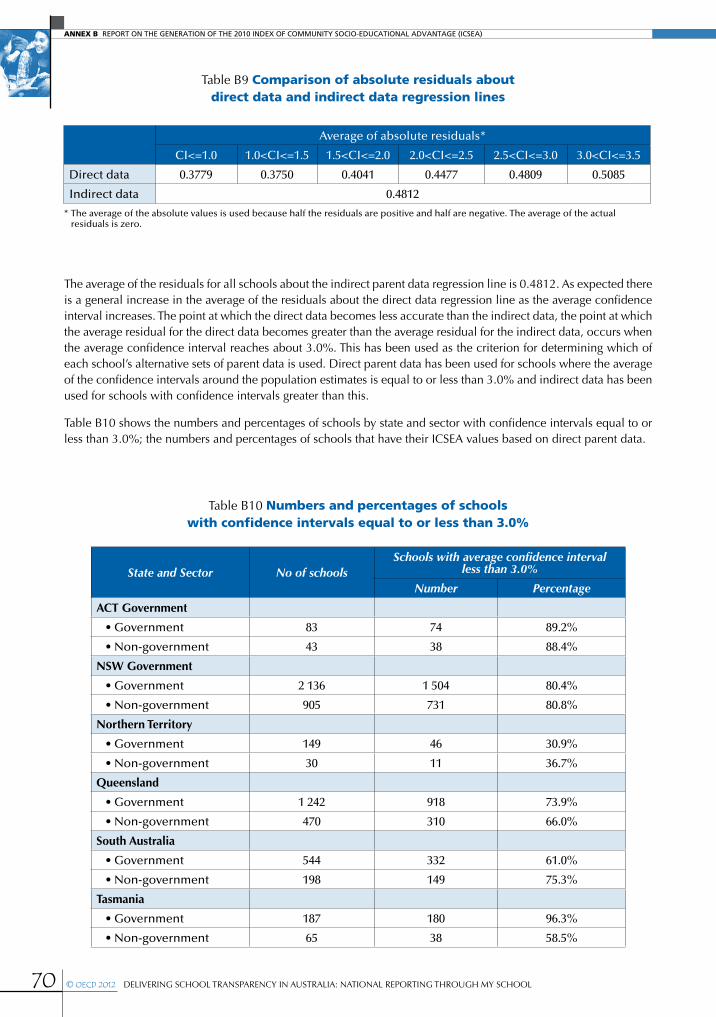
ANNEX B RepoRt on the geneRation of the 2010 index of Community SoCio-eduCational advantage (iCSea)
70 © OECD 2012 DELIVERING SCHOOL TRANSPARENCY IN AUSTRALIA: NATIONAL REPORTING THROUGH MY SCHOOL
Table B9 comparison of absolute residuals about direct data and indirect data regression lines
Average of absolute residuals*
CI<=1.0 1.0<CI<=1.5 1.5<CI<=2.0 2.0<CI<=2.5 2.5<CI<=3.0 3.0<CI<=3.5
Direct data 0.3779 0.3750 0.4041 0.4477 0.4809 0.5085
Indirect data 0.4812
* The average of the absolute values is used because half the residuals are positive and half are negative. The average of the actual residuals is zero.
The average of the residuals for all schools about the indirect parent data regression line is 0.4812. As expected there is a general increase in the average of the residuals about the direct data regression line as the average confidence interval increases. The point at which the direct data becomes less accurate than the indirect data, the point at which the average residual for the direct data becomes greater than the average residual for the indirect data, occurs when the average confidence interval reaches about 3.0%. This has been used as the criterion for determining which of each school’s alternative sets of parent data is used. Direct parent data has been used for schools where the average of the confidence intervals around the population estimates is equal to or less than 3.0% and indirect data has been used for schools with confidence intervals greater than this.
Table B10 shows the numbers and percentages of schools by state and sector with confidence intervals equal to or less than 3.0%; the numbers and percentages of schools that have their ICSEA values based on direct parent data.
State and Sector No of schoolsSchools with average confidence interval
less than 3.0%
Number Percentage
ACT Government
• Government 83 74 89.2%
• Non-government 43 38 88.4%
NSW Government
• Government 2 136 1 504 80.4%
• Non-government 905 731 80.8%
Northern Territory
• Government 149 46 30.9%
• Non-government 30 11 36.7%
Queensland
• Government 1 242 918 73.9%
• Non-government 470 310 66.0%
South Australia
• Government 544 332 61.0%
• Non-government 198 149 75.3%
Tasmania
• Government 187 180 96.3%
• Non-government 65 38 58.5%
Table B10 numbers and percentages of schools with confidence intervals equal to or less than 3.0%

ANNEX B RepoRt on the geneRation of the 2010 index of Community SoCio-eduCational advantage (iCSea)
DELIVERING SCHOOL TRANSPARENCY IN AUSTRALIA: NATIONAL REPORTING THROUGH MY SCHOOL © OECD 2012 71
It was demonstrated earlier that a school’s average confidence interval is determined by the size of its enrolment as well as its response rate; small schools need greater response rates to achieve similar confidence intervals to large schools - see Table B2. As expected, therefore, the majority of the schools with confidence intervals greater than 3.0% are small schools. Half of these schools have enrolments of less than 60 students.
aligning direct and indirect Parent data scalesThere were 6 789 schools that had:
•an average confidence interval for their direct parent data less than or equal to 3.0; and
•a value on the indirect parent data scale.
These 6 789 ‘moderation schools’ were divided into 10 groups of equal size (deciles) on the direct and indirect parent data scales and the medians of the sets of deciles were determined. (Note that a particular school is not necessarily in the same decile on the two different scales.
Table B11 reports the medians for the two sets of deciles and Figure B2 shows the relationship between them. Note that the scales are still in a roughly standardised form.
Victoria
• Government 1 493 1 338 89.6%
• Non-government 764 589 77.1%
Western Australia
• Government 746 388 52.0%
• Non-government 294 220 74.8%
Total 9 865 6 976 70.7%
Note: Numbers do not add up to totals because some schools could not be allocated to a particular sector.
Table B11 medians for indirect and direct parent data scale deciles
Decile Indirect data scale Direct data scale
1 -0.9642 -0.9820
2 -0.6148 -0.6973
3 -0.4545 -0.5101
4 -0.3133 -0.3380
5 -0.1705 -0.1527
6 -0.0238 0.0344
7 0.1578 0.2481
8 0.4165 0.5134
9 0.7591 0.8652
10 1.2647 1.3773
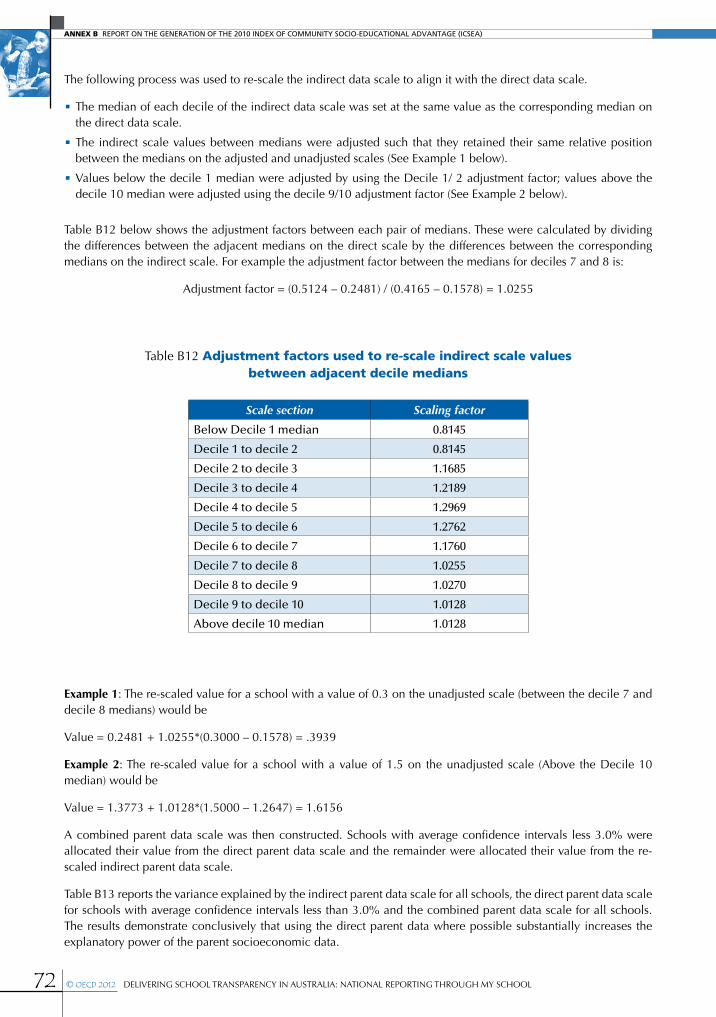
ANNEX B RepoRt on the geneRation of the 2010 index of Community SoCio-eduCational advantage (iCSea)
72 © OECD 2012 DELIVERING SCHOOL TRANSPARENCY IN AUSTRALIA: NATIONAL REPORTING THROUGH MY SCHOOL
The following process was used to re-scale the indirect data scale to align it with the direct data scale.
•The median of each decile of the indirect data scale was set at the same value as the corresponding median on the direct data scale.
•The indirect scale values between medians were adjusted such that they retained their same relative position between the medians on the adjusted and unadjusted scales (See Example 1 below).
•Values below the decile 1 median were adjusted by using the Decile 1/ 2 adjustment factor; values above the decile 10 median were adjusted using the decile 9/10 adjustment factor (See Example 2 below).
Table B12 below shows the adjustment factors between each pair of medians. These were calculated by dividing the differences between the adjacent medians on the direct scale by the differences between the corresponding medians on the indirect scale. For example the adjustment factor between the medians for deciles 7 and 8 is:
Adjustment factor = (0.5124 – 0.2481) / (0.4165 – 0.1578) = 1.0255
Example 1: The re-scaled value for a school with a value of 0.3 on the unadjusted scale (between the decile 7 and decile 8 medians) would be
Value = 0.2481 + 1.0255*(0.3000 – 0.1578) = .3939
Example 2: The re-scaled value for a school with a value of 1.5 on the unadjusted scale (Above the Decile 10 median) would be
Value = 1.3773 + 1.0128*(1.5000 – 1.2647) = 1.6156
A combined parent data scale was then constructed. Schools with average confidence intervals less 3.0% were allocated their value from the direct parent data scale and the remainder were allocated their value from the re-scaled indirect parent data scale.
Table B13 reports the variance explained by the indirect parent data scale for all schools, the direct parent data scale for schools with average confidence intervals less than 3.0% and the combined parent data scale for all schools. The results demonstrate conclusively that using the direct parent data where possible substantially increases the explanatory power of the parent socioeconomic data.
Table B12 adjustment factors used to re-scale indirect scale values between adjacent decile medians
Scale section Scaling factor
Below Decile 1 median 0.8145
Decile 1 to decile 2 0.8145
Decile 2 to decile 3 1.1685
Decile 3 to decile 4 1.2189
Decile 4 to decile 5 1.2969
Decile 5 to decile 6 1.2762
Decile 6 to decile 7 1.1760
Decile 7 to decile 8 1.0255
Decile 8 to decile 9 1.0270
Decile 9 to decile 10 1.0128
Above decile 10 median 1.0128

ANNEX B RepoRt on the geneRation of the 2010 index of Community SoCio-eduCational advantage (iCSea)
DELIVERING SCHOOL TRANSPARENCY IN AUSTRALIA: NATIONAL REPORTING THROUGH MY SCHOOL © OECD 2012 73
Table B13 variance explained by direct, indirect and combined parent data scales
Table B14 additional and total variance explained as additional variables are added
Explained variance
Indirect parent data scale 51.5%
Direct parent data scale 62.7%
Combined parent data scale 58.8%
inclusion of school variables – construction of the icseaAs in 2009 the quadratic and cubic variants of the parent data scale, the ‘school percentage of Aboriginal and Torres Strait (ATSI) enrolments’ and the school Accessibility/Remoteness Index of Australia (ARIA) values were then added to produce the ICSEA scale. Table 16 shows the results of progressively including these additional variables.
The additional variance explained by the ATSI enrolment variable (8.9%) is approximately twice as large as in the 2009 ICSEA scale. This is because the ABS variable ‘Percentage of people who identified themselves as being of Aboriginal or Torres Strait Islander origin’ was omitted from the calculation of the indirect data scale and there was no equivalent variable used in the construction of the direct data scale.
The inclusion of the quadratic component of the parent data scale increased the explained variance by 0.5% indicating that the relationship between parent socio-educational status and school performance is non-linear. The contribution of the remaining two variables was less than 0.1%.
The preliminary set of ICSEA values was scaled to a mean of 1 000 and a standard deviation of 100.
inclusion of a disadvantaged lbote adjustmentLBOTE students usually perform marginally better on average than their non-LBOTE colleagues. However, there is considerable variation in performance across the different language groups within the LBOTE community with some language groups being particularly disadvantaged. In response to community concerns, the 2010 ICSEA includes an adjustment for schools with students from these disadvantaged language groups.
Supplementary analyses show that parents of students in these disadvantaged language groups are likely to have lower school education levels than other LBOTE parents. Accordingly, an additional variable, the percentage of parents in the school community who were both LBOTE and who reported having a maximum school education level of Year 9 or equivalent was included in the calculation of the ICSEA. This additional variable is referred to as the ‘Disadvantaged LBOTE variable’.
VariablesExplained variance
Additional Total
Parent data 58.8%
+ Percentage of ATSI enrolments 8.9% 67.7%
+ parent data squared 0.5% 68.2%
+ parent data cubed <0.1% 68.2%
+ ARIA <0.1% 68.2%

ANNEX B RepoRt on the geneRation of the 2010 index of Community SoCio-eduCational advantage (iCSea)
74 © OECD 2012 DELIVERING SCHOOL TRANSPARENCY IN AUSTRALIA: NATIONAL REPORTING THROUGH MY SCHOOL
The LBOTE adjustment was limited to schools with a confidence interval less than or equal to 3.0% around the Disadvantaged LBOTE variable – the target schools. Because the adjustment was limited to a subset of schools it could not be calculated by simply adding the LBOTE school education variable to the preliminary ICSEA scale which includes all schools, as was done with the ‘school percentage of ATSI enrolments’ variable. The adjustment was calculated by carrying out separate regression analyses with the target schools with and without the Disadvantage LBOTE variable and calculating the difference. These differences were then subtracted from the preliminary ICSEA values of the target schools. The inclusion of this variable increased the explanatory power of the ICSEA by 0.1% for the target schools.
The Disadvantaged LBOTE adjustment factor is approximately -0.5 ICSEA points for each one per cent of disadvantaged LBOTE students in the school. The maximum possible reduction in the school ICSEA score is therefore approximately 50 points.
comParison of icsea 2009 and 2010Tables B15 and B16 provide a comparison of the variables used in the construction of ICSEA in 2010 and 2009.
Table B15 variables used in the construction of icsea in 2010
Table B16 variables used in the construction of icsea in 2009
Component Data source
Socio-educational information For 71% of schools this comprises 7 variables constructed from data supplied directly by parents – see Table B7
For 29% of schools this comprises 6 variables constructed from estimates based on ABS census data – see Table B8
Proportion of ATSI enrolments The proportion of Aboriginal and Torres Strait Islander students enrolled in the school as indicated in school enrolment records
Accessibility/Remoteness The school’s value on the Accessibility/Remoteness Index of Australia (ARIA)
Proportion of disadvantaged LBOTE students
The proportion of students from LBOTE families with parents having low school education levels as indicated in school enrolment records
Component Data source
Socio-educational information Thirteen variables constructed from estimates based on ABS census data - the variables listed in Table B8 excluding the proportion of unemployed parents and including the proportion of Aboriginal families in the community.
Proportion of ATSI enrolments The proportion of Aboriginal and Torres Strait Islander students enrolled in the school as indicated in school enrolment records
Accessibility/Remoteness The school’s value on the Accessibility/Remoteness Index of Australia (ARIA)

ANNEX B RepoRt on the geneRation of the 2010 index of Community SoCio-eduCational advantage (iCSea)
DELIVERING SCHOOL TRANSPARENCY IN AUSTRALIA: NATIONAL REPORTING THROUGH MY SCHOOL © OECD 2012 75
imPact of changes in the calculation of icsea
Table B17 2009-10 difference deciles
Figure B2 histogram of the differences between direct and indirect parent data icsea values
Decile Difference
1 -349.0 to -47.9
2 -47.9 to -32.0
3 -32.0 to -20.9
4 -20.9 to -11.6
5 -11.6 to -2.5
6 -2.5 to 6.8
7 6.8 to 6.9
8 16.9 to 29.5
9 29.5 to 49.5
10 49.5 to 428.3
Freq
uenc
y
ICSEA_diff
Mean =0.44Std. Dev. =43.93
N =9 221
-200 -150 -100 -50 0 50 100 150 200
0
500
1 000
1 500
2 000
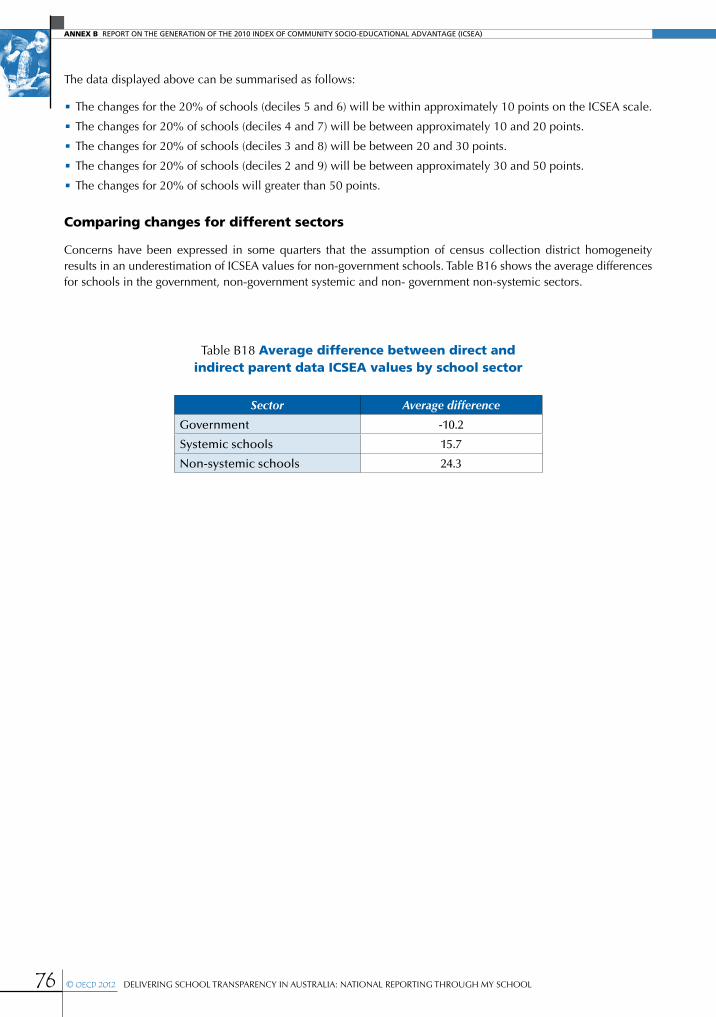
ANNEX B RepoRt on the geneRation of the 2010 index of Community SoCio-eduCational advantage (iCSea)
76 © OECD 2012 DELIVERING SCHOOL TRANSPARENCY IN AUSTRALIA: NATIONAL REPORTING THROUGH MY SCHOOL
The data displayed above can be summarised as follows:
•The changes for the 20% of schools (deciles 5 and 6) will be within approximately 10 points on the ICSEA scale.
•The changes for 20% of schools (deciles 4 and 7) will be between approximately 10 and 20 points.
•The changes for 20% of schools (deciles 3 and 8) will be between 20 and 30 points.
•The changes for 20% of schools (deciles 2 and 9) will be between approximately 30 and 50 points.
•The changes for 20% of schools will greater than 50 points.
comparing changes for different sectors
Concerns have been expressed in some quarters that the assumption of census collection district homogeneity results in an underestimation of ICSEA values for non-government schools. Table B16 shows the average differences for schools in the government, non-government systemic and non- government non-systemic sectors.
Table B18 average difference between direct and indirect parent data icsea values by school sector
Sector Average difference
Government -10.2
Systemic schools 15.7
Non-systemic schools 24.3


Please cite this publication as:
OECD (2012), Delivering School Transparency in Australia: National Reporting through My School, Strong Performers and Successful Reformers in Education, OECD Publishing. http://dx.doi.org/10.1787/9789264175884-en
This work is published on the OECD iLibrary, which gathers all OECD books, periodicals and statistical databases. Visit www.oecd-ilibrary.org, and do not hesitate to contact us for more information.
isbn 978-92-64-17563-1 98 2012 07 1 P -:HSTCQE=V\Z[XV:
strong Performers and successful Reformers in Education
Delivering school Transparency in AustralianATionAl REPoRTing ThRough My school
This case study describes the policy-making process in Australia leading to the public release of information on every school in Australia through the My School website. Policy lessons are described to provide insight for OECD member countries which may be grappling with similar issues in developing school accountability systems, particularly those working within federal-state contexts.
While some of the lessons from this policy development and implementation process relate specifically to Australia’s circumstances, there are general policy prescriptions of broader interest to other countries seeking to improve school education through measurement and reporting of key factors of school operations and performance.
contentsChapter 1. The policy challenge of delivering school transparency
Chapter 2. Policy background
Chapter 3. Decision making
Chapter 4. My School website launched
Chapter 5. Conclusion
stro
ng
Perfo
rmers an
d s
uccessfu
l Refo
rmers in E
du
cation D
elivering
sch
oo
l Transp
arency in A
ustralia
strong Performers and successful Reformers in Education
Delivering school Transparency in AustralianATionAl REPoRTing ThRough My school
982012071cov.indd 1 21-Jun-2012 2:25:51 PM