national blood authority agency resources … · 611 nba national blood authority agency resources...
TRANSCRIPT

611
NB
A
NATIONAL BLOOD AUTHORITY
Agency Resources and Planned Performance

612

613
NB
A
National Blood Authority Health and Ageing Portfolio Agency
Section 1: Agency Overview and Resources.................................................. 614 1.1: Agency Overview ........................................................................................ 614 1.2: Agency Resources ...................................................................................... 615 1.3: Budget Measures ........................................................................................ 616 1.4: Transition from Outcomes and Outputs to Outcomes and Programs......... 616
Section 2: Outcomes and Planned Performance............................................ 617 2.1: Outcomes and Performance Information .................................................... 617
Section 3: Explanatory Tables and Budgeted Financial Statements ........... 629 3.1: Explanatory Tables...................................................................................... 629 3.2: Budgeted Financial Statements .................................................................. 630

NBA – Agency Budget Statements – Agency Overview and Resources
614
Section 1: Agency Overview and Resources
1.1 Agency Overview The Australian Government provides funding to the National Blood Authority (NBA) to ensure that Australia’s blood supply is secure and well managed.
The NBA is an independent statutory agency, representing the interests of the Australian Government and all State and Territory Governments. The Australian Government established the NBA in July 2003 under the National Blood Authority Act 2003 as part of a coordinated approach to policy setting, governance, funding and management of the Australian blood banking and plasma product sector.
The NBA, on behalf of the Australian Government, manages and coordinates the Australian blood supply in accordance with the National Blood Agreement between the Australian, State and Territory Governments. This includes negotiating and managing national contracts with suppliers of blood and blood related products on behalf of all governments, which together will provide a total of $911 million in 2009-10 for this purpose. The NBA’s management of contracts enables the development of an agreed single national pricing schedule.
The NBA works with all governments and other responsible stakeholders to: implement an efficient demand-driven structure and blood supply system that is highly responsive to needs, based upon evidence and good clinical practice; and to ensure that Australia’s blood supply is safe, secure, adequate and affordable.

NBA – Agency Budget Statements – Agency Overview and Resources
615
NB
A
1.2 Agency Resources Table 1.2.1 shows the total resources from all origins. The table summarises how resources will be applied by outcome and by departmental classifications.
Table 1.2.1: NBA Resource Statement – Budget Estimates for 2009-10 as at Budget May 2009
Estimate Proposed Total Estimated of prior at Budget estimate available
year amounts appropriationavailable in
2009-10 2009-10 2009-10 2008-09$'000 $'000 $'000 $'000
Ordinary annual servicesDepartmental appropriation
Departmental appropriation* - 5,523 5,523 5,447Total - 5,523 5,523 5,447
Administered expenses*Outcome 1 - 7,708 7,708 10,893Total - 7,708 7,708 10,893
Total ordinary annual services - 13,231 13,231 16,340
Total available annual appropriations - 13,231 13,231 16,340
Special accountsOpening balance 187,489 187,489 182,835Appropriation receipts - 13,231 13,231 16,340Non-appropriation receipts toSpecial accounts# - 899,257 899,257 822,762
Total special account 187,489 912,488 1,099,977 1,021,937
Total resourcing 187,489 925,719 1,113,208 1,038,277
Less appropriations drawn fromannual or special appropriations aboveand credited to special accountsand/or CAC Act bodies through - (13,231) (13,231) (16,340)annual appropriations
Total net resourcing for NBA 187,489 912,488 1,099,977 1,021,937
Notes: All figures are GST exclusive.
* Appropriation Bill (No.1) 2009-10. # Non appropriation receipts do not balance to other receipts in Table 3.1.2 as these numbers are GST
exclusive.

NBA – Agency Budget Statements – Agency Overview and Resources
616
1.3 Budget Measures Section 1.3 is not applicable to the NBA in 2009-10.
1.4 Transition from Outcomes and Outputs to Outcomes and Programs
From the 2009-10 Budget, all General Government Sector (GGS) entities will be reporting on a Program basis. The table below outlines the transition from the 2008-09 Budget year (as at Additional Estimates), which was presented in administered items, outputs and output groups, to the program reporting framework used for the 2009-10 Budget. The table also captures revisions made to GGS Outcome Statements under the Operation Sunlight Outcome Statements Review.
Figure 1: Transition Table 2008-09 Budget Year
2009-10 Budget Year
Outcome 1:
Australia’s blood supply is secure and well managed
→
Outcome 1:
Access to a secure supply of safe and affordable blood products, including through national supply arrangements and coordination of best practice standards within agreed funding policies under the national blood arrangements
Program 1.1:
National Blood Authority
Output Group 1:
Meet product demand through effective planning and the management of supply arrangements
→
Program 1.1:
National blood agreement management
Note: Under the previous performance reporting structure, departmental activity was reported under departmental outputs. Under the new structure, departmental costs are reported as Programs.

NBA – Agency Budget Statements – Outcomes and Planned Performance
617
NB
A
Section 2: Outcomes and Planned Performance
2.1 Outcomes and Performance Information
Outcome 1 – Access to a secure supply of safe and affordable blood products, including through national supply arrangements and coordination of best
practice standards within agreed funding policies under the national blood arrangements
Outcome Strategy Through the NBA, the Australian Government aims to ensure that all Australians have access to a secure and well-managed blood supply. This will be achieved by the NBA, on behalf of the Australian, State and Territory Governments, by managing and coordinating the Australian blood supply in accordance with the National Blood Agreement, and developing and implementing arrangements for the secure supply of safe and affordable blood products and services. A key element is the establishment of purchasing arrangements for fresh, fractionated and recombinant products that deliver value for money. The NBA will also improve long-term planning and work with stakeholders to facilitate national improvements in the appropriate use of blood products.
The NBA is a major contributor to the blood sector in Australia, and seeks optimal patient outcomes consistent with the policy directions of Health Ministers. The NBA will work with all stakeholders, including suppliers of blood and blood products, to underpin supply arrangements with sector-wide risk management strategies that ensure the blood sector is able to provide responsive input to relevant wider health sector priorities.
The NBA will also promote and facilitate initiatives to improve blood sector performance, through identifying opportunities for improving the cost-effectiveness of the supply chain for plasma derived and recombinant blood products, and obtaining detailed information on product usage.
The achievement of improved clinical usage of blood and blood products remains a key objective of all governments. The NBA will facilitate improvements through the development and promulgation of evidence-based national standards and guidelines informed by close engagement with clinicians. The NBA will also facilitate the production and sharing of best practice information and data through clinical networks as well as discussion and research to improve the appropriate usage of blood and blood products.
Refer to discussions under Program 1.1: National blood agreement management for further information on these Government initiatives.

NBA – Agency Budget Statements – Outcomes and Planned Performance
618
NBA Trends Increasing demand for products has been one of the main drivers for the total cost of the blood and blood product supply, which has increased by an average of 11.9 per cent per annum from 2003-04 to 2007-08. Funding to the Australian Red Cross Blood Service (which collects and supplies fresh blood products) has increased by 10.6 per cent per annum over the same period, reflecting a combination of safer and higher quality products, cost increases and growth in demand. Although unit price growth for plasma-derived and recombinant blood products has been constrained below inflation, strong demand growth for clotting factors and intravenous immunoglobulin (IVIg) has resulted in a comparable cost growth for these products.
Trend Projection 1.1: Meeting the demand for red blood cells.
Trend 1.1 demonstrates the predicted growth in the demand for red blood cells over the Budget and three forward years. Red blood cells are used in major surgery and other treatments to supplement the patient’s own blood. Persons aged 65 and over use approximately 54 per cent of all red cells because older people require more complex surgery and medical treatments. Demand increase will therefore reflect the increasing proportion of the population that is in this age group. The NBA will work with the Australian Red Cross Blood Service to ensure that there is sufficient capacity to meet the increasing demand. The NBA is also working with the jurisdictions, clinicians and the Australian Red Cross Blood Service to improve the effectiveness of red blood cell use and reduce wastage.
Figure 2: Estimated increase in demand for red blood cells
736,808
757,034
777,972
798,322
822,577
845,367
768,919
744,250
833,907
811,377
680,000
700,000
720,000
740,000
760,000
780,000
800,000
820,000
840,000
860,000
2003-04 2004-05 2005-06 2006-07 2007-08 2008-09Estimate
2009-10Estimate
2010-11Estimate
2011-12Estimate
2012-13Estimate
Units
Year Source: NBA internal data 2009. Estimates are based on historical trends, current policy, regulatory provisions, clinical practice and population parameters, but do not reflect the potential impact of current and future initiatives designed to reduce the inappropriate use of blood.

NBA – Agency Budget Statements – Outcomes and Planned Performance
619
NB
A
Trend Projection 1.2: Meeting the demand for Intravenous Immunoglobulin.
Trend 1.2 demonstrates the impact of the continued strong growth in demand for IVIg across a broad range of conditions. IVIg is extracted from plasma collected from blood and plasma donations and is used in a wide range of therapies often for debilitating conditions where the patient’s immune system is deficient or defective. Australia will produce enough IVIg to meet approximately 78 per cent of demand in 2009-10. The remainder is imported to provide sufficient product to meet Australia’s needs and to mitigate supply risk. Despite usage per head in Australia being less than that in the United States of America and Canada, the historical growth of 14 per cent annually in IVIg is of concern. To ensure IVIg usage is clinically appropriate, the Criteria for the Clinical Use of Intravenous Immunoglobulin in Australia, which was implemented on 3 March 2008, contains evidence-based rules limiting the conditions for which IVIg is funded under the national blood arrangements. The criteria will be evaluated every three years to ensure continued alignment with new and emerging clinical outcome evidence.
Figure 3: Estimated increase in demand for IVIg
3,786,607
3,380,899
3,018,660
2,695,232
2,406,457
2,152,6781,898,527
1,666,8961,459,4161,345,431
-
500,000
1,000,000
1,500,000
2,000,000
2,500,000
3,000,000
3,500,000
4,000,000
2003-04 2004-05 2005-06 2006-07 2007-08 2008-09Estimate
2009-10Estimate
2010-11Estimate
2011-12Estimate
2012-13Estimate
gm
Year Source: NBA internal data 2009. Estimates are based on historical trends and current policy but do not fully reflect the potential impact of initiatives such as the Criteria for the Clinical Use of Intravenous Immunoglobulin (IVIg) in Australia.

NBA – Agency Budget Statements – Outcomes and Planned Performance
620
Trend Projection 1.3: Meeting the demand for Factor VIII, a blood clotting factor.
Trend 1.3 demonstrates the estimated growth in demand for Factor VIII, a clotting factor deficient in persons with haemophilia. Replacement therapy enables affected persons to lead healthy and longer lives. Increased demand is multi-factorial including increased prophylactic treatment regimes, increased number of patients, increasing patient weights, high usage in patients with inhibitors and increased surgical use as patients live longer.
Figure 4: Estimated increase in demand for Factor VIII
81,442,500
103,736,250
116,012,250
131,984,750
166,791,938
211,096,046
148,259,500
94,082,500
187,640,930
237,483,052
-
50,000,000
100,000,000
150,000,000
200,000,000
250,000,000
2003-04 2004-05 2005-06 2006-07 2007-08 2008-09Estimate
2009-10Estimate
2010-11Estimate
2011-12Estimate
2012-13Estimate
IU
Year Source: NBA internal data 2009. Estimates are based on historical trends, current policy, regulatory provisions, clinical practice and population parameters.

NBA – Agency Budget Statements – Outcomes and Planned Performance
621
NB
A
NBA Budgeted Expenses and Resources Table 2.1.1 provides an overview of the total expenses for the NBA by Program.
Table 2.1.1: Budgeted Expenses and Resources for the NBA
2008-09 2009-10Estimated Estimated
actual expensesexpenses
$'000 $'000Program 1.1: National blood agreement managementAdministered expenses
Special accountsNational Blood Authority Account 828,358 887,684National Managed Fund (Blood and Blood Products)
Special Account - -Net adjustment for non cash expenses (1,860) 3,331
Departmental expensesSpecial accounts
National Blood Authority Account 8,786 10,579Net adjustment for non cash expenses 590 544
Subtotal for Program 1.1 835,874 902,138
Total expenses for NBA 835,874 902,138
2008-09 2009-10Average staffing level (number) 51 47

NBA – Agency Budget Statements – Outcomes and Planned Performance
622
Contributions to the NBA Program 1.1: National blood agreement management
Program Objective Through this Program, the Australian Government aims to ensure that Australia’s blood supply is affordable, secure and well-managed. This will be achieved through effective planning, procurement, funding, contract and risk management and innovative sector performance improvement measures informed by strong engagement with stakeholders and the clinical community. The following discusses the key strategic directions the Australian Government will take through the NBA to help achieve this objective.
Key Strategic Directions This Program aims to:
• ensure the supply of all required blood and blood products through effective procurement and management of product availability;
• implement blood sector policy for the management of risk and sector performance improvement; and
• facilitate appropriate patient blood management and safe use of blood products.
Major Activities
Supply of Blood and Blood Products
The Australian Government is committed to ensuring the supply of all required blood and blood products to Australians. The NBA will achieve this by liaising with jurisdictions and suppliers, including the Australian Red Cross Blood Service, to ensure that day-to-day product supply and planned requirements for products into the future are managed to meet the needs of clinicians and patients.
The NBA will continue providing effective management of current contracts by working with suppliers to ensure contracted performance, improved data and reporting for the sector.
In 2009-10, the NBA will negotiate and commence new arrangements from 1 January 2010 with CSL Limited for the ongoing fractionation of Australian plasma and manufacture of key blood products such as IVIg and blood clotting factor products. The contract with the Australian Red Cross Blood Service for the continued collection and supply of fresh blood products, including red blood cells, will be extended pending implementation of a new contract in 2010-11. From 1 July 2009, the NBA will also implement extensions to current contracts with Baxter Healthcare, NovoNordisk and Wyeth for the supply of a several key imported blood clotting factor products which are not produced locally. In 2009-10, the NBA will review the market for IVIg to determine whether to extend current contracts beyond 31 December 2010 or to undertake a new procurement.
A key challenge in this area is achieving value-for-money in accordance with the objectives of the National Blood Agreement, in an environment where there are sole or a limited range of suppliers. As well, foreign exchange factors facing suppliers have affected the profitability of their Australian operations and, potentially, the sustainability of operating in Australia. The NBA gathers information on international prices and other business

NBA – Agency Budget Statements – Outcomes and Planned Performance
623
NB
A
intelligence to ensure that it is a well informed purchaser, constructing its tenders and contracts to best achieve value-for-money.
In 2009-10, the NBA will refine and fully implement a methodology for evidence-based evaluation and advice to governments to support decisions about additions or changes to products or services funded under the National Blood Agreement. This will ensure a consistent and transparent approach for meeting governments’ requirements for the funding and supply of safe, cost-effective products. A key challenge in this work is the appropriate balance between cost-effective analysis and the many other policy objectives in the National Blood Agreement.
The NBA, on behalf of all governments, will continue to develop its knowledge framework to provide expert advice and information to governments on the changing markets, trends and global issues that affect the blood sector. In 2009-10, the NBA will continue to develop improved supply planning and demand modelling processes to incorporate new data sources and an improved understanding of clinical use. The NBA will also provide expert advice to governments on future procurement activities, which will consider the impact of the global financial crisis on international suppliers as well as changing global supply/demand and industry dynamics. This analysis and advice will influence the timing and nature of approaches to the market to support the objectives of providing best value-for-money while maintaining a secure supply of blood products. A key challenge in this area is the ability to effectively model future demand when patterns of use can change quickly and evidence for current and emerging practices are limited.
Risk Management and Sector Performance Improvement
The Australian Government is committed to ensuring that the supply of all required blood and blood products to Australians is maintained in all foreseeable scenarios. It is also committed to improving the management and performance of the Australian blood sector through the effective implementation of evidence-based blood sector policy. The NBA will contribute to this by continuing to undertake contingency and risk management planning to provide accurate and timely information for decision-making.
In 2009-10, the NBA will consult with relevant jurisdictions, medical experts and other stakeholders to further improve the National Blood Supply Contingency Plan. The Plan includes strategies for managing the blood supply throughout Australia in situations of increased demand or a reduction in supply capacity that are specific to the blood sector or that are generated by circumstances within the wider health sector. A key direction for 2009-10 is to integrate blood sector contingency planning into broader public health analysis, information and decision-making with regard to transfusion transmitted infections through detailed engagement with the Communicable Disease Network of Australia and the Public Health Laboratory Network of Australia.
Driving sector performance improvements requires the NBA to understand all facets of the collection, production, distribution and usage of products, as well as monitoring supplier performance as driven by the NBA’s contract management. In 2009-10, several projects will advance this responsibility. A key challenge in this area is to provide nationally reliable and relevant information with a disparate set of systems and processes in each jurisdiction and limited information flows. In 2008, the NBA developed and had endorsed by the Jurisdictional Blood Committee a national data and information management strategy. The NBA will continue to implement this strategy in 2009-10 and refine innovative solutions to maximise information capture from disparate systems.

NBA – Agency Budget Statements – Outcomes and Planned Performance
624
In 2009-10, the NBA will continue a review of the distribution arrangements for plasma and recombinant products to identify performance improvement opportunities for the blood sector. The initial phase of the review was completed in 2008-09 and involved information gathering and analysis across the sector and identified possible opportunities for efficiencies through improved supply chain management of product inventories. Further work to identify implementation approaches will continue in 2009-10 through detailed engagement with distribution and logistic experts, product suppliers and hospitals. The core challenge during 2009-10 will be the ability to achieve change and move towards more contemporary supply chain practices in a system that has evolved over many years.
Following the initial implementation of the data collection capacity of the Australian Bleeding Disorder Registry in December 2008, the NBA will enhance the data aggregation and reporting capabilities through 2009-10. When fully operational, the Registry will inform both governments and the clinical community about patient demographics, product use and dosing trends, and will support improvement in a number of areas including demand modelling for Factor VIII.
Work as part of the contract negotiations to benchmark performance of contracts for price and quality will also provide reference points for sector performance improvement. Central to these challenges is the completion of the Output Based Funding Model for the Australian Red Cross Blood Service that will allow more transparency and accountability at all levels of the blood sector, as well as allow for appropriate international comparisons.
The NBA will improve the production and sharing of best practice information and data with clinical networks through the Blood Measures project. The outcomes of this project will facilitate research in the blood sector, based on agreed definitions, which will allow comparison and analysis over time.
Appropriate Patient Blood Management and Safe Use of Blood and Blood Products
The Australian Government is committed to promoting safe, high quality management and use of blood and blood related products and services in Australia. The NBA will achieve this by working and consulting with key stakeholders such as clinical speciality colleges to develop and promulgate national standards and guidelines, to influence blood usage.
The NBA will support appropriate patient blood management by working with the National Health and Medical Research Council1 to produce new guidelines for the use of fresh blood components such as red blood cells. In total there will be six guidelines covering the principal areas of use. The research and analysis for this work will continue in 2009-10 through the continuation of direct engagement with clinical experts. The innovative patient focused structure of these guidelines will produce a world leading guide on the appropriate use of blood products and will enhance Australia’s standing in supporting patient blood management requirements.
The core challenge for this work is to obtain rigorous evidence on which to base advice. This will be addressed through the appointment of professional systematic reviewers with experience in evidence-based evaluations. Where high quality evidence is not available, the guidelines will provide ‘practice tips’ developed from consultations and research on emerging current best practice.
1 For further discussion of the National Health and Medical Research Council (NHMRC), refer to the NHMRC
chapter located later in these Portfolio Budget Statements.

NBA – Agency Budget Statements – Outcomes and Planned Performance
625
NB
A
The NBA will also commence a review of the Criteria for the Clinical Use of Intravenous Immunoglobulin in Australia to update the current criteria. This review will access all available clinical evidence and utilise clinical expertise to ensure the criteria continue to reflect best possible clinical practice.
The NBA will also work with government agencies and clinicians to set standards for measurement and facilitate the dissemination of information that will influence blood usage. This work is designed to reduce inappropriate or unnecessary transfusions, thereby minimising risk for patients and decreasing demand for product. In 2009-10, the NBA will build on the existing investment within jurisdictions to identify core and agreed minimum data sets in the area of haemovigilance and report these results progressively over time. The NBA will further refine Australia’s haemovigilance program by expanding reporting to more jurisdictions and identifying strategies to improve practices that lead to adverse events involving blood transfusions such as incorrect specimen labelling.
The NBA will also facilitate a more detailed analysis of red cell usage data through state-based data linkage projects to provide unique and world leading views on the appropriateness of the use of red cell products in Australia. The major challenge in this project will be to devise a methodology that will allow the disparate data collection systems within each jurisdiction to provide information against the agreed minimum data set.
Program 1.1: Expenses The NBA is mainly funded jointly by the Commonwealth, and States and Territories on a 63 per cent: 37 per cent basis through annual contributions. These contributions meet the cost of the supply of blood and blood products as well as NBA operational costs. All NBA receipts and payments are accounted through Special Accounts.
The movement in administered expenses, which relate to the cost of the supply of blood and blood products, reflects the ongoing demand and price changes for these products.
Program support expenses cover the employee and supplier costs of the NBA.
Further details are provided in 3.2.2 Analysis of Budgeted Financial Statements.
Table 2.1.2: Program Expenses
2008-09 2009-10 2010-11 2011-12 2012-13Estimated Budget Forward Forward Forward
actual year 1 year 2 year 3$'000 $'000 $'000 $'000 $'000
Annual administered expenses:Special account expenses:
National Blood Authority Account 828,358 887,684 988,954 1,082,585 1,190,881National Managed Fund (Blood
and Blood Products)Special Account - - - - -
Net adjustment for non cash expenses (1,860) 3,331 5,695 5,182 5,874
Program support 9,376 11,123 10,392 9,857 8,883
Total Program expenses 835,874 902,138 1,005,041 1,097,624 1,205,638

NBA – Agency Budget Statements – Outcomes and Planned Performance
626
Program 1.1: Deliverables To ensure all Australians have access to a secure supply of safe and affordable blood products, Program 1.1 provides funding to: manage blood supply contracts and arrangements; enhance risk management strategies and drive sector performance improvement; and monitor and improve the use of blood and blood products. The NBA has overall responsibility for the ‘deliverables’ that contribute to the Program.
Qualitative Deliverables Supply of Blood and Blood Products
• Manage the performance of contracted suppliers through 2009-10 through monitoring outputs and Key Performance Indicators, and auditing supplier reports.
• Continue and improve plasma fractionation and product distribution by concluding a new contract with CSL Limited.
• Continue and improve the supply of blood and blood products by agreeing future contractual arrangements with the Australian Red Cross Blood Service by June 2010.
• Continue the supply of imported plasma derived and recombinant blood products by implementing extensions to supply contracts with Baxter Healthcare, NovoNordisk and Wyeth.
• Review procurement options for the future supply of imported IVIg by May 2010.
• Improve the processes for adding products to the national product list by researching and recommending a methodology for evaluating proposals.
Risk Management and Sector Performance Improvement
• Increase the scope of the National Blood Supply Contingency Plan by submitting the transfusion transmitted infection annex for Ministerial clearance by June 2010.
• Identify performance improvement opportunities for the blood sector by finalising the Review of the Distribution Arrangements for Plasma and Recombinant Products by June 2010.
• Enhance the Australian Bleeding Disorder Register reporting capability by June 2010.
• Implement the recommendations of the independent business study of the Australian Red Cross Blood Service by June 2010.
• Finalise details of the Output Based Funding Model for the Australian Red Cross Blood Service contract by June 2010.
• Publication of the Blood Measures outcomes by September 2009.
Appropriate Patient Blood Management and Safe Use of Blood and Blood Products
• Provide clinicians with evidence-based information on safe and appropriate blood management by releasing two elements of the National Health and Medical Research Council Clinical Practice Guidelines for Patient Blood Management by 30 June 2010.
• Provide clinicians and stakeholders with information on the safe use of blood by publishing the second National Haemovigilance Report by June 2010.

NBA – Agency Budget Statements – Outcomes and Planned Performance
627
NB
A
• Ensure the continued alignment of the Criteria for the Clinical Use of Intravenous Immunoglobulin in Australia with new and emerging clinical outcome evidence by agreeing the methodology for a review of the criteria by December 2009.
• Facilitate a more detailed analysis of red cell usage data by recommending methodology for a red cell usage linkage model to all jurisdictions by March 2010.
Table 2.1.3: Quantitative Deliverables for Program 1.1
Quantitative Deliverables
2008-09 Revised Budget
2009-10 Budget
2010-11 Forward Year 1
2011-12 Forward Year 2
2012-13 Forward Year 3
Supply of Blood and Blood Products
Number of blood supply contracts managed. 13 13 14 14 14
Appropriate Patient Blood Management and Safe Use of Blood and Blood Products
Number of National Health and Medical Research Council product guidelines produced (release of guidelines to begin in 2009-10).
N/A 2 2 2 N/A
Program 1.1: Key Performance Indicators The following ‘key performance indicators’ measure the impact of the Program.
Qualitative Indicators Supply of Blood and Blood Products
• Management and coordination of Australia’s blood supply in accordance with the National Blood Agreement between the Australian, State and Territory Governments. Measured by the level of satisfaction of all funding jurisdictions with planning, management and coordination of blood supply.
• Management of the methodology and processes for adding products to the national product list. Measured by the level of satisfaction of all funding jurisdictions with the NBA’s management.
Risk Management and Sector Performance Improvement
• Management of the National Blood Supply Contingency Plan. Measured by the level of satisfaction of all funding jurisdictions with the NBA’s management and implementation, when appropriate.
• Review of Distribution Arrangements for Plasma and Recombinant Products completed to review timetable.

NBA – Agency Budget Statements – Outcomes and Planned Performance
628
• The Australian Bleeding Disorder Registry meets stakeholder expectations. Measured by the level of satisfaction of stakeholders with Australian Bleeding Disorder Registry management and functionality.
Table 2.1.4: Quantitative Key Performance Indicators for Program 1.1
Quantitative Indicators
2008-09 Revised Budget
2009-10 Budget Target
2010-11 Forward Year 1
2011-12 Forward Year 2
2012-13 Forward Year 3
Supply of Blood and Blood Products
Cost-effectiveness of the management of the National Blood Agreement. Measured by comparison of administration costs with national supply plan budget.
1.4% 1.4% <1.4% <1.4% <1.4%
Variance between actual and NBA estimated total demand for supply of products.
<5% <5% <5% <5% <5%
Risk Management and Sector Performance Improvement
Number of days the National Blood Supply Contingency Plan is activated for plasma and recombinant products.2
0 0 0 0 0
2 The National Blood Supply Contingency Plan is only activated in the event that stocks of products are
insufficient to meet demand. In managing the supply of products, the NBA aims to ensure that there is always sufficient stock to meet demand.

NBA – Agency Budget Statements – Budgeted Financial Statements
629
NB
A
Section 3: Explanatory Tables and Budgeted Financial Statements
Section 3 presents explanatory tables and budgeted financial statements which provide a comprehensive snapshot of agency finances for the Budget year 2009-10. It explains how budget plans are incorporated into the financial statements and provides further details of the reconciliation between appropriations and Program expenses, movements in administered funds, special accounts and Government Indigenous expenditure.
3.1 Explanatory Tables 3.1.1 Movement of Administered Funds Between Years Section 3.1.1 is not applicable to the NBA. 3.1.2 Special Accounts Special accounts provide a means to set aside and record amounts used for specified purposes. Special Accounts can be created by a Finance Minister’s Determination under the Financial Management and Accountability Act 1997 or under separate enabling legislation. Table 3.1.2 shows the expected additions (receipts) and reductions (payments) for each account used by the NBA.
Table 3.1.2: Estimates of Special Account Cash Flows and Balances
Opening Appropriation Other Closingbalance receipts receipts Payments balance2009-10 2009-10 2009-10 2009-10 2009-102008-09 2008-09 2008-09 2008-09 2008-09
Outcome $'000 $'000 $'000 $'000 $'000
National Blood Authority Account - s21 FMA Act [National Blood 1 114,654 4,746 976,041 976,248 119,193 Authority Act 2003 ]A 122,068 6,978 899,227 913,619 114,654
National Blood Authority
Account - s21 FMA Act
[National Blood 1 9,107 5,523 3,677 11,013 7,294 Authority Act 2003 ]D 8,949 5,447 3,866 9,155 9,107
National Managed Fund (Blood and BloodProducts) Special 1 63,728 2,962 7,995 - 74,685 Account - s20 FMA 51,818 3,915 7,995 - 63,728
Total specialaccounts2009-10 Estimate 187,489 13,231 987,713 987,261 201,172
Total special accounts2008-09 estimate actual 182,835 16,340 911,088 922,774 187,489
Notes: D = Departmental; A = Administered

NBA – Agency Budget Statements – Budgeted Financial Statements
630
3.1.3 Australian Government Indigenous Expenditure The 2009-10 Australian Government Indigenous Expenditure Statement is not applicable because the NBA has no specific Indigenous expenses.
3.2 Budgeted Financial Statements 3.2.1 Differences in Agency Resourcing and Financial Statements Section 3.2.1 is not applicable to the NBA.
3.2.2 Analysis of Budgeted Financial Statements An analysis of the NBA’s budgeted financial statements for 2009-10 is provided below.
Departmental Resources Comprehensive Income Statement
NBA operational costs are funded jointly by the Australian, State and Territory Governments on a 63%:37% basis through annual contributions. All NBA receipts and payments are accounted through special accounts.
NBA operational funding was increased for the four years from 2005-06 to 2008-09 to build capacity, particularly for risk management, appropriate patient blood management and the safe use of blood and blood products. While all planned initiatives in these areas are well underway, several factors have caused the progress of implementation to slip resulting in an accumulation of funds not yet spent.
Drawing on these accumulated funds to meet the staffing and other costs of completing these initiatives will result in operating deficits in 2009-10, 2010-11 and 2011-12. These deficits have been approved by the Minister for Finance and Deregulation.
With the full implementation of these initiatives by 2012-13, staffing and other costs will be managed down to the level of funding provided for the NBA’s core procurement, supply management and contract management activities.
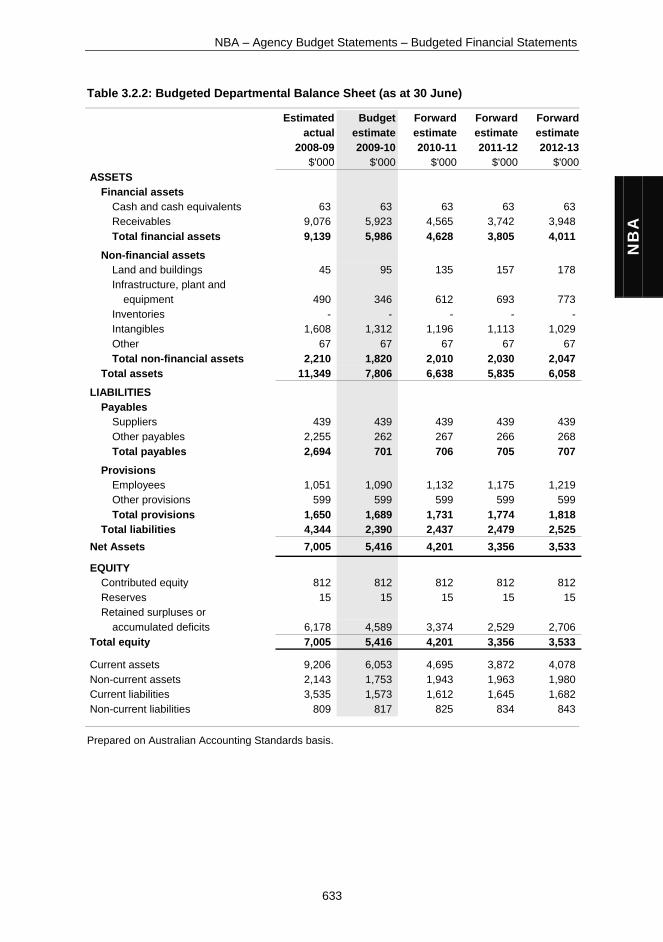
Balance Sheet
Special account accumulated funds are held within the Official Public Account and included as Receivables in the Balance Sheet. The level of Receivables will fall as accumulated funds are used to meet expenses in 2009-10 to 2011-13. The NBA will maintain sufficient accumulated funds to cover employee entitlements and other liabilities.
The value of intangible assets will fall over 2009-10 and forward years reflecting the use and amortisation of the new integrated data management system. Other non-financial assets and liabilities will remain broadly stable over the period.
Administered Resources
Schedule of Budgeted Income and Expenses Administered on Behalf of Government
The NBA administered accounts include contributions from all states and territories and the Australian Government for the supply of blood and blood related products for 2009-10. Each year the Australian Health Ministers’ Council approves an Annual National Supply Plan and Budget which is formulated by the NBA from demand estimates provided by the states and territories.

NBA – Agency Budget Statements – Budgeted Financial Statements
631
NB
A
The 2009-10 Budget for the supply of blood and blood products has increased by $64.5 million from 2008-09 reflecting increased demand and price rises.
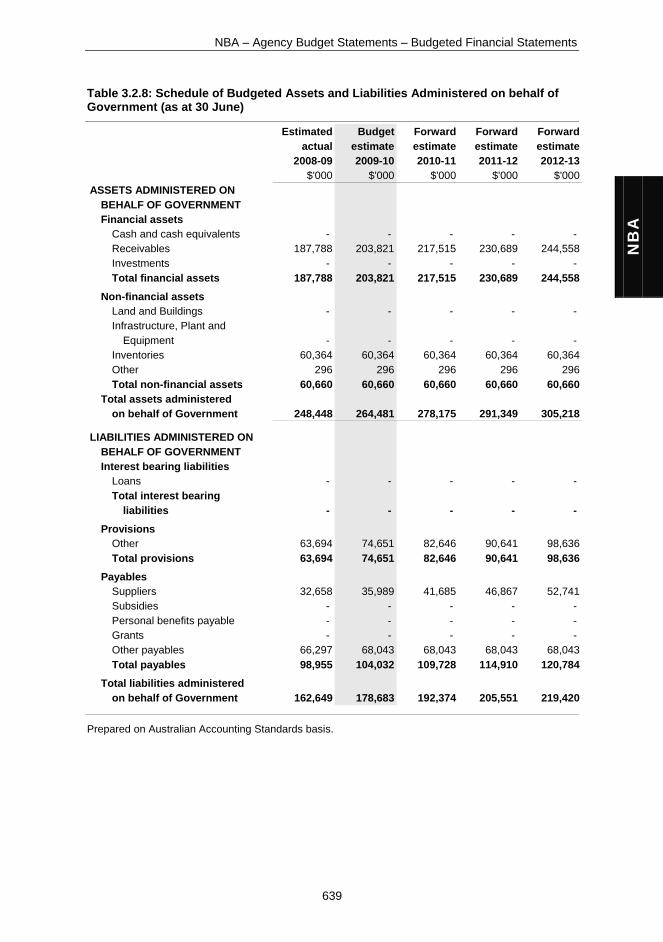
Schedule of Budgeted Assets and Liabilities Administered on Behalf of Government
The schedule of budgeted assets and liabilities administered on behalf of Government illustrates normal movements in non-financial assets and liabilities. The increase in Receivables over the forward years relates mainly to contributions received from the Australian Government, states and territories for ongoing purchases of blood and blood products and funding of the National Managed Fund. These amounts are held in the Official Public Account and treated as Receivables in the schedule of budgeted assets and liabilities.

NBA – Agency Budget Statements – Budgeted Financial Statements
632
3.2.3 Budgeted Financial Statements Tables Table 3.2.1: Budgeted Departmental Comprehensive Income Statement (for the period ended 30 June)
Estimated Budget Forward Forward Forwardactual estimate estimate estimate estimate
2008-09 2009-10 2010-11 2011-12 2012-13$'000 $'000 $'000 $'000 $'000
EXPENSESEmployee benefits 4,840 6,244 5,803 5,495 4917Supplier 3,590 3,990 3,682 3,432 3,036 Grants - - - - - Depreciation and amortisation 946 890 907 930 930 Write-down and impairment of
assets - - - - - Losses from asset sales - - - - - Finance costs - - - - - Other - - - - - Total expenses 9,376 11,124 10,392 9,857 8,883
LESS: OWN-SOURCE INCOME
RevenueSale of goods and rendering
of services - - - - - Fees and fines - - - - - Interest - - - - - Other revenue 3,949 3,593 3,299 3,292 3,311 Total revenue 3,949 3,593 3,299 3,292 3,311
GainsSale of assets - - - - - Other gains 96 115 115 115 115 Total gains 96 115 115 115 115
Total own-source income 4,045 3,708 3,414 3,407 3,426
Net cost of (contribution by) services 5,331 7,416 6,978 6,450 5,457
Appropriation revenue 5,447 5,523 5,617 5,605 5,637
Surplus (Deficit) 116 (1,893) (1,361) (845) 180
Surplus (Deficit) attributable to the Australian Government 116 (1,893) (1,361) (845) 180
Prepared on Australian Accounting Standards basis.
NBA – Agency Budget Statements – Budgeted Financial Statements
633
NB
A
Table 3.2.2: Budgeted Departmental Balance Sheet (as at 30 June)
Estimated Budget Forward Forward Forwardactual estimate estimate estimate estimate
2008-09 2009-10 2010-11 2011-12 2012-13$'000 $'000 $'000 $'000 $'000
ASSETSFinancial assets
Cash and cash equivalents 63 63 63 63 63 Receivables 9,076 5,923 4,565 3,742 3,948 Total financial assets 9,139 5,986 4,628 3,805 4,011
Non-financial assetsLand and buildings 45 95 135 157 178 Infrastructure, plant and
equipment 490 346 612 693 773 Inventories - - - - - Intangibles 1,608 1,312 1,196 1,113 1,029 Other 67 67 67 67 67 Total non-financial assets 2,210 1,820 2,010 2,030 2,047
Total assets 11,349 7,806 6,638 5,835 6,058
LIABILITIESPayables
Suppliers 439 439 439 439 439 Other payables 2,255 262 267 266 268 Total payables 2,694 701 706 705 707
ProvisionsEmployees 1,051 1,090 1,132 1,175 1,219 Other provisions 599 599 599 599 599 Total provisions 1,650 1,689 1,731 1,774 1,818
Total liabilities 4,344 2,390 2,437 2,479 2,525 Net Assets 7,005 5,416 4,201 3,356 3,533
EQUITYContributed equity 812 812 812 812 812 Reserves 15 15 15 15 15 Retained surpluses or
accumulated deficits 6,178 4,589 3,374 2,529 2,706 Total equity 7,005 5,416 4,201 3,356 3,533
Current assets 9,206 6,053 4,695 3,872 4,078 Non-current assets 2,143 1,753 1,943 1,963 1,980 Current liabilities 3,535 1,573 1,612 1,645 1,682 Non-current liabilities 809 817 825 834 843
Prepared on Australian Accounting Standards basis.

NBA – Agency Budget Statements – Budgeted Financial Statements
Table 3.2.3: Budgeted Departmental Statement of Cash Flows (for the period ended 30 June)
Estimated Budget Forward Forward Forwardactual estimate estimate estimate estimate
2008-09 2009-10 2010-11 2011-12 2012-13$'000 $'000 $'000 $'000 $'000
OPERATING ACTIVITIESCash received
Appropriations 5,447 5,523 5,617 5,605 5,637 Interest - - - - - Net GST received 454 430 405 380 341 Other cash received 3,412 5,060 4,660 4,112 3,313 Total cash received 9,313 11,013 10,682 10,097 9,291
Cash usedEmployees 5,302 6,404 5,962 5,652 5,072 Suppliers 2,954 3,675 3,367 3,117 2,721 Net GST paid 369 434 403 378 338 Cash to the Official Public Account 159 - - - 210
Total cash used 8,784 10,513 9,732 9,147 8,341 Net cash from (or used by)
operating activities 529 500 950 950 950
INVESTING ACTIVITIESCash used
Purchase of property, plant and equipment 530 500 950 950 950
Total cash used 530 500 950 950 950 Net cash from (or used by)
investing activities (530) (500) (950) (950) (950)
Net cash from (or used by) financing activities - - - - -
Net increase (or decrease)in cash held (1) - - - - Cash at the beginning of
the reporting period 64 63 63 63 63 Cash at the end of the
reporting period 63 63 63 63 63
Prepared on Australian Accounting Standards basis.
634

NBA – Agency Budget Statements – Budgeted Financial Statements
Table 3.2.4: Departmental Statement of Changes in Equity – Summary of Movement (Budget year 2009-10)
Retained Asset Other Contributed Totalearnings revaluation reserves equity/ equity
reserve capital$'000 $'000 $'000 $'000 $'000
Opening balance as at 1 July 2009 6,178 15 - 812 7,005 Adjustment 304 304 Net operating result (1,893) - - - (1,893) Appropriation (equity
injection) - - - - -
Estimated closing balanceas at 30 June 2010 4,589 15 - 812 5,416
NB
A
635

NBA – Agency Budget Statements – Budgeted Financial Statements
636
Table 3.2.5: Departmental Capital Budget Statement
Estimated Budget Forward Forward Forward actual estimate estimate estimate estimate
2008-09 2009-10 2010-11 2011-12 2012-13$'000 $'000 $'000 $'000 $'000
CAPITAL APPROPRIATIONSTotal equity injections - - - - - Total loans - - - - - Special appropriations - - - - - Total capital
appropriations - - - - -
Represented by:Purchase of non-financial
assets - - - - - Other - - - - - Total represented by - - - - -
ACQUISITION OF NON-FINANCIAL ASSETSFunded by capital
appropriations - - - - - Funded internally from
Departmental resources* 530 500 950 950 950 Assets received due to
restructure (FMA s32) - - - - - Total acquisitions of
non-financial assets 530 500 950 950 950
Note * Includes the following sources of funding: - annual and prior year appropriations; - donations and contributions; - gifts; - finance leases; - internally developed assets; - s31 relevant agency receipts; and - proceeds from the sale of assets.
NBA – Agency Budget Statements – Budgeted Financial Statements
637
NB
A
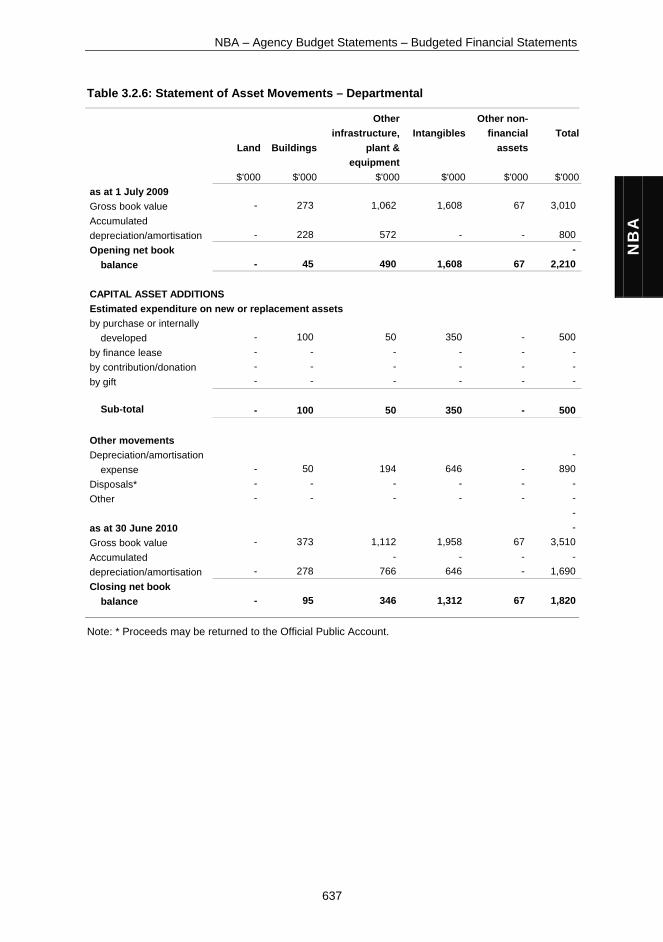
Table 3.2.6: Statement of Asset Movements – Departmental
Other Other non-infrastructure, Intangibles financial Total
Land Buildings plant & assetsequipment
$'000 $'000 $'000 $'000 $'000 $'000as at 1 July 2009Gross book value - 273 1,062 1,608 67 3,010 Accumulated depreciation/amortisation - 228 572 - - 800 Opening net book -
balance - 45 490 1,608 67 2,210
CAPITAL ASSET ADDITIONSEstimated expenditure on new or replacement assetsby purchase or internally
developed - 100 50 350 - 500 by finance lease - - - - - - by contribution/donation - - - - - - by gift - - - - - -
Sub-total - 100 50 350 - 500
Other movementsDepreciation/amortisation -
expense - 50 194 646 - 890 Disposals* - - - - - - Other - - - - - -
- as at 30 June 2010 - Gross book value - 373 1,112 1,958 67 3,510 Accumulated - - - - depreciation/amortisation - 278 766 646 - 1,690 Closing net book
balance - 95 346 1,312 67 1,820
Note: * Proceeds may be returned to the Official Public Account.

NBA – Agency Budget Statements – Budgeted Financial Statements
638
Table 3.2.7: Schedule of Budgeted Income and Expenses Administered on behalf of Government (for the period ended 30 June)
Estimated Budget Forward Forward Forwardactual estimate estimate estimate estimate
2008-09 2009-10 2010-11 2011-12 2012-13$'000 $'000 $'000 $'000 $'000
INCOME ADMINISTERED ONBEHALF OF GOVERNMENTRevenue
TaxationOther taxes, fees and
fines - - - - - Total taxation - - - - -
Non-taxationInterest - - - - - Other sources of non-
taxation revenues 826,498 891,015 994,649 1,087,767 1,196,755Total non-taxation 826,498 891,015 994,649 1,087,767 1,196,755
Total revenuesadministered on behalfof Government 826,498 891,015 994,649 1,087,767 1,196,755
GainsOther gains - - - - - Total gains administeredon behalf of Government - - - - -
Total income administeredon behalf ofGovernment 826,498 891,015 994,649 1,087,767 1,196,755
EXPENSES ADMINISTERED ONBEHALF OF GOVERNMENTEmployees - - - - - Suppliers 397,064 434,877 500,224 562,406 632,895Depreciation and
amortisation - - - - - Grants 429,434 456,138 494,425 525,361 563,860Subsidies - - - - - Personal benefits - - - - - Write down and impairment - - - - -
of assets - - - - - Concessional Loan Discount - - - - - Total expenses
administered on behalfof Government 826,498 891,015 994,649 1,087,767 1,196,755
Prepared on Australian Accounting Standards basis.
NBA – Agency Budget Statements – Budgeted Financial Statements
639
NB
A
Table 3.2.8: Schedule of Budgeted Assets and Liabilities Administered on behalf of Government (as at 30 June)
Estimated Budget Forward Forward Forwardactual estimate estimate estimate estimate
2008-09 2009-10 2010-11 2011-12 2012-13$'000 $'000 $'000 $'000 $'000
ASSETS ADMINISTERED ON BEHALF OF GOVERNMENTFinancial assets
Cash and cash equivalents - - - - - Receivables 187,788 203,821 217,515 230,689 244,558Investments - - - - - Total financial assets 187,788 203,821 217,515 230,689 244,558
Non-financial assetsLand and Buildings - - - - - Infrastructure, Plant and
Equipment - - - - - Inventories 60,364 60,364 60,364 60,364 60,364Other 296 296 296 296 296Total non-financial assets 60,660 60,660 60,660 60,660 60,660
Total assets administered on behalf of Government 248,448 264,481 278,175 291,349 305,218
LIABILITIES ADMINISTERED ON BEHALF OF GOVERNMENTInterest bearing liabilities
Loans - - - - - Total interest bearing
liabilities - - - - -
ProvisionsOther 63,694 74,651 82,646 90,641 98,636Total provisions 63,694 74,651 82,646 90,641 98,636
PayablesSuppliers 32,658 35,989 41,685 46,867 52,741Subsidies - - - - - Personal benefits payable - - - - - Grants - - - - - Other payables 66,297 68,043 68,043 68,043 68,043Total payables 98,955 104,032 109,728 114,910 120,784
Total liabilities administeredon behalf of Government 162,649 178,683 192,374 205,551 219,420
Prepared on Australian Accounting Standards basis.

NBA – Agency Budget Statements – Budgeted Financial Statements
640
Table 3.2.9: Schedule of Budgeted Administered Cash Flows (for the period ended 30 June)
Estimated Budget Forward Forward Forwardactual estimate estimate estimate estimate
2008-09 2009-10 2010-11 2011-12 2012-13$'000 $'000 $'000 $'000 $'000
OPERATING ACTIVITIESCash received
Net GST received 87,872 88,026 97,738 107,225 117,859Other 300,842 328,566 368,020 402,474 442,799Total cash received 388,714 416,592 465,758 509,699 560,658
Cash usedGrant payments 429,434 456,138 494,425 525,361 563,861Suppliers 393,763 428,546 494,529 557,224 627,020Cash to the Offical Public
Account 4,497 15,496 12,827 12,401 12,961Net GST paid 85,261 88,564 98,601 108,001 118,767Other 5,160 3,000 - - - Total cash used 918,115 991,744 1,100,382 1,202,987 1,322,609
Net cash from (or used by)operating activities (529,401) (575,152) (634,624) (693,288) (761,951)
INVESTING ACTIVITIESCash used
Other - - - - - Total cash used - - - - -
Net cash from (or used by)investing activities - - - - -
FINANCING ACTIVITIESCash used
Other - - - - - Total cash used - - - - -
Net cash from (or used by)financing activities - - - - -
Net increase (or decrease)
in cash held (529,401) (575,152) (634,624) (693,288) (761,951)Cash at beginning of reporting period - - - - - Cash from Official Public Account for:
- special accounts 518,508 567,445 634,624 693,288 761,951- appropriations 10,893 7,707 - - -
Cash at end of reportingperiod - - - - -
Prepared on Australian Accounting Standards basis.

NBA – Agency Budget Statements – Budgeted Financial Statements
641
NB
A
3.2.4 Notes to the Financial Statements
The budgeted financial statements for the NBA are prepared for the Budget year, previous year and three forward years.
Departmental Financial Statements Budgeted Departmental Comprehensive Income Statement (for the period ended 30 June)
This statement provides a picture of the expected financial results for the NBA by identifying full accrual expenses and revenues.
Budgeted Departmental Balance Sheet (as at 30 June)
The statement shows the financial position of the NBA. It enables decision-makers to track the management of the NBA’s assets and liabilities.
Budgeted Departmental Statement of Cash Flows (for the period ended 30 June)
Budgeted cash flows as reflected in the statement of cash flows, provides important information on the extent and nature of cash flows by characterising them into expected cash flows from operating activities, investing activities and financing activities.
Departmental Statement of Changes in Equity – Summary of Movement (Budget year 2009-2010)
This table shows the movements in equity during the Budget year.
Schedule of Administered Activity Schedule of Budgeted Income and Expenses Administered on Behalf of Government (for the period ended 30 June)
The schedule identifies the revenues and expenses administered by the NBA on behalf of the Government.
Schedule of Budgeted Assets and Liabilities Administered on Behalf of Government (as at 30 June)
The schedule shows the assets and liabilities administered by the NBA on behalf of the Government.
Schedule of Budgeted Administered Cash Flows (for the period ended 30 June)
The schedule shows the cash flows administered by the NBA on behalf of the Government.

NBA – Agency Budget Statements – Budgeted Financial Statements
642