national blood authority - doctorconnect · established on 1 july 2003 under the national blood...
TRANSCRIPT

293
National Blood Authority Health and Ageing portfolio agency
Section 1: Agency overview....................................................................................295
Section 2: Agency resources for 2005-06..............................................................296 2.1: Appropriations and other resources....................................................................296 2.2: 2005-06 Budget measures..................................................................................298 2.3: Other revenue available to be used ....................................................................298 2.4: Movement of administered funds from 2004-05 to 2005-06 ...............................299 2.5: Special appropriations.........................................................................................299 2.6: Special accounts .................................................................................................299 2.7: Administered capital and departmental equity injections and loans ...................300
Section 3: Agency outcomes..................................................................................301 3.1: Summary of outcomes, outputs and administered items....................................301 3.2: Outcomes — departmental and administered ....................................................301 3.3: Outcomes resourcing ..........................................................................................302
Section 4: Other reporting requirements...............................................................306 4.1: Purchaser-provider arrangements ......................................................................306 4.2: Cost recovery arrangements...............................................................................306
Section 5: Budgeted financial statements.............................................................307 5.1: Analysis of budgeted financial statements..........................................................307 5.2: Budgeted financial statements tables .................................................................309 5.3: Notes to the financial statements........................................................................323

294

Section 1—Agency overview
295
Section 1: Agency overview
The National Blood Authority (NBA) is an independent statutory agency, representing the interests of the Australian Government and all State and Territory governments. The NBA was established on 1 July 2003 under the National Blood Authority Act 2003 as part of a coordinated approach to policy setting, governance, funding and management of the Australian blood banking and plasma product sector. The NBA vision is ‘saving and improving Australian lives through a world class blood supply’. The NBA manages national contracts with suppliers of blood and blood products on behalf of all Australian governments, who together provide a total of over $500 million annually for this purpose. The NBA manages and coordinates the Australian blood supply in accordance with the National Blood Agreement agreed by the Australian Government and State and Territory governments. The NBA was established as an Australian Government Agency under the National Blood Act 2003 and the Financial Management and Accountability Act 1997. The Authority is also subject to the Public Service Act 1999 and the Auditor-General Act 1997.
Table 1.1: Agency outcome and output group Outcome Output group Australia’s blood supply is secure and well managed.
1. Meet product demand through effective planning and the management of supply arrangements.

Agency budget statements—NBA
296
Section 2: Agency resources for 2005-06
2.1: APPROPRIATIONS AND OTHER RESOURCES
Table 2.1 shows the total resources from all origins for 2005-06, including appropriations. The table summarises how revenue will be applied by outcome, administered and departmental classification.
The total appropriation for the NBA in the 2005-06 Budget is $6,632 million.
In addition, the Authority receives $570.024 million from all funding jurisdictions in a cost share arrangement (63% Australian Government and 37% from State and Territory governments together).

Section 2—Agency resources for 2005-06
297
Table 2.1: Appropriations and other revenue 2005-061 Total
resources7
$'000 $'000 $'000 $'000 %6 $'000 %6 $'000Bill Bill Special Total
No. 1 No. 22 approp3 approp4
National BloodAuthority NBAAdministered - - - - 0% 565,481 100% 565,481
Departmental 6,226 - 6,226 58% 4,543 42% 10,769 Total NBA 6,226 - - 6,226 1% 570,024 99% 576,250
Departmental capital (equity injections) - 406 - 406 100% - 0% 406 Total resources 6,226 406 - 6,632 1% 570,024 99% 576,656
Note: Refer to Budgeted statement of financial performance for application of agency revenue.
1 This table has been redesigned to correspond with Budget Paper No. 4 ‘Agency Resourcing’. It nowincludes (where appropriate) administered revenue from other sources. 2 Under the appropriation structure, Bill No. 2 includes Specific Purpose Payments (SPPs), new agencyOutcomes (NAOs), administered capital and departmental capital via departmental injections and loans.3 Estimated expenses from individual Special Appropriations are shown at Section 3, Tables 3.1, etc.4 Total appropriations = Bill No. 1 + Bill No. 2 + Special appropriations.
5 Revenue from other sources includes FMA s.31 revenues, CAC body revenues that are available to beexpensed, special accounts (non-appropriation revenues) and resources received free of charge.6 Percentage figures indicate the percentage contribution of Revenue from Government (DepartmentalAppropriations) to the total price of outputs, by outcome, and the percentage contribution of Revenuefrom other sources (Departmental) to the total price of outputs, by outcome.7 Total resources = Total appropriations + Revenue from other sources.
Appropriations Revenue fromother sources5
Agency budget statements—NBA
298
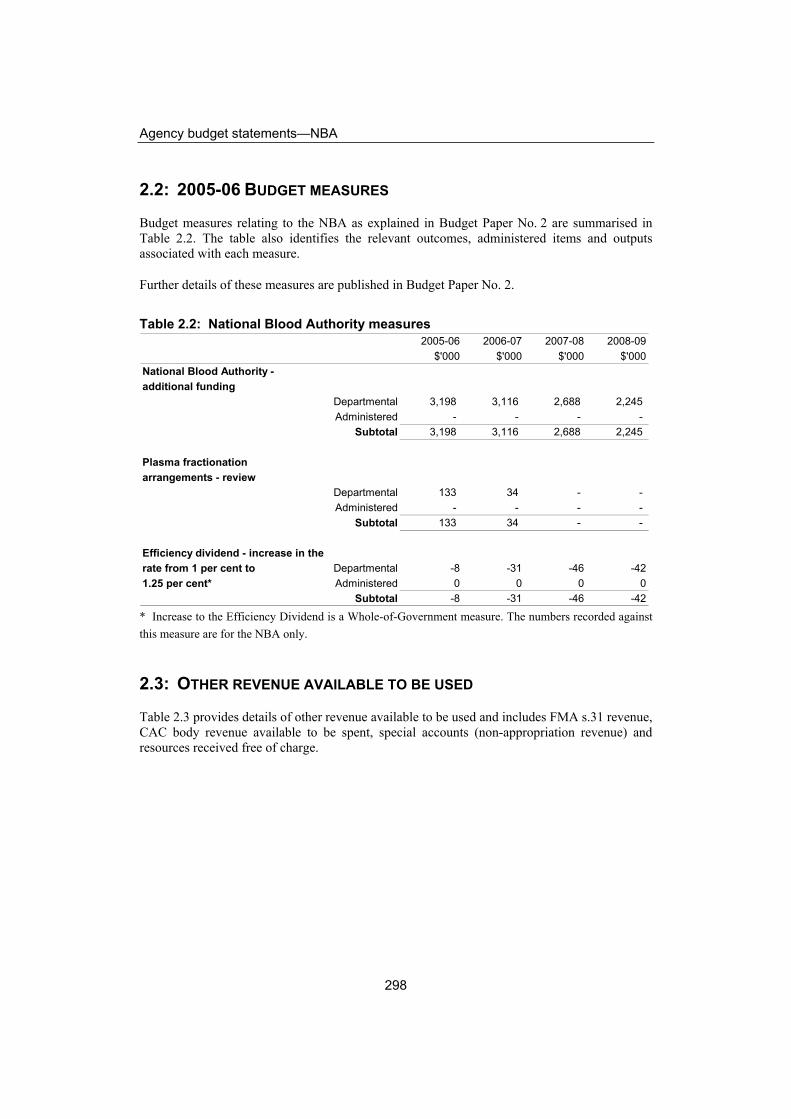
2.2: 2005-06 BUDGET MEASURES
Budget measures relating to the NBA as explained in Budget Paper No. 2 are summarised in Table 2.2. The table also identifies the relevant outcomes, administered items and outputs associated with each measure.
Further details of these measures are published in Budget Paper No. 2.
Table 2.2: National Blood Authority measures 2005-06 2006-07 2007-08 2008-09
$'000 $'000 $'000 $'000National Blood Authority - additional funding
Departmental 3,198 3,116 2,688 2,245 Administered - - - -
Subtotal 3,198 3,116 2,688 2,245
Plasma fractionationarrangements - review
Departmental 133 34 - - Administered - - - -
Subtotal 133 34 - -
Efficiency dividend - increase in therate from 1 per cent to Departmental -8 -31 -46 -421.25 per cent* Administered 0 0 0 0
Subtotal -8 -31 -46 -42 * Increase to the Efficiency Dividend is a Whole-of-Government measure. The numbers recorded against this measure are for the NBA only.
2.3: OTHER REVENUE AVAILABLE TO BE USED
Table 2.3 provides details of other revenue available to be used and includes FMA s.31 revenue, CAC body revenue available to be spent, special accounts (non-appropriation revenue) and resources received free of charge.

Section 2—Agency resources for 2005-06
299
Table 2.3: Other revenue available to be used1 Revenue from Budgetother sources estimate
2004-05 2005-06$'000 $'000
Departmental other revenueContributions from States and Territories 3,356 4,543
Total departmental other revenue available to be used 3,356 4,543
Administered other revenueContributions from States and Territories 199,429 209,102 Contributions from Australian Government 341,719 356,379
Total administered other revenue available to be used 541,148 565,481 1 This table replaces the former table ‘Receipts from independent sources’. It represents own source revenue available for spending on departmental purposes.
2.4: MOVEMENT OF ADMINISTERED FUNDS FROM 2004-05 TO 2005-06 There are no movement of administered funds from 2004-05 to 2005-06.
2.5: SPECIAL APPROPRIATIONS Section 2.5 is not applicable to the NBA.
2.6: SPECIAL ACCOUNTS
Table 2.6: Estimates of special account flows and balances Opening Closingbalance Receipts Payments Adjustments balance2005-06 2005-06 2005-06 2005-06 2005-062004-05 2004-05 2004-05 2004-05 2004-05
$'000 $'000 $'000 $'000 $'000
2,074 11,229 11,023 - 2,280 1,615 9,831 9,372 2,074
21,188 623,821 623,126 - 21,883 17,010 602,658 598,480 - 21,188
22,328 7,991 - - 30,319 - 22,328 - - 22,328
Total special accounts 2005-06 Budget estimate 45,590 643,041 634,149 - 54,482
Total Special Accounts2004-05 estimate actual 18,625 634,817 607,852 - 45,590
D = Departmental A = AdministeredActs Glossary:FMA Act = Financial Management and Accountability Act, 1997
S21 FMA Act 1997 and National Blood Authority Act 2003 (D)
S21 FMA Act 1997 and National Blood Authority Act 2003 (A)
The National Managed Funds (Blood and Blood Products) - S20 FMA Act 1997 (A)

Agency budget statements—NBA
300
2.7: ADMINISTERED CAPITAL AND DEPARTMENTAL EQUITY INJECTIONS AND LOANS
The NBA will receive $0.406m in Departmental Capital injections in 2005-06 to develop and implement knowledge management systems that will be the repository for blood and blood product data and information from both Australia and overseas. This information system will assist the NBA in analysis of clinical use and demand management.

Section 3—Agency outcomes
301
Section 3: Agency outcomes
This section explains how the resources identified in Section 2 will be used to deliver outputs and administered items to contribute to NBA’s outcome.
3.1: SUMMARY OF OUTCOMES, OUTPUTS AND ADMINISTERED ITEMS
The NBA works to achieving a single outcome specified by government. This section provides a summary of the agency’s activities for 2005-06, followed by related performance information.
Figure 4: Outcomes and output groups and administered items
National Blood Authority General Manager—Dr Alison Turner
Outcome—Australia’s blood supply is secure and well managed
Total price of outputs Total departmental outcomes appropriation
Total administered expense
$10.769m $6.226m $568.187m
Output group 1 Meet product demand through effective planning and the management of supply arrangements
Total price Departmental appropriations
$10.769m $6.226m
The NBA’s appropriations from consolidated revenue are drawn under its own outcome in the 2005-06 Budget—‘Australia’s blood supply is secure and well managed’.
Previously, the NBA drew appropriations from consolidated revenue under the outcome ‘Quality health care’, from which the Department of Health and Ageing also drew appropriations.
3.2: OUTCOMES — DEPARTMENTAL AND ADMINISTERED
Departmental appropriations The NBA has total departmental appropriations of $6.226 million in 2005-06 plus an equity injection of $0.406 million. The NBA also receives departmental expenses from all State and Territories in a cost share arrangement (63 per cent Australian Government and 37 per cent from State and Territory governments together).

Agency budget statements—NBA
302
Administered appropriations by outcome The NBA also receives administered expenses from all States and Territories and the Australian Government in a cost share arrangement for the supply of blood and blood products (63 per cent Australian Government and 37 per cent from State and Territory governments together).
3.3: OUTCOMES RESOURCING
Outcome summary—the year ahead The NBA is the national coordinating agency for supply and demand planning and the purchase of blood and blood products from suppliers on behalf of all Australian governments. The operations of the Authority are jointly funded by the Australian Government at 63 per cent and the State and Territory governments at 37 per cent. Specifically the NBA’s role is to:
• coordinate national demand and supply planning of blood and blood products and purchase those products on behalf of all Australian Governments;
• negotiate and manage contracts on behalf of all States and Territories and the Australian Government with suppliers of blood and blood products to enable the development of an agreed single national pricing schedule;
• implement an efficient demand-driven system, based upon evidence and good clinical practice, so that the blood supply system is highly responsive to needs; and
• work in a collaborative manner with all governments and other responsible parties to ensure that Australia's blood supply is safe, secure, adequate and affordable.
During 2005-06 the priorities for the NBA are to:
• consolidate and enhance the contract management framework to deliver further improvements to supply arrangements;
• working with relevant jurisdictions and medical experts to further improve the supply planning contingency and risk management processes;
• develop the NBA’s capacity to appropriately influence the quality of use and demand for products and services;
• refine and implement evidence based process for consideration of new products and services;
• manage contracts with suppliers, in particular the implementation of revised arrangements with the Australian Red Cross Blood Service and CSL Limited; and
• enhance the NBA’s ability to provide authoritative advice and information to governments on the changing industry and markets, trends and global issues.
Additional funding for NBA operations
As part of its commitment to the new blood sector arrangements, the Australian Government will provide $11.2 million additional departmental funding over four years for the NBA. This

Section 3—Agency outcomes
303
money will allow the NBA to maintain its current commitment to improved contract management while expanding its capacity to deliver all of its functions mandated by the National Blood Agreement.
The NBA was established in 2003 as part of governments’ response to the Review of the Australian Blood Banking and Plasma Products Sector chaired by Sir Ninian Stephen.
The NBA is jointly funded by the Australian Government and the States and Territories under the National Blood Agreement. This agreement specifies the range of functions that governments have agreed that the NBA should undertake. The costs of the NBA are shared on a 63:37 ratio between the Australian Government and the States and Territories.
Under funding levels received in the last two years, the NBA has achieved substantial price savings for governments through effective contract negotiations. In addition it has put in place measures to improve the security of supply of products to patients and has achieved other supply improvements.
This funding will allow the NBA to maintain its current level of activity in contract management, as well as developing the capacity over the term of the measure to:
• achieve substantial improvements in the efficient management of blood products;
• allow all governments an increased capacity to understand and manage outlays on the blood sector;
• work with the health sector to improve the quality and safety of blood product usage; and
• contribute towards improved clinical outcomes for patients through better use of blood products.
In particular, public confidence in the blood supply will be maintained through the establishment of risk and contingency plans to address possible threats to the safety, security and availability of blood products.
Review of Australia’s plasma fractionation arrangements
The NBA will also receive $167,000 over 2005-06 and 2006-07 to provide the Department of Health and Ageing with industry and sector specific information for its review of Australia’s blood fractionation arrangements.
Outcome resourcing Table 3.1 shows how the 2005-06 Budget appropriations translate to total resourcing for NBA, including administered expenses, revenue from government (appropriation), revenue from other sources (Departmental) and the total price of outputs.

Agency budget statements—NBA
304
Table 3.1: Total resources for the National Blood Authority
Estimated Budgetactual estimate
2004-05 2005-06$'000 $'000
Administered appropriations to National Blood Authority Special Account1 5,412 -
Total administered appropriations 5,412 -
from Special Accounts (estimated payments from Special Account balances1
s21 FMA Act 1997 and National Blood Authority Act 2003 598,480 625,126 The National Managed Funds (Blood and Blood Products) - s20 FMA Act 1997 - -
Total Administered Special Account outflows 598,480 625,126
Departmental revenueTotal revenue from Government (appropriations) 4,736 6,226
Total other resources available to be used 3,356 4,543
8,092 10,769 (Total revenue from Government and from other sources)
Departmental revenue by output groupOutput Group 1 - Meet product demand through effectiveplanning and the management of supply arrangements 8,092 10,769
8,092 10,769 (Total revenue from Government and from other sources)
from Special Accounts (estimated payments from Special Account balances)1
s21 FMA Act 1997 and National Blood Authority Act 2003 9,372 11,023
Total departmental Special Account outflows 9,372 11,023
13,504 10,769
2004-05 2005-06Average staffing level (number) 34 40
1. Special Account outflows are shown in the payments column of the Special Account table in Table 2.6. The estimated payments from special account balances are provided by way of note only and do not form part of the total estimated resourcing.
Total estimated resourcing for NBA(Total price of outputs and administered appropriations)
Total Price of Departmental Outputs
Total Price of Departmental Outputs

Section 3—Agency outcomes
305
Performance information for the National Blood Authority
Table 3.2: Performance information for the National Blood Authority
Output group 1—Meet product demand through effective planning and the management of supply arrangements • Manage and coordinate Australia’s blood
supply in accordance with the National Blood Agreement agreed by the Australian Government, States and Territories.
Quality: Satisfaction from all funding jurisdictions on the planning, management and coordination of the blood supply in accordance with the National Blood Agreement. Quantity: Number of supply contracts varied or negotiated. Quantity: Number of contracts being managed. Quality: Satisfaction from all jurisdictions and stakeholders that there is a sufficient and available supply of blood and blood products to meet jurisdictional demand levels as reflected in annual jurisdictional estimates.
Price: $10.769m
Evaluations The NBA regularly seeks feedback from the Jurisdictional Blood Committee (representatives from all States and Territories and the Australian Government) on its performance and processes. The Authority has also established a Supplier and a Community and Professional Forum as a mechanism for discussion and feedback from other major stakeholders.
There will be no further evaluations conducted by the NBA in 2005-06.

Agency budget statements—NBA
306
Section 4: Other reporting requirements
4.1: PURCHASER-PROVIDER ARRANGEMENTS
There are no purchaser-provider arrangements reported by the National Blood Authority.
4.2: COST RECOVERY ARRANGEMENTS
There are no cost recovery arrangements reported by the National Blood Authority.

Section 5—Budgeted financial statements
307
Section 5: Budgeted financial statements
5.1: ANALYSIS OF BUDGETED FINANCIAL STATEMENTS
Departmental
Statement of Financial Performance
In 2005-06 the NBA is budgeting for an operating surplus of $0.561 million which is generated to retain equity to fund future capital purchases and employee entitlements.
Revenue will increase in 2005-06 by $2.677 million. The NBA is jointly funded by the Australian Government and the States and Territories under the National Blood Agreement. This agreement specifies the range of functions that governments have agreed that the NBA should undertake. The costs of the NBA are shared on a 63:37 ratio between the Australian Government and the States and Territories.
Funding jurisdictions will provide additional departmental funding for the NBA to maintain its current commitment to improved contract management while expanding its capacity to deliver all of its functions mandated by the National Blood Agreement.
Total expenses are estimated to be $10.208 million 2005-06, $2.416 million greater than the $7.792 million estimate for 2004-05. The additional funding received from governments will allow the authority to increase its resources from 34 ASL to 40 ASL and also provide additional expertise to support the functions mandated by governments.
Depreciation and amortisation charges will also increase over the forward years representing additional capital purchases funded by governments for the development and implementation of knowledge management systems.
Statement of Financial Position
Cash balances will remain stable over the forward years. Receivables are expected to increase due to an increase in appropriation receivable from the Official Public Account to fund future capital purchases as they fall due.
Non financial assets are expected to increase from the purchase and development of software for the provision of knowledge management systems over 2005-06 and 2006-07.
Liabilities for the NBA are represented by payables to suppliers and provisions for employee entitlements. These are expected to remain relatively stable across the forward years.

Agency budget statements—NBA
308
Cash59%
Receivables10%
Infrastructure, plant and equipment
13%
Intangibles17%
Other non-financial assets
1%
Budgeted Departmental Assets as at 30 June 2006
Administered Schedule of budgeted revenues and expenses administered on behalf of Government
The NBA administered accounts include contributions from all States and Territories and the Australian Government for the supply of blood and blood related products for 2005-06. Each year the Australian Health Ministers Council approves a National Products and Services List and the Annual Supply Plan. The supply plan and budget are formulated by the NBA from demand estimates provided by jurisdictions and product prices in supply contracts negotiate by the NBA with suppliers.
The 2005-06 budget for the supply of blood and blood products has increased by $18.921 million from 2004-05 to 2005-06. The financial impact of the increase in demand has been partially offset by a reduction in new prices successfully negotiated with suppliers by the NBA in 2004-05.
Schedule of budgeted assets and liabilities administered on behalf of Government
The schedule of budgeted assets and liabilities administered on behalf of governments illustrates normal movements in non financial assets and payables. The increase in receivables over the forward years relates to contributions received from States and Territories and the Australian Government for funding of the National Managed Fund a special account under Section 21 of the FMA Act 1997.

Section 5—Budgeted financial statements
309
5.2: BUDGETED FINANCIAL STATEMENTS TABLES
Table 5.1: Budgeted departmental statement of financial performance for the period ended 30 June
Estimated Budget Forward Forward Forwardactual estimate estimate estimate estimate
2004-05 2005-06 2006-07 2007-08 2008-09$'000 $'000 $'000 $'000 $'000
REVENUERevenues from ordinary activities
Appropriation revenues 4,736 6,226 6,071 6,033 5,595 Other revenues from related entities - - - - - Goods and services - - - - - Interest - - - - - Dividends - - - - - Revenue from sales of assets - - - - - Reversals of previous asset
write-downs - - - - - Net foreign exchange gains - - - - - Rents - - - - - Royalties - - - - - Correction of fundamental error - - - - - Other 3,356 4,543 3,814 3,571 3,317
Revenues from ordinary activities 8,092 10,769 9,885 9,604 8,912
EXPENSEExpenses from ordinary activities
(excluding borrowing costs expense)Employees 3,759 4,763 4,652 4,606 4,472 Suppliers 3,988 5,194 4,560 4,566 4,008 Grants - - - - - Subsidies - - - - - Depreciation and amortisation 45 251 412 412 412 Write-down of assets and
impairment of assets - - - - - Value of assets sold - - - - - Net foreign exchange losses - - - - - Correction of fundamental error - - - - - Other - - - - -
Expenses from ordinary activities 7,792 10,208 9,624 9,584 8,892 (excluding borrowing costs expense)
Borrowing costs expense - - - - - Share of net profits or (losses) of
associates and joint ventures accounted for using the equitymethod - - - - -
Correction of fundamental error - - - - -

Agency budget statements—NBA
310
Table 5.1: Budgeted departmental statement of financial performance (cont) for the period ended 30 June
Estimated Budget Forward Forward Forwardactual estimate estimate estimate estimate
2004-05 2005-06 2006-07 2007-08 2008-09$'000 $'000 $'000 $'000 $'000
Operating surplus or (deficit) from ordinary activities 300 561 261 20 20
Gain or (loss) on extraordinary items - - - - - Correction of fundamental error - - - - -
Net surplus or (deficit) 300 561 261 20 20 Outside equity interests in net
surplus or (deficit) - - - - -
Net surplus or deficit attributable to the Australian Government 300 561 261 20 20

Section 5—Budgeted financial statements
311
Table 5.2: Budgeted departmental statement of financial position as at 30 June
Estimated Budget Forward Forward Forwardactual estimate estimate estimate estimate
2004-05 2005-06 2006-07 2007-08 2008-09$'000 $'000 $'000 $'000 $'000
ASSETSFinancial assets
Cash 2,074 2,119 2,014 2,134 2,245 Receivables 294 361 674 997 1,322 Investments accounted for under
the equity method - - - - - Investments (s.39 FMA Act;
s.18 CAC Act; s.19 CAC Act) - - - - - Other investments - - - - - Accrued revenues - - - - - Other financial assets - - - - -
Total financial assets 2,368 2,480 2,688 3,131 3,567
Non-financial assetsLand and buildings - - - - - Infrastructure, plant and equipment 580 490 400 310 220 Investment properties - - - - - Heritage and cultural assets - - - - - Inventories - - - - - Intangibles 151 635 958 636 314 Other non-financial assets 53 53 53 53 53
Total non-financial assets 784 1,178 1,411 999 587
Total assets 3,152 3,658 4,099 4,130 4,154
LIABILITIESInterest bearing liabilities
Loans - - - - - Leases - - - - - Deposits - - - - - Overdraft - - - - - Other interest bearing liabilities - - - - -
Total interest bearing liabilities - - - - -
ProvisionsEmployees 723 579 569 574 574 Other provisions 19 19 19 19 19
Total provisions 742 598 588 593 593
PayablesSuppliers 931 674 515 518 521 Grants - - - - - Dividends - - - - - Borrowing costs - - - - - Other payables 267 207 150 153 154
Total payables 1,198 881 665 671 675
Total liabilities 1,940 1,479 1,253 1,264 1,268

Agency budget statements—NBA
312
Table 5.2: Budgeted departmental statement of financial position (cont) as at 30 June
Estimated Budget Forward Forward Forwardactual estimate estimate estimate estimate
2004-05 2005-06 2006-07 2007-08 2008-09$'000 $'000 $'000 $'000 $'000
EQUITY*
Parent entity interestContributed equity - 406 812 812 812 Reserves - - - - - Statutory funds - - - - - Retained surpluses or
accumulated deficits 1,212 1,773 2,034 2,054 2,074 Total parent entity interest 1,212 2,179 2,846 2,866 2,886
Outside equity interestContributed equity - - - - - Reserves - - - - - Retained surpluses or
accumulated deficits - - - - - Total outside equity interest - - - - -
Total equity 1,212 2,179 2,846 2,866 2,886
Current assets 2,734 3,173 3,556 3,583 3,604 Non-current assets 418 485 543 547 550 Current liabilities 1,394 1,042 823 831 835 Non-current liabilities 546 437 430 433 433 * ‘Equity’ is the residual interest in assets after deduction of liabilities.

Section 5—Budgeted financial statements
313
Table 5.3: Budgeted departmental statement of cash flows for the period ended 30 June
Estimated Budget Forward Forward Forwardactual estimate estimate estimate estimate
2004-05 2005-06 2006-07 2007-08 2008-09$'000 $'000 $'000 $'000 $'000
OPERATING ACTIVITIESCash receivedGoods and services - - - - - Appropriations 4,736 6,125 5,867 5,830 5,392 Interest - - - - - Dividends - - - - - Other 4,310 5,242 4,119 3,909 3,602 Extraordinary items - - - - - Total cash received 9,046 11,367 9,986 9,739 8,994
Cash usedEmployees 3,763 4,908 4,661 4,602 4,472 Suppliers 5,160 6,175 5,191 5,017 4,411 Grants - - - - - Borrowing costs - - - - - Other - - - - - Extraordinary items - - - - - Total cash used 8,923 11,083 9,852 9,619 8,883 Net cash from or (used by)
operating activities 123 284 134 120 111
INVESTING ACTIVITIESCash receivedPurchase of property, plant,
equipment and intangibles - - - - - Proceeds from sales of financial
instruments - - - - - Bills of exchange and promissory notes - - - - - Repayments of loans made - - - - - Investments (s.39 FMA Act;
s.18 CAC Act; s.19 CAC Act) - - - - - Other - - - - - Extraordinary items - - - - - Total cash received - - - - -
Cash usedPurchase of property, plant
and equipment 450 645 645 - - Purchase of financial instruments - - - - - Bills of exchange and promissory notes - - - - - Loans made - - - - - Investments (s.39 FMA Act;
s.18 CAC Act; s.19 CAC Act) - - - - - Other - - - - - Extraordinary items - - - - - Total cash used 450 645 645 - - Net cash from or (used by)
investing activities (450) (645) (645) - -

Agency budget statements—NBA
314
Table 5.3: Budgeted departmental statement of cash flows (cont) for the period ended 30 June
Estimated Budget Forward Forward Forwardactual estimate estimate estimate estimate
2004-05 2005-06 2006-07 2007-08 2008-09$'000 $'000 $'000 $'000 $'000
FINANCING ACTIVITIESCash receivedAppropriations - contributed equity - 406 406 - - Proceeds from issuing financial
instruments - - - - - Proceeds from loans - - - - - Other - - - - - Extraordinary items - - - - - Total cash received - 406 406 - -
Cash usedRepayments of debt - - - - - Capital use charge paid - - - - - Dividends paid - - - - - Other - - - - - Extraordinary items - - - - - Total cash used - - - - - Net cash from/(used by) financing
activities - 406 406 - - Net increase or (decrease)
in cash held (327) 45 (105) 120 111 Cash at the beginning of
the reporting period 2,401 2,074 2,119 2,014 2,134 Effect of exchange rate movements
on cash at the beginning of reporting period - - - - -
Cash at the end of the reporting period 2,074 2,119 2,014 2,134 2,245

Section 5—Budgeted financial statements
315
Table 5.4: Departmental capital budget statement Estimated Budget Forward Forward Forward
actual estimate estimate estimate estimate2004-05 2005-06 2006-07 2007-08 2008-09
$'000 $'000 $'000 $'000 $'000
CAPITAL APPROPRIATIONSTotal equity injections - 406 406 - - Total loans - - - - -
Total capital appropriations - 406 406 - -
Represented by:Purchase of non-financial assets - 406 406 - - Other - - - - -
Total represented by - 406 406 - -
PURCHASE OF NON-FINANCIAL ASSETSFunded by capital appropriation - 406 406 - - Funded internally by
Departmental resources 450 239 239 - - Total 450 645 645 - -

Agency budget statements—NBA
316
Table 5.5: Departmental property, plant, equipment and intangibles — summary of movement (Budget year 2005-06)
Land Buildings Other Computer Totalinfrastructure software
plant andequipment
$'000 $'000 $'000 $'000 $'000As at 1 July 2005
Gross book value - - 649 162 811 Accumulated depreciation - - 69 11 80
Opening net book value - - 580 151 731
Additions:by purchase - - - 645 645 by finance lease - - - - - from acquisitions of entities or
operations (including restructuring) - - - - -
Net revaluation increment/decrement - - - - - Reclassifications - - - - - Depreciation/amortisation expense - - 90 161 251 Recoverable amount write-downs - - - - - Other movements - - - - -
Disposals:from disposal of entities or
operations (including restructuring) - - - - - other disposals - - - - -
As at 30 June 2006Gross book value - - 649 807 1,456 Accumulated depreciation - - 159 172 331
Closing net book value - - 490 635 1,125

Section 5—Budgeted financial statements
317
Table 5.6: Schedule of budgeted revenues and expenses administered on behalf of Government for the period ended 30 June
Estimated Budget Forward Forward Forwardactual estimates estimate estimate estimate
2004-05 2005-06 2006-07 2007-08 2008-09$'000 $'000 $'000 $'000 $'000
REVENUES ADMINISTERED ONBEHALF OF GOVERNMENT
TaxationIncome tax - - - - - Indirect tax - - - - - Other taxes, fees and fines - - - - -
Total taxation - - - - -
Non-taxation (revenues from Government)Goods and services - - - - - Interest - - - - - Dividends - - - - - Net foreign exchange gains - - - - - Revenues from sale of assets - - - - - Other sources of non tax revenue -
related entities 341,719 356,379 356,043 356,548 357,074 Other sources of non tax revenue -
external entities 199,429 209,102 208,915 209,191 209,508 Rents - - - - - Royalties - - - - - Correction of fundamental error - - - - -
Total non-taxation 541,148 565,481 564,958 565,739 566,582
Total revenues administeredon behalf of Government 541,148 565,481 564,958 565,739 566,582
EXPENSES ADMINISTERED ONBEHALF OF GOVERNMENTGrants 266,335 284,045 284,045 284,045 284,045 Subsidies - - - - - Personal benefits - - - - - Employees - - - - - Suppliers 280,225 281,436 280,913 281,694 282,537 Depreciation and amortisation - - - - - Write down and impairment of assets - - - - - Value of assets sold - - - - - Net foreign exchange losses - - - - - Interest - - - - - Correction of fundamental error - - - - - Other - - - - - Extraordinary items - - - - -
Total expenses administeredon behalf of Government 546,560 565,481 564,958 565,739 566,582

Agency budget statements—NBA
318
Table 5.7: Schedule of budgeted assets and liabilities administered on behalf of Government as at 30 June
Estimated Budget Forward Forward Forwardactual estimate estimate estimate estimate
2004-05 2005-06 2006-07 2007-08 2008-09$'000 $'000 $'000 $'000 $'000
ASSETS ADMINISTERED ON BEHALF OF GOVERNMENT
Financial assetsCash - - - - - Receivables 52,619 61,672 69,607 77,681 85,762 Investments under the equity method - - - - - Investments (s.39 FMA Act) - - - - - Accrued revenues - - - - - Other financial assets - - - - -
Total financial assets 52,619 61,672 69,607 77,681 85,762
Non-financial assetsLand and buildings - - - - - Infrastructure, plant and equipment - - - - - Investment properties - - - - - Inventories 34,988 34,988 34,988 34,988 34,988 Intangibles - - - - - Other non-financial assets 22,195 23,670 23,670 23,670 23,670
Total non-financial assets 57,183 58,658 58,658 58,658 58,658
Total assets administered on behalf of Government 109,802 120,330 128,265 136,339 144,420
LIABILITIES ADMINISTERED ON BEHALF OF GOVERNMENT
Interest bearing liabilitiesAustralian Government securities - - - - - Loans - - - - - Leases - - - - - Deposits - - - - - Overdrafts - - - - - Other - - - - -
Total interest bearing liabilities - - - - -
ProvisionsEmployees - - - - - Taxation refunds provided - - - - - Australian currency on issue - - - - - Other provisions 22,329 30,319 38,310 46,300 54,291
Total provisions 22,329 30,319 38,310 46,300 54,291
PayablesSuppliers 18,023 18,748 18,731 18,757 18,785 Grants and subsidies - - - - - Personal benefits payable - - - - - Taxation refunds due - - - - - Other payables 39,703 41,516 41,477 41,535 41,597
Total payables 57,726 60,264 60,208 60,292 60,382
Total liabilities administeredon behalf of Government 80,055 90,583 98,518 106,592 114,673 .

Section 5—Budgeted financial statements
319
Table 5.8: Schedule of budgeted administered cash flows for the period ended 30 June
Estimated Budget Forward Forward Forwardactual estimate estimate estimate estimate
2004-05 2005-06 2006-07 2007-08 2008-09$'000 $'000 $'000 $'000 $'000
OPERATING ACTIVITIESCash received
Income tax - - - - - Indirect tax - - - - - Other taxes, fees and fines - - - - - Sales of goods - - - - - Rendering of services - - - - - Interest - - - - - Dividends - - - - - Other 625,338 631,812 629,687 630,616 631,546
Total cash received 625,338 631,812 629,687 630,616 631,546
Cash usedBorrowing costs - - - - - Employees - - - - - Grant payments 267,188 285,521 284,045 284,045 284,045 Interest paid - - - - - Subsidies paid - - - - - Personal benefits - - - - - Suppliers 331,645 337,605 337,698 338,510 339,435 Other - - - - -
Total cash used 598,833 623,126 621,743 622,555 623,480
Net cash from/(used by) operating activities 26,505 8,686 7,944 8,061 8,066
INVESTING ACTIVITIESCash received
Proceeds from sales ofproperty, plant and equipmentand intangibles - - - - -
Proceeds from sales ofequity instruments - - - - -
Proceeds from sales of investments - - - - - Repayments of advances - - - - - Cash from Official Public Account - - - - - Transfers from other entities - - - - - Investments (s.39 FMA Act,
s.18 CAC Act, s.19 CAC Act) - - - - - Other - - - - -
Total cash received - - - - - .

Agency budget statements—NBA
320
Table 5.8: Schedule of budgeted administered cash flows (cont) for the period ended 30 June
Estimated Budget Forward Forward Forwardactual estimate estimate estimate estimate
2004-05 2005-06 2006-07 2007-08 2008-09$'000 $'000 $'000 $'000 $'000
Cash usedPurchase of property, plant
and equipment and intangibles - - - - - Purchase of equity instruments - - - - - Advances and loans made - - - - - Cash to Official Public Account - - - - - Transfers to other entities - - - - - Investments (s.39 FMA Act,
s.18 CAC Act, s.19 CAC Act) - - - - - Other - - - - -
Total cash used - - - - -
Net cash from/(used by) investing activities - - - - -
FINANCING ACTIVITIESCash received
Proceeds from borrowing - - - - - Cash from Official Public Account - - - - - Other - - - - -
Total cash received - - - - - Cash used
Net repayment of borrowings - - - - - Dividends paid - - - - - Cash to Official Public Account 26,505 8,686 7,944 8,061 8,066 Other - - - - -
Total cash used 26,505 8,686 7,944 8,061 8,066
Net cash from/(used by) financing activities (26,505) (8,686) (7,944) (8,061) (8,066)
Net increase or (decrease) in cash held - - - - - Cash at beginning of reporting period - - - - - Cash from Official Public Account for
Appropriations - - - - - Special accounts - - - - -
Transfers from other entities(Finance - Whole of Government) - - - - -
Cash to Official Public Account forAppropriations - - - - - Special accounts - - - - -
Transfers from other entities(Finance - Whole of Government) - - - - -
Effect of exchange rate movements on cash at beginning of reporting period - - - - -
Cash at end of reporting period - - - - -

Section 5—Budgeted financial statements
321
Table 5.9: Schedule of administered capital budget Estimated Budget Forward Forward Forward
actual estimate estimate estimate estimate2004-05 2005-06 2006-07 2007-08 2008-09
$'000 $'000 $'000 $'000 $'000CAPITAL APPROPRIATIONS
Administered capital - - - - - Special appropriations - - - - -
Total capital appropriations - - - - -
Represented by:Purchase of non-financial assets - - - - - Other - - - - -
Total represented by - - - - -
PURCHASE OF NON-FINANCIALASSETSFunded by capital appropriation - - - - - Funded internally by Departmental
resources - - - - -

Agency budget statements—NBA
322
Table 5.10: Schedule of property, plant, equipment and intangibles — summary of movement (Budget Year 2005-06)
Land Buildings Other Computer Totalinfrastructure software
plant andequipment
$'000 $'000 $'000 $'000 $'000As at 1 July 2005
Gross book value - - - - - Accumulated depreciation - - - - -
Opening net book value - - - - -
Additions:by purchase - - - - - by finance lease - - - - - from acquisitions of entities or
operations (including restructuring) - - - - -
Net revaluation increment/decrement - - - - - Reclassifications - - - - - Depreciation/amortisation expense - - - - - Recoverable amount write-downs - - - - - Other movements - - - - -
Disposals:from disposal of entities or
operations (including restructuring) - - - - - other disposals - - - - -
As at 30 June 2006Gross book value - - - - - Accumulated depreciation - - - - -
Closing net book value - - - - -

Section 5—Budgeted financial statements
323
5.3: NOTES TO THE FINANCIAL STATEMENTS
Departmental Financial Statements and Schedules of Administered Items
Under the Australian Government’s accrual-based budgeting framework, and consistent with Australian Accounting Standards, transactions that agencies control (departmental transactions) are separately budgeted for and reported on from transactions agencies do not have control over (administered transactions). This ensures that agencies are only held fully accountable for the transactions over which they have control.
• Departmental items are those assets, liabilities, revenues and expenses in relation to the authority that are controlled by the authority. Departmental expenses include employee and supplier expenses and other operational costs, which are incurred by the authority in providing its goods and services.
• Administered items are revenues, expenses, assets and liabilities that are managed by an authority on behalf of the Government according to set government directions. Administered expenses include, grants and supplier expenses and administered revenues include contributions from States and Territories and the Australian Government.
Appropriations in the accrual budgeting framework
Under the Australian Government’s accrual budgeting framework, separate annual appropriations are provided for:
• Departmental price of outputs appropriations: representing the Government’s purchase of outputs from agencies or authority’s;
• Departmental capital appropriations: for investments by the Government for additional capital purchases; and
• Administered expense appropriations: for the estimated administered expenses relating to interest from the Government on special accounts held by the Authority.
Revenue from other sources
In addition, the NBA receives funding from all jurisdictions in a cost share arrangement (63% Australian Government and 37% from State and Territory Governments together). These amounts are held in special accounts.
Asset valuation In accordance with Schedule 1 of the Financial Management and Accountability (Financial Statements 2003-04) Orders and the Australian Accounting Standards, land, buildings, infrastructure, plant and equipment are valued on the fair value basis from 1 July 2003.

Agency budget statements—NBA
324