national advisory committee for aeronautics/67531/metadc57019/m2/1/high... · national advisory...
TRANSCRIPT

NATIONAL ADVISORY COMMITTEE FOR AERONAUTICS
TECHNICAL NOTE 4279
EFFECTS OF FIXING TRANSITION ON THE TRANSONIC AERODYNAMIC
CHARACTERISTICS OF A WINGBODY CONFIGURATION AT
REYNOLDS NUMBERS FROM 2.4 TO 12 MILLION
By Lynn W. Hunton
Ames Aeronautical Laboratory Moffett Field, Calif.
Washington
July 1958
TECH LIBRARY KAFB, NM
NATIONAL ADVISORY COMQ~EZ~ F'ORAEXONAUTICS
TRCHNICAL NOTE 4279
EFFFCTS OF FIXING TRANSITION ON THE TRANSONIC AERODYNAMIC
CHARACTFRISTICS OF A WING-BODY CONFIGURATION AT
RExImGDs N-uMBEm FROM 2.4 TO 12 MIXLION
By Lyan W. Hun-ton
SUMMARY
A wind-tunnel investigation has been made of the effects of fixing boundary-layer transition with wires on the aerody-nsmic characteristics of a wing-body configuration at Mach numbers from 0.7 to 1.3. The tests were conducted at constant Reynolds numbers of 2.4, 4, 8, and 3.2 million. The model consisted of an aspect-ratio-3 trapezoidal wing with a 3- percent-thick biconvex section in combination with a Sears-Haack body of revolution.
Results jnticated that with free transition of the boundary layer on the model, large effects of Reynolds number occurred on the aero- dyntic characteristics near zero U9t. These effects disappeared at test Reynolds numbers of about 8 million and above. Fixing of transi- tion on the model practically eliminated these effects over the entire Reynolds number range investigated. Furthermore, the fixed transition data matched closely the results obtained with free transitfon at a Reynolds number of 12 million. The wires used to trip the boundary layer caused an increment in drag coefficient of about 0.0008 at a Reynolds number of 12 million which remained approximately constant throughout the Mach number range.
INTRODUCTION
c
The extrapolation of small-scale test results to conditions that generally represent those of full scale continues to be one of the major problems encountered in properly interpreting wind-tunnel data. A vast majority of all high-speed tests in wind tunnels are conducted at Reynolds numbers below 4 million (based on the wing chord). For Reynolds numbers of this order, a large percentage of the boundary layer on the model can be laminar and changes in Reynolds number may cause rather large differences in the pressure distribution, such as discussed in references 1 and 2. Tests at low Reynolds numbers can result in irregu- lar lift and moment characteristics and changes in skin-friction drag

2 NACA TN 4279
with lift coefficient. Under full-scale conditions in flight, on the other hand, where the boundary layer is turbulent over most of the lift- ing surfaces, few, if any, of these irregular variations in aerodynamic characteristics found near zero lift would be expected.
1 -
One method used quite extensively in wind-tunnel tests to increase the effective Reynolds number consists of artificially fixing the transi- tion point of the boundary layer on the wing and body surfaces by mechani- cally disturbing the boundary layer with some form of surface roughness (e.g., refs. 1 and 3). While in most cases this technique has quite suc- cessfully diminished the severity of the irregularities in the aerodynamic characteristics, there has always persisted some element of doubt regard- ing the general applicability of data obtained in this manner.
It is the purpose of this report to examine in some detail the effects of fixing transition on a wing-body configuration at transonic Mach numbers. The analysis is based on lift, drag, and pitching-moment results obtained in the Ames ll-foot transonic wind tunnel on an unswept wing with a j-percent-thick biconvex section. The model was tested both with and without transition fixed for Mach numbers ranging from 0.7 to 1.3 and for Reynolds numbers ranging from 2.4 to 12.0 million.
NOTATION .
CD
'Dmin
Q)F
CL
%
Cm
CmcL b
C
cav
drag coefficient, 9 .-
w
minimum drag coefficient
skin-friction drag coefficient 2 skin-friction drag; j4 wetted area
lift lift coefficient, - SS
dCL lift curve slope, z
pitching-moment coefficient, pitching moment about Z/4
Glm dc, pitching-moment curve slope - ' dCL
wing span
local wing chord
average geometric chord of wing-body combination, wetted area of wing-body combination
2b + 2r,(s - 2)
F mean aerodynamic chord -. .-

NACA TN 4279 3
2 body length, distance from nose to theoretical point of closure
Q free-stream dynamic pressure
R Reynolds number based on F
R' Reynolds number based on cav
r local body radius
r0
S
maximum body radius
area of wing plan form
X Ustance along bcdy axis from origin at the nose of the body
a angle of attack, deg
6 boundary-layer thickness
‘1 fraction of semispan
Tunnel
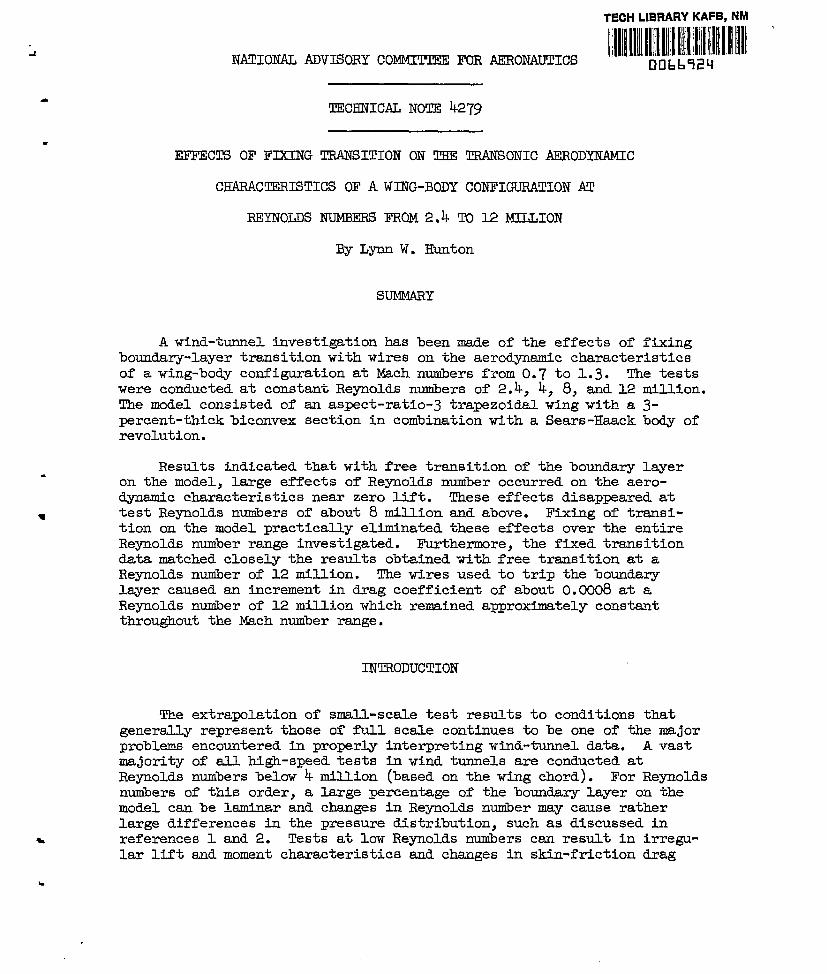
The tests were conducted in the Ames Ill-foot transonic WFnd tunnel which is a closed-circuit, variable-pressure type with perforated test- section walls. Figure 1 shows a schematic view of the tunnel circuit and figure 2 shows a sectional view of the test section. Mach number is continuously variable from 0.7 to 1.4 while the stagnation pressure also is continuously variable from 2 to 35 pounds pr square inch absolute. The air is dried to prevent the formation of condensation shocks. The three-stage axial flow compressor is driven by four 45,000 horsepower wound rotor induction motors.
Nozzle.- The nozzle is a variable geometry convergent-divergent type with two walls plane and parallel and the other two walls of flexi- ble plate that are driven by single jacks. The thickness distribution of the flexible walls is such as to yield a theoretically ide&L nozzle shape for producing a uniform flow field at the entry to the test sec- tion at a Mach number of 1.25. For other Mach numbers, of course, the flow field at the test-section entrance will be slightly nonuniform.
Test section.- The test region is square in cross section, ll feet by ll feet, and is 22 feet long. AllfourwCLls are perforatedand enclosed by a pressure-tight plenum chamber which equalizes the pressure on 83.U walJ.8. Growth of the boundary layer is compensated for approximately

4 NACATNk279
by slightly diverging the top and bottom walls; the two side walls are parallel. The porosity or open area in each of the four walls is 6 per- cent of the total wall area. Venting of the plenum chamber to the main stream is effected by a stepped opening at the entry to the diffuser. The pressure level in the plenum chamber is thus partislly controlled by the ejector action of the main stream flow'over this step.
Flow characteristics.- The longitudinal variations of air-stream Mach number in the test section for Mach numbers ranging from 0.8 to 1.5 are given in figure 3. These results were obtained at a stagnation pres- sure of one atmosphere and a stagnation temperature of about 100° F. Measurements of the local Mach number were made at b-inch intervals along the axis of the tunnel with the test section empty. The region for mini- mum Mach number disturbances for either subsonic or supersonic Mach num- bers can be seen to occur in approximately a lo-foot length of test section between stations 100 and 220. These.results, together with off- axis survey data (not presented here), showed the maximum deviation in Mach number to be less than *0.005 within the test region. The test location of the wing-body configuration of the present investigation is shown in figure 3 to be well centered within the lo-foot region of smoothest flow: - -
Model support.- The model was sting supported from a traversing support strut which is mounted vertically downstream of the test section. Changes in angle of attack are made in a vertical. plane. The support strut was traversed in the verticti plane so as to keep the center of rotation of the model essentially in the horizontal center plane of the test section. Themaximum angle-of-attack range attainable is KL5'.
Model
Pertinent dimensions of the wing-body model are given in figure 4. The wing was trapezoidal in plan form and had 19.1' sweepback of the leading edge, an aspect ratio of 3.1, a taper ratio of 0.39, and 3-percent-thick biconvex airfoil sections pars.LLel to the plane of symmetry.
The equation for the Sears-Haack body given in figure 4 relates the radius of the body to its length. The length indicated refers to the theoretic&L length of the body for complete closure at the aft end whereas the actual body length was only 79 percent of this value. The body fineness ratio (theoretical) was 12.5 and the ratio of maximum cross sectional area of the body to the wing area was 0.0510.
The model was sting-mounted and aLI. forces and moments were measured with an internal, electrical, strain-gage-type balance. Model angle of attack was measured by means of a pendulum actuated transducer located in the nose of the model. be within kO.05'.
Accuracy of this instrument is estimated to
.
*

NASA TN 4279 5
Boundary-layer transition on the model was fixed by means of a wire located near the nose of the body and-on the upper and lower surfaces of the wing as shown in figure 4. The wire diameter was 0.010 inch, the minimum size wire required to trip the boundary layer for the Mach number and Reynolds number ranges of these tests, according to the data of reference 4.
TESTS AND c0RRECT10RS
Lift, drag, and pitching moments were measured for the model at Mach numbers from 0.7 to 1.3 for an angle-of-attack range extending from -4O to loo. These tests were made at constant Reynolds numbers of 2.4, 4.0, 8.0, and 12.0 million based on the wing mean aerodynamic chord. The model was tested smooth and with wires added to fix transition.
No wall-interference corrections have been applied to the data. In reference 3 results are presented of an investigation of interference effects in a porous walled test section using a model configuration identical to the one considered herein. It was shown for Mach numbers from 0.6 to 1.3 that for the present amount of wall porosity (6-percent open area) practically interference-free data are obtainable for this model with as much as 1.2~percent blockage. The model blockage ratio of the subject investigation was only 0.6 percent.
i The pressure at the base of the model was measured and the axial force was adjusted to correspond to that force which would exist if the base pressure were equal to the free-stream pressure.
RESULTS AND DISCUSSION
Lift, pitching-moment, and drag characteristics for the model are presented in figures 5 to 7 for Mach numbers ranging from 0.7 to 1.3. C!omparisons are shown for the model with boundary-layer transition both free and fixed and for Reynolds numbers of 2.4, 4.0, 8.0, and 12.0 million. Following these basic data figures are sumnaary cross plots of the more important aeroaynamic characteristics. Lift curve slope, pitching-moment curve slope, and minimum drag characteristics are pre- sented in figures 8 to Xl., 12 to 14, and 15 to 19, respectively.
Lift Characteristics
.
1
At transonic speeds interaction of a shock wave with the boundary layer often affects the pressure distribution in a significantly differ- ent manner depending on whether the boundary layer is lsminar or turbulent

6 N&CA TN 4279
ahead of the shock (ref. 2). This difference between the lamlnar and turbulent layer cases makes it difficult to extrapolate smaU.-scale wind- tunnel data to large-scale applications.
.
d
Figure 8(a) clearly illustrates the large variation in lift curve slope that can be encountered at different Reynolds numbers when free transition is permitted on the model. At high subsonic Mach numbers almost a twofold change in this parameter occurs as the test Reynolds number is increased from 2.4 to I.2 million. The appearance of a large Reynolds number effect on CL& even at Mach numbers below the critical value (approximately 0.9 for the 3-percent-thick wing section) is a little surprising. At 0.7 Mach number figure 8(a) shows that the value of CL is much smsller at a Reynolds number of 2.4 million than at 12 million. The change csa be seen to be very gradual. with the change in Reynolds number. It is not at all clear from the available data whether the flow condition on the wing or the fuselage is responsible for the low lift curve slope. At higher subsonic Mach numbers the large Reynolds number effect on the zero lift & increases still further up to a Mach number of about 0.95. At this point, the effect declFnes sharply as the lift curve slope at the lower Reynolds numbers abruptly increases to values closely matching those obtained at the higher Reynolds numbers of 8 and 12 million. At sonic and supersonic Mach numbers the lift curve slope was little affected by changes in either Reynolds num- ber or lift coefficient (figs. 8(b) and 8(c)).
.
Fixing transition on the model completely alters the nonlinearity of the lift characteristics. Wires installed near the leading edge of the wing on both the upper and lower surfaces and near the nose of the fuselage (see fig. 4) artificially induced a turbulent boundary layer over most of the model. That the wires actually tripped the boundary layer successfully was established by experiment in which transition of the boundary layer was indicated by a diffusible solid, azobenzine (see
P
-
ref. 5). As a matter of interest a comparison between-the diameter‘of the wire of 0.010 inch and the calculated' thickness of the lsminar boundary layer on the wing at the wire location is presented in figure 9.
Figure 10(a) shows that with transition fixed on the model the effects of Reynolds number on the lift curve slope through zero lift virtually disappear. A summary of the effect of fixing transition on CL, for the several test Reynolds numbers given in figure ll(a), con- clusively illustrates the effectiveness of fixing transition at low Reynolds numbers in simulating the lift characteristics at high Reynolds number for this trapezoidal. wing-body configuration. The figure includes ' the theoretical lift curve slope variation with Mach number. For the subsonic speed range the Weissinger theory (ref. 6) was used while for the supersonic speed range solutions of the linearized compressible flow equation (ref. 7) were employed. Wing-body interference effects in the 1 Based on flat-plate considerations.

NACA TN 4279 7
calculations for both subsonic and supersonic speeds were accounted for by the method of Pitts, Nielsen, and KaaMari (ref. 8). The theory csn be seen to agree fairly well with experiment for the two highest Reynolds number conditions of 8 and 12 million with transition of the boundary layer either natural or induced. The largest discrepancy between the theory and experiment occurs in the low supersonic speed range where the Mach lines from one tip intersect the opposite tip. At Reynolds numbers of 2.4 and 4 million only the data with transition fixed show good corre- lation with the theory at subsonic speeds. At supersonic speeds little effect can be seen on the lift curve slope of figure ll of a variation in Reynolds number or of fixing transition.
Pitching-Moment Characteristics
A comparison of the data in figures 8 and 12 shows that the majority of the changes in lift are closely paralleled by accompanying changes in pitching moment. Effects of Reynolds number on the pitching-moment curve slope at zero lift with natural transition (fig. 12(a)) are almost identi- cal to those seen in the case of C& throughout the Mach number range. At low Reynolds number and subcritical Mach numbers, forward shifts in center of pressure on the model of as much as 12 percent of the mean aerodynamic chord were found, while at supercritical speeds the forward travel of center of pressure reached as high as 26 percent of the mean aerodynamic chord. At a Mach number of 0.94, the influence of the shock- wave boundary-layer interaction effect disappears quite abruptly causing the center of pressure to undergo a sudden rearward travel of approxi- mately 45 percent of the mean aerodynamic chord. This ma@pitude of change in center of pressure at a low Reynolds number compares with a shift of the aerodynamic center of only 13 percent near sonic speed for the model at a Reynolds number of 12 miU.ion. At supersonic speeds the effect of Reynolds number on the pitching-moment characteristics can be seen to disappear almost entirely.
Inducing transition on the model is shown in figure 13 to render the pitching-moment characteristics practic&Lly invariant with Reynolds num- ber at the lower lift coefficients of 0 and 0.2. At 0.4 lift coefficient significant Reynolds number effects are shown at Mach numbers below 0.9.
Figure 14 summarizes the effect on the pitching-moment curve slopes of fixing transition at the severaL values of test Reynolds number. These curves clearly show that for this configuration at zero lift the effect of Reynolds number practically disappears at some value of Reynolds number between 4 and 8 million. The value of this critical Reynolds num- ber would vary to some extent from one wind tunnel to another depending on the air-stream turbulence level. Above a Reynolds number of 8 million it appears to make little difference on the pitching-moment characteristics

8 NACA TN 4279
whether transition of the boundary layer is allowed to develop naturally or is induced artificially which probably indicates that the natural and induced locations of transition are nearly the same. Hence, the direct effect of the wire trip on the wing loading is quite SIILU at the higher Reynolds numbers.
At Reynolds numbers below 8 million, fixing of transition on this model constitutes an effective means by which the aerodynamic character- istics obtained at low Reynolds numbers can be made to approximate quite closely the results obtained at high Reynolds numbers. While such a result is encouraging from the standpoint of improving the usefulness of small-scele data, it nevertheless is a little surprising for the subsonic Mach number case, considering the sharp leading edge of the wing profile. It would be expected that the flow would separate at the sharp leading edge at small angles of attack and transition would occur close to the leading edge under all circumstances. Effectiveness of the transition strip apparently means that extensive runs of lsminar flow must have existed.
Drag Characteristics
Minimum drag characteristics of this model further illustrate some of the problems encountered in small-scale tests of models on which the boundary layer is allowed to undergo natural transition. Figures 15(a) and 16 show ~~ as a function of Mach number to increase gradually with increase in Reynolds number. Also, in the summary of these transi- tion free results given in figure 17 it can be seen that the minimum drag continues to increase to Reynolds numbers as high as 8 million. The magnitude of this change as well as the level of the drag would depend, of course, on the condition of the model surfaces and on the turbulence level of the air stream. Under these circumstances then, it would be virtually impossible to obtain consistent measurements of CDmin from one wind tunnel to the next. With transition fixed,= on the other hand, the minimum drag undergoes a normsl gradual decrease in value with increase in Reynolds number. It is also interesting to note that these minimum drag characteristics as a function of Reynolds number held quite
=It is to be noted that for the transition-fixed configuration the level of drag (hence ~,) was found to be-slightly in error (&CD =" 0.0015) for-the two lowest Reynolds number tests of 2.4 and 4.0 million. A portion of the 4 million Reynolds number data with transi- tion fixed was re-run to establish the drag level and these results are included in figures 7 and 15(b) through 18. No similar checkwas made, however, at a Reynolds number of 2.4 million which accounts for the omission of these results from the sumnary plots of CDrnin. Since the drag error is small, the effect on the lift and pitching-moment measure- ments is insig;nificant and hence has been ignored.

NASA TN 4279 J
”
.
uniformly throughout the Mach number range, subsonic or supersonic. Furthermore, the results at a Reynolds number of 12 million would tend to indicate that the drag of the wire remains nearly constant throughout the Mach number range at a value of about 0.0008 in drag coefficient. This value for the drag of the wire is close to the calculated drag values for the wire on an identical model given in reference 3.
The drag characteristics of the model as a function of Reynolds number permit sn interesting comparison to be made with the skin-friction drag of a flat plate. If it is assumed that the minimum drag measured for the model at a Mach number of 0.7 represents the subsonic skin- friction drag, then a comparison such as shown in figure 18 can be made. Here the measured Qmin values for the model have been converted to a skin-friction coefficient C!Q, using one-h&f the wetted area of the complete model as a reference instead of wing area. In the case of the values of Reynolds number, however, a -problem arises as to what reference length to use to compare the wing-body combination with a sim@e rectangu- lar flat plate. For the present comparisons equ.sl spans were selected and an average geometric chord for the complete wing and body combination was computed for a reference length. With this increased reference length sll test Reynolds number values were increased by 40 percent. These results in figure 18 are seen to be in excellent agreement with theoreti- cal values for a flat plate. The measured drag points with transition fixed exhibit virtually the same slope as the theoreticsl Scblichting turbulent skin-friction curve for a flat plate and are displaced above the theoretical curve by an amount about equal to the estimated drag increment for the wire.
Figure 18 also includes a curve showing the calculated skin-friction drag coefficient for the model with laminar and turbulent boundary-layer flow areas assumed to be distributed in the manner illustrated in fig- ure lg. The location of transition was assumed to occur at Reynolds num- bers of 1.4 million for the wing and 2.5 million for the body. It should be noted that both these values of critical Reynolds number are somewhat arbitrary: That for the wing falls well within the critical range indi- cated for a flat plate in reference 9, while that for the body was chosen on the basis of unpublished results obtained in the Ames l2-foot pressure wind tunnel on several types of bodies of revolution. The favorable effect of negative pressure gradients on the stability of the laminar boundary layer on the wing was ignored. Despite these approximations, the calculated curve is seen to be in excellent agreement with the free transition data.
CONCLUSIONS
A study has been made of the effect of fixing boundary-layer transi- tion on the lift, drag, and moment characteristics of en aspect-ratio-3 trapezoidal wing-body configuration for Mach numbers from 0.7 to 1.3 and

10 NACA TN 4279
Reynolds numbers were as follows:
from 2.4 to 12 million. The general conclusions reached -
1. With natural transition on the model, large effects of Reynolds number were found near zero lift at subsonic Mach numbers on lift curve slope, pitching-moment curve slope, and drag. These effects persisted up to a Reynolds number of about 8 million.
2. Fixing of transition on the wing and body for the most part eliminated the effects of Reynolds number on the lift and moment charac- teristics and, in the case of minimum drag, resulted in a norm&L decrease in drag throughout the Reynolds numberrange -of the tests. Hence, fixing of transition constitutes an effective means by which the aerodynamic characteristics obtained at low scale can be made to approximate closely the results obtained at high Reynolds number.
3. The wires used to trip the boundary layer on the model caused a minimum drag coefficient increment of about 0.0008 throughout the Mach number range at a Reynolds number of 12 million.
Ames Aeronautical Laboratory National Advisory Committee for Aeronautics
Moffett Field, Calif., Apr. 24, 1958
REFERENCES
1. Haines, A. B., Holder, D. W., and Pearcey, H. H.: Scale Effects at High Subsonic and Trsnsonic Speeds, and Methods for Fixing Boundary- Layer Transition in Model Experiments. British TN Aero. 2338, Sept. 1954.
2. Holder, D. W., Pearcey, H. H., and Gadd, G. E.: The Interaction Between Shock Waves and Boundary Layers. British A.R.C. C.P. No. 180, 1955.
3* Stivers, Louis S., and Lippmann, Garth W.: Effects of Fixing Boundary-Layer Transition for an Unswept-Wing Model and an Evaha- tion of Porous Tunnel-Wall Interference for Mach Numbers From 0.60 to 1.4-O. NACA 'IN 4228, 1958.
4. Winter, K. G., Scott-Wilson, J. B., and Davies, F. V.: Methods of Determination and of Fixing Boundary Layer Transition on Wind Tunnel Models at Supersonic Speeds. British TN Aero 2341; A.R.C. C.P. No. 212; and A.R.C. Rep. 17,416, 1955; AGARD Rep. AG 17/P7, Nov. 1954. .

NACA 'ITT 4279 ll
5. Main-Smith, J. D.: Chemical Solids as Diffusible CoatFng Films for Visual Indications of Boundary-Layer Transition in Air and Water. British A.R.C. R.&M. 2755. Feb. 1950)
(Also available as R.A.E. Chem. 466,
6. DeYoung, John, and Harper, Charles W.: Theoretical Symmetric Span Loading at Subsonic Speeds for Wings Having Arbitrary Plan Form. NACA Rep. gU, 1948.
7. Lapin, Ellis: Charts for the Computation of Lift and Drag of Finite Wings at Supersonic Speeds. Oct. 1949.
Douglas Aircraft Co. Rep. SM-13480,
8. Pitts, William C., Nielsen, Jack N., and Kaattari, George E.: Lift and Center of Pressure of Wing-Body-Tail Combinations at Subsonic, Transonic, and Supersonic Speeds. NACA Rep. 1307, 1957.
9* Gazley, Carl, Jr.: Boundary-Layer Stability and Transition in Sub- sotic and Supersonic Flow. General Electric Rep. No. 52~0506, May 1952. (Also available as Heat Transfer and Fluid Mechanics, L.A., Preprints, 1952, Pp- 73-93)

12 NACA TN 4279
=To air dryer --s.Jla com&m?ssor c
'Mach meter
-Outline of test chamber
-__--- -__- __-._
-i
-r-------- I Outline of motor house
Figure 1." General plan view of the Ames Ill-foot tranaonlc wind. tunnel.

I .
A43406.2
figUre 2-- Arrangement Of the Ames ll-foot transan3.c wind-tunnel test-section ref@On. I5 -a ul

I k L c
I I I I I I
1.0
.P
.a
Figure 3.- Mach number tistdbution in the test section ddinea on the center-line axis with tunnel empty. G

E
All dlmenslom In Inches unless otherwise noted.
-It+ 2.87
Tramltion wires
c2l.86
1
\ \ \ a n \ \ \ \ \
*10.98+ll.5o-L( 37.63 - - 29.58 1
1 2=l.l.5.00 a
Figure 4.- Plan-form details of the model.
--t
63.41
1
---_ -- - - _ --- 4 rJ
. . I ,

I I I .
.6
..2
U kfi iV ii I 0 Free tram1t1ca 0 Fixed traneitlcm
-.s 0 4 8 1.2 16 (ior M=o.~)
An&? of attack, a, dag
(a) R=z!.~Lo"
Figure 5.- Ccmparlsoa of the lift chamcterlstlcs of the model with tmndtion free and fixes for conetaT12. Mach nuuibers.
s

--l-rr I I I 0 Free transition I I III III I I I I ” ’ “1 ! I
I I I I I I - 23. 3
III II 11 ’ “1 I I I I I I I I I I ! I I I I I I I I
.6
I Y
(b) R=4.0x10⁶
Figure fj.- Contirmed.

I , P L .
.6 I I /I / w*?o/l.& .gq *‘“I” . I l
Y / .4
-. 4 0 Fixed transition
-. 6 -4 0 4 8 1.2 16 (for b&70)
Angle of attack, a,deg
(c) R=8.zb<106
Figure 5.- c0dhuea.

1.0
.8 OFtree trans1tlon q mxed tram1tion
.6
-. 6 8 -4 0 4 8 (* W.-P) Angle of attwk, a, deg 2
(a) ~=r2.cmoe E
is! Piigre 5.- Continuea. i5
d
I . I .

I , I I t .
.8
-8 -4 0 4 8 (for ti.13) mm of attach, a, &g
(e) R=U.wos
mgre 5.- conciuaea.

.8
.6
.2
0
-.2
-. 4.. - ". 0 Feed. transition
--5.4 0 -.04 -a -.I2 (far l4dL-p)
Pitclang-mcaaant coemcicat, cm
(a) R=~.~Lo"
Figure 6.- Cosrparison of the pitching-mcmmd characteristics of the mcdel with transition free and fixed for constant Mach numbers. 6
72
I L I , .

1.0
0 Free trarrsition .8
.2
0
-.e
-. 4
I -?04
-
0 -.04 ..08
Pltching-nlmt coefYicient, cm
(a) R&.W06
Figure 6.- cdhued.

-
1.0 I I I I I I I I I I I I I I I I I I I I I I I l I I I I 1) I I I I I I I I I I I I I I I I I I I Iometrensition I I
I I I I I I I I 1 q Femd trene1t10n
h t2 1.20 1.3op I I
P Y
PI rI i i i I i
Pitchingaant coaff"iclent, cm
(c) R=8.cmO6
PQLKE 6.” Continues.
. L . . I ',

.6
.4
.2
0
-. 4
-. 6
Pitcbing~ent coefflclent, cm
(a) R=12.0X10e
Flgure 6.- Continued.

.8
0 Fbed trene1tion .6
.4 .4
.2 .2
I I I I I.&I WI lb7 18’1 I I I I I.&I WI lb7 18’1 VI HI I I I I I I I I
-. 4
-. 6 .a3 .04 0 l .04 -.09 (for Kl.13)
Pltdhgm t coeffloieIlt, cm
(e) R=12.(3x10⁶
Figure 6.- Concluded.
I .

.8
.6
.4
.2
3
F: G 0
-.2
-. 6’ r ) 0 .a2 A4 .06 .oe .lo .I2 .14 .16 ..Lu \L”r Pm. ,“,
(a) R=~.~Ao~
Figure 7.- Comparison of the drag characteristics of the model with trmsition free snd fixed for constant Mach numbers.

_. .._.
.6
.
(b) R=4.Cx106
Figure 7.- Continued.
I , . I

-.2
-. 4
-. 6 0 .04 .06 .oe JO .I2 .14 .16 (for~~.p)
JhwJf coefflclent, CD
(c) R=8.0x10⁶
Figure 7.- Continued,

1 ., 0 I I I I I I I I I I I I I I
I 1 ] j 0 Free trmeit1on
.8
1
I I I I I I I I I I q I%xea transition
.6
,.2
.
8. 4
,.60 .m! .& A6 (for 160.70)
Dreg cmm.clent, CD
(d) R=12.0x10⁶
Figure 7.- Cont;imea.
, I .

1.0
.8
.6
.4
.2
0
..2
. . 4 III II I ” ” ” ‘1 1’ ‘1 “1””
r. 6 0 .02 .04 .06 (for Md.13)
Crag coeWicient, CD
(e) R=12.CDU.06
Figure 7.- Concluded.

.-
! “,I
:6 t -7 .8 .9 1.0 1.1 M
(4 CL=0
w
mgure 8.- Variation of lift curve slope with Mach number for several values of Reynolds number; transition free.
, t

0 .6 l 7 .8 09 1.0
M
(b) ~,=a.8
figure 8.. contlnuea.
1.1

w .F
R __O__ 2.4 x 10"
.x?-
2
4.0 x log. 8.0 x 10'
-J2.0 x 108 I I I I I I
‘“I-I
I I16
I I
-7 .8 09 1.0 M
(c) CL-o.4
Mgure 8.- codda.

N&A TN 4279 35
6, in.
diam.
.6 .B
Figure 9.- Cakulated thickness of the lsminar boundary layer at the wire location as a function of wing semispan.

.
w m
.oa
%
.04
0 .6 .7 .8 .9 1.0 1.1 1.2 1.3
M
Figure lO.- Variation of lift curve slope with Mach nmber for several values of Reynolti number; transition fixed.
. I
* #

.08
.04
n l 7 .8 -9 1.0 1.1 1.2 1.3
M
(a) cp3.2
Figure lo.- continued.
Y

.04 .04
:6: :6: 97 97 .8 .8 -9 -9 M
(c) CL=&4
Figure lO.- concludea.
w OJ
, I I

NACA TN 4279 39
Free transition ----Fixed transition ------Theory
R=4.0Sx 10'
.6 .8 1.0 1.2 1.4 M
Figure Il.- Effect of fixing transition on the variation of lift curve slope with Mach number for several values of Reynolds number.

NACA !l'N 4279
Free transition --- Fixed transition
.I I I I I I
R=l2.0 x lo6 0 I I .6 .8 1.0 1.2 1.4
M
(b) CpO.2
Figure Ill.- Contimed.
.

L NACA TN 4279 41
cLa
.1
Free transition -- -Fixed transition
R=4.0 x 10' 0
Figure Il.- Concluded.
.

,
-* 4 R
- 2.4 x lo6
.CT .6 .8 .9 1.0 1.1 1.2 l-3 M
(4 CL=O
Figure l2.- Variation of pitching-moment curve slope tith Mach number for several values of Reynolds number; transltlon free.

I .
-. 2
4.0 x 1oa 8.0 x lo6
-*- l2.0 x 106 0
rigwe ET!.- Continued.

c%L
0
1
-2 .6 -7 .8 -9 1.0 I.1 1.2 1.3
M
(c) CL=&4
Figure l2.- CcmclxkIed.
I

-. 4
-.2
% L
0
.2 2 .6
- 2.4 fx 10' I I I I3
i? 4.0 x los I I I I I I I I 8.0 x lo6
n .tl -9 1.0 1.1 1.2 1.3 M
(a) CL&
Figure 13.- Variation of pitching-momant curve elope with Mach number for: several vaJ.ues of Reynolds number; transition fixed.

,.2 I I I I I I
,-s- 2.4 "x 10'
H : 4.0 x lo6 8.0 x 10”
06 .8 .9 1.0 1.1 1.2 1.3 M
(b) CL=&2
Flgure 13.- Contintbzd.
‘ , . I r

, 1
M
(c) CLd.4
Figure 13.- Concluded.

4-a
-. 2
0
.2
C mCL
-. 2
0
.2
NACA TN 42'79
Free transition --- Fixed transition
0 I I I I ---a .’
Y Rd.0 X lo6
.2
I I I I al I I I --L// I R=8.0 x 10' 1
0
.,I .6 .a 1.0 1.2 1.4
M
(a) CL=O
Figure lb.- Effect of fixing transition on the variation of pitching- moment curve slope with Mach number for several values of Reynolds numbers

L . NACA TN 4279 49
Free transition --- Fixed transition
-. 2
0
.2 -a
c! mcL -.2 .
0
,2 ,2
0 0 R=l2.0 R=l2.0 x 10 x 10
.a
(b) CL=&2
Figure lb.- Continued.

NACA TN 4279
-. 2
0
.2
Rree transition --- Fixed transition
0
.2 .6 .0 1.0 1.2 1.4
M
(c) c!+L4
Figure lb.- Concluded.

003
.M
0 .
- 2.4 "x 10'
H
4.0 x lo6 8.0 x lo"
- - 12.0 x 10" t
0-7 .8
(a) !lhrlsition free.
Figure 15.- Variation of mlnimum drag with MBch number for several values of Reynolds number.

.-
VI lu
.6 .B l 9 1.0 1.1 1.2 l-3 M
(II) Transltlon flxed
Plgure 15.- Concluded.
I

NACA TN 4279 53
l%ee transition --- Fixed transition
0 .6 .8 1.0 1.2 1.4
M
Figure 16.- Effect of fixing transition on the variation of minti drag with Mach number for skveral values of Reynolds number.

54 NACA
0 Free transition I7 Fixed trasition
.016
.n
.008
.008
TN 4279
c
Figure 17.- Effect of fixing transition on the variation of minimum drag with Reynolds number for several vaLues of Mach number.

10 9 8
7
6
5
4
cDF 3
2
1 L6 7
I I -. c~+Lgl(log,JP ) -2*58 L
4 . -A. -2-m- e,-*
\
g 10" 2 3
R'
R' ' L 1.4 x 10d ( WiJlg) -=*= 2.5 x lo6 (body)
I
\
5 6 7
0 itree ti-ausition III Fixed transitior
-
- ;I g lo7 1.:
1
i
Figure 18.- Comwrlson of nxinimum &rag for the model (M=O.7) tith the theoretical, skin-friction drag coefficient of a flat plate.

1 Lambax area
Figllm 1y.- ,Smp.l,e distribution oflminarand tuxbulentboundary-layer flow axeas for themcdel !2 with free transition for the calcuutions of figuxe 18. x
cl