nasa tla workload analysis support
TRANSCRIPT
NASA Contractor Report 3199
I .. 0. _ ....
I
NASA-CR-3199 19800011509 uc_"_ ,,_.._-.-,_........[
NASA TLA Workload Analysis SupportVolume 1 - Detailed Task Scenarios for General
Aviation and Metering and Spacing Studies
James L. Sundstrom
CONTRACT NAS 1-13741
MARCH 1980
N/L/X
https://ntrs.nasa.gov/search.jsp?R=19800011509 2020-03-21T19:53:04+00:00Z
brought to you by COREView metadata, citation and similar papers at core.ac.uk
provided by NASA Technical Reports Server

3 1176 00520 2859 !
II
Ii
i
NASA Contractor Report 3199
NASA TLA Workload Analysis SupportVolume 1 - Detailed Task Scenarios for General
Aviation and Metering and Spacing Studies
James L. SundstromBoeing Commercial Airplane CompanySeattle, IVashington
Prepared forLangley Research Centerunder Contract NAS1-13741
N/LS/XNational Aeronauticsand Space Administration
Scientific and TechnicalInformation Office
1980

FOREWORD
This technical report covers work performed under Change Order of NASA contractNAS 1-13471, "Timeline Analysis Program." This study effort was initiated to developdetailed task workload scenarios for one general aviation instrument flight studies and fivecommercial aviation metering and spacing techniques utilizing advanced electronic displays.
Work was performed under the guidance of Amos A. Spady, Jr. as technical monitor.Additional contributions were provided by Max J. Kurbjun in definition of objectives and
Kathryn Smith in resolution of computer programming problems.
This contract effort covered the period from September 30, 1977 through September 30,1978 at the NASA/Langley Research Center, Hampton, Virginia. James L. Sundstrom was
the principal investigator and requirements analyst, Arthur F. Anderson was the programanalyst, and Wayne D. Smith, program manager, and Donald L. Parks provided direction andassistance in the human factors area.
..°
lU

CONTENTS
Page
1.0 INTRODUCTION AND SUMMARY .................................... 1
1.1 Background ................................................... 21.2 Summary of Scenario Details ..................................... 2
1.2.1 General Aviation Single Pilot IFR ............................ 21.2.2 Metering and Spacing (M/S) Scenarios ......................... 31.2.3 Forward Flight Deck (FFD) Autopilot Scenario ................. 3
2.0 TECHNICAL APPROACH ........................................... 4
3.0 ABBREVIATIONS ................................................. 6
4.0 SCENARIO RESULTS .............................................. 7
4.1 General Aviation Single Pilot IFR Scenario (GA-SPIFR) ................. 7
4.1.1 Purpose ................................................ 74.1.2 Description ............................................. 74.1.3 Data Development ........................................ 84.1.4 Validation Results ........................................ 9
4.2 Metering and Spacing (CDTI Baselines) .............................. 9
4.2.1 Purpose ................................................ 94.2.2 Description ............................................. 9
4.2.2.1 Byers Approach ................................... 104.2.2.2 Longmont Approach ............................... 11
4.2.3 Data Development ........................................ 124.2.4 Validation Results ........................................ 12
4.3 Forward Flight Deck Autopilot .................................... 134.3.1 Purpose ................................................ 134.3.2 Description ............................................. 134.3.3 Data Development ........................................ 144.3.4 Validation Results ........................................ 14
5.0 CONCLUSIONS AND RECOMMENDATIONS ........................... 155.1 Conclusions ................................................... 155.2 Recommendations .............................................. 15
REFERENCES ........................................................ 17

TABLES
No. Page
I Byers Approach Scenario Key Event Data ................................ 192 Longmont Approach Scenario Key Event Data ............................ 203 Examples of New Metering and Spacing Data File.......................... 21
FIGURES
No. Page
I General Aviation Scenario Profile ...................................... 222 Coordinate System in General Aviation Simulator ......................... 233 Workload Analysis Worksheet ......................................... 244 Human Factors Data Used for Task Time Derivation ....................... 255 Internal Vision Workload Histogram Report .............................. 266 Denver Runway 26 Arrival Routes ..................................... 277 Fixed Path Metering and Spacing ...................................... 288 Workload Histogram ................................................ 299 Workload Summary ................................................. 30
10 Mission Timeline ................................................... 3111 Forward Flight Deck Scenario Profile ................................... 32
vi
1.0 INTRODUCTION AND SUMMARY
Tile purpose of this report is to summarize tile efforts required to develop detail task datafor six new timeline analysis (TLA) detailed task scenarios. These detail task scenarios
reflect the requirements for general aviation, metering and spacing, and terminal controlvehicle (TCV) research studies. This volume will provide an outline of steps required toinitiate a detailed task scenario and resulting examples. Volumes 2 and 3 provide detailedreport data (CR- 3239 and CR- 3240 ).
Tile Timeline Analysis (TLA) program was originally developed to aid the National Aero-nautics and Space Administration (NASA) Terminal Control Vehicle (TCV) programstudies. The emphasis of the TLA program was to provide detailed task-by-task scenariosthat would provide measures of crewmember workload demands for normal and abnormalflight situations.
The present contract was to adapt tile TLA data to the following studies:
1. A general aviation single pilot instrument flight research
2. A study on metering and spacing techniques and also the installation of a cockpitdisplay traffic indicator (CDTI) in airline flight decks
3. An extension of the original TCV scenario to show autopilot control operation in tileforward flight deck.
Item 1 required a complete buildup of task data representative of tile aircraft beingsimulated in this study. Items 2 and 3 basically required modification and reorganization ofthe existing TLA data file. The new detail task scenario data developed under the aboveefforts was submitted against the TLA program for validation purposes, i.e., checking thedata order to remove errors that may have occurred during the creation of the scenario data.
The TLA program is general in nature, hence, it lends itself well to many different applica-tions. The current NASA TLA program configuration requires large amounts of work forthe analyst to create or substantially modify any scenario. This results from the scenariobuilding technique being one of iteratively filling in the blanks, i.e., first define the majorevents and then go back and fill in the basic tasks required to fly the airplane. The major
problem is to fill in the scenario as completely as possible to reflect a continuous workloadsituation. It is the "gap filling" requirement for the continuous workload picture thatrestricts the effectiveness of the TLA program. The NASA TLA program needs to berefined to reduce scenario construction and report generation in order to further increase
the program utility and productive analytical work.
1.1 BACKGROUND
The TLA program contract NAS1-13741 under change order 4 specified two tasks. Thesetwo tasks were: (1) develop scenarios to be used with the general aviation single pilotinstrument flight research (GA-SPIFR) studies, and (2) develop one or more scenarios tobe used in the studies pertaining to metering and spacing (M/S).
Additionally, another scenario was tasked to describe the workload associated with thestandard forward flight deck functions in TCV operations. This scenario was created toextend the data of the original scenario group in which all forward flight deck operationswere manual control while all aft flight deck operations were 4-dimensional (4D) auto-control. It defines the activities required to operate from the forward flight deck of theTCV aircraft while using a standard airline-type autopilot, i.e., inputting pitch and attitudeinformation via the control wheel steering feature.
These scenarios, as with the original TLA scenarios, were developed from descriptions ofmajor flight milestones called key events. The key events are described by procedures (setthe flaps, lower landing gear, etc.) which are composed of the individual tasks (uniqueoperations) that need to be performed in order to accomplish the procedure. Each taskdemand is allocated to two or more of the nine possible crewmember workload channels
utilized to accomplish the task. Tile channels are internal and external vision, left/righthands and feet, audition, verbal, and cognition. Every task is considered to impact thecognitive channel.
Tile general aviation, M/S, and TCV scenarios reflect nominal workloads based onpublished checklists and operating procedures for the aircraft involved.
The baseline detailed task scenarios assume all workload tasks to be accomplished correctlyand without repetition when indicated.
1.2 SUMMARY OF SCENARIO DETAILS
The following discussion summarizes the elements of the developed scenarios and majorobservations resulting from their construction and validation. Also, preliminary workload-related information resulting from the validation efforts is presented as a matter of generalinterest.
1.2.1 GENERAL AVIATION SINGLE PILOT IFR
The general aviation single pilot scenario details the efforts required to depart, climbout,enter a holding pattern, enter an air traffic pattern via radar vectors, and fly a landingapproach within a high-density traffic area. All procedures and tasks were developed todepict the workload required to operate a Cessna 172-series aircraft in the Atlanta, Georgia,high-density traffic area by a single pilot. This effort required a complete data file develop-ment, i.e., new tasks were defined based on a Cessna 172-type cockpit arrangement andorganized into procedures as required by the checklists and operations manual.
2
The scenario was validated by the TLA program. Initial validation reports appear to indi-cate an imbalance regarding visual versus cognitive workload, pointing out a need forredefining the weighting procedure used to define the cognitive channel. All other workloadchannels appear to be rational.
1.2.2 METERING AND SPACING (M/S) SCENARIOS
Four detailed task scenarios were created for this task: two for the Longmont arrival pathto Denver and two for the Byers arrival path. Each set consists of one scenario depictingthe use of manual (hands-on) flight controls and autothrottles, and one scenario depictingthe use of 2D autopilot flight path control also using autothrottles.
These scenarios start with the aircraft already in an en route descent. The Longmontapproach is a more classical air traffic pattern utilizing a downwind and base leg to the finalapproach path, whereas the Byers arrival path is basically a straight-in approach to theDenver airport.
The M/S task scenarios were validated (checked for data errors) by the TLA program. Theseefforts automatically provided preliminary information regarding the workload profiles.
Overall, a comparison of the manual scenario versus the autopilot scenario does not show alarge workload differential. This is due to the fact that the majority of the workload wasvisually oriented for both scenarios. Basically all that changed was the hands-on workload,i.e., the workload associated with manually flying the airplane.
1.2.3 FORWARD FLIGHT DECK AUTOPILOT SCENARIO
This task scenario was created by modifying the in-flight phases of the original TLA TCVprogram, i.e., climb, en route cruise, descent, approach, and land. The modification con-sisted of removing all straight-and-level manual control procedures from the affected phases.These phases then describe the effort required to fly via manual autopilot with pitch anddirectional changes input through the control wheel steering feature.
The initial TLA validation reports for this effort indicate that, as might be expected, there isa reduction in workload for the motor, cognitive, and weighted average channels. (Moredetailed analyses of the results were not performed due to contract time constraints.)
2.0 TECHNICAL APPROACH
The most recent TLA task requirements were to develop six new additional detailed taskscenarios. One scenario (general aviation) was built from scratch and the remaining fivewere produced by modifying the existing TCV data file to show the required operations.The following is an outline of the general approach to building a detailed task scenario andthe associated TLA data file from the beginning:
1. Define the purpose for developing the scenario
2. Define a route structure, or an area of operations that will present the activity to bestudied
3. Write a descriptive scenario of the events that will take place for the length of time thescenario is assumed to be active
4. Outline the complete scenario in terms of events or key milestones, i.e., start takeoff,start turn, level off, descend, intercept final approach course, land, etc
5. Develop procedures, based on the checklists and operations manuals of the aircraft
type, which will fully describe the activities required to reach and pass the key mile-stones
6. Define each procedure, in turn, by the discrete tasks or points that must be looked at,actuated, or switched in order to accomplish the activity, e.g., setting the flaps requiresactuating the flap lever, monitoring the flap position indicator, checking the leadingedge indicator lights, monitoring airspeed, and all associated communication thataccompanies this procedure.
7. Items 4 through 6 are broken into four distinct groupings:
a. The key events are grouped to describe phases of flight. Flight phases are directedto accomplishing one of the major key milestones. For instance, the takeoffphase includes all procedures and tasks required from takeoff clearance throughraising the gear. This phase is followed by climb, enroute cruise, descent,approach, and landing. In the data file, the PHASE description consists of allprocedures active during the time period of the phase.
b. The procedures are broken out separately since they may be used in any phaseif they are applicable.
c. The tasks are also grouped separately in the data file as the most basic unit used
to describe workload activity. They are grouped by the subsystems involved bythe task.
4
d. The subsystems breakout is used to develop a measure of workload activity bysubsystem. This breakout basically follows the specification for Manufacturer'sTechnical Data, ATA (Airline Transport Association) Specification Number 100,revision II (also see ref. 1). The differences for TLA are that the subsystems werenot defined for secondary and tertiary levels nor was the ATA numberingsystem used.
The steps above develop the phase, procedure, task, and subsystem data necessary todescribe in detail the activities required to perform as described by the written scenario.
However, before the detailed task data can be submitted to the Timeline Analysis Programfor validation, it is necessary to define the time required to perform each task and allocatethat time to the appropriate operator channels. Operator channels are those physicalattributes required for task performance: vision (internal and external), communications(audition and verbal), and motor activity (left/right hand and foot). Also, all tasks are, bydefinition, said to impact cognition; therefore a small percentage of every task time isallocated to the cognition channel.
Task time definition requires the following steps:
1. All switches, gauges, and controls must be defined in X, Y, and Z coordinates relativeto the right eye and right shoulder design points.
2. The computed distances are then applied to the task ordering as described by theprocedures. (Note: The same task may be used from several different positionsrequiring more than one task number for the same task.)
3. Finally, human factors data regarding reach and look times between points are appliedto the task distance ordering to define each task time.
4. The task times are then allocated across the operator channels on a percentage basis.If the task is discrete it requires a 100 percent utilization of the operator channel,otherwise the percentage allocation will be less. (An example would be setting a switchwhich requires it to be identified visually and operated manually. The total task timemay require only 20 percent visual activity while requiring 100 percent manual activityand some small percent for thinking about the task.)
The above activities produce the detail task scenario to be validated by the TLA program.It is only after the above activities have been accomplished that workload evaluation andanalyses can begin. However, once the data file has been developed, defined, and debuggedsubsequent workload efforts will generally only require data file modifications.
3.0 ABBREVIATIONS
AFD Aft Flight Deck
ATC Air Traffic Control
CDTI Cockpit Display Traffic Indicator
FFD Forward Flight Deck
GA-SPIFR General Aviation Single Pilot IFR
IFR Instrument Flight Research
MC Manual Control
M/S Metering and Spacing
R Radial
TCV Terminal Control Vehicle
TLA Timeline Analysis
VOR Very High Frequency Omnidirectional Range
2D Two-Dimensional Navigation
6

4.0 SCENARIO RESULTS
This section provides a discussion of the three major groups of study scenarios, i.e., generalaviation, M/S, and TCV forward flight deck (FFD). Each area will be addressed separatelyin terms of purpose, description, data development, and outputs.
4.1 GENERAL AVIATION SINGLE PILOT IFR SCENARIO (GA-SPIFR)
4.1.1 PURPOSE
The purpose behind this scenario was to provide a basis to later define and study nominal/off-nominal workloads that might be encountered by a general aviation single pilot in IFR
conditions in an ATC high density traffic area. The result of the study was to be a baselinethat could be used to develop procedures and/or equipment that might reduce the work-loads associated with single pilot instrument approaches.
4.1.2 DESCRIPTION
A plan view of the general aviation single-pilot instrument flight rules (GA-SPIFR) flightprofile is shown in figure 1. As noted on the figure, the operations were assumed to takeplace at the HARTSFIELD Atlanta International Airport (Atlanta). The flight as shownencompassed: (1) a departure from Atlanta, (2) climb via the runway 8 ILS missedapproach path, (3) a holding pattern at the missed approach fix, (4) radar vectors to thefinal approach course, (5) and, an ILS final approach to landing. The complete scenariofrom takeoff to landing requires 40 minutes. All task activities presented in this scenarioare representative of the Cessna 172-series aircraft. Activity details were derived from thechecklists and operating instructions of the aircraft plus activities required by the ATC
system.
The detail description is as follows:
The flight begins with the aircraft in position ready for takeoff. Upon receiving theair traffic control (ATC) takeoff clearance, the pilot applies full power to start thetakeoff sequence.
After rotation and liftoff, the pilot raises the flaps, climbs straight ahead, and contactsthe ATC departure control. The pilot receives instructions to climb to straight aheadto 1500 ft, then turn left climbing to 3500 ft via the outbound Atlanta VOR (veryhigh frequency omnidirectional range) radial (R) 360 to the TROY intersection andhold NORTH.
The pilot then sets up the proper navigation radio frequencies to intercept both theATLANTA VOR R-360 and the TROY intersection defined by the Atlanta VORR-360 and the 254 radial from the NORCROSS VOR. Upon reaching the intersec-tion the pilot enters a holding pattern with the outbound leg heading 360 using rightturns.
7

While in tile holding pattern, the pilot receives ATC instructions to depart the holdingpattern and follow ATC radar guidance vectors to the final approach course. Uponreaching the final approach course, the pilot flies to touchdown using ILS procedures.The scenario terminates at the completion of landing roll.
A gross timeline from the above scenario were described by phases-takeoff, climb,cruise, holding, descent, final approach, and events-liftoff, flap settings, radio changes,
and landing. Inspection of the basic profile, aircraft type, and area of operation willprovide selected scenario elements (e.g., takeoff, cross outer marker) which providedtime constraint estimates. The time estimates provide a gross timeline which wasrefined by an iterative process.
The detailed flight profile procedures and tasks were then developed by personnel of the
Stability and Control Branch of the Flight Dynamics and Control Division at the NASA/LRC. Preliminary results of this effort have been reported in NASA Technical Memoran-dum 78748 (ref. 2) co-authored by David A. Hinton and John D. Shaughnessy.
The data file created for the general aviation scenario effort is a permanent datafile in thecomputer system at NASA and under the control of the Stability and Control Branch
personnel. The data file will not be presented in this report.
4.1.3 DATA DEVELOPMENT
The generalaviationtask time data were developedindependent of the TCVdata file as thelocation and sequencingof task elements is substantiallydifferent for the general aviationaircraft. However,tile analyticalprocedure and techniquesused to developthese data werethe sameas those used to developthe TCVdata.
Basicallythe data developmenttechniques based on panel arrangementsand procedureswere:
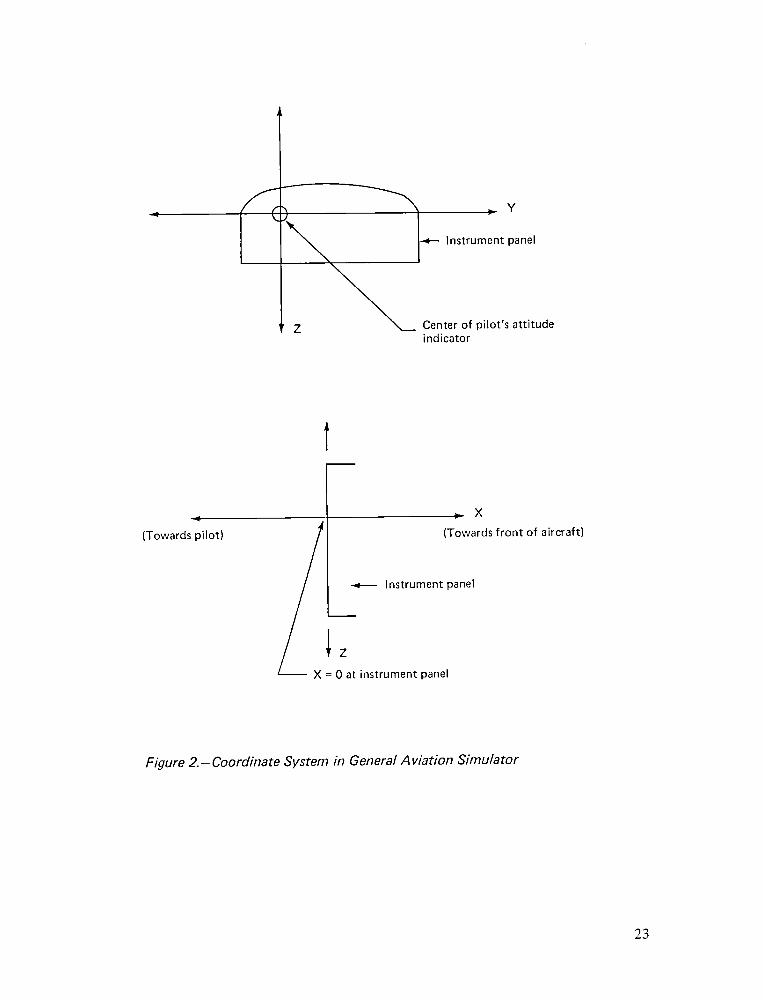
1. Locatingall instruments and controls in X, Y, and Z relativeto a nominal eye andshoulder point (fig. 2)
2. Developinga sequenceof tasks required to complete a procedure from the checklistsand operating procedure for the aircraft type (fig. 3)
3. Applyinghuman factorsdata to the task sequencerequirements for reach distances,switch or control actuations, and eye anglechangesto developthe task time (fig. 4).
The data for reach times,switch actuation, and eye turn times in the GA-SPIFRstudy werethe same as those used for the originalTLA terminalcontrol vehicledata file as presentedin the NASAcontractor report CR-144942(ref. 3).
The final product of data developmentwasa detailedtask scenarioand data file uniqueto the GA-SPIFRstudies beingperformedby the Stabilityand Control Branchat NASA/LRC.
4.1.4 VALIDATION RESULTS
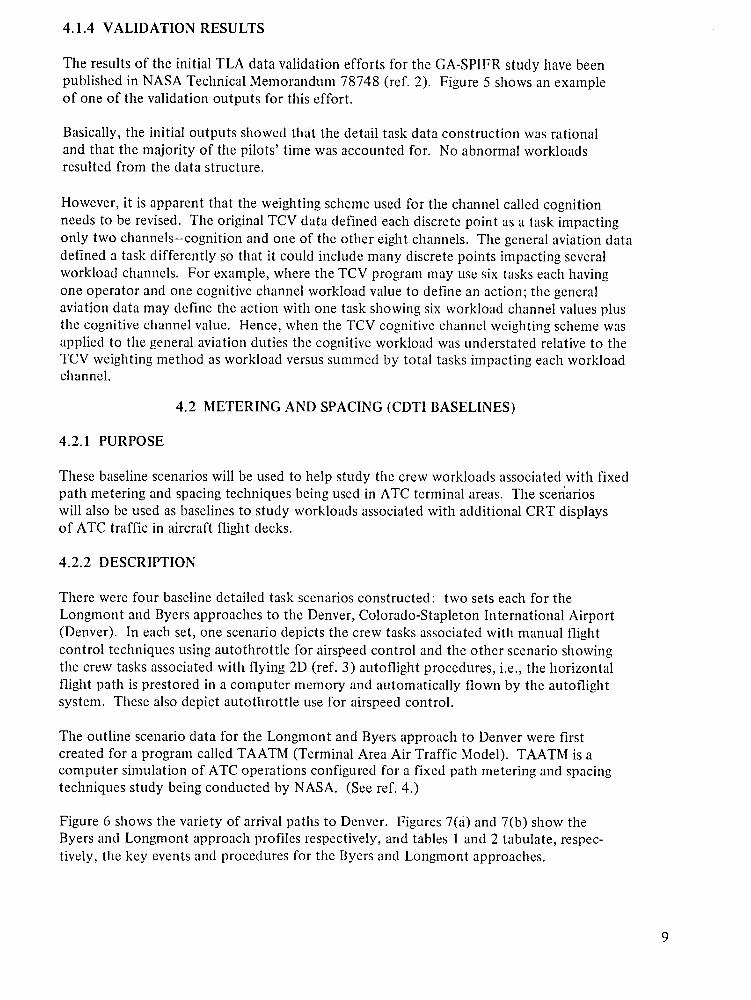
The results of tile initial TLA data validation efforts for the GA-SPIFR study have beenpublished in NASA Technical Memorandum 78748 (ref. 2). Figure 5 shows an exampleof one of the validation outputs for this effort.
Basically, the initial outputs showed that the detail task data construction was rationaland that the majority of the pilots' time was accounted for. No abnormal workloadsresulted from the data structure.
However, it is apparent that the weighting scheme used for the channel called cognitionneeds to be revised. The original TCV data defined each discrete point as a task impactingonly two channels-cognition and one of the other eight channels. The general aviation datadefined a task differently so that it could include many discrete points impacting severalworkload channels. For example, where the TCV program may use six tasks each havingone operator and one cognitive channel workload value to define an action; the general
aviation data may define the action with one task showing six workload channel values plusthe cognitive channel value. Hence, when the TCV cognitive channel weighting scheme wasapplied to the general aviation duties the cognitive workload was understated relative to theTCV weighting method as workload versus summed by total tasks impacting each workloadchannel.
4.2 METERING AND SPACING (CDTI BASELINES)
4.2.1 PURPOSE
These baseline scenarios will be used to help study the crew workloads associated with fixedpath metering and spacing techniques being used in ATC terminal areas. The sceriarios
will also be used as baselines to study workloads associated with additional CRT displaysof ATC traffic in aircraft flight decks.
4.2.2 DESCRIPTION
There were four baseline detailed task scenarios constructed: two sets each for the
Longmont and Byers approaches to the Denver, Colorado-Stapleton International Airport(Denver). In each set, one scenario depicts the crew tasks associated with manual flightcontrol techniques using autothrottle for airspeed control and the other scenario showingthe crew tasks associated with flying 2D (ref. 3) autoflight procedures, i.e., the horizontal
flight path is prestored in a computer memory and automatically flown by the autoflightsystem. These also depict autothrottle use for airspeed control.
The outline scenario data for the Longmont and Byers approach to Denver were firstcreated for a program called TAATM (Terminal Area Air Traffic Model). TAATM is acomputer simulation of ATC operations configured for a fixed path metering and spacingtechniques study being conducted by NASA. (See ref. 4.)
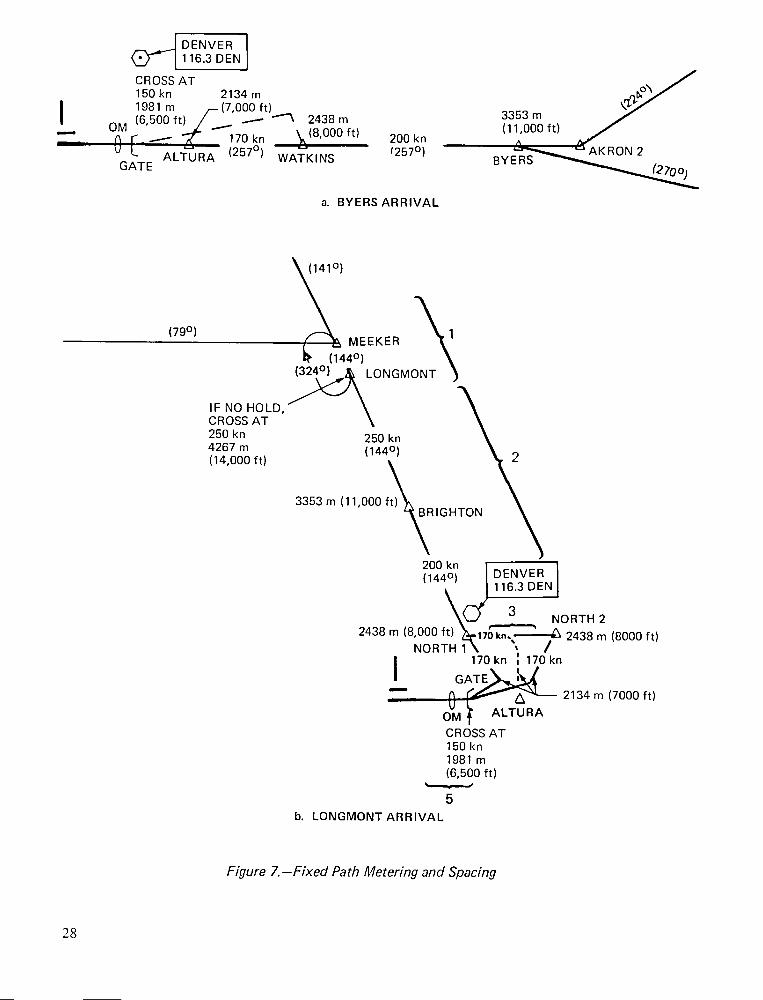
Figure 6 shows the variety of arrival paths to Denver. Figures 7(_i) and 7(b) show theByers and Longmont approach profiles respectively, and tables 1 and 2 tabulate, respec-tively, the key events and procedures for the Byers and Longmont approaches.
9

4.2.2.1 Byers Approach
The Byers approach is basically a straight-in approach to Denver. Figure 6 shows a dottedcourse line deviation from the Watkins intersection. This represents the course deviationthat might be needed for metering and spacing purposes. The tabulations of table 1 at times480 and 524 seconds indicate the course and speed adjustments necessary to obtain thecorrect spacing for tile Byers approach.
Based on the scenario event data, two baseline scenarios were generated: The first wasmanual flight control using autothrottle, and, the second was a 2D autoflight control profileusing autothrottle. The use of autothrottle control in the scenario construction reflectscurrent thinking about future flight control methods. It is assumed that autothrottle willbe generally available and used as it will reduce workload.
The Byers approach path is depicted in four phases as described below. In the followingdescription, the computer recognized phase name is given for the manual control (MC) and2D control flight techniques, i.e., phase name (MC) and phase name (2D).
Figure 7(b) shows a plan view of the approach profile and table 2 describes the eventhappenings during the approach.
The Longmont approach, like the Byers, provides for course deviations that may be neededfor metering and spacing techniques. The course deviation area occurs between NORTH 1
and the approach gate shown on figure 7(b). Also, like Byers, there are two baseline
scenarios for this approach profile depicting manual and autoflight control techniques.
The Longmont approach consists of six phases which are described below; again thecomputer name for the MC and 2D flight techniques will be provided in the description.
Phase Type Description
Descent With Speed Reduction This phase describes the descent, leveling off,and speed reduction activity required prior toentering a holding pattern at the Longmontintersection. The phase names are LMNT (MC)and LMT2 (2D).
Holding Pattern This phase details the activities required to enterand fly one loop of a holding pattern. Thephase names are HPTN (MC) and HPT2 (2D).
Descent With Speed Reduction The activities in this phase are basically the sameas those of the first phase. The differences are
in communications and the length of the phase.The phase names are BRTN (MC) and BTN2(2D).
10

Phase Type Description
Descent This phase shows the descent activity requiredto cross the North 1 intersection at the trafficpattern altitude. The phase names are NRTH(MC) and NRT2 (2D).
Descent With Airspeed Reduction This is the beginning phase showing crewactivities associated with leveling off from adescent profile, reducing speed, and returningto descent profile to cross Byers at 3353m(11,000 ft). The computer names are BYRZ(MC) and BYR2 (2D).
En Route Descent This phase shows a continuation of descent tothe WATKINS intersection. The computernames are WTIKN (MC) or WTK2 (2D).
Metering and Spacing Maneuvers This phase shows the activities required for acourse deviation to achieve proper metering andspacing. It also includes speed reductionactivities. The computer names are GATE (MC)and GTE2 (2D).
Final Approach This phase shows the activities involved withflying the final approach course from the outermarker to touchdown. The computer namesare BFNL (MC) and BFN2 (2D).
4.2.2.2 Longmont Approach
The Longmont approach represents a more classical traffic pattern including:
1. Holding pattern
2. En route descent profile
3. Downwind leg
4. Base leg
5. Final approach path
11

Phase Type Description
Metering and Spacing Deviations This phase shows the activities required toachieve proper metering and spacing into thetraffic flow. Figure 5 shows three possibleroutes within the area between the North 1intersection and the approach gate. Currentlyonly the route indicated with the dashed line isdescribed. The phase names are MTRS (MC)and MTR2 (2D).
Final Approach This phase details the final approach pathactivities from the outer marker through touch-down. The phase names are LFNL (MC) andLFN2 (2D).
4.2.3 DATA DEVELOPMENT
The data for the Denver studies was developed from the existing TCV data file. The fourstudy scenarios required 20 new phase descriptions, 93 new procedures, and a large numberof tasks. Table 3 shows examples of the newly created phases and procedures as derived
from the workload analysis worksheet shown in figure 3. (New tasks are not shown as theywere spread throughout the data file and are not easily identifiable.)
Due to the extensive number of changes and the nature of the studies, a separate data file
was created for the M/S studies. This was accomplished by removing the phase specifica-tions from the TCV data file and replacing them with phase descriptions for the M/S studies.Also, the new procedures and tasks for these studies were entered into this data file. The
complete data file is presented in volume 2 of this report.
The primary reason for separating the M/S data file from the original data file was to assuresegregated use of the common task data in the two files. Separating the data for the twoareas of studies will allow each study group to independently modify task data without
impacting the other study. This would not be possible if the two data files were integrated.
4.2.4 VALIDATION RESULTS
The initial TLA validation reports for these scenarios show that the task situations arerational and that pilots' time is well accounted for based on activity channels. The copilots',or first officers' task efforts need to be more completely defined. The outputs depict twomeasures of workload-the workload histogram and workload summary-and a chronologicallisting of tasks called the mission timeline. Examples of these reports are provided infigures 8, 9, and 10. Volume 2 shows both the data file and the graphic outputs for the M/Sscenarios and the workload efforts can be readily noted, i.e., volume 2 shows the TLAgraphic outputs for both the Byers and Longmont approaches resulting from initial scenariovalidation efforts for both crewmembers and for both approach types.
12
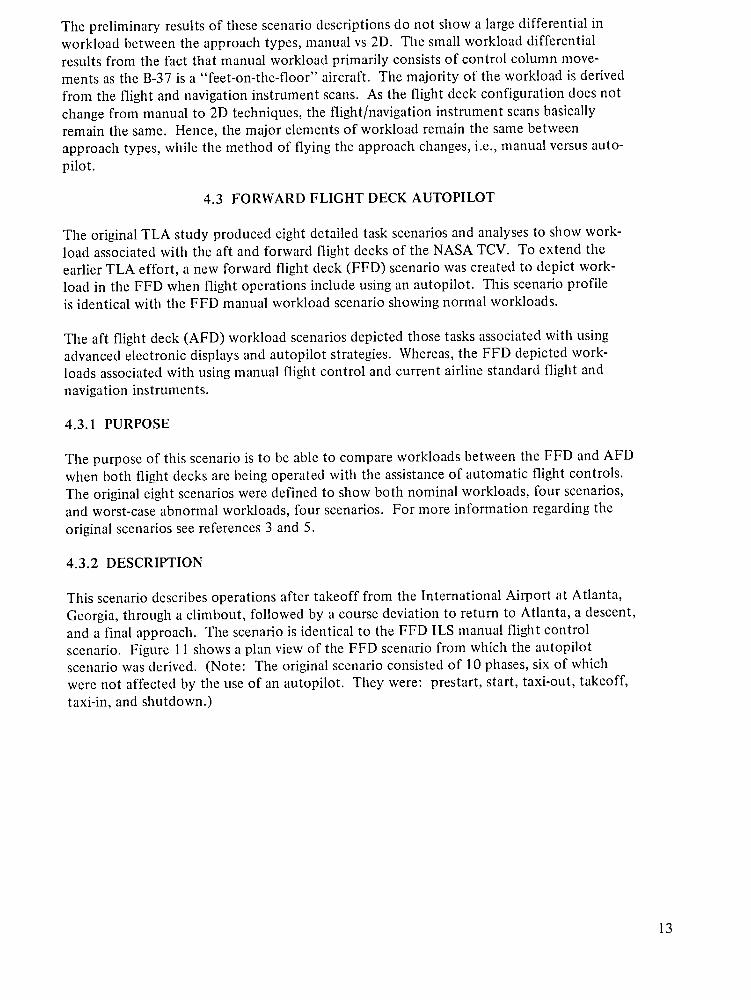
The preliminary results of these scenario descriptions do not show a large differential inworkload between the approach types, manual vs 2D. The small workload differentialresults from the fact that manual workload primarily consists of control column move-ments as the B-37 is a "feet-on-the-floor" aircraft. The majority of the workload is derived
from the flight and navigation instrument scans. As the flight deck configuration does not
change from manual to 2D techniques, the flight/navigation instrument scans basicallyremain the same. Hence, the major elements of workload remain the same between
approach types, while the method of flying the approach changes, i.e., manual versus auto-pilot.
4.3 FORWARD FLIGHT DECK AUTOPILOT
The original TLA study produced eight detailed task scenarios and analyses to show work-load associated with the aft and forward flight decks of the NASA TCV. To extend theearlier TLA effort, a new forward flight deck (FFD) scenario was created to depict work-load in the FFD when flight operations include using an autopilot. This scenario profileis identical with the FFD manual workload scenario showing normal workloads.
The aft flight deck (AFD) workload scenarios depicted those tasks associated with usingadvanced electronic displays and autopilot strategies. Whereas, the FFD depicted work-loads associated with using manual flight control and current airline standard flight and
navigation instruments.
4.3.1 PURPOSE
The purpose of this scenario is to be able to compare workloads between the FFD and AFDwhen both flight decks are being operated with the assistance of automatic flight controls.
The original eight scenarios were defined to show both nominal workloads, four scenarios,and worst-case abnormal workloads, four scenarios. For more information regarding the
original scenarios see references 3 and 5.
4.3.2 DESCRIPTION
This scenario describes operations after takeoff from the International Airport at Atlanta,
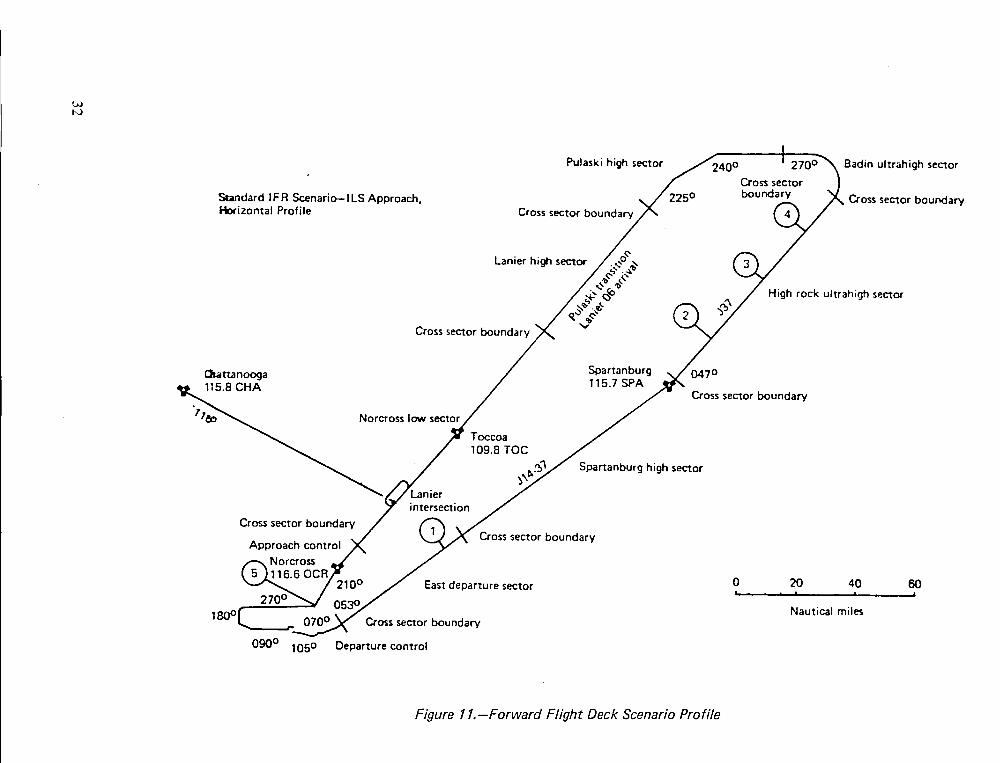
Georgia, through a climbout, followed by a course deviation to return to Atlanta, a descent,and a final approach. The scenario is identical to the FFD ILS manual flight controlscenario. Figure 11 shows a plan view of the FFD scenario from which the autopilotscenario was derived. (Note: The original scenario consisted of 10 phases, six of whichwere not affected by the use of an autopilot. They were: prestart, start, taxi-out, takeoff,
taxi-in, and shutdown.)
13

4.3.3 DATA DEVELOPMENT
Tile data required for this detailed task scenario effort was developed from and incorporatedinto the TCV Atlanta data file. This effort basically consisted of creating four new phasesusing detailed task data from the existing climb, cruise, descent, and approach and landphases of the forward flight deck manual control scenario. The goal was accomplished byremoving the manual flight control procedures from the flight phases of the ILS manualflight control scenario. These edited phases were then renamed and inserted into the datafile. The complete TCV data file is presented in volume 3.
4.3.4 VALIDATION RESULTS
The initial TLA output reports demonstrated operability of the new scenario and verifiedthat no data errors occurred. Volume 3 shows the complete TLA report validations for thisscenario effort along with the TCV data file. The reports shown in volume 3 are like thoseshown in figures 8, 9, and 10.
14
5.0 CONCLUSIONS AND RECOMMENDATIONS
5.1 CONCLUSIONS
Six new scenarios have been created and validated for three areas of research at the NASA/Langley Research facility. These scenarios by study area are:
1. General Aviation
One baseline scenario depicting the detailed task effort required of a single pilot
operating under instrument flight conditions in a high-density traffic area.
2. Metering and Spacing/CDTI Studies
Four baselinescenarioshavebeen created for use in the M/Sstudies. Plansare thatthey willprovidea baselineworkload for future studies regardinga CDTI.
3. Terminal Control Vehicle
A baseline scenario for the forward flight deck to provide a comparison of workloadefforts for autopilot usage in both the AFD forward and aft flight deck and FFD.
The six detailed task scenarios created during the last phase of the contract have beenentered into data files and validated by the TLA program. Initial validation efforts showthat the detail task construction for the pilots appear to be rational in that they reflect thedemands placed on the pilots. Also, these efforts do not show any instances of abnormally(over 100 percent) high workloads.
All of the new scenario construction data plus the original Atlanta TCV data needs to bevalidated, i.e., the accuracy of scenario construction techniques needs to be confirmed,refined, and modified, if necessary, to more accurately reflect actual or real world workloaddata based on real world operations or simulations. Currently, all TLA scenarios reflectworkload values based on published checklists and operating procedures and, as such, theyare reasonably complete. Nonpublished company communications have not been fullyaccounted for in the scenarios.
5.2 RECOMMENDATIONS
The TLA program utilizes a general data file consisting of four main segments-phases,procedures, tasks, and subsystems-in which detailed task scenarios are defined by phasenames consisting of detailed procedure names. These procedures are in turn defined bydetail tasks and their performance requirements. This partitioning of data allows forprocedures and tasks to be used in several different situations.
15
However, when creating new data or modifying data, the partitioning causes problems.As it is currently configured, the TLA program at NASA requires large amounts of tediousdata file reading to develop new or modify existing scenarios. This was especially true offive of the six recently created scenarios. The analyst is forced to search many tasks to findone that meets his needs. If the task does not exist, the analyst must then create the task.
The NASA TLA program needs to be refined to reduce scenario construction efforts andincrease program utility and analyst productivity. Currently, the capability exists to stream-line the TLA program and reduce scenario construction times. This can be accomplished bya front-end program that develops the task times and allocates the channel workloadpercentages based on the analysts specifications. This front-end program utilizes thegeometric data for switch, control, and indicator locations to derive the nominal behavorialtimes required to perform any given task. The program calculates the reach distances,control/switch actuation times, and eye-angle change necessary to complete the task.Using this capability, the analyst need only submit the order in which tasks are to beperformed. The front-end then develops the data that the analyst would have previouslydeveloped manually. This results in time savingsand enhances the ability to look at manyvariations of a concept.
This capability could be further extended by developing the capability of TLA to performinteractively. This would allow the analyst the ability to develop a baseline detailed taskscenario, then modify it at a computer terminal, and see the results immediately.
16
REFERENCES
1. Hereley, N. E., Assigned Subiect Numbers for 73 7 Maintenance Manual, Boeingdocument D6-40899, April 1973.
2. Hinton, D. A. and Shaughnessy, J. D., Adaptation of Timeline Analysis Program toSingle Pilot hzstrument Flight Research, NASA TM-78748, August 1978.
3. Miller, K. H., Timeline Analysis Program (TLA-1) Final Report, NASA CR-144942,April 1976.
4. Britt, C. L., Credeur, L., et al, "Research in Ground-Based Near Terminal Area 4DGuidance and Control," l Oth Congress of The bzternational Council of theAeronautical Sciences, October 1976.
5. Dean, R. D., Farrell, R. J., and Hitt, J. D., "Effect of Vibration on the Operation ofDecimal Input Devices." Human Factors, vol. 1 no. 3, June 1969.
6. An Index of Electronic Equipment Operability, Data Store, AIR-C43-1/62 RP(1),American Institute for Research, January 1962.
17


Table l.-Byers Approach Scenario Key Event Data
Position AltitudeTime North East(Sec) (nmi) (nmi) meters (feet) Event
Start(0) -5.74 55.04 4535 (14,879) Start of Flight Message-"United 24, contact DenverApproach on 128.95"
DenverControl ResponseMessage--"United 24, proceed to Byers, descent andmaintain 13,000"
82 -3.35 47.50 3953 (12,969) End of descent
104 -2.75 45.09 3953 (12,969) Message-"United 24, descent and maintain 12,000"
112 -2.56 44.29 3953 (12.969) Message-"United 24, descent and maintain 11,000"
124 -2.29 43.07 3856 (12,650) Message-"United 24, reduce speedto 250 knots"
214 -0.62 35.29 3791 (12,437) Complete speedreduction resumesdescent
224 -0.53 34.40 3726 (12,224) Message-"United 24, reduce speedto 200 knots"
227 -0.53 34.40 3726 (12,224) CrossByers Fix
278 -0.44 31.07 3661 (12,011) End of deceleration, resumesdescent to 8,000
434 -0.75 21.55 2429 (7,968) End of descent
452 -0.73 20.37 2429 (7,968) Message-"United 24, contact Denver Local Control at 118.3"
480 -0.72 18.71 2429 (7,968) Message-"United 24, turn right to heading 350 degreesthen reduce to normalApproach Speed" (Approach Speeddepends on load factor 150 kts)
524 0.55 16.95 2368 (7,770) Message-"United 24, fly direct to Approach Gate, contact power at OuterMarker on 120.0
862 -0.72 4.17 1981 (6,500) CrossOuter Marker
976 -0.72 0.33 1627 (5,339) Cross Runway Threshold

Table 2.-Longmont Approach Scenario Key Event Data
Position AltitudeTime North East(Sec) (nmi) (nmi) meters (feet) Event
Start(0) 28.08 -34.39 5372 (17,624) Start of Flight Message-"United 76, Contact Denver Approach Control on128.05"
Denver Control ResponseMessage-"United 76, proceedto Longmont, descentand maintain 16,000"
5 28.05 -33.46 5177 (16,984) Message-"United 76, descent and maintain 15,000"
13 28.03 -32.54 4981 (16,344) Message-"United 76, hold at Longmont expect further clearanceat 16:40"(0 second= 13:49:23 time of day)
45 28.02 -28.91 4641 (16,120) End of descent
141 27.77 -18.10 4608 (15,119) Message-"United 76, descent and maintain 14,000"
190 27.61 -12.74 4313 (14,149) End of descent
229 27.47 - 8.33 4313 (14,149) Message-"United 76, reduce speedto 250 knots"
265 26.29 - 4.75 4313 (14,149) Message-"United 76, hold at Longmont, expect further clearanceat 16:40:42"(time of day)
286 24.84 - 3.50 4313 (14,149) CrossLongmont inbound for holding
459 25.19 - 3.63 4313 (14,149) Depart holding from Longmont
461 24.88 - 3.45 4313 (14,149) Message-"United 76, increasespeedto 220 knots, descent and maintain11,000"
589 15.44 0.52 3479 (11,414) Message-"United 76, reduce speedto 170 knots"
646 11.89 1.95 3413 (11,197) End of deceleration, resumesdescent to 8,000
715 8.21 3.40 2852 (9,358) Message-"United 76, contact Denver Local Control on 118.3"
760 5.92 4.36 2490 ( 8,461) End of descent
Makes RNAV or Map turn toward North 2
837 4.24 7.97 2475 (8,119) Message-"United 76, fly direct to Altura"
909 1.83 9.88 2170 (7,119) Message-"United 76, fly direct to Approach Gate"
993 -0.31 6.71 1981 (6,500) Message-"United 76, reduce to normal approach speed,contact tower on 120.0at Outer Marker" (Approach Speeddepends on load factor 150 kts.)
1053 -0.72 4.12 1981 (6,500) CrossOuter Marker
1161 -0.71 0.39 1629 (5,345) CrossRunway Threshold

Table 3.-Examples of New Metering and Spacing Data File
..... _R0_ ; GATE THOU T_30$ 10 t60053 10 I_001_ 10 JCLm 10TOUCHOOWN I$C1DS Z5 1600_q 30 {$_10_ "35 1600_7 40o_
160018 40 4T_LN6 40 1600_ 50I 150018 100 I_CqOS 115 A_LN6 140 16006_ _20
) I 4TOLN9 Z40 _SCIOS 24_ TS_IO_ Z55__L_TZ L_N_MOHT 4PP_OkCH_.TO .LMNT01 O0 DO T_P_O_ DO 1400Z3 00
t_40_NG WITH HOLDING ISC20S 10 LMNTOZ 74 30 _P2OS 50
3 P_TERH 030007 30 L_NTO3 35 {SC_0S 40
__IL_''--_ • ALTCPT 40 LRNTS0 4_• r' _ .....
" 7sp6os _o 0_0007 t00-1SC30S 110D PHASE Tsczos i_o I_o
____'_L':nESCRIPTIC_L_____sp3osz_o_03ooo_ zoo _sc_o_ _to ...........tMNT04 2?0
PRO^ED._ H&":_ _.--_[;T?_w ?_Y_J"'=''_?3_ T_P_O_ _30 300,_,_,- _ .......... r-( _PZ0_ 300--_LT_PT _'5_0 1S_10¶ 310 3ZO ....
3 PHASE -" t_NrO_ 3_0 /4_BSPD 350.tS_ZOS_0 _20 _P05_ 4?0
435 15P10S_ _35HPTZ HOLDING PeTTE_K Pq_ LMNTSI O0 H_pT_ 00 03000? 10 _SC605 15
MEEKER 4N_ LONGEST T_C05S Z55 / 'BTNZ &I_RNFT 0EP&_TS qL0 LMNT_2 0Oja_'MNT07 00 &¢D_O 00 TS_15¶ 0_
-- " DESCENDTNG TO It000- 030007-- _TSC30S--15"LMNTSR- -ZO-ALTZCH' -ZO
T_ooOS ._'30 030007 45 T$_20_ 50 [SC_0_ 110ISPIo_/__ZO0 ....
mNRTZ ATRCRAFTOESCENSS----LMNT_,JI#_'00-LMNTS_-------00---_LT_=T mDZ'-TSC155" --0_TO 8000 ANDSLOWS 4F_I_.T 0_ 4F0_po 05 T¶PO_S 07 _P_0_ 1ETO 170 KTS __€_011 I? TSClS_ T7
............ /f_oo __----l_- _oo__ _...... -_z-_s_zos -_z/ _s_os 5_ '
_" ALT_CH 5_ LMNT54 57 I_00_5 lOZ tfi0018 102...... i --10Z TSPq0_----_?O_O0O? 1171SC30S--117
/f TSC_0S 14'T_MNTOq 357 T_3OS 202_NLTCPT 232 TSP_OS 232"T_0S ?32
-_MyR-2--NORfH"i-METj_t_[-_D--LMNT55--O3"TK&CHG--_O O30007" -0O-TSC_0S--05SPACING A_& 10 TSPbO$ tO LqNT_O _05 030007 _05
/ TK&CNG 113 TS_hOS 1!,0 1_0 tSP60_ 1_0---- /" O_0007--Z10 TS_50S--_IS---- 2?O'IS_tOS--_ZO
/ L_NT_]. 225 T_A_HG _30 ILT2CH _40/ _ _Z_O TSP60S 250 1400Z3 Z55 030007 315
-- / 1._C30S -310 4LT_PT--3S0-O30007--350 ......k_N2 ;€_,_L_PTq LkNOTNGL_NT1Z 00 LMNTS_ 30 LND&RM " 00 030007 O_
_T I_PO_S__O_ 1_0060 _.O? T_IO_ 07.... ,_ ....... O? ]S_30S --'07 1_0053--17 16001_-- 1? ........................
) /J LN_L_ Z? tSPl0S 37 TS_IO_ 47| .... LMNTS? _.47 LNDCLR 4? 47 TSPlO_ 47
-7"---_ ......... t._oo_q--57 160057 --57 160o1_ --57-4TOLN5--- 57") / _ I SCqO_ I0_ AT_LN3 157 1_0065 25Z ITnLND Z27
l • TSCl_S 237
/--EV_NT/e_OCEDU_E .................................
i | _UDE _.NkNGE PR_C 2N 33 O 10 Pl _N 3_ 1.40 IO Pl"
___PDOC ZH 47 __.O IO_l_i _ 48 ]*_0 10 Pl
%'__CNNNG_--PROC 2_ _3 --0 --l_]----_ u .... l] -_ lq.---*lrrO"ZOFLIGHTP{TH _K 03 0 _C_ - o_ -o c'I>-'_,TASKNN'IE/STARTTIHE/A;IDCRE',,It.gEI.IBEREXECUTI;IGTASK
_q 30 2,5 Pl ?_ "-'_6----3.48 -- Pl ....................
2K 32 4.5 2H _I 5.o1 Pl2q 22 5,o3 _I _i Ol 6,_1 _1

Bear Creek >>;_880 %0
Figure 1.-Genera/Aviation Scenario Profile
22
Instrument panel
\
Z ___ Center of pilot's attitudeindicator
t
_ X
(Towards pilot) (Towards front of aircraft)
-_ Instrument panel
Z
X = 0 at instrument panel
Figure 2.-Coordinate System in General Aviation Simulator
23

TLA I'/ORKLOADANALYSIS'WORKSHEET PAGE OF... lO,_,,,L,_ COMFI_UTIOIM ,,,
PHASE/EVENT/PROCEDURE DATA PROCEDURE/TASK DATA
CODE NO. I NAME/DESCRIPTION CODE NO. NAME/DESCRIPTION c,,__ ...."J ST,UTriM( _u._,,C,7 _.k;,_lJ_,I_I_.{_({, +
_00001 (--_'PTI_CTDEP/IRTUI_E IP o/ P/oK UP .,_Vh,_/qOpHo,,.jE P ! _2.o! I 0.0AFTER TAKEOFF IP 07 ,_xE _,qb,o r_,_,,,s,-,.,o.,., P q4.ol 2.0
IT 3_ ,_o,JtTo,e t_,_b_o T_,/V,vS x.£to,v P 2 7.o 6.o
IP IO ,,_,qtKE l_/gb/o -rRA/v_r,,1/s*s/o_,, F "_ _.0 -3.0
_ ... ___.____.___ IP o4 RETurn' ,_Jc_op_/Ü_- P I 2, o ll_7.o=
COOOt'2 I_ECEIvE TRRFFI¢ ,4bvt$oRy IT 2.,_ I_o_IToR l_RblO T/_RNS/_41SS/ON P ) _ O I0.0
I P Ol pick UP _n/c_op_o_f P I _.c 6,o
IP 07 /V_RKE R,qblO T/qR_vS,,_._.rto_/ P 2 _. O IS'.O_ O/ 5CA/'J O_T3FD£ AIRdR/tFT _ I /._ 1_.0
-- r' IP o_ #_E T_R_., ,_tcRoP_l_[ P I 2.o 11.0
IP Ol Plot: U,_ _n_cRot)H_£ P I _.o ._.oI P 0"7 /_RKE l_ll_lo 7"/_/t)v_r,*n/E£/o_v P _4. ¢ _. oIP o_ tRETu/RA/ _._/cl?oPHo_£ P 1 3.¢ IO._
_'tX IP Io ,_R_E _,qD)o r/?,_,,u_',,._/rSm_., ,b 12 5-.c 2._
If > I_ HOL-b ,',.4_cRoP_o,_ P i_ _.¢ 7.0
IT _ 2 /vl O,_ l TOt_ RI# 51O TRI_Iv__IvII.__('IOI_ _ I ].0 7,0
I P 0,_ IRE TuR/,J /_/c_o FHo_- p ) ,_.oi q. 0
_oo0o5 i_EdE_uE I_E_u_'S7- TO I T 22 A,IO/V /TO,_ Iql2_lO T RRI_E,,_IS_£1o,,J p I 2.0 0. o
FRY f)LTITu'bE IP OI hICK Op ,_Ol>HoA_Z p i 2. 0 2._ I
I_b /_ HO_ D /Z'llCi_'_PHo/w_ _ I 1.0 .4.0
I_ o-.I ,'__I_K E R A B /o T IR/O/v.r/_/SSlO/_J F_ .2 _ . _ E,.o
IP O_ RE Tv'_,'/w ,,vllcRoPH_,,,,I£ P I ,_.o ;-7.._"
i
Figure 3.- Workload Analysis Worksheet
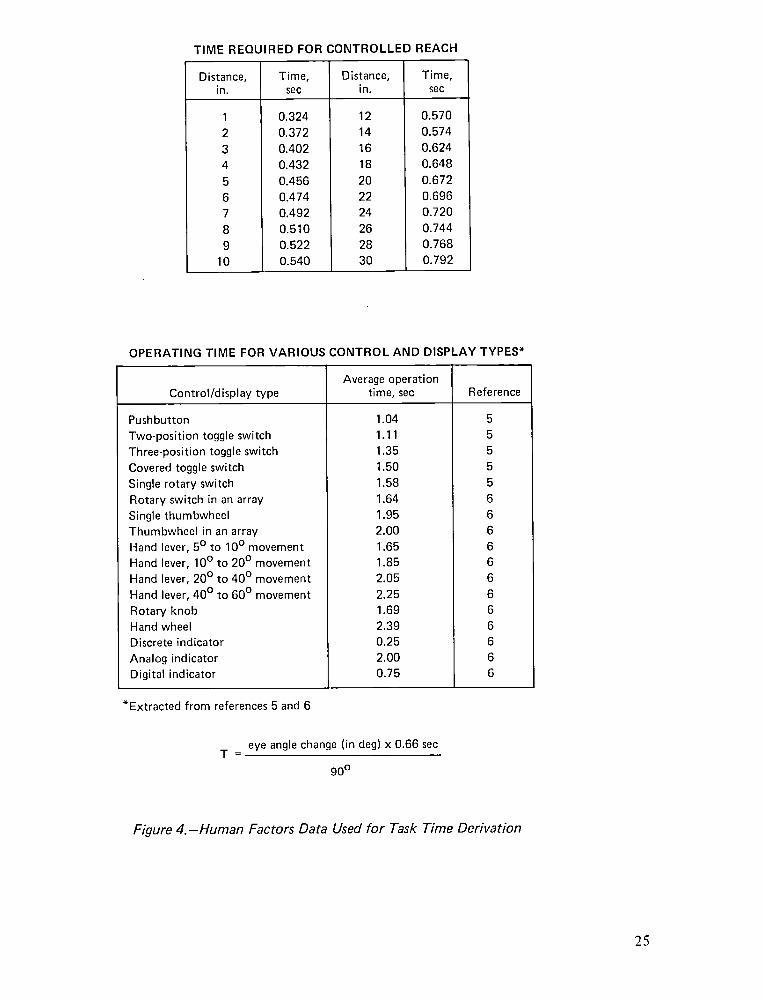
TIME REQUIRED FOR CONTROLLED REACH
Distance, Time, Distance, Time,in. sec in. sec
1 0.324 12 0.5702 0.372 14 0.5743 0.402 16 0.6244 0.432 18 0.6485 0.456 20 0.6726 0.474 22 0.6967 0.492 24 0.7208 0.510 26 0.7449 0.522 28 0.768
10 0.540 30 0.792
OPERATING TIME FOR VARIOUS ;ONTROL AND DISPLAY TYPES*
AverageoperationControl/display type time, sec Reference
Pushbutton 1.04 5Two-position toggle switch 1.11 5Three-position toggle switch 1.35 5Coveredtoggle switch 1.50 5Single rotary switch 1.58 5Rotary switch in an array 1.64 6Single thumbwheel 1.95 6Thumbwheel in an array 2.00 6Hand lever, 5° to 10° movement 1.65 6Hand lever, 10° to 20° movement 1.85 6Hand lever, 20° to 40° movement 2.05 6Hand lever,40° to 60° movement 2.25 6Rotary knob 1.69 6Hand wheel 2.39 6Discrete indicator 0.25 6Analog indicator 2.00 6Digital indicator 0.75 6
*Extracted from references5 and 6
eye angle change (in deg) x 0.66 secT-
9O°
Figure 4.-Human Factors Data Used for Task Time Derivation
25

_._ .................... M] S,S113N CONFl 6LIRRT[ ON
¢_ RPR[L 197EI CRENMEMB[-R- PJLO.I" I ,,.,,,.__. FII'L TLR 8CFNFIP,]O GR -5PIFR "_C:H_R.N..N..E'!:_T._!..N.TEIR.I_Rt:_V.!._[ _IN........... J [L8 RNY O
120
r-1o:c_ I:QO PERK NORKLORDLIMIT
"_ BOZ -
" 60u.lQ.
9O
2O
0 I I L. .L ........... !................ J_............. [ [ j_0 2_.0 YBO 720 960 ] 200 1,'-.t_0 1680 ] 920 21.60 2_00
T[ME iSECONDS j
I_J
F,-
l--
J
...................................................
Figure 5.-Internal Vision Workload Histogram Report

_R EEKER
ONGMONT v_
IGHT / _ \_
\I \ ' /i _ DEN_"_'VE--R
16.3 DENI NORTH 2 \
NORTH 1 \/I \
I OM \
ALTURA WATKINS B
'\ GATE
BROOMFIE,O_SOUTH /, SOUTH 2 /
_,' , //" ! <""CONFER F"''".,,.,....I "_ \
FRANKTON
KIOWA ]117.5 10q
ELIZABETH V
_J
-4 Figure 6.-Denver Runway 26 Arrival Routes
_ DENVER116.3 DEN
CROSSAT k,,_o__150 kn 2134 m
I 1981m z- (7'000._ft)'_'_ 2438m
(6,500 ft) ./_ 3353 m jm OM _ .._- 170" \(8000ft) (11,000ft)0 I= _ Kn _ ' 200 kn/ _ o 1257°) _ "-'AKRON 2
- ALTURA (257) WATKINS DYERS _"""__0o)GATE
a. DYERS ARRIVAL
)(790) ( _ MEEKER "_1
I_ (144o) _,
IF NO HOLD, (324:)_J_ LO ONT )._j<._/ NGMCROSSAT k250 kn 250 kn4267m (144° ) \ ,_
(14,000 ft) ft]__ R _ZTON _)
3353 m (11,000IGH
200 kn t I(144° ) I DENVER l
_J116"3DENl\___/ 3 NORTH 2
2438 (8,OOOft) _'170kn-_"_ a 2438 m (8000 ft)m
NORTH 1\ ' /
I 170kn _ 170knGATE_
--' OOMi_-_''_A''_L-- 2134 m (7000 ft)ALTURACROSSAT150 kn1981 rn(6,500 ft)
5b. LONGMONT ARRIVAL
Figure 7.-Fixed Path Metering and Spacing
28
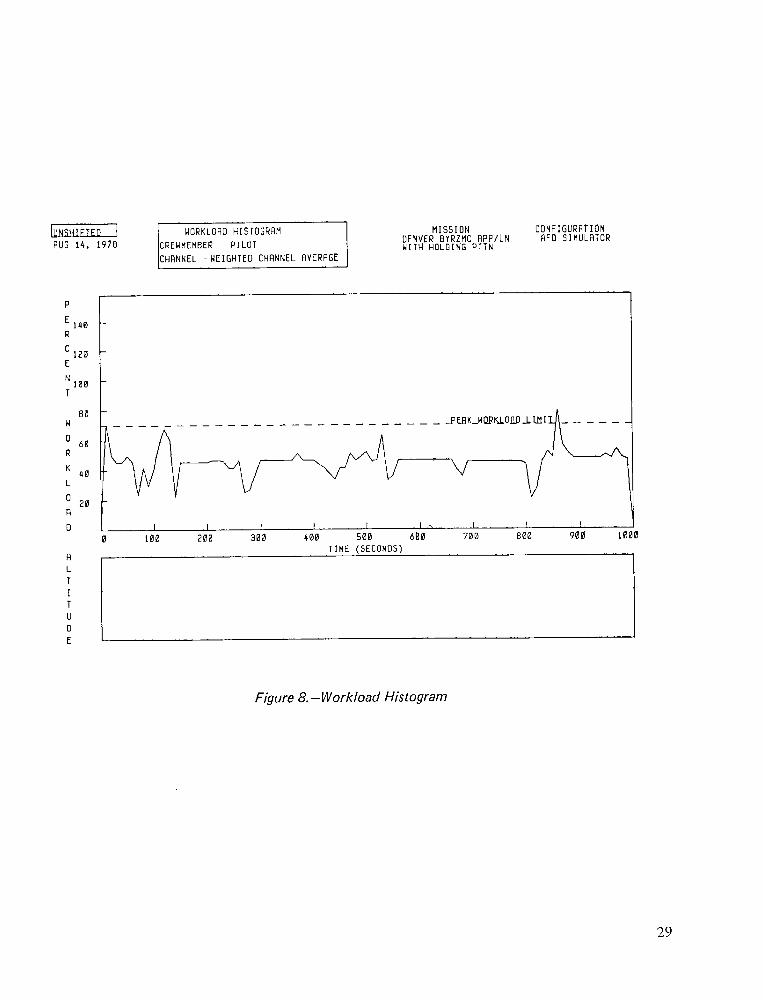
IUNS'HIFTED"I WORKLORDHISTOGRRM MISSION CONFIGURATIONRUG 14, 1978 CREWMEMBER PILOT DENVERwITNNOLDINGBYRZMCpTTNRPPILNAFD 51MULRTOR
CHRNNEL -WEIGHTED CHANNEL AVERAGE
Figure 8.-Workload Histogram
29

WORKLOAD SUMMARY I AUG [4, [97B
CREHMEMBER- PILOT ]PERCENT NORKLORDING DVERAGE F-"7.ISIGMA E_
TOTAL VISION lllllllIllil
TOTAL MOTOR " H-H-H
COGN[T[ON Itllll'i['i_J h].lllililIi]l}
TOTAL COHMUNICBT[DN IIIIIIIIIIIIII
WEIGHTED AVERnGE
• , I I I I I I . i i , h. ,
MISSION CONFIGURATION FLIGHT PHASEDENVER BYRZMC APPILN AFD 5IMULATOR FINAL APPROACH TOWITH HOLDING PTTN
FROM THE GATE TNRU
TOUCHDOWN
Figure 9.-Workload Summary
30

IUN'SHIFTEDI { MISSION TIMELINE BUG 14. 1978IMISSION-DENVER BYRZMC APP/LNI NITH HOLDING PTTNICONFIGURATION- RFD SIMULATOR|FLIGHTPHASE -BYERS APPROACH TOI LANDING FROM ENROUTEI CRUISE[CREWMEMBER- PILOT
.... EVENTIPROCEDURE OR _RSK OURCODE TASK DESCRIPTION (SEC_ TIME IN SECONDS ..,
BYRZQI START OF FLIGHTSCENARIO MESSAGE
MCA60S CONTROL AIRCRAFT - F(60 SEC P_OC)
15P605 FLIGHT INSTRUMENTSCAN - F
iPBYRZOI MON CDM- UNITED Z_, 5. ]CONTACT DENVER APRCHON 128.95
4A 65 MANUALLY CONTROL AIC 60. JAB 10 ACTUATE THROTTLES TD 60. I
ADJUST AIRSPEED2J 42 MON EADI 6B. i3L 02 MDN VERTICAL SPEED 60. l
INDIC3A 10 MONITOR AIR5PEED 60. .l
INDIC2K. 15 MDN EHSI DISPLAY 60. .lIPBYRZ03 MONCOM- UNITED Z4. 5. []
DENVER,PROCEEDTODYERS DESCEND ANDMAINTAIN 1300B
140023 REPORT 1000 FT TO VLEVEL OFF
IP 11 MDN VERBAL REPORT 1.7 0MCQOSS CONTROL AIRCRRFT - H V
FLI,5 SEC PROC)GHT INSTRUMENT1SP055SCAN - A
BA IQ MONITOR AIRSPEED S. DINDIC
2K 16 MDN EHSI DISPLAY 5. []4A 64 MANUALLY CONTROL A/C S. []4B 09 ACTUATE THROTTLES TO 5. []
ADJUST AIRSPEED2J 42 HONEADI 5. D
i I I . I , I I , . [ . [ I ,L , I I I
0. 50. 100. 150. 200. 250. 300.
Figure lO.-Mission Timeline
3]
GObo
Pulaski high sector Cross sit 270°_ Badinultrahigh sectoro
error--":_[_ndardIFR Scenario-lLS Approach. _ 225 o boundary _ Cross sector boundary
Horizontal Profile Cross sector boundaS _ "
/.,,%_.'"/_° / Highrock,.,,ra.ighsector
C_ttanooga / Spar_nburg ._ 047 °115.8 CHA / ] lb./ :_'A
• / J - Cross sector boundary
/ 109.8 TOC
"/ n::oon..;Cross sector boundary / /_ \ /
Approach contr _ "_ Cross sector boundary
Norcross! b Jl16.60C
4o 8o
L____' ___ ....180° o s sector boundary Nautical miles
090o 105° Departure control
Figure 11.-Forward Flight Deck Scenario Profile


1 Report No I 2. Government Accession No. 3 Reoplenl's Catalog NoNASA CR-3199 I
4. Title and Subtitle 5 Report Date
NASA TLA Workload Analysis Support March 1980Volume 1 - Detailed Task Scenarios for General 6 Perle...._Org.....,,enCodeAviation and Metering and Spacing Studies
l. Author(s) 8. Perform,rig Organuat,on Report No
James L. Sundstrom D6-32872
9. Performing Organization Name and Address 10 Work Un,t No
Boeing Commercial Airplane CompanyP.O.Box3707 11ContractorGraotNoSeattle, Washington 98124 NAS l- 13741
13 Type of Report and Per,od Cove,ed|2. Sponsoring Aqency Name and Address
Contractor ReportNationalAeronauticsand SpaceAdministrationWashington, D.C. 20546 ,4 Sp....... gAgencyCod_
15. Supplementary Notes
Langley Technical Monitor: Amos A. Spady, Jr.Topical Report
1G Abstract
This document reports on tile efforts and outlines the techniques required to produce andvalidate six detailed task timeline scenarios for crew workload studies in the areas of:
a) General aviation single pilot instrument flight rules operations in a high-density trafficarea
b) Fixed path metering and spacing operations
c) Comparative workload operation between the forward and aft-flight decks of theNASA Terminal Control Vehicle.
The validation efforts also provide a cursory examination of the resultant demand workloadbased on the operating procedures depicted in the detailed task scenarios.
7. Key Words (Suggested by Authorls) ) I 18. Distribution Statement
Task scenario, General aviation single pilot J Unclassified - Unlimited
timeline analysis, Crew workload, Meteringand spacing, TCV
Subject Category 53
19. Secur,ty Class,f. (of th,sreport) 20. SecurityClassif. lof thispage) 121. No. of Pages [ 22. Pr,ce"
Unclassified Unclassified I 36 I $4.50
"For saleby theNationalTechnicalInformationService,Springfield,Virginia 22161
NASA-Langley, 1980

National Aeronautics and THIRD-CLASS BULK RATE Postage and Fees Paid
Space Admin istration National Aeronautics andSpace Administration
Washington, D.C. NASA-45120546
Official Business _j
Penalty for Private Use, $300
3 1176 00520 2859
POSTMASTER: If Undeliverable (Section 158Postal Manual) Do Not Return