nanoparticle heterogeneity: an emerging structural
TRANSCRIPT

1
Nanoparticle heterogeneity: an emerging structural parameter 1
influencing particle fate in biological media? 2
3
4
Jean-Michel Rabanel a , ‡,*, Vahid Adibnia b ,*, Soudeh F. Tehrani b ,*, Steven Sanche b, 5
Patrice Hildgen b, Xavier Banquy b, ‡, Charles Ramassamy a, ‡ 6
a Centre INRS Institut Armand-Frappier, 7
531, boul. des Prairies, Laval, QC H7V 1B7 Canada 8
9 b Faculté de Pharmacie, Université de Montréal, 10
C.P. 6128, Succursale Centre-ville, Montréal, Québec, H3C 3J7, Canada 11
12 ‡ Corresponding authors: [email protected]; [email protected]; 13
* These authors contribute equally 15
Table of content 16
Abstract ............................................................................................................................... 3 17
Introduction ......................................................................................................................... 4 18
1. Particle suspension heterogeneity .......................................................................... 10 19
1.1. Effect of particle size on NP chemical composition .......................................... 10 20
1.2. Effect of particle size on drug loading ............................................................... 12 21
1.3. Surface charges heterogeneity in a particle suspension ..................................... 13 22
1.4. Nanoparticle corona heterogeneity in a suspension ........................................... 13 23
1.4.1. PEG particle surface coverage ........................................................................ 13 24
1.4.2. PEG surface heterogeneity and subpopulations ............................................. 14 25
1.5. Ligand surface distribution in suspension .......................................................... 16 26
2. Single particle heterogeneity.................................................................................. 18 27
2.1. Hydrophilic corona heterogeneity at the single particle level ............................ 18 28
2.2. Ligand distribution on a single particle .............................................................. 19 29
3. Engineered heterogeneity....................................................................................... 21 30

2
3.1. Chemically anisotropic nanoparticles and superstructures ................................ 21 1
3.2. Applications of the engineered heterogeneity .................................................... 26 2
4. Analytical methods to characterize heterogeneity: recent developments .............. 27 3
4.1. Detection of heterogeneity in particle suspension.............................................. 27 4
4.1.1. Fractionation of particle suspensions ............................................................. 27 5
4.1.2. Direct analysis of nanoparticle suspensions ................................................... 28 6
4.2. Detection and analysis of heterogeneity at the single particle level .................. 33 7
4.3. Data presentation and statistical considerations in heterogeneity assessment ... 41 8
5. Perspectives............................................................................................................ 43 9
5.1. Factors impacting suspension heterogeneity ...................................................... 43 10
5.2. Innate heterogeneity vs. acquired heterogeneity ................................................ 49 11
Conclusions and outlook ................................................................................................... 51 12
Acknowledgments............................................................................................................. 54 13
References ......................................................................................................................... 54 14
15
16
17
18
Graphical Abstract 19
20
21
22 23

3
Abstract 1
Drug nanocarriers surface chemistry is often presumed to be uniform. For instance, the 2
polymer surface-coverage-density and distribution of ligands on nanoparticles are 3
described with averaged values obtained from quantification techniques on a particle 4
population. However, these averaged values may conceal heterogeneities at different 5
levels, either because of the presence of particle sub-populations or because of surface 6
inhomogeneities, such as patchy surfaces on individual particles. 7
Characterization and quantification of chemical surface heterogeneities are tedious tasks, 8
which are rather limited by currently available instruments and research protocols. 9
However, existence of heterogeneities could contribute to some non-linear effects 10
observed during nanoformulation optimization process, could contribute to problems 11
related to nanocarrier production scale-up and could correlate with unexpected biological 12
outcomes. On the other hand, these heterogeneities, while usually unintended and 13
detrimental to nanocarrier performance, may, in some cases, be sought as adjustable 14
properties that provide NPs with unique functionality. 15
In this review, results and processes related to these issues are compiled, and perspectives 16
and possible analytical developments are discussed. 17
18
Key words: PEG, heterogeneity, nanoparticle, liposomes, ligand, ligand clustering, 19
patchy nanoparticle, phase separation 20
21
22

4
Introduction 1
The accumulation of drug nanocarriers at pathological sites such as tumors and brain 2
parenchyma, in spite of the “enhanced permeability and retention” (EPR) effect 1, 3
intensive optimization of formulation and the addition of targeting ligand, is deceptive. 4
Only a few percent of the injected dose is effectively accumulated at the targeted site 2-4, 5
while 90 to 99% is distributed in non-targeted organs, potentially contributing to adverse 6
effects. This issue is particularly critical for the delivery of active compounds to central 7
nervous system as the blood brain barrier acts as a formidable obstacle to nanoparticles 8
(NPs) entry. Different reasons have been suggested for the specifically low accumulation 9
and retention of nanoparticle formulations, which critically affects therapeutic efficacy. 10
Considering the complexity of the biological processes, our knowledge about the 11
interaction between different tissues and the surface of nanoparticles is still incomplete, 12
leading to an inaccurate predication of NPs fate in vivo. The limited diffusion of NPs in 13
tissues and across biological barriers has been also underestimated 3. Another set of 14
explanations can be regrouped around the concept of particle heterogeneity. For example, 15
key physicochemical properties such as size, shape, elastic modulus and surface 16
chemistry have been shown to have differential effects on protein opsonization and 17
particle distribution in healthy tissues and tumors, as well as on toxicity 5-8. More recent 18
studies have shown that size dispersity and surface chemistry heterogeneity can directly 19
modulate NP distribution in vivo 9, 10. These observations can be attributed to the extreme 20
sensitivity of biological systems “to sense” specific surface architecture of foreign nano-21
objects at the molecular level, with an unmatched resolution 11. 22

5
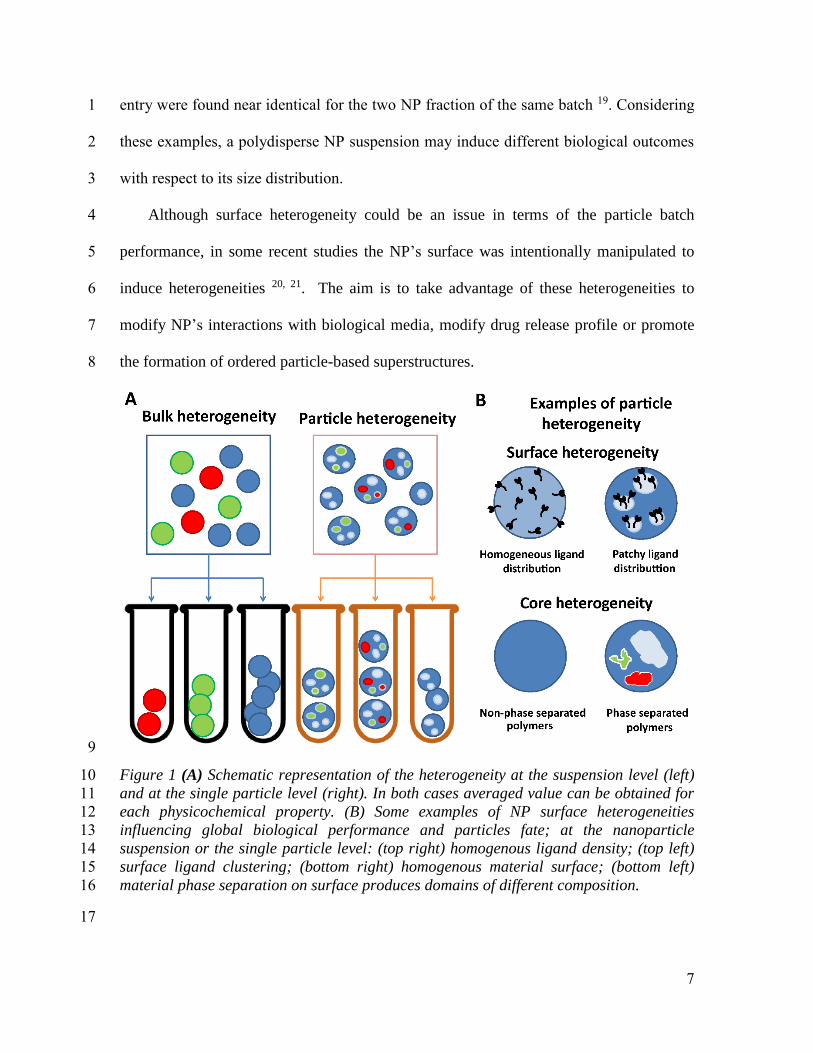
Particle heterogeneity can be classified according to two organization levels: at the 1
suspension level, i.e. subpopulation of particles within a same batch exhibiting different 2
properties and chemistry; or at the nanoparticle level, i.e. non-homogenous distribution of 3
physicochemical properties in the core or at the surface of a single particle (Figure 1). 4
With suspension heterogeneity, different nanocarrier populations within the same batch 5
behave differently in terms of the therapeutic efficacy. As a consequence, the effective 6
dose of nanocarrier having the optimal characteristics will be over- or under-estimated. 7
Additionally the effective dose of optimal nanocarrier will be also highly sensitive to 8
batch to batch variability. Additionally, the NP sub-populations which are not effective 9
may be detrimental, and could trigger toxicity or unwanted immune system reactions 10
from the host. The single particle heterogeneity has also the potential to alter the specific 11
interactions between the nanocarrier surface and proteins 12, or membrane 13, 14 in vivo, 12
causing unexpected therapeutic outcomes. 13
Every day, new and more complex nanocarriers are being tested in research labs and 14
clinical settings. The frequent use of responsive smart materials and bio-mimetic delivery 15
strategies contributes to the constantly increasing complexity of the newly developed 16
formulations. This also translates into complex synthesis, purification and formulation 17
steps, which tremendously complicates their characterization and compliance with 18
regulatory guidelines 15. However, little concern is raised about the challenges from 19
defects and heterogeneities of these complex nanostructures. Most fabrication processes 20
do not allow rigorous control over homogeneity, because of complex and difficult to 21
control physical mechanisms, such as phase separation, kinetic control of the assembly, 22
mixing homogeneity and purification. The control of homogeneity at nanoscale is non-23

6
trivial, and higher number of reaction/fabrication steps increases the probability of defect 1
and inhomogeneity. 2
Certainly one of the most illustrative examples of how suspension heterogeneity 3
affects biological outcomes is the impact of particle size dispersity. Small NPs (<150 nm) 4
are reported to be more effective than large NPs in cancer therapeutic 16. However, in 5
several cases, it has been shown that relatively large NPs may serve as better drug 6
carriers. For example, after studying different micelle batches with hydrodynamic 7
diameters ranging from 22-300 nm (mean diameters determined by DLS), Wang et al. 8
showed that the optimal size for blood circulation time and tumor accumulation was 100-9
160 nm 17. However, larger micelles (100-160 nm) had poorer tumor penetration than the 10
small ones (30 nm), highlighting the necessity for attentive size control 17. 11
Thus, nanoparticle batch size heterogeneity can also significantly influence 12
biodistribution and targeting. The role of particle size on in vivo efficacy has been 13
recently discussed 10, 18. In the case of PRINT® NPs (“Particle Replication In Non-14
wetting Templates”), particle size appeared to be the main factor in NP tumor 15
accumulation in vivo rather than the specific ligand density or particle shape 18. Another 16
example is Poly(lactic-co-glycolic) NPs (PLGA NPs) produced by emulsion-solvent 17
evaporation technique, which notoriously results in a heterogeneous size distribution. In 18
an experimental study, a PLGA NP batch carrying a plasmid encoding luciferase protein 19
was fractionated over a 100 nm pore-size filter, resulting two NP fractions having a mean 20
diameter of 70 and 200 nm. It was shown that luciferase transfection efficiency was 27-21
fold higher with smaller NPs (mean diameter 70 nm) compared to larger NPs (mean 22
diameter 200 nm). This result was obtained despite surface charges, DNA release and cell 23
7
entry were found near identical for the two NP fraction of the same batch 19. Considering 1
these examples, a polydisperse NP suspension may induce different biological outcomes 2
with respect to its size distribution. 3
Although surface heterogeneity could be an issue in terms of the particle batch 4
performance, in some recent studies the NP’s surface was intentionally manipulated to 5
induce heterogeneities 20, 21. The aim is to take advantage of these heterogeneities to 6
modify NP’s interactions with biological media, modify drug release profile or promote 7
the formation of ordered particle-based superstructures. 8
9
Figure 1 (A) Schematic representation of the heterogeneity at the suspension level (left) 10
and at the single particle level (right). In both cases averaged value can be obtained for 11
each physicochemical property. (B) Some examples of NP surface heterogeneities 12
influencing global biological performance and particles fate; at the nanoparticle 13
suspension or the single particle level: (top right) homogenous ligand density; (top left) 14
surface ligand clustering; (bottom right) homogenous material surface; (bottom left) 15
material phase separation on surface produces domains of different composition. 16
17

8
The heterogeneity of physicochemical properties within a nanocarriers population is an 1
emerging issue and concern. In this review, recent results regarding the chemical 2
heterogeneity are discussed (see Figure 2 for selected examples of particle heterogeneity 3
imaging). Size heterogeneity will be discussed only with the perspective of its role in the 4
variation of chemical composition and topology, since size fractionation could be related 5
to distinct chemical compositions. The focus will be on chemical heterogeneity: core 6
composition, hydrophilic corona layer heterogeneity and ligand density heterogeneities. 7
The discussion of this review will focus on the methods to highlight this heterogeneity, 8
some consequences on in vivo performances, the potential source of this heterogeneity 9
and how to minimize or in some cases optimize it. 10
9
1
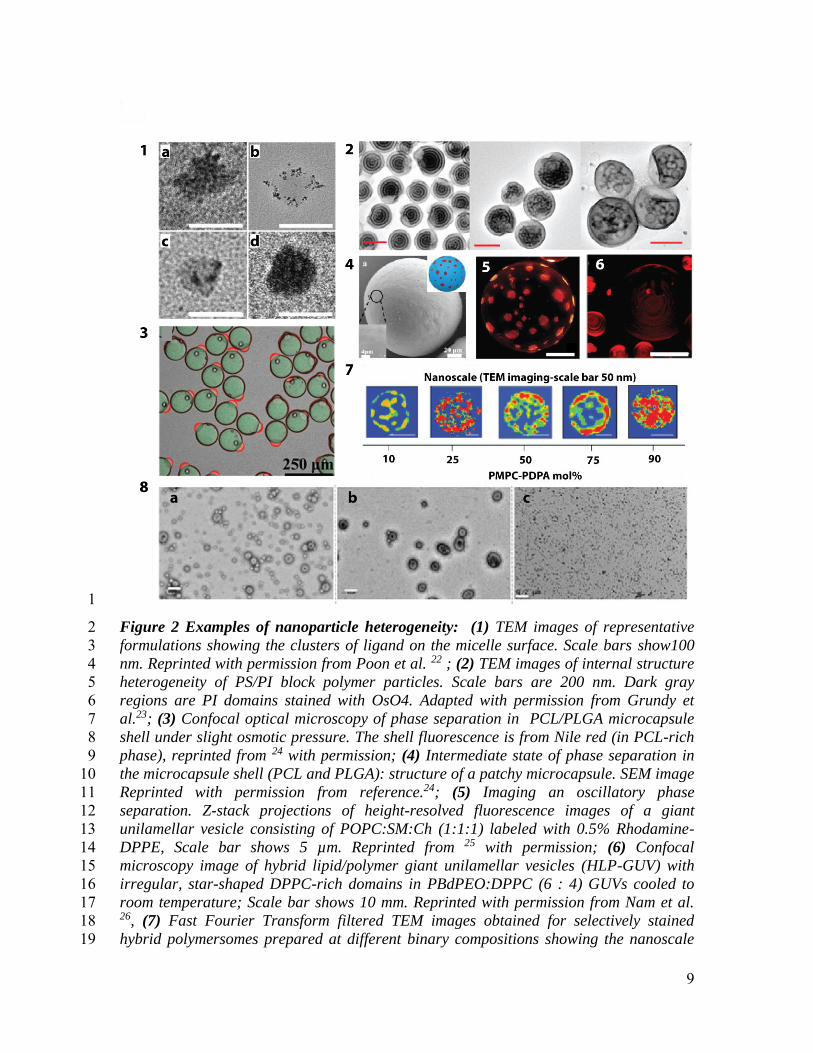
Figure 2 Examples of nanoparticle heterogeneity: (1) TEM images of representative 2
formulations showing the clusters of ligand on the micelle surface. Scale bars show100 3
nm. Reprinted with permission from Poon et al. 22 ; (2) TEM images of internal structure 4
heterogeneity of PS/PI block polymer particles. Scale bars are 200 nm. Dark gray 5
regions are PI domains stained with OsO4. Adapted with permission from Grundy et 6
al.23; (3) Confocal optical microscopy of phase separation in PCL/PLGA microcapsule 7
shell under slight osmotic pressure. The shell fluorescence is from Nile red (in PCL-rich 8
phase), reprinted from 24 with permission; (4) Intermediate state of phase separation in 9
the microcapsule shell (PCL and PLGA): structure of a patchy microcapsule. SEM image 10
Reprinted with permission from reference.24; (5) Imaging an oscillatory phase 11
separation. Z-stack projections of height-resolved fluorescence images of a giant 12
unilamellar vesicle consisting of POPC:SM:Ch (1:1:1) labeled with 0.5% Rhodamine-13
DPPE, Scale bar shows 5 µm. Reprinted from 25 with permission; (6) Confocal 14
microscopy image of hybrid lipid/polymer giant unilamellar vesicles (HLP-GUV) with 15
irregular, star-shaped DPPC-rich domains in PBdPEO:DPPC (6 : 4) GUVs cooled to 16
room temperature; Scale bar shows 10 mm. Reprinted with permission from Nam et al. 17 26, (7) Fast Fourier Transform filtered TEM images obtained for selectively stained 18
hybrid polymersomes prepared at different binary compositions showing the nanoscale 19

10
morphology, reprinted from LoPresti et al.27; (8) Illustration of size heterogeneity: TEM 1
micrographs of the polymersomes solution (a) before AF4 separation; (b) aſter 2
separation and (c) the separated micelle solution. Scale bars show 200 nm. Reprinted 3
from Robertson et al. 28 with permission. 4
5
1. Particle suspension heterogeneity 6
When heterogeneity is found at the suspension level, discrete particles subpopulation 7
with distinct physicochemical properties and chemical composition can be identified 8
within the suspension. Although this subject has not been studied extensively, some 9
studies have reported subpopulation heterogeneity based on particle suspension 10
fractionation. Particle fractionation has been mainly based on the size or the density of 11
NPs essentially because the available techniques mainly operate based on particle mass or 12
volume differences. As developed below, strong correlations between particle size and 13
chemical composition were often described. Note that the size dispersity is not discussed 14
in this review as a heterogeneity on its own. However, it is one of the important sources 15
of creating surface or chemical heterogeneity in NP suspensions. Therefore, we discuss 16
the relation between the size dispersity and chemical/surface heterogeneities, and the 17
subsequent effect of such heterogeneities on the NP performance. 18
1.1. Effect of particle size on NP chemical composition 19
Recent reports have highlighted higher-than-expected variations in nanocarrier 20
chemical composition correlated to their size polydispersity with important consequences 21
on the performance. The influence of size polydispersity on the chemical composition 22
and active delivery properties of lipid NPs encapsulating siRNA have been recently 23
investigated 29. Two similar lipid NP batches with similar bulk properties (chemical 24
composition, hydrodynamic diameter, surface charge, and encapsulation levels) were 25

11
tested. The lipid NPs were fractionated on a size exclusion chromatography (SEC) 1
column and fractions were analyzed for the chemical composition, lipid/encapsulated 2
siRNA ratio and in vitro efficacy of gene silencing activity of siRNA. While one batch 3
was found monodisperse (a uniform lipid composition across fractions), the second one 4
showed a significant dispersity for all the parameters tested. In vitro gene silencing 5
activity of the bulk batches and SEC fractions was evaluated. The two NPs batches 6
without fractionation displayed overlapping dose-response curve. In contrast, fractions of 7
the two batches showed significant differences for their in vitro activity, highlighting the 8
importance of heterogeneity assessments 29. 9
In the case of polymeric NPs, the polymer composition and Mw can vary with NP 10
size as demonstrated by Pirok et al. The authors developed a two-dimensional liquid 11
chromatography (LC/LC) system, which combines hydrodynamic chromatography (HC) 12
and SEC. The HC was used to fractionate a mixture of polystyrene and polyacrylate 13
(PS/PACR) polymeric NPs based on their size, and SEC analyzed polymers composition 14
of each NP fraction 30. PS and PACR NPs were effectively separated in different 15
fractions, but the technique showed a lack of resolution to separate PACR NPs of 16
different size. The subsequent polymer SEC analyses gave insights on the polymer Mw 17
and Mw distribution in the different NP fractions. Larger particles generally were 18
composed of larger polymer chains, while Mw distribution was found to be modulated 19
according to particle size 30. The significance of these differences in polymer composition 20
on different biological response remains to be established. 21
Preparation of NPs is often associated with the use of surfactant to control the size 22
and stability of the resulting suspension. The amount of surfactant on particle surface 23

12
influences several surface properties. It has been shown that the particle size influences 1
the amount of surfactant poly(vinyl alcohol) (PVA) adsorbed on PLGA nanoparticles 9. 2
Biological outcomes, such as cellular uptake and distribution for those particles could be 3
explained not only in terms of size differences but also in terms of surface chemical 4
composition differences 9, 31. 5
Surfactants have been also used as NP surface modifiers. For instance, Poloxamine 6
908 and Polysorbate 80 physioadsorbed on NPs were shown to induce a change in blood 7
circulation time and organ biodistribution when a concentration threshold was reached 32. 8
These changes has been attributed to selective adsorption of plasma proteins on the NPs 9
surface, enabling some sort of tissues targeting 33. The existence of coating heterogeneity 10
and its influence on NPs fate had not been investigated, even though the unstable nature 11
of physioadsorbed coating in vivo can make it prone to shedding. 12
13
1.2. Effect of particle size on drug loading 14
For drug nanocarriers, bulk chemical composition heterogeneity can be the result of 15
differential drug encapsulation in different particle sub-population. The relationship 16
between particle size, drug loading (DL) and encapsulation efficiency (EE) had been 17
previously addressed for particle suspensions with distinct size distributions. For protein-18
loaded microspheres which were size-fractionated by centrifugation, the loading 19
efficiency was similarly found to depend on the microparticles size 34. Gefitinib content 20
in the collected polymeric microspheres was found to vary at least 3 times between the 21
smaller MPs (<20 µm) and the larger ones (>100µm) 35. This phenomenon has not been 22
shown yet for NPs (size <1µm) but it could be expected according to this study. 23

13
1.3. Surface charges heterogeneity in a particle suspension 1
Evidence of chemical heterogeneity in particle suspension has also been demonstrated 2
from diffusive measurements in complex matrices. NP suspension, prepared by 3
polyelectrolyte assembly with near neutral surface charge, were shown to contain NP 4
sub-populations with higher diffusion coefficient in mucus than the average NP 5
population 36. The difference in the diffusion coefficient was attributed to heterogeneity 6
of surface charge. The authors explained that the process of self-assembly of 7
polyelectrolyte polymers into NPs lead to surface charges that are not uniformly 8
distributed. The result was surface domains with different charges, leading to different 9
interactions with the mucin network 36. This hypothesis is supported by results showing 10
that the spatial organization and charge distribution composition on peptide, even with 11
similar overall charge, can modulate their diffusion in a mucin gel 37. 12
13
1.4. Nanoparticle corona heterogeneity in a suspension 14
The surface of nanocarriers is usually constituted by a hydrophilic polymer corona, 15
which plays a major role in colloidal stability, anti-fouling, pharmacokinetic and 16
biodistribution. Polyethylene glycol (PEG) is by far the most used polymer for this 17
purpose 38. Therefore, the discussions in this section are mainly about this polymer. 18
However, most of the principles discussed below can be applicable to other surface-19
tethered polymers. 20
1.4.1. PEG particle surface coverage 21
The antifouling efficacy of a PEG layer is related to its surface density, which is often 22
characterized by a surface-density average value for a NP population 38. PEG chain could 23
14
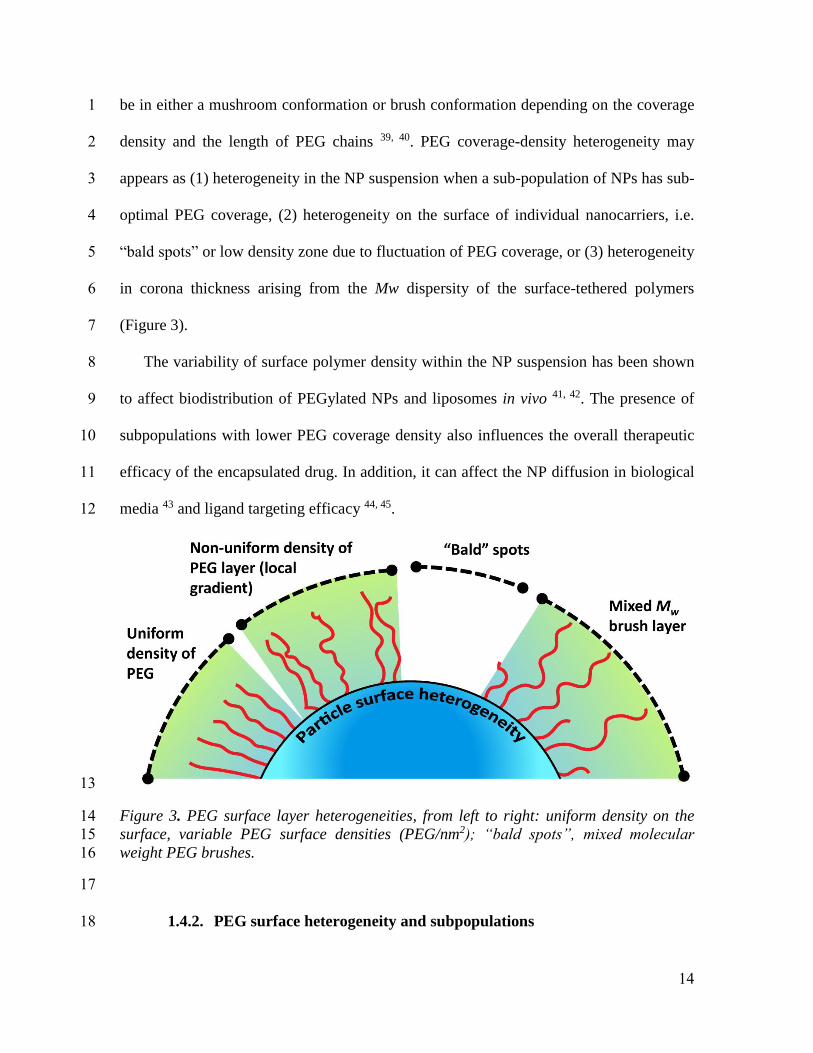
be in either a mushroom conformation or brush conformation depending on the coverage 1
density and the length of PEG chains 39, 40. PEG coverage-density heterogeneity may 2
appears as (1) heterogeneity in the NP suspension when a sub-population of NPs has sub-3
optimal PEG coverage, (2) heterogeneity on the surface of individual nanocarriers, i.e. 4
“bald spots” or low density zone due to fluctuation of PEG coverage, or (3) heterogeneity 5
in corona thickness arising from the Mw dispersity of the surface-tethered polymers 6
(Figure 3). 7
The variability of surface polymer density within the NP suspension has been shown 8
to affect biodistribution of PEGylated NPs and liposomes in vivo 41, 42. The presence of 9
subpopulations with lower PEG coverage density also influences the overall therapeutic 10
efficacy of the encapsulated drug. In addition, it can affect the NP diffusion in biological 11
media 43 and ligand targeting efficacy 44, 45. 12
13
Figure 3. PEG surface layer heterogeneities, from left to right: uniform density on the 14
surface, variable PEG surface densities (PEG/nm2); “bald spots”, mixed molecular 15
weight PEG brushes. 16
17
1.4.2. PEG surface heterogeneity and subpopulations 18

15
Surface composition is challenging to characterize particularly homogeneity of 1
surface coverage 11. The averaged PEG chain surface density (PEG chain/nm2) is 2
calculated from NP ensemble averaged measurements 38. Although not extensively 3
studied, the PEG heterogeneity in PEGylated polymeric particle populations has been 4
documented by Moghimi and coworkers 46, 47. Using hydrophobic interactions 5
chromatography (HIC), the authors were able to characterize the heterogeneity of a 6
population of polystyrene microspheres (MPs) after PEG grafting. Since the level of 7
surface hydrophobicity relates to the PEG grafting density, suspensions of MPs, with 8
different surface hydrophobicities, were found to behave differently regarding 9
macrophage uptake, protein binding and circulation time in blood 47. 10
Besides surface density heterogeneity, the polymers corona thickness could be 11
modulated by the molecular weight distribution. When PEG chain length is increased, an 12
increase in the distance between tethered polymer chains is observed resulting in a 13
decrease in coverage density due to the excluded volume effect. A lower coverage 14
density decreases the antifouling efficacy of the PEG layer 48. To maintain surface anti-15
fouling efficacy, several studies have proposed mixed/heterogeneous PEG layers. Indeed, 16
it has been shown, on flat surfaces modified with a PEG 5kD, that the addition of a short 17
"underbrush" layer of 2kD PEG leads to a decrease in non-specific protein absorption 49-18
51. Studies on liposomes demonstrated the benefit of this approach on the circulation time 19
52, 53. Colloidal stability of gold NPs has been improved using mixed-molecular-weights 20
PEG layer as well 54. Likewise, “hetero-brush” PEG surface (with 2kD “underbrush” and 21
5 to 20kD PEG chains “over brush”) on peptide nanospheres show greater proteins 22

16
resistance and serum stability than “homo-brush” PEG surface with 2kD or 5kD chains 1
55. 2
The quantification of PEG chains with different Mw values on the same NPs is a 3
challenging task that is yet to be overcome. This is important to ensure that the optimal 4
ratio between PEG chain lengths is maintained through the preparation process, and that 5
the surface is covered by a uniform mixing of the different chain lengths to avoid 6
possible phase separation phenomenon 48. 7
1.5. Ligand surface distribution in suspension 8
Heterogeneity in ligand-modified surfaces may appear either with a variable number 9
of ligand per nanocarriers or with a non-uniform spreading or clustering of ligands on the 10
surface of a single particle (Figure 1B). The latter will be addressed in section 2. It is 11
well established that ligands multivalency improves the affinity of ligand-modified 12
carriers toward targeted cells 56, cell internalization 57 and drug encapsulating efficiency 13
58. Quantitative determination of ligand density, although an indispensable step toward 14
optimization, is suffering from lack of accurate techniques to quantify ligand number on 15
individual particles. The quantification is often performed based on the knowledge of 16
particle concentration, particle total surface area and core diameter38, 59. 17
Numerous studies tried to address the question of the optimal ligand number and 18
density to achieve high specific endocytosis and/or tumor accumulation 18, 60, 61. However, 19
these studies rarely took the heterogeneity of ligand number per particle (ligand-to-20
nanoparticle ratio) into account. They often exclusively used the average values for this 21
characterization. The average value, however, does not recognize the distribution of 22
ligand number and its eventual dependence over other physicochemical parameters such 23
17
as particle size. Another concern is the sensitivity of the ligand grafting reaction to 1
surface heterogeneity such as surface roughness which could modulate coupling reaction 2
rate and reaction kinetics 62. 3
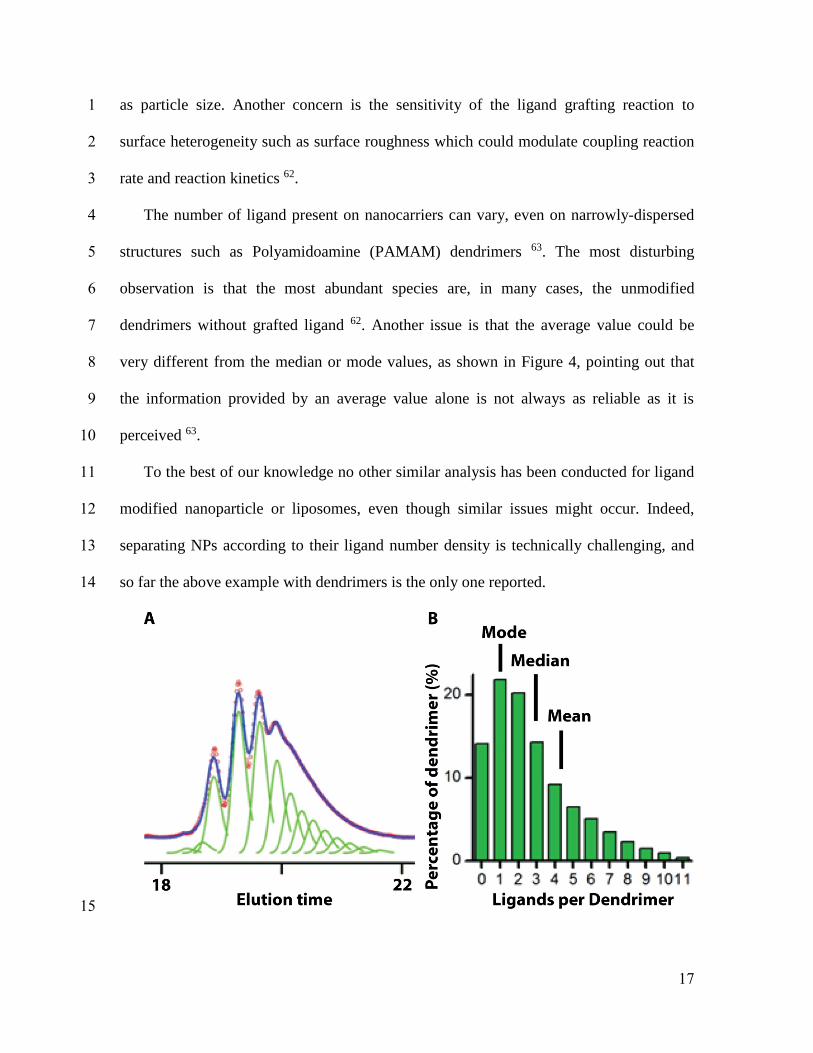
The number of ligand present on nanocarriers can vary, even on narrowly-dispersed 4
structures such as Polyamidoamine (PAMAM) dendrimers 63. The most disturbing 5
observation is that the most abundant species are, in many cases, the unmodified 6
dendrimers without grafted ligand 62. Another issue is that the average value could be 7
very different from the median or mode values, as shown in Figure 4, pointing out that 8
the information provided by an average value alone is not always as reliable as it is 9
perceived 63. 10
To the best of our knowledge no other similar analysis has been conducted for ligand 11
modified nanoparticle or liposomes, even though similar issues might occur. Indeed, 12
separating NPs according to their ligand number density is technically challenging, and 13
so far the above example with dendrimers is the only one reported. 14
15

18
Figure 4 (A) Peak fitting method quantifies the distribution of dendrimer−ligand species 1
resolved in the HPLC elution traces. (B) Dendrimer−ligand distributions. Adapted from 2
reference 63with permission. 3
4
2. Single particle heterogeneity 5
2.1. Hydrophilic corona heterogeneity at the single particle level 6
As mentioned earlier, another type of PEG coverage-density heterogeneity can be 7
deleterious to nanocarriers performance: heterogeneity on the surface of individual 8
nanocarrier, e.g., “bald spots” or low density regions due to fluctuation of PEG brush 9
coverage. Low PEG surface densities are prone to protein adsorption 64. Thus, these 10
surface heterogeneities can lead to accelerated opsonisation and mononuclear phagocytic 11
system (MPS) uptake and elimination6. 12
It has been reported that gelatin NPs observed by atomic force microscopy (AFM) 13
topographic imaging show rougher surface when modified with PEG. This roughness 14
suggests that PEG chains are not distributed homogeneously on the surface 65. 15
Differences in stiffness between PLA and PEG have been used to visualize surface 16
heterogeneity caused by PEG/PLA phase separation at the surface of NPs 66, 67. Other 17
indirect evidences of PEG surface heterogeneity have been provided by XPS analyses. In 18
PEG-g-PLA NPs, shift in the carbon peaks positions suggests existence of areas with 19
different charge accumulation on the NP surface, which in turn supports the presence of 20
PEG enriched regions 66. 21
At this point, there is a clear lack of accessible and direct techniques to allow surface 22
PEG quantification and characterization at the individual particle level that hinders 23
complete understanding of the possible role of heterogeneity on nanocarriers performance 24
and further process optimizations. 25

19
Similarly, uneven distribution of PEG chains on the surface of liposomes has been 1
reported due to phase separations of PEG-lipids 68, 69. It has been suggested that longer 2
PEG chains interact via van der Waals forces and interchain hydrogen bonding, causing 3
chain entanglement that leads to enriched PEG domains 68. PEGylated lipid also 4
influences hydrocarbon chain packing, favoring a temperature dependent phase 5
separation 69. Potentially, it cannot be overlooked that a similar effect could happen when 6
forming solid NPs, nucleic acid-PEGylated polymer assembly or during PEG grafting. 7
These points are discussed further in the origin of heterogeneity section. 8
Spatial organization and assembly of lipids were at the origin of heterogeneity in 9
liposome suspension. Heterogeneity in liposome surface organization was found 10
responsible for the existence of two liposome populations having distinct stability 11
properties and affinity for surfaces. The heterogeneity was attributed to differences in the 12
number of surface hydrophobic active sites which leads to spontaneous leakage of 13
content and increase in the affinity for hydrophobic surfaces 70. 14
It is well known that different curvature radius of spherical nanocarriers affect PEG 15
chains layer packing 6. In the case of gold non-spherical particle (AuNPs), coverage 16
heterogeneity could arise from faces, corners and edges which could either induce a local 17
non-optimal packing of the PEG layer, or local variation of the grafting efficiency 71. 18
2.2. Ligand distribution on a single particle 19
As discussed earlier, ligand multivalency plays a major role in targeted system 20
affinity. The interplay between ligand and surface chemistry is another important 21
parameter because it could influence targeting efficacy. For example surface PEGylation 22
may decrease ligand affinity 72 73. Xu et al. have shown that nanodomains located on a 23

20
lipoplex particles carrying plasmid DNA can affect transfection efficacy. The authors 1
demonstrated that targeting was improved when specific ligands (folate) were located in 2
cholesterol-rich lipid domains on the NPs surface. PEGylation of lipoplexes usually 3
results in a decrease of plasmid DNA transfection efficacy. PEGylation of lipoplexes 4
with DSPE-cholesterol conjugate results in PEG chains to be located mainly in the 5
cholesterol-rich domains. In this case, the transfection efficacy was not affected 74. The 6
question, whether this effect was mediated by the change in physical properties of the 7
carrier surface, such as ligand clustering, remains unanswered. 8
In another study, clustered or patchy presentation of ligands has also been shown to 9
influence the targeting efficacy 22. Clustering of ligands bound to the polymer end-groups 10
was observed in a micellar system constituted by dendritic polymers. Clustered ligand 11
presentation increases the efficacy of NPs due to their enhanced uptake, which is resulted 12
from the higher avidity and longer residence time in cell membrane 22. Tumor targeting 13
of polymer-based nanovesicles was improved both in vitro and in vivo using vesicles 14
made of lipid/polymer blends 75. The authors attributed this improvement to the 15
“dilution” effect of the PEG brush density at vesicles surfaces when lipid/polymer 16
composition was modulated. PEG brush can presumably have a negative effect on ligand-17
receptor recognition under certain conditions. On the other hand, Dao et al. showed 18
recently by Fluorescence Resonance Energy Transfer (FRET) analysis and Small-Angle 19
Neutron Scattering (SANS), that phase separation between polymer and lipid occurs in 20
hybrid polymer-lipid vesicles, which can lead to the formation of nanodomains that 21
impacts the biological activity of NPs 76. Surface clustering of the folate ligand enhances 22
cellular internalisation of NPs compared to a dispersed more homogenous distribution 77. 23

21
1
3. Engineered heterogeneity 2
Although heterogeneity is generally perceived as a negative factor in nanomaterial 3
performance, in some cases, such as for ligand clustering discussed above, it has been 4
studied as another adjustable surface property. Indeed, some reports have shown that NPs 5
with patchy polymeric surfaces favor cell internalization, modulate drug release and drive 6
particle auto-assembly. In these cases, the surface has engineered heterogeneity. 7
3.1. Chemically anisotropic nanoparticles and superstructures 8
Engineered NP heterogeneity results in anisotropic particles that can be categorized 9
as Janus, multi-compartment and patchy particles as illustrated in Figure 5. Patchy 10
particles have domains of varying properties on their corona, whereas in Janus NPs, two 11
distinct phases are separated either in the corona or in the core. 12
13

22
Figure 5. Schematic representation of Janus, patchy and multi-compartment NPs. The 1
different possible combinations of these structures are also depicted. Adapted from Du 2
and O’Reilly 20 with permission. 3
4
Multi-compartment particles are similar to patchy particles with the difference that the 5
multiple phase-separated domains are present in the core of the NP rather than in the 6
corona. Combinations of these three types of inhomogeneity produce a large spectrum of 7
complex anisotropic particle structures. In this section we review some of the most recent 8
designs of these novel classes of NPs. For more information on fabrication and assembly 9
of these NPs refer to Pawar and Kretzschmar (2010) 78, Du and O’Reilly (2011) 20, Liu et 10
al. (2015) 79, Ravaine and Duguet (2017) 21. 11
Mixtures of polymer and lipids have been proposed for membrane and lipo-12
polymersomes preparation. The mixing of these two types of materials creates new 13
hybrid vesicles for drug delivery if the preparation conditions are well adjusted 14
(temperature, ratio and speed). For the preparation of hybrid lipo-polymersomes, Nam et 15
al. used phase separation upon mixing and demixing of lipids and diblock polymer to 16
generate surface domains. The resulting surfaces have varying domains in hybrid lipo-17
polymersomes 26. 18
As evident in the numerous reviews published on this subject, the production of patchy 19
particles is now efficiently done. However, non-random patterning of NPs, except for 20
Janus surface patterning, is not as convenient. In an interesting study aimed at controlling 21
surface patterns, Choueiri et al. in 2016 used thermodynamically driven segregation of 22
polymer ligands, from a uniform polymer brush into surface pinned micelles, by 23
changing the solvent quality 80. This methodology appeared to be effective in controlling 24

23
the dimensions of the patches, their spatial distribution and their surface density. 1
Although the initial mechanism results in reversible formation of the patches, their shape 2
and configuration can be frozen using photo-crosslinking. The formation and shape of 3
these particles are illustrated in Figure 6. In a similar study, Ye et al. experimentally and 4
theoretically showed that the number of patches is inversely proportional to the 5
concentration of patch-forming blocks 81. 6
7
Figure 6. (a) Schematic representation of the solvent-mediated formation of the surface 8
patches on NP surface. (b) Electron tomography reconstruction image of a 60 nm 9
nanoparticle with three patches of polystyrene with a grafting density of 0.02 chains per 10
nm2. TEM image of a gold NP carrying photocrosslinked thiol-terminated polystyrene-11
co-polyisoprene patches. Scale bars in b and c are 20 nm. Adapted from Choueiri et al. 12
(2016) 80 with permission. 13
14
Multicompartment micelles can be produced, using linear ABC triblock terpolymer via a 15
step-wise reduction of the degree of conformational freedom and dynamics 82. In the first 16
step, the triblock terpolymer self-assembles into a core-shell geometry when exposed to a 17
non-solvent for the B block. This step leaves A and C blocks in the corona. During the 18

24
next step, exposure to a non-solvent for the A block triggers the collapse of block A, 1
leading to higher-level assembly of the subunits into the final superstructure as shown in 2
Figure 7. 3
4
Figure 7. Mechanism of the directed hierarchical self-assembly of triblock terpolymers in 5
solutions. The scale bar is 50 nm. Reprint from Groschel et al. (2012) 82 with permission. 6
7
Under suitable conditions, the colloidal polymerization of these self-assembled NPs can 8
be used to produce segmented superstructures 82. Similar multicompartment micelles 9
were used to produce anisotropic colloidal polymers with segmented structure 83. An 10
interesting sequel of this work was recently published by Lobling et al. in 2016 where 11
these NPs (with C corona and A/B cores) were used to produce nanostructures with 12
controlled patch morphology (see Figure 8) 84. The ratio of the blocks length 𝑁𝐶/𝑁𝐴 was 13
found to control the transition from micelle geometry to sphere, cylinder, sheets and 14
vesicles, while length of the B block, 𝑁𝐵, controls the patch morphology from spherical 15
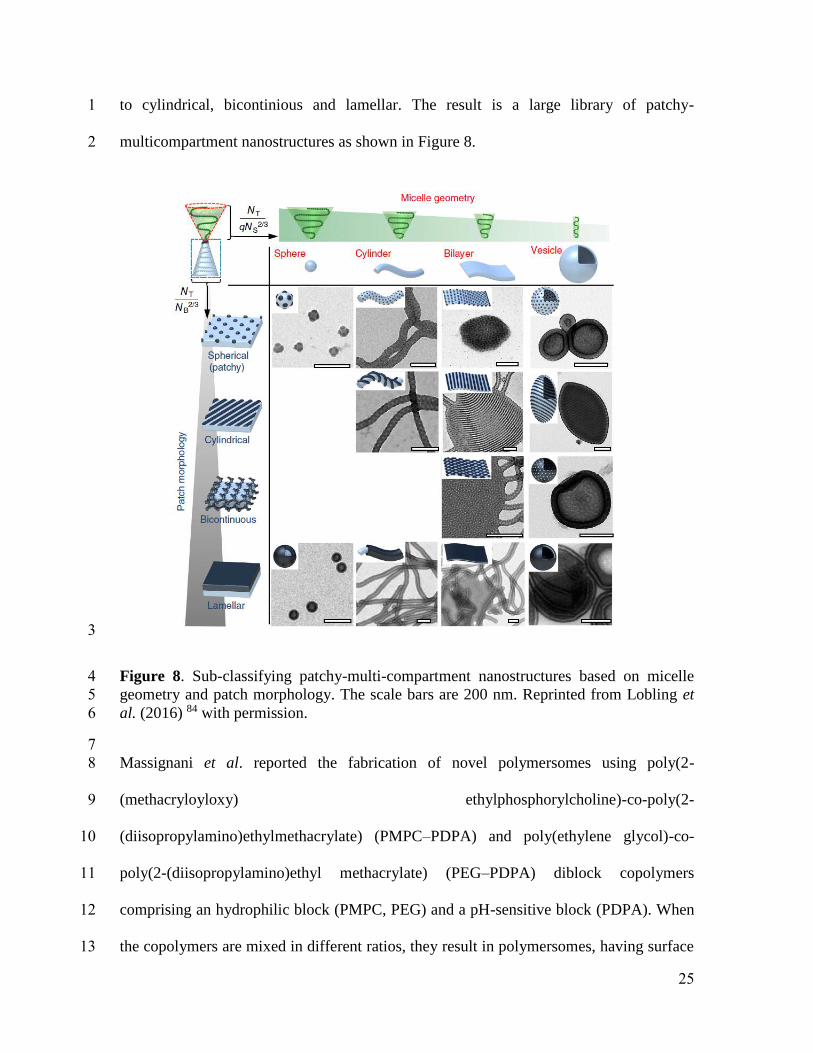
25
to cylindrical, bicontinious and lamellar. The result is a large library of patchy-1
multicompartment nanostructures as shown in Figure 8. 2
3
Figure 8. Sub-classifying patchy-multi-compartment nanostructures based on micelle 4
geometry and patch morphology. The scale bars are 200 nm. Reprinted from Lobling et 5
al. (2016) 84 with permission. 6
7
Massignani et al. reported the fabrication of novel polymersomes using poly(2-8
(methacryloyloxy) ethylphosphorylcholine)-co-poly(2-9
(diisopropylamino)ethylmethacrylate) (PMPC–PDPA) and poly(ethylene glycol)-co-10
poly(2-(diisopropylamino)ethyl methacrylate) (PEG–PDPA) diblock copolymers 11
comprising an hydrophilic block (PMPC, PEG) and a pH-sensitive block (PDPA). When 12
the copolymers are mixed in different ratios, they result in polymersomes, having surface 13

26
phase separation as evidenced by staining and visualization by TEM. The patchy 1
PMPC/PEG surfaces show differences in cell internalization rates, relative to the surface 2
polymer 85. 3
3.2. Applications of the engineered heterogeneity 4
The increasing attention towards the production of chemically anisotropic particles is 5
fueled by the numerous potential applications of this novel class of materials. Self-6
assembly of polymers into desired nano- and micro-patterned structures can be employed 7
in biomedical, electronic and energy applications. Perhaps the most intriguing application 8
is the formation of self-propelled nano/micro particles which can be used for efficient 9
micro/nano mixing. In this section, while focusing on biomedical applications, we review 10
some of the recent literature on chemically anisotropic particles. 11
Verma et al. showed that 6 nm nanoparticles, coated with a shell of hydrophobic and 12
anionic ligands regularly arranged into ribbon-like domains of alternating composition 13
penetrate cell membranes without evidence of membrane disruption. On the other hand, 14
particles with identical hydrophobic content but without structural order in the ligand 15
shell do not penetrate cell membranes. The authors concluded that structural organization 16
of surface chemical groups plays a key role in regulating cell-membrane penetration 13. 17
The self-propelling property of Janus particles has been studied experimentally and 18
theoretically by Howse et al. By coating half of the surface of polystyrene MPs with 19
platinum, the authors showed that at short times, the particles trajectory was 20
predominantly ballistic with velocities in the 𝜇m/s range, while at longer times the 21
motion was random. This example interestingly illustrates how Janus structures (or 22

27
potentially other chemically anisotropic particles) can be employed for designing 1
chemical locomotive systems 86. 2
With the ultimate objective of improving the delivery of macromolecular therapeutics 3
to the cellular cytoplasm, Imam et al. (2017) studied the effect of lipid membrane phase 4
separation on membrane fusion. They demonstrated that phase separated vesicles 5
transferred their content into the cellular cytoplasm four times more efficiently than 6
homogeneous vesicles 87. Heterogeneous surfaces could potentially be used as tools to 7
understand cellular functions 88, modify NP biodistribution 89 and increase antifouling 8
properties 90, 91. Many more applications of chemically anisotropic particles in drug 9
delivery was reviewed by Tran et al. in 2014 92. 10
11
4. Analytical methods to characterize heterogeneity: recent developments 12
Few methodologies are available to assess heterogeneity since the development of 13
proper analytic tools for this purpose is still at its infancy. The techniques may vary 14
depending on whether heterogeneity at the suspension level or at the single particle level 15
is characterized. 16
4.1. Detection of heterogeneity in particle suspension 17
4.1.1. Fractionation of particle suspensions 18
Several studies have reported the use of fractionation of particle suspension by size, 19
density or surface properties to assess their chemical compositions, efficacy and fate in 20
vivo. Several fractionation methods have been reported: fractionation based on particle 21
size with Size Exclusion Chromatography (SEC) 63, Asymmetric flow field flow 22
fractionation (AF4) 93 94, 95 or centrifugation 96. Centrifugation fractionation can be based 23
28
on particle density with isopycnic centrifugation 97, 98, or sedimentation velocity 1
analytical ultracentrifugation 99-101. Least common is fractionation based on affinity 2
chromatography since separation cannot be achieved for nanoscale objects 47. 3
Heterogeneity in size and shape has been also highlighted in studies on NPs 4
purification since NP subpopulation could be detected during purification procedures 28, 5
102. Fractionations based on other properties than size and density, such as ligand number, 6
are rarely reported except for the study by Mullen et al. discussed above in section 1.5 63. 7
Following fractionation, NP subpopulations can be analyzed using conventional 8
techniques to determine for instance, chemical composition, ligand numbers or other 9
physicochemical parameters. These results could be confronted to average values 10
obtained from the entire NP population to draw conclusions on NP batch heterogeneity. 11
4.1.2. Direct analysis of nanoparticle suspensions 12
Techniques that rely on a direct analysis of the NPs are useful for identifying 13
heterogeneities within a suspension. For example, observation of thousands of liposomes 14
by confocal microscopy along with fluorescent signal processing, can identify lipid 15
composition heterogeneity between liposomes of the same batch 103. The technical and 16
practical aspects of individual liposome visualization by confocal microscopy as 17
proposed by Larsen et al. 103 is more detailed in section 4.2. The lipid composition was 18
reported to vary significantly (ten-fold) between liposomes, which can impart drastic 19
effects on their physicochemical properties. Such composition heterogeneity could not be 20
identified using conventional techniques that rely on averaged properties over the entire 21
particle population. Despite the valuable information obtained using such direct 22
observation, high throughput screening of particles is often impossible. Therefore, it is 23

29
important to assess the possibility of using other characterization techniques for detecting 1
heterogeneities. 2
Electrophoretic methods (EM) are able to screen small NPs and identify size and 3
charge heterogeneity based on their electrophoretic mobility. The mobility depends on 4
NP charge, size, shape and surface functionalization. This technique can be divided in 5
two main categories: gel-based and gel-free separation. 6
Doane et al. applied the gel electrophoresis (GE) method to quantify the 7
electrophoretic mobility of PEGylated gold NPs (Au NPs) according to the PEG-ligand 8
molecular weight and hydrodynamic radius. Since different PEG molecular weights 9
produce different gel migration patterns, this technique was applied to characterize and 10
separate NPs according to their PEG-ligand molecular weight difference104. A similar 11
approach was applied by Daou et al to separate PEGylated quantum dots according to the 12
PEG-ligand molecular weight 105. Gel electrophoresis has also been applied to separate 13
Au NPs modified by monofunctional methoxy-PEG according to the PEG-ligand surface 14
density 106. However, GE is rather limited by the size range, typically only NPs smaller 15
than 25 nm can be resolved due to the gel pore sizes. 16
Capillary electrophoresis is extensively used to study several physicochemical 17
parameters of a population of nanoparticles and nanoparticle-biomolecule conjugates 107-18
109. By coupling capillary electrophoresis with laser-induced fluorescence detection, 19
Duffy et al. were able to detected individual sulfated polystyrene particles loaded with a 20
fluorescent dye. Using this approach, chemical heterogeneity, surface interactions, 21
double-layer ion distribution, size and 𝜁-potential can be studied at the single particle 22
level, and separation based on these parameters can be undertaken 110. Rezenom et al. 23

30
reported that a small number of individual particles can be characterized, and the 1
detection efficiency in this technique ranged from 38 to 57% for different particle sizes 2
111. 3
Polystyrene particles (PS) functionalized by amino, carboxylate, and sulfate were 4
separated and characterized by capillary electrophoresis-UV according to their difference 5
in surface charge 108. The separation was achieved for significant surface charge 6
difference between functionalized PS particles (more than 20-30 mV difference in 7
surface potential and charge inversion); whereas, charge difference inside the same batch 8
of NPs is usually less significant (SD about +/-10 mV). Therefore, optimization is 9
necessary before this technique could be used to resolve heterogeneity inside a 10
suspension of NPs. An important point is that samples in capillary electrophoresis are in 11
an electrolyte solution. Therefore, NPs stability in solution must be carefully monitored 12
109, 112. Other critical points to be considered are the improvement of resolution, 13
reproducibility and current lack of reference nanomaterials to be used as standard in 14
analytic methods 109. 15
Industrial applications of colloidal particles, such as inks and paints, usually 16
require samples concentration far above the concentration and turbidity limits that the 17
light scattering techniques can operate in. In addition, in large scale production of 18
nanoparticles it is preferred to measure the properties (especially NP size and 𝜁-potential) 19
in real time so that a control system can respond and eliminate any defected sub-20
populations, thereby decreasing the heterogeneity in the final product. Electroacoustic 21
spectroscopy, a technique that operates based on electrokinetic phenomena at megahertz 22
frequencies, is an ideal characterization method for concentrated nano- and micro-particle 23

31
suspensions and industrial slurries 113. This technique is not limited by the turbidity since 1
the measurements are based on sound rather than light propagation. O’Brien et al. (2003) 2
used electroacoustic spectroscopy to successfully determine the size and zeta potential of 3
a highly concentrated silica NP suspension (43 wt%) while the suspension was being 4
pumped through a flow circuit 114. Many interesting industrial applications of this 5
technique in nanoparticle characterization were reviewed by Hunter 113. In addition, 6
electroacoustic spectroscopy can be used for characterization of NPs while they are 7
embedded in opaque non-Newtonian media. Adibnia and Hill (2014) used electroacoustic 8
spectroscopy to show that NPs embedded in hydrogel distribute heterogeneously, and 9
reflect different diffusive patterns within sub-populations of NPs 115. 10
Tunable resistive pore sensing allows the analysis of size and zeta potential of 11
individual particles in a suspension. In this technique a resistance pulse is generated over 12
time each time individual particles pass through a pore. The pulse profile can be 13
interpreted using appropriate theories to extract the particle size, shape, charge and 14
concentration 116. Evidently, the pore size dictates the size range of the particle to be 15
analyzed. Therefore, size tunable pore sensors were introduced to tune the pore 16
dimensions typically using mechanically stretching elastic pores 117. Using an appropriate 17
theoretical model, Kozak et al. (2012) extracted the electrophoretic component of the 18
particle motion in the pore, and successfully evaluated the 𝜁-potential and size of 19
individual polystyrene particles 117. Vogel et al. implemented a high-resolution tunable 20
resistive pulse technique to measure size and 𝜁-potential of biological samples such as 21
mixed anionic, cationic liposomes and extracellular vesicles in plasma on a single particle 22
analysis basis (see Figure 9). They also studied the in-situ immobilization of DNA on 23

32
magnetic particles by measuring individual particles 𝜁-potential 118. Tunable resistive 1
pulse sensing can also be used to investigate adsorbed protein layers on nanoparticles by 2
individual particle size measurement 119, which is not possible using conventional 3
techniques such as dynamic light scattering due to the formation of agglomerates. It 4
should be noted that the sensitivity and throughput of resistive pulse sensing is still 5
improving, especially with the integration of micro- and nano-fabrication technologies 6
120. 7
8
Figure 9. (A) Zeta potential vs particle size of bare polystyrene (CPN100), carboxylated 9
polystyrene particles (CPC70, CPC100), magnetic particles (Bio-Adembeads) and 10
magnetic particles modified with DNA. The mix of all 5 particle types (in yellow) 11
resembles very well the particle distributions when particle types are measured 12
separately. From reference Vogel et al. 118 (adapted and use with permission) (B) 13
Principle of TRPS, schematic representation of a pore; right down: pulse signal 14
generated by each individual particles. Adapted and use with permission from 15
Sommerville et al.121. 16
17
Flow cytometry can be used as a screening technique to quantitatively examine 18
the adsorption of fluorescent proteins onto PEGylated microparticles (MP) surfaces. 19
Observation of different population of fluorescent MP can demonstrate MP batch 20
heterogeneity 122. However, until recently the technique was not transferable to nano-21
sized objects, due to detection limitations. Recent developments have resulted in several 22

33
report of optimized “in house” equipment able to analyze nanoparticles and nanovesicles 1
123, 124. The possibilities opened by these recent developments in the identification of NP 2
subpopulation as a function of size, adsorbed proteins and surface properties are 3
enormous 125-127. 4
Microfluidics has been used for nanoparticle separation and characterization. 5
Microfluidic devices offer a convenient, single step and most importantly continuous 6
particle separation, which is now very well-established for micron-sized particle sorting 7
128. The electrophoretic mobility and particle size of individual Hepatitis B Virus capsids 8
were measured in two nanofluidic 45 nm wide pores in series using resistive pulse 9
sensing 129. The nanofluidic fluorescence-based detection and characterization of small 10
lipid vesicles on a single particle basis was done in a nano flow cytometer 130. The device 11
could count the number of fluorescent synthetic lipid vesicles down to a vesicle 12
concentration of 170 fM also detecting binding reactions occurring at the surface of 13
individual vesicles. This potentially could allow the detection of heterogeneities in 14
vesicle subpopulations and identify specific biomolecules on the surface. 15
16
4.2. Detection and analysis of heterogeneity at the single particle level 17
Unfortunately, until now there are not many techniques allowing the study of NPs 18
surface individually with high spatial resolution and high throughput. Surface 19
heterogeneity at the single particle level is currently assessed by imaging techniques such 20
as TEM, SEM, AFM and fluorescent microscopy. 21
Transmission and Scanning electronic microscopy (TEM and SEM) are the methods 22
of choice to visualize particle heterogeneity at the population or single particle level. Size 23

34
and shape can be readily resolved providing that the particles are stable enough. Some 1
insights into chemical heterogeneity can be detected if materials have different electronic 2
density or could be stained with heavy metal salts. However, features such as PEG 3
surface coverage cannot be readily analyzed. The limitations of imaging techniques are 4
related to tedious and time consuming image analysis to obtain enough statistical power. 5
The surface heterogeneity of Poly(lactide-co-glycolide) (PLGA) NPs coated with a 6
mixture of lecithin and 1,2-distearoyl-sn-glycero-3-phosphoethanolamine (DSPE)-N-7
polyethylene glycol (PEG) with NH2 or O-CH3 end-terminal groups was visualized by 8
TEM. NPs visualization was carried out by grafting carboxylated quantum dots (QDs) to 9
the PEG NH2 terminal group on NPs surface. Similarly, patchy surface of MPs 10
conjugated by gold NPs (AuNPs) was observed by TEM and SEM 131 . In both case the 11
formation of patches on the surface of particles was demonstrated by Electronic 12
Microscopy (EM). According to the authors this heterogeneity is related to the difference 13
in segregation of DSPE-PEG according to difference in end-terminal group (NH2 vs 14
OCH3). Even though this kind of technique provides a lot of information about surface 15
heterogeneity, it should not be forgotten that the functionalization of the surface by QDs 16
or AuNPs could create more surface heterogeneity due to the non-uniformity of chemical 17
coupling reaction. Similar MPs were also synthesized using DSPE-PEG conjugated by 18
fluorescent dye. Similarly, the patchy surface was observed on the MPs surface by 19
confocal microscopy 131. 20
Surface heterogeneity of individual liposomes with diameters between 50 nm to 1.5 21
µm was reported by high-throughput confocal fluorescent microscopy. The labeled 22
liposomes were prepared with a pair of fluorescent lipid analogues with identical fatty 23

35
acid tails (phospholipid DHPE and fatty acid C16 respectively) attached to two different 1
fluorescent dyes. The molar ratio of the two labels was analyzed by confocal fluorescent 2
microscopy on individual liposome by measuring their intensity ratio. Variable label 3
molar ratio were recorded for individual liposomes, reflecting lipid composition 4
heterogeneity 103. However, because of the low resolution of confocal microscopy in the 5
submicron range, it does not allow visualizing individual liposome surface with high 6
enough detail. 7
The ratio of lipid to proteins of proteoliposome with mean diameter of 100 nm was 8
determined by confocal fluorescent microscopy. High throughput analysis of 9
proteoliposome was performed by labeling the transmembrane proteins with Cy3 or Cy5 10
and the lipid phase with Oregon green DHPE3. The analyses of thousands of 11
proteoliposomes allowed the heterogeneity in distribution of transmembrane protein in 12
proteoliposomes to be characterized. Three subpopulations of proteoliposomes with 13
different transmembrane protein compositions could be identified 132. This could have 14
implications in formulation of targeted liposome for drug delivery using surface proteins 15
as targeting ligand. 16
Atomic force microscopy (AFM) is a reliable approach to obtain information about 17
the nanoscale heterogeneity on the surface of coated or functionalized material. AFM is 18
frequently used to characterize NP size distribution 133-135. However, to the best of our 19
knowledge, in very few articles, AFM was used to study the surface properties related to 20
the surface heterogeneity. The shape, size and core-shell structure of superparamagnetic 21
iron oxide nanoparticles (SPION) modified by pullulan (a polysaccharide used to 22
increase biocompatibility of SPION) was investigated by AFM. In this study, the authors 23

36
demonstrated that the particle structures is constituted of an inner magnetite core and an 1
outer polymeric shell of pullulan 136. The nanoscale spatial resolution of AFM provides 2
important information about nanoparticles surface. As previously mentioned in section 3
2.1, heterogeneous distribution of PEG was observed in AFM topographic mode 65 or 4
AFM “phase imaging” mode 66, 67 . 5
Stan et al. applied AFM and atomic force spectroscopy (AFS) in contact and tapping 6
mode on flat gold substrates functionalized by PEG thiol in aqueous PEG solution. In this 7
study, the morphology and PEG heterogeneity of surface coverage and the mechanical 8
properties of the PEG surface coatings were measured by AFS 137. Additionally, the data 9
gathered by AFM and AFS provided enough statistical evidence to calculate the length 10
and density of PEG brush. The authors reported a significant heterogeneity in PEG 11
surface coverage, forming sparse and brush-like islands. It is important to mention that 12
this study was performed on flat gold surfaces, and it is yet to be applied to spherical gold 13
NPs. A similar study was performed by Nnebe et al. on PEG chain layer grafted on silica 14
by tapping-mode AFM. Analyses of compression forces applied by the AFM probe on 15
the surface PEG layer reflected the grafting density and the PEG layer thickness, which 16
could reveal heterogeneity in surface chemistry 138. 17
Atomic force microscopy scanning electrochemical microscopy (AFM-SECM) was 18
employed by Huang et al. to visualize the PEG corona labeled by ferrocence 139. 19
Additionally, AFM-SECM could allow the visualization of the gold core of individual 20
NPs. In this technique, by generating a specific tip current, a microelectrode probe 21
allows electrochemical detection of the PEG labeled by ferrocence (Fc-PEG redox label) 22
immobilized onto a 20 nm gold NP surface. The intensity of this specific current relies on 23

37
the concentration of ferrocence or any other redox label on the surface of the gold NPs, 1
while AFM tapping mode determine the location on individual NPs. In other words, 2
AFM-SECM allows the determination of the statistical distribution of PEG density in the 3
surface of gold NPS by analyzing individual NPs. In this study, for each image a 4
histogram showing the distribution of the number of Fc-PEG chains per nanoparticle 5
probed was generated. AFM-SECM could be useful to detect the surface heterogeneity 6
within the same batch of NPs as the redox-labeled macromolecule resolution was found 7
to be around 20 nm. However, AFM-SECM is not a universal technique as it could be 8
applied only to NPs with conducting substrate. Additionally, the use of AFM-SECM 9
requires the functionalization with redox label, limiting the range of application of this 10
technique. 11
Structural disorders and packing efficiency of the phospholipid bilayer of giant 12
multilamellar liposomes (diameter in the order of hundred microns) were visualized by 13
Confocal Raman Microspectroscopy. The combination of Raman spectroscopy and 14
microscopy allows for the mapping of the surface composition of the material with a 15
superior resolution in the sub-micron range 140. The authors investigated three regions in 16
the vibrational spectrum (C-C stretching, C-H deformation and C-H stretching) to reveal 17
phase and lateral packing heterogeneity in the phospholipid membrane. It should be 18
mentioned that confocal Raman microspectroscopy currently cannot be applied to 19
submicron particles because of the low spatial resolution of the technique. 20
A combination of different techniques is a successful approach to unveil never-seen-21
before surface details at the nanoscale. A good example is the combination of super-22

38
resolution fluorescence microscopy (SRFM) with TEM techniques to investigate 1
structure heterogeneity of soft NPs 141. 2
Core−shell architectures of hard and soft core/shell NP stained by fluorescent dye or 3
AuNPs or AgNPs were visualized by SRFM (fluorescent probe) or TEM (metallic NPs). 4
Microscopy data allows determining the 2D radial distribution of metallic NPs or 5
fluorophores, therefore allowing the 3D reconstruction of the internal structure of the 6
core/shell NPs 141. This technique enables quantifying the different compartment volumes 7
in a single microgel, and to access the quantitative evaluation of structural heterogeneity 8
of a NP ensemble. Moreover, temperature-induced changes of the responsive soft shell 9
labelled with AgNPs could be observed at the single microgel level 141. 10
Combination of AFM and infrared (IR) spectroscopy was shown to provide the high 11
topographic spatial resolution of AFM in combination with the thermal, chemical 12
analysis and compositional imaging capabilities of IR spectroscopy, showing great 13
potential for NP investigation 142. More generally, the effective characterization of 14
particle surface homogeneity can only result from combination of methods as shown by 15
F. Stellacci and coworkers 143. 16
39
1
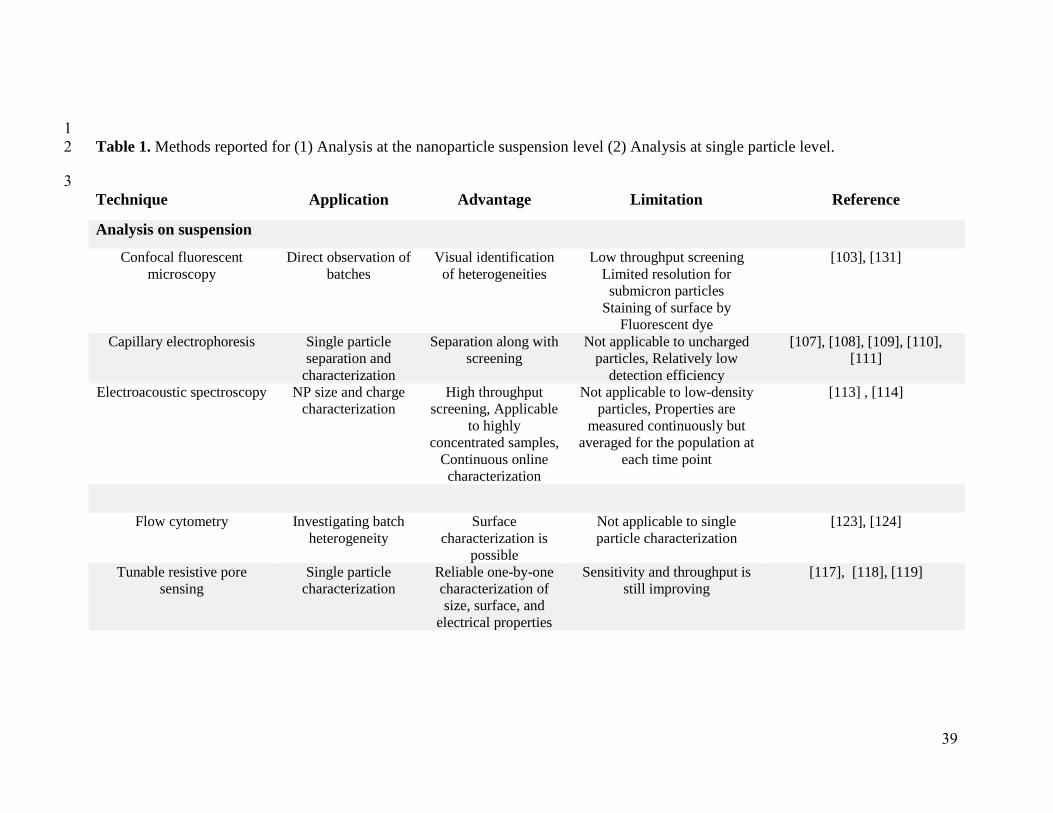
Table 1. Methods reported for (1) Analysis at the nanoparticle suspension level (2) Analysis at single particle level. 2
3
Technique Application Advantage Limitation Reference
Analysis on suspension
Confocal fluorescent
microscopy
Direct observation of
batches
Visual identification
of heterogeneities
Low throughput screening
Limited resolution for
submicron particles
Staining of surface by
Fluorescent dye
[103], [131]
Capillary electrophoresis Single particle
separation and
characterization
Separation along with
screening
Not applicable to uncharged
particles, Relatively low
detection efficiency
[107], [108], [109], [110],
[111]
Electroacoustic spectroscopy NP size and charge
characterization
High throughput
screening, Applicable
to highly
concentrated samples,
Continuous online
characterization
Not applicable to low-density
particles, Properties are
measured continuously but
averaged for the population at
each time point
[113] , [114]
Flow cytometry Investigating batch
heterogeneity
Surface
characterization is
possible
Not applicable to single
particle characterization
[123], [124]
Tunable resistive pore
sensing
Single particle
characterization
Reliable one-by-one
characterization of
size, surface, and
electrical properties
Sensitivity and throughput is
still improving
[117], [118], [119]

40
Micro- and nano-fluidics NP separation and
characterization
Single step
continious approach.
Nanofluidics
applicable to single
particle analysis
Low throughput screening
[128], [129], [130]
Analysis at the single particle level
Transmission electronic
microscopy (TEM)
Direct observation of
NP batches
Visualisation of intact
NPs
Staining of surface Sensitivity
of NPs to electrons
[131]
Electrochemical atomic
force microscopy
Probing surface of
individual
nanoparticles
High spatial
resolution
Surface functionalization by
redox label
[139]
Atomic force microscopy
(AFM)
All types of solid
particle (in air)
Ease of application Resolution: Limited by AFM
tip,
Unable to determine the
detailed characteristics of the
morphology
[143]
Raman microspectroscopy chemical composition
mapping of particles
surface
Mapping chemical
composition of
single particle
Limited resolution for
submicron particles
[140]
Super-resolution
fluorescence microscopy
(SRFM)
Direct observation of
NP batches
Visualisation of intact
NPs
Staining of surface is necessary
Diffraction-limited
[141]
41
1
4.3. Data presentation and statistical considerations in heterogeneity assessment 2
Parameter heterogeneity statistical assessment is of paramount importance, but a 3
complex issue. In this section, discussion is limited to some basic issues, readers 4
interested in more information are invited to consult suggested textbook and references 5
cited in the following sections 144. 6
Data distribution and central tendency values 7
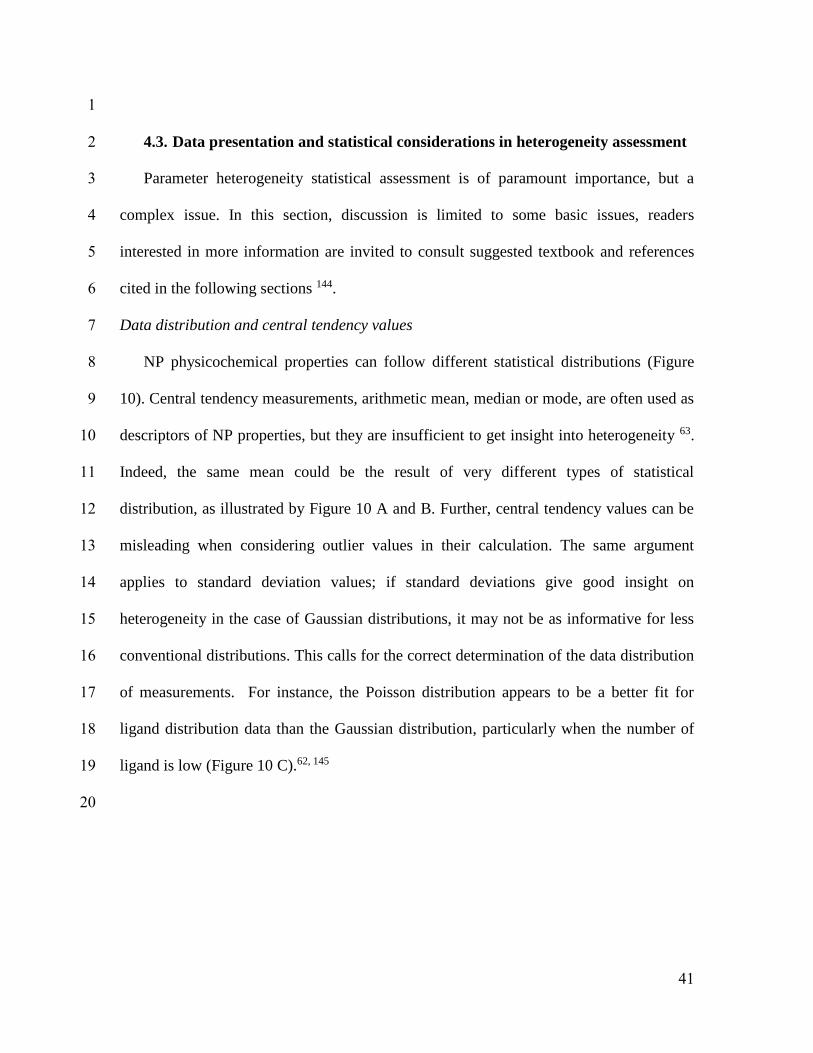
NP physicochemical properties can follow different statistical distributions (Figure 8
10). Central tendency measurements, arithmetic mean, median or mode, are often used as 9
descriptors of NP properties, but they are insufficient to get insight into heterogeneity 63. 10
Indeed, the same mean could be the result of very different types of statistical 11
distribution, as illustrated by Figure 10 A and B. Further, central tendency values can be 12
misleading when considering outlier values in their calculation. The same argument 13
applies to standard deviation values; if standard deviations give good insight on 14
heterogeneity in the case of Gaussian distributions, it may not be as informative for less 15
conventional distributions. This calls for the correct determination of the data distribution 16
of measurements. For instance, the Poisson distribution appears to be a better fit for 17
ligand distribution data than the Gaussian distribution, particularly when the number of 18
ligand is low (Figure 10 C).62, 145 19
20

42
1
Figure 10. Statistical distributions: (A) Normal and bimodal distributions; (B) Normal 2
and skewed distributions with central tendency values (Mean: solid line; Median: dotted 3
line, Mode: dashed line, σ: standard deviation of the color-associated distribution), In A 4
and B: Mean=40 for all the distribution, while mode and median are varying with the 5
type of distribution. In the case of normal distribution: Mean=Median=Mode (C) Poison 6
distributions-with different Poisson parameter λ (mean and variance); (D) 3D plot, a 7
possible representation of a nanoparticle population for which 3 different parameters are 8
known for each NP individually. 9
Statistical considerations regarding multiple parameters analysis 10
If we consider different parameters, for example size, ligand density and surface 11
charge for the same NP suspension, the three central tendency values can give the 12
impression that most NPs have their three parameter values close to the multivariate 13
mean. However, this may only be the case when the parameters are both independent and 14
follow unimodal, narrow distributions. Hence, it may be that only a small fraction of the 15
NP suspensions displays these values for the three parameters. It is also possible that 16
clusters of NP suspensions arise when parameters correlate (see Figure 10 D). Unless the 17

43
three parameters are measured simultaneously on the same particle and for a 1
representative number of particle from the suspension, it cannot be assumed that an 2
“average” nanoparticles exist 146. 3
In conclusion, the end-goal is to be able to determine which fraction of the suspension 4
is having the desired targeted values for all the key parameters. In other words the goal is 5
to determine which part of the NP distribution leads to the desired biological outcomes. 6
Collecting information about parameter distributions, in addition to central tendency 7
values, is important to ensure a critical number of particles have the desired properties. 8
Ideally, this information would be gained from measurements obtained on individual 9
particles or from careful sub population samplings. Otherwise, it would be important to 10
find ways of estimating the percentage of NP populations having parameter values within 11
specific interval limits, something that can be envisioned under reasonable assumptions 12
about distributions and correlations. 13
14
5. Perspectives 15
5.1. Factors impacting suspension heterogeneity 16
The intended or unintended presence of non-uniform surface and domains on NPs 17
usually results from the following reasons: 1) dispersity of materials properties such as 18
size and chemical composition; 2) phase separation between two or more components of 19
the same particle, typically lipids and/or polymers; 3) non-homogenous mixing of 20
materials or reactants; and finally 4) incomplete chemical reactions. 21
Role of materials heterogeneity 22

44
In a bottom-up strategy (usual for lipid and polymer NP assembly), the structuration 1
at the higher level of organization (the particle) strongly depends on material properties 2
and dispersity. The materials could show dispersity in chain/block size as well as 3
dispersity in chemical composition. The latter could result from non-homogenous 4
monomer distribution; local fluctuation along the chain, or in the case of phospholipid 5
materials, different fatty acids chain lengths. It is hypothesized that dispersity could affect 6
the structuration as well as the heterogeneity of the next level of organization. 7
For instance, it has been shown that in some conditions a mix of block copolymer 8
with a fraction of hydrophobic homopolymer as low as 10% w/w can trigger a change in 9
particle morphology from vesicles to spheres 147. This could be an issue with copolymers 10
that are not completely purified and characterized, such as block copolymers resulting 11
from coupling reactions 148. 12
On the other hand, some other studies reported contradictory results. As it was 13
reported by Lebouille et al., polymer composition and size dispersity does not have a 14
significant influence on NPs size when prepared in a fast mixing process 149. However, 15
the effect of polymer dispersity on slow mixing processes has not been elucidated. 16
Relationship between polydispersity and self-assembly/phase separation of block 17
copolymers has been reviewed recently 150. As mentioned in this review, poly dispersity 18
index (PDI) is a poor descriptor of dispersity breadth as it depends on a number-average 19
molecular mass. Calculated molar mass dispersity (MMD) is a better descriptor of the 20
breadth of chain distribution 150. MMD influences almost every aspect of self-assembly, 21
from microphase separated domains size to interface thickness and temperature at which 22
ordered/disordered transition occurred. The influence of MMD modulation is interpreted 23

45
in terms of change in entropy of the system: 1) A decrease in entropic penalty associated 1
with the fact that less chain stretching is required as the long chains fill the bulk of the 2
domains while the short chains adopt relaxed conformations at interphase; 2) An increase 3
in configurational entropy when smaller chains present in a domain with a broad MMD 4
are pulled into the other phase separated domains. The relative contributions of these two 5
phenomena depend on the broadness of the molecular weight distribution. This is an 6
important issue for the industrial development of nanomaterials because industrially 7
produced block copolymers possess higher variability than controlled laboratory 8
produced copolymers. Polydisperse copolymers can out-perform narrow dispersed block 9
copolymers as they can lead to new morphologies and larger nanodomains 151. 10
Control of nanomaterial assembly: phase separation 11
Self-assembly of block polymer at nanoscale is a common way to prepare complex 12
structures with different morphologies. When diblock polymers or polymer blends are 13
dissolved in a mixed phase (organic solvent phase), upon solvent withdrawal the mixed 14
phase could be demixed and form a two-phase system if blocks are chemically 15
incompatible. Block copolymers cannot separate in macroscopic scale, but they segregate 16
locally, in microscale. The block segregation is enthalpy driven by repulsive forces 17
between unlike chains. Phase organization strongly depends on the speed and direction of 18
solvent removal. Different morphologies and structures could be produced if parameters 19
of the phase separation process are slightly modified. In particular, the volume fraction of 20
one block is an important factor in determining which structure will be adopted. 21
Interaction parameter between blocks χ (which is temperature dependent) and the degree 22
of polymerization of a block N are as the other effective parameters since their product 23

46
represent the segregation strength between blocks 152, 153. For instance, a mix of closely 1
related polyesters could lead to specific structuration: phase separation of PLGA and PCL 2
at the wall of a polymer capsule creates PCL domains on the capsule’s surface 24. 3
The self-assembly of material leads to the formation of only a few type of 4
nanostructure. Recently, it has been argued that this limitation is due to a lack of 5
information “programmed” into the starting material 154. For instance, the nature and size 6
of the building blocks can be seen as information to direct assembly of domains with 7
specific shape and size 154. It is expected that the addition of information to guide 8
materials assembly may improve colloid homogeneity or engineered heterogeneity. 9
These considerations on phase separation and organization of polymer materials can 10
also be considered with hybrid materials, mixture of lipids and polymer or other additives 11
such as cholesterol or surfactant molecules. 12
Control of materials assembly: mixing 13
Most preparation methods involve a thermodynamic and kinetic control of material 14
assembly147, 155, and the mixing time plays a major role if particle assembly and 15
organization depends on both polymer precipitation and phase separation. 16
Chemical engineers are well aware of the challenges related to the mixing at different 17
time and length scales to achieve chemical reaction homogeneity and reliable end-18
products. Complete mixing at very short length scale, which is necessary to obtain 19
nanoscale structures, is very difficult to achieve due to the dependence of perfect mixing 20
to time. Incomplete micromixing coupled with non-linear chemical reactions, 21
autocatalysis or assembly can yield to extremely variable outcomes 156. 22

47
In the context of polymer nanocarrier assembly by nanoprecipitation processes, size 1
and size dispersity was found to be directly related to the speed and homogeneity of 2
mixing of the solvent and anti-solvent phases. Several technological solutions have 3
proposed such as Nanoflash micromixing and microfluidic approaches to resolve the 4
issue of complete mixing 157-160. These issues become more important at the scale up 5
step, as efficient mixers are difficult to scale up. 6
However, when a microfluidic mixing method such as the staggered Herringbone 7
mixing nanoprecipitation (SHMN) is compared to classical batch nanoprecipitation (BN), 8
it is found that the process with the fastest mixing time (SHMN) produces smaller NPs 9
with less batch-to-batch variability than BN 161. On the other hand, size polydispersity 10
index is greater for SHMN than BN, suggesting that size control remains a complex issue 11
161. 12
Heterogeneity due to incomplete chemical reaction and purification 13
Nanocarrier preparation involves several chemical reaction steps, including synthesis 14
using the raw materials and surface modification by coupling reaction to add ligands and 15
polymers to modify the surface. Heterogeneity could arise from incomplete chemical 16
reaction, unavailability of reactive groups due to steric and conformation hindrances, 17
slow reaction kinetic and difficulties to purify and homogenize the resulting modified 18
particles. When reaction involves polymerization, inhomogeneity could arise from 19
initiation, propagation and termination of chains 162. 20
Polymer-stabilized colloids can be produced by surface modification by polymer 21
grafting. The grafting method plays an important role in the degree of homogeneity of the 22
polymer-grafted surface. Two grafting strategies are available, the “grafting to” approach, 23

48
which is grafting polymer chains on the surface; and “grafting from” approach, which 1
consists of direct polymerization of pendant chains from the NP surface. The “grafting 2
from” approach has been credited for higher grafting density, thereby more homogenous 3
surface coverage 163. However, as demonstrated by a simulation study, the “grafting to” 4
approach yields to NPs with a more isotropic polymer coverage and a more homogenous 5
surface than the “grafting from” strategy 163. On the other hand the grafting efficiency of 6
the “grafting to” approach is a rather low, and leads to lower ligand density. Noteworthy, 7
a recent study showed no differences in the two conjugation approaches regarding surface 8
heterogeneity 164. 9
The challenges related to precisely conjugate a ligand on a scaffold have been 10
addressed in a recent review 145. One of the main issues when synthesizing multivalent 11
functional conjugates is the heterogeneity of the end-product which is often a complex 12
mixture of imaging dye, targeting ligand and active compound, all grafted on a polymer 13
scaffold. Grafting of multiple molecules on the scaffold can lead to large numbers of 14
different possible combinations. This was recently elegantly demonstrated in the case of 15
stepwise conjugations of targeting ligand, active molecule and tracking dye to G5 16
PAMAM dendrimers which lead to over 4000 combinations of possible conjugates 145. 17
Surface grafting heterogeneity in Au NPs functionalized with thiolated DNA has been 18
studied by localized surface plasmon resonance. Variations of about 10% in DNA 19
coverage were observed in particle suspensions, a significantly higher dispersity than 20
what was expected from a Poisson distribution (usually used for discrete data 21
distribution). This large variation in surface coverage was attributed to the heterogeneity 22
of particle surface properties resulting from a difference in reaction rates between 23

49
particles 165. Another well studied case in the nanocarrier domain are dendrimer 1
formulations, which are a complex mix of different dendrimer generations, with slightly 2
dispersed arborescent structures, displaying different pharmacokinetics and toxicological 3
properties 166-168. 4
5.2. Innate heterogeneity vs. acquired heterogeneity 5
When introduced in a biological media, nanocarriers experience immediate 6
opsonisation, i.e., adsorption of proteins on their surface. This process has a strong 7
impact on toxicity, immunotoxicity, biodistribution, particle-cell interactions and drug 8
targeting. It is now well accepted that nanocarrier fate largely depends on the amount and 9
type of bound/adsorbed proteins at the surface of the carrier. The quantity and type of the 10
proteins adsorbed on a NP surface depend on a number of factors related to the 11
nanocarriers properties including chemical composition of the surface 12, 169, size 6 and 12
topography of the surface 170, as well as factors related to the protein composition and 13
duration of exposure 171. The formation of the protein corona introduces a new source of 14
heterogeneity that is only partially related to the properties of the pristine NPs. 15
As discussed above, a hydrophilic PEG corona can prevent protein fouling to 16
some extent. But it can also affect protein adsorption kinetics and therefore the time 17
evolution of the corona composition41, 172. On the other hand, PEG surface heterogeneity 18
such as “bald spot” can induce rapid and local protein adsorption on a NP surface, 19
triggering complement and/or immune system recognition cascade6. 20
Opsonisation is a dynamic process as protein adsorption is the result of interplay 21
between protein affinity and relative abundance. Moreover, complex phenomenon such 22
as protein denaturation and cooperative binding can take place. Protein adsorption is 23

50
therefore highly complex and non-linear phenomena which makes prediction of the 1
corona composition extremely difficult. 2
When protein corona is analyzed, one can only report an average protein 3
composition. But this averaged composition do not necessarily reflect the real 4
composition on individual particles, as recently discussed by Forest and Pourchez 146. 5
Different protein distributions for the same average protein composition are 6
schematically illustrated in Figure 11. It can be envisioned that these different 7
distributions can produce very different outcomes regarding toxicity, ligand recognition, 8
biodistribution and drug delivery efficacy. 9
10
Figure 11. Possible scenarios after proteomic analysis of the protein corona of a 11
suspension of 10 NPs with the same average composition. Adapted from 146 with 12
permission. 13
14
51
Precise characterization of the protein corona heterogeneity requires analytical 1
techniques able to quantify the protein corona composition at the single particle level. 2
Some attempt have been reported using differential centrifugal sedimentation, showing 3
that the protein corona composition depends strongly on NP size, with larger particles 4
being more prone to protein adsorption 173. Spatial localization of proteins on NP surface 5
has been characterized using a combination of antibody-labelled gold NPs, differential 6
centrifugal sedimentation and various imaging techniques as well174. The spatial 7
organization of epitope (adsorbed transferrin) at the surface of the NPs was found to be 8
random, consistent with a random protein adsorption for this protein 174. 9
Protein adsorption on mesoporous silica NPs was investigated on individual particle by 10
stochastic optical reconstruction microscopy (STORM) 175. STORM has a spatial 11
resolution in the 20 nm range allowing quantification and visualization of adsorbed 12
proteins. The study showed that protein adsorption was highly heterogeneous inside the 13
same NP suspension and evolved with time. The authors speculated that small differences 14
in surface chemistry were resulting in different protein adsorption pattern amplifying 15
particle diversity and resulting in the coexistence of particles with very different protein 16
layers 175. In spite of these recent advances, at this time the technical challenges related to 17
corona heterogeneity investigation are still ahead of us. 18
19
Conclusions and outlook 20
In this review we intent to raise awareness about the importance of nanomaterial 21
heterogeneity and its so far known consequences, especially in the biomedical field. We 22

52
provide some guidelines to identify and to analyze it, and we explore the possibility of 1
controlling it through experiments aimed at creating heterogeneous systems. 2
It could be understood, in a bioengineering and regulatory perspective, that 3
obtaining homogenous NPs is important to obtain predictable, reproducible and fully 4
functional NP batches. Indeed, variations in key chemical surface properties such as PEG 5
coverage and ligand grafting density are contributing to the reduction of the effective 6
dose of drug nanocarrier with the optimal properties within the same particle suspension. 7
As discussed by Forest and Pourchez in their paper “the myth of the average 8
nanoparticle”, a ligand functionalized PEGylated nanocarrier displaying the average size, 9
ligand and PEG densities may not exist in the actual NP batch as the average values may 10
hide extreme values for each of these parameters 146. A similar issue is arising from 11
synthesis of multivalent functional conjugates, comprising tracking dye, targeting ligand 12
and active grafted on a polymer scaffold 145. 13
Even though nanocarriers heterogeneity is a known problem, it is difficult to 14
tackle as most measurements are still performed on a NPs ensemble, instead of on 15
subpopulations/fractions or individual particles. There is an urgent need to develop 16
methods to study particle sub-population heterogeneity and single particle heterogeneity. 17
It can be expected that present and future developments of combination of analytical 18
techniques and computational modelling of NPs structures could provide with new 19
insights into the heterogeneity phenomena. Lately, strong efforts towards reaching this 20
goal have been made with the development of the “Nanotechnology Characterization 21
Laboratory” in the USA (https://ncl.cancer.gov/) and recently in the EU 22

53
(http://www.euncl.eu/). These laboratories contribute to standardized procedures to fully 1
characterize nanomaterials. 2
On the other hand, heterogeneous (and eventually irregular) surfaces, such as 3
patchy surfaces, may provide unprecedented properties for drug delivery. Heterogeneity 4
can be beneficial if it is implemented in a controlled fashion among the entire NP 5
population. Otherwise, it often results in unpredictable and adverse effects in different 6
applications. The current trend toward biomimetic strategies boosts the interest for 7
nanocarriers with surface heterogeneity. Indeed, biological membranes are complex 8
mixtures of lipids proteins and proteoglycans, forming at the same time a very well 9
structured and heterogeneous interface, which fulfills complex functions. Biomimetic 10
strategies include the addition of a plasmatic membrane on NP surface 176, 177, elaboration 11
of mimetic of lipoprotein 178, or pathogen mimetics amongst other179. 12
In concrete terms, a practical course of action should include a more scrutinized 13
determination of the statistical distribution of data to get an in-depth understanding of the 14
NP batch characteristics. This can be done using existing analytical techniques, using 15
extensive sample fractionation to get information on sampled subpopulations, improving 16
resolution of analytical techniques (such as flow cytometry), combining techniques in 17
order to get better insights into chemical data, and to get simultaneous information on the 18
same NPs. At the same time we ought to be able to make more connections between this 19
newly documented NP heterogeneity and biological outcomes, such as targeting, 20
biodistribution, ability to diffuse in biological media and therapeutic efficacy. 21
22
Conflicts of interest 23

54
The authors declare no conflict of interest 1
2
Acknowledgments 3
JMR gratefully acknowledge postdoctoral funding by NSERC/CRSNG (Government of 4
Canada), XB is grateful for the financial support from the CRC program. CR is grateful 5
for the financial support from the Louise and André Charon Research Chair in Alzheimer 6
disease (INRS, Fondation Universitaire Armand-Frappier), PH and XB acknowledge 7
support from NSERC/CRSNG “Discovery grant program”. 8
9
References 10
11
12
1. J. Fang, H. Nakamura and H. Maeda, Adv Drug Deliv Rev, 2011, 63, 136-151. 13
2. Y. H. Bae and K. Park, Journal of Controlled Release, 2011, 153, 198-205. 14
3. D. J. A. Crommelin and A. T. Florence, International Journal of Pharmaceutics, 15
2013. 16
4. S. Wilhelm, A. J. Tavares, Q. Dai, S. Ohta, J. Audet, H. F. Dvorak and W. C. W. 17
Chan, Nature Reviews Materials, 2016, 1, 16014. 18
5. S. D. Perrault, C. Walkey, T. Jennings, H. C. Fischer and W. C. Chan, Nano Lett, 19
2009, 9, 1909-1915. 20
6. A. Vonarbourg, C. Passirani, P. Saulnier and J. P. Benoit, Biomaterials, 2006, 27, 21
4356-4373. 22
7. M. V. D. Z. Park, A. M. Neigh, J. P. Vermeulen, L. J. J. de la Fonteyne, H. W. 23
Verharen, J. J. Briedé, H. van Loveren and W. H. de Jong, Biomaterials, 2011, 24
32, 9810-9817. 25
8. X.-D. Zhang, D. Wu, X. Shen, P.-X. Liu, N. Yang, B. Zhao, H. Zhang, Y.-M. 26
Sun, L.-A. Zhang and F.-Y. Fan, International Journal of Nanomedicine, 2011, 6, 27
2071-2081. 28
9. I. M. Adjei, C. Peetla and V. Labhasetwar, Nanomedicine, 2013, DOI: 29
10.2217/nnm.13.70, 1-12. 30
10. J. W. Hickey, J. L. Santos, J.-M. Williford and H.-Q. Mao, Journal of Controlled 31
Release, 2015, 219, 536-547. 32
11. J.-B. Coty and C. Vauthier, Journal of Controlled Release, 2018, 275, 254-268. 33

55
12. E. S. Melby, S. E. Lohse, J. E. Park, A. M. Vartanian, R. A. Putans, H. B. Abbott, 1
R. J. Hamers, C. J. Murphy and J. A. Pedersen, ACS Nano, 2017, 11, 5489-5499. 2
13. A. Verma, O. Uzun, Y. Hu, Y. Hu, H.-S. Han, N. Watson, S. Chen, D. J. Irvine 3
and F. Stellacci, Nat. Mater., 2008, 7, 588-595. 4
14. Y. Li, X. Zhang and D. Cao, Soft Matter, 2014, 10, 6844-6856. 5
15. Z. Cheng, A. Al Zaki, J. Z. Hui, V. R. Muzykantov and A. Tsourkas, Science, 6
2012, 338, 903-910. 7
16. L. Shang, K. Nienhaus and G. U. Nienhaus, Journal of Nanobiotechnology, 2014, 8
12, 5-5. 9
17. J. Wang, W. Mao, L. L. Lock, J. Tang, M. Sui, W. Sun, H. Cui, D. Xu and Y. 10
Shen, ACS Nano, 2015, 9, 7195-7206. 11
18. K. G. Reuter, J. L. Perry, D. Kim, J. C. Luft, R. Liu and J. M. DeSimone, Nano 12
Letters, 2015, 15, 6371-6378. 13
19. S. Prabha, W.-Z. Zhou, J. Panyam and V. Labhasetwar, International Journal of 14
Pharmaceutics, 2002, 244, 105-115. 15
20. J. Du and R. K. O'Reilly, Chemical Society Reviews, 2011, 40, 2402-2416. 16
21. S. Ravaine and E. Duguet, Current Opinion in Colloid & Interface Science, 2017, 17
30, 45-53. 18
22. Z. Poon, S. Chen, A. C. Engler, H.-i. Lee, E. Atas, G. von Maltzahn, S. N. Bhatia 19
and P. T. Hammond, Angewandte Chemie International Edition, 2010, 49, 7266-20
7270. 21
23. L. S. Grundy, V. E. Lee, N. Li, C. Sosa, W. D. Mulhearn, R. Liu, R. A. Register, 22
A. Nikoubashman, R. K. Prud’homme, A. Z. Panagiotopoulos and R. D. Priestley, 23
ACS Nano, 2018, 12, 4660-4668. 24
24. W. Shi and D. A. Weitz, Macromolecules, 2017, 50, 7681-7686. 25
25. K. Oglęcka, P. Rangamani, B. Liedberg, R. S. Kraut and A. N. Parikh, eLife, 26
2014, 3, e03695. 27
26. J. Nam, T. K. Vanderlick and P. A. Beales, Soft Matter, 2012, 8, 7982-7988. 28
27. C. LoPresti, M. Massignani, C. Fernyhough, A. Blanazs, A. J. Ryan, J. Madsen, 29
N. J. Warren, S. P. Armes, A. L. Lewis, S. Chirasatitsin, A. J. Engler and G. 30
Battaglia, ACS Nano, 2011, 5, 1775-1784. 31
28. J. D. Robertson, L. Rizzello, M. Avila-Olias, J. Gaitzsch, C. Contini, M. S. 32
Magoń, S. A. Renshaw and G. Battaglia, Scientific Reports, 2016, 6, 27494. 33
29. J. Zhang, Y. Pei, H. Zhang, L. Wang, L. Arrington, Y. Zhang, A. Glass and A. M. 34
Leone, Molecular Pharmaceutics, 2012, 10, 397-405. 35
30. B. W. J. Pirok, N. Abdulhussain, T. Aalbers, B. Wouters, R. A. H. Peters and P. J. 36
Schoenmakers, Analytical Chemistry, 2017, 89, 9167-9174. 37
31. S. K. Sahoo, J. Panyam, S. Prabha and V. Labhasetwar, Journal of Controlled 38
Release, 2002, 82, 105-114. 39
32. L. Araujo, R. Löbenberg and J. Kreuter, Journal of Drug Targeting, 1999, 6, 373-40
385. 41
33. B. Petri, A. Bootz, A. Khalansky, T. Hekmatara, R. Müller, R. Uhl, J. Kreuter and 42
S. Gelperina, Journal of Controlled Release, 2007, 117, 51-58. 43
34. D. Dutta, M. Salifu, R. W. Sirianni and S. E. Stabenfeldt, Journal of Biomedical 44
Materials Research Part A, 2016, 104, 688-696. 45

56
35. W. Chen, A. Palazzo, W. E. Hennink and R. J. Kok, Molecular Pharmaceutics, 1
2017, 14, 459-467. 2
36. M. Abdulkarim, N. Agullo, B. Cattoz, P. Griffiths, A. Bernkop-Schnurch, S. 3
Borros and M. Gumbleton, Eur. J. Pharm. Biopharm., 2015, 97, 230-238. 4
37. Leon D. Li, T. Crouzier, A. Sarkar, L. Dunphy, J. Han and K. Ribbeck, 5
Biophysical Journal, 2013, 105, 1357-1365. 6
38. J.-M. Rabanel, P. Hildgen and X. Banquy, Journal of Controlled Release, 2014, 7
185, 71-87. 8
39. P. G. Degennes, Macromolecules, 1980, 13, 1069-1075. 9
40. S. Alexander, J. Phys. France, 1977, 38, 983-987. 10
41. N. Bertrand, P. Grenier, M. Mahmoudi, E. M. Lima, E. A. Appel, F. Dormont, J.-11
M. Lim, R. Karnik, R. Langer and O. C. Farokhzad, Nature Communications, 12
2017, 8, 777. 13
42. T. Ishida, M. Harada, X. Y. Wang, M. Ichihara, K. Irimura and H. Kiwada, 14
Journal of Controlled Release, 2005, 105, 305-317. 15
43. Q. Xu, L. M. Ensign, N. J. Boylan, A. Schön, X. Gong, J.-C. Yang, N. W. Lamb, 16
S. Cai, T. Yu, E. Freire and J. Hanes, ACS Nano, 2015, 9, 9217-9227. 17
44. S. Zhang, C. Tang and C. Yin, Drug Delivery, 2015, 22, 182-190. 18
45. I. Fukuda, S. Mochizuki and K. Sakurai, Colloids and Surfaces B: Biointerfaces, 19
2016, 146, 642-648. 20
46. S. M. Moghimi, Biochimica et Biophysica Acta (BBA) - Molecular Cell Research, 21
2002, 1590, 131-139. 22
47. J. K. Gbadamosi, A. C. Hunter and S. M. Moghimi, FEBS Letters, 2002, 532, 23
338-344. 24
48. W. T. E. Bosker, P. A. Iakovlev, W. Norde and M. A. Cohen Stuart, Journal of 25
Colloid and Interface Science, 2005, 286, 496-503. 26
49. K. Uchida, H. Otsuka, M. Kaneko, K. Kataoka and Y. Nagasaki, Analytical 27
Chemistry, 2005, 77, 1075-1080. 28
50. K. Uchida, Y. Hoshino, A. Tamura, K. Yoshimoto, S. Kojima, K. Yamashita, I. 29
Yamanaka, H. Otsuka, K. Kataoka and Y. Nagasaki, Biointerphases, 2007, 2, 30
126-130. 31
51. Y. Nagasaki, Polym J, 2011, 43, 949-958. 32
52. Y. Sadzuka, A. Nakade, R. Hirama, A. Miyagishima, Y. Nozawa, S. Hirota and T. 33
Sonobe, International Journal of Pharmaceutics, 2002, 238, 171-180. 34
53. Y. Sadzuka, I. Sugiyama, T. Tsuruda and T. Sonobe, International Journal of 35
Pharmaceutics, 2006, 312, 83-89. 36
54. T. Liu and B. Thierry, Langmuir, 2012, 28, 15634-15642. 37
55. M. Matsumoto, M. Matsusaki and M. Akashi, Macromolecular Bioscience, 2014, 38
14, 142-150. 39
56. R. Weissleder, K. Kelly, E. Y. Sun, T. Shtatland and L. Josephson, Nature 40
Biotechnology, 2005, 23, 1418. 41
57. K. F. Pirollo and E. H. Chang, Trends in Biotechnology, 2008, 26, 552-558. 42
58. S. Hong, P. R. Leroueil, I. J. Majoros, B. G. Orr, J. R. Baker and M. M. Banaszak 43
Holl, Chemistry & Biology, 2007, 14, 107-115. 44
59. A. M. Smith, K. A. Johnston, S. E. Crawford, L. E. Marbella and J. E. Millstone, 45
Analyst, 2017, 142, 11-29. 46

57
60. M. E. Gindy, S. Ji, T. R. Hoye, A. Z. Panagiotopoulos and R. K. Prud’homme, 1
Biomacromolecules, 2008, 9, 2705-2711. 2
61. D. R. Elias, A. Poloukhtine, V. Popik and A. Tsourkas, Nanomedicine: 3
Nanotechnology, Biology and Medicine, 2013, 9, 194-201. 4
62. D. G. Mullen and M. M. Banaszak Holl, Accounts of Chemical Research, 2011, 5
44, 1135-1145. 6
63. D. G. Mullen, M. Fang, A. Desai, J. R. Baker, B. G. Orr and M. M. Banaszak 7
Holl, ACS Nano, 2010, 4, 657-670. 8
64. R. Michel, S. Pasche, M. Textor and D. G. Castner, Langmuir, 2005, 21, 12327-9
12332. 10
65. J. C. Zillies, K. Zwiorek, G. Winter and C. Coester, Analytical Chemistry, 2007, 11
79, 4574-4580. 12
66. S. Sant, S. Poulin and P. Hildgen, J Biomed Mater Res A, 2008, 87A, 885-895. 13
67. S. Essa, J. M. Rabanel and P. Hildgen, International Journal of Pharmaceutics, 14
2010, 388, 263-273. 15
68. F. Bedu-Addo, P. Tang, Y. Xu and L. Huang, Pharm Res, 1996, 13, 710-717. 16
69. J. Y. Lehtonen and P. K. Kinnunen, Biophysical Journal, 1995, 68, 525-535. 17
70. V. Agmo Hernández, G. Karlsson and K. Edwards, Langmuir, 2011, 27, 4873-18
4883. 19
71. X. Xia, M. Yang, Y. Wang, Y. Zheng, Q. Li, J. Chen and Y. Xia, ACS Nano, 20
2011, 6, 512-522. 21
72. W. J. Duncanson, M. A. Figa, K. Hallock, S. Zalipsky, J. A. Hamilton and J. Y. 22
Wong, Biomaterials, 2007, 28, 4991-4999. 23
73. R. Hennig, K. Pollinger, A. Veser, M. Breunig and A. Goepferich, Journal of 24
Controlled Release, 2014, 194, 20-27. 25
74. L. Xu, J. Betker, H. Yin and T. J. Anchordoquy, Journal of Controlled Release, 26
2012, 160, 57-63. 27
75. Z. Cheng, D. R. Elias, N. P. Kamat, E. D. Johnston, A. Poloukhtine, V. Popik, D. 28
A. Hammer and A. Tsourkas, Bioconjugate Chemistry, 2011, 22, 2021-2029. 29
76. T. P. T. Dao, F. Fernandes, M. Er-Rafik, R. Salva, M. Schmutz, A. Brûlet, M. 30
Prieto, O. Sandre and J. F. Le Meins, ACS Macro Letters, 2015, 4, 182-186. 31
77. E. Moradi, D. Vllasaliu, M. Garnett, F. Falcone and S. Stolnik, RSC Advances, 32
2012, 2, 3025-3033. 33
78. A. B. Pawar and I. Kretzschmar, Macromolecular Rapid Communications, 2010, 34
31, 150-168. 35
79. Y. Liu, B. Liu and Z. Nie, Nano Today, 2015, 10, 278-300. 36
80. R. M. Choueiri, E. Galati, H. Thérien-Aubin, A. Klinkova, E. M. Larin, A. 37
Querejeta-Fernández, L. Han, H. L. Xin, O. Gang, E. B. Zhulina, M. Rubinstein 38
and E. Kumacheva, Nature, 2016, 538, 79. 39
81. X. Ye, Z.-W. Li, Z.-Y. Sun and B. Khomami, ACS Nano, 2016, 10, 5199-5203. 40
82. A. H. Gröschel, F. H. Schacher, H. Schmalz, O. V. Borisov, E. B. Zhulina, A. 41
Walther and A. H. E. Müller, Nature Communications, 2012, 3, 710. 42
83. A. H. Gröschel, A. Walther, T. I. Löbling, F. H. Schacher, H. Schmalz and A. H. 43
E. Müller, Nature, 2013, 503, 247. 44
84. T. I. Löbling, O. Borisov, J. S. Haataja, O. Ikkala, A. H. Gröschel and A. H. E. 45
Müller, Nature Communications, 2016, 7, 12097. 46

58
85. M. Massignani, C. LoPresti, A. Blanazs, J. Madsen, S. P. Armes, A. L. Lewis and 1
G. Battaglia, Small, 2009, 5, 2424-2432. 2
86. J. R. Howse, R. A. L. Jones, A. J. Ryan, T. Gough, R. Vafabakhsh and R. 3
Golestanian, Physical Review Letters, 2007, 99, 048102. 4
87. Z. I. Imam, L. E. Kenyon, G. Ashby, F. Nagib, M. Mendicino, C. Zhao, A. K. 5
Gadok and J. C. Stachowiak, Cellular and Molecular Bioengineering, 2017, 10, 6
387-403. 7
88. Y. Yi, L. Sanchez, Y. Gao, K. Lee and Y. Yu, Chemistry of Materials, 2017, 29, 8
1448-1460. 9
89. H. Gao, J. Xiong, T. Cheng, J. Liu, L. Chu, J. Liu, R. Ma and L. Shi, 10
Biomacromolecules, 2013, 14, 460-467. 11
90. M. Penna, K. Ley, S. Maclaughlin and I. Yarovsky, Faraday Discussions, 2016, 12
191, 435-464. 13
91. L. Shen and J. Zhu, Advances in Colloid and Interface Science, 2016, 228, 40-54. 14
92. L.-T.-C. Tran, S. Lesieur and V. Faivre, Expert Opinion on Drug Delivery, 2014, 15
11, 1061-1074. 16
93. M. Wagner, S. Holzschuh, A. Traeger, A. Fahr and U. S. Schubert, Analytical 17
Chemistry, 2014, 86, 5201-5210. 18
94. A. Zattoni, B. Roda, F. Borghi, V. Marassi and P. Reschiglian, Journal of 19
Pharmaceutical and Biomedical Analysis, 2014, 87, 53-61. 20
95. L. F. Pease, D. I. Lipin, D.-H. Tsai, M. R. Zachariah, L. H. L. Lua, M. J. Tarlov 21
and A. P. J. Middelberg, Biotechnology and Bioengineering, 2009, 102, 845-855. 22
96. K. L. Planken and H. Colfen, Nanoscale, 2010, 2, 1849-1869. 23
97. C. Vauthier, C. Schmidt and P. Couvreur, Journal of Nanoparticle Research, 24
1999, 1, 411-418. 25
98. C.-Y. Wen, M. Tang, J. Hu, L.-L. Wu, D.-W. Pang, J.-B. Zeng and X.-Y. Li, 26
Analytical Chemistry, 2016, 88, 10134-10142. 27
99. D. N. Benoit, H. Zhu, M. H. Lilierose, R. A. Verm, N. Ali, A. N. Morrison, J. D. 28
Fortner, C. Avendano and V. L. Colvin, Analytical Chemistry, 2012, 84, 9238-29
9245. 30
100. B. Demeler, T.-L. Nguyen, G. E. Gorbet, V. Schirf, E. H. Brookes, P. Mulvaney, 31
A. a. O. El-Ballouli, J. Pan, O. M. Bakr, A. K. Demeler, B. I. Hernandez Uribe, N. 32
Bhattarai and R. L. Whetten, Analytical Chemistry, 2014, 86, 7688-7695. 33
101. D. Mehn, P. Iavicoli, N. Cabaleiro, S. E. Borgos, F. Caputo, O. Geiss, L. Calzolai, 34
F. Rossi and D. Gilliland, International Journal of Pharmaceutics, 2017, 523, 35
320-326. 36
102. M. Tobio, R. Gref, A. Sanchez, R. Langer and M. J. Alonso, Pharm Res, 1998, 37
15, 270-275. 38
103. J. Larsen, N. S. Hatzakis and D. Stamou, Journal of the American Chemical 39
Society, 2011, 133, 10685-10687. 40
104. T. L. Doane, Y. Cheng, A. Babar, R. J. Hill and C. Burda, J Am Chem Soc, 2010, 41
132, 15624-15631. 42
105. T. J. Daou, L. Li, P. Reiss, V. Josserand and I. Texier, Langmuir, 2009, 25, 3040-43
3044. 44
106. Y. Liu, M. K. Shipton, J. Ryan, E. D. Kaufman, S. Franzen and D. L. Feldheim, 45
Analytical Chemistry, 2007, 79, 2221-2229. 46

59
107. U. Pyell, Electrophoresis, 2010, 31, 814-831. 1
108. K. R. Riley, S. Liu, G. Yu, K. Libby, R. Cubicciotti and C. L. Colyer, Journal of 2
Chromatography A, 2016, 1463, 169-175. 3
109. L. Trapiella-Alfonso, F. d’Orlyé and A. Varenne, Analytical and Bioanalytical 4
Chemistry, 2016, 408, 2669-2675. 5
110. C. F. Duffy, A. A. McEathron and E. A. Arriaga, ELECTROPHORESIS, 2002, 6
23, 2040-2047. 7
111. Y. H. Rezenom, A. D. Wellman, L. Tilstra, C. D. Medley and S. D. Gilman, 8
Analyst, 2007, 132, 1215-1222. 9
112. M. R. Ivanov, H. R. Bednar and A. J. Haes, ACS Nano, 2009, 3, 386-394. 10
113. R. J. Hunter, Colloids and Surfaces A: Physicochemical and Engineering Aspects, 11
2001, 195, 205-214. 12
114. R. W. O'Brien, A. Jones and W. N. Rowlands, Colloids and Surfaces A: 13
Physicochemical and Engineering Aspects, 2003, 218, 89-101. 14
115. V. Adibnia and R. J. Hill, Macromolecules, 2014, 47, 8064-8071. 15
116. D. Kozak, W. Anderson, R. Vogel and M. Trau, Nano Today, 2011, 6, 531-545. 16
117. D. Kozak, W. Anderson, R. Vogel, S. Chen, F. Antaw and M. Trau, ACS Nano, 17
2012, 6, 6990-6997. 18
118. R. Vogel, A. K. Pal, S. Jambhrunkar, P. Patel, S. S. Thakur, E. Reátegui, H. S. 19
Parekh, P. Saá, A. Stassinopoulos and M. F. Broom, Scientific Reports, 2017, 7, 20
17479. 21
119. A. Sikora, A. G. Shard and C. Minelli, Langmuir, 2016, 32, 2216-2224. 22
120. Y. Song, J. Zhang and D. Li, Micromachines, 2017, 8, 204. 23
121. J. A. Somerville, G. R. Willmott, J. Eldridge, M. Griffiths and K. M. McGrath, 24
Journal of Colloid and Interface Science, 2013, 394, 243-251. 25
122. A. Chen, D. Kozak, B. J. Battersby and M. Trau, Biofouling, 2008, 24, 267-273. 26
123. C. Chen, S. Zhu, S. Wang, W. Zhang, Y. Cheng and X. Yan, ACS Applied 27
Materials & Interfaces, 2017, 9, 13913-13919. 28
124. L. Yang, S. Zhu, W. Hang, L. Wu and X. Yan, Analytical Chemistry, 2009, 81, 29
2555-2563. 30
125. G. Marcoux, A.-C. Duchez, N. Cloutier, P. Provost, P. A. Nigrovic and E. 31
Boilard, Scientific Reports, 2016, 6, 35928. 32
126. S. A. Stoner, E. Duggan, D. Condello, A. Guerrero, J. R. Turk, P. K. Narayanan 33
and J. P. Nolan, Cytometry Part A, 2016, 89, 196-206. 34
127. E. J. van der Vlist, E. N. M. Nolte-'t Hoen, W. Stoorvogel, G. J. A. Arkesteijn and 35
M. H. M. Wauben, Nature Protocols, 2012, 7, 1311. 36
128. T. Salafi, K. K. Zeming and Y. Zhang, Lab on a Chip, 2017, 17, 11-33. 37
129. Z. D. Harms, D. G. Haywood, A. R. Kneller, L. Selzer, A. Zlotnick and S. C. 38
Jacobson, Analytical Chemistry, 2015, 87, 699-705. 39
130. R. Friedrich, S. Block, M. Alizadehheidari, S. Heider, J. Fritzsche, E. K. 40
Esbjorner, F. Westerlund and M. Bally, Lab on a Chip, 2017, 17, 830-841. 41
131. C. Salvador-Morales, P. M. Valencia, W. Gao, R. Karnik and O. C. Farokhzad, 42
Small, 2013, 9, 511-517. 43
132. S. Mathiasen, S. M. Christensen, J. J. Fung, S. G. F. Rasmussen, J. F. Fay, S. K. 44
Jorgensen, S. Veshaguri, D. L. Farrens, M. Kiskowski, B. Kobilka and D. 45
Stamou, Nature Methods, 2014, 11, 931. 46

60
133. A.-Y. Jee and M. Lee, Current Applied Physics, 2009, 9, e144-e147. 1
134. R. D. Boyd, S. K. Pichaimuthu and A. Cuenat, Colloids and Surfaces A: 2
Physicochemical and Engineering Aspects, 2011, 387, 35-42. 3
135. C. M. Hoo, N. Starostin, P. West and M. L. Mecartney, Journal of Nanoparticle 4
Research, 2008, 10, 89-96. 5
136. A. K. Gupta and M. Gupta, Biomaterials, 2005, 26, 1565-1573. 6
137. G. Stan, F. W. DelRio, R. I. MacCuspie and R. F. Cook, The Journal of Physical 7
Chemistry B, 2012, 116, 3138-3147. 8
138. I. M. Nnebe and J. W. Schneider, Macromolecules, 2006, 39, 3616-3621. 9
139. K. Huang, A. Anne, M. A. Bahri and C. Demaille, ACS Nano, 2013, 7, 4151-10
4163. 11
140. H. Noothalapati, K. Iwasaki, C. Yoshimoto, K. Yoshikiyo, T. Nishikawa, M. 12
Ando, H.-o. Hamaguchi and T. Yamamoto, Spectrochimica Acta Part A: 13
Molecular and Biomolecular Spectroscopy, 2017, 187, 186-190. 14
141. A. P. H. Gelissen, A. Oppermann, T. Caumanns, P. Hebbeker, S. K. Turnhoff, R. 15
Tiwari, S. Eisold, U. Simon, Y. Lu, J. Mayer, W. Richtering, A. Walther and D. 16
Wöll, Nano Letters, 2016, 16, 7295-7301. 17
142. A. Dazzi and C. B. Prater, Chemical Reviews, 2017, 117, 5146-5173. 18
143. Q. Ong, Z. Luo and F. Stellacci, Accounts of Chemical Research, 2017, 50, 1911-19
1919. 20
144. Catherine Forbes, Merran Evans, Nicholas Hastings and B. Peacock, Statistical 21
Distributions, 4th edition, John Wiley & Sons, Inc., 2010. 22
145. M. A. van Dongen, C. A. Dougherty and M. M. Banaszak Holl, 23
Biomacromolecules, 2014, 15, 3215-3234. 24
146. V. Forest and J. Pourchez, Nano Today, 2016, 11, 700-703. 25
147. Y. Mai and A. Eisenberg, Chemical Society Reviews, 2012, 41, 5969-5985. 26
148. S. Marrache and S. Dhar, Proceedings of the National Academy of Sciences, 27
2012, 109, 16288-16293. 28
149. J. G. J. L. Lebouille, R. Stepanyan, J. J. M. Slot, M. A. Cohen Stuart and R. 29
Tuinier, Colloids and Surfaces A: Physicochemical and Engineering Aspects, 30
2014, 460, 225-235. 31
150. N. A. Lynd, A. J. Meuler and M. A. Hillmyer, Progress in Polymer Science, 32
2008, 33, 875-893. 33
151. K. Matyjaszewski, Science, 2011, 333, 1104-1105. 34
152. F. Bates, Science, 1991, 251, 898-905. 35
153. L. Leibler, Macromolecules, 1980, 13, 1602-1617. 36
154. L. Cademartiri and K. J. M. Bishop, Nat. Mater., 2015, 14, 2-9. 37
155. C. Allen, D. Maysinger and A. Eisenberg, Colloids and Surfaces B: Biointerfaces, 38
1999, 16, 3-27. 39
156. I. R. Epstein, Nature, 1995, 374, 321. 40
157. R. Karnik, F. Gu, P. Basto, C. Cannizzaro, L. Dean, W. Kyei-Manu, R. Langer 41
and O. C. Farokhzad, Nano Letters, 2008, 8, 2906-2912. 42
158. S. P. Kee and A. Gavriilidis, Chem Eng J, 2008, 142, 109-121. 43
159. A. D. Stroock, S. K. W. Dertinger, A. Ajdari, I. Mezić, H. A. Stone and G. M. 44
Whitesides, Science, 2002, 295, 647-651. 45
61
160. S. M. D'addio and R. K. Prud'homme, Advanced drug delivery reviews, 2011, 63, 1
417-426. 2
161. T. R. García, A. G. Ac, A. Lalloz, F.-X. Lacasse, P. Hildgen, J.-M. Rabanel and 3
X. Banquy, Langmuir, 2018, 34, pp 5772–5780. 4
162. C. M. Hui, J. Pietrasik, M. Schmitt, C. Mahoney, J. Choi, M. R. Bockstaller and 5
K. Matyjaszewski, Chemistry of Materials, 2014, 26, 745-762. 6
163. M. Asai, D. Zhao and S. K. Kumar, ACS Nano, 2017, 11, 7028-7035. 7
164. H. Liu, H.-Y. Zhao, F. Müller-Plathe, H.-J. Qian, Z.-Y. Sun and Z.-Y. Lu, 8
Macromolecules, 2018, DOI: 10.1021/acs.macromol.8b00309. 9
165. M. Horáček, R. E. Armstrong and P. Zijlstra, Langmuir, 2018, 34, 131-138. 10
166. M. A. van Dongen, A. Desai, B. G. Orr, J. R. Baker and M. M. Banaszak Holl, 11
Polymer, 2013, 54, 4126-4133. 12
167. I. Elkin, X. Banquy, C. J. Barrett and P. Hildgen, Journal of Controlled Release, 13
2017, 264, 288-305. 14
168. X. Shi, I. J. Majoros, A. K. Patri, X. Bi, M. T. Islam, A. Desai, T. R. Ganser and 15
J. J. R. Baker, Analyst, 2006, 131, 374-381. 16
169. M. Lundqvist, J. Stigler, G. Elia, I. Lynch, T. Cedervall and K. A. Dawson, P Natl 17
Acad Sci USA, 2008, 105, 14265-14270. 18
170. R. X. Huang, R. R. Carney, K. Ikuma, F. Stellacci and B. L. T. Lau, Acs Nano, 19
2014, 8, 5402-5412. 20
171. M. Mahmoudi, N. Bertrand, H. Zope and O. C. Farokhzad, Nano Today, 2016, 11, 21
817-832. 22
172. S. Schöttler, G. Becker, S. Winzen, T. Steinbach, K. Mohr, K. Landfester, V. 23
Mailänder and F. R. Wurm, Nature Nanotechnology, 2016, 11, 372. 24
173. R. Wang, L. Chen, D. Li, R. Liu and G. Ge, Particle & Particle Systems 25
Characterization, 2017, 34, 1770040-n/a. 26
174. P. M. Kelly, C. Åberg, E. Polo, A. O'Connell, J. Cookman, J. Fallon, Ž. Krpetić 27
and K. A. Dawson, Nature Nanotechnology, 2015, 10, 472. 28
175. N. Feiner-Gracia, M. Beck, S. Pujals, S. Tosi, T. Mandal, C. Buske, M. Linden 29
and L. Albertazzi, Small, 2017, 13, 1701631-n/a. 30
176. C.-M. J. Hu, L. Zhang, S. Aryal, C. Cheung, R. H. Fang and L. Zhang, 31
Proceedings of the National Academy of Sciences, 2011, 108, 10980-10985. 32
177. B. T. Luk and L. Zhang, Journal of Controlled Release, 2015, 220, 600-607. 33
178. Q. Song, M. Huang, L. Yao, X. Wang, X. Gu, J. Chen, J. Chen, J. Huang, Q. Hu, 34
T. Kang, Z. Rong, H. Qi, G. Zheng, H. Chen and X. Gao, ACS Nano, 2014, 8, 35
2345-2359. 36
179. J.-W. Yoo, D. J. Irvine, D. E. Discher and S. Mitragotri, Nature Reviews Drug 37
Discovery, 2011, 10, 521. 38
39