nanobret™ te intracellular e3 ligase assays, crbn and …
TRANSCRIPT
10/20 TM626
T E C H N I C A L M A N U A L
NanoBRET™ TE Intracellular E3 Ligase Assays, CRBN and VHLInstructions for Use of Products N2910, N2911, N2912, N2930, N2931 and N2932
Promega Corporation · 2800 Woods Hollow Road · Madison, WI 53711-5399 USA · Toll Free in USA 800-356-9526 · 608-274-4330 · Fax 608-277-2516 1www.promega.com TM626 · 10/20
1. Description .........................................................................................................................................2
2. Product Components and Storage Conditions .......................................................................................6
3. Before You Begin .................................................................................................................................83.A. Preparing NanoBRET™ Expression Vectors ..................................................................................83.B. Instrument Requirements and Setup ............................................................................................8
4. Overview of NanoBRET™ TE Intracellular E3 Ligase Assay Modes and Materials .................................. 104.A. Materials to be Supplied by the User .......................................................................................... 104.B. Transient Transfection of HEK293 Cells with E3 Ligase-NanoLuc® Fusion Vectors ........................ 10
5. Live-Cell Mode Protocol .................................................................................................................... 115.A. Preparing Complete 20X NanoBRET™ Tracer Reagent ................................................................ 135.B. Preparing Test Compounds or PROTACs .................................................................................... 145.C. Preparing Transfected Cells and Adding Tracer and Test Compound ............................................. 145.D. NanoBRET™ Assay Protocol ..................................................................................................... 155.E. Determining BRET Ratio ........................................................................................................... 165.F. BRET Data for CRBN and VHL Assays ........................................................................................ 17
6. Permeabilized-Cell Mode Protocol ...................................................................................................... 186.A. Preparing Complete 20X NanoBRET™ Tracer Reagent ................................................................ 206.B. Preparing Test Compounds or PROTACs .................................................................................... 216.C. Preparing 10X Digitonin Solution ............................................................................................. 216.D. Preparing Transfected Cells and Adding Tracer and Test Compound ............................................ 216.E. NanoBRET™ Assay Protocol ..................................................................................................... 226.F. Determining BRET Ratio ........................................................................................................... 236.G. BRET Data for CRBN and VHL Assays ........................................................................................ 24
7. Assessing PROTAC Intracellular Availability ....................................................................................... 26
8. Troubleshooting................................................................................................................................ 29
All technical literature is available at: www.promega.com/protocols/ Visit the web site to verify that you are using the most current version of this Technical Manual.
E-mail Promega Technical Services if you have questions on use of this system: [email protected]
NanoBRET™ TE Intracellular E3 Ligase Assays, CRBN and VHL
2 Promega Corporation · 2800 Woods Hollow Road · Madison, WI 53711-5399 USA · Toll Free in USA 800-356-9526 · 608-274-4330 · Fax 608-277-2516TM626 · 10/20 www.promega.com
9. Appendix .......................................................................................................................................... 329.A. Impact of Incubation Time on the Permeabilized-Cell Mode Assays .............................................. 329.B. Effect of DDB1 Co-Expression on the CRBN Assay ....................................................................... 349.C. Achieving Adequate Plate Mixing for 96-Well and 384-Well Formats ............................................ 359.D. Achieving Quantitative Analysis of Test Compound and PROTAC Affinity ...................................... 359.E. Preparing Stable Cell Lines Expressing NanoLuc® Fusion Proteins ............................................... 389.F. Extinction Coefficient of NanoBRET™ TE Tracers ....................................................................... 389.G. NanoBRET™ Donor and Acceptor Emission Spectra ................................................................... 389.H. References ............................................................................................................................... 399.I. Related Products ...................................................................................................................... 40
1. Description
The NanoBRET™ Target Engagement (TE) Assay measures compound binding at select target proteins within intact cells (1). The NanoBRET™ TE Assay has been applied successfully to study multiple target classes (2). Here we describe the NanoBRET™ TE Intracellular E3 Ligase Assay(a-h), which measures compound binding to an E3 ubiquitin ligase protein, such as cereblon (CRBN) or von Hippel-Lindau disease tumor suppressor (VHL), fused to NanoLuc® luciferase. Specifically, the NanoBRET™ TE E3 Ligase Assay measures compound and/or proteolysis-targeting chimera (PROTAC) binding in live cells, where cellular factors such as the plasma membrane can impact binding potency. PROTACs are heterobifunctional degraders composed of a target protein and E3 ligase binding moieties, connected via a chemical linker. PROTACs can have high molecular weights and suffer from poor cell permeability. To determine the permeability of novel PROTACs in a simple work flow, NanoBRET™ TE Assays can be performed in permeabilized cells to assess compound binding to the E3 ligase in the absence of the cell membrane, which can be particularly important for understanding PROTAC permeability.
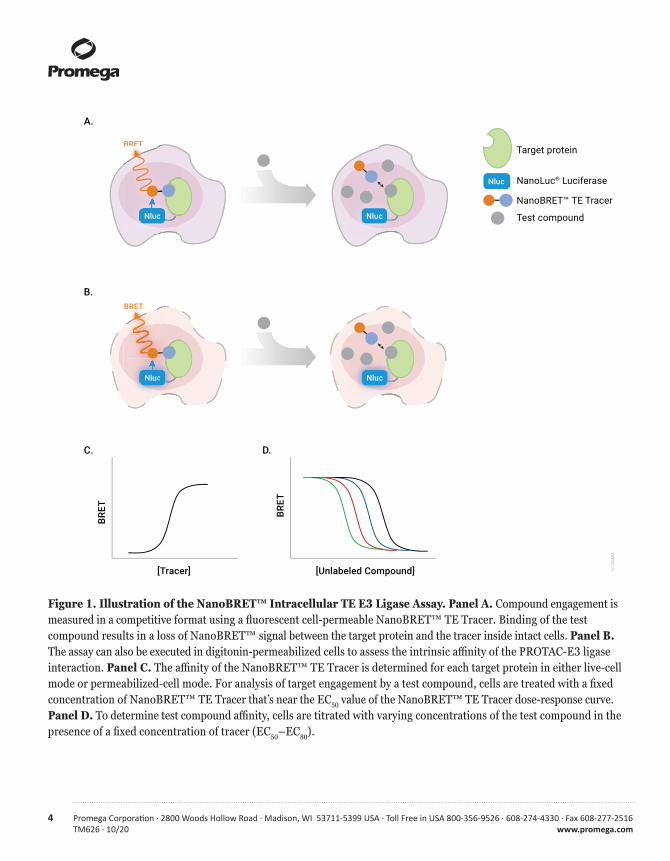
This technical manual provides two assay modes, live-cell and permeabilized-cell, for the study of PROTAC target engagement to the VHL or CRBN E3 ligases (Figure 1). The live-cell assay enables measurement of intracellular PROTAC affinity for CRBN or VHL in live, intact cells. Specifically, the live-cell version of the NanoBRET™ TE Assay (Figure 1, Panel A) uses four key components: 1) an expressed cellular target protein (CRBN or VHL) fused to the bright NanoLuc® luciferase; 2) a cell-permeable fluorescent NanoBRET™ TE Tracer that specifically binds to the target protein (CRBN or VHL); 3) a substrate for NanoLuc® luciferase; and 4) an extracellular inhibitor for NanoLuc® luciferase.
Promega Corporation · 2800 Woods Hollow Road · Madison, WI 53711-5399 USA · Toll Free in USA 800-356-9526 · 608-274-4330 · Fax 608-277-2516 3www.promega.com TM626 · 10/20
Bioluminescence resonance energy transfer (BRET) is achieved through a transfer of the luminescent energy from NanoLuc® luciferase to the fluorescent tracer that is bound to the target protein-NanoLuc® fusion (Figure 1, Panels A and C). Compounds that are applied to the cells and specifically engage the intracellular target protein-NanoLuc® fusion will result in a dose-dependent decrease in BRET (Figure 1, Panels A and D) by competition with a fixed concentration of NanoBRET™ TE Tracer. For live-cell TE measurements (Figure 1, Panel A), an extracel-lular NanoLuc® inhibitor is used to mitigate any NanoLuc® signal that may arise from cells compromised during handling, while not adversely affecting NanoLuc® luciferase expressed within healthy living cells.
In the permeabilized-cell assay (Figure 1, Panel B), the intrinsic binding affinity of PROTACs for CRBN or VHL in the absence of the cell membrane can be determined. For TE measurements in permeabilized cells, the assay is similar to that described for the live-cell assay, except that the NanoLuc® inhibitor is omitted and digitonin (a gentle detergent that interacts with membrane cholesterol) is added to permeabilize the cell membrane. This makes the compound or PROTAC available to the target and assesses the intrinsic affinity of the ligand for the target.
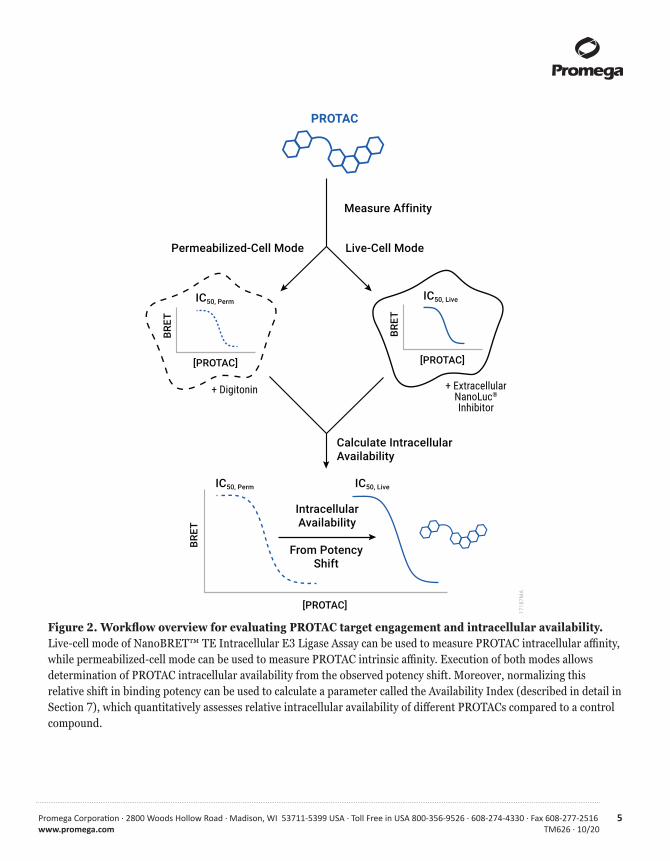
As PROTACs are typically high in molecular weight and can suffer from poor cell permeability or intracellular availabil-ity, optimizing PROTACs for permeability may be critical in designing PROTACs with good degradation capacity. Thus, determining PROTAC permeability or cellular availability independently is desirable from a mechanistic standpoint. To date, methods to directly determine the permeability for an unmodified PROTAC are generally limited to artificial systems such as parallel artificial membrane permeability assay (PAMPA) and Caco-2 platforms, which can be limiting due to the low apparent permeability of many PROTACs (often below the limit of detection for these assays). To help address this need to determine permeability, the relative intracellular availability of PROTACs can be assessed by comparing live-cell versus permeabilized-cell potency values using the NanoBRET™ TE E3 Ligase Assay. Figure 2 provides an overview for determining the intracellular availability of the PROTAC, which is evident from the relative change in binding potency in live cells versus permeabilized cells. Moreover, normalizing this relative change in binding potency can be used to calculate a parameter called the Availability Index (see Section 7 for details), which quantitatively assesses relative intracellular availability of different PROTACs compared to a control compound.
4 Promega Corporation · 2800 Woods Hollow Road · Madison, WI 53711-5399 USA · Toll Free in USA 800-356-9526 · 608-274-4330 · Fax 608-277-2516TM626 · 10/20 www.promega.com
Figure 1. Illustration of the NanoBRET™ Intracellular TE E3 Ligase Assay. Panel A. Compound engagement is measured in a competitive format using a fluorescent cell-permeable NanoBRET™ TE Tracer. Binding of the test compound results in a loss of NanoBRET™ signal between the target protein and the tracer inside intact cells. Panel B. The assay can also be executed in digitonin-permeabilized cells to assess the intrinsic affinity of the PROTAC-E3 ligase interaction. Panel C. The affinity of the NanoBRET™ TE Tracer is determined for each target protein in either live-cell mode or permeabilized-cell mode. For analysis of target engagement by a test compound, cells are treated with a fixed concentration of NanoBRET™ TE Tracer that’s near the EC50 value of the NanoBRET™ TE Tracer dose-response curve. Panel D. To determine test compound affinity, cells are titrated with varying concentrations of the test compound in the presence of a fixed concentration of tracer (EC50–EC80).
1718
6MA
BRET
A.
C. D.
[Tracer] [Unlabeled Compound]
BRET BR
ET
NlucNluc
Nluc
Nluc
NanoLuc® Luciferase
NanoBRET™ TE Tracer
Target protein
Test compound
BRET
B.
Nluc
BRET
NlucNluc
BRET
Promega Corporation · 2800 Woods Hollow Road · Madison, WI 53711-5399 USA · Toll Free in USA 800-356-9526 · 608-274-4330 · Fax 608-277-2516 5www.promega.com TM626 · 10/20
Figure 2. Workflow overview for evaluating PROTAC target engagement and intracellular availability. Live-cell mode of NanoBRET™ TE Intracellular E3 Ligase Assay can be used to measure PROTAC intracellular affinity, while permeabilized-cell mode can be used to measure PROTAC intrinsic affinity. Execution of both modes allows determination of PROTAC intracellular availability from the observed potency shift. Moreover, normalizing this relative shift in binding potency can be used to calculate a parameter called the Availability Index (described in detail in Section 7), which quantitatively assesses relative intracellular availability of different PROTACs compared to a control compound.
Measure Affinity
Calculate Intracellular Availability
Live-Cell ModePermeabilized-Cell Mode
+ ExtracellularNanoLuc®
Inhibitor+ Digitonin
PROTAC
BRET
[PROTAC]
IC50, Live
BRET
[PROTAC]
IC50, Perm
BRET
[PROTAC]
IC50, Perm IC50, Live
IntracellularAvailability
From PotencyShift
1718
7MA
6 Promega Corporation · 2800 Woods Hollow Road · Madison, WI 53711-5399 USA · Toll Free in USA 800-356-9526 · 608-274-4330 · Fax 608-277-2516TM626 · 10/20 www.promega.com
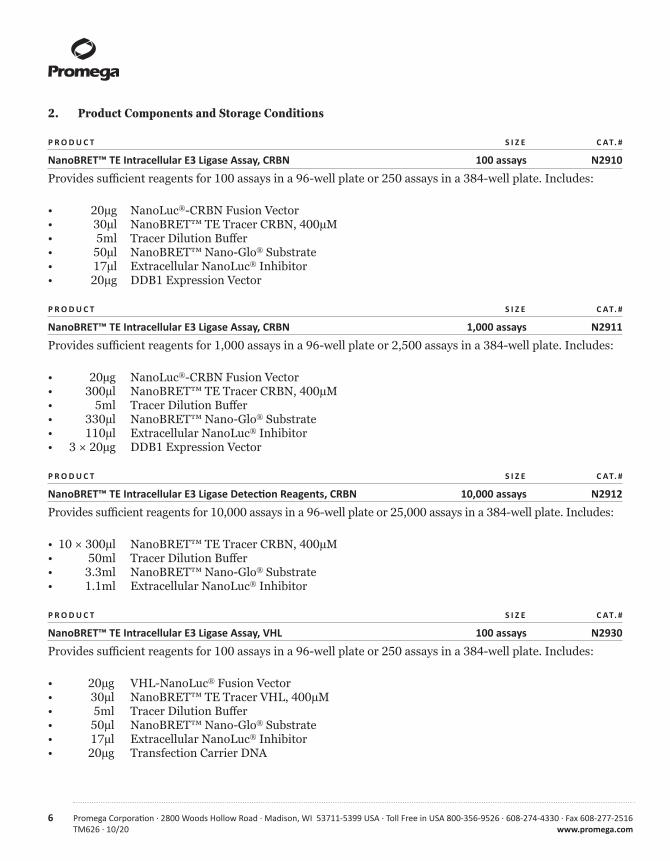
2. Product Components and Storage Conditions
P R O D U C T S I Z E C AT. #
NanoBRET™ TE Intracellular E3 Ligase Assay, CRBN 100 assays N2910
Provides sufficient reagents for 100 assays in a 96-well plate or 250 assays in a 384-well plate. Includes:
• 20µg NanoLuc®-CRBN Fusion Vector• 30µl NanoBRET™ TE Tracer CRBN, 400µM• 5ml Tracer Dilution Buffer• 50µl NanoBRET™ Nano-Glo® Substrate• 17µl Extracellular NanoLuc® Inhibitor• 20µg DDB1 Expression Vector
P R O D U C T S I Z E C AT. #
NanoBRET™ TE Intracellular E3 Ligase Assay, CRBN 1,000 assays N2911
Provides sufficient reagents for 1,000 assays in a 96-well plate or 2,500 assays in a 384-well plate. Includes:
• 20µg NanoLuc®-CRBN Fusion Vector• 300µl NanoBRET™ TE Tracer CRBN, 400µM• 5ml Tracer Dilution Buffer• 330µl NanoBRET™ Nano-Glo® Substrate• 110µl Extracellular NanoLuc® Inhibitor• 3 × 20µg DDB1 Expression Vector
P R O D U C T S I Z E C AT. #
NanoBRET™ TE Intracellular E3 Ligase Detection Reagents, CRBN 10,000 assays N2912
Provides sufficient reagents for 10,000 assays in a 96-well plate or 25,000 assays in a 384-well plate. Includes:
• 10 × 300µl NanoBRET™ TE Tracer CRBN, 400µM• 50ml Tracer Dilution Buffer• 3.3ml NanoBRET™ Nano-Glo® Substrate• 1.1ml Extracellular NanoLuc® Inhibitor
P R O D U C T S I Z E C AT. #
NanoBRET™ TE Intracellular E3 Ligase Assay, VHL 100 assays N2930
Provides sufficient reagents for 100 assays in a 96-well plate or 250 assays in a 384-well plate. Includes:
• 20µg VHL-NanoLuc® Fusion Vector• 30µl NanoBRET™ TE Tracer VHL, 400µM• 5ml Tracer Dilution Buffer• 50µl NanoBRET™ Nano-Glo® Substrate• 17µl Extracellular NanoLuc® Inhibitor• 20µg Transfection Carrier DNA

Promega Corporation · 2800 Woods Hollow Road · Madison, WI 53711-5399 USA · Toll Free in USA 800-356-9526 · 608-274-4330 · Fax 608-277-2516 7www.promega.com TM626 · 10/20
P R O D U C T S I Z E C AT. #
NanoBRET™ TE Intracellular E3 Ligase Assay, VHL 1,000 assays N2931
Provides sufficient reagents for 1,000 assays in a 96-well plate or 2,500 assays in a 384-well plate. Includes: • 20µg VHL-NanoLuc® Fusion Vector• 300µl NanoBRET™ TE Tracer VHL, 400µM• 5ml Tracer Dilution Buffer• 330µl NanoBRET™ Nano-Glo® Substrate• 110µl Extracellular NanoLuc® Inhibitor• 100µg Transfection Carrier DNA
P R O D U C T S I Z E C AT. #
NanoBRET™ TE Intracellular E3 Ligase Detection Reagents, VHL 10,000 assays N2932
Provides sufficient reagents for 10,000 assays in a 96-well plate or 25,000 assays in a 384-well plate. Includes: • 10 × 300µl NanoBRET™ TE Tracer VHL, 400µM• 50ml Tracer Dilution Buffer• 3.3ml NanoBRET™ Nano-Glo® Substrate• 1.1ml Extracellular NanoLuc® Inhibitor
Storage Conditions: Store all NanoBRET™ TE Intracellular E3 Ligase Assay components below −65°C. Alternatively, store the NanoBRET™ TE tracers below −65°C and all other components at –30°C to −10°C. Avoid multiple freeze-thaw cycles of the vector. We recommend aliquoting NanoBRET™ TE Tracer components and avoiding more than 5 freeze-thaw cycles. Store all NanoBRET™ TE Tracers, NanoBRET™ Nano-Glo® Substrate and Extracellular NanoLuc® Inhibitor protected from light.
Available Separately
Vectors
P R O D U C T S I Z E C AT. #
NanoLuc®-CRBN Fusion Vector 20µg N2741
VHL-NanoLuc® Fusion Vector 20µg N2751
DDB1 Expression Vector 3 × 20µg N2761
NanoBRET™ Substrate/Inhibitor Reagents
P R O D U C T S I Z E C AT. #
Intracellular TE Nano-Glo® Substrate/Inhibitor 100 assays N2162
1,000 assays N2160
10,000 assays N2161
8 Promega Corporation · 2800 Woods Hollow Road · Madison, WI 53711-5399 USA · Toll Free in USA 800-356-9526 · 608-274-4330 · Fax 608-277-2516TM626 · 10/20 www.promega.com
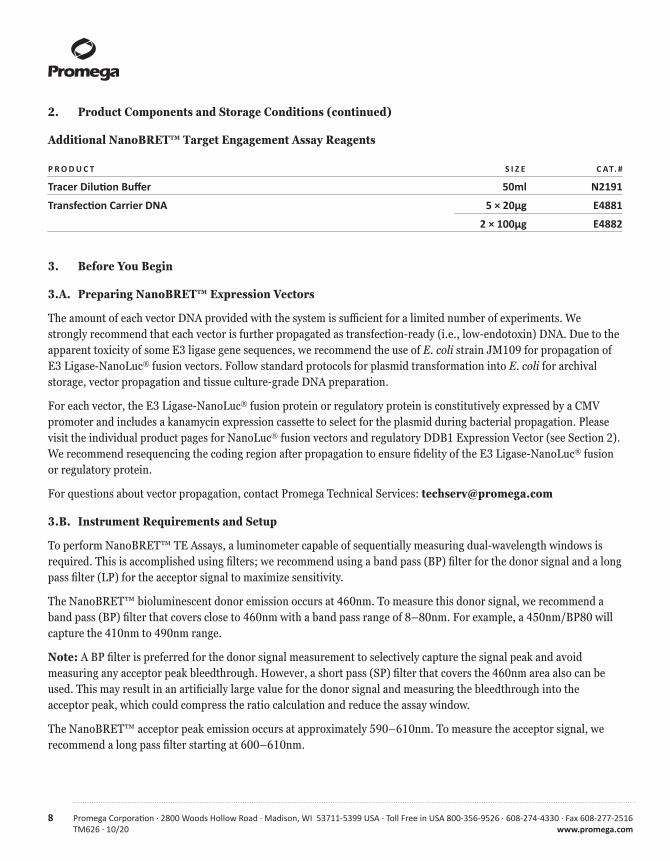
2. Product Components and Storage Conditions (continued)
Additional NanoBRET™ Target Engagement Assay Reagents
P R O D U C T S I Z E C AT. #
Tracer Dilution Buffer 50ml N2191
Transfection Carrier DNA 5 × 20µg E4881
2 × 100µg E4882
3. Before You Begin
3.A. Preparing NanoBRET™ Expression Vectors
The amount of each vector DNA provided with the system is sufficient for a limited number of experiments. We strongly recommend that each vector is further propagated as transfection-ready (i.e., low-endotoxin) DNA. Due to the apparent toxicity of some E3 ligase gene sequences, we recommend the use of E. coli strain JM109 for propagation of E3 Ligase-NanoLuc® fusion vectors. Follow standard protocols for plasmid transformation into E. coli for archival storage, vector propagation and tissue culture-grade DNA preparation.
For each vector, the E3 Ligase-NanoLuc® fusion protein or regulatory protein is constitutively expressed by a CMV promoter and includes a kanamycin expression cassette to select for the plasmid during bacterial propagation. Please visit the individual product pages for NanoLuc® fusion vectors and regulatory DDB1 Expression Vector (see Section 2). We recommend resequencing the coding region after propagation to ensure fidelity of the E3 Ligase-NanoLuc® fusion or regulatory protein.
For questions about vector propagation, contact Promega Technical Services: [email protected]
3.B. Instrument Requirements and Setup
To perform NanoBRET™ TE Assays, a luminometer capable of sequentially measuring dual-wavelength windows is required. This is accomplished using filters; we recommend using a band pass (BP) filter for the donor signal and a long pass filter (LP) for the acceptor signal to maximize sensitivity.
The NanoBRET™ bioluminescent donor emission occurs at 460nm. To measure this donor signal, we recommend a band pass (BP) filter that covers close to 460nm with a band pass range of 8–80nm. For example, a 450nm/BP80 will capture the 410nm to 490nm range.
Note: A BP filter is preferred for the donor signal measurement to selectively capture the signal peak and avoid measuring any acceptor peak bleedthrough. However, a short pass (SP) filter that covers the 460nm area also can be used. This may result in an artificially large value for the donor signal and measuring the bleedthrough into the acceptor peak, which could compress the ratio calculation and reduce the assay window.
The NanoBRET™ acceptor peak emission occurs at approximately 590–610nm. To measure the acceptor signal, we recommend a long pass filter starting at 600–610nm.
Promega Corporation · 2800 Woods Hollow Road · Madison, WI 53711-5399 USA · Toll Free in USA 800-356-9526 · 608-274-4330 · Fax 608-277-2516 9www.promega.com TM626 · 10/20
Instruments capable of dual-luminescence measurements are either equipped with a filter selection or the filters can be purchased and added separately. For instruments using mirrors, select a luminescence mirror or dichroic mirror. An integration time of 0.2–1 second is typically sufficient. Ensure that the gain on the photomultiplier tube (PMT) is optimized to capture the highest donor signal without reaching instrument saturation.
Consult with your instrument manufacturer to determine if the proper filters are installed or for the steps needed to add filters to the luminometer. For example, a special holder or cube might be required for the filters to be mounted, and the shape and thickness may vary among instruments. We have experience with the following instruments and configurations:
• The GloMax® Discover System (Cat.# GM3000) with preloaded filters for donor 450nm/8nm BP and acceptor 600nm LP. Select the preloaded BRET:NanoBRET™ 618 protocol from the Protocol menu.
• BMG Labtech CLARIOstar® with preloaded filters for donor 450nm/80nm BP and acceptor 610nm LP.
• Thermo Varioskan® with filters obtained from Edmunds Optics, using donor 450nm CWL, 25mm diameter, 80nm FWHM, interference filter and acceptor 1 inch diameter, RG-610 long pass filter.
Another instrument capable of measuring dual luminescence is the PerkinElmer EnVision® Multilabel Reader. To use the EnVision® for NanoBRET™ Assays, Perkin Elmer supplies the following optics:
• EnVision Optimized Label-NanoBRET (PE Cat.# 2100-8530). It includes: dichroic mirror, 585nm (Cat.# 2100-4380); filter, 460/80nm (Cat.# 2100-5950); and filter 647/75nm (Cat.# 2100-5970).
10 Promega Corporation · 2800 Woods Hollow Road · Madison, WI 53711-5399 USA · Toll Free in USA 800-356-9526 · 608-274-4330 · Fax 608-277-2516TM626 · 10/20 www.promega.com
4. Overview of NanoBRET™ TE Intracellular E3 Ligase Assay Modes and Materials
The NanoBRET™ TE Intracellular Assay can be performed in both a live-cell or permeabilized-cell mode (Figures 1 and 2), using specific NanoBRET™ TE Tracer concentrations that have been optimized for either mode. The live-cell mode can be used to determine the intracellular affinity of a ligand for the E3 ligase, and the permeabilized-cell mode used to determine the intrinsic affinity of the ligand for the E3 ligase in the absence of the cell membrane. In addition, these two measurements can be combined to query the ligand intracellular availability. In general, similar reagents are used for each assay mode (with a few key exceptions) and the same transfection protocol is followed in both cases. Section 4.A lists the required reagents. Section 4.B details the transfection protocol. Section 5 describes the protocol for the live-cell assay mode and recommended tracer concentrations. Section 6 contains the protocol for permeabilized-cell assay mode and recommended tracer concentrations. Section 7 describes how measurements obtained from live-cell and permeabilized-cell modes can be combined to assess the relative intracellular availability of the ligand of interest.
4.A. Materials to be Supplied by the User• Dulbecco’s Modified Eagle Medium (DMEM; Thermo Fisher Cat.# 11995-065)• fetal bovine serum (HyClone Cat.# SH30070.03, Seradigm Cat.# 1500-050)• Opti-MEM® I Reduced Serum Medium, without phenol red (Thermo Fisher Cat.# 11058-021)• white, nonbinding surface (NBS) 96-well plates (Corning® Cat.# 3600) or 384-well plates (Corning® Cat.# 3574).
(Note: the NanoBRET™ VHL and CRBN Assays must be performed in this nonbinding surface plate. They do not work effectively in other plate types, such as tissue culture-treated plates).
• tissue-culture equipment and reagents• polypropylene plasticware (Note: Do not use polystyrene plasticware for this assay.)• 0.05% Trypsin/EDTA (Thermo Fisher Cat.# 25300)• FuGENE® HD Transfection Reagent (Cat.# E2311)• DMSO (Sigma Cat.# 2650)• Digitonin (Cat.# G9441, 20mg/ml in DMSO; Sigma Cat.# D141 prepared at 50mg/ml in DMSO; Note: Only
needed for permeabilized mode).• detection instrument capable of measuring NanoBRET™ wavelengths (e.g., GloMax® Discover System, Cat.# GM3000)
4.B. Transient Transfection of HEK293 Cells with E3 Ligase-NanoLuc® Fusion Vectors
This protocol has been optimized for HEK293 cells and can be used with live-cell and permeabilized-cell assays. If other cell types are used, optimize the transfection conditions and revalidate the assay to determine an appropriate concentration of NanoBRET™ TE tracer (4). For optimal performance, use cells that have been freshly passaged, ideally within 1–2 days.
1. Cultivate HEK293 cells (or desired cell type) appropriately prior to assay.
2. Remove medium from cell flask by aspiration, trypsinize and allow cells to dissociate from the flask.
3. Neutralize trypsin using cell culture medium (90% DMEM, 10% fetal bovine serum) and centrifuge at 200 × g for 5 minutes to pellet the cells.
4. Aspirate medium and resuspend cells in cell culture medium.
5. Adjust density to 2 × 10⁵ cells/ml using cell culture medium.
Promega Corporation · 2800 Woods Hollow Road · Madison, WI 53711-5399 USA · Toll Free in USA 800-356-9526 · 608-274-4330 · Fax 608-277-2516 11www.promega.com TM626 · 10/20
6. If HEK293 cells are used, prepare lipid:DNA complexes as follows:
a. Prepare a 10µg/ml solution of DNA in Opti-MEM® I reduced serum medium without phenol red, by serially diluting the NanoLuc® fusion vector with Transfection Carrier DNA (1µg/µl) or appropriate Expression Vector to maintain the same amount of DNA if needed. The solution should consist of the following for each target:
• For CRBN: 9.0µg/ml of DDB1 Expression Vector, 1.0µg/ml of NanoLuc®-CRBN Fusion Vector and 1ml of Opti-MEM® I reduced serum medium without phenol red.
Note: The DDB1 partner protein is co-expressed along with CRBN to improve assay performance and assay stability. DDB1 Expression Vector replaces Transfection Carrier DNA in the CRBN assay. See Section 9.B for more details.
• For VHL: 9.0µg/ml of Transfection Carrier DNA, 1.0µg/ml of VHL-NanoLuc® Fusion Vector and 1ml of Opti-MEM® I reduced serum medium without phenol red.
b. Mix thoroughly.
c. Add 30µl of FuGENE® HD Transfection Reagent into each milliliter of DNA mixture to form a lipid:DNA complex. Ensure that the FuGENE® HD Transfection Reagent does not touch the plastic side of the tube; pipet directly into the liquid in the tube.
d. Mix by inversion 5–10 times.
e. Incubate at ambient temperature for 20 minutes to allow complexes to form.
7. In a sterile conical tube, mix 1 part of the lipid:DNA complex (e.g., 1ml) with 20 parts of HEK293 cells (e.g., 20ml) in suspension at 2 × 10⁵ cells/ml. Mix gently by inversion 5 times.
Note: Larger or smaller bulk transfections should be scaled accordingly, using this 20:1 cells to lipid:DNA complex ratio.
8. Dispense cells + lipid:DNA complex into a sterile tissue culture flask and incubate 20–30 hours in a 37°C, 5% CO2 incubator. We recommend a cell density of approximately 55,000–80,000 cells/cm2 during transfection. For example, use approximately 4–6 × 10⁶ cells for a T75 flask.
For assays in live-cell mode, continue to Section 5. For assays in permeabilized-cell mode, continue to Section 6.
5. Live-Cell Mode Protocol
The live-cell mode of NanoBRET™ TE E3 Ligase Assays is used to determine the intracellular affinity for PROTACs and other ligands that bind to CRBN or VHL E3 ligases (Figure 3). Use this protocol on its own, or as a part of the overall workflow to evaluate PROTAC intracellular availability (see Section 7). The volumes specified for the NanoBRET™ Target Engagement Protocol are for 96-well plates. Table 1 lists the assay volumes used for both 96- and 384-well plates for the live-cell mode. Modify the reagent volumes in Sections 5.A–D as listed in Table 1 if 384-well plates are used.
12 Promega Corporation · 2800 Woods Hollow Road · Madison, WI 53711-5399 USA · Toll Free in USA 800-356-9526 · 608-274-4330 · Fax 608-277-2516TM626 · 10/20 www.promega.com
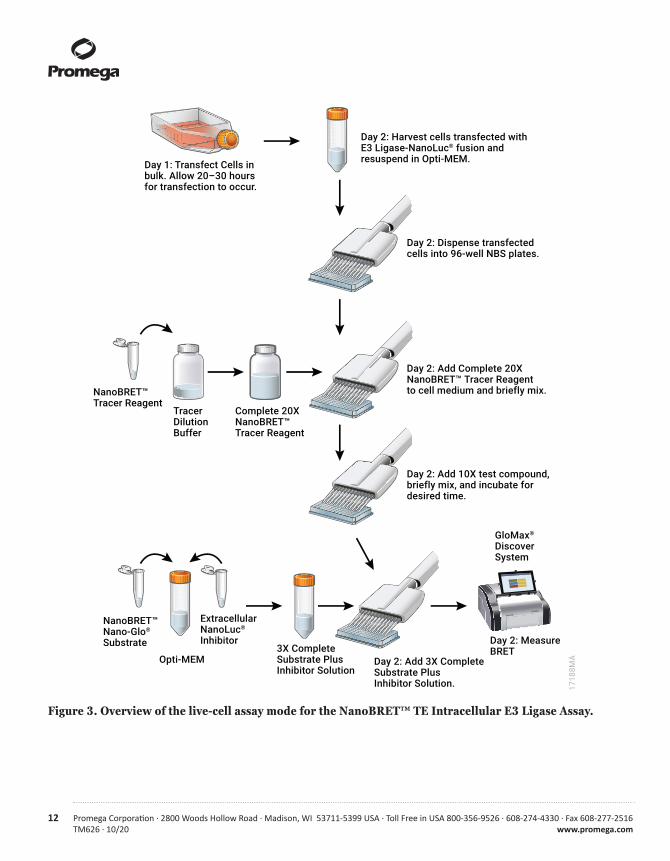
Figure 3. Overview of the live-cell assay mode for the NanoBRET™ TE Intracellular E3 Ligase Assay.
Day 1: Transfect Cells in bulk. Allow 20–30 hours for transfection to occur.
Day 2: Harvest cells transfected with E3 Ligase-NanoLuc® fusion and resuspend in Opti-MEM.
Day 2: Dispense transfected cells into 96-well NBS plates.
Day 2: Add Complete 20X NanoBRET™ Tracer Reagent to cell medium and briefly mix.
Day 2: Add 10X test compound, briefly mix, and incubate for desired time.
NanoBRET™ Tracer Reagent
TracerDilutionBuffer
Complete 20XNanoBRET™ Tracer Reagent
NanoBRET™Nano-Glo®
Substrate
Opti-MEM
ExtracellularNanoLuc®
Inhibitor3X CompleteSubstrate PlusInhibitor Solution
Day 2: Add 3X CompleteSubstrate PlusInhibitor Solution.
GloMax®
DiscoverSystem
Day 2: Measure BRET
1718
8MA
Promega Corporation · 2800 Woods Hollow Road · Madison, WI 53711-5399 USA · Toll Free in USA 800-356-9526 · 608-274-4330 · Fax 608-277-2516 13www.promega.com TM626 · 10/20
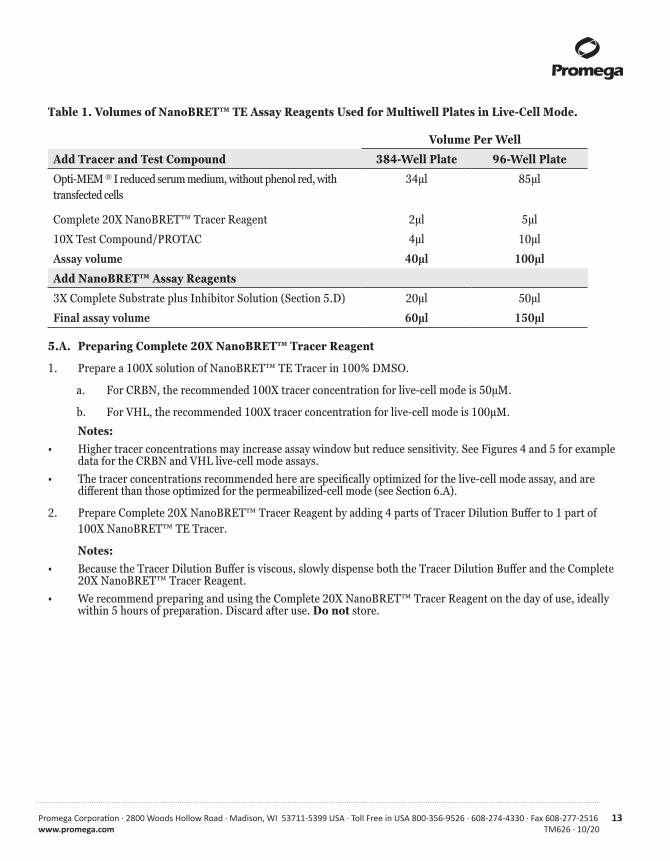
Table 1. Volumes of NanoBRET™ TE Assay Reagents Used for Multiwell Plates in Live-Cell Mode.
Volume Per Well
Add Tracer and Test Compound 384-Well Plate 96-Well Plate
Opti-MEM ® I reduced serum medium, without phenol red, with transfected cells
34µl 85µl
Complete 20X NanoBRET™ Tracer Reagent 2µl 5µl
10X Test Compound/PROTAC 4µl 10µl
Assay volume 40µl 100µl
Add NanoBRET™ Assay Reagents
3X Complete Substrate plus Inhibitor Solution (Section 5.D) 20µl 50µl
Final assay volume 60µl 150µl
5.A. Preparing Complete 20X NanoBRET™ Tracer Reagent
1. Prepare a 100X solution of NanoBRET™ TE Tracer in 100% DMSO.
a. For CRBN, the recommended 100X tracer concentration for live-cell mode is 50µM.
b. For VHL, the recommended 100X tracer concentration for live-cell mode is 100µM.
Notes: • Higher tracer concentrations may increase assay window but reduce sensitivity. See Figures 4 and 5 for example
data for the CRBN and VHL live-cell mode assays.• The tracer concentrations recommended here are specifically optimized for the live-cell mode assay, and are
different than those optimized for the permeabilized-cell mode (see Section 6.A).
2. Prepare Complete 20X NanoBRET™ Tracer Reagent by adding 4 parts of Tracer Dilution Buffer to 1 part of 100X NanoBRET™ TE Tracer.
Notes:• Because the Tracer Dilution Buffer is viscous, slowly dispense both the Tracer Dilution Buffer and the Complete
20X NanoBRET™ Tracer Reagent.• We recommend preparing and using the Complete 20X NanoBRET™ Tracer Reagent on the day of use, ideally
within 5 hours of preparation. Discard after use. Do not store.
14 Promega Corporation · 2800 Woods Hollow Road · Madison, WI 53711-5399 USA · Toll Free in USA 800-356-9526 · 608-274-4330 · Fax 608-277-2516TM626 · 10/20 www.promega.com
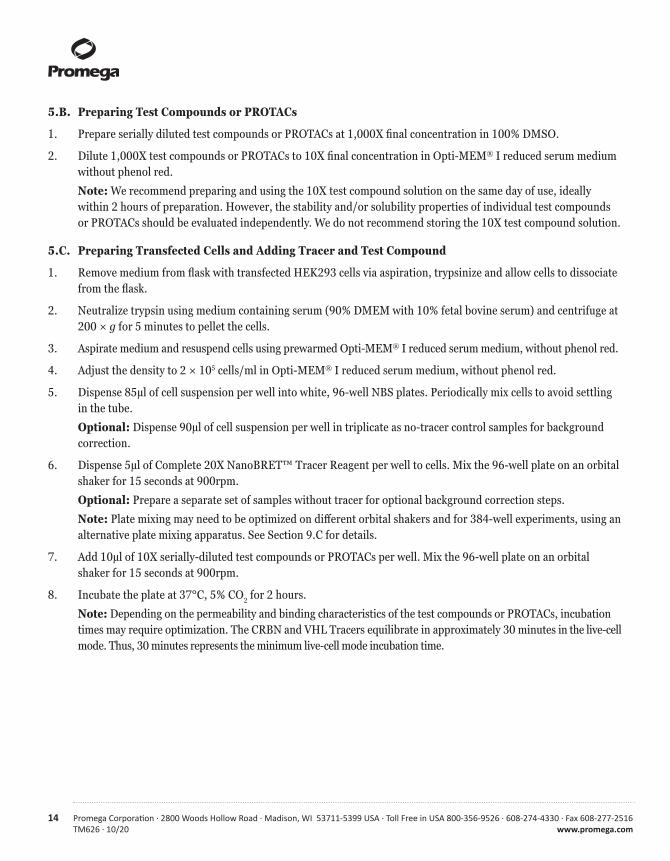
5.B. Preparing Test Compounds or PROTACs
1. Prepare serially diluted test compounds or PROTACs at 1,000X final concentration in 100% DMSO.
2. Dilute 1,000X test compounds or PROTACs to 10X final concentration in Opti-MEM® I reduced serum medium without phenol red.
Note: We recommend preparing and using the 10X test compound solution on the same day of use, ideally within 2 hours of preparation. However, the stability and/or solubility properties of individual test compounds or PROTACs should be evaluated independently. We do not recommend storing the 10X test compound solution.
5.C. Preparing Transfected Cells and Adding Tracer and Test Compound
1. Remove medium from flask with transfected HEK293 cells via aspiration, trypsinize and allow cells to dissociate from the flask.
2. Neutralize trypsin using medium containing serum (90% DMEM with 10% fetal bovine serum) and centrifuge at 200 × g for 5 minutes to pellet the cells.
3. Aspirate medium and resuspend cells using prewarmed Opti-MEM® I reduced serum medium, without phenol red.
4. Adjust the density to 2 × 10⁵ cells/ml in Opti-MEM® I reduced serum medium, without phenol red.
5. Dispense 85µl of cell suspension per well into white, 96-well NBS plates. Periodically mix cells to avoid settling in the tube.
Optional: Dispense 90µl of cell suspension per well in triplicate as no-tracer control samples for background correction.
6. Dispense 5µl of Complete 20X NanoBRET™ Tracer Reagent per well to cells. Mix the 96-well plate on an orbital shaker for 15 seconds at 900rpm.
Optional: Prepare a separate set of samples without tracer for optional background correction steps.
Note: Plate mixing may need to be optimized on different orbital shakers and for 384-well experiments, using an alternative plate mixing apparatus. See Section 9.C for details.
7. Add 10µl of 10X serially-diluted test compounds or PROTACs per well. Mix the 96-well plate on an orbital shaker for 15 seconds at 900rpm.
8. Incubate the plate at 37°C, 5% CO2 for 2 hours.
Note: Depending on the permeability and binding characteristics of the test compounds or PROTACs, incubation times may require optimization. The CRBN and VHL Tracers equilibrate in approximately 30 minutes in the live-cell mode. Thus, 30 minutes represents the minimum live-cell mode incubation time.
Promega Corporation · 2800 Woods Hollow Road · Madison, WI 53711-5399 USA · Toll Free in USA 800-356-9526 · 608-274-4330 · Fax 608-277-2516 15www.promega.com TM626 · 10/20
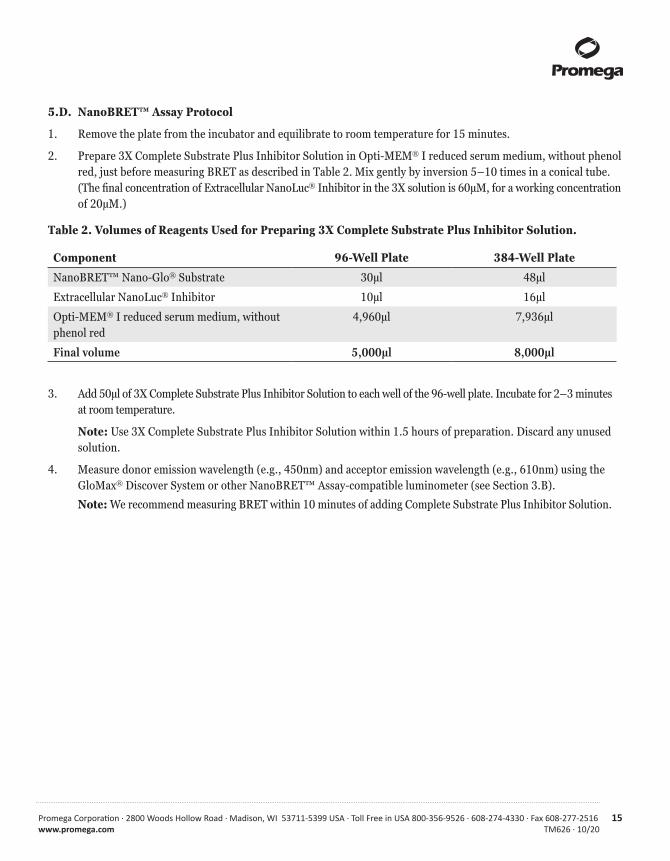
5.D. NanoBRET™ Assay Protocol
1. Remove the plate from the incubator and equilibrate to room temperature for 15 minutes.
2. Prepare 3X Complete Substrate Plus Inhibitor Solution in Opti-MEM® I reduced serum medium, without phenol red, just before measuring BRET as described in Table 2. Mix gently by inversion 5–10 times in a conical tube. (The final concentration of Extracellular NanoLuc® Inhibitor in the 3X solution is 60µM, for a working concentration of 20µM.)
Table 2. Volumes of Reagents Used for Preparing 3X Complete Substrate Plus Inhibitor Solution.
Component 96-Well Plate 384-Well Plate
NanoBRET™ Nano-Glo® Substrate 30µl 48µl
Extracellular NanoLuc® Inhibitor 10µl 16µl
Opti-MEM® I reduced serum medium, without phenol red
4,960µl 7,936µl
Final volume 5,000µl 8,000µl
3. Add 50µl of 3X Complete Substrate Plus Inhibitor Solution to each well of the 96-well plate. Incubate for 2–3 minutes at room temperature.
Note: Use 3X Complete Substrate Plus Inhibitor Solution within 1.5 hours of preparation. Discard any unused solution.
4. Measure donor emission wavelength (e.g., 450nm) and acceptor emission wavelength (e.g., 610nm) using the GloMax® Discover System or other NanoBRET™ Assay-compatible luminometer (see Section 3.B).
Note: We recommend measuring BRET within 10 minutes of adding Complete Substrate Plus Inhibitor Solution.
16 Promega Corporation · 2800 Woods Hollow Road · Madison, WI 53711-5399 USA · Toll Free in USA 800-356-9526 · 608-274-4330 · Fax 608-277-2516TM626 · 10/20 www.promega.com
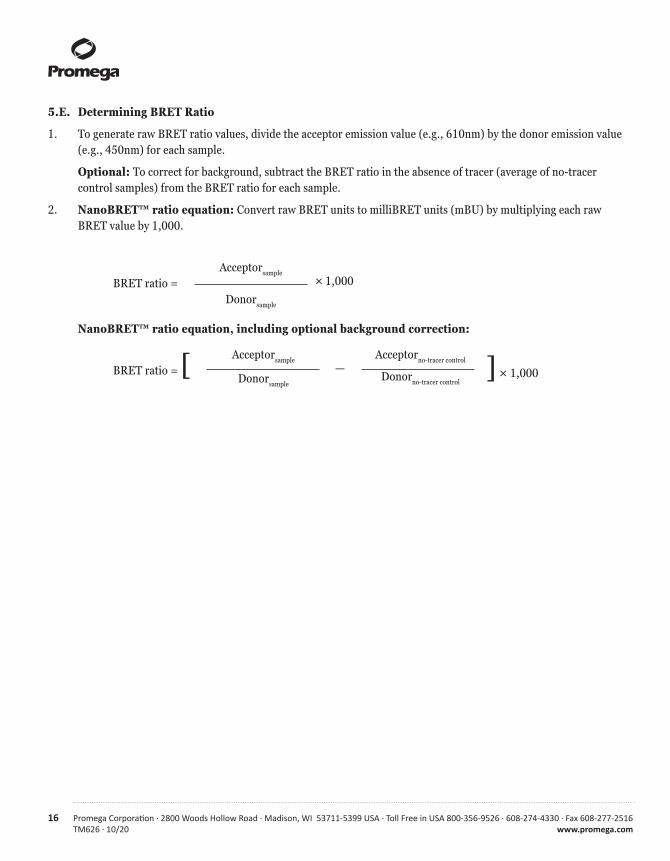
5.E. Determining BRET Ratio
1. To generate raw BRET ratio values, divide the acceptor emission value (e.g., 610nm) by the donor emission value (e.g., 450nm) for each sample.
Optional: To correct for background, subtract the BRET ratio in the absence of tracer (average of no-tracer control samples) from the BRET ratio for each sample.
2. NanoBRET™ ratio equation: Convert raw BRET units to milliBRET units (mBU) by multiplying each raw BRET value by 1,000.
BRET ratio =
Acceptorsample
Donorsample
× 1,000
NanoBRET™ ratio equation, including optional background correction:
BRET ratio = [ Acceptorsample
Donorsample
—Acceptorno-tracer control
Donorno-tracer control] × 1,000
Promega Corporation · 2800 Woods Hollow Road · Madison, WI 53711-5399 USA · Toll Free in USA 800-356-9526 · 608-274-4330 · Fax 608-277-2516 17www.promega.com TM626 · 10/20
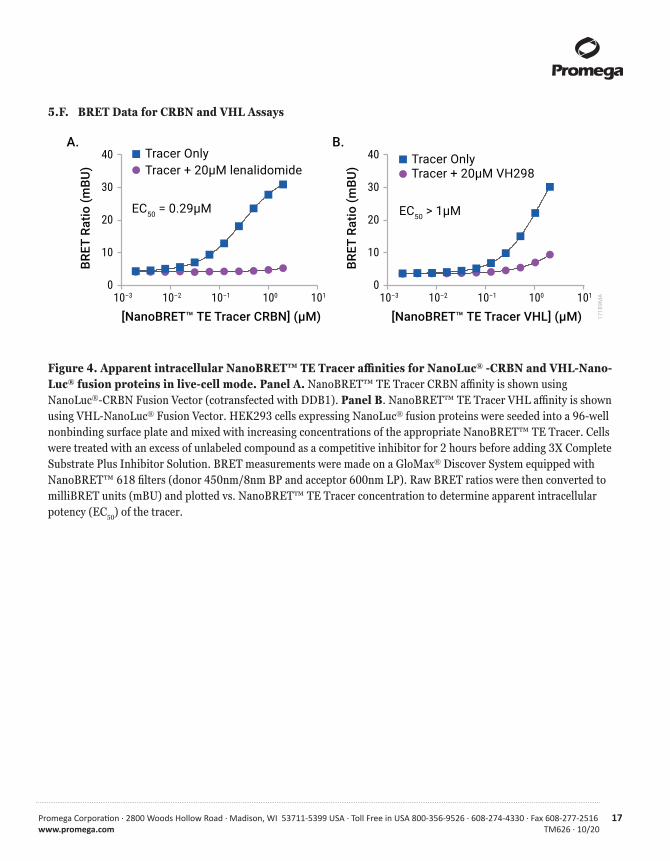
5.F. BRET Data for CRBN and VHL Assays
Figure 4. Apparent intracellular NanoBRET™ TE Tracer affinities for NanoLuc® -CRBN and VHL-Nano-Luc® fusion proteins in live-cell mode. Panel A. NanoBRET™ TE Tracer CRBN affinity is shown using NanoLuc®-CRBN Fusion Vector (cotransfected with DDB1). Panel B. NanoBRET™ TE Tracer VHL affinity is shown using VHL-NanoLuc® Fusion Vector. HEK293 cells expressing NanoLuc® fusion proteins were seeded into a 96-well nonbinding surface plate and mixed with increasing concentrations of the appropriate NanoBRET™ TE Tracer. Cells were treated with an excess of unlabeled compound as a competitive inhibitor for 2 hours before adding 3X Complete Substrate Plus Inhibitor Solution. BRET measurements were made on a GloMax® Discover System equipped with NanoBRET™ 618 filters (donor 450nm/8nm BP and acceptor 600nm LP). Raw BRET ratios were then converted to milliBRET units (mBU) and plotted vs. NanoBRET™ TE Tracer concentration to determine apparent intracellular potency (EC50) of the tracer.
10–3 10–2 10–1 100 1010
10
20
30
40
[NanoBRET™ TE Tracer CRBN] (μM)
BRET
Rat
io (m
BU)
Tracer Only
EC50 = 0.29μM
Tracer + 20μM lenalidomide
A.Tracer Only
EC50 > 1μM
Tracer + 20μM VH298
10–3 10–2 10–1 100 1010
10
20
30
40
[NanoBRET™ TE Tracer VHL] (μM)
BRET
Rat
io (m
BU)
B.
1718
9MA
18 Promega Corporation · 2800 Woods Hollow Road · Madison, WI 53711-5399 USA · Toll Free in USA 800-356-9526 · 608-274-4330 · Fax 608-277-2516TM626 · 10/20 www.promega.com
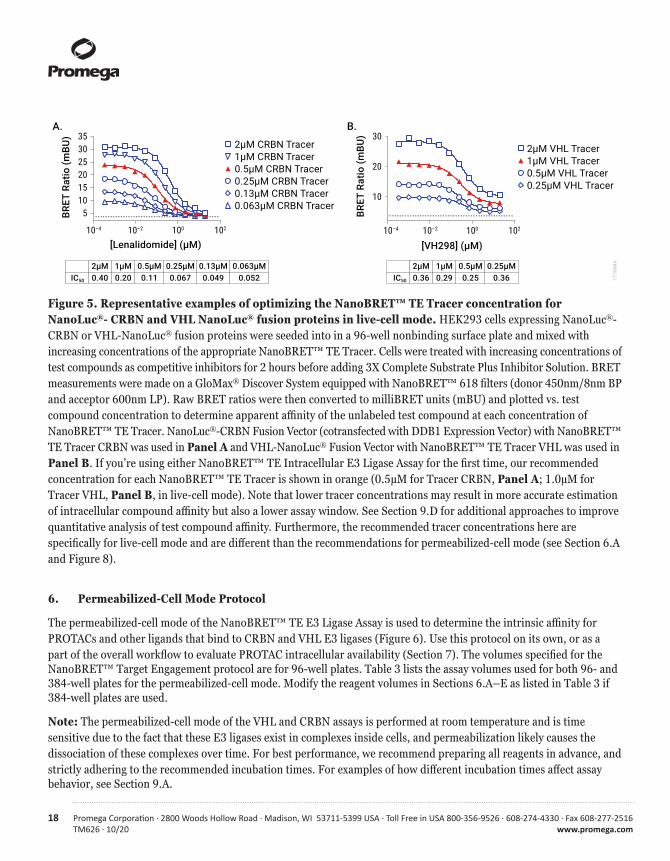
Figure 5. Representative examples of optimizing the NanoBRET™ TE Tracer concentration for NanoLuc®- CRBN and VHL NanoLuc® fusion proteins in live-cell mode. HEK293 cells expressing NanoLuc®-CRBN or VHL-NanoLuc® fusion proteins were seeded into in a 96-well nonbinding surface plate and mixed with increasing concentrations of the appropriate NanoBRET™ TE Tracer. Cells were treated with increasing concentrations of test compounds as competitive inhibitors for 2 hours before adding 3X Complete Substrate Plus Inhibitor Solution. BRET measurements were made on a GloMax® Discover System equipped with NanoBRET™ 618 filters (donor 450nm/8nm BP and acceptor 600nm LP). Raw BRET ratios were then converted to milliBRET units (mBU) and plotted vs. test compound concentration to determine apparent affinity of the unlabeled test compound at each concentration of NanoBRET™ TE Tracer. NanoLuc®-CRBN Fusion Vector (cotransfected with DDB1 Expression Vector) with NanoBRET™ TE Tracer CRBN was used in Panel A and VHL-NanoLuc® Fusion Vector with NanoBRET™ TE Tracer VHL was used in Panel B. If you’re using either NanoBRET™ TE Intracellular E3 Ligase Assay for the first time, our recommended concentration for each NanoBRET™ TE Tracer is shown in orange (0.5µM for Tracer CRBN, Panel A; 1.0µM for Tracer VHL, Panel B, in live-cell mode). Note that lower tracer concentrations may result in more accurate estimation of intracellular compound affinity but also a lower assay window. See Section 9.D for additional approaches to improve quantitative analysis of test compound affinity. Furthermore, the recommended tracer concentrations here are specifically for live-cell mode and are different than the recommendations for permeabilized-cell mode (see Section 6.A and Figure 8).
6. Permeabilized-Cell Mode Protocol
The permeabilized-cell mode of the NanoBRET™ TE E3 Ligase Assay is used to determine the intrinsic affinity for PROTACs and other ligands that bind to CRBN and VHL E3 ligases (Figure 6). Use this protocol on its own, or as a part of the overall workflow to evaluate PROTAC intracellular availability (Section 7). The volumes specified for the NanoBRET™ Target Engagement protocol are for 96-well plates. Table 3 lists the assay volumes used for both 96- and 384-well plates for the permeabilized-cell mode. Modify the reagent volumes in Sections 6.A–E as listed in Table 3 if 384-well plates are used.
Note: The permeabilized-cell mode of the VHL and CRBN assays is performed at room temperature and is time sensitive due to the fact that these E3 ligases exist in complexes inside cells, and permeabilization likely causes the dissociation of these complexes over time. For best performance, we recommend preparing all reagents in advance, and strictly adhering to the recommended incubation times. For examples of how different incubation times affect assay behavior, see Section 9.A.
10–4 10–2 100 102
5101520253035
[Lenalidomide] (μM)
BRET
Rat
io (m
BU)
2μM CRBN Tracer1μM CRBN Tracer0.5μM CRBN Tracer0.25μM CRBN Tracer0.13μM CRBN Tracer0.063μM CRBN Tracer
IC50
2μM0.40
1μM0.20
0.5μM0.11
0.25μM0.067
0.13μM0.049
0.063μM0.052
A.
10
20
30
[VH298] (μM)
2μM VHL Tracer1μM VHL Tracer0.5μM VHL Tracer0.25μM VHL Tracer
IC50
2μM0.36
1μM0.29
0.5μM0.25
0.25μM0.36
BRET
Rat
io (m
BU)
10–4 10–2 100 102
B.
1719
0MA
Promega Corporation · 2800 Woods Hollow Road · Madison, WI 53711-5399 USA · Toll Free in USA 800-356-9526 · 608-274-4330 · Fax 608-277-2516 19www.promega.com TM626 · 10/20
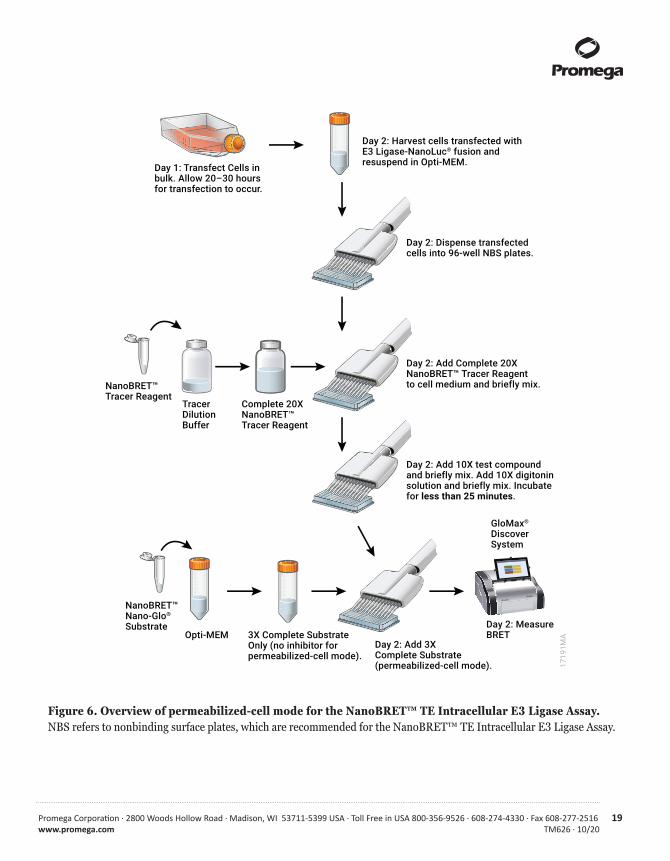
Figure 6. Overview of permeabilized-cell mode for the NanoBRET™ TE Intracellular E3 Ligase Assay. NBS refers to nonbinding surface plates, which are recommended for the NanoBRET™ TE Intracellular E3 Ligase Assay.
Day 1: Transfect Cells in bulk. Allow 20–30 hours for transfection to occur.
Day 2: Harvest cells transfected with E3 Ligase-NanoLuc® fusion and resuspend in Opti-MEM.
Day 2: Dispense transfected cells into 96-well NBS plates.
Day 2: Add Complete 20X NanoBRET™ Tracer Reagent to cell medium and briefly mix.
Day 2: Add 10X test compound and briefly mix. Add 10X digitonin solution and briefly mix. Incubate for less than 25 minutes.
NanoBRET™Tracer Reagent
TracerDilutionBuffer
Complete 20XNanoBRET™Tracer Reagent
NanoBRET™Nano-Glo®
SubstrateOpti-MEM 3X Complete Substrate
Only (no inhibitor for permeabilized-cell mode).
Day 2: Add 3X Complete Substrate (permeabilized-cell mode).
GloMax®
DiscoverSystem
Day 2: Measure BRET
1719
1MA
20 Promega Corporation · 2800 Woods Hollow Road · Madison, WI 53711-5399 USA · Toll Free in USA 800-356-9526 · 608-274-4330 · Fax 608-277-2516TM626 · 10/20 www.promega.com
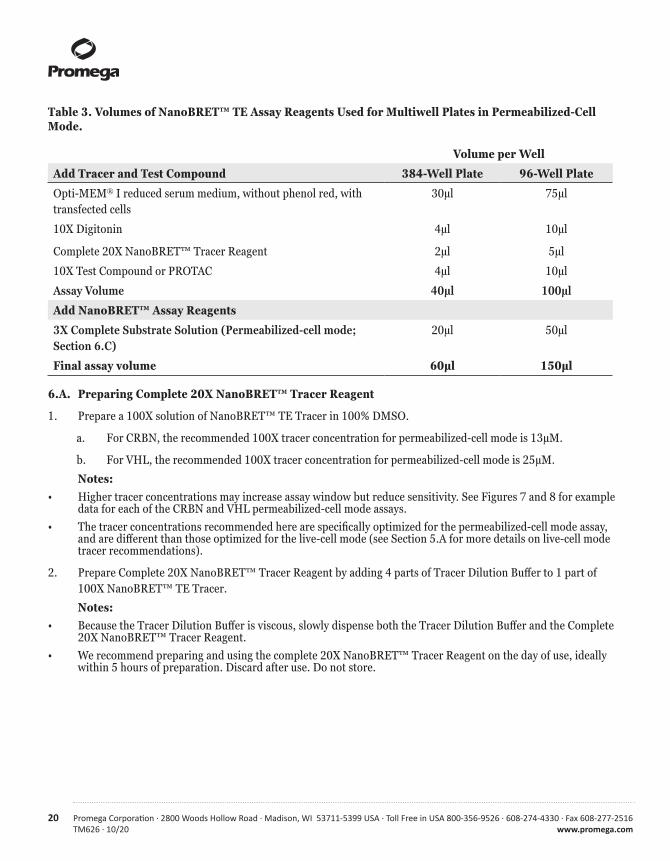
Table 3. Volumes of NanoBRET™ TE Assay Reagents Used for Multiwell Plates in Permeabilized-Cell Mode.
Volume per Well
Add Tracer and Test Compound 384-Well Plate 96-Well Plate
Opti-MEM® I reduced serum medium, without phenol red, with transfected cells
30µl 75µl
10X Digitonin 4µl 10µl
Complete 20X NanoBRET™ Tracer Reagent 2µl 5µl
10X Test Compound or PROTAC 4µl 10µl
Assay Volume 40µl 100µl
Add NanoBRET™ Assay Reagents
3X Complete Substrate Solution (Permeabilized-cell mode; Section 6.C)
20µl 50µl
Final assay volume 60µl 150µl
6.A. Preparing Complete 20X NanoBRET™ Tracer Reagent
1. Prepare a 100X solution of NanoBRET™ TE Tracer in 100% DMSO.
a. For CRBN, the recommended 100X tracer concentration for permeabilized-cell mode is 13µM.
b. For VHL, the recommended 100X tracer concentration for permeabilized-cell mode is 25µM.
Notes: • Higher tracer concentrations may increase assay window but reduce sensitivity. See Figures 7 and 8 for example
data for each of the CRBN and VHL permeabilized-cell mode assays.• The tracer concentrations recommended here are specifically optimized for the permeabilized-cell mode assay,
and are different than those optimized for the live-cell mode (see Section 5.A for more details on live-cell mode tracer recommendations).
2. Prepare Complete 20X NanoBRET™ Tracer Reagent by adding 4 parts of Tracer Dilution Buffer to 1 part of 100X NanoBRET™ TE Tracer.
Notes: • Because the Tracer Dilution Buffer is viscous, slowly dispense both the Tracer Dilution Buffer and the Complete
20X NanoBRET™ Tracer Reagent.• We recommend preparing and using the complete 20X NanoBRET™ Tracer Reagent on the day of use, ideally
within 5 hours of preparation. Discard after use. Do not store.
Promega Corporation · 2800 Woods Hollow Road · Madison, WI 53711-5399 USA · Toll Free in USA 800-356-9526 · 608-274-4330 · Fax 608-277-2516 21www.promega.com TM626 · 10/20
6.B. Preparing Test Compounds or PROTACs
1. Prepare serially diluted test compounds or PROTACs at 1,000X final concentration in 100% DMSO.
2. Dilute 1,000X test compounds or PROTACs to 10X final concentration in Opti-MEM® I reduced serum medium, without phenol red.
Note: We recommend preparing and using the 10X test compound solution on the same day, ideally within 2 hours of preparation. However, the stability and/or solubility properties of individual test compounds or PROTACs should be evaluated independently. We do not recommend storing the 10X test compound solution.
6.C. Preparing 10X Digitonin Solution
1. Prepare 1,000X concentrated digitonin solution at 50mg/ml in DMSO.
Note: The 20mg/ml Digitonin stock solution from Promega (Cat.# G9441) is at 400X.
2. Dilute the concentrated digitonin solution to 10X final concentration in Opti-MEM® I reduced serum medium without phenol red. The concentration of this 10X solution is 500µg/ml.
Note: Permeabilization is achieved rapidly at a final digitonin concentration of 50µg/ml.
6.D. Preparing Transfected Cells and Adding Tracer and Test Compound
1. Remove medium from flask with transfected HEK293 cells via aspiration, trypsinize and allow cells to dissociate from the flask.
2. Neutralize trypsin using medium containing serum (90% DMEM with 10% fetal bovine serum) and centrifuge at 200 × g for 5 minutes to pellet the cells.
3. Aspirate medium and resuspend cells using prewarmed Opti-MEM® I reduced serum medium, without phenol red.
4. Adjust the density to 2 × 10⁵ cells/ml in Opti-MEM® I reduced serum medium, without phenol red.
5. Dispense 75µl per well of cell suspension into white, 96-well NBS plates. Periodically mix cells to avoid settling in the tube.
Optional: Dispense 80µl of cell suspension per well in triplicate as no-tracer control samples for background correction.
6. Dispense 5µl of Complete 20X NanoBRET™ Tracer Reagent per well to cells. Mix the 96-well plate on an orbital shaker for 15 seconds at 900rpm.
Optional: Prepare a separate set of samples without tracer for optional background correction steps.
Note: Plate mixing may need to be optimized on different orbital shakers and for 384-well experiments, using an alternative plate mixing apparatus. See Section 9.C for details.
7. Add 10µl of 10X serially diluted test compounds or PROTACs per well. Mix the 96-well plate on an orbital shaker for 15 seconds at 900rpm.
8. Add 10µl of 10X digitonin solution per well. Mix the 96-well plate on an orbital shaker for 15 seconds at 900rpm. Start a timer and proceed immediately to Step 9.
22 Promega Corporation · 2800 Woods Hollow Road · Madison, WI 53711-5399 USA · Toll Free in USA 800-356-9526 · 608-274-4330 · Fax 608-277-2516TM626 · 10/20 www.promega.com
9. Incubate the plate at ambient temperature, protected from light, for a consistent period of time for each assay plate. Do not incubate longer than 25 minutes.
Note: For best comparability, assay plates should be incubated for the same amount of time, ideally with no greater than a 5-minute differential between plates. See Section 9.A for the effect of different incubation times.
6.E. NanoBRET™ Assay Protocol
1. Prepare 3X Complete Substrate Solution (permeabilized-cell mode) in Opti-MEM® I reduced serum medium, without phenol red, just before measuring BRET as described in Table 4. Mix gently by inversion 5–10 times in a conical tube.
Table 4. Volumes of NanoBRET™ TE Reagents Used for Preparing 3X Complete Substrate Solution (Permeabilized-Cell Mode).
Component 96-Well Plate 384-Well Plate
NanoBRET™ Nano-Glo® Substrate 30µl 48µl
Opti-MEM® reduced serum medium, without phenol red
4,970µl 7,952µl
Final volume 5,000µl 8,000µl
Note: Due to the fact that the cells are permeabilized, the Extracellular NanoLuc Inhibitor is specifically omitted from this solution.
2. Add 50µl of 3X Complete Substrate Solution (permeabilized-cell mode) to each well of the 96-well plate. Incubate for 0.5−1 minute at room temperature.
Note: Use 3X Complete Substrate Solution (permeabilized-cell mode) within 1.5 hours. Discard any unused solution.
3. Measure donor emission wavelength (e.g., 450nm) and acceptor emission wavelength (e.g., 610nm) using the GloMax® Discover System or other NanoBRET™ Assay-compatible luminometer (see Section 3.B).
Note: We recommend measuring BRET within 5 minutes of adding 3X Complete Substrate Solution (permeabilized-cell mode).
Promega Corporation · 2800 Woods Hollow Road · Madison, WI 53711-5399 USA · Toll Free in USA 800-356-9526 · 608-274-4330 · Fax 608-277-2516 23www.promega.com TM626 · 10/20
6.F. Determining BRET Ratio
1. To generate raw BRET ratio values, divide the acceptor emission value (e.g., 610nm) by the donor emission value (e.g., 450nm) for each sample.
Optional: To correct for background, subtract the BRET ratio in the absence of tracer (average of no-tracer control samples) from the BRET ratio of each sample.
2. NanoBRET™ ratio equation: Convert raw BRET units to milliBRET units (mBU) by multiplying each raw BRET value by 1,000.
BRET ratio =
Acceptorsample
Donorsample
× 1,000
NanoBRET™ ratio equation, including optional background correction:
BRET ratio = [ Acceptorsample
Donorsample
—Acceptorno-tracer control
Donorno-tracer control] × 1,000
24 Promega Corporation · 2800 Woods Hollow Road · Madison, WI 53711-5399 USA · Toll Free in USA 800-356-9526 · 608-274-4330 · Fax 608-277-2516TM626 · 10/20 www.promega.com
6.G. BRET Data for CRBN and VHL Assays
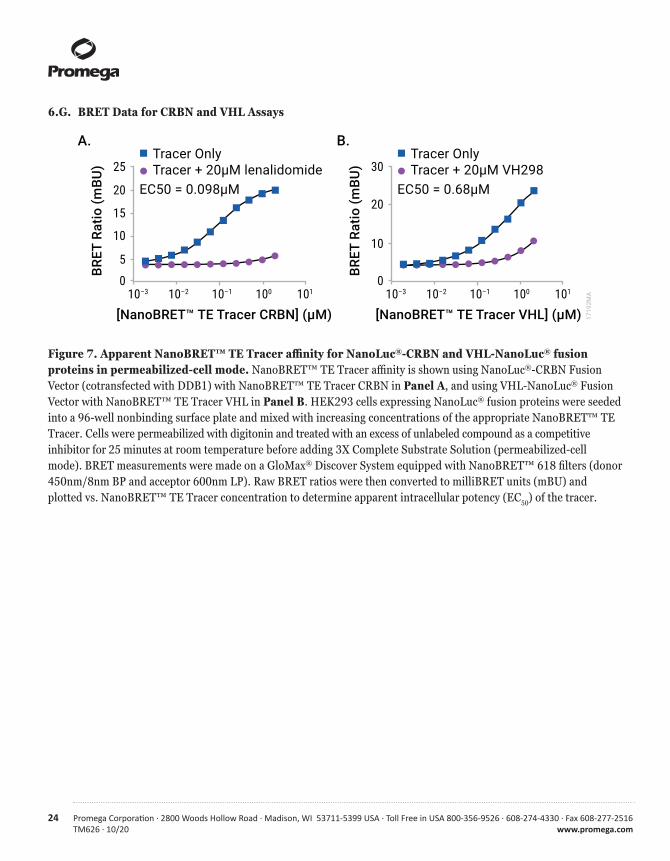
Figure 7. Apparent NanoBRET™ TE Tracer affinity for NanoLuc®-CRBN and VHL-NanoLuc® fusion proteins in permeabilized-cell mode. NanoBRET™ TE Tracer affinity is shown using NanoLuc®-CRBN Fusion Vector (cotransfected with DDB1) with NanoBRET™ TE Tracer CRBN in Panel A, and using VHL-NanoLuc® Fusion Vector with NanoBRET™ TE Tracer VHL in Panel B. HEK293 cells expressing NanoLuc® fusion proteins were seeded into a 96-well nonbinding surface plate and mixed with increasing concentrations of the appropriate NanoBRET™ TE Tracer. Cells were permeabilized with digitonin and treated with an excess of unlabeled compound as a competitive inhibitor for 25 minutes at room temperature before adding 3X Complete Substrate Solution (permeabilized-cell mode). BRET measurements were made on a GloMax® Discover System equipped with NanoBRET™ 618 filters (donor 450nm/8nm BP and acceptor 600nm LP). Raw BRET ratios were then converted to milliBRET units (mBU) and plotted vs. NanoBRET™ TE Tracer concentration to determine apparent intracellular potency (EC50) of the tracer.
10
20
30
[NanoBRET™ TE Tracer VHL] (μM)
Tracer OnlyTracer + 20μM VH298
BRET
Rat
io (m
BU)
10–3 10–2 100 101
B.
10–10
EC50 = 0.68μM
[NanoBRET™ TE Tracer CRBN] (μM)
10
20
25Tracer OnlyTracer + 20μM lenalidomide
BRET
Rat
io (m
BU)
10–3 10–2 100 10110–10
EC50 = 0.098μM
5
15
A.
1719
2MA
Promega Corporation · 2800 Woods Hollow Road · Madison, WI 53711-5399 USA · Toll Free in USA 800-356-9526 · 608-274-4330 · Fax 608-277-2516 25www.promega.com TM626 · 10/20
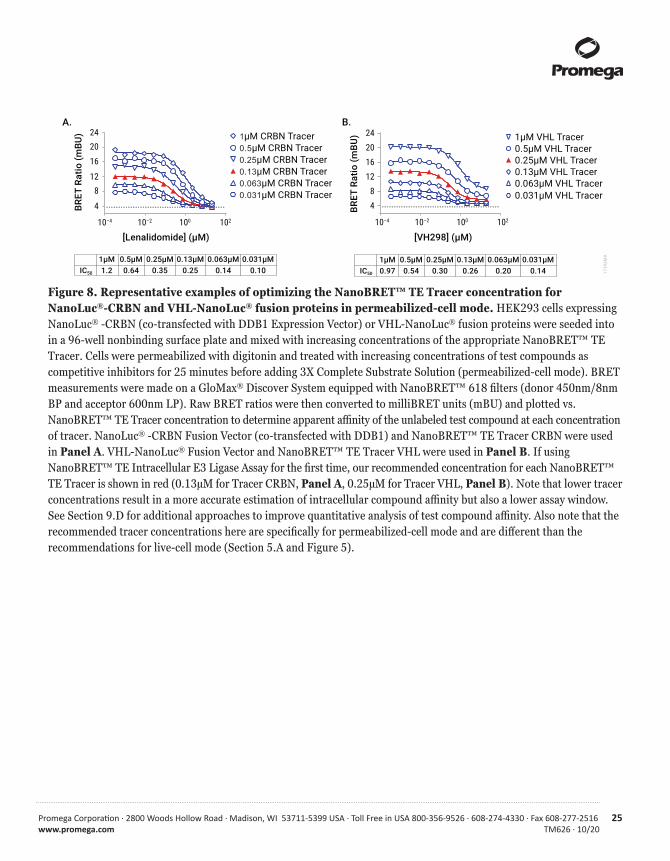
Figure 8. Representative examples of optimizing the NanoBRET™ TE Tracer concentration for NanoLuc®-CRBN and VHL-NanoLuc® fusion proteins in permeabilized-cell mode. HEK293 cells expressing NanoLuc® -CRBN (co-transfected with DDB1 Expression Vector) or VHL-NanoLuc® fusion proteins were seeded into in a 96-well nonbinding surface plate and mixed with increasing concentrations of the appropriate NanoBRET™ TE Tracer. Cells were permeabilized with digitonin and treated with increasing concentrations of test compounds as competitive inhibitors for 25 minutes before adding 3X Complete Substrate Solution (permeabilized-cell mode). BRET measurements were made on a GloMax® Discover System equipped with NanoBRET™ 618 filters (donor 450nm/8nm BP and acceptor 600nm LP). Raw BRET ratios were then converted to milliBRET units (mBU) and plotted vs. NanoBRET™ TE Tracer concentration to determine apparent affinity of the unlabeled test compound at each concentration of tracer. NanoLuc® -CRBN Fusion Vector (co-transfected with DDB1) and NanoBRET™ TE Tracer CRBN were used in Panel A. VHL-NanoLuc® Fusion Vector and NanoBRET™ TE Tracer VHL were used in Panel B. If using NanoBRET™ TE Intracellular E3 Ligase Assay for the first time, our recommended concentration for each NanoBRET™ TE Tracer is shown in red (0.13µM for Tracer CRBN, Panel A, 0.25µM for Tracer VHL, Panel B). Note that lower tracer concentrations result in a more accurate estimation of intracellular compound affinity but also a lower assay window. See Section 9.D for additional approaches to improve quantitative analysis of test compound affinity. Also note that the recommended tracer concentrations here are specifically for permeabilized-cell mode and are different than the recommendations for live-cell mode (Section 5.A and Figure 5).
48
12162024 1μM VHL Tracer
0.5μM VHL Tracer0.25μM VHL Tracer0.13μM VHL Tracer0.063μM VHL Tracer0.031μM VHL Tracer
BRET
Rat
io (m
BU)
10–4 10–2 100 102
[VH298] (μM)
IC50
1μM0.97
0.5μM0.54
0.25μM0.30
0.13μM0.26
0.063μM0.20
0.031μM0.14
A. B.
10–4 10–2 100 102
4
812
162024 1μM CRBN Tracer
0.5μM CRBN Tracer0.25μM CRBN Tracer0.13μM CRBN Tracer0.063μM CRBN Tracer0.031μM CRBN Tracer
BRET
Rat
io (m
BU)
[Lenalidomide] (μM)
IC50
1μM1.2
0.5μM0.64
0.25μM0.35
0.13μM0.25
0.063μM0.14
0.031μM0.10 17
193M
A
26 Promega Corporation · 2800 Woods Hollow Road · Madison, WI 53711-5399 USA · Toll Free in USA 800-356-9526 · 608-274-4330 · Fax 608-277-2516TM626 · 10/20 www.promega.com
7. Assessing PROTAC Intracellular Availability
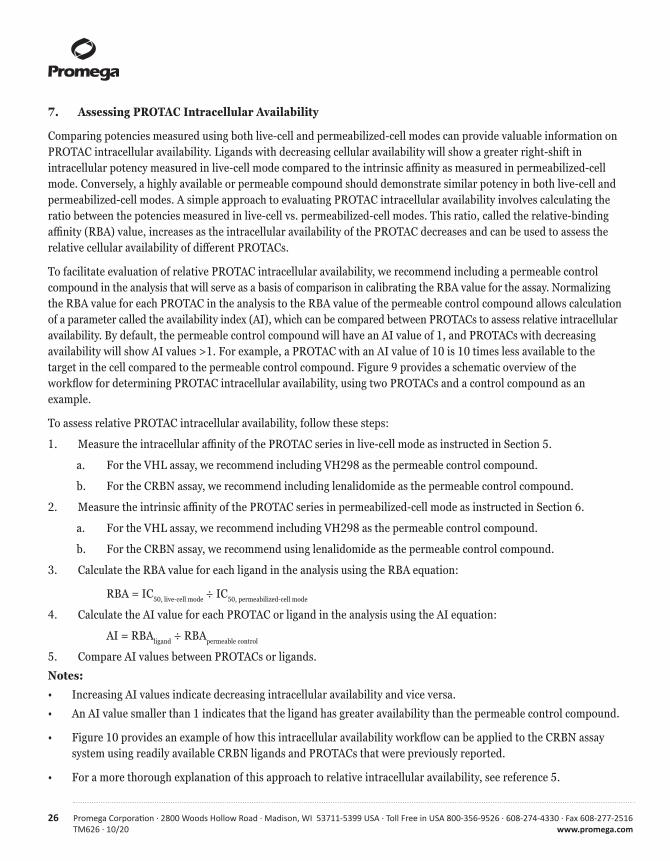
Comparing potencies measured using both live-cell and permeabilized-cell modes can provide valuable information on PROTAC intracellular availability. Ligands with decreasing cellular availability will show a greater right-shift in intracellular potency measured in live-cell mode compared to the intrinsic affinity as measured in permeabilized-cell mode. Conversely, a highly available or permeable compound should demonstrate similar potency in both live-cell and permeabilized-cell modes. A simple approach to evaluating PROTAC intracellular availability involves calculating the ratio between the potencies measured in live-cell vs. permeabilized-cell modes. This ratio, called the relative-binding affinity (RBA) value, increases as the intracellular availability of the PROTAC decreases and can be used to assess the relative cellular availability of different PROTACs.
To facilitate evaluation of relative PROTAC intracellular availability, we recommend including a permeable control compound in the analysis that will serve as a basis of comparison in calibrating the RBA value for the assay. Normalizing the RBA value for each PROTAC in the analysis to the RBA value of the permeable control compound allows calculation of a parameter called the availability index (AI), which can be compared between PROTACs to assess relative intracellular availability. By default, the permeable control compound will have an AI value of 1, and PROTACs with decreasing availability will show AI values >1. For example, a PROTAC with an AI value of 10 is 10 times less available to the target in the cell compared to the permeable control compound. Figure 9 provides a schematic overview of the workflow for determining PROTAC intracellular availability, using two PROTACs and a control compound as an example.
To assess relative PROTAC intracellular availability, follow these steps:
1. Measure the intracellular affinity of the PROTAC series in live-cell mode as instructed in Section 5.
a. For the VHL assay, we recommend including VH298 as the permeable control compound.
b. For the CRBN assay, we recommend including lenalidomide as the permeable control compound.
2. Measure the intrinsic affinity of the PROTAC series in permeabilized-cell mode as instructed in Section 6.
a. For the VHL assay, we recommend including VH298 as the permeable control compound.
b. For the CRBN assay, we recommend using lenalidomide as the permeable control compound.
3. Calculate the RBA value for each ligand in the analysis using the RBA equation:
RBA = IC50, live-cell mode ÷ IC50, permeabilized-cell mode
4. Calculate the AI value for each PROTAC or ligand in the analysis using the AI equation:
AI = RBAligand ÷ RBApermeable control
5. Compare AI values between PROTACs or ligands.
Notes:
• Increasing AI values indicate decreasing intracellular availability and vice versa.
• An AI value smaller than 1 indicates that the ligand has greater availability than the permeable control compound.
• Figure 10 provides an example of how this intracellular availability workflow can be applied to the CRBN assay system using readily available CRBN ligands and PROTACs that were previously reported.
• For a more thorough explanation of this approach to relative intracellular availability, see reference 5.
Promega Corporation · 2800 Woods Hollow Road · Madison, WI 53711-5399 USA · Toll Free in USA 800-356-9526 · 608-274-4330 · Fax 608-277-2516 27www.promega.com TM626 · 10/20
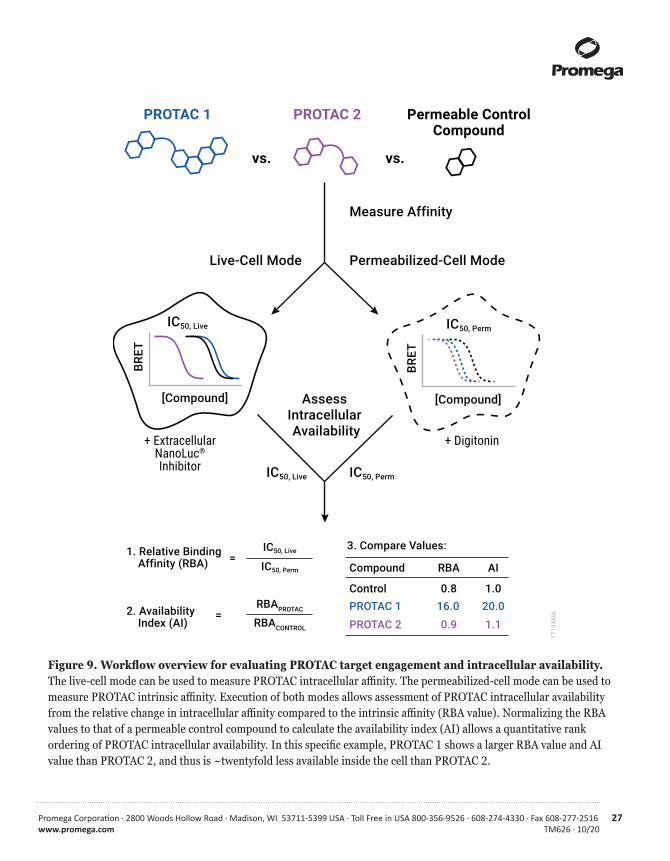
Figure 9. Workflow overview for evaluating PROTAC target engagement and intracellular availability. The live-cell mode can be used to measure PROTAC intracellular affinity. The permeabilized-cell mode can be used to measure PROTAC intrinsic affinity. Execution of both modes allows assessment of PROTAC intracellular availability from the relative change in intracellular affinity compared to the intrinsic affinity (RBA value). Normalizing the RBA values to that of a permeable control compound to calculate the availability index (AI) allows a quantitative rank ordering of PROTAC intracellular availability. In this specific example, PROTAC 1 shows a larger RBA value and AI value than PROTAC 2, and thus is ~twentyfold less available inside the cell than PROTAC 2.
Permeabilized-Cell ModeLive-Cell Mode
AssessIntracellular Availability
+ ExtracellularNanoLuc®
Inhibitor
+ Digitonin
PROTAC 1 PROTAC 2BR
ET
[Compound]BR
ET[Compound]
Permeable ControlCompound
vs. vs.
IC50, Live
IC50, Perm
1. Relative Binding Affinity (RBA)
2. Availability Index (AI)
RBAPROTAC
RBACONTROL
=
=
3. Compare Values:
Compound RBA AI
Control 0.8 1.0PROTAC 1PROTAC 2
16.0 20.00.9 1.1
Measure Affinity
IC50, Live IC50, Perm
IC50, PermIC50, Live
1719
4MA
28 Promega Corporation · 2800 Woods Hollow Road · Madison, WI 53711-5399 USA · Toll Free in USA 800-356-9526 · 608-274-4330 · Fax 608-277-2516TM626 · 10/20 www.promega.com
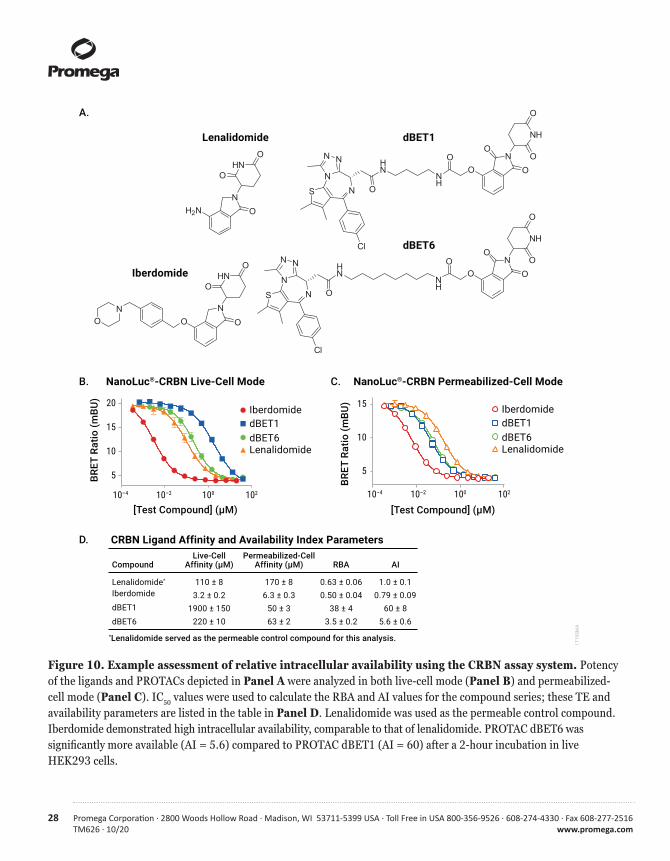
Figure 10. Example assessment of relative intracellular availability using the CRBN assay system. Potency of the ligands and PROTACs depicted in Panel A were analyzed in both live-cell mode (Panel B) and permeabilized-cell mode (Panel C). IC50 values were used to calculate the RBA and AI values for the compound series; these TE and availability parameters are listed in the table in Panel D. Lenalidomide was used as the permeable control compound. Iberdomide demonstrated high intracellular availability, comparable to that of lenalidomide. PROTAC dBET6 was significantly more available (AI = 5.6) compared to PROTAC dBET1 (AI = 60) after a 2-hour incubation in live HEK293 cells.
D. CRBN Ligand Affinity and Availability Index Parameters
CompoundLive-Cell
Affinity (μM)Permeabilized-Cell
Affinity (μM) RBA AI
Lenalidomide*
Iberdomide
dBET1
dBET6
110 ± 83.2 ± 0.2
1900 ± 150220 ± 10
170 ± 86.3 ± 0.3
50 ± 363 ± 2
0.63 ± 0.060.50 ± 0.04
38 ± 43.5 ± 0.2
1.0 ± 0.10.79 ± 0.09
60 ± 85.6 ± 0.6
*Lenalidomide served as the permeable control compound for this analysis.
5
10
15
C. NanoLuc®-CRBN Permeabilized-Cell Mode
IberdomidedBET1dBET6Lenalidomide
BRET
Rat
io (m
BU)
[Test Compound] (μM)10–4 10–2 100 10210–4 10–2 100 102
5
10
15
20
B. NanoLuc®-CRBN Live-Cell Mode
BRET
Rat
io (m
BU)
[Test Compound] (μM)
IberdomidedBET1dBET6Lenalidomide
OHN
O
NOH2N
OHN
O
NOO
NO
HN
N
N N
N
Cl
OS
NH
OO
N
NH
O
O
O
O
HN
N
N N
N
Cl
OS
NH
OO
N
NH
O
O
O
O
A.
Iberdomide
Lenalidomide dBET1
dBET6
1719
5MA
Promega Corporation · 2800 Woods Hollow Road · Madison, WI 53711-5399 USA · Toll Free in USA 800-356-9526 · 608-274-4330 · Fax 608-277-2516 29www.promega.com TM626 · 10/20
8. Troubleshooting
For questions not addressed here, please contact your local Promega Branch Office or Distributor. Contact information available at: www.promega.com E-mail: [email protected]
Symptoms Possible Causes and CommentsNanoBRET™ signal without test compound Tracer was adsorbed to plasticware surface. Use polypropylene is weak or close to instrument background materials and avoid polystyrene materials during transfer of tracer working reagents to minimize tracer adsorption.
Incorrect plate type was used. We recommend using Corning® nonbinding surface assay plates (Cat.# 3600 or #3574). Alternative plates may require assay revalidation (consult reference 4 for assay validation details).
Suboptimal tracer concentration. Consider optimizing the concentration of tracer for your experiment. Only dilute NanoBRET™ TE Tracers to 20X in Tracer Dilution Buffer prior to adding the tracer to the culture medium. NanoBRET™ TE Tracers VHL and CRBN performance will not improve above 2µM.
Instrument was set up improperly. Use the correct filters for donor wavelength (450nm) and acceptor wavelength (590nm) on your instrument to accurately measure NanoBRET™ signals.
Poor expression levels of the NanoLuc® fusion protein. Not all fusion proteins express identically in HEK293 cells, though the majority express adequately using the transfection conditions described in Section 4. If poor expression is suspected, determine the luminescence (RLU) from the donor (450nm) and acceptor (610nm) channels for cells expressing the NanoLuc® fusion (the signal) and compare that to the donor and acceptor RLU in the absence of cells expressing NanoLuc® (the background). If the signal-to-background ratio is less than 100, consider optimizing transfection conditions. Transfection optimization could involve increasing the ratio of the NanoLuc® fusion vector to the transfection carrier DNA while keeping the total DNA in the transfection mixture fixed. Moreover, cell density at time of harvest can affect transfectability. Newly passaged HEK293 cells (ideally within 1–2 days) should be harvested at 80−95% confluency for optimal transfectability. HEK293 cells approach- ing confluency do not transfect as efficiently.
30 Promega Corporation · 2800 Woods Hollow Road · Madison, WI 53711-5399 USA · Toll Free in USA 800-356-9526 · 608-274-4330 · Fax 608-277-2516TM626 · 10/20 www.promega.com
8. Troubleshooting (continued)Symptoms Possible Causes and CommentsNanoBRET™ signal without test compound Extracellular NanoLuc® Inhibitor was added to permeabilized- is weak or close to instrument background cell mode plates. Extracellular NanoLuc® Inhibitor should not (continued) be used in the permeabilized-cell mode, as this will quench the signal.
Observed IC50 value is right-shifted When performing the live-cell mode assay, target engagement compared to expected value may result in right-shifted pharmacology relative to that observed in a biochemical assay due to myriad cellular factors. These include permeability and the presence of intracellular complexes, among other variables. Moreover, target engagement parameters for full-length targets in a cellular context may differ from that of truncated domains commonly used in biochemical assays.
Incubation time in permeabilized-cell mode was longer than recommended and resulted in right-shifted potency. We recommend incubation times post permeabilization of no more than 25 minutes, with no greater than a 5-minute difference between assay plates. See Section 9.A for examples of the impact of incubation time on the assay in permeabilized mode.
The concentration of the NanoBRET™ TE Tracer may affect the observed IC50 value. Carefully select tracer concentration (see Section 9.D). Determine a more accurate compound IC50 by optimizing the tracer concentration.
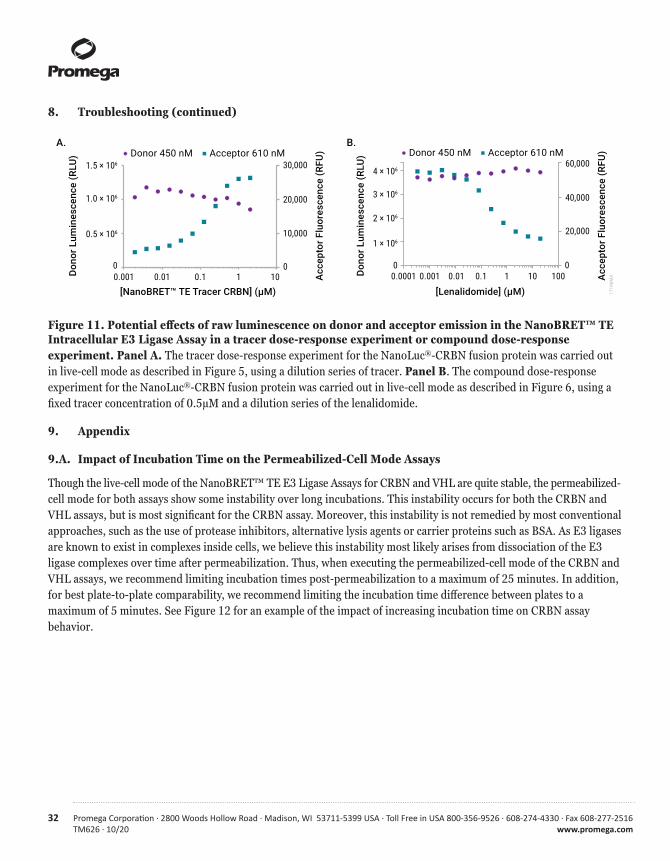
Donor or acceptor luminescence This phenomenon is common but generally does not affect the increases or decreases when tracer assay. Figure 11 demonstrates representative data showing raw is added luminescence from donor (450nm) and acceptor (610nm) channels when NanoBRET™ TE Tracer CRBN is titrated or when a test compound is titrated against a fixed concentration of tracer. BRET that occurs between the NanoLuc® fusion protein and fluorescent tracer may result in a dose-dependent increase in acceptor luminescence with a corresponding decrease in donor luminescence. The effect of BRET on donor and acceptor luminescence may vary depending on the target and tracer used. Ratiometric BRET analysis mitigates the influence of fluctuations in raw luminescence from NanoLuc® luciferase.
Promega Corporation · 2800 Woods Hollow Road · Madison, WI 53711-5399 USA · Toll Free in USA 800-356-9526 · 608-274-4330 · Fax 608-277-2516 31www.promega.com TM626 · 10/20
Symptoms Possible Causes and CommentsNoisy data Poor expression levels of the NanoLuc® fusion protein. Not all fusion proteins express identically in HEK293 cells, though the majority express adequately using the transfection conditions described in Section 4. If poor expression is suspected, determine the luminescence (RLU) from the donor (450nm) and acceptor (610nm) channels for cells expressing the NanoLuc® fusion (the signal) and compare that to the donor and acceptor RLU in the absence of cells expressing NanoLuc® (the back- ground). If the signal-to-background ratio is less than 100, consider optimizing transfection conditions, including increas- ing the ratio of the NanoLuc® fusion vector to the transfection carrier DNA while keeping the total DNA in the transfection mixture fixed.
Cell density at time of harvest can affect transfectability. Freshly passaged HEK293 cells (ideally within 1–2 days) should be harvested at 80−95% confluency for optimal transfection efficiency. HEK293 cells approaching confluency do not transfect as efficiently.
Plate-to-plate or day-to-day differences can be observed in the permeabilized format especially if strict adherence to the incubation time is not observed. We have seen assay instability in permeabilized cells and this instability is exacerbated with increasing incubation times. We recommend no more than a 5-minutes differential between plates for best comparability.
Ensure that 9 parts of DDB1 DNA has been transfected with 1 part of CRBN (instead of transfection carrier DNA.) The co-expression of DDB1 helps to stabilize the CRBN assay, especially in permeabilized-cell mode (see Section 9.B).
32 Promega Corporation · 2800 Woods Hollow Road · Madison, WI 53711-5399 USA · Toll Free in USA 800-356-9526 · 608-274-4330 · Fax 608-277-2516TM626 · 10/20 www.promega.com
8. Troubleshooting (continued)
Figure 11. Potential effects of raw luminescence on donor and acceptor emission in the NanoBRET™ TE Intracellular E3 Ligase Assay in a tracer dose-response experiment or compound dose-response experiment. Panel A. The tracer dose-response experiment for the NanoLuc®-CRBN fusion protein was carried out in live-cell mode as described in Figure 5, using a dilution series of tracer. Panel B. The compound dose-response experiment for the NanoLuc®-CRBN fusion protein was carried out in live-cell mode as described in Figure 6, using a fixed tracer concentration of 0.5µM and a dilution series of the lenalidomide.
9. Appendix
9.A. Impact of Incubation Time on the Permeabilized-Cell Mode Assays
Though the live-cell mode of the NanoBRET™ TE E3 Ligase Assays for CRBN and VHL are quite stable, the permeabilized-cell mode for both assays show some instability over long incubations. This instability occurs for both the CRBN and VHL assays, but is most significant for the CRBN assay. Moreover, this instability is not remedied by most conventional approaches, such as the use of protease inhibitors, alternative lysis agents or carrier proteins such as BSA. As E3 ligases are known to exist in complexes inside cells, we believe this instability most likely arises from dissociation of the E3 ligase complexes over time after permeabilization. Thus, when executing the permeabilized-cell mode of the CRBN and VHL assays, we recommend limiting incubation times post-permeabilization to a maximum of 25 minutes. In addition, for best plate-to-plate comparability, we recommend limiting the incubation time difference between plates to a maximum of 5 minutes. See Figure 12 for an example of the impact of increasing incubation time on CRBN assay behavior.
0.0001 0.001 0.01 0.1 10 1000 0
20,000
40,000
60,000
Dono
r Lum
ines
cenc
e (R
LU)
Acc
epto
r Flu
ores
cenc
e (R
FU)
4 × 10⁶
3 × 10⁶
2 × 10⁶
1 × 10⁶
[Lenalidomide] (µM)1
B.Donor 450 nM Acceptor 610 nM
0.001 0.01 0.1 100 0
10,000
20,000
30,000
A.Donor 450 nM Acceptor 610 nM
Dono
r Lum
ines
cenc
e (R
LU)
Acc
epto
r Flu
ores
cenc
e (R
FU)
1.5 × 10⁶
[NanoBRET™ TE Tracer CRBN] (µM)1
1.0 × 10⁶
0.5 × 10⁶
1719
6MA
Promega Corporation · 2800 Woods Hollow Road · Madison, WI 53711-5399 USA · Toll Free in USA 800-356-9526 · 608-274-4330 · Fax 608-277-2516 33www.promega.com TM626 · 10/20
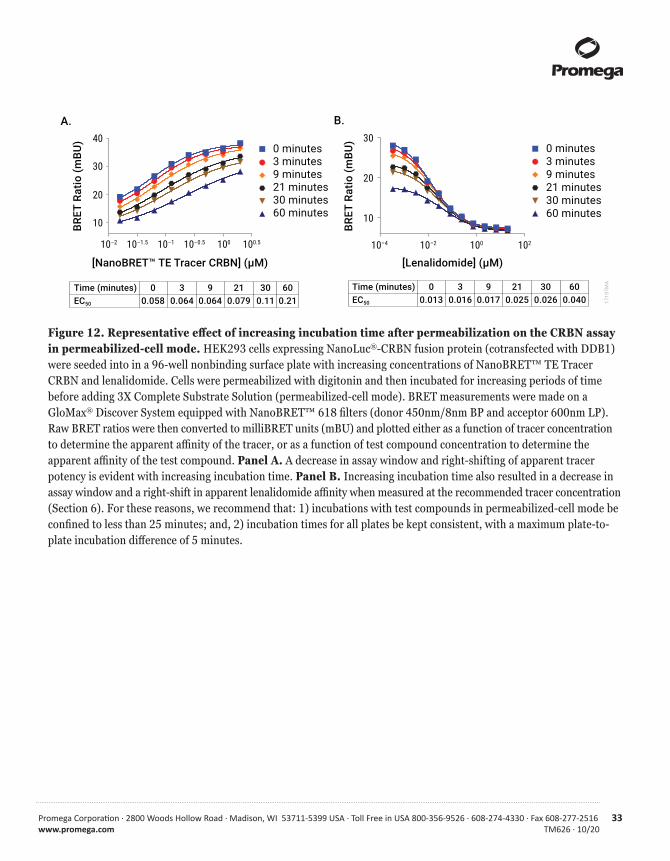
Figure 12. Representative effect of increasing incubation time after permeabilization on the CRBN assay in permeabilized-cell mode. HEK293 cells expressing NanoLuc®-CRBN fusion protein (cotransfected with DDB1) were seeded into in a 96-well nonbinding surface plate with increasing concentrations of NanoBRET™ TE Tracer CRBN and lenalidomide. Cells were permeabilized with digitonin and then incubated for increasing periods of time before adding 3X Complete Substrate Solution (permeabilized-cell mode). BRET measurements were made on a GloMax® Discover System equipped with NanoBRET™ 618 filters (donor 450nm/8nm BP and acceptor 600nm LP). Raw BRET ratios were then converted to milliBRET units (mBU) and plotted either as a function of tracer concentration to determine the apparent affinity of the tracer, or as a function of test compound concentration to determine the apparent affinity of the test compound. Panel A. A decrease in assay window and right-shifting of apparent tracer potency is evident with increasing incubation time. Panel B. Increasing incubation time also resulted in a decrease in assay window and a right-shift in apparent lenalidomide affinity when measured at the recommended tracer concentration (Section 6). For these reasons, we recommend that: 1) incubations with test compounds in permeabilized-cell mode be confined to less than 25 minutes; and, 2) incubation times for all plates be kept consistent, with a maximum plate-to-plate incubation difference of 5 minutes.
10–4 10–2 100 102
10
20
300 minutes 3 minutes 9 minutes 21 minutes30 minutes 60 minutes
BRET
Rat
io (m
BU)
[Lenalidomide] (μM)
EC50
00.013
30.016
90.017
210.025
300.026
600.040
Time (minutes)
B.
10–2 10–1.5 10–1 10–0.5 100 100.5
10
20
30
400 minutes 3 minutes 9 minutes 21 minutes30 minutes60 minutes
BRET
Rat
io (m
BU)
[NanoBRET™ TE Tracer CRBN] (μM)
EC50
00.058
30.064
90.064
210.079
300.11
600.21
Time (minutes)
A.
1719
7MA
34 Promega Corporation · 2800 Woods Hollow Road · Madison, WI 53711-5399 USA · Toll Free in USA 800-356-9526 · 608-274-4330 · Fax 608-277-2516TM626 · 10/20 www.promega.com
9.B. Effect of DDB1 Co-Expression on the CRBN Assay
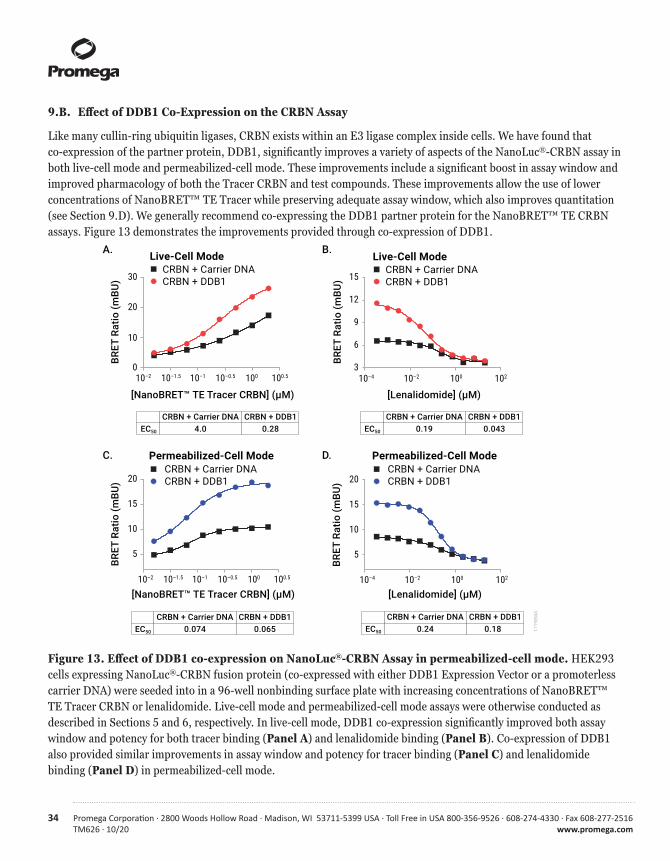
Like many cullin-ring ubiquitin ligases, CRBN exists within an E3 ligase complex inside cells. We have found that co-expression of the partner protein, DDB1, significantly improves a variety of aspects of the NanoLuc®-CRBN assay in both live-cell mode and permeabilized-cell mode. These improvements include a significant boost in assay window and improved pharmacology of both the Tracer CRBN and test compounds. These improvements allow the use of lower concentrations of NanoBRET™ TE Tracer while preserving adequate assay window, which also improves quantitation (see Section 9.D). We generally recommend co-expressing the DDB1 partner protein for the NanoBRET™ TE CRBN assays. Figure 13 demonstrates the improvements provided through co-expression of DDB1.
Figure 13. Effect of DDB1 co-expression on NanoLuc®-CRBN Assay in permeabilized-cell mode. HEK293 cells expressing NanoLuc®-CRBN fusion protein (co-expressed with either DDB1 Expression Vector or a promoterless carrier DNA) were seeded into in a 96-well nonbinding surface plate with increasing concentrations of NanoBRET™ TE Tracer CRBN or lenalidomide. Live-cell mode and permeabilized-cell mode assays were otherwise conducted as described in Sections 5 and 6, respectively. In live-cell mode, DDB1 co-expression significantly improved both assay window and potency for both tracer binding (Panel A) and lenalidomide binding (Panel B). Co-expression of DDB1 also provided similar improvements in assay window and potency for tracer binding (Panel C) and lenalidomide binding (Panel D) in permeabilized-cell mode.
5
10
15
20
C. D.CRBN + Carrier DNACRBN + DDB1
Permeabilized-Cell Mode
BRET
Rat
io (m
BU)
[NanoBRET™ TE Tracer CRBN] (μM)
CRBN + Carrier DNAEC50 0.074 0.065
CRBN + DDB1 CRBN + Carrier DNAEC50 0.24 0.18
CRBN + DDB1
10–4 10–2 100 102
[Lenalidomide] (μM)
5
10
15
20
BRET
Rat
io (m
BU)
CRBN + Carrier DNACRBN + DDB1
Permeabilized-Cell Mode
10–2 10–1.5 10–1 10–0.5 100 100.5
10–2 10–1.5 10–1 10–0.5 100 100.50
10
20
30
CRBN + Carrier DNA
Live-Cell ModeA.
CRBN + Carrier DNACRBN + DDB1
BRET
Rat
io (m
BU)
[NanoBRET™ TE Tracer CRBN] (μM)
EC50 4.0 0.28CRBN + DDB1
3
6
9
12
15
B. Live-Cell ModeCRBN + Carrier DNACRBN + DDB1
BRET
Rat
io (m
BU)
CRBN + Carrier DNAEC50 0.19 0.043
CRBN + DDB1
10–4 10–2 100 102
[Lenalidomide] (μM)
1719
8MA
Promega Corporation · 2800 Woods Hollow Road · Madison, WI 53711-5399 USA · Toll Free in USA 800-356-9526 · 608-274-4330 · Fax 608-277-2516 35www.promega.com TM626 · 10/20
9.C. Achieving Adequate Plate Mixing for 96-Well and 384-Well Formats
Due to the viscosity of the Tracer Dilution Buffer, special attention must be given to plate mixing to ensure that the Complete 20X NanoBRET™ Tracer Reagent is adequately dispersed in the assay. Creating a sufficient mixing vortex requires that the orbit of the mixer is smaller in diameter than the inside diameter of each well. For 96-well formats, most commercially available orbital shakers will be capable of dispersing the tracer reagent, though optimizing the shaking force may be required (typically by visual inspection). For the 384-well assay format, we recommend using specific equipment that creates a mixing vortex in the wells of 384-well plates. We have experience with horizontal shakers such as the VibraTranslator™ line of products from Union Scientific. Consult your mixing apparatus manufacturer to determine the suitability of your plate mixer for 384-well applications that use viscous reagents.
9.D. Achieving Quantitative Analysis of Test Compound and PROTAC Affinity
The NanoBRET™ TE Intracellular E3 Ligase Assays allow you to evaluate the affinity of a test compound for a target of interest. However, like other competitive binding assays, the apparent affinity of a test compound can be affected by the amount of the NanoBRET™ TE Tracer that is used in the assay. Because the tracer and test compound both compete for binding to the target NanoLuc® fusion, increasing concentrations of NanoBRET™ TE Tracer can shift the apparent IC50 value of the test drug to higher concentrations. This relationship, termed the “Cheng-Prusoff relationship” becomes most significant when the concentration of tracer is in excess of its affinity for the target NanoLuc® fusion.
If you are a new user of the NanoBRET™ TE Assay, we suggest that you measure the affinity of test compounds at the recommended concentration of tracer, which is usually a subsaturating dose between the EC50 and EC80 of the tracer. This provides a good starting point for the rank-ordering of test compound affinity for the E3 Ligase-NanoLuc® fusion. The recommended tracer concentration CRBN or VHL E3 ligases can be found above in Section 5. Live-Cell Mode Protocol, and Section 6. Permeabilized-Cell Mode Protocol.
Once familiar with the NanoBRET™ TE Assay, you can further optimize the tracer concentration to achieve a more quantitative analysis of test compound affinity. With careful choice of the NanoBRET™ TE Tracer concentration, the NanoBRET™ TE Assay allows you to achieve a more quantitative determination of test compound affinity that approaches the apparent intracellular affinity constant (intracellular Ki) for the target NanoLuc® fusion.
To improve quantitation of test compound affinity, choose a tracer concentration that is at or below the EC50 of the tracer for the target NanoLuc® fusion. An example of this approach is provided in Figure 14 (Panels A and B) and Figure 15 (Panel D) for a target with strong binding of the NanoBRET™ TE Tracer, as shown in the NanoBRET™ dose-response curve. Provided that the assay window is still adequate (ideally assay window >2), this approach will produce an IC50 for the test compound that is independent of the concentration of NanoBRET™ TE Tracer used in the experiment.
Due to the functional performance limits of the NanoBRET™ TE Tracers (typically 2µM), some targets cannot be saturated by the tracer under live cell assay conditions. In these cases (for an example, see Figure 15, Panel A), the apparent IC50 value of the test compound may appear insensitive to tracer concentration. Thus, the recommended tracer concentration is already a good choice for approaching quantitative analysis.
For users interested in more advanced approaches that directly measure the intracellular Ki, the Cheng-Prusoff relationship can be utilized to perform linear regression analysis for targets in which the tracer binding is saturable. For details on the linearized Cheng-Prusoff analysis, consult references 3 and 4 (Section 9.H).
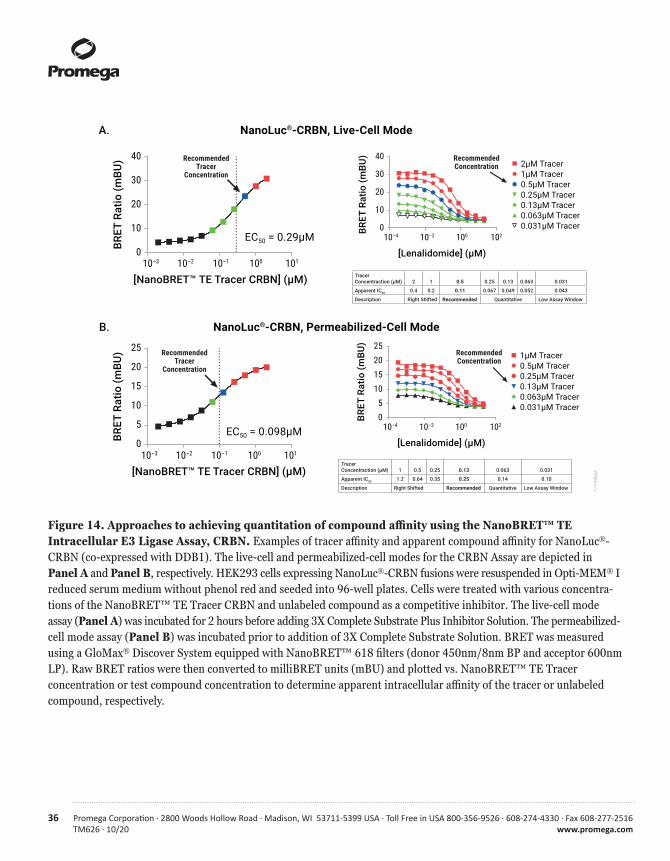
36 Promega Corporation · 2800 Woods Hollow Road · Madison, WI 53711-5399 USA · Toll Free in USA 800-356-9526 · 608-274-4330 · Fax 608-277-2516TM626 · 10/20 www.promega.com
Figure 14. Approaches to achieving quantitation of compound affinity using the NanoBRET™ TE Intracellular E3 Ligase Assay, CRBN. Examples of tracer affinity and apparent compound affinity for NanoLuc®-CRBN (co-expressed with DDB1). The live-cell and permeabilized-cell modes for the CRBN Assay are depicted in Panel A and Panel B, respectively. HEK293 cells expressing NanoLuc®-CRBN fusions were resuspended in Opti-MEM® I reduced serum medium without phenol red and seeded into 96-well plates. Cells were treated with various concentra-tions of the NanoBRET™ TE Tracer CRBN and unlabeled compound as a competitive inhibitor. The live-cell mode assay (Panel A) was incubated for 2 hours before adding 3X Complete Substrate Plus Inhibitor Solution. The permeabilized-cell mode assay (Panel B) was incubated prior to addition of 3X Complete Substrate Solution. BRET was measured using a GloMax® Discover System equipped with NanoBRET™ 618 filters (donor 450nm/8nm BP and acceptor 600nm LP). Raw BRET ratios were then converted to milliBRET units (mBU) and plotted vs. NanoBRET™ TE Tracer concentration or test compound concentration to determine apparent intracellular affinity of the tracer or unlabeled compound, respectively.
10–3 10–2 10–1 100 1010
10
20
30
40
10–4 10–2 100 1020
10
20
30
40
[Lenalidomide] (µM)
2µM Tracer1µM Tracer0.5µM Tracer0.25µM Tracer0.13µM Tracer0.063µM Tracer0.031µM Tracer
A. NanoLuc®-CRBN, Live-Cell Mode
EC50 = 0.29µM
BRET
Rat
io (m
BU)
[NanoBRET™ TE Tracer CRBN] (µM)
RecommendedTracer
Concentration
RecommendedConcentration
BRET
Rat
io (m
BU)
Tracer Concentraction (µM) 2 1 0.5 0.25 0.13 0.063 0.031
Apparent IC50 0.4 0.2 0.11 0.067 0.049 0.052 0.043
Description Right Shifted Recommended Quantitative Low Assay Window
0
5
10
15
20
25
05
10152025
1µM Tracer0.5µM Tracer0.25µM Tracer0.13µM Tracer0.063µM Tracer0.031µM Tracer
B.
RecommendedTracer
Concentration
EC50 = 0.098µM
10–3 10–2 10–1 100 101
BRET
Rat
io (m
BU)
[NanoBRET™ TE Tracer CRBN] (µM)
NanoLuc®-CRBN, Permeabilized-Cell Mode
RecommendedConcentration
10–4 10–2 100 102
[Lenalidomide] (µM)
BRET
Rat
io (m
BU)
Tracer Concentraction (µM) 1 0.5 0.25 0.13 0.063 0.031
Apparent IC50 1.2 0.64 0.35 0.25 0.14 0.10
Description Right Shifted Recommended Quantitative Low Assay Window 1719
9MA
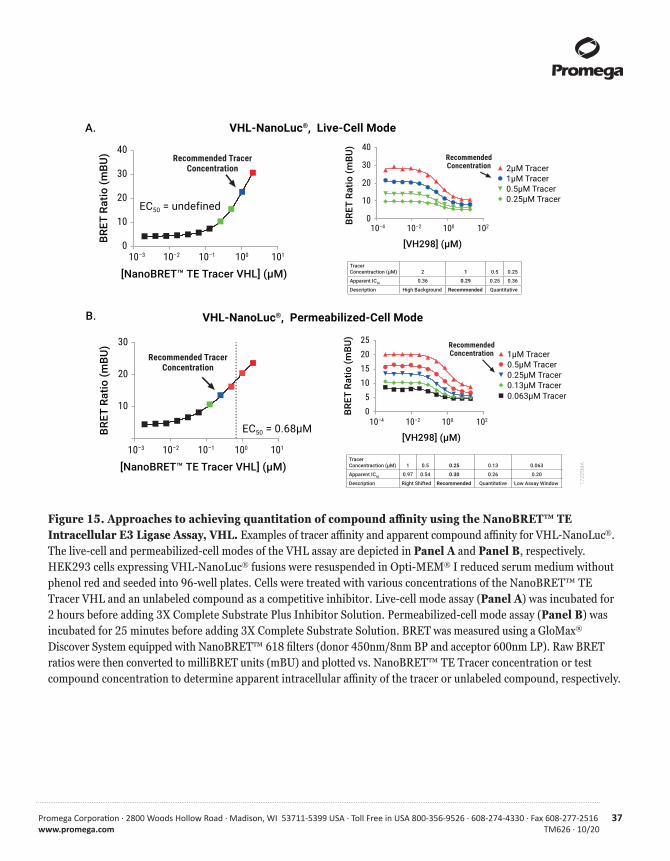
Promega Corporation · 2800 Woods Hollow Road · Madison, WI 53711-5399 USA · Toll Free in USA 800-356-9526 · 608-274-4330 · Fax 608-277-2516 37www.promega.com TM626 · 10/20
Figure 15. Approaches to achieving quantitation of compound affinity using the NanoBRET™ TE Intracellular E3 Ligase Assay, VHL. Examples of tracer affinity and apparent compound affinity for VHL-NanoLuc®. The live-cell and permeabilized-cell modes of the VHL assay are depicted in Panel A and Panel B, respectively. HEK293 cells expressing VHL-NanoLuc® fusions were resuspended in Opti-MEM® I reduced serum medium without phenol red and seeded into 96-well plates. Cells were treated with various concentrations of the NanoBRET™ TE Tracer VHL and an unlabeled compound as a competitive inhibitor. Live-cell mode assay (Panel A) was incubated for 2 hours before adding 3X Complete Substrate Plus Inhibitor Solution. Permeabilized-cell mode assay (Panel B) was incubated for 25 minutes before adding 3X Complete Substrate Solution. BRET was measured using a GloMax® Discover System equipped with NanoBRET™ 618 filters (donor 450nm/8nm BP and acceptor 600nm LP). Raw BRET ratios were then converted to milliBRET units (mBU) and plotted vs. NanoBRET™ TE Tracer concentration or test compound concentration to determine apparent intracellular affinity of the tracer or unlabeled compound, respectively.
10
20
301µM Tracer0.5µM Tracer0.25µM Tracer0.13µM Tracer0.063µM Tracer
B.
Recommended TracerConcentration
EC50 = 0.68µM
[NanoBRET™ TE Tracer VHL] (µM)10–3 10–2 10–1 100 101
BRET
Rat
io (m
BU)
VHL-NanoLuc®, Permeabilized-Cell Mode
RecommendedConcentration
05
10152025
BRET
Rat
io (m
BU)
[VH298] (µM)
10–4 10–2 100 102
Tracer Concentraction (µM) 1 0.5 0.25 0.13 0.063
Apparent IC50 0.97 0.54 0.30 0.26 0.20
Description Right Shifted Recommended Quantitative Low Assay Window
[VH298] (µM)
2µM Tracer1µM Tracer0.5µM Tracer0.25µM Tracer
A.
[NanoBRET™ TE Tracer VHL] (µM)10–3 10–2 10–1 100 101
0
10
20
30
40
BRET
Rat
io (m
BU)
EC50 = undefined
Recommended TracerConcentration
RecommendedConcentration
VHL-NanoLuc®, Live-Cell Mode
10–4 10–2 100 1020
10
20
30
40
BRET
Rat
io (m
BU)
Tracer Concentraction (µM) 2 1 0.5 0.25
Apparent IC50 0.36 0.29 0.25 0.36
Description High Background Recommended Quantitative
1722
5MA
38 Promega Corporation · 2800 Woods Hollow Road · Madison, WI 53711-5399 USA · Toll Free in USA 800-356-9526 · 608-274-4330 · Fax 608-277-2516TM626 · 10/20 www.promega.com
9.E. Preparing Stable Cell Lines Expressing NanoLuc® Fusion Proteins
Some users may prefer to use stable cell lines for the NanoBRET™ assay as opposed to cells that have been transiently transfected. This approach can help to shorten the assay workflow and improve day-to-day assay variability. However, the NanoLuc® expression vectors are designed for transient transfection and use relatively strong constitutive promoters (CMV). To avoid overexpression in stable cell lines, we recommend the use of attenuated promoters (i.e., CMV deletion promoters, the PGK promoter or the TK promoter) for appropriate expression of the NanoLuc® fusion protein.
An alternative to stable cell lines is the use of assay-ready cells that have been pretransfected with the NanoLuc® fusion protein of interest. Assay-ready cells can be prepared in advance in bulk, aliquoted and cryopreserved, after which individual tubes can be thawed on demand and used immediately in the NanoBRET™ TE assay. This approach can also help to shorten the assay workflow and improve day-to-day assay variability.
9.F. Extinction Coefficient of NanoBRET™ TE Tracers
CRBN and VHL NanoBRET™ TE Tracers use the NanoBRET™ 590 fluorophore. The concentration of each NanoBRET™ TE Tracer was determined using an extinction coefficient of 83,000 M–1 cm–1 at 590nm. See Table 10.1 in reference for details (6).
9.G. NanoBRET™ Donor and Acceptor Emission Spectra
The NanoBRET™ TE Assays have been optimized to use a blue-shifted NanoLuc® donor and a red-shifted fluorescent tracer acceptor that have minimal spectral overlap within the assay (Figure 16). This results in an optimized signal:background ratio and hence an optimized NanoBRET™ ratio.
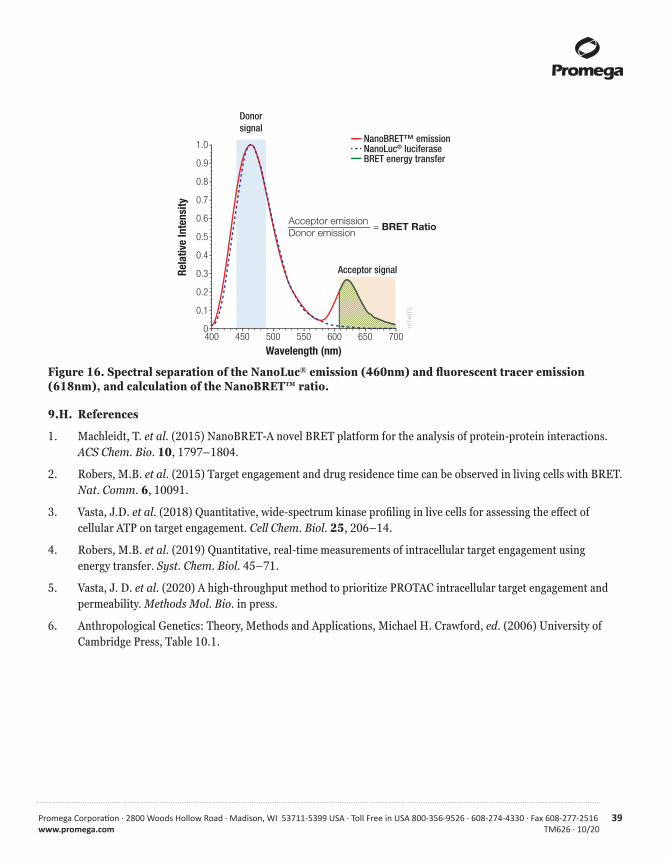
Promega Corporation · 2800 Woods Hollow Road · Madison, WI 53711-5399 USA · Toll Free in USA 800-356-9526 · 608-274-4330 · Fax 608-277-2516 39www.promega.com TM626 · 10/20
Figure 16. Spectral separation of the NanoLuc® emission (460nm) and fluorescent tracer emission (618nm), and calculation of the NanoBRET™ ratio.
9.H. References
1. Machleidt, T. et al. (2015) NanoBRET-A novel BRET platform for the analysis of protein-protein interactions. ACS Chem. Bio. 10, 1797–1804.
2. Robers, M.B. et al. (2015) Target engagement and drug residence time can be observed in living cells with BRET. Nat. Comm. 6, 10091.
3. Vasta, J.D. et al. (2018) Quantitative, wide-spectrum kinase profiling in live cells for assessing the effect of cellular ATP on target engagement. Cell Chem. Biol. 25, 206–14.
4. Robers, M.B. et al. (2019) Quantitative, real-time measurements of intracellular target engagement using energy transfer. Syst. Chem. Biol. 45–71.
5. Vasta, J. D. et al. (2020) A high-throughput method to prioritize PROTAC intracellular target engagement and permeability. Methods Mol. Bio. in press.
6. Anthropological Genetics: Theory, Methods and Applications, Michael H. Crawford, ed. (2006) University of Cambridge Press, Table 10.1.
4000
0.1
0.2
0.3
0.4
0.5
0.6
0.7
0.8
0.9
1.0
450 500 550 600 650 700
Wavelength (nm)
Rela
tive
Inte
nsity
Acceptor signal
Donorsignal
Acceptor emissionDonor emission = BRET Ratio
1274
9TC
NanoBRET™ emission
BRET energy transferNanoLuc® luciferase
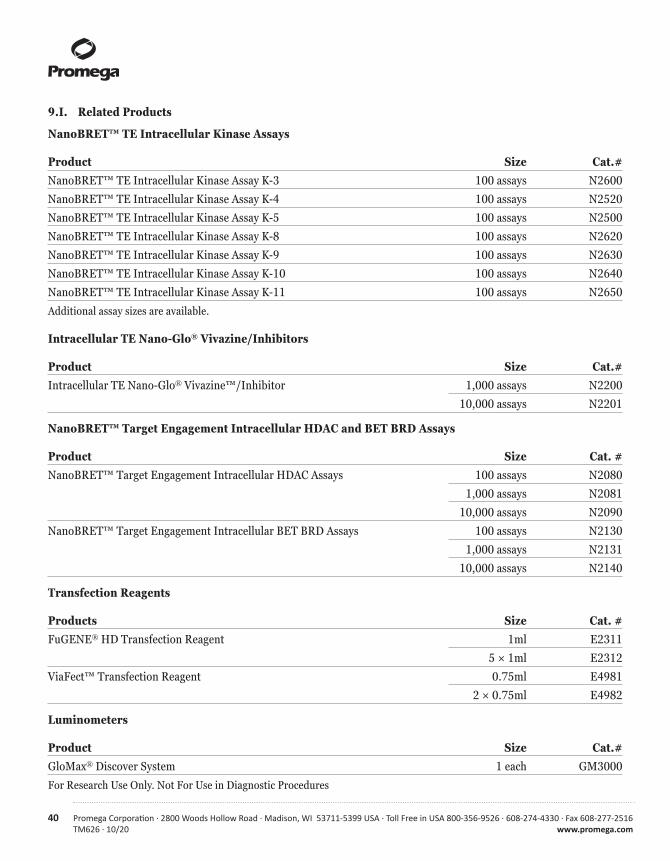
40 Promega Corporation · 2800 Woods Hollow Road · Madison, WI 53711-5399 USA · Toll Free in USA 800-356-9526 · 608-274-4330 · Fax 608-277-2516TM626 · 10/20 www.promega.com
9.I. Related Products
NanoBRET™ TE Intracellular Kinase Assays
Product Size Cat.#NanoBRET™ TE Intracellular Kinase Assay K-3 100 assays N2600
NanoBRET™ TE Intracellular Kinase Assay K-4 100 assays N2520
NanoBRET™ TE Intracellular Kinase Assay K-5 100 assays N2500
NanoBRET™ TE Intracellular Kinase Assay K-8 100 assays N2620
NanoBRET™ TE Intracellular Kinase Assay K-9 100 assays N2630
NanoBRET™ TE Intracellular Kinase Assay K-10 100 assays N2640
NanoBRET™ TE Intracellular Kinase Assay K-11 100 assays N2650
Additional assay sizes are available.
Intracellular TE Nano-Glo® Vivazine/Inhibitors
Product Size Cat.#Intracellular TE Nano-Glo® Vivazine™/Inhibitor 1,000 assays N2200
10,000 assays N2201
NanoBRET™ Target Engagement Intracellular HDAC and BET BRD Assays
Product Size Cat. #NanoBRET™ Target Engagement Intracellular HDAC Assays 100 assays N2080
1,000 assays N2081
10,000 assays N2090
NanoBRET™ Target Engagement Intracellular BET BRD Assays 100 assays N2130
1,000 assays N2131
10,000 assays N2140
Transfection Reagents
Products Size Cat. #FuGENE® HD Transfection Reagent 1ml E2311
5 × 1ml E2312
ViaFect™ Transfection Reagent 0.75ml E4981
2 × 0.75ml E4982
Luminometers
Product Size Cat.#GloMax® Discover System 1 each GM3000
For Research Use Only. Not For Use in Diagnostic Procedures
Promega Corporation · 2800 Woods Hollow Road · Madison, WI 53711-5399 USA · Toll Free in USA 800-356-9526 · 608-274-4330 · Fax 608-277-2516 41www.promega.com TM626 · 10/20
(a)BY USE OF THIS PRODUCT, RESEARCHER AGREES TO BE BOUND BY THE TERMS OF THIS LIMITED USE LABEL LICENSE. If researcher is not willing to accept the terms of this label license, and the product is unused, Promega will accept return of the unused product and provide researcher with a full refund.
Researcher may use this product for research use only; no commercial use is allowed. Commercial use means any and all uses of this product by a party in exchange for consideration, including, but not limited to (1) use in further product manufacture; (2) use in provision of services, information or data; and (3) resale of the product, whether or not such product is resold for use in research. Researcher shall have no right to modify or otherwise create variations of the product. No other use or transfer of this product is authorized without the prior express written consent of Promega.
For uses of this product intended for energy transfer (such as bioluminescence resonance energy transfer) to acceptors other than genetically encoded autofluorescent protein, researcher must:
(i) use NanoBRET™-branded energy acceptors (e.g., NanoBRET™ tracers, NanoBRET™ dyes, BRET-optimized HaloTag® ligands) for all determinations of energy transfer activity; (ii) contact Promega to obtain a license for use of the product for energy transfer assays using energy acceptors not manufactured by Promega.
With respect to any uses outside this label license, including any diagnostic, therapeutic, prophylactic or commercial uses, please contact Promega for supply and licensing information. PROMEGA MAKES NO REPRESENTATIONS OR WARRANTIES OF ANY KIND, EITHER EXPRESSED OR IMPLIED, INCLUDING FOR MERCHANTABILITY OR FITNESS FOR A PARTICULAR PURPOSE, WITH REGARD TO THE PRODUCT. The terms of this label license shall be governed under the laws of the State of Wisconsin, USA.(b)BY USE OF THIS PRODUCT, RESEARCHER AGREES TO BE BOUND BY THE TERMS OF THIS LIMITED USE LABEL LICENSE. If researcher is not willing to accept the terms of this label license, and the product is unused, Promega will accept return of the unused product and provide researcher with a full refund.
Researcher may use this product for research use only; no commercial use is allowed. Commercial use means any and all uses of this product by a party in exchange for consideration, including, but not limited to (1) use in further product manufacture; (2) use in provision of services, information or data; and (3) resale of the product, whether or not such product is resold for use in research. Researcher shall have no right to modify or otherwise create variations of the product. No other use or transfer of this product is authorized without the prior express written consent of Promega.
For uses of this product for energy transfer (such as bioluminescence resonance energy transfer), researcher must:
(i) use NanoLuc®-branded luciferase or derivatives for all energy transfer determinations conducted with this product; and (ii) use NanoBRET™-branded luminescent assay reagents (LARs; e.g. NanoBRET™ Nano-Glo® Substrate), Intracellular TE Nano-Glo® Substrate/Inhibitor, or Intracellular TE Nano-Glo® Vivazine/Inhibitor for all determinations of luminescent activity; or (iii) contact Promega to obtain a license for use of the product with LARs not listed above or manufactured by Promega.
In addition, researcher must:
Contact Promega to obtain a license for use of the product in assays not involving bioluminescence resonance energy transfer (BRET).
With respect to any uses outside this label license, including any diagnostic, therapeutic, prophylactic or commercial uses, please contact Promega for supply and licensing information. PROMEGA MAKES NO REPRESENTATIONS OR WARRANTIES OF ANY KIND, EITHER EXPRESSED OR IMPLIED, INCLUDING FOR MERCHANTABILITY OR FITNESS FOR A PARTICULAR PURPOSE, WITH REGARD TO THE PRODUCT. The terms of this label license shall be governed under the laws of the State of Wisconsin, USA.
42 Promega Corporation · 2800 Woods Hollow Road · Madison, WI 53711-5399 USA · Toll Free in USA 800-356-9526 · 608-274-4330 · Fax 608-277-2516TM626 · 10/20 www.promega.com
(c)BY USE OF THIS PRODUCT, RESEARCHER AGREES TO BE BOUND BY THE TERMS OF THIS LIMITED USE LABEL LICENSE. If researcher is not willing to accept the terms of this label license, and the product is unused, Promega will accept return of the unused product and provide researcher with a full refund.
Researcher may use this product for research use only; no transfer or commercial use of this product is allowed. Commercial use means any and all uses of this product by a party in exchange for consideration, including, but not limited to (1) use in further product manufacture; (2) use in provision of services, information or data; and (3) resale of the product, whether or not such product is resold for use in research. Researcher shall have no right to modify or otherwise create variations of the nucleotide sequence of the luciferase gene. No other use of this product is authorized without the prior express written consent of Promega.
In addition, researcher must:
(1a) use Nano-Glo®-branded luminescent assay reagents (LARs) for all determinations of luminescence activity of this product; or (1b) contact Promega to obtain a license for use of the product with LARs not manufactured by Promega.
For uses of this product (NanoLuc® ORF Vector) for energy transfer (such as bioluminescence resonance energy transfer), researcher must:
(2a) use NanoBRET™-branded luminescent assay reagents (LARs; e.g. NanoBRET™ Nano-Glo® Substrate), Intracellular TE Nano-Glo® Substrate/Inhibitor, or Intracellular TE Nano-Glo® VivazineTM/Inhibitor for all determinations of luminescent activity; and (2b) use NanoBRET™-branded energy acceptors (e.g., NanoBRET™ tracers, NanoBRET™ dyes, BRET-optimized HaloTag® ligands) for all determinations of energy transfer activity; or (2c) contact Promega to obtain a license for use of the product for energy transfer assays using energy acceptors not manufactured by Promega. No license is needed if the energy transfer acceptor is a genetically encoded autofluorescent protein.
With respect to any uses outside this label license, including any diagnostic, therapeutic, prophylactic or commercial uses, please contact Promega for supply and licensing information. PROMEGA MAKES NO REPRESENTATIONS OR WARRANTIES OF ANY KIND, EITHER EXPRESSED OR IMPLIED, INCLUDING FOR MERCHANTABILITY OR FITNESS FOR A PARTICULAR PURPOSE, WITH REGARD TO THE PRODUCT. The terms of this label license shall be governed under the laws of the State of Wisconsin, USA.(d)Licensed under EP1295121 and EP1088233.(e)U.S. Pat. Nos. 8,557,970, 8,669,103, 9,777,311, 9,840,730, 9,951,373 and 10,633,690, European Pat. Nos. 2990478, 2456864, 2635595 and 3181687 and other patents and patents pending.(f)U.S. Pat. No. 8,809,529 and other patents and patents pending.(g)U.S. Pat. Nos. 10,067,149 and 10,024,862 and other patents and patents pending. (h)U.S. Pat. No. 10,513,694 and other patents and patents pending.
© 2020 Promega Corporation. All Rights Reserved.
GloMax, Nano-Glo and NanoLuc are registered trademarks of Promega Corporation. NanoBRET, Viafect and Vivazine are trademarks of Promega Corporation.
CLARIOstar is a registered trademark of BMG Labtech. Corning is a registered trademark of Corning, Inc. Envision is a registered trademark of PerkinElmer, Inc. FuGENE is a registered trademark of Fugent, L.L.C., USA. Opti-MEM and Varioskan are registered trademarks of Thermo Fisher Scientific. VibraTranslator is a trademark of Union Scientific Corporation.
Products may be covered by pending or issued patents or may have certain limitations. Please visit our Web site for more information.
All prices and specifications are subject to change without prior notice.
Product claims are subject to change. Please contact Promega Technical Services or access the Promega online catalog for the most up-to-date information on Promega products.