nanobret™ protein:protein interaction system - …/media/files/resources/protocols/technical...
TRANSCRIPT
Revised 12/16 TM439
T E C H N I C A L M A N U A L
NanoBRET™ Protein:Protein Interaction SystemInstructions for Use of Products N1661, N1662 and N1663

Promega Corporation · 2800 Woods Hollow Road · Madison, WI 53711-5399 USA · Toll Free in USA 800-356-9526 · 608-274-4330 · Fax 608-277-2516 1www.promega.com TM439 · Revised 12/16
All technical literature is available at: www.promega.com/protocols/ Visit the web site to verify that you are using the most current version of this Technical Manual.
E-mail Promega Technical Services if you have questions on use of this system: [email protected]
NanoBRET™ Protein:Protein Interaction System
1. Description .........................................................................................................................................2
2. Product Components and Storage Conditions ........................................................................................4
3. General Considerations .......................................................................................................................63.A. Instrumentation .........................................................................................................................63.B. Strategy and Workflow for Setting Up and Optimizing a NanoBRET™ Assay ...................................6
4. Before You Begin .................................................................................................................................84.A. Constructing NanoBRET™ Expression Vectors .............................................................................84.B. Instrument Setup........................................................................................................................94.C. NanoBRET™ PPI Control Pair (p53, MDM2) .............................................................................. 104.D. NanoBRET™ Positive Control ................................................................................................... 11
5. NanoBRET™ Protocols ...................................................................................................................... 125.A. Transient Transfection of HEK293 Cells with HaloTag® and NanoLuc® Fusions ............................ 125.B. Replating Transfected HEK293 Cells into Multiwell Plates and Adding HaloTag® NanoBRET™ 618
Ligand ..................................................................................................................................... 155.C. Optional Protocol for Testing Compounds or Inhibitors ............................................................... 165.D. Adding NanoBRET™ Nano-Glo® Substrate and Taking NanoBRET™ Measurements ..................... 165.E. NanoBRET™ Calculations ......................................................................................................... 17
6. Representative Data ......................................................................................................................... 18
7. Troubleshooting................................................................................................................................ 20
8. Composition of Buffers and Solutions ................................................................................................. 22
9. References ........................................................................................................................................ 22
10. Appendix .......................................................................................................................................... 2310.A. Assay Validation Recommendations ........................................................................................... 2310.B. Donor Saturation Assay (DSA) Protocol ..................................................................................... 2310.C. Multiplexing with the CellTiter-Glo® 2.0 Assay ........................................................................... 26
11. Related Products ............................................................................................................................... 27
12. Summary of Change .......................................................................................................................... 27
2 Promega Corporation · 2800 Woods Hollow Road · Madison, WI 53711-5399 USA · Toll Free in USA 800-356-9526 · 608-274-4330 · Fax 608-277-2516TM439 · Revised 12/16 www.promega.com
1. Description
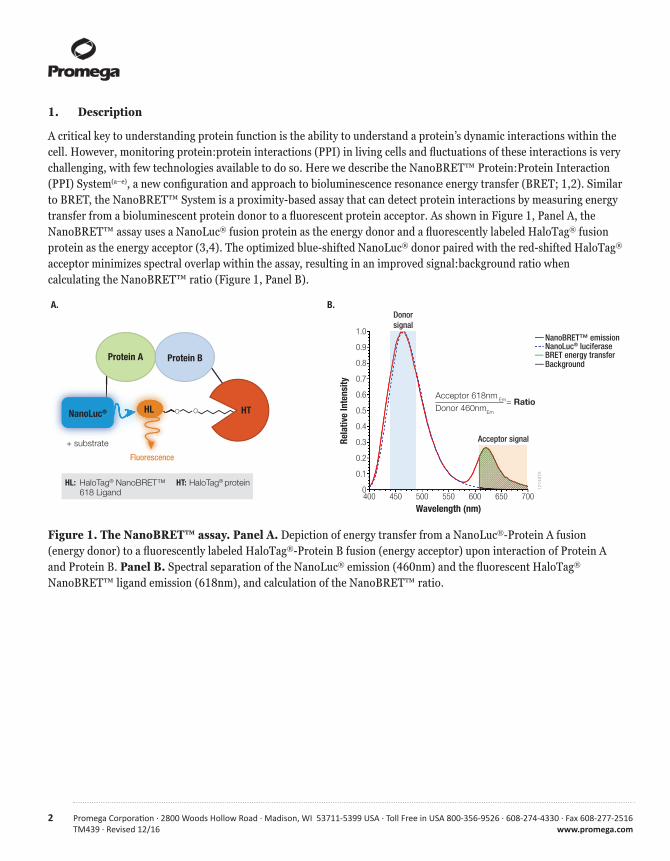
A critical key to understanding protein function is the ability to understand a protein’s dynamic interactions within the cell. However, monitoring protein:protein interactions (PPI) in living cells and fluctuations of these interactions is very challenging, with few technologies available to do so. Here we describe the NanoBRET™ Protein:Protein Interaction (PPI) System(a–e), a new configuration and approach to bioluminescence resonance energy transfer (BRET; 1,2). Similar to BRET, the NanoBRET™ System is a proximity-based assay that can detect protein interactions by measuring energy transfer from a bioluminescent protein donor to a fluorescent protein acceptor. As shown in Figure 1, Panel A, the NanoBRET™ assay uses a NanoLuc® fusion protein as the energy donor and a fluorescently labeled HaloTag® fusion protein as the energy acceptor (3,4). The optimized blue-shifted NanoLuc® donor paired with the red-shifted HaloTag® acceptor minimizes spectral overlap within the assay, resulting in an improved signal:background ratio when calculating the NanoBRET™ ratio (Figure 1, Panel B).
NanoLuc® OOHL HT
Protein A Protein B
HL: HT:HaloTag® NanoBRET™618 Ligand
HaloTag® protein
Fluorescence
+ substrate
A. B.
Background
NanoBRET™ emission
BRET energy transferNanoLuc® luciferase
4000
0.1
0.2
0.3
0.4
0.5
0.6
0.7
0.8
0.9
1.0
450 500 550 600 650 700
Wavelength (nm)
Rela
tive
Inte
nsity
Acceptor signal
Donorsignal
Acceptor 618nm Em
Donor 460nmEm
= Ratio
1274
9TA
Figure 1. The NanoBRET™ assay. Panel A. Depiction of energy transfer from a NanoLuc®-Protein A fusion (energy donor) to a fluorescently labeled HaloTag®-Protein B fusion (energy acceptor) upon interaction of Protein A and Protein B. Panel B. Spectral separation of the NanoLuc® emission (460nm) and the fluorescent HaloTag® NanoBRET™ ligand emission (618nm), and calculation of the NanoBRET™ ratio.
Promega Corporation · 2800 Woods Hollow Road · Madison, WI 53711-5399 USA · Toll Free in USA 800-356-9526 · 608-274-4330 · Fax 608-277-2516 3www.promega.com TM439 · Revised 12/16
1275
0MA
Co-transfect donor and acceptor vectors.
Replate cells with and without HaloTag® NanoBRET™ 618 Ligand.
Add NanoBRET™ Nano-Glo® Substrate, and measure donor and acceptor signals.
Calculate NanoBRET™Corrected Ratio.
= LigandNanoBRET™CorrectedRatio
No-ligandcontrol–618nm
460nm( ( 618nm460nm( (
GloMax® Discover System
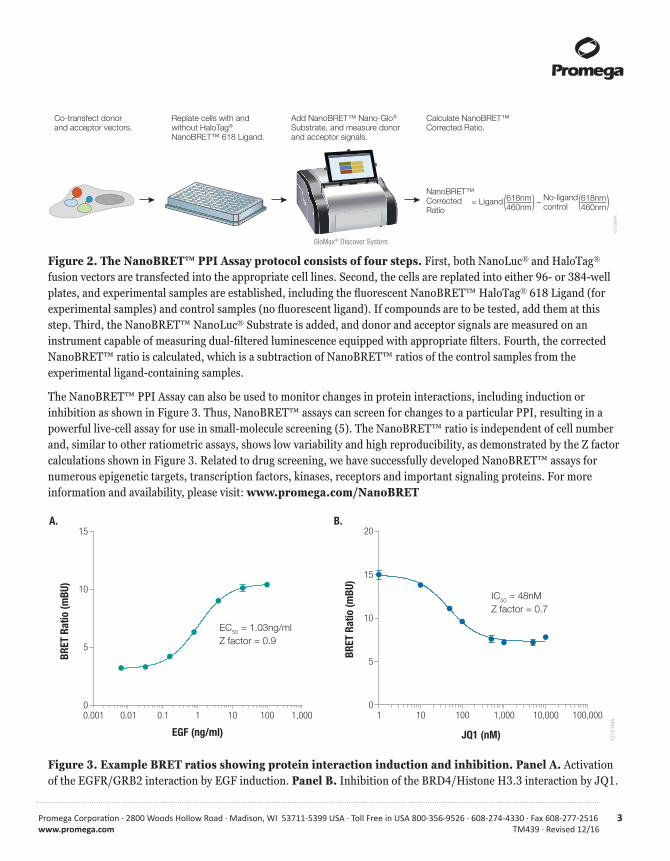
Figure 2. The NanoBRET™ PPI Assay protocol consists of four steps. First, both NanoLuc® and HaloTag® fusion vectors are transfected into the appropriate cell lines. Second, the cells are replated into either 96- or 384-well plates, and experimental samples are established, including the fluorescent NanoBRET™ HaloTag® 618 Ligand (for experimental samples) and control samples (no fluorescent ligand). If compounds are to be tested, add them at this step. Third, the NanoBRET™ NanoLuc® Substrate is added, and donor and acceptor signals are measured on an instrument capable of measuring dual-filtered luminescence equipped with appropriate filters. Fourth, the corrected NanoBRET™ ratio is calculated, which is a subtraction of NanoBRET™ ratios of the control samples from the experimental ligand-containing samples.
The NanoBRET™ PPI Assay can also be used to monitor changes in protein interactions, including induction or inhibition as shown in Figure 3. Thus, NanoBRET™ assays can screen for changes to a particular PPI, resulting in a powerful live-cell assay for use in small-molecule screening (5). The NanoBRET™ ratio is independent of cell number and, similar to other ratiometric assays, shows low variability and high reproducibility, as demonstrated by the Z factor calculations shown in Figure 3. Related to drug screening, we have successfully developed NanoBRET™ assays for numerous epigenetic targets, transcription factors, kinases, receptors and important signaling proteins. For more information and availability, please visit: www.promega.com/NanoBRET
1275
1MA
0.001 0.01 0.1 101 100 1,0000
5
10
15
EC50 = 1.03ng/ml Z factor = 0.9
EGF (ng/ml)
BRET
Rat
io (m
BU)
100101 1,000 10,000 100,0000
5
10
15
20
IC50 = 48nMZ factor = 0.7
JQ1 (nM)
BRET
Rat
io (m
BU)
A. B.
Figure 3. Example BRET ratios showing protein interaction induction and inhibition. Panel A. Activation of the EGFR/GRB2 interaction by EGF induction. Panel B. Inhibition of the BRD4/Histone H3.3 interaction by JQ1.

4 Promega Corporation · 2800 Woods Hollow Road · Madison, WI 53711-5399 USA · Toll Free in USA 800-356-9526 · 608-274-4330 · Fax 608-277-2516TM439 · Revised 12/16 www.promega.com
2. Product Components and Storage Conditions
P R O D U C T S I Z E C AT. #
NanoBRET™ Nano-Glo® Detection System 200 assays N1661
This system is sufficient for 200 assays performed in 96-well plates. This system also can be used in 384-well plates for a total of 500 assays. Includes:
• 1 × 50µl NanoBRET™ Nano-Glo® Substrate• 1 × 20µl HaloTag® NanoBRET™ 618 Ligand
P R O D U C T S I Z E C AT. #
NanoBRET™ Nano-Glo® Detection System 1,000 assays N1662
This system is sufficient for 1,000 assays performed in 96-well plates. This system also can be used in 384-well plates for a total of 2,500 assays. Includes:
• 5 × 50µl NanoBRET™ Nano-Glo® Substrate• 5 × 20µl HaloTag® NanoBRET™ 618 Ligand
P R O D U C T S I Z E C AT. #
NanoBRET™ Nano-Glo® Detection System 10,000 assays N1663
This system is sufficient for 10,000 assays performed in 96-well plates. This system also can be used in 384-well plates for a total of 25,000 assays. Includes:
• 2 × 1.25ml NanoBRET™ Nano-Glo® Substrate• 1 × 1ml HaloTag® NanoBRET™ 618 Ligand
Storage Conditions: Store at –30°C to –10°C protected from light. The HaloTag® NanoBRET™ 618 Ligand can be frozen and thawed up to 5 times.
Control Vectors
P R O D U C T S I Z E C AT. #
NanoBRET™ Positive Control 1 each N1581
Includes:
• 20µg NanoBRET™ Positive Control Vector• 20µg Transfection Carrier DNA
P R O D U C T S I Z E C AT. #
NanoBRET™ PPI Control Pair (p53, MDM2): 1 each N1641
Includes:
• 20µg p53-HaloTag®Fusion Vector• 20µg NanoLuc®-MDM2 Fusion Vector

Promega Corporation · 2800 Woods Hollow Road · Madison, WI 53711-5399 USA · Toll Free in USA 800-356-9526 · 608-274-4330 · Fax 608-277-2516 5www.promega.com TM439 · Revised 12/16
Note: Enough substrate and ligand is provided for the number of assays indicated for the NanoBRET™ Nano-Glo® Detection Systems. Because we recommend always including a set of samples without HaloTag® NanoBRET™ 618 Ligand as a negative control, you may have extra ligand. The individual detection reagents are also available to purchase separately.
Available Separately
P R O D U C T S I Z E C AT. #
NanoBRET™ Nano-Glo® Substrate 50µl N1571
5 × 50µl N1572
2 × 1.25ml N1573
HaloTag® NanoBRET™ 618 Ligand 20µl G9801
P R O D U C T S I Z E C AT. #
NanoBRET™ PPI Assay Flexi® Starter Bundle 1 each N1821
Includes:
• NanoBRET™ Nano-Glo® Detection System, 200 assays• NanoBRET™ PPI Control Pair (p53, MDM2)• pFN31K Nluc CMV-neo Flexi® Vector• pFC32K Nluc CMV-neo Flexi® Vector• pFN21A HaloTag® CMV Flexi® Vector• pFC14K HaloTag® CMV Flexi® Vector
P R O D U C T S I Z E C AT. #
NanoBRET™ PPI Assay MCS Starter Bundle 1 each N1811
Includes:
• NanoBRET™ Nano-Glo® Detection System, 200 assays• NanoBRET™ PPI Control Pair (p53, MDM2)• pNLF1-N (CMV/Hygro) Vector• pNLF1-C (CMV/Hygro) Vector• pHTN HaloTag® CMV-neo Vector• pHTC HaloTag® CMV-neo Vector
Transfection Reagent
P R O D U C T S I Z E C AT. #
FuGENE® HD Transfection Reagent 1ml E2311
5 × 1ml E2312

6 Promega Corporation · 2800 Woods Hollow Road · Madison, WI 53711-5399 USA · Toll Free in USA 800-356-9526 · 608-274-4330 · Fax 608-277-2516TM439 · Revised 12/16 www.promega.com
3. General Considerations
In this section, we describe critical factors for your NanoBRET™ PPI Assay, including instrumentation requirements and a strategy overview for developing and optimizing an assay.
3.A. Instrumentation
To perform NanoBRET™ PPI Assays, use an instrument capable of sequentially measuring dual-filtered luminescence values equipped with appropriate filters. The ideal filter setup will include a band pass (BP) filter centered around 460nm to measure the donor signal (Emission 450nm/BP 80nm) and a long pass (LP) filter starting at around 600–610nm to measure the acceptor signal (Emission 610nm/LP). Note: Filters outside of these ranges will miss critical measurements and compromise data quality.
3.B. Strategy and Workflow for Setting Up and Optimizing a NanoBRET™ Assay
Figure 4 lists the steps necessary for generating and optimizing a NanoBRET™ assay in cases where there are no known constraints about where a particular protein can be tagged. In cases where more than one donor/acceptor combination is acceptable, these validating experiments help select the more robust configuration.
Promega Corporation · 2800 Woods Hollow Road · Madison, WI 53711-5399 USA · Toll Free in USA 800-356-9526 · 608-274-4330 · Fax 608-277-2516 7www.promega.com TM439 · Revised 12/16
A
A A
ANL
NL
NL
NL
HT
HT
HT
HT
B
B
B
HT B
HT B
B
A ANL
ANL
NLHT
AHT NL B
B
NL
NL B
BA ANL
A NL
HT
A HT
HTB
1275
2MA
HTB
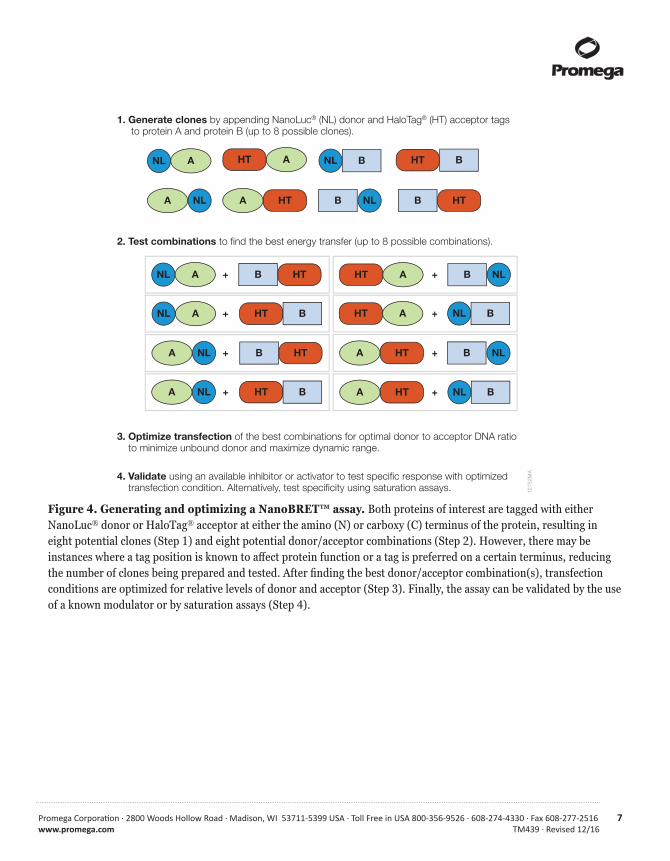
1. Generate clones by appending NanoLuc® (NL) donor and HaloTag® (HT) acceptor tags to protein A and protein B (up to 8 possible clones).
2. Test combinations to find the best energy transfer (up to 8 possible combinations).
3. Optimize transfection of the best combinations for optimal donor to acceptor DNA ratio to minimize unbound donor and maximize dynamic range.
4. Validate using an available inhibitor or activator to test specific response with optimized transfection condition. Alternatively, test specificity using saturation assays.
+
+
+
+
+
+
+
+
Figure 4. Generating and optimizing a NanoBRET™ assay. Both proteins of interest are tagged with either NanoLuc® donor or HaloTag® acceptor at either the amino (N) or carboxy (C) terminus of the protein, resulting in eight potential clones (Step 1) and eight potential donor/acceptor combinations (Step 2). However, there may be instances where a tag position is known to affect protein function or a tag is preferred on a certain terminus, reducing the number of clones being prepared and tested. After finding the best donor/acceptor combination(s), transfection conditions are optimized for relative levels of donor and acceptor (Step 3). Finally, the assay can be validated by the use of a known modulator or by saturation assays (Step 4).
8 Promega Corporation · 2800 Woods Hollow Road · Madison, WI 53711-5399 USA · Toll Free in USA 800-356-9526 · 608-274-4330 · Fax 608-277-2516TM439 · Revised 12/16 www.promega.com
4. Before You Begin
4.A. Constructing NanoBRET™ Expression Vectors
Two sets of vectors exist for creating NanoBRET™ fusions to the proteins of interest (POI). These vectors are compatible with the Flexi® Vector System, which facilitates rapid cloning of all constructs of interest, or conventional vectors using multiple cloning sites (MCS).
Flexi® Vector System compatible vectors
For detailed information on the Flexi® Vector System, please refer to the Flexi® Vector Systems Technical Manual #TM254 available at: www.promega.com/protocols
In brief, Flexi® vectors contain a lethal gene that must be replaced with the desired gene of interest for cells to survive and colonies to form. The optimized protocols and reagents greatly reduce the overall cloning burden, especially when generating up to eight different constructs for a given PPI pair.
The standard protocol for cloning PCR products can be used to introduce genes of interest into the various HaloTag® vectors, NanoLuc® vectors or both. To reduce the cloning burden, each POI can be initially cloned from a PCR product into the amino (N) terminal HaloTag® entry vector pFN21A HaloTag® CMV Flexi® Vector (Cat.# G2821), and after sequencing confirmation, transferred to the remaining vectors without the need to sequence the insert for each construct. Please refer to Section 4 of the Flexi® Vector Systems Technical Manual #TM254 for the transfer protocol. Note: For vectors that append the tags on the carboxy (C) terminus, use a modified version of the Section 4.B protocol where the Carboxy Flexi® Enzyme Blend (SgfI & EcoICRI) is used in the vector digest for Step 2 instead of the Flexi® Enzyme Blend (SgfI & PmeI) as described in Technical Manual #TM254.
A simpler cloning approach is to transfer the open reading frame (ORF) of interest from an existing Flexi® compatible vector to the HaloTag® and NanoLuc® fusion vectors. Use our Find My Gene™ resource (www.promega.com/findmygene/search.aspx) to search a list of nearly 10,000 constructs to determine if one exists with your gene of interest. These ORFs were cloned into pFN21A HaloTag® CMV Flexi® Vector, which appends the HaloTag® protein to the N terminus of the fusion protein. Follow the protocols in Sections 5.A and 5.B of Technical Manual #TM254 to transfer an ORF to the remaining HaloTag® (C-terminal) and NanoLuc® (N- and C-terminal) fusion vectors.
MCS vectors
Follow standard cloning procedures to introduce genes of interest into the various MCS vectors as described for the individual vector protocols.

Promega Corporation · 2800 Woods Hollow Road · Madison, WI 53711-5399 USA · Toll Free in USA 800-356-9526 · 608-274-4330 · Fax 608-277-2516 9www.promega.com TM439 · Revised 12/16
4.B. Instrument Setup
To perform NanoBRET™ PPI Assays, a luminometer capable of sequentially measuring dual wavelength windows is required. This is accomplished by using filters; we recommend using a band pass (BP) filter for the donor signal and a long pass filter (LP) for the acceptor signal to maximize sensitivity.
1. The NanoBRET™ bioluminescent donor emission occurs at 460nm. To measure this donor signal, we recommend a band pass (BP) filter that covers close to 460nm with a band pass range of 8–80nm. For example, a 450nm/BP80 will capture the 410nm to 490nm range.
Note: A BP filter is preferred for the donor signal measurement to selectively capture the signal peak and avoid measuring any acceptor peak bleed-through. However, a short pass (SP) filter that covers the 460nm area also can be used. This may result in an artificially large value for the donor signal and measuring the bleed-through into the acceptor peak, which could compress the ratio calculation, reducing the assay window.
2. The NanoBRET™ acceptor emission occurs at 618nm. To measure the acceptor signal, we recommend a long pass filter starting at 600–610nm.
Instruments capable of dual-luminescence measurements are either equipped with a filter selection or the filters can be purchased and added separately. For instruments using mirrors, select the luminescence mirror. An integration time of 0.2–1 second is typically sufficient. Ensure that the gain on the PMT is optimized to capture the highest donor signal without reaching instrument saturation.
Consult with your instrument manufacturer to determine if the proper filters are installed or what steps are needed to add filters to the luminometer. For example, a special holder or cube might be required for the filters to be mounted, and the shape and thickness may vary among instruments. We have experience with the following instruments and configurations:
1. The GloMax® Discover System (Cat.# GM3000) with preloaded filters for donor 450nm/8nm BP and acceptor 600nm LP. Select the preloaded BRET:NanoBRET™ 618 protocol from the Protocol menu.
2. BMG Labtech CLARIOstar® with preloaded filters for donor 450nm/80nm BP and acceptor 610nm LP
3. Thermo Varioskan® with filters obtained from Edmunds Optics, using donor 450nm CWL, 25mm diameter, 80nm FWHM, Interference Filter and acceptor 1 inch diameter, RG-610 Long Pass Filter
Another instrument capable of measuring dual luminescence is the PerkinElmer EnVision® Multilabel Reader with the following recommended setup:• Mirror: Luminescence - Slot4• Emission filter: Chroma Cat.# AT600LP- EmSlot4• Second emission filter: Chroma Cat.# AT460/50m - EmSlot1• Measurement height (mm): 6.5• Measurement time (seconds): 1

10 Promega Corporation · 2800 Woods Hollow Road · Madison, WI 53711-5399 USA · Toll Free in USA 800-356-9526 · 608-274-4330 · Fax 608-277-2516TM439 · Revised 12/16 www.promega.com
4.C. NanoBRET™ PPI Control Pair (p53, MDM2)
To ensure your instrument has been configured properly, we recommend testing with the NanoBRET™ PPI Control Pair (p53, MDM2; Cat.# N1641) consisting of the interacting protein partners p53 and MDM2 either available separately or included in the NanoBRET™ PPI Assay Flexi® Starter Bundle (Cat.# N1821) and the NanoBRET™ PPI Assay MCS Starter Bundle (Cat.# N1811). This reference control pair can also be used as a control when running other NanoBRET™ assays. The p53/MDM2 interaction can be specifically disrupted by the commercially available compound Nutlin-3 (6; Tocris Cat.# 3984). Figure 5 shows representative data with this system generated using the GloMax® Discover System (Cat.# GM3000). In all cases, the expected biological response to Nutlin-3 was observed. For this system as well as other NanoBRET™ PPI Assays, the absolute NanoBRET™ ratios will be dependent on several factors, including the proximity of the protein partners, affinity of the interaction, relative occupancy and instrument setup. Absolute values should not be compared between systems or instruments.
1275
3MA
Nutlin-3 (µM)
BRET
Rat
io (m
BU)
A.
B. C.
Vehicle 10µM Nutlin-3
12.5
4.8
BRET
Rat
io (m
BU)
Z factor = 0.8
96-Well Plate
0
2
4
6
8
10
12
14
Vehicle 10µM Nutlin-3
BRET
Rat
io (m
BU) 14.4
5.1
Z factor = 0.8
384-Well Plate
0
5
10
15
20
0.0001 0.001 0.01 0.1 1 10 1000
2
4
6
8
10
12
14
16
IC50 = 1.9µM
Figure 5. Representative data for the p53/MDM2 NanoBRET™ PPI Control Pair. Panel A is a dose-response curve (DRC) against the specific inhibitor Nutlin-3. Panels B and C show single-dose measurements and calculation of Z factors in the 96-well format (Panel B) and 384-well format (Panel C). Data generated using the GloMax® Discover System equipped with 450nm/8nm BP and 600nm LP filters.
Promega Corporation · 2800 Woods Hollow Road · Madison, WI 53711-5399 USA · Toll Free in USA 800-356-9526 · 608-274-4330 · Fax 608-277-2516 11www.promega.com TM439 · Revised 12/16
4.D. NanoBRET™ Positive Control
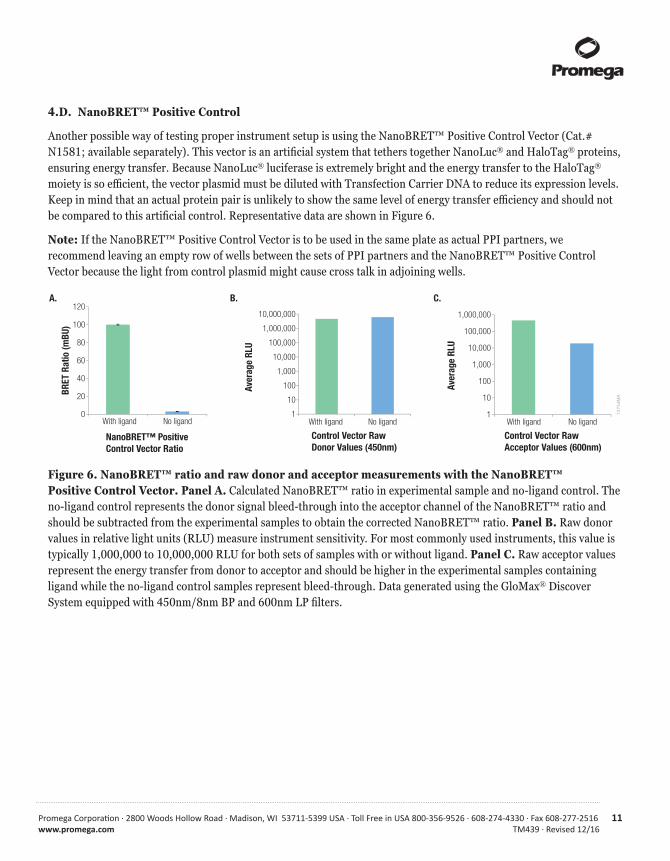
Another possible way of testing proper instrument setup is using the NanoBRET™ Positive Control Vector (Cat.# N1581; available separately). This vector is an artificial system that tethers together NanoLuc® and HaloTag® proteins, ensuring energy transfer. Because NanoLuc® luciferase is extremely bright and the energy transfer to the HaloTag® moiety is so efficient, the vector plasmid must be diluted with Transfection Carrier DNA to reduce its expression levels. Keep in mind that an actual protein pair is unlikely to show the same level of energy transfer efficiency and should not be compared to this artificial control. Representative data are shown in Figure 6.
Note: If the NanoBRET™ Positive Control Vector is to be used in the same plate as actual PPI partners, we recommend leaving an empty row of wells between the sets of PPI partners and the NanoBRET™ Positive Control Vector because the light from control plasmid might cause cross talk in adjoining wells.
1275
4MA
A. B. C.
With ligand No ligand
BRET
Rat
io (m
BU)
NanoBRET™ Positive Control Vector Ratio
0
20
40
60
80
100
120
With ligand No ligand1
10
100
1,000
10,000
100,000
1,000,000
10,000,000
Aver
age
RLU
Control Vector Raw Donor Values (450nm)
Aver
age
RLU
1
10
100
1,000
10,000
100,000
1,000,000
With ligand No ligand
Control Vector Raw Acceptor Values (600nm)
Figure 6. NanoBRET™ ratio and raw donor and acceptor measurements with the NanoBRET™ Positive Control Vector. Panel A. Calculated NanoBRET™ ratio in experimental sample and no-ligand control. The no-ligand control represents the donor signal bleed-through into the acceptor channel of the NanoBRET™ ratio and should be subtracted from the experimental samples to obtain the corrected NanoBRET™ ratio. Panel B. Raw donor values in relative light units (RLU) measure instrument sensitivity. For most commonly used instruments, this value is typically 1,000,000 to 10,000,000 RLU for both sets of samples with or without ligand. Panel C. Raw acceptor values represent the energy transfer from donor to acceptor and should be higher in the experimental samples containing ligand while the no-ligand control samples represent bleed-through. Data generated using the GloMax® Discover System equipped with 450nm/8nm BP and 600nm LP filters.
12 Promega Corporation · 2800 Woods Hollow Road · Madison, WI 53711-5399 USA · Toll Free in USA 800-356-9526 · 608-274-4330 · Fax 608-277-2516TM439 · Revised 12/16 www.promega.com
5. NanoBRET™ Protocols
Materials to be Supplied by the User• HEK293 or similar cultured mammalian cells• white, 96-well plate (Costar Cat.# 3917) or 384-well plate (Corning Cat.# 3570)• tissue culture equipment and reagents (see Composition of Buffers and Solutions, Section 8).• DPBS (Invitrogen Cat.# 14190) • 0.05% Trypsin/EDTA (Invitrogen Cat.# 25300)• FuGENE® HD Transfection Reagent (Cat.# E2311)• HaloTag® constructs, tissue culture grade DNA• NanoLuc® constructs, tissue culture grade DNA• DMEM (Gibco Cat.#11995)• fetal bovine serum (HyClone Cat.# SH30070.03)• Opti-MEM® I Reduced Serum Medium, no phenol red (Life Technologies Cat.# 11058-021)• DMSO (Sigma Cat.# 2650)• Nuclease-Free Water (Cat.# P1191)• Optional: p53/MDM2 inhibitor Nutlin-3 (Tocris Cat.# 3984)
5.A. Transient Transfection of HEK293 Cells with HaloTag® and NanoLuc® Fusions
Note: Follow the appropriate transfection scheme as DNA amounts required are different for the various controls or the various stages of assay optimization. The five different transfection schemes are:• Checking instrument performance by NanoBRET™ PPI Control Pair• Checking instrument performance by NanoBRET™ Positive Control• Assay optimization: Testing all combinations of initial protein pairs • Assay optimization: Diluting NanoLuc® Donor DNA• NanoBRET™ assay with optimized tag placement and DNA concentration conditions
Following the transfection step, all the remaining steps in the protocol remain identical regardless of type of transfection performed.
Transfection Conditions for NanoBRET™ PPI Control Pair
1. Culture HEK293 cells appropriately prior to assay.
2. Remove medium from cell flask by aspiration, trypsinize and allow cells to dissociate from the flask bottom.
3. Neutralize trypsin using cell culture medium, count cells to estimate density and resuspend to a final density of 4 × 10⁵ cells/ml in cell culture medium.
4. Plate 2ml of cells (800,000 cells) into a well of a six-well plate.
5. Allow the cells to attach and recover for 4–6 hours at 37°C, 5% CO2.
6. Prepare a transfection mixture consisting of 2µg of p53-HaloTag® Fusion Vector DNA + 0.2µg of NanoLuc®-MDM2 Fusion Vector DNA diluted in water.
Promega Corporation · 2800 Woods Hollow Road · Madison, WI 53711-5399 USA · Toll Free in USA 800-356-9526 · 608-274-4330 · Fax 608-277-2516 13www.promega.com TM439 · Revised 12/16
7. Add 100µl of Opti-MEM® I Reduced Serum Medium, no phenol red, to the transfection mixture, and mix well.
8. Add 8µl of FuGENE® HD Transfection Reagent, and incubate at room temperature for 10 minutes.
9. Add transfection mixture to wells with attached cells, and express proteins for approximately 20 hours at 37°C, 5% CO2.
10. Proceed to Section 5.B, or if testing compounds, go to Section 5.C.
Transfection Conditions for NanoBRET™ Positive Control
1. Culture HEK293 cells appropriately prior to assay.
2. Remove medium from cell flask by aspiration, trypsinize and allow cells to dissociate from the flask bottom.
3. Neutralize trypsin using cell culture medium, count cells to estimate density and resuspend to a final density of 4 × 10⁵ cells/ml in cell culture medium.
4. Plate 2ml of cells (800,000 cells) into a well of a six-well plate.
5. Allow the cells to attach and recover for 4–6 hours at 37°C, 5% CO2.
6. Prepare a transfection mixture consisting of 2µg of Transfection Carrier DNA + 0.002µg of NanoBRET™ Positive Control Vector diluted in water.
7. Add 100µl of Opti-MEM® I Reduced Serum Medium, no phenol red, to the transfection mixture, and mix well.
8. Add 8µl of FuGENE® HD Transfection Reagent, and incubate at room temperature for 10 minutes.
9. Add transfection mixture to wells with attached cells, and express proteins for approximately 20 hours at 37°C, 5% CO2.
10. Proceed to Section 5.B, or if testing compounds, go to Section 5.C.
Transfection Conditions for Assay Optimization: Testing all Combinations of Initial Protein Pairs
1. Culture HEK293 cells appropriately prior to assay.
2. Remove medium from cell flask by aspiration, trypsinize and allow cells to dissociate from the flask bottom.
3. Neutralize trypsin using cell culture medium, count cells to estimate density and resuspend to a final density of 4 × 10⁵ cells/ml in cell culture medium.
4. Plate 2ml of cells (800,000 cells) into a well of a six-well plate.
5. Allow the cells to attach and recover for 4–6 hours at 37°C, 5% CO2.
6. Prepare transfection mixture or mixtures consisting of 2µg of HaloTag® plasmid + 0.2µg of NanoLuc® plasmid diluted in water for each combination being tested.
7. Add 100µl of Opti-MEM® I Reduced Serum Medium, no phenol red, to the transfection mixture, and mix well.
8. Add 8µl of FuGENE® HD Transfection Reagent, and incubate at room temperature for 10 minutes.
9. Add transfection mixture to wells with attached cells, and express proteins for approximately 20 hours at 37°C, 5% CO2.
10. Proceed to Section 5.B, or if testing compounds, go to Section 5.C.

14 Promega Corporation · 2800 Woods Hollow Road · Madison, WI 53711-5399 USA · Toll Free in USA 800-356-9526 · 608-274-4330 · Fax 608-277-2516TM439 · Revised 12/16 www.promega.com
5.A. Transient Transfection of HEK293 Cells with HaloTag® and NanoLuc® Fusion (continued)
Transfection Conditions for Assay Optimization: NanoLuc® Donor DNA Dilution
1. Culture HEK293 cells appropriately prior to assay.
2. Remove medium from cell flask by aspiration, trypsinize and allow cells to dissociate from the flask bottom.
3. Neutralize trypsin using cell culture medium, count cells to estimate density and resuspend to a final density of 4 × 10⁵ cells/ml in cell culture medium.
4. Plate 2ml of cells (800,000 cells) into a well of a six-well plate.
5. Allow the cells to attach and recover for 4–6 hours at 37°C, 5% CO2.
6. Prepare transfection mixtures as depicted below for each selected combination from the initial screening (usually 2–4 combinations) with different amounts of HaloTag® and NanoLuc® DNA representing tenfold dilutions of the NanoLuc® DNA to reduce the amount of free donor as expressed proteins. To assemble reactions, serially dilute the NanoLuc® DNA plasmids tenfold in water. For each transfection mixture, the total amount of DNA is roughly 2µg.
Ratio Desired Amount Used
1:1 (NanoLuc® to HaloTag®) 1µg HaloTag® plasmid + 1µg NanoLuc® plasmid
1:10 (NanoLuc® to HaloTag®) 2µg HaloTag® plasmid + 0.2µg NanoLuc® plasmid
1:100 (NanoLuc® to HaloTag®) 2µg HaloTag® plasmid + 0.02µg NanoLuc® plasmid
1:1,000 (NanoLuc® to HaloTag®) 2µg HaloTag® plasmid + 0.002µg NanoLuc® plasmid
7. Add 100µl of Opti-MEM® I Reduced Serum Medium, no phenol red, to the transfection mixture, and mix well.
8. Add 8µl of FuGENE® HD Transfection Reagent, and incubate at room temperature for 10 minutes.
9. Add transfection mixture to wells with attached cells, and express proteins for approximately 20 hours at 37°C, 5% CO2.
10. Proceed to Section 5.B, or if testing compounds, go to Section 5.C.
Transfection Conditions for a NanoBRET™ PPI Assay with Optimized Tag Placement and DNA Concentration
Follow the optimized and validated protocol for your assay. For assay validation suggestions, see Section 10.
1. Culture HEK293 cells appropriately prior to assay.
2. Remove medium from cell flask by aspiration, trypsinize and allow cells to dissociate from the flask bottom.
3. Neutralize trypsin using cell culture medium, count cells to estimate density and resuspend to a final density of 4 × 10⁵ cells/ml in cell culture medium.
4. Plate 2ml of cells (800,000 cells) into each well of six-well plates sufficient for the number of planned assays. After transfection and cell division, three wells of a six-well plate yield enough cells for assaying one 96-well plate.
Promega Corporation · 2800 Woods Hollow Road · Madison, WI 53711-5399 USA · Toll Free in USA 800-356-9526 · 608-274-4330 · Fax 608-277-2516 15www.promega.com TM439 · Revised 12/16
5. Allow the cells to attach and recover for 4–6 hours at 37°C, 5% CO2.
6. Prepare a transfection mixture consisting of the optimized pair and relative DNA concentrations. For example, prepare 2µg of HaloTag® plasmid + 0.02µg of NanoLuc® plasmid (diluted in water) if the 1:100 dilution yielded the best results.
7. Add 100µl of Opti-MEM® I Reduced Serum Medium, no phenol red, to the transfection mixture, and mix well.
8. Add 8µl of FuGENE® HD Transfection Reagent, and incubate at room temperature for 10 minutes.
9. Add transfection mixture to wells with attached cells, and express proteins for approximately 20 hours at 37°C, 5% CO2.
10. Proceed to Section 5.B, or if testing compounds, go to Section 5.C.
5.B. Replating Transfected HEK293 Cells into Multiwell Plates and Adding HaloTag® NanoBRET™ 618 Ligand
1. For each well in a six-well plate, remove medium from cells, and wash with 1ml of DPBS. Discard.
2. Add 0.5ml of 0.05% trypsin-EDTA, and incubate at room temperature until cells lift from well bottom.
3. Add 2ml of cell culture medium to neutralize trypsin, mix to collect and resuspend cells, and transfer cell suspension to a 15ml conical tube.
4. Spin cells down at 125 × g for 5 minutes. Discard cell culture medium, and resuspend in an equal volume of assay medium (Opti-MEM® I Reduced Serum Medium, no phenol red + 4% FBS).
5. Count to estimate cell density, and adjust density to 2 × 10⁵ cells/ml in assay medium. To cover an entire 96-well plate, you need at least 10ml of cells at this concentration. For a 384-well plate, you need approximately 16ml of cells at this concentration.
Note: If compounds or inhibitors are being tested, use the optional protocol in Section 5.C, which adjusts cell density and volume to accommodate compounds being tested.
6. Divide cells into two pools, and add HaloTag® NanoBRET™ 618 Ligand or DMSO vehicle as follows:
Experimental samples (+ ligand): Add 1µl of 0.1mM HaloTag® NanoBRET™ 618 Ligand per milliliter of cells (100nM final concentration).
No-acceptor controls (– ligand): Add 1µl of DMSO per milliliter of cells (0.1% DMSO final concentration).
7. For NanoBRET™ measurements without compound treatment, plate cells in the volumes indicated below:
96-well format: Dispense 100µl of each pool of the cells prepared in Step 6 in at least 3–4 wells.
384-well format: Dispense 40µl of each pool of the cells prepared in Step 6 in at least 3–4 wells.
8. Incubate plates at 37°C, 5% CO2 a minimum of 4–6 hours to overnight (18–24 hours).
9. Proceed to Section 5.D.

16 Promega Corporation · 2800 Woods Hollow Road · Madison, WI 53711-5399 USA · Toll Free in USA 800-356-9526 · 608-274-4330 · Fax 608-277-2516TM439 · Revised 12/16 www.promega.com
5.C. Optional Protocol for Testing Compounds or Inhibitors
1. For each well in a six-well plate, remove medium from cells, and wash with 1ml of DPBS. Discard.
2. Add 0.5ml of 0.05% trypsin-EDTA, and incubate at room temperature until cells lift from well bottom.
3. Add 2ml of cell culture medium to neutralize trypsin, mix to collect and resuspend cells, and transfer cell suspension to a 15ml conical tube.
4. Spin cells down at 125 × g for 5 minutes. Discard cell culture medium, and resuspend in an equal volume of assay medium (Opti-MEM® I Reduced Serum Medium, no phenol red + 4% FBS).
5. Count to estimate cell density, and adjust density to 2.2 × 10⁵ cells/ml in assay medium. To cover an entire 96-well plate, you need at least 10ml of cells at this concentration. For an entire 384-well plate, you need approximately 16ml of cells at this concentration.
6. Divide cells into two pools, and add HaloTag® NanoBRET™ 618 Ligand or DMSO vehicle as follows:
Experimental samples (+ ligand): Add 1µl of 0.1mM HaloTag® NanoBRET™ 618 Ligand per milliliter of cells (100nM final concentration).
No-acceptor controls (– ligand): Add 1µl of DMSO per milliliter of cells (0.1% DMSO final concentration).
7. Plate cells in the volumes indicated below:
96-well format: Dispense 90µl of each pool of the cells prepared in Step 6 in at least 3–4 wells.
384-well format: Dispense 36µl of each pool of the cells prepared in Step 6 in at least 3–4 wells
8. Add compounds at tenfold higher than that desired for the final concentration in assay media (e.g.,100µM for 10µM final concentration):
96-well format: Dispense 10µl of 10X compound or vehicle to plated cells.
384-well format: Dispense 4µl of 10X compound or vehicle to plated cells.
9. Incubate plates at 37°C, 5% CO2 a minimum of 4–6 hours to overnight (18–24 hours). For maximum compound effect, we recommend overnight incubation.
10. Proceed to Section 5.D.
Note regarding Dose-Response Curves (DRC): If compounds or inhibitors are to be tested at a range of concentrations, perform serial dilutions in diluent containing the same amount of solvent as the highest concentration. For example, if the highest 10X concentration contains 1% DMSO, subsequent dilutions should be done in assay media containing 1% DMSO to keep the final concentration at 0.1% DMSO for all samples. For a vehicle or zero control, add DMSO containing media without compound. The NanoBRET™ assay has been tested at up to 0.5% final DMSO concentration with no consequence. Higher DMSO concentrations may be tolerated in the assay.
5.D. Adding NanoBRET™ Nano-Glo® Substrate and Taking NanoBRET™ Measurements
1. Prepare a 5X solution of NanoBRET™ Nano-Glo® Substrate in Opti-MEM® I Reduced Serum Medium, no phenol red. This is a 100-fold dilution of the stock reagent. For one 96-well plate, prepare a minimum of 2.5ml of medium + 25µl of stock reagent. For one 384-well plate, prepare a minimum of 3.9ml of medium + 39µl of stock reagent. For both multiwell formats, we recommend preparing at least 10% extra solution to account for dead volume, especially if using automated dispensing.
Note: Use the 5X solution within 2 hours if stored at room temperature or within 4 hours if stored at 4°C.
Promega Corporation · 2800 Woods Hollow Road · Madison, WI 53711-5399 USA · Toll Free in USA 800-356-9526 · 608-274-4330 · Fax 608-277-2516 17www.promega.com TM439 · Revised 12/16
2. Add substrate to cells, and shake plate to mix for 30 seconds. (We recommend using an electromagnetic mixer for the 384-well format.):
96-well format: Add 25µl of substrate.
384-well format: Add 10µl of substrate.
3. Measure donor emission (460nm) and acceptor emission (618nm) within 10 minutes of substrate addition using a NanoBRET™ PPI Assay-compatible luminometer (see Section 4.B).
Note: You can use the same plate to determine cell viability and determine the effect of compounds on cell viability (i.e., toxicity) by multiplexing with CellTiter-Glo® 2.0 Assay (Cat.# G9241). After taking NanoBRET™ measurements, keep the plate and follow the protocol in Section 10.C.
5.E. NanoBRET™ Calculations
1. Divide the acceptor emission value (e.g., 618nm) by the donor emission value (e.g., 460nm) for each sample to generate raw NanoBRET™ ratio values.
618nmEm = Raw NanoBRET™ Ratio = BU 460nmEm
2. To convert raw NanoBRET™ units (typically decimal values) to milliBRET units (mBU; whole numbers), multiply each raw BRET value by 1,000.
618nmEm = BU × 1,000 = mBU 460nmEm
3. Determine the mean NanoBRET™ ratio for each set of samples: Experimental samples with HaloTag® NanoBRET™ 618 Ligand and no-acceptor control samples. To factor in donor-contributed background or bleed-through, subtract the no-acceptor control mean from the Experimental mean for the corrected NanoBRET™ ratio.
Mean mBU experimental – Mean mBU no-ligand control = Mean corrected mBU
4. Optional: Generate Z´ and Z factor calculations to gauge assay consistency (7). A Z´ factor estimates assay consistency by comparing the mean and standard deviation values of the experimental samples and a baseline control such as the no-ligand control.
Z´ factor = 1 – (3X STDV experimental + 3X STDV no-ligand control)
(Mean mBU experimental – Mean mBU no-ligand control)
In the presence of a modulator, such as an inhibitor, a Z factor (different from a Z´ factor) takes into account both the assay variability and the difference between a treated sample and a vehicle control (delta). Use corrected mBU and STDV for these calculations. In general, an assay with a Z´ or Z value between 0.5–1 is considered to be robust with lower assay variability. In the following example, the treated sample represents an inhibitor. However, if measuring an enhancer, reverse the values in the formula to ensure a positive value.
Z factor = 1 – (3X STDV untreated + 3X STDV treated)
(Mean mBU untreated – Mean mBU treated)
][
][
18 Promega Corporation · 2800 Woods Hollow Road · Madison, WI 53711-5399 USA · Toll Free in USA 800-356-9526 · 608-274-4330 · Fax 608-277-2516TM439 · Revised 12/16 www.promega.com
6. Representative Data
1275
6MA
A-HT +NL-B
HT-A +NL-B
A-HT +B-NL
HT-A +B-NL
HT-B +A-NL
HT-B +NL-A
B-HT +A-NL
B-HT +NL-A
A-HT +NL-B
HT-A +NL-B
A-HT +B-NL
HT-A +B-NL
HT-B +A-NL
HT-B +NL-A
B-HT +A-NL
B-HT +NL-A
8.1
5.0
14.3
9.1
2.3 3.0
5.77.2
02468
10121416
A-HT +NL-B
HT-A +NL-B
A-HT +B-NL
HT-A +B-NL
HT-B +A-NL
HT-B +NL-A
B-HT +A-NL
B-HT +NL-A
BRET
Rat
io (m
BU)
NanoBRET™ Ratios of PPI Combinations Tested
0
500,000
1,000,000
1,500,000
2,000,000
2,500,000
3,000,000
Lum
ines
cenc
e (R
LU)
Lum
ines
cenc
e (R
LU)
Raw 460nm Donor Values
Raw 618nm Acceptor Values
LigandControl
LigandControl
0
10,000
20,000
30,000
40,000
50,000
A.
B.
C.
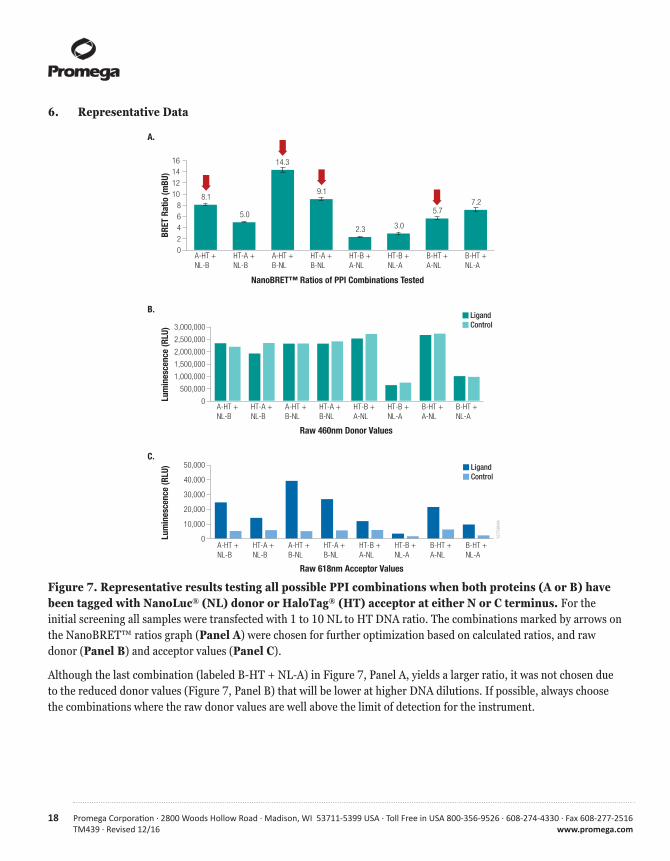
Figure 7. Representative results testing all possible PPI combinations when both proteins (A or B) have been tagged with NanoLuc® (NL) donor or HaloTag® (HT) acceptor at either N or C terminus. For the initial screening all samples were transfected with 1 to 10 NL to HT DNA ratio. The combinations marked by arrows on the NanoBRET™ ratios graph (Panel A) were chosen for further optimization based on calculated ratios, and raw donor (Panel B) and acceptor values (Panel C).
Although the last combination (labeled B-HT + NL-A) in Figure 7, Panel A, yields a larger ratio, it was not chosen due to the reduced donor values (Figure 7, Panel B) that will be lower at higher DNA dilutions. If possible, always choose the combinations where the raw donor values are well above the limit of detection for the instrument.

Promega Corporation · 2800 Woods Hollow Road · Madison, WI 53711-5399 USA · Toll Free in USA 800-356-9526 · 608-274-4330 · Fax 608-277-2516 19www.promega.com TM439 · Revised 12/16
1275
7MA
BRET
Rat
io (m
BU)
Lum
ines
cenc
e (R
LU)
Lum
ines
cenc
e (R
LU)
Raw 460nm Donor Values
Raw 618nm Acceptor Values
LigandControl
LigandControl
A.
B.
C.
2.6
8.3
15.3 15.6
02468
1012141618
1 to 1 1 to 10 1 to 100 1 to 1,000
1 to 1 1 to 10 1 to 100 1 to 1,000
1 to 1 1 to 10 1 to 100 1 to 1,000
NanoBRET™ Ratios of NanoLuc® to HaloTag® DNA Dilutions
0
200,000
400,000
600,000
800,000
1,000,000
0
2,000
4,000
6,000
8,000
Figure 8. One of the top combinations from the initial screen shown in Figure 7 (HT-A + B-NL) was chosen for serial dilution of NL DNA to find the optimal amount yielding the best dynamic range. Equal amounts of NL and HT DNA (1 to 1) and 1 to 10, 1 to 100, and 1 to 1,000 dilutions of NL relative to HT DNA were used.
The 1 to 100 dilution marked by an arrow on the NanoBRET™ ratios graph was chosen as the optimal NL to HT DNA ratio. Note that the 1 to 1,000 dilution also yields a similar ratio, but the raw donor values are extremely low running into the risk of operating too close to the instrument limit of detection, which is likely to increase variability.
20 Promega Corporation · 2800 Woods Hollow Road · Madison, WI 53711-5399 USA · Toll Free in USA 800-356-9526 · 608-274-4330 · Fax 608-277-2516TM439 · Revised 12/16 www.promega.com
7. Troubleshooting
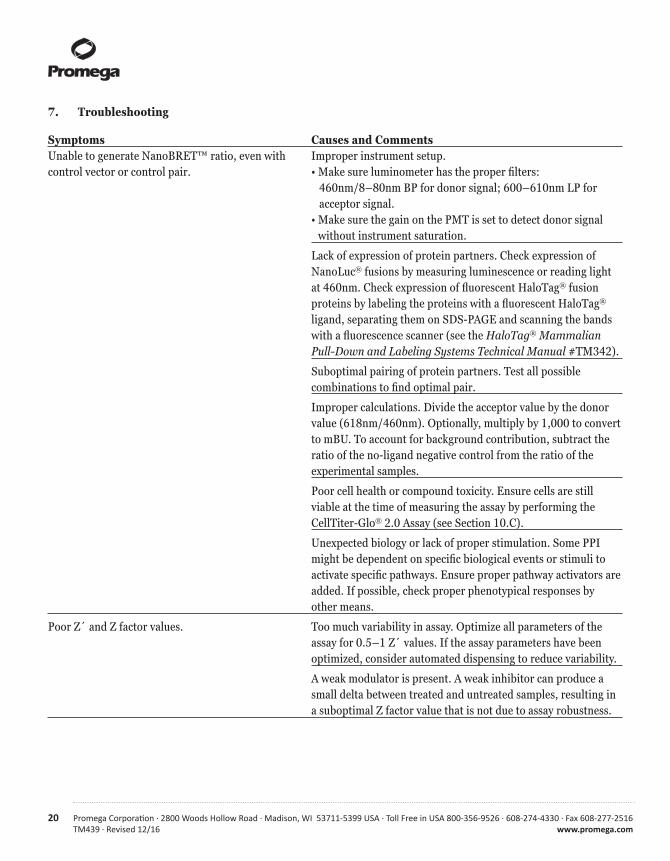
Symptoms Causes and CommentsUnable to generate NanoBRET™ ratio, even with Improper instrument setup. control vector or control pair. • Make sure luminometer has the proper filters: 460nm/8–80nm BP for donor signal; 600–610nm LP for acceptor signal. • Make sure the gain on the PMT is set to detect donor signal
without instrument saturation.
Lack of expression of protein partners. Check expression of NanoLuc® fusions by measuring luminescence or reading light at 460nm. Check expression of fluorescent HaloTag® fusion proteins by labeling the proteins with a fluorescent HaloTag® ligand, separating them on SDS-PAGE and scanning the bands with a fluorescence scanner (see the HaloTag® Mammalian Pull-Down and Labeling Systems Technical Manual #TM342).
Suboptimal pairing of protein partners. Test all possible combinations to find optimal pair.
Improper calculations. Divide the acceptor value by the donor value (618nm/460nm). Optionally, multiply by 1,000 to convert to mBU. To account for background contribution, subtract the ratio of the no-ligand negative control from the ratio of the experimental samples.
Poor cell health or compound toxicity. Ensure cells are still viable at the time of measuring the assay by performing the CellTiter-Glo® 2.0 Assay (see Section 10.C).
Unexpected biology or lack of proper stimulation. Some PPI might be dependent on specific biological events or stimuli to activate specific pathways. Ensure proper pathway activators are added. If possible, check proper phenotypical responses by other means.
Poor Z´ and Z factor values. Too much variability in assay. Optimize all parameters of the assay for 0.5–1 Z´ values. If the assay parameters have been optimized, consider automated dispensing to reduce variability.
A weak modulator is present. A weak inhibitor can produce a small delta between treated and untreated samples, resulting in a suboptimal Z factor value that is not due to assay robustness.
Promega Corporation · 2800 Woods Hollow Road · Madison, WI 53711-5399 USA · Toll Free in USA 800-356-9526 · 608-274-4330 · Fax 608-277-2516 21www.promega.com TM439 · Revised 12/16
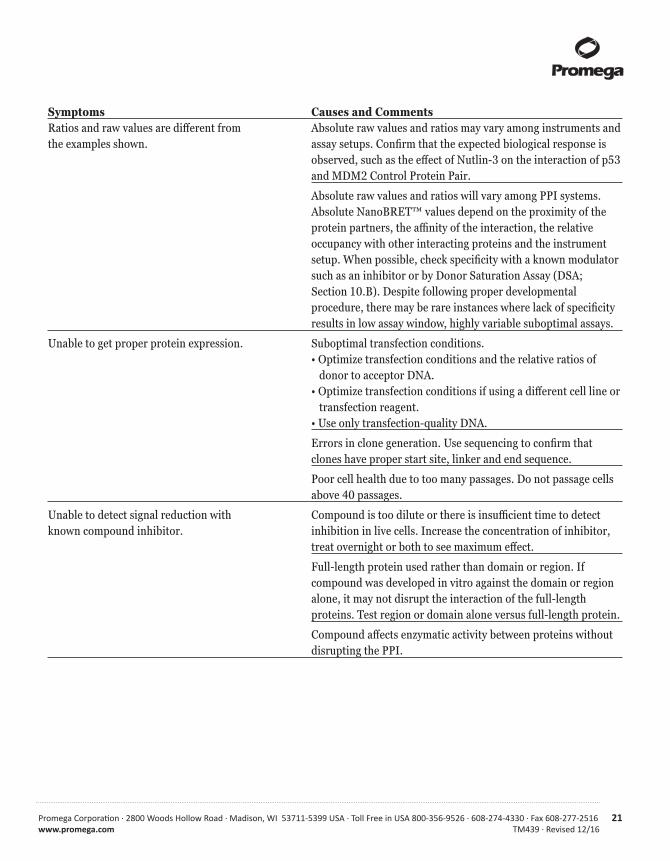
Symptoms Causes and CommentsRatios and raw values are different from Absolute raw values and ratios may vary among instruments and the examples shown. assay setups. Confirm that the expected biological response is
observed, such as the effect of Nutlin-3 on the interaction of p53 and MDM2 Control Protein Pair.
Absolute raw values and ratios will vary among PPI systems. Absolute NanoBRET™ values depend on the proximity of the protein partners, the affinity of the interaction, the relative occupancy with other interacting proteins and the instrument setup. When possible, check specificity with a known modulator such as an inhibitor or by Donor Saturation Assay (DSA; Section 10.B). Despite following proper developmental procedure, there may be rare instances where lack of specificity results in low assay window, highly variable suboptimal assays.
Unable to get proper protein expression. Suboptimal transfection conditions. • Optimize transfection conditions and the relative ratios of donor to acceptor DNA. • Optimize transfection conditions if using a different cell line or transfection reagent. • Use only transfection-quality DNA.
Errors in clone generation. Use sequencing to confirm that clones have proper start site, linker and end sequence.
Poor cell health due to too many passages. Do not passage cells above 40 passages.
Unable to detect signal reduction with Compound is too dilute or there is insufficient time to detect known compound inhibitor. inhibition in live cells. Increase the concentration of inhibitor,
treat overnight or both to see maximum effect.
Full-length protein used rather than domain or region. If compound was developed in vitro against the domain or region alone, it may not disrupt the interaction of the full-length proteins. Test region or domain alone versus full-length protein.
Compound affects enzymatic activity between proteins without disrupting the PPI.
22 Promega Corporation · 2800 Woods Hollow Road · Madison, WI 53711-5399 USA · Toll Free in USA 800-356-9526 · 608-274-4330 · Fax 608-277-2516TM439 · Revised 12/16 www.promega.com
7. Troubleshooting (continued)
Symptoms Causes and CommentsDiscolored HaloTag® NanoBRET™ 618 Ligand The HaloTag® NanoBRET™ 618 Ligand is typically a pink to
red color, but there might be instances where it appears a lighter hue or colorless. This is due to varying degrees of molecular closeness. In the closed form, the ligand is colorless. When added to medium, the ligand converts to the open usable form. To confirm chemical integrity, dilute 1µl of HaloTag® NanoBRET™ 618 Ligand in 1ml of Opti-MEM® I Reduced Serum Medium, no phenol red, and check fluorescence by exciting the fluorophore at 593±4nm and reading the emission at 621±4nm. If using the GloMax® Discover System, use the green channel (Ex: 525nm, Em: 580–640 nm).
8. Composition of Buffers and SolutionsCell Culture Medium • 90% DMEM (Gibco Cat #11995) • 10% FBS (HyClone Cat.# SH30070.03)Assay Medium • 96% Opti-MEM® I Reduced Serum Medium, no phenol red (Life Technologies Cat.# 11058) • 4% FBS (such as HyClone Cat.# SH30070.03)
9. References
1. Pfleger, K.D. and Eidne, K.A. (2006) Illuminating insights into protein-protein interactions using bioluminescence resonance energy transfer (BRET). Nat Methods 3, 165–74.
2. Mercier, J.F. et al. (2002) Quantitative assessment of beta 1- and beta 2-adrenergic receptor homo- and heterodimerization by bioluminescence resonance energy transfer. J Biol Chem. 277, 44925–31.
3. Hall, M.P. et al. (2012) Engineered luciferase reporter from a deep sea shrimp utilizing a novel imidazopyrazinone substrate. ACS Chem. Biol. 7, 1848–57.
4. Deplus, R. et al. (2013) TET2 and TET3 regulate GlcNAcylation and H3K4 methylation through OGT and SET1/COMPASS. EMBO J. 32, 645–55.
5. Demont, E.H. et al. (2014) 1,3-dimethyl benzimidazolones are potent, selective inhibitors of the BRPF1 bromodomain. ACS Med. Chem. Lett. 5, 1190–5.
6. Vassilev, L.T. et al. (2004) In vivo activation of the p53 pathway by small-molecule antagonists of MDM2. Science 303, 844–8.
7. Zhang J.H., Chung, T.D. and Oldenburg, K.R. (1999) A simple statistical parameter for use in evaluation and validation of high throughput screening assays. J. Biomol. Screen. 4, 67–73.
8. Bacart, J. et al. (2008) The BRET technology and its application to screening assays. Biotechnol. J. 3, 311–24.

Promega Corporation · 2800 Woods Hollow Road · Madison, WI 53711-5399 USA · Toll Free in USA 800-356-9526 · 608-274-4330 · Fax 608-277-2516 23www.promega.com TM439 · Revised 12/16
10. Appendix
10.A. Assay Validation Recommendations
If more than one pair combination work and a known modulator (inhibitor or enhancer) is available, test all potential combinations to see which one responds best to expected biology.
10.B. Donor Saturation Assay (DSA) Protocol
To validate a NanoBRET™ assay in the absence of known inhibitors, ascertain assay specificity by performing a Donor Saturation Assay (DSA; 8) using the donor/acceptor combination(s) identified in the initial screening. (See Figure 9 for an illustration of the principle of a DSA.)
1275
5MA
Nonspecific interaction
Specific interaction
Nonspecific interaction
Specific interaction
Acceptor concentrationDonor concentration
A
DD
D
A A
DD
D D
DD A
AA
A
A
A
A
AAA
DD
A
D A
No BRET No BRET Low BRET BRET
A A
DD
D
No BRET
AA
A
A
A
A A
DD
A
D A
BRET
DD
DA D
DA
D AD A
D A
D A
A
A
A
A
AA D A
D A
D A
Low BRET BRET BRET BRET
DD
AD A
BRET
A
A
A
A
AA D A
D A
D A
BRET
BRET
Acceptor-to-Donor Ratio
Figure 9. Principle of a DSA.
In a scenario where the amount of donor is held constant while the amount of acceptor is gradually increased, nonspecific BRET can result from proteins being in close proximity, and the signal will increase linearly with increasing amounts of acceptor. However, a specific BRET signal will increase in a hyperbolic manner and reach a plateau representing complete saturation of all donors with acceptor molecules.
To perform this DSA protocol, cells are transfected with a constant amount of the NanoLuc® donor DNA and variable amounts of HaloTag® acceptor DNA to represent increasing amounts of acceptor-to-donor ratios. An optional negative control sample could be transfected with unfused or unrelated DNA as a mock donor or an acceptor that is known to be in the same cellular space (e.g., nucleus, cytoplasm or membrane). If the interaction of the protein pair is real, the DSA curve will show saturation, while a negative control would yield a linear or flat curve as shown in Figure 10.
24 Promega Corporation · 2800 Woods Hollow Road · Madison, WI 53711-5399 USA · Toll Free in USA 800-356-9526 · 608-274-4330 · Fax 608-277-2516TM439 · Revised 12/16 www.promega.com
10.B. Donor Saturation Assay (DSA) Protocol (continued)
1275
8MA
Specific pairNegative control
0 20 40 60 80 100
Acceptor-to-Donor Ratio
0
50
100
Perc
ent o
f Max
imum
BRE
T Ra
tio
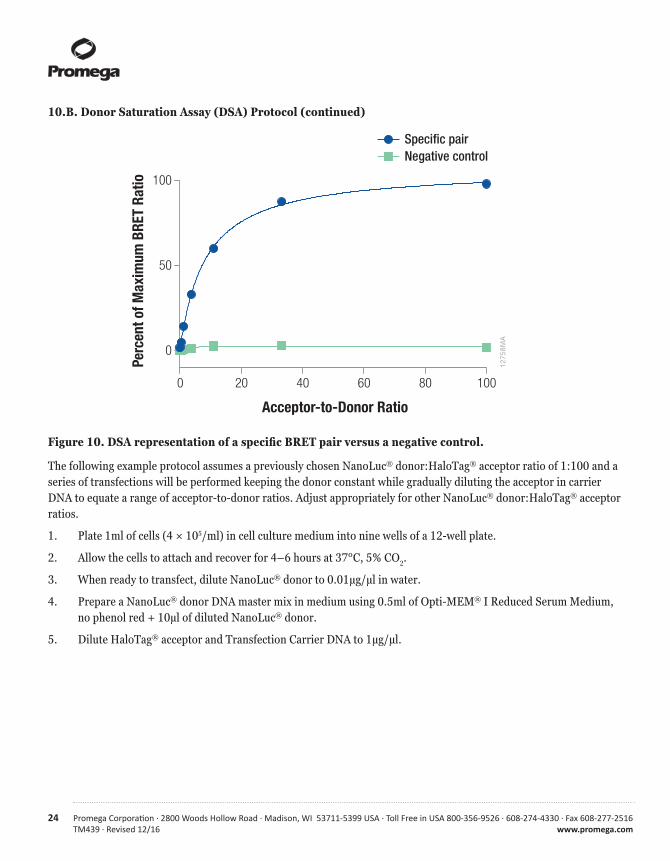
Figure 10. DSA representation of a specific BRET pair versus a negative control.
The following example protocol assumes a previously chosen NanoLuc® donor:HaloTag® acceptor ratio of 1:100 and a series of transfections will be performed keeping the donor constant while gradually diluting the acceptor in carrier DNA to equate a range of acceptor-to-donor ratios. Adjust appropriately for other NanoLuc® donor:HaloTag® acceptor ratios.
1. Plate 1ml of cells (4 × 10⁵/ml) in cell culture medium into nine wells of a 12-well plate.
2. Allow the cells to attach and recover for 4–6 hours at 37°C, 5% CO2.
3. When ready to transfect, dilute NanoLuc® donor to 0.01µg/µl in water.
4. Prepare a NanoLuc® donor DNA master mix in medium using 0.5ml of Opti-MEM® I Reduced Serum Medium, no phenol red + 10µl of diluted NanoLuc® donor.
5. Dilute HaloTag® acceptor and Transfection Carrier DNA to 1µg/µl.
Promega Corporation · 2800 Woods Hollow Road · Madison, WI 53711-5399 USA · Toll Free in USA 800-356-9526 · 608-274-4330 · Fax 608-277-2516 25www.promega.com TM439 · Revised 12/16
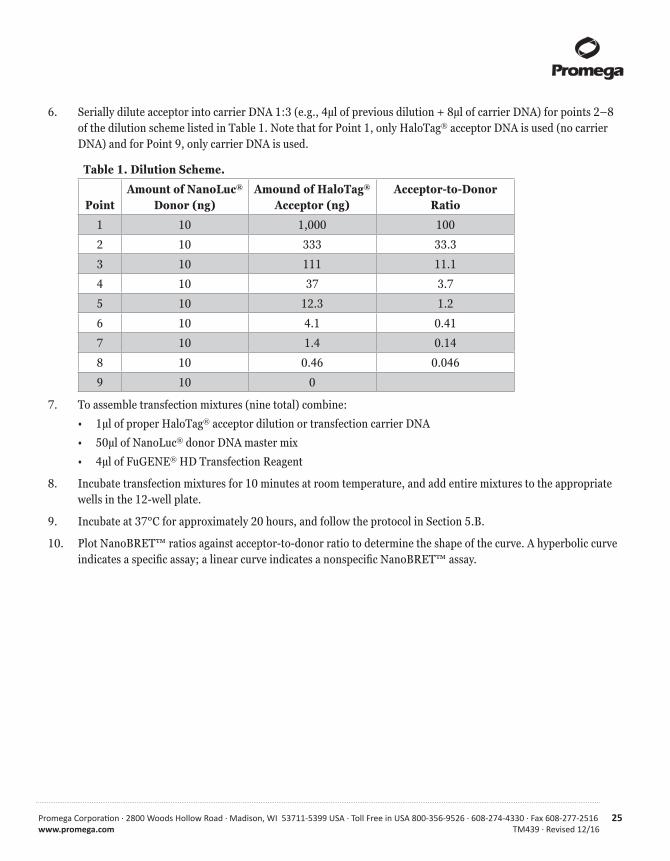
6. Serially dilute acceptor into carrier DNA 1:3 (e.g., 4µl of previous dilution + 8µl of carrier DNA) for points 2–8 of the dilution scheme listed in Table 1. Note that for Point 1, only HaloTag® acceptor DNA is used (no carrier DNA) and for Point 9, only carrier DNA is used.
Table 1. Dilution Scheme.
PointAmount of NanoLuc®
Donor (ng)Amound of HaloTag®
Acceptor (ng)Acceptor-to-Donor
Ratio
1 10 1,000 100
2 10 333 33.3
3 10 111 11.1
4 10 37 3.7
5 10 12.3 1.2
6 10 4.1 0.41
7 10 1.4 0.14
8 10 0.46 0.046
9 10 0
7. To assemble transfection mixtures (nine total) combine:
• 1µl of proper HaloTag® acceptor dilution or transfection carrier DNA
• 50µl of NanoLuc® donor DNA master mix
• 4µl of FuGENE® HD Transfection Reagent
8. Incubate transfection mixtures for 10 minutes at room temperature, and add entire mixtures to the appropriate wells in the 12-well plate.
9. Incubate at 37°C for approximately 20 hours, and follow the protocol in Section 5.B.
10. Plot NanoBRET™ ratios against acceptor-to-donor ratio to determine the shape of the curve. A hyperbolic curve indicates a specific assay; a linear curve indicates a nonspecific NanoBRET™ assay.

26 Promega Corporation · 2800 Woods Hollow Road · Madison, WI 53711-5399 USA · Toll Free in USA 800-356-9526 · 608-274-4330 · Fax 608-277-2516TM439 · Revised 12/16 www.promega.com
10.C. Multiplexing with the CellTiter-Glo® 2.0 Assay
In some cases, you may want to determine the cell viability or compound toxicity or both plus perform the NanoBRET™ assay. Multiplexing with another assay will give you more data from a single well. Assess cell health using the ready-to-use CellTiter-Glo® 2.0 Assay, a luminescent assay that quantitates the amount of ATP present, which indicates the presence of metabolically active cells. Figure 11 shows example data.
1. Equilibrate CellTiter-Glo® 2.0 Reagent to room temperature.
2. Following NanoBRET™ measurements, add 125µl of CellTiter-Glo® 2.0 Reagent per well of the plate, and mix on a plate shaker at 500–700rpm for 5 minutes.
3. Incubate the plate at room temperature for 30 minutes to allow cell lysis and quenching of NanoLuc® signal.
4. After the 30-minute incubation is complete, measure total luminescence on a luminometer. If using the GloMax® Discover System, select the CellTiter-Glo® protocol.
5. If determining compound toxicity, compare the luminescence (RLU) of vehicle-containing samples versus compound-containing samples. Note that even if some toxicity is observed, the NanoBRET™ ratio is only derived from the live cells in the NanoBRET™ assay. Unless total cell death is observed, a reduction in NanoBRET™ signal by an inhibitor is most likely due to actual disruption of the interaction and not cell death.
Figure 11. Example data for multiplexing the NanoBRET™ PPI Assay with the CellTiter-Glo® 2.0 Assay. Panel A. The NanoBRET™ PPI Control Pair (p53-HaloTag® Fusion Vector and NanoLuc®-MDM2 Fusion Vector) were assayed in the NanoBRET™ Assay with and without the modulator nutlin-3. Panel B. Following NanoBRET™ measurements, the same samples were assayed for cell viability using the CellTiter-Glo® 2.0 Reagent.
1282
3MA
0
2
4
6
8
10
12
14
16
Corr
ecte
d m
BU
Vehicle 10µM nutlin-3
NanoBRET™ Ratio
0
5,000,000
10,000,000
15,000,000
20,000,000
25,000,000
Lum
ines
cenc
e (R
LU)
Vehicle 10µM nutlin-3
Cell Viability
A. B.
Promega Corporation · 2800 Woods Hollow Road · Madison, WI 53711-5399 USA · Toll Free in USA 800-356-9526 · 608-274-4330 · Fax 608-277-2516 27www.promega.com TM439 · Revised 12/16
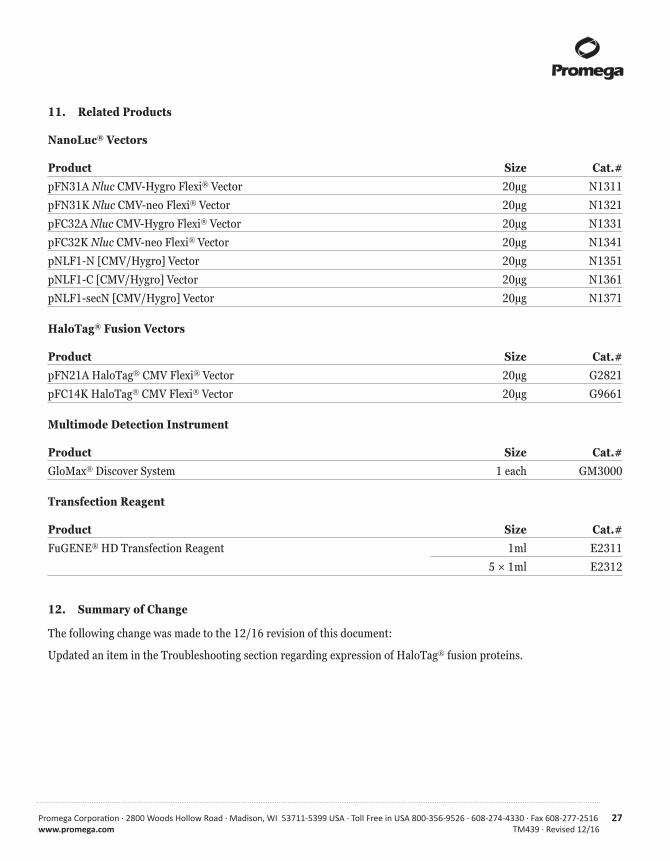
11. Related Products
NanoLuc® Vectors
Product Size Cat.#pFN31A Nluc CMV-Hygro Flexi® Vector 20μg N1311
pFN31K Nluc CMV-neo Flexi® Vector 20μg N1321
pFC32A Nluc CMV-Hygro Flexi® Vector 20μg N1331
pFC32K Nluc CMV-neo Flexi® Vector 20μg N1341
pNLF1-N [CMV/Hygro] Vector 20μg N1351
pNLF1-C [CMV/Hygro] Vector 20μg N1361
pNLF1-secN [CMV/Hygro] Vector 20μg N1371
HaloTag® Fusion Vectors
Product Size Cat.#pFN21A HaloTag® CMV Flexi® Vector 20μg G2821
pFC14K HaloTag® CMV Flexi® Vector 20μg G9661
Multimode Detection Instrument
Product Size Cat.#GloMax® Discover System 1 each GM3000
Transfection Reagent
Product Size Cat.#FuGENE® HD Transfection Reagent 1ml E2311
5 × 1ml E2312
12. Summary of Change
The following change was made to the 12/16 revision of this document:
Updated an item in the Troubleshooting section regarding expression of HaloTag® fusion proteins.
28 Promega Corporation · 2800 Woods Hollow Road · Madison, WI 53711-5399 USA · Toll Free in USA 800-356-9526 · 608-274-4330 · Fax 608-277-2516TM439 · Revised 12/16 www.promega.com
(a)BY USE OF THIS PRODUCT, RESEARCHER AGREES TO BE BOUND BY THE TERMS OF THIS LIMITED USE LABEL LICENSE. If researcher is not willing to accept the terms of this label license, and the product is unused, Promega will accept return of the unused product and provide researcher with a full refund.
Researcher may use this product for research use only; no commercial use is allowed. Commercial use means any and all uses of this product by a party in exchange for consideration, including, but not limited to, (1) use in further product manufacture; (2) use in provision of services, information or data; and (3) resale of the product, whether or not such product is resold for use in research. Researcher shall have no right to modify or otherwise create variations of the product. No other use or transfer of this product is authorized without the prior express written consent of Promega.
For uses of Nano-Glo®-branded reagents intended for energy transfer (such as bioluminescence resonance energy transfer) to acceptors other than a genetically encoded autofluorescent protein, researcher must:
(a) use NanoBRET™-branded energy acceptors (e.g., BRET-optimized HaloTag® ligands) for all determinations of energy transfer activity by this product; or
(b) contact Promega to obtain a license for use of the product for energy transfer assays to energy acceptors not manufactured by Promega.
With respect to any uses outside this label license, including any diagnostic, therapeutic, prophylactic or commercial uses, please contact Promega for supply and licensing information. PROMEGA MAKES NO REPRESENTATIONS OR WARRANTIES OF ANY KIND, EITHER EXPRESSED OR IMPLIED, INCLUDING FOR MERCHANTABILITY OR FITNESS FOR A PARTICULAR PURPOSE, WITH REGARD TO THE PRODUCT. The terms of this label license shall be governed under the laws of the State of Wisconsin, USA. (b)U.S. Pat. No. 8,809,529 and other patents pending.(c)U.S. Pat. No. 7,867,726 and other patents and patents pending.(d)Patents Pending.(e)Licensed under EP1295121 and EP1088233.
© 2015,2016 Promega Corporation. All Rights Reserved.
CellTiter-Glo, Flexi, GloMax, HaloTag, Nano-Glo and NanoLuc are registered trademarks of Promega Corporation. Find My Gene and NanoBRET are trademarks of Promega Corporation.
CLARIOstar is a registered trademark of BMG LABTECH. FuGENE is a registered trademark of Fugent, L.L.C., USA. Opti-MEM is a registered trademark of Life Technologies, Inc. Varioskan is a registered trademark of Thermo Fisher Scientific.
Products may be covered by pending or issued patents or may have certain limitations. Please visit our Web site for more information.
All prices and specifications are subject to change without prior notice.
Product claims are subject to change. Please contact Promega Technical Services or access the Promega online catalog for the most up-to-date information on Promega products.