:n z technical bulletin no. 103 december 1979 :!!:n · technical bulletin no. 103 december 1979...
TRANSCRIPT

ll)oo...~r0OoZ:n:!!:n:::>onrJ
TECHNICAL BULLETI N No. 103 DEC EMBER 1979
EFFECTS OFDRIP IRRIGATION AND NITROGEN FERTILIZATION
ON VEGETATIVE GROWTH, FRUIT YIELD,AND MINERAL COMPOSITION OF THE PETIOLES
AND FRUITS OF PAPAYA
M. Awada, I-pai Wu, R. H. Suehisa,and M. M. Padgett
HAWAII AGRICULTURAL ExPERIMENT STATION, UNIVERSITY O F HAWAII

CONTENTS
Page
Introduction 1Materials and Methods 2Results and Discussion 5
Veget ative Growth 5Fruiting and Fruit Quality 7Nutrient-Element Composition of the Petioles. . . . . . . . . . . . . . 7Nutrient-Element Composition of the Fruits 12Rel ation of the Yield of Marketabl e Fruits to th e
Water Applicati on Fraction of Pan Evapor ation. . . . . . . . . .. 15Relation of the Number of Marketable Fruits to Petiole N 15
Recommendation s 17Summary , 17Lit erature Cit ed 19
ACKNOWLEDGMENTS
The au thors wish to th ank the following management personnel ofPrin cess Orchard: Mead Kirkpatrick and Lynn Chase, for suggesting theproblem and co op erating with us during th e early ph ase, and Ron Terryfor continuing to co operate with us during th e late ph ase of the study.We are also thankful to J ame s A. Silva for designing the experiment.Appreciation is extended to Paul C. Ekern for his helpful and constructive comments on the early draft of this report.
THE AUTHORS
Minoru Awada is Associat e Plant Physiologist , Hawaii AgriculturalExperiment Station, Coll ege of Tropical Agriculture and HumanResources, University of Haw aii.
I-pai Wu is Professor of Agricultural En gineering and AgriculturalEngineer, Hawaii Agricultural Experime nt Stati on, Coll ege of Tr opi calAgriculture and Human Resources, University of Hawaii.
Robert H. Suehisa is Research Associat e, Hawaii AgriculturalExperiment Station , Coll ege of Tropical Agriculture and Hum anResources, University of Hawaii.
Melanie M. Padgett is Laborat ory Technician at Princess Orchard ,Pulehu, Island of Maui , Hawaii.

EFFECTS OFDRIP IRRIGATION AND NITROGEN FERTILIZATION
ON VEGETATIVE GROWTH, FRUIT YIELD,AND MINERAL COMPOSITION OF THE PETIOLES
AND FRUITS OF PAPAYA
M. Awada, l -pai Wu, R . H. Suehis a,and M. M. Pad gett
INTRODUCTION
A recent co mme rcial plant ing of papay a in PuIchu, Island of Maui,Hawaii, presented this opportunity to study th e wat er and nitrogenrequirem ents of pap ay a plants. The orchard, on th e slop es of Haleakalaat an elevat ion of 600 to 800 feet, is in an are a wh ere the days arewarm , the nights are coo l , rainfall is sparse, and the wind is strong attimes. Th e soil h as a low moisture-retention capacity . Under such conditions, pap aya pl ants need t o be intensely irrigated to maintain gro wthan d production of fruits.
Information on the requirem ent of papaya plants for water ismeager. In the only study co nd uc te d in Hawaii (2), p apaya pl ants atWaim an alo, Island of Oahu , wer e irrigat ed by furrows, and th e effectsof soi l moisture tensi on on gro wt h and fruit yield were observed.Becau se it has b een dem onst rated that wat er is delivered t o the roo ts ofplan ts more efficie ntly by drip irri gation th an by any other method, thedrip method is b ein g adopte d b y many crop growe rs in Hawaii andelsewhere (1).
In th e present study , under d rip irri gati on, the water and ni t rogenrequirem en ts o f b earing papay a plants at Pul ehu "Yere tentativelydet ermined . Th e effect s o f th ese vari abl es on vegetativ e gro wth , fru ityield, and miner al co mposition of the petioles and fruit s wer e alsostudied.
2 HAWAII AG RICU LTURAL EX PE RIMENT STA TI ON
MATERIALS AND METHODS
This st udy was co nduc te d on Ilowering and bearing pap aya plants(Carica papaya L. varie ty 'Solo') at Princess Orch ard , located at Pulehu,from Septe mber 197 5 to June 1977 . T he soi l in th e orchard is in theKeah ua series and is a member of the clayey, kaolini tic, isoh yperth ermic fam ily o f Typic Torrox , order of Oxisols (10). The ava ilab lemoisture of this so il was reported as b ein g 4.5 percent (10), whic hind icates a low moisture ret en tion capacity .
T he experime n ta l area was pr eviou sly plan ted once wit h pa paya. T heso il was limed to about pH 6.7 with finely crushed coral 9 months priorto planting. Nitrogen (N) at 0.04 Ib and phospho rus (P) at 0.0 5 Ibfrom diammonium phospha te (18.46) were applied at th e b o ttom ofeac h planting site, and three yo ung plants wer e tra nsplanted into it.Plan ts wer e spaced 6 feet in a row, 5Y2 feet betw een rows I and 2, and11 feet between rows 2 and 3, giving 880 plan ts/acre. At flowering, twoout of th ree plan ts fro m a site we re cu t and d iscarde d , and P at 0. 20Ib/ tree fro m treblesupe rphosphate was applied eq ua lly in four sha llowholes in the soil area aro un d the drip lin e o f the rem aining tr ee. Thus,a total o f 0.2 5 lb P/planting site was applied in this study.
Plan ts were subjec ted to 5 irrigation and 5 N treatme nts in asplit-plot arra nge me nt with th e irrigation bein g the main plo t and N th esubplot , giving a to ta l o f 25 treatments. Eac h subplot cons iste d o f sixplan ts, th ree eac h from two adjacent ro ws, bu t dat a wer e taken fromthe two cen tral plants of eac h plo t only . Treatments were replicatedtw ice in a randomized bl ock design.
The no mina l irri gat ion treatmen ts, which were used to calculate theac tua l t rea tme n ts, we re water applied to eac h plant at 3, 6, 9 , 12 , and15 gal/day. In an effort to main tain th e relat ive effect of treatme ntsth rou ghou t the year, a sche me was devised in which more wat er th anth e nominal treatments was given wh en the needs of th e plants weregreate r and less water wh en th e needs wer e less. The evaporat ion ofwater from a United Sta te s Dep artment of Agricult ure Class A pan wasused as th e basis of this weekly adj ustme nt o f wa ter applicat ion. Thus,the weekly irrigati on applica t ion of eac h trea tme nt was the nominalt reatme nt adj usted with th e weekly pan evaporation of the wa ter tocorrespond to the frac t ion of the average annua l pan evaporat ion(1.637 inch es/w eek). Plants were irri gated tw ice a week but the amounto f water application was ex presse d o n a per-day ba sis.

DRIP IRRIGATION AND NITROGEN EFFECTS ON PAPAYA 3
Plants were irrigated with a single microtube that was placed on theground about 18 inches from the stem. The rate of water applicationwas 8.7 gal/hour, equivalent to 10 lb/inch? in the water pressure gauge.Thus, differential treatments resulted from the duration of irrig ation.When fields in the orchard were irrigated simultaneously with theexperimental plots, however, the pressure of the water became lower,resulting in less amount of water delivery than the calibrated amount.During our study it was estimated that the occasional drop in waterpressure resulted in 6 to 25 percent, or an average of 16 percen t lesswater delivered than under more ideal conditions when water pressurewas constant. The average estimated delivery of water (84 percent) wasused for calculating the irrigation treatments. Thus, the averageamounts of water (gallons) applied per tree per day during the course ofthis study were treatment 1,2.7; treatment 2, 5.4; treatment 3, 8.1;treatment 4, 10.8; and treatment 5, 13.6. These will be referred to as11,12,13,14, and 15, respectively.
Nitrogen treatments were 0.10, 0.25, 0.50,1.00, and 2.00 Ib N/tree,and increments of these totals were applied at 6-week intervals from theflowering stage through 7 months of the bearing stage. Hereafter, thesetreatments will be referred to as N1, N2, N3, N4, and N5, respectively.Ammonium sulfate, the N carrier, was broadcast on the ground area inthe vicinity of the microtube.
The growth rate of the stem circumference and the dry weight of therecently matured petiole, which was also used for chemical analysis ofthe nutrients, were used as the growth indices.
Mature fruits were harvested weekly from January 1976 to June1977. At each harvest, they were segregated into marketable fruits(Hawaii Grade No.1 export) and culls, and the number and weight ofeach group of fruits were recorded. Since response to the treatmentswas not detected in yield taken between January 13 to June 22, 1976,the total yield data from only June 29, 1976 to June 28, 1977 werestatistically analyzed and presented in this report.
Fruits were sampled on September 2, September 30, October 28, andDecember 2, 1976, from the weekly harvest for fruit-quality andmineral determinations. A single marketable fruit per plot was sampledfrom harvested fruits and allowed to ripen at room temperature until ayellow color developed over 25 to 50 percent of the fruit surface. Thefirmness of the fruit flesh was then evaluated by using the University ofCalifornia Firmness Tester. The total soluble solids and the moisture were

*"
Tab
le1.
Eff
ects
of
irri
gati
on
and
Nfe
rtil
izat
ion
on
grow
thra
teo
fth
est
emci
rcu
mfe
renc
e
Gro
wth
rate
(mm
/day
)
Sep
t.9
,1
97
5-
Dec
.2,
197
5-
Feb
.24
,1
97
6-
May
18,
19
76
-A
ug.
10,
19
76
-N
ov.
4,19
76
-Ja
n.
25,
197
7-
Tre
atm
ent
Dec
.2,
197
5Fe
b.
24,
1976
May
18,
1976
Au
g.10
,19
76
Nov
.4
,19
76
Jan
.25
,19
77A
pri
l29
,19
77
110
.85
1.5
10
.92
0.0
40
.01
0.1
30
.05
121.
07
1.64
0.9
20
.04
0.0
50
.09
0.0
7::r:
131.
001.
71
1.0
50.
070
.02
0.1
00.
06
>14
1.3
21.
670
.92
0.1
00.
07
0.1
40.
05~
151.
301.
741.
02
0.0
90.
06
0.12
0.0
8::: -
Stat
isti
cals
igni
fica
nce
f> C"
)L
inea
r**
**N
S*
*N
SN
S::e
Qu
adra
tic
NS
NS
NS
NS
NS
NS
NS
n c::::
NI
0.97
1.6
30.
98
0.0
30
.03
r-0
.09
0.0
4....,
N2
1.03
1.69
1.0
00
.07
0.0
30
.09
0.0
6c:::
: ::eN
31.
201.
62
0.9
70
.04
0.0
50.
14
0.06
>N
41.
12
1.64
0.9
80.
100
.02
0.12
0.0
6r-
N5
1.2
21.
670
.91
0.1
00.
07
0.1
50.
09tT
l~ "'"
Stat
isti
cal
sign
ific
ance
/tT
l::e
Lin
ear
**N
SN
S**
NS
NS
**§::
Qua
dra
tic
NS
NS
NS
NS
NS
NS
NS
tTl
Z ....,
ZSta
tist
ical
sign
ific
ance
:**
=1%
leve
l,*
=5
%le
vel,
and
NS
=n
ot
sign
ific
ant.
I~ > ...., - 0 Z

DRIP IRRIGATION AN D NIT ROGEN E FF ECTS ON PAPAYA 5
determined on a longitudinal sample of the fru it flesh , and a nutrientanalys is was the n mad e fro m the dried sample used in the m oisturedetermination.
Th e recently matured pe t ioles were sampled on June 22 , 197 6,Au gust 24, 1976, Oct ob er 19, 1976, and J anuary 11, 1977 fordeterminati on of nutrients. Two petioles, one from eac h tree in a plot,co ns t itu te d a sample. Th e preparation of the samples for chemica lanalys is and the chemical procedures for the nu t rients, excep t for somenu trients, are described in an earl ier report (8). Sodium (Na) wasdetermined by atomic absorpt io n, ch lorine (CI) by th e chlo ridome ter,and boron (B) b y the autoana lyzer, using Azom ethine-H reagent forco lo r development.
Th e procedures d escribed in Sned ecor and Coch ran (12) were usedfor stat ist ica l treatm ent of the dat a. Since N t reatme n ts were un equallyspaced , Grandage's procedure for ca lcula t ing th e orthogonal coefficien ts (11 ) in regression was used.
RESULTS AND DISCUSSION
Vegetative GrowthTh ere was no inte ract ion b etween irr igat ion and N on growth , fru it
yield , and fruit-qu ali ty fac tors in th is study. Few interacti on s wer edet ected in petiol e co m position ; thus, the main effects of treat mentswill be emphas ized in th is report. Small but statist ically signi ficantdifferen ces in growth rate of the stem circum ference resulted from t heirr igation and N t rea tme nts at some of the measurem ent period s (Tabl e1).
An it em of interest in the irr igat ion t reatmen ts was th e observat ionth at the circumference gro wth rat e was larger during the peri od ofDecember 2, 197 5 to February 24, 197 6 than during the peri od ofSeptember 9 to December 2 , 1975 even th ou gh pl ants in th e formerperiod were olde r and wer e expecte d to grow at a slowe r rat e thanth ose in the lat t er period. A greate r increase in circum ference gro wthra te also was observed in t he period of November 4, 1976 to J anuary25 , 1977 ove r the period o f August 10 to November 4, 1976. A featureco mmon in b oth instan ces was th at the period of faster gro wthco inc ide d with the peri od of heavier rain, shorter days, lower ligh tin te nsity , lower air tem perature, and higher humidity of th e air.

Tab
le2
.E
ffec
tso
fir
rig
atio
nan
dN
fert
iliz
atio
no
nd
ryw
eig
ht
of
the
pet
iole
Dry
wei
gh
to
fth
ep
etio
leo
nsa
mp
ling
dat
e(g
/pet
iole
)
Tre
atm
ent
Jun
e22
,1
97
6A
ug.
24
,19
76
Oct
.1
9,
197
6
II10
.14
.95
.212
13.3
5.8
6.2
1314
.07
.35.
514
16.8
9.0
6.4
1515
.59
.27.
7
Sta
tist
ical
sign
ific
ance
fL
inea
r*
*N
SQ
uad
rati
cN
SN
SN
S
Nl
9.8
4.6
4.5
N2
11.
65
.44.
8N
314
.46.
75
.6N
416
.88
.77.
4N
517
.110
.78.
7
Sta
tist
ical
sign
ific
ance
fL
inea
r**
****
Qu
adra
tic
***
NS
ZS
tati
stic
alsi
gnif
ican
ce:
**=
1%le
vel,
*=
5%le
vel,
and
NS
=n
ot
sig
nif
ican
t.
C'>
Jan
.II
,1
97
7
7.9
8.9
8.4
I~9
.79
.3
~N
S
I~N
S(1
7.2
c::: r-7
.6>-'
l
8.7
c::: f':I10
.2> -
10.6
, C'"l X -e
**I~
NS
M Z >-'l
tr: >-'l > >-'l <3
IZ
DRIP IRRIGATION AND NIT ROGEN E FFECTS ON PAP AY A 7
The gro w th o f stem heigh t was not st ud ied in th is ex pe rime nt , butplants from Princess Orc ha rd see me d to b e taller t ha n pl an ts at aco mpa rab le stage of maturi ty from Puna, Island of Hawaii , and fro mWaima na lo and Poam oh o, Island of Oa hu, whic h migh t have resultedfro m the occurrence of a lon ger period o f d ry days (witho ut ra in) atPrincess Orchard than at th e other localiti es.
Increases in d ry we ight of the peti oles resulted from b oth th eirrigation and N t reatme n ts, bu t t he latter had grea ter e ffec t on thisind ex of gro wth (T abl e 2 ). These results from the N treatments co n firmresults reported previou sly (3) and, thus, est abli sh th e change in peti oleweigh t as a reli abl e index of vege ta tive resp on se to N fertilizati on.
Fruiting and Fruit QualityYield o f marketable fruit s b ecam e higher up to t reatme nt 14 as
irriga tion was incr eased; a furth er incr ease in yield bey ond thistreatme n t was not atta ined wi th a higher applica tion o f irri gation(Tabl e 3). These incr eases in mark etable fruits, how ever, were accom pani ed by a higher y ield of culls. Th e percentage o f market abl e fruitste nde d to inc rease up to t rea tme nt 14 as more wat er was ap plied to th eplants, but this w as no t sta t ist ically sign ifican t. With in cr easin girrigation rates, frui t size significant ly increased . Th e total soluble solidsand the firmn ess o f th e fruits we re not affec te d by irrigati on.
Yie ld of marketabl e fru its increased only up to treatm ent N3 as Nfert iliza t ion was in creased ; however , in co nt ras t with th e y ield ofmark et abl e fruit s, culls increased up to treatment N5 as more N wasgiven to the plants. Th e total soluble solids o f the fru its increased asmore N was applied to th e plants, co n firming results o f previous st ud iesat Waim an alo (7) and Puna (4). Fruits becam e softer as N fertilizati onincreased , a finding th at may be of importan ce in sh ipme nt of papayato th e market.
Nutrient-Element Composition of the PetiolesTo separate th e effec t on pe t iole co mposit ion of th e irri gation
treatment from th e effect o f rai n, th e nu tri en t values o f samplesob ta ined during th e d ry season (june 22, Au gust 24, and Oct ob er 19 ,197 G) were ave raged and arc pr esented sep aratel y (Tabl e 4 ) from th enu tri ent values o f samples during th e wet season (j anuary 11 , 1977)(Tab le 5). Nitrogen in the pe t iole tended to decrease as irrigati on was

00 IT
able
3.
Eff
ects
of
irri
gati
on
and
Nfe
rtili
zati
on
on
fru
itin
gan
dso
me
fru
it-qu
alit
yfa
cto
rs)' To
tal
solu
ble
Mar
ket
able
Mar
keta
ble
Mar
keta
ble
Fru
itsso
lids
Pres
sure
fru
its
fru
its
fru
itsC
ulls
Cu
llsha
rves
ted
(%fr
esh
of
fles
hT
r eat
men
t[n
o.j
tree
](I
b/tr
ee)
(%)
(no
./tr
ee)
( Ib
/tre
e)(l
b)w
eigh
t)Y
(IbY
"
II33
.63
0.6
28.2
85.6
61.1
0.76
712
.08
.012
47
.245
.13
2.1
100
.08
0.0
0.8
33
12.6
8.7
1346
.545
.23
1.5
101.
081
.10
.86
411
.88
.814
58
.059
.83
5.2
106
.992
.60
.92
812
.49
.7::r: ;;>
1560
.359
.035
.011
1.8
97
.20
.91
312
.39.
0:;;;
Sta
tist
ical
sign
ific
an
cef
~L
inea
r*
*N
S**
***
NS
NS
;;> 0Q
uad
rati
cN
SN
SN
SN
SN
SN
SN
SN
Sc: o
Nl
41
.04
1.0
35.2
75.
46
4.4
0.8
971
1.9
10.3
c::N
24
3.6
42
.63
2.0
92
.872
.10.
83
312
.19
.1t"
">-3
N3
50
.65
3.8
34
.19
7.7
83
.80
. 90
212
.08
.5c::
N4
5 5.0
50
.532
.911
2.2
90
.60
.84
212
.58
.5;>
;l ;;>N
555
.45
1.8
30
.312
7.2
10
1.4
0.8
31
12.6
8.0
r- tTl
Sta
tist
ical
sign
ific
anc
ef~ '"
Lin
ear
**N
SN
S**
**N
S*
*tT
l
Qu
adra
tic
NS
NS
NS
****
NS
NS
NS
;>;l - 3:: tTl
YD
ata
onfr
uiti
ngw
ere
tak
endu
ring
June
29,
19
76
toJu
ne
28,
19
77
and
tho
seon
tota
lso
lubl
eso
lids
and
pre
ssu
reo
fth
efr
uit
sw
ere
aver
aged
I~fr
om
sam
ples
tak
enon
Sep
tem
ber
2,Se
pte
mb
er30
,Oct
ob
er28
,an
dD
ecem
ber
2,
19
76
.Z
Sta
tist
ical
sign
ific
anc
e:**
=1%
leve
l,*
=5
%le
vel,
and
NS
=n
otsi
gnif
ican
t.>-3 0 Z

0 c: -e
Tab
le4
.E
ffec
tso
fir
riga
tion
and
Nfe
rtil
izat
ion
on
mo
istu
rean
dm
iner
alco
mpo
siti
on
of
the
pet
iole
du
ring
the
dry
seas
on)
';;; '"
Dry
wei
ght
CiPe
tiol
e>-
moi
stu
reN
PK
Ca
Mg
SN
aC
IM
nB
>-3
Tre
atm
ent
(%fr
esh
wei
ght)
(%)
(%)
(%)
(%)
(%)
(%)
(%)
(%)
(ppm
)(p
pm
)0 Z
1189
.40.
990
.22
4.7
31.
410.
64
0.62
0.1
11.
70
4622
.3>- Z
1289
.20.
920.
234.
751.
380.
610.
590
.13
1.5
244
22.6
013
88.9
0.9
00
.24
4.54
1.5
30
.61
0.62
0.16
1.50
4422
.9Z -
1489
.20
.92
0.2
34
.64
1.5
30
.56
0.6
10
.18
1.45
4122
.9>-3
1589
.10.
910
.24
4.7
61.
53
0.5
50
.56
0.16
1.4
742
23.
7'"0
Sta
tist
ical
sign
ific
ance
f0 M
Lin
ear
NS
NS
NS
NS
**
NS
****
NS
*Z
Qua
drat
icN
SN
SN
SN
SN
SN
SN
SN
S**
NS
NS
t'1 ":l
":l
Nl
89
.60
.84
0.2
65
.13
1.5
30
.64
0.6
40
.16
1.87
41
23.5
t'1 (J
N2
89
.30
.84
0.2
54
.91
1.53
0.6
10
.67
0.1
61.
714
223
.0>-3 [J
l
N3
89.2
0.88
0.2
34
.93
1.3
70
.56
0.6
40
.15
1.50
452
3.0
0N
488
.80.
970
.21
4.3
11.
460.
540
.54
0.14
1.3
04
32
2.3
ZN
588
.91.
120.
204
.13
1.4
90
.61
0.5
10
.13
1.26
4622
.7-e >- "t
lSt
atis
tica
lsi
gnif
ican
cef
>-L
inea
r**
****
**N
SN
S**
***
NS
*-<: >-
Qua
drat
ic**
NS
***
NS
**N
SN
S**
NS
*-
-
YNu
trie
ntco
ncen
trat
ion
sw
ere
aver
aged
fro
mp
etio
les
sam
ple
do
n]
une
22,
Aug
ust
24,
and
Oct
ober
19,
197
6.Z
Sta
tist
ical
sign
ific
ance
:**
=1%
leve
l,*
=5%
leve
l,an
dN
S=
no
tsi
gnif
ican
t.
<l:l

......
0 IT
able
5.
Eff
ects
of
irri
gat
ion
and
Nfe
rtil
izat
ion
onm
oist
ure
and
min
eral
com
posi
tion
of
the
peti
ole
du
rin
gth
ew
etse
ason
Y
Pet
iole
Dry
wei
ght
mo
istu
reN
PK
Ca
Mg
SN
aC
IM
nB
Tre
atm
ent
(%fr
esh
wei
ght)
(%)
(%)
(%)
(%)
(%)
(%)
(%)
(%)
(pp
m)
(ppm
)
II89
.81.
16
0.3
04
.67
1.7
20
.49
0.5
20
.12
1.98
4623
.812
89.9
1.22
0.2
95
.09
1.69
0.4
60
.55
0.12
1.8
544
22.8
139
0.0
1.1
70
.29
4.9
61.
580
.39
0.5
20
.13
1.64
43
23.5
1489
.81.
200
.30
4.8
21.
74
0.4
20
.54
0.1
41.
6039
23.0
::c >-15
90.2
1.21
0.3
05
.08
1.55
0.3
90.
540
.14
1.65
4023
.3::s >-
Stat
isti
cal
sign
ific
ance
/':::::
:L
inea
r*
NS
NS
NS
NS
NS
NS
NS
NS
NS
NS
>-Q
uad
rati
cN
SN
SN
SN
SN
SN
SN
SN
SN
SN
SN
SC
) ::<:'
NI
90
.01.
050.
33
5.2
51.
670.
480
.59
0.13
2.18
3924
.1c=; c::
N2
90
.41.
140
.30
5.14
1.6
60
.42
0.5
50
.14
2.08
372
3.3
r- ...,N
389
.81.
12
0.3
05.
11
1.64
0.3
90.
540.
121.
7444
23.2
c::N
489
.91.
27
0.2
74.
74
1.7
00
.43
0.50
0.1
31.
52
4523
.2::<
:' >-N
589
.71.
380
.26
4.3
81.
62
0.4
30.
48
0.1
31.
2246
22.6
r- tTl
Sta
tist
ical
sign
ific
ance
fX "C
Lin
ear
***
***
NS
NS
**N
S**
***
tTl
Qu
adra
tic
NS
NS
NS
NS
NS
NS
NS
NS
**N
SN
S::<
:' §: tTl
YN
utr
ient
valu
es
wer
efr
omp
etio
les
sam
ple
do
nJ
anu
ary
II,
1977
.I~
ZS
tati
stic
alsi
gnif
ican
ce:
**=
I%le
vel,
*=
5%le
vel,
and
NS
=n
ot
sign
ific
ant.
..., >- ..., 0 Z
DRIP IRRIGATION AND NITROGEN EFFECTS ON PAPAYA 11
increased, but this was not statistically significant (Table 4) . Calcium(Ca) and B in the petiole incr eased with increasing irrigation ratesduring th e dry seas on (Table 4). Since these tw o elements areconsidered to be immobile in the phloem and therefore not subj ect torecircul ation (9) , the necessity of maintaining an ade quate irrigation fora sustained supply of th ese two elem ents for development of newtissues is indicated . Sodium in th e petiole became higher whilemagnesium (Mg) and CI becam e lower as irrigation was increased.
Th e effec ts o f th e irri gation treatme nts on petiole compositionobserved during the dry season dis appeared with th e onset of rain(Tabl e 5). During th e wet season, petiol e moisture in th e high-irri gationtreatment inc reas ed , which may b e related to dilution from greate rgro wth of pl ants in th e low -irrigation tr eatment. Greater growth ofplants in th e low- than in the high-irrigation treatment also resultedfrom rain in the study at Waimanalo (2) . The co ncent rat ions of N, P,potassium (K), Ca, and CI in the petiole were higher during the wet thanduring th e dry season. Peti ole P was in th e high ran ge during th e dryseaso n and be cam e even higher and was in th e excess range during thewet season. Sulfur (S) and Mg in th e petiole were low er during the wetth an during th e dry season.
In gene ral, th e concentrat ion of petiole N at Princess Or chard in th edry season (Table 4) was substantially lower th an that observed atPuna, throughout th e year (4, 6). This difference in petiole N betweenth e two places may be rel at ed to a differen ce in climatic cond it ions ,whi ch resulted in different growt h patterns, whi ch, in turn, resulted insuch con tras t ing petiol e-N co ncen tra t ions . Even at Prin cess Orch ard,how ever, th e co nc en tra t ion o f pe ti ole N b ecam e higher in th e wetseason (Tabl e 5 ), which again may be related to a difference in clim aticco nd it ions in th e dry and wet season s.
Th e effec t o f N fertilization on th e petiole composit ion of the othe rclements was similar in th e dry season (Tabl e 4) and th e wet season(Table 5). Decreases in petiole co nc en tra t ions o f P, K, S, Cl, and Bresulted from N fertilization. Because N has a large effect on veget ativegrowt h, it is not possible to attribu te these de creases to gro wt h dilutiono r to ion an tagonism, but because th e decreases in petiole conce nt rations o f K and CI were so mu ch larger th an th ose o f the other clements,antago nisms o f N/K and N/CI wer e possibly in part ope ra t ive.Man gan ese (Mn) in the petiole increased with increasing N fertilization,co nfirmi ng results reported previously (6).

12 HAWAII AG RICU LTURA L EX PE RIMEN T ST ATION
Nutrient-Element Composition of the FruitsIn th e dry season, th e co ncen tra t ion 0 1' Ca in the Fruits decr eased
with increasing irrigati on rates (Tabl e 6 ), which is opposite fro m th eresult found in the petiol es (Tabl e 4 ). This may have resulted fro m agreater effec t o f dilution Fro m increased fru it size tha n From increasedpetiole size . Nitrogen in th e Fruits b ecam e higher and P b ecame low er asN fert iliza t ion increased during the dry and wet season s (Tabl es 6, 7) ,whi ch is similar to th e effec ts observed in the pe t ioles.
Th e co ncent ra tion 0 1' the clem ents was generally low er in th e Fru itsth an in th e petiol es, b ut d if fer en ces were larger with some clem en tstha n with others (Tabl es 4, 6). The co ncentrat ion of Nor P in th e fruitswas 80 percent of th e co ncentrat ion in the petioles, while th at of Cawas only 14 percent o f th e co ncentrat ion in th e petiol es. The differ en cein co ncent ra t io ns 0 1' B, K, and Mg betw een th e fruit s and th e petiol eswas in term ed iate b etween th at of N and Ca.
Figure 1 presents th e rel ation between th e co ncentrat ions 0 1' N in th efruits and in the petiol es. This rel ati onship is curv iline ar, particul arl y atth e high co ncen tra t ions 0 1' petiol e and Fru it N. It indicat es th at , under
Figure 1. Rel ation of fru it N t o pe t io le N. Petiole-N value s fr om June 22,August 24, Oc tober 19, 1977 , and January 11 , 19 78 and fru it-N valu es fro mSeptember 3, September 30 , Oct ober 28, and December 2, 1977 wer e averaged.

t:l ~ ::;;T
able
6.E
ffec
tso
fir
riga
tio
nan
dN
fert
iliz
atio
no
nth
em
iner
alco
mp
osit
ion
of
the
frui
td
uri
ngth
edr
yse
aso
nY
- ~ ~D
ryw
eigh
t- 0
Moi
stu
reN
PK
Ca
Mg
B>- ..,
Tre
atm
en
t(%
fres
hw
eig
ht)
(%)
(%)
(%)
(%)
(%)
(pp
m)
0 ZI1
85.1
0.78
0.1
82.
40
0.2
40
.22
15.3
>-12
85
.30
.78
0.1
82.
31
0.2
20
.20
15
.4Z
1385
.20
.76
0.2
02.
280
.19
0.18
15.2
t:l Z14
85.3
0.7
60
.20
2.3
00
.17
0.1
714
.6::J
158
5.4
0.7
80
.20
2.3
10
.19
0.1
715
.3~ 0
Sta
tist
ical
sign
ific
ance
f0 t%
1L
inea
rN
SN
SN
SN
S**
*N
SZ
Qu
adra
tic
NS
NS
NS
NS
NS
NS
NS
t%1
"'1
NI
85.8
0.7
00
.23
2.43
0.21
0.2
015
.3"'
1 t%1
N2
85
.30
.67
0.1
82.
130
.21
0.2
015
.3o ..,
N3
85.3
0.70
0 .2
02.
32
0.2
10.
1914
.9[F
J
N4
84
.70
.86
0.1
82 .
36
0.1
70.
1615
.20 Z
N5
85.3
0.92
0.1
62.
37
0.2
20.
2015
.2'"0 >-
Stat
isti
cal
sign
iflc
ance
f
I~L
inea
rN
S**
**N
SN
SN
SN
SQ
uad
rati
c**
NS
NS
NS
***
NS
--
YN
utr
ien
tco
ncen
tra
tio
ns
fro
mfr
uits
sam
ple
do
nS
epte
mbe
r3,
Sep
tem
ber
30,
and
Oct
ob
er28
,19
76
we
reav
erag
ed.
ZSta
tist
ical
sign
ific
ance
:**
=1%
leve
l,*
=5
%le
vel,
and
NS
=no
tsi
gnif
ican
t.
I ......
e"o

Tab
le7
.E
ffec
tsof
irri
gati
onan
dN
fert
iliz
atio
no
nth
em
iner
alco
mpo
siti
on
ofth
efr
uit
du
ring
the
wet
seas
on)
'
....- "'"
Moi
stu
reN
PT
reat
men
t(%
fres
hw
eigh
t)(%
)(%
)
118
4.8
0.8
60
.25
128
4.5
0.8
20
.18
138
4.8
0.8
80
.22
1485
.30
.75
0.2
215
84.
60.
870
.19
Stat
isti
cal
sign
ific
anc
e/L
inea
rN
SN
SN
SQ
uad
rati
cN
SN
SN
S
Nl
86.2
0.8
00.
28N
284
.90
.75
0.2
2N
38
4.8
0.7
90
.22
N4
83.
60
.88
0.1
9N
58
4.5
0.9
40
.16
Sta
tist
ical
sign
ific
ance
fL
inea
rN
S**
**Q
uad
rati
c*
NS
NS
YN
utr
ien
tco
nce
ntr
atio
nsw
ere
from
Dec
emb
er2
,19
76.
ZS
tati
stic
alsi
gnif
ican
ce:
**=
1%le
vel,
*=
5%
leve
l,an
dN
S=
not
sign
ific
ant.
Dry
wei
ght
KC
aM
gB
(%)
(%)
(%)
(pp
m)
2.96
0.27
0.2
314
.92.
35
0.3
10
.26
14.5
2.5
10.
33
0.25
14.9
2.64
0.3
30
.24
14.2
I~2.
340.
320.
2513
.9
c:**
NS
NS
NS
I~N
SN
SN
SN
SC;
2.7
40
.39
0.3
015
.4o c:::
2.5
30.
350
.28
14.2
s:;2.
57
0.27
0.2
214
.6c:::
2.6
00
.28
0.2
214
.2~ >
2.35
0.2
60
.21
14.0
r- ~ X "0N
S**
**N
SI~
NS
**
NS
~ §: t"l Z ..., en ..., >- j 0 Z
DR IP IRRIGATION AN D NIT ROGEN EF FE CT S ON PAPAY A 15
co nd itions at Prin cess Orchard , frui t N can b e pred icted fro m petiole Nwith a high degree of precision .
Relation of the Yield of Marketable Fruitsto the Water Application Fraction of Pan Evaporation
The average weekly applicatio ns of wa te r and th e average panevaporat ions of wa te r during the summe r of 197 6 and the wa te rapp licat ions as frac t ions of the pa n evaporat ion are presented in Table8.
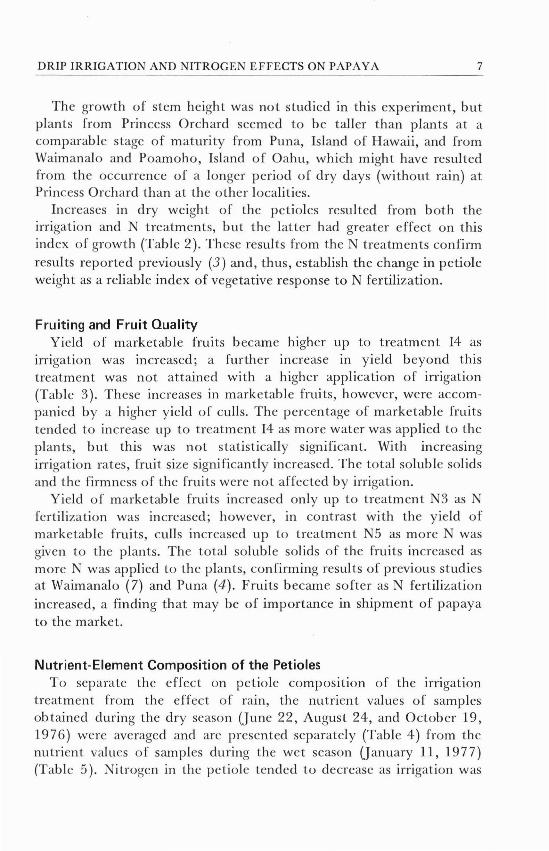
In Figure 2 th e yield of mark et able fru its was relat ed to th e wat erapplica t ion frac t ion o f th e pa n evapo ra t ion. Maximum yield of fru itswas attained at th e water app lica t ion fraction of ] .29. This value is 17percent higher than the value reporte d for sugarca ne and maize (1),wh ich wou ld place pap ay a in a higher category than th ese crops in itsreq uir em ent for wat er.
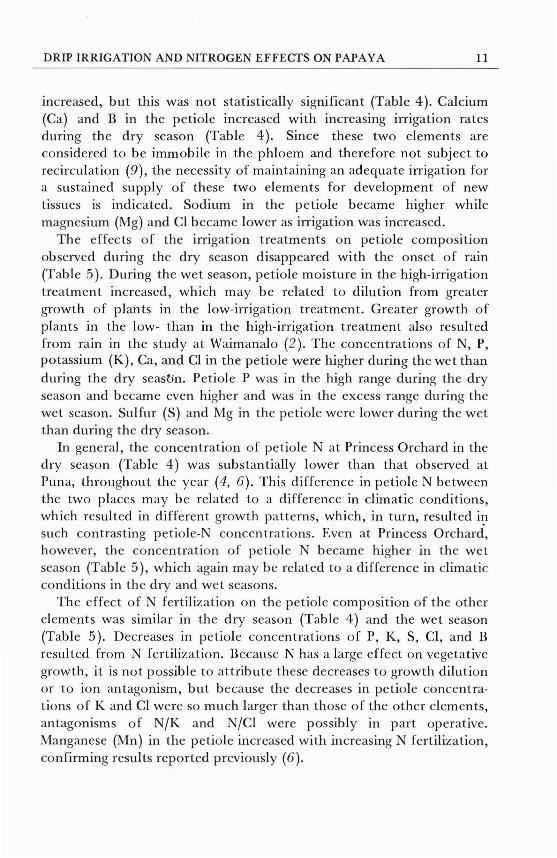
Relation of the Number of Marketable Fruits to Petiole NBecau se th e co nce ntra t ion of petiole N fro m tr eatment 11 tended to
be higher th an th at o f petiole N from th e othe r irrigat io n treatmentsand did no t seem to bel on g in the same gro up as th e othe rs, petiole Nfro m th is treatment (11 ) was not included in this ph ase of th e st udy .The optimal numb er o f marketab le fruits was produced at about 0.86percen t N (F igure 3), which is co nside rably low er th an th e op t imalnumb er determined for Puna (4 , 6 ) and Waim an alo (7 ). This differ en cein the crit ical N level b etween Princess Or chard on one hand and Punaand Waim an alo on the othe r may be rela te d to a differen ce in growthco nd itio ns as d iscussed in previou s sec t ions of this rep ort.
Tab le 8. Amount of water ap plicat ion in the var ious trea tments expressed as a fr act io nof pan evaporat io n du ring th e summe r of 197 6.
Tr eatment
II12131415
Irrigati on(in ch es/d ay/acre)Z
.115
.22 7
.348
.45 2
.5 66
Pan evaporation(in ch es/day/acre)Z
.350
.35 0
.350
.350
.35 0
Irri gation/pa n evaporation
.33
.65
.991.291.6 2
ZAveraged fro m weekly data during J une 29 to Septembe r 20, 19 76.

HAWAII AG RICU LTURA L EX PE RIMENT STATION16
70
60
wwa:: 50~
.....lD...J
0 40...JW
>=~
:5 30a::u,
w...Jms 20w
'"a::~ 10
00 0 .25 0 .50 0 .75 1.00 1.25 1.50 1.75 2 .00
WATER APPLICATION AS A FRACTION OF PAN EVAPORATION
Figure 2. Relation b etween th e y ield of mark etable fru its and the waterap plica tion ex pressed as a frac t io n of pan evaporat ion. T he da tum of fr ui t yield wasthe total weekl y y ield fro m June 29, 1976 toJune 28 , 19 77 , and th e d atum of thewater applicat io n was averaged from weekl y d at a during June 29 to September 20,1976 and ex pres sed on a p er-day b asis.
65
w 60wa::~<,(f)~
:5 55a::u,
w...JlD 50~w
'"a::<I:::!E 45u,0a::wlD 40:::!E::>z
00 0 .80 0.85 0 .90 0.9 5 1.00 1.0 5 1.10 1.1 5
PETIOLE N (% DRY WT )
Figure 3. Relation b et ween the num ber of m arket able fru its and th e conce ntration of pe tiole N. Yiel d was th e total numb er of marke table fru its harvestedfrom June 29, 19 76 to June 28, 19 77 , and p etiol e N was averaged from th e samp lesof June 22, Augus t 24, and October 19, 19 76 .

DRIP IRRIGATION AND NITROGEN EFFECTS ON PAPAY A
RECOMMENDATIONS
17
Since an increase in irrigation resulted in an increased number andincreased size of mark et abl e fruits wi th ou t affect ing th e total solubl esolids and firmn ess o f th e frui ts, an irr igat ion ra te associate d wit hmaximum fru it y ield is advisable at Princess Orchard. In sche dulingirrigation for th e week, th e amount of water ap plicat ion sho uld be 1.3times the pa n evapora tion o f wat er (Class A pan) fro m the previou sweek .
The co ncentrat ion o f pcti ole-N during th e dry season at Prin cessOrch ard sho uld b e maintained at about 0.86 percent N, dry we ight. Theapplica t ion rate o f N associated with thi s co ncent ra t ion o f petiole Nwas a total o f 0.50 Ib N/tree applied in increm ents at 6-week intervals fromth e flowering stage th rough 6 months of the bearing stage. This application ra te applies only to replan t fields in Prin cess Or chard , wh ich had asimilar N fertilizatio n sche dule as the orchard used in the present st udy.
Since P at 224 lb/ucre resulted in peti olc-P co ncentrat ions in the highto excessive ran ge, a rat e of ab out 45 lb P[ecte, applied at t ransplantingtime only, is advisable . Potassium fertilizer was not app lied in the presen t study an d yet the petiole-K concentration was in th e high range .Thus, this nutrient should be del eted from th e fertilizer program atPrin cess Orchard until th e need for it appears in th e future.
An other study is need ed at Princess Or chard to det ermine wh eth erth e cri tical-N co ncentratio n determined fro m petioles sampled duringthe we t season will be simi lar to the one at Puna. Th e ex perime ntal areasho uld be in an area that is low in soi l N, and the planting date sho uldbe so selecte d th at N resp onse is ob ta ined at the start o f b earing duringthe wet season . A st udy is also need ed to determine th e m ost su ita bleirrigat ion interval (number of days before irrigati ng) and the nu mb er ofmicrotubes per plan t for optimum delivery and d istribu ti on of water inthe so il.
SUMMARY
Flowe ring and bearin g papaya plants at Pulchu , Island of Maui , werediffer en tially irr igated by the drip method and d ifferen ti ally fert ilize dwit h N in fac torial co mb inat ions.

18 HAWAll AG RICU LTURA L EX PE RIMEN T STATION
Th e gro wth rate of th e stem circum fere nce was increased at times byth e irri gati on and N treatme n ts , but th ese increases wer e sma ll. Th eweight o f th e petiole was increased co nsisten tly by N fertilization.
The yield, numb er , and size o f the market abl e frui ts were incr easedby the irrigation rat es. Th e numb er o f marketabl e fruit s was increasedby th e N fertilization, but this incr ease was accompanied by a highyiel d of culls. The to tal soluble so lids o f th e fruits were incr eased , butth e firm ness o f the Ilesh was decr eased by t he N fert iliza t ion.
Th e co nce ntrat ion o f petiole N and th e crit ica l-N co nce ntrat ionduring the dry seas on (June 22 to Octob er 19) were substant ially lowertha n those fo und in Puna, Island of Hawaii , and the explanat ion of thi sdi fferen ce at th e tw o places is di scu ssed.
Th e co ncent rat ions o f Ca, B, and Na in th e peti ol e increased andth ose of Mg and CI decreased as irrigation was increased . Nitrogen inth e petiol e te nde d to decrease as irrigati on was increased, bu t thi s wasnot st atisti cally signif ican t. Th e concent rat io ns of P, K, S, CI, and B inthe petiole decreased and the co ncen trat ion of Mn incr eased as Nfert iliza t ion increased.
The yield o f m ark etabl e fru its was rela ted to th e wa te r applicationfraction o f the pan evaporatio n , and ma ximum yield was ob ta ined atth e water application fraction of 1.29. It is sugges te d tha t this valu e beused as a guide to irrigat ion of papaya plan ts at Pul ehu, Maui.

DRIP IRRIGATION AN D NIT ROGEN EFFECTS ON PAPAY A
LITERATURE CITED
19
1. Anonym ou s. 197 4. Proc. 2nd Intern at. Drip Irri gation Con gr., Univ.of California, Riverside, California. 56 9 pp .
2. Awada , M. 1962. So il moisture tension in relati on to growth andyield of pap aya (Carica papaya L.). Hawaii Agr. Exp. St a, Tech.Bull. 49. 15 pp.
3. . 1977. Relation s o f nitrogen, ph osph orus, and potassiumfer t iliza tion to nu tri ent co mposit ion of th e pe tiole and growth ofpap aya.] . Ame r. Soc. I-I ort. Sci. 102 :41 3- 41 8.
4 . , and C. Long. 1971 . Relati on s of peti ole nitrogen levels tonitrogen fertilization and yield o f pa paya. J. Amer. Soc. Hort. Sci.96:7 45-749.
5. , and . 1977. Criti cal phosph orus level in petiolesof papaya. Hawaii Agr. Ex p. St a. Tech. Bull. 97 . 25 pp.
6. , and . 1978. Relati on of nitrogen and ph osph orusfertilization to fruitin g and peti ole compos ition o f 'Solo' papaya.]. Ame r. Soc. Hort. Sci. 10 3 :217-219.
7. , and R. I-I. Suehi sa. 197 5. Crit ical nitrogen level in pe tioleso f papaya. Hawaii Agr. Ex p. St a. Tech . Bull. 94. 20 pp .
8. , _ , and Y. Kan ehi ro. 197 5. Effec ts of lim e andph osphorus on yield, t,rrowth , and petiole composition of pap aya.J. Am er. Soc. Hort. Sci. 100:294-298.
9. Epste in , E. 1972. Phl oem tr ansport of inorgani c solutes . In Mineralnutriti on o f plant s: prin ciple s and perspecti ves. J ohn Wiley & Son s,New York. pp. 2 12-2 16.
10. Foote, D. E., E. L. Hill, S. Nakamura, and F. St eph ens. 197 2. Soilsurvey, Islands o f Kauai, Oahu, Maui , Molok ai, and Lan ai, St at e ofHawaii. Supt. of Doc. , U.S. Gov t. Print. Office, Washin gton , D.C.23 2 pp .
II. Grandage, A. 1958. Orthogonal coefficients for un equal intervals.Biometrics 14 :287- 289.
12. Snedecor, G. W., and W. G. Cochran. 1969. Stati sti cal method s. 6thcd. Iow a State College Press, Am es, Iow a.

DISCLAIMER
Reference to a comp any or product name does not imply approval orrecommendation of the product by the College of Tropical Agricultureand Human Resources, University of Hawaii, or the United StatesDepartment of Agricu lture to th e exclusion of others that may besuitab le.
Hawaii resid ents m ay order single co pies of this publication free of charge fromcou n ty offices . Out-o f-St ate in quiries or bulk orders should be sent to the Agricultural Publications and Information Office , College of T ropical Agriculture and Hu m an Resources, University of Haw aii, 2500 Do le Street, Krauss Hall 107, Honolu lu ,Haw aii 96822. Price per copy to bulk users, forty -five cen ts plus postage .

Hawaii Agri cultural Experiment StationCollege of Tropical Agriculture and Human Resources, University of HawaiiWilliam R. Furtick, Dean of the Coll ege and Director of the Experiment StationNoel P. Kefford, Acting Associate Directo r of the Experiment Station
Tech. Bull . 103-December 1979 (2 .5M)